Huntington, VA Map & Demographics
Huntington Map
Huntington Overview
$64,960
PER CAPITA INCOME
$140,190
AVG FAMILY INCOME
$96,382
AVG HOUSEHOLD INCOME
23.1%
WAGE / INCOME GAP [ % ]
76.9¢/ $1
WAGE / INCOME GAP [ $ ]
0.37
INEQUALITY / GINI INDEX
13,913
TOTAL POPULATION
7,100
MALE POPULATION
6,813
FEMALE POPULATION
104.21
MALES / 100 FEMALES
95.96
FEMALES / 100 MALES
36.0
MEDIAN AGE
2.8
AVG FAMILY SIZE
1.9
AVG HOUSEHOLD SIZE
9,822
LABOR FORCE [ PEOPLE ]
82.0%
PERCENT IN LABOR FORCE
3.9%
UNEMPLOYMENT RATE
Income in Huntington
Income Overview in Huntington
Per Capita Income in Huntington is $64,960, while median incomes of families and households are $140,190 and $96,382 respectively.
| Characteristic | Number | Measure |
| Per Capita Income | 13,913 | $64,960 |
| Median Family Income | 2,937 | $140,190 |
| Mean Family Income | 2,937 | $153,843 |
| Median Household Income | 7,183 | $96,382 |
| Mean Household Income | 7,183 | $123,680 |
| Income Deficit | 2,937 | $0 |
| Wage / Income Gap (%) | 13,913 | 23.06% |
| Wage / Income Gap ($) | 13,913 | 76.94¢ per $1 |
| Gini / Inequality Index | 13,913 | 0.37 |
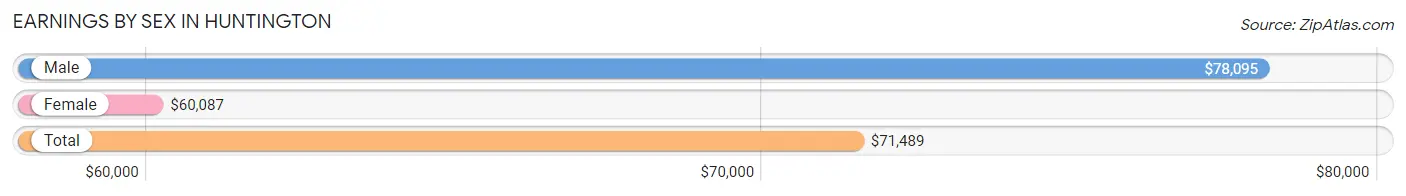
Earnings by Sex in Huntington
Average Earnings in Huntington are $71,489, $78,095 for men and $60,087 for women, a difference of 23.1%.
| Sex | Number | Average Earnings |
| Male | 5,306 (53.6%) | $78,095 |
| Female | 4,594 (46.4%) | $60,087 |
| Total | 9,900 (100.0%) | $71,489 |
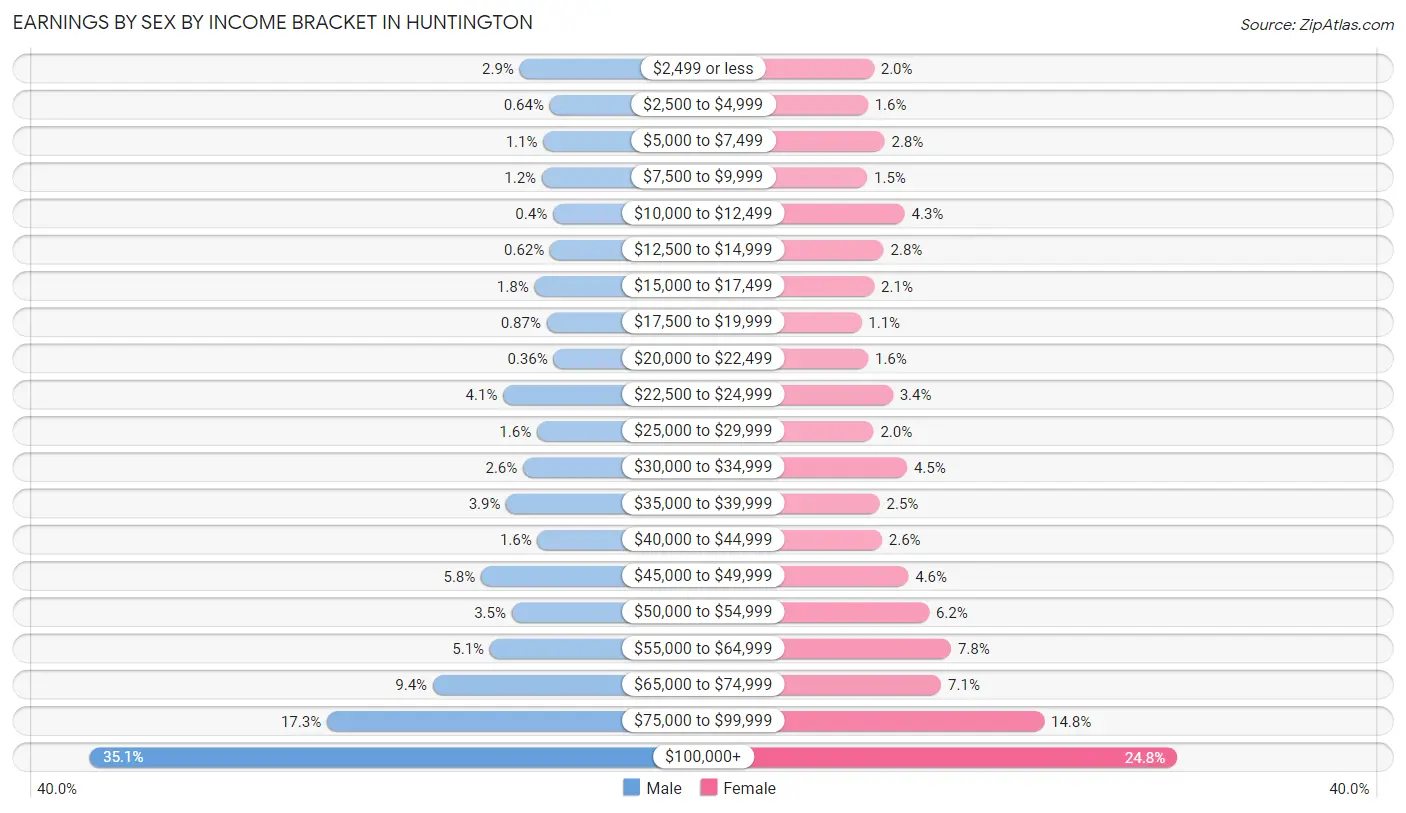
Earnings by Sex by Income Bracket in Huntington
The most common earnings brackets in Huntington are $100,000+ for men (1,862 | 35.1%) and $100,000+ for women (1,137 | 24.7%).
| Income | Male | Female |
| $2,499 or less | 154 (2.9%) | 93 (2.0%) |
| $2,500 to $4,999 | 34 (0.6%) | 72 (1.6%) |
| $5,000 to $7,499 | 60 (1.1%) | 130 (2.8%) |
| $7,500 to $9,999 | 65 (1.2%) | 70 (1.5%) |
| $10,000 to $12,499 | 21 (0.4%) | 199 (4.3%) |
| $12,500 to $14,999 | 33 (0.6%) | 127 (2.8%) |
| $15,000 to $17,499 | 95 (1.8%) | 94 (2.1%) |
| $17,500 to $19,999 | 46 (0.9%) | 50 (1.1%) |
| $20,000 to $22,499 | 19 (0.4%) | 73 (1.6%) |
| $22,500 to $24,999 | 219 (4.1%) | 158 (3.4%) |
| $25,000 to $29,999 | 85 (1.6%) | 92 (2.0%) |
| $30,000 to $34,999 | 140 (2.6%) | 207 (4.5%) |
| $35,000 to $39,999 | 207 (3.9%) | 113 (2.5%) |
| $40,000 to $44,999 | 83 (1.6%) | 121 (2.6%) |
| $45,000 to $49,999 | 307 (5.8%) | 212 (4.6%) |
| $50,000 to $54,999 | 185 (3.5%) | 283 (6.2%) |
| $55,000 to $64,999 | 272 (5.1%) | 359 (7.8%) |
| $65,000 to $74,999 | 499 (9.4%) | 325 (7.1%) |
| $75,000 to $99,999 | 920 (17.3%) | 679 (14.8%) |
| $100,000+ | 1,862 (35.1%) | 1,137 (24.7%) |
| Total | 5,306 (100.0%) | 4,594 (100.0%) |
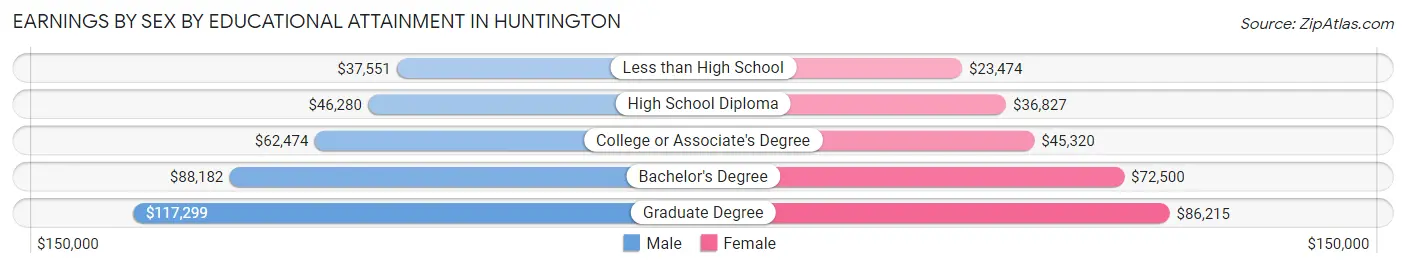
Earnings by Sex by Educational Attainment in Huntington
Average earnings in Huntington are $84,960 for men and $67,009 for women, a difference of 21.1%. Men with an educational attainment of graduate degree enjoy the highest average annual earnings of $117,299, while those with less than high school education earn the least with $37,551. Women with an educational attainment of graduate degree earn the most with the average annual earnings of $86,215, while those with less than high school education have the smallest earnings of $23,474.
| Educational Attainment | Male Income | Female Income |
| Less than High School | $37,551 | $23,474 |
| High School Diploma | $46,280 | $36,827 |
| College or Associate's Degree | $62,474 | $45,320 |
| Bachelor's Degree | $88,182 | $72,500 |
| Graduate Degree | $117,299 | $86,215 |
| Total | $84,960 | $67,009 |
Family Income in Huntington
Family Income Brackets in Huntington
According to the Huntington family income data, there are 861 families falling into the $200,000+ income range, which is the most common income bracket and makes up 29.3% of all families. Conversely, the less than $10,000 income bracket is the least frequent group with only 15 families (0.5%) belonging to this category.
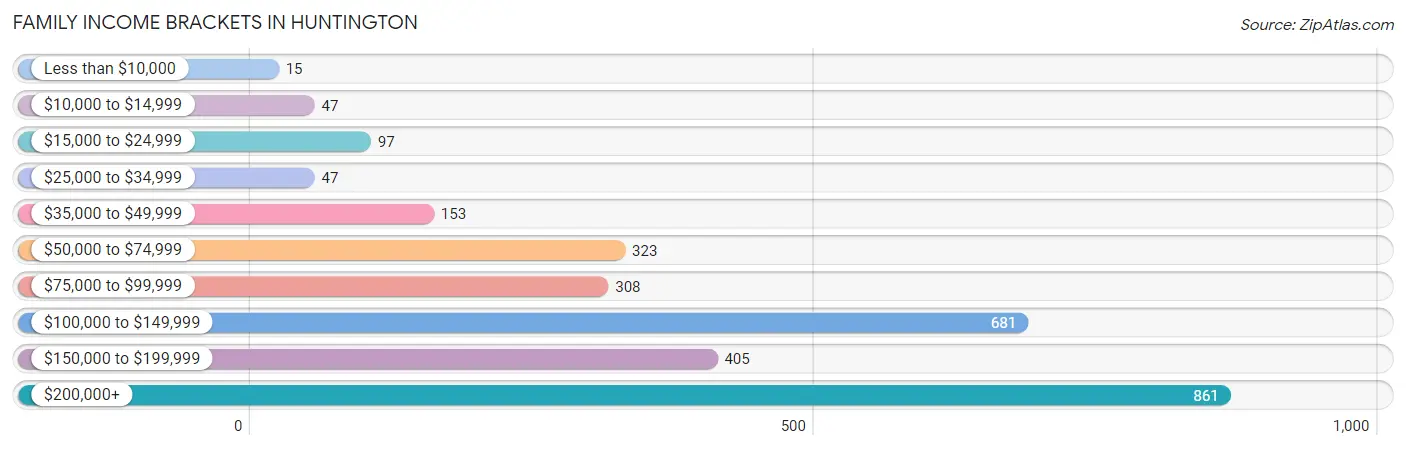
| Income Bracket | # Families | % Families |
| Less than $10,000 | 15 | 0.5% |
| $10,000 to $14,999 | 47 | 1.6% |
| $15,000 to $24,999 | 97 | 3.3% |
| $25,000 to $34,999 | 47 | 1.6% |
| $35,000 to $49,999 | 153 | 5.2% |
| $50,000 to $74,999 | 323 | 11.0% |
| $75,000 to $99,999 | 308 | 10.5% |
| $100,000 to $149,999 | 681 | 23.2% |
| $150,000 to $199,999 | 405 | 13.8% |
| $200,000+ | 861 | 29.3% |
Family Income by Famaliy Size in Huntington
4-person families (211 | 7.2%) account for the highest median family income in Huntington with $185,865 per family, while 2-person families (1,696 | 57.8%) have the highest median income of $72,466 per family member.
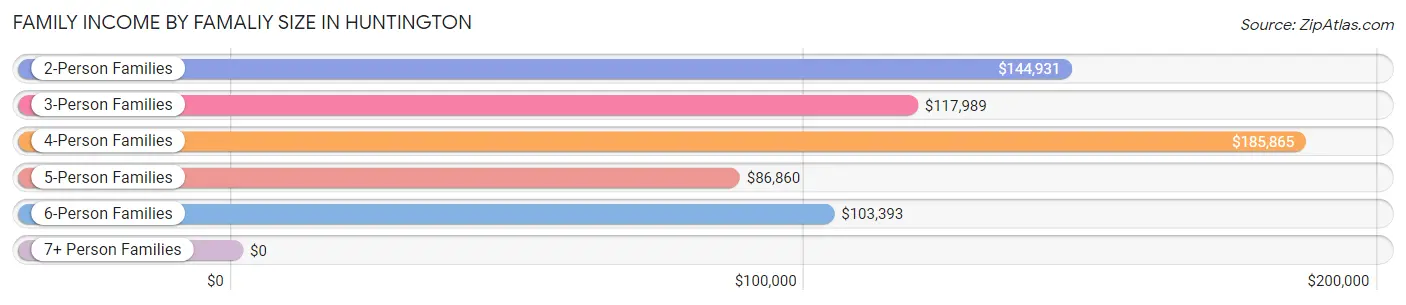
| Income Bracket | # Families | Median Income |
| 2-Person Families | 1,696 (57.8%) | $144,931 |
| 3-Person Families | 770 (26.2%) | $117,989 |
| 4-Person Families | 211 (7.2%) | $185,865 |
| 5-Person Families | 125 (4.3%) | $86,860 |
| 6-Person Families | 75 (2.5%) | $103,393 |
| 7+ Person Families | 60 (2.0%) | $0 |
| Total | 2,937 (100.0%) | $140,190 |
Family Income by Number of Earners in Huntington
The median family income in Huntington is $140,190, with families comprising 2 earners (1,748) having the highest median family income of $169,063, while families with 1 earner (755) have the lowest median family income of $78,537, accounting for 59.5% and 25.7% of families, respectively.
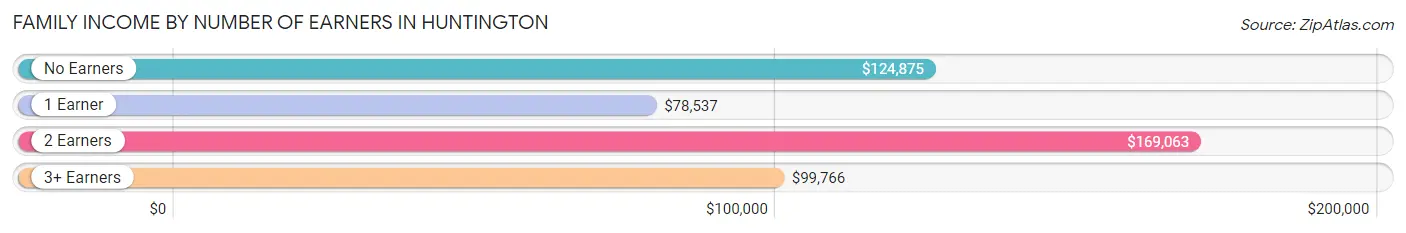
| Number of Earners | # Families | Median Income |
| No Earners | 173 (5.9%) | $124,875 |
| 1 Earner | 755 (25.7%) | $78,537 |
| 2 Earners | 1,748 (59.5%) | $169,063 |
| 3+ Earners | 261 (8.9%) | $99,766 |
| Total | 2,937 (100.0%) | $140,190 |
Household Income in Huntington
Household Income Brackets in Huntington
With 1,329 households falling in the category, the $200,000+ income range is the most frequent in Huntington, accounting for 18.5% of all households. In contrast, only 151 households (2.1%) fall into the less than $10,000 income bracket, making it the least populous group.
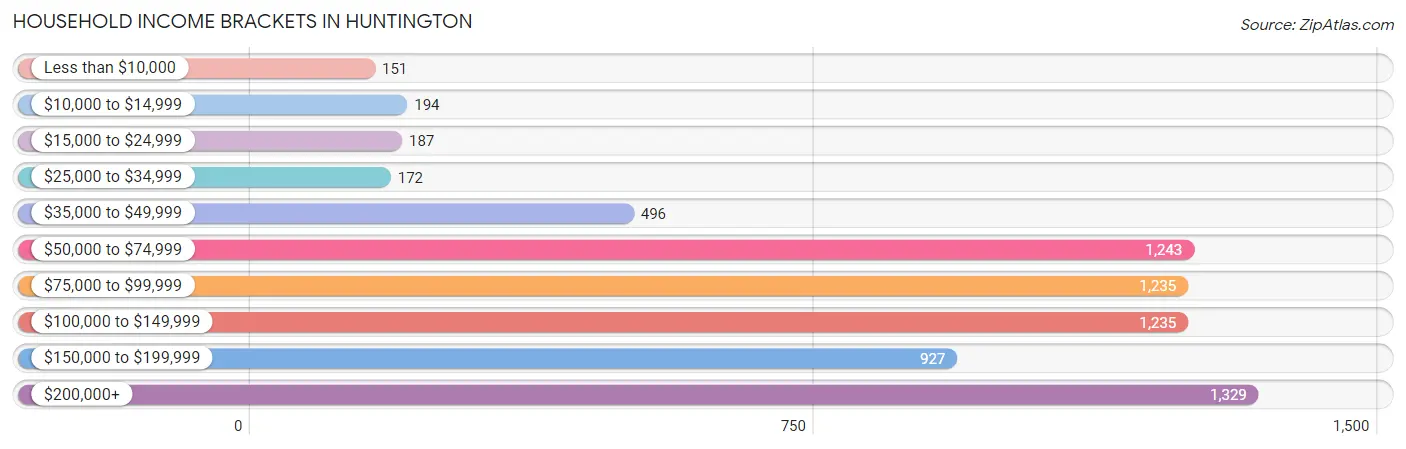
| Income Bracket | # Households | % Households |
| Less than $10,000 | 151 | 2.1% |
| $10,000 to $14,999 | 194 | 2.7% |
| $15,000 to $24,999 | 187 | 2.6% |
| $25,000 to $34,999 | 172 | 2.4% |
| $35,000 to $49,999 | 496 | 6.9% |
| $50,000 to $74,999 | 1,243 | 17.3% |
| $75,000 to $99,999 | 1,235 | 17.2% |
| $100,000 to $149,999 | 1,235 | 17.2% |
| $150,000 to $199,999 | 927 | 12.9% |
| $200,000+ | 1,329 | 18.5% |
Household Income by Householder Age in Huntington
The median household income in Huntington is $96,382, with the highest median household income of $110,805 found in the 25 to 44 years age bracket for the primary householder. A total of 3,534 households (49.2%) fall into this category. Meanwhile, the 15 to 24 years age bracket for the primary householder has the lowest median household income of $75,313, with 361 households (5.0%) in this group.
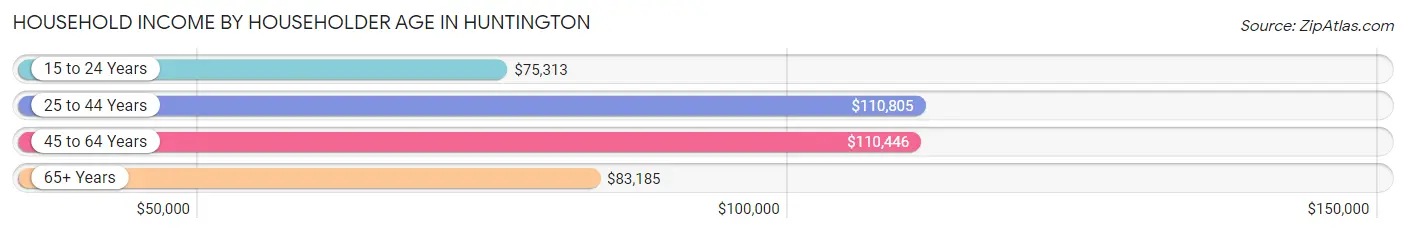
| Income Bracket | # Households | Median Income |
| 15 to 24 Years | 361 (5.0%) | $75,313 |
| 25 to 44 Years | 3,534 (49.2%) | $110,805 |
| 45 to 64 Years | 2,059 (28.7%) | $110,446 |
| 65+ Years | 1,229 (17.1%) | $83,185 |
| Total | 7,183 (100.0%) | $96,382 |
Poverty in Huntington
Income Below Poverty by Sex and Age in Huntington
With 4.5% poverty level for males and 8.1% for females among the residents of Huntington, 15 year old males and 15 year old females are the most vulnerable to poverty, with 17 males (27.9%) and 36 females (66.7%) in their respective age groups living below the poverty level.
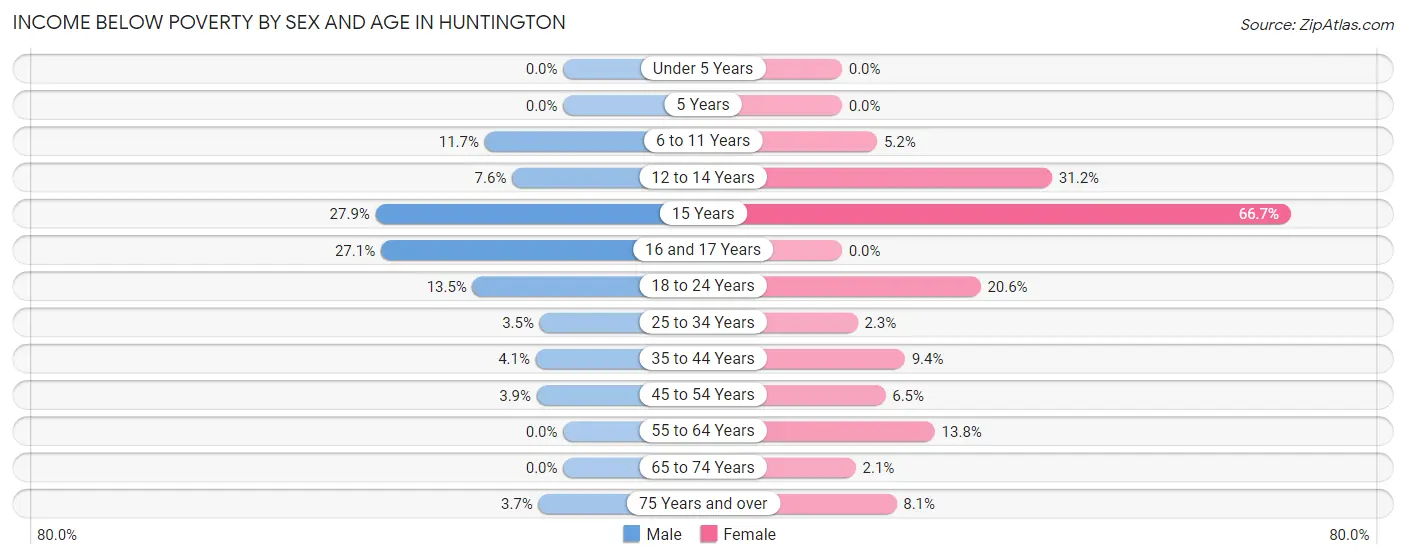
| Age Bracket | Male | Female |
| Under 5 Years | 0 (0.0%) | 0 (0.0%) |
| 5 Years | 0 (0.0%) | 0 (0.0%) |
| 6 to 11 Years | 14 (11.7%) | 13 (5.2%) |
| 12 to 14 Years | 17 (7.6%) | 73 (31.2%) |
| 15 Years | 17 (27.9%) | 36 (66.7%) |
| 16 and 17 Years | 13 (27.1%) | 0 (0.0%) |
| 18 to 24 Years | 95 (13.5%) | 91 (20.6%) |
| 25 to 34 Years | 59 (3.5%) | 40 (2.3%) |
| 35 to 44 Years | 52 (4.1%) | 114 (9.3%) |
| 45 to 54 Years | 43 (3.9%) | 49 (6.5%) |
| 55 to 64 Years | 0 (0.0%) | 95 (13.8%) |
| 65 to 74 Years | 0 (0.0%) | 12 (2.1%) |
| 75 Years and over | 12 (3.7%) | 25 (8.1%) |
| Total | 322 (4.5%) | 548 (8.1%) |
Income Above Poverty by Sex and Age in Huntington
According to the poverty statistics in Huntington, males aged under 5 years and females aged under 5 years are the age groups that are most secure financially, with 100.0% of males and 100.0% of females in these age groups living above the poverty line.
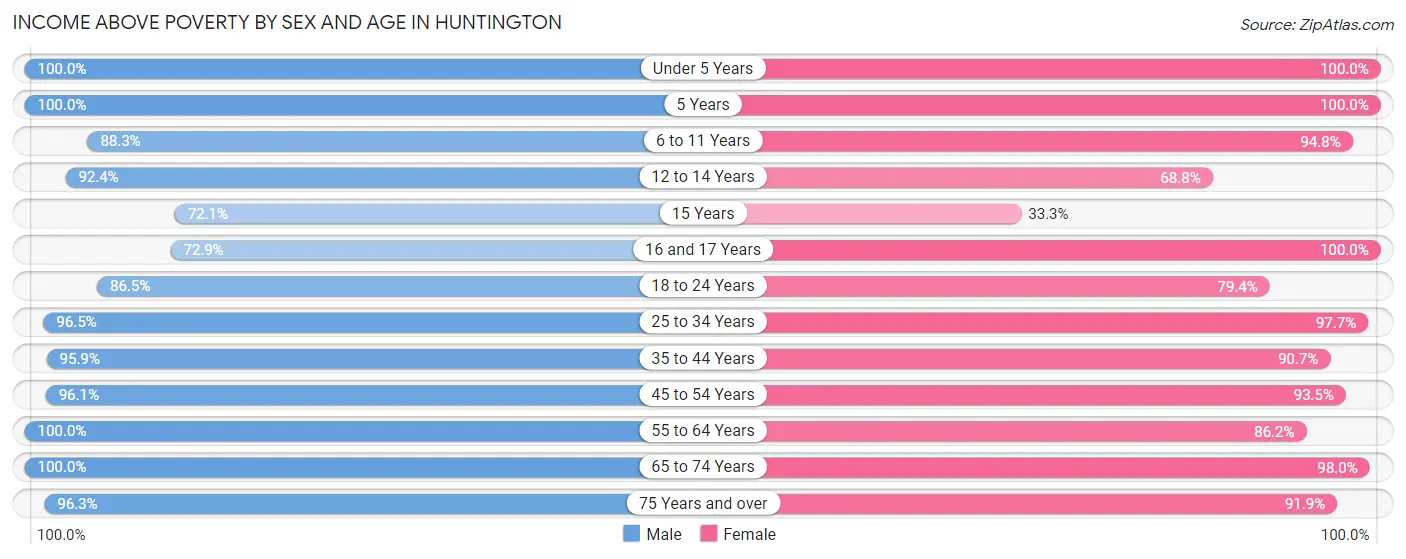
| Age Bracket | Male | Female |
| Under 5 Years | 476 (100.0%) | 418 (100.0%) |
| 5 Years | 28 (100.0%) | 37 (100.0%) |
| 6 to 11 Years | 106 (88.3%) | 236 (94.8%) |
| 12 to 14 Years | 207 (92.4%) | 161 (68.8%) |
| 15 Years | 44 (72.1%) | 18 (33.3%) |
| 16 and 17 Years | 35 (72.9%) | 81 (100.0%) |
| 18 to 24 Years | 611 (86.5%) | 351 (79.4%) |
| 25 to 34 Years | 1,629 (96.5%) | 1,673 (97.7%) |
| 35 to 44 Years | 1,220 (95.9%) | 1,105 (90.6%) |
| 45 to 54 Years | 1,052 (96.1%) | 710 (93.5%) |
| 55 to 64 Years | 635 (100.0%) | 594 (86.2%) |
| 65 to 74 Years | 411 (100.0%) | 572 (98.0%) |
| 75 Years and over | 315 (96.3%) | 284 (91.9%) |
| Total | 6,769 (95.5%) | 6,240 (91.9%) |
Income Below Poverty Among Married-Couple Families in Huntington
The poverty statistics for married-couple families in Huntington show that 0.6% or 13 of the total 2,282 families live below the poverty line. Families with no children have the highest poverty rate of 0.9%, comprising of 13 families. On the other hand, families with 1 or 2 children have the lowest poverty rate of 0.0%, which includes 0 families.
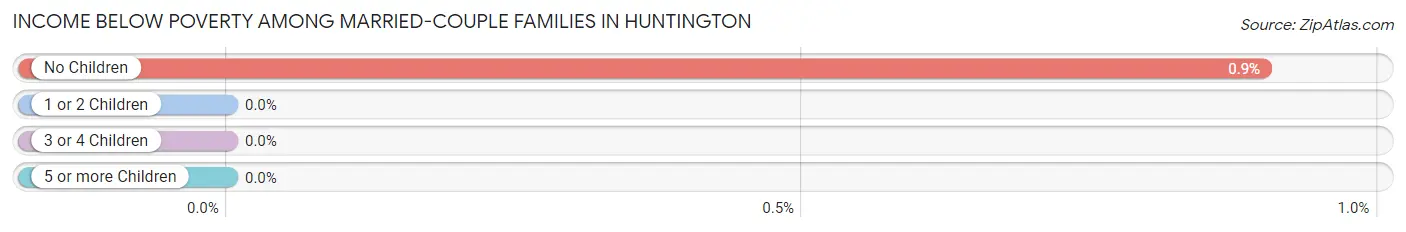
| Children | Above Poverty | Below Poverty |
| No Children | 1,435 (99.1%) | 13 (0.9%) |
| 1 or 2 Children | 799 (100.0%) | 0 (0.0%) |
| 3 or 4 Children | 27 (100.0%) | 0 (0.0%) |
| 5 or more Children | 8 (100.0%) | 0 (0.0%) |
| Total | 2,269 (99.4%) | 13 (0.6%) |
Income Below Poverty Among Single-Parent Households in Huntington
According to the poverty data in Huntington, 7.0% or 11 single-father households and 27.0% or 134 single-mother households are living below the poverty line. Among single-father households, those with no children have the highest poverty rate, with 11 households (22.0%) experiencing poverty. Likewise, among single-mother households, those with 1 or 2 children have the highest poverty rate, with 105 households (35.2%) falling below the poverty line.
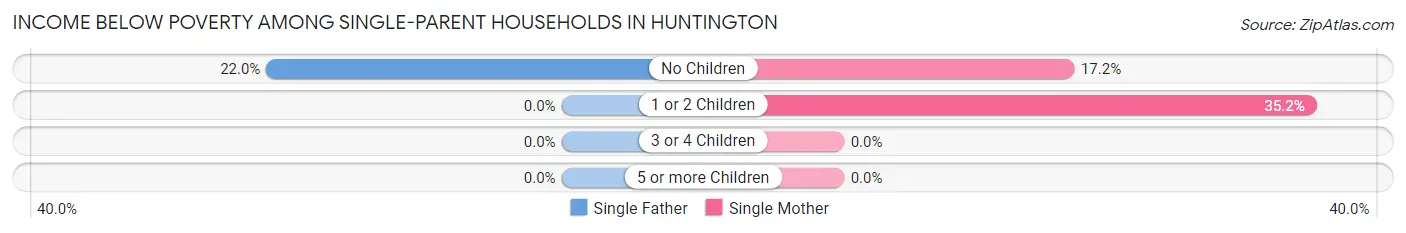
| Children | Single Father | Single Mother |
| No Children | 11 (22.0%) | 29 (17.2%) |
| 1 or 2 Children | 0 (0.0%) | 105 (35.2%) |
| 3 or 4 Children | 0 (0.0%) | 0 (0.0%) |
| 5 or more Children | 0 (0.0%) | 0 (0.0%) |
| Total | 11 (7.0%) | 134 (27.0%) |
Income Below Poverty Among Married-Couple vs Single-Parent Households in Huntington
The poverty data for Huntington shows that 13 of the married-couple family households (0.6%) and 145 of the single-parent households (22.1%) are living below the poverty level. Within the married-couple family households, those with no children have the highest poverty rate, with 13 households (0.9%) falling below the poverty line. Among the single-parent households, those with 1 or 2 children have the highest poverty rate, with 105 household (25.9%) living below poverty.
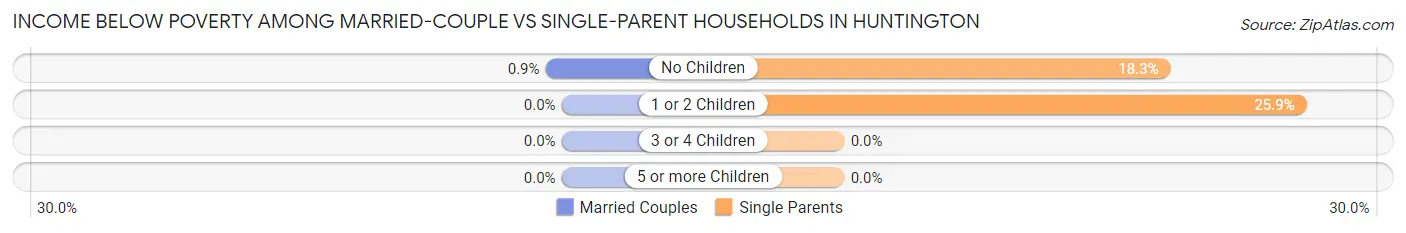
| Children | Married-Couple Families | Single-Parent Households |
| No Children | 13 (0.9%) | 40 (18.3%) |
| 1 or 2 Children | 0 (0.0%) | 105 (25.9%) |
| 3 or 4 Children | 0 (0.0%) | 0 (0.0%) |
| 5 or more Children | 0 (0.0%) | 0 (0.0%) |
| Total | 13 (0.6%) | 145 (22.1%) |
Race in Huntington
The most populous races in Huntington are White / Caucasian (7,564 | 54.4%), Black / African American (2,218 | 15.9%), and Hispanic or Latino (2,165 | 15.6%).
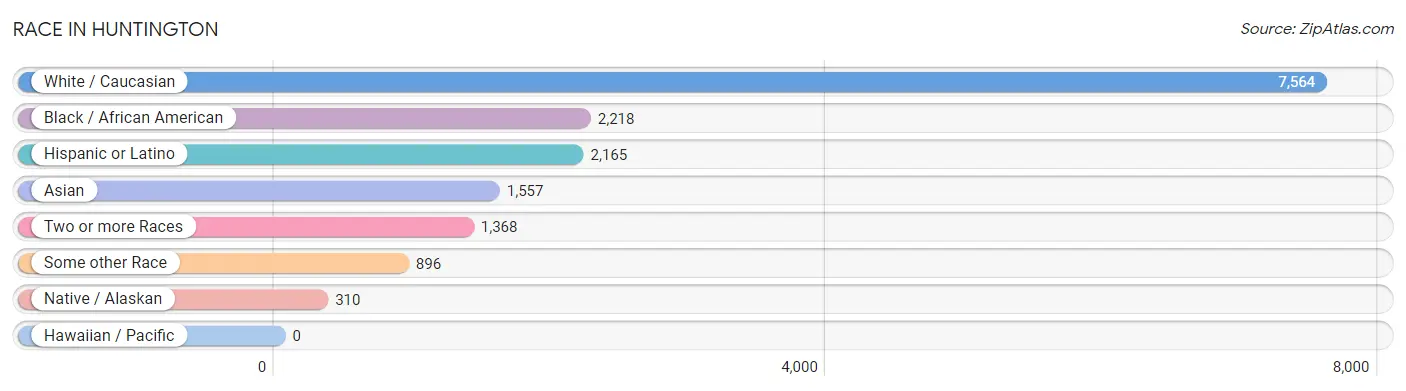
| Race | # Population | % Population |
| Asian | 1,557 | 11.2% |
| Black / African American | 2,218 | 15.9% |
| Hawaiian / Pacific | 0 | 0.0% |
| Hispanic or Latino | 2,165 | 15.6% |
| Native / Alaskan | 310 | 2.2% |
| White / Caucasian | 7,564 | 54.4% |
| Two or more Races | 1,368 | 9.8% |
| Some other Race | 896 | 6.4% |
| Total | 13,913 | 100.0% |
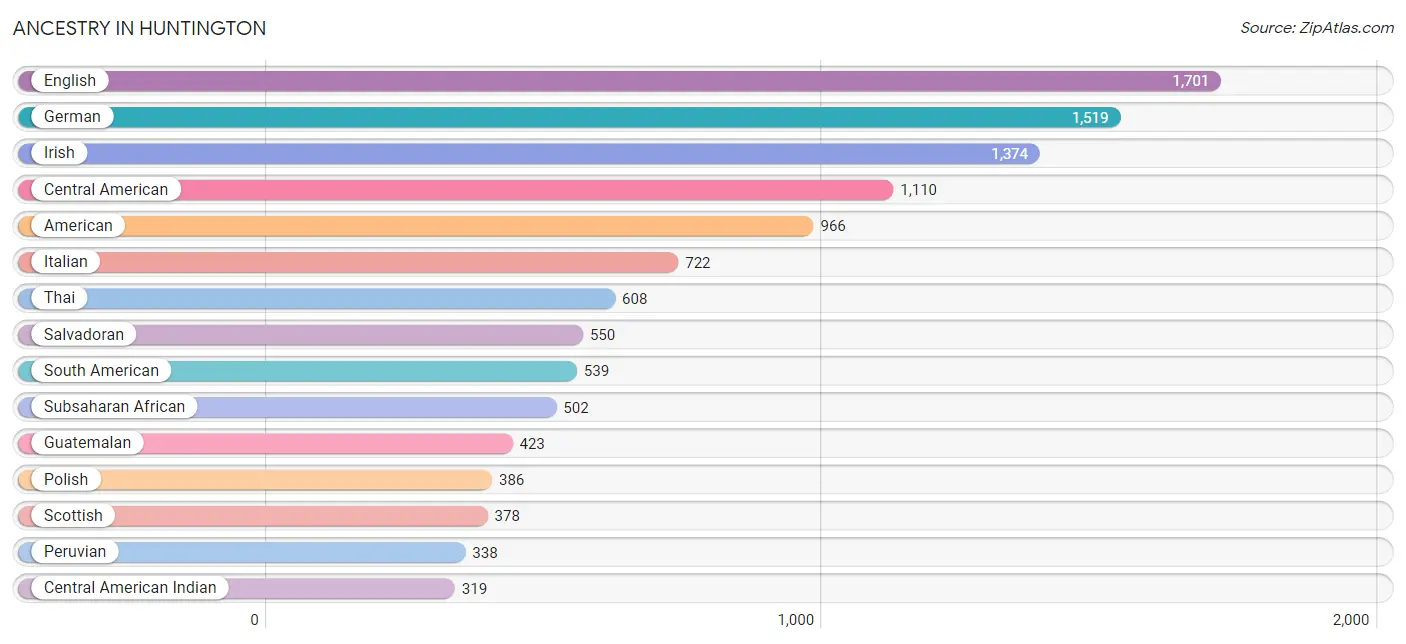
Ancestry in Huntington
The most populous ancestries reported in Huntington are English (1,701 | 12.2%), German (1,519 | 10.9%), Irish (1,374 | 9.9%), Central American (1,110 | 8.0%), and American (966 | 6.9%), together accounting for 48.0% of all Huntington residents.
| Ancestry | # Population | % Population |
| Afghan | 125 | 0.9% |
| African | 118 | 0.9% |
| Albanian | 35 | 0.3% |
| American | 966 | 6.9% |
| Arab | 316 | 2.3% |
| Armenian | 66 | 0.5% |
| Austrian | 49 | 0.4% |
| Bhutanese | 88 | 0.6% |
| Bolivian | 47 | 0.3% |
| Brazilian | 90 | 0.6% |
| British | 20 | 0.1% |
| British West Indian | 7 | 0.1% |
| Bulgarian | 46 | 0.3% |
| Burmese | 85 | 0.6% |
| Cajun | 9 | 0.1% |
| Canadian | 67 | 0.5% |
| Celtic | 23 | 0.2% |
| Central American | 1,110 | 8.0% |
| Central American Indian | 319 | 2.3% |
| Cherokee | 5 | 0.0% |
| Chilean | 9 | 0.1% |
| Choctaw | 23 | 0.2% |
| Colombian | 27 | 0.2% |
| Costa Rican | 16 | 0.1% |
| Croatian | 13 | 0.1% |
| Cuban | 15 | 0.1% |
| Czech | 98 | 0.7% |
| Danish | 45 | 0.3% |
| Dominican | 69 | 0.5% |
| Dutch | 108 | 0.8% |
| Eastern European | 33 | 0.2% |
| Ecuadorian | 17 | 0.1% |
| Egyptian | 177 | 1.3% |
| English | 1,701 | 12.2% |
| Estonian | 58 | 0.4% |
| Ethiopian | 149 | 1.1% |
| European | 154 | 1.1% |
| Filipino | 10 | 0.1% |
| Finnish | 30 | 0.2% |
| French | 226 | 1.6% |
| French Canadian | 102 | 0.7% |
| German | 1,519 | 10.9% |
| Greek | 61 | 0.4% |
| Guatemalan | 423 | 3.0% |
| Honduran | 48 | 0.4% |
| Hungarian | 78 | 0.6% |
| Indian (Asian) | 182 | 1.3% |
| Indonesian | 25 | 0.2% |
| Iranian | 21 | 0.2% |
| Irish | 1,374 | 9.9% |
| Italian | 722 | 5.2% |
| Jamaican | 19 | 0.1% |
| Kenyan | 20 | 0.1% |
| Korean | 189 | 1.4% |
| Laotian | 54 | 0.4% |
| Latvian | 10 | 0.1% |
| Liberian | 22 | 0.2% |
| Maltese | 7 | 0.1% |
| Mexican | 92 | 0.7% |
| Moroccan | 120 | 0.9% |
| Native Hawaiian | 2 | 0.0% |
| Nicaraguan | 29 | 0.2% |
| Nigerian | 2 | 0.0% |
| Northern European | 9 | 0.1% |
| Norwegian | 95 | 0.7% |
| Pakistani | 208 | 1.5% |
| Panamanian | 44 | 0.3% |
| Peruvian | 338 | 2.4% |
| Polish | 386 | 2.8% |
| Portuguese | 52 | 0.4% |
| Puerto Rican | 225 | 1.6% |
| Romanian | 21 | 0.2% |
| Russian | 131 | 0.9% |
| Salvadoran | 550 | 4.0% |
| Scandinavian | 55 | 0.4% |
| Scotch-Irish | 132 | 0.9% |
| Scottish | 378 | 2.7% |
| Serbian | 47 | 0.3% |
| Sioux | 2 | 0.0% |
| Slavic | 6 | 0.0% |
| Slovak | 8 | 0.1% |
| Somali | 13 | 0.1% |
| South American | 539 | 3.9% |
| South American Indian | 4 | 0.0% |
| Spaniard | 5 | 0.0% |
| Spanish | 29 | 0.2% |
| Sri Lankan | 199 | 1.4% |
| Subsaharan African | 502 | 3.6% |
| Swedish | 124 | 0.9% |
| Swiss | 45 | 0.3% |
| Thai | 608 | 4.4% |
| Ukrainian | 66 | 0.5% |
| Uruguayan | 10 | 0.1% |
| Venezuelan | 91 | 0.6% |
| Welsh | 96 | 0.7% |
| West Indian | 43 | 0.3% | View All 96 Rows |
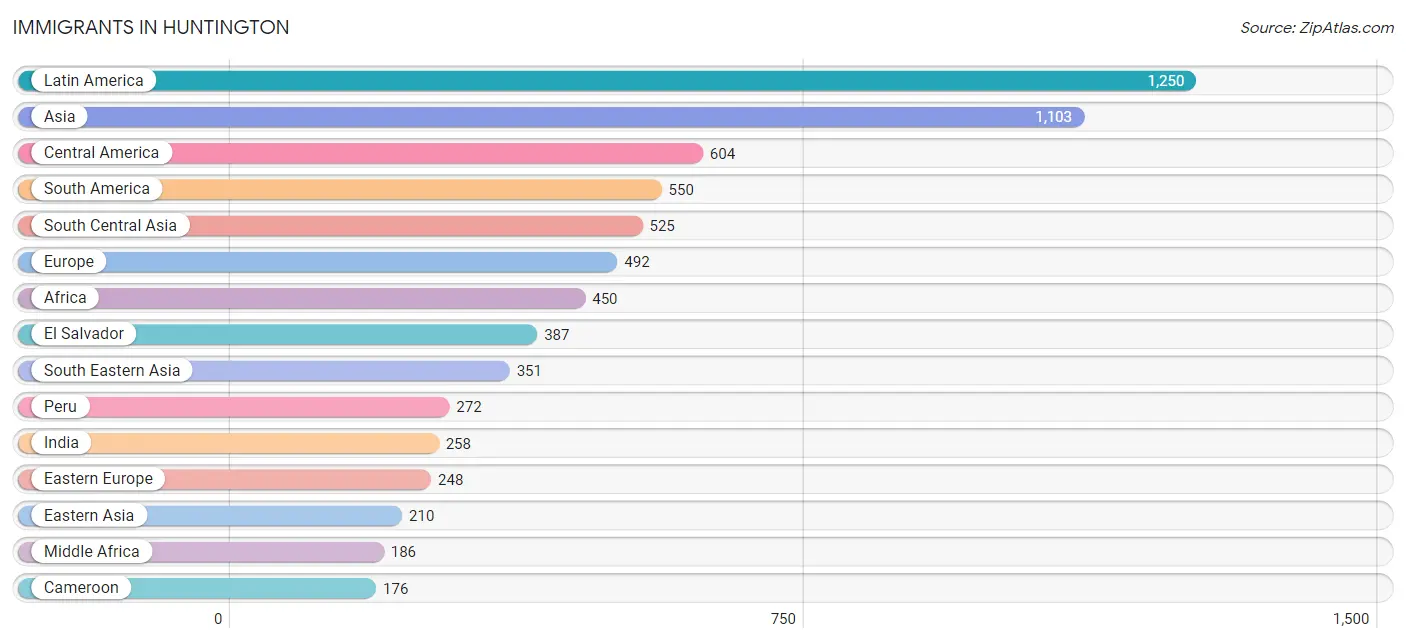
Immigrants in Huntington
The most numerous immigrant groups reported in Huntington came from Latin America (1,250 | 9.0%), Asia (1,103 | 7.9%), Central America (604 | 4.3%), South America (550 | 4.0%), and South Central Asia (525 | 3.8%), together accounting for 29.0% of all Huntington residents.
| Immigration Origin | # Population | % Population |
| Afghanistan | 131 | 0.9% |
| Africa | 450 | 3.2% |
| Albania | 17 | 0.1% |
| Asia | 1,103 | 7.9% |
| Bangladesh | 35 | 0.3% |
| Belarus | 26 | 0.2% |
| Bolivia | 47 | 0.3% |
| Bosnia and Herzegovina | 10 | 0.1% |
| Brazil | 59 | 0.4% |
| Bulgaria | 29 | 0.2% |
| Cameroon | 176 | 1.3% |
| Canada | 81 | 0.6% |
| Caribbean | 96 | 0.7% |
| Central America | 604 | 4.3% |
| China | 138 | 1.0% |
| Colombia | 25 | 0.2% |
| Costa Rica | 7 | 0.1% |
| Cuba | 10 | 0.1% |
| Dominican Republic | 16 | 0.1% |
| Eastern Africa | 107 | 0.8% |
| Eastern Asia | 210 | 1.5% |
| Eastern Europe | 248 | 1.8% |
| Ecuador | 8 | 0.1% |
| Egypt | 124 | 0.9% |
| El Salvador | 387 | 2.8% |
| England | 55 | 0.4% |
| Ethiopia | 107 | 0.8% |
| Europe | 492 | 3.5% |
| France | 6 | 0.0% |
| Germany | 33 | 0.2% |
| Grenada | 7 | 0.1% |
| Guatemala | 162 | 1.2% |
| Guyana | 38 | 0.3% |
| Honduras | 14 | 0.1% |
| Hong Kong | 9 | 0.1% |
| Hungary | 19 | 0.1% |
| India | 258 | 1.8% |
| Indonesia | 32 | 0.2% |
| Iran | 21 | 0.2% |
| Italy | 34 | 0.2% |
| Jamaica | 38 | 0.3% |
| Japan | 41 | 0.3% |
| Korea | 31 | 0.2% |
| Latin America | 1,250 | 9.0% |
| Latvia | 10 | 0.1% |
| Malaysia | 18 | 0.1% |
| Mexico | 5 | 0.0% |
| Middle Africa | 186 | 1.3% |
| Morocco | 4 | 0.0% |
| Netherlands | 6 | 0.0% |
| Nicaragua | 29 | 0.2% |
| Northern Africa | 128 | 0.9% |
| Northern Europe | 160 | 1.1% |
| Pakistan | 66 | 0.5% |
| Peru | 272 | 2.0% |
| Philippines | 56 | 0.4% |
| Poland | 3 | 0.0% |
| Russia | 69 | 0.5% |
| South Africa | 29 | 0.2% |
| South America | 550 | 4.0% |
| South Central Asia | 525 | 3.8% |
| South Eastern Asia | 351 | 2.5% |
| Southern Europe | 39 | 0.3% |
| Spain | 5 | 0.0% |
| Sri Lanka | 14 | 0.1% |
| Taiwan | 28 | 0.2% |
| Thailand | 109 | 0.8% |
| Trinidad and Tobago | 25 | 0.2% |
| Ukraine | 31 | 0.2% |
| Uruguay | 10 | 0.1% |
| Venezuela | 91 | 0.6% |
| Vietnam | 111 | 0.8% |
| Western Asia | 17 | 0.1% |
| Western Europe | 45 | 0.3% |
| Zaire | 10 | 0.1% | View All 75 Rows |
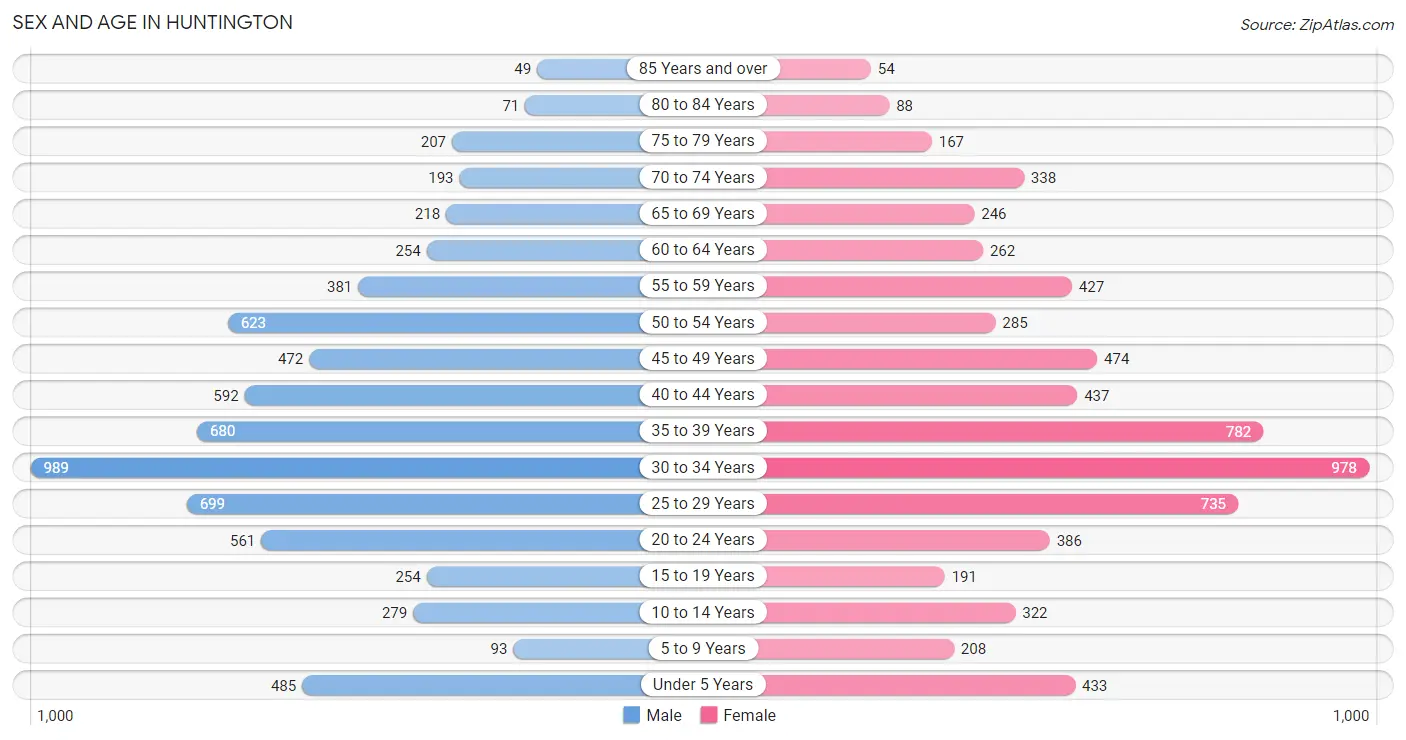
Sex and Age in Huntington
Sex and Age in Huntington
The most populous age groups in Huntington are 30 to 34 Years (989 | 13.9%) for men and 30 to 34 Years (978 | 14.3%) for women.
| Age Bracket | Male | Female |
| Under 5 Years | 485 (6.8%) | 433 (6.4%) |
| 5 to 9 Years | 93 (1.3%) | 208 (3.0%) |
| 10 to 14 Years | 279 (3.9%) | 322 (4.7%) |
| 15 to 19 Years | 254 (3.6%) | 191 (2.8%) |
| 20 to 24 Years | 561 (7.9%) | 386 (5.7%) |
| 25 to 29 Years | 699 (9.9%) | 735 (10.8%) |
| 30 to 34 Years | 989 (13.9%) | 978 (14.3%) |
| 35 to 39 Years | 680 (9.6%) | 782 (11.5%) |
| 40 to 44 Years | 592 (8.3%) | 437 (6.4%) |
| 45 to 49 Years | 472 (6.7%) | 474 (7.0%) |
| 50 to 54 Years | 623 (8.8%) | 285 (4.2%) |
| 55 to 59 Years | 381 (5.4%) | 427 (6.3%) |
| 60 to 64 Years | 254 (3.6%) | 262 (3.8%) |
| 65 to 69 Years | 218 (3.1%) | 246 (3.6%) |
| 70 to 74 Years | 193 (2.7%) | 338 (5.0%) |
| 75 to 79 Years | 207 (2.9%) | 167 (2.5%) |
| 80 to 84 Years | 71 (1.0%) | 88 (1.3%) |
| 85 Years and over | 49 (0.7%) | 54 (0.8%) |
| Total | 7,100 (100.0%) | 6,813 (100.0%) |
Families and Households in Huntington
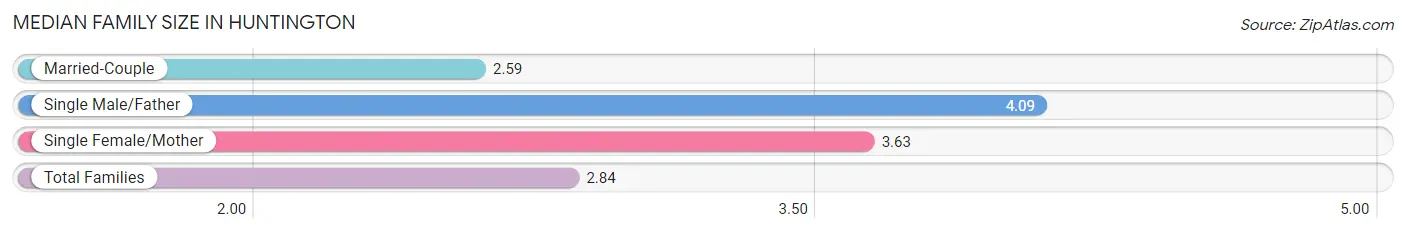
Median Family Size in Huntington
The median family size in Huntington is 2.84 persons per family, with single male/father families (158 | 5.4%) accounting for the largest median family size of 4.09 persons per family. On the other hand, married-couple families (2,282 | 77.7%) represent the smallest median family size with 2.59 persons per family.
| Family Type | # Families | Family Size |
| Married-Couple | 2,282 (77.7%) | 2.59 |
| Single Male/Father | 158 (5.4%) | 4.09 |
| Single Female/Mother | 497 (16.9%) | 3.63 |
| Total Families | 2,937 (100.0%) | 2.84 |
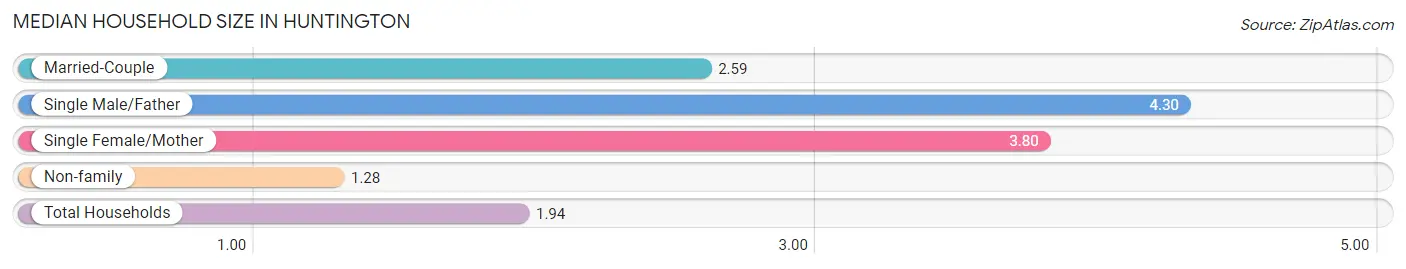
Median Household Size in Huntington
The median household size in Huntington is 1.94 persons per household, with single male/father households (158 | 2.2%) accounting for the largest median household size of 4.3 persons per household. non-family households (4,246 | 59.1%) represent the smallest median household size with 1.28 persons per household.
| Household Type | # Households | Household Size |
| Married-Couple | 2,282 (31.8%) | 2.59 |
| Single Male/Father | 158 (2.2%) | 4.30 |
| Single Female/Mother | 497 (6.9%) | 3.80 |
| Non-family | 4,246 (59.1%) | 1.28 |
| Total Households | 7,183 (100.0%) | 1.94 |
Household Size by Marriage Status in Huntington
Out of a total of 7,183 households in Huntington, 2,937 (40.9%) are family households, while 4,246 (59.1%) are nonfamily households. The most numerous type of family households are 2-person households, comprising 1,650, and the most common type of nonfamily households are 1-person households, comprising 3,372.
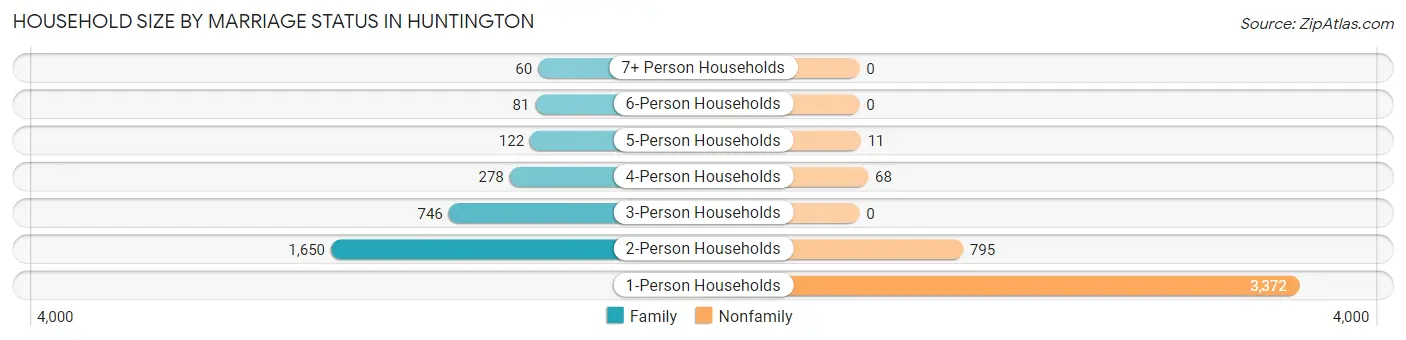
| Household Size | Family Households | Nonfamily Households |
| 1-Person Households | - | 3,372 (46.9%) |
| 2-Person Households | 1,650 (23.0%) | 795 (11.1%) |
| 3-Person Households | 746 (10.4%) | 0 (0.0%) |
| 4-Person Households | 278 (3.9%) | 68 (0.9%) |
| 5-Person Households | 122 (1.7%) | 11 (0.2%) |
| 6-Person Households | 81 (1.1%) | 0 (0.0%) |
| 7+ Person Households | 60 (0.8%) | 0 (0.0%) |
| Total | 2,937 (40.9%) | 4,246 (59.1%) |
Female Fertility in Huntington
Fertility by Age in Huntington
Average fertility rate in Huntington is 51.0 births per 1,000 women. Women in the age bracket of 20 to 34 years have the highest fertility rate with 78.0 births per 1,000 women. Women in the age bracket of 20 to 34 years acount for 79.9% of all women with births.
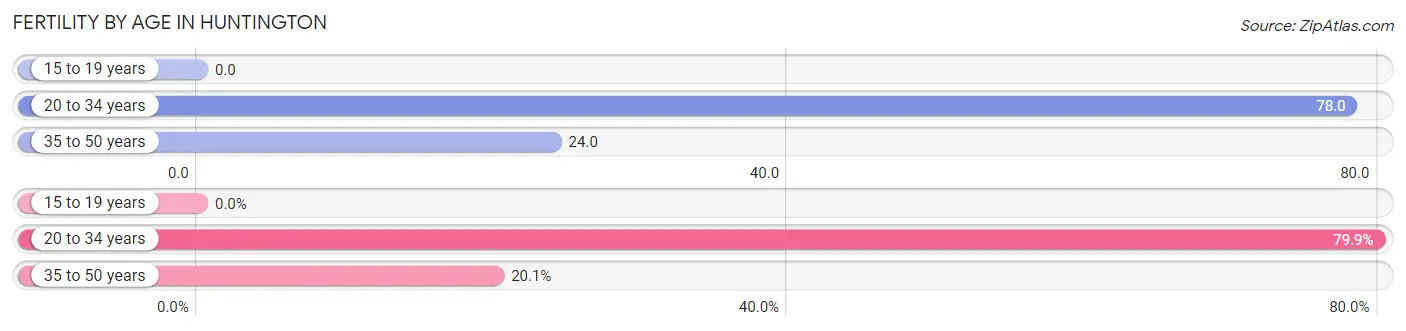
| Age Bracket | Women with Births | Births / 1,000 Women |
| 15 to 19 years | 0 (0.0%) | 0.0 |
| 20 to 34 years | 163 (79.9%) | 78.0 |
| 35 to 50 years | 41 (20.1%) | 24.0 |
| Total | 204 (100.0%) | 51.0 |
Fertility by Age by Marriage Status in Huntington
92.6% of women with births (204) in Huntington are married. The highest percentage of unmarried women with births falls into 35 to 50 years age bracket with 36.6% of them unmarried at the time of birth, while the lowest percentage of unmarried women with births belong to 20 to 34 years age bracket with 0.0% of them unmarried.
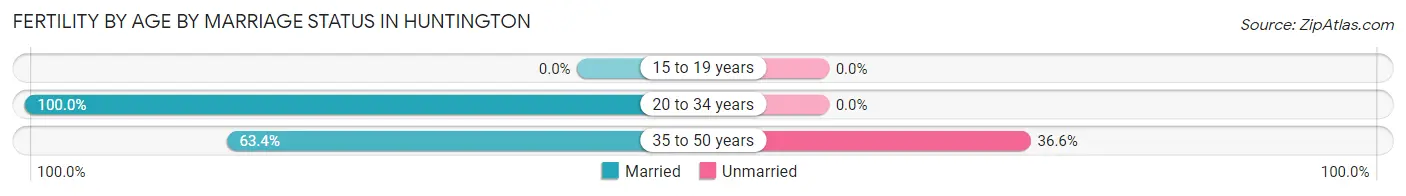
| Age Bracket | Married | Unmarried |
| 15 to 19 years | 0 (0.0%) | 0 (0.0%) |
| 20 to 34 years | 163 (100.0%) | 0 (0.0%) |
| 35 to 50 years | 26 (63.4%) | 15 (36.6%) |
| Total | 189 (92.6%) | 15 (7.3%) |
Fertility by Education in Huntington
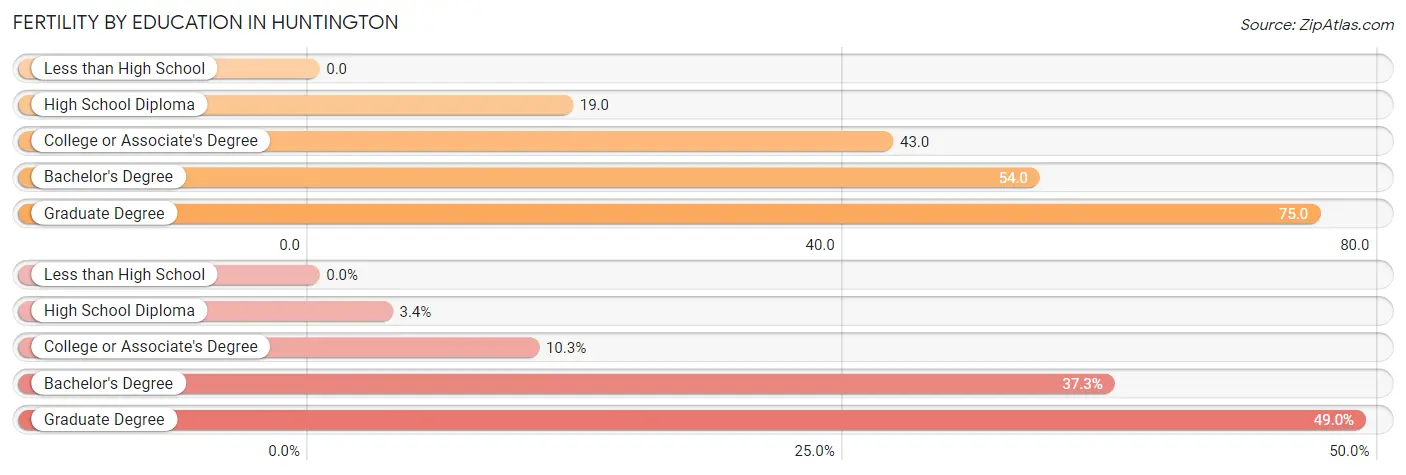
| Educational Attainment | Women with Births | Births / 1,000 Women |
| Less than High School | 0 (0.0%) | 0.0 |
| High School Diploma | 7 (3.4%) | 19.0 |
| College or Associate's Degree | 21 (10.3%) | 43.0 |
| Bachelor's Degree | 76 (37.2%) | 54.0 |
| Graduate Degree | 100 (49.0%) | 75.0 |
| Total | 204 (100.0%) | 51.0 |
Fertility by Education by Marriage Status in Huntington
7.3% of women with births in Huntington are unmarried. Women with the educational attainment of high school diploma are most likely to be married with 100.0% of them married at childbirth, while women with the educational attainment of graduate degree are least likely to be married with 15.0% of them unmarried at childbirth.
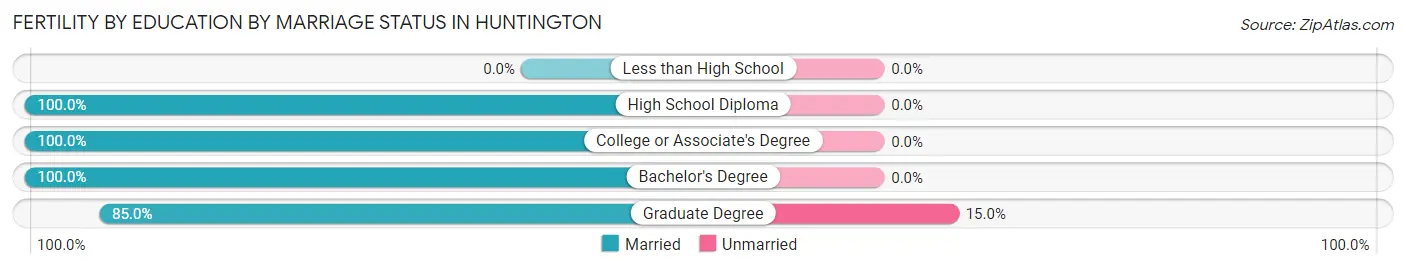
| Educational Attainment | Married | Unmarried |
| Less than High School | 0 (0.0%) | 0 (0.0%) |
| High School Diploma | 7 (100.0%) | 0 (0.0%) |
| College or Associate's Degree | 21 (100.0%) | 0 (0.0%) |
| Bachelor's Degree | 76 (100.0%) | 0 (0.0%) |
| Graduate Degree | 85 (85.0%) | 15 (15.0%) |
| Total | 189 (92.6%) | 15 (7.3%) |
Employment Characteristics in Huntington
Employment by Class of Employer in Huntington
Among the 9,337 employed individuals in Huntington, private company employees (4,173 | 44.7%), federal government employees (2,660 | 28.5%), and not-for-profit organizations (1,042 | 11.2%) make up the most common classes of employment.
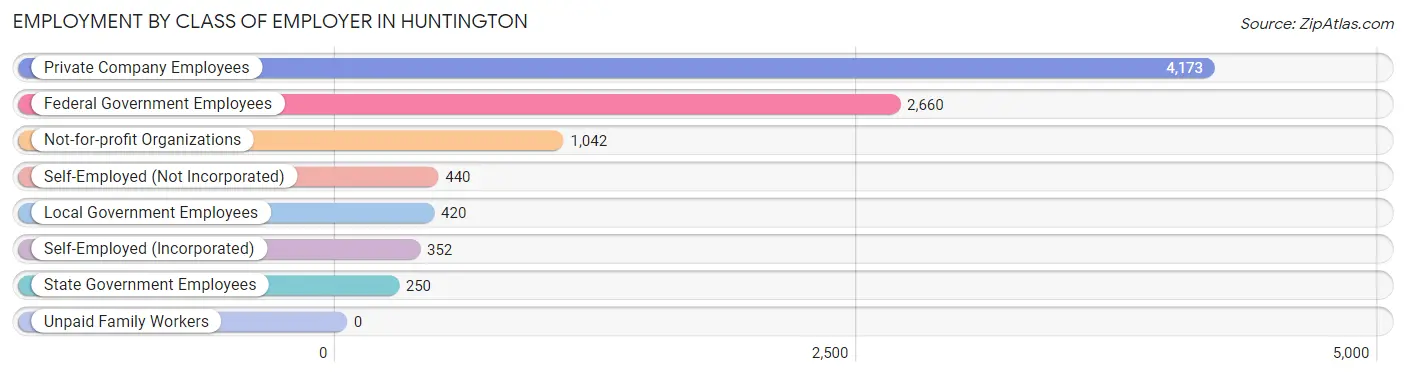
| Employer Class | # Employees | % Employees |
| Private Company Employees | 4,173 | 44.7% |
| Self-Employed (Incorporated) | 352 | 3.8% |
| Self-Employed (Not Incorporated) | 440 | 4.7% |
| Not-for-profit Organizations | 1,042 | 11.2% |
| Local Government Employees | 420 | 4.5% |
| State Government Employees | 250 | 2.7% |
| Federal Government Employees | 2,660 | 28.5% |
| Unpaid Family Workers | 0 | 0.0% |
| Total | 9,337 | 100.0% |
Employment Status by Age in Huntington
According to the labor force statistics for Huntington, out of the total population over 16 years of age (11,978), 82.0% or 9,822 individuals are in the labor force, with 3.9% or 383 of them unemployed. The age group with the highest labor force participation rate is 45 to 54 years, with 95.0% or 1,761 individuals in the labor force. Within the labor force, the 16 to 19 years age range has the highest percentage of unemployed individuals, with 15.8% or 17 of them being unemployed.
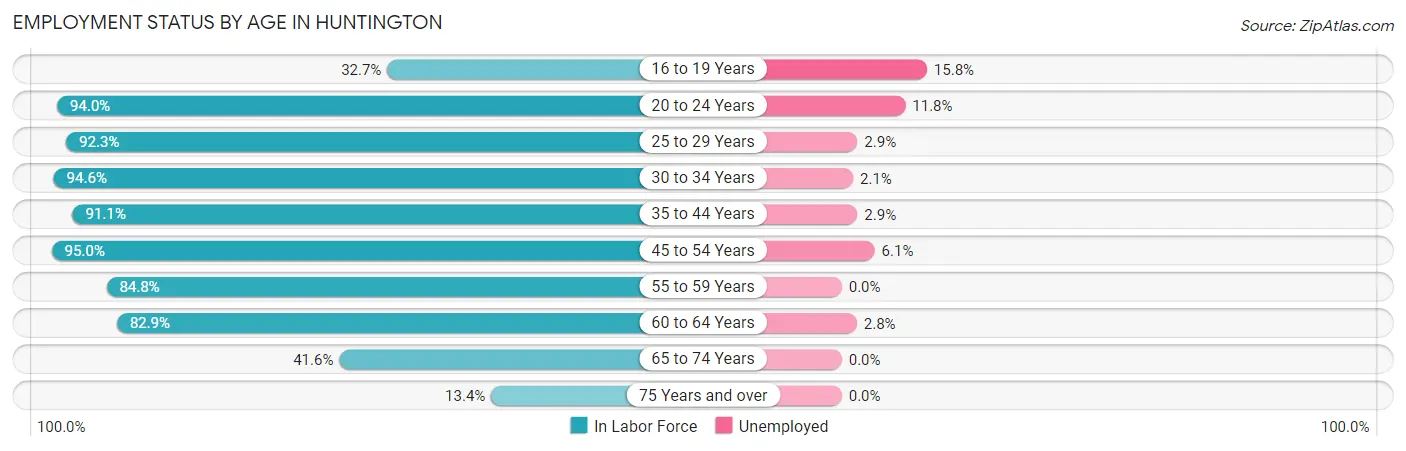
| Age Bracket | In Labor Force | Unemployed |
| 16 to 19 Years | 108 (32.7%) | 17 (15.8%) |
| 20 to 24 Years | 890 (94.0%) | 105 (11.8%) |
| 25 to 29 Years | 1,324 (92.3%) | 38 (2.9%) |
| 30 to 34 Years | 1,861 (94.6%) | 39 (2.1%) |
| 35 to 44 Years | 2,269 (91.1%) | 66 (2.9%) |
| 45 to 54 Years | 1,761 (95.0%) | 107 (6.1%) |
| 55 to 59 Years | 685 (84.8%) | 0 (0.0%) |
| 60 to 64 Years | 428 (82.9%) | 12 (2.8%) |
| 65 to 74 Years | 414 (41.6%) | 0 (0.0%) |
| 75 Years and over | 85 (13.4%) | 0 (0.0%) |
| Total | 9,822 (82.0%) | 383 (3.9%) |
Employment Status by Educational Attainment in Huntington
According to labor force statistics for Huntington, 91.8% of individuals (8,326) out of the total population between 25 and 64 years of age (9,070) are in the labor force, with 3.1% or 258 of them being unemployed. The group with the highest labor force participation rate are those with the educational attainment of bachelor's degree or higher, with 95.3% or 5,972 individuals in the labor force. Within the labor force, individuals with high school diploma education have the highest percentage of unemployment, with 9.2% or 71 of them being unemployed.
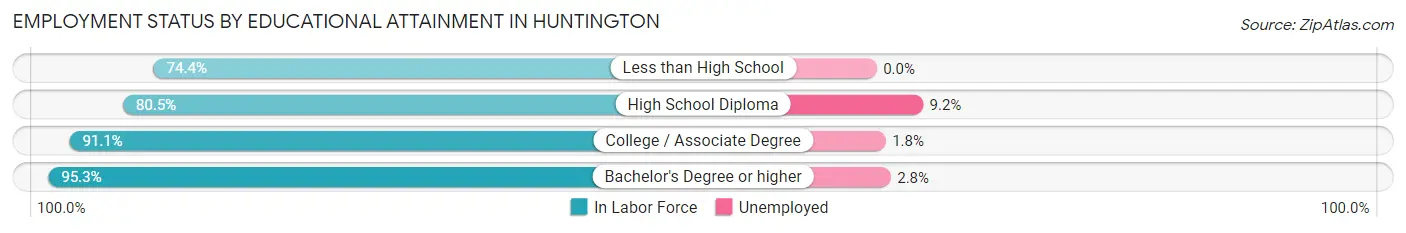
| Educational Attainment | In Labor Force | Unemployed |
| Less than High School | 419 (74.4%) | 0 (0.0%) |
| High School Diploma | 774 (80.5%) | 88 (9.2%) |
| College / Associate Degree | 1,165 (91.1%) | 23 (1.8%) |
| Bachelor's Degree or higher | 5,972 (95.3%) | 175 (2.8%) |
| Total | 8,326 (91.8%) | 281 (3.1%) |
Employment Occupations by Sex in Huntington
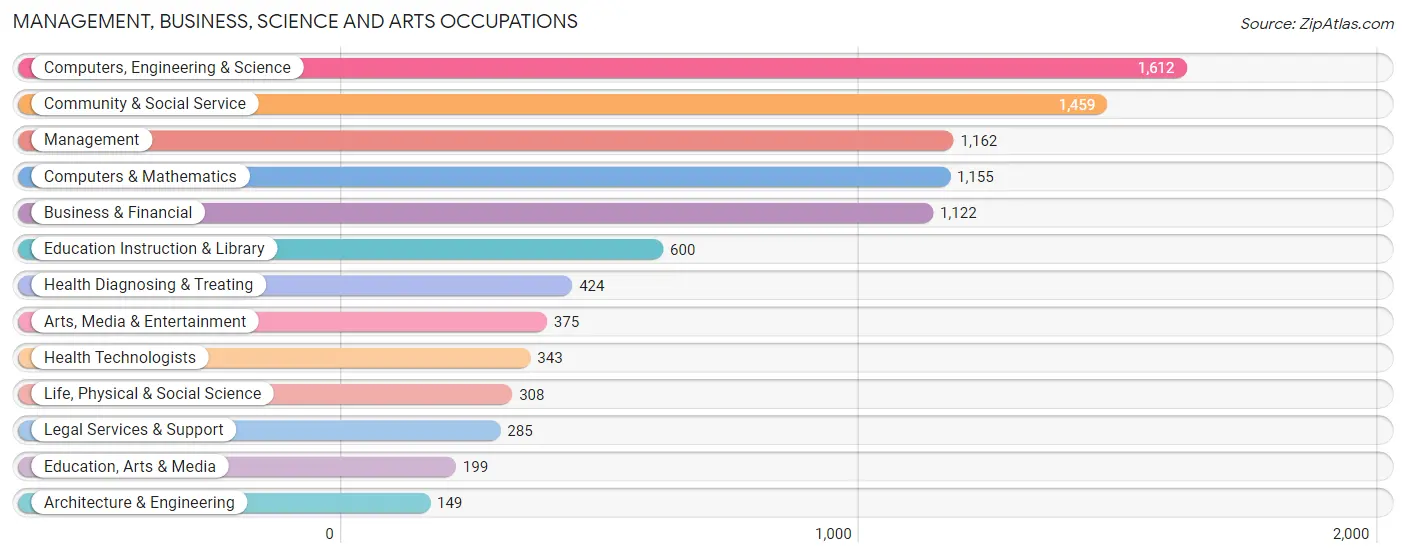
Management, Business, Science and Arts Occupations
The most common Management, Business, Science and Arts occupations in Huntington are Computers, Engineering & Science (1,612 | 17.9%), Community & Social Service (1,459 | 16.2%), Management (1,162 | 12.9%), Computers & Mathematics (1,155 | 12.8%), and Business & Financial (1,122 | 12.5%).
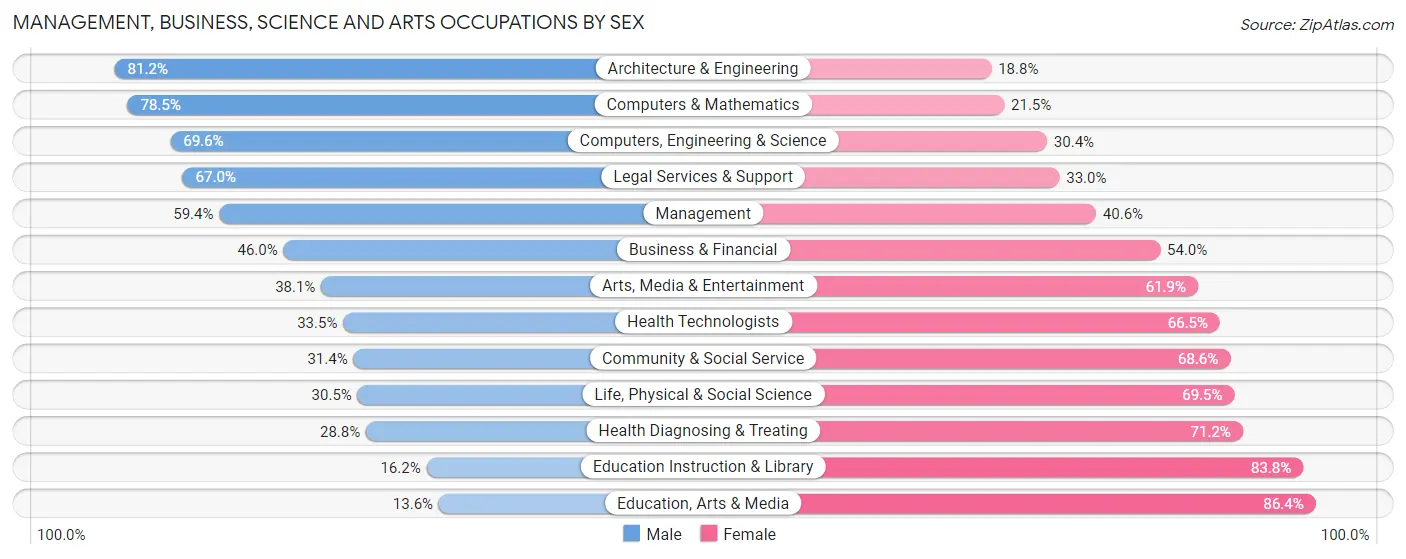
Management, Business, Science and Arts Occupations by Sex
Within the Management, Business, Science and Arts occupations in Huntington, the most male-oriented occupations are Architecture & Engineering (81.2%), Computers & Mathematics (78.5%), and Computers, Engineering & Science (69.6%), while the most female-oriented occupations are Education, Arts & Media (86.4%), Education Instruction & Library (83.8%), and Health Diagnosing & Treating (71.2%).
| Occupation | Male | Female |
| Management | 690 (59.4%) | 472 (40.6%) |
| Business & Financial | 516 (46.0%) | 606 (54.0%) |
| Computers, Engineering & Science | 1,122 (69.6%) | 490 (30.4%) |
| Computers & Mathematics | 907 (78.5%) | 248 (21.5%) |
| Architecture & Engineering | 121 (81.2%) | 28 (18.8%) |
| Life, Physical & Social Science | 94 (30.5%) | 214 (69.5%) |
| Community & Social Service | 458 (31.4%) | 1,001 (68.6%) |
| Education, Arts & Media | 27 (13.6%) | 172 (86.4%) |
| Legal Services & Support | 191 (67.0%) | 94 (33.0%) |
| Education Instruction & Library | 97 (16.2%) | 503 (83.8%) |
| Arts, Media & Entertainment | 143 (38.1%) | 232 (61.9%) |
| Health Diagnosing & Treating | 122 (28.8%) | 302 (71.2%) |
| Health Technologists | 115 (33.5%) | 228 (66.5%) |
| Total (Category) | 2,908 (50.3%) | 2,871 (49.7%) |
| Total (Overall) | 4,761 (52.9%) | 4,245 (47.1%) |
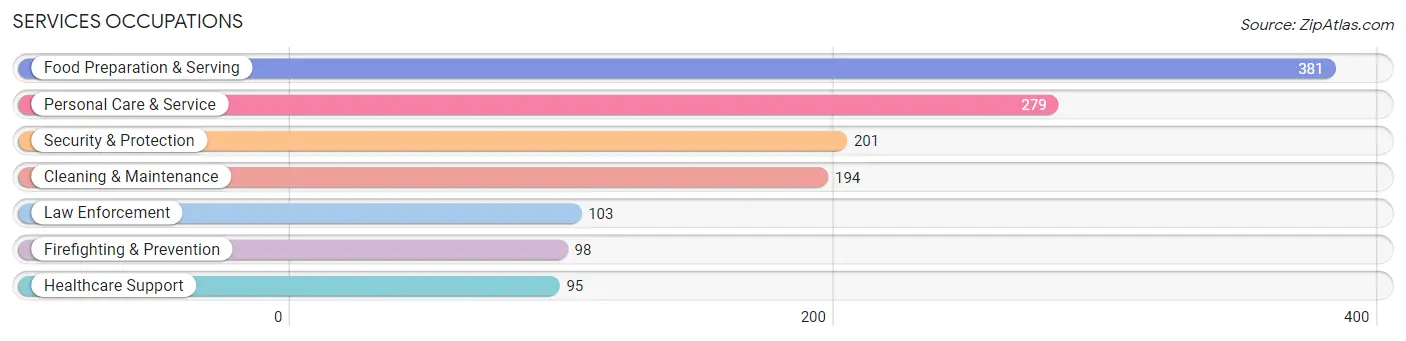
Services Occupations
The most common Services occupations in Huntington are Food Preparation & Serving (381 | 4.2%), Personal Care & Service (279 | 3.1%), Security & Protection (201 | 2.2%), Cleaning & Maintenance (194 | 2.1%), and Law Enforcement (103 | 1.1%).
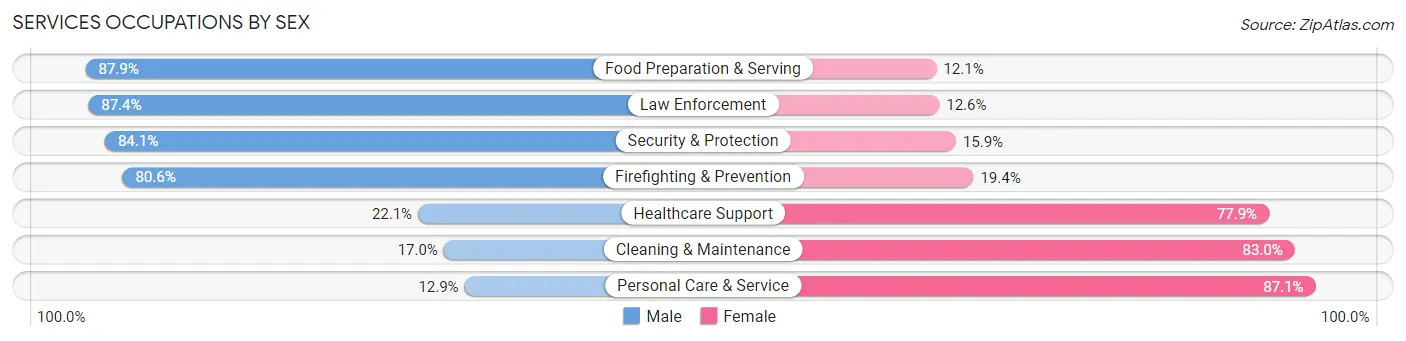
Services Occupations by Sex
Within the Services occupations in Huntington, the most male-oriented occupations are Food Preparation & Serving (87.9%), Law Enforcement (87.4%), and Security & Protection (84.1%), while the most female-oriented occupations are Personal Care & Service (87.1%), Cleaning & Maintenance (83.0%), and Healthcare Support (77.9%).
| Occupation | Male | Female |
| Healthcare Support | 21 (22.1%) | 74 (77.9%) |
| Security & Protection | 169 (84.1%) | 32 (15.9%) |
| Firefighting & Prevention | 79 (80.6%) | 19 (19.4%) |
| Law Enforcement | 90 (87.4%) | 13 (12.6%) |
| Food Preparation & Serving | 335 (87.9%) | 46 (12.1%) |
| Cleaning & Maintenance | 33 (17.0%) | 161 (83.0%) |
| Personal Care & Service | 36 (12.9%) | 243 (87.1%) |
| Total (Category) | 594 (51.6%) | 556 (48.3%) |
| Total (Overall) | 4,761 (52.9%) | 4,245 (47.1%) |
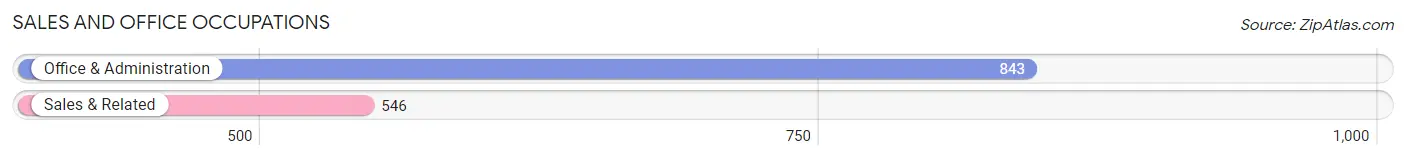
Sales and Office Occupations
The most common Sales and Office occupations in Huntington are Office & Administration (843 | 9.4%), and Sales & Related (546 | 6.1%).
Sales and Office Occupations by Sex
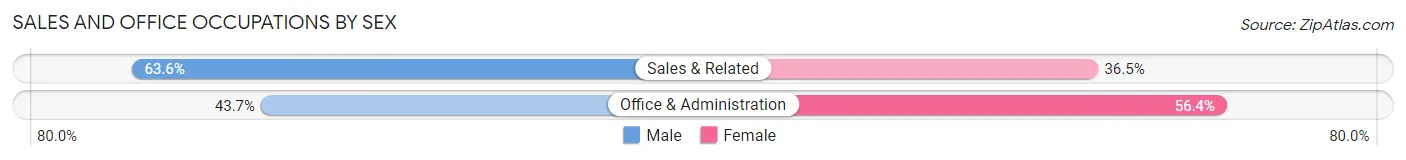
| Occupation | Male | Female |
| Sales & Related | 347 (63.5%) | 199 (36.4%) |
| Office & Administration | 368 (43.6%) | 475 (56.4%) |
| Total (Category) | 715 (51.5%) | 674 (48.5%) |
| Total (Overall) | 4,761 (52.9%) | 4,245 (47.1%) |
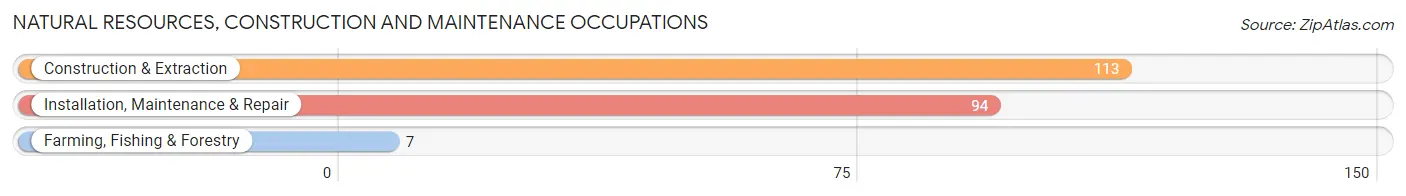
Natural Resources, Construction and Maintenance Occupations
The most common Natural Resources, Construction and Maintenance occupations in Huntington are Construction & Extraction (113 | 1.3%), Installation, Maintenance & Repair (94 | 1.0%), and Farming, Fishing & Forestry (7 | 0.1%).
Natural Resources, Construction and Maintenance Occupations by Sex
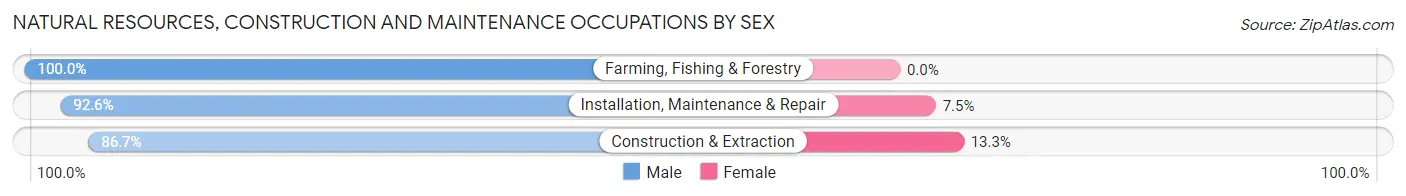
| Occupation | Male | Female |
| Farming, Fishing & Forestry | 7 (100.0%) | 0 (0.0%) |
| Construction & Extraction | 98 (86.7%) | 15 (13.3%) |
| Installation, Maintenance & Repair | 87 (92.5%) | 7 (7.4%) |
| Total (Category) | 192 (89.7%) | 22 (10.3%) |
| Total (Overall) | 4,761 (52.9%) | 4,245 (47.1%) |
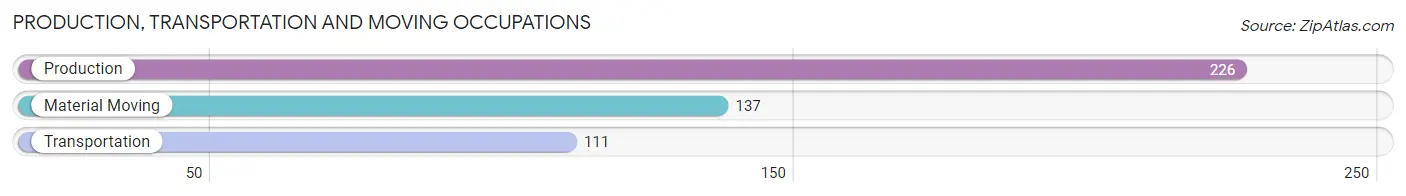
Production, Transportation and Moving Occupations
The most common Production, Transportation and Moving occupations in Huntington are Production (226 | 2.5%), Material Moving (137 | 1.5%), and Transportation (111 | 1.2%).
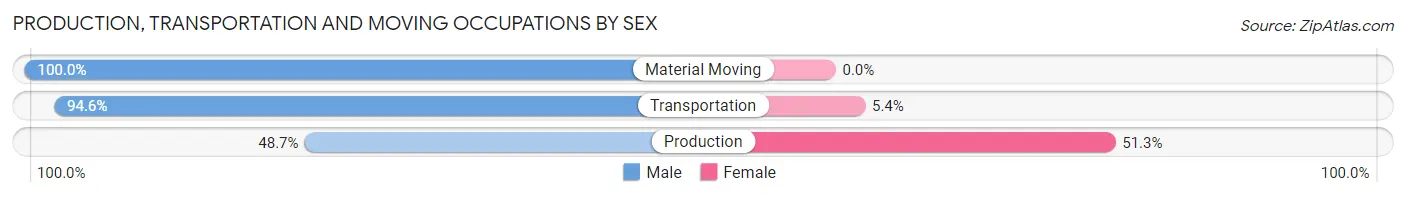
Production, Transportation and Moving Occupations by Sex
| Occupation | Male | Female |
| Production | 110 (48.7%) | 116 (51.3%) |
| Transportation | 105 (94.6%) | 6 (5.4%) |
| Material Moving | 137 (100.0%) | 0 (0.0%) |
| Total (Category) | 352 (74.3%) | 122 (25.7%) |
| Total (Overall) | 4,761 (52.9%) | 4,245 (47.1%) |
Employment Industries by Sex in Huntington
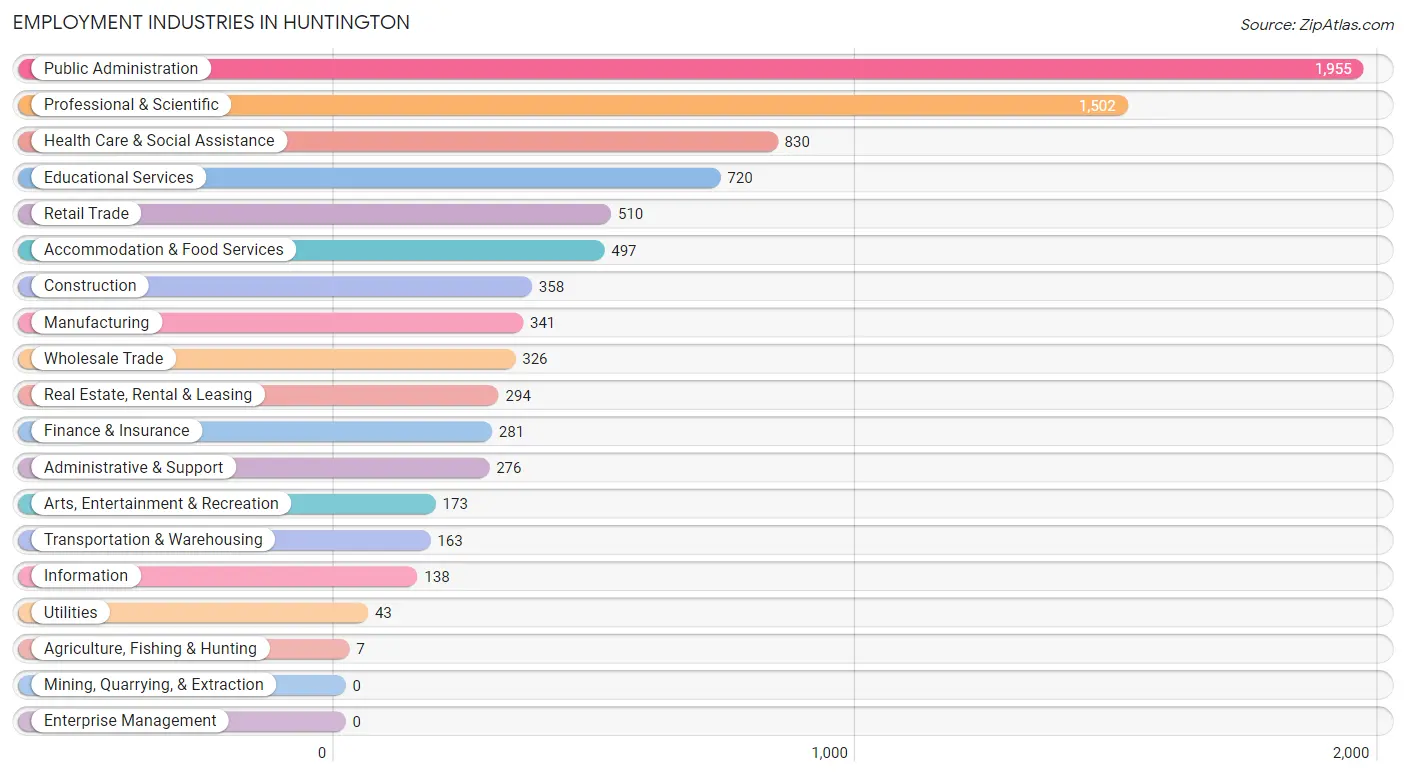
Employment Industries in Huntington
The major employment industries in Huntington include Public Administration (1,955 | 21.7%), Professional & Scientific (1,502 | 16.7%), Health Care & Social Assistance (830 | 9.2%), Educational Services (720 | 8.0%), and Retail Trade (510 | 5.7%).
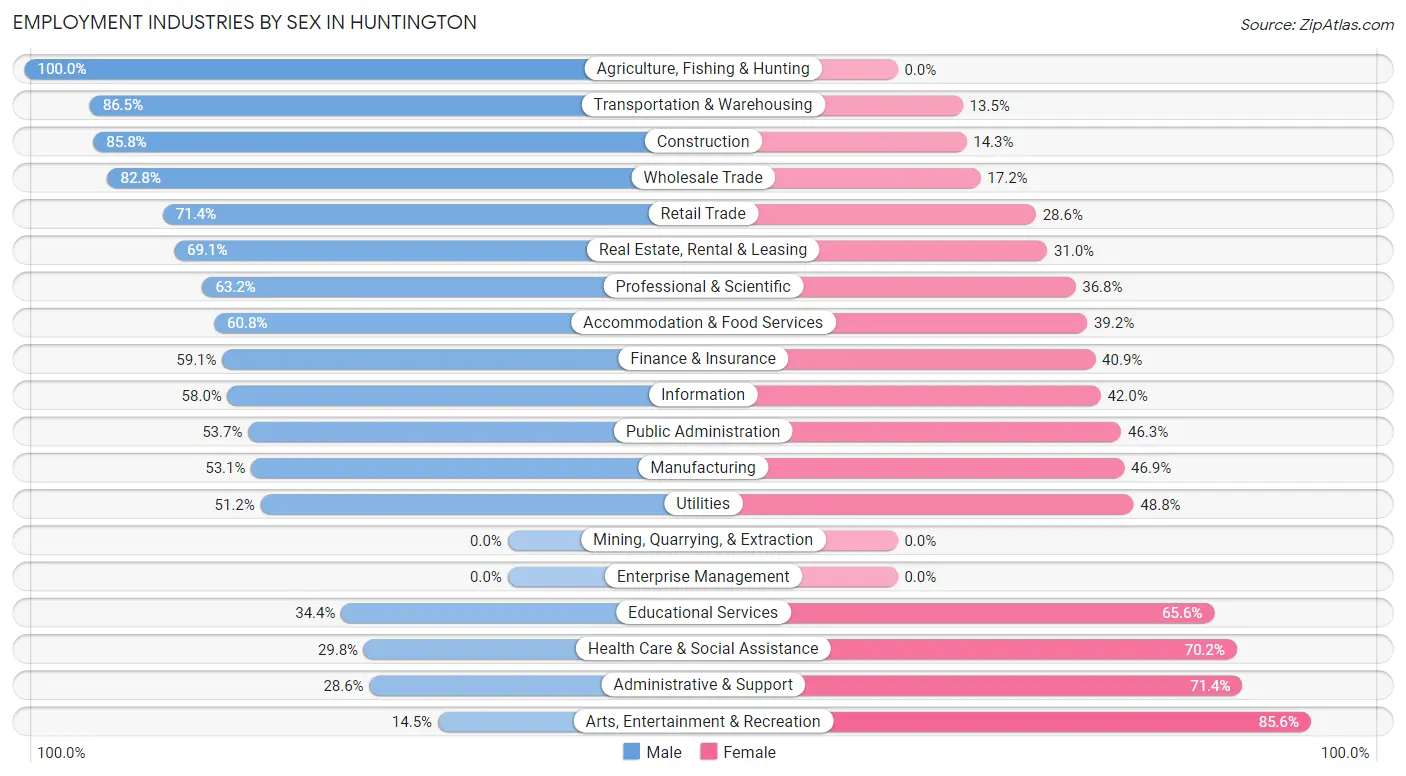
Employment Industries by Sex in Huntington
The Huntington industries that see more men than women are Agriculture, Fishing & Hunting (100.0%), Transportation & Warehousing (86.5%), and Construction (85.8%), whereas the industries that tend to have a higher number of women are Arts, Entertainment & Recreation (85.6%), Administrative & Support (71.4%), and Health Care & Social Assistance (70.2%).
| Industry | Male | Female |
| Agriculture, Fishing & Hunting | 7 (100.0%) | 0 (0.0%) |
| Mining, Quarrying, & Extraction | 0 (0.0%) | 0 (0.0%) |
| Construction | 307 (85.8%) | 51 (14.2%) |
| Manufacturing | 181 (53.1%) | 160 (46.9%) |
| Wholesale Trade | 270 (82.8%) | 56 (17.2%) |
| Retail Trade | 364 (71.4%) | 146 (28.6%) |
| Transportation & Warehousing | 141 (86.5%) | 22 (13.5%) |
| Utilities | 22 (51.2%) | 21 (48.8%) |
| Information | 80 (58.0%) | 58 (42.0%) |
| Finance & Insurance | 166 (59.1%) | 115 (40.9%) |
| Real Estate, Rental & Leasing | 203 (69.1%) | 91 (30.9%) |
| Professional & Scientific | 949 (63.2%) | 553 (36.8%) |
| Enterprise Management | 0 (0.0%) | 0 (0.0%) |
| Administrative & Support | 79 (28.6%) | 197 (71.4%) |
| Educational Services | 248 (34.4%) | 472 (65.6%) |
| Health Care & Social Assistance | 247 (29.8%) | 583 (70.2%) |
| Arts, Entertainment & Recreation | 25 (14.4%) | 148 (85.6%) |
| Accommodation & Food Services | 302 (60.8%) | 195 (39.2%) |
| Public Administration | 1,050 (53.7%) | 905 (46.3%) |
| Total | 4,761 (52.9%) | 4,245 (47.1%) |
Education in Huntington
School Enrollment in Huntington
The most common levels of schooling among the 2,598 students in Huntington are college / undergraduate (642 | 24.7%), graduate / professional (574 | 22.1%), and middle school (499 | 19.2%).
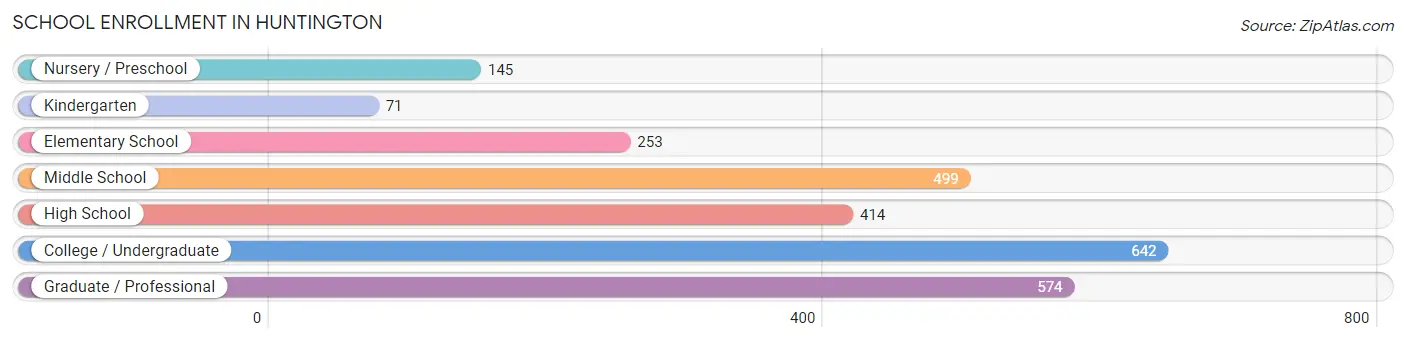
| School Level | # Students | % Students |
| Nursery / Preschool | 145 | 5.6% |
| Kindergarten | 71 | 2.7% |
| Elementary School | 253 | 9.7% |
| Middle School | 499 | 19.2% |
| High School | 414 | 15.9% |
| College / Undergraduate | 642 | 24.7% |
| Graduate / Professional | 574 | 22.1% |
| Total | 2,598 | 100.0% |
School Enrollment by Age by Funding Source in Huntington
Out of a total of 2,598 students who are enrolled in schools in Huntington, 598 (23.0%) attend a private institution, while the remaining 2,000 (77.0%) are enrolled in public schools. The age group of 3 to 4 year olds has the highest likelihood of being enrolled in private schools, with 80 (55.2% in the age bracket) enrolled. Conversely, the age group of 5 to 9 year old has the lowest likelihood of being enrolled in a private school, with 283 (95.6% in the age bracket) attending a public institution.
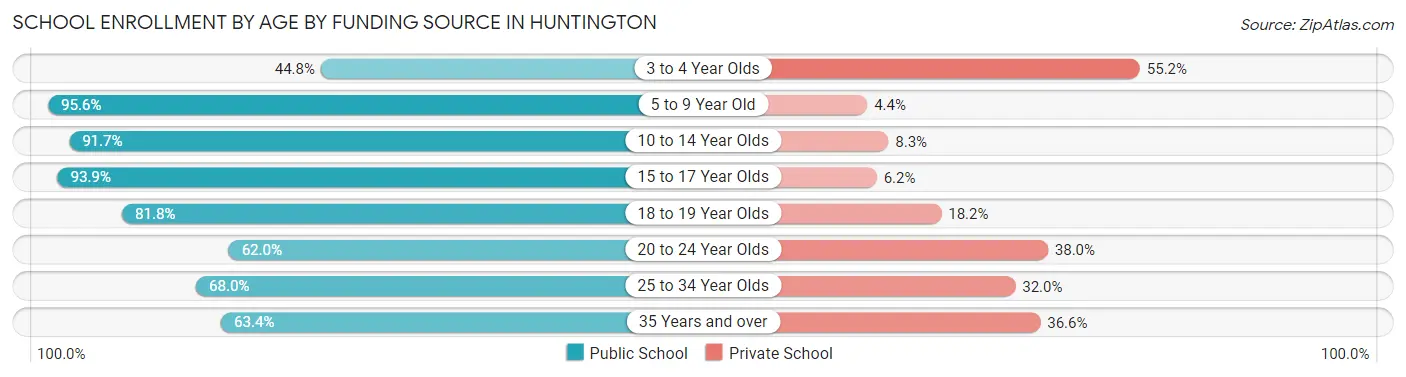
| Age Bracket | Public School | Private School |
| 3 to 4 Year Olds | 65 (44.8%) | 80 (55.2%) |
| 5 to 9 Year Old | 283 (95.6%) | 13 (4.4%) |
| 10 to 14 Year Olds | 551 (91.7%) | 50 (8.3%) |
| 15 to 17 Year Olds | 229 (93.9%) | 15 (6.1%) |
| 18 to 19 Year Olds | 117 (81.8%) | 26 (18.2%) |
| 20 to 24 Year Olds | 176 (62.0%) | 108 (38.0%) |
| 25 to 34 Year Olds | 264 (68.0%) | 124 (32.0%) |
| 35 Years and over | 315 (63.4%) | 182 (36.6%) |
| Total | 2,000 (77.0%) | 598 (23.0%) |
Educational Attainment by Field of Study in Huntington
Social sciences (1,401 | 17.2%), business (1,206 | 14.8%), arts & humanities (820 | 10.1%), science & technology (532 | 6.5%), and engineering (521 | 6.4%) are the most common fields of study among 8,140 individuals in Huntington who have obtained a bachelor's degree or higher.
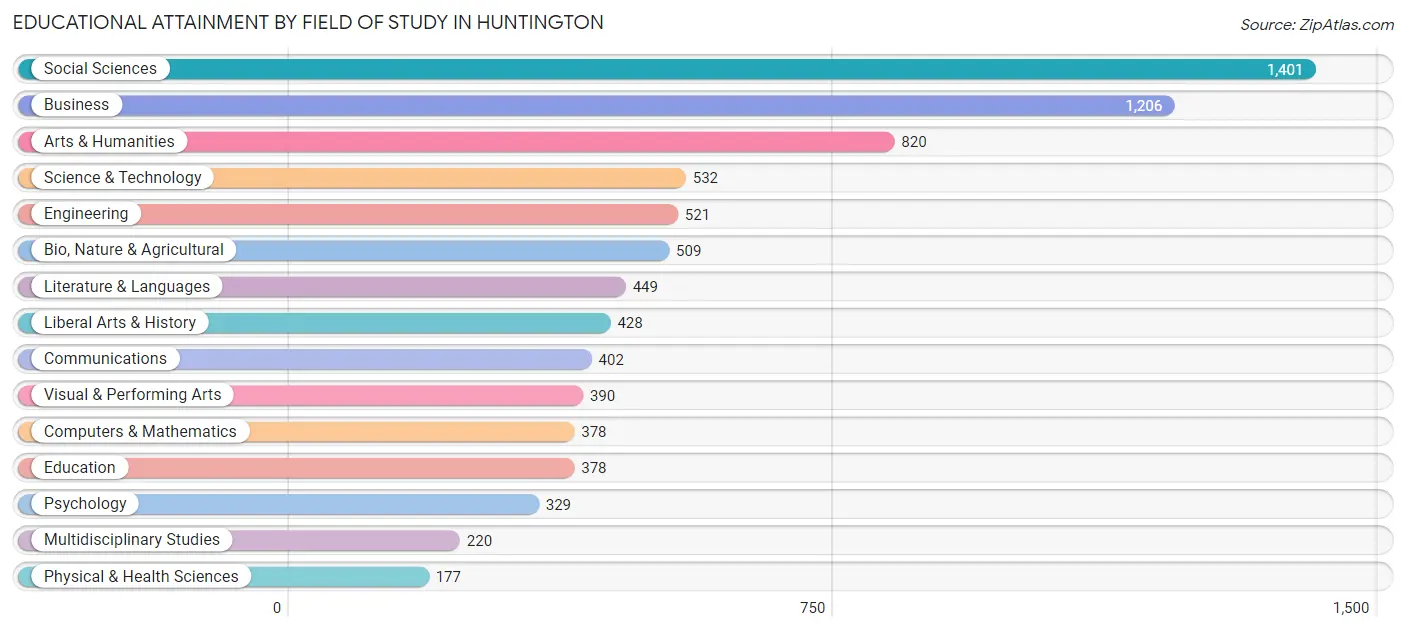
| Field of Study | # Graduates | % Graduates |
| Computers & Mathematics | 378 | 4.6% |
| Bio, Nature & Agricultural | 509 | 6.2% |
| Physical & Health Sciences | 177 | 2.2% |
| Psychology | 329 | 4.0% |
| Social Sciences | 1,401 | 17.2% |
| Engineering | 521 | 6.4% |
| Multidisciplinary Studies | 220 | 2.7% |
| Science & Technology | 532 | 6.5% |
| Business | 1,206 | 14.8% |
| Education | 378 | 4.6% |
| Literature & Languages | 449 | 5.5% |
| Liberal Arts & History | 428 | 5.3% |
| Visual & Performing Arts | 390 | 4.8% |
| Communications | 402 | 4.9% |
| Arts & Humanities | 820 | 10.1% |
| Total | 8,140 | 100.0% |
Transportation & Commute in Huntington
Vehicle Availability by Sex in Huntington
The most prevalent vehicle ownership categories in Huntington are males with 2 vehicles (2,177, accounting for 43.1%) and females with 2 vehicles (1,682, making up 50.8%).
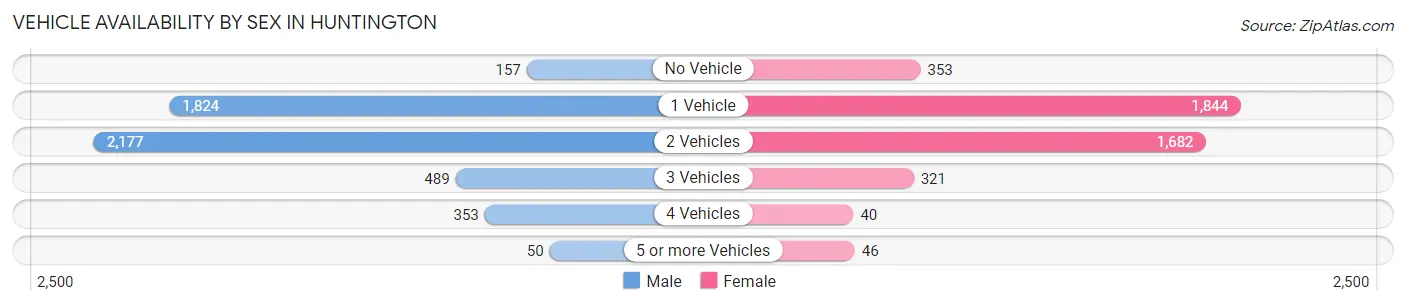
| Vehicles Available | Male | Female |
| No Vehicle | 157 (3.1%) | 353 (8.2%) |
| 1 Vehicle | 1,824 (36.1%) | 1,844 (43.0%) |
| 2 Vehicles | 2,177 (43.1%) | 1,682 (39.2%) |
| 3 Vehicles | 489 (9.7%) | 321 (7.5%) |
| 4 Vehicles | 353 (7.0%) | 40 (0.9%) |
| 5 or more Vehicles | 50 (1.0%) | 46 (1.1%) |
| Total | 5,050 (100.0%) | 4,286 (100.0%) |
Commute Time in Huntington
The most frequently occuring commute durations in Huntington are 45 to 59 minutes (1,521 commuters, 21.1%), 30 to 34 minutes (1,353 commuters, 18.8%), and 20 to 24 minutes (1,109 commuters, 15.4%).
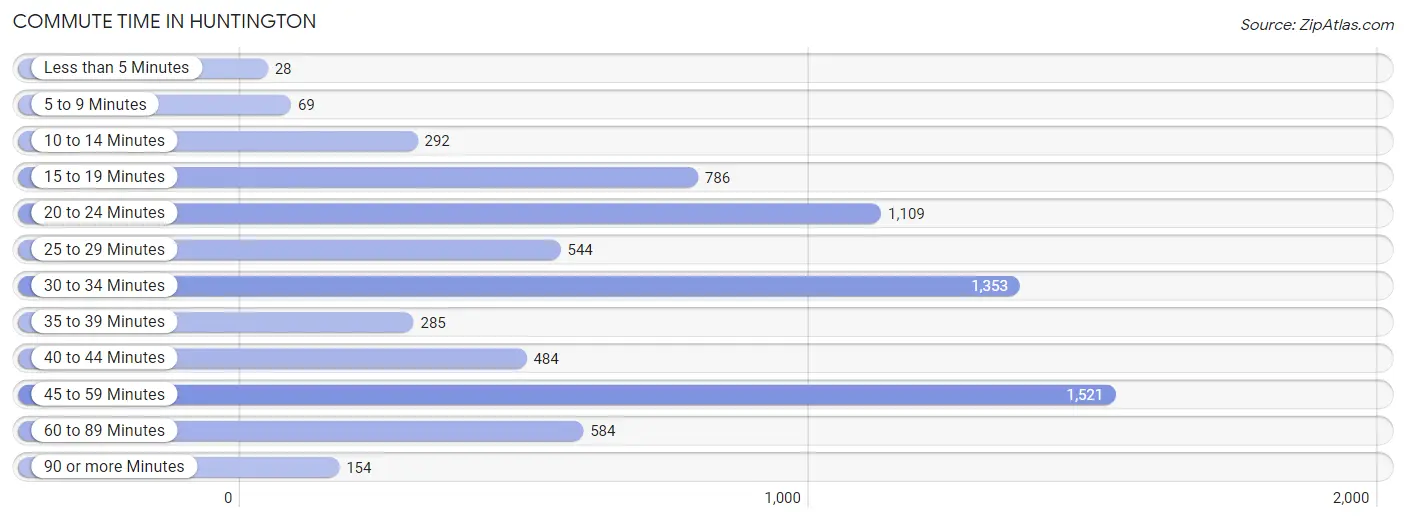
| Commute Time | # Commuters | % Commuters |
| Less than 5 Minutes | 28 | 0.4% |
| 5 to 9 Minutes | 69 | 1.0% |
| 10 to 14 Minutes | 292 | 4.1% |
| 15 to 19 Minutes | 786 | 10.9% |
| 20 to 24 Minutes | 1,109 | 15.4% |
| 25 to 29 Minutes | 544 | 7.5% |
| 30 to 34 Minutes | 1,353 | 18.8% |
| 35 to 39 Minutes | 285 | 4.0% |
| 40 to 44 Minutes | 484 | 6.7% |
| 45 to 59 Minutes | 1,521 | 21.1% |
| 60 to 89 Minutes | 584 | 8.1% |
| 90 or more Minutes | 154 | 2.1% |
Commute Time by Sex in Huntington
The most common commute times in Huntington are 45 to 59 minutes (971 commuters, 24.4%) for males and 30 to 34 minutes (675 commuters, 20.9%) for females.
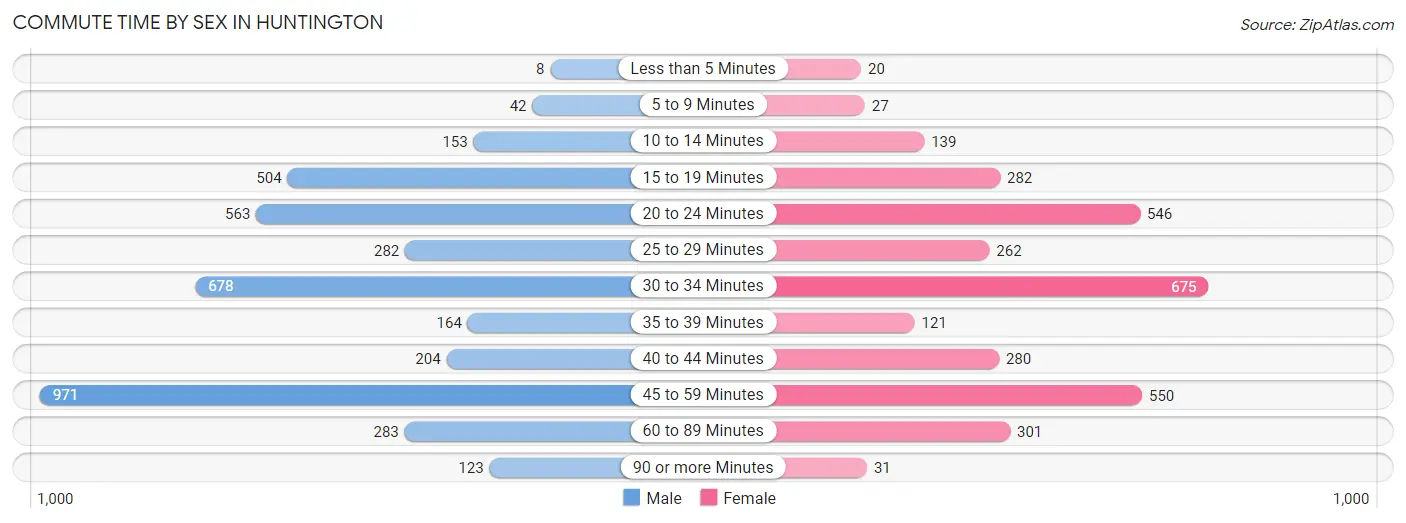
| Commute Time | Male | Female |
| Less than 5 Minutes | 8 (0.2%) | 20 (0.6%) |
| 5 to 9 Minutes | 42 (1.1%) | 27 (0.8%) |
| 10 to 14 Minutes | 153 (3.8%) | 139 (4.3%) |
| 15 to 19 Minutes | 504 (12.7%) | 282 (8.7%) |
| 20 to 24 Minutes | 563 (14.2%) | 546 (16.9%) |
| 25 to 29 Minutes | 282 (7.1%) | 262 (8.1%) |
| 30 to 34 Minutes | 678 (17.1%) | 675 (20.9%) |
| 35 to 39 Minutes | 164 (4.1%) | 121 (3.7%) |
| 40 to 44 Minutes | 204 (5.1%) | 280 (8.7%) |
| 45 to 59 Minutes | 971 (24.4%) | 550 (17.0%) |
| 60 to 89 Minutes | 283 (7.1%) | 301 (9.3%) |
| 90 or more Minutes | 123 (3.1%) | 31 (1.0%) |
Time of Departure to Work by Sex in Huntington
The most frequent times of departure to work in Huntington are 7:00 AM to 7:29 AM (688, 17.3%) for males and 7:30 AM to 7:59 AM (619, 19.1%) for females.
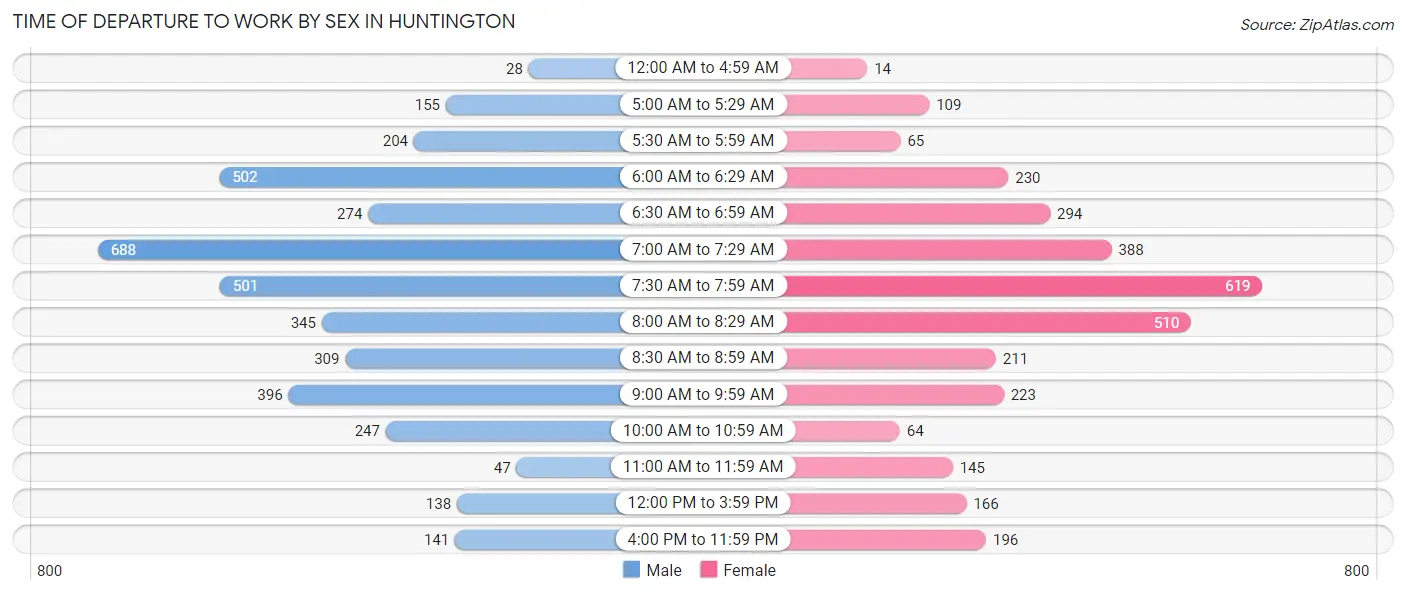
| Time of Departure | Male | Female |
| 12:00 AM to 4:59 AM | 28 (0.7%) | 14 (0.4%) |
| 5:00 AM to 5:29 AM | 155 (3.9%) | 109 (3.4%) |
| 5:30 AM to 5:59 AM | 204 (5.1%) | 65 (2.0%) |
| 6:00 AM to 6:29 AM | 502 (12.6%) | 230 (7.1%) |
| 6:30 AM to 6:59 AM | 274 (6.9%) | 294 (9.1%) |
| 7:00 AM to 7:29 AM | 688 (17.3%) | 388 (12.0%) |
| 7:30 AM to 7:59 AM | 501 (12.6%) | 619 (19.1%) |
| 8:00 AM to 8:29 AM | 345 (8.7%) | 510 (15.8%) |
| 8:30 AM to 8:59 AM | 309 (7.8%) | 211 (6.5%) |
| 9:00 AM to 9:59 AM | 396 (10.0%) | 223 (6.9%) |
| 10:00 AM to 10:59 AM | 247 (6.2%) | 64 (2.0%) |
| 11:00 AM to 11:59 AM | 47 (1.2%) | 145 (4.5%) |
| 12:00 PM to 3:59 PM | 138 (3.5%) | 166 (5.1%) |
| 4:00 PM to 11:59 PM | 141 (3.5%) | 196 (6.1%) |
| Total | 3,975 (100.0%) | 3,234 (100.0%) |
Housing Occupancy in Huntington
Occupancy by Ownership in Huntington
Of the total 7,183 dwellings in Huntington, owner-occupied units account for 3,032 (42.2%), while renter-occupied units make up 4,151 (57.8%).
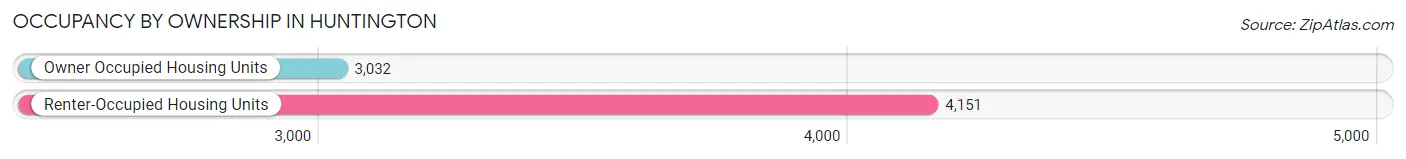
| Occupancy | # Housing Units | % Housing Units |
| Owner Occupied Housing Units | 3,032 | 42.2% |
| Renter-Occupied Housing Units | 4,151 | 57.8% |
| Total Occupied Housing Units | 7,183 | 100.0% |
Occupancy by Household Size in Huntington
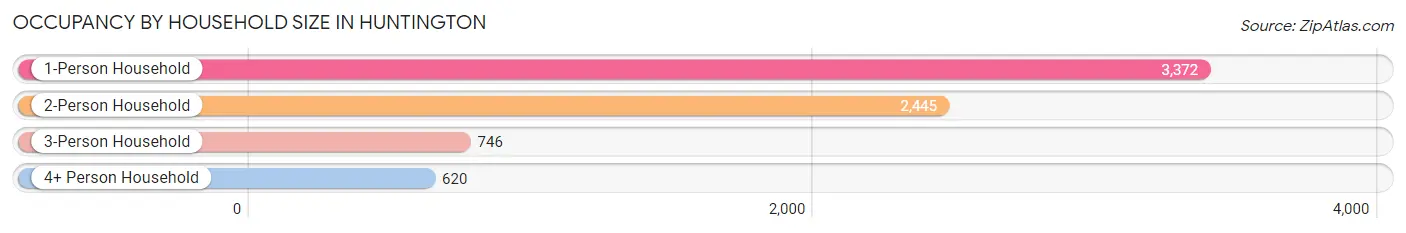
| Household Size | # Housing Units | % Housing Units |
| 1-Person Household | 3,372 | 46.9% |
| 2-Person Household | 2,445 | 34.0% |
| 3-Person Household | 746 | 10.4% |
| 4+ Person Household | 620 | 8.6% |
| Total Housing Units | 7,183 | 100.0% |
Occupancy by Ownership by Household Size in Huntington
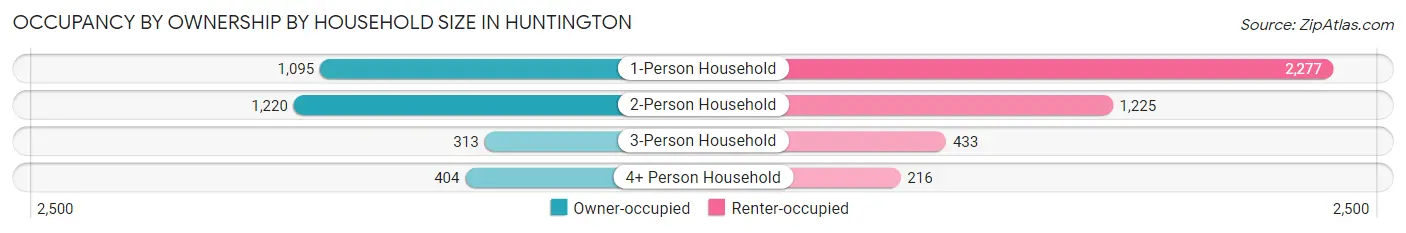
| Household Size | Owner-occupied | Renter-occupied |
| 1-Person Household | 1,095 (32.5%) | 2,277 (67.5%) |
| 2-Person Household | 1,220 (49.9%) | 1,225 (50.1%) |
| 3-Person Household | 313 (42.0%) | 433 (58.0%) |
| 4+ Person Household | 404 (65.2%) | 216 (34.8%) |
| Total Housing Units | 3,032 (42.2%) | 4,151 (57.8%) |
Occupancy by Educational Attainment in Huntington
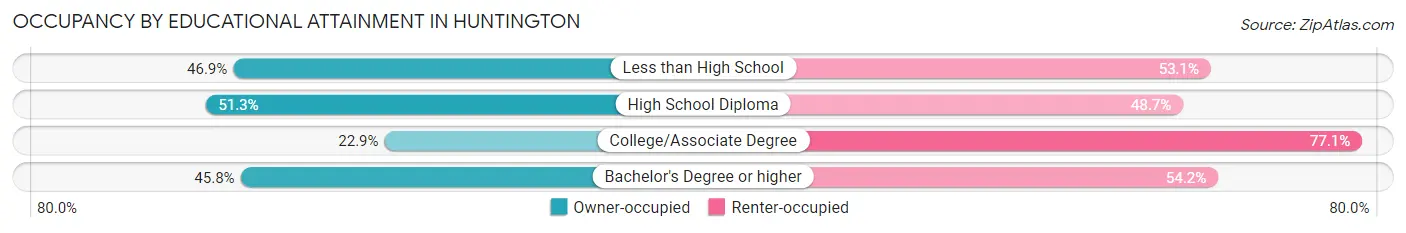
| Household Size | Owner-occupied | Renter-occupied |
| Less than High School | 84 (46.9%) | 95 (53.1%) |
| High School Diploma | 311 (51.3%) | 295 (48.7%) |
| College/Associate Degree | 293 (22.9%) | 984 (77.1%) |
| Bachelor's Degree or higher | 2,344 (45.8%) | 2,777 (54.2%) |
Occupancy by Age of Householder in Huntington
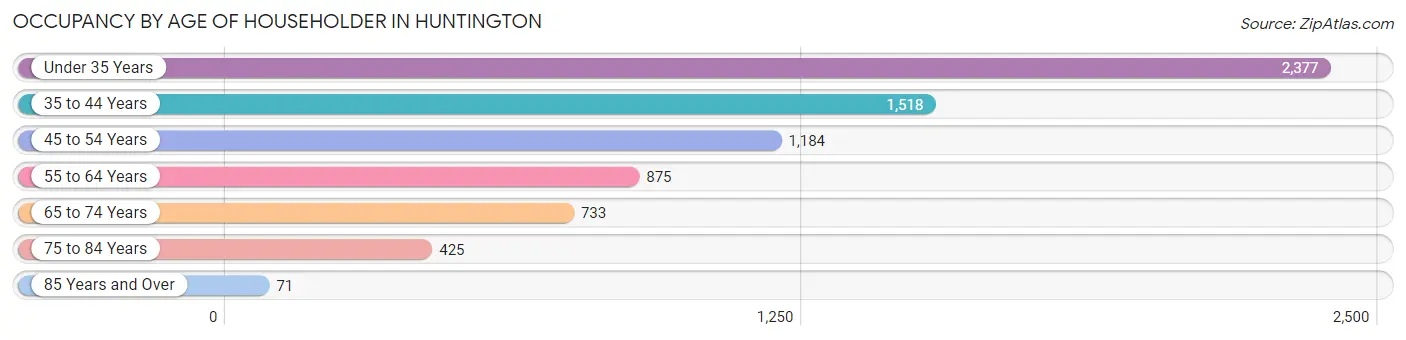
| Age Bracket | # Households | % Households |
| Under 35 Years | 2,377 | 33.1% |
| 35 to 44 Years | 1,518 | 21.1% |
| 45 to 54 Years | 1,184 | 16.5% |
| 55 to 64 Years | 875 | 12.2% |
| 65 to 74 Years | 733 | 10.2% |
| 75 to 84 Years | 425 | 5.9% |
| 85 Years and Over | 71 | 1.0% |
| Total | 7,183 | 100.0% |
Housing Finances in Huntington
Median Income by Occupancy in Huntington
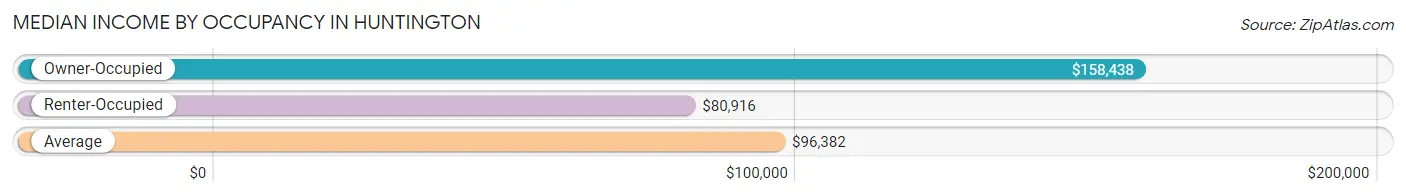
| Occupancy Type | # Households | Median Income |
| Owner-Occupied | 3,032 (42.2%) | $158,438 |
| Renter-Occupied | 4,151 (57.8%) | $80,916 |
| Average | 7,183 (100.0%) | $96,382 |
Occupancy by Householder Income Bracket in Huntington
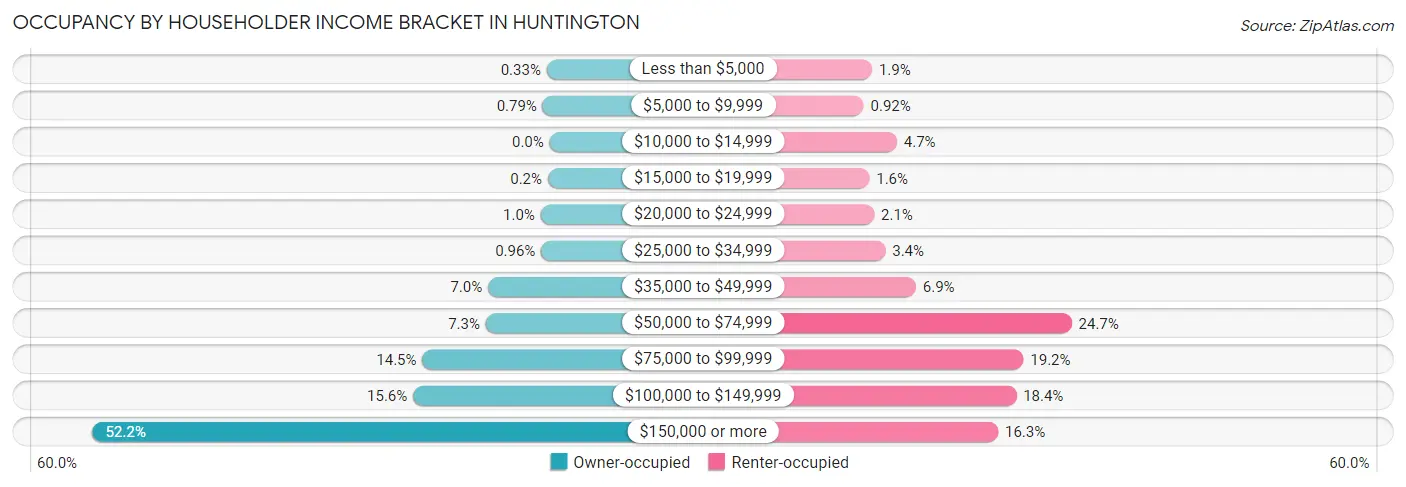
| Income Bracket | Owner-occupied | Renter-occupied |
| Less than $5,000 | 10 (0.3%) | 78 (1.9%) |
| $5,000 to $9,999 | 24 (0.8%) | 38 (0.9%) |
| $10,000 to $14,999 | 0 (0.0%) | 196 (4.7%) |
| $15,000 to $19,999 | 6 (0.2%) | 65 (1.6%) |
| $20,000 to $24,999 | 31 (1.0%) | 88 (2.1%) |
| $25,000 to $34,999 | 29 (1.0%) | 141 (3.4%) |
| $35,000 to $49,999 | 213 (7.0%) | 286 (6.9%) |
| $50,000 to $74,999 | 221 (7.3%) | 1,025 (24.7%) |
| $75,000 to $99,999 | 441 (14.5%) | 796 (19.2%) |
| $100,000 to $149,999 | 473 (15.6%) | 762 (18.4%) |
| $150,000 or more | 1,584 (52.2%) | 676 (16.3%) |
| Total | 3,032 (100.0%) | 4,151 (100.0%) |
Monthly Housing Cost Tiers in Huntington
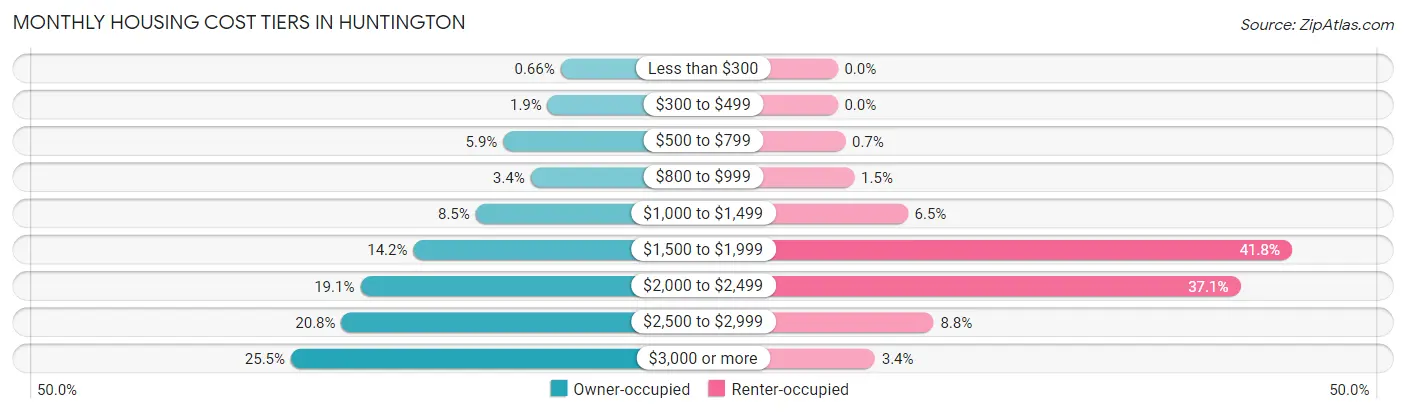
| Monthly Cost | Owner-occupied | Renter-occupied |
| Less than $300 | 20 (0.7%) | 0 (0.0%) |
| $300 to $499 | 56 (1.8%) | 0 (0.0%) |
| $500 to $799 | 180 (5.9%) | 29 (0.7%) |
| $800 to $999 | 104 (3.4%) | 64 (1.5%) |
| $1,000 to $1,499 | 257 (8.5%) | 268 (6.5%) |
| $1,500 to $1,999 | 431 (14.2%) | 1,736 (41.8%) |
| $2,000 to $2,499 | 579 (19.1%) | 1,539 (37.1%) |
| $2,500 to $2,999 | 632 (20.8%) | 367 (8.8%) |
| $3,000 or more | 773 (25.5%) | 143 (3.4%) |
| Total | 3,032 (100.0%) | 4,151 (100.0%) |
Physical Housing Characteristics in Huntington
Housing Structures in Huntington
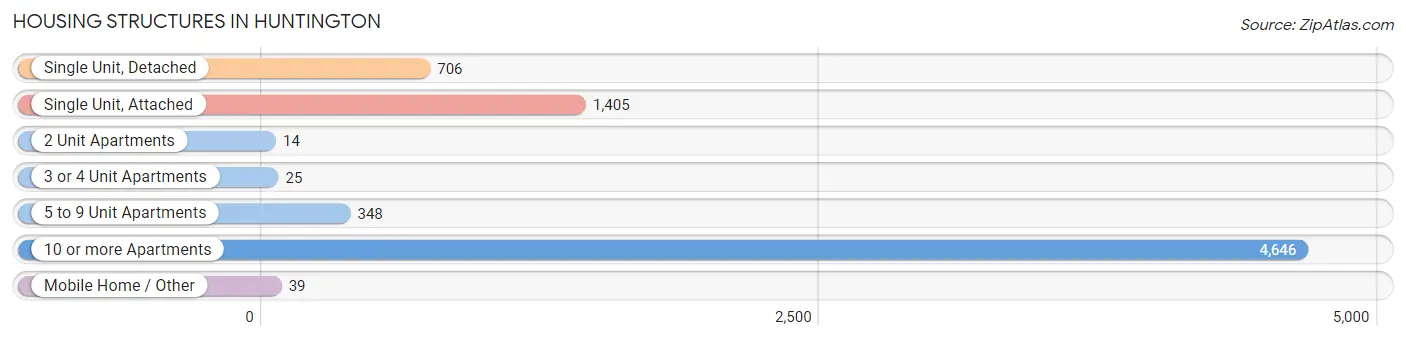
| Structure Type | # Housing Units | % Housing Units |
| Single Unit, Detached | 706 | 9.8% |
| Single Unit, Attached | 1,405 | 19.6% |
| 2 Unit Apartments | 14 | 0.2% |
| 3 or 4 Unit Apartments | 25 | 0.4% |
| 5 to 9 Unit Apartments | 348 | 4.8% |
| 10 or more Apartments | 4,646 | 64.7% |
| Mobile Home / Other | 39 | 0.5% |
| Total | 7,183 | 100.0% |
Housing Structures by Occupancy in Huntington
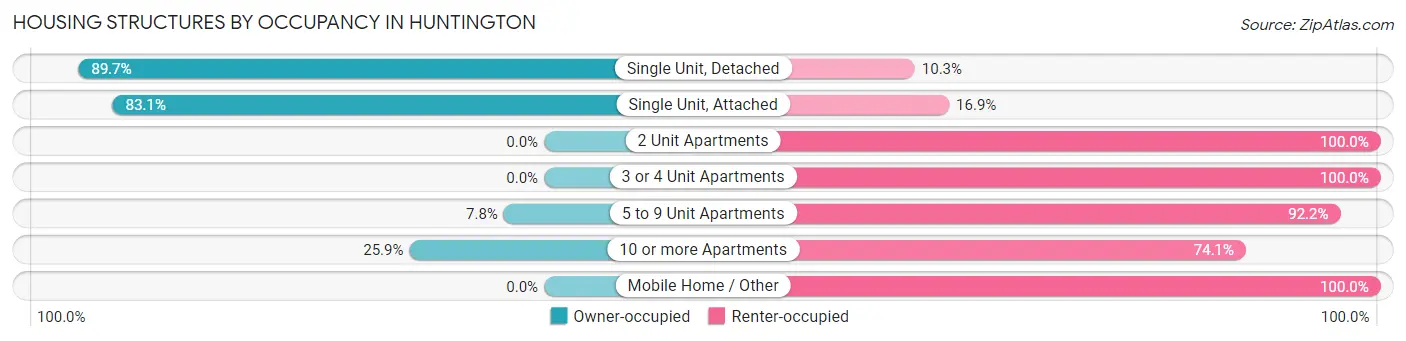
| Structure Type | Owner-occupied | Renter-occupied |
| Single Unit, Detached | 633 (89.7%) | 73 (10.3%) |
| Single Unit, Attached | 1,167 (83.1%) | 238 (16.9%) |
| 2 Unit Apartments | 0 (0.0%) | 14 (100.0%) |
| 3 or 4 Unit Apartments | 0 (0.0%) | 25 (100.0%) |
| 5 to 9 Unit Apartments | 27 (7.8%) | 321 (92.2%) |
| 10 or more Apartments | 1,205 (25.9%) | 3,441 (74.1%) |
| Mobile Home / Other | 0 (0.0%) | 39 (100.0%) |
| Total | 3,032 (42.2%) | 4,151 (57.8%) |
Housing Structures by Number of Rooms in Huntington
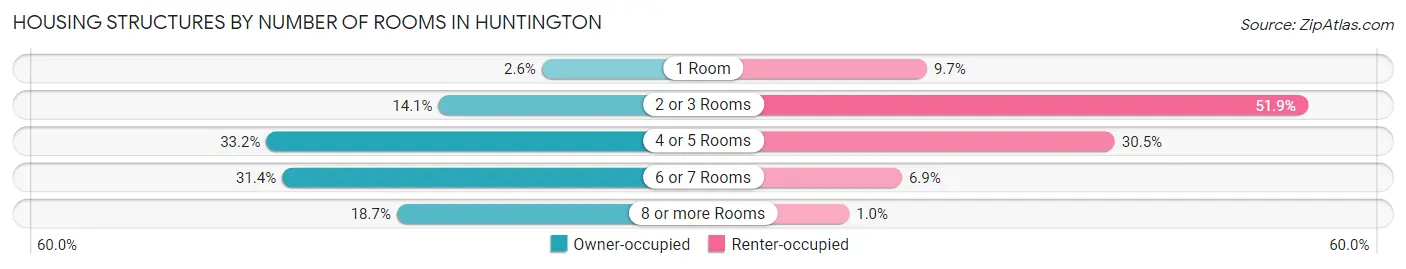
| Number of Rooms | Owner-occupied | Renter-occupied |
| 1 Room | 79 (2.6%) | 401 (9.7%) |
| 2 or 3 Rooms | 427 (14.1%) | 2,154 (51.9%) |
| 4 or 5 Rooms | 1,006 (33.2%) | 1,267 (30.5%) |
| 6 or 7 Rooms | 953 (31.4%) | 286 (6.9%) |
| 8 or more Rooms | 567 (18.7%) | 43 (1.0%) |
| Total | 3,032 (100.0%) | 4,151 (100.0%) |
Housing Structure by Heating Type in Huntington
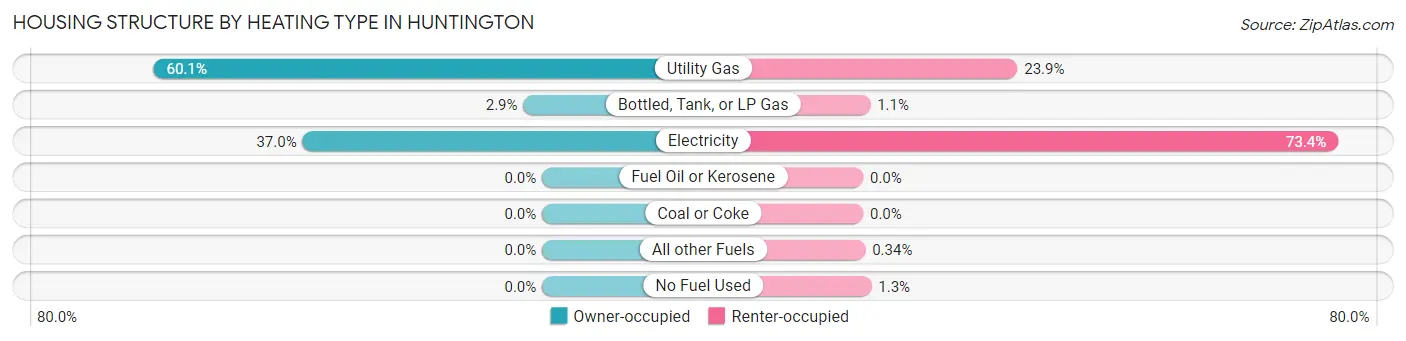
| Heating Type | Owner-occupied | Renter-occupied |
| Utility Gas | 1,821 (60.1%) | 990 (23.8%) |
| Bottled, Tank, or LP Gas | 88 (2.9%) | 46 (1.1%) |
| Electricity | 1,123 (37.0%) | 3,048 (73.4%) |
| Fuel Oil or Kerosene | 0 (0.0%) | 0 (0.0%) |
| Coal or Coke | 0 (0.0%) | 0 (0.0%) |
| All other Fuels | 0 (0.0%) | 14 (0.3%) |
| No Fuel Used | 0 (0.0%) | 53 (1.3%) |
| Total | 3,032 (100.0%) | 4,151 (100.0%) |
Household Vehicle Usage in Huntington
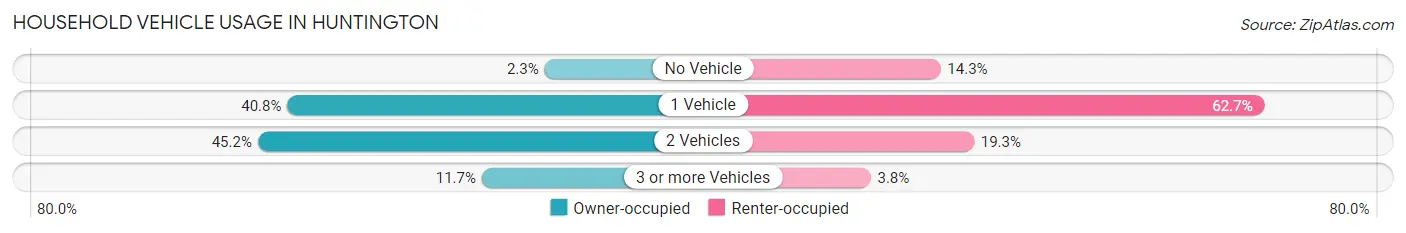
| Vehicles per Household | Owner-occupied | Renter-occupied |
| No Vehicle | 71 (2.3%) | 592 (14.3%) |
| 1 Vehicle | 1,236 (40.8%) | 2,601 (62.7%) |
| 2 Vehicles | 1,370 (45.2%) | 799 (19.3%) |
| 3 or more Vehicles | 355 (11.7%) | 159 (3.8%) |
| Total | 3,032 (100.0%) | 4,151 (100.0%) |
Real Estate & Mortgages in Huntington
Real Estate and Mortgage Overview in Huntington
| Characteristic | Without Mortgage | With Mortgage |
| Housing Units | 712 | 2,320 |
| Median Property Value | $460,300 | $493,000 |
| Median Household Income | $133,214 | $1,280 |
| Monthly Housing Costs | $994 | $773 |
| Real Estate Taxes | $5,281 | $30 |
Property Value by Mortgage Status in Huntington
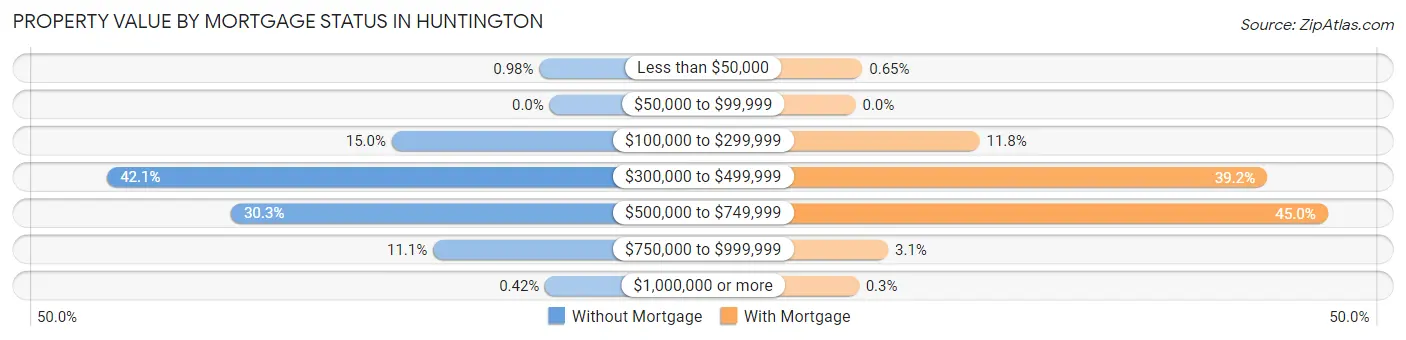
| Property Value | Without Mortgage | With Mortgage |
| Less than $50,000 | 7 (1.0%) | 15 (0.6%) |
| $50,000 to $99,999 | 0 (0.0%) | 0 (0.0%) |
| $100,000 to $299,999 | 107 (15.0%) | 274 (11.8%) |
| $300,000 to $499,999 | 300 (42.1%) | 909 (39.2%) |
| $500,000 to $749,999 | 216 (30.3%) | 1,043 (45.0%) |
| $750,000 to $999,999 | 79 (11.1%) | 72 (3.1%) |
| $1,000,000 or more | 3 (0.4%) | 7 (0.3%) |
| Total | 712 (100.0%) | 2,320 (100.0%) |
Household Income by Mortgage Status in Huntington
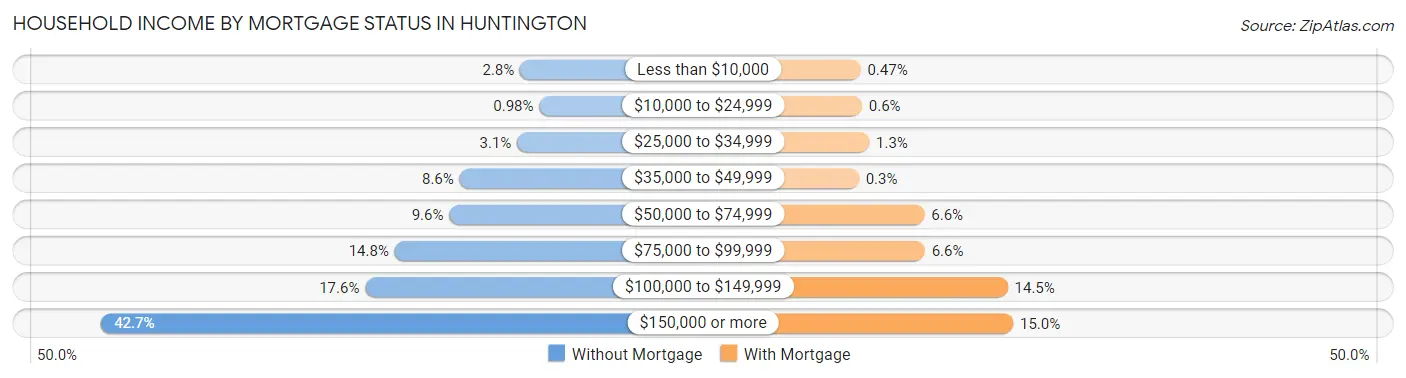
| Household Income | Without Mortgage | With Mortgage |
| Less than $10,000 | 20 (2.8%) | 11 (0.5%) |
| $10,000 to $24,999 | 7 (1.0%) | 14 (0.6%) |
| $25,000 to $34,999 | 22 (3.1%) | 30 (1.3%) |
| $35,000 to $49,999 | 61 (8.6%) | 7 (0.3%) |
| $50,000 to $74,999 | 68 (9.6%) | 152 (6.6%) |
| $75,000 to $99,999 | 105 (14.7%) | 153 (6.6%) |
| $100,000 to $149,999 | 125 (17.6%) | 336 (14.5%) |
| $150,000 or more | 304 (42.7%) | 348 (15.0%) |
| Total | 712 (100.0%) | 2,320 (100.0%) |
Property Value to Household Income Ratio in Huntington
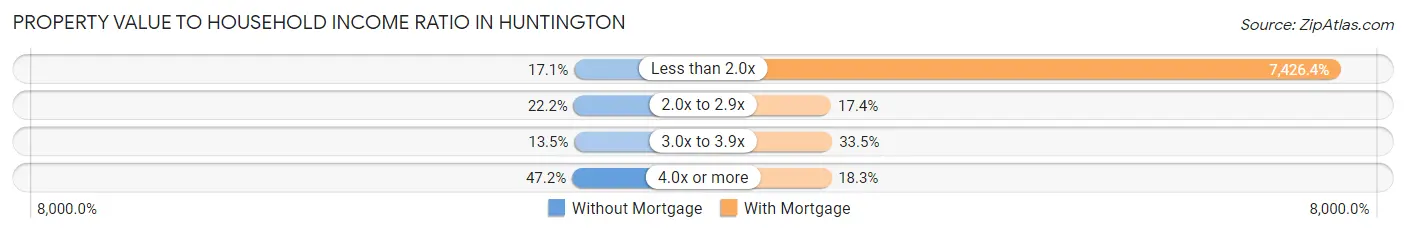
| Value-to-Income Ratio | Without Mortgage | With Mortgage |
| Less than 2.0x | 122 (17.1%) | 172,292 (7,426.4%) |
| 2.0x to 2.9x | 158 (22.2%) | 403 (17.4%) |
| 3.0x to 3.9x | 96 (13.5%) | 778 (33.5%) |
| 4.0x or more | 336 (47.2%) | 425 (18.3%) |
| Total | 712 (100.0%) | 2,320 (100.0%) |
Real Estate Taxes by Mortgage Status in Huntington
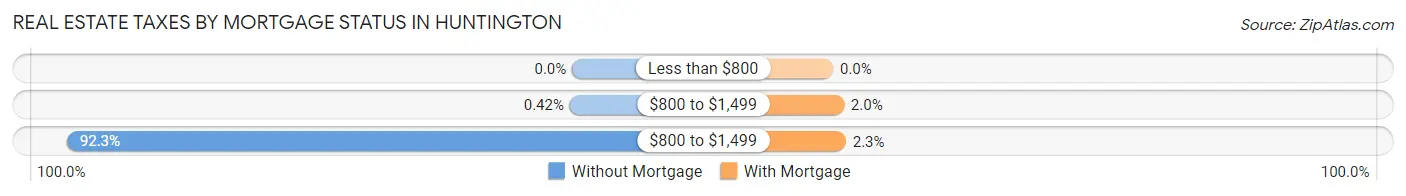
| Property Taxes | Without Mortgage | With Mortgage |
| Less than $800 | 0 (0.0%) | 0 (0.0%) |
| $800 to $1,499 | 3 (0.4%) | 46 (2.0%) |
| $800 to $1,499 | 657 (92.3%) | 54 (2.3%) |
| Total | 712 (100.0%) | 2,320 (100.0%) |
Health & Disability in Huntington
Health Insurance Coverage by Age in Huntington
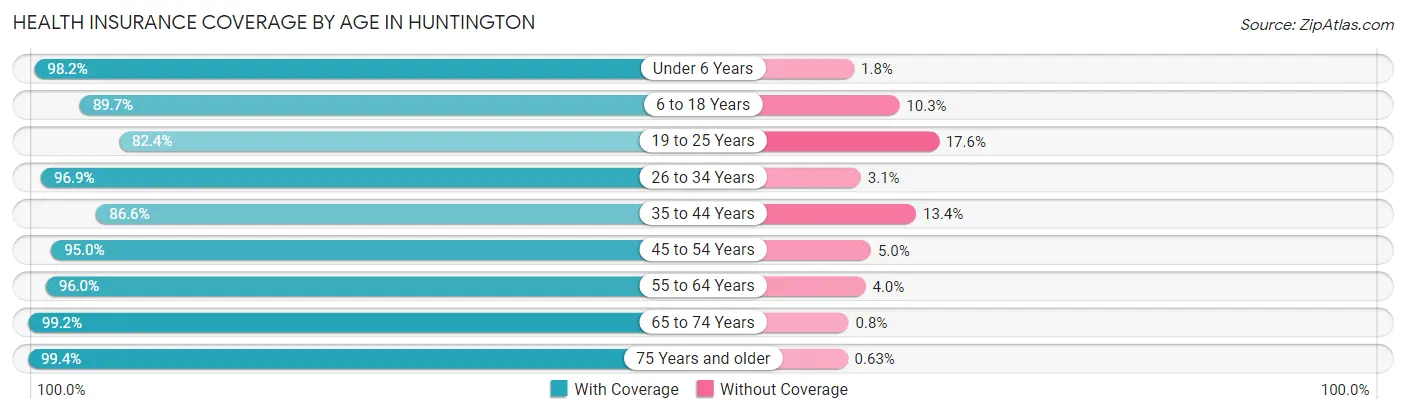
| Age Bracket | With Coverage | Without Coverage |
| Under 6 Years | 965 (98.2%) | 18 (1.8%) |
| 6 to 18 Years | 1,065 (89.7%) | 122 (10.3%) |
| 19 to 25 Years | 973 (82.4%) | 208 (17.6%) |
| 26 to 34 Years | 2,977 (96.9%) | 95 (3.1%) |
| 35 to 44 Years | 2,025 (86.6%) | 313 (13.4%) |
| 45 to 54 Years | 1,664 (95.0%) | 87 (5.0%) |
| 55 to 64 Years | 1,260 (96.0%) | 52 (4.0%) |
| 65 to 74 Years | 987 (99.2%) | 8 (0.8%) |
| 75 Years and older | 632 (99.4%) | 4 (0.6%) |
| Total | 12,548 (93.3%) | 907 (6.7%) |
Health Insurance Coverage by Citizenship Status in Huntington
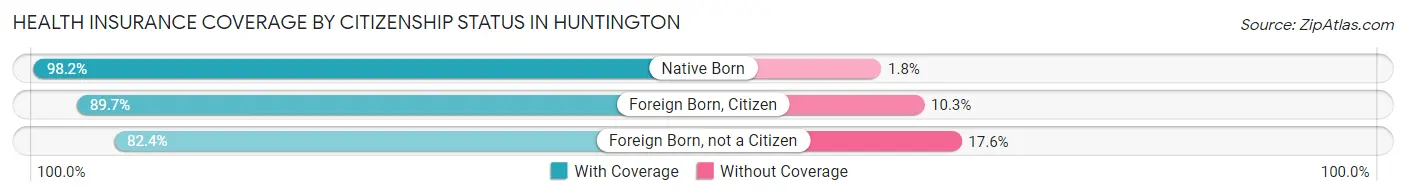
| Citizenship Status | With Coverage | Without Coverage |
| Native Born | 965 (98.2%) | 18 (1.8%) |
| Foreign Born, Citizen | 1,065 (89.7%) | 122 (10.3%) |
| Foreign Born, not a Citizen | 973 (82.4%) | 208 (17.6%) |
Health Insurance Coverage by Household Income in Huntington
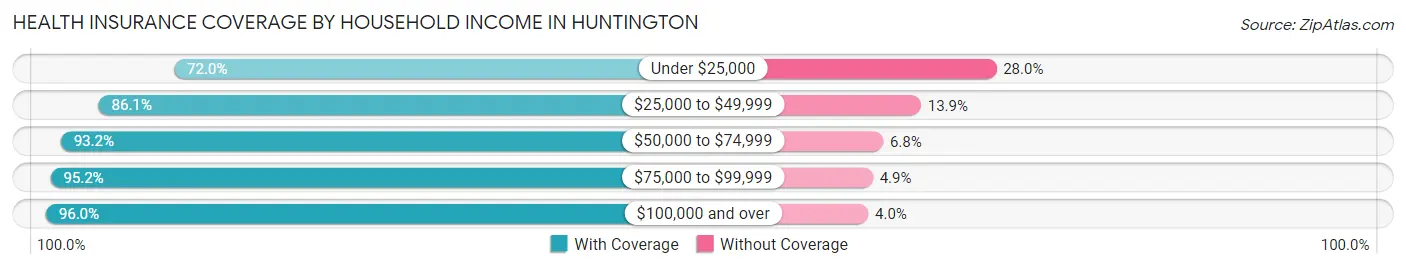
| Household Income | With Coverage | Without Coverage |
| Under $25,000 | 594 (72.0%) | 231 (28.0%) |
| $25,000 to $49,999 | 857 (86.1%) | 138 (13.9%) |
| $50,000 to $74,999 | 1,897 (93.2%) | 138 (6.8%) |
| $75,000 to $99,999 | 1,905 (95.2%) | 97 (4.9%) |
| $100,000 and over | 7,293 (96.0%) | 303 (4.0%) |
Public vs Private Health Insurance Coverage by Age in Huntington
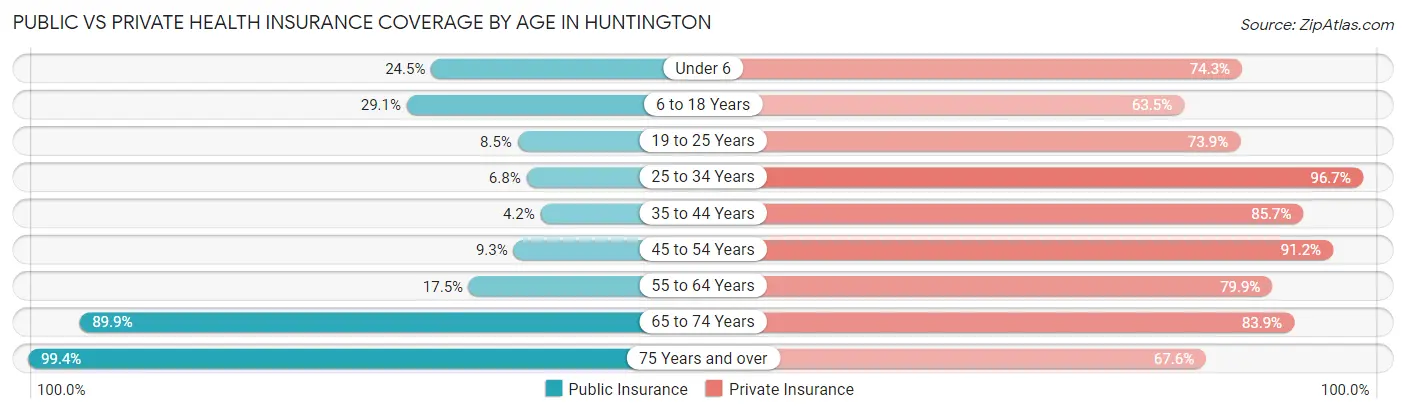
| Age Bracket | Public Insurance | Private Insurance |
| Under 6 | 241 (24.5%) | 730 (74.3%) |
| 6 to 18 Years | 345 (29.1%) | 754 (63.5%) |
| 19 to 25 Years | 100 (8.5%) | 873 (73.9%) |
| 25 to 34 Years | 210 (6.8%) | 2,969 (96.7%) |
| 35 to 44 Years | 99 (4.2%) | 2,003 (85.7%) |
| 45 to 54 Years | 162 (9.2%) | 1,596 (91.1%) |
| 55 to 64 Years | 230 (17.5%) | 1,048 (79.9%) |
| 65 to 74 Years | 894 (89.8%) | 835 (83.9%) |
| 75 Years and over | 632 (99.4%) | 430 (67.6%) |
| Total | 2,913 (21.6%) | 11,238 (83.5%) |
Disability Status by Sex by Age in Huntington
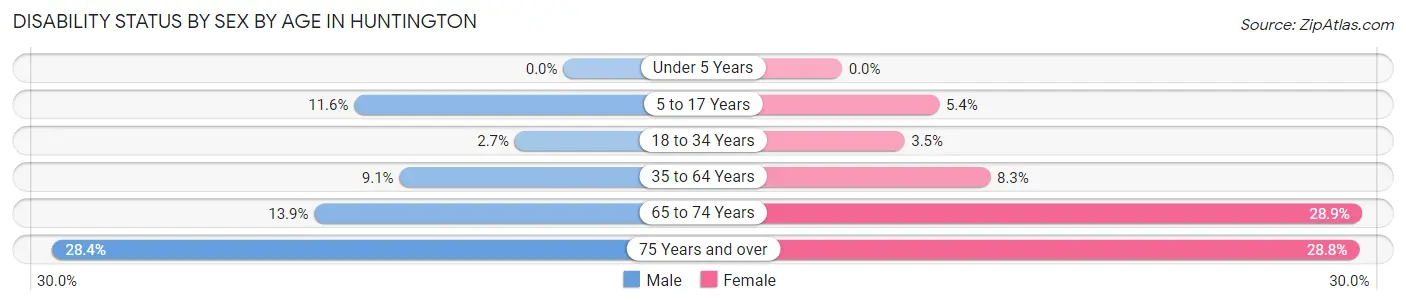
| Age Bracket | Male | Female |
| Under 5 Years | 0 (0.0%) | 0 (0.0%) |
| 5 to 17 Years | 56 (11.6%) | 36 (5.4%) |
| 18 to 34 Years | 61 (2.7%) | 73 (3.5%) |
| 35 to 64 Years | 254 (9.1%) | 216 (8.3%) |
| 65 to 74 Years | 57 (13.9%) | 169 (28.9%) |
| 75 Years and over | 93 (28.4%) | 89 (28.8%) |
Disability Class by Sex by Age in Huntington
Disability Class: Hearing Difficulty
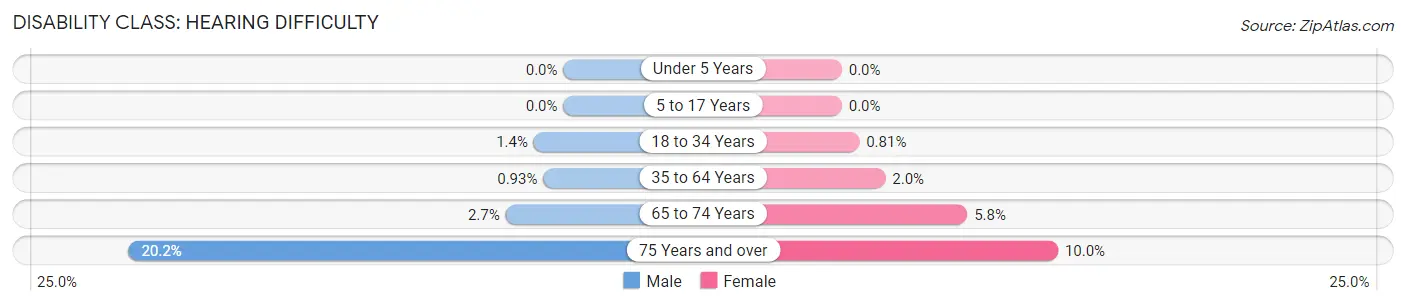
| Age Bracket | Male | Female |
| Under 5 Years | 0 (0.0%) | 0 (0.0%) |
| 5 to 17 Years | 0 (0.0%) | 0 (0.0%) |
| 18 to 34 Years | 31 (1.4%) | 17 (0.8%) |
| 35 to 64 Years | 26 (0.9%) | 53 (2.0%) |
| 65 to 74 Years | 11 (2.7%) | 34 (5.8%) |
| 75 Years and over | 66 (20.2%) | 31 (10.0%) |
Disability Class: Vision Difficulty
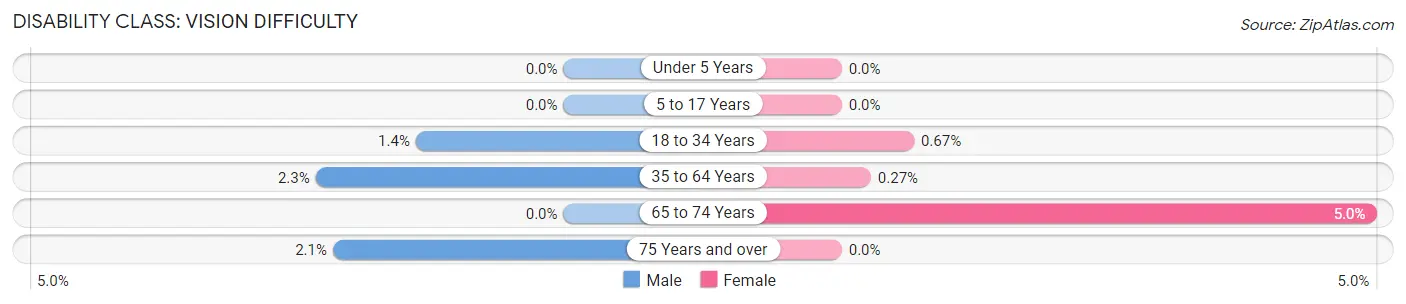
| Age Bracket | Male | Female |
| Under 5 Years | 0 (0.0%) | 0 (0.0%) |
| 5 to 17 Years | 0 (0.0%) | 0 (0.0%) |
| 18 to 34 Years | 31 (1.4%) | 14 (0.7%) |
| 35 to 64 Years | 64 (2.3%) | 7 (0.3%) |
| 65 to 74 Years | 0 (0.0%) | 29 (5.0%) |
| 75 Years and over | 7 (2.1%) | 0 (0.0%) |
Disability Class: Cognitive Difficulty
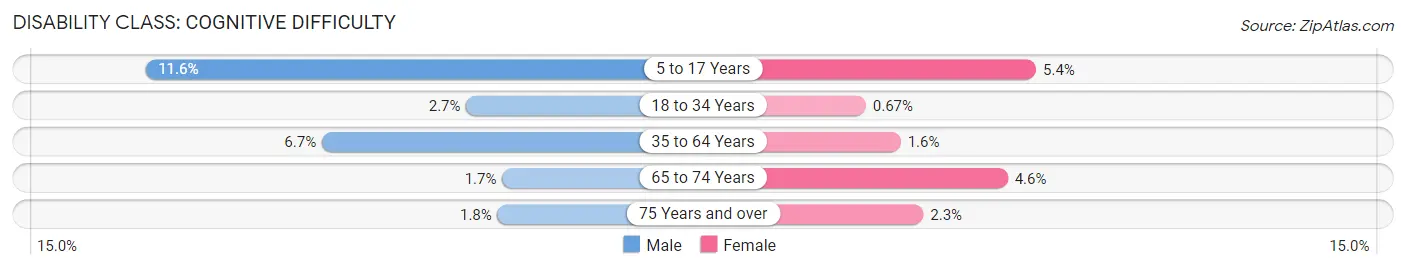
| Age Bracket | Male | Female |
| 5 to 17 Years | 56 (11.6%) | 36 (5.4%) |
| 18 to 34 Years | 61 (2.7%) | 14 (0.7%) |
| 35 to 64 Years | 187 (6.7%) | 43 (1.6%) |
| 65 to 74 Years | 7 (1.7%) | 27 (4.6%) |
| 75 Years and over | 6 (1.8%) | 7 (2.3%) |
Disability Class: Ambulatory Difficulty
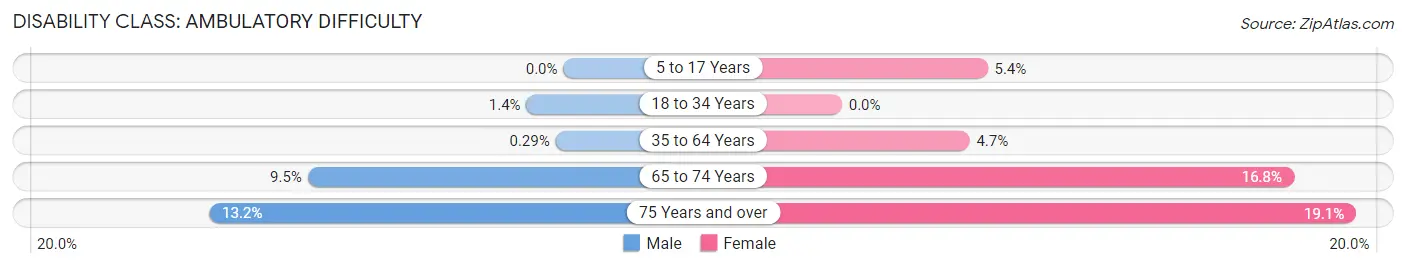
| Age Bracket | Male | Female |
| 5 to 17 Years | 0 (0.0%) | 36 (5.4%) |
| 18 to 34 Years | 31 (1.4%) | 0 (0.0%) |
| 35 to 64 Years | 8 (0.3%) | 124 (4.7%) |
| 65 to 74 Years | 39 (9.5%) | 98 (16.8%) |
| 75 Years and over | 43 (13.2%) | 59 (19.1%) |
Disability Class: Self-Care Difficulty
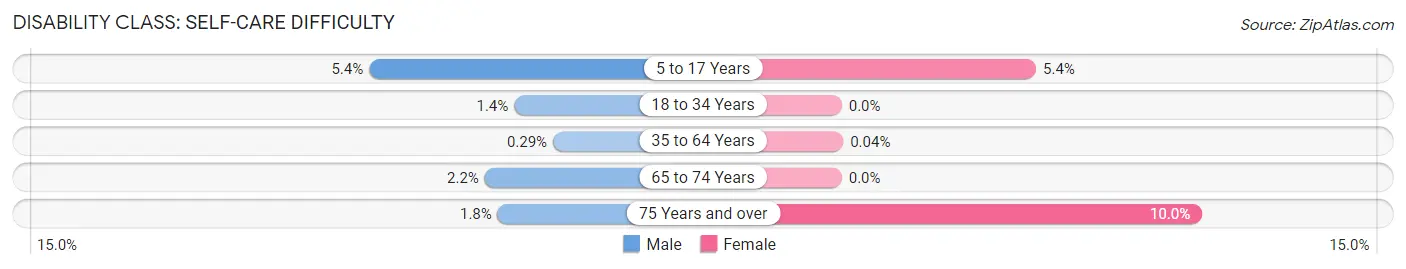
| Age Bracket | Male | Female |
| 5 to 17 Years | 26 (5.4%) | 36 (5.4%) |
| 18 to 34 Years | 31 (1.4%) | 0 (0.0%) |
| 35 to 64 Years | 8 (0.3%) | 1 (0.0%) |
| 65 to 74 Years | 9 (2.2%) | 0 (0.0%) |
| 75 Years and over | 6 (1.8%) | 31 (10.0%) |
Technology Access in Huntington
Computing Device Access in Huntington
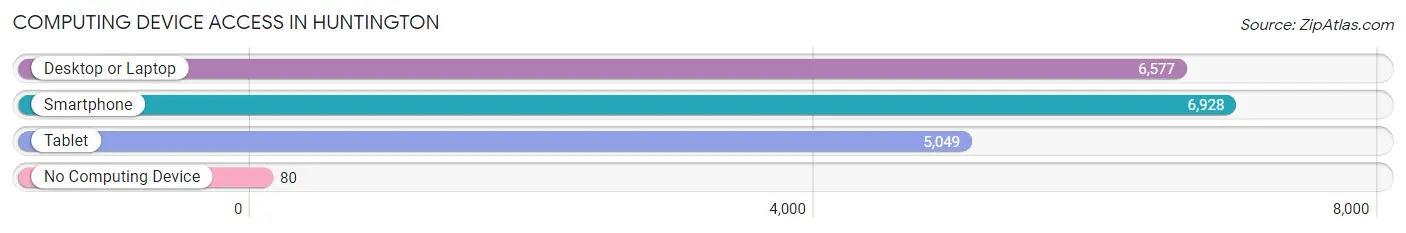
| Device Type | # Households | % Households |
| Desktop or Laptop | 6,577 | 91.6% |
| Smartphone | 6,928 | 96.5% |
| Tablet | 5,049 | 70.3% |
| No Computing Device | 80 | 1.1% |
| Total | 7,183 | 100.0% |
Internet Access in Huntington
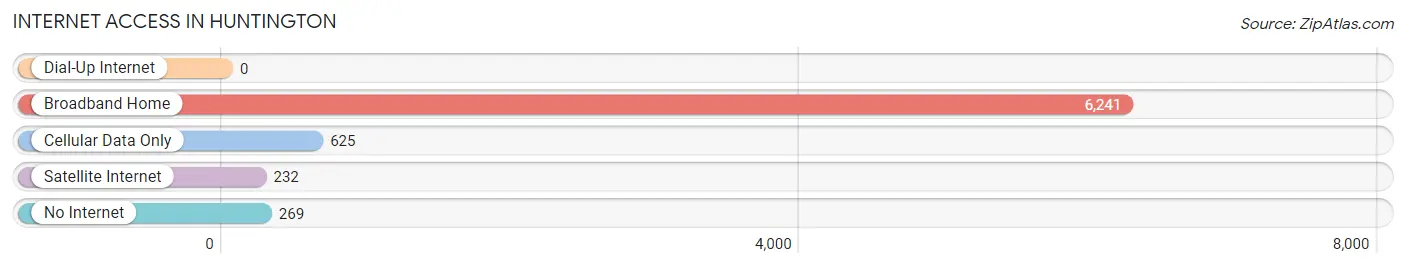
| Internet Type | # Households | % Households |
| Dial-Up Internet | 0 | 0.0% |
| Broadband Home | 6,241 | 86.9% |
| Cellular Data Only | 625 | 8.7% |
| Satellite Internet | 232 | 3.2% |
| No Internet | 269 | 3.7% |
| Total | 7,183 | 100.0% |
Huntington Summary
Huntington, Virginia is a small town located in Fairfax County, Virginia. It is situated on the banks of the Potomac River, just south of Washington, D.C. The town has a population of approximately 8,000 people and is part of the Washington Metropolitan Area.
History
Huntington was first settled in the early 1700s by English settlers. The town was originally known as “Hunting Creek” and was part of the Fairfax County land grant. The town was officially incorporated in 1871 and was named after the nearby Huntington House, which was built in 1790.
In the late 1800s, the town was a popular summer resort for wealthy Washingtonians. The town was also home to a number of large estates, including the historic Woodlawn Estate.
Geography
Huntington is located in the northern part of Fairfax County, Virginia. It is situated on the banks of the Potomac River, just south of Washington, D.C. The town is bordered by the towns of McLean and Vienna to the north, and Falls Church to the east. The town is also close to the cities of Alexandria and Arlington.
The town has a total area of 1.3 square miles, all of which is land. The town is located at an elevation of approximately 100 feet above sea level.
Economy
Huntington’s economy is largely based on the service industry. The town is home to a number of restaurants, retail stores, and other businesses. The town is also home to a number of government contractors, including the Department of Defense and the Department of Homeland Security.
Demographics
As of the 2010 census, Huntington had a population of 8,000 people. The racial makeup of the town was 79.2% White, 11.2% African American, 0.3% Native American, 4.2% Asian, and 5.1% from other races. Hispanic or Latino of any race were 8.2% of the population.
The median income for a household in the town was $90,000, and the median income for a family was $100,000. The per capita income for the town was $40,000. About 4.2% of families and 5.3% of the population were below the poverty line, including 6.2% of those under age 18 and 4.2% of those age 65 or over.
Huntington is a small town with a rich history and a diverse population. The town is home to a number of businesses and government contractors, and is a popular destination for tourists and Washingtonians alike. The town is also close to a number of major cities, making it an ideal place to live and work.
Common Questions
What is Per Capita Income in Huntington?
Per Capita income in Huntington is $64,960.
What is the Median Family Income in Huntington?
Median Family Income in Huntington is $140,190.
What is the Median Household income in Huntington?
Median Household Income in Huntington is $96,382.
What is Income or Wage Gap in Huntington?
Income or Wage Gap in Huntington is 23.1%.
Women in Huntington earn 76.9 cents for every dollar earned by a man.
What is Inequality or Gini Index in Huntington?
Inequality or Gini Index in Huntington is 0.37.
What is the Total Population of Huntington?
Total Population of Huntington is 13,913.
What is the Total Male Population of Huntington?
Total Male Population of Huntington is 7,100.
What is the Total Female Population of Huntington?
Total Female Population of Huntington is 6,813.
What is the Ratio of Males per 100 Females in Huntington?
There are 104.21 Males per 100 Females in Huntington.
What is the Ratio of Females per 100 Males in Huntington?
There are 95.96 Females per 100 Males in Huntington.
What is the Median Population Age in Huntington?
Median Population Age in Huntington is 36.0 Years.
What is the Average Family Size in Huntington
Average Family Size in Huntington is 2.8 People.
What is the Average Household Size in Huntington
Average Household Size in Huntington is 1.9 People.
How Large is the Labor Force in Huntington?
There are 9,822 People in the Labor Forcein in Huntington.
What is the Percentage of People in the Labor Force in Huntington?
82.0% of People are in the Labor Force in Huntington.
What is the Unemployment Rate in Huntington?
Unemployment Rate in Huntington is 3.9%.