Altavista, VA Map & Demographics
Altavista Map
Altavista Overview
$29,114
PER CAPITA INCOME
$52,986
AVG FAMILY INCOME
$39,761
AVG HOUSEHOLD INCOME
6.1%
WAGE / INCOME GAP [ % ]
93.9¢/ $1
WAGE / INCOME GAP [ $ ]
0.45
INEQUALITY / GINI INDEX
3,370
TOTAL POPULATION
1,704
MALE POPULATION
1,666
FEMALE POPULATION
102.28
MALES / 100 FEMALES
97.77
FEMALES / 100 MALES
41.6
MEDIAN AGE
3.0
AVG FAMILY SIZE
2.3
AVG HOUSEHOLD SIZE
1,647
LABOR FORCE [ PEOPLE ]
61.3%
PERCENT IN LABOR FORCE
11.5%
UNEMPLOYMENT RATE
Altavista Zip Codes
Altavista Area Codes
Income in Altavista
Income Overview in Altavista
Per Capita Income in Altavista is $29,114, while median incomes of families and households are $52,986 and $39,761 respectively.
| Characteristic | Number | Measure |
| Per Capita Income | 3,370 | $29,114 |
| Median Family Income | 863 | $52,986 |
| Mean Family Income | 863 | $74,366 |
| Median Household Income | 1,451 | $39,761 |
| Mean Household Income | 1,451 | $62,480 |
| Income Deficit | 863 | $0 |
| Wage / Income Gap (%) | 3,370 | 6.11% |
| Wage / Income Gap ($) | 3,370 | 93.89¢ per $1 |
| Gini / Inequality Index | 3,370 | 0.45 |
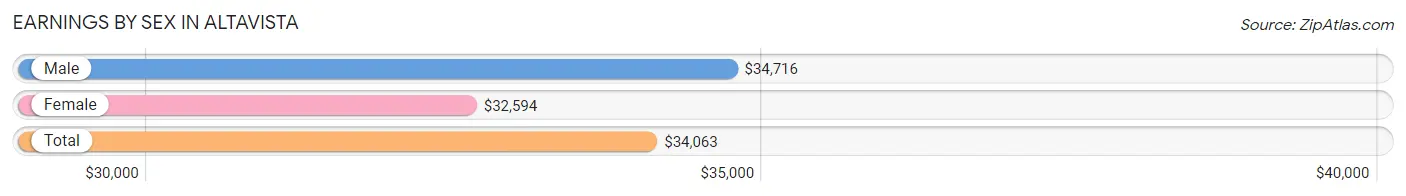
Earnings by Sex in Altavista
Average Earnings in Altavista are $34,063, $34,716 for men and $32,594 for women, a difference of 6.1%.
| Sex | Number | Average Earnings |
| Male | 865 (50.3%) | $34,716 |
| Female | 856 (49.7%) | $32,594 |
| Total | 1,721 (100.0%) | $34,063 |
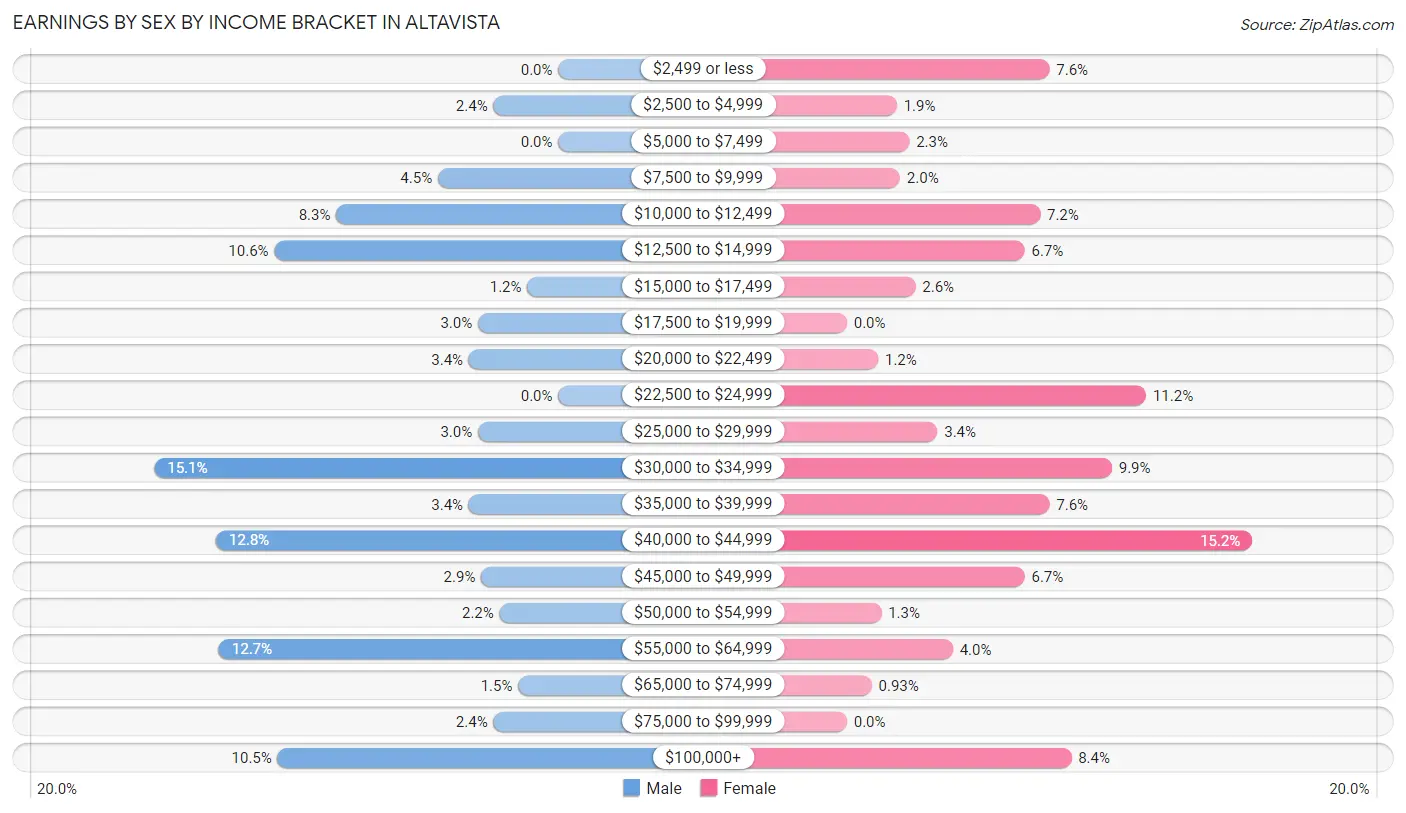
Earnings by Sex by Income Bracket in Altavista
The most common earnings brackets in Altavista are $30,000 to $34,999 for men (131 | 15.1%) and $40,000 to $44,999 for women (130 | 15.2%).
| Income | Male | Female |
| $2,499 or less | 0 (0.0%) | 65 (7.6%) |
| $2,500 to $4,999 | 21 (2.4%) | 16 (1.9%) |
| $5,000 to $7,499 | 0 (0.0%) | 20 (2.3%) |
| $7,500 to $9,999 | 39 (4.5%) | 17 (2.0%) |
| $10,000 to $12,499 | 72 (8.3%) | 62 (7.2%) |
| $12,500 to $14,999 | 92 (10.6%) | 57 (6.7%) |
| $15,000 to $17,499 | 10 (1.2%) | 22 (2.6%) |
| $17,500 to $19,999 | 26 (3.0%) | 0 (0.0%) |
| $20,000 to $22,499 | 29 (3.4%) | 10 (1.2%) |
| $22,500 to $24,999 | 0 (0.0%) | 96 (11.2%) |
| $25,000 to $29,999 | 26 (3.0%) | 29 (3.4%) |
| $30,000 to $34,999 | 131 (15.1%) | 85 (9.9%) |
| $35,000 to $39,999 | 29 (3.4%) | 65 (7.6%) |
| $40,000 to $44,999 | 111 (12.8%) | 130 (15.2%) |
| $45,000 to $49,999 | 25 (2.9%) | 57 (6.7%) |
| $50,000 to $54,999 | 19 (2.2%) | 11 (1.3%) |
| $55,000 to $64,999 | 110 (12.7%) | 34 (4.0%) |
| $65,000 to $74,999 | 13 (1.5%) | 8 (0.9%) |
| $75,000 to $99,999 | 21 (2.4%) | 0 (0.0%) |
| $100,000+ | 91 (10.5%) | 72 (8.4%) |
| Total | 865 (100.0%) | 856 (100.0%) |
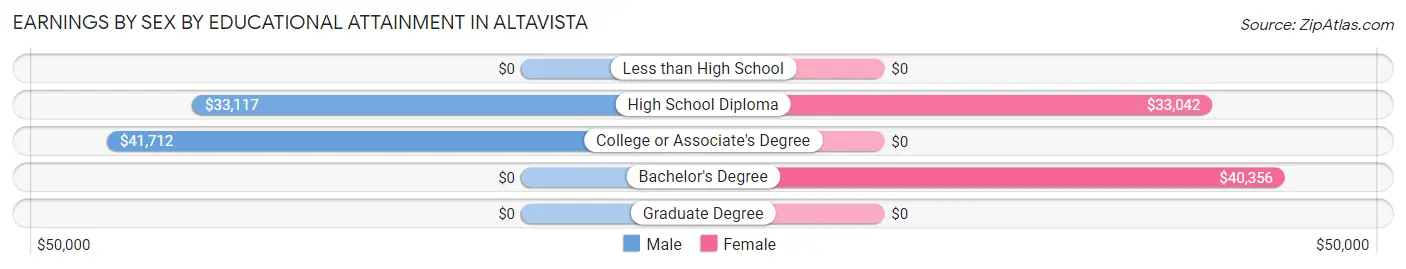
Earnings by Sex by Educational Attainment in Altavista
Average earnings in Altavista are $40,159 for men and $33,373 for women, a difference of 16.9%. Men with an educational attainment of college or associate's degree enjoy the highest average annual earnings of $41,712, while those with high school diploma education earn the least with $33,117. Women with an educational attainment of bachelor's degree earn the most with the average annual earnings of $40,356, while those with high school diploma education have the smallest earnings of $33,042.
| Educational Attainment | Male Income | Female Income |
| Less than High School | - | - |
| High School Diploma | $33,117 | $33,042 |
| College or Associate's Degree | $41,712 | $0 |
| Bachelor's Degree | - | - |
| Graduate Degree | - | - |
| Total | $40,159 | $33,373 |
Family Income in Altavista
Family Income Brackets in Altavista
According to the Altavista family income data, there are 188 families falling into the $25,000 to $34,999 income range, which is the most common income bracket and makes up 21.8% of all families.
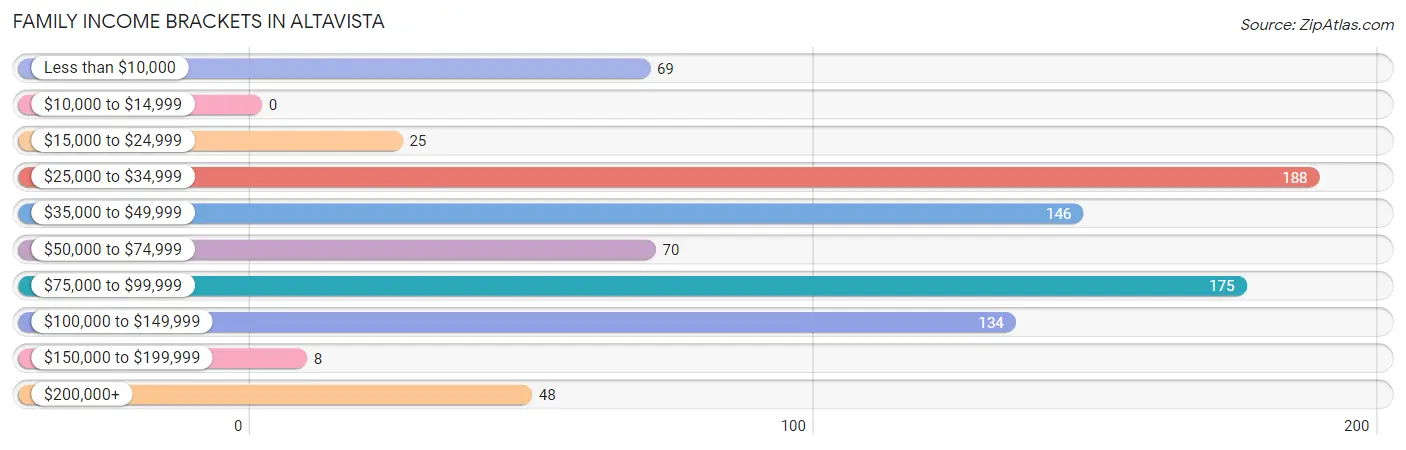
| Income Bracket | # Families | % Families |
| Less than $10,000 | 69 | 8.0% |
| $10,000 to $14,999 | 0 | 0.0% |
| $15,000 to $24,999 | 25 | 2.9% |
| $25,000 to $34,999 | 188 | 21.8% |
| $35,000 to $49,999 | 146 | 16.9% |
| $50,000 to $74,999 | 70 | 8.1% |
| $75,000 to $99,999 | 175 | 20.3% |
| $100,000 to $149,999 | 134 | 15.5% |
| $150,000 to $199,999 | 8 | 0.9% |
| $200,000+ | 48 | 5.6% |
Family Income by Famaliy Size in Altavista
5-person families (76 | 8.8%) account for the highest median family income in Altavista with $92,348 per family, while 2-person families (437 | 50.6%) have the highest median income of $22,032 per family member.
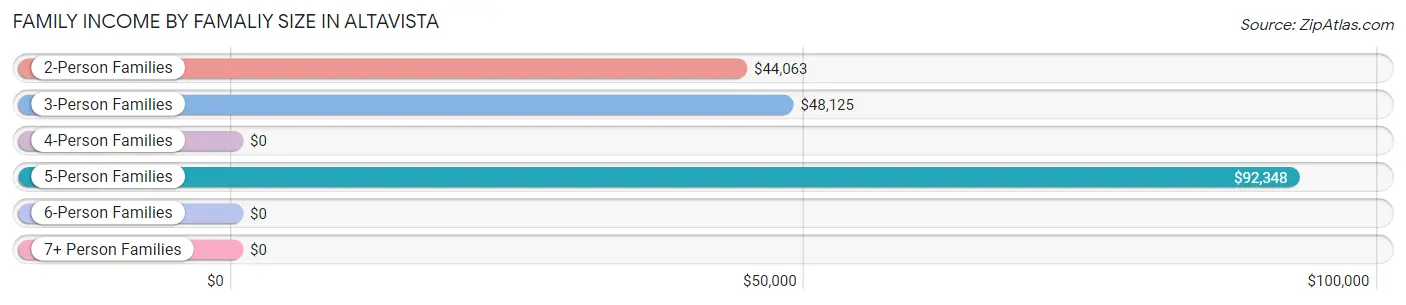
| Income Bracket | # Families | Median Income |
| 2-Person Families | 437 (50.6%) | $44,063 |
| 3-Person Families | 293 (34.0%) | $48,125 |
| 4-Person Families | 42 (4.9%) | $0 |
| 5-Person Families | 76 (8.8%) | $92,348 |
| 6-Person Families | 15 (1.7%) | $0 |
| 7+ Person Families | 0 (0.0%) | $0 |
| Total | 863 (100.0%) | $52,986 |
Family Income by Number of Earners in Altavista
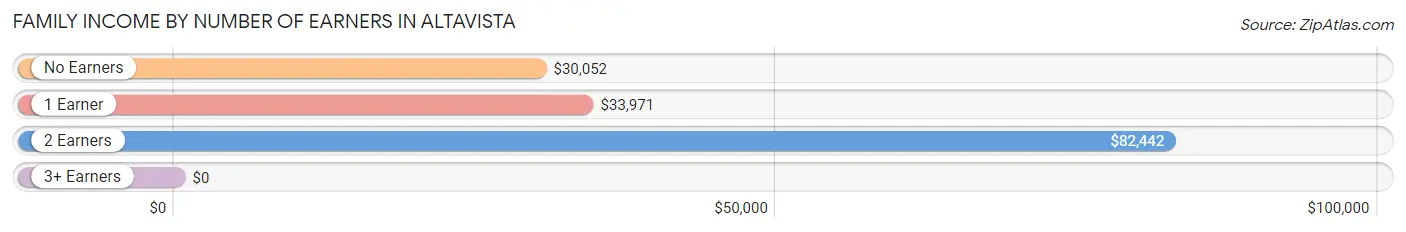
| Number of Earners | # Families | Median Income |
| No Earners | 137 (15.9%) | $30,052 |
| 1 Earner | 320 (37.1%) | $33,971 |
| 2 Earners | 386 (44.7%) | $82,442 |
| 3+ Earners | 20 (2.3%) | $0 |
| Total | 863 (100.0%) | $52,986 |
Household Income in Altavista
Household Income Brackets in Altavista
With 332 households falling in the category, the $25,000 to $34,999 income range is the most frequent in Altavista, accounting for 22.9% of all households. In contrast, only 9 households (0.6%) fall into the $150,000 to $199,999 income bracket, making it the least populous group.
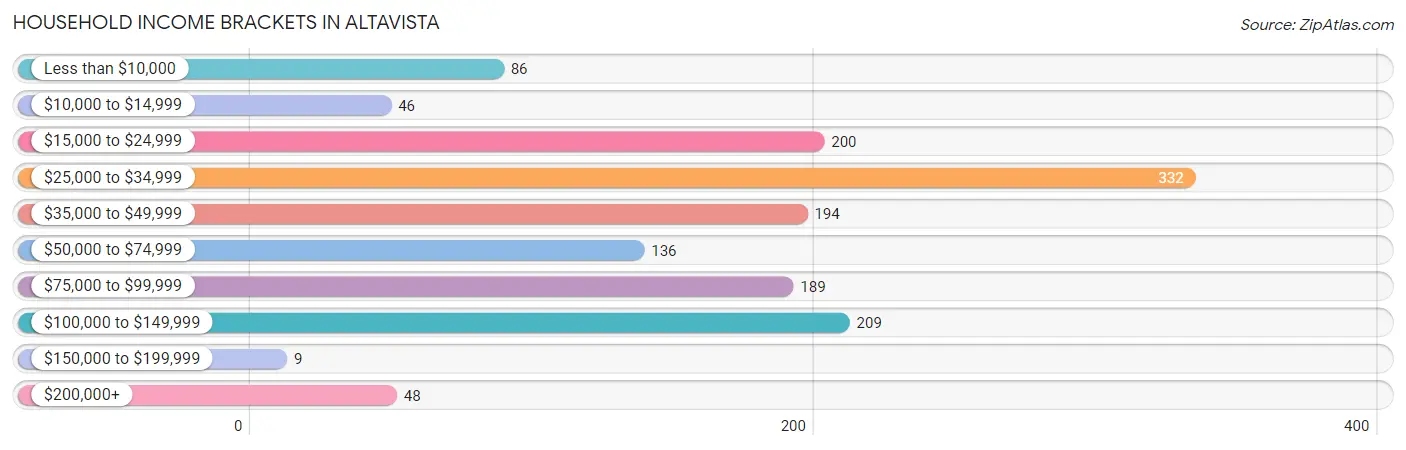
| Income Bracket | # Households | % Households |
| Less than $10,000 | 86 | 5.9% |
| $10,000 to $14,999 | 46 | 3.2% |
| $15,000 to $24,999 | 200 | 13.8% |
| $25,000 to $34,999 | 332 | 22.9% |
| $35,000 to $49,999 | 194 | 13.4% |
| $50,000 to $74,999 | 136 | 9.4% |
| $75,000 to $99,999 | 189 | 13.0% |
| $100,000 to $149,999 | 209 | 14.4% |
| $150,000 to $199,999 | 9 | 0.6% |
| $200,000+ | 48 | 3.3% |
Household Income by Householder Age in Altavista
The median household income in Altavista is $39,761, with the highest median household income of $73,906 found in the 45 to 64 years age bracket for the primary householder. A total of 477 households (32.9%) fall into this category. Meanwhile, the 15 to 24 years age bracket for the primary householder has the lowest median household income of $0, with 24 households (1.7%) in this group.
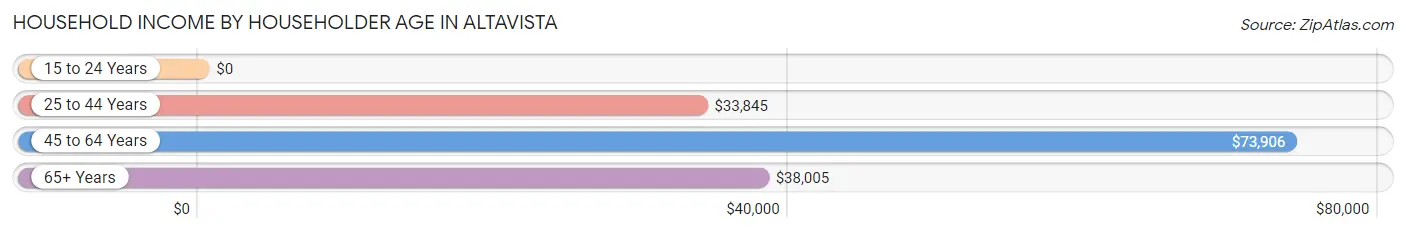
| Income Bracket | # Households | Median Income |
| 15 to 24 Years | 24 (1.7%) | $0 |
| 25 to 44 Years | 491 (33.8%) | $33,845 |
| 45 to 64 Years | 477 (32.9%) | $73,906 |
| 65+ Years | 459 (31.6%) | $38,005 |
| Total | 1,451 (100.0%) | $39,761 |
Poverty in Altavista
Income Below Poverty by Sex and Age in Altavista
With 13.4% poverty level for males and 7.0% for females among the residents of Altavista, under 5 year old males and 18 to 24 year old females are the most vulnerable to poverty, with 54 males (46.2%) and 7 females (21.9%) in their respective age groups living below the poverty level.
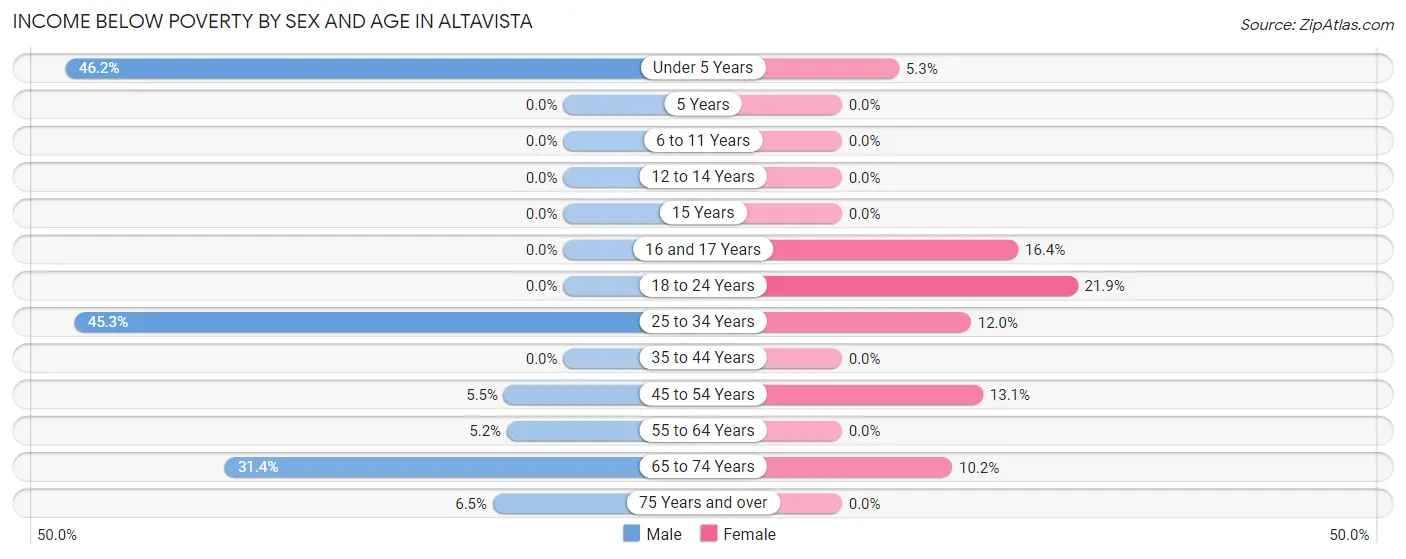
| Age Bracket | Male | Female |
| Under 5 Years | 54 (46.2%) | 7 (5.3%) |
| 5 Years | 0 (0.0%) | 0 (0.0%) |
| 6 to 11 Years | 0 (0.0%) | 0 (0.0%) |
| 12 to 14 Years | 0 (0.0%) | 0 (0.0%) |
| 15 Years | 0 (0.0%) | 0 (0.0%) |
| 16 and 17 Years | 0 (0.0%) | 9 (16.4%) |
| 18 to 24 Years | 0 (0.0%) | 7 (21.9%) |
| 25 to 34 Years | 73 (45.3%) | 34 (12.0%) |
| 35 to 44 Years | 0 (0.0%) | 0 (0.0%) |
| 45 to 54 Years | 9 (5.5%) | 39 (13.1%) |
| 55 to 64 Years | 12 (5.2%) | 0 (0.0%) |
| 65 to 74 Years | 65 (31.4%) | 18 (10.2%) |
| 75 Years and over | 7 (6.5%) | 0 (0.0%) |
| Total | 220 (13.4%) | 114 (7.0%) |
Income Above Poverty by Sex and Age in Altavista
According to the poverty statistics in Altavista, males aged 5 years and females aged 5 years are the age groups that are most secure financially, with 100.0% of males and 100.0% of females in these age groups living above the poverty line.
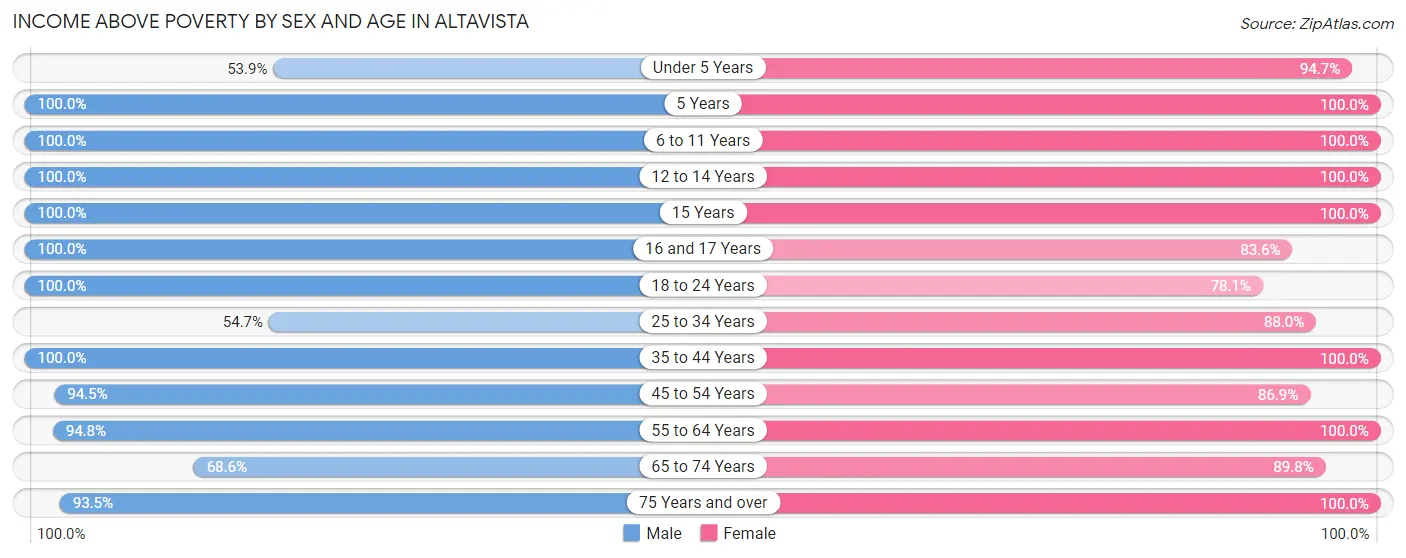
| Age Bracket | Male | Female |
| Under 5 Years | 63 (53.8%) | 125 (94.7%) |
| 5 Years | 13 (100.0%) | 33 (100.0%) |
| 6 to 11 Years | 121 (100.0%) | 70 (100.0%) |
| 12 to 14 Years | 71 (100.0%) | 63 (100.0%) |
| 15 Years | 49 (100.0%) | 14 (100.0%) |
| 16 and 17 Years | 32 (100.0%) | 46 (83.6%) |
| 18 to 24 Years | 127 (100.0%) | 25 (78.1%) |
| 25 to 34 Years | 88 (54.7%) | 250 (88.0%) |
| 35 to 44 Years | 250 (100.0%) | 139 (100.0%) |
| 45 to 54 Years | 154 (94.5%) | 259 (86.9%) |
| 55 to 64 Years | 217 (94.8%) | 211 (100.0%) |
| 65 to 74 Years | 142 (68.6%) | 158 (89.8%) |
| 75 Years and over | 100 (93.5%) | 123 (100.0%) |
| Total | 1,427 (86.6%) | 1,516 (93.0%) |
Income Below Poverty Among Married-Couple Families in Altavista
The poverty statistics for married-couple families in Altavista show that 1.3% or 7 of the total 528 families live below the poverty line. Families with no children have the highest poverty rate of 2.9%, comprising of 7 families. On the other hand, families with 1 or 2 children have the lowest poverty rate of 0.0%, which includes 0 families.
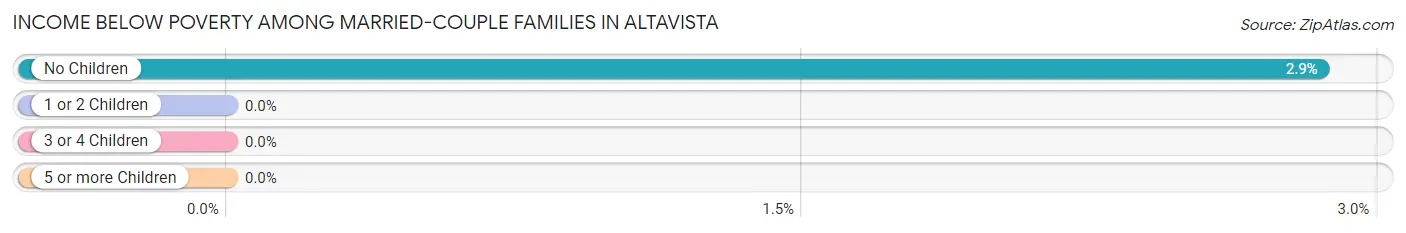
| Children | Above Poverty | Below Poverty |
| No Children | 239 (97.2%) | 7 (2.9%) |
| 1 or 2 Children | 191 (100.0%) | 0 (0.0%) |
| 3 or 4 Children | 91 (100.0%) | 0 (0.0%) |
| 5 or more Children | 0 (0.0%) | 0 (0.0%) |
| Total | 521 (98.7%) | 7 (1.3%) |
Income Below Poverty Among Single-Parent Households in Altavista
According to the poverty data in Altavista, 28.0% or 42 single-father households and 10.8% or 20 single-mother households are living below the poverty line. Among single-father households, those with 1 or 2 children have the highest poverty rate, with 42 households (59.2%) experiencing poverty. Likewise, among single-mother households, those with 1 or 2 children have the highest poverty rate, with 20 households (15.0%) falling below the poverty line.
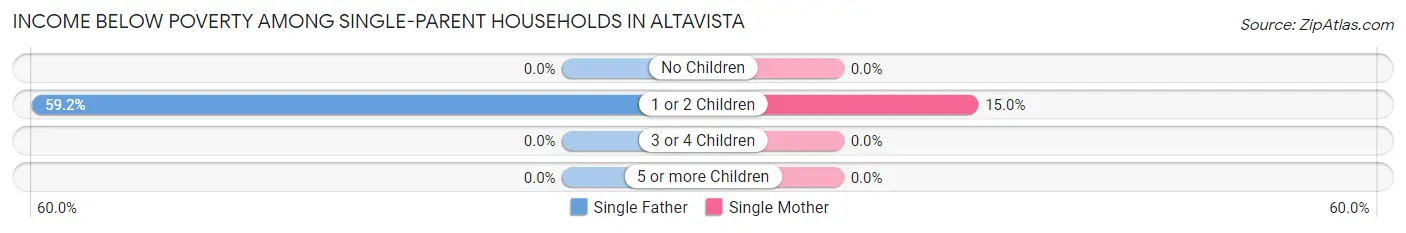
| Children | Single Father | Single Mother |
| No Children | 0 (0.0%) | 0 (0.0%) |
| 1 or 2 Children | 42 (59.2%) | 20 (15.0%) |
| 3 or 4 Children | 0 (0.0%) | 0 (0.0%) |
| 5 or more Children | 0 (0.0%) | 0 (0.0%) |
| Total | 42 (28.0%) | 20 (10.8%) |
Income Below Poverty Among Married-Couple vs Single-Parent Households in Altavista
The poverty data for Altavista shows that 7 of the married-couple family households (1.3%) and 62 of the single-parent households (18.5%) are living below the poverty level. Within the married-couple family households, those with no children have the highest poverty rate, with 7 households (2.9%) falling below the poverty line. Among the single-parent households, those with 1 or 2 children have the highest poverty rate, with 62 household (30.4%) living below poverty.
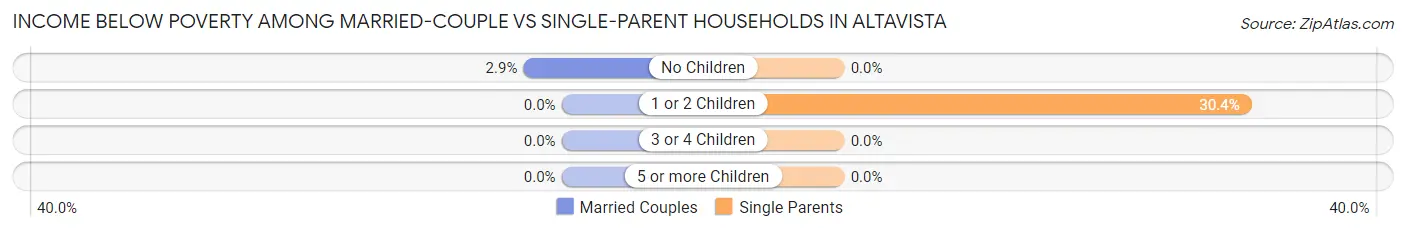
| Children | Married-Couple Families | Single-Parent Households |
| No Children | 7 (2.9%) | 0 (0.0%) |
| 1 or 2 Children | 0 (0.0%) | 62 (30.4%) |
| 3 or 4 Children | 0 (0.0%) | 0 (0.0%) |
| 5 or more Children | 0 (0.0%) | 0 (0.0%) |
| Total | 7 (1.3%) | 62 (18.5%) |
Race in Altavista
The most populous races in Altavista are White / Caucasian (2,215 | 65.7%), Black / African American (1,037 | 30.8%), and Two or more Races (118 | 3.5%).
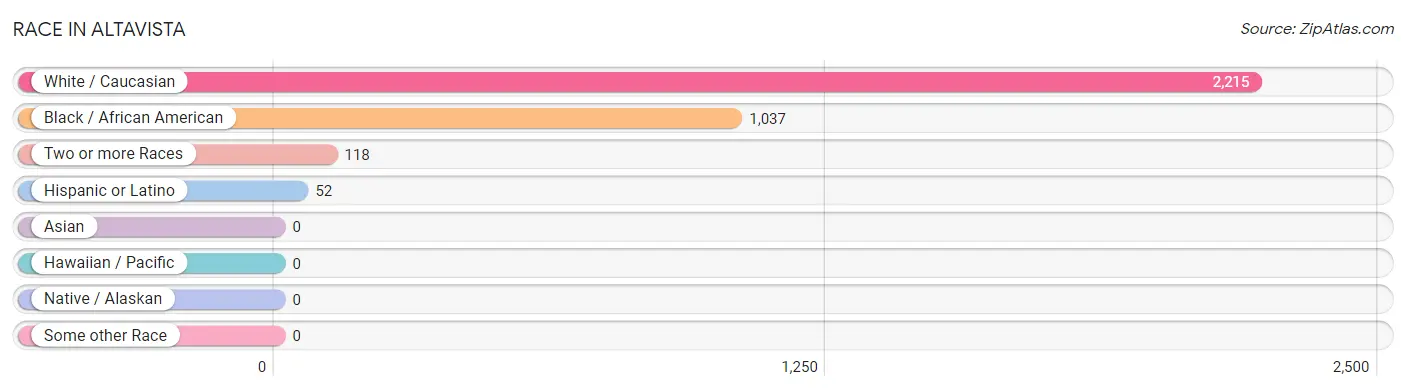
| Race | # Population | % Population |
| Asian | 0 | 0.0% |
| Black / African American | 1,037 | 30.8% |
| Hawaiian / Pacific | 0 | 0.0% |
| Hispanic or Latino | 52 | 1.5% |
| Native / Alaskan | 0 | 0.0% |
| White / Caucasian | 2,215 | 65.7% |
| Two or more Races | 118 | 3.5% |
| Some other Race | 0 | 0.0% |
| Total | 3,370 | 100.0% |
Ancestry in Altavista
The most populous ancestries reported in Altavista are American (463 | 13.7%), English (361 | 10.7%), European (212 | 6.3%), Irish (204 | 6.0%), and German (185 | 5.5%), together accounting for 42.3% of all Altavista residents.
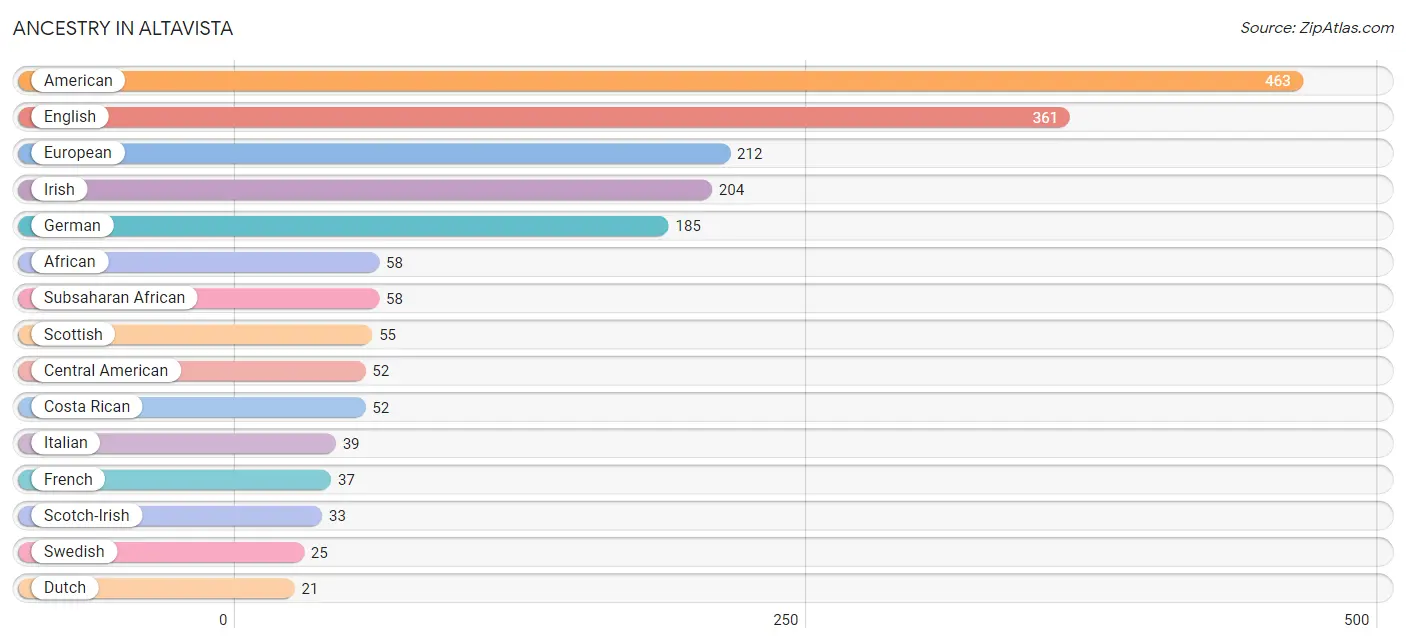
| Ancestry | # Population | % Population |
| African | 58 | 1.7% |
| American | 463 | 13.7% |
| Blackfeet | 12 | 0.4% |
| British | 17 | 0.5% |
| Central American | 52 | 1.5% |
| Costa Rican | 52 | 1.5% |
| Dutch | 21 | 0.6% |
| English | 361 | 10.7% |
| European | 212 | 6.3% |
| French | 37 | 1.1% |
| German | 185 | 5.5% |
| Hungarian | 19 | 0.6% |
| Irish | 204 | 6.0% |
| Italian | 39 | 1.2% |
| Northern European | 5 | 0.2% |
| Polish | 8 | 0.2% |
| Scotch-Irish | 33 | 1.0% |
| Scottish | 55 | 1.6% |
| Subsaharan African | 58 | 1.7% |
| Swedish | 25 | 0.7% |
| Swiss | 8 | 0.2% | View All 21 Rows |
Immigrants in Altavista

| Immigration Origin | # Population | % Population | View All 0 Rows |
Sex and Age in Altavista
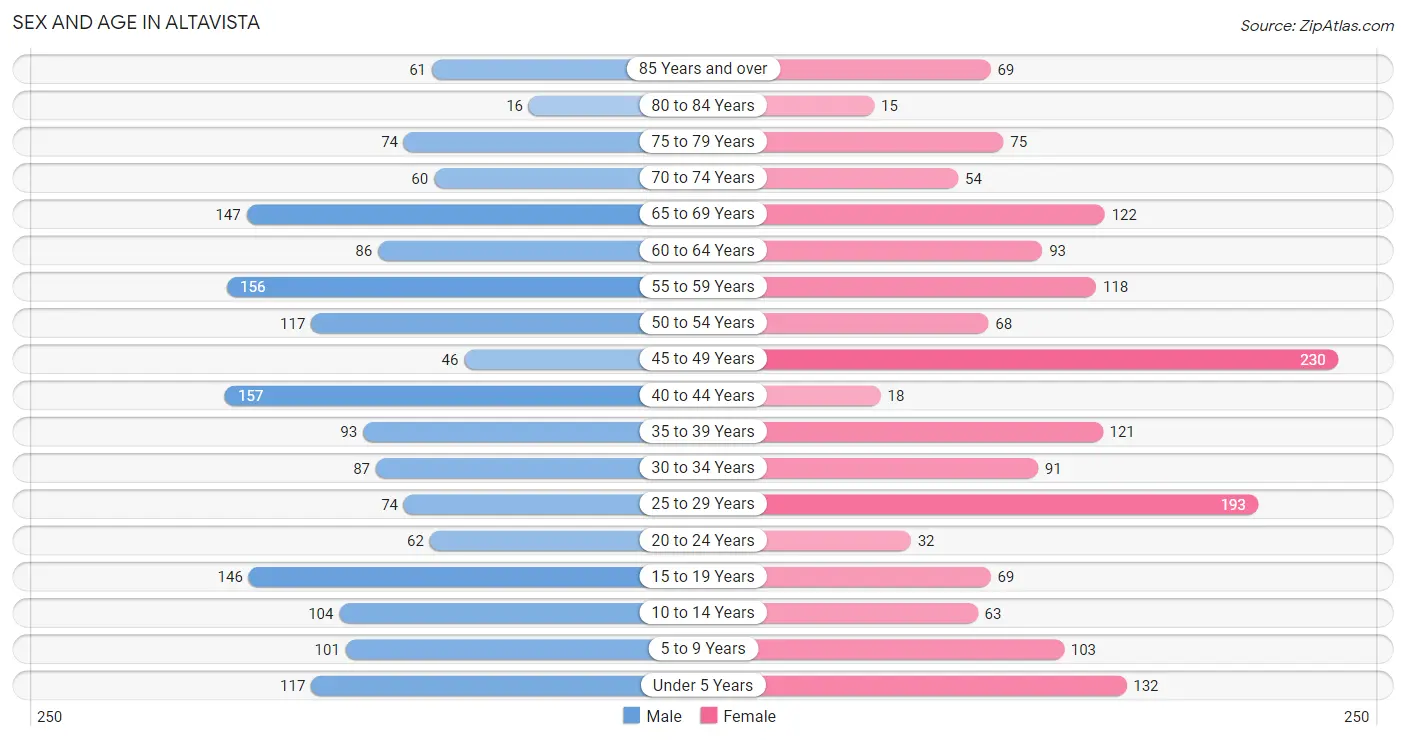
Sex and Age in Altavista
The most populous age groups in Altavista are 40 to 44 Years (157 | 9.2%) for men and 45 to 49 Years (230 | 13.8%) for women.
| Age Bracket | Male | Female |
| Under 5 Years | 117 (6.9%) | 132 (7.9%) |
| 5 to 9 Years | 101 (5.9%) | 103 (6.2%) |
| 10 to 14 Years | 104 (6.1%) | 63 (3.8%) |
| 15 to 19 Years | 146 (8.6%) | 69 (4.1%) |
| 20 to 24 Years | 62 (3.6%) | 32 (1.9%) |
| 25 to 29 Years | 74 (4.3%) | 193 (11.6%) |
| 30 to 34 Years | 87 (5.1%) | 91 (5.5%) |
| 35 to 39 Years | 93 (5.5%) | 121 (7.3%) |
| 40 to 44 Years | 157 (9.2%) | 18 (1.1%) |
| 45 to 49 Years | 46 (2.7%) | 230 (13.8%) |
| 50 to 54 Years | 117 (6.9%) | 68 (4.1%) |
| 55 to 59 Years | 156 (9.1%) | 118 (7.1%) |
| 60 to 64 Years | 86 (5.1%) | 93 (5.6%) |
| 65 to 69 Years | 147 (8.6%) | 122 (7.3%) |
| 70 to 74 Years | 60 (3.5%) | 54 (3.2%) |
| 75 to 79 Years | 74 (4.3%) | 75 (4.5%) |
| 80 to 84 Years | 16 (0.9%) | 15 (0.9%) |
| 85 Years and over | 61 (3.6%) | 69 (4.1%) |
| Total | 1,704 (100.0%) | 1,666 (100.0%) |
Families and Households in Altavista
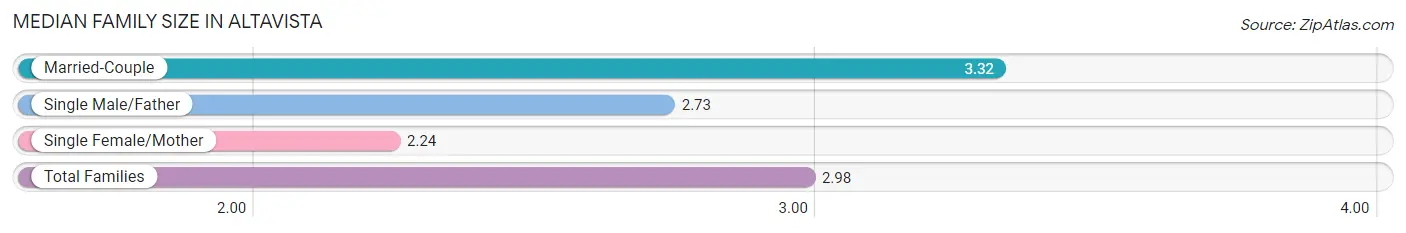
Median Family Size in Altavista
The median family size in Altavista is 2.98 persons per family, with married-couple families (528 | 61.2%) accounting for the largest median family size of 3.32 persons per family. On the other hand, single female/mother families (185 | 21.4%) represent the smallest median family size with 2.24 persons per family.
| Family Type | # Families | Family Size |
| Married-Couple | 528 (61.2%) | 3.32 |
| Single Male/Father | 150 (17.4%) | 2.73 |
| Single Female/Mother | 185 (21.4%) | 2.24 |
| Total Families | 863 (100.0%) | 2.98 |
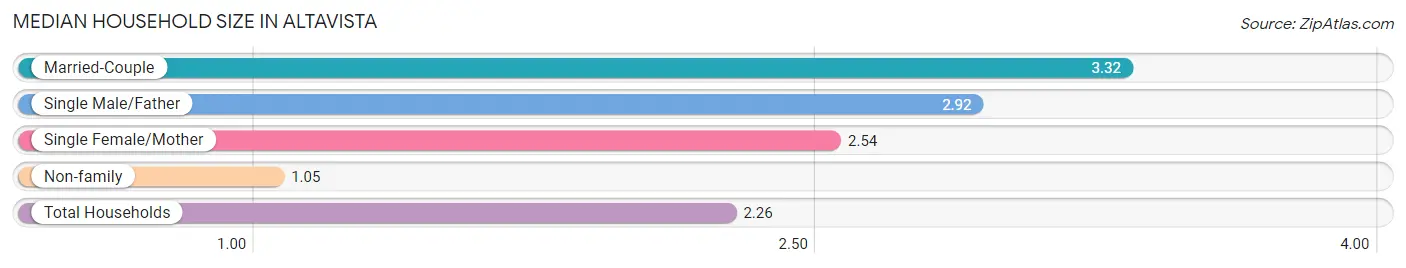
Median Household Size in Altavista
The median household size in Altavista is 2.26 persons per household, with married-couple households (528 | 36.4%) accounting for the largest median household size of 3.32 persons per household. non-family households (588 | 40.5%) represent the smallest median household size with 1.05 persons per household.
| Household Type | # Households | Household Size |
| Married-Couple | 528 (36.4%) | 3.32 |
| Single Male/Father | 150 (10.3%) | 2.92 |
| Single Female/Mother | 185 (12.8%) | 2.54 |
| Non-family | 588 (40.5%) | 1.05 |
| Total Households | 1,451 (100.0%) | 2.26 |
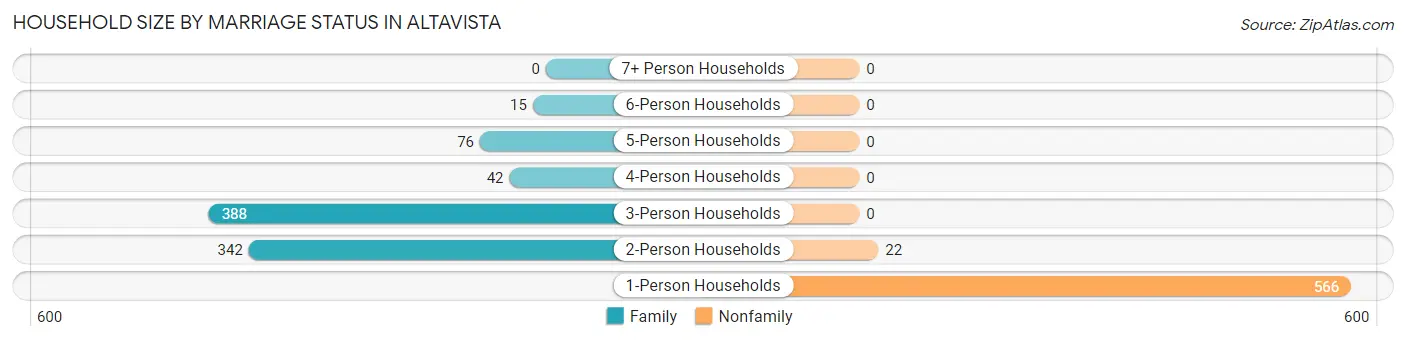
Household Size by Marriage Status in Altavista
Out of a total of 1,451 households in Altavista, 863 (59.5%) are family households, while 588 (40.5%) are nonfamily households. The most numerous type of family households are 3-person households, comprising 388, and the most common type of nonfamily households are 1-person households, comprising 566.
| Household Size | Family Households | Nonfamily Households |
| 1-Person Households | - | 566 (39.0%) |
| 2-Person Households | 342 (23.6%) | 22 (1.5%) |
| 3-Person Households | 388 (26.7%) | 0 (0.0%) |
| 4-Person Households | 42 (2.9%) | 0 (0.0%) |
| 5-Person Households | 76 (5.2%) | 0 (0.0%) |
| 6-Person Households | 15 (1.0%) | 0 (0.0%) |
| 7+ Person Households | 0 (0.0%) | 0 (0.0%) |
| Total | 863 (59.5%) | 588 (40.5%) |
Female Fertility in Altavista
Fertility by Age in Altavista
Average fertility rate in Altavista is 186.0 births per 1,000 women. Women in the age bracket of 20 to 34 years have the highest fertility rate with 449.0 births per 1,000 women. Women in the age bracket of 20 to 34 years acount for 100.0% of all women with births.
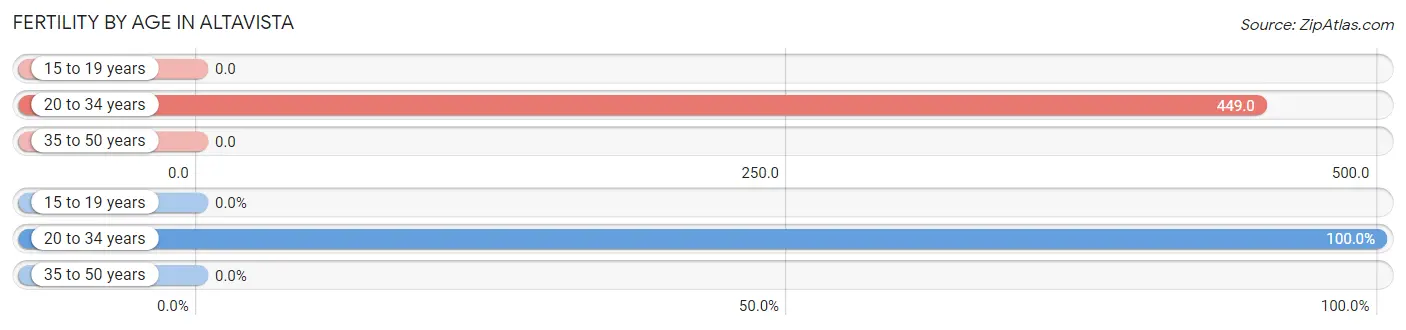
| Age Bracket | Women with Births | Births / 1,000 Women |
| 15 to 19 years | 0 (0.0%) | 0.0 |
| 20 to 34 years | 142 (100.0%) | 449.0 |
| 35 to 50 years | 0 (0.0%) | 0.0 |
| Total | 142 (100.0%) | 186.0 |
Fertility by Age by Marriage Status in Altavista
38.7% of women with births (142) in Altavista are married. The highest percentage of unmarried women with births falls into 20 to 34 years age bracket with 61.3% of them unmarried at the time of birth, while the lowest percentage of unmarried women with births belong to 20 to 34 years age bracket with 61.3% of them unmarried.
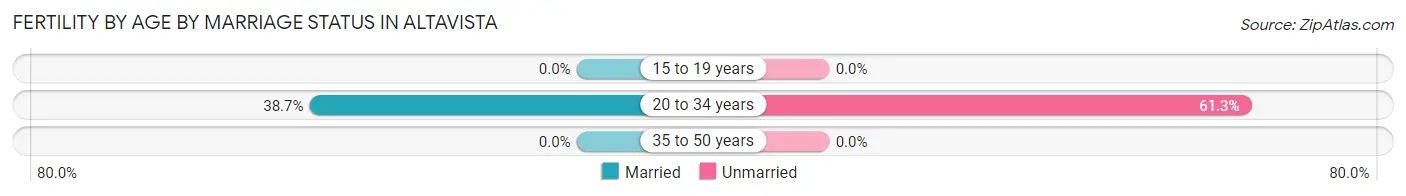
| Age Bracket | Married | Unmarried |
| 15 to 19 years | 0 (0.0%) | 0 (0.0%) |
| 20 to 34 years | 55 (38.7%) | 87 (61.3%) |
| 35 to 50 years | 0 (0.0%) | 0 (0.0%) |
| Total | 55 (38.7%) | 87 (61.3%) |
Fertility by Education in Altavista
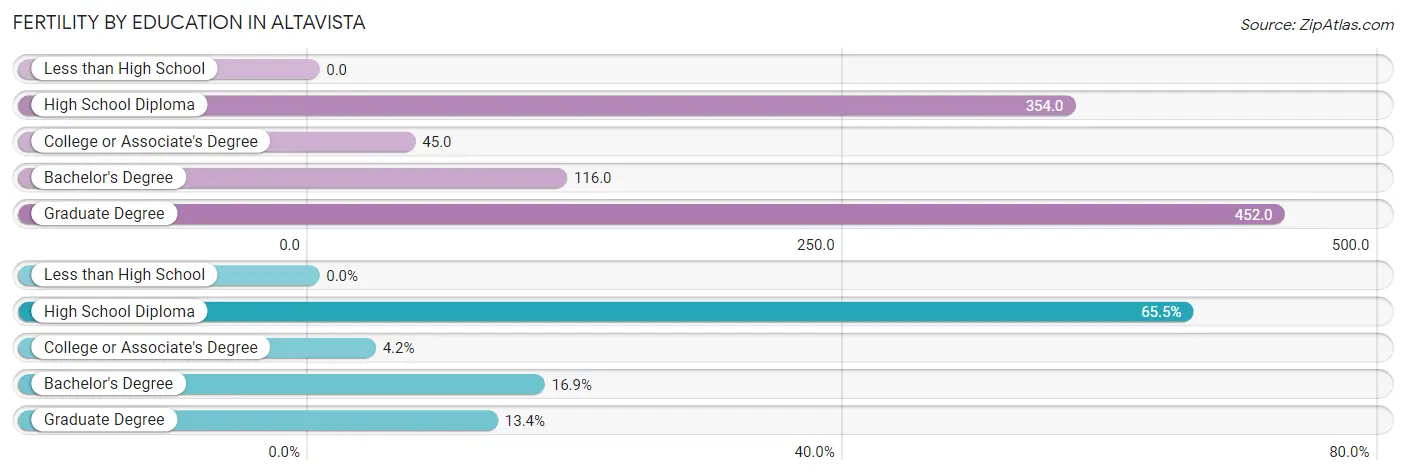
| Educational Attainment | Women with Births | Births / 1,000 Women |
| Less than High School | 0 (0.0%) | 0.0 |
| High School Diploma | 93 (65.5%) | 354.0 |
| College or Associate's Degree | 6 (4.2%) | 45.0 |
| Bachelor's Degree | 24 (16.9%) | 116.0 |
| Graduate Degree | 19 (13.4%) | 452.0 |
| Total | 142 (100.0%) | 186.0 |
Fertility by Education by Marriage Status in Altavista
61.3% of women with births in Altavista are unmarried. Women with the educational attainment of college or associate's degree are most likely to be married with 100.0% of them married at childbirth, while women with the educational attainment of high school diploma are least likely to be married with 93.5% of them unmarried at childbirth.
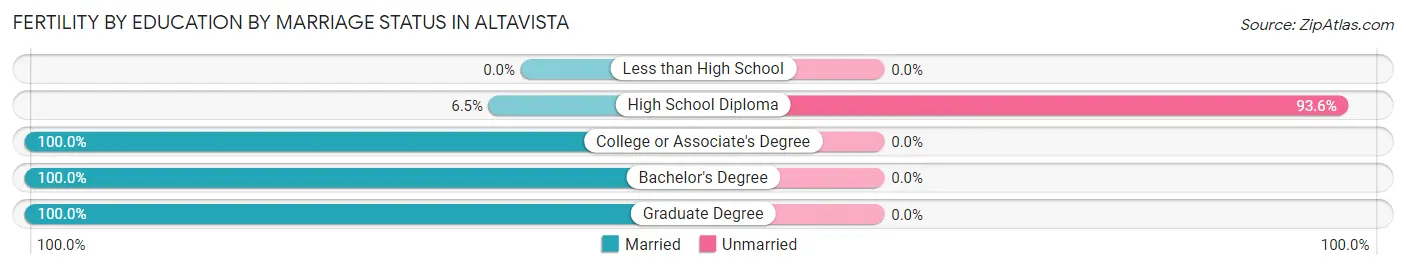
| Educational Attainment | Married | Unmarried |
| Less than High School | 0 (0.0%) | 0 (0.0%) |
| High School Diploma | 6 (6.5%) | 87 (93.5%) |
| College or Associate's Degree | 6 (100.0%) | 0 (0.0%) |
| Bachelor's Degree | 24 (100.0%) | 0 (0.0%) |
| Graduate Degree | 19 (100.0%) | 0 (0.0%) |
| Total | 55 (38.7%) | 87 (61.3%) |
Employment Characteristics in Altavista
Employment by Class of Employer in Altavista
Among the 1,383 employed individuals in Altavista, private company employees (1,064 | 76.9%), state government employees (93 | 6.7%), and local government employees (71 | 5.1%) make up the most common classes of employment.
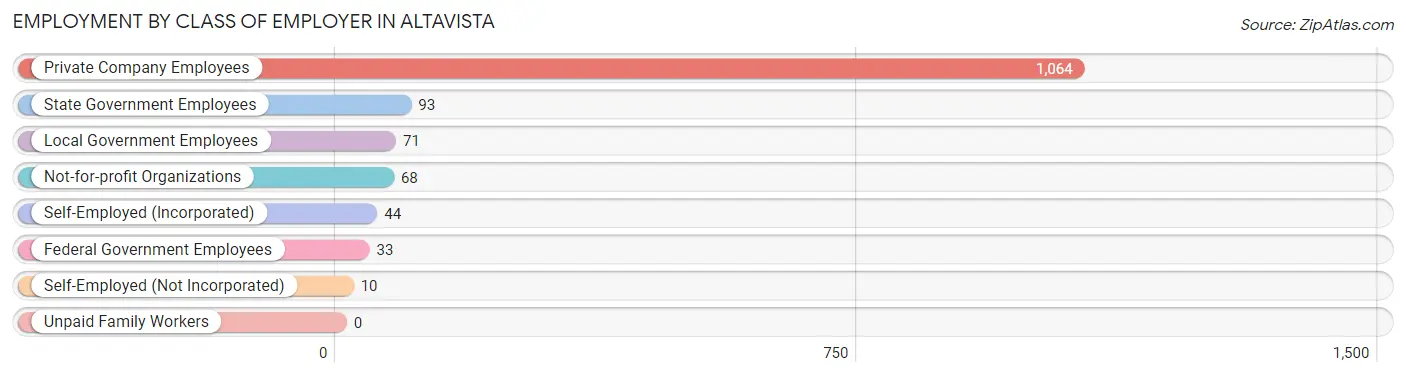
| Employer Class | # Employees | % Employees |
| Private Company Employees | 1,064 | 76.9% |
| Self-Employed (Incorporated) | 44 | 3.2% |
| Self-Employed (Not Incorporated) | 10 | 0.7% |
| Not-for-profit Organizations | 68 | 4.9% |
| Local Government Employees | 71 | 5.1% |
| State Government Employees | 93 | 6.7% |
| Federal Government Employees | 33 | 2.4% |
| Unpaid Family Workers | 0 | 0.0% |
| Total | 1,383 | 100.0% |
Employment Status by Age in Altavista
According to the labor force statistics for Altavista, out of the total population over 16 years of age (2,687), 61.3% or 1,647 individuals are in the labor force, with 11.5% or 189 of them unemployed. The age group with the highest labor force participation rate is 25 to 29 years, with 96.3% or 257 individuals in the labor force. Within the labor force, the 16 to 19 years age range has the highest percentage of unemployed individuals, with 38.7% or 29 of them being unemployed.
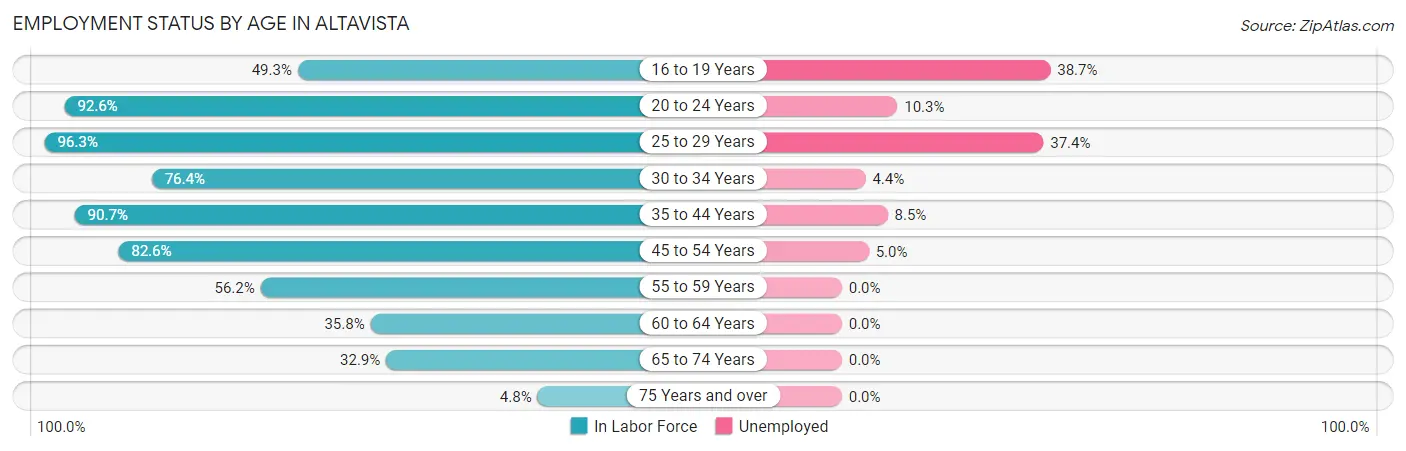
| Age Bracket | In Labor Force | Unemployed |
| 16 to 19 Years | 75 (49.3%) | 29 (38.7%) |
| 20 to 24 Years | 87 (92.6%) | 9 (10.3%) |
| 25 to 29 Years | 257 (96.3%) | 96 (37.4%) |
| 30 to 34 Years | 136 (76.4%) | 6 (4.4%) |
| 35 to 44 Years | 353 (90.7%) | 30 (8.5%) |
| 45 to 54 Years | 381 (82.6%) | 19 (5.0%) |
| 55 to 59 Years | 154 (56.2%) | 0 (0.0%) |
| 60 to 64 Years | 64 (35.8%) | 0 (0.0%) |
| 65 to 74 Years | 126 (32.9%) | 0 (0.0%) |
| 75 Years and over | 15 (4.8%) | 0 (0.0%) |
| Total | 1,647 (61.3%) | 189 (11.5%) |
Employment Status by Educational Attainment in Altavista
According to labor force statistics for Altavista, 76.9% of individuals (1,344) out of the total population between 25 and 64 years of age (1,748) are in the labor force, with 11.2% or 151 of them being unemployed. The group with the highest labor force participation rate are those with the educational attainment of bachelor's degree or higher, with 90.7% or 409 individuals in the labor force. Within the labor force, individuals with high school diploma education have the highest percentage of unemployment, with 20.1% or 86 of them being unemployed.
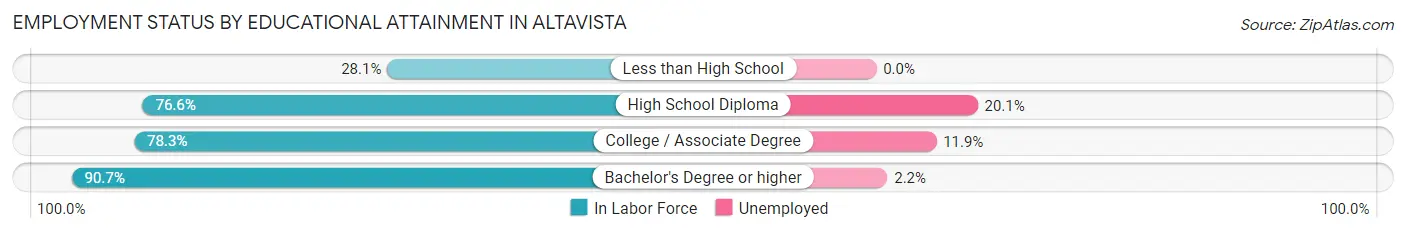
| Educational Attainment | In Labor Force | Unemployed |
| Less than High School | 39 (28.1%) | 0 (0.0%) |
| High School Diploma | 428 (76.6%) | 112 (20.1%) |
| College / Associate Degree | 469 (78.3%) | 71 (11.9%) |
| Bachelor's Degree or higher | 409 (90.7%) | 10 (2.2%) |
| Total | 1,344 (76.9%) | 196 (11.2%) |
Employment Occupations by Sex in Altavista
Management, Business, Science and Arts Occupations
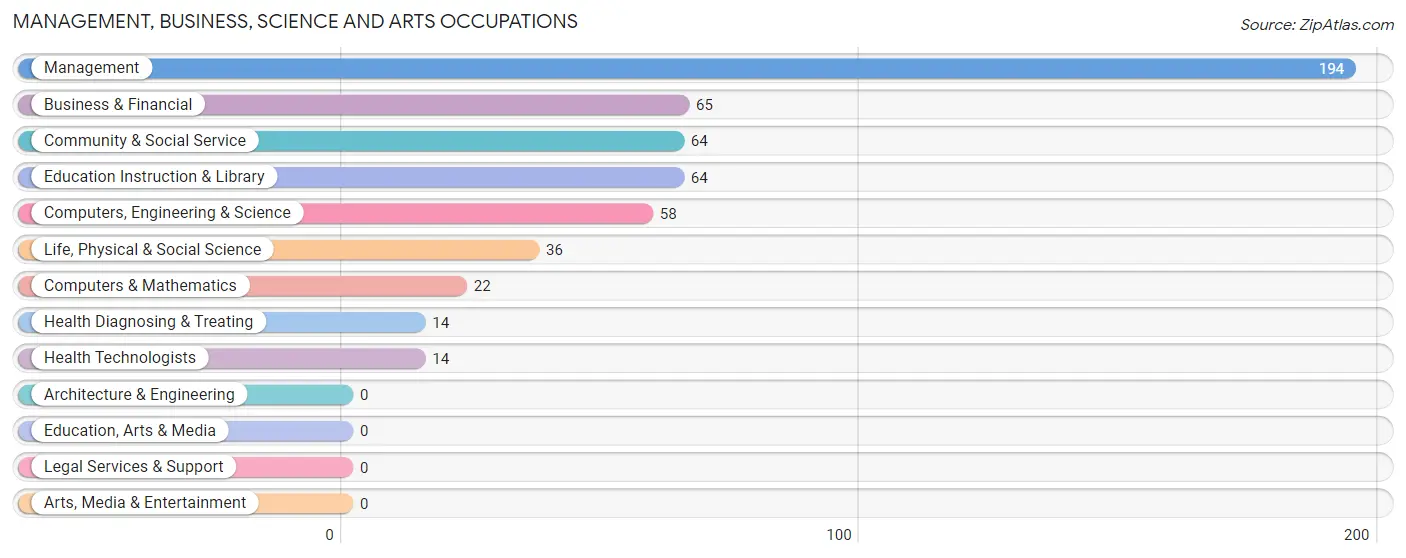
The most common Management, Business, Science and Arts occupations in Altavista are Management (194 | 13.3%), Business & Financial (65 | 4.5%), Community & Social Service (64 | 4.4%), Education Instruction & Library (64 | 4.4%), and Computers, Engineering & Science (58 | 4.0%).
Management, Business, Science and Arts Occupations by Sex
Within the Management, Business, Science and Arts occupations in Altavista, the most male-oriented occupations are Computers & Mathematics (54.5%), Management (26.8%), and Computers, Engineering & Science (20.7%), while the most female-oriented occupations are Life, Physical & Social Science (100.0%), Health Diagnosing & Treating (100.0%), and Health Technologists (100.0%).
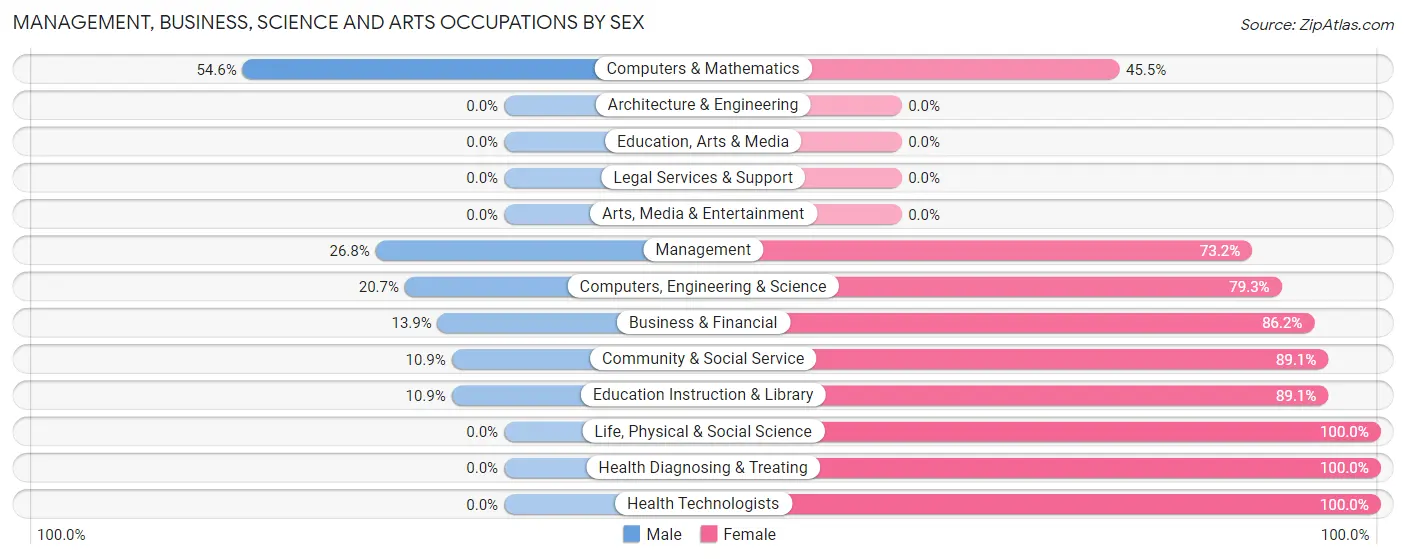
| Occupation | Male | Female |
| Management | 52 (26.8%) | 142 (73.2%) |
| Business & Financial | 9 (13.9%) | 56 (86.2%) |
| Computers, Engineering & Science | 12 (20.7%) | 46 (79.3%) |
| Computers & Mathematics | 12 (54.5%) | 10 (45.5%) |
| Architecture & Engineering | 0 (0.0%) | 0 (0.0%) |
| Life, Physical & Social Science | 0 (0.0%) | 36 (100.0%) |
| Community & Social Service | 7 (10.9%) | 57 (89.1%) |
| Education, Arts & Media | 0 (0.0%) | 0 (0.0%) |
| Legal Services & Support | 0 (0.0%) | 0 (0.0%) |
| Education Instruction & Library | 7 (10.9%) | 57 (89.1%) |
| Arts, Media & Entertainment | 0 (0.0%) | 0 (0.0%) |
| Health Diagnosing & Treating | 0 (0.0%) | 14 (100.0%) |
| Health Technologists | 0 (0.0%) | 14 (100.0%) |
| Total (Category) | 80 (20.3%) | 315 (79.7%) |
| Total (Overall) | 735 (50.4%) | 724 (49.6%) |
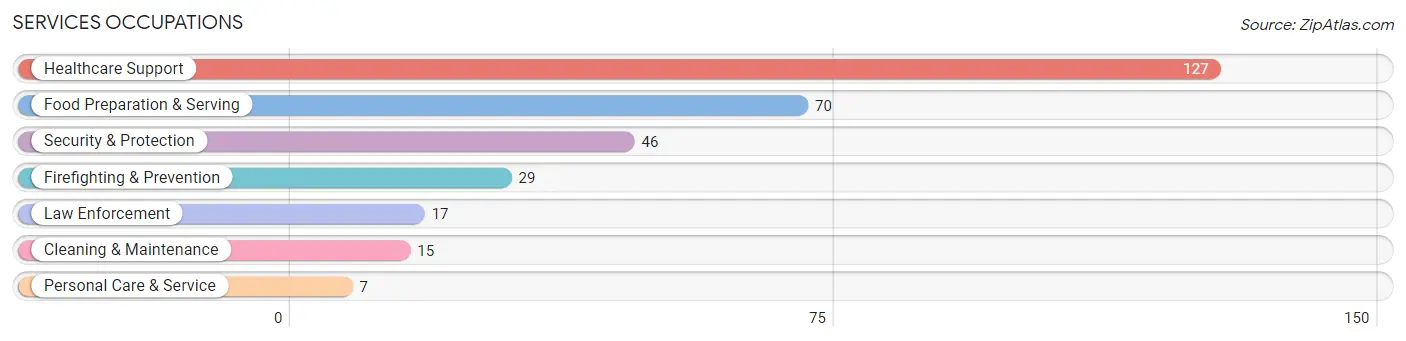
Services Occupations
The most common Services occupations in Altavista are Healthcare Support (127 | 8.7%), Food Preparation & Serving (70 | 4.8%), Security & Protection (46 | 3.2%), Firefighting & Prevention (29 | 2.0%), and Law Enforcement (17 | 1.2%).
Services Occupations by Sex
Within the Services occupations in Altavista, the most male-oriented occupations are Security & Protection (100.0%), Firefighting & Prevention (100.0%), and Law Enforcement (100.0%), while the most female-oriented occupations are Healthcare Support (100.0%), Personal Care & Service (100.0%), and Food Preparation & Serving (64.3%).
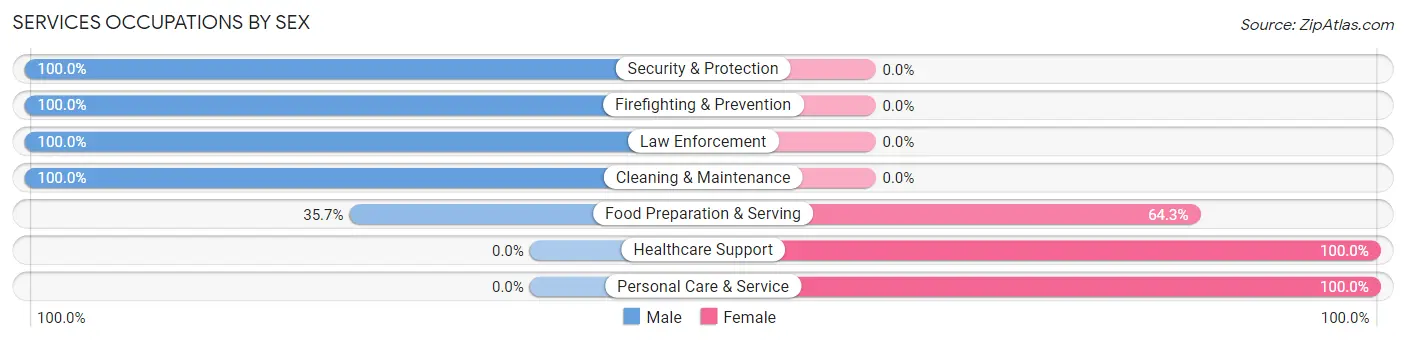
| Occupation | Male | Female |
| Healthcare Support | 0 (0.0%) | 127 (100.0%) |
| Security & Protection | 46 (100.0%) | 0 (0.0%) |
| Firefighting & Prevention | 29 (100.0%) | 0 (0.0%) |
| Law Enforcement | 17 (100.0%) | 0 (0.0%) |
| Food Preparation & Serving | 25 (35.7%) | 45 (64.3%) |
| Cleaning & Maintenance | 15 (100.0%) | 0 (0.0%) |
| Personal Care & Service | 0 (0.0%) | 7 (100.0%) |
| Total (Category) | 86 (32.5%) | 179 (67.5%) |
| Total (Overall) | 735 (50.4%) | 724 (49.6%) |
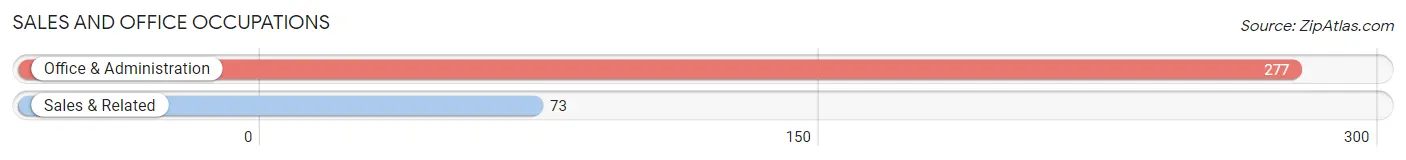
Sales and Office Occupations
The most common Sales and Office occupations in Altavista are Office & Administration (277 | 19.0%), and Sales & Related (73 | 5.0%).
Sales and Office Occupations by Sex

| Occupation | Male | Female |
| Sales & Related | 56 (76.7%) | 17 (23.3%) |
| Office & Administration | 86 (31.0%) | 191 (69.0%) |
| Total (Category) | 142 (40.6%) | 208 (59.4%) |
| Total (Overall) | 735 (50.4%) | 724 (49.6%) |
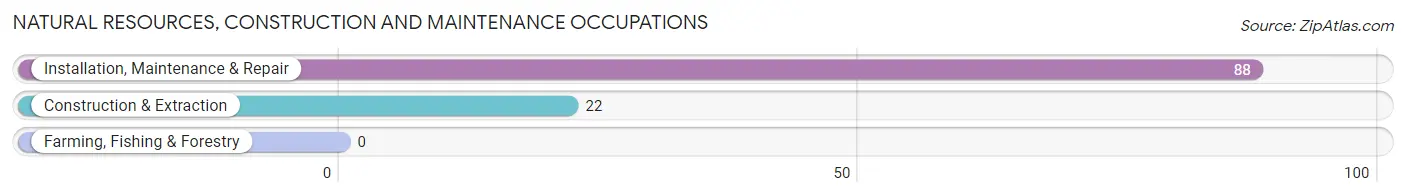
Natural Resources, Construction and Maintenance Occupations
The most common Natural Resources, Construction and Maintenance occupations in Altavista are Installation, Maintenance & Repair (88 | 6.0%), and Construction & Extraction (22 | 1.5%).
Natural Resources, Construction and Maintenance Occupations by Sex
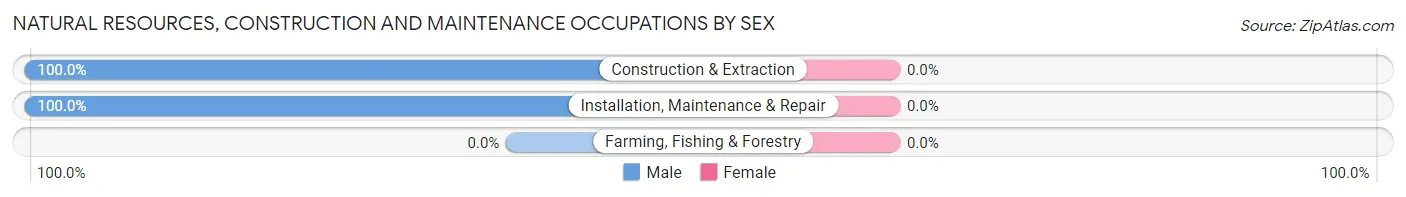
| Occupation | Male | Female |
| Farming, Fishing & Forestry | 0 (0.0%) | 0 (0.0%) |
| Construction & Extraction | 22 (100.0%) | 0 (0.0%) |
| Installation, Maintenance & Repair | 88 (100.0%) | 0 (0.0%) |
| Total (Category) | 110 (100.0%) | 0 (0.0%) |
| Total (Overall) | 735 (50.4%) | 724 (49.6%) |
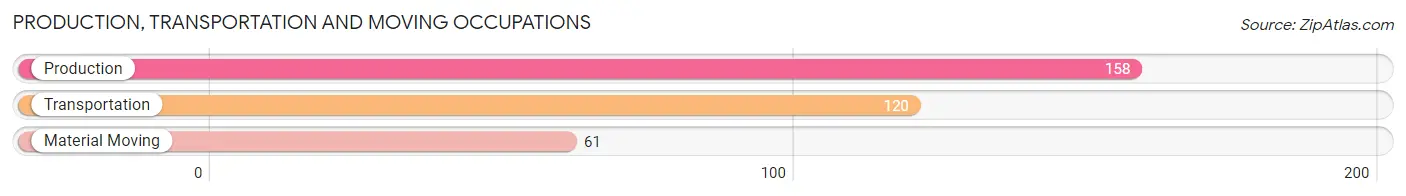
Production, Transportation and Moving Occupations
The most common Production, Transportation and Moving occupations in Altavista are Production (158 | 10.8%), Transportation (120 | 8.2%), and Material Moving (61 | 4.2%).
Production, Transportation and Moving Occupations by Sex
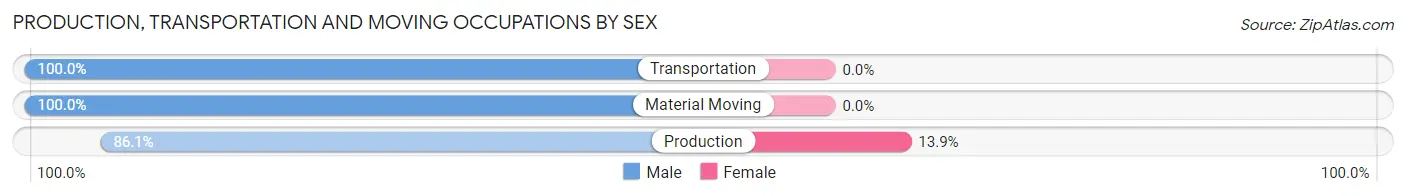
| Occupation | Male | Female |
| Production | 136 (86.1%) | 22 (13.9%) |
| Transportation | 120 (100.0%) | 0 (0.0%) |
| Material Moving | 61 (100.0%) | 0 (0.0%) |
| Total (Category) | 317 (93.5%) | 22 (6.5%) |
| Total (Overall) | 735 (50.4%) | 724 (49.6%) |
Employment Industries by Sex in Altavista
Employment Industries in Altavista
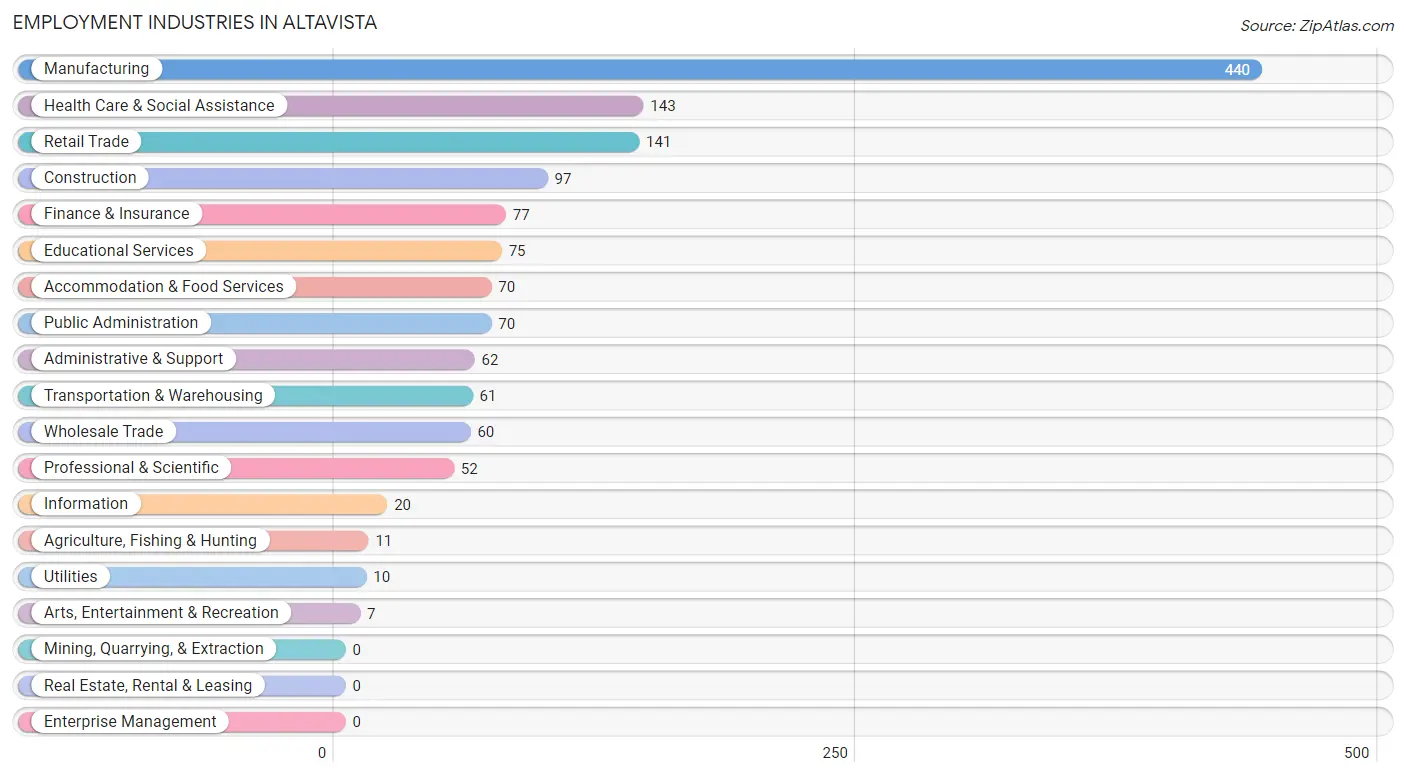
The major employment industries in Altavista include Manufacturing (440 | 30.2%), Health Care & Social Assistance (143 | 9.8%), Retail Trade (141 | 9.7%), Construction (97 | 6.7%), and Finance & Insurance (77 | 5.3%).
Employment Industries by Sex in Altavista
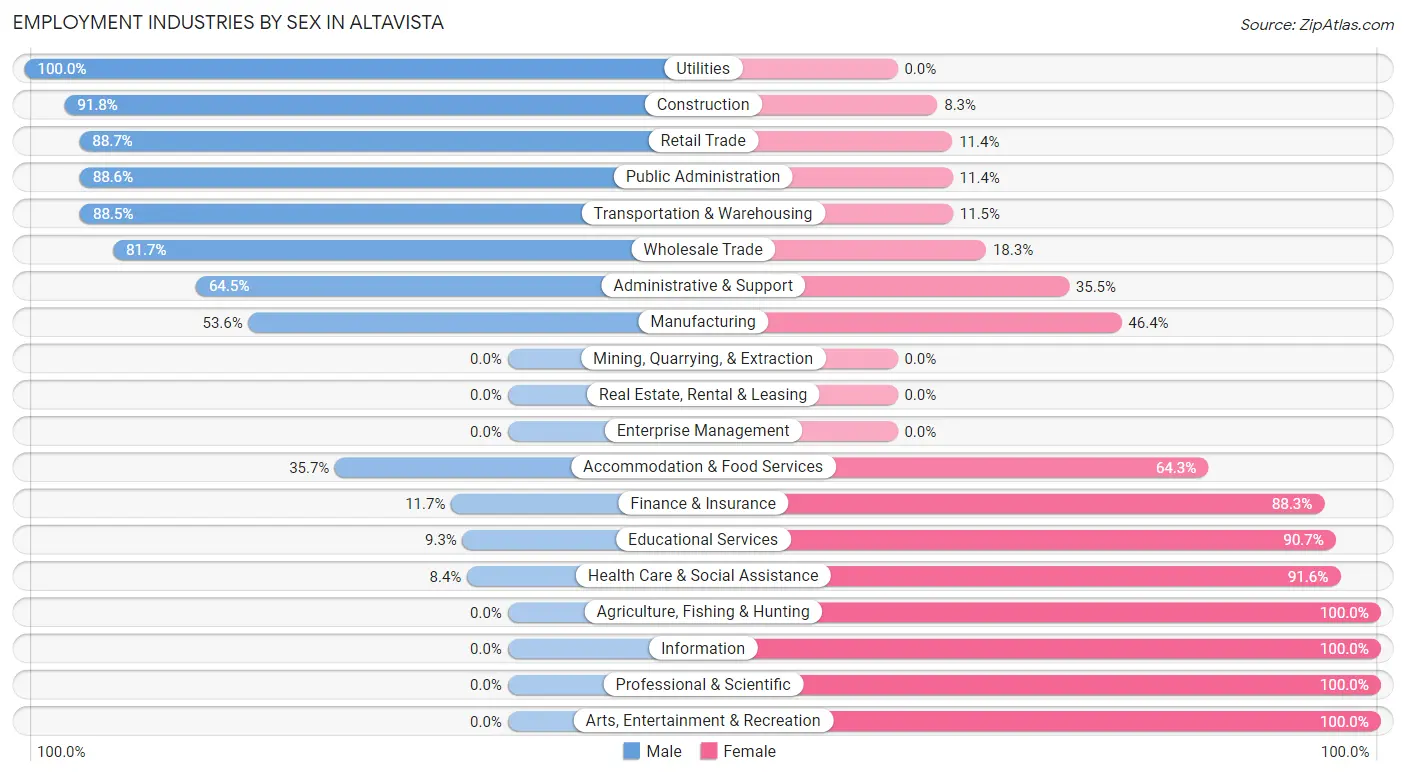
The Altavista industries that see more men than women are Utilities (100.0%), Construction (91.7%), and Retail Trade (88.6%), whereas the industries that tend to have a higher number of women are Agriculture, Fishing & Hunting (100.0%), Information (100.0%), and Professional & Scientific (100.0%).
| Industry | Male | Female |
| Agriculture, Fishing & Hunting | 0 (0.0%) | 11 (100.0%) |
| Mining, Quarrying, & Extraction | 0 (0.0%) | 0 (0.0%) |
| Construction | 89 (91.7%) | 8 (8.3%) |
| Manufacturing | 236 (53.6%) | 204 (46.4%) |
| Wholesale Trade | 49 (81.7%) | 11 (18.3%) |
| Retail Trade | 125 (88.6%) | 16 (11.4%) |
| Transportation & Warehousing | 54 (88.5%) | 7 (11.5%) |
| Utilities | 10 (100.0%) | 0 (0.0%) |
| Information | 0 (0.0%) | 20 (100.0%) |
| Finance & Insurance | 9 (11.7%) | 68 (88.3%) |
| Real Estate, Rental & Leasing | 0 (0.0%) | 0 (0.0%) |
| Professional & Scientific | 0 (0.0%) | 52 (100.0%) |
| Enterprise Management | 0 (0.0%) | 0 (0.0%) |
| Administrative & Support | 40 (64.5%) | 22 (35.5%) |
| Educational Services | 7 (9.3%) | 68 (90.7%) |
| Health Care & Social Assistance | 12 (8.4%) | 131 (91.6%) |
| Arts, Entertainment & Recreation | 0 (0.0%) | 7 (100.0%) |
| Accommodation & Food Services | 25 (35.7%) | 45 (64.3%) |
| Public Administration | 62 (88.6%) | 8 (11.4%) |
| Total | 735 (50.4%) | 724 (49.6%) |
Education in Altavista
School Enrollment in Altavista
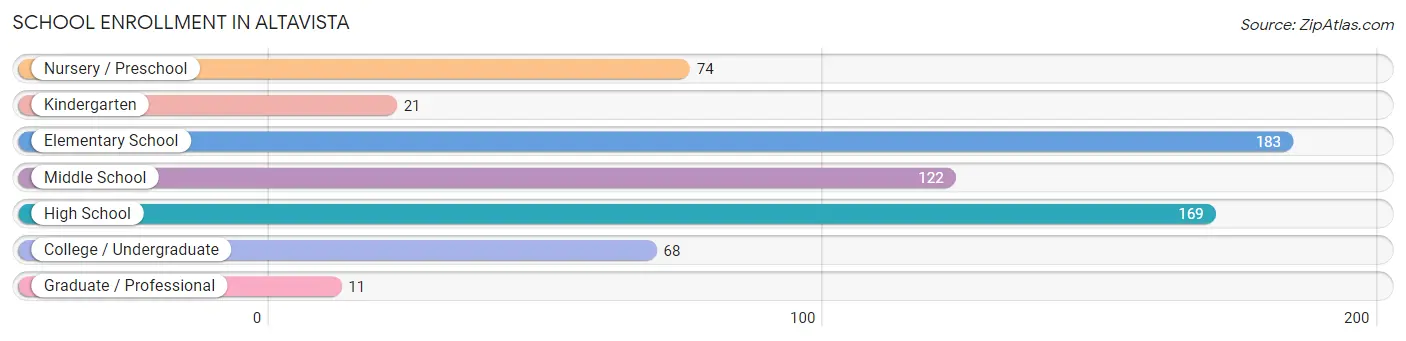
The most common levels of schooling among the 648 students in Altavista are elementary school (183 | 28.2%), high school (169 | 26.1%), and middle school (122 | 18.8%).
| School Level | # Students | % Students |
| Nursery / Preschool | 74 | 11.4% |
| Kindergarten | 21 | 3.2% |
| Elementary School | 183 | 28.2% |
| Middle School | 122 | 18.8% |
| High School | 169 | 26.1% |
| College / Undergraduate | 68 | 10.5% |
| Graduate / Professional | 11 | 1.7% |
| Total | 648 | 100.0% |
School Enrollment by Age by Funding Source in Altavista
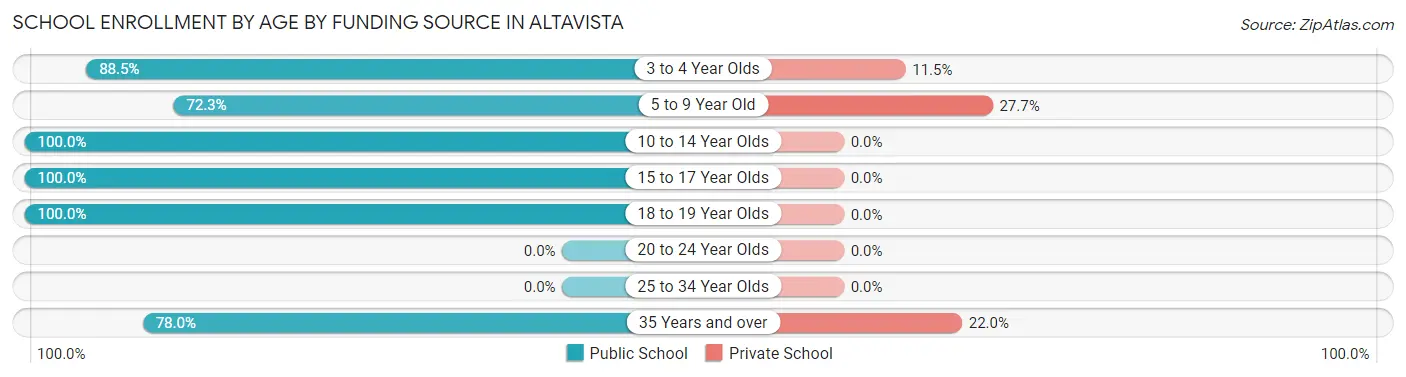
Out of a total of 648 students who are enrolled in schools in Altavista, 69 (10.6%) attend a private institution, while the remaining 579 (89.4%) are enrolled in public schools. The age group of 5 to 9 year old has the highest likelihood of being enrolled in private schools, with 51 (27.7% in the age bracket) enrolled. Conversely, the age group of 10 to 14 year olds has the lowest likelihood of being enrolled in a private school, with 167 (100.0% in the age bracket) attending a public institution.
| Age Bracket | Public School | Private School |
| 3 to 4 Year Olds | 54 (88.5%) | 7 (11.5%) |
| 5 to 9 Year Old | 133 (72.3%) | 51 (27.7%) |
| 10 to 14 Year Olds | 167 (100.0%) | 0 (0.0%) |
| 15 to 17 Year Olds | 150 (100.0%) | 0 (0.0%) |
| 18 to 19 Year Olds | 36 (100.0%) | 0 (0.0%) |
| 20 to 24 Year Olds | 0 (0.0%) | 0 (0.0%) |
| 25 to 34 Year Olds | 0 (0.0%) | 0 (0.0%) |
| 35 Years and over | 39 (78.0%) | 11 (22.0%) |
| Total | 579 (89.4%) | 69 (10.6%) |
Educational Attainment by Field of Study in Altavista
Business (247 | 31.7%), education (86 | 11.0%), computers & mathematics (67 | 8.6%), social sciences (65 | 8.3%), and arts & humanities (65 | 8.3%) are the most common fields of study among 779 individuals in Altavista who have obtained a bachelor's degree or higher.
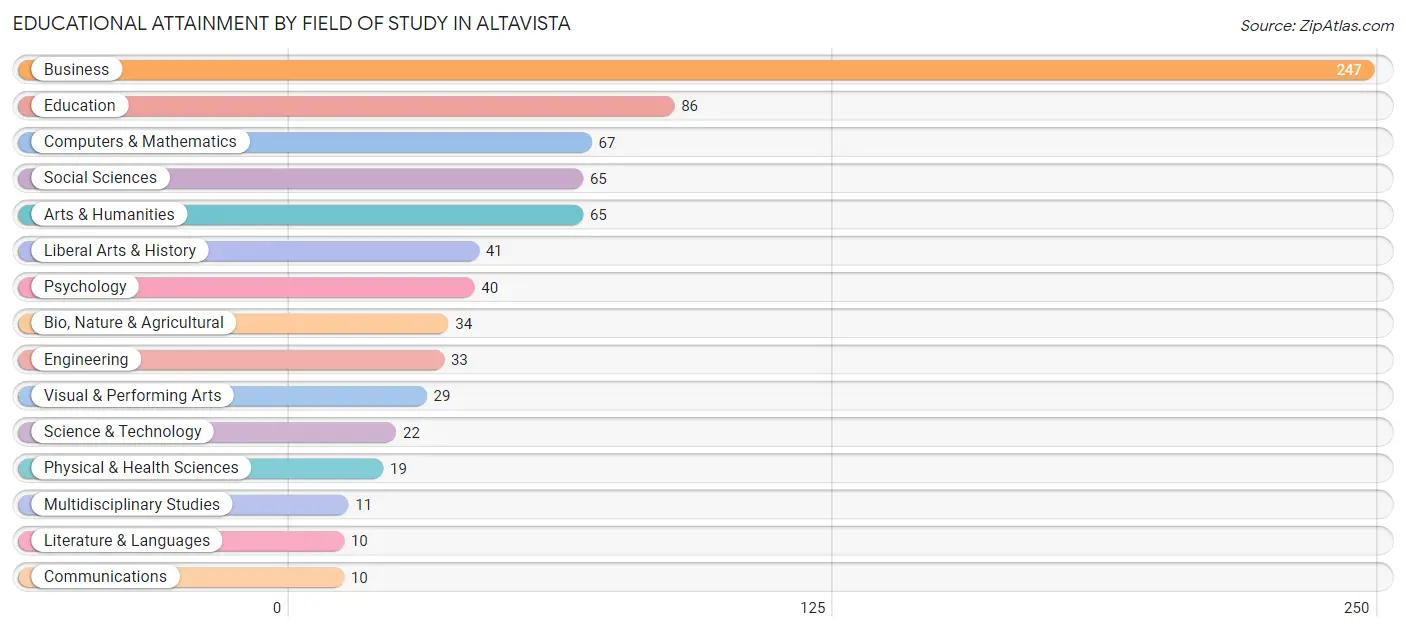
| Field of Study | # Graduates | % Graduates |
| Computers & Mathematics | 67 | 8.6% |
| Bio, Nature & Agricultural | 34 | 4.4% |
| Physical & Health Sciences | 19 | 2.4% |
| Psychology | 40 | 5.1% |
| Social Sciences | 65 | 8.3% |
| Engineering | 33 | 4.2% |
| Multidisciplinary Studies | 11 | 1.4% |
| Science & Technology | 22 | 2.8% |
| Business | 247 | 31.7% |
| Education | 86 | 11.0% |
| Literature & Languages | 10 | 1.3% |
| Liberal Arts & History | 41 | 5.3% |
| Visual & Performing Arts | 29 | 3.7% |
| Communications | 10 | 1.3% |
| Arts & Humanities | 65 | 8.3% |
| Total | 779 | 100.0% |
Transportation & Commute in Altavista
Vehicle Availability by Sex in Altavista
The most prevalent vehicle ownership categories in Altavista are males with 2 vehicles (370, accounting for 54.0%) and females with 2 vehicles (233, making up 53.0%).
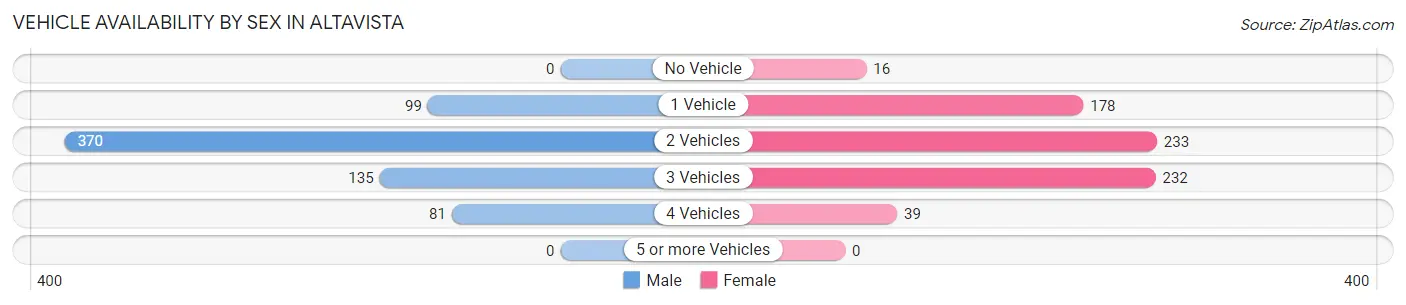
| Vehicles Available | Male | Female |
| No Vehicle | 0 (0.0%) | 16 (2.3%) |
| 1 Vehicle | 99 (14.4%) | 178 (25.5%) |
| 2 Vehicles | 370 (54.0%) | 233 (33.4%) |
| 3 Vehicles | 135 (19.7%) | 232 (33.2%) |
| 4 Vehicles | 81 (11.8%) | 39 (5.6%) |
| 5 or more Vehicles | 0 (0.0%) | 0 (0.0%) |
| Total | 685 (100.0%) | 698 (100.0%) |
Commute Time in Altavista
The most frequently occuring commute durations in Altavista are 45 to 59 minutes (294 commuters, 22.4%), 5 to 9 minutes (244 commuters, 18.6%), and 30 to 34 minutes (198 commuters, 15.1%).
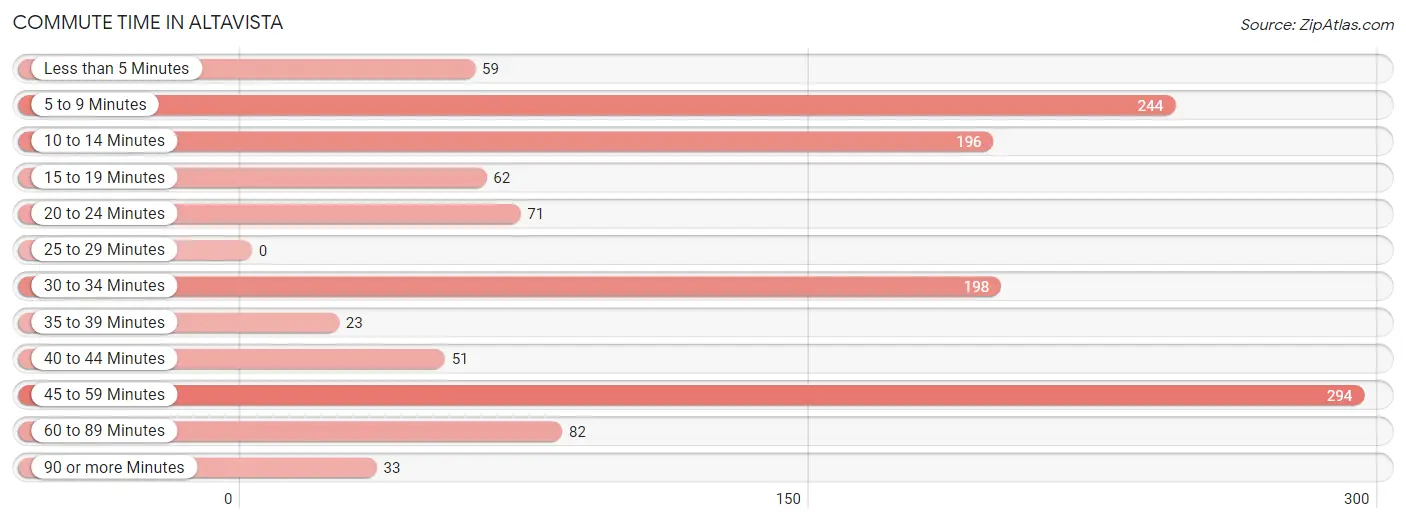
| Commute Time | # Commuters | % Commuters |
| Less than 5 Minutes | 59 | 4.5% |
| 5 to 9 Minutes | 244 | 18.6% |
| 10 to 14 Minutes | 196 | 14.9% |
| 15 to 19 Minutes | 62 | 4.7% |
| 20 to 24 Minutes | 71 | 5.4% |
| 25 to 29 Minutes | 0 | 0.0% |
| 30 to 34 Minutes | 198 | 15.1% |
| 35 to 39 Minutes | 23 | 1.8% |
| 40 to 44 Minutes | 51 | 3.9% |
| 45 to 59 Minutes | 294 | 22.4% |
| 60 to 89 Minutes | 82 | 6.2% |
| 90 or more Minutes | 33 | 2.5% |
Commute Time by Sex in Altavista
The most common commute times in Altavista are 45 to 59 minutes (185 commuters, 27.8%) for males and 5 to 9 minutes (136 commuters, 21.0%) for females.
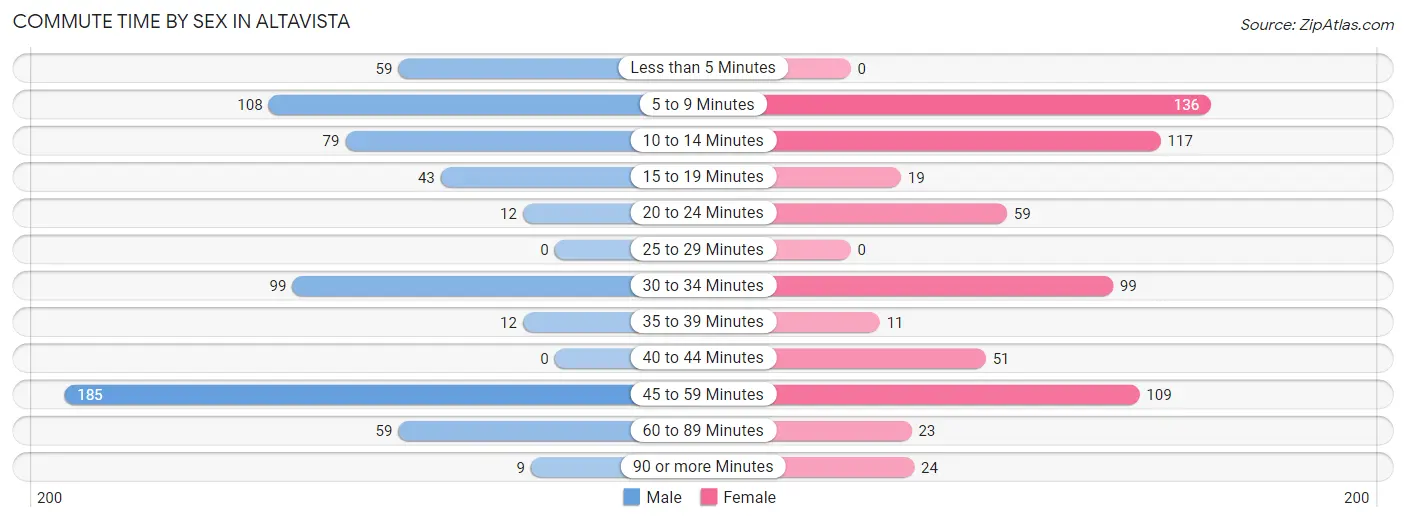
| Commute Time | Male | Female |
| Less than 5 Minutes | 59 (8.9%) | 0 (0.0%) |
| 5 to 9 Minutes | 108 (16.2%) | 136 (21.0%) |
| 10 to 14 Minutes | 79 (11.9%) | 117 (18.1%) |
| 15 to 19 Minutes | 43 (6.5%) | 19 (2.9%) |
| 20 to 24 Minutes | 12 (1.8%) | 59 (9.1%) |
| 25 to 29 Minutes | 0 (0.0%) | 0 (0.0%) |
| 30 to 34 Minutes | 99 (14.9%) | 99 (15.3%) |
| 35 to 39 Minutes | 12 (1.8%) | 11 (1.7%) |
| 40 to 44 Minutes | 0 (0.0%) | 51 (7.9%) |
| 45 to 59 Minutes | 185 (27.8%) | 109 (16.8%) |
| 60 to 89 Minutes | 59 (8.9%) | 23 (3.5%) |
| 90 or more Minutes | 9 (1.3%) | 24 (3.7%) |
Time of Departure to Work by Sex in Altavista
The most frequent times of departure to work in Altavista are 7:00 AM to 7:29 AM (124, 18.6%) for males and 7:30 AM to 7:59 AM (272, 42.0%) for females.
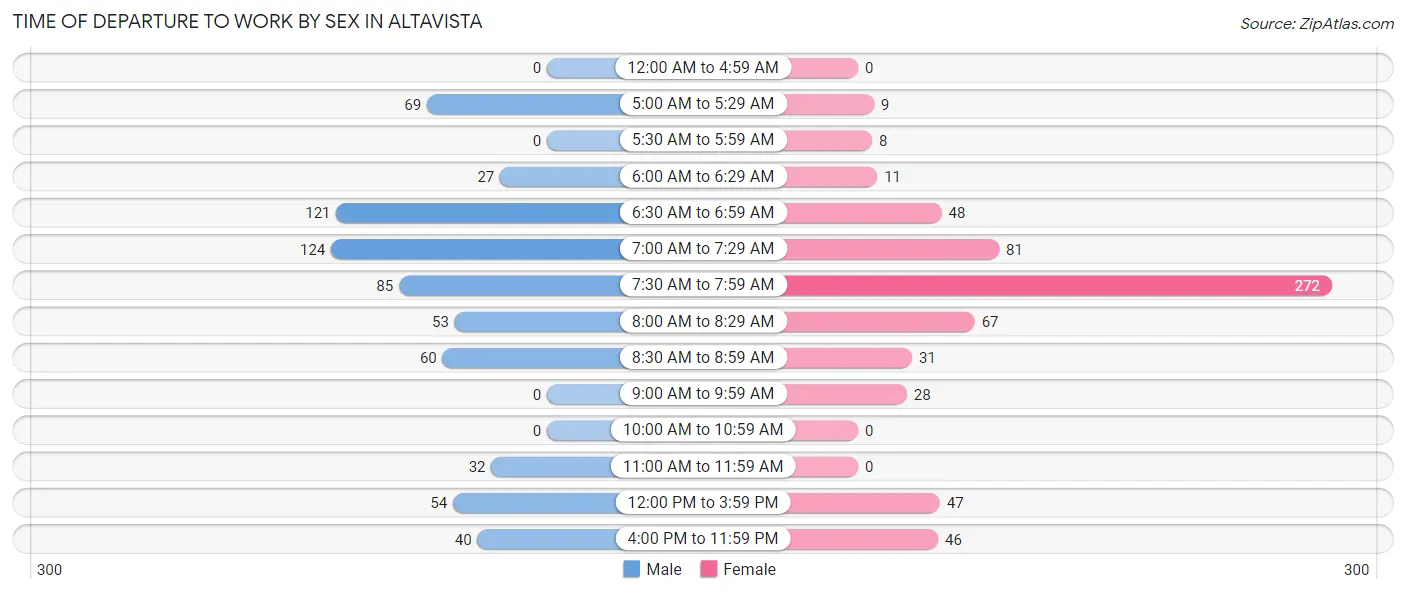
| Time of Departure | Male | Female |
| 12:00 AM to 4:59 AM | 0 (0.0%) | 0 (0.0%) |
| 5:00 AM to 5:29 AM | 69 (10.4%) | 9 (1.4%) |
| 5:30 AM to 5:59 AM | 0 (0.0%) | 8 (1.2%) |
| 6:00 AM to 6:29 AM | 27 (4.1%) | 11 (1.7%) |
| 6:30 AM to 6:59 AM | 121 (18.2%) | 48 (7.4%) |
| 7:00 AM to 7:29 AM | 124 (18.6%) | 81 (12.5%) |
| 7:30 AM to 7:59 AM | 85 (12.8%) | 272 (42.0%) |
| 8:00 AM to 8:29 AM | 53 (8.0%) | 67 (10.3%) |
| 8:30 AM to 8:59 AM | 60 (9.0%) | 31 (4.8%) |
| 9:00 AM to 9:59 AM | 0 (0.0%) | 28 (4.3%) |
| 10:00 AM to 10:59 AM | 0 (0.0%) | 0 (0.0%) |
| 11:00 AM to 11:59 AM | 32 (4.8%) | 0 (0.0%) |
| 12:00 PM to 3:59 PM | 54 (8.1%) | 47 (7.2%) |
| 4:00 PM to 11:59 PM | 40 (6.0%) | 46 (7.1%) |
| Total | 665 (100.0%) | 648 (100.0%) |
Housing Occupancy in Altavista
Occupancy by Ownership in Altavista
Of the total 1,451 dwellings in Altavista, owner-occupied units account for 940 (64.8%), while renter-occupied units make up 511 (35.2%).
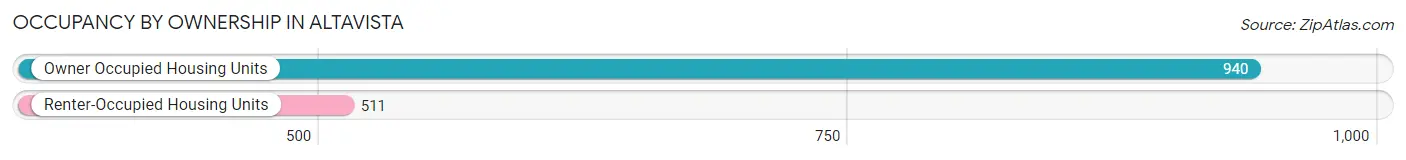
| Occupancy | # Housing Units | % Housing Units |
| Owner Occupied Housing Units | 940 | 64.8% |
| Renter-Occupied Housing Units | 511 | 35.2% |
| Total Occupied Housing Units | 1,451 | 100.0% |
Occupancy by Household Size in Altavista
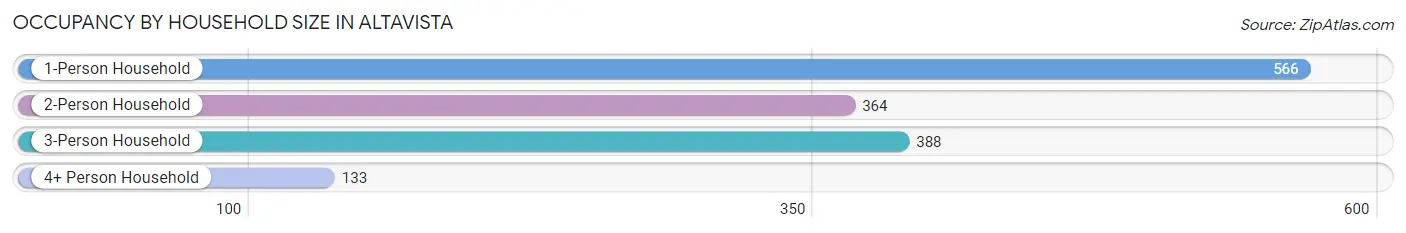
| Household Size | # Housing Units | % Housing Units |
| 1-Person Household | 566 | 39.0% |
| 2-Person Household | 364 | 25.1% |
| 3-Person Household | 388 | 26.7% |
| 4+ Person Household | 133 | 9.2% |
| Total Housing Units | 1,451 | 100.0% |
Occupancy by Ownership by Household Size in Altavista
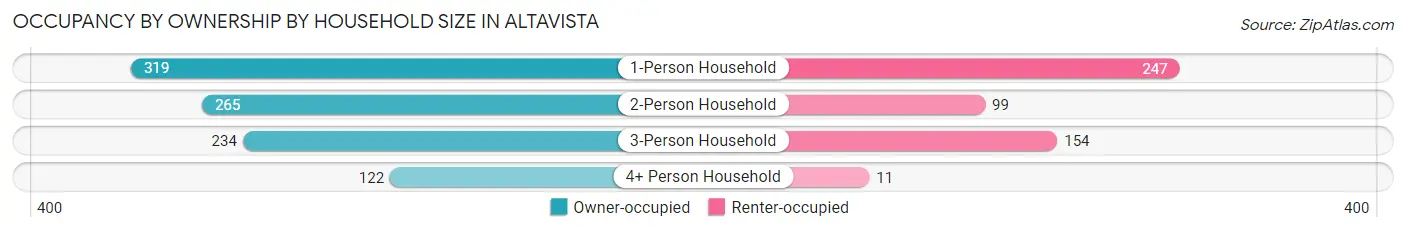
| Household Size | Owner-occupied | Renter-occupied |
| 1-Person Household | 319 (56.4%) | 247 (43.6%) |
| 2-Person Household | 265 (72.8%) | 99 (27.2%) |
| 3-Person Household | 234 (60.3%) | 154 (39.7%) |
| 4+ Person Household | 122 (91.7%) | 11 (8.3%) |
| Total Housing Units | 940 (64.8%) | 511 (35.2%) |
Occupancy by Educational Attainment in Altavista
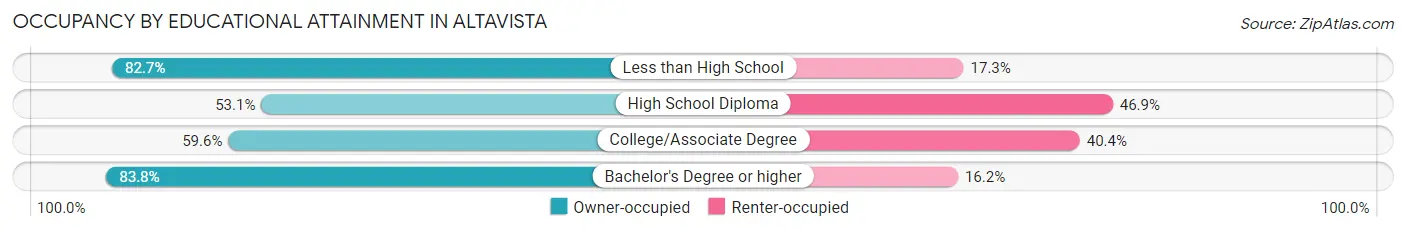
| Household Size | Owner-occupied | Renter-occupied |
| Less than High School | 143 (82.7%) | 30 (17.3%) |
| High School Diploma | 224 (53.1%) | 198 (46.9%) |
| College/Associate Degree | 356 (59.6%) | 241 (40.4%) |
| Bachelor's Degree or higher | 217 (83.8%) | 42 (16.2%) |
Occupancy by Age of Householder in Altavista
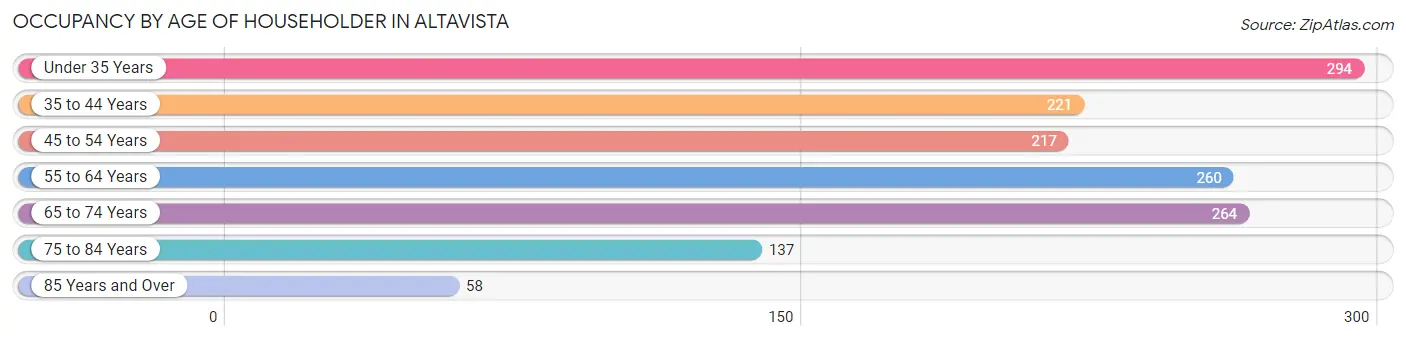
| Age Bracket | # Households | % Households |
| Under 35 Years | 294 | 20.3% |
| 35 to 44 Years | 221 | 15.2% |
| 45 to 54 Years | 217 | 15.0% |
| 55 to 64 Years | 260 | 17.9% |
| 65 to 74 Years | 264 | 18.2% |
| 75 to 84 Years | 137 | 9.4% |
| 85 Years and Over | 58 | 4.0% |
| Total | 1,451 | 100.0% |
Housing Finances in Altavista
Median Income by Occupancy in Altavista
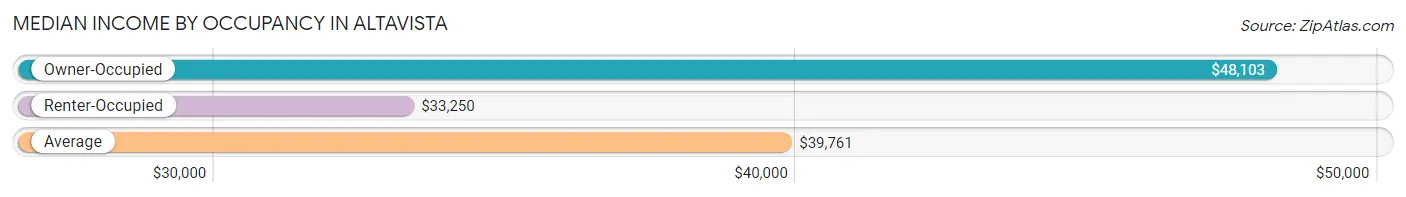
| Occupancy Type | # Households | Median Income |
| Owner-Occupied | 940 (64.8%) | $48,103 |
| Renter-Occupied | 511 (35.2%) | $33,250 |
| Average | 1,451 (100.0%) | $39,761 |
Occupancy by Householder Income Bracket in Altavista
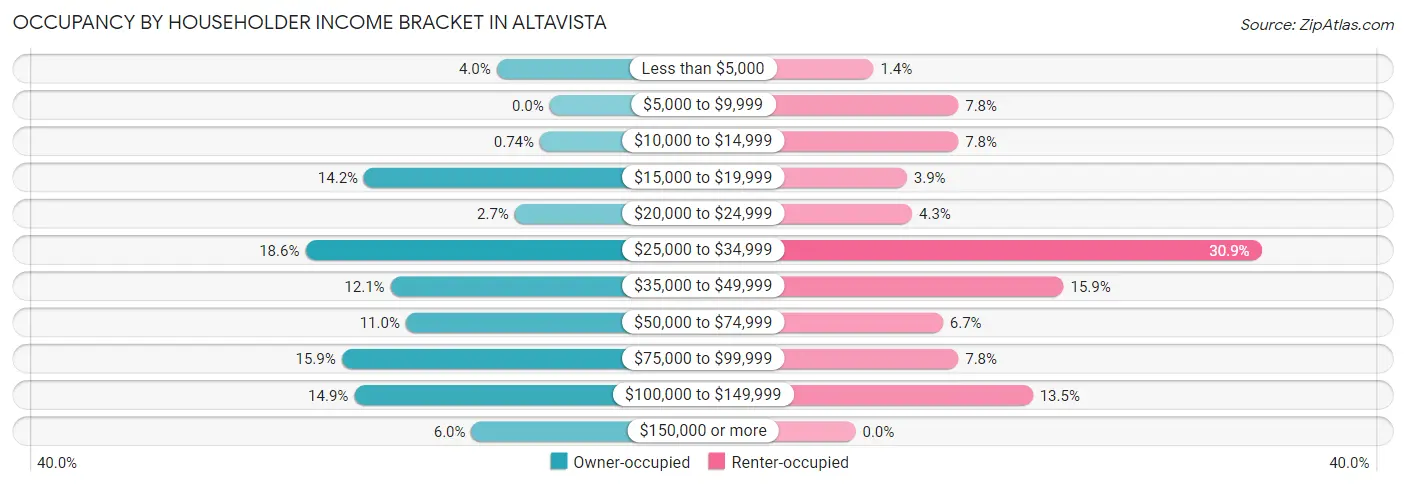
| Income Bracket | Owner-occupied | Renter-occupied |
| Less than $5,000 | 38 (4.0%) | 7 (1.4%) |
| $5,000 to $9,999 | 0 (0.0%) | 40 (7.8%) |
| $10,000 to $14,999 | 7 (0.7%) | 40 (7.8%) |
| $15,000 to $19,999 | 133 (14.1%) | 20 (3.9%) |
| $20,000 to $24,999 | 25 (2.7%) | 22 (4.3%) |
| $25,000 to $34,999 | 175 (18.6%) | 158 (30.9%) |
| $35,000 to $49,999 | 114 (12.1%) | 81 (15.9%) |
| $50,000 to $74,999 | 103 (11.0%) | 34 (6.7%) |
| $75,000 to $99,999 | 149 (15.9%) | 40 (7.8%) |
| $100,000 to $149,999 | 140 (14.9%) | 69 (13.5%) |
| $150,000 or more | 56 (6.0%) | 0 (0.0%) |
| Total | 940 (100.0%) | 511 (100.0%) |
Monthly Housing Cost Tiers in Altavista
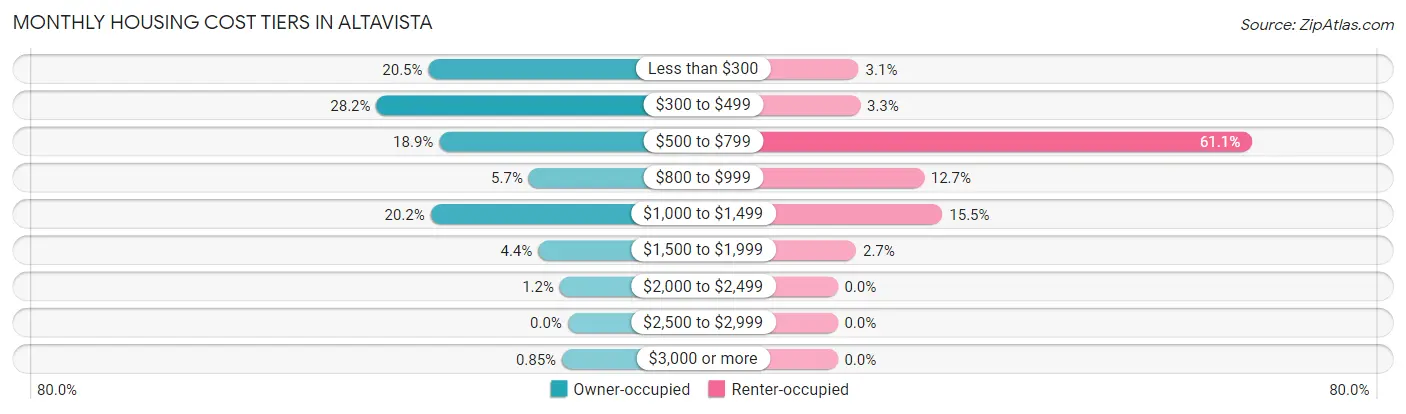
| Monthly Cost | Owner-occupied | Renter-occupied |
| Less than $300 | 193 (20.5%) | 16 (3.1%) |
| $300 to $499 | 265 (28.2%) | 17 (3.3%) |
| $500 to $799 | 178 (18.9%) | 312 (61.1%) |
| $800 to $999 | 54 (5.7%) | 65 (12.7%) |
| $1,000 to $1,499 | 190 (20.2%) | 79 (15.5%) |
| $1,500 to $1,999 | 41 (4.4%) | 14 (2.7%) |
| $2,000 to $2,499 | 11 (1.2%) | 0 (0.0%) |
| $2,500 to $2,999 | 0 (0.0%) | 0 (0.0%) |
| $3,000 or more | 8 (0.9%) | 0 (0.0%) |
| Total | 940 (100.0%) | 511 (100.0%) |
Physical Housing Characteristics in Altavista
Housing Structures in Altavista
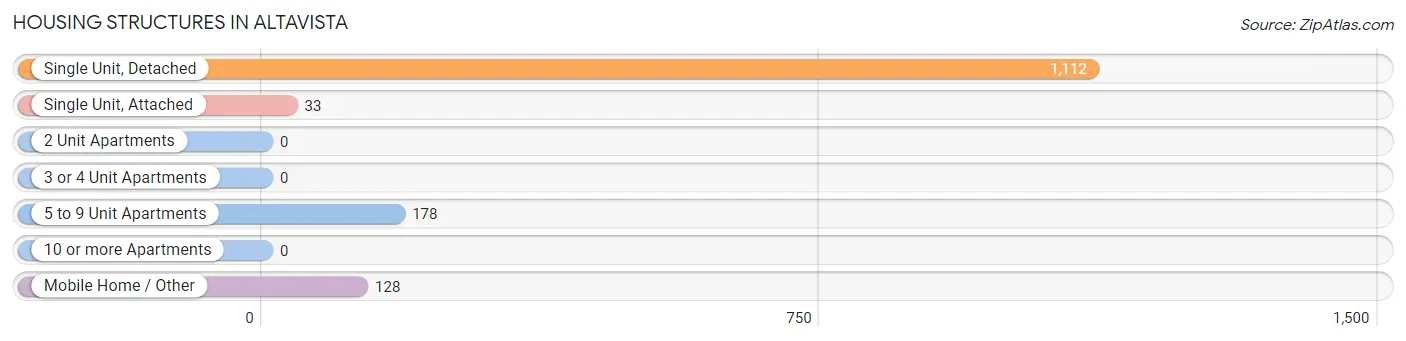
| Structure Type | # Housing Units | % Housing Units |
| Single Unit, Detached | 1,112 | 76.6% |
| Single Unit, Attached | 33 | 2.3% |
| 2 Unit Apartments | 0 | 0.0% |
| 3 or 4 Unit Apartments | 0 | 0.0% |
| 5 to 9 Unit Apartments | 178 | 12.3% |
| 10 or more Apartments | 0 | 0.0% |
| Mobile Home / Other | 128 | 8.8% |
| Total | 1,451 | 100.0% |
Housing Structures by Occupancy in Altavista
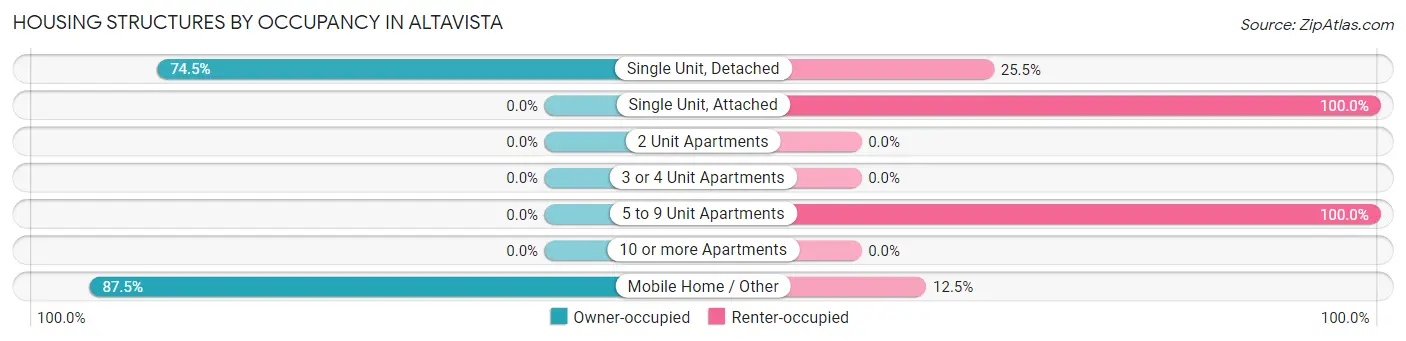
| Structure Type | Owner-occupied | Renter-occupied |
| Single Unit, Detached | 828 (74.5%) | 284 (25.5%) |
| Single Unit, Attached | 0 (0.0%) | 33 (100.0%) |
| 2 Unit Apartments | 0 (0.0%) | 0 (0.0%) |
| 3 or 4 Unit Apartments | 0 (0.0%) | 0 (0.0%) |
| 5 to 9 Unit Apartments | 0 (0.0%) | 178 (100.0%) |
| 10 or more Apartments | 0 (0.0%) | 0 (0.0%) |
| Mobile Home / Other | 112 (87.5%) | 16 (12.5%) |
| Total | 940 (64.8%) | 511 (35.2%) |
Housing Structures by Number of Rooms in Altavista
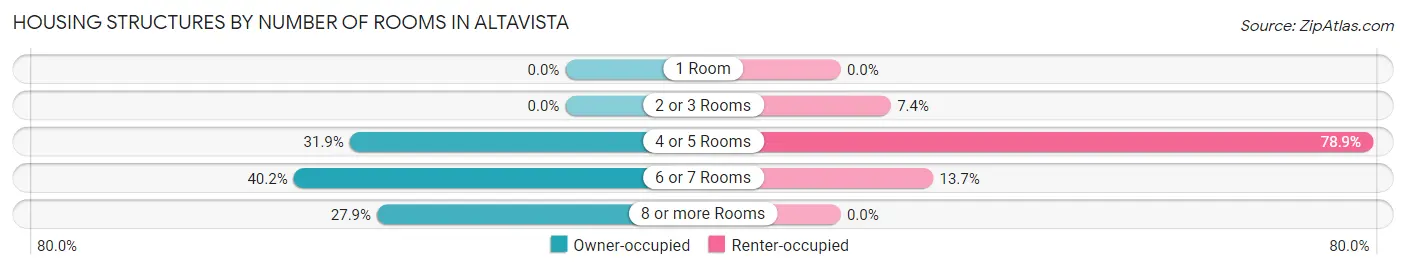
| Number of Rooms | Owner-occupied | Renter-occupied |
| 1 Room | 0 (0.0%) | 0 (0.0%) |
| 2 or 3 Rooms | 0 (0.0%) | 38 (7.4%) |
| 4 or 5 Rooms | 300 (31.9%) | 403 (78.9%) |
| 6 or 7 Rooms | 378 (40.2%) | 70 (13.7%) |
| 8 or more Rooms | 262 (27.9%) | 0 (0.0%) |
| Total | 940 (100.0%) | 511 (100.0%) |
Housing Structure by Heating Type in Altavista
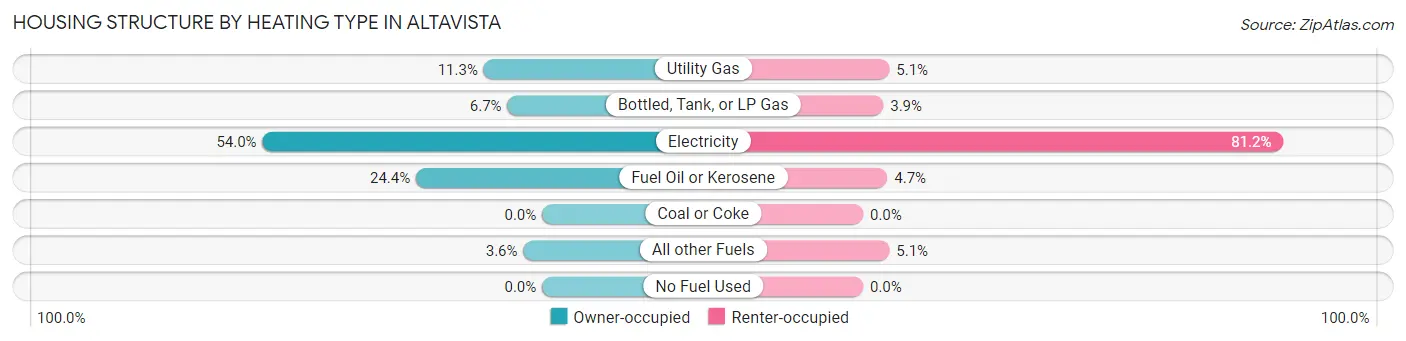
| Heating Type | Owner-occupied | Renter-occupied |
| Utility Gas | 106 (11.3%) | 26 (5.1%) |
| Bottled, Tank, or LP Gas | 63 (6.7%) | 20 (3.9%) |
| Electricity | 508 (54.0%) | 415 (81.2%) |
| Fuel Oil or Kerosene | 229 (24.4%) | 24 (4.7%) |
| Coal or Coke | 0 (0.0%) | 0 (0.0%) |
| All other Fuels | 34 (3.6%) | 26 (5.1%) |
| No Fuel Used | 0 (0.0%) | 0 (0.0%) |
| Total | 940 (100.0%) | 511 (100.0%) |
Household Vehicle Usage in Altavista
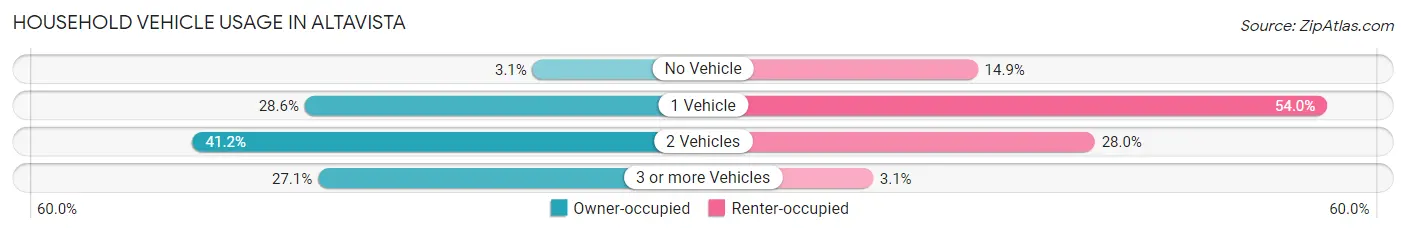
| Vehicles per Household | Owner-occupied | Renter-occupied |
| No Vehicle | 29 (3.1%) | 76 (14.9%) |
| 1 Vehicle | 269 (28.6%) | 276 (54.0%) |
| 2 Vehicles | 387 (41.2%) | 143 (28.0%) |
| 3 or more Vehicles | 255 (27.1%) | 16 (3.1%) |
| Total | 940 (100.0%) | 511 (100.0%) |
Real Estate & Mortgages in Altavista
Real Estate and Mortgage Overview in Altavista
| Characteristic | Without Mortgage | With Mortgage |
| Housing Units | 521 | 419 |
| Median Property Value | $105,900 | $152,000 |
| Median Household Income | $34,592 | $0 |
| Monthly Housing Costs | $376 | $8 |
| Real Estate Taxes | $526 | $9 |
Property Value by Mortgage Status in Altavista
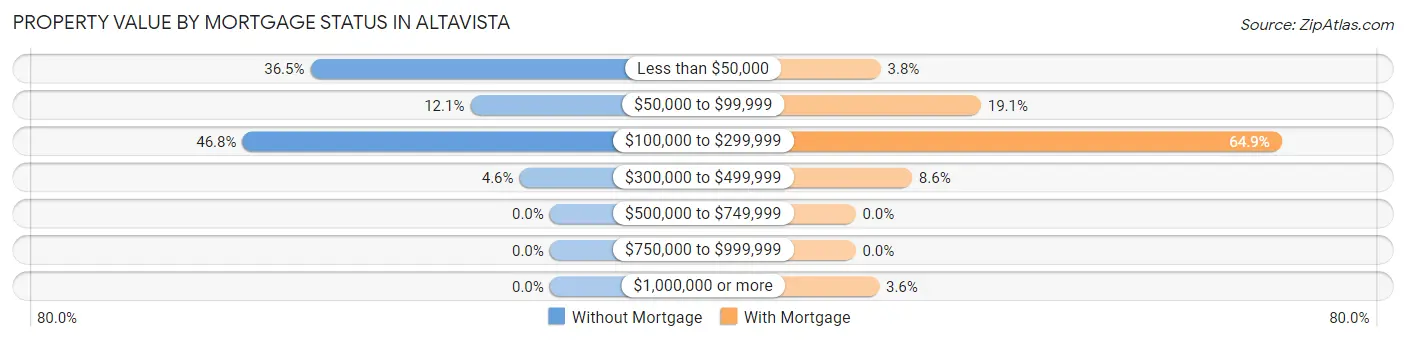
| Property Value | Without Mortgage | With Mortgage |
| Less than $50,000 | 190 (36.5%) | 16 (3.8%) |
| $50,000 to $99,999 | 63 (12.1%) | 80 (19.1%) |
| $100,000 to $299,999 | 244 (46.8%) | 272 (64.9%) |
| $300,000 to $499,999 | 24 (4.6%) | 36 (8.6%) |
| $500,000 to $749,999 | 0 (0.0%) | 0 (0.0%) |
| $750,000 to $999,999 | 0 (0.0%) | 0 (0.0%) |
| $1,000,000 or more | 0 (0.0%) | 15 (3.6%) |
| Total | 521 (100.0%) | 419 (100.0%) |
Household Income by Mortgage Status in Altavista
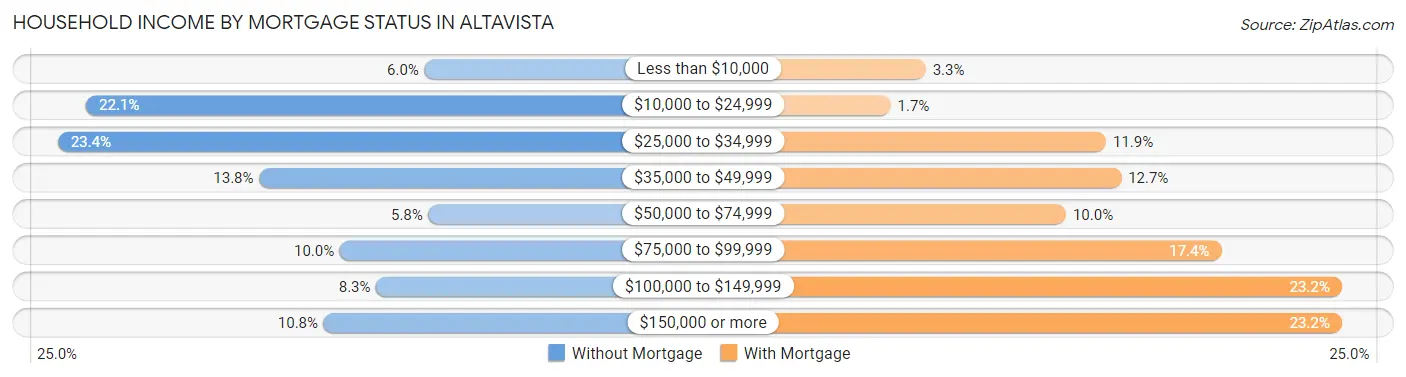
| Household Income | Without Mortgage | With Mortgage |
| Less than $10,000 | 31 (5.9%) | 14 (3.3%) |
| $10,000 to $24,999 | 115 (22.1%) | 7 (1.7%) |
| $25,000 to $34,999 | 122 (23.4%) | 50 (11.9%) |
| $35,000 to $49,999 | 72 (13.8%) | 53 (12.7%) |
| $50,000 to $74,999 | 30 (5.8%) | 42 (10.0%) |
| $75,000 to $99,999 | 52 (10.0%) | 73 (17.4%) |
| $100,000 to $149,999 | 43 (8.3%) | 97 (23.2%) |
| $150,000 or more | 56 (10.7%) | 97 (23.2%) |
| Total | 521 (100.0%) | 419 (100.0%) |
Property Value to Household Income Ratio in Altavista
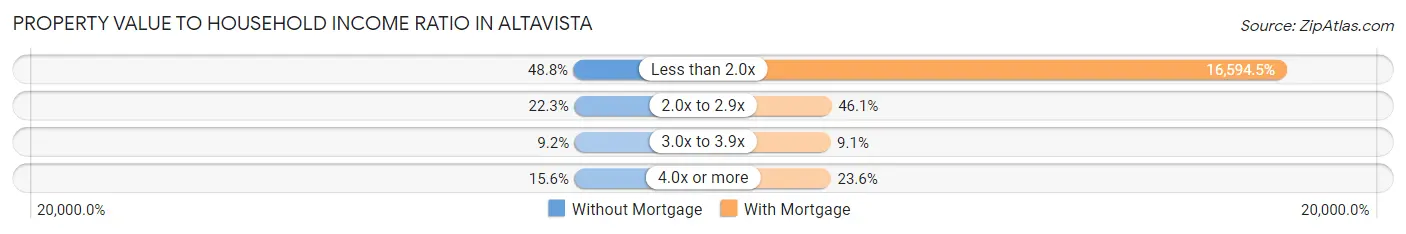
| Value-to-Income Ratio | Without Mortgage | With Mortgage |
| Less than 2.0x | 254 (48.7%) | 69,531 (16,594.5%) |
| 2.0x to 2.9x | 116 (22.3%) | 193 (46.1%) |
| 3.0x to 3.9x | 48 (9.2%) | 38 (9.1%) |
| 4.0x or more | 81 (15.5%) | 99 (23.6%) |
| Total | 521 (100.0%) | 419 (100.0%) |
Real Estate Taxes by Mortgage Status in Altavista
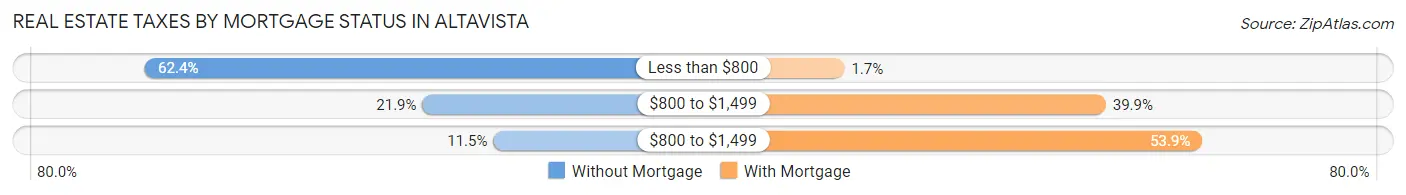
| Property Taxes | Without Mortgage | With Mortgage |
| Less than $800 | 325 (62.4%) | 7 (1.7%) |
| $800 to $1,499 | 114 (21.9%) | 167 (39.9%) |
| $800 to $1,499 | 60 (11.5%) | 226 (53.9%) |
| Total | 521 (100.0%) | 419 (100.0%) |
Health & Disability in Altavista
Health Insurance Coverage by Age in Altavista
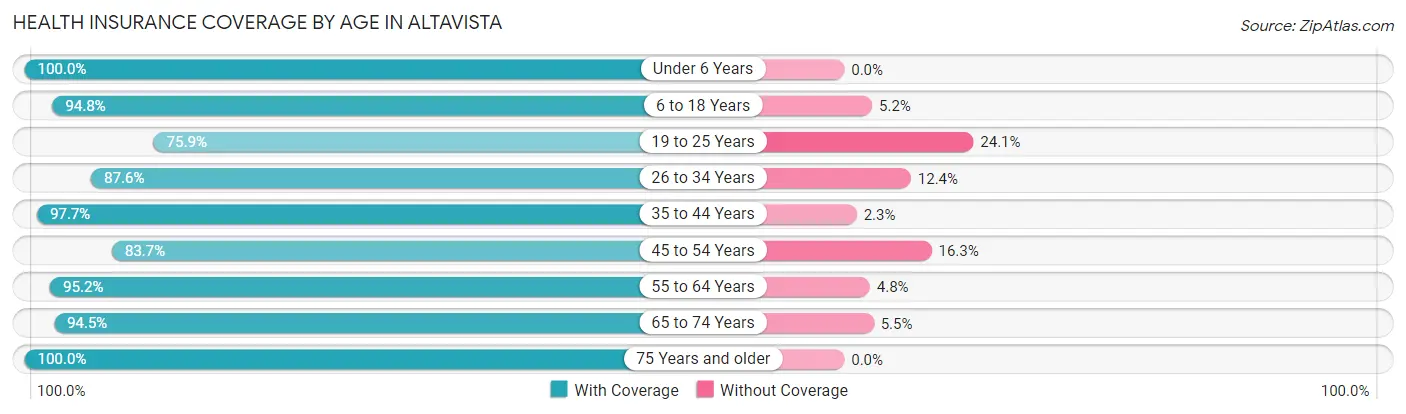
| Age Bracket | With Coverage | Without Coverage |
| Under 6 Years | 295 (100.0%) | 0 (0.0%) |
| 6 to 18 Years | 457 (94.8%) | 25 (5.2%) |
| 19 to 25 Years | 123 (75.9%) | 39 (24.1%) |
| 26 to 34 Years | 381 (87.6%) | 54 (12.4%) |
| 35 to 44 Years | 380 (97.7%) | 9 (2.3%) |
| 45 to 54 Years | 386 (83.7%) | 75 (16.3%) |
| 55 to 64 Years | 419 (95.2%) | 21 (4.8%) |
| 65 to 74 Years | 362 (94.5%) | 21 (5.5%) |
| 75 Years and older | 230 (100.0%) | 0 (0.0%) |
| Total | 3,033 (92.5%) | 244 (7.4%) |
Health Insurance Coverage by Citizenship Status in Altavista
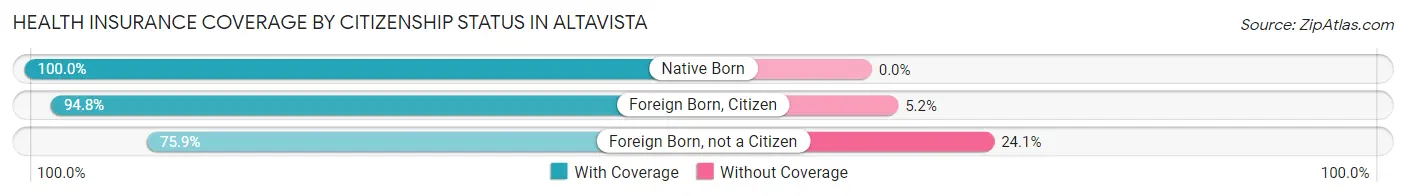
| Citizenship Status | With Coverage | Without Coverage |
| Native Born | 295 (100.0%) | 0 (0.0%) |
| Foreign Born, Citizen | 457 (94.8%) | 25 (5.2%) |
| Foreign Born, not a Citizen | 123 (75.9%) | 39 (24.1%) |
Health Insurance Coverage by Household Income in Altavista
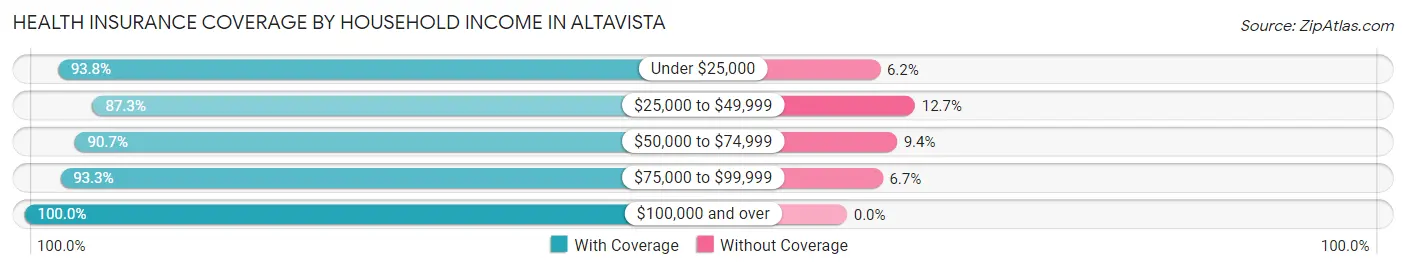
| Household Income | With Coverage | Without Coverage |
| Under $25,000 | 393 (93.8%) | 26 (6.2%) |
| $25,000 to $49,999 | 973 (87.3%) | 142 (12.7%) |
| $50,000 to $74,999 | 252 (90.6%) | 26 (9.3%) |
| $75,000 to $99,999 | 698 (93.3%) | 50 (6.7%) |
| $100,000 and over | 717 (100.0%) | 0 (0.0%) |
Public vs Private Health Insurance Coverage by Age in Altavista
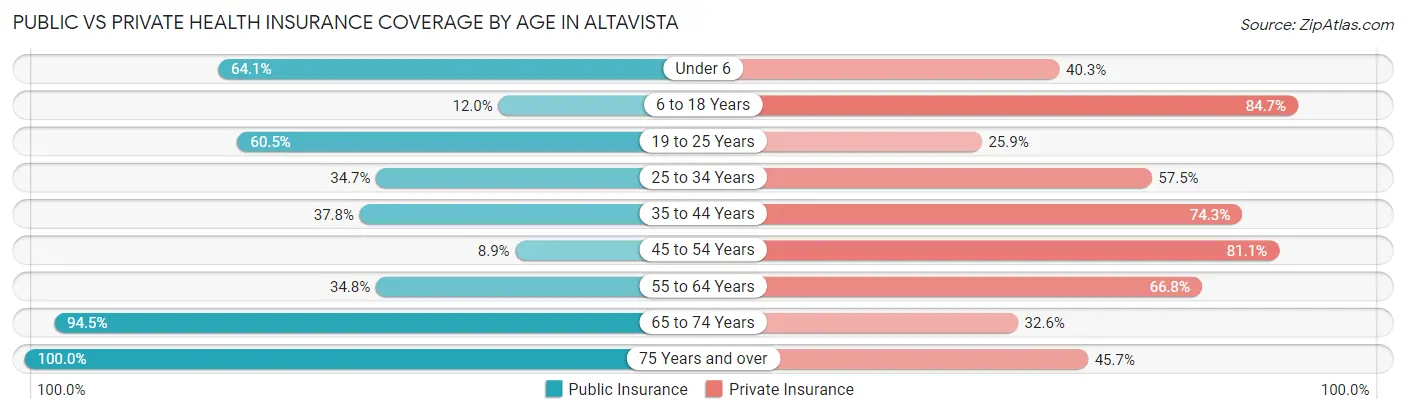
| Age Bracket | Public Insurance | Private Insurance |
| Under 6 | 189 (64.1%) | 119 (40.3%) |
| 6 to 18 Years | 58 (12.0%) | 408 (84.7%) |
| 19 to 25 Years | 98 (60.5%) | 42 (25.9%) |
| 25 to 34 Years | 151 (34.7%) | 250 (57.5%) |
| 35 to 44 Years | 147 (37.8%) | 289 (74.3%) |
| 45 to 54 Years | 41 (8.9%) | 374 (81.1%) |
| 55 to 64 Years | 153 (34.8%) | 294 (66.8%) |
| 65 to 74 Years | 362 (94.5%) | 125 (32.6%) |
| 75 Years and over | 230 (100.0%) | 105 (45.7%) |
| Total | 1,429 (43.6%) | 2,006 (61.2%) |
Disability Status by Sex by Age in Altavista
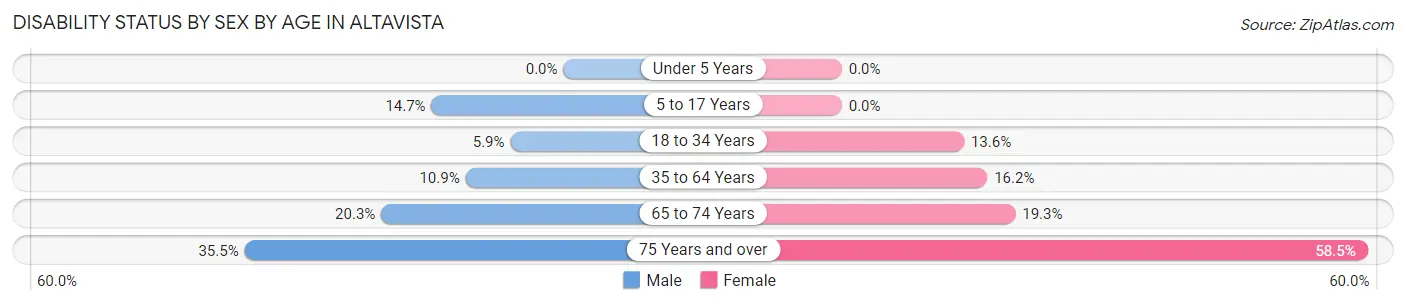
| Age Bracket | Male | Female |
| Under 5 Years | 0 (0.0%) | 0 (0.0%) |
| 5 to 17 Years | 42 (14.7%) | 0 (0.0%) |
| 18 to 34 Years | 17 (5.9%) | 43 (13.6%) |
| 35 to 64 Years | 70 (10.9%) | 105 (16.2%) |
| 65 to 74 Years | 42 (20.3%) | 34 (19.3%) |
| 75 Years and over | 38 (35.5%) | 72 (58.5%) |
Disability Class by Sex by Age in Altavista
Disability Class: Hearing Difficulty
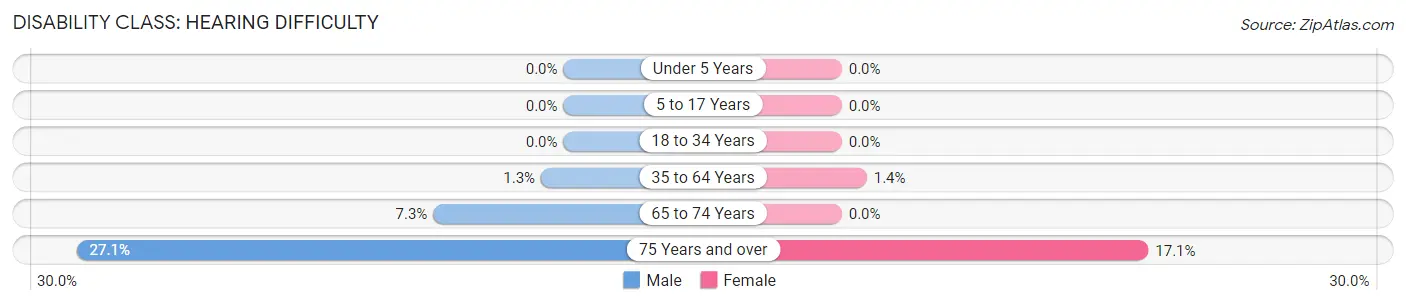
| Age Bracket | Male | Female |
| Under 5 Years | 0 (0.0%) | 0 (0.0%) |
| 5 to 17 Years | 0 (0.0%) | 0 (0.0%) |
| 18 to 34 Years | 0 (0.0%) | 0 (0.0%) |
| 35 to 64 Years | 8 (1.3%) | 9 (1.4%) |
| 65 to 74 Years | 15 (7.2%) | 0 (0.0%) |
| 75 Years and over | 29 (27.1%) | 21 (17.1%) |
Disability Class: Vision Difficulty
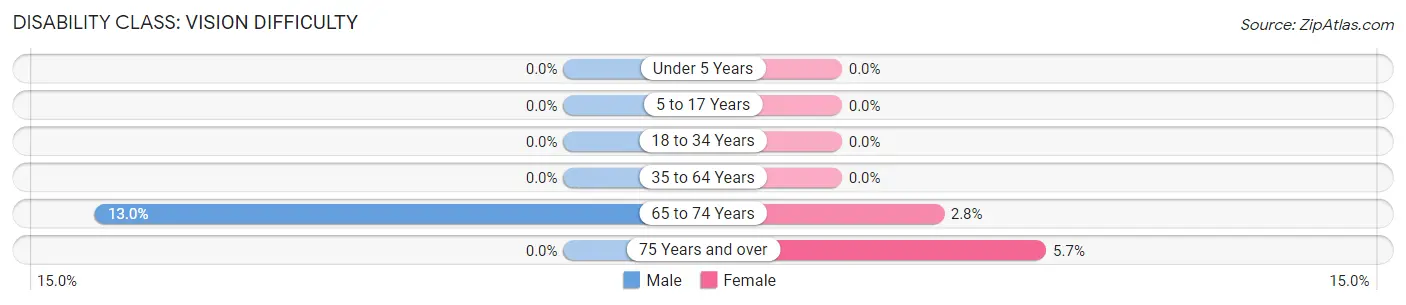
| Age Bracket | Male | Female |
| Under 5 Years | 0 (0.0%) | 0 (0.0%) |
| 5 to 17 Years | 0 (0.0%) | 0 (0.0%) |
| 18 to 34 Years | 0 (0.0%) | 0 (0.0%) |
| 35 to 64 Years | 0 (0.0%) | 0 (0.0%) |
| 65 to 74 Years | 27 (13.0%) | 5 (2.8%) |
| 75 Years and over | 0 (0.0%) | 7 (5.7%) |
Disability Class: Cognitive Difficulty
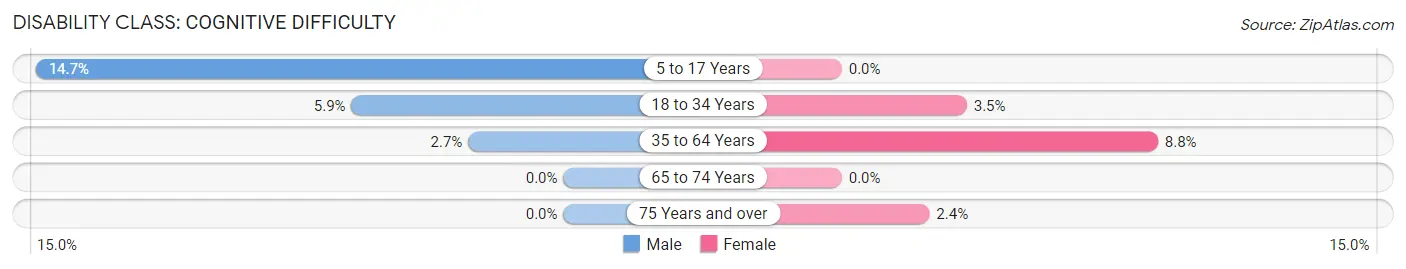
| Age Bracket | Male | Female |
| 5 to 17 Years | 42 (14.7%) | 0 (0.0%) |
| 18 to 34 Years | 17 (5.9%) | 11 (3.5%) |
| 35 to 64 Years | 17 (2.6%) | 57 (8.8%) |
| 65 to 74 Years | 0 (0.0%) | 0 (0.0%) |
| 75 Years and over | 0 (0.0%) | 3 (2.4%) |
Disability Class: Ambulatory Difficulty
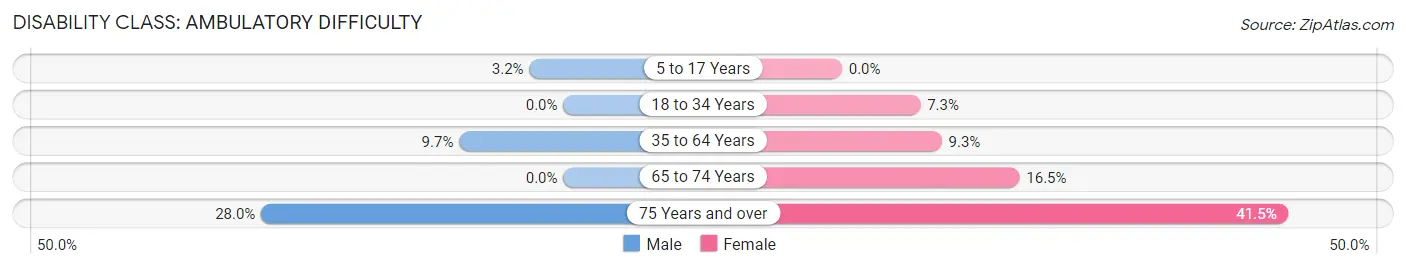
| Age Bracket | Male | Female |
| 5 to 17 Years | 9 (3.2%) | 0 (0.0%) |
| 18 to 34 Years | 0 (0.0%) | 23 (7.3%) |
| 35 to 64 Years | 62 (9.7%) | 60 (9.3%) |
| 65 to 74 Years | 0 (0.0%) | 29 (16.5%) |
| 75 Years and over | 30 (28.0%) | 51 (41.5%) |
Disability Class: Self-Care Difficulty
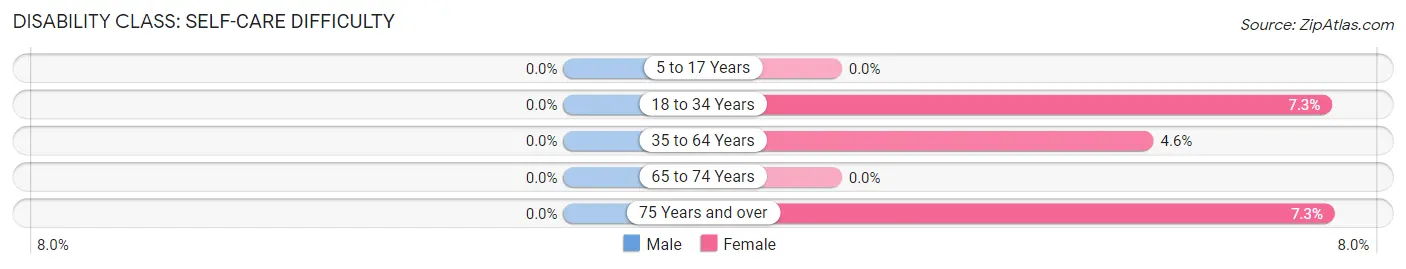
| Age Bracket | Male | Female |
| 5 to 17 Years | 0 (0.0%) | 0 (0.0%) |
| 18 to 34 Years | 0 (0.0%) | 23 (7.3%) |
| 35 to 64 Years | 0 (0.0%) | 30 (4.6%) |
| 65 to 74 Years | 0 (0.0%) | 0 (0.0%) |
| 75 Years and over | 0 (0.0%) | 9 (7.3%) |
Technology Access in Altavista
Computing Device Access in Altavista
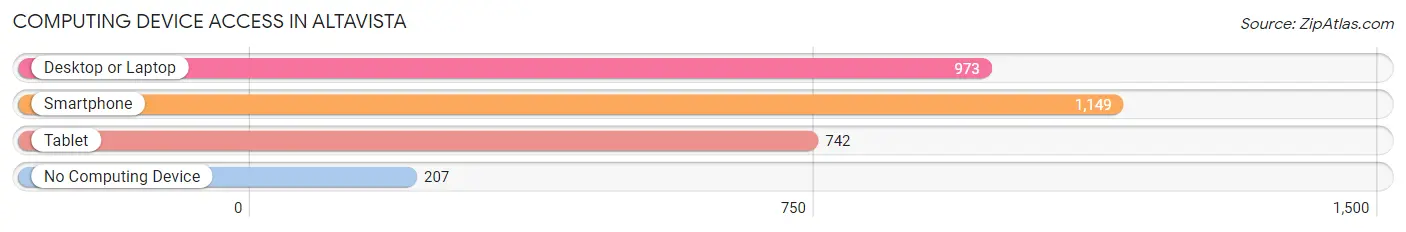
| Device Type | # Households | % Households |
| Desktop or Laptop | 973 | 67.1% |
| Smartphone | 1,149 | 79.2% |
| Tablet | 742 | 51.1% |
| No Computing Device | 207 | 14.3% |
| Total | 1,451 | 100.0% |
Internet Access in Altavista
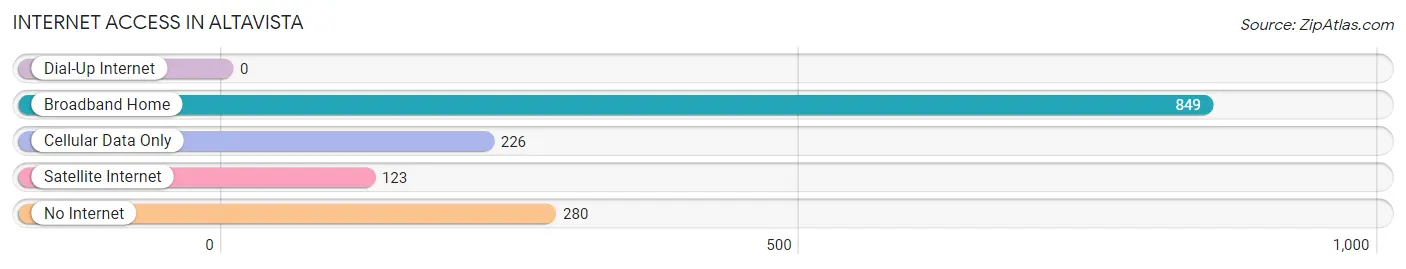
| Internet Type | # Households | % Households |
| Dial-Up Internet | 0 | 0.0% |
| Broadband Home | 849 | 58.5% |
| Cellular Data Only | 226 | 15.6% |
| Satellite Internet | 123 | 8.5% |
| No Internet | 280 | 19.3% |
| Total | 1,451 | 100.0% |
Altavista Summary
Altavista, Virginia is a small town located in the south-central part of the state, in Campbell County. It is situated on the banks of the Staunton River, and is part of the Lynchburg Metropolitan Statistical Area. The town has a population of approximately 8,000 people, and is known for its historic downtown area, which is listed on the National Register of Historic Places.
History
Altavista was founded in 1777 by William Lynch, a Revolutionary War veteran. The town was named after the Spanish phrase “alta vista,” which translates to “high view.” The town was originally a trading post and a stop on the stagecoach route between Lynchburg and Danville. In 1845, the town was incorporated, and in 1854, the first railroad line was built, connecting Altavista to Lynchburg.
In the late 19th century, Altavista became a major center for the tobacco industry. The town was home to several tobacco warehouses, and the tobacco industry was the primary source of employment for many of the town’s residents. In the early 20th century, the town’s economy shifted to textiles, and the town became home to several textile mills.
Geography
Altavista is located in the south-central part of Virginia, in Campbell County. The town is situated on the banks of the Staunton River, and is part of the Lynchburg Metropolitan Statistical Area. The town is located approximately 30 miles south of Lynchburg, and is approximately 90 miles west of Richmond.
The town is located in a hilly region of the state, and is surrounded by the Blue Ridge Mountains to the east and the Allegheny Mountains to the west. The town is located in a humid subtropical climate zone, and experiences hot, humid summers and mild winters.
Economy
The economy of Altavista is largely based on manufacturing and agriculture. The town is home to several manufacturing plants, including a paper mill, a furniture factory, and a plastics plant. The town is also home to several agricultural operations, including dairy farms, poultry farms, and vegetable farms.
The town is also home to several retail stores, restaurants, and other businesses. The town is served by the Altavista Area Chamber of Commerce, which works to promote economic development in the area.
Demographics
As of the 2010 census, the population of Altavista was 8,097. The racial makeup of the town was 79.3% White, 17.2% African American, 0.5% Native American, 0.7% Asian, 0.1% Pacific Islander, and 2.2% from other races. Hispanic or Latino of any race were 2.7% of the population.
The median household income in Altavista was $37,917, and the median family income was $45,938. The per capita income was $19,945. About 17.2% of the population was below the poverty line.
Altavista is served by the Campbell County Public Schools system. The town is home to two elementary schools, one middle school, and one high school. The town is also home to several private schools, including a Catholic school and a Christian school.
Common Questions
What is Per Capita Income in Altavista?
Per Capita income in Altavista is $29,114.
What is the Median Family Income in Altavista?
Median Family Income in Altavista is $52,986.
What is the Median Household income in Altavista?
Median Household Income in Altavista is $39,761.
What is Income or Wage Gap in Altavista?
Income or Wage Gap in Altavista is 6.1%.
Women in Altavista earn 93.9 cents for every dollar earned by a man.
What is Inequality or Gini Index in Altavista?
Inequality or Gini Index in Altavista is 0.45.
What is the Total Population of Altavista?
Total Population of Altavista is 3,370.
What is the Total Male Population of Altavista?
Total Male Population of Altavista is 1,704.
What is the Total Female Population of Altavista?
Total Female Population of Altavista is 1,666.
What is the Ratio of Males per 100 Females in Altavista?
There are 102.28 Males per 100 Females in Altavista.
What is the Ratio of Females per 100 Males in Altavista?
There are 97.77 Females per 100 Males in Altavista.
What is the Median Population Age in Altavista?
Median Population Age in Altavista is 41.6 Years.
What is the Average Family Size in Altavista
Average Family Size in Altavista is 3.0 People.
What is the Average Household Size in Altavista
Average Household Size in Altavista is 2.3 People.
How Large is the Labor Force in Altavista?
There are 1,647 People in the Labor Forcein in Altavista.
What is the Percentage of People in the Labor Force in Altavista?
61.3% of People are in the Labor Force in Altavista.
What is the Unemployment Rate in Altavista?
Unemployment Rate in Altavista is 11.5%.