Crimora, VA Map & Demographics
Crimora Map
Crimora Overview
$31,140
PER CAPITA INCOME
$73,359
AVG FAMILY INCOME
$73,609
AVG HOUSEHOLD INCOME
37.5%
WAGE / INCOME GAP [ % ]
62.5¢/ $1
WAGE / INCOME GAP [ $ ]
$16,571
FAMILY INCOME DEFICIT
0.37
INEQUALITY / GINI INDEX
2,017
TOTAL POPULATION
997
MALE POPULATION
1,020
FEMALE POPULATION
97.75
MALES / 100 FEMALES
102.31
FEMALES / 100 MALES
47.5
MEDIAN AGE
2.7
AVG FAMILY SIZE
2.5
AVG HOUSEHOLD SIZE
1,015
LABOR FORCE [ PEOPLE ]
62.4%
PERCENT IN LABOR FORCE
6.0%
UNEMPLOYMENT RATE
Crimora Zip Codes
Crimora Area Codes
Income in Crimora
Income Overview in Crimora
Per Capita Income in Crimora is $31,140, while median incomes of families and households are $73,359 and $73,609 respectively.
| Characteristic | Number | Measure |
| Per Capita Income | 2,017 | $31,140 |
| Median Family Income | 605 | $73,359 |
| Mean Family Income | 605 | $74,722 |
| Median Household Income | 811 | $73,609 |
| Mean Household Income | 811 | $74,609 |
| Income Deficit | 605 | $16,571 |
| Wage / Income Gap (%) | 2,017 | 37.52% |
| Wage / Income Gap ($) | 2,017 | 62.48¢ per $1 |
| Gini / Inequality Index | 2,017 | 0.37 |
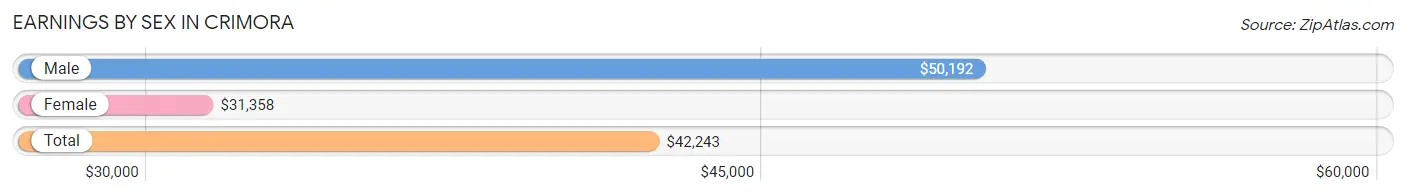
Earnings by Sex in Crimora
Average Earnings in Crimora are $42,243, $50,192 for men and $31,358 for women, a difference of 37.5%.
| Sex | Number | Average Earnings |
| Male | 554 (55.6%) | $50,192 |
| Female | 443 (44.4%) | $31,358 |
| Total | 997 (100.0%) | $42,243 |
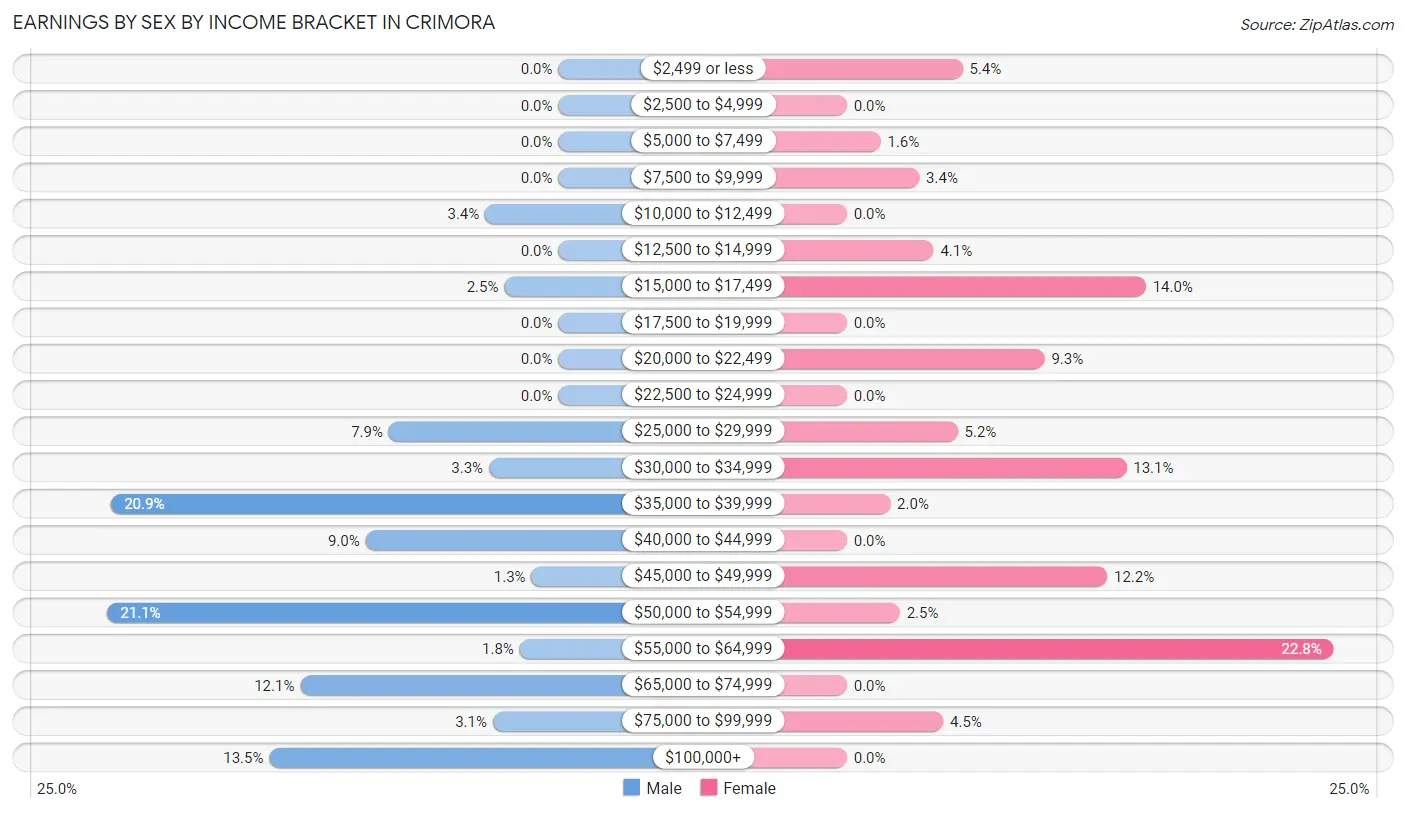
Earnings by Sex by Income Bracket in Crimora
The most common earnings brackets in Crimora are $50,000 to $54,999 for men (117 | 21.1%) and $55,000 to $64,999 for women (101 | 22.8%).
| Income | Male | Female |
| $2,499 or less | 0 (0.0%) | 24 (5.4%) |
| $2,500 to $4,999 | 0 (0.0%) | 0 (0.0%) |
| $5,000 to $7,499 | 0 (0.0%) | 7 (1.6%) |
| $7,500 to $9,999 | 0 (0.0%) | 15 (3.4%) |
| $10,000 to $12,499 | 19 (3.4%) | 0 (0.0%) |
| $12,500 to $14,999 | 0 (0.0%) | 18 (4.1%) |
| $15,000 to $17,499 | 14 (2.5%) | 62 (14.0%) |
| $17,500 to $19,999 | 0 (0.0%) | 0 (0.0%) |
| $20,000 to $22,499 | 0 (0.0%) | 41 (9.3%) |
| $22,500 to $24,999 | 0 (0.0%) | 0 (0.0%) |
| $25,000 to $29,999 | 44 (7.9%) | 23 (5.2%) |
| $30,000 to $34,999 | 18 (3.3%) | 58 (13.1%) |
| $35,000 to $39,999 | 116 (20.9%) | 9 (2.0%) |
| $40,000 to $44,999 | 50 (9.0%) | 0 (0.0%) |
| $45,000 to $49,999 | 7 (1.3%) | 54 (12.2%) |
| $50,000 to $54,999 | 117 (21.1%) | 11 (2.5%) |
| $55,000 to $64,999 | 10 (1.8%) | 101 (22.8%) |
| $65,000 to $74,999 | 67 (12.1%) | 0 (0.0%) |
| $75,000 to $99,999 | 17 (3.1%) | 20 (4.5%) |
| $100,000+ | 75 (13.5%) | 0 (0.0%) |
| Total | 554 (100.0%) | 443 (100.0%) |
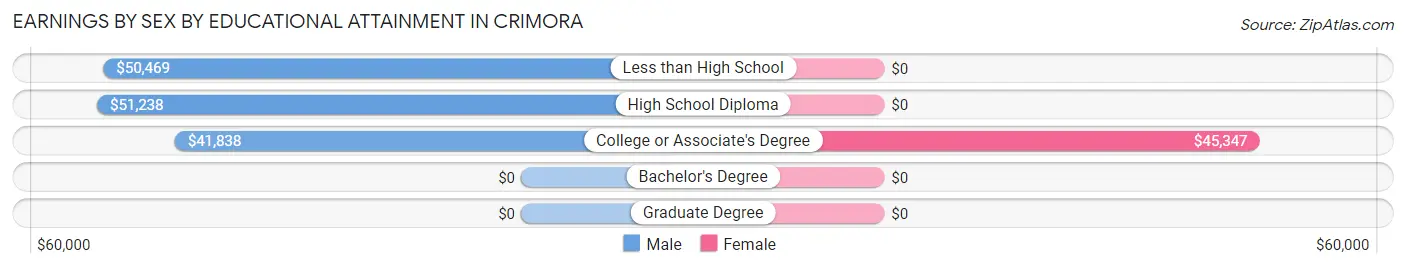
Earnings by Sex by Educational Attainment in Crimora
Average earnings in Crimora are $51,015 for men and $31,918 for women, a difference of 37.4%. Men with an educational attainment of high school diploma enjoy the highest average annual earnings of $51,238, while those with college or associate's degree education earn the least with $41,838. Women with an educational attainment of college or associate's degree earn the most with the average annual earnings of $45,347, while those with college or associate's degree education have the smallest earnings of $45,347.
| Educational Attainment | Male Income | Female Income |
| Less than High School | $50,469 | $0 |
| High School Diploma | $51,238 | $0 |
| College or Associate's Degree | $41,838 | $45,347 |
| Bachelor's Degree | - | - |
| Graduate Degree | - | - |
| Total | $51,015 | $31,918 |
Family Income in Crimora
Family Income Brackets in Crimora
According to the Crimora family income data, there are 147 families falling into the $50,000 to $74,999 income range, which is the most common income bracket and makes up 24.3% of all families.
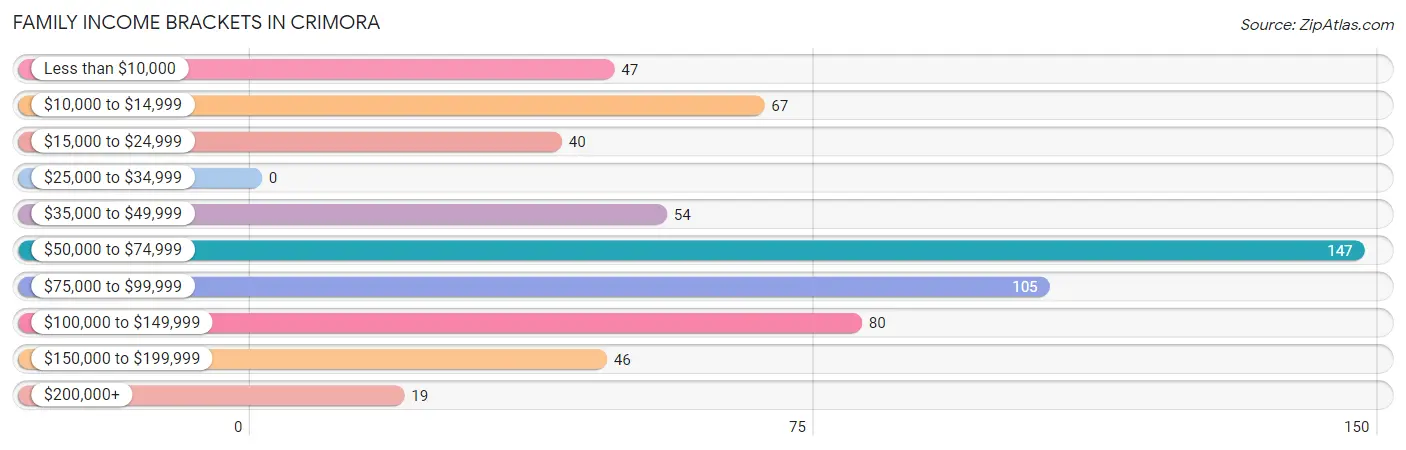
| Income Bracket | # Families | % Families |
| Less than $10,000 | 47 | 7.8% |
| $10,000 to $14,999 | 67 | 11.1% |
| $15,000 to $24,999 | 40 | 6.6% |
| $25,000 to $34,999 | 0 | 0.0% |
| $35,000 to $49,999 | 54 | 8.9% |
| $50,000 to $74,999 | 147 | 24.3% |
| $75,000 to $99,999 | 105 | 17.4% |
| $100,000 to $149,999 | 80 | 13.2% |
| $150,000 to $199,999 | 46 | 7.6% |
| $200,000+ | 19 | 3.1% |
Family Income by Famaliy Size in Crimora
3-person families (89 | 14.7%) account for the highest median family income in Crimora with $90,777 per family, while 2-person families (390 | 64.5%) have the highest median income of $36,782 per family member.
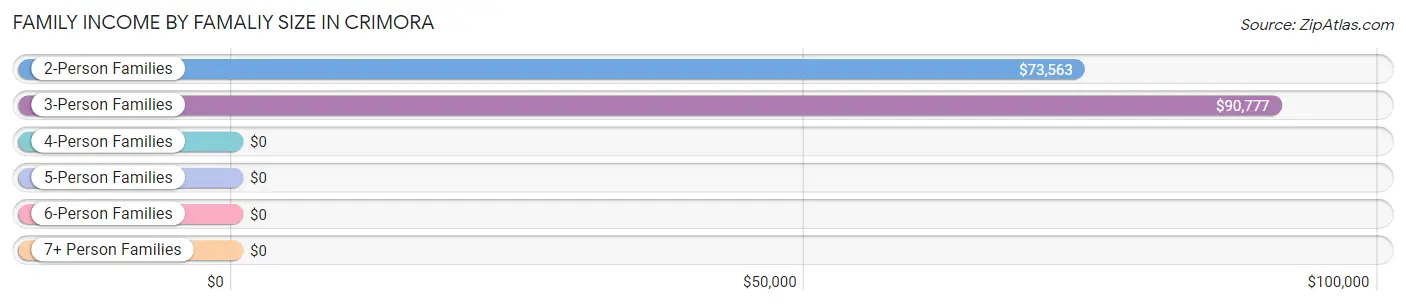
| Income Bracket | # Families | Median Income |
| 2-Person Families | 390 (64.5%) | $73,563 |
| 3-Person Families | 89 (14.7%) | $90,777 |
| 4-Person Families | 92 (15.2%) | $0 |
| 5-Person Families | 34 (5.6%) | $0 |
| 6-Person Families | 0 (0.0%) | $0 |
| 7+ Person Families | 0 (0.0%) | $0 |
| Total | 605 (100.0%) | $73,359 |
Family Income by Number of Earners in Crimora
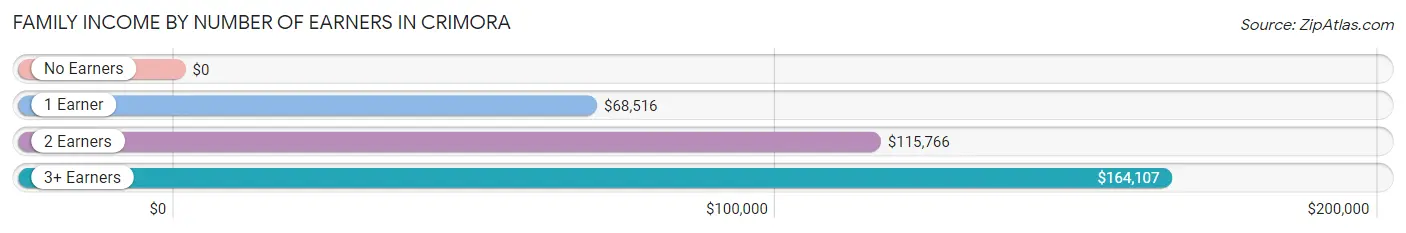
| Number of Earners | # Families | Median Income |
| No Earners | 156 (25.8%) | $0 |
| 1 Earner | 235 (38.8%) | $68,516 |
| 2 Earners | 161 (26.6%) | $115,766 |
| 3+ Earners | 53 (8.8%) | $164,107 |
| Total | 605 (100.0%) | $73,359 |
Household Income in Crimora
Household Income Brackets in Crimora
With 176 households falling in the category, the $75,000 to $99,999 income range is the most frequent in Crimora, accounting for 21.7% of all households. In contrast, only 19 households (2.3%) fall into the $200,000+ income bracket, making it the least populous group.
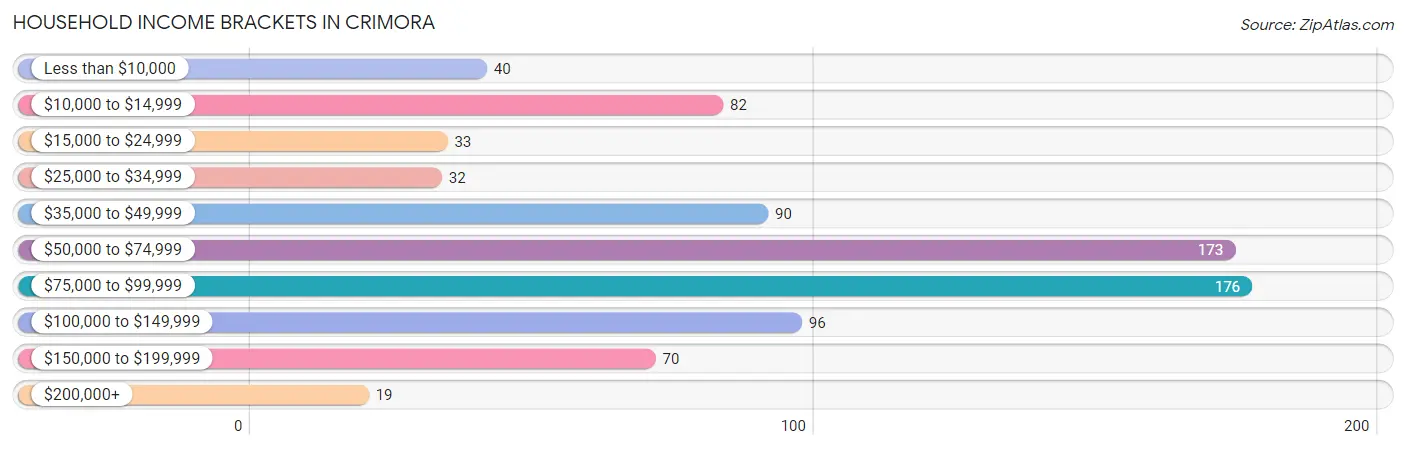
| Income Bracket | # Households | % Households |
| Less than $10,000 | 40 | 4.9% |
| $10,000 to $14,999 | 82 | 10.1% |
| $15,000 to $24,999 | 33 | 4.1% |
| $25,000 to $34,999 | 32 | 3.9% |
| $35,000 to $49,999 | 90 | 11.1% |
| $50,000 to $74,999 | 173 | 21.3% |
| $75,000 to $99,999 | 176 | 21.7% |
| $100,000 to $149,999 | 96 | 11.8% |
| $150,000 to $199,999 | 70 | 8.6% |
| $200,000+ | 19 | 2.3% |
Household Income by Householder Age in Crimora
The median household income in Crimora is $73,609, with the highest median household income of $83,081 found in the 25 to 44 years age bracket for the primary householder. A total of 205 households (25.3%) fall into this category.
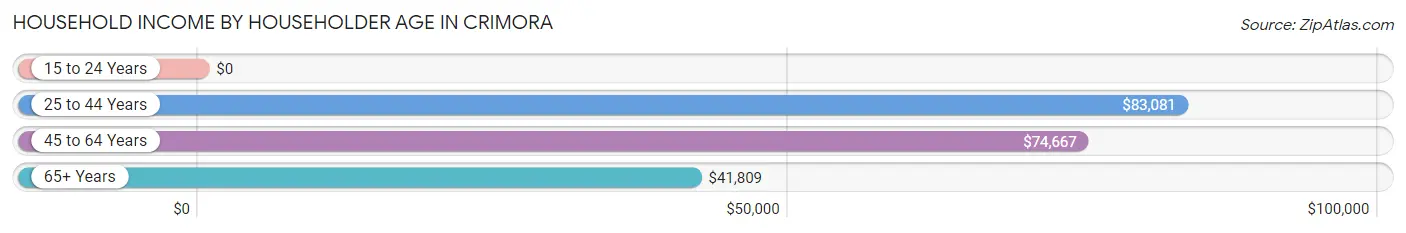
| Income Bracket | # Households | Median Income |
| 15 to 24 Years | 0 (0.0%) | $0 |
| 25 to 44 Years | 205 (25.3%) | $83,081 |
| 45 to 64 Years | 392 (48.3%) | $74,667 |
| 65+ Years | 214 (26.4%) | $41,809 |
| Total | 811 (100.0%) | $73,609 |
Poverty in Crimora
Income Below Poverty by Sex and Age in Crimora
With 15.8% poverty level for males and 31.3% for females among the residents of Crimora, 5 year old males and 6 to 11 year old females are the most vulnerable to poverty, with 50 males (100.0%) and 44 females (69.8%) in their respective age groups living below the poverty level.
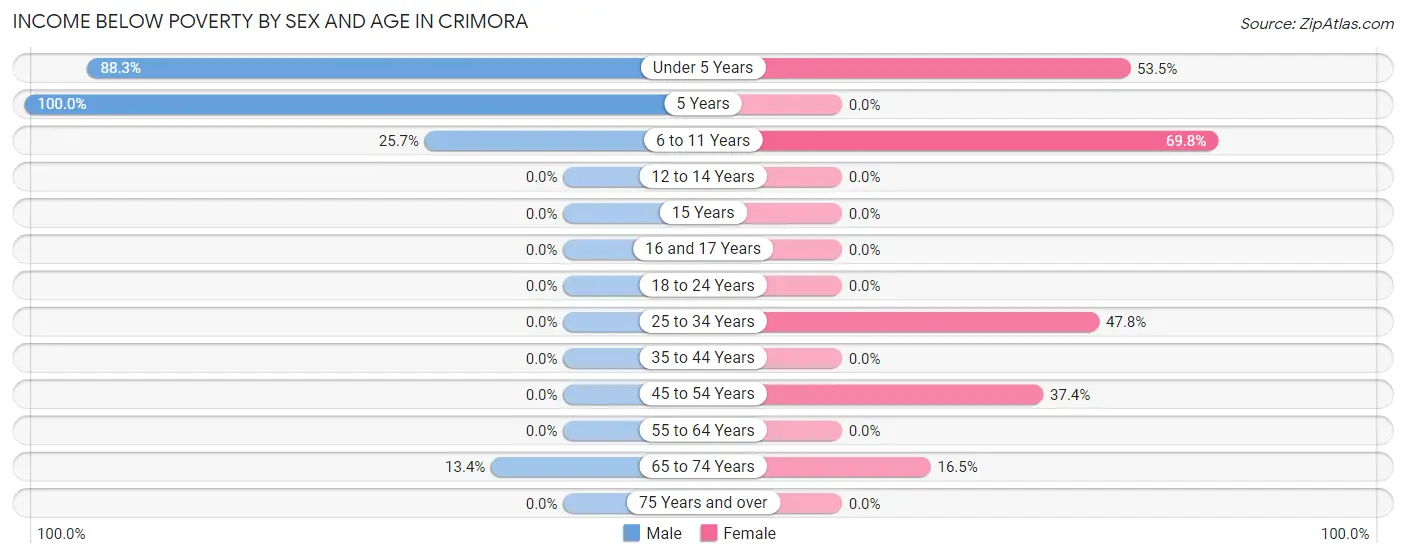
| Age Bracket | Male | Female |
| Under 5 Years | 83 (88.3%) | 61 (53.5%) |
| 5 Years | 50 (100.0%) | 0 (0.0%) |
| 6 to 11 Years | 9 (25.7%) | 44 (69.8%) |
| 12 to 14 Years | 0 (0.0%) | 0 (0.0%) |
| 15 Years | 0 (0.0%) | 0 (0.0%) |
| 16 and 17 Years | 0 (0.0%) | 0 (0.0%) |
| 18 to 24 Years | 0 (0.0%) | 0 (0.0%) |
| 25 to 34 Years | 0 (0.0%) | 128 (47.8%) |
| 35 to 44 Years | 0 (0.0%) | 0 (0.0%) |
| 45 to 54 Years | 0 (0.0%) | 71 (37.4%) |
| 55 to 64 Years | 0 (0.0%) | 0 (0.0%) |
| 65 to 74 Years | 13 (13.4%) | 15 (16.5%) |
| 75 Years and over | 0 (0.0%) | 0 (0.0%) |
| Total | 155 (15.8%) | 319 (31.3%) |
Income Above Poverty by Sex and Age in Crimora
According to the poverty statistics in Crimora, males aged 18 to 24 years and females aged 5 years are the age groups that are most secure financially, with 100.0% of males and 100.0% of females in these age groups living above the poverty line.
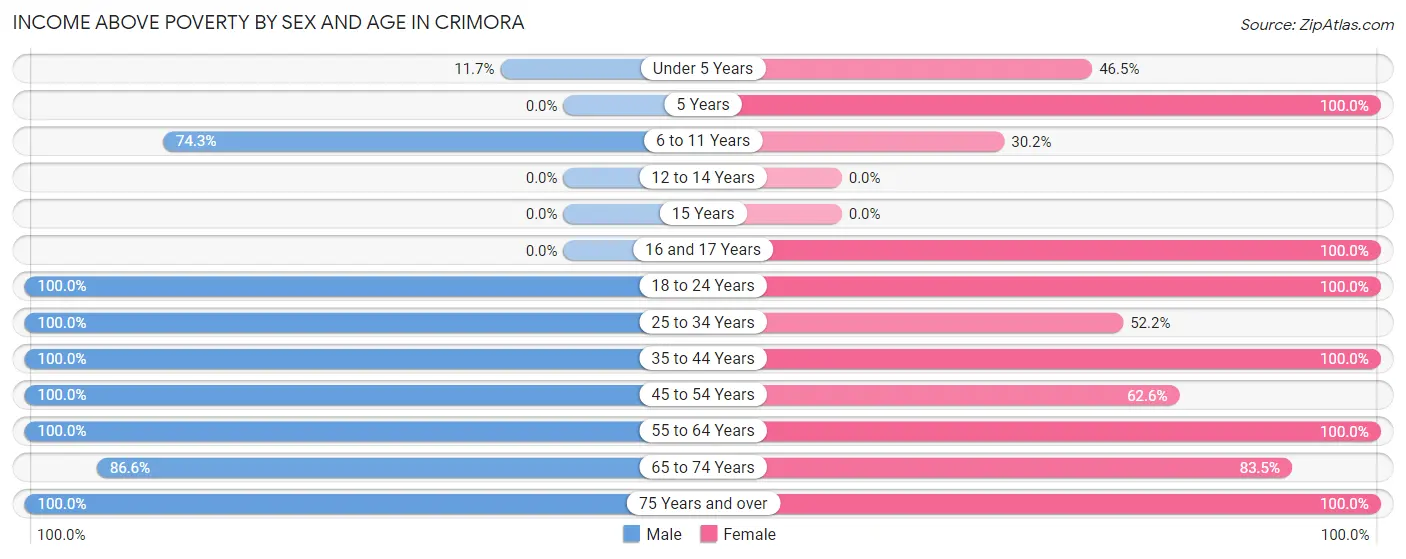
| Age Bracket | Male | Female |
| Under 5 Years | 11 (11.7%) | 53 (46.5%) |
| 5 Years | 0 (0.0%) | 17 (100.0%) |
| 6 to 11 Years | 26 (74.3%) | 19 (30.2%) |
| 12 to 14 Years | 0 (0.0%) | 0 (0.0%) |
| 15 Years | 0 (0.0%) | 0 (0.0%) |
| 16 and 17 Years | 0 (0.0%) | 21 (100.0%) |
| 18 to 24 Years | 77 (100.0%) | 26 (100.0%) |
| 25 to 34 Years | 161 (100.0%) | 140 (52.2%) |
| 35 to 44 Years | 37 (100.0%) | 9 (100.0%) |
| 45 to 54 Years | 140 (100.0%) | 119 (62.6%) |
| 55 to 64 Years | 187 (100.0%) | 189 (100.0%) |
| 65 to 74 Years | 84 (86.6%) | 76 (83.5%) |
| 75 Years and over | 101 (100.0%) | 32 (100.0%) |
| Total | 824 (84.2%) | 701 (68.7%) |
Income Below Poverty Among Married-Couple Families in Crimora
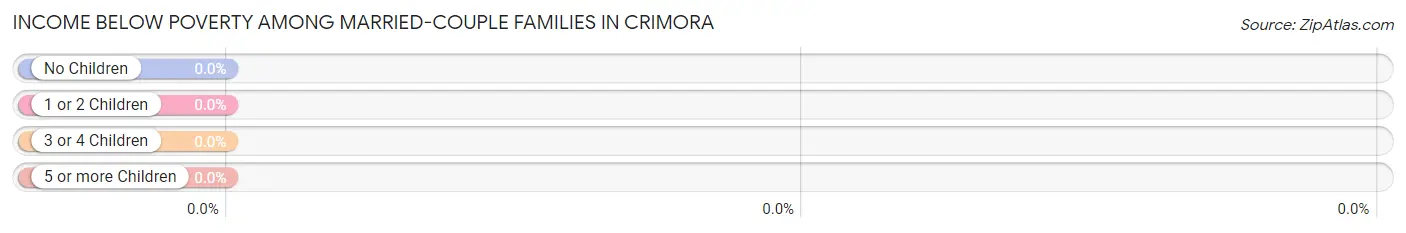
| Children | Above Poverty | Below Poverty |
| No Children | 302 (100.0%) | 0 (0.0%) |
| 1 or 2 Children | 81 (100.0%) | 0 (0.0%) |
| 3 or 4 Children | 0 (0.0%) | 0 (0.0%) |
| 5 or more Children | 0 (0.0%) | 0 (0.0%) |
| Total | 383 (100.0%) | 0 (0.0%) |
Income Below Poverty Among Single-Parent Households in Crimora
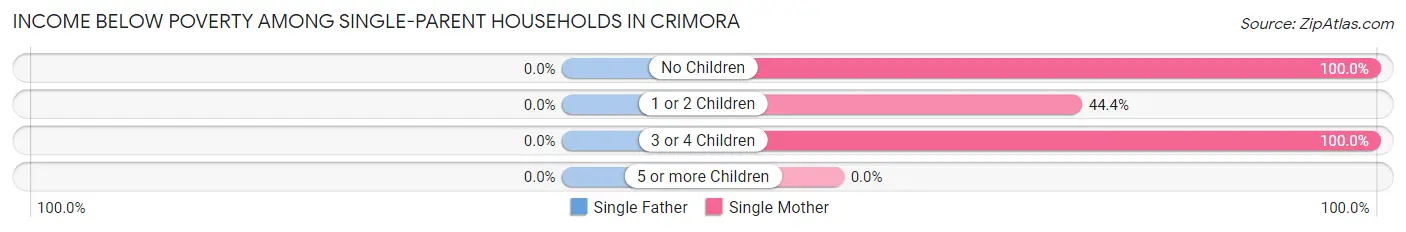
| Children | Single Father | Single Mother |
| No Children | 0 (0.0%) | 15 (100.0%) |
| 1 or 2 Children | 0 (0.0%) | 59 (44.4%) |
| 3 or 4 Children | 0 (0.0%) | 40 (100.0%) |
| 5 or more Children | 0 (0.0%) | 0 (0.0%) |
| Total | 0 (0.0%) | 114 (60.6%) |
Income Below Poverty Among Married-Couple vs Single-Parent Households in Crimora
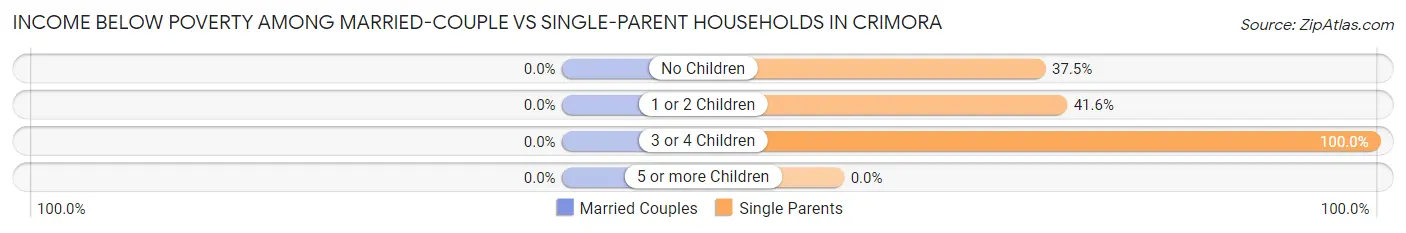
| Children | Married-Couple Families | Single-Parent Households |
| No Children | 0 (0.0%) | 15 (37.5%) |
| 1 or 2 Children | 0 (0.0%) | 59 (41.5%) |
| 3 or 4 Children | 0 (0.0%) | 40 (100.0%) |
| 5 or more Children | 0 (0.0%) | 0 (0.0%) |
| Total | 0 (0.0%) | 114 (51.3%) |
Race in Crimora
The most populous races in Crimora are , and White / Caucasian (2,017 | 100.0%).
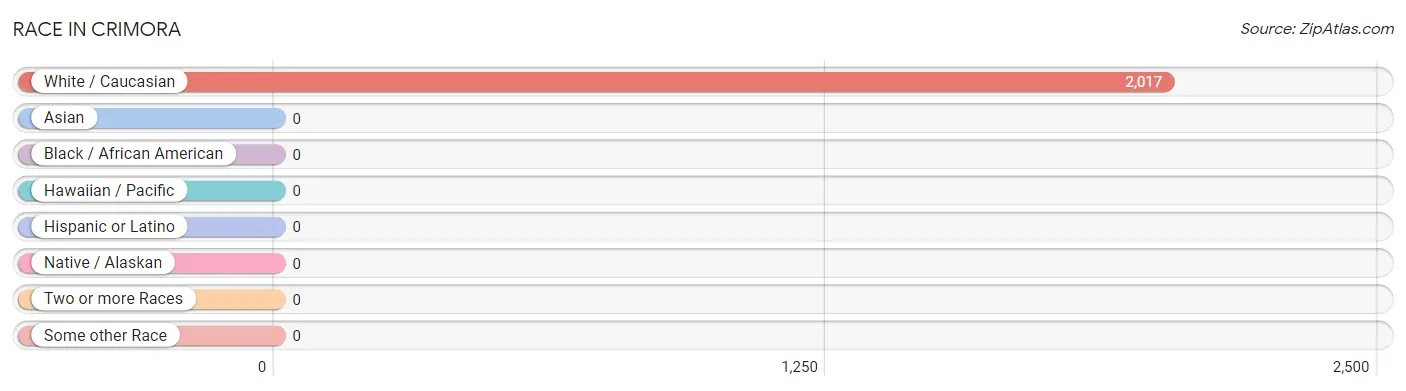
| Race | # Population | % Population |
| Asian | 0 | 0.0% |
| Black / African American | 0 | 0.0% |
| Hawaiian / Pacific | 0 | 0.0% |
| Hispanic or Latino | 0 | 0.0% |
| Native / Alaskan | 0 | 0.0% |
| White / Caucasian | 2,017 | 100.0% |
| Two or more Races | 0 | 0.0% |
| Some other Race | 0 | 0.0% |
| Total | 2,017 | 100.0% |
Ancestry in Crimora
The most populous ancestries reported in Crimora are English (280 | 13.9%), American (235 | 11.7%), German (182 | 9.0%), Irish (181 | 9.0%), and European (167 | 8.3%), together accounting for 51.8% of all Crimora residents.
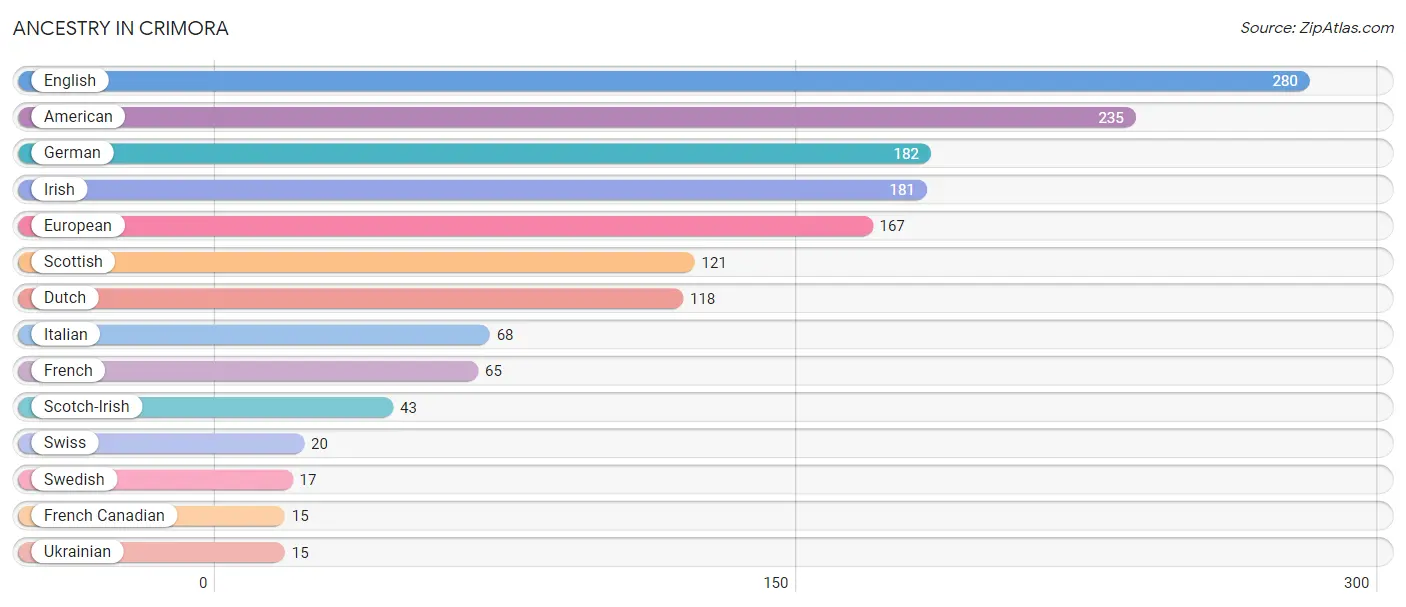
| Ancestry | # Population | % Population |
| American | 235 | 11.7% |
| Dutch | 118 | 5.9% |
| English | 280 | 13.9% |
| European | 167 | 8.3% |
| French | 65 | 3.2% |
| French Canadian | 15 | 0.7% |
| German | 182 | 9.0% |
| Irish | 181 | 9.0% |
| Italian | 68 | 3.4% |
| Scotch-Irish | 43 | 2.1% |
| Scottish | 121 | 6.0% |
| Swedish | 17 | 0.8% |
| Swiss | 20 | 1.0% |
| Ukrainian | 15 | 0.7% | View All 14 Rows |
Immigrants in Crimora

| Immigration Origin | # Population | % Population | View All 0 Rows |
Sex and Age in Crimora
Sex and Age in Crimora
The most populous age groups in Crimora are 25 to 29 Years (126 | 12.6%) for men and 25 to 29 Years (206 | 20.2%) for women.
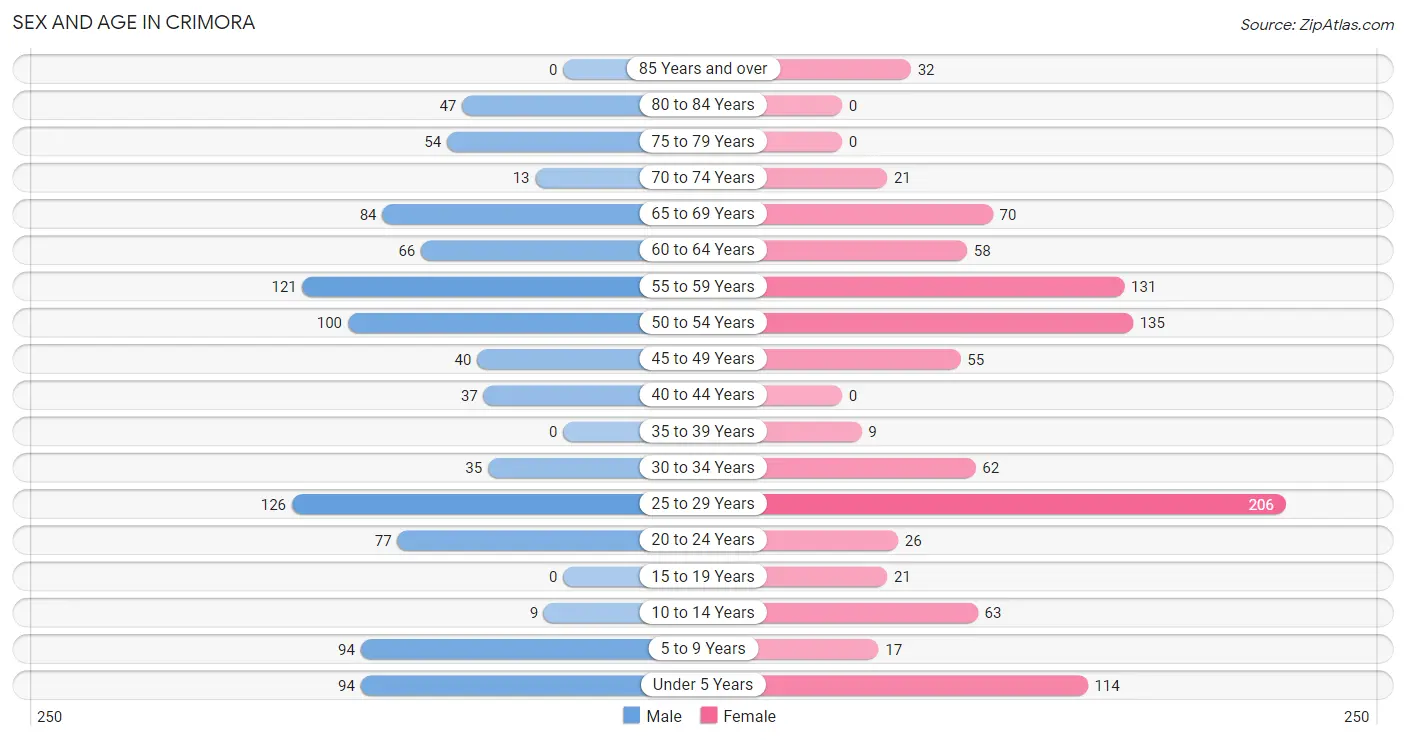
| Age Bracket | Male | Female |
| Under 5 Years | 94 (9.4%) | 114 (11.2%) |
| 5 to 9 Years | 94 (9.4%) | 17 (1.7%) |
| 10 to 14 Years | 9 (0.9%) | 63 (6.2%) |
| 15 to 19 Years | 0 (0.0%) | 21 (2.1%) |
| 20 to 24 Years | 77 (7.7%) | 26 (2.5%) |
| 25 to 29 Years | 126 (12.6%) | 206 (20.2%) |
| 30 to 34 Years | 35 (3.5%) | 62 (6.1%) |
| 35 to 39 Years | 0 (0.0%) | 9 (0.9%) |
| 40 to 44 Years | 37 (3.7%) | 0 (0.0%) |
| 45 to 49 Years | 40 (4.0%) | 55 (5.4%) |
| 50 to 54 Years | 100 (10.0%) | 135 (13.2%) |
| 55 to 59 Years | 121 (12.1%) | 131 (12.8%) |
| 60 to 64 Years | 66 (6.6%) | 58 (5.7%) |
| 65 to 69 Years | 84 (8.4%) | 70 (6.9%) |
| 70 to 74 Years | 13 (1.3%) | 21 (2.1%) |
| 75 to 79 Years | 54 (5.4%) | 0 (0.0%) |
| 80 to 84 Years | 47 (4.7%) | 0 (0.0%) |
| 85 Years and over | 0 (0.0%) | 32 (3.1%) |
| Total | 997 (100.0%) | 1,020 (100.0%) |
Families and Households in Crimora
Median Family Size in Crimora
The median family size in Crimora is 2.72 persons per family, with single female/mother families (188 | 31.1%) accounting for the largest median family size of 3.15 persons per family. On the other hand, single male/father families (34 | 5.6%) represent the smallest median family size with 2.35 persons per family.
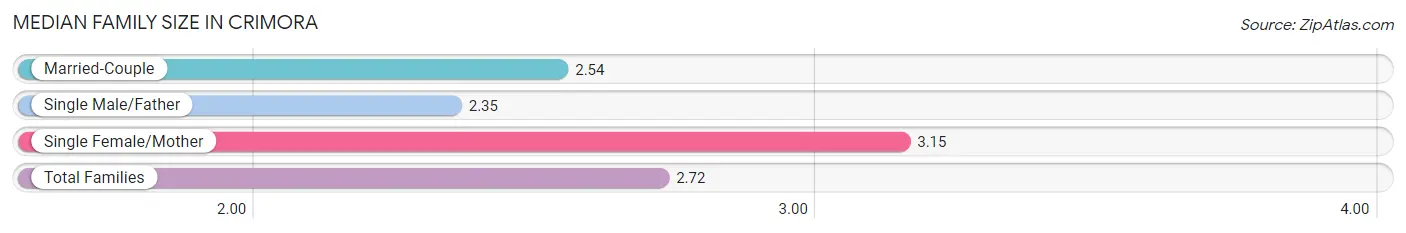
| Family Type | # Families | Family Size |
| Married-Couple | 383 (63.3%) | 2.54 |
| Single Male/Father | 34 (5.6%) | 2.35 |
| Single Female/Mother | 188 (31.1%) | 3.15 |
| Total Families | 605 (100.0%) | 2.72 |
Median Household Size in Crimora
The median household size in Crimora is 2.49 persons per household, with single female/mother households (188 | 23.2%) accounting for the largest median household size of 3.72 persons per household. non-family households (206 | 25.4%) represent the smallest median household size with 1.24 persons per household.
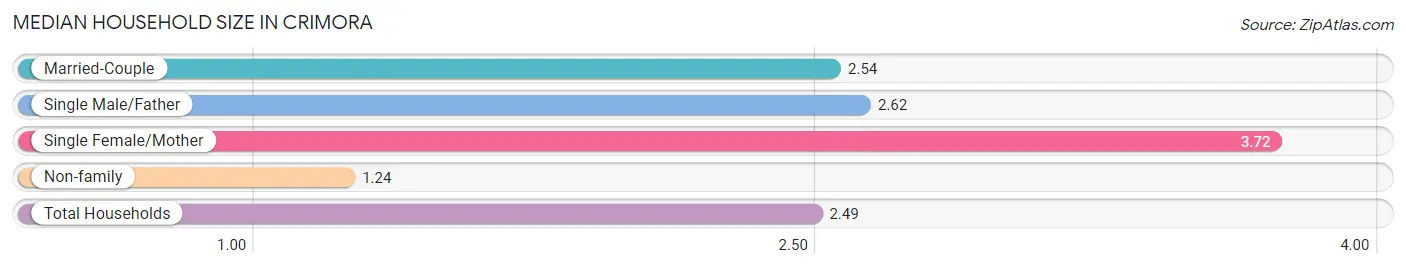
| Household Type | # Households | Household Size |
| Married-Couple | 383 (47.2%) | 2.54 |
| Single Male/Father | 34 (4.2%) | 2.62 |
| Single Female/Mother | 188 (23.2%) | 3.72 |
| Non-family | 206 (25.4%) | 1.24 |
| Total Households | 811 (100.0%) | 2.49 |
Household Size by Marriage Status in Crimora
Out of a total of 811 households in Crimora, 605 (74.6%) are family households, while 206 (25.4%) are nonfamily households. The most numerous type of family households are 2-person households, comprising 309, and the most common type of nonfamily households are 1-person households, comprising 165.
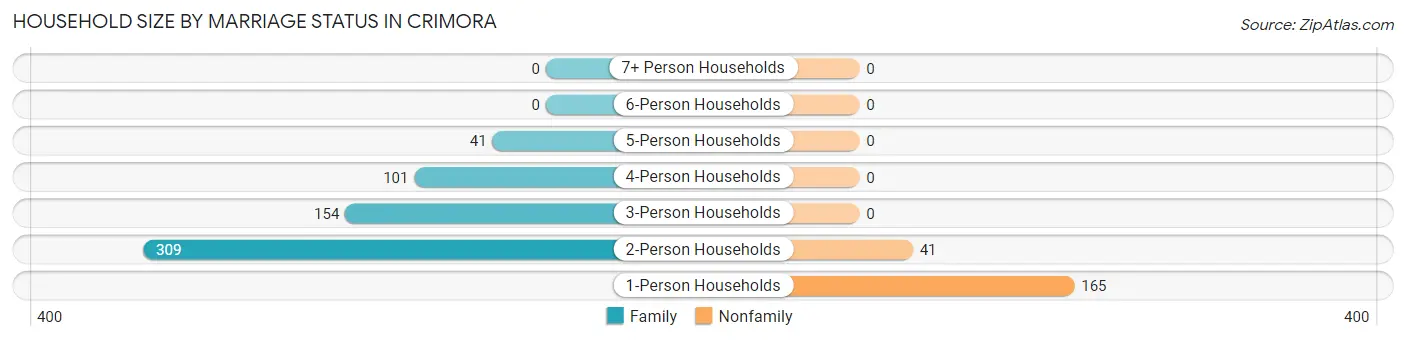
| Household Size | Family Households | Nonfamily Households |
| 1-Person Households | - | 165 (20.3%) |
| 2-Person Households | 309 (38.1%) | 41 (5.1%) |
| 3-Person Households | 154 (19.0%) | 0 (0.0%) |
| 4-Person Households | 101 (12.4%) | 0 (0.0%) |
| 5-Person Households | 41 (5.1%) | 0 (0.0%) |
| 6-Person Households | 0 (0.0%) | 0 (0.0%) |
| 7+ Person Households | 0 (0.0%) | 0 (0.0%) |
| Total | 605 (74.6%) | 206 (25.4%) |
Female Fertility in Crimora
Fertility by Age in Crimora
Average fertility rate in Crimora is 106.0 births per 1,000 women. Women in the age bracket of 20 to 34 years have the highest fertility rate with 136.0 births per 1,000 women. Women in the age bracket of 20 to 34 years acount for 100.0% of all women with births.
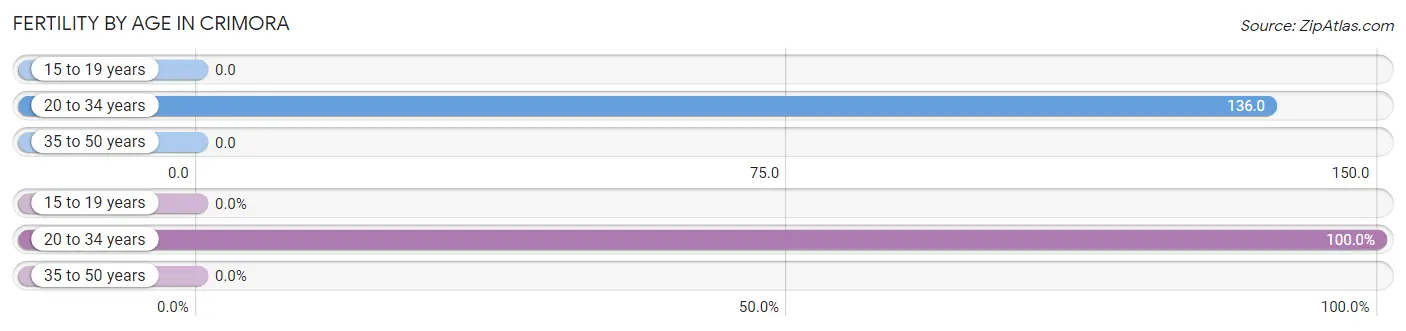
| Age Bracket | Women with Births | Births / 1,000 Women |
| 15 to 19 years | 0 (0.0%) | 0.0 |
| 20 to 34 years | 40 (100.0%) | 136.0 |
| 35 to 50 years | 0 (0.0%) | 0.0 |
| Total | 40 (100.0%) | 106.0 |
Fertility by Age by Marriage Status in Crimora
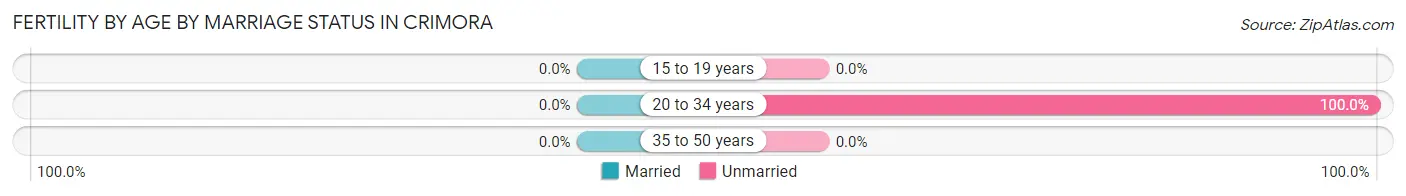
| Age Bracket | Married | Unmarried |
| 15 to 19 years | 0 (0.0%) | 0 (0.0%) |
| 20 to 34 years | 0 (0.0%) | 40 (100.0%) |
| 35 to 50 years | 0 (0.0%) | 0 (0.0%) |
| Total | 0 (0.0%) | 40 (100.0%) |
Fertility by Education in Crimora
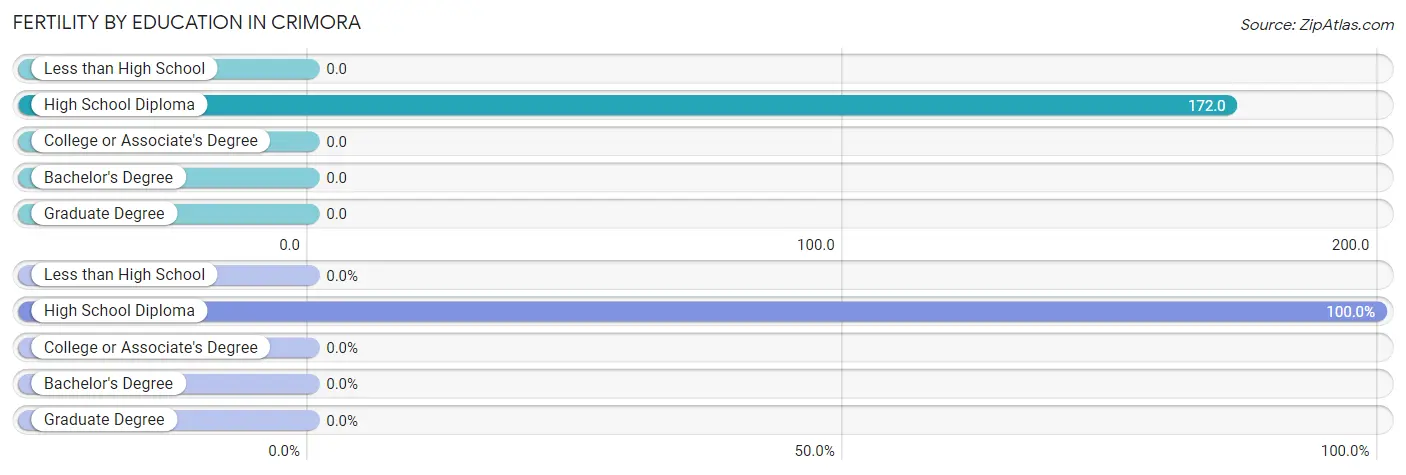
| Educational Attainment | Women with Births | Births / 1,000 Women |
| Less than High School | 0 (0.0%) | 0.0 |
| High School Diploma | 40 (100.0%) | 172.0 |
| College or Associate's Degree | 0 (0.0%) | 0.0 |
| Bachelor's Degree | 0 (0.0%) | 0.0 |
| Graduate Degree | 0 (0.0%) | 0.0 |
| Total | 40 (100.0%) | 106.0 |
Fertility by Education by Marriage Status in Crimora
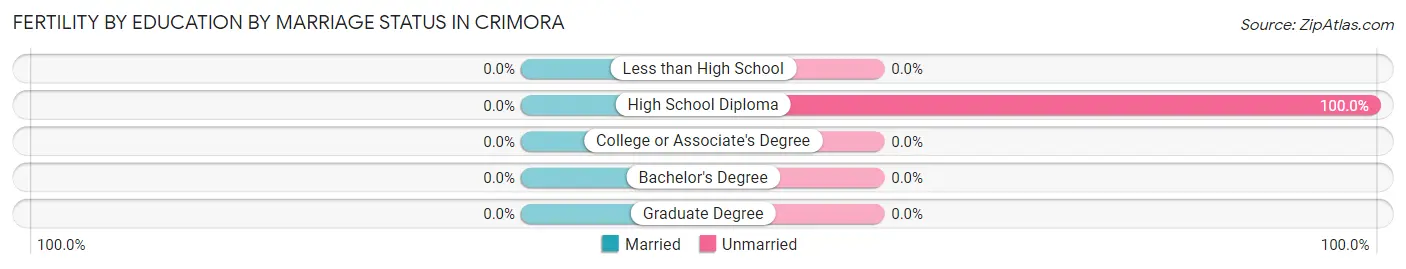
| Educational Attainment | Married | Unmarried |
| Less than High School | 0 (0.0%) | 0 (0.0%) |
| High School Diploma | 0 (0.0%) | 40 (100.0%) |
| College or Associate's Degree | 0 (0.0%) | 0 (0.0%) |
| Bachelor's Degree | 0 (0.0%) | 0 (0.0%) |
| Graduate Degree | 0 (0.0%) | 0 (0.0%) |
| Total | 0 (0.0%) | 40 (100.0%) |
Employment Characteristics in Crimora
Employment by Class of Employer in Crimora
Among the 953 employed individuals in Crimora, private company employees (846 | 88.8%), not-for-profit organizations (54 | 5.7%), and local government employees (30 | 3.2%) make up the most common classes of employment.
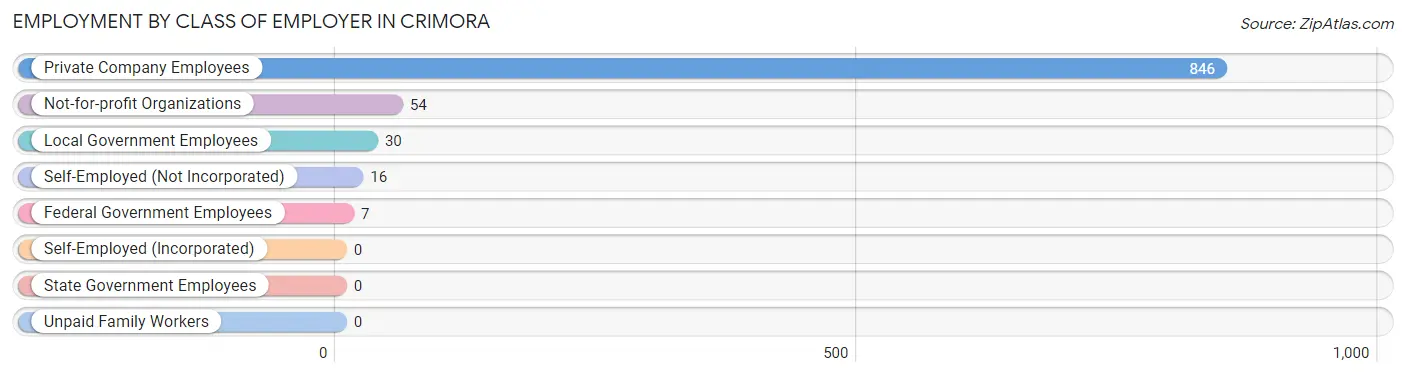
| Employer Class | # Employees | % Employees |
| Private Company Employees | 846 | 88.8% |
| Self-Employed (Incorporated) | 0 | 0.0% |
| Self-Employed (Not Incorporated) | 16 | 1.7% |
| Not-for-profit Organizations | 54 | 5.7% |
| Local Government Employees | 30 | 3.2% |
| State Government Employees | 0 | 0.0% |
| Federal Government Employees | 7 | 0.7% |
| Unpaid Family Workers | 0 | 0.0% |
| Total | 953 | 100.0% |
Employment Status by Age in Crimora
According to the labor force statistics for Crimora, out of the total population over 16 years of age (1,626), 62.4% or 1,015 individuals are in the labor force, with 6.0% or 61 of them unemployed. The age group with the highest labor force participation rate is 16 to 19 years, with 100.0% or 21 individuals in the labor force. Within the labor force, the 16 to 19 years age range has the highest percentage of unemployed individuals, with 100.0% or 21 of them being unemployed.
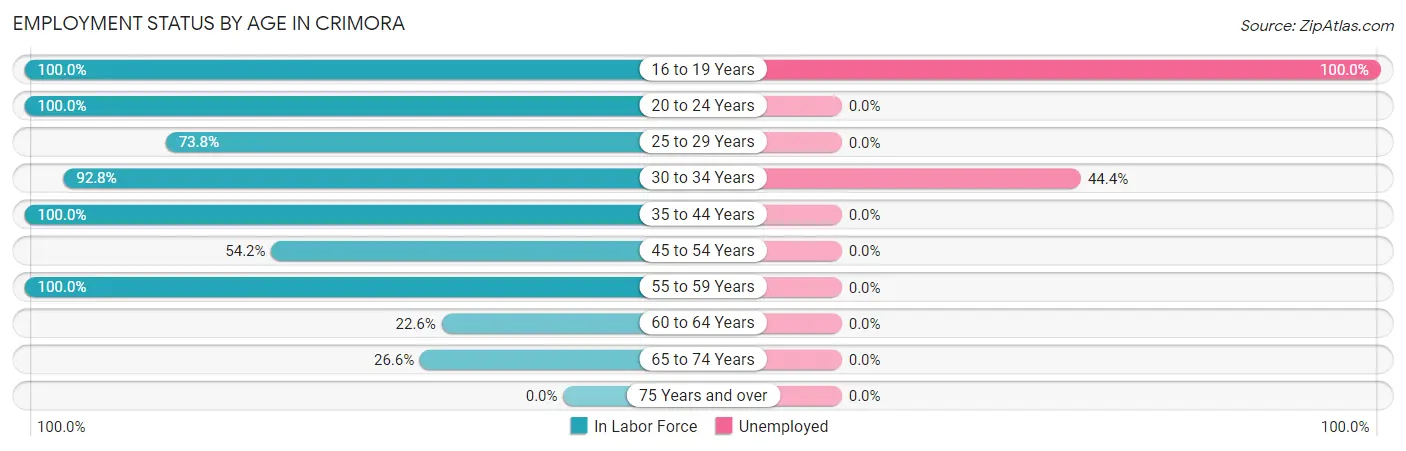
| Age Bracket | In Labor Force | Unemployed |
| 16 to 19 Years | 21 (100.0%) | 21 (100.0%) |
| 20 to 24 Years | 103 (100.0%) | 0 (0.0%) |
| 25 to 29 Years | 245 (73.8%) | 0 (0.0%) |
| 30 to 34 Years | 90 (92.8%) | 40 (44.4%) |
| 35 to 44 Years | 46 (100.0%) | 0 (0.0%) |
| 45 to 54 Years | 179 (54.2%) | 0 (0.0%) |
| 55 to 59 Years | 252 (100.0%) | 0 (0.0%) |
| 60 to 64 Years | 28 (22.6%) | 0 (0.0%) |
| 65 to 74 Years | 50 (26.6%) | 0 (0.0%) |
| 75 Years and over | 0 (0.0%) | 0 (0.0%) |
| Total | 1,015 (62.4%) | 61 (6.0%) |
Employment Status by Educational Attainment in Crimora
According to labor force statistics for Crimora, 71.1% of individuals (840) out of the total population between 25 and 64 years of age (1,181) are in the labor force, with 4.8% or 40 of them being unemployed. The group with the highest labor force participation rate are those with the educational attainment of bachelor's degree or higher, with 100.0% or 67 individuals in the labor force. Within the labor force, individuals with high school diploma education have the highest percentage of unemployment, with 7.4% or 40 of them being unemployed.
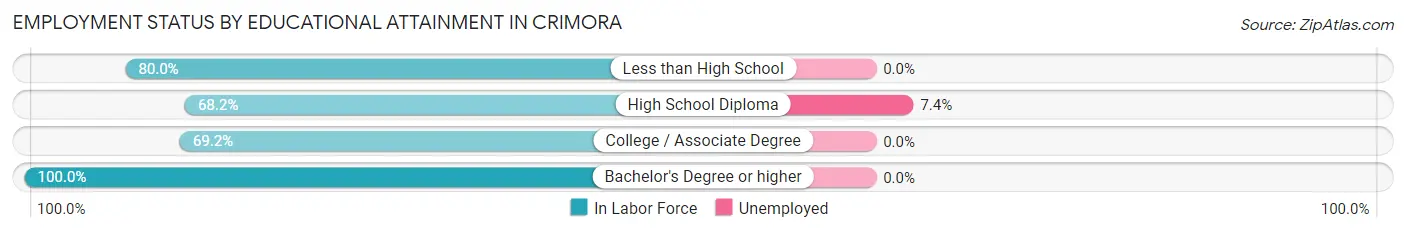
| Educational Attainment | In Labor Force | Unemployed |
| Less than High School | 76 (80.0%) | 0 (0.0%) |
| High School Diploma | 544 (68.2%) | 59 (7.4%) |
| College / Associate Degree | 153 (69.2%) | 0 (0.0%) |
| Bachelor's Degree or higher | 67 (100.0%) | 0 (0.0%) |
| Total | 840 (71.1%) | 57 (4.8%) |
Employment Occupations by Sex in Crimora
Management, Business, Science and Arts Occupations
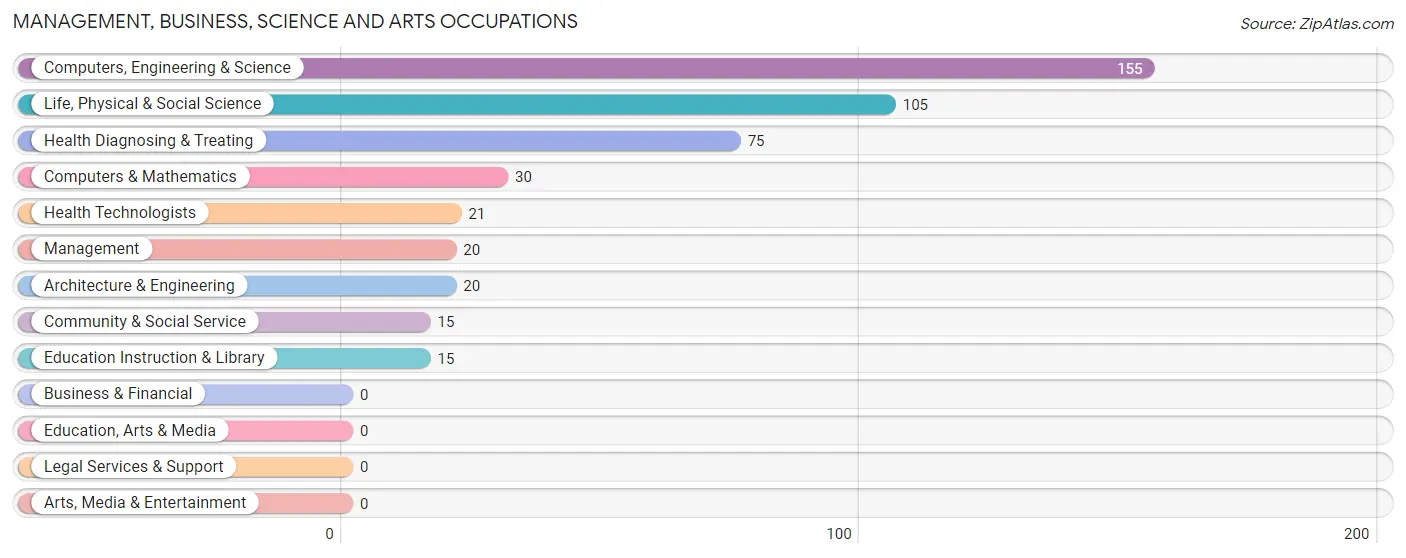
The most common Management, Business, Science and Arts occupations in Crimora are Computers, Engineering & Science (155 | 16.3%), Life, Physical & Social Science (105 | 11.0%), Health Diagnosing & Treating (75 | 7.9%), Computers & Mathematics (30 | 3.2%), and Health Technologists (21 | 2.2%).
Management, Business, Science and Arts Occupations by Sex
Within the Management, Business, Science and Arts occupations in Crimora, the most male-oriented occupations are Computers & Mathematics (100.0%), Architecture & Engineering (100.0%), and Computers, Engineering & Science (48.4%), while the most female-oriented occupations are Management (100.0%), Community & Social Service (100.0%), and Education Instruction & Library (100.0%).
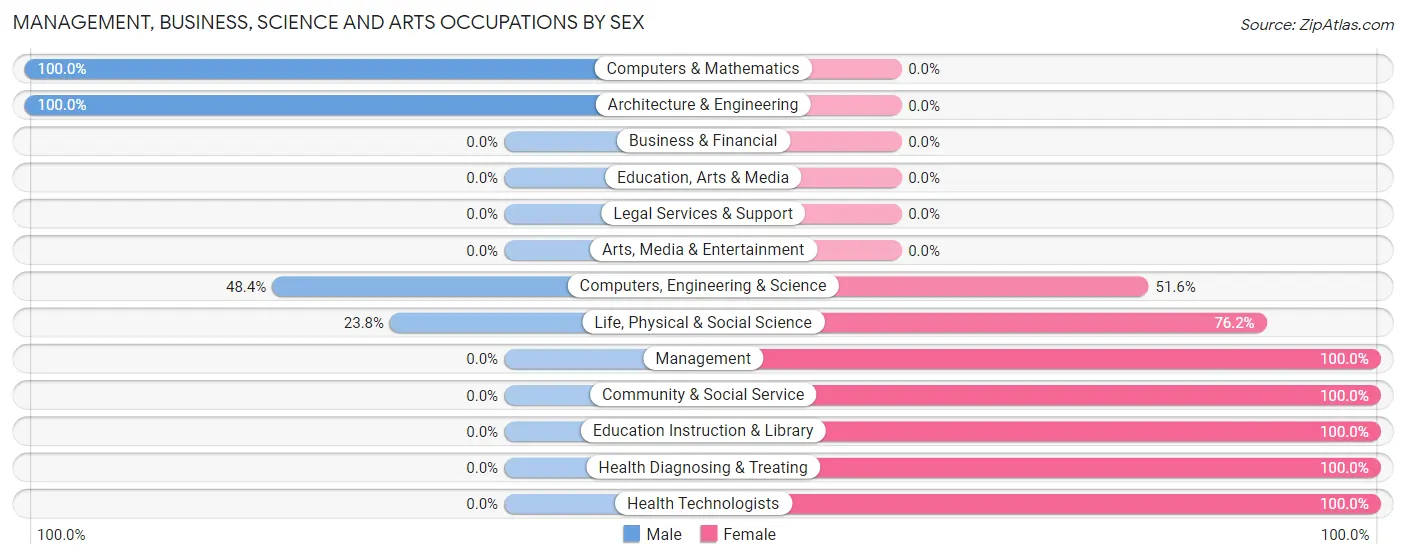
| Occupation | Male | Female |
| Management | 0 (0.0%) | 20 (100.0%) |
| Business & Financial | 0 (0.0%) | 0 (0.0%) |
| Computers, Engineering & Science | 75 (48.4%) | 80 (51.6%) |
| Computers & Mathematics | 30 (100.0%) | 0 (0.0%) |
| Architecture & Engineering | 20 (100.0%) | 0 (0.0%) |
| Life, Physical & Social Science | 25 (23.8%) | 80 (76.2%) |
| Community & Social Service | 0 (0.0%) | 15 (100.0%) |
| Education, Arts & Media | 0 (0.0%) | 0 (0.0%) |
| Legal Services & Support | 0 (0.0%) | 0 (0.0%) |
| Education Instruction & Library | 0 (0.0%) | 15 (100.0%) |
| Arts, Media & Entertainment | 0 (0.0%) | 0 (0.0%) |
| Health Diagnosing & Treating | 0 (0.0%) | 75 (100.0%) |
| Health Technologists | 0 (0.0%) | 21 (100.0%) |
| Total (Category) | 75 (28.3%) | 190 (71.7%) |
| Total (Overall) | 554 (58.1%) | 399 (41.9%) |
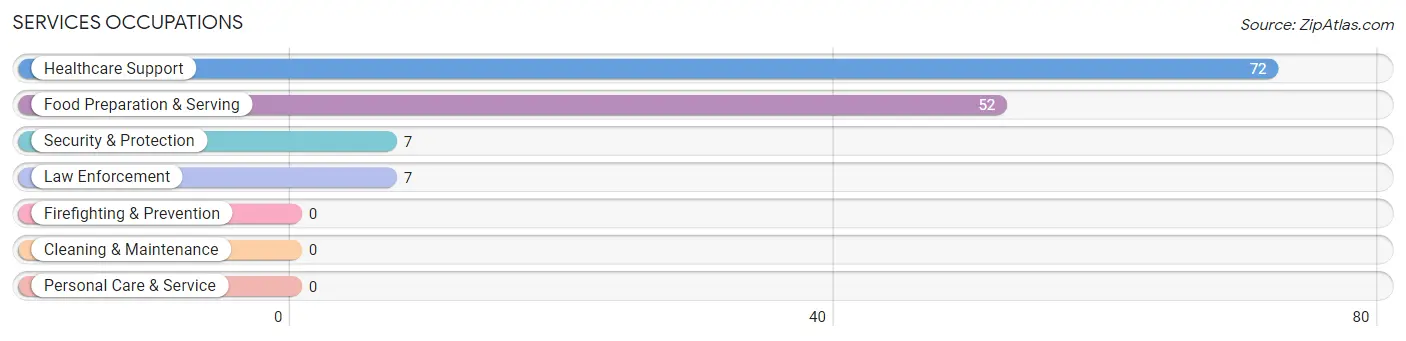
Services Occupations
The most common Services occupations in Crimora are Healthcare Support (72 | 7.6%), Food Preparation & Serving (52 | 5.5%), Security & Protection (7 | 0.7%), and Law Enforcement (7 | 0.7%).
Services Occupations by Sex
Within the Services occupations in Crimora, the most male-oriented occupations are Security & Protection (100.0%), Law Enforcement (100.0%), and Food Preparation & Serving (26.9%), while the most female-oriented occupations are Healthcare Support (80.6%), and Food Preparation & Serving (73.1%).
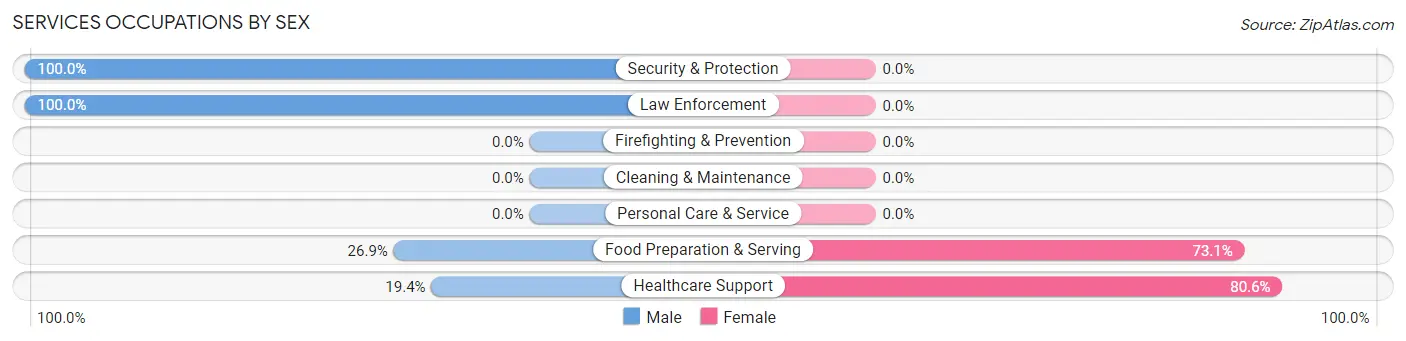
| Occupation | Male | Female |
| Healthcare Support | 14 (19.4%) | 58 (80.6%) |
| Security & Protection | 7 (100.0%) | 0 (0.0%) |
| Firefighting & Prevention | 0 (0.0%) | 0 (0.0%) |
| Law Enforcement | 7 (100.0%) | 0 (0.0%) |
| Food Preparation & Serving | 14 (26.9%) | 38 (73.1%) |
| Cleaning & Maintenance | 0 (0.0%) | 0 (0.0%) |
| Personal Care & Service | 0 (0.0%) | 0 (0.0%) |
| Total (Category) | 35 (26.7%) | 96 (73.3%) |
| Total (Overall) | 554 (58.1%) | 399 (41.9%) |
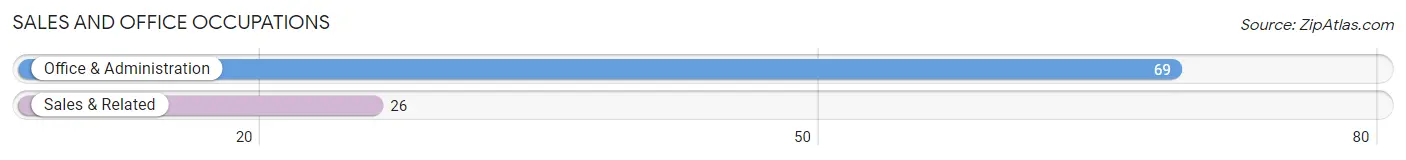
Sales and Office Occupations
The most common Sales and Office occupations in Crimora are Office & Administration (69 | 7.2%), and Sales & Related (26 | 2.7%).
Sales and Office Occupations by Sex
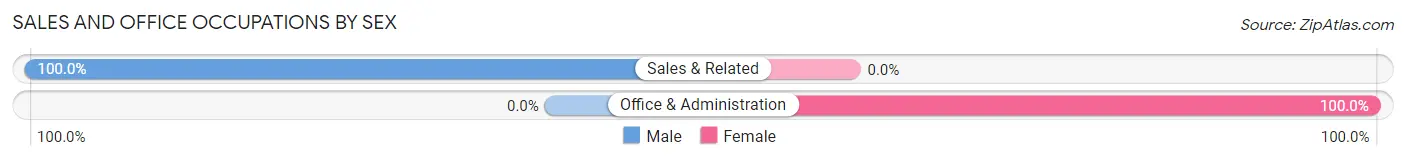
| Occupation | Male | Female |
| Sales & Related | 26 (100.0%) | 0 (0.0%) |
| Office & Administration | 0 (0.0%) | 69 (100.0%) |
| Total (Category) | 26 (27.4%) | 69 (72.6%) |
| Total (Overall) | 554 (58.1%) | 399 (41.9%) |
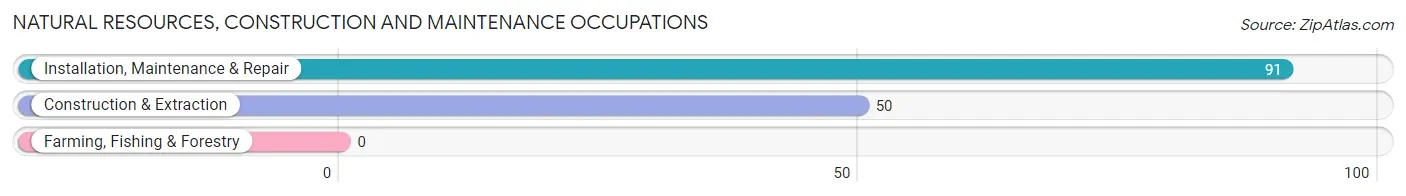
Natural Resources, Construction and Maintenance Occupations
The most common Natural Resources, Construction and Maintenance occupations in Crimora are Installation, Maintenance & Repair (91 | 9.6%), and Construction & Extraction (50 | 5.2%).
Natural Resources, Construction and Maintenance Occupations by Sex
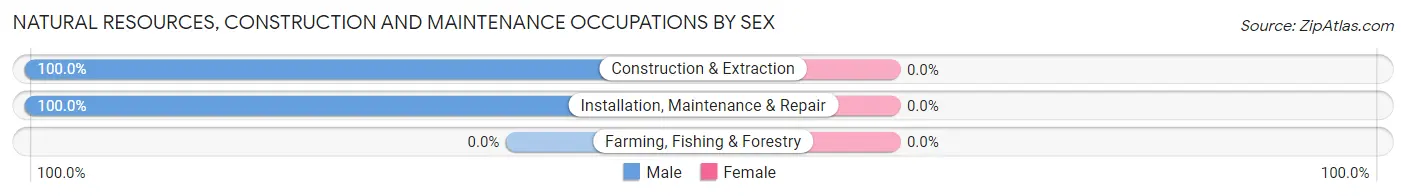
| Occupation | Male | Female |
| Farming, Fishing & Forestry | 0 (0.0%) | 0 (0.0%) |
| Construction & Extraction | 50 (100.0%) | 0 (0.0%) |
| Installation, Maintenance & Repair | 91 (100.0%) | 0 (0.0%) |
| Total (Category) | 141 (100.0%) | 0 (0.0%) |
| Total (Overall) | 554 (58.1%) | 399 (41.9%) |
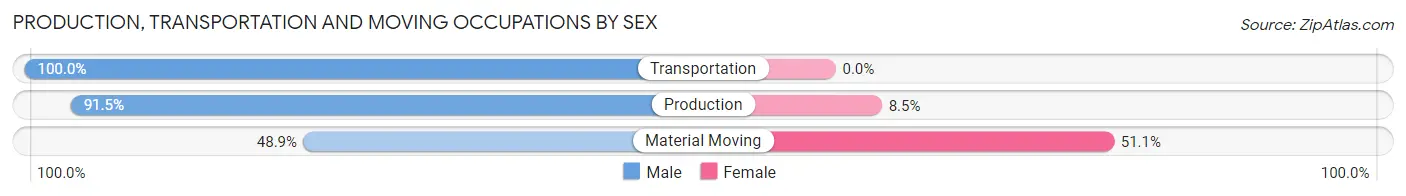
Production, Transportation and Moving Occupations
The most common Production, Transportation and Moving occupations in Crimora are Production (236 | 24.8%), Material Moving (47 | 4.9%), and Transportation (38 | 4.0%).
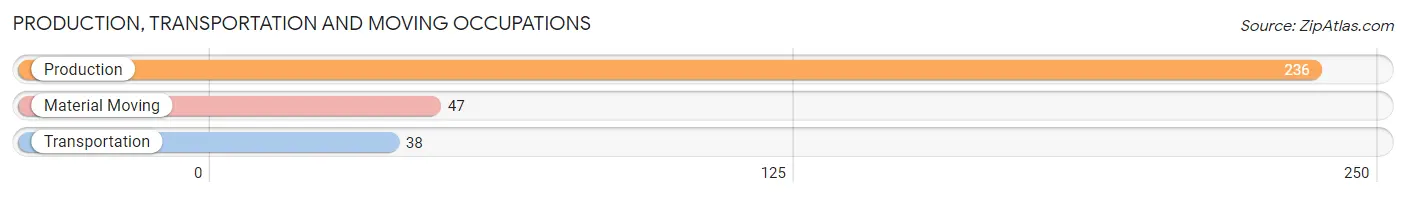
Production, Transportation and Moving Occupations by Sex
| Occupation | Male | Female |
| Production | 216 (91.5%) | 20 (8.5%) |
| Transportation | 38 (100.0%) | 0 (0.0%) |
| Material Moving | 23 (48.9%) | 24 (51.1%) |
| Total (Category) | 277 (86.3%) | 44 (13.7%) |
| Total (Overall) | 554 (58.1%) | 399 (41.9%) |
Employment Industries by Sex in Crimora
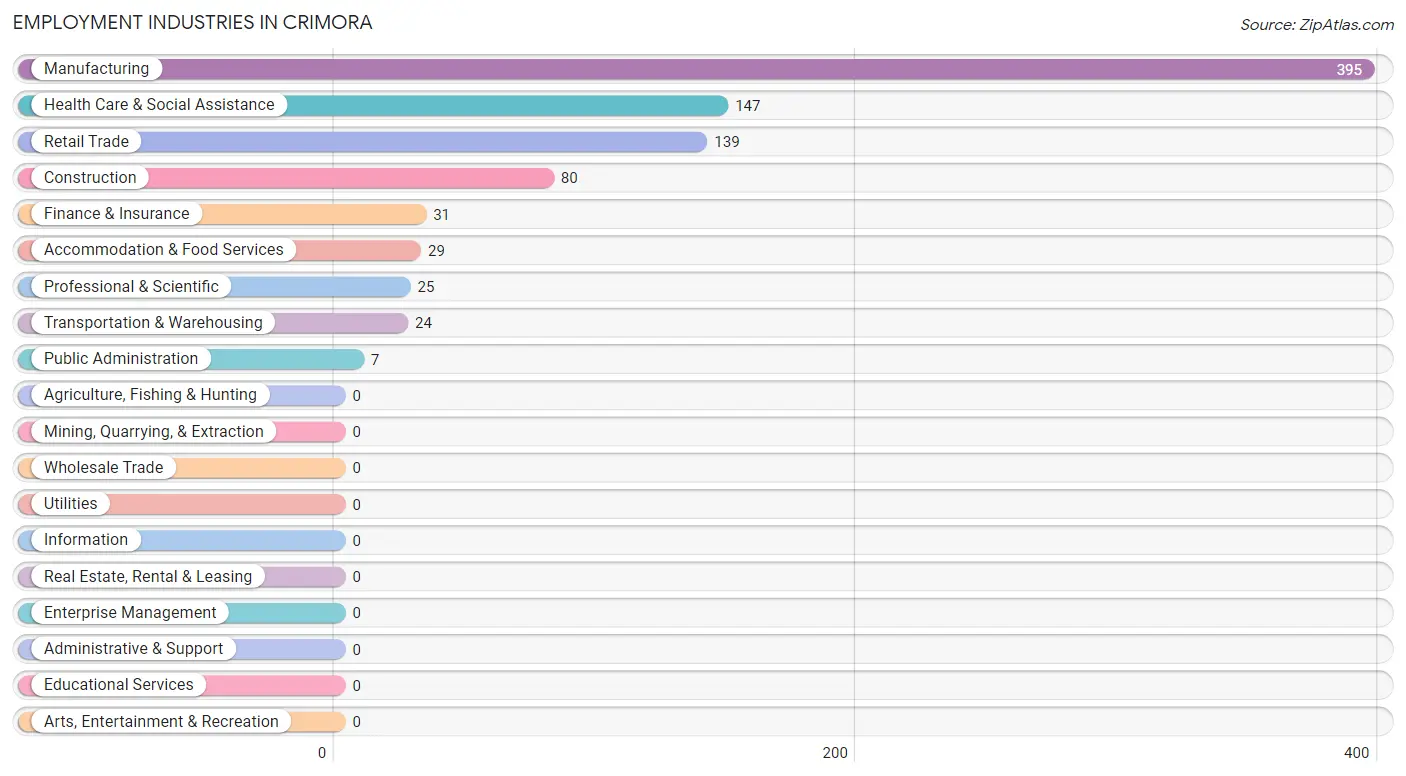
Employment Industries in Crimora
The major employment industries in Crimora include Manufacturing (395 | 41.4%), Health Care & Social Assistance (147 | 15.4%), Retail Trade (139 | 14.6%), Construction (80 | 8.4%), and Finance & Insurance (31 | 3.3%).
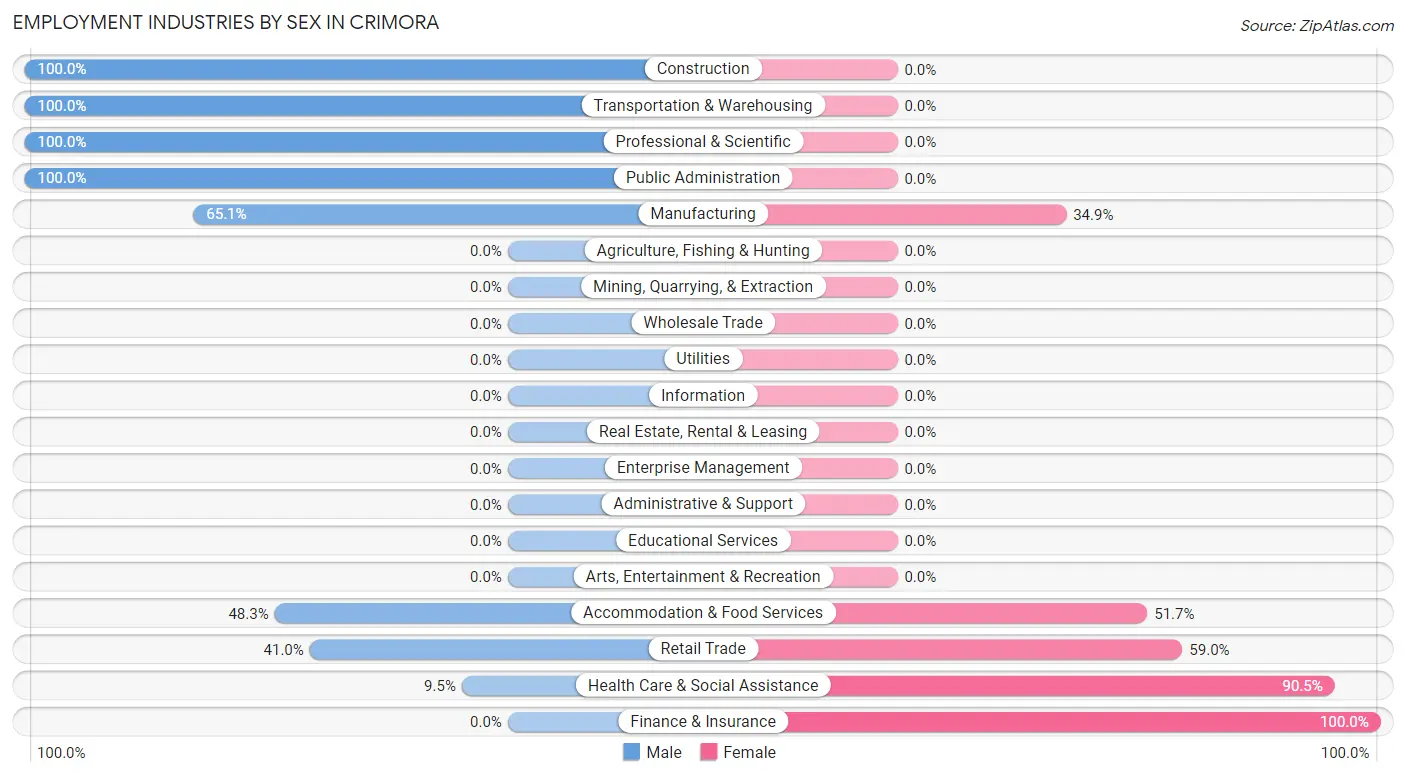
Employment Industries by Sex in Crimora
The Crimora industries that see more men than women are Construction (100.0%), Transportation & Warehousing (100.0%), and Professional & Scientific (100.0%), whereas the industries that tend to have a higher number of women are Finance & Insurance (100.0%), Health Care & Social Assistance (90.5%), and Retail Trade (59.0%).
| Industry | Male | Female |
| Agriculture, Fishing & Hunting | 0 (0.0%) | 0 (0.0%) |
| Mining, Quarrying, & Extraction | 0 (0.0%) | 0 (0.0%) |
| Construction | 80 (100.0%) | 0 (0.0%) |
| Manufacturing | 257 (65.1%) | 138 (34.9%) |
| Wholesale Trade | 0 (0.0%) | 0 (0.0%) |
| Retail Trade | 57 (41.0%) | 82 (59.0%) |
| Transportation & Warehousing | 24 (100.0%) | 0 (0.0%) |
| Utilities | 0 (0.0%) | 0 (0.0%) |
| Information | 0 (0.0%) | 0 (0.0%) |
| Finance & Insurance | 0 (0.0%) | 31 (100.0%) |
| Real Estate, Rental & Leasing | 0 (0.0%) | 0 (0.0%) |
| Professional & Scientific | 25 (100.0%) | 0 (0.0%) |
| Enterprise Management | 0 (0.0%) | 0 (0.0%) |
| Administrative & Support | 0 (0.0%) | 0 (0.0%) |
| Educational Services | 0 (0.0%) | 0 (0.0%) |
| Health Care & Social Assistance | 14 (9.5%) | 133 (90.5%) |
| Arts, Entertainment & Recreation | 0 (0.0%) | 0 (0.0%) |
| Accommodation & Food Services | 14 (48.3%) | 15 (51.7%) |
| Public Administration | 7 (100.0%) | 0 (0.0%) |
| Total | 554 (58.1%) | 399 (41.9%) |
Education in Crimora
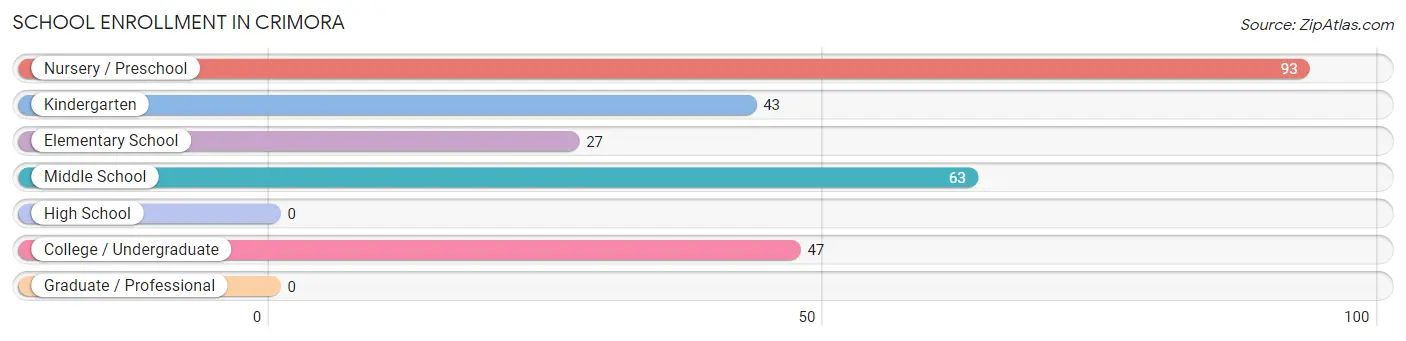
School Enrollment in Crimora
The most common levels of schooling among the 273 students in Crimora are nursery / preschool (93 | 34.1%), middle school (63 | 23.1%), and college / undergraduate (47 | 17.2%).
| School Level | # Students | % Students |
| Nursery / Preschool | 93 | 34.1% |
| Kindergarten | 43 | 15.8% |
| Elementary School | 27 | 9.9% |
| Middle School | 63 | 23.1% |
| High School | 0 | 0.0% |
| College / Undergraduate | 47 | 17.2% |
| Graduate / Professional | 0 | 0.0% |
| Total | 273 | 100.0% |
School Enrollment by Age by Funding Source in Crimora
Out of a total of 273 students who are enrolled in schools in Crimora, 67 (24.5%) attend a private institution, while the remaining 206 (75.5%) are enrolled in public schools. The age group of 5 to 9 year old has the highest likelihood of being enrolled in private schools, with 67 (60.4% in the age bracket) enrolled. Conversely, the age group of 3 to 4 year olds has the lowest likelihood of being enrolled in a private school, with 43 (100.0% in the age bracket) attending a public institution.
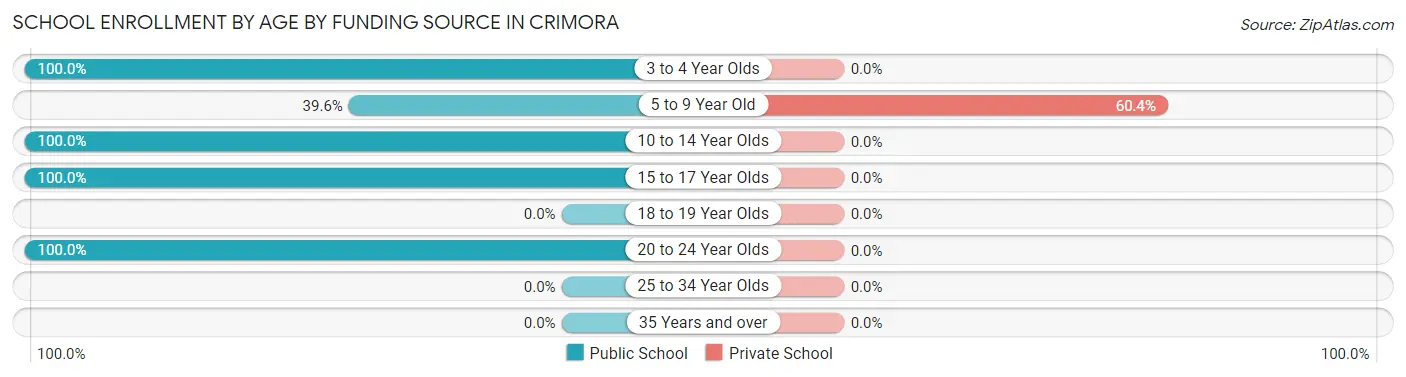
| Age Bracket | Public School | Private School |
| 3 to 4 Year Olds | 43 (100.0%) | 0 (0.0%) |
| 5 to 9 Year Old | 44 (39.6%) | 67 (60.4%) |
| 10 to 14 Year Olds | 72 (100.0%) | 0 (0.0%) |
| 15 to 17 Year Olds | 21 (100.0%) | 0 (0.0%) |
| 18 to 19 Year Olds | 0 (0.0%) | 0 (0.0%) |
| 20 to 24 Year Olds | 26 (100.0%) | 0 (0.0%) |
| 25 to 34 Year Olds | 0 (0.0%) | 0 (0.0%) |
| 35 Years and over | 0 (0.0%) | 0 (0.0%) |
| Total | 206 (75.5%) | 67 (24.5%) |
Educational Attainment by Field of Study in Crimora
Business (45 | 49.4%), computers & mathematics (25 | 27.5%), and social sciences (21 | 23.1%) are the most common fields of study among 91 individuals in Crimora who have obtained a bachelor's degree or higher.
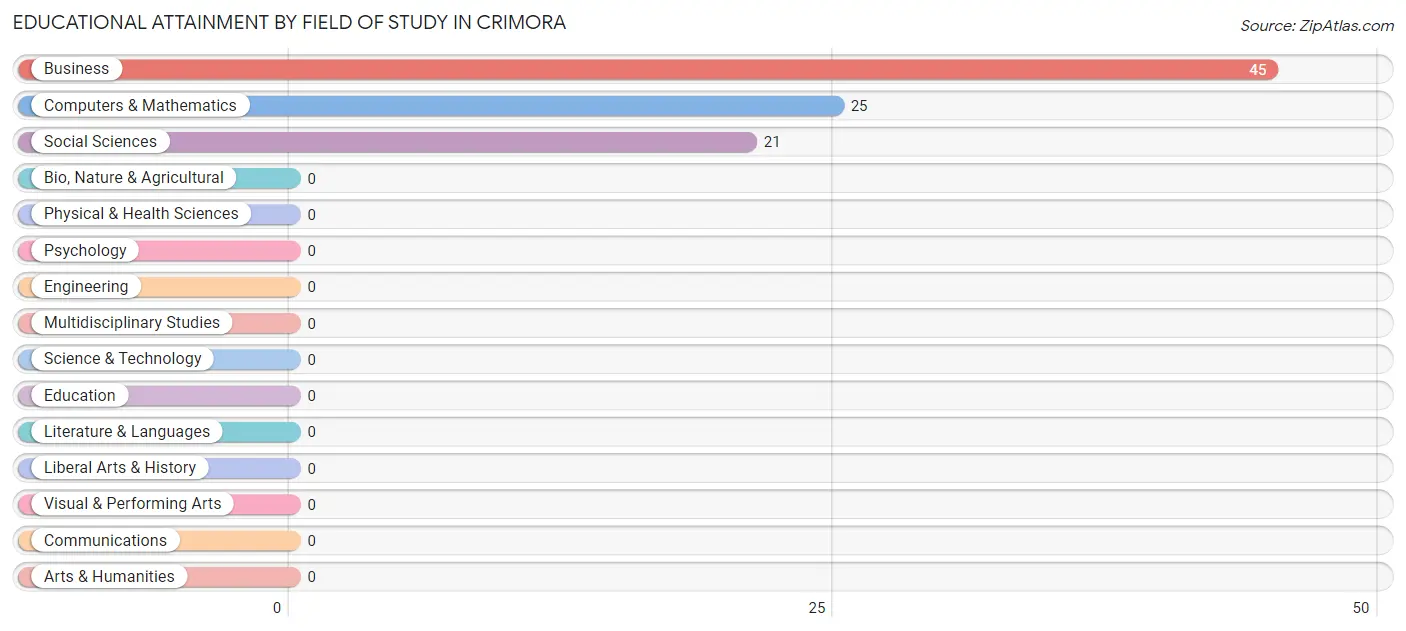
| Field of Study | # Graduates | % Graduates |
| Computers & Mathematics | 25 | 27.5% |
| Bio, Nature & Agricultural | 0 | 0.0% |
| Physical & Health Sciences | 0 | 0.0% |
| Psychology | 0 | 0.0% |
| Social Sciences | 21 | 23.1% |
| Engineering | 0 | 0.0% |
| Multidisciplinary Studies | 0 | 0.0% |
| Science & Technology | 0 | 0.0% |
| Business | 45 | 49.4% |
| Education | 0 | 0.0% |
| Literature & Languages | 0 | 0.0% |
| Liberal Arts & History | 0 | 0.0% |
| Visual & Performing Arts | 0 | 0.0% |
| Communications | 0 | 0.0% |
| Arts & Humanities | 0 | 0.0% |
| Total | 91 | 100.0% |
Transportation & Commute in Crimora
Vehicle Availability by Sex in Crimora
The most prevalent vehicle ownership categories in Crimora are males with 2 vehicles (223, accounting for 40.3%) and females with 2 vehicles (221, making up 55.9%).
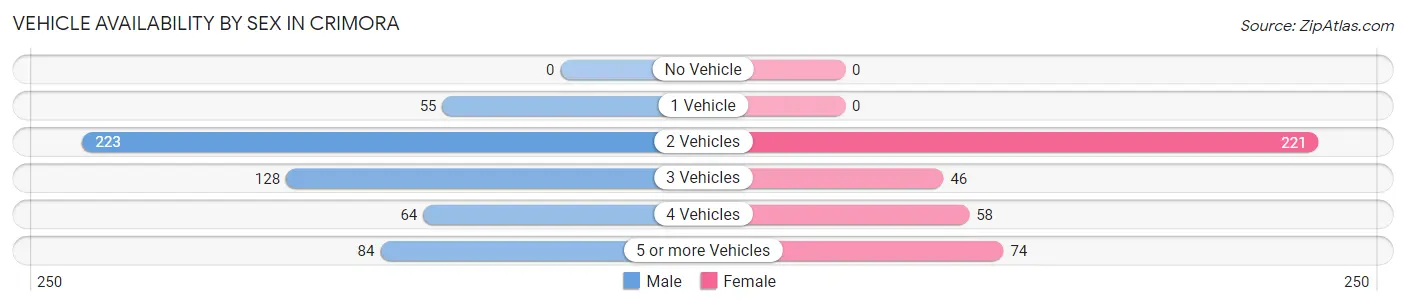
| Vehicles Available | Male | Female |
| No Vehicle | 0 (0.0%) | 0 (0.0%) |
| 1 Vehicle | 55 (9.9%) | 0 (0.0%) |
| 2 Vehicles | 223 (40.3%) | 221 (55.4%) |
| 3 Vehicles | 128 (23.1%) | 46 (11.5%) |
| 4 Vehicles | 64 (11.6%) | 58 (14.5%) |
| 5 or more Vehicles | 84 (15.2%) | 74 (18.5%) |
| Total | 554 (100.0%) | 399 (100.0%) |
Commute Time in Crimora
The most frequently occuring commute durations in Crimora are 20 to 24 minutes (243 commuters, 26.8%), 30 to 34 minutes (153 commuters, 16.9%), and 10 to 14 minutes (133 commuters, 14.7%).
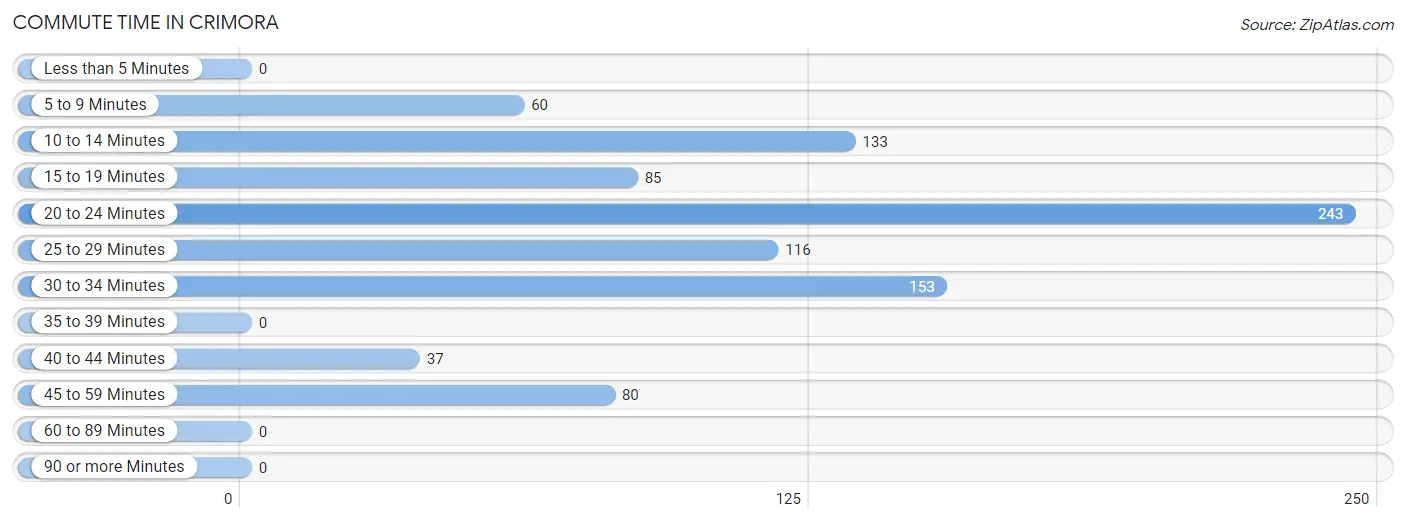
| Commute Time | # Commuters | % Commuters |
| Less than 5 Minutes | 0 | 0.0% |
| 5 to 9 Minutes | 60 | 6.6% |
| 10 to 14 Minutes | 133 | 14.7% |
| 15 to 19 Minutes | 85 | 9.4% |
| 20 to 24 Minutes | 243 | 26.8% |
| 25 to 29 Minutes | 116 | 12.8% |
| 30 to 34 Minutes | 153 | 16.9% |
| 35 to 39 Minutes | 0 | 0.0% |
| 40 to 44 Minutes | 37 | 4.1% |
| 45 to 59 Minutes | 80 | 8.8% |
| 60 to 89 Minutes | 0 | 0.0% |
| 90 or more Minutes | 0 | 0.0% |
Commute Time by Sex in Crimora
The most common commute times in Crimora are 10 to 14 minutes (133 commuters, 26.2%) for males and 20 to 24 minutes (145 commuters, 36.3%) for females.
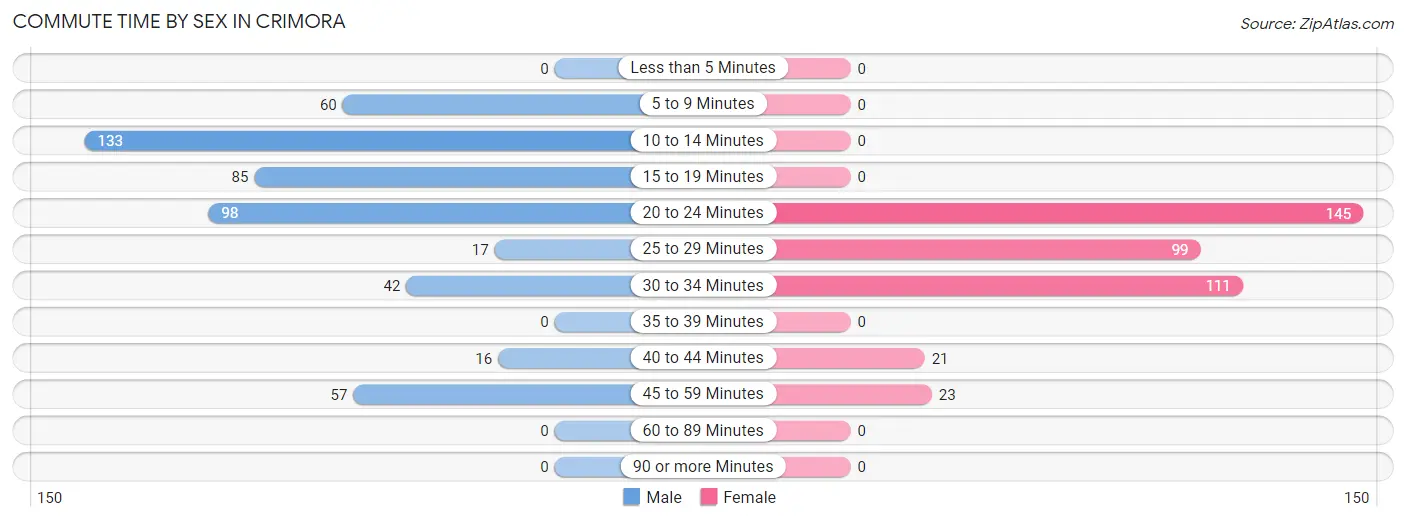
| Commute Time | Male | Female |
| Less than 5 Minutes | 0 (0.0%) | 0 (0.0%) |
| 5 to 9 Minutes | 60 (11.8%) | 0 (0.0%) |
| 10 to 14 Minutes | 133 (26.2%) | 0 (0.0%) |
| 15 to 19 Minutes | 85 (16.7%) | 0 (0.0%) |
| 20 to 24 Minutes | 98 (19.3%) | 145 (36.3%) |
| 25 to 29 Minutes | 17 (3.4%) | 99 (24.8%) |
| 30 to 34 Minutes | 42 (8.3%) | 111 (27.8%) |
| 35 to 39 Minutes | 0 (0.0%) | 0 (0.0%) |
| 40 to 44 Minutes | 16 (3.2%) | 21 (5.3%) |
| 45 to 59 Minutes | 57 (11.2%) | 23 (5.8%) |
| 60 to 89 Minutes | 0 (0.0%) | 0 (0.0%) |
| 90 or more Minutes | 0 (0.0%) | 0 (0.0%) |
Time of Departure to Work by Sex in Crimora
The most frequent times of departure to work in Crimora are 6:30 AM to 6:59 AM (139, 27.4%) for males and 6:30 AM to 6:59 AM (97, 24.3%) for females.
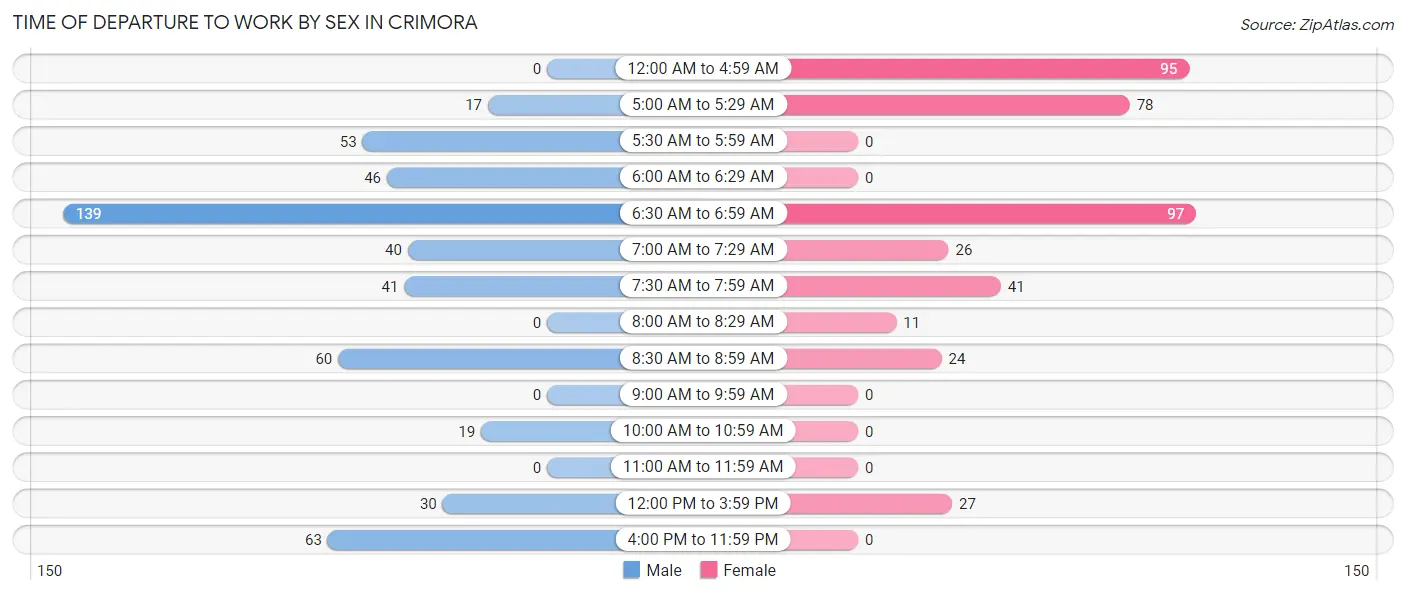
| Time of Departure | Male | Female |
| 12:00 AM to 4:59 AM | 0 (0.0%) | 95 (23.8%) |
| 5:00 AM to 5:29 AM | 17 (3.4%) | 78 (19.6%) |
| 5:30 AM to 5:59 AM | 53 (10.4%) | 0 (0.0%) |
| 6:00 AM to 6:29 AM | 46 (9.1%) | 0 (0.0%) |
| 6:30 AM to 6:59 AM | 139 (27.4%) | 97 (24.3%) |
| 7:00 AM to 7:29 AM | 40 (7.9%) | 26 (6.5%) |
| 7:30 AM to 7:59 AM | 41 (8.1%) | 41 (10.3%) |
| 8:00 AM to 8:29 AM | 0 (0.0%) | 11 (2.8%) |
| 8:30 AM to 8:59 AM | 60 (11.8%) | 24 (6.0%) |
| 9:00 AM to 9:59 AM | 0 (0.0%) | 0 (0.0%) |
| 10:00 AM to 10:59 AM | 19 (3.7%) | 0 (0.0%) |
| 11:00 AM to 11:59 AM | 0 (0.0%) | 0 (0.0%) |
| 12:00 PM to 3:59 PM | 30 (5.9%) | 27 (6.8%) |
| 4:00 PM to 11:59 PM | 63 (12.4%) | 0 (0.0%) |
| Total | 508 (100.0%) | 399 (100.0%) |
Housing Occupancy in Crimora
Occupancy by Ownership in Crimora
Of the total 811 dwellings in Crimora, owner-occupied units account for 725 (89.4%), while renter-occupied units make up 86 (10.6%).
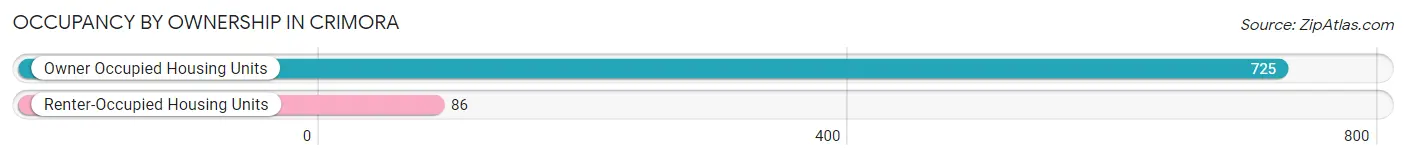
| Occupancy | # Housing Units | % Housing Units |
| Owner Occupied Housing Units | 725 | 89.4% |
| Renter-Occupied Housing Units | 86 | 10.6% |
| Total Occupied Housing Units | 811 | 100.0% |
Occupancy by Household Size in Crimora
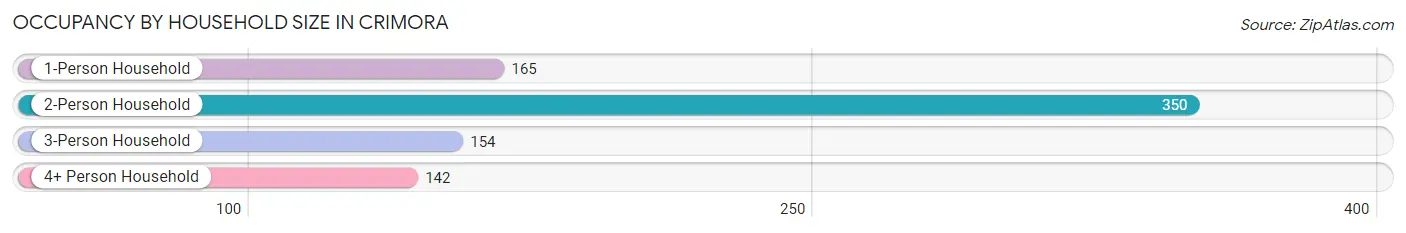
| Household Size | # Housing Units | % Housing Units |
| 1-Person Household | 165 | 20.3% |
| 2-Person Household | 350 | 43.2% |
| 3-Person Household | 154 | 19.0% |
| 4+ Person Household | 142 | 17.5% |
| Total Housing Units | 811 | 100.0% |
Occupancy by Ownership by Household Size in Crimora
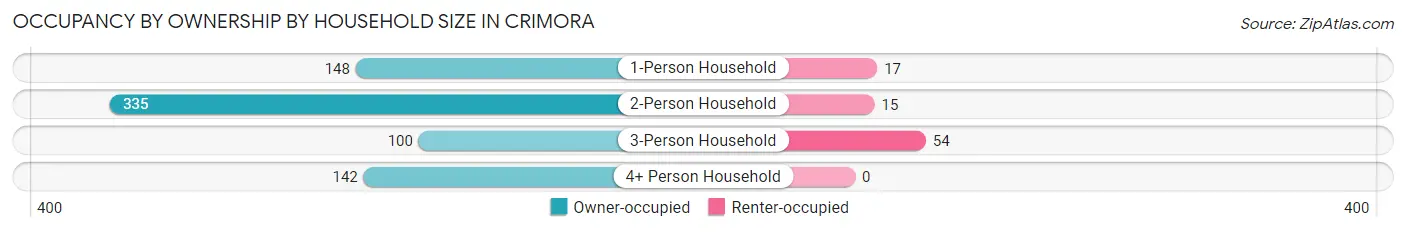
| Household Size | Owner-occupied | Renter-occupied |
| 1-Person Household | 148 (89.7%) | 17 (10.3%) |
| 2-Person Household | 335 (95.7%) | 15 (4.3%) |
| 3-Person Household | 100 (64.9%) | 54 (35.1%) |
| 4+ Person Household | 142 (100.0%) | 0 (0.0%) |
| Total Housing Units | 725 (89.4%) | 86 (10.6%) |
Occupancy by Educational Attainment in Crimora
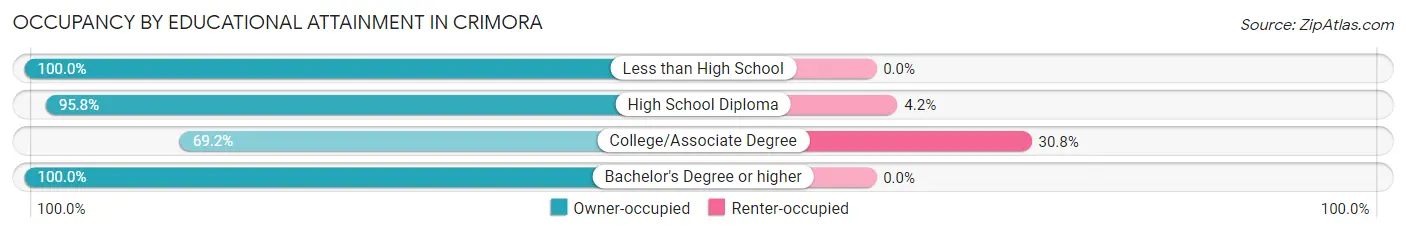
| Household Size | Owner-occupied | Renter-occupied |
| Less than High School | 124 (100.0%) | 0 (0.0%) |
| High School Diploma | 387 (95.8%) | 17 (4.2%) |
| College/Associate Degree | 155 (69.2%) | 69 (30.8%) |
| Bachelor's Degree or higher | 59 (100.0%) | 0 (0.0%) |
Occupancy by Age of Householder in Crimora
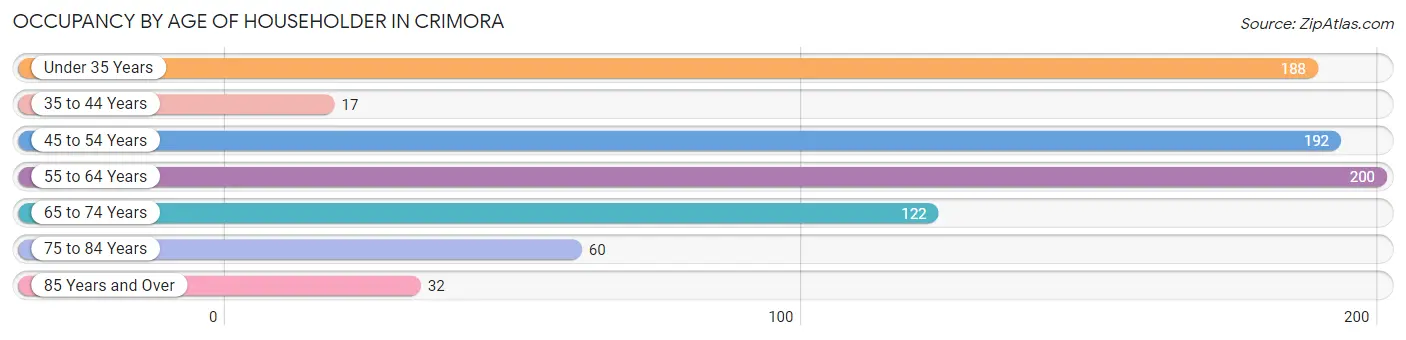
| Age Bracket | # Households | % Households |
| Under 35 Years | 188 | 23.2% |
| 35 to 44 Years | 17 | 2.1% |
| 45 to 54 Years | 192 | 23.7% |
| 55 to 64 Years | 200 | 24.7% |
| 65 to 74 Years | 122 | 15.0% |
| 75 to 84 Years | 60 | 7.4% |
| 85 Years and Over | 32 | 4.0% |
| Total | 811 | 100.0% |
Housing Finances in Crimora
Median Income by Occupancy in Crimora
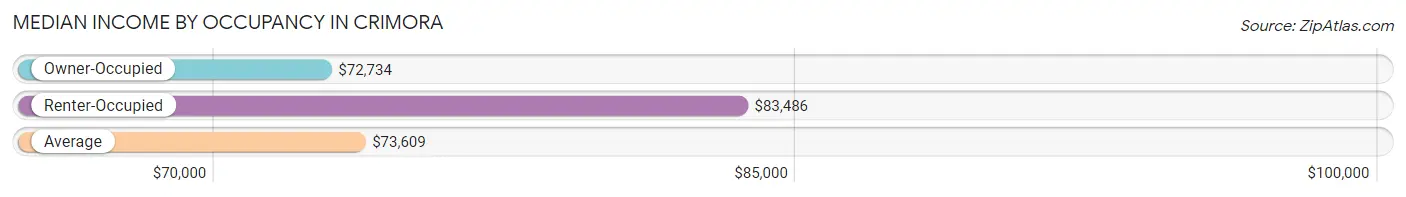
| Occupancy Type | # Households | Median Income |
| Owner-Occupied | 725 (89.4%) | $72,734 |
| Renter-Occupied | 86 (10.6%) | $83,486 |
| Average | 811 (100.0%) | $73,609 |
Occupancy by Householder Income Bracket in Crimora
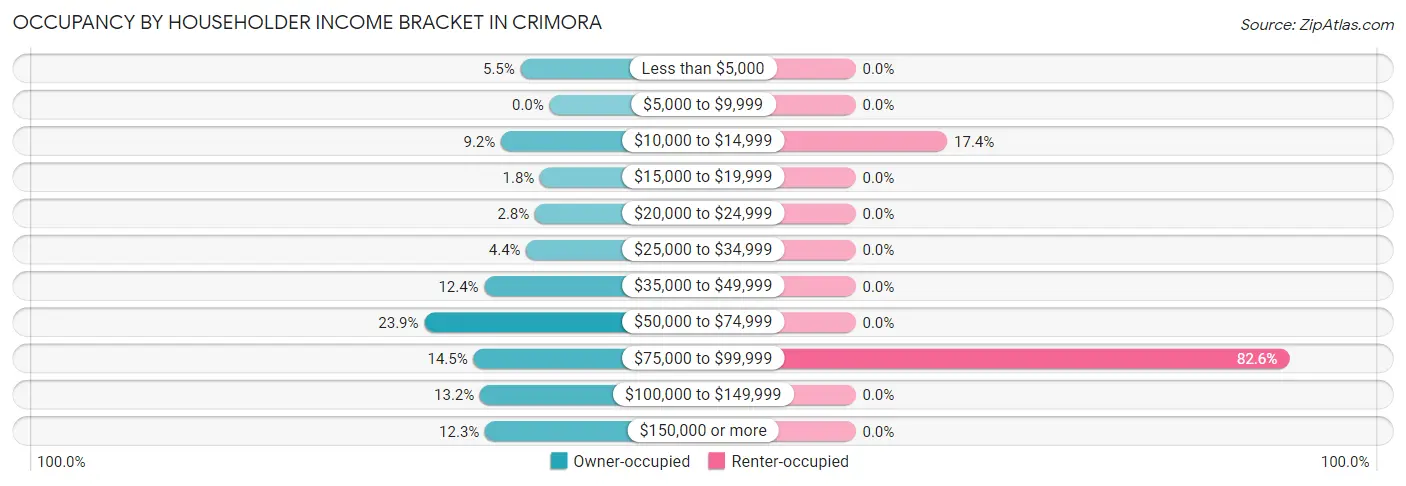
| Income Bracket | Owner-occupied | Renter-occupied |
| Less than $5,000 | 40 (5.5%) | 0 (0.0%) |
| $5,000 to $9,999 | 0 (0.0%) | 0 (0.0%) |
| $10,000 to $14,999 | 67 (9.2%) | 15 (17.4%) |
| $15,000 to $19,999 | 13 (1.8%) | 0 (0.0%) |
| $20,000 to $24,999 | 20 (2.8%) | 0 (0.0%) |
| $25,000 to $34,999 | 32 (4.4%) | 0 (0.0%) |
| $35,000 to $49,999 | 90 (12.4%) | 0 (0.0%) |
| $50,000 to $74,999 | 173 (23.9%) | 0 (0.0%) |
| $75,000 to $99,999 | 105 (14.5%) | 71 (82.6%) |
| $100,000 to $149,999 | 96 (13.2%) | 0 (0.0%) |
| $150,000 or more | 89 (12.3%) | 0 (0.0%) |
| Total | 725 (100.0%) | 86 (100.0%) |
Monthly Housing Cost Tiers in Crimora
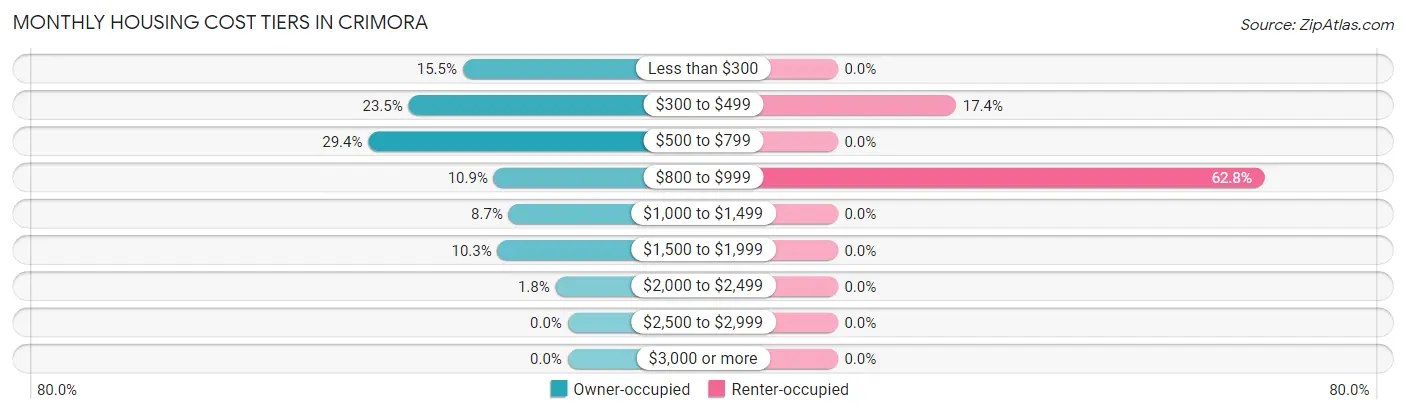
| Monthly Cost | Owner-occupied | Renter-occupied |
| Less than $300 | 112 (15.4%) | 0 (0.0%) |
| $300 to $499 | 170 (23.4%) | 15 (17.4%) |
| $500 to $799 | 213 (29.4%) | 0 (0.0%) |
| $800 to $999 | 79 (10.9%) | 54 (62.8%) |
| $1,000 to $1,499 | 63 (8.7%) | 0 (0.0%) |
| $1,500 to $1,999 | 75 (10.3%) | 0 (0.0%) |
| $2,000 to $2,499 | 13 (1.8%) | 0 (0.0%) |
| $2,500 to $2,999 | 0 (0.0%) | 0 (0.0%) |
| $3,000 or more | 0 (0.0%) | 0 (0.0%) |
| Total | 725 (100.0%) | 86 (100.0%) |
Physical Housing Characteristics in Crimora
Housing Structures in Crimora
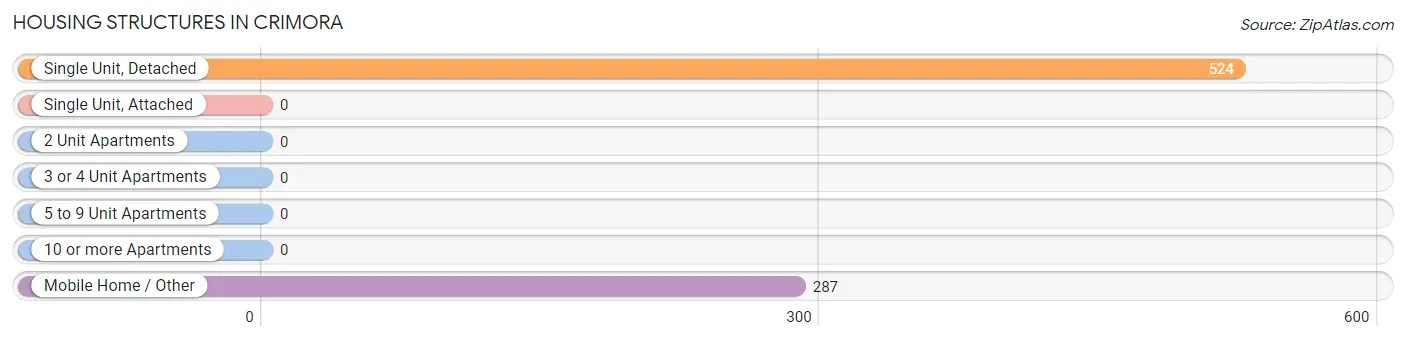
| Structure Type | # Housing Units | % Housing Units |
| Single Unit, Detached | 524 | 64.6% |
| Single Unit, Attached | 0 | 0.0% |
| 2 Unit Apartments | 0 | 0.0% |
| 3 or 4 Unit Apartments | 0 | 0.0% |
| 5 to 9 Unit Apartments | 0 | 0.0% |
| 10 or more Apartments | 0 | 0.0% |
| Mobile Home / Other | 287 | 35.4% |
| Total | 811 | 100.0% |
Housing Structures by Occupancy in Crimora
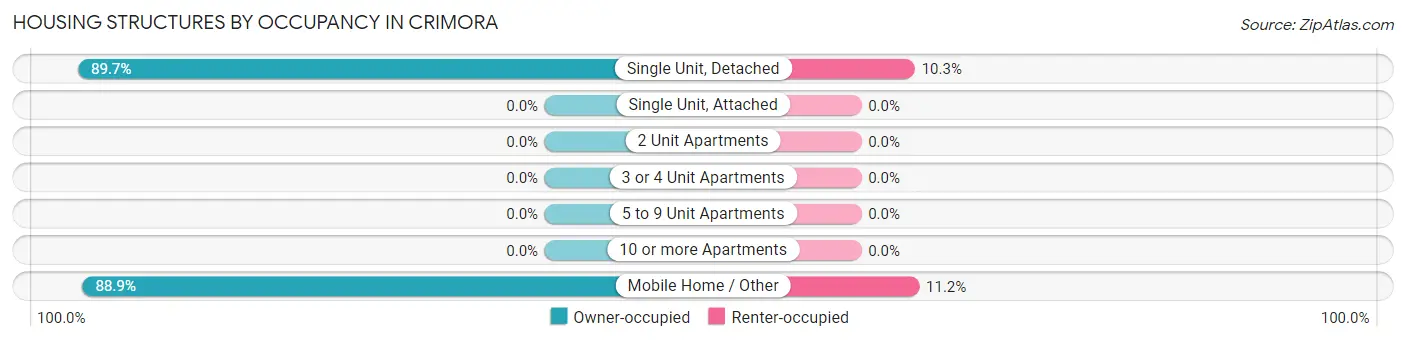
| Structure Type | Owner-occupied | Renter-occupied |
| Single Unit, Detached | 470 (89.7%) | 54 (10.3%) |
| Single Unit, Attached | 0 (0.0%) | 0 (0.0%) |
| 2 Unit Apartments | 0 (0.0%) | 0 (0.0%) |
| 3 or 4 Unit Apartments | 0 (0.0%) | 0 (0.0%) |
| 5 to 9 Unit Apartments | 0 (0.0%) | 0 (0.0%) |
| 10 or more Apartments | 0 (0.0%) | 0 (0.0%) |
| Mobile Home / Other | 255 (88.8%) | 32 (11.2%) |
| Total | 725 (89.4%) | 86 (10.6%) |
Housing Structures by Number of Rooms in Crimora
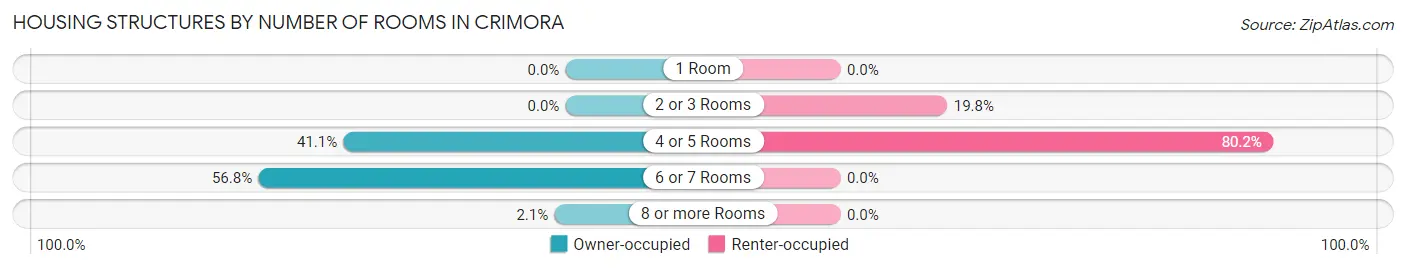
| Number of Rooms | Owner-occupied | Renter-occupied |
| 1 Room | 0 (0.0%) | 0 (0.0%) |
| 2 or 3 Rooms | 0 (0.0%) | 17 (19.8%) |
| 4 or 5 Rooms | 298 (41.1%) | 69 (80.2%) |
| 6 or 7 Rooms | 412 (56.8%) | 0 (0.0%) |
| 8 or more Rooms | 15 (2.1%) | 0 (0.0%) |
| Total | 725 (100.0%) | 86 (100.0%) |
Housing Structure by Heating Type in Crimora
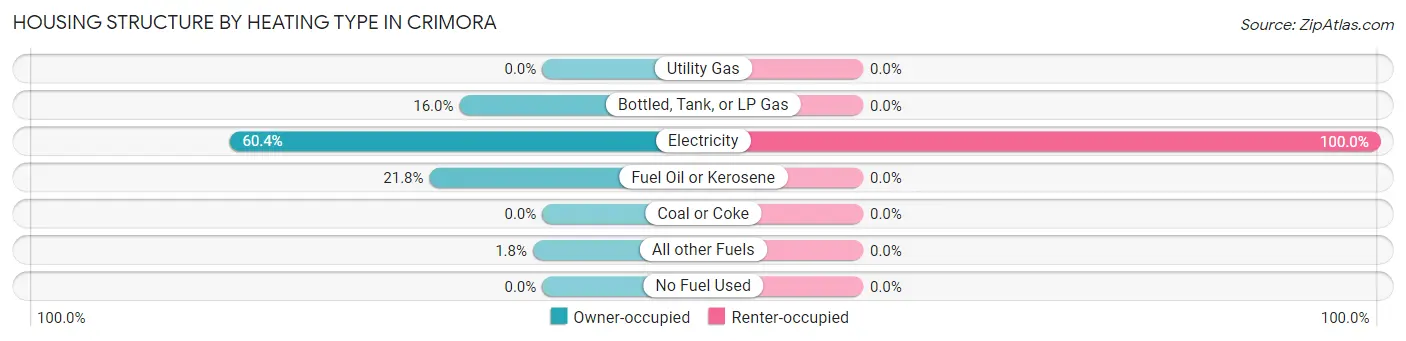
| Heating Type | Owner-occupied | Renter-occupied |
| Utility Gas | 0 (0.0%) | 0 (0.0%) |
| Bottled, Tank, or LP Gas | 116 (16.0%) | 0 (0.0%) |
| Electricity | 438 (60.4%) | 86 (100.0%) |
| Fuel Oil or Kerosene | 158 (21.8%) | 0 (0.0%) |
| Coal or Coke | 0 (0.0%) | 0 (0.0%) |
| All other Fuels | 13 (1.8%) | 0 (0.0%) |
| No Fuel Used | 0 (0.0%) | 0 (0.0%) |
| Total | 725 (100.0%) | 86 (100.0%) |
Household Vehicle Usage in Crimora
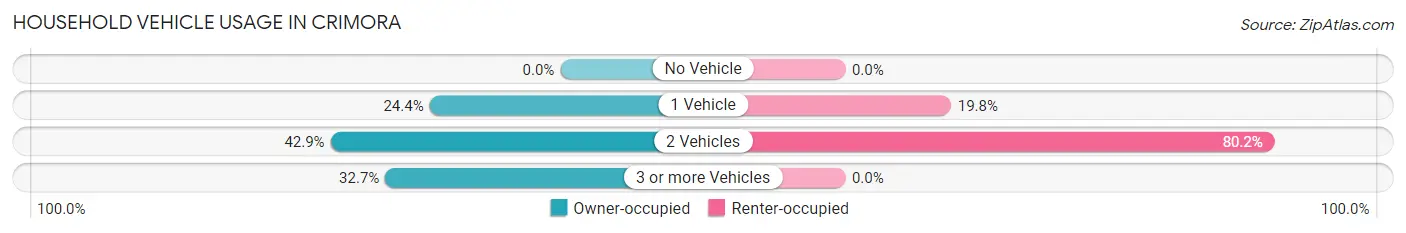
| Vehicles per Household | Owner-occupied | Renter-occupied |
| No Vehicle | 0 (0.0%) | 0 (0.0%) |
| 1 Vehicle | 177 (24.4%) | 17 (19.8%) |
| 2 Vehicles | 311 (42.9%) | 69 (80.2%) |
| 3 or more Vehicles | 237 (32.7%) | 0 (0.0%) |
| Total | 725 (100.0%) | 86 (100.0%) |
Real Estate & Mortgages in Crimora
Real Estate and Mortgage Overview in Crimora
| Characteristic | Without Mortgage | With Mortgage |
| Housing Units | 467 | 258 |
| Median Property Value | $176,500 | $210,400 |
| Median Household Income | $72,891 | $64 |
| Monthly Housing Costs | $469 | $0 |
| Real Estate Taxes | $706 | $0 |
Property Value by Mortgage Status in Crimora
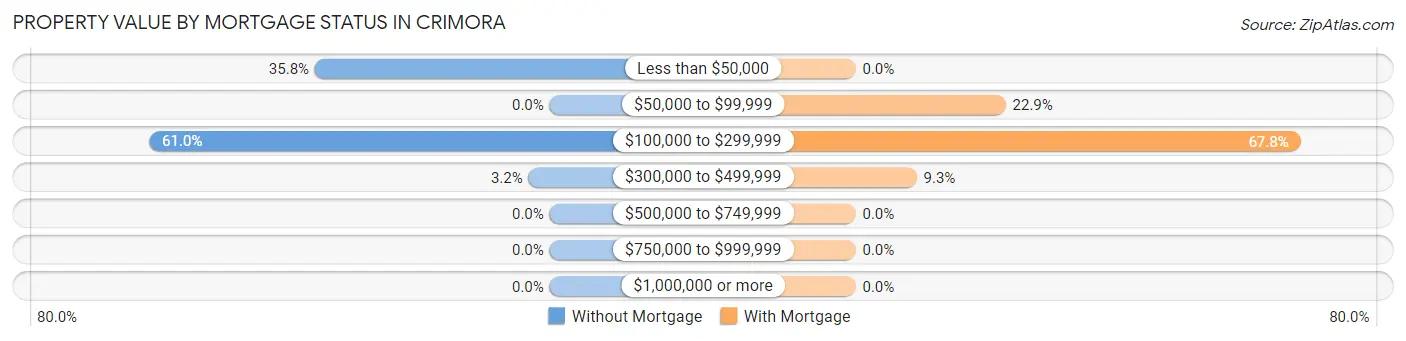
| Property Value | Without Mortgage | With Mortgage |
| Less than $50,000 | 167 (35.8%) | 0 (0.0%) |
| $50,000 to $99,999 | 0 (0.0%) | 59 (22.9%) |
| $100,000 to $299,999 | 285 (61.0%) | 175 (67.8%) |
| $300,000 to $499,999 | 15 (3.2%) | 24 (9.3%) |
| $500,000 to $749,999 | 0 (0.0%) | 0 (0.0%) |
| $750,000 to $999,999 | 0 (0.0%) | 0 (0.0%) |
| $1,000,000 or more | 0 (0.0%) | 0 (0.0%) |
| Total | 467 (100.0%) | 258 (100.0%) |
Household Income by Mortgage Status in Crimora
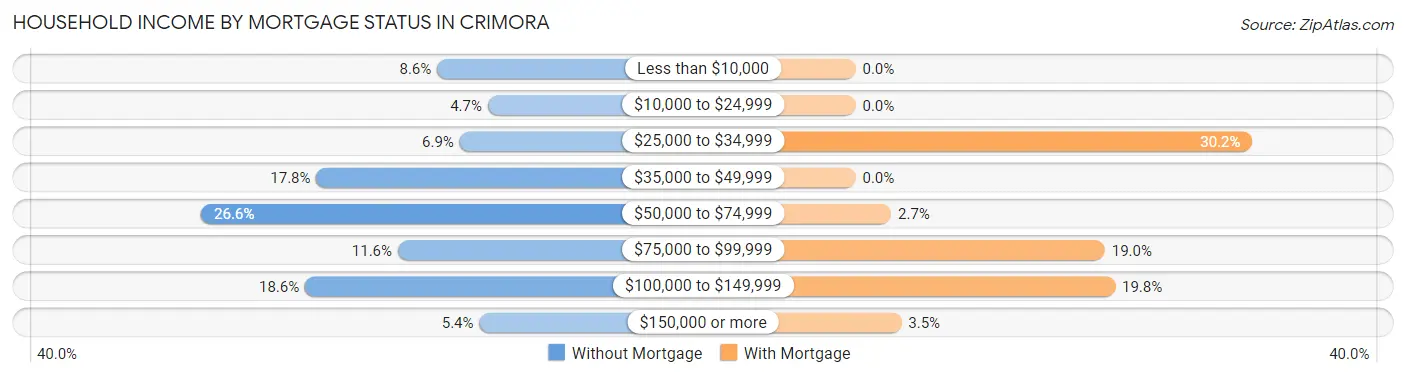
| Household Income | Without Mortgage | With Mortgage |
| Less than $10,000 | 40 (8.6%) | 0 (0.0%) |
| $10,000 to $24,999 | 22 (4.7%) | 0 (0.0%) |
| $25,000 to $34,999 | 32 (6.9%) | 78 (30.2%) |
| $35,000 to $49,999 | 83 (17.8%) | 0 (0.0%) |
| $50,000 to $74,999 | 124 (26.6%) | 7 (2.7%) |
| $75,000 to $99,999 | 54 (11.6%) | 49 (19.0%) |
| $100,000 to $149,999 | 87 (18.6%) | 51 (19.8%) |
| $150,000 or more | 25 (5.3%) | 9 (3.5%) |
| Total | 467 (100.0%) | 258 (100.0%) |
Property Value to Household Income Ratio in Crimora
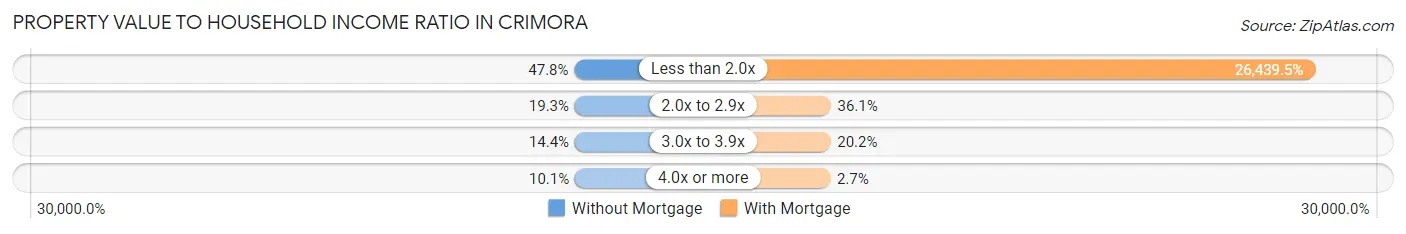
| Value-to-Income Ratio | Without Mortgage | With Mortgage |
| Less than 2.0x | 223 (47.7%) | 68,214 (26,439.5%) |
| 2.0x to 2.9x | 90 (19.3%) | 93 (36.0%) |
| 3.0x to 3.9x | 67 (14.3%) | 52 (20.2%) |
| 4.0x or more | 47 (10.1%) | 7 (2.7%) |
| Total | 467 (100.0%) | 258 (100.0%) |
Real Estate Taxes by Mortgage Status in Crimora
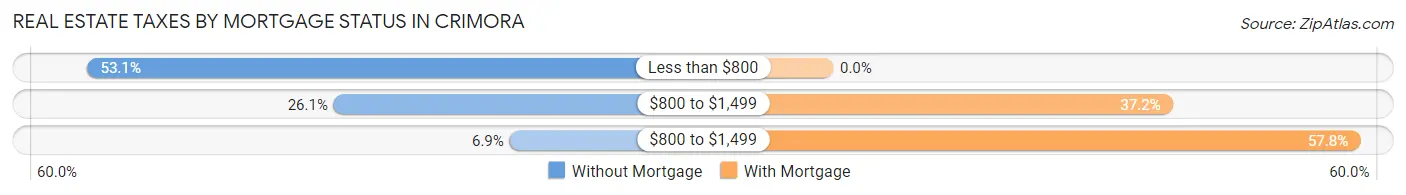
| Property Taxes | Without Mortgage | With Mortgage |
| Less than $800 | 248 (53.1%) | 0 (0.0%) |
| $800 to $1,499 | 122 (26.1%) | 96 (37.2%) |
| $800 to $1,499 | 32 (6.9%) | 149 (57.8%) |
| Total | 467 (100.0%) | 258 (100.0%) |
Health & Disability in Crimora
Health Insurance Coverage by Age in Crimora
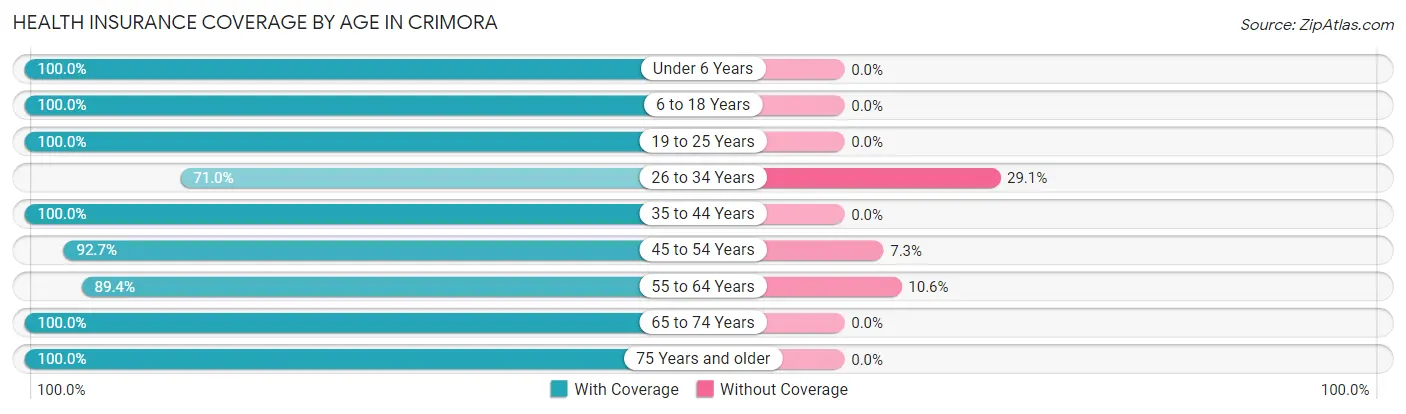
| Age Bracket | With Coverage | Without Coverage |
| Under 6 Years | 284 (100.0%) | 0 (0.0%) |
| 6 to 18 Years | 128 (100.0%) | 0 (0.0%) |
| 19 to 25 Years | 174 (100.0%) | 0 (0.0%) |
| 26 to 34 Years | 254 (71.0%) | 104 (29.0%) |
| 35 to 44 Years | 46 (100.0%) | 0 (0.0%) |
| 45 to 54 Years | 306 (92.7%) | 24 (7.3%) |
| 55 to 64 Years | 336 (89.4%) | 40 (10.6%) |
| 65 to 74 Years | 188 (100.0%) | 0 (0.0%) |
| 75 Years and older | 133 (100.0%) | 0 (0.0%) |
| Total | 1,849 (91.7%) | 168 (8.3%) |
Health Insurance Coverage by Citizenship Status in Crimora
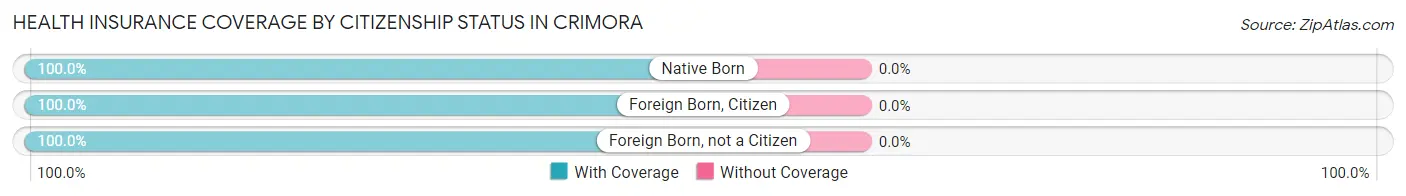
| Citizenship Status | With Coverage | Without Coverage |
| Native Born | 284 (100.0%) | 0 (0.0%) |
| Foreign Born, Citizen | 128 (100.0%) | 0 (0.0%) |
| Foreign Born, not a Citizen | 174 (100.0%) | 0 (0.0%) |
Health Insurance Coverage by Household Income in Crimora
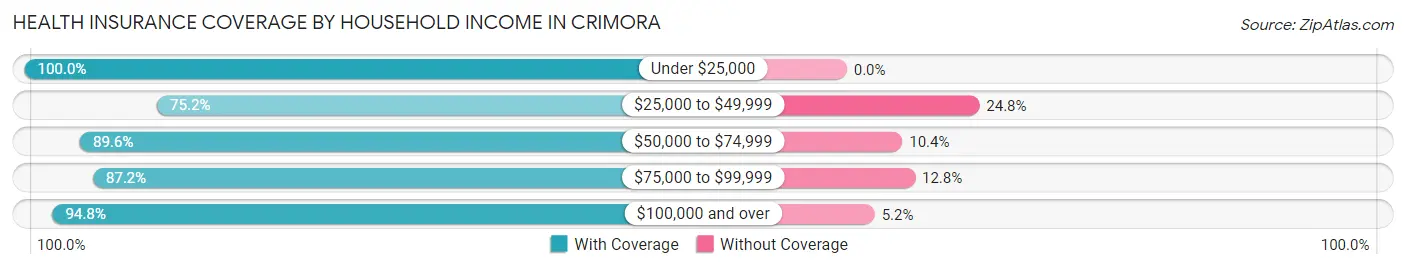
| Household Income | With Coverage | Without Coverage |
| Under $25,000 | 505 (100.0%) | 0 (0.0%) |
| $25,000 to $49,999 | 121 (75.2%) | 40 (24.8%) |
| $50,000 to $74,999 | 379 (89.6%) | 44 (10.4%) |
| $75,000 to $99,999 | 409 (87.2%) | 60 (12.8%) |
| $100,000 and over | 435 (94.8%) | 24 (5.2%) |
Public vs Private Health Insurance Coverage by Age in Crimora
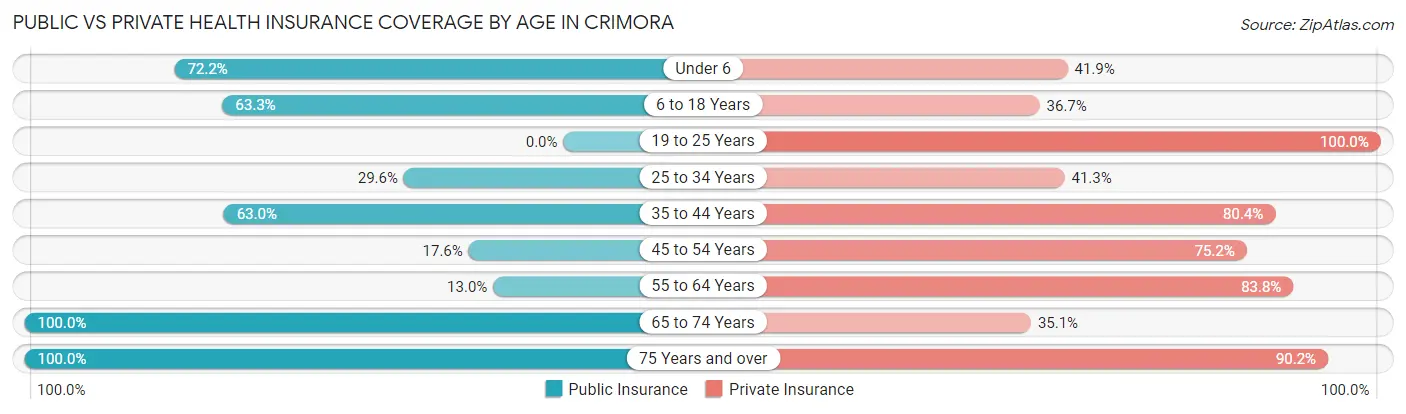
| Age Bracket | Public Insurance | Private Insurance |
| Under 6 | 205 (72.2%) | 119 (41.9%) |
| 6 to 18 Years | 81 (63.3%) | 47 (36.7%) |
| 19 to 25 Years | 0 (0.0%) | 174 (100.0%) |
| 25 to 34 Years | 106 (29.6%) | 148 (41.3%) |
| 35 to 44 Years | 29 (63.0%) | 37 (80.4%) |
| 45 to 54 Years | 58 (17.6%) | 248 (75.1%) |
| 55 to 64 Years | 49 (13.0%) | 315 (83.8%) |
| 65 to 74 Years | 188 (100.0%) | 66 (35.1%) |
| 75 Years and over | 133 (100.0%) | 120 (90.2%) |
| Total | 849 (42.1%) | 1,274 (63.2%) |
Disability Status by Sex by Age in Crimora
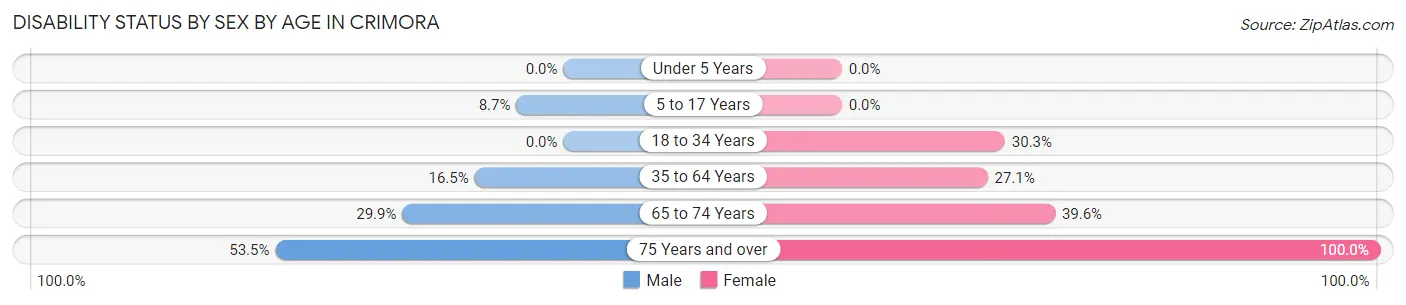
| Age Bracket | Male | Female |
| Under 5 Years | 0 (0.0%) | 0 (0.0%) |
| 5 to 17 Years | 9 (8.7%) | 0 (0.0%) |
| 18 to 34 Years | 0 (0.0%) | 89 (30.3%) |
| 35 to 64 Years | 60 (16.5%) | 105 (27.1%) |
| 65 to 74 Years | 29 (29.9%) | 36 (39.6%) |
| 75 Years and over | 54 (53.5%) | 32 (100.0%) |
Disability Class by Sex by Age in Crimora
Disability Class: Hearing Difficulty
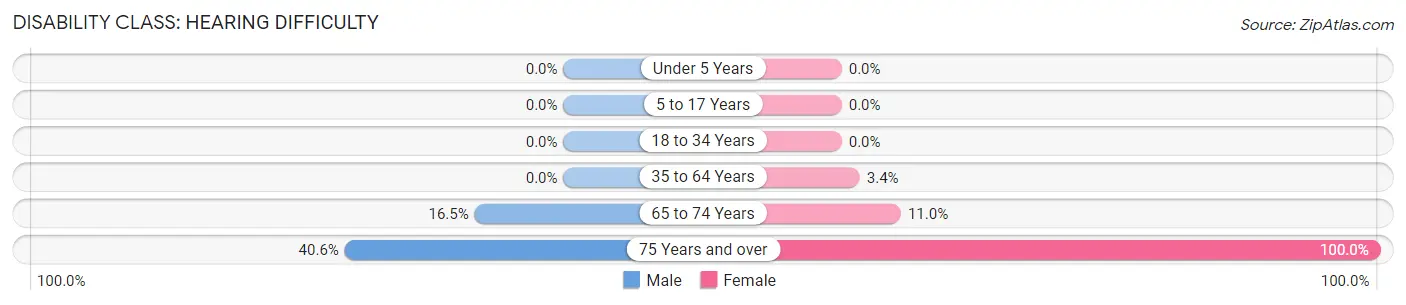
| Age Bracket | Male | Female |
| Under 5 Years | 0 (0.0%) | 0 (0.0%) |
| 5 to 17 Years | 0 (0.0%) | 0 (0.0%) |
| 18 to 34 Years | 0 (0.0%) | 0 (0.0%) |
| 35 to 64 Years | 0 (0.0%) | 13 (3.4%) |
| 65 to 74 Years | 16 (16.5%) | 10 (11.0%) |
| 75 Years and over | 41 (40.6%) | 32 (100.0%) |
Disability Class: Vision Difficulty
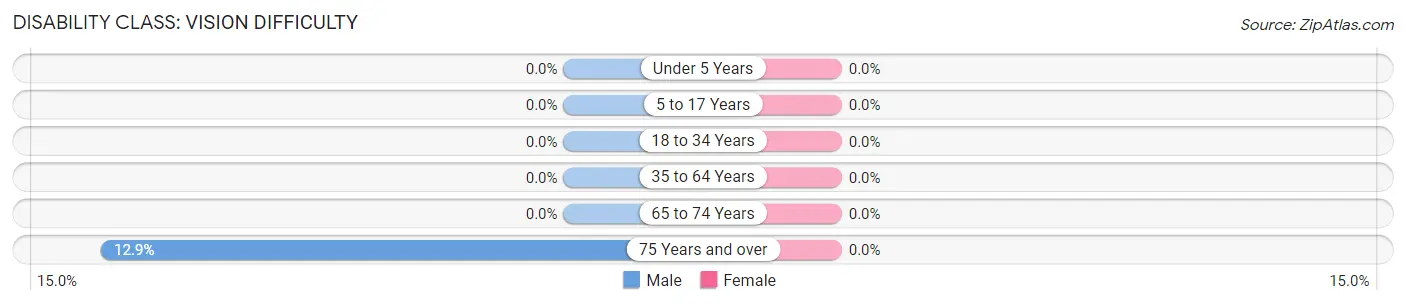
| Age Bracket | Male | Female |
| Under 5 Years | 0 (0.0%) | 0 (0.0%) |
| 5 to 17 Years | 0 (0.0%) | 0 (0.0%) |
| 18 to 34 Years | 0 (0.0%) | 0 (0.0%) |
| 35 to 64 Years | 0 (0.0%) | 0 (0.0%) |
| 65 to 74 Years | 0 (0.0%) | 0 (0.0%) |
| 75 Years and over | 13 (12.9%) | 0 (0.0%) |
Disability Class: Cognitive Difficulty
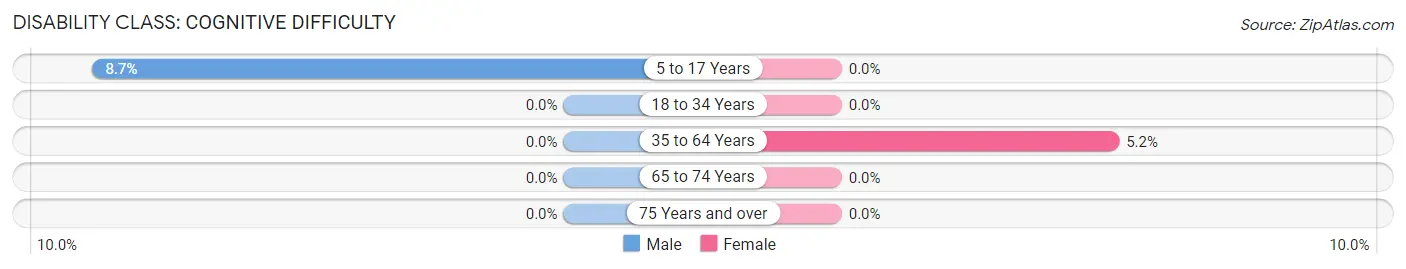
| Age Bracket | Male | Female |
| 5 to 17 Years | 9 (8.7%) | 0 (0.0%) |
| 18 to 34 Years | 0 (0.0%) | 0 (0.0%) |
| 35 to 64 Years | 0 (0.0%) | 20 (5.1%) |
| 65 to 74 Years | 0 (0.0%) | 0 (0.0%) |
| 75 Years and over | 0 (0.0%) | 0 (0.0%) |
Disability Class: Ambulatory Difficulty
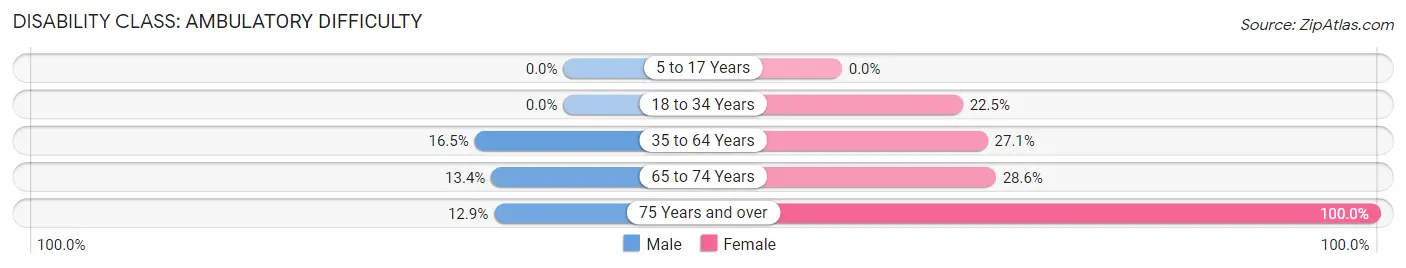
| Age Bracket | Male | Female |
| 5 to 17 Years | 0 (0.0%) | 0 (0.0%) |
| 18 to 34 Years | 0 (0.0%) | 66 (22.5%) |
| 35 to 64 Years | 60 (16.5%) | 105 (27.1%) |
| 65 to 74 Years | 13 (13.4%) | 26 (28.6%) |
| 75 Years and over | 13 (12.9%) | 32 (100.0%) |
Disability Class: Self-Care Difficulty
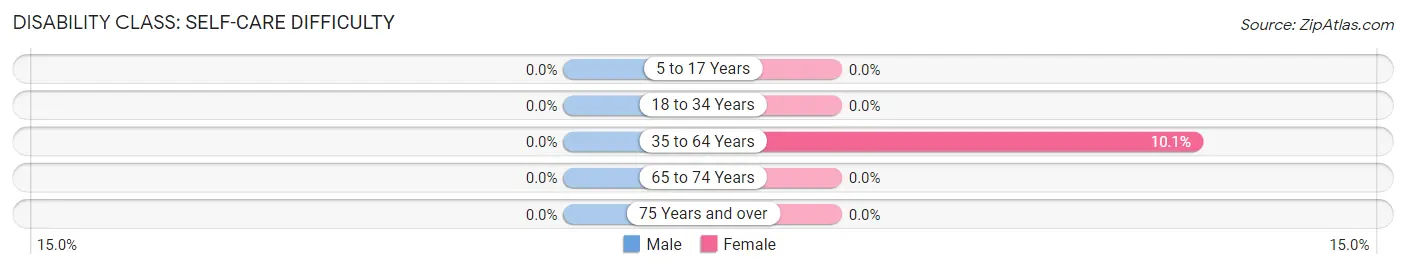
| Age Bracket | Male | Female |
| 5 to 17 Years | 0 (0.0%) | 0 (0.0%) |
| 18 to 34 Years | 0 (0.0%) | 0 (0.0%) |
| 35 to 64 Years | 0 (0.0%) | 39 (10.1%) |
| 65 to 74 Years | 0 (0.0%) | 0 (0.0%) |
| 75 Years and over | 0 (0.0%) | 0 (0.0%) |
Technology Access in Crimora
Computing Device Access in Crimora
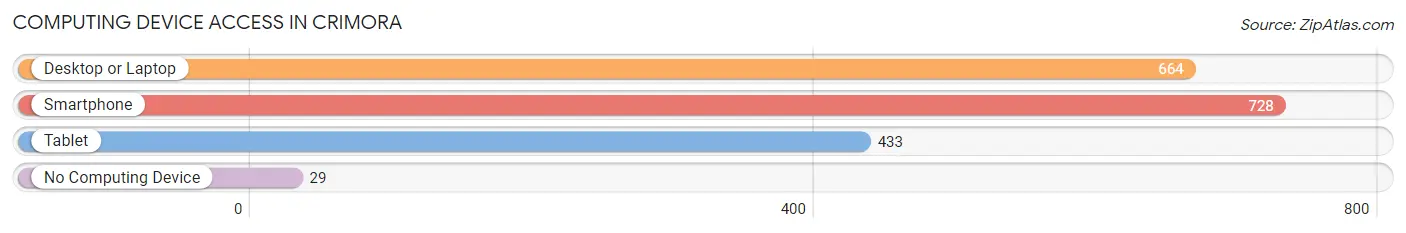
| Device Type | # Households | % Households |
| Desktop or Laptop | 664 | 81.9% |
| Smartphone | 728 | 89.8% |
| Tablet | 433 | 53.4% |
| No Computing Device | 29 | 3.6% |
| Total | 811 | 100.0% |
Internet Access in Crimora
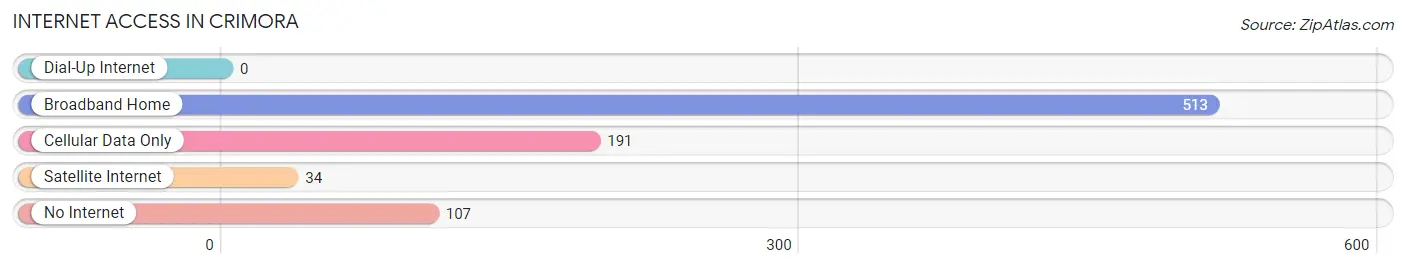
| Internet Type | # Households | % Households |
| Dial-Up Internet | 0 | 0.0% |
| Broadband Home | 513 | 63.3% |
| Cellular Data Only | 191 | 23.5% |
| Satellite Internet | 34 | 4.2% |
| No Internet | 107 | 13.2% |
| Total | 811 | 100.0% |
Crimora Summary
Crimora is an unincorporated community located in Augusta County, Virginia. It is situated in the Shenandoah Valley, approximately 10 miles north of Staunton and 15 miles south of Harrisonburg. The population of Crimora was 1,845 at the 2010 census.
History
The area that is now Crimora was first settled in the late 1700s by German immigrants. The town was originally known as “Crim’s Ford” after the family that owned the land. In 1883, the name was changed to Crimora. The town was officially incorporated in 1891.
Crimora was a small farming community until the early 1900s when the Chesapeake and Ohio Railway (C&O) built a line through the town. This allowed for the development of a small industrial district, which included a brickyard, a sawmill, and a gristmill. The town also had a post office, a general store, and a hotel.
In the early 1900s, Crimora was a popular destination for tourists. The town was known for its mineral springs, which were believed to have healing properties. The springs were a popular attraction until the 1950s when they were closed due to pollution.
Geography
Crimora is located in the Shenandoah Valley, approximately 10 miles north of Staunton and 15 miles south of Harrisonburg. The town is situated on the banks of the South River, which is a tributary of the Shenandoah River. The town is surrounded by rolling hills and mountains.
The climate in Crimora is temperate, with hot summers and cold winters. The average annual temperature is 54°F (12°C). The average annual precipitation is 40 inches (101 cm).
Economy
The economy of Crimora is largely based on agriculture and tourism. The town is home to several farms, which produce a variety of crops, including corn, soybeans, and hay. The town is also home to several wineries, which produce a variety of wines.
Tourism is an important part of the economy of Crimora. The town is home to several historic sites, including the Crimora Mineral Springs, the Crimora Covered Bridge, and the Crimora Historic District. The town is also home to several outdoor recreation areas, including the Crimora Lake Recreation Area and the Crimora Wildlife Management Area.
Demographics
As of the 2010 census, the population of Crimora was 1,845. The racial makeup of the town was 94.3% White, 2.2% African American, 0.3% Native American, 0.7% Asian, 0.1% Pacific Islander, 0.7% from other races, and 1.7% from two or more races. Hispanic or Latino of any race were 2.2% of the population.
The median household income in Crimora was $41,250, and the median family income was $50,000. The per capita income was $20,945. About 11.2% of families and 14.2% of the population were below the poverty line, including 18.2% of those under age 18 and 8.3% of those age 65 or over.
Common Questions
What is Per Capita Income in Crimora?
Per Capita income in Crimora is $31,140.
What is the Median Family Income in Crimora?
Median Family Income in Crimora is $73,359.
What is the Median Household income in Crimora?
Median Household Income in Crimora is $73,609.
What is Income or Wage Gap in Crimora?
Income or Wage Gap in Crimora is 37.5%.
Women in Crimora earn 62.5 cents for every dollar earned by a man.
What is Family Income Deficit in Crimora?
Family Income Deficit in Crimora is $16,571.
Families that are below poverty line in Crimora earn $16,571 less on average than the poverty threshold level.
What is Inequality or Gini Index in Crimora?
Inequality or Gini Index in Crimora is 0.37.
What is the Total Population of Crimora?
Total Population of Crimora is 2,017.
What is the Total Male Population of Crimora?
Total Male Population of Crimora is 997.
What is the Total Female Population of Crimora?
Total Female Population of Crimora is 1,020.
What is the Ratio of Males per 100 Females in Crimora?
There are 97.75 Males per 100 Females in Crimora.
What is the Ratio of Females per 100 Males in Crimora?
There are 102.31 Females per 100 Males in Crimora.
What is the Median Population Age in Crimora?
Median Population Age in Crimora is 47.5 Years.
What is the Average Family Size in Crimora
Average Family Size in Crimora is 2.7 People.
What is the Average Household Size in Crimora
Average Household Size in Crimora is 2.5 People.
How Large is the Labor Force in Crimora?
There are 1,015 People in the Labor Forcein in Crimora.
What is the Percentage of People in the Labor Force in Crimora?
62.4% of People are in the Labor Force in Crimora.
What is the Unemployment Rate in Crimora?
Unemployment Rate in Crimora is 6.0%.