Orange, VA Map & Demographics
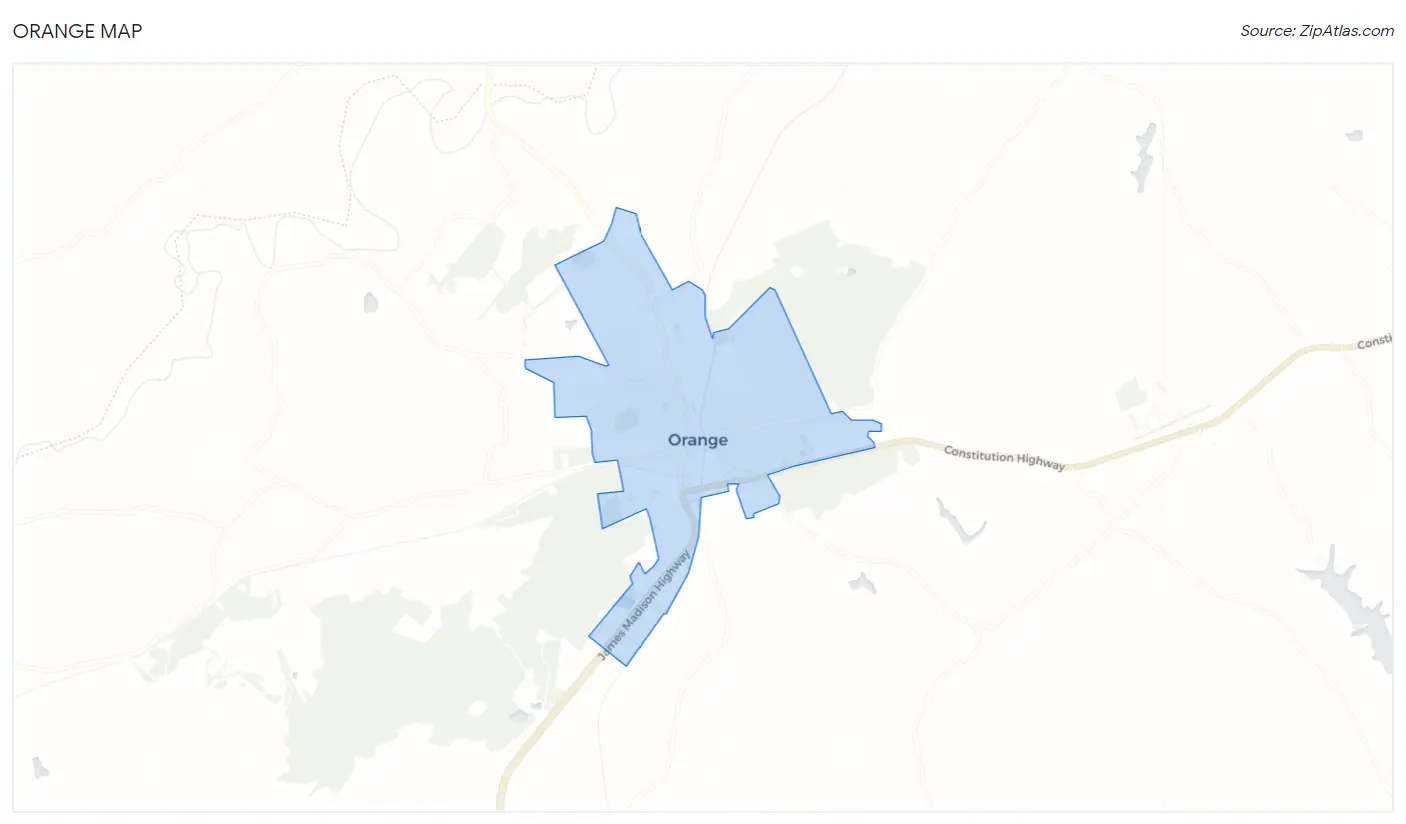
Orange Map
Orange Overview
$27,315
PER CAPITA INCOME
$78,685
AVG FAMILY INCOME
$59,196
AVG HOUSEHOLD INCOME
25.3%
WAGE / INCOME GAP [ % ]
74.7¢/ $1
WAGE / INCOME GAP [ $ ]
$2,978
FAMILY INCOME DEFICIT
0.37
INEQUALITY / GINI INDEX
4,919
TOTAL POPULATION
2,396
MALE POPULATION
2,523
FEMALE POPULATION
94.97
MALES / 100 FEMALES
105.30
FEMALES / 100 MALES
37.1
MEDIAN AGE
3.1
AVG FAMILY SIZE
2.4
AVG HOUSEHOLD SIZE
2,237
LABOR FORCE [ PEOPLE ]
55.9%
PERCENT IN LABOR FORCE
6.8%
UNEMPLOYMENT RATE
Orange Zip Codes
Orange Area Codes
Income in Orange
Income Overview in Orange
Per Capita Income in Orange is $27,315, while median incomes of families and households are $78,685 and $59,196 respectively.
| Characteristic | Number | Measure |
| Per Capita Income | 4,919 | $27,315 |
| Median Family Income | 1,001 | $78,685 |
| Mean Family Income | 1,001 | $78,876 |
| Median Household Income | 1,811 | $59,196 |
| Mean Household Income | 1,811 | $70,998 |
| Income Deficit | 1,001 | $2,978 |
| Wage / Income Gap (%) | 4,919 | 25.33% |
| Wage / Income Gap ($) | 4,919 | 74.67¢ per $1 |
| Gini / Inequality Index | 4,919 | 0.37 |
Earnings by Sex in Orange
Average Earnings in Orange are $37,735, $41,015 for men and $30,625 for women, a difference of 25.3%.

| Sex | Number | Average Earnings |
| Male | 1,165 (49.4%) | $41,015 |
| Female | 1,194 (50.6%) | $30,625 |
| Total | 2,359 (100.0%) | $37,735 |
Earnings by Sex by Income Bracket in Orange
The most common earnings brackets in Orange are $30,000 to $34,999 for men (187 | 16.1%) and $35,000 to $39,999 for women (187 | 15.7%).
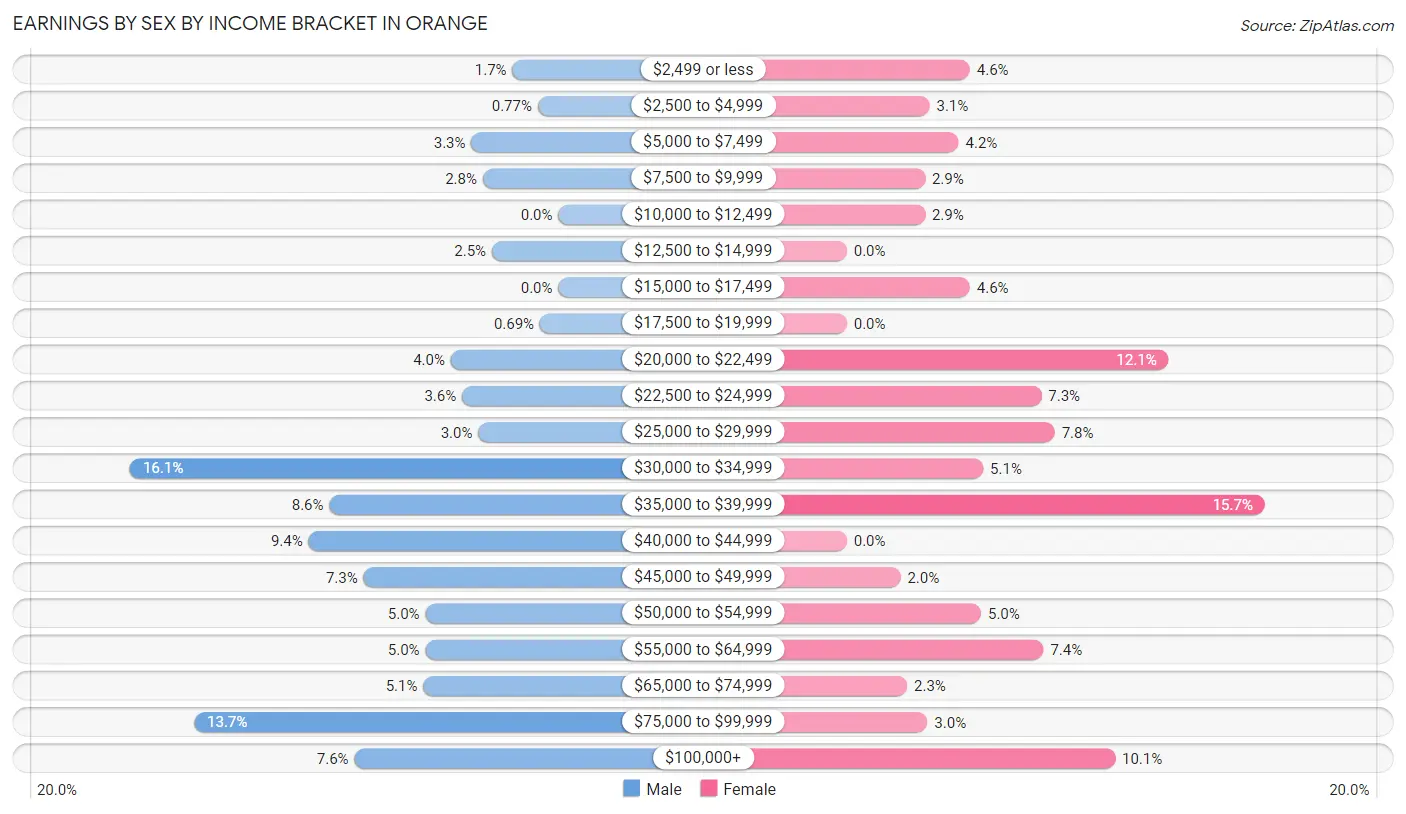
| Income | Male | Female |
| $2,499 or less | 20 (1.7%) | 55 (4.6%) |
| $2,500 to $4,999 | 9 (0.8%) | 37 (3.1%) |
| $5,000 to $7,499 | 38 (3.3%) | 50 (4.2%) |
| $7,500 to $9,999 | 33 (2.8%) | 35 (2.9%) |
| $10,000 to $12,499 | 0 (0.0%) | 35 (2.9%) |
| $12,500 to $14,999 | 29 (2.5%) | 0 (0.0%) |
| $15,000 to $17,499 | 0 (0.0%) | 55 (4.6%) |
| $17,500 to $19,999 | 8 (0.7%) | 0 (0.0%) |
| $20,000 to $22,499 | 47 (4.0%) | 144 (12.1%) |
| $22,500 to $24,999 | 42 (3.6%) | 87 (7.3%) |
| $25,000 to $29,999 | 35 (3.0%) | 93 (7.8%) |
| $30,000 to $34,999 | 187 (16.1%) | 61 (5.1%) |
| $35,000 to $39,999 | 100 (8.6%) | 187 (15.7%) |
| $40,000 to $44,999 | 109 (9.4%) | 0 (0.0%) |
| $45,000 to $49,999 | 85 (7.3%) | 24 (2.0%) |
| $50,000 to $54,999 | 58 (5.0%) | 60 (5.0%) |
| $55,000 to $64,999 | 58 (5.0%) | 88 (7.4%) |
| $65,000 to $74,999 | 59 (5.1%) | 27 (2.3%) |
| $75,000 to $99,999 | 159 (13.7%) | 36 (3.0%) |
| $100,000+ | 89 (7.6%) | 120 (10.1%) |
| Total | 1,165 (100.0%) | 1,194 (100.0%) |
Earnings by Sex by Educational Attainment in Orange
Average earnings in Orange are $40,544 for men and $31,250 for women, a difference of 22.9%. Men with an educational attainment of college or associate's degree enjoy the highest average annual earnings of $56,121, while those with less than high school education earn the least with $21,543. Women with an educational attainment of graduate degree earn the most with the average annual earnings of $64,583, while those with college or associate's degree education have the smallest earnings of $23,362.
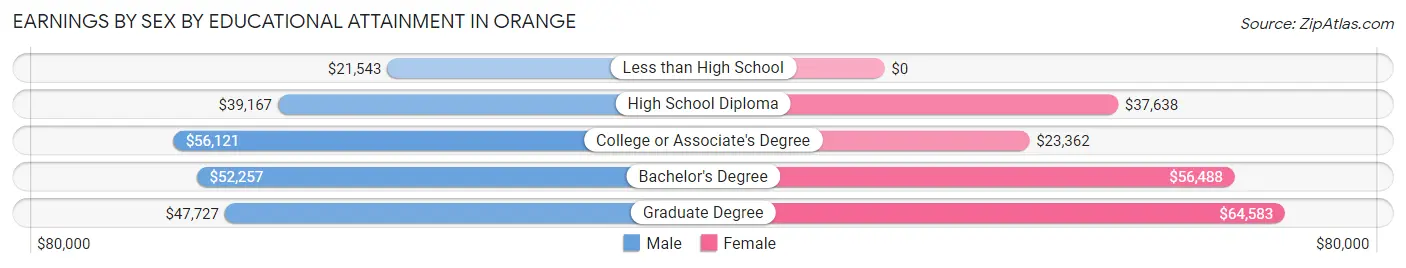
| Educational Attainment | Male Income | Female Income |
| Less than High School | $21,543 | $0 |
| High School Diploma | $39,167 | $37,638 |
| College or Associate's Degree | $56,121 | $23,362 |
| Bachelor's Degree | $52,257 | $56,488 |
| Graduate Degree | $47,727 | $64,583 |
| Total | $40,544 | $31,250 |
Family Income in Orange
Family Income Brackets in Orange
According to the Orange family income data, there are 244 families falling into the $75,000 to $99,999 income range, which is the most common income bracket and makes up 24.4% of all families.
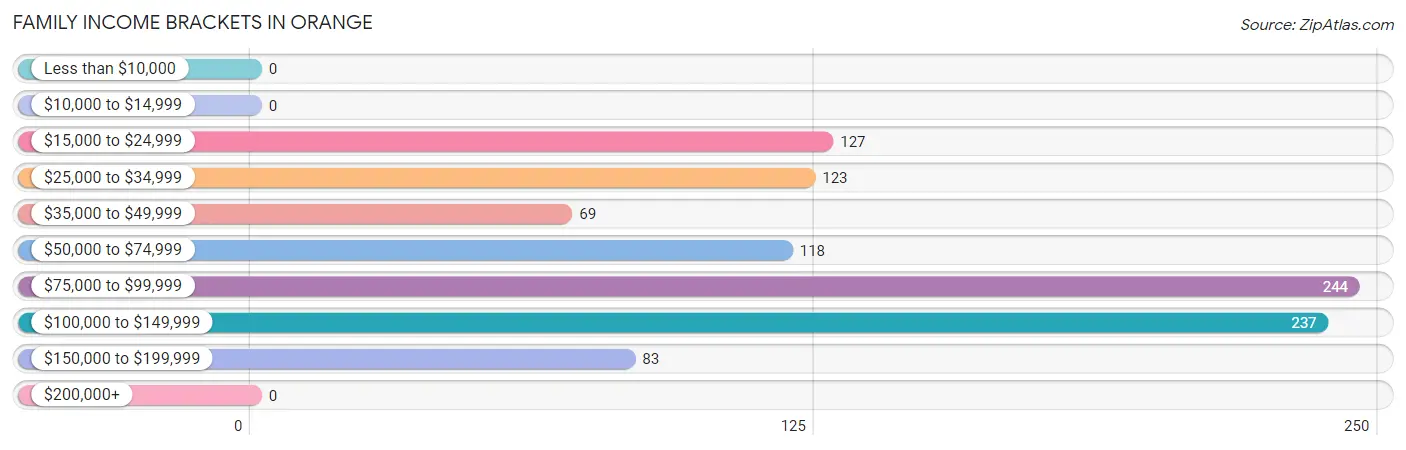
| Income Bracket | # Families | % Families |
| Less than $10,000 | 0 | 0.0% |
| $10,000 to $14,999 | 0 | 0.0% |
| $15,000 to $24,999 | 127 | 12.7% |
| $25,000 to $34,999 | 123 | 12.3% |
| $35,000 to $49,999 | 69 | 6.9% |
| $50,000 to $74,999 | 118 | 11.8% |
| $75,000 to $99,999 | 244 | 24.4% |
| $100,000 to $149,999 | 237 | 23.7% |
| $150,000 to $199,999 | 83 | 8.3% |
| $200,000+ | 0 | 0.0% |
Family Income by Famaliy Size in Orange
5-person families (91 | 9.1%) account for the highest median family income in Orange with $106,076 per family, while 2-person families (341 | 34.1%) have the highest median income of $39,170 per family member.
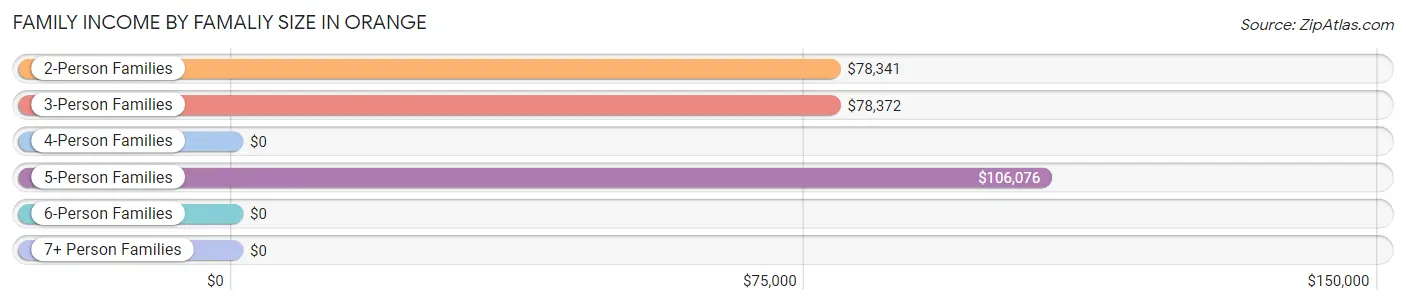
| Income Bracket | # Families | Median Income |
| 2-Person Families | 341 (34.1%) | $78,341 |
| 3-Person Families | 371 (37.1%) | $78,372 |
| 4-Person Families | 148 (14.8%) | $0 |
| 5-Person Families | 91 (9.1%) | $106,076 |
| 6-Person Families | 50 (5.0%) | $0 |
| 7+ Person Families | 0 (0.0%) | $0 |
| Total | 1,001 (100.0%) | $78,685 |
Family Income by Number of Earners in Orange
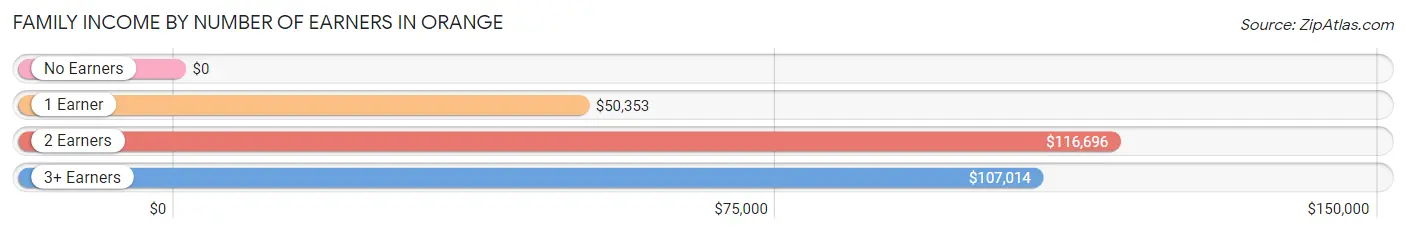
| Number of Earners | # Families | Median Income |
| No Earners | 75 (7.5%) | $0 |
| 1 Earner | 545 (54.4%) | $50,353 |
| 2 Earners | 257 (25.7%) | $116,696 |
| 3+ Earners | 124 (12.4%) | $107,014 |
| Total | 1,001 (100.0%) | $78,685 |
Household Income in Orange
Household Income Brackets in Orange
With 393 households falling in the category, the $75,000 to $99,999 income range is the most frequent in Orange, accounting for 21.7% of all households. In contrast, only 14 households (0.8%) fall into the less than $10,000 income bracket, making it the least populous group.
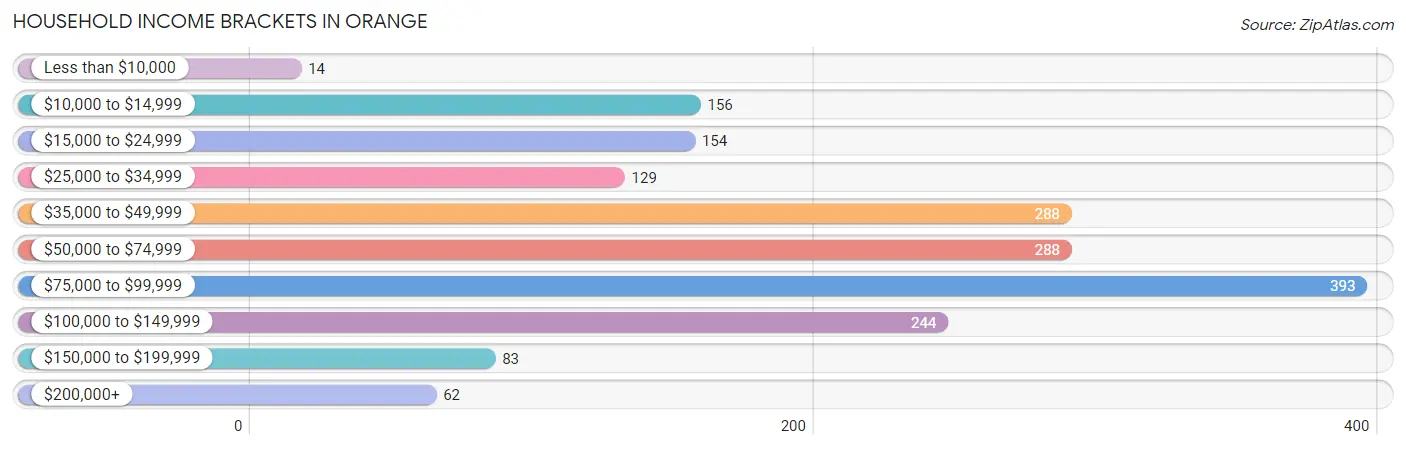
| Income Bracket | # Households | % Households |
| Less than $10,000 | 14 | 0.8% |
| $10,000 to $14,999 | 156 | 8.6% |
| $15,000 to $24,999 | 154 | 8.5% |
| $25,000 to $34,999 | 129 | 7.1% |
| $35,000 to $49,999 | 288 | 15.9% |
| $50,000 to $74,999 | 288 | 15.9% |
| $75,000 to $99,999 | 393 | 21.7% |
| $100,000 to $149,999 | 244 | 13.5% |
| $150,000 to $199,999 | 83 | 4.6% |
| $200,000+ | 62 | 3.4% |
Household Income by Householder Age in Orange
The median household income in Orange is $59,196, with the highest median household income of $59,643 found in the 25 to 44 years age bracket for the primary householder. A total of 450 households (24.8%) fall into this category. Meanwhile, the 15 to 24 years age bracket for the primary householder has the lowest median household income of $0, with 143 households (7.9%) in this group.
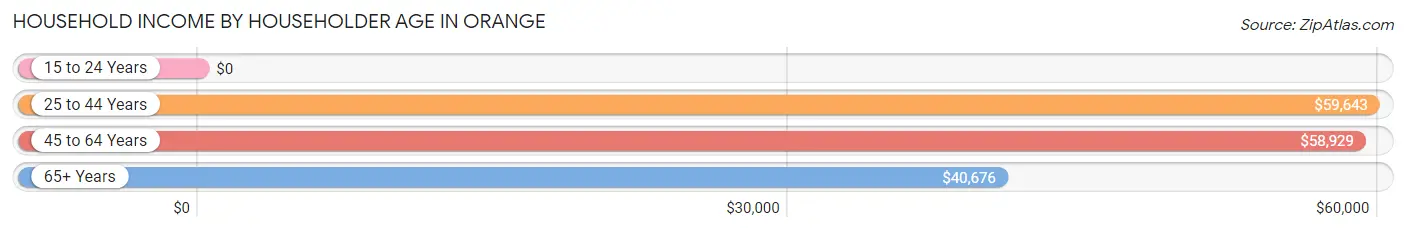
| Income Bracket | # Households | Median Income |
| 15 to 24 Years | 143 (7.9%) | $0 |
| 25 to 44 Years | 450 (24.8%) | $59,643 |
| 45 to 64 Years | 770 (42.5%) | $58,929 |
| 65+ Years | 448 (24.7%) | $40,676 |
| Total | 1,811 (100.0%) | $59,196 |
Poverty in Orange
Income Below Poverty by Sex and Age in Orange
With 14.3% poverty level for males and 22.3% for females among the residents of Orange, under 5 year old males and under 5 year old females are the most vulnerable to poverty, with 61 males (43.0%) and 62 females (64.6%) in their respective age groups living below the poverty level.
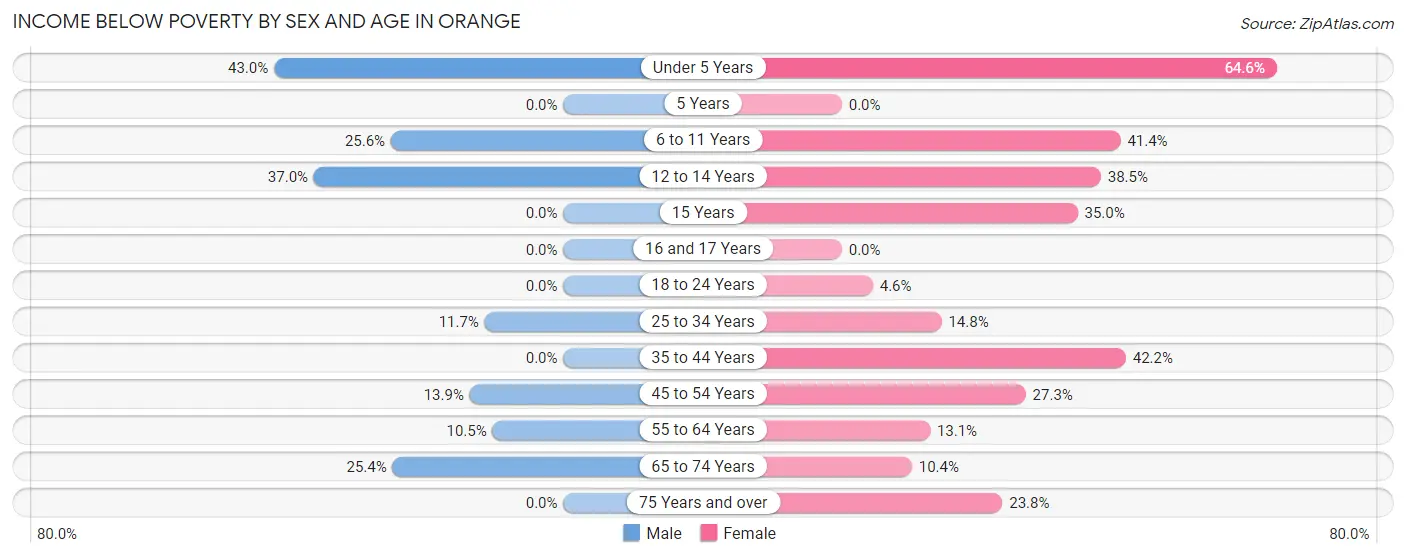
| Age Bracket | Male | Female |
| Under 5 Years | 61 (43.0%) | 62 (64.6%) |
| 5 Years | 0 (0.0%) | 0 (0.0%) |
| 6 to 11 Years | 64 (25.6%) | 96 (41.4%) |
| 12 to 14 Years | 10 (37.0%) | 10 (38.5%) |
| 15 Years | 0 (0.0%) | 14 (35.0%) |
| 16 and 17 Years | 0 (0.0%) | 0 (0.0%) |
| 18 to 24 Years | 0 (0.0%) | 12 (4.6%) |
| 25 to 34 Years | 57 (11.7%) | 41 (14.8%) |
| 35 to 44 Years | 0 (0.0%) | 70 (42.2%) |
| 45 to 54 Years | 26 (13.9%) | 95 (27.3%) |
| 55 to 64 Years | 39 (10.5%) | 39 (13.1%) |
| 65 to 74 Years | 35 (25.4%) | 21 (10.4%) |
| 75 Years and over | 0 (0.0%) | 61 (23.8%) |
| Total | 292 (14.3%) | 521 (22.3%) |
Income Above Poverty by Sex and Age in Orange
According to the poverty statistics in Orange, males aged 15 years and females aged 5 years are the age groups that are most secure financially, with 100.0% of males and 100.0% of females in these age groups living above the poverty line.
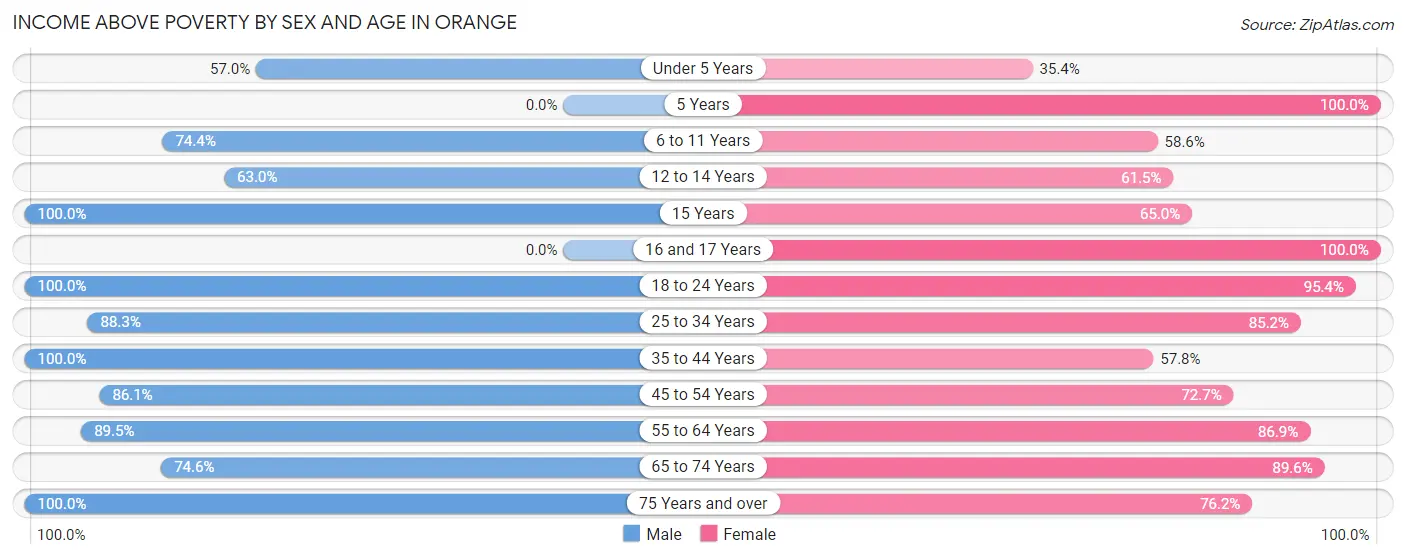
| Age Bracket | Male | Female |
| Under 5 Years | 81 (57.0%) | 34 (35.4%) |
| 5 Years | 0 (0.0%) | 65 (100.0%) |
| 6 to 11 Years | 186 (74.4%) | 136 (58.6%) |
| 12 to 14 Years | 17 (63.0%) | 16 (61.5%) |
| 15 Years | 35 (100.0%) | 26 (65.0%) |
| 16 and 17 Years | 0 (0.0%) | 73 (100.0%) |
| 18 to 24 Years | 213 (100.0%) | 249 (95.4%) |
| 25 to 34 Years | 431 (88.3%) | 236 (85.2%) |
| 35 to 44 Years | 138 (100.0%) | 96 (57.8%) |
| 45 to 54 Years | 161 (86.1%) | 253 (72.7%) |
| 55 to 64 Years | 332 (89.5%) | 259 (86.9%) |
| 65 to 74 Years | 103 (74.6%) | 181 (89.6%) |
| 75 Years and over | 52 (100.0%) | 195 (76.2%) |
| Total | 1,749 (85.7%) | 1,819 (77.7%) |
Income Below Poverty Among Married-Couple Families in Orange
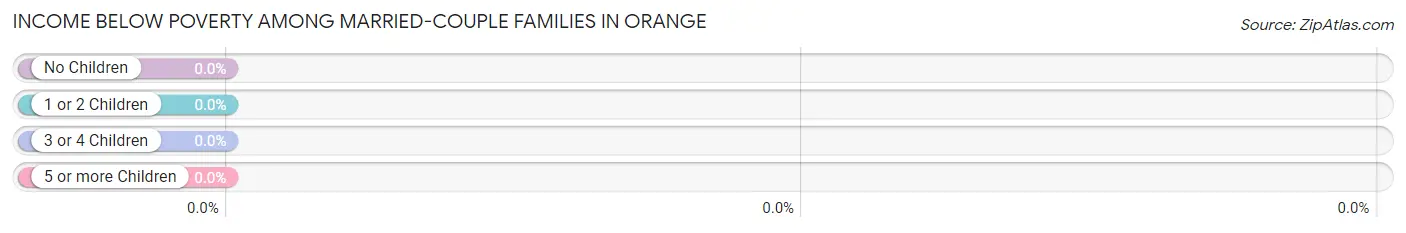
| Children | Above Poverty | Below Poverty |
| No Children | 347 (100.0%) | 0 (0.0%) |
| 1 or 2 Children | 143 (100.0%) | 0 (0.0%) |
| 3 or 4 Children | 41 (100.0%) | 0 (0.0%) |
| 5 or more Children | 0 (0.0%) | 0 (0.0%) |
| Total | 531 (100.0%) | 0 (0.0%) |
Income Below Poverty Among Single-Parent Households in Orange
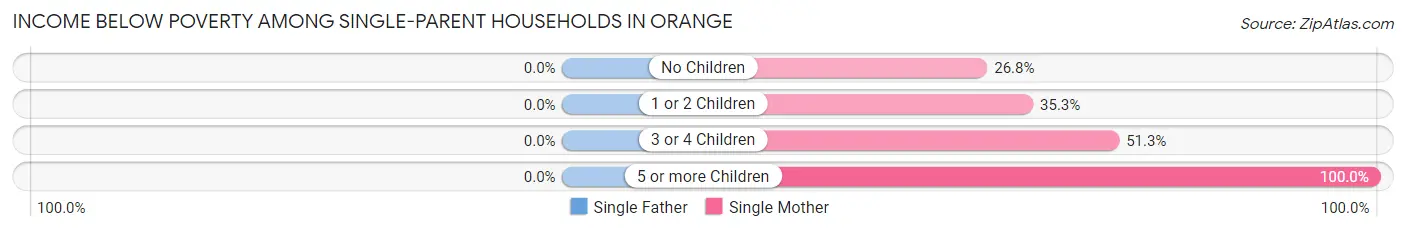
| Children | Single Father | Single Mother |
| No Children | 0 (0.0%) | 42 (26.8%) |
| 1 or 2 Children | 0 (0.0%) | 72 (35.3%) |
| 3 or 4 Children | 0 (0.0%) | 39 (51.3%) |
| 5 or more Children | 0 (0.0%) | 13 (100.0%) |
| Total | 0 (0.0%) | 166 (36.9%) |
Income Below Poverty Among Married-Couple vs Single-Parent Households in Orange
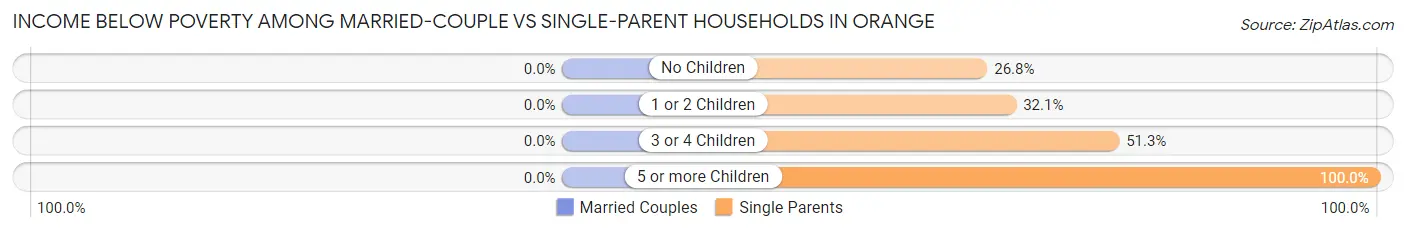
| Children | Married-Couple Families | Single-Parent Households |
| No Children | 0 (0.0%) | 42 (26.8%) |
| 1 or 2 Children | 0 (0.0%) | 72 (32.1%) |
| 3 or 4 Children | 0 (0.0%) | 39 (51.3%) |
| 5 or more Children | 0 (0.0%) | 13 (100.0%) |
| Total | 0 (0.0%) | 166 (35.3%) |
Race in Orange
The most populous races in Orange are White / Caucasian (3,106 | 63.1%), Black / African American (1,423 | 28.9%), and Two or more Races (323 | 6.6%).
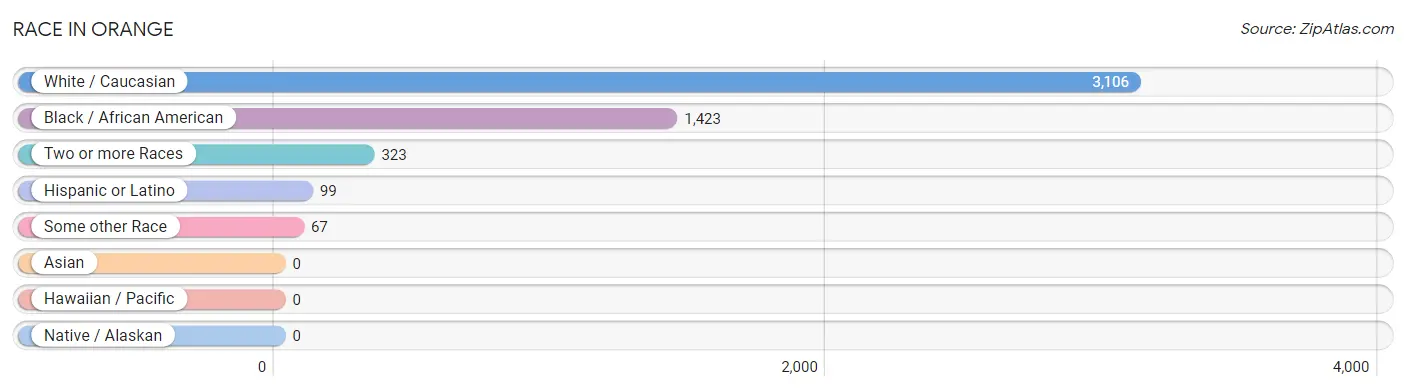
| Race | # Population | % Population |
| Asian | 0 | 0.0% |
| Black / African American | 1,423 | 28.9% |
| Hawaiian / Pacific | 0 | 0.0% |
| Hispanic or Latino | 99 | 2.0% |
| Native / Alaskan | 0 | 0.0% |
| White / Caucasian | 3,106 | 63.1% |
| Two or more Races | 323 | 6.6% |
| Some other Race | 67 | 1.4% |
| Total | 4,919 | 100.0% |
Ancestry in Orange
The most populous ancestries reported in Orange are Irish (807 | 16.4%), German (520 | 10.6%), English (440 | 8.9%), American (212 | 4.3%), and Norwegian (177 | 3.6%), together accounting for 43.8% of all Orange residents.
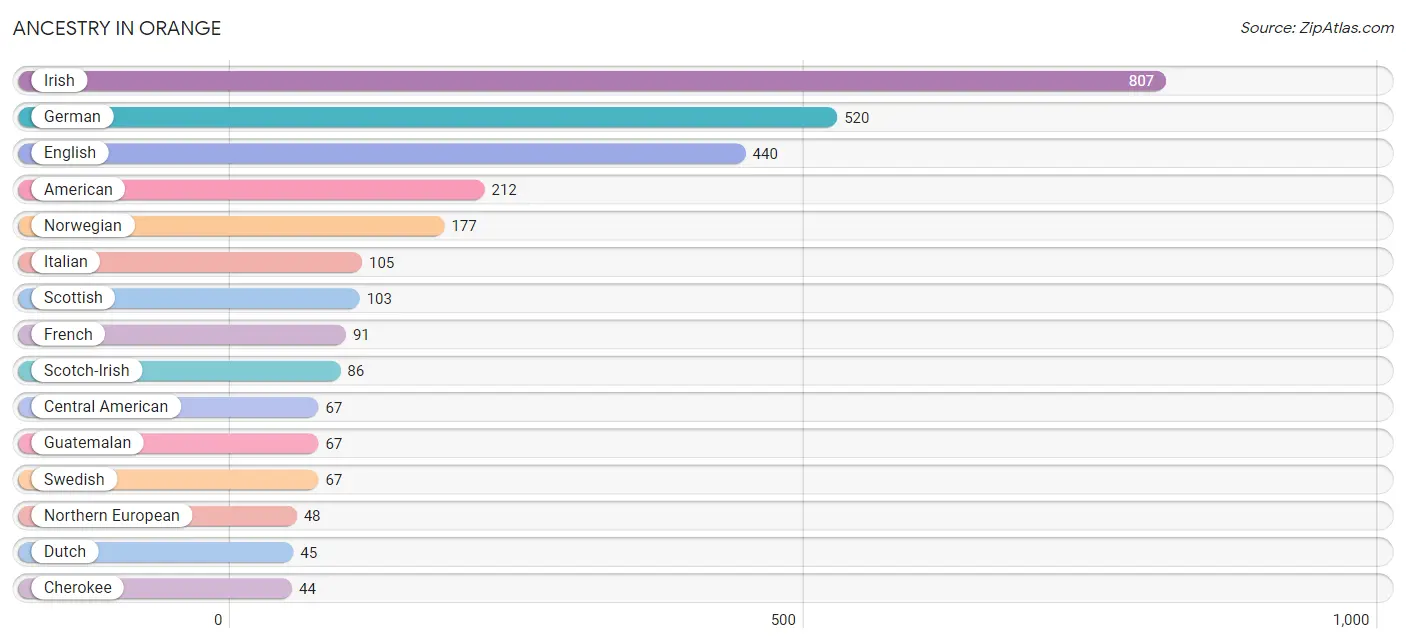
| Ancestry | # Population | % Population |
| American | 212 | 4.3% |
| Blackfeet | 9 | 0.2% |
| Central American | 67 | 1.4% |
| Cherokee | 44 | 0.9% |
| Dutch | 45 | 0.9% |
| Eastern European | 15 | 0.3% |
| English | 440 | 8.9% |
| European | 20 | 0.4% |
| French | 91 | 1.8% |
| German | 520 | 10.6% |
| Greek | 13 | 0.3% |
| Guatemalan | 67 | 1.4% |
| Irish | 807 | 16.4% |
| Italian | 105 | 2.1% |
| Lithuanian | 15 | 0.3% |
| Mexican | 16 | 0.3% |
| Nigerian | 44 | 0.9% |
| Northern European | 48 | 1.0% |
| Norwegian | 177 | 3.6% |
| Pennsylvania German | 20 | 0.4% |
| Polish | 38 | 0.8% |
| Scotch-Irish | 86 | 1.8% |
| Scottish | 103 | 2.1% |
| Spanish | 7 | 0.1% |
| Subsaharan African | 44 | 0.9% |
| Swedish | 67 | 1.4% |
| Welsh | 8 | 0.2% | View All 27 Rows |
Immigrants in Orange
The most numerous immigrant groups reported in Orange came from Central America (8 | 0.2%), Latin America (8 | 0.2%), and Mexico (8 | 0.2%), together accounting for 0.5% of all Orange residents.
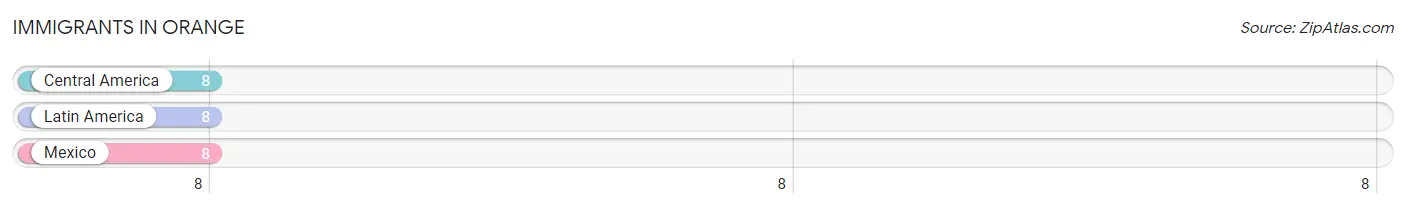
| Immigration Origin | # Population | % Population |
| Central America | 8 | 0.2% |
| Latin America | 8 | 0.2% |
| Mexico | 8 | 0.2% | View All 3 Rows |
Sex and Age in Orange
Sex and Age in Orange
The most populous age groups in Orange are 25 to 29 Years (425 | 17.7%) for men and 20 to 24 Years (256 | 10.2%) for women.
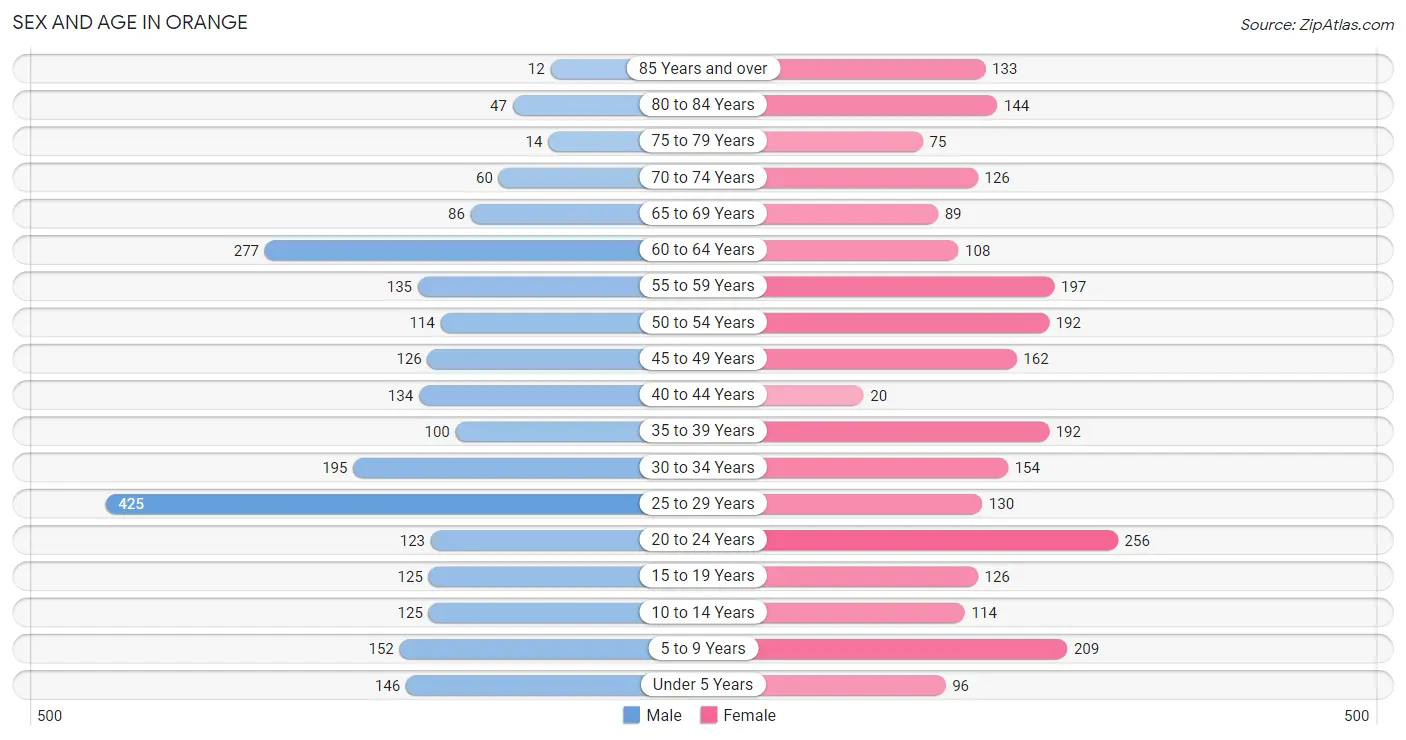
| Age Bracket | Male | Female |
| Under 5 Years | 146 (6.1%) | 96 (3.8%) |
| 5 to 9 Years | 152 (6.3%) | 209 (8.3%) |
| 10 to 14 Years | 125 (5.2%) | 114 (4.5%) |
| 15 to 19 Years | 125 (5.2%) | 126 (5.0%) |
| 20 to 24 Years | 123 (5.1%) | 256 (10.2%) |
| 25 to 29 Years | 425 (17.7%) | 130 (5.1%) |
| 30 to 34 Years | 195 (8.1%) | 154 (6.1%) |
| 35 to 39 Years | 100 (4.2%) | 192 (7.6%) |
| 40 to 44 Years | 134 (5.6%) | 20 (0.8%) |
| 45 to 49 Years | 126 (5.3%) | 162 (6.4%) |
| 50 to 54 Years | 114 (4.8%) | 192 (7.6%) |
| 55 to 59 Years | 135 (5.6%) | 197 (7.8%) |
| 60 to 64 Years | 277 (11.6%) | 108 (4.3%) |
| 65 to 69 Years | 86 (3.6%) | 89 (3.5%) |
| 70 to 74 Years | 60 (2.5%) | 126 (5.0%) |
| 75 to 79 Years | 14 (0.6%) | 75 (3.0%) |
| 80 to 84 Years | 47 (2.0%) | 144 (5.7%) |
| 85 Years and over | 12 (0.5%) | 133 (5.3%) |
| Total | 2,396 (100.0%) | 2,523 (100.0%) |
Families and Households in Orange
Median Family Size in Orange
The median family size in Orange is 3.15 persons per family, with single male/father families (20 | 2.0%) accounting for the largest median family size of 3.35 persons per family. On the other hand, married-couple families (531 | 53.0%) represent the smallest median family size with 2.99 persons per family.
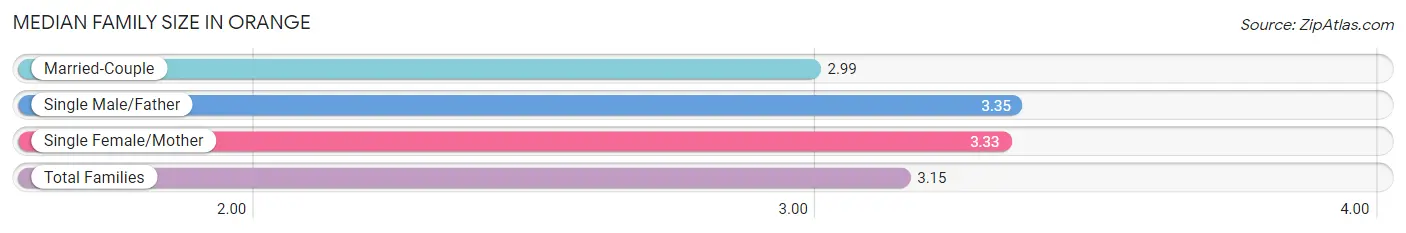
| Family Type | # Families | Family Size |
| Married-Couple | 531 (53.0%) | 2.99 |
| Single Male/Father | 20 (2.0%) | 3.35 |
| Single Female/Mother | 450 (45.0%) | 3.33 |
| Total Families | 1,001 (100.0%) | 3.15 |
Median Household Size in Orange
The median household size in Orange is 2.40 persons per household, with single female/mother households (450 | 24.8%) accounting for the largest median household size of 3.87 persons per household. non-family households (810 | 44.7%) represent the smallest median household size with 1.16 persons per household.
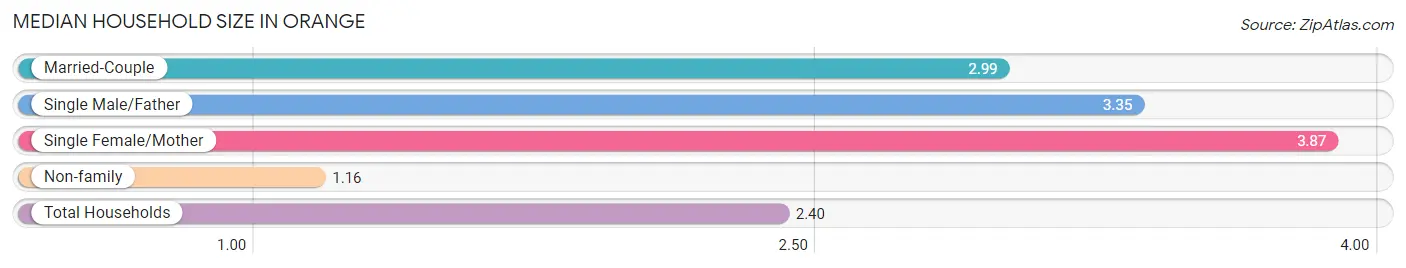
| Household Type | # Households | Household Size |
| Married-Couple | 531 (29.3%) | 2.99 |
| Single Male/Father | 20 (1.1%) | 3.35 |
| Single Female/Mother | 450 (24.8%) | 3.87 |
| Non-family | 810 (44.7%) | 1.16 |
| Total Households | 1,811 (100.0%) | 2.40 |
Household Size by Marriage Status in Orange
Out of a total of 1,811 households in Orange, 1,001 (55.3%) are family households, while 810 (44.7%) are nonfamily households. The most numerous type of family households are 3-person households, comprising 293, and the most common type of nonfamily households are 1-person households, comprising 675.
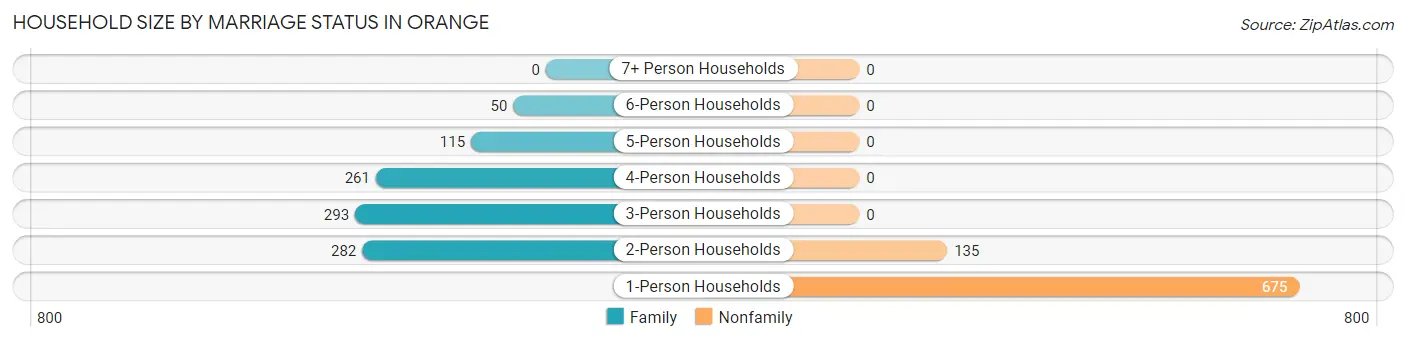
| Household Size | Family Households | Nonfamily Households |
| 1-Person Households | - | 675 (37.3%) |
| 2-Person Households | 282 (15.6%) | 135 (7.4%) |
| 3-Person Households | 293 (16.2%) | 0 (0.0%) |
| 4-Person Households | 261 (14.4%) | 0 (0.0%) |
| 5-Person Households | 115 (6.4%) | 0 (0.0%) |
| 6-Person Households | 50 (2.8%) | 0 (0.0%) |
| 7+ Person Households | 0 (0.0%) | 0 (0.0%) |
| Total | 1,001 (55.3%) | 810 (44.7%) |
Female Fertility in Orange
Fertility by Age in Orange
Average fertility rate in Orange is 33.0 births per 1,000 women. Women in the age bracket of 35 to 50 years have the highest fertility rate with 67.0 births per 1,000 women. Women in the age bracket of 35 to 50 years acount for 80.6% of all women with births.
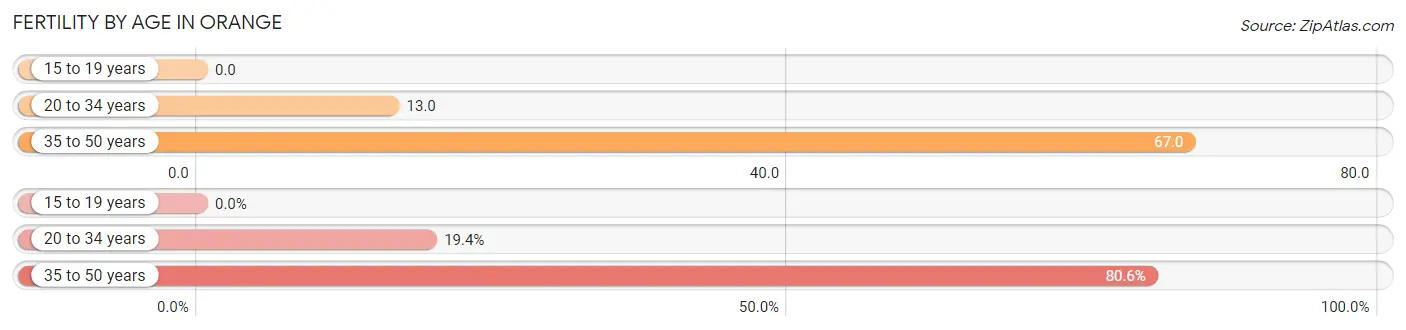
| Age Bracket | Women with Births | Births / 1,000 Women |
| 15 to 19 years | 0 (0.0%) | 0.0 |
| 20 to 34 years | 7 (19.4%) | 13.0 |
| 35 to 50 years | 29 (80.6%) | 67.0 |
| Total | 36 (100.0%) | 33.0 |
Fertility by Age by Marriage Status in Orange
80.6% of women with births (36) in Orange are married. The highest percentage of unmarried women with births falls into 20 to 34 years age bracket with 100.0% of them unmarried at the time of birth, while the lowest percentage of unmarried women with births belong to 35 to 50 years age bracket with 0.0% of them unmarried.
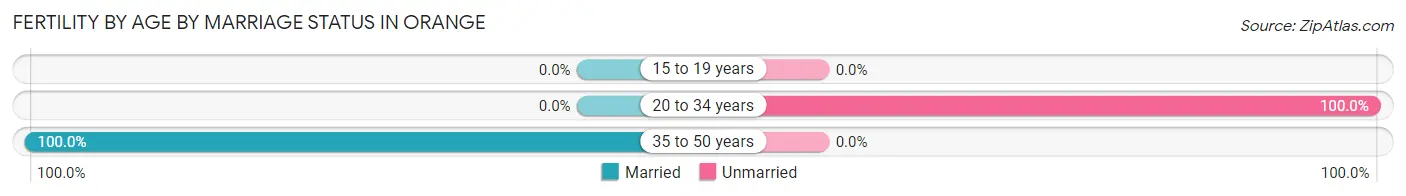
| Age Bracket | Married | Unmarried |
| 15 to 19 years | 0 (0.0%) | 0 (0.0%) |
| 20 to 34 years | 0 (0.0%) | 7 (100.0%) |
| 35 to 50 years | 29 (100.0%) | 0 (0.0%) |
| Total | 29 (80.6%) | 7 (19.4%) |
Fertility by Education in Orange
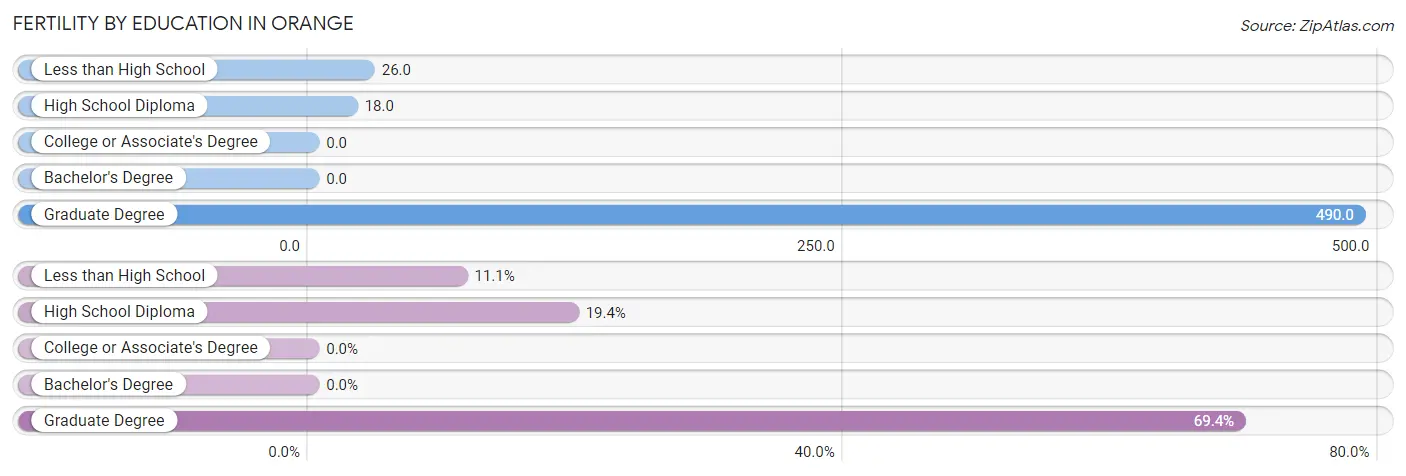
| Educational Attainment | Women with Births | Births / 1,000 Women |
| Less than High School | 4 (11.1%) | 26.0 |
| High School Diploma | 7 (19.4%) | 18.0 |
| College or Associate's Degree | 0 (0.0%) | 0.0 |
| Bachelor's Degree | 0 (0.0%) | 0.0 |
| Graduate Degree | 25 (69.4%) | 490.0 |
| Total | 36 (100.0%) | 33.0 |
Fertility by Education by Marriage Status in Orange
19.4% of women with births in Orange are unmarried. Women with the educational attainment of less than high school are most likely to be married with 100.0% of them married at childbirth, while women with the educational attainment of high school diploma are least likely to be married with 100.0% of them unmarried at childbirth.
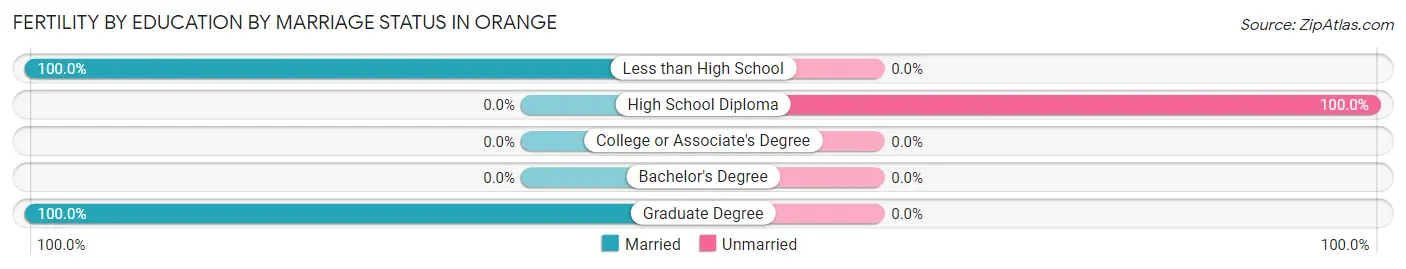
| Educational Attainment | Married | Unmarried |
| Less than High School | 4 (100.0%) | 0 (0.0%) |
| High School Diploma | 0 (0.0%) | 7 (100.0%) |
| College or Associate's Degree | 0 (0.0%) | 0 (0.0%) |
| Bachelor's Degree | 0 (0.0%) | 0 (0.0%) |
| Graduate Degree | 25 (100.0%) | 0 (0.0%) |
| Total | 29 (80.6%) | 7 (19.4%) |
Employment Characteristics in Orange
Employment by Class of Employer in Orange
Among the 2,089 employed individuals in Orange, private company employees (1,266 | 60.6%), not-for-profit organizations (251 | 12.0%), and local government employees (251 | 12.0%) make up the most common classes of employment.
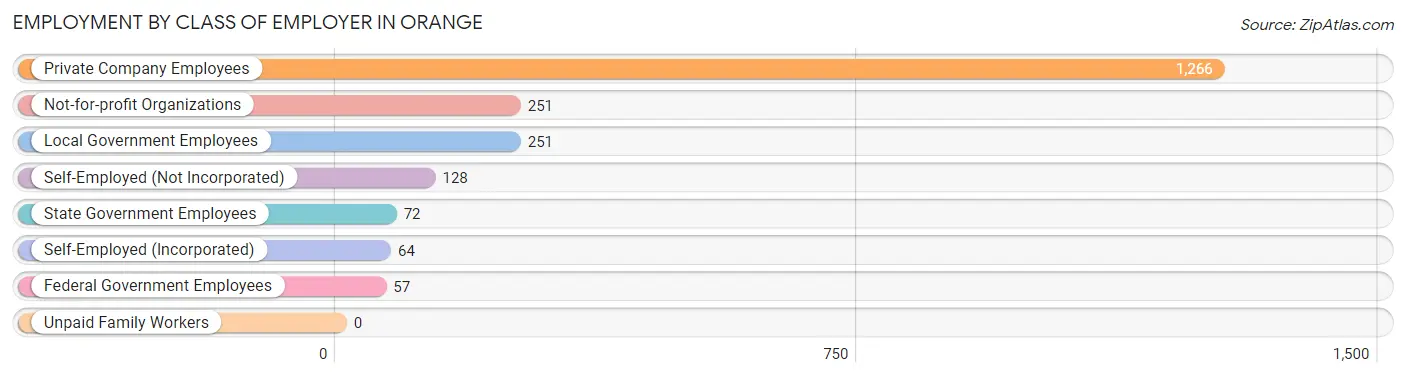
| Employer Class | # Employees | % Employees |
| Private Company Employees | 1,266 | 60.6% |
| Self-Employed (Incorporated) | 64 | 3.1% |
| Self-Employed (Not Incorporated) | 128 | 6.1% |
| Not-for-profit Organizations | 251 | 12.0% |
| Local Government Employees | 251 | 12.0% |
| State Government Employees | 72 | 3.5% |
| Federal Government Employees | 57 | 2.7% |
| Unpaid Family Workers | 0 | 0.0% |
| Total | 2,089 | 100.0% |
Employment Status by Age in Orange
According to the labor force statistics for Orange, out of the total population over 16 years of age (4,002), 55.9% or 2,237 individuals are in the labor force, with 6.8% or 152 of them unemployed. The age group with the highest labor force participation rate is 25 to 29 years, with 73.3% or 407 individuals in the labor force. Within the labor force, the 25 to 29 years age range has the highest percentage of unemployed individuals, with 26.0% or 106 of them being unemployed.
| Age Bracket | In Labor Force | Unemployed |
| 16 to 19 Years | 22 (12.5%) | 0 (0.0%) |
| 20 to 24 Years | 238 (62.8%) | 0 (0.0%) |
| 25 to 29 Years | 407 (73.3%) | 106 (26.0%) |
| 30 to 34 Years | 254 (72.8%) | 0 (0.0%) |
| 35 to 44 Years | 304 (68.2%) | 17 (5.6%) |
| 45 to 54 Years | 417 (70.2%) | 4 (1.0%) |
| 55 to 59 Years | 212 (63.9%) | 9 (4.2%) |
| 60 to 64 Years | 247 (64.2%) | 12 (4.9%) |
| 65 to 74 Years | 123 (34.1%) | 0 (0.0%) |
| 75 Years and over | 13 (3.1%) | 0 (0.0%) |
| Total | 2,237 (55.9%) | 152 (6.8%) |
Employment Status by Educational Attainment in Orange
According to labor force statistics for Orange, 69.2% of individuals (1,841) out of the total population between 25 and 64 years of age (2,661) are in the labor force, with 8.0% or 147 of them being unemployed. The group with the highest labor force participation rate are those with the educational attainment of bachelor's degree or higher, with 81.8% or 400 individuals in the labor force. Within the labor force, individuals with high school diploma education have the highest percentage of unemployment, with 16.4% or 122 of them being unemployed.
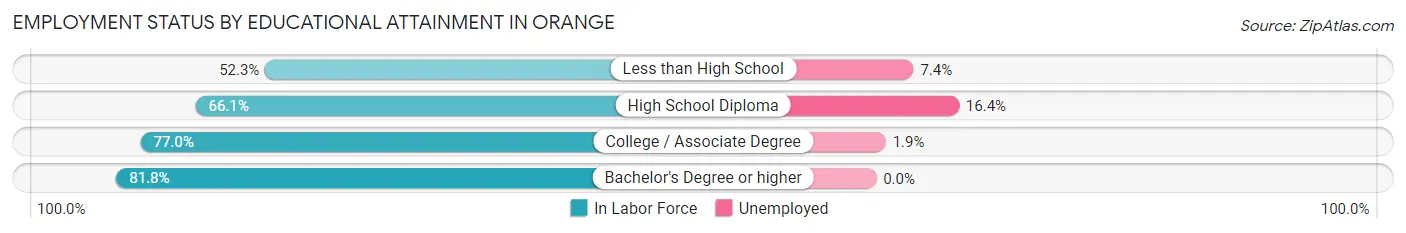
| Educational Attainment | In Labor Force | Unemployed |
| Less than High School | 231 (52.3%) | 33 (7.4%) |
| High School Diploma | 744 (66.1%) | 184 (16.4%) |
| College / Associate Degree | 466 (77.0%) | 11 (1.9%) |
| Bachelor's Degree or higher | 400 (81.8%) | 0 (0.0%) |
| Total | 1,841 (69.2%) | 213 (8.0%) |
Employment Occupations by Sex in Orange
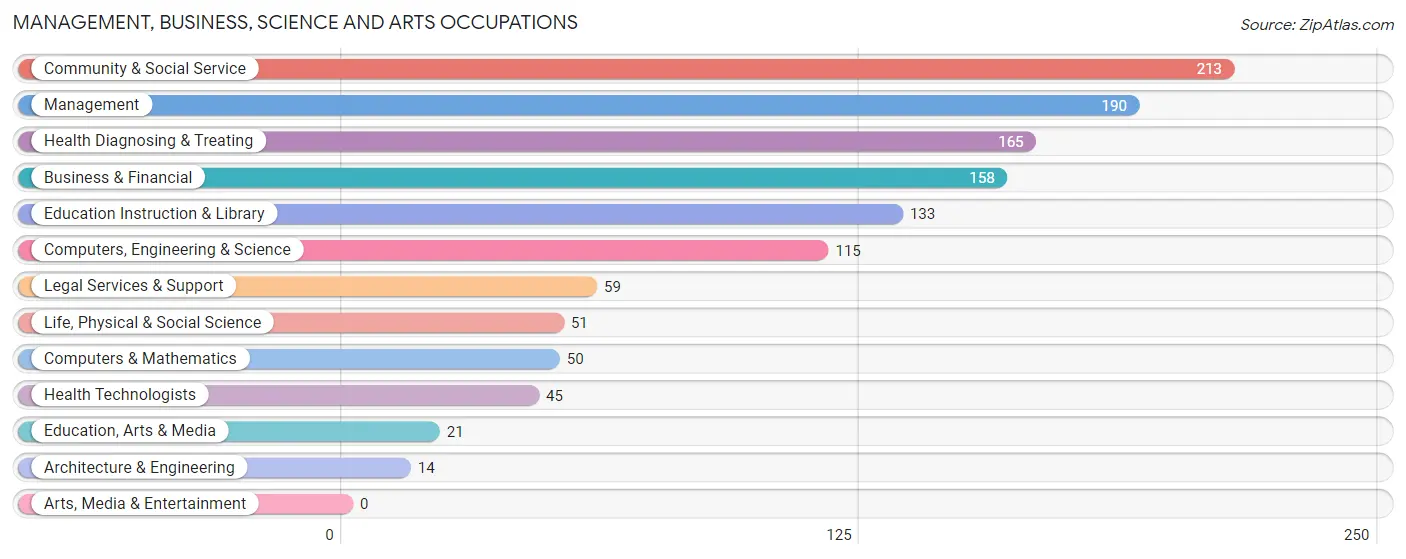
Management, Business, Science and Arts Occupations
The most common Management, Business, Science and Arts occupations in Orange are Community & Social Service (213 | 10.4%), Management (190 | 9.3%), Health Diagnosing & Treating (165 | 8.1%), Business & Financial (158 | 7.7%), and Education Instruction & Library (133 | 6.5%).
Management, Business, Science and Arts Occupations by Sex
Within the Management, Business, Science and Arts occupations in Orange, the most male-oriented occupations are Architecture & Engineering (100.0%), Life, Physical & Social Science (100.0%), and Management (83.7%), while the most female-oriented occupations are Education, Arts & Media (100.0%), Health Diagnosing & Treating (100.0%), and Health Technologists (100.0%).
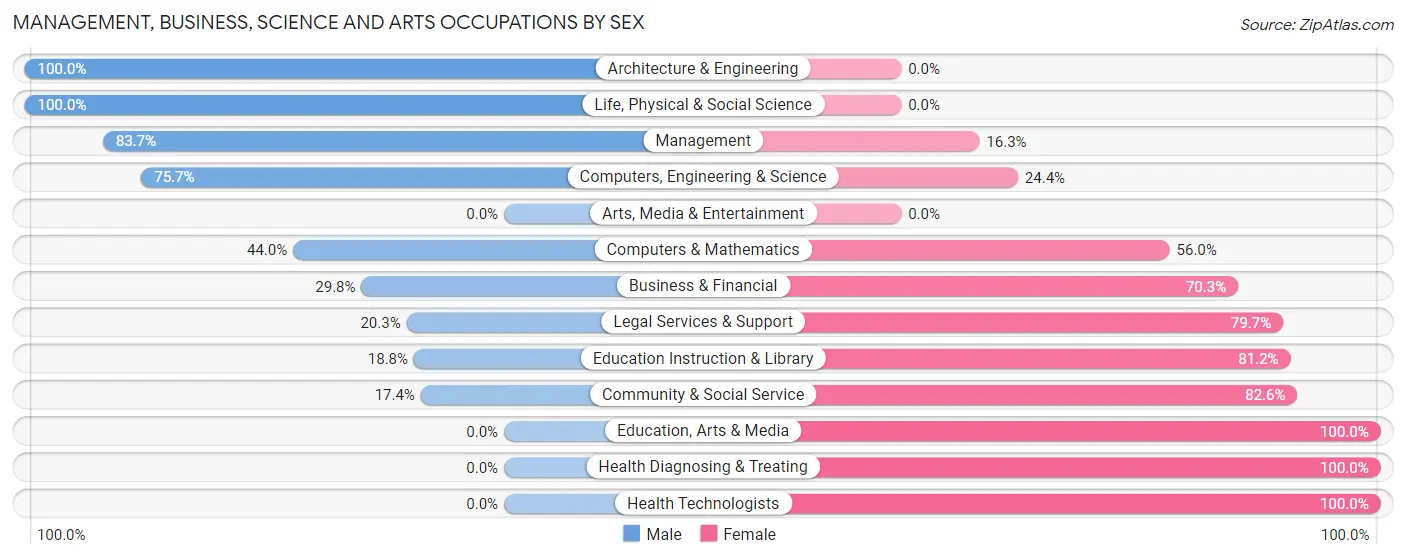
| Occupation | Male | Female |
| Management | 159 (83.7%) | 31 (16.3%) |
| Business & Financial | 47 (29.7%) | 111 (70.3%) |
| Computers, Engineering & Science | 87 (75.6%) | 28 (24.3%) |
| Computers & Mathematics | 22 (44.0%) | 28 (56.0%) |
| Architecture & Engineering | 14 (100.0%) | 0 (0.0%) |
| Life, Physical & Social Science | 51 (100.0%) | 0 (0.0%) |
| Community & Social Service | 37 (17.4%) | 176 (82.6%) |
| Education, Arts & Media | 0 (0.0%) | 21 (100.0%) |
| Legal Services & Support | 12 (20.3%) | 47 (79.7%) |
| Education Instruction & Library | 25 (18.8%) | 108 (81.2%) |
| Arts, Media & Entertainment | 0 (0.0%) | 0 (0.0%) |
| Health Diagnosing & Treating | 0 (0.0%) | 165 (100.0%) |
| Health Technologists | 0 (0.0%) | 45 (100.0%) |
| Total (Category) | 330 (39.2%) | 511 (60.8%) |
| Total (Overall) | 927 (45.4%) | 1,116 (54.6%) |
Services Occupations
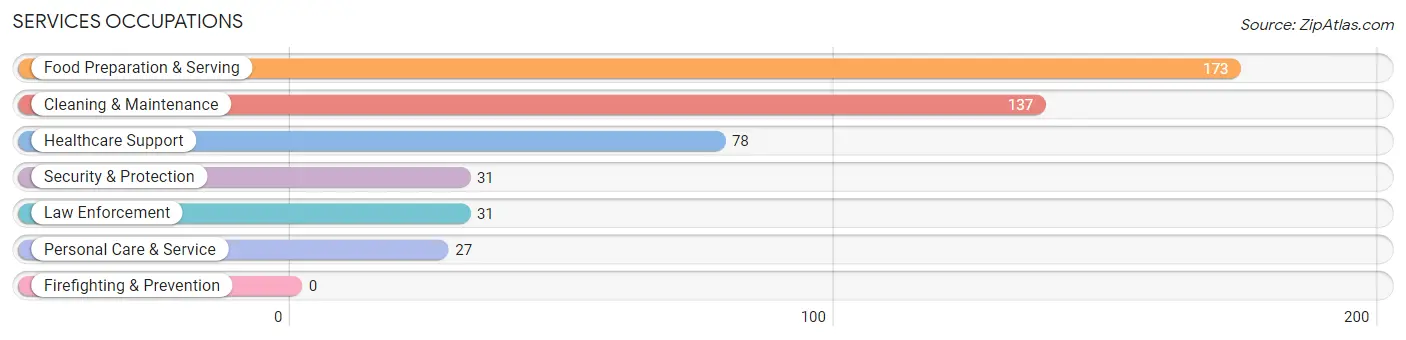
The most common Services occupations in Orange are Food Preparation & Serving (173 | 8.5%), Cleaning & Maintenance (137 | 6.7%), Healthcare Support (78 | 3.8%), Security & Protection (31 | 1.5%), and Law Enforcement (31 | 1.5%).
Services Occupations by Sex
Within the Services occupations in Orange, the most male-oriented occupations are Security & Protection (100.0%), Law Enforcement (100.0%), and Personal Care & Service (59.3%), while the most female-oriented occupations are Healthcare Support (80.8%), Food Preparation & Serving (67.6%), and Cleaning & Maintenance (47.4%).
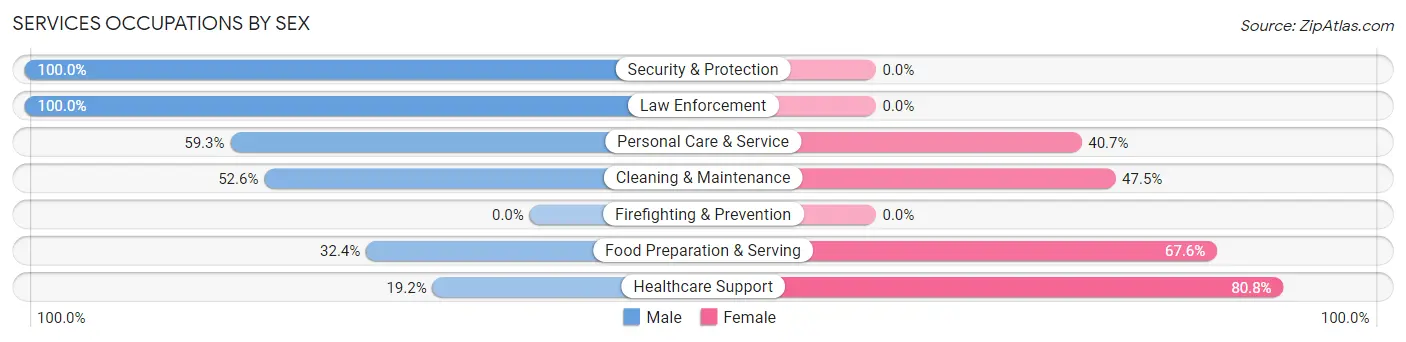
| Occupation | Male | Female |
| Healthcare Support | 15 (19.2%) | 63 (80.8%) |
| Security & Protection | 31 (100.0%) | 0 (0.0%) |
| Firefighting & Prevention | 0 (0.0%) | 0 (0.0%) |
| Law Enforcement | 31 (100.0%) | 0 (0.0%) |
| Food Preparation & Serving | 56 (32.4%) | 117 (67.6%) |
| Cleaning & Maintenance | 72 (52.5%) | 65 (47.4%) |
| Personal Care & Service | 16 (59.3%) | 11 (40.7%) |
| Total (Category) | 190 (42.6%) | 256 (57.4%) |
| Total (Overall) | 927 (45.4%) | 1,116 (54.6%) |
Sales and Office Occupations
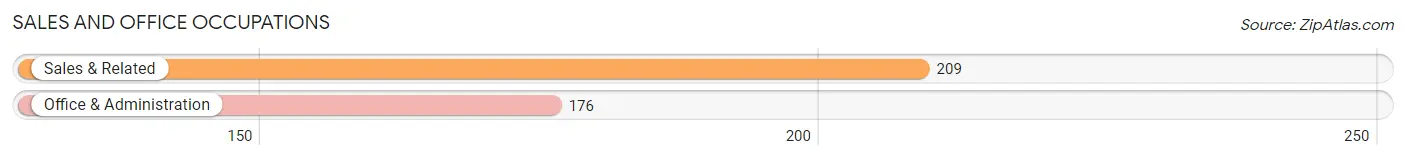
The most common Sales and Office occupations in Orange are Sales & Related (209 | 10.2%), and Office & Administration (176 | 8.6%).
Sales and Office Occupations by Sex
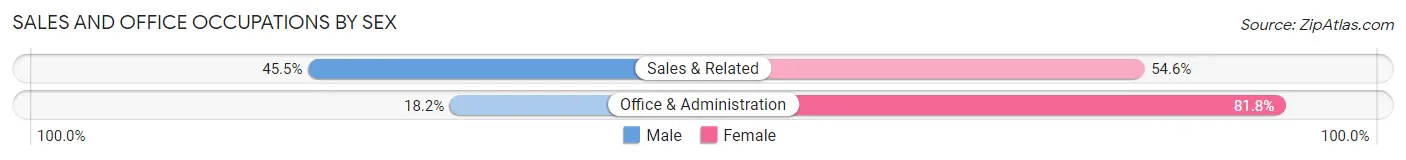
| Occupation | Male | Female |
| Sales & Related | 95 (45.5%) | 114 (54.5%) |
| Office & Administration | 32 (18.2%) | 144 (81.8%) |
| Total (Category) | 127 (33.0%) | 258 (67.0%) |
| Total (Overall) | 927 (45.4%) | 1,116 (54.6%) |
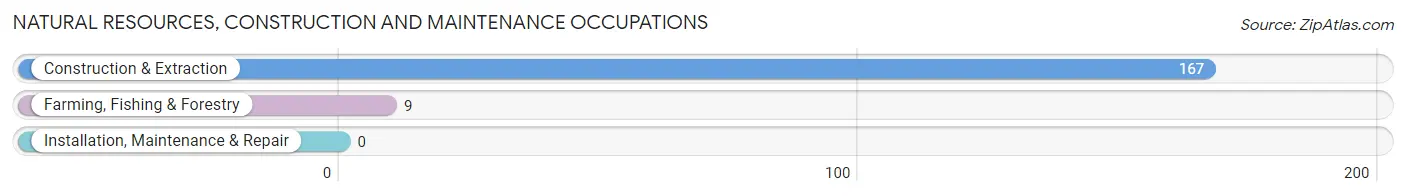
Natural Resources, Construction and Maintenance Occupations
The most common Natural Resources, Construction and Maintenance occupations in Orange are Construction & Extraction (167 | 8.2%), and Farming, Fishing & Forestry (9 | 0.4%).
Natural Resources, Construction and Maintenance Occupations by Sex
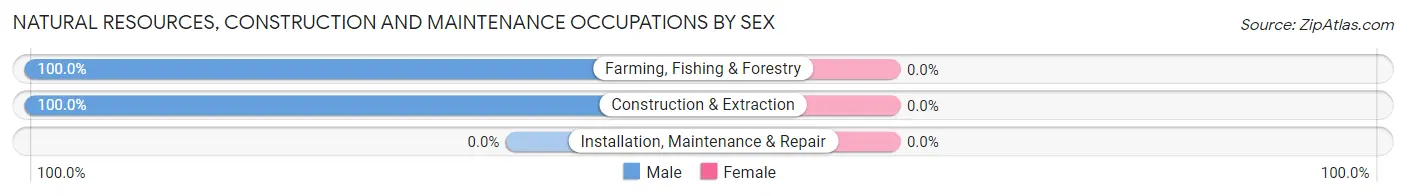
| Occupation | Male | Female |
| Farming, Fishing & Forestry | 9 (100.0%) | 0 (0.0%) |
| Construction & Extraction | 167 (100.0%) | 0 (0.0%) |
| Installation, Maintenance & Repair | 0 (0.0%) | 0 (0.0%) |
| Total (Category) | 176 (100.0%) | 0 (0.0%) |
| Total (Overall) | 927 (45.4%) | 1,116 (54.6%) |
Production, Transportation and Moving Occupations
The most common Production, Transportation and Moving occupations in Orange are Production (83 | 4.1%), Transportation (60 | 2.9%), and Material Moving (52 | 2.5%).
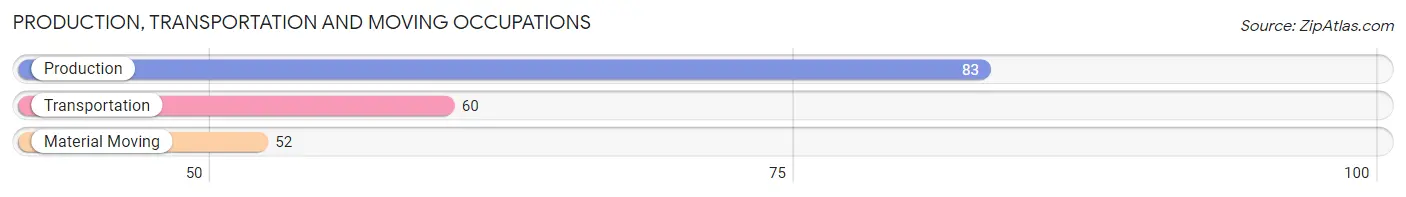
Production, Transportation and Moving Occupations by Sex
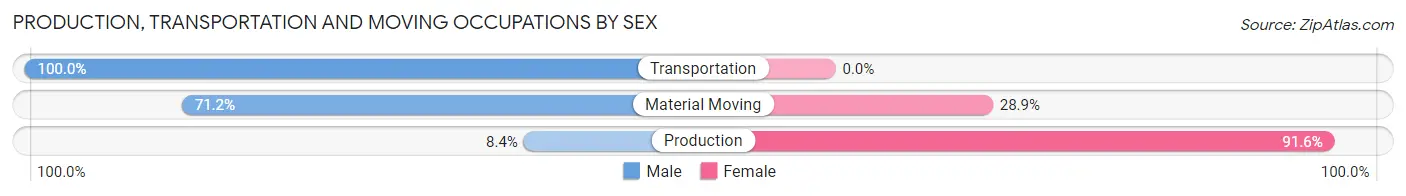
| Occupation | Male | Female |
| Production | 7 (8.4%) | 76 (91.6%) |
| Transportation | 60 (100.0%) | 0 (0.0%) |
| Material Moving | 37 (71.2%) | 15 (28.8%) |
| Total (Category) | 104 (53.3%) | 91 (46.7%) |
| Total (Overall) | 927 (45.4%) | 1,116 (54.6%) |
Employment Industries by Sex in Orange
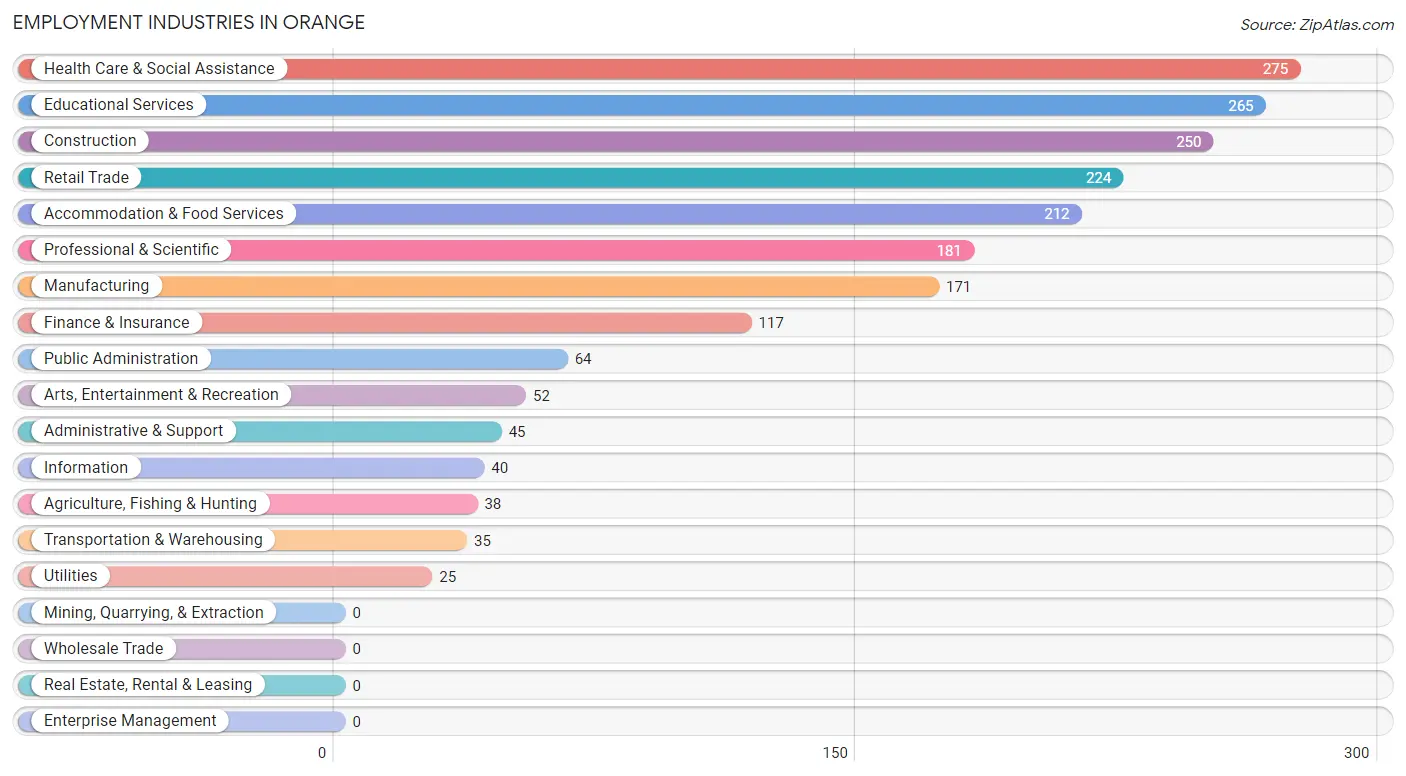
Employment Industries in Orange
The major employment industries in Orange include Health Care & Social Assistance (275 | 13.5%), Educational Services (265 | 13.0%), Construction (250 | 12.2%), Retail Trade (224 | 11.0%), and Accommodation & Food Services (212 | 10.4%).
Employment Industries by Sex in Orange
The Orange industries that see more men than women are Agriculture, Fishing & Hunting (100.0%), Utilities (100.0%), and Construction (94.0%), whereas the industries that tend to have a higher number of women are Information (100.0%), Finance & Insurance (100.0%), and Health Care & Social Assistance (87.3%).
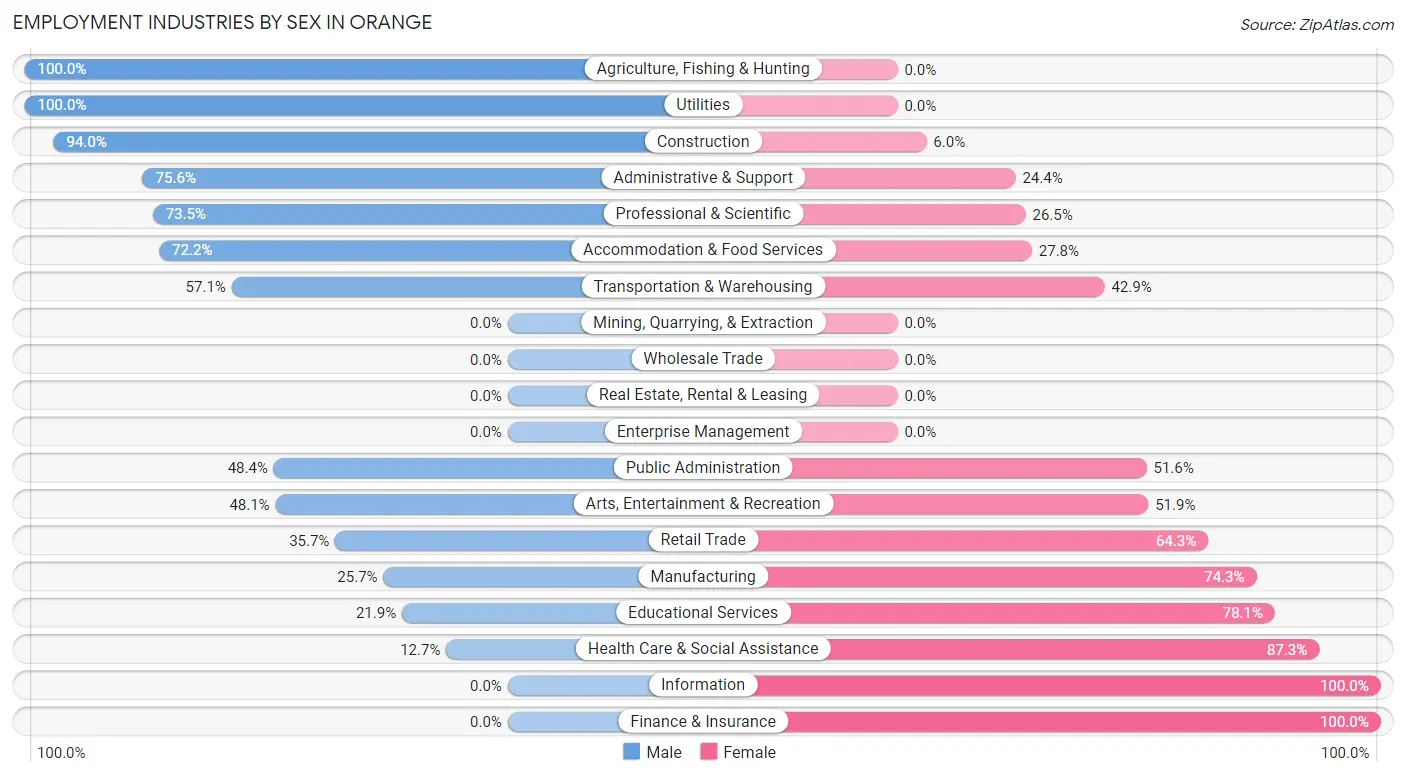
| Industry | Male | Female |
| Agriculture, Fishing & Hunting | 38 (100.0%) | 0 (0.0%) |
| Mining, Quarrying, & Extraction | 0 (0.0%) | 0 (0.0%) |
| Construction | 235 (94.0%) | 15 (6.0%) |
| Manufacturing | 44 (25.7%) | 127 (74.3%) |
| Wholesale Trade | 0 (0.0%) | 0 (0.0%) |
| Retail Trade | 80 (35.7%) | 144 (64.3%) |
| Transportation & Warehousing | 20 (57.1%) | 15 (42.9%) |
| Utilities | 25 (100.0%) | 0 (0.0%) |
| Information | 0 (0.0%) | 40 (100.0%) |
| Finance & Insurance | 0 (0.0%) | 117 (100.0%) |
| Real Estate, Rental & Leasing | 0 (0.0%) | 0 (0.0%) |
| Professional & Scientific | 133 (73.5%) | 48 (26.5%) |
| Enterprise Management | 0 (0.0%) | 0 (0.0%) |
| Administrative & Support | 34 (75.6%) | 11 (24.4%) |
| Educational Services | 58 (21.9%) | 207 (78.1%) |
| Health Care & Social Assistance | 35 (12.7%) | 240 (87.3%) |
| Arts, Entertainment & Recreation | 25 (48.1%) | 27 (51.9%) |
| Accommodation & Food Services | 153 (72.2%) | 59 (27.8%) |
| Public Administration | 31 (48.4%) | 33 (51.6%) |
| Total | 927 (45.4%) | 1,116 (54.6%) |
Education in Orange
School Enrollment in Orange
The most common levels of schooling among the 1,061 students in Orange are elementary school (307 | 28.9%), high school (225 | 21.2%), and college / undergraduate (199 | 18.8%).
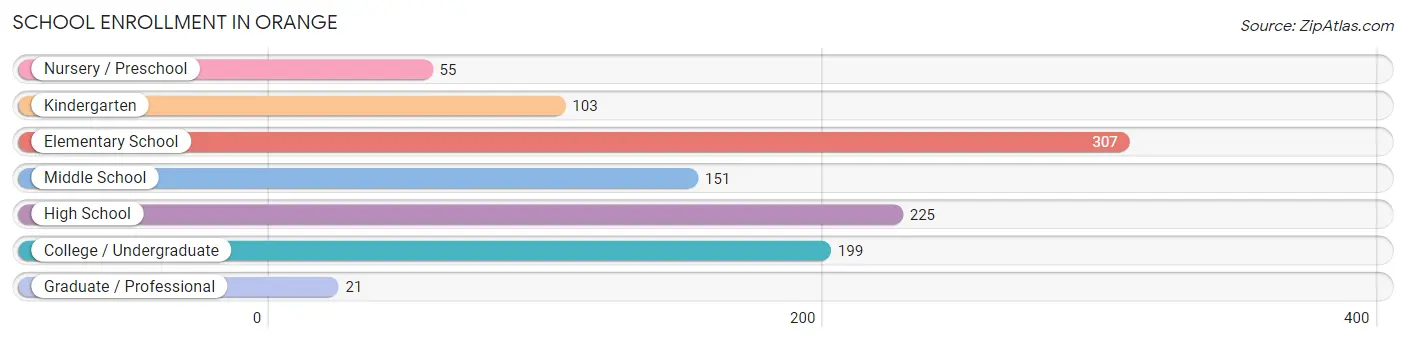
| School Level | # Students | % Students |
| Nursery / Preschool | 55 | 5.2% |
| Kindergarten | 103 | 9.7% |
| Elementary School | 307 | 28.9% |
| Middle School | 151 | 14.2% |
| High School | 225 | 21.2% |
| College / Undergraduate | 199 | 18.8% |
| Graduate / Professional | 21 | 2.0% |
| Total | 1,061 | 100.0% |
School Enrollment by Age by Funding Source in Orange
Out of a total of 1,061 students who are enrolled in schools in Orange, 56 (5.3%) attend a private institution, while the remaining 1,005 (94.7%) are enrolled in public schools. The age group of 35 years and over has the highest likelihood of being enrolled in private schools, with 11 (26.8% in the age bracket) enrolled. Conversely, the age group of 3 to 4 year olds has the lowest likelihood of being enrolled in a private school, with 55 (100.0% in the age bracket) attending a public institution.
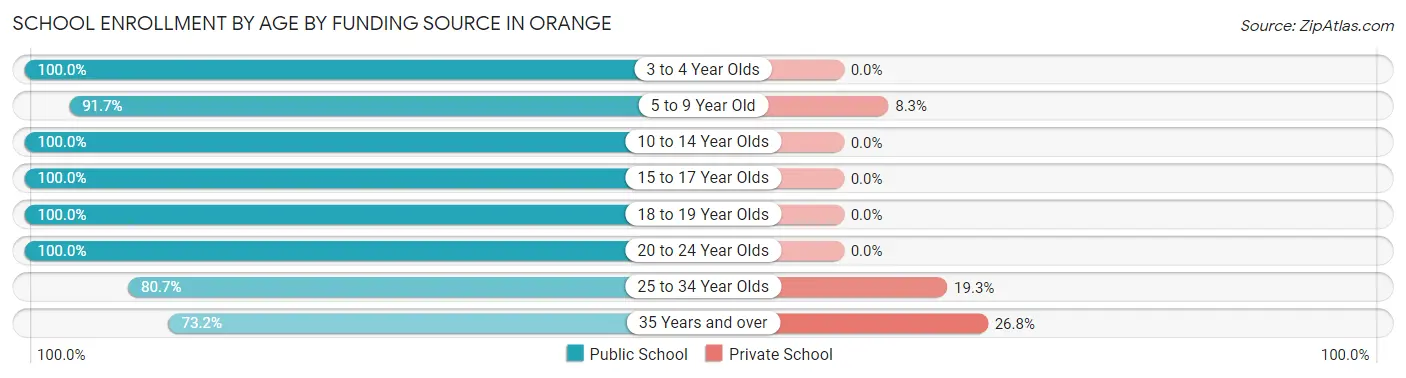
| Age Bracket | Public School | Private School |
| 3 to 4 Year Olds | 55 (100.0%) | 0 (0.0%) |
| 5 to 9 Year Old | 320 (91.7%) | 29 (8.3%) |
| 10 to 14 Year Olds | 239 (100.0%) | 0 (0.0%) |
| 15 to 17 Year Olds | 148 (100.0%) | 0 (0.0%) |
| 18 to 19 Year Olds | 48 (100.0%) | 0 (0.0%) |
| 20 to 24 Year Olds | 98 (100.0%) | 0 (0.0%) |
| 25 to 34 Year Olds | 67 (80.7%) | 16 (19.3%) |
| 35 Years and over | 30 (73.2%) | 11 (26.8%) |
| Total | 1,005 (94.7%) | 56 (5.3%) |
Educational Attainment by Field of Study in Orange
Physical & health sciences (101 | 15.3%), literature & languages (85 | 12.8%), liberal arts & history (73 | 11.0%), education (58 | 8.8%), and social sciences (55 | 8.3%) are the most common fields of study among 662 individuals in Orange who have obtained a bachelor's degree or higher.
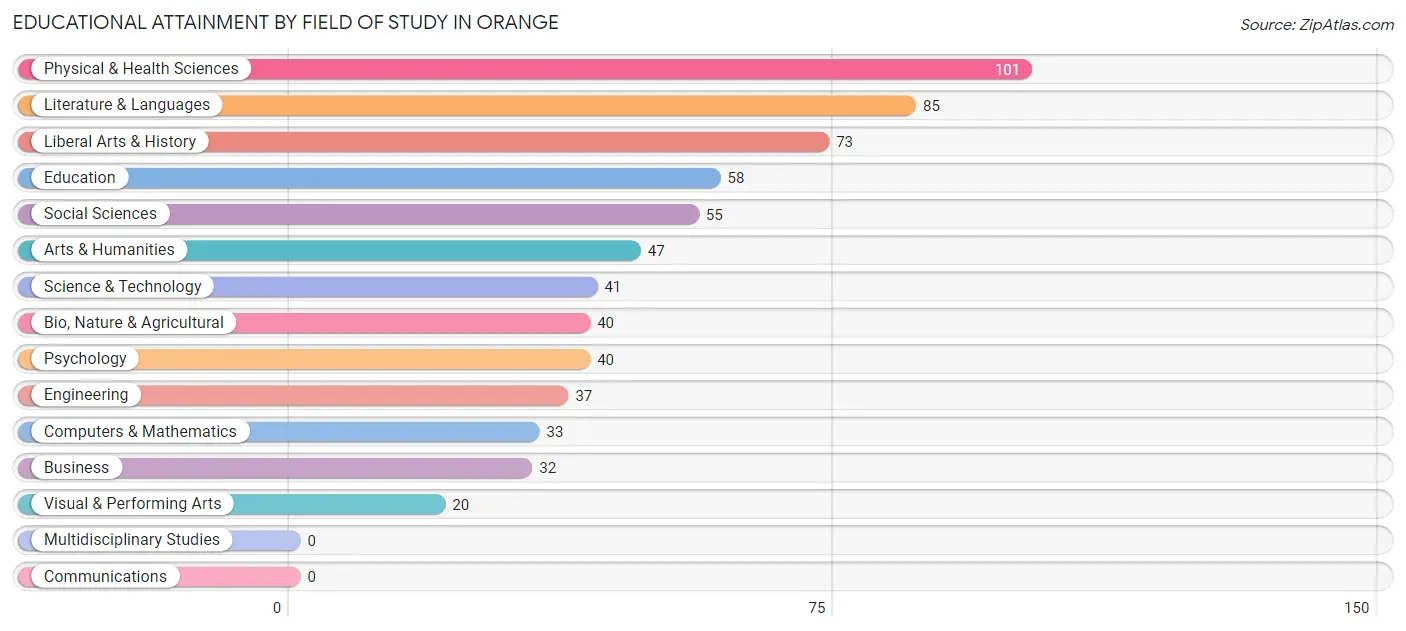
| Field of Study | # Graduates | % Graduates |
| Computers & Mathematics | 33 | 5.0% |
| Bio, Nature & Agricultural | 40 | 6.0% |
| Physical & Health Sciences | 101 | 15.3% |
| Psychology | 40 | 6.0% |
| Social Sciences | 55 | 8.3% |
| Engineering | 37 | 5.6% |
| Multidisciplinary Studies | 0 | 0.0% |
| Science & Technology | 41 | 6.2% |
| Business | 32 | 4.8% |
| Education | 58 | 8.8% |
| Literature & Languages | 85 | 12.8% |
| Liberal Arts & History | 73 | 11.0% |
| Visual & Performing Arts | 20 | 3.0% |
| Communications | 0 | 0.0% |
| Arts & Humanities | 47 | 7.1% |
| Total | 662 | 100.0% |
Transportation & Commute in Orange
Vehicle Availability by Sex in Orange
The most prevalent vehicle ownership categories in Orange are males with 1 vehicle (349, accounting for 35.9%) and females with 1 vehicle (271, making up 31.6%).
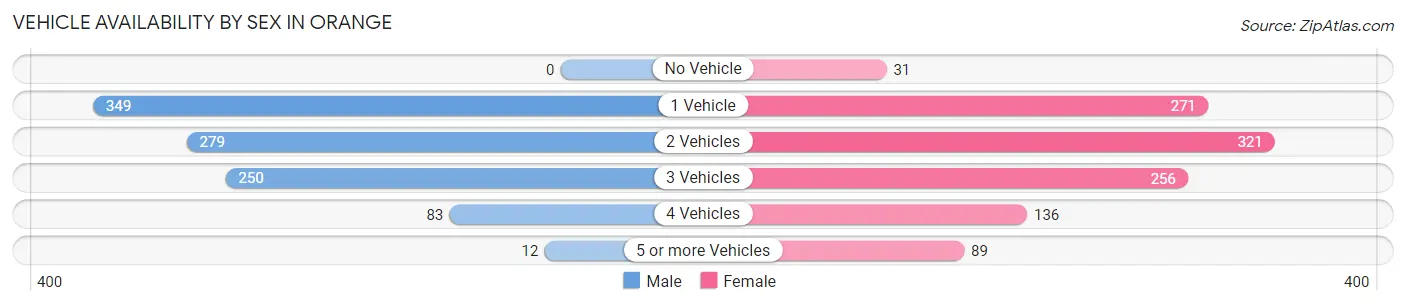
| Vehicles Available | Male | Female |
| No Vehicle | 0 (0.0%) | 31 (2.8%) |
| 1 Vehicle | 349 (35.9%) | 271 (24.5%) |
| 2 Vehicles | 279 (28.7%) | 321 (29.1%) |
| 3 Vehicles | 250 (25.7%) | 256 (23.2%) |
| 4 Vehicles | 83 (8.5%) | 136 (12.3%) |
| 5 or more Vehicles | 12 (1.2%) | 89 (8.1%) |
| Total | 973 (100.0%) | 1,104 (100.0%) |
Commute Time in Orange
The most frequently occuring commute durations in Orange are 10 to 14 minutes (283 commuters, 14.8%), 15 to 19 minutes (252 commuters, 13.2%), and 20 to 24 minutes (233 commuters, 12.2%).
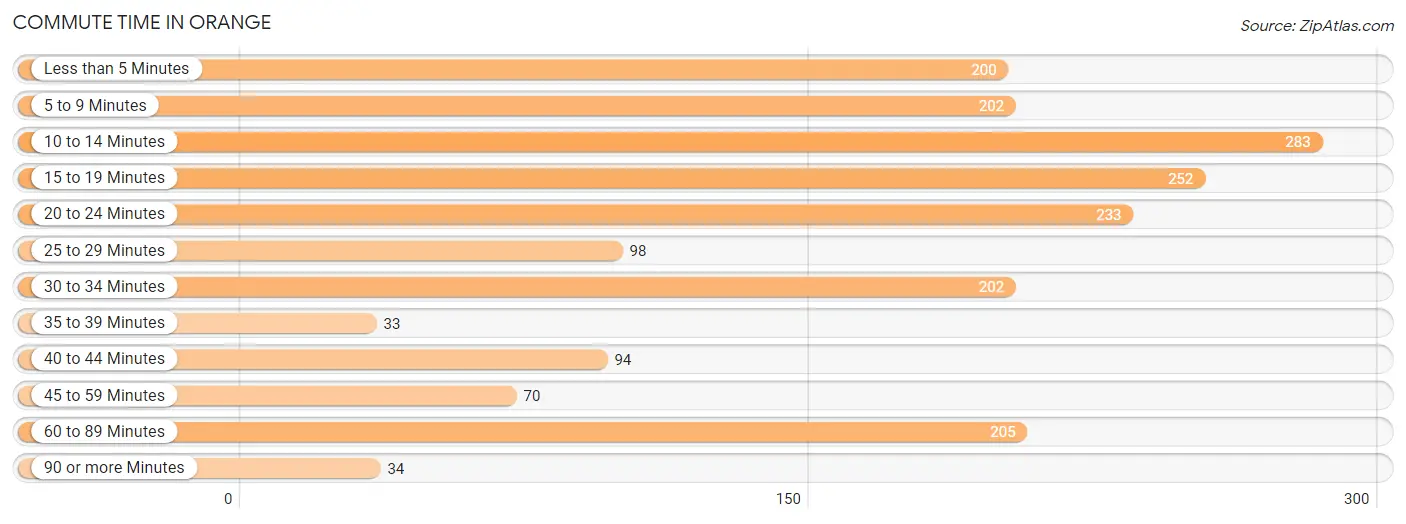
| Commute Time | # Commuters | % Commuters |
| Less than 5 Minutes | 200 | 10.5% |
| 5 to 9 Minutes | 202 | 10.6% |
| 10 to 14 Minutes | 283 | 14.8% |
| 15 to 19 Minutes | 252 | 13.2% |
| 20 to 24 Minutes | 233 | 12.2% |
| 25 to 29 Minutes | 98 | 5.1% |
| 30 to 34 Minutes | 202 | 10.6% |
| 35 to 39 Minutes | 33 | 1.7% |
| 40 to 44 Minutes | 94 | 4.9% |
| 45 to 59 Minutes | 70 | 3.7% |
| 60 to 89 Minutes | 205 | 10.8% |
| 90 or more Minutes | 34 | 1.8% |
Commute Time by Sex in Orange
The most common commute times in Orange are 15 to 19 minutes (195 commuters, 22.0%) for males and less than 5 minutes (173 commuters, 17.0%) for females.
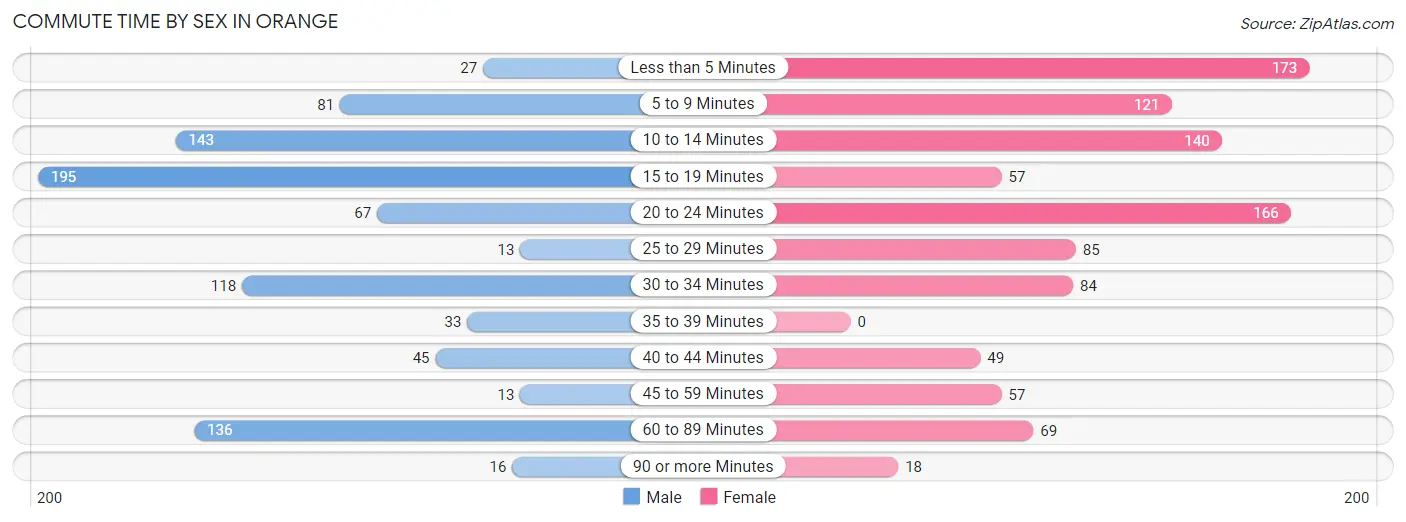
| Commute Time | Male | Female |
| Less than 5 Minutes | 27 (3.0%) | 173 (17.0%) |
| 5 to 9 Minutes | 81 (9.1%) | 121 (11.9%) |
| 10 to 14 Minutes | 143 (16.1%) | 140 (13.7%) |
| 15 to 19 Minutes | 195 (22.0%) | 57 (5.6%) |
| 20 to 24 Minutes | 67 (7.5%) | 166 (16.3%) |
| 25 to 29 Minutes | 13 (1.5%) | 85 (8.3%) |
| 30 to 34 Minutes | 118 (13.3%) | 84 (8.2%) |
| 35 to 39 Minutes | 33 (3.7%) | 0 (0.0%) |
| 40 to 44 Minutes | 45 (5.1%) | 49 (4.8%) |
| 45 to 59 Minutes | 13 (1.5%) | 57 (5.6%) |
| 60 to 89 Minutes | 136 (15.3%) | 69 (6.8%) |
| 90 or more Minutes | 16 (1.8%) | 18 (1.8%) |
Time of Departure to Work by Sex in Orange
The most frequent times of departure to work in Orange are 7:00 AM to 7:29 AM (145, 16.4%) for males and 7:30 AM to 7:59 AM (207, 20.3%) for females.
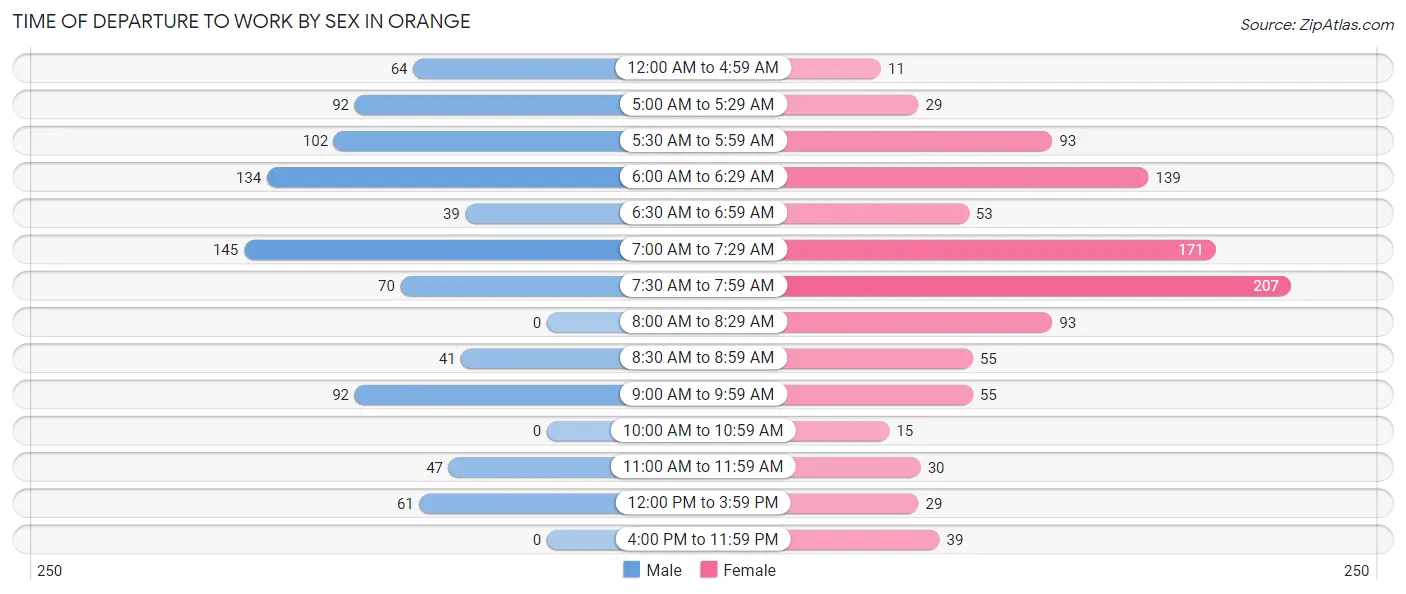
| Time of Departure | Male | Female |
| 12:00 AM to 4:59 AM | 64 (7.2%) | 11 (1.1%) |
| 5:00 AM to 5:29 AM | 92 (10.4%) | 29 (2.9%) |
| 5:30 AM to 5:59 AM | 102 (11.5%) | 93 (9.1%) |
| 6:00 AM to 6:29 AM | 134 (15.1%) | 139 (13.6%) |
| 6:30 AM to 6:59 AM | 39 (4.4%) | 53 (5.2%) |
| 7:00 AM to 7:29 AM | 145 (16.4%) | 171 (16.8%) |
| 7:30 AM to 7:59 AM | 70 (7.9%) | 207 (20.3%) |
| 8:00 AM to 8:29 AM | 0 (0.0%) | 93 (9.1%) |
| 8:30 AM to 8:59 AM | 41 (4.6%) | 55 (5.4%) |
| 9:00 AM to 9:59 AM | 92 (10.4%) | 55 (5.4%) |
| 10:00 AM to 10:59 AM | 0 (0.0%) | 15 (1.5%) |
| 11:00 AM to 11:59 AM | 47 (5.3%) | 30 (2.9%) |
| 12:00 PM to 3:59 PM | 61 (6.9%) | 29 (2.9%) |
| 4:00 PM to 11:59 PM | 0 (0.0%) | 39 (3.8%) |
| Total | 887 (100.0%) | 1,019 (100.0%) |
Housing Occupancy in Orange
Occupancy by Ownership in Orange
Of the total 1,811 dwellings in Orange, owner-occupied units account for 796 (44.0%), while renter-occupied units make up 1,015 (56.0%).
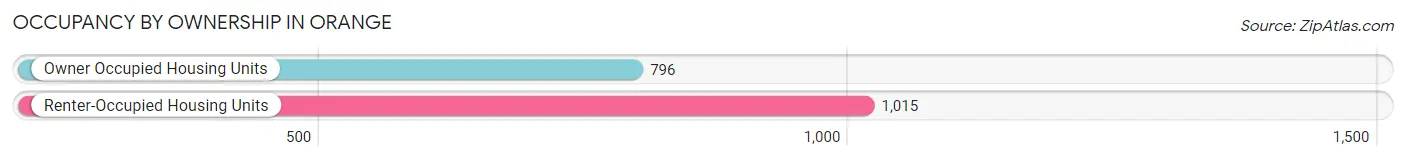
| Occupancy | # Housing Units | % Housing Units |
| Owner Occupied Housing Units | 796 | 44.0% |
| Renter-Occupied Housing Units | 1,015 | 56.0% |
| Total Occupied Housing Units | 1,811 | 100.0% |
Occupancy by Household Size in Orange
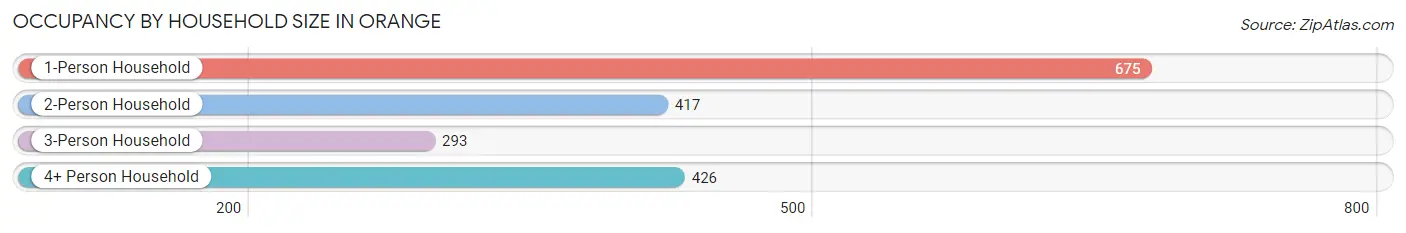
| Household Size | # Housing Units | % Housing Units |
| 1-Person Household | 675 | 37.3% |
| 2-Person Household | 417 | 23.0% |
| 3-Person Household | 293 | 16.2% |
| 4+ Person Household | 426 | 23.5% |
| Total Housing Units | 1,811 | 100.0% |
Occupancy by Ownership by Household Size in Orange
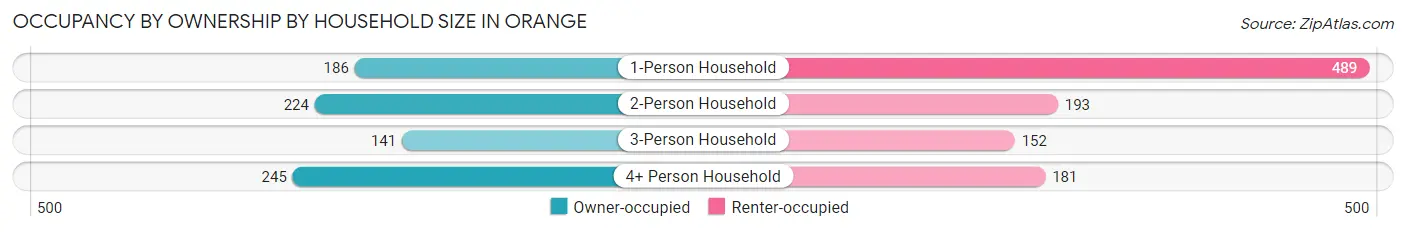
| Household Size | Owner-occupied | Renter-occupied |
| 1-Person Household | 186 (27.6%) | 489 (72.4%) |
| 2-Person Household | 224 (53.7%) | 193 (46.3%) |
| 3-Person Household | 141 (48.1%) | 152 (51.9%) |
| 4+ Person Household | 245 (57.5%) | 181 (42.5%) |
| Total Housing Units | 796 (44.0%) | 1,015 (56.0%) |
Occupancy by Educational Attainment in Orange
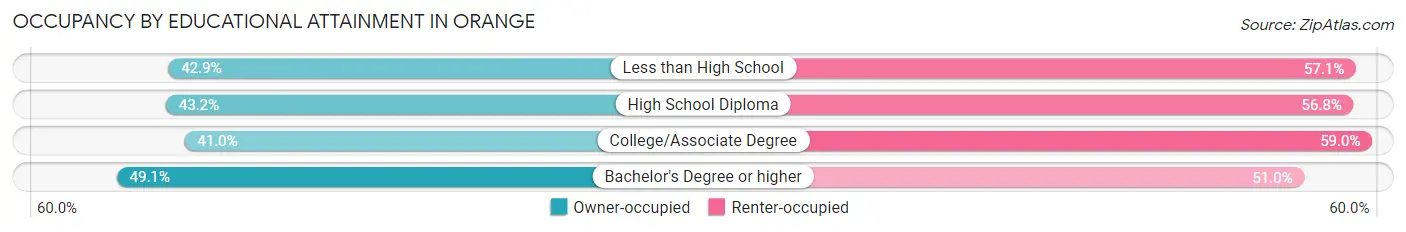
| Household Size | Owner-occupied | Renter-occupied |
| Less than High School | 118 (42.9%) | 157 (57.1%) |
| High School Diploma | 197 (43.2%) | 259 (56.8%) |
| College/Associate Degree | 248 (41.0%) | 357 (59.0%) |
| Bachelor's Degree or higher | 233 (49.0%) | 242 (50.9%) |
Occupancy by Age of Householder in Orange
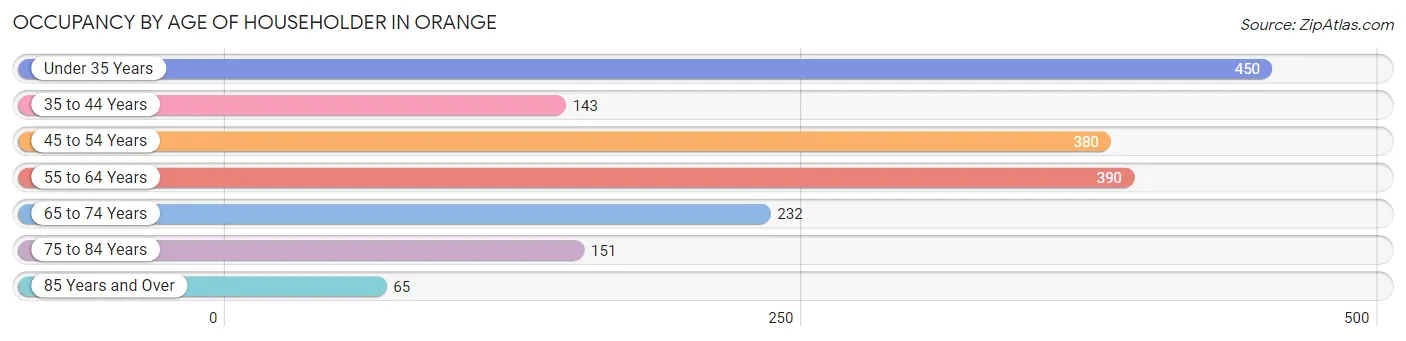
| Age Bracket | # Households | % Households |
| Under 35 Years | 450 | 24.8% |
| 35 to 44 Years | 143 | 7.9% |
| 45 to 54 Years | 380 | 21.0% |
| 55 to 64 Years | 390 | 21.5% |
| 65 to 74 Years | 232 | 12.8% |
| 75 to 84 Years | 151 | 8.3% |
| 85 Years and Over | 65 | 3.6% |
| Total | 1,811 | 100.0% |
Housing Finances in Orange
Median Income by Occupancy in Orange
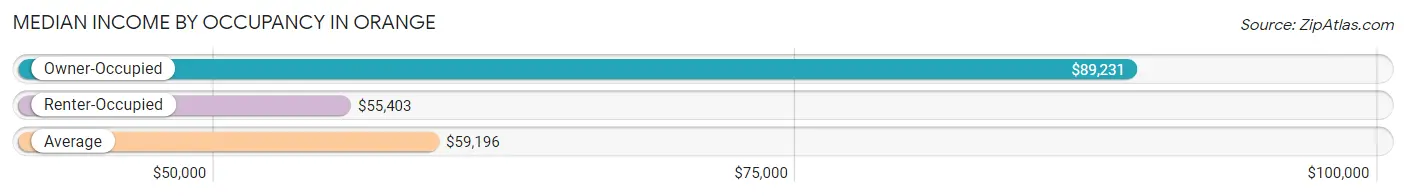
| Occupancy Type | # Households | Median Income |
| Owner-Occupied | 796 (44.0%) | $89,231 |
| Renter-Occupied | 1,015 (56.0%) | $55,403 |
| Average | 1,811 (100.0%) | $59,196 |
Occupancy by Householder Income Bracket in Orange
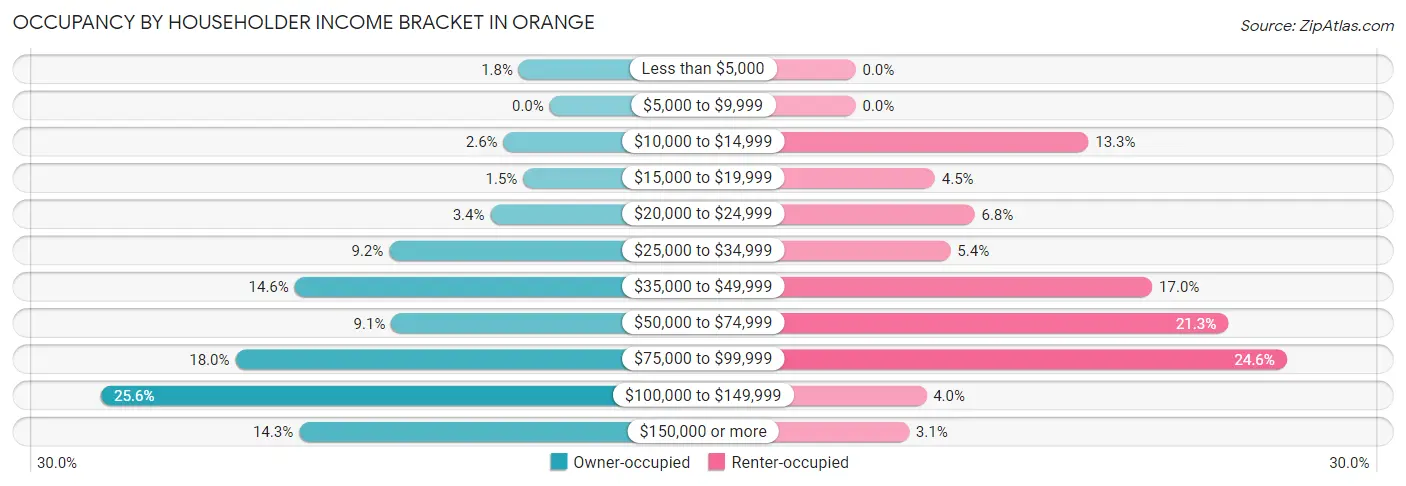
| Income Bracket | Owner-occupied | Renter-occupied |
| Less than $5,000 | 14 (1.8%) | 0 (0.0%) |
| $5,000 to $9,999 | 0 (0.0%) | 0 (0.0%) |
| $10,000 to $14,999 | 21 (2.6%) | 135 (13.3%) |
| $15,000 to $19,999 | 12 (1.5%) | 46 (4.5%) |
| $20,000 to $24,999 | 27 (3.4%) | 69 (6.8%) |
| $25,000 to $34,999 | 73 (9.2%) | 55 (5.4%) |
| $35,000 to $49,999 | 116 (14.6%) | 172 (17.0%) |
| $50,000 to $74,999 | 72 (9.0%) | 216 (21.3%) |
| $75,000 to $99,999 | 143 (18.0%) | 250 (24.6%) |
| $100,000 to $149,999 | 204 (25.6%) | 41 (4.0%) |
| $150,000 or more | 114 (14.3%) | 31 (3.0%) |
| Total | 796 (100.0%) | 1,015 (100.0%) |
Monthly Housing Cost Tiers in Orange
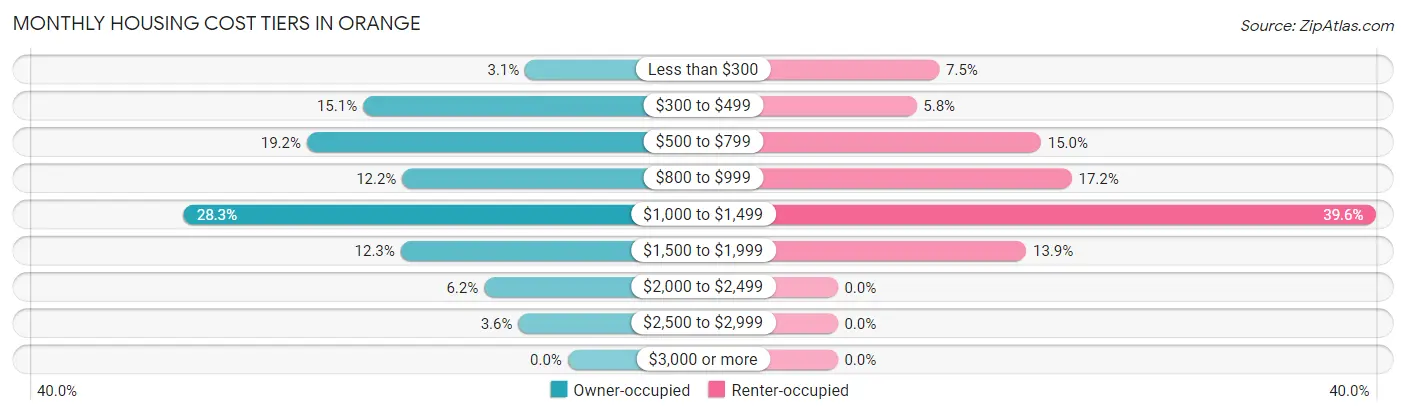
| Monthly Cost | Owner-occupied | Renter-occupied |
| Less than $300 | 25 (3.1%) | 76 (7.5%) |
| $300 to $499 | 120 (15.1%) | 59 (5.8%) |
| $500 to $799 | 153 (19.2%) | 152 (15.0%) |
| $800 to $999 | 97 (12.2%) | 175 (17.2%) |
| $1,000 to $1,499 | 225 (28.3%) | 402 (39.6%) |
| $1,500 to $1,999 | 98 (12.3%) | 141 (13.9%) |
| $2,000 to $2,499 | 49 (6.2%) | 0 (0.0%) |
| $2,500 to $2,999 | 29 (3.6%) | 0 (0.0%) |
| $3,000 or more | 0 (0.0%) | 0 (0.0%) |
| Total | 796 (100.0%) | 1,015 (100.0%) |
Physical Housing Characteristics in Orange
Housing Structures in Orange
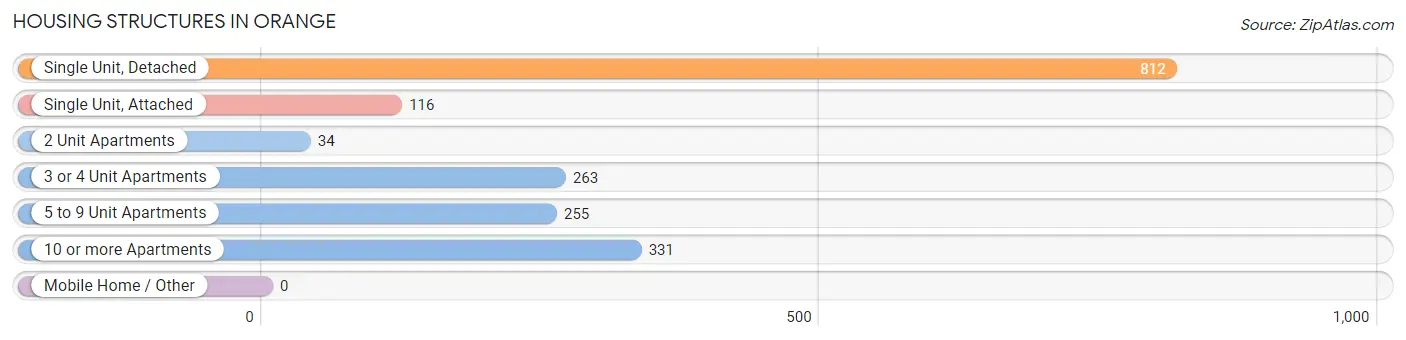
| Structure Type | # Housing Units | % Housing Units |
| Single Unit, Detached | 812 | 44.8% |
| Single Unit, Attached | 116 | 6.4% |
| 2 Unit Apartments | 34 | 1.9% |
| 3 or 4 Unit Apartments | 263 | 14.5% |
| 5 to 9 Unit Apartments | 255 | 14.1% |
| 10 or more Apartments | 331 | 18.3% |
| Mobile Home / Other | 0 | 0.0% |
| Total | 1,811 | 100.0% |
Housing Structures by Occupancy in Orange
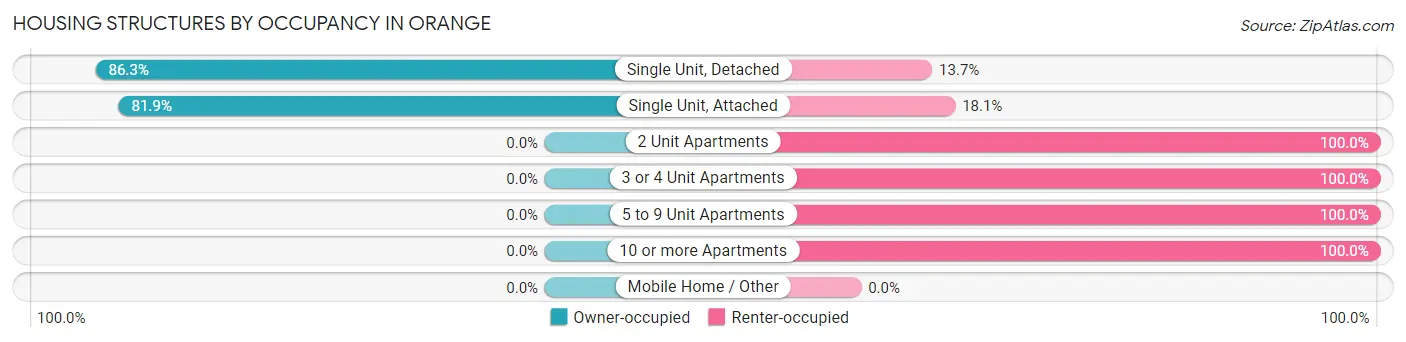
| Structure Type | Owner-occupied | Renter-occupied |
| Single Unit, Detached | 701 (86.3%) | 111 (13.7%) |
| Single Unit, Attached | 95 (81.9%) | 21 (18.1%) |
| 2 Unit Apartments | 0 (0.0%) | 34 (100.0%) |
| 3 or 4 Unit Apartments | 0 (0.0%) | 263 (100.0%) |
| 5 to 9 Unit Apartments | 0 (0.0%) | 255 (100.0%) |
| 10 or more Apartments | 0 (0.0%) | 331 (100.0%) |
| Mobile Home / Other | 0 (0.0%) | 0 (0.0%) |
| Total | 796 (44.0%) | 1,015 (56.0%) |
Housing Structures by Number of Rooms in Orange
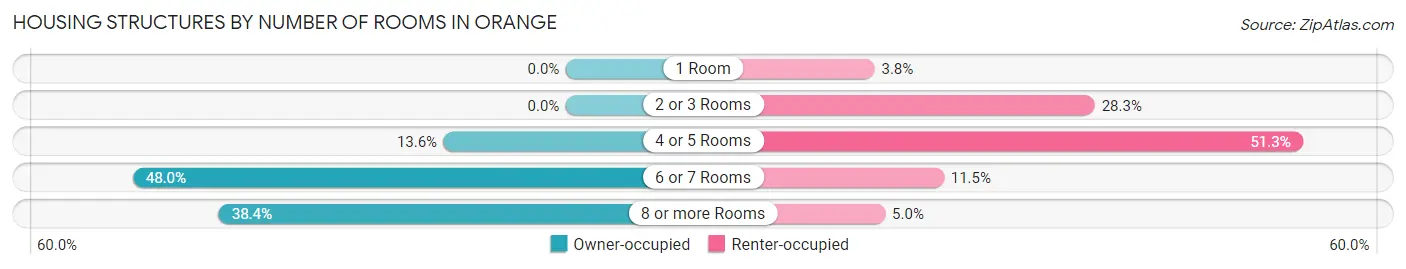
| Number of Rooms | Owner-occupied | Renter-occupied |
| 1 Room | 0 (0.0%) | 39 (3.8%) |
| 2 or 3 Rooms | 0 (0.0%) | 287 (28.3%) |
| 4 or 5 Rooms | 108 (13.6%) | 521 (51.3%) |
| 6 or 7 Rooms | 382 (48.0%) | 117 (11.5%) |
| 8 or more Rooms | 306 (38.4%) | 51 (5.0%) |
| Total | 796 (100.0%) | 1,015 (100.0%) |
Housing Structure by Heating Type in Orange
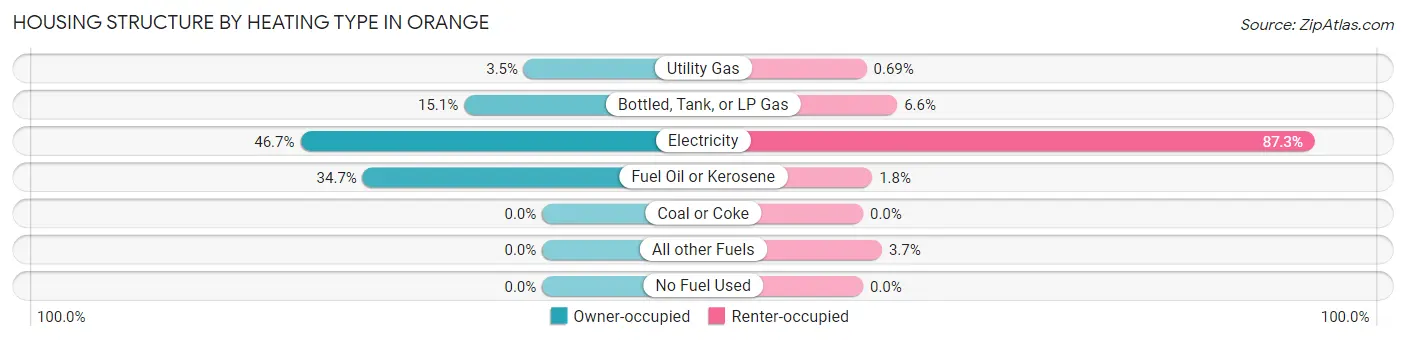
| Heating Type | Owner-occupied | Renter-occupied |
| Utility Gas | 28 (3.5%) | 7 (0.7%) |
| Bottled, Tank, or LP Gas | 120 (15.1%) | 67 (6.6%) |
| Electricity | 372 (46.7%) | 886 (87.3%) |
| Fuel Oil or Kerosene | 276 (34.7%) | 18 (1.8%) |
| Coal or Coke | 0 (0.0%) | 0 (0.0%) |
| All other Fuels | 0 (0.0%) | 37 (3.6%) |
| No Fuel Used | 0 (0.0%) | 0 (0.0%) |
| Total | 796 (100.0%) | 1,015 (100.0%) |
Household Vehicle Usage in Orange
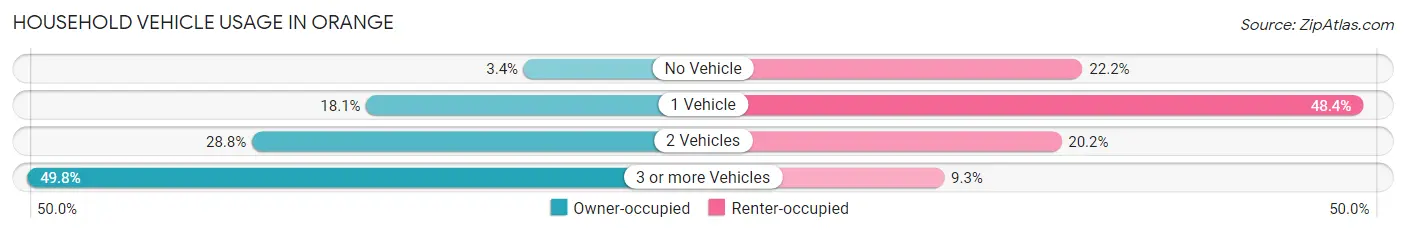
| Vehicles per Household | Owner-occupied | Renter-occupied |
| No Vehicle | 27 (3.4%) | 225 (22.2%) |
| 1 Vehicle | 144 (18.1%) | 491 (48.4%) |
| 2 Vehicles | 229 (28.8%) | 205 (20.2%) |
| 3 or more Vehicles | 396 (49.7%) | 94 (9.3%) |
| Total | 796 (100.0%) | 1,015 (100.0%) |
Real Estate & Mortgages in Orange
Real Estate and Mortgage Overview in Orange
| Characteristic | Without Mortgage | With Mortgage |
| Housing Units | 298 | 498 |
| Median Property Value | $251,800 | $227,700 |
| Median Household Income | $47,264 | $89 |
| Monthly Housing Costs | $504 | $0 |
| Real Estate Taxes | $1,702 | $0 |
Property Value by Mortgage Status in Orange
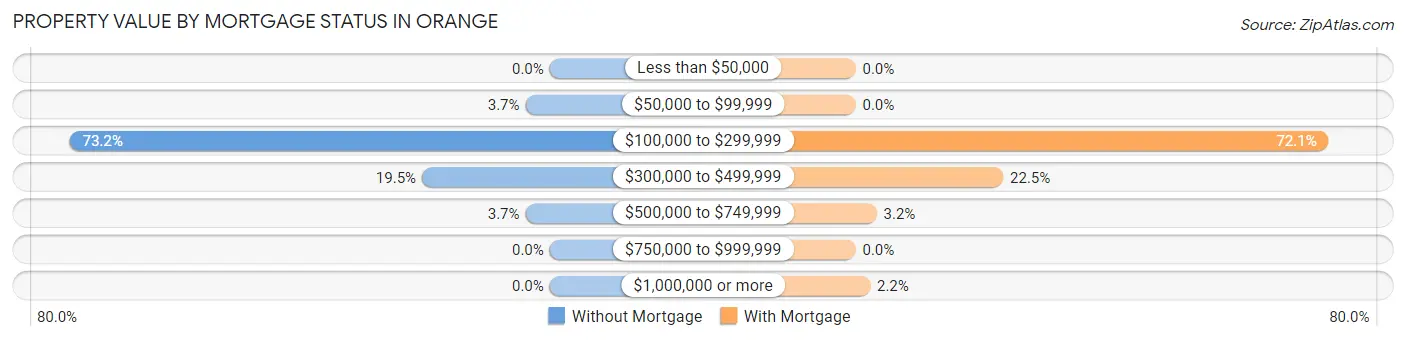
| Property Value | Without Mortgage | With Mortgage |
| Less than $50,000 | 0 (0.0%) | 0 (0.0%) |
| $50,000 to $99,999 | 11 (3.7%) | 0 (0.0%) |
| $100,000 to $299,999 | 218 (73.2%) | 359 (72.1%) |
| $300,000 to $499,999 | 58 (19.5%) | 112 (22.5%) |
| $500,000 to $749,999 | 11 (3.7%) | 16 (3.2%) |
| $750,000 to $999,999 | 0 (0.0%) | 0 (0.0%) |
| $1,000,000 or more | 0 (0.0%) | 11 (2.2%) |
| Total | 298 (100.0%) | 498 (100.0%) |
Household Income by Mortgage Status in Orange
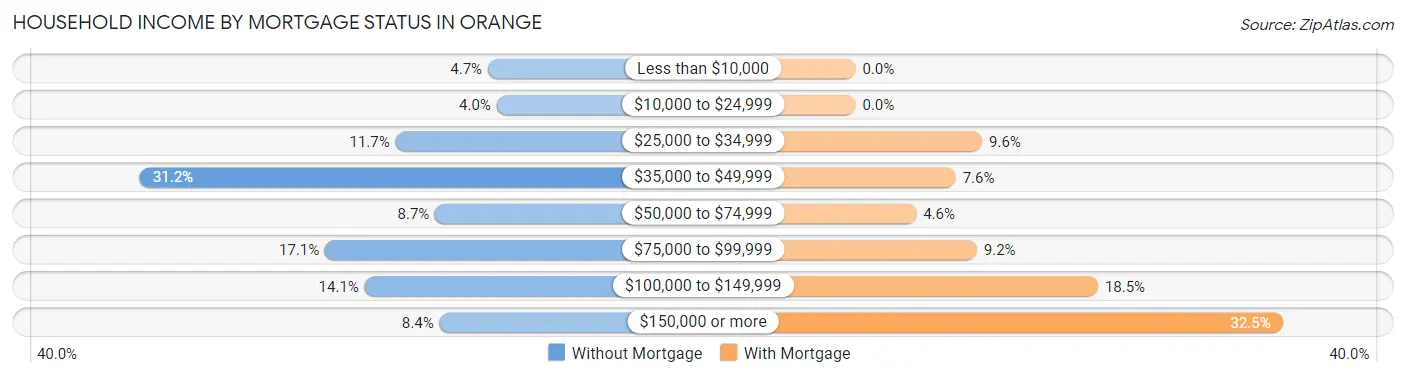
| Household Income | Without Mortgage | With Mortgage |
| Less than $10,000 | 14 (4.7%) | 0 (0.0%) |
| $10,000 to $24,999 | 12 (4.0%) | 0 (0.0%) |
| $25,000 to $34,999 | 35 (11.7%) | 48 (9.6%) |
| $35,000 to $49,999 | 93 (31.2%) | 38 (7.6%) |
| $50,000 to $74,999 | 26 (8.7%) | 23 (4.6%) |
| $75,000 to $99,999 | 51 (17.1%) | 46 (9.2%) |
| $100,000 to $149,999 | 42 (14.1%) | 92 (18.5%) |
| $150,000 or more | 25 (8.4%) | 162 (32.5%) |
| Total | 298 (100.0%) | 498 (100.0%) |
Property Value to Household Income Ratio in Orange
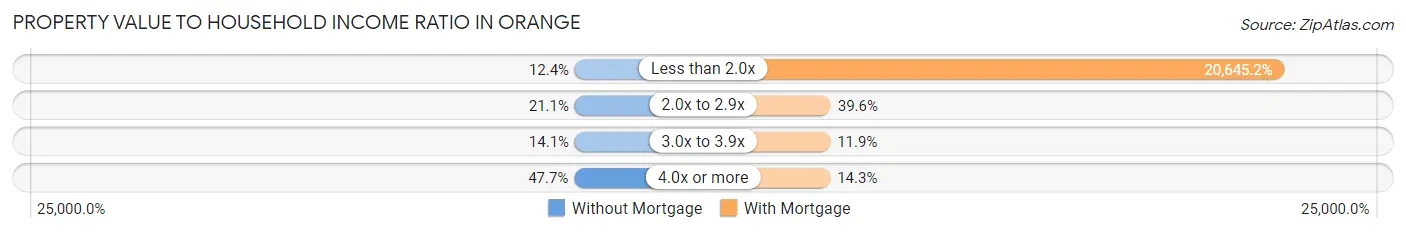
| Value-to-Income Ratio | Without Mortgage | With Mortgage |
| Less than 2.0x | 37 (12.4%) | 102,813 (20,645.2%) |
| 2.0x to 2.9x | 63 (21.1%) | 197 (39.6%) |
| 3.0x to 3.9x | 42 (14.1%) | 59 (11.8%) |
| 4.0x or more | 142 (47.6%) | 71 (14.3%) |
| Total | 298 (100.0%) | 498 (100.0%) |
Real Estate Taxes by Mortgage Status in Orange
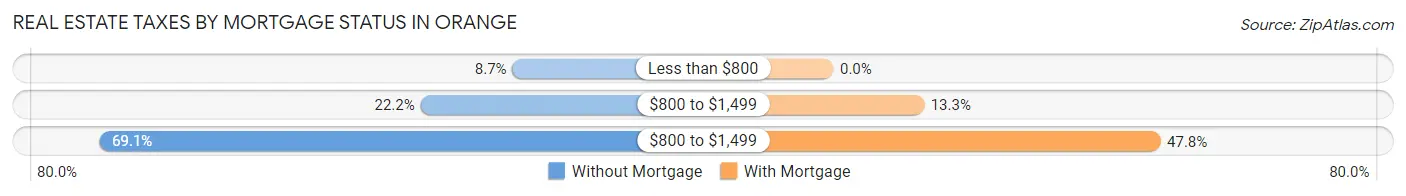
| Property Taxes | Without Mortgage | With Mortgage |
| Less than $800 | 26 (8.7%) | 0 (0.0%) |
| $800 to $1,499 | 66 (22.2%) | 66 (13.3%) |
| $800 to $1,499 | 206 (69.1%) | 238 (47.8%) |
| Total | 298 (100.0%) | 498 (100.0%) |
Health & Disability in Orange
Health Insurance Coverage by Age in Orange
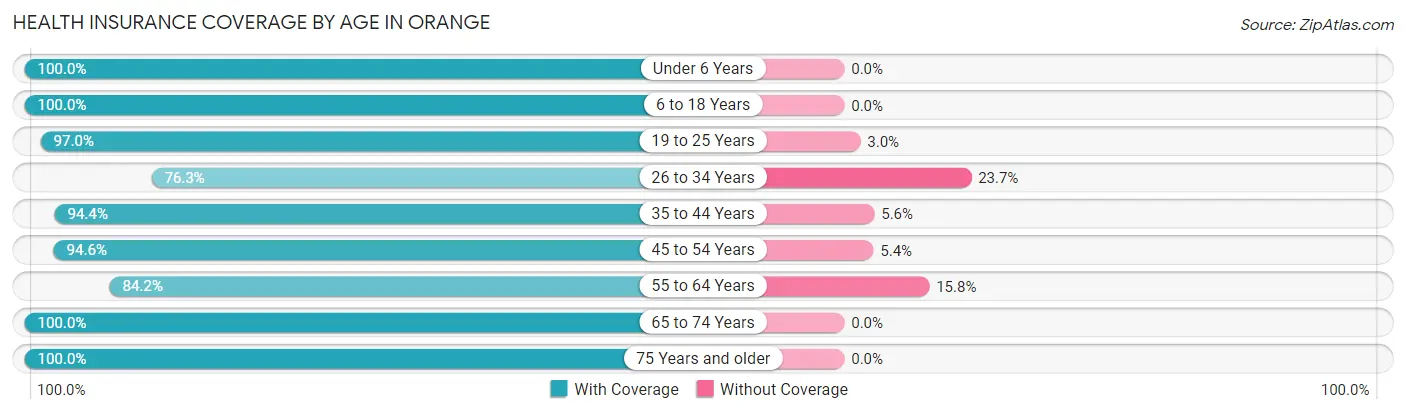
| Age Bracket | With Coverage | Without Coverage |
| Under 6 Years | 307 (100.0%) | 0 (0.0%) |
| 6 to 18 Years | 752 (100.0%) | 0 (0.0%) |
| 19 to 25 Years | 422 (97.0%) | 13 (3.0%) |
| 26 to 34 Years | 526 (76.3%) | 163 (23.7%) |
| 35 to 44 Years | 287 (94.4%) | 17 (5.6%) |
| 45 to 54 Years | 506 (94.6%) | 29 (5.4%) |
| 55 to 64 Years | 563 (84.2%) | 106 (15.8%) |
| 65 to 74 Years | 340 (100.0%) | 0 (0.0%) |
| 75 Years and older | 308 (100.0%) | 0 (0.0%) |
| Total | 4,011 (92.4%) | 328 (7.6%) |
Health Insurance Coverage by Citizenship Status in Orange
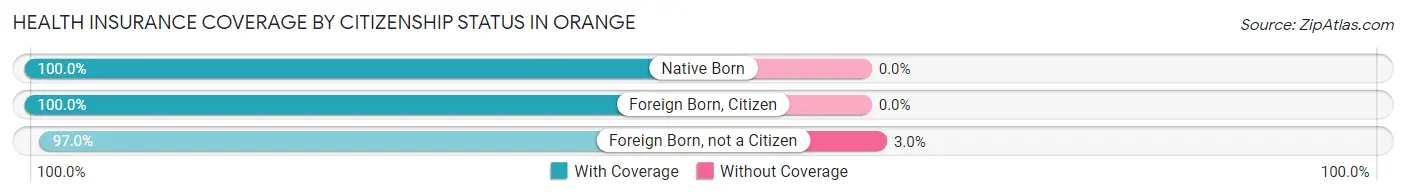
| Citizenship Status | With Coverage | Without Coverage |
| Native Born | 307 (100.0%) | 0 (0.0%) |
| Foreign Born, Citizen | 752 (100.0%) | 0 (0.0%) |
| Foreign Born, not a Citizen | 422 (97.0%) | 13 (3.0%) |
Health Insurance Coverage by Household Income in Orange
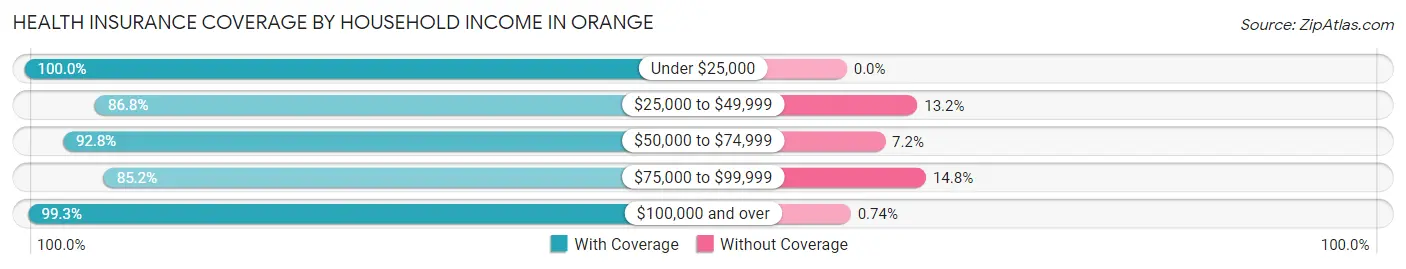
| Household Income | With Coverage | Without Coverage |
| Under $25,000 | 477 (100.0%) | 0 (0.0%) |
| $25,000 to $49,999 | 828 (86.8%) | 126 (13.2%) |
| $50,000 to $74,999 | 620 (92.8%) | 48 (7.2%) |
| $75,000 to $99,999 | 832 (85.2%) | 145 (14.8%) |
| $100,000 and over | 1,208 (99.3%) | 9 (0.7%) |
Public vs Private Health Insurance Coverage by Age in Orange
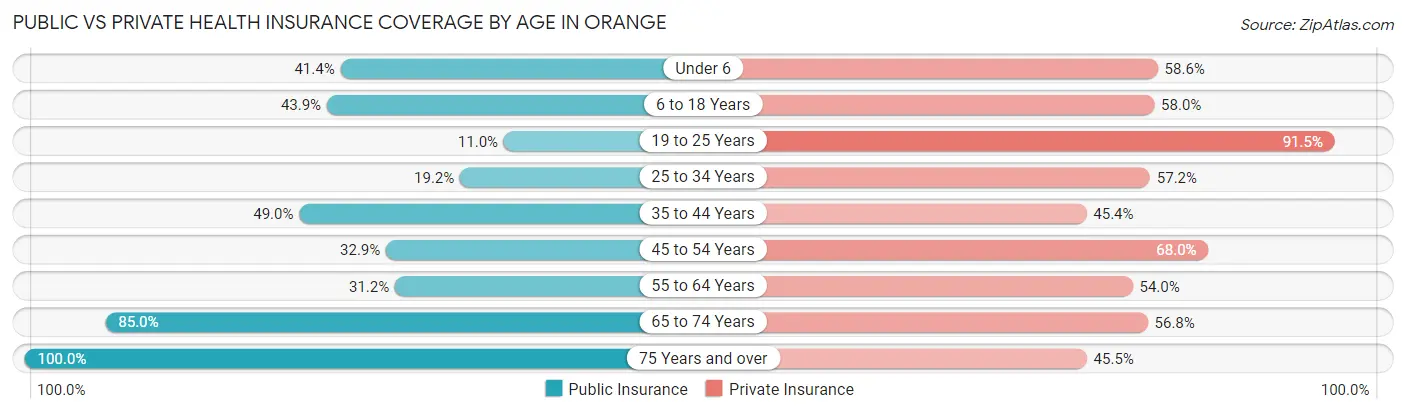
| Age Bracket | Public Insurance | Private Insurance |
| Under 6 | 127 (41.4%) | 180 (58.6%) |
| 6 to 18 Years | 330 (43.9%) | 436 (58.0%) |
| 19 to 25 Years | 48 (11.0%) | 398 (91.5%) |
| 25 to 34 Years | 132 (19.2%) | 394 (57.2%) |
| 35 to 44 Years | 149 (49.0%) | 138 (45.4%) |
| 45 to 54 Years | 176 (32.9%) | 364 (68.0%) |
| 55 to 64 Years | 209 (31.2%) | 361 (54.0%) |
| 65 to 74 Years | 289 (85.0%) | 193 (56.8%) |
| 75 Years and over | 308 (100.0%) | 140 (45.5%) |
| Total | 1,768 (40.7%) | 2,604 (60.0%) |
Disability Status by Sex by Age in Orange
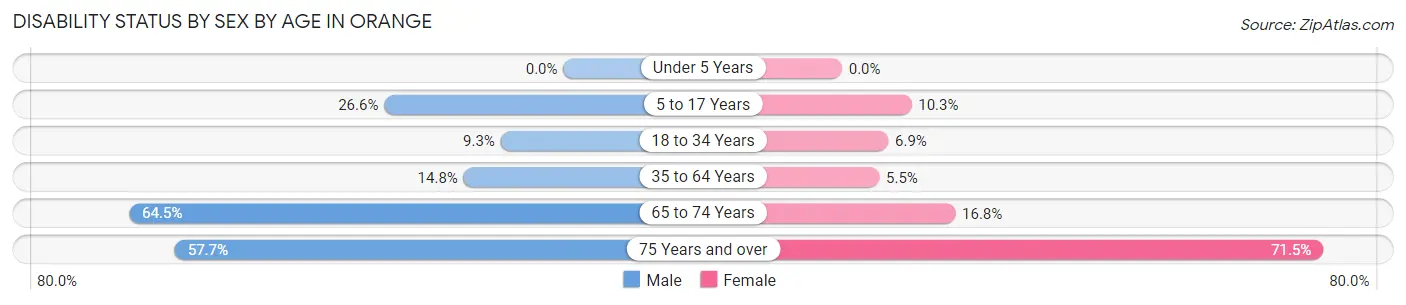
| Age Bracket | Male | Female |
| Under 5 Years | 0 (0.0%) | 0 (0.0%) |
| 5 to 17 Years | 83 (26.6%) | 45 (10.3%) |
| 18 to 34 Years | 61 (9.3%) | 37 (6.9%) |
| 35 to 64 Years | 103 (14.8%) | 45 (5.5%) |
| 65 to 74 Years | 89 (64.5%) | 34 (16.8%) |
| 75 Years and over | 30 (57.7%) | 183 (71.5%) |
Disability Class by Sex by Age in Orange
Disability Class: Hearing Difficulty
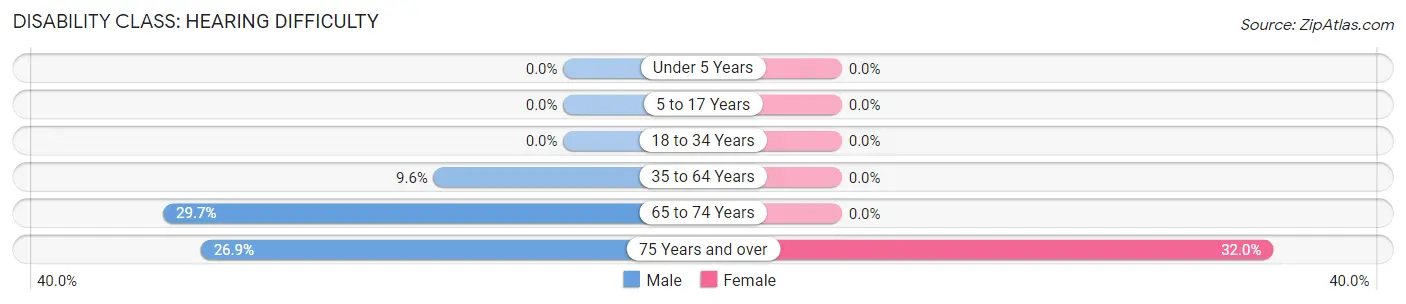
| Age Bracket | Male | Female |
| Under 5 Years | 0 (0.0%) | 0 (0.0%) |
| 5 to 17 Years | 0 (0.0%) | 0 (0.0%) |
| 18 to 34 Years | 0 (0.0%) | 0 (0.0%) |
| 35 to 64 Years | 67 (9.6%) | 0 (0.0%) |
| 65 to 74 Years | 41 (29.7%) | 0 (0.0%) |
| 75 Years and over | 14 (26.9%) | 82 (32.0%) |
Disability Class: Vision Difficulty
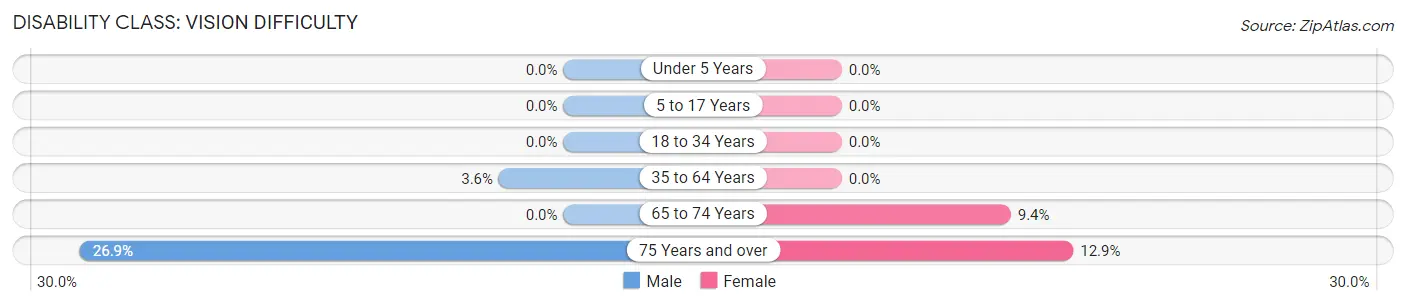
| Age Bracket | Male | Female |
| Under 5 Years | 0 (0.0%) | 0 (0.0%) |
| 5 to 17 Years | 0 (0.0%) | 0 (0.0%) |
| 18 to 34 Years | 0 (0.0%) | 0 (0.0%) |
| 35 to 64 Years | 25 (3.6%) | 0 (0.0%) |
| 65 to 74 Years | 0 (0.0%) | 19 (9.4%) |
| 75 Years and over | 14 (26.9%) | 33 (12.9%) |
Disability Class: Cognitive Difficulty
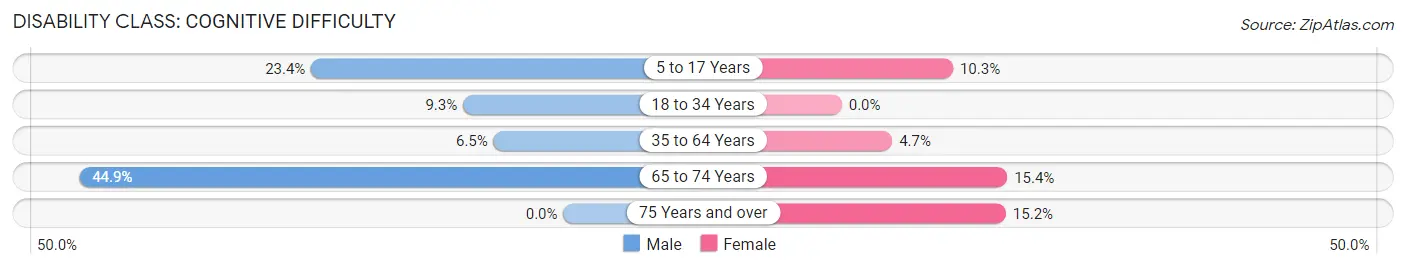
| Age Bracket | Male | Female |
| 5 to 17 Years | 73 (23.4%) | 45 (10.3%) |
| 18 to 34 Years | 61 (9.3%) | 0 (0.0%) |
| 35 to 64 Years | 45 (6.5%) | 38 (4.7%) |
| 65 to 74 Years | 62 (44.9%) | 31 (15.3%) |
| 75 Years and over | 0 (0.0%) | 39 (15.2%) |
Disability Class: Ambulatory Difficulty
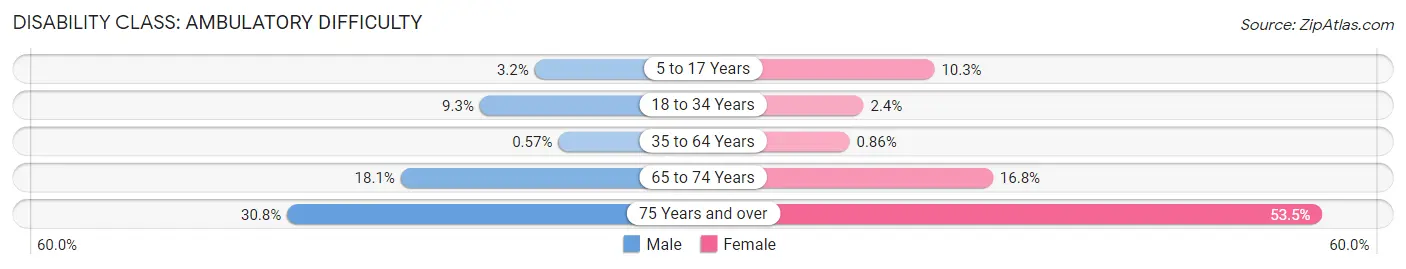
| Age Bracket | Male | Female |
| 5 to 17 Years | 10 (3.2%) | 45 (10.3%) |
| 18 to 34 Years | 61 (9.3%) | 13 (2.4%) |
| 35 to 64 Years | 4 (0.6%) | 7 (0.9%) |
| 65 to 74 Years | 25 (18.1%) | 34 (16.8%) |
| 75 Years and over | 16 (30.8%) | 137 (53.5%) |
Disability Class: Self-Care Difficulty
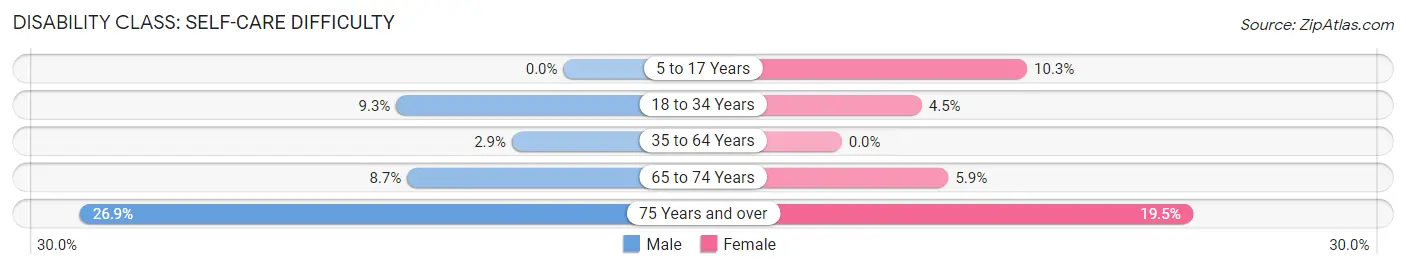
| Age Bracket | Male | Female |
| 5 to 17 Years | 0 (0.0%) | 45 (10.3%) |
| 18 to 34 Years | 61 (9.3%) | 24 (4.5%) |
| 35 to 64 Years | 20 (2.9%) | 0 (0.0%) |
| 65 to 74 Years | 12 (8.7%) | 12 (5.9%) |
| 75 Years and over | 14 (26.9%) | 50 (19.5%) |
Technology Access in Orange
Computing Device Access in Orange
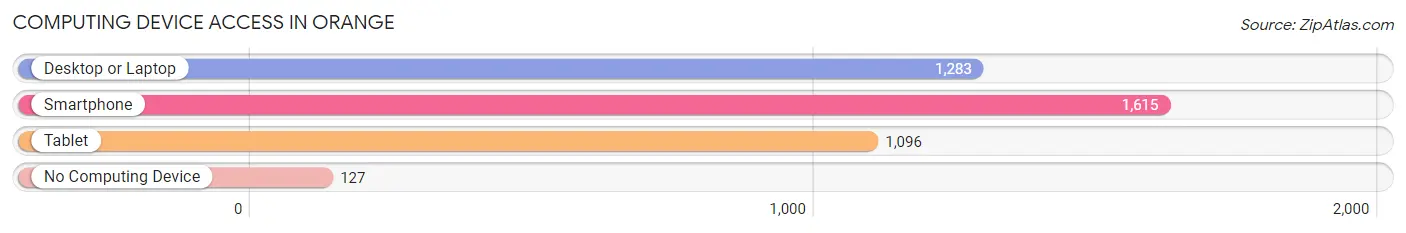
| Device Type | # Households | % Households |
| Desktop or Laptop | 1,283 | 70.8% |
| Smartphone | 1,615 | 89.2% |
| Tablet | 1,096 | 60.5% |
| No Computing Device | 127 | 7.0% |
| Total | 1,811 | 100.0% |
Internet Access in Orange
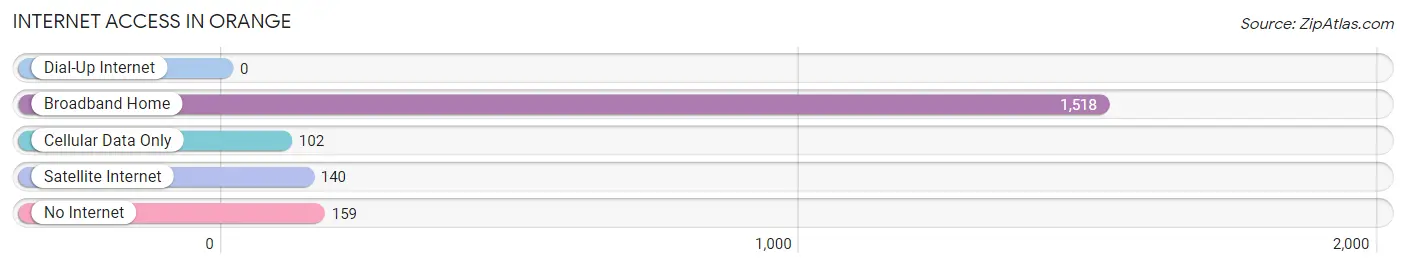
| Internet Type | # Households | % Households |
| Dial-Up Internet | 0 | 0.0% |
| Broadband Home | 1,518 | 83.8% |
| Cellular Data Only | 102 | 5.6% |
| Satellite Internet | 140 | 7.7% |
| No Internet | 159 | 8.8% |
| Total | 1,811 | 100.0% |
Orange Summary
Orange, Virginia is a small town located in the foothills of the Blue Ridge Mountains in the central part of the state. It is the county seat of Orange County and is located about 60 miles northwest of Richmond. The town has a population of 4,721 as of the 2010 census.
Geography
Orange is located in the foothills of the Blue Ridge Mountains in the Piedmont region of Virginia. The town is situated on the Rapidan River, which is a tributary of the Rappahannock River. The town is located at the intersection of U.S. Route 15 and U.S. Route 20. The town is surrounded by the towns of Gordonsville, Barboursville, and Locust Grove. The town is located in a rural area and is surrounded by farms and forests.
History
Orange was founded in 1734 by William and Mary College. The town was named after William IV, Prince of Orange. The town was originally a trading post and was an important stop on the Great Wagon Road. The town was also an important stop on the Orange and Alexandria Railroad, which was built in the mid-1800s. The railroad connected Orange to Washington, D.C. and Richmond.
The town was an important center of the Civil War. The Battle of the Wilderness was fought nearby in 1864. The town was also the site of the Battle of Mine Run in 1863.
Economy
Orange is a small town with a limited economy. The town is home to several small businesses, including restaurants, shops, and a few manufacturing companies. The town is also home to a few wineries and vineyards. The town is also home to a few small farms.
The town is also home to a few government offices, including the Orange County Courthouse and the Orange County Sheriff's Office. The town is also home to a few schools, including Orange County High School and Orange Elementary School.
Demographics
As of the 2010 census, the population of Orange was 4,721. The population is predominantly white (90.2%) and African American (7.2%). The median household income is $45,945 and the median age is 40.
Conclusion
Orange, Virginia is a small town located in the foothills of the Blue Ridge Mountains in the central part of the state. It is the county seat of Orange County and is located about 60 miles northwest of Richmond. The town has a population of 4,721 as of the 2010 census. The town is surrounded by farms and forests and is home to several small businesses, including restaurants, shops, and a few manufacturing companies. The town is also home to a few government offices, including the Orange County Courthouse and the Orange County Sheriff's Office. The population is predominantly white (90.2%) and African American (7.2%). The median household income is $45,945 and the median age is 40.
Common Questions
What is Per Capita Income in Orange?
Per Capita income in Orange is $27,315.
What is the Median Family Income in Orange?
Median Family Income in Orange is $78,685.
What is the Median Household income in Orange?
Median Household Income in Orange is $59,196.
What is Income or Wage Gap in Orange?
Income or Wage Gap in Orange is 25.3%.
Women in Orange earn 74.7 cents for every dollar earned by a man.
What is Family Income Deficit in Orange?
Family Income Deficit in Orange is $2,978.
Families that are below poverty line in Orange earn $2,978 less on average than the poverty threshold level.
What is Inequality or Gini Index in Orange?
Inequality or Gini Index in Orange is 0.37.
What is the Total Population of Orange?
Total Population of Orange is 4,919.
What is the Total Male Population of Orange?
Total Male Population of Orange is 2,396.
What is the Total Female Population of Orange?
Total Female Population of Orange is 2,523.
What is the Ratio of Males per 100 Females in Orange?
There are 94.97 Males per 100 Females in Orange.
What is the Ratio of Females per 100 Males in Orange?
There are 105.30 Females per 100 Males in Orange.
What is the Median Population Age in Orange?
Median Population Age in Orange is 37.1 Years.
What is the Average Family Size in Orange
Average Family Size in Orange is 3.1 People.
What is the Average Household Size in Orange
Average Household Size in Orange is 2.4 People.
How Large is the Labor Force in Orange?
There are 2,237 People in the Labor Forcein in Orange.
What is the Percentage of People in the Labor Force in Orange?
55.9% of People are in the Labor Force in Orange.
What is the Unemployment Rate in Orange?
Unemployment Rate in Orange is 6.8%.