Opal, VA Map & Demographics
Opal Map
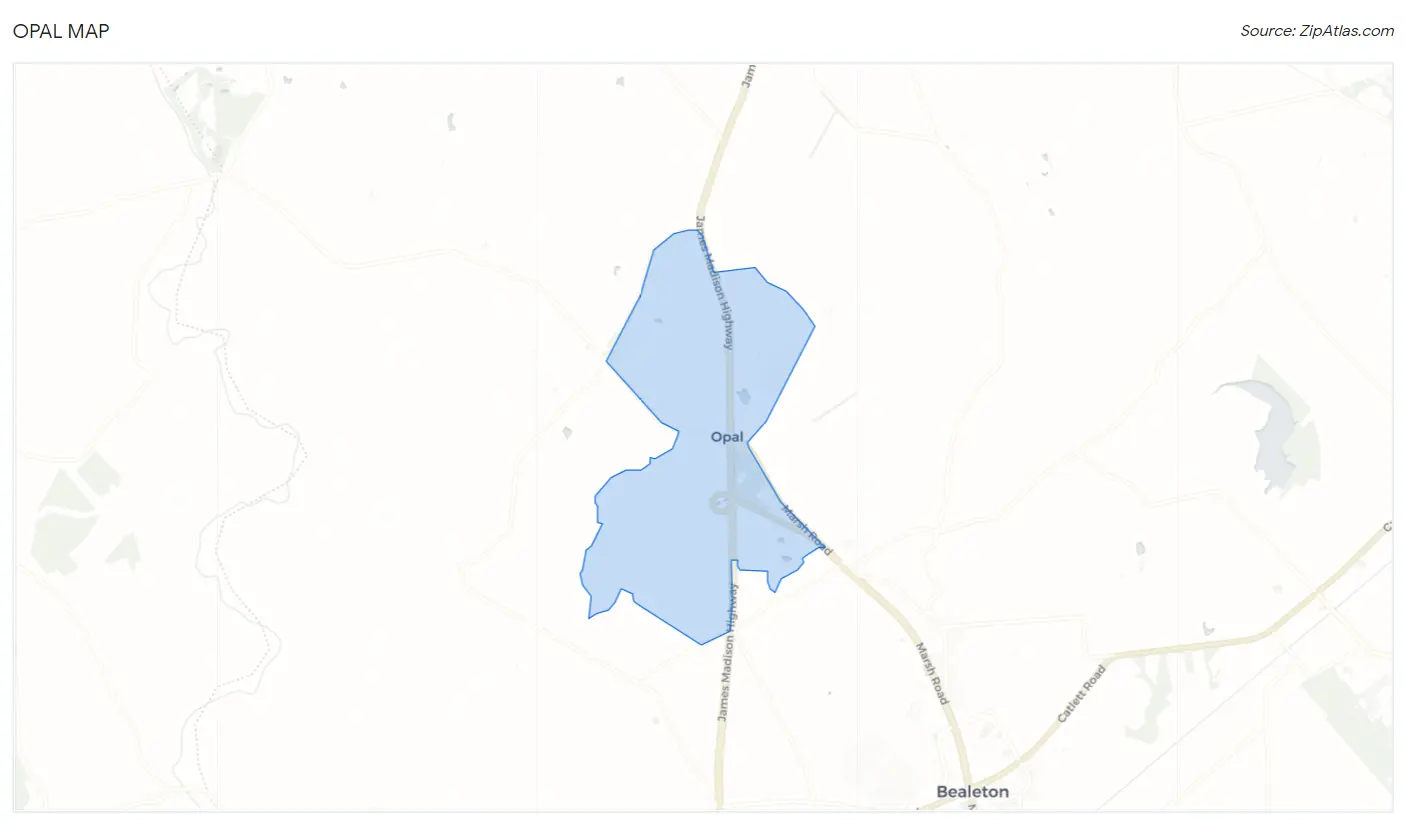
Opal Overview
$51,105
PER CAPITA INCOME
$186,719
AVG FAMILY INCOME
$185,536
AVG HOUSEHOLD INCOME
23.0%
WAGE / INCOME GAP [ % ]
77.0¢/ $1
WAGE / INCOME GAP [ $ ]
0.29
INEQUALITY / GINI INDEX
756
TOTAL POPULATION
381
MALE POPULATION
375
FEMALE POPULATION
101.60
MALES / 100 FEMALES
98.43
FEMALES / 100 MALES
36.7
MEDIAN AGE
3.9
AVG FAMILY SIZE
3.8
AVG HOUSEHOLD SIZE
512
LABOR FORCE [ PEOPLE ]
86.8%
PERCENT IN LABOR FORCE
1.2%
UNEMPLOYMENT RATE
Income in Opal
Income Overview in Opal
Per Capita Income in Opal is $51,105, while median incomes of families and households are $186,719 and $185,536 respectively.
| Characteristic | Number | Measure |
| Per Capita Income | 756 | $51,105 |
| Median Family Income | 183 | $186,719 |
| Mean Family Income | 183 | $188,059 |
| Median Household Income | 200 | $185,536 |
| Mean Household Income | 200 | $181,594 |
| Income Deficit | 183 | $0 |
| Wage / Income Gap (%) | 756 | 22.99% |
| Wage / Income Gap ($) | 756 | 77.01¢ per $1 |
| Gini / Inequality Index | 756 | 0.29 |
Earnings by Sex in Opal
Average Earnings in Opal are $57,102, $60,521 for men and $46,607 for women, a difference of 23.0%.
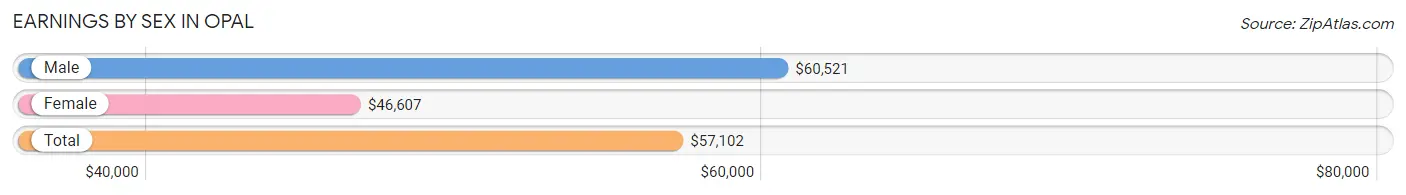
| Sex | Number | Average Earnings |
| Male | 243 (47.2%) | $60,521 |
| Female | 272 (52.8%) | $46,607 |
| Total | 515 (100.0%) | $57,102 |
Earnings by Sex by Income Bracket in Opal
The most common earnings brackets in Opal are $75,000 to $99,999 for men (52 | 21.4%) and $75,000 to $99,999 for women (58 | 21.3%).
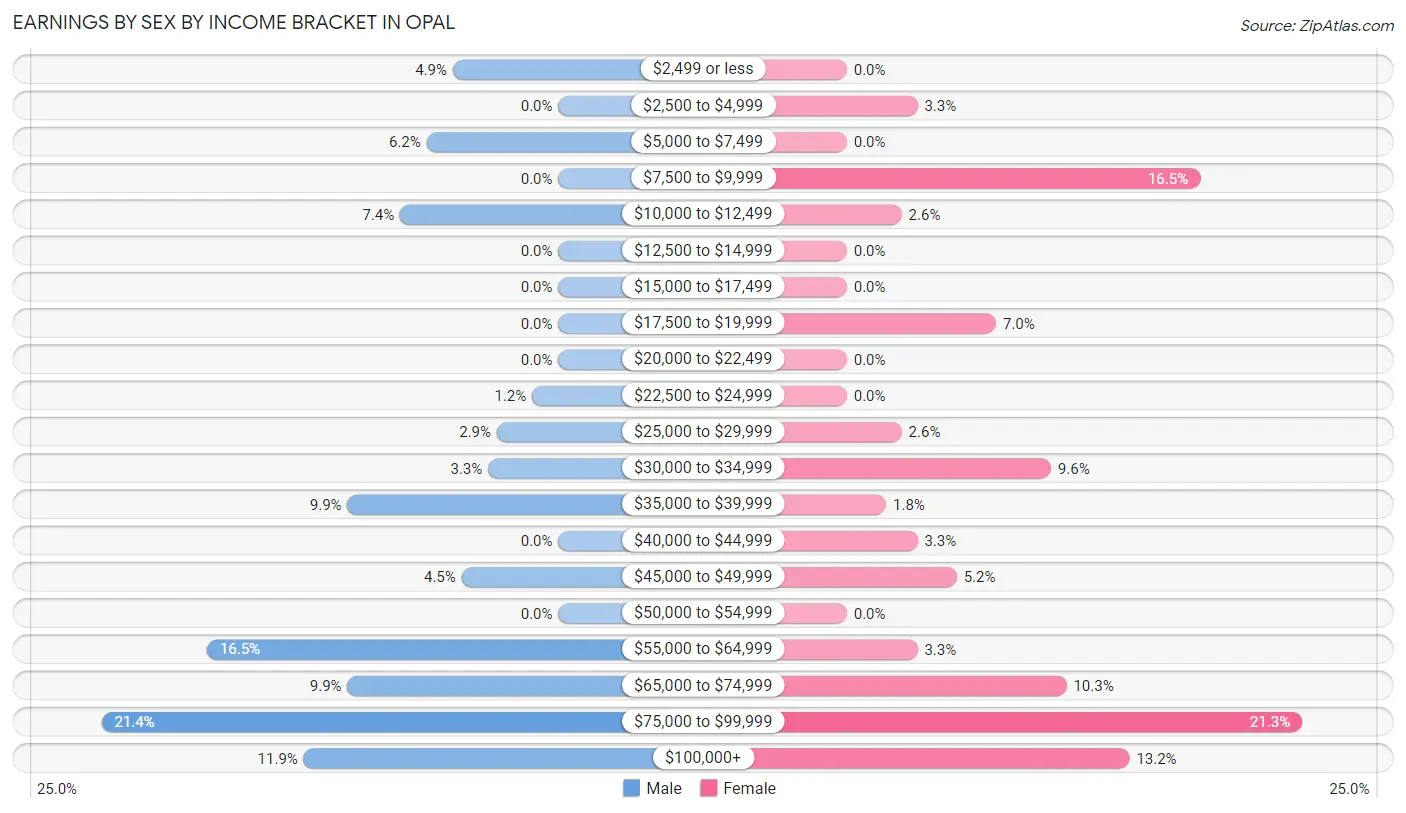
| Income | Male | Female |
| $2,499 or less | 12 (4.9%) | 0 (0.0%) |
| $2,500 to $4,999 | 0 (0.0%) | 9 (3.3%) |
| $5,000 to $7,499 | 15 (6.2%) | 0 (0.0%) |
| $7,500 to $9,999 | 0 (0.0%) | 45 (16.5%) |
| $10,000 to $12,499 | 18 (7.4%) | 7 (2.6%) |
| $12,500 to $14,999 | 0 (0.0%) | 0 (0.0%) |
| $15,000 to $17,499 | 0 (0.0%) | 0 (0.0%) |
| $17,500 to $19,999 | 0 (0.0%) | 19 (7.0%) |
| $20,000 to $22,499 | 0 (0.0%) | 0 (0.0%) |
| $22,500 to $24,999 | 3 (1.2%) | 0 (0.0%) |
| $25,000 to $29,999 | 7 (2.9%) | 7 (2.6%) |
| $30,000 to $34,999 | 8 (3.3%) | 26 (9.6%) |
| $35,000 to $39,999 | 24 (9.9%) | 5 (1.8%) |
| $40,000 to $44,999 | 0 (0.0%) | 9 (3.3%) |
| $45,000 to $49,999 | 11 (4.5%) | 14 (5.1%) |
| $50,000 to $54,999 | 0 (0.0%) | 0 (0.0%) |
| $55,000 to $64,999 | 40 (16.5%) | 9 (3.3%) |
| $65,000 to $74,999 | 24 (9.9%) | 28 (10.3%) |
| $75,000 to $99,999 | 52 (21.4%) | 58 (21.3%) |
| $100,000+ | 29 (11.9%) | 36 (13.2%) |
| Total | 243 (100.0%) | 272 (100.0%) |
Earnings by Sex by Educational Attainment in Opal
Average earnings in Opal are $66,667 for men and $73,750 for women, a difference of 9.6%. Men with an educational attainment of bachelor's degree enjoy the highest average annual earnings of $95,508, while those with high school diploma education earn the least with $39,107. Women with an educational attainment of graduate degree earn the most with the average annual earnings of $93,750, while those with college or associate's degree education have the smallest earnings of $46,806.
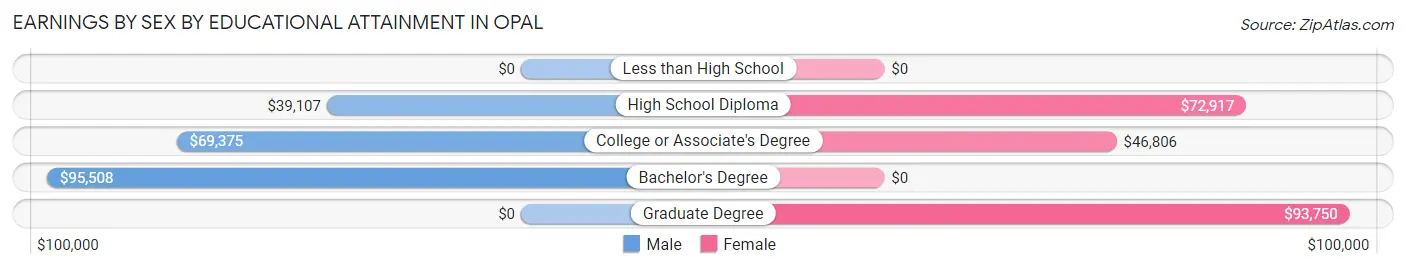
| Educational Attainment | Male Income | Female Income |
| Less than High School | - | - |
| High School Diploma | $39,107 | $72,917 |
| College or Associate's Degree | $69,375 | $46,806 |
| Bachelor's Degree | $95,508 | $0 |
| Graduate Degree | - | - |
| Total | $66,667 | $73,750 |
Family Income in Opal
Family Income Brackets in Opal
According to the Opal family income data, there are 70 families falling into the $200,000+ income range, which is the most common income bracket and makes up 38.3% of all families.
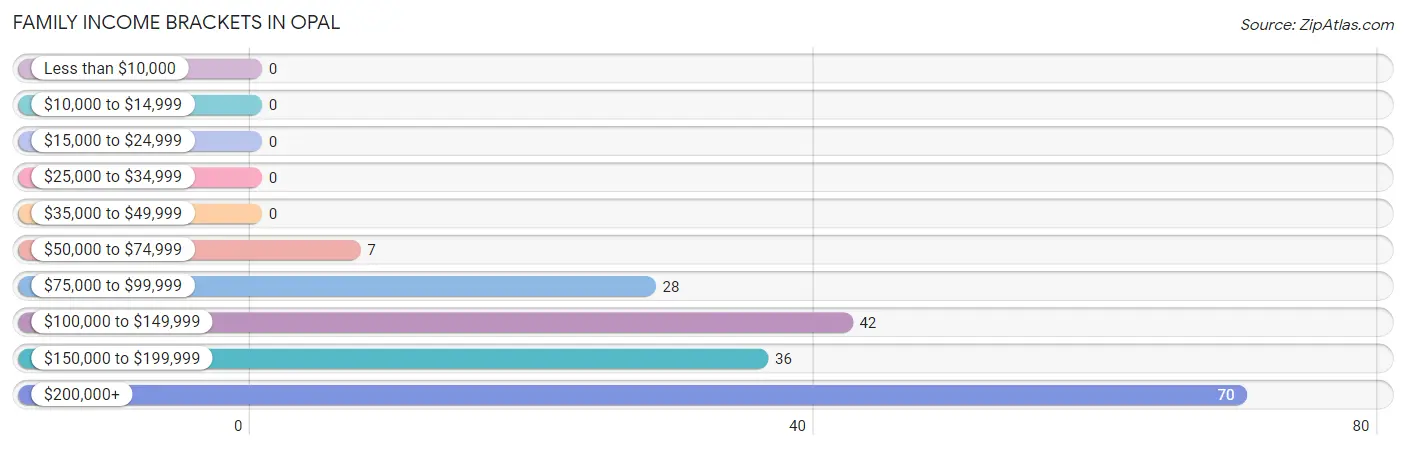
| Income Bracket | # Families | % Families |
| Less than $10,000 | 0 | 0.0% |
| $10,000 to $14,999 | 0 | 0.0% |
| $15,000 to $24,999 | 0 | 0.0% |
| $25,000 to $34,999 | 0 | 0.0% |
| $35,000 to $49,999 | 0 | 0.0% |
| $50,000 to $74,999 | 7 | 3.8% |
| $75,000 to $99,999 | 28 | 15.3% |
| $100,000 to $149,999 | 42 | 23.0% |
| $150,000 to $199,999 | 36 | 19.7% |
| $200,000+ | 70 | 38.3% |
Family Income by Famaliy Size in Opal
3-person families (30 | 16.4%) account for the highest median family income in Opal with $188,750 per family, while 3-person families (30 | 16.4%) have the highest median income of $62,917 per family member.
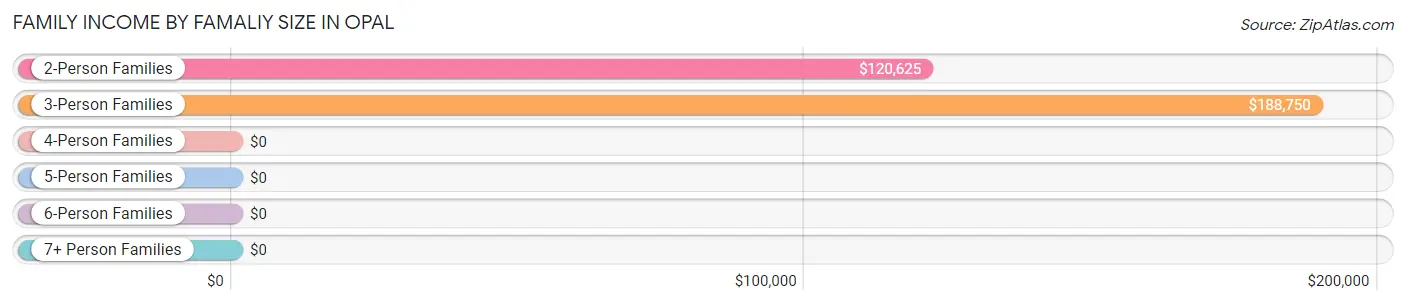
| Income Bracket | # Families | Median Income |
| 2-Person Families | 73 (39.9%) | $120,625 |
| 3-Person Families | 30 (16.4%) | $188,750 |
| 4-Person Families | 40 (21.9%) | $0 |
| 5-Person Families | 7 (3.8%) | $0 |
| 6-Person Families | 22 (12.0%) | $0 |
| 7+ Person Families | 11 (6.0%) | $0 |
| Total | 183 (100.0%) | $186,719 |
Family Income by Number of Earners in Opal
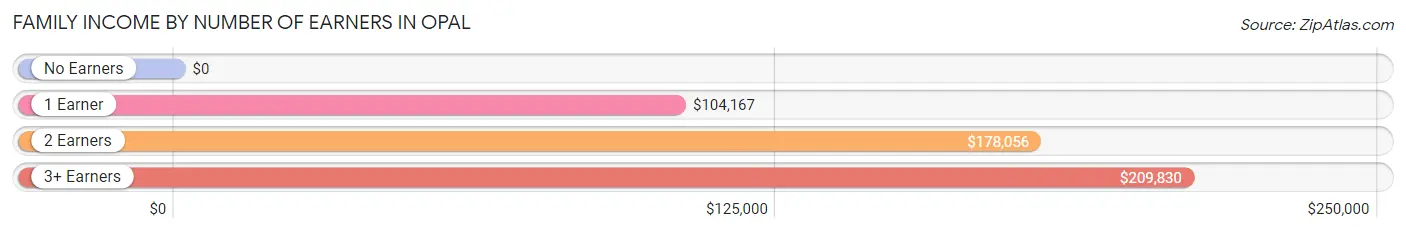
| Number of Earners | # Families | Median Income |
| No Earners | 0 (0.0%) | $0 |
| 1 Earner | 32 (17.5%) | $104,167 |
| 2 Earners | 94 (51.4%) | $178,056 |
| 3+ Earners | 57 (31.1%) | $209,830 |
| Total | 183 (100.0%) | $186,719 |
Household Income in Opal
Household Income Brackets in Opal
With 70 households falling in the category, the $200,000+ income range is the most frequent in Opal, accounting for 35.0% of all households.
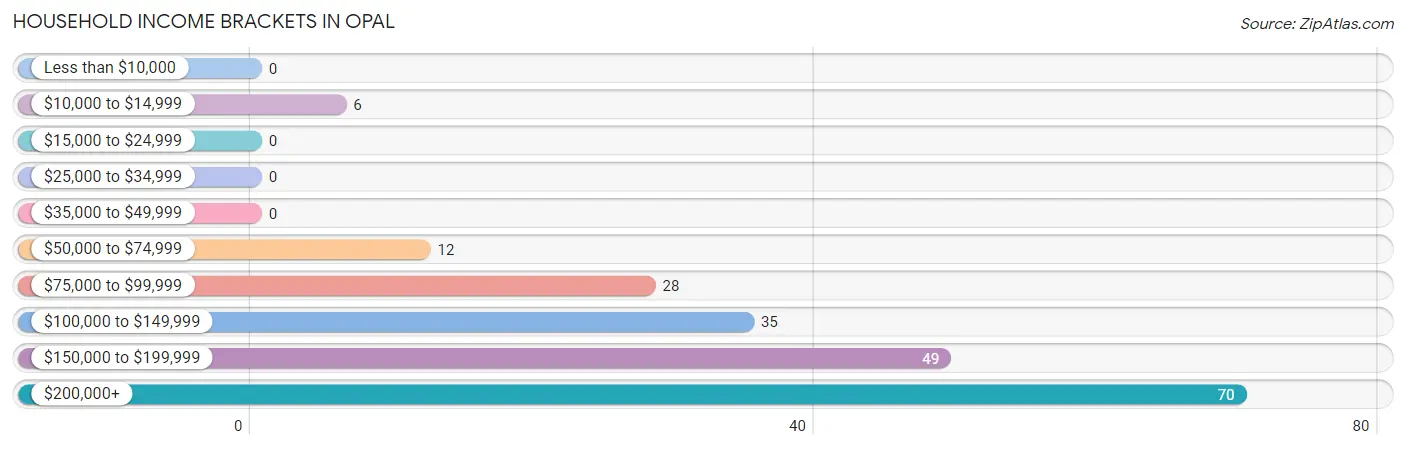
| Income Bracket | # Households | % Households |
| Less than $10,000 | 0 | 0.0% |
| $10,000 to $14,999 | 6 | 3.0% |
| $15,000 to $24,999 | 0 | 0.0% |
| $25,000 to $34,999 | 0 | 0.0% |
| $35,000 to $49,999 | 0 | 0.0% |
| $50,000 to $74,999 | 12 | 6.0% |
| $75,000 to $99,999 | 28 | 14.0% |
| $100,000 to $149,999 | 35 | 17.5% |
| $150,000 to $199,999 | 49 | 24.5% |
| $200,000+ | 70 | 35.0% |
Household Income by Householder Age in Opal
The median household income in Opal is $185,536, with the highest median household income of $197,679 found in the 45 to 64 years age bracket for the primary householder. A total of 109 households (54.5%) fall into this category.
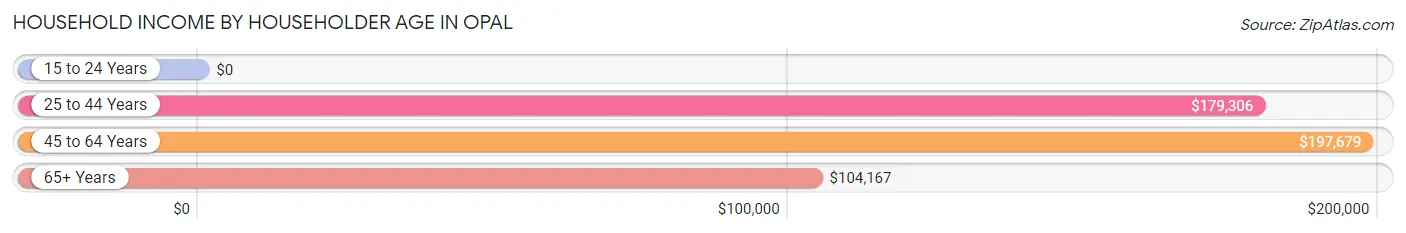
| Income Bracket | # Households | Median Income |
| 15 to 24 Years | 0 (0.0%) | $0 |
| 25 to 44 Years | 61 (30.5%) | $179,306 |
| 45 to 64 Years | 109 (54.5%) | $197,679 |
| 65+ Years | 30 (15.0%) | $104,167 |
| Total | 200 (100.0%) | $185,536 |
Poverty in Opal
Income Below Poverty by Sex and Age in Opal
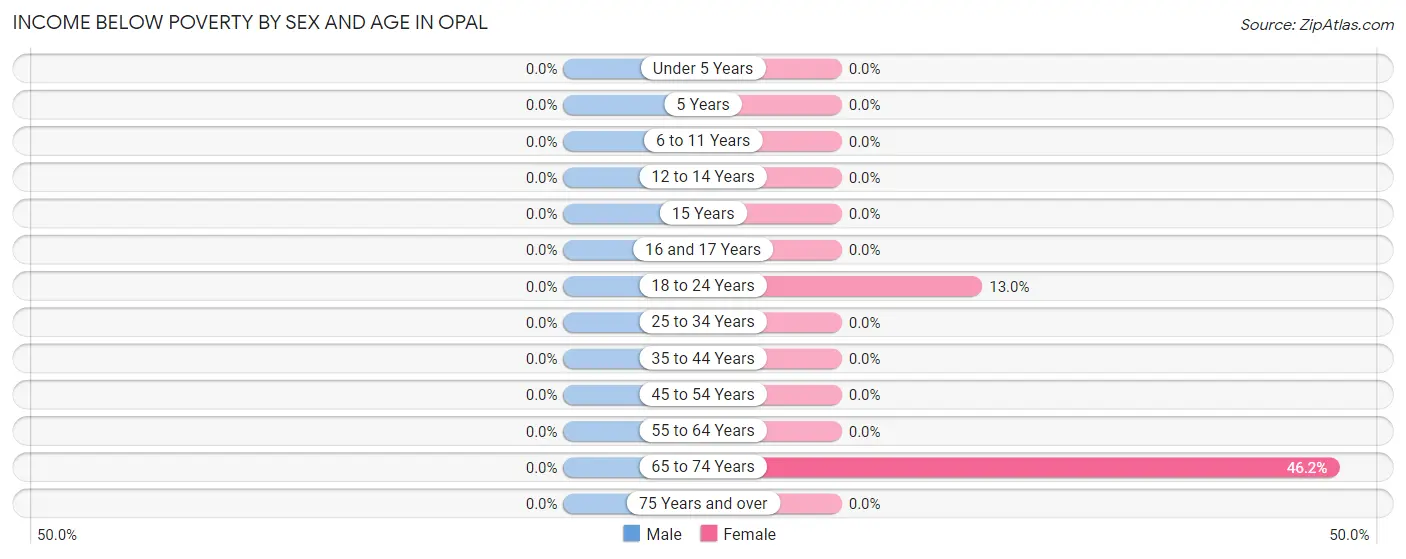
| Age Bracket | Male | Female |
| Under 5 Years | 0 (0.0%) | 0 (0.0%) |
| 5 Years | 0 (0.0%) | 0 (0.0%) |
| 6 to 11 Years | 0 (0.0%) | 0 (0.0%) |
| 12 to 14 Years | 0 (0.0%) | 0 (0.0%) |
| 15 Years | 0 (0.0%) | 0 (0.0%) |
| 16 and 17 Years | 0 (0.0%) | 0 (0.0%) |
| 18 to 24 Years | 0 (0.0%) | 9 (13.0%) |
| 25 to 34 Years | 0 (0.0%) | 0 (0.0%) |
| 35 to 44 Years | 0 (0.0%) | 0 (0.0%) |
| 45 to 54 Years | 0 (0.0%) | 0 (0.0%) |
| 55 to 64 Years | 0 (0.0%) | 0 (0.0%) |
| 65 to 74 Years | 0 (0.0%) | 6 (46.2%) |
| 75 Years and over | 0 (0.0%) | 0 (0.0%) |
| Total | 0 (0.0%) | 15 (4.0%) |
Income Above Poverty by Sex and Age in Opal
According to the poverty statistics in Opal, males aged 6 to 11 years and females aged under 5 years are the age groups that are most secure financially, with 100.0% of males and 100.0% of females in these age groups living above the poverty line.
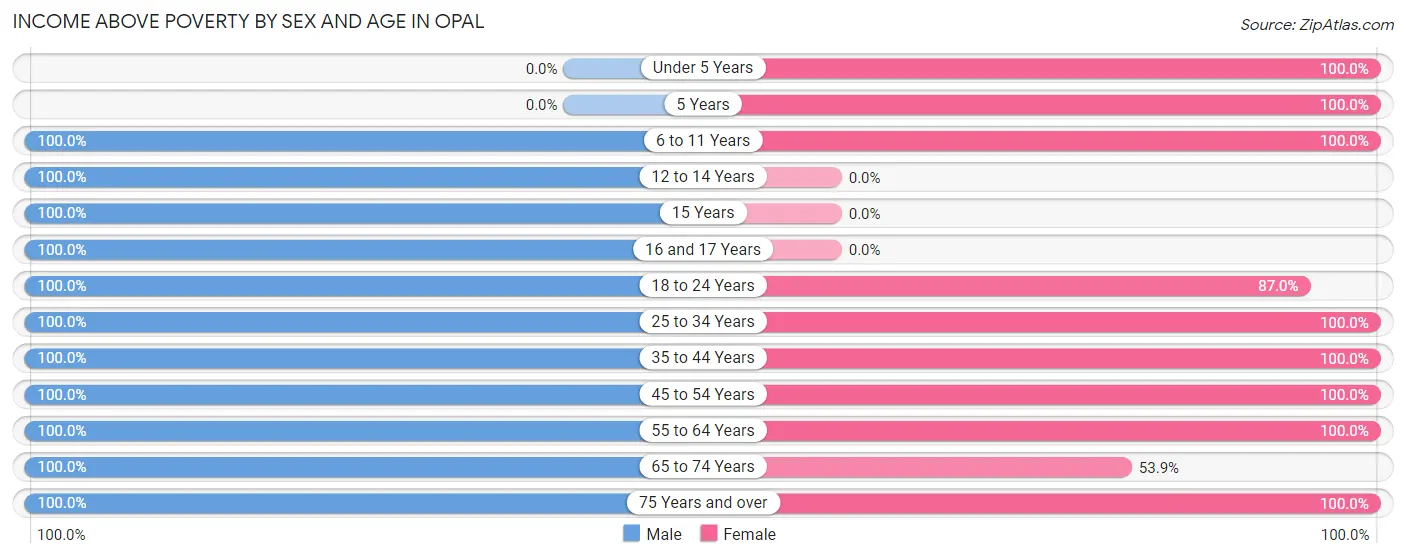
| Age Bracket | Male | Female |
| Under 5 Years | 0 (0.0%) | 21 (100.0%) |
| 5 Years | 0 (0.0%) | 4 (100.0%) |
| 6 to 11 Years | 61 (100.0%) | 52 (100.0%) |
| 12 to 14 Years | 13 (100.0%) | 0 (0.0%) |
| 15 Years | 15 (100.0%) | 0 (0.0%) |
| 16 and 17 Years | 24 (100.0%) | 0 (0.0%) |
| 18 to 24 Years | 33 (100.0%) | 60 (87.0%) |
| 25 to 34 Years | 29 (100.0%) | 40 (100.0%) |
| 35 to 44 Years | 65 (100.0%) | 56 (100.0%) |
| 45 to 54 Years | 65 (100.0%) | 41 (100.0%) |
| 55 to 64 Years | 52 (100.0%) | 76 (100.0%) |
| 65 to 74 Years | 15 (100.0%) | 7 (53.8%) |
| 75 Years and over | 9 (100.0%) | 3 (100.0%) |
| Total | 381 (100.0%) | 360 (96.0%) |
Income Below Poverty Among Married-Couple Families in Opal
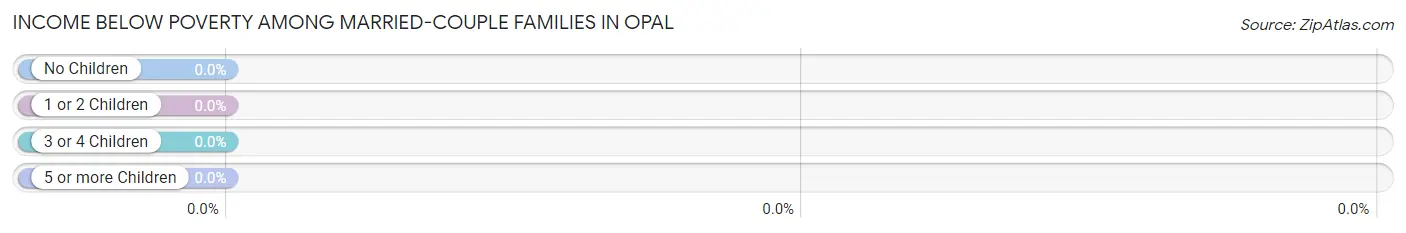
| Children | Above Poverty | Below Poverty |
| No Children | 71 (100.0%) | 0 (0.0%) |
| 1 or 2 Children | 67 (100.0%) | 0 (0.0%) |
| 3 or 4 Children | 11 (100.0%) | 0 (0.0%) |
| 5 or more Children | 0 (0.0%) | 0 (0.0%) |
| Total | 149 (100.0%) | 0 (0.0%) |
Income Below Poverty Among Single-Parent Households in Opal
| Children | Single Father | Single Mother |
| No Children | 0 (0.0%) | 0 (0.0%) |
| 1 or 2 Children | 0 (0.0%) | 0 (0.0%) |
| 3 or 4 Children | 0 (0.0%) | 0 (0.0%) |
| 5 or more Children | 0 (0.0%) | 0 (0.0%) |
| Total | 0 (0.0%) | 0 (0.0%) |
Income Below Poverty Among Married-Couple vs Single-Parent Households in Opal
| Children | Married-Couple Families | Single-Parent Households |
| No Children | 0 (0.0%) | 0 (0.0%) |
| 1 or 2 Children | 0 (0.0%) | 0 (0.0%) |
| 3 or 4 Children | 0 (0.0%) | 0 (0.0%) |
| 5 or more Children | 0 (0.0%) | 0 (0.0%) |
| Total | 0 (0.0%) | 0 (0.0%) |
Race in Opal
The most populous races in Opal are White / Caucasian (558 | 73.8%), Hispanic or Latino (181 | 23.9%), and Two or more Races (80 | 10.6%).

| Race | # Population | % Population |
| Asian | 21 | 2.8% |
| Black / African American | 72 | 9.5% |
| Hawaiian / Pacific | 0 | 0.0% |
| Hispanic or Latino | 181 | 23.9% |
| Native / Alaskan | 0 | 0.0% |
| White / Caucasian | 558 | 73.8% |
| Two or more Races | 80 | 10.6% |
| Some other Race | 25 | 3.3% |
| Total | 756 | 100.0% |
Ancestry in Opal
The most populous ancestries reported in Opal are Central American (150 | 19.8%), Salvadoran (128 | 16.9%), English (99 | 13.1%), Scottish (86 | 11.4%), and German (54 | 7.1%), together accounting for 68.4% of all Opal residents.
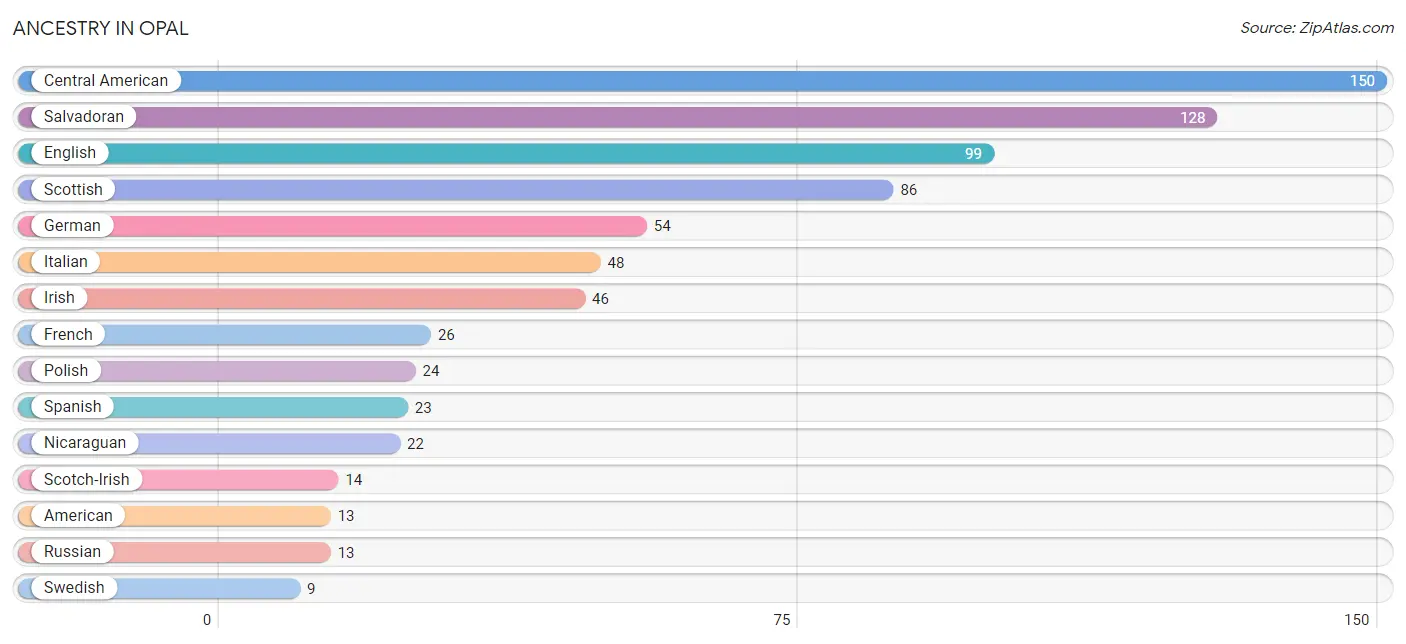
| Ancestry | # Population | % Population |
| American | 13 | 1.7% |
| British West Indian | 7 | 0.9% |
| Central American | 150 | 19.8% |
| English | 99 | 13.1% |
| French | 26 | 3.4% |
| German | 54 | 7.1% |
| Irish | 46 | 6.1% |
| Italian | 48 | 6.4% |
| Nicaraguan | 22 | 2.9% |
| Norwegian | 5 | 0.7% |
| Polish | 24 | 3.2% |
| Puerto Rican | 8 | 1.1% |
| Romanian | 4 | 0.5% |
| Russian | 13 | 1.7% |
| Salvadoran | 128 | 16.9% |
| Scotch-Irish | 14 | 1.8% |
| Scottish | 86 | 11.4% |
| Spanish | 23 | 3.0% |
| Swedish | 9 | 1.2% | View All 19 Rows |
Immigrants in Opal
The most numerous immigrant groups reported in Opal came from Latin America (67 | 8.9%), Central America (54 | 7.1%), El Salvador (32 | 4.2%), Nicaragua (22 | 2.9%), and Caribbean (13 | 1.7%), together accounting for 24.9% of all Opal residents.
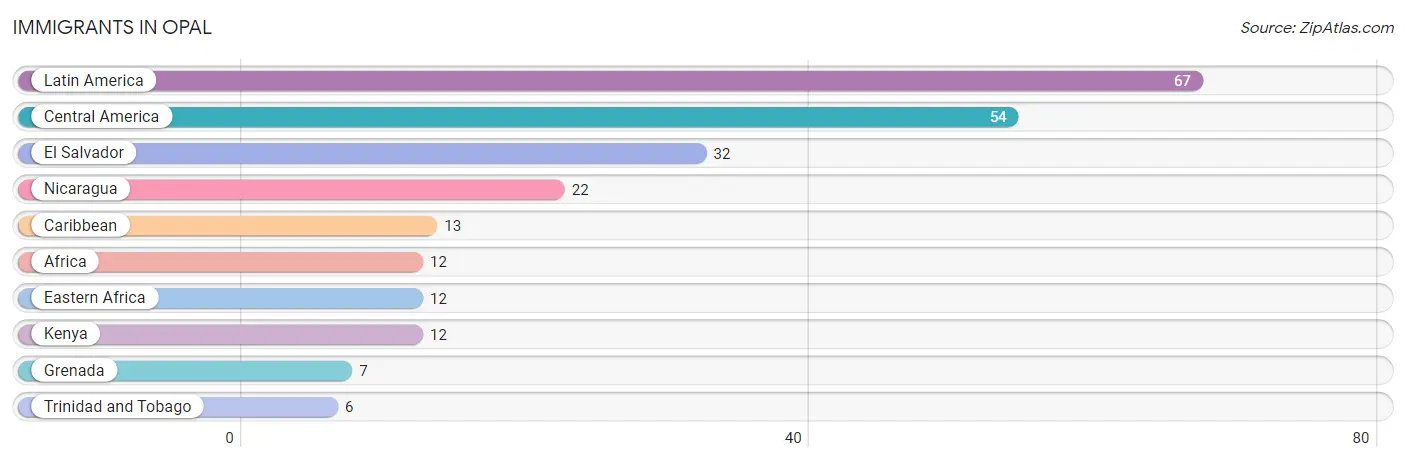
| Immigration Origin | # Population | % Population |
| Africa | 12 | 1.6% |
| Caribbean | 13 | 1.7% |
| Central America | 54 | 7.1% |
| Eastern Africa | 12 | 1.6% |
| El Salvador | 32 | 4.2% |
| Grenada | 7 | 0.9% |
| Kenya | 12 | 1.6% |
| Latin America | 67 | 8.9% |
| Nicaragua | 22 | 2.9% |
| Trinidad and Tobago | 6 | 0.8% | View All 10 Rows |
Sex and Age in Opal
Sex and Age in Opal
The most populous age groups in Opal are 35 to 39 Years (60 | 15.8%) for men and 55 to 59 Years (47 | 12.5%) for women.
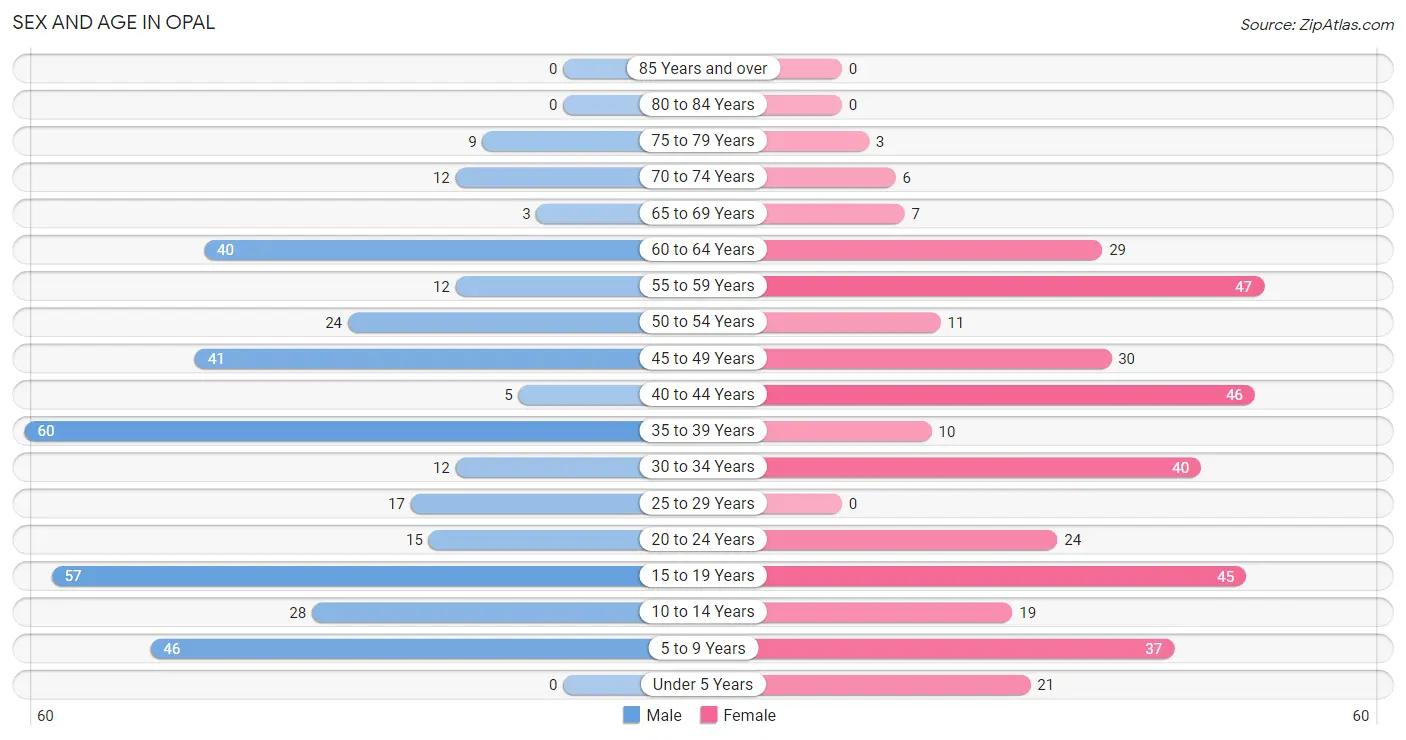
| Age Bracket | Male | Female |
| Under 5 Years | 0 (0.0%) | 21 (5.6%) |
| 5 to 9 Years | 46 (12.1%) | 37 (9.9%) |
| 10 to 14 Years | 28 (7.3%) | 19 (5.1%) |
| 15 to 19 Years | 57 (15.0%) | 45 (12.0%) |
| 20 to 24 Years | 15 (3.9%) | 24 (6.4%) |
| 25 to 29 Years | 17 (4.5%) | 0 (0.0%) |
| 30 to 34 Years | 12 (3.2%) | 40 (10.7%) |
| 35 to 39 Years | 60 (15.8%) | 10 (2.7%) |
| 40 to 44 Years | 5 (1.3%) | 46 (12.3%) |
| 45 to 49 Years | 41 (10.8%) | 30 (8.0%) |
| 50 to 54 Years | 24 (6.3%) | 11 (2.9%) |
| 55 to 59 Years | 12 (3.2%) | 47 (12.5%) |
| 60 to 64 Years | 40 (10.5%) | 29 (7.7%) |
| 65 to 69 Years | 3 (0.8%) | 7 (1.9%) |
| 70 to 74 Years | 12 (3.2%) | 6 (1.6%) |
| 75 to 79 Years | 9 (2.4%) | 3 (0.8%) |
| 80 to 84 Years | 0 (0.0%) | 0 (0.0%) |
| 85 Years and over | 0 (0.0%) | 0 (0.0%) |
| Total | 381 (100.0%) | 375 (100.0%) |
Families and Households in Opal
Median Family Size in Opal
The median family size in Opal is 3.90 persons per family, with single male/father families (13 | 7.1%) accounting for the largest median family size of 4 persons per family. On the other hand, single female/mother families (21 | 11.5%) represent the smallest median family size with 3.14 persons per family.
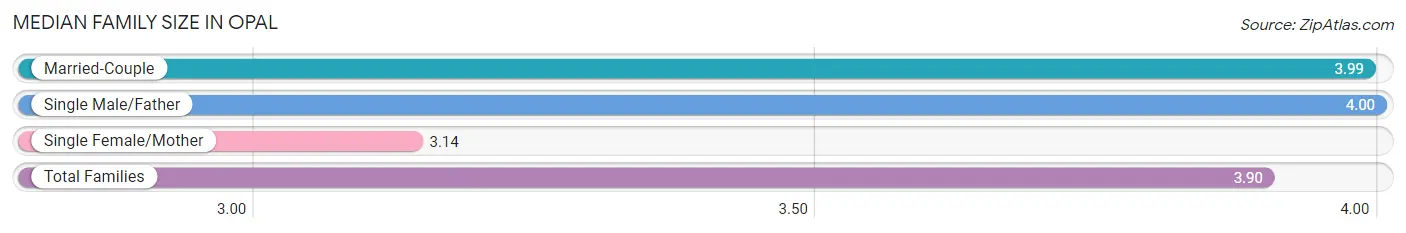
| Family Type | # Families | Family Size |
| Married-Couple | 149 (81.4%) | 3.99 |
| Single Male/Father | 13 (7.1%) | 4.00 |
| Single Female/Mother | 21 (11.5%) | 3.14 |
| Total Families | 183 (100.0%) | 3.90 |
Median Household Size in Opal
The median household size in Opal is 3.78 persons per household, with married-couple households (149 | 74.5%) accounting for the largest median household size of 4.05 persons per household. non-family households (17 | 8.5%) represent the smallest median household size with 1.29 persons per household.
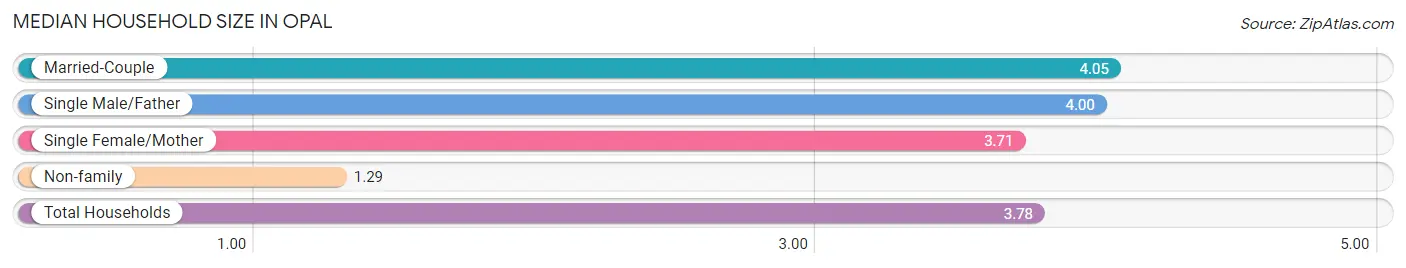
| Household Type | # Households | Household Size |
| Married-Couple | 149 (74.5%) | 4.05 |
| Single Male/Father | 13 (6.5%) | 4.00 |
| Single Female/Mother | 21 (10.5%) | 3.71 |
| Non-family | 17 (8.5%) | 1.29 |
| Total Households | 200 (100.0%) | 3.78 |
Household Size by Marriage Status in Opal
Out of a total of 200 households in Opal, 183 (91.5%) are family households, while 17 (8.5%) are nonfamily households. The most numerous type of family households are 2-person households, comprising 66, and the most common type of nonfamily households are 1-person households, comprising 11.
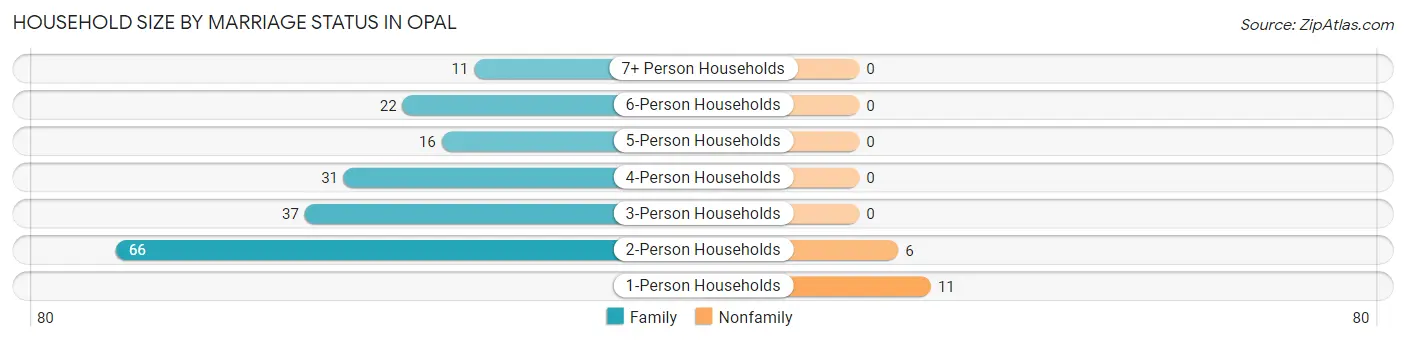
| Household Size | Family Households | Nonfamily Households |
| 1-Person Households | - | 11 (5.5%) |
| 2-Person Households | 66 (33.0%) | 6 (3.0%) |
| 3-Person Households | 37 (18.5%) | 0 (0.0%) |
| 4-Person Households | 31 (15.5%) | 0 (0.0%) |
| 5-Person Households | 16 (8.0%) | 0 (0.0%) |
| 6-Person Households | 22 (11.0%) | 0 (0.0%) |
| 7+ Person Households | 11 (5.5%) | 0 (0.0%) |
| Total | 183 (91.5%) | 17 (8.5%) |
Female Fertility in Opal
Fertility by Age in Opal
| Age Bracket | Women with Births | Births / 1,000 Women |
| 15 to 19 years | 0 (0.0%) | 0.0 |
| 20 to 34 years | 0 (0.0%) | 0.0 |
| 35 to 50 years | 0 (0.0%) | 0.0 |
| Total | 0 (0.0%) | 0.0 |
Fertility by Age by Marriage Status in Opal
| Age Bracket | Married | Unmarried |
| 15 to 19 years | 0 (0.0%) | 0 (0.0%) |
| 20 to 34 years | 0 (0.0%) | 0 (0.0%) |
| 35 to 50 years | 0 (0.0%) | 0 (0.0%) |
| Total | 0 (0.0%) | 0 (0.0%) |
Fertility by Education in Opal
| Educational Attainment | Women with Births | Births / 1,000 Women |
| Less than High School | 0 (0.0%) | 0.0 |
| High School Diploma | 0 (0.0%) | 0.0 |
| College or Associate's Degree | 0 (0.0%) | 0.0 |
| Bachelor's Degree | 0 (0.0%) | 0.0 |
| Graduate Degree | 0 (0.0%) | 0.0 |
| Total | 0 (0.0%) | 0.0 |
Fertility by Education by Marriage Status in Opal
| Educational Attainment | Married | Unmarried |
| Less than High School | 0 (0.0%) | 0 (0.0%) |
| High School Diploma | 0 (0.0%) | 0 (0.0%) |
| College or Associate's Degree | 0 (0.0%) | 0 (0.0%) |
| Bachelor's Degree | 0 (0.0%) | 0 (0.0%) |
| Graduate Degree | 0 (0.0%) | 0 (0.0%) |
| Total | 0 (0.0%) | 0 (0.0%) |
Employment Characteristics in Opal
Employment by Class of Employer in Opal
Among the 506 employed individuals in Opal, private company employees (352 | 69.6%), local government employees (58 | 11.5%), and federal government employees (43 | 8.5%) make up the most common classes of employment.
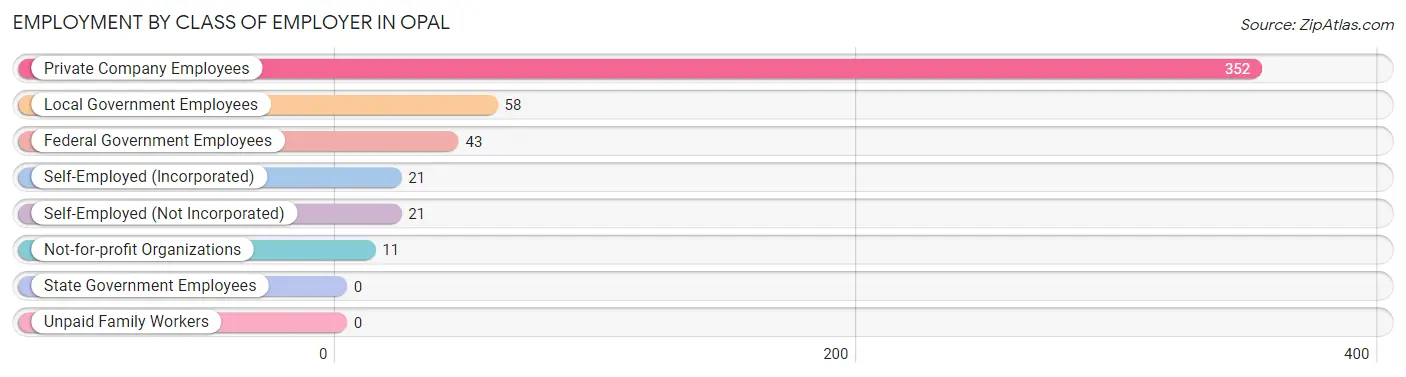
| Employer Class | # Employees | % Employees |
| Private Company Employees | 352 | 69.6% |
| Self-Employed (Incorporated) | 21 | 4.2% |
| Self-Employed (Not Incorporated) | 21 | 4.2% |
| Not-for-profit Organizations | 11 | 2.2% |
| Local Government Employees | 58 | 11.5% |
| State Government Employees | 0 | 0.0% |
| Federal Government Employees | 43 | 8.5% |
| Unpaid Family Workers | 0 | 0.0% |
| Total | 506 | 100.0% |
Employment Status by Age in Opal
According to the labor force statistics for Opal, out of the total population over 16 years of age (590), 86.8% or 512 individuals are in the labor force, with 1.2% or 6 of them unemployed. The age group with the highest labor force participation rate is 20 to 24 years, with 100.0% or 39 individuals in the labor force. Within the labor force, the 20 to 24 years age range has the highest percentage of unemployed individuals, with 15.4% or 6 of them being unemployed.
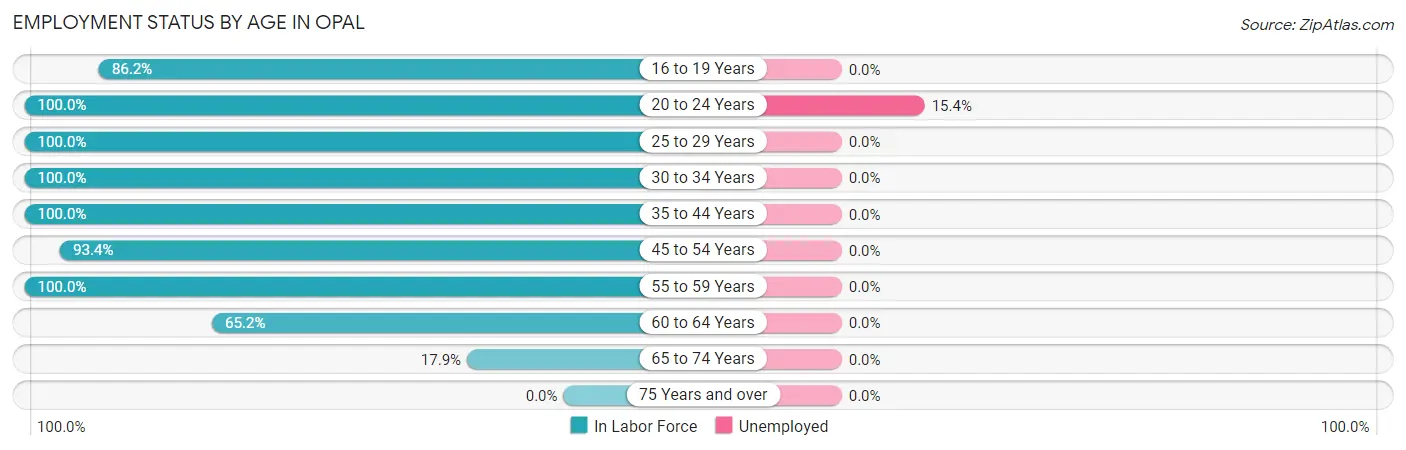
| Age Bracket | In Labor Force | Unemployed |
| 16 to 19 Years | 75 (86.2%) | 0 (0.0%) |
| 20 to 24 Years | 39 (100.0%) | 6 (15.4%) |
| 25 to 29 Years | 17 (100.0%) | 0 (0.0%) |
| 30 to 34 Years | 52 (100.0%) | 0 (0.0%) |
| 35 to 44 Years | 121 (100.0%) | 0 (0.0%) |
| 45 to 54 Years | 99 (93.4%) | 0 (0.0%) |
| 55 to 59 Years | 59 (100.0%) | 0 (0.0%) |
| 60 to 64 Years | 45 (65.2%) | 0 (0.0%) |
| 65 to 74 Years | 5 (17.9%) | 0 (0.0%) |
| 75 Years and over | 0 (0.0%) | 0 (0.0%) |
| Total | 512 (86.8%) | 6 (1.2%) |
Employment Status by Educational Attainment in Opal
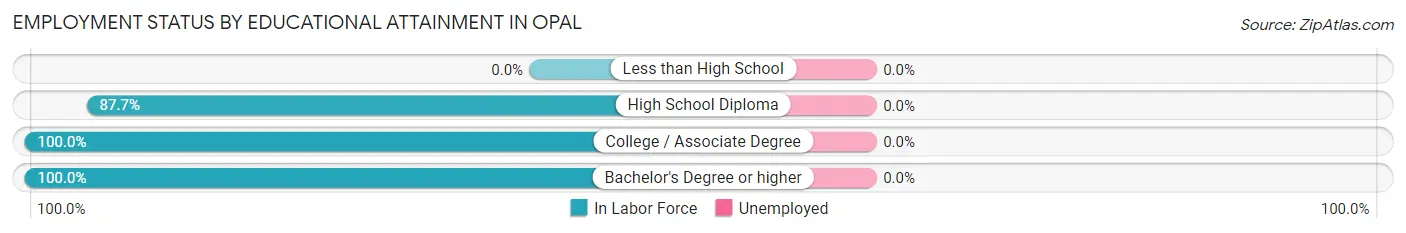
| Educational Attainment | In Labor Force | Unemployed |
| Less than High School | 0 (0.0%) | 0 (0.0%) |
| High School Diploma | 107 (87.7%) | 0 (0.0%) |
| College / Associate Degree | 111 (100.0%) | 0 (0.0%) |
| Bachelor's Degree or higher | 175 (100.0%) | 0 (0.0%) |
| Total | 393 (92.7%) | 0 (0.0%) |
Employment Occupations by Sex in Opal
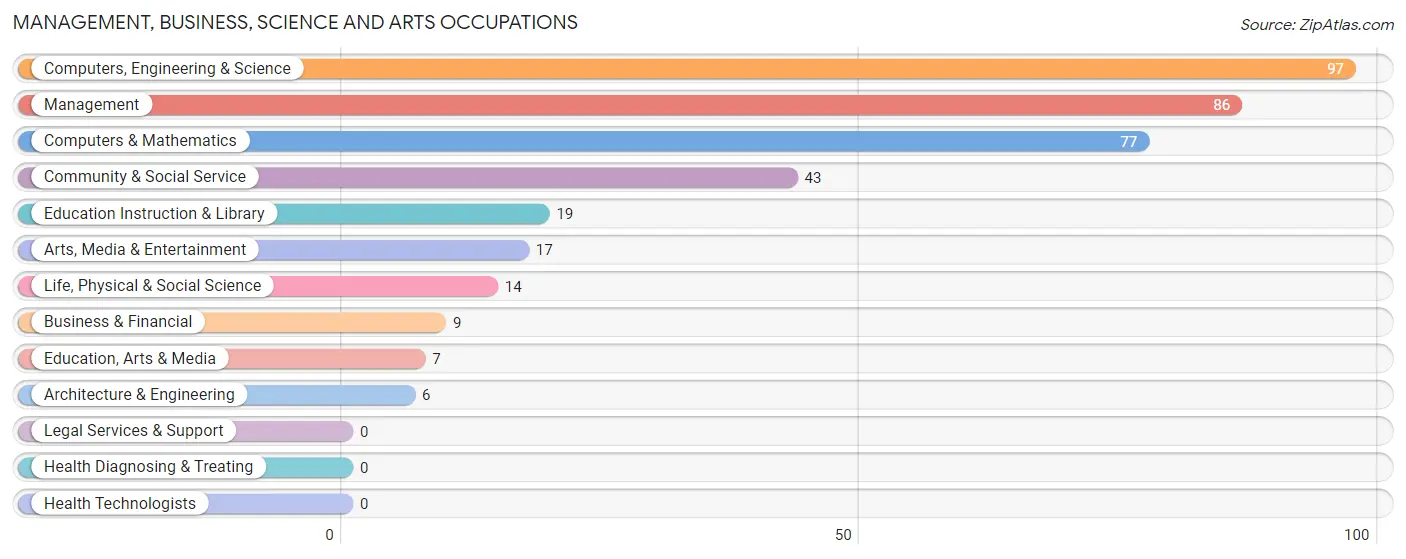
Management, Business, Science and Arts Occupations
The most common Management, Business, Science and Arts occupations in Opal are Computers, Engineering & Science (97 | 19.2%), Management (86 | 17.0%), Computers & Mathematics (77 | 15.2%), Community & Social Service (43 | 8.5%), and Education Instruction & Library (19 | 3.7%).
Management, Business, Science and Arts Occupations by Sex
Within the Management, Business, Science and Arts occupations in Opal, the most male-oriented occupations are Architecture & Engineering (100.0%), Computers & Mathematics (68.8%), and Computers, Engineering & Science (60.8%), while the most female-oriented occupations are Business & Financial (100.0%), Life, Physical & Social Science (100.0%), and Education, Arts & Media (100.0%).
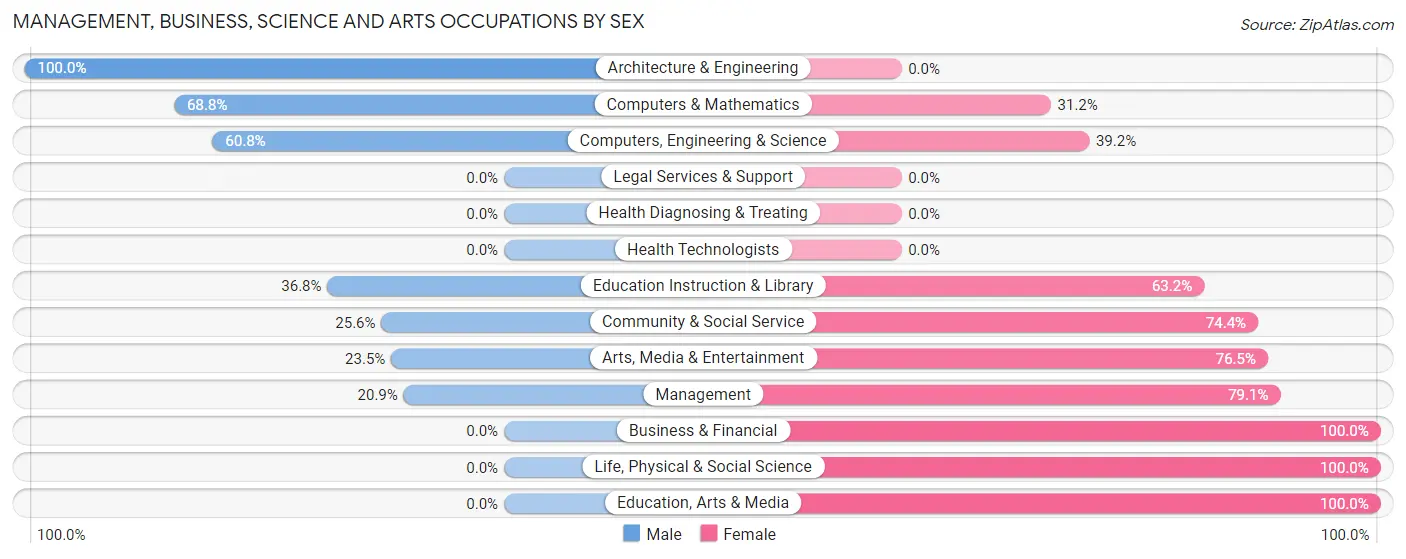
| Occupation | Male | Female |
| Management | 18 (20.9%) | 68 (79.1%) |
| Business & Financial | 0 (0.0%) | 9 (100.0%) |
| Computers, Engineering & Science | 59 (60.8%) | 38 (39.2%) |
| Computers & Mathematics | 53 (68.8%) | 24 (31.2%) |
| Architecture & Engineering | 6 (100.0%) | 0 (0.0%) |
| Life, Physical & Social Science | 0 (0.0%) | 14 (100.0%) |
| Community & Social Service | 11 (25.6%) | 32 (74.4%) |
| Education, Arts & Media | 0 (0.0%) | 7 (100.0%) |
| Legal Services & Support | 0 (0.0%) | 0 (0.0%) |
| Education Instruction & Library | 7 (36.8%) | 12 (63.2%) |
| Arts, Media & Entertainment | 4 (23.5%) | 13 (76.5%) |
| Health Diagnosing & Treating | 0 (0.0%) | 0 (0.0%) |
| Health Technologists | 0 (0.0%) | 0 (0.0%) |
| Total (Category) | 88 (37.4%) | 147 (62.5%) |
| Total (Overall) | 234 (46.3%) | 272 (53.7%) |
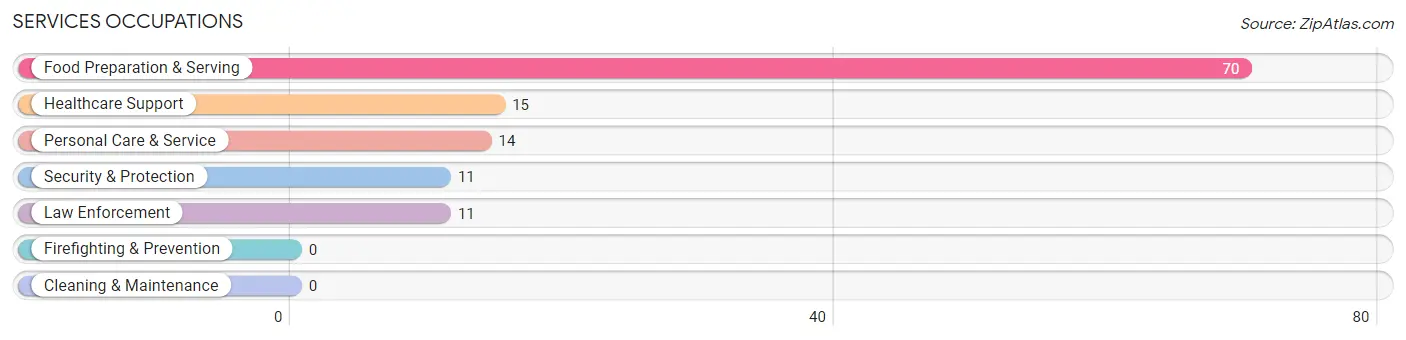
Services Occupations
The most common Services occupations in Opal are Food Preparation & Serving (70 | 13.8%), Healthcare Support (15 | 3.0%), Personal Care & Service (14 | 2.8%), Security & Protection (11 | 2.2%), and Law Enforcement (11 | 2.2%).
Services Occupations by Sex
Within the Services occupations in Opal, the most male-oriented occupations are Security & Protection (100.0%), Law Enforcement (100.0%), and Food Preparation & Serving (35.7%), while the most female-oriented occupations are Healthcare Support (100.0%), Personal Care & Service (100.0%), and Food Preparation & Serving (64.3%).
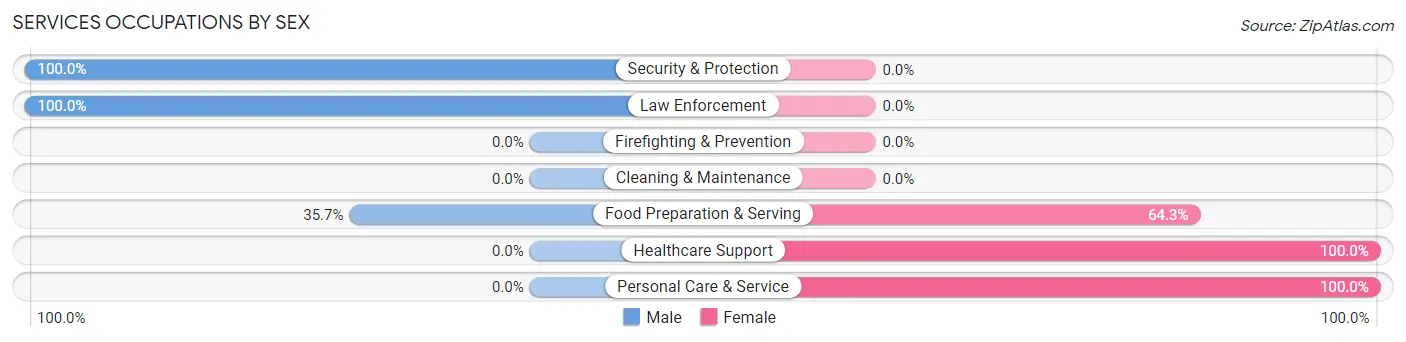
| Occupation | Male | Female |
| Healthcare Support | 0 (0.0%) | 15 (100.0%) |
| Security & Protection | 11 (100.0%) | 0 (0.0%) |
| Firefighting & Prevention | 0 (0.0%) | 0 (0.0%) |
| Law Enforcement | 11 (100.0%) | 0 (0.0%) |
| Food Preparation & Serving | 25 (35.7%) | 45 (64.3%) |
| Cleaning & Maintenance | 0 (0.0%) | 0 (0.0%) |
| Personal Care & Service | 0 (0.0%) | 14 (100.0%) |
| Total (Category) | 36 (32.7%) | 74 (67.3%) |
| Total (Overall) | 234 (46.3%) | 272 (53.7%) |
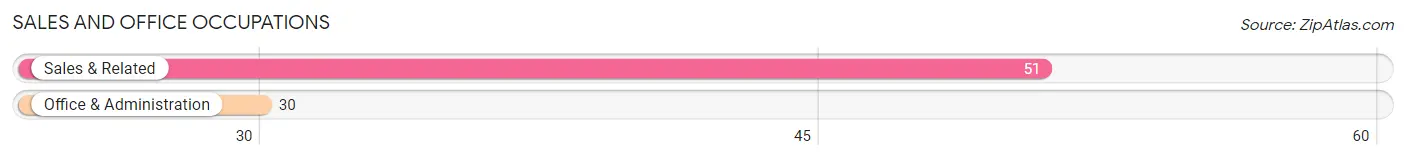
Sales and Office Occupations
The most common Sales and Office occupations in Opal are Sales & Related (51 | 10.1%), and Office & Administration (30 | 5.9%).
Sales and Office Occupations by Sex
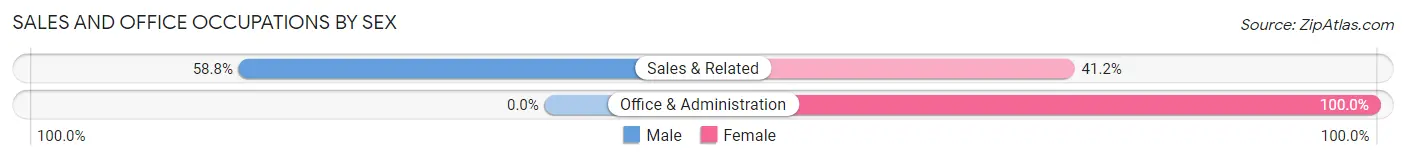
| Occupation | Male | Female |
| Sales & Related | 30 (58.8%) | 21 (41.2%) |
| Office & Administration | 0 (0.0%) | 30 (100.0%) |
| Total (Category) | 30 (37.0%) | 51 (63.0%) |
| Total (Overall) | 234 (46.3%) | 272 (53.7%) |
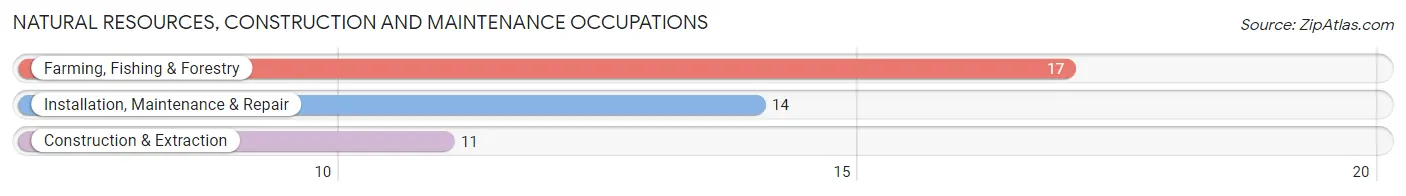
Natural Resources, Construction and Maintenance Occupations
The most common Natural Resources, Construction and Maintenance occupations in Opal are Farming, Fishing & Forestry (17 | 3.4%), Installation, Maintenance & Repair (14 | 2.8%), and Construction & Extraction (11 | 2.2%).
Natural Resources, Construction and Maintenance Occupations by Sex
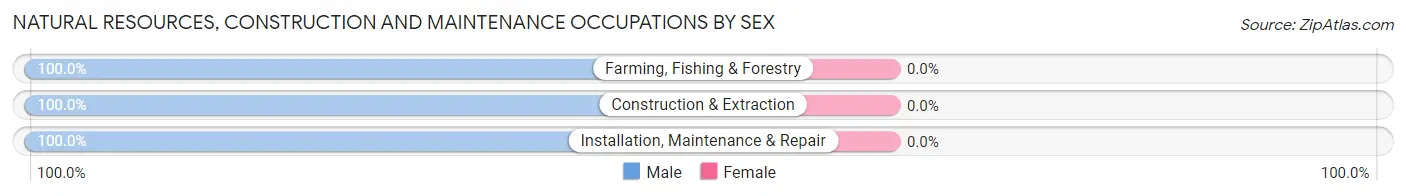
| Occupation | Male | Female |
| Farming, Fishing & Forestry | 17 (100.0%) | 0 (0.0%) |
| Construction & Extraction | 11 (100.0%) | 0 (0.0%) |
| Installation, Maintenance & Repair | 14 (100.0%) | 0 (0.0%) |
| Total (Category) | 42 (100.0%) | 0 (0.0%) |
| Total (Overall) | 234 (46.3%) | 272 (53.7%) |
Production, Transportation and Moving Occupations
The most common Production, Transportation and Moving occupations in Opal are Material Moving (20 | 4.0%), Transportation (13 | 2.6%), and Production (5 | 1.0%).
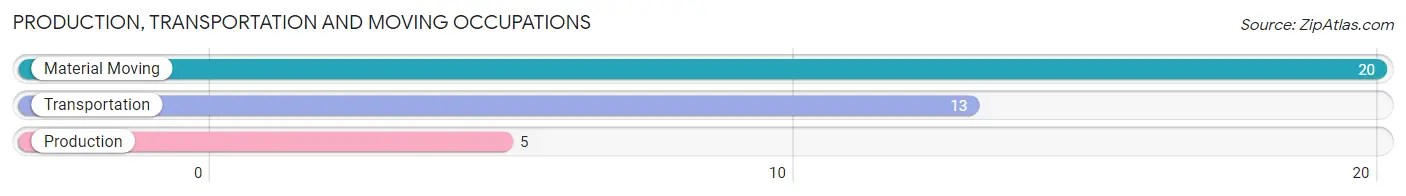
Production, Transportation and Moving Occupations by Sex
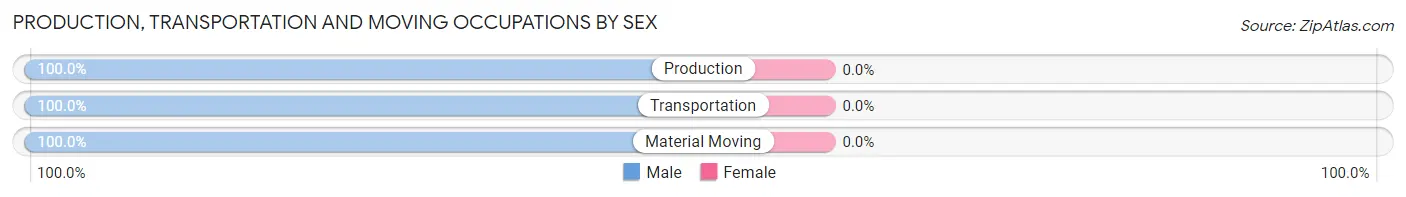
| Occupation | Male | Female |
| Production | 5 (100.0%) | 0 (0.0%) |
| Transportation | 13 (100.0%) | 0 (0.0%) |
| Material Moving | 20 (100.0%) | 0 (0.0%) |
| Total (Category) | 38 (100.0%) | 0 (0.0%) |
| Total (Overall) | 234 (46.3%) | 272 (53.7%) |
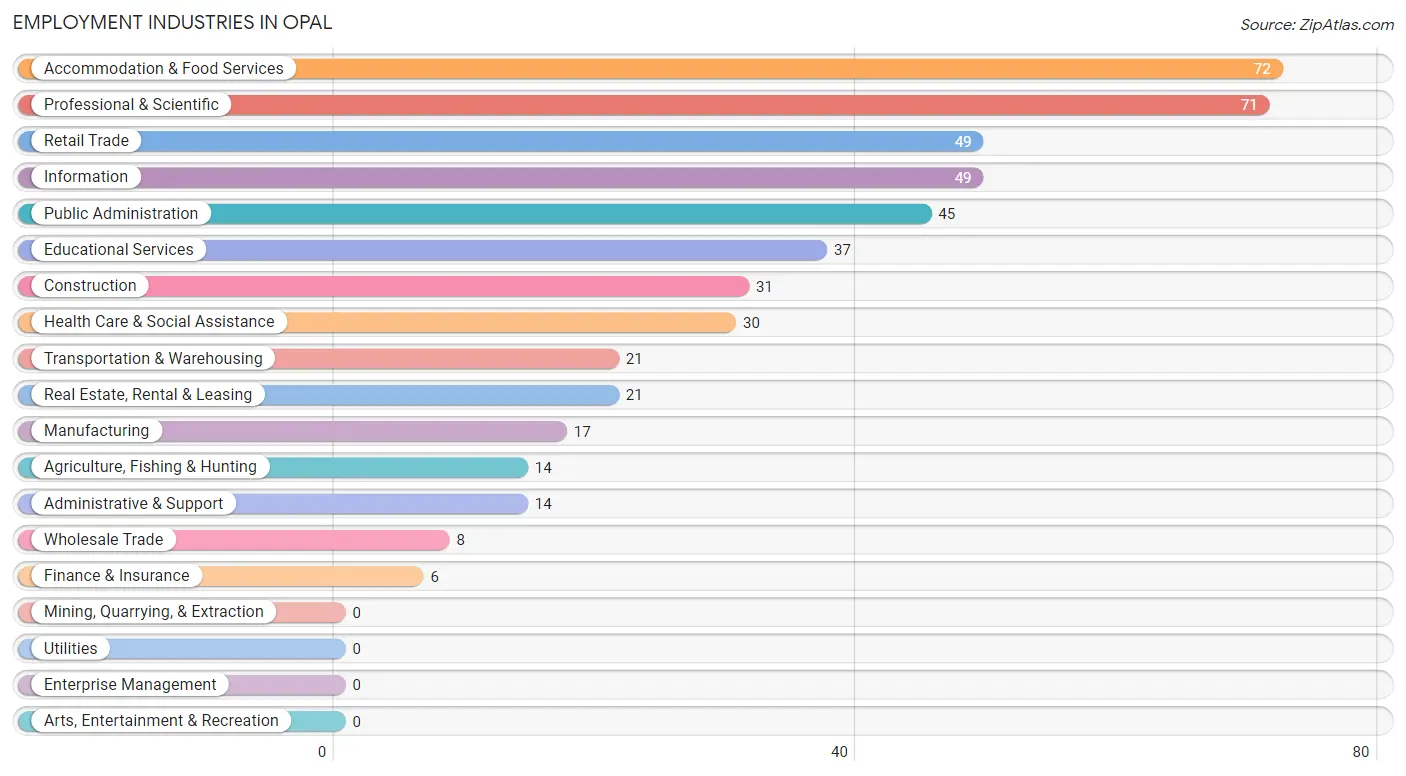
Employment Industries by Sex in Opal
Employment Industries in Opal
The major employment industries in Opal include Accommodation & Food Services (72 | 14.2%), Professional & Scientific (71 | 14.0%), Retail Trade (49 | 9.7%), Information (49 | 9.7%), and Public Administration (45 | 8.9%).
Employment Industries by Sex in Opal
The Opal industries that see more men than women are Manufacturing (100.0%), Wholesale Trade (100.0%), and Administrative & Support (100.0%), whereas the industries that tend to have a higher number of women are Agriculture, Fishing & Hunting (100.0%), Finance & Insurance (100.0%), and Professional & Scientific (87.3%).
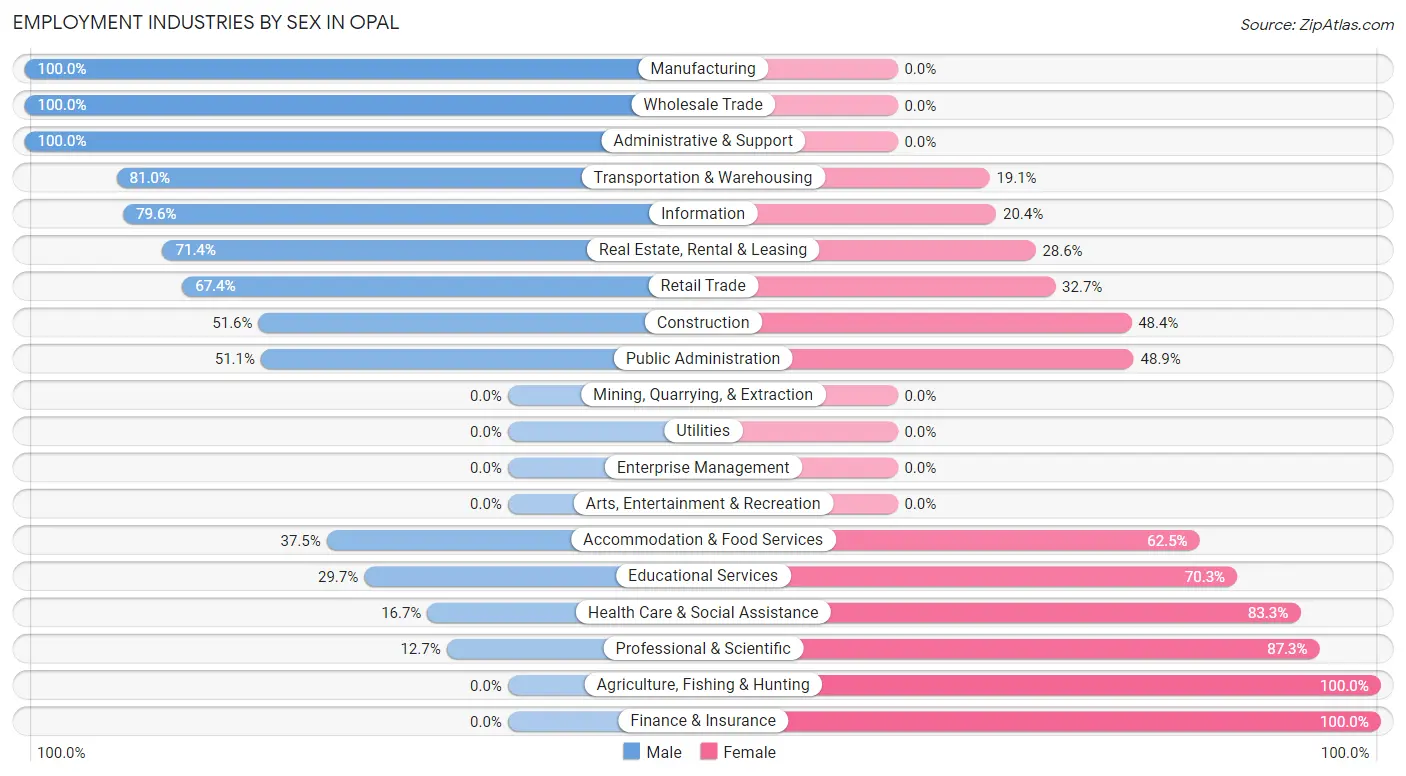
| Industry | Male | Female |
| Agriculture, Fishing & Hunting | 0 (0.0%) | 14 (100.0%) |
| Mining, Quarrying, & Extraction | 0 (0.0%) | 0 (0.0%) |
| Construction | 16 (51.6%) | 15 (48.4%) |
| Manufacturing | 17 (100.0%) | 0 (0.0%) |
| Wholesale Trade | 8 (100.0%) | 0 (0.0%) |
| Retail Trade | 33 (67.3%) | 16 (32.7%) |
| Transportation & Warehousing | 17 (80.9%) | 4 (19.1%) |
| Utilities | 0 (0.0%) | 0 (0.0%) |
| Information | 39 (79.6%) | 10 (20.4%) |
| Finance & Insurance | 0 (0.0%) | 6 (100.0%) |
| Real Estate, Rental & Leasing | 15 (71.4%) | 6 (28.6%) |
| Professional & Scientific | 9 (12.7%) | 62 (87.3%) |
| Enterprise Management | 0 (0.0%) | 0 (0.0%) |
| Administrative & Support | 14 (100.0%) | 0 (0.0%) |
| Educational Services | 11 (29.7%) | 26 (70.3%) |
| Health Care & Social Assistance | 5 (16.7%) | 25 (83.3%) |
| Arts, Entertainment & Recreation | 0 (0.0%) | 0 (0.0%) |
| Accommodation & Food Services | 27 (37.5%) | 45 (62.5%) |
| Public Administration | 23 (51.1%) | 22 (48.9%) |
| Total | 234 (46.3%) | 272 (53.7%) |
Education in Opal
School Enrollment in Opal
The most common levels of schooling among the 227 students in Opal are elementary school (87 | 38.3%), high school (45 | 19.8%), and college / undergraduate (44 | 19.4%).
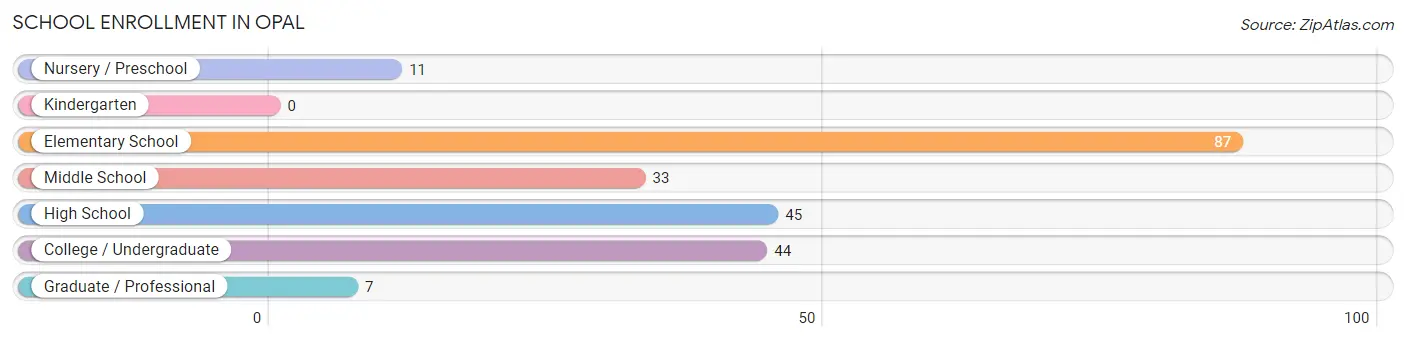
| School Level | # Students | % Students |
| Nursery / Preschool | 11 | 4.9% |
| Kindergarten | 0 | 0.0% |
| Elementary School | 87 | 38.3% |
| Middle School | 33 | 14.5% |
| High School | 45 | 19.8% |
| College / Undergraduate | 44 | 19.4% |
| Graduate / Professional | 7 | 3.1% |
| Total | 227 | 100.0% |
School Enrollment by Age by Funding Source in Opal
Out of a total of 227 students who are enrolled in schools in Opal, 33 (14.5%) attend a private institution, while the remaining 194 (85.5%) are enrolled in public schools. The age group of 10 to 14 year olds has the highest likelihood of being enrolled in private schools, with 22 (46.8% in the age bracket) enrolled. Conversely, the age group of 3 to 4 year olds has the lowest likelihood of being enrolled in a private school, with 7 (100.0% in the age bracket) attending a public institution.
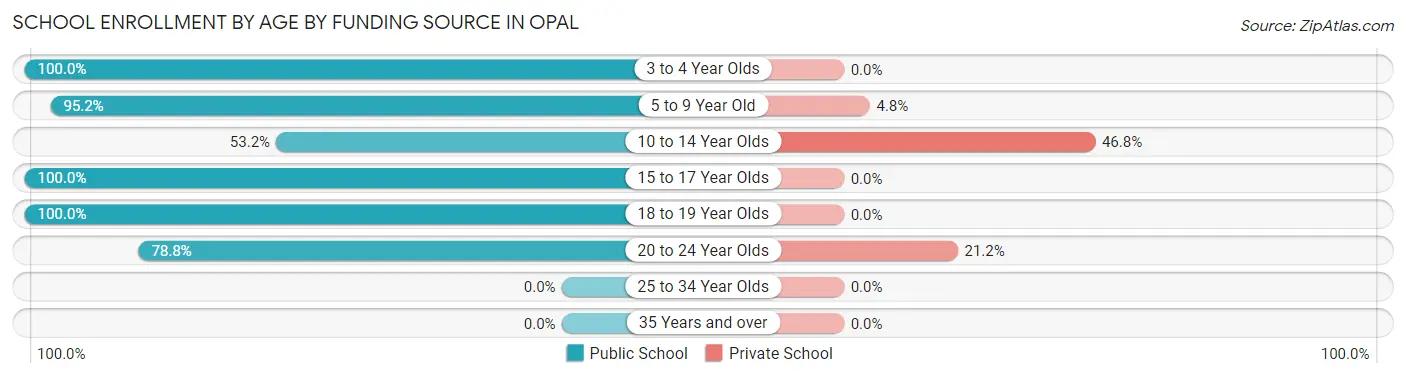
| Age Bracket | Public School | Private School |
| 3 to 4 Year Olds | 7 (100.0%) | 0 (0.0%) |
| 5 to 9 Year Old | 79 (95.2%) | 4 (4.8%) |
| 10 to 14 Year Olds | 25 (53.2%) | 22 (46.8%) |
| 15 to 17 Year Olds | 39 (100.0%) | 0 (0.0%) |
| 18 to 19 Year Olds | 18 (100.0%) | 0 (0.0%) |
| 20 to 24 Year Olds | 26 (78.8%) | 7 (21.2%) |
| 25 to 34 Year Olds | 0 (0.0%) | 0 (0.0%) |
| 35 Years and over | 0 (0.0%) | 0 (0.0%) |
| Total | 194 (85.5%) | 33 (14.5%) |
Educational Attainment by Field of Study in Opal
Computers & mathematics (53 | 26.1%), communications (26 | 12.8%), psychology (23 | 11.3%), business (23 | 11.3%), and social sciences (20 | 9.9%) are the most common fields of study among 203 individuals in Opal who have obtained a bachelor's degree or higher.
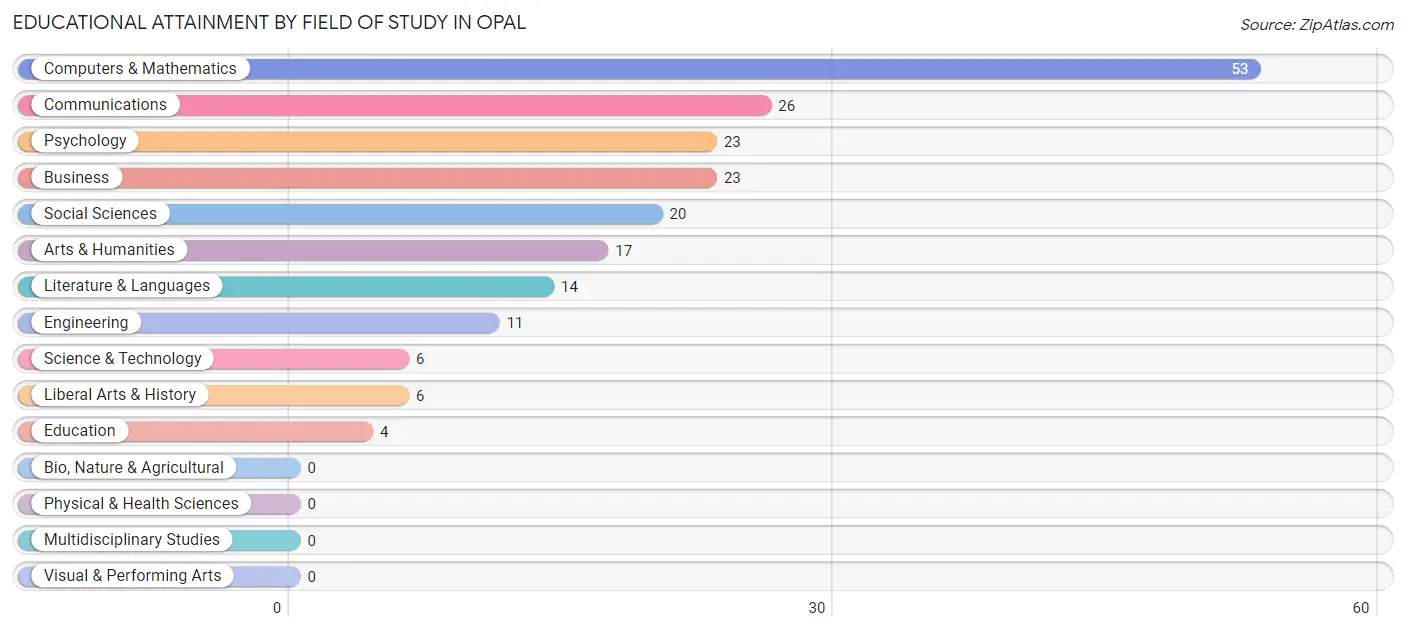
| Field of Study | # Graduates | % Graduates |
| Computers & Mathematics | 53 | 26.1% |
| Bio, Nature & Agricultural | 0 | 0.0% |
| Physical & Health Sciences | 0 | 0.0% |
| Psychology | 23 | 11.3% |
| Social Sciences | 20 | 9.9% |
| Engineering | 11 | 5.4% |
| Multidisciplinary Studies | 0 | 0.0% |
| Science & Technology | 6 | 3.0% |
| Business | 23 | 11.3% |
| Education | 4 | 2.0% |
| Literature & Languages | 14 | 6.9% |
| Liberal Arts & History | 6 | 3.0% |
| Visual & Performing Arts | 0 | 0.0% |
| Communications | 26 | 12.8% |
| Arts & Humanities | 17 | 8.4% |
| Total | 203 | 100.0% |
Transportation & Commute in Opal
Vehicle Availability by Sex in Opal
The most prevalent vehicle ownership categories in Opal are males with 3 vehicles (100, accounting for 42.7%) and females with 3 vehicles (153, making up 36.8%).
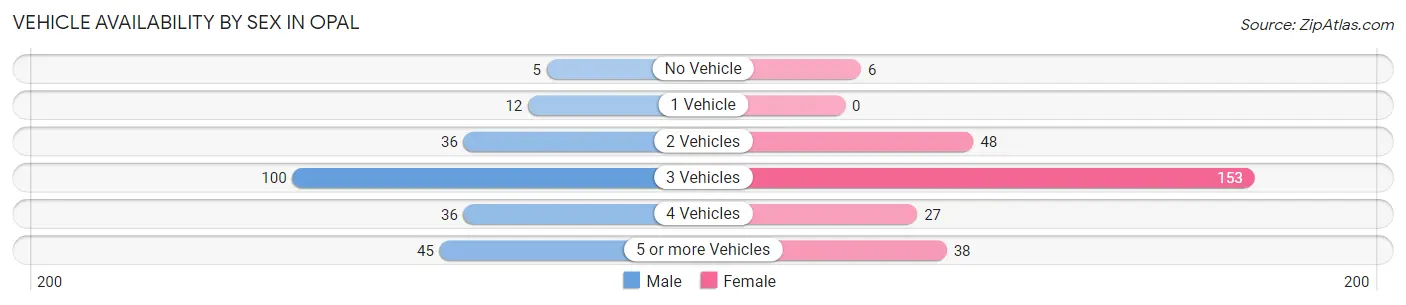
| Vehicles Available | Male | Female |
| No Vehicle | 5 (2.1%) | 6 (2.2%) |
| 1 Vehicle | 12 (5.1%) | 0 (0.0%) |
| 2 Vehicles | 36 (15.4%) | 48 (17.6%) |
| 3 Vehicles | 100 (42.7%) | 153 (56.2%) |
| 4 Vehicles | 36 (15.4%) | 27 (9.9%) |
| 5 or more Vehicles | 45 (19.2%) | 38 (14.0%) |
| Total | 234 (100.0%) | 272 (100.0%) |
Commute Time in Opal
The most frequently occuring commute durations in Opal are 60 to 89 minutes (88 commuters, 19.4%), 30 to 34 minutes (81 commuters, 17.8%), and 90 or more minutes (57 commuters, 12.6%).
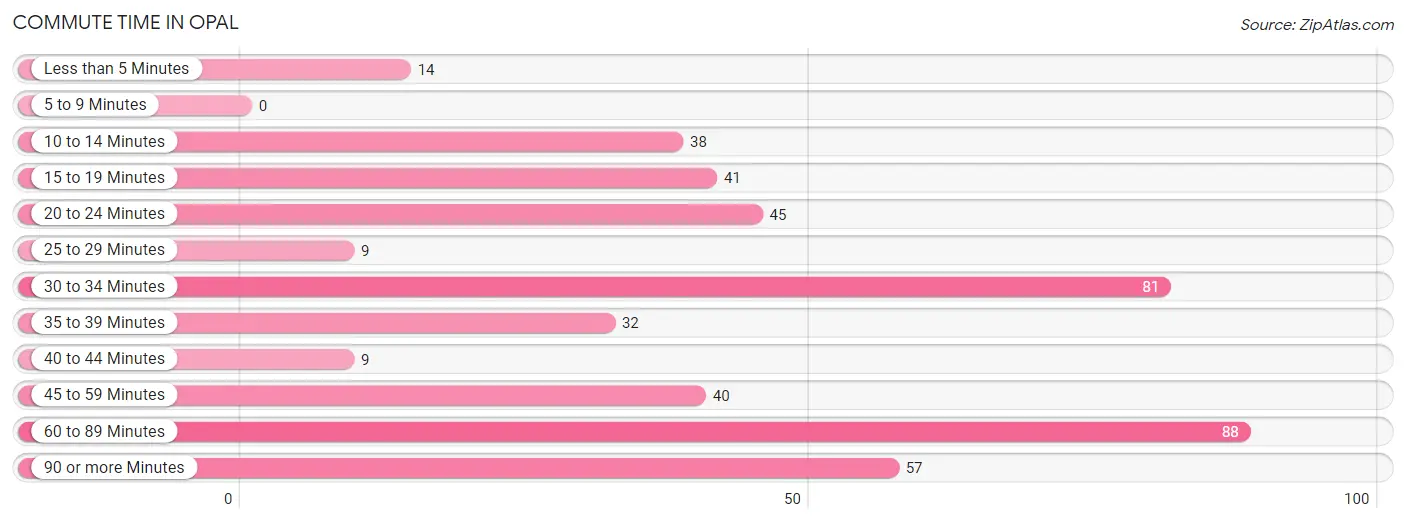
| Commute Time | # Commuters | % Commuters |
| Less than 5 Minutes | 14 | 3.1% |
| 5 to 9 Minutes | 0 | 0.0% |
| 10 to 14 Minutes | 38 | 8.4% |
| 15 to 19 Minutes | 41 | 9.0% |
| 20 to 24 Minutes | 45 | 9.9% |
| 25 to 29 Minutes | 9 | 2.0% |
| 30 to 34 Minutes | 81 | 17.8% |
| 35 to 39 Minutes | 32 | 7.0% |
| 40 to 44 Minutes | 9 | 2.0% |
| 45 to 59 Minutes | 40 | 8.8% |
| 60 to 89 Minutes | 88 | 19.4% |
| 90 or more Minutes | 57 | 12.6% |
Commute Time by Sex in Opal
The most common commute times in Opal are 60 to 89 minutes (60 commuters, 30.8%) for males and 30 to 34 minutes (50 commuters, 19.3%) for females.
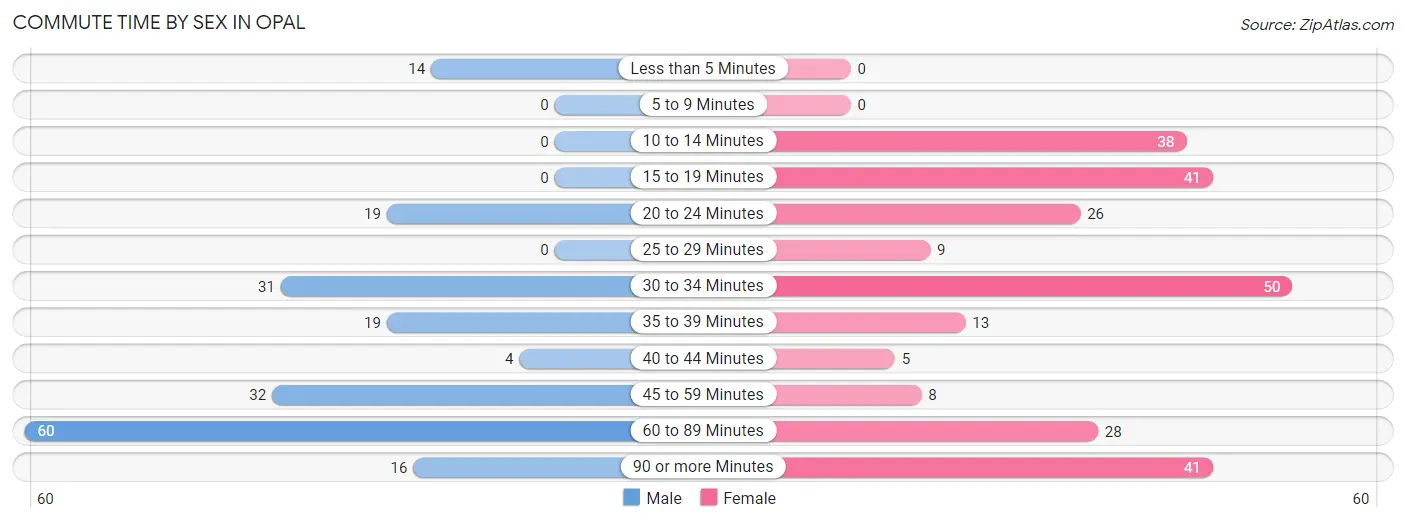
| Commute Time | Male | Female |
| Less than 5 Minutes | 14 (7.2%) | 0 (0.0%) |
| 5 to 9 Minutes | 0 (0.0%) | 0 (0.0%) |
| 10 to 14 Minutes | 0 (0.0%) | 38 (14.7%) |
| 15 to 19 Minutes | 0 (0.0%) | 41 (15.8%) |
| 20 to 24 Minutes | 19 (9.7%) | 26 (10.0%) |
| 25 to 29 Minutes | 0 (0.0%) | 9 (3.5%) |
| 30 to 34 Minutes | 31 (15.9%) | 50 (19.3%) |
| 35 to 39 Minutes | 19 (9.7%) | 13 (5.0%) |
| 40 to 44 Minutes | 4 (2.1%) | 5 (1.9%) |
| 45 to 59 Minutes | 32 (16.4%) | 8 (3.1%) |
| 60 to 89 Minutes | 60 (30.8%) | 28 (10.8%) |
| 90 or more Minutes | 16 (8.2%) | 41 (15.8%) |
Time of Departure to Work by Sex in Opal
The most frequent times of departure to work in Opal are 12:00 AM to 4:59 AM (58, 29.7%) for males and 6:30 AM to 6:59 AM (64, 24.7%) for females.
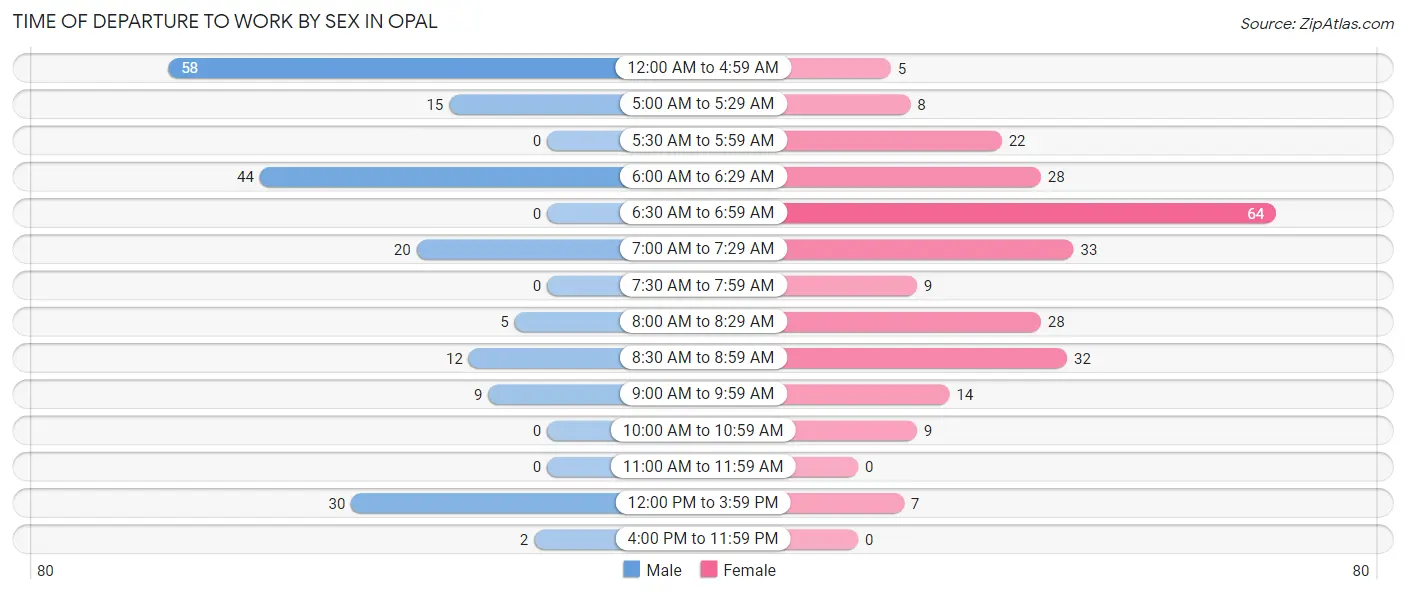
| Time of Departure | Male | Female |
| 12:00 AM to 4:59 AM | 58 (29.7%) | 5 (1.9%) |
| 5:00 AM to 5:29 AM | 15 (7.7%) | 8 (3.1%) |
| 5:30 AM to 5:59 AM | 0 (0.0%) | 22 (8.5%) |
| 6:00 AM to 6:29 AM | 44 (22.6%) | 28 (10.8%) |
| 6:30 AM to 6:59 AM | 0 (0.0%) | 64 (24.7%) |
| 7:00 AM to 7:29 AM | 20 (10.3%) | 33 (12.7%) |
| 7:30 AM to 7:59 AM | 0 (0.0%) | 9 (3.5%) |
| 8:00 AM to 8:29 AM | 5 (2.6%) | 28 (10.8%) |
| 8:30 AM to 8:59 AM | 12 (6.1%) | 32 (12.4%) |
| 9:00 AM to 9:59 AM | 9 (4.6%) | 14 (5.4%) |
| 10:00 AM to 10:59 AM | 0 (0.0%) | 9 (3.5%) |
| 11:00 AM to 11:59 AM | 0 (0.0%) | 0 (0.0%) |
| 12:00 PM to 3:59 PM | 30 (15.4%) | 7 (2.7%) |
| 4:00 PM to 11:59 PM | 2 (1.0%) | 0 (0.0%) |
| Total | 195 (100.0%) | 259 (100.0%) |
Housing Occupancy in Opal
Occupancy by Ownership in Opal
Of the total 200 dwellings in Opal, owner-occupied units account for 181 (90.5%), while renter-occupied units make up 19 (9.5%).
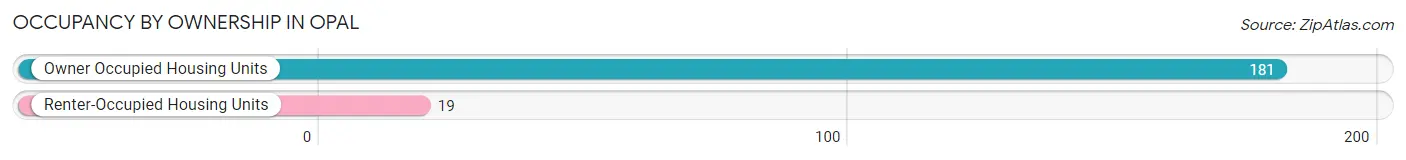
| Occupancy | # Housing Units | % Housing Units |
| Owner Occupied Housing Units | 181 | 90.5% |
| Renter-Occupied Housing Units | 19 | 9.5% |
| Total Occupied Housing Units | 200 | 100.0% |
Occupancy by Household Size in Opal
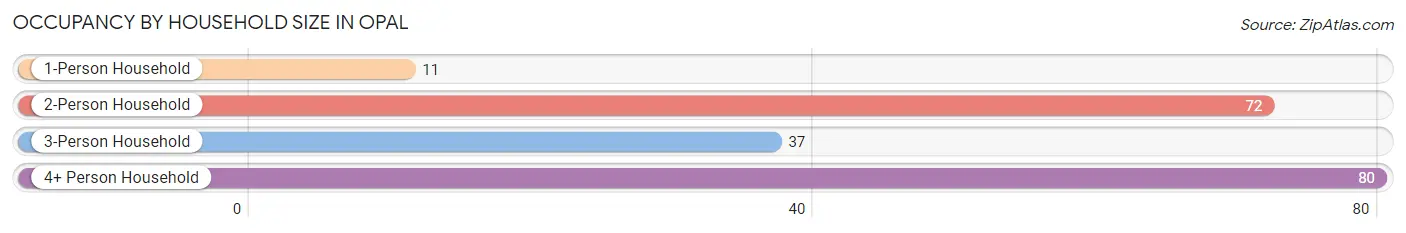
| Household Size | # Housing Units | % Housing Units |
| 1-Person Household | 11 | 5.5% |
| 2-Person Household | 72 | 36.0% |
| 3-Person Household | 37 | 18.5% |
| 4+ Person Household | 80 | 40.0% |
| Total Housing Units | 200 | 100.0% |
Occupancy by Ownership by Household Size in Opal
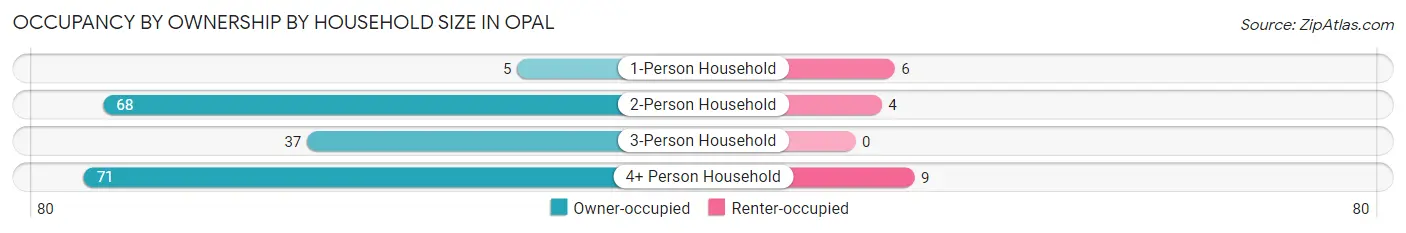
| Household Size | Owner-occupied | Renter-occupied |
| 1-Person Household | 5 (45.5%) | 6 (54.5%) |
| 2-Person Household | 68 (94.4%) | 4 (5.6%) |
| 3-Person Household | 37 (100.0%) | 0 (0.0%) |
| 4+ Person Household | 71 (88.7%) | 9 (11.3%) |
| Total Housing Units | 181 (90.5%) | 19 (9.5%) |
Occupancy by Educational Attainment in Opal
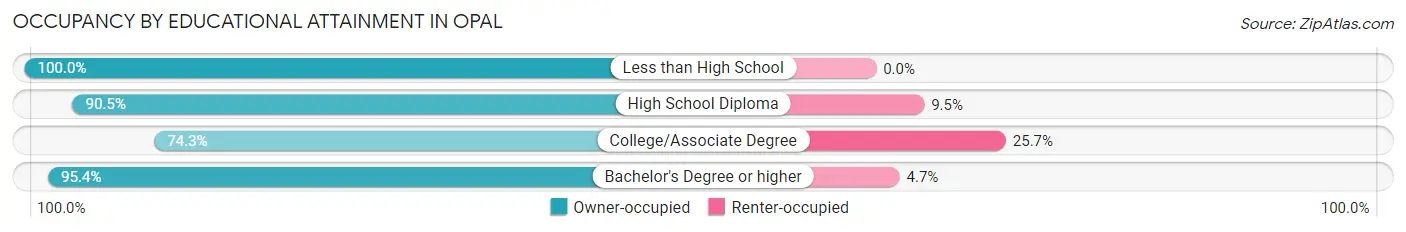
| Household Size | Owner-occupied | Renter-occupied |
| Less than High School | 16 (100.0%) | 0 (0.0%) |
| High School Diploma | 57 (90.5%) | 6 (9.5%) |
| College/Associate Degree | 26 (74.3%) | 9 (25.7%) |
| Bachelor's Degree or higher | 82 (95.4%) | 4 (4.6%) |
Occupancy by Age of Householder in Opal
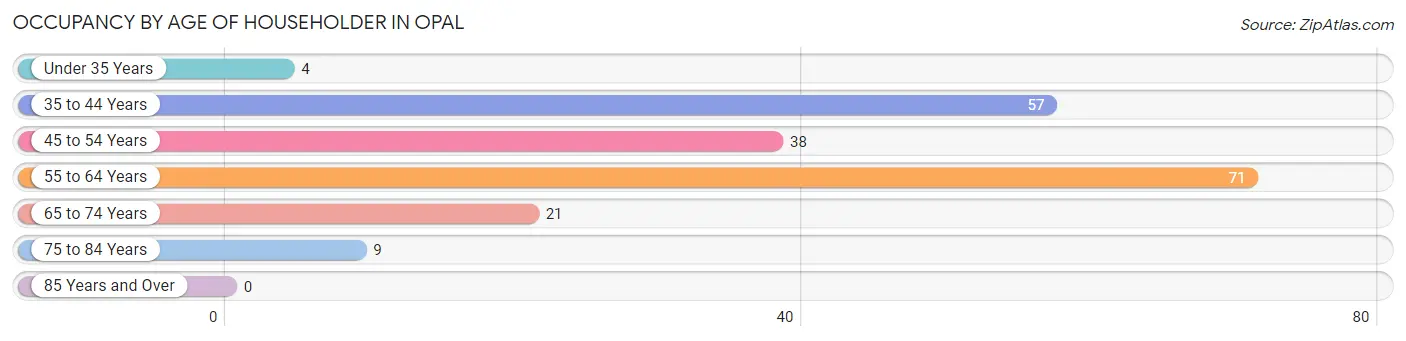
| Age Bracket | # Households | % Households |
| Under 35 Years | 4 | 2.0% |
| 35 to 44 Years | 57 | 28.5% |
| 45 to 54 Years | 38 | 19.0% |
| 55 to 64 Years | 71 | 35.5% |
| 65 to 74 Years | 21 | 10.5% |
| 75 to 84 Years | 9 | 4.5% |
| 85 Years and Over | 0 | 0.0% |
| Total | 200 | 100.0% |
Housing Finances in Opal
Median Income by Occupancy in Opal
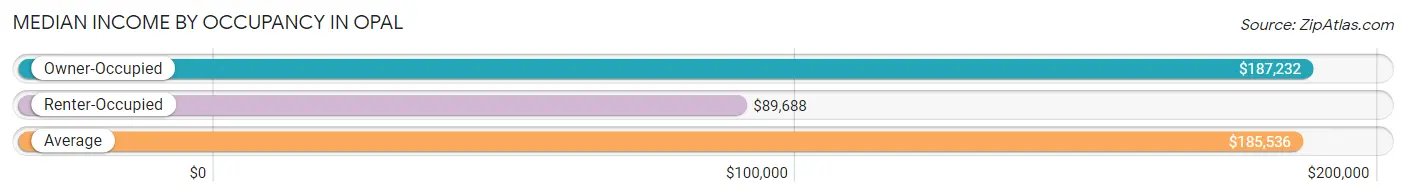
| Occupancy Type | # Households | Median Income |
| Owner-Occupied | 181 (90.5%) | $187,232 |
| Renter-Occupied | 19 (9.5%) | $89,688 |
| Average | 200 (100.0%) | $185,536 |
Occupancy by Householder Income Bracket in Opal
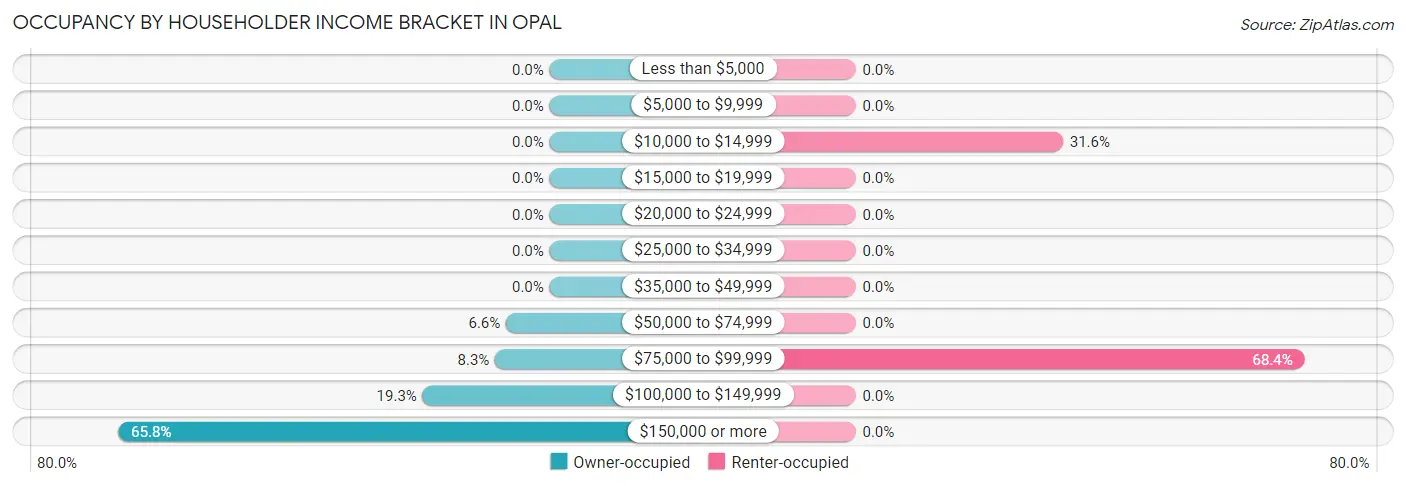
| Income Bracket | Owner-occupied | Renter-occupied |
| Less than $5,000 | 0 (0.0%) | 0 (0.0%) |
| $5,000 to $9,999 | 0 (0.0%) | 0 (0.0%) |
| $10,000 to $14,999 | 0 (0.0%) | 6 (31.6%) |
| $15,000 to $19,999 | 0 (0.0%) | 0 (0.0%) |
| $20,000 to $24,999 | 0 (0.0%) | 0 (0.0%) |
| $25,000 to $34,999 | 0 (0.0%) | 0 (0.0%) |
| $35,000 to $49,999 | 0 (0.0%) | 0 (0.0%) |
| $50,000 to $74,999 | 12 (6.6%) | 0 (0.0%) |
| $75,000 to $99,999 | 15 (8.3%) | 13 (68.4%) |
| $100,000 to $149,999 | 35 (19.3%) | 0 (0.0%) |
| $150,000 or more | 119 (65.7%) | 0 (0.0%) |
| Total | 181 (100.0%) | 19 (100.0%) |
Monthly Housing Cost Tiers in Opal
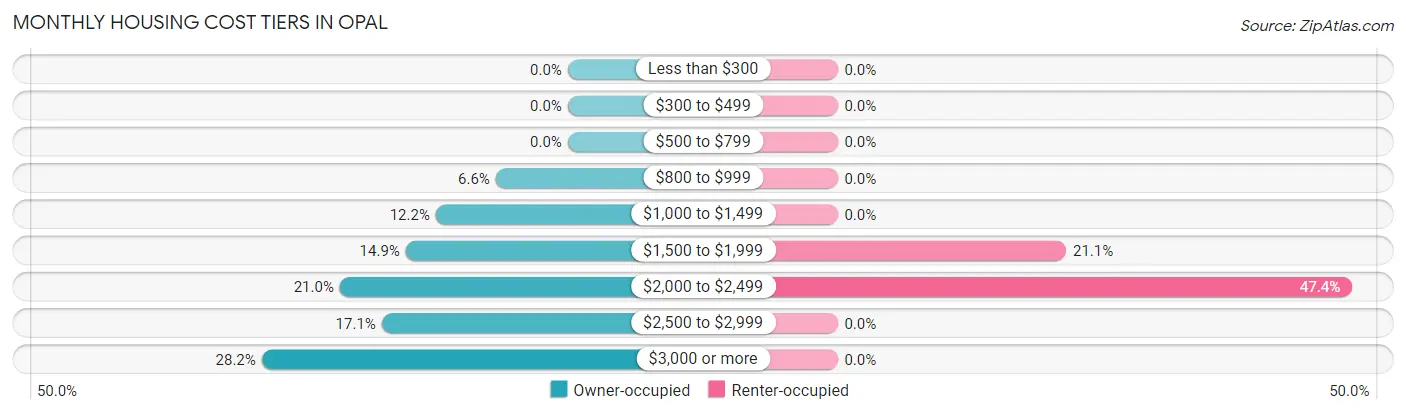
| Monthly Cost | Owner-occupied | Renter-occupied |
| Less than $300 | 0 (0.0%) | 0 (0.0%) |
| $300 to $499 | 0 (0.0%) | 0 (0.0%) |
| $500 to $799 | 0 (0.0%) | 0 (0.0%) |
| $800 to $999 | 12 (6.6%) | 0 (0.0%) |
| $1,000 to $1,499 | 22 (12.1%) | 0 (0.0%) |
| $1,500 to $1,999 | 27 (14.9%) | 4 (21.0%) |
| $2,000 to $2,499 | 38 (21.0%) | 9 (47.4%) |
| $2,500 to $2,999 | 31 (17.1%) | 0 (0.0%) |
| $3,000 or more | 51 (28.2%) | 0 (0.0%) |
| Total | 181 (100.0%) | 19 (100.0%) |
Physical Housing Characteristics in Opal
Housing Structures in Opal
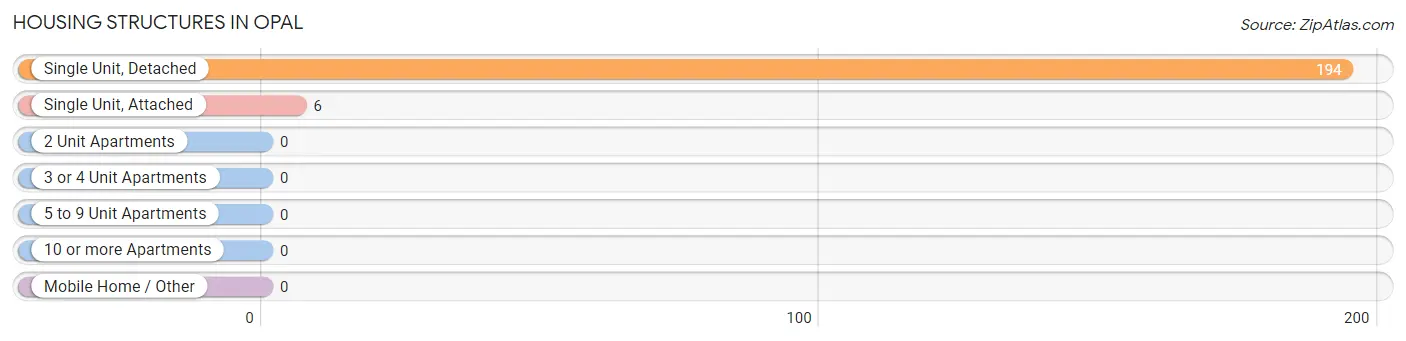
| Structure Type | # Housing Units | % Housing Units |
| Single Unit, Detached | 194 | 97.0% |
| Single Unit, Attached | 6 | 3.0% |
| 2 Unit Apartments | 0 | 0.0% |
| 3 or 4 Unit Apartments | 0 | 0.0% |
| 5 to 9 Unit Apartments | 0 | 0.0% |
| 10 or more Apartments | 0 | 0.0% |
| Mobile Home / Other | 0 | 0.0% |
| Total | 200 | 100.0% |
Housing Structures by Occupancy in Opal
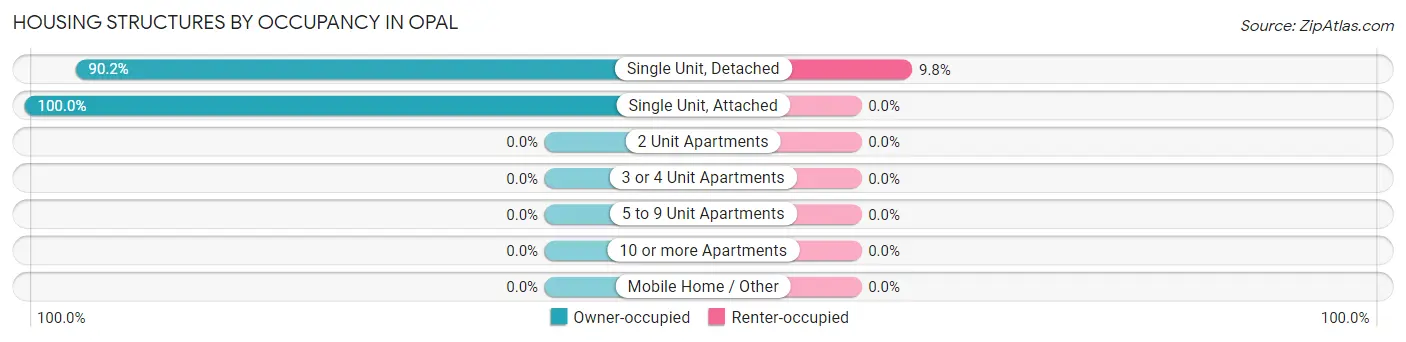
| Structure Type | Owner-occupied | Renter-occupied |
| Single Unit, Detached | 175 (90.2%) | 19 (9.8%) |
| Single Unit, Attached | 6 (100.0%) | 0 (0.0%) |
| 2 Unit Apartments | 0 (0.0%) | 0 (0.0%) |
| 3 or 4 Unit Apartments | 0 (0.0%) | 0 (0.0%) |
| 5 to 9 Unit Apartments | 0 (0.0%) | 0 (0.0%) |
| 10 or more Apartments | 0 (0.0%) | 0 (0.0%) |
| Mobile Home / Other | 0 (0.0%) | 0 (0.0%) |
| Total | 181 (90.5%) | 19 (9.5%) |
Housing Structures by Number of Rooms in Opal
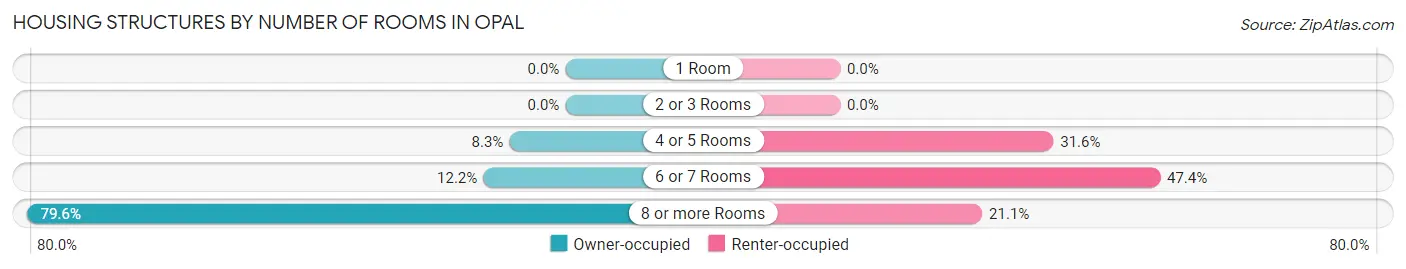
| Number of Rooms | Owner-occupied | Renter-occupied |
| 1 Room | 0 (0.0%) | 0 (0.0%) |
| 2 or 3 Rooms | 0 (0.0%) | 0 (0.0%) |
| 4 or 5 Rooms | 15 (8.3%) | 6 (31.6%) |
| 6 or 7 Rooms | 22 (12.1%) | 9 (47.4%) |
| 8 or more Rooms | 144 (79.6%) | 4 (21.0%) |
| Total | 181 (100.0%) | 19 (100.0%) |
Housing Structure by Heating Type in Opal
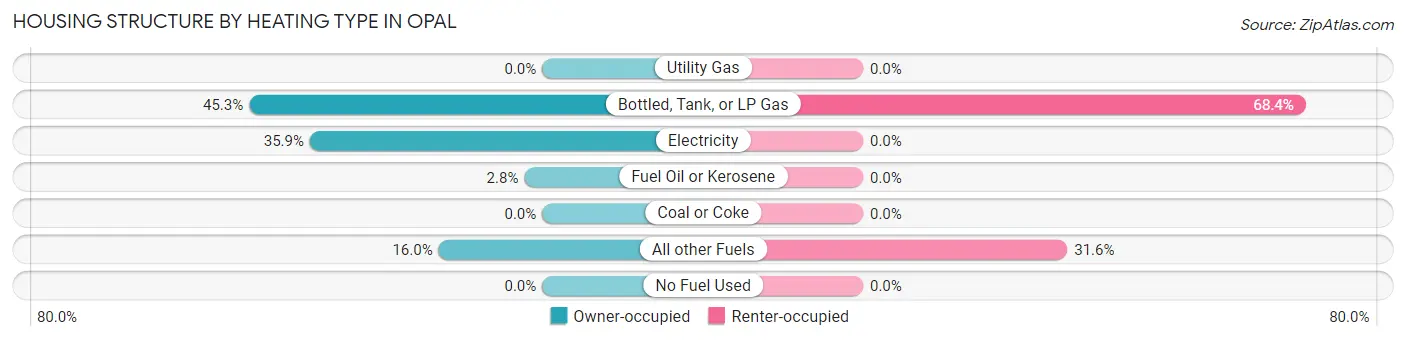
| Heating Type | Owner-occupied | Renter-occupied |
| Utility Gas | 0 (0.0%) | 0 (0.0%) |
| Bottled, Tank, or LP Gas | 82 (45.3%) | 13 (68.4%) |
| Electricity | 65 (35.9%) | 0 (0.0%) |
| Fuel Oil or Kerosene | 5 (2.8%) | 0 (0.0%) |
| Coal or Coke | 0 (0.0%) | 0 (0.0%) |
| All other Fuels | 29 (16.0%) | 6 (31.6%) |
| No Fuel Used | 0 (0.0%) | 0 (0.0%) |
| Total | 181 (100.0%) | 19 (100.0%) |
Household Vehicle Usage in Opal
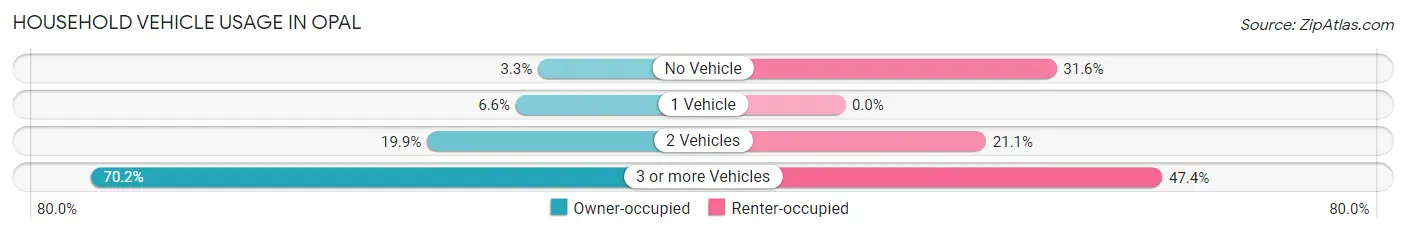
| Vehicles per Household | Owner-occupied | Renter-occupied |
| No Vehicle | 6 (3.3%) | 6 (31.6%) |
| 1 Vehicle | 12 (6.6%) | 0 (0.0%) |
| 2 Vehicles | 36 (19.9%) | 4 (21.0%) |
| 3 or more Vehicles | 127 (70.2%) | 9 (47.4%) |
| Total | 181 (100.0%) | 19 (100.0%) |
Real Estate & Mortgages in Opal
Real Estate and Mortgage Overview in Opal
| Characteristic | Without Mortgage | With Mortgage |
| Housing Units | 18 | 163 |
| Median Property Value | $475,000 | $451,900 |
| Median Household Income | $188,750 | $107 |
| Monthly Housing Costs | $875 | $51 |
| Real Estate Taxes | $4,750 | $0 |
Property Value by Mortgage Status in Opal
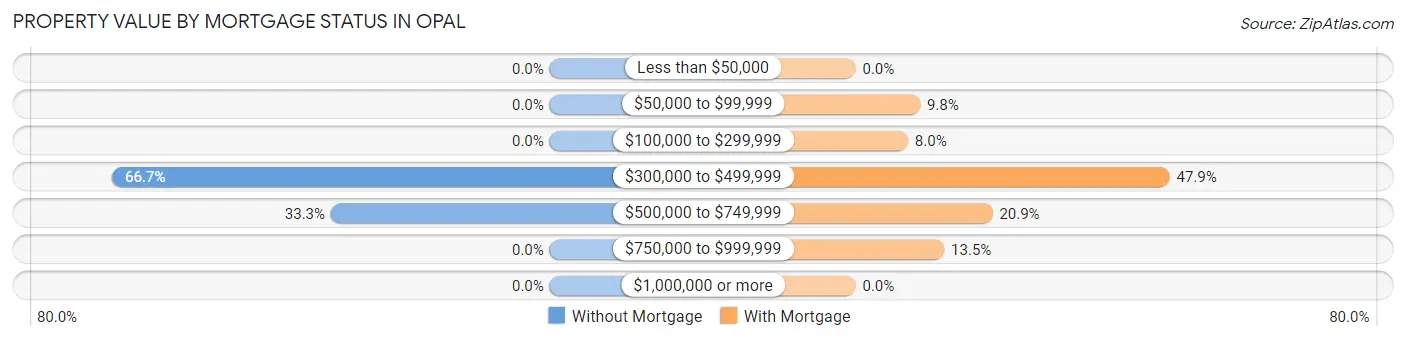
| Property Value | Without Mortgage | With Mortgage |
| Less than $50,000 | 0 (0.0%) | 0 (0.0%) |
| $50,000 to $99,999 | 0 (0.0%) | 16 (9.8%) |
| $100,000 to $299,999 | 0 (0.0%) | 13 (8.0%) |
| $300,000 to $499,999 | 12 (66.7%) | 78 (47.8%) |
| $500,000 to $749,999 | 6 (33.3%) | 34 (20.9%) |
| $750,000 to $999,999 | 0 (0.0%) | 22 (13.5%) |
| $1,000,000 or more | 0 (0.0%) | 0 (0.0%) |
| Total | 18 (100.0%) | 163 (100.0%) |
Household Income by Mortgage Status in Opal
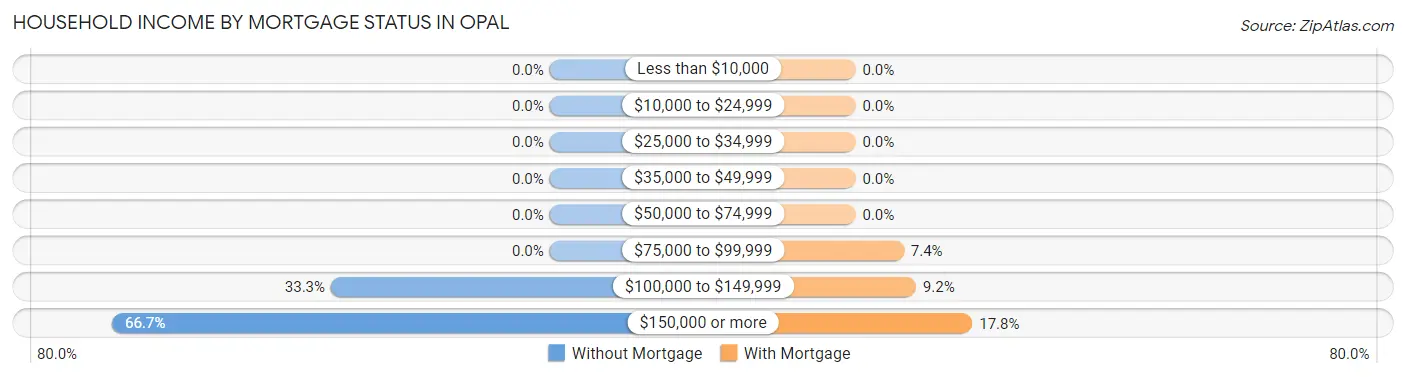
| Household Income | Without Mortgage | With Mortgage |
| Less than $10,000 | 0 (0.0%) | 0 (0.0%) |
| $10,000 to $24,999 | 0 (0.0%) | 0 (0.0%) |
| $25,000 to $34,999 | 0 (0.0%) | 0 (0.0%) |
| $35,000 to $49,999 | 0 (0.0%) | 0 (0.0%) |
| $50,000 to $74,999 | 0 (0.0%) | 0 (0.0%) |
| $75,000 to $99,999 | 0 (0.0%) | 12 (7.4%) |
| $100,000 to $149,999 | 6 (33.3%) | 15 (9.2%) |
| $150,000 or more | 12 (66.7%) | 29 (17.8%) |
| Total | 18 (100.0%) | 163 (100.0%) |
Property Value to Household Income Ratio in Opal
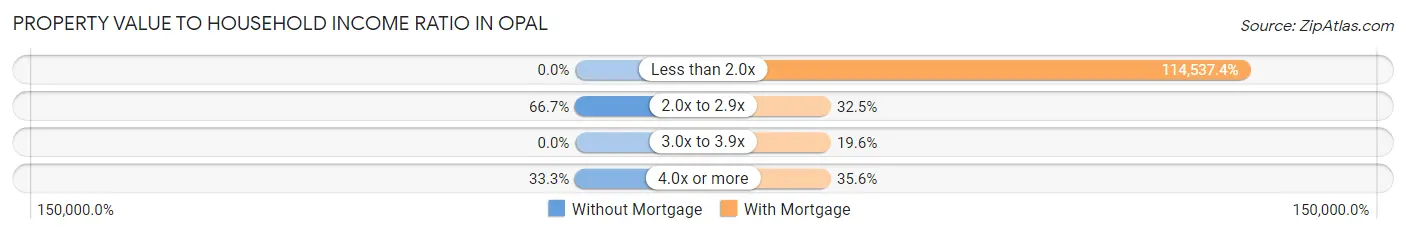
| Value-to-Income Ratio | Without Mortgage | With Mortgage |
| Less than 2.0x | 0 (0.0%) | 186,696 (114,537.4%) |
| 2.0x to 2.9x | 12 (66.7%) | 53 (32.5%) |
| 3.0x to 3.9x | 0 (0.0%) | 32 (19.6%) |
| 4.0x or more | 6 (33.3%) | 58 (35.6%) |
| Total | 18 (100.0%) | 163 (100.0%) |
Real Estate Taxes by Mortgage Status in Opal
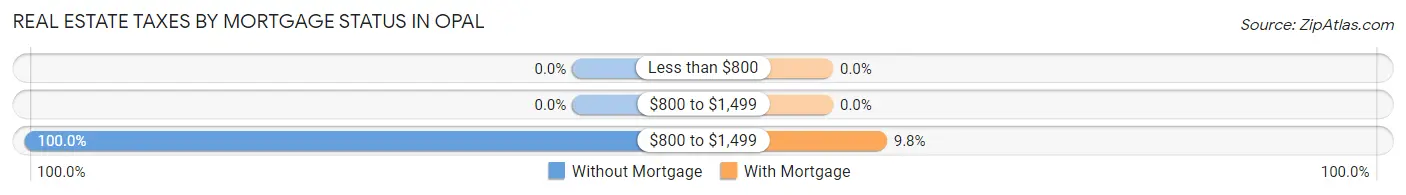
| Property Taxes | Without Mortgage | With Mortgage |
| Less than $800 | 0 (0.0%) | 0 (0.0%) |
| $800 to $1,499 | 0 (0.0%) | 0 (0.0%) |
| $800 to $1,499 | 18 (100.0%) | 16 (9.8%) |
| Total | 18 (100.0%) | 163 (100.0%) |
Health & Disability in Opal
Health Insurance Coverage by Age in Opal
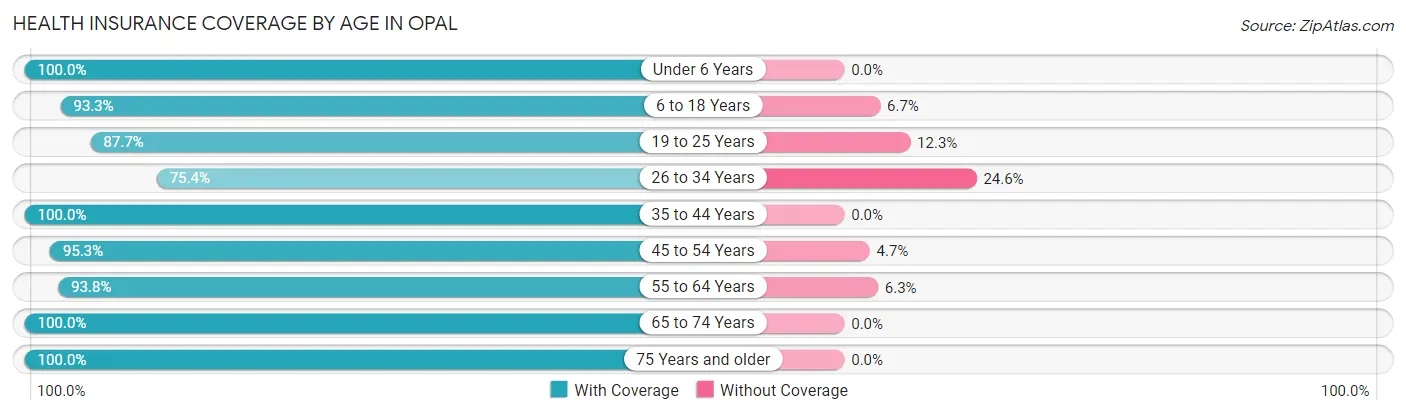
| Age Bracket | With Coverage | Without Coverage |
| Under 6 Years | 25 (100.0%) | 0 (0.0%) |
| 6 to 18 Years | 196 (93.3%) | 14 (6.7%) |
| 19 to 25 Years | 50 (87.7%) | 7 (12.3%) |
| 26 to 34 Years | 52 (75.4%) | 17 (24.6%) |
| 35 to 44 Years | 121 (100.0%) | 0 (0.0%) |
| 45 to 54 Years | 101 (95.3%) | 5 (4.7%) |
| 55 to 64 Years | 120 (93.8%) | 8 (6.2%) |
| 65 to 74 Years | 28 (100.0%) | 0 (0.0%) |
| 75 Years and older | 12 (100.0%) | 0 (0.0%) |
| Total | 705 (93.2%) | 51 (6.8%) |
Health Insurance Coverage by Citizenship Status in Opal
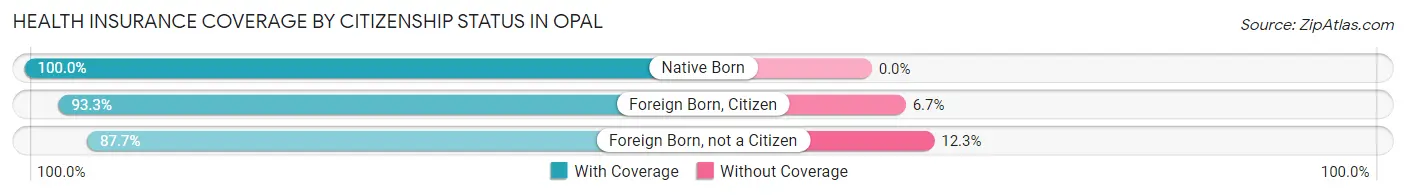
| Citizenship Status | With Coverage | Without Coverage |
| Native Born | 25 (100.0%) | 0 (0.0%) |
| Foreign Born, Citizen | 196 (93.3%) | 14 (6.7%) |
| Foreign Born, not a Citizen | 50 (87.7%) | 7 (12.3%) |
Health Insurance Coverage by Household Income in Opal
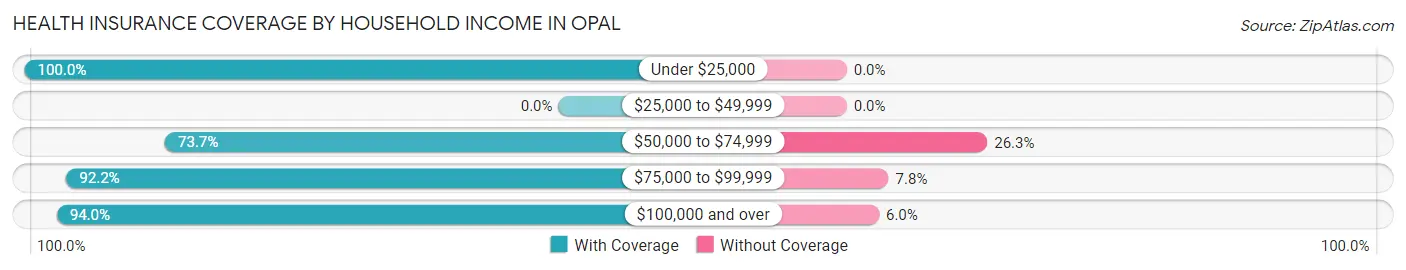
| Household Income | With Coverage | Without Coverage |
| Under $25,000 | 6 (100.0%) | 0 (0.0%) |
| $25,000 to $49,999 | 0 (0.0%) | 0 (0.0%) |
| $50,000 to $74,999 | 14 (73.7%) | 5 (26.3%) |
| $75,000 to $99,999 | 94 (92.2%) | 8 (7.8%) |
| $100,000 and over | 591 (94.0%) | 38 (6.0%) |
Public vs Private Health Insurance Coverage by Age in Opal
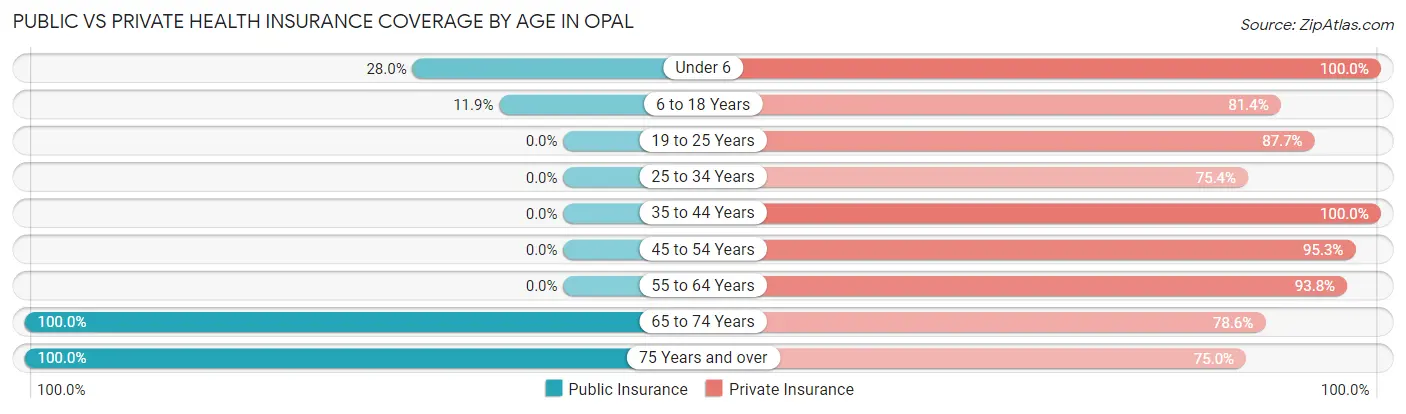
| Age Bracket | Public Insurance | Private Insurance |
| Under 6 | 7 (28.0%) | 25 (100.0%) |
| 6 to 18 Years | 25 (11.9%) | 171 (81.4%) |
| 19 to 25 Years | 0 (0.0%) | 50 (87.7%) |
| 25 to 34 Years | 0 (0.0%) | 52 (75.4%) |
| 35 to 44 Years | 0 (0.0%) | 121 (100.0%) |
| 45 to 54 Years | 0 (0.0%) | 101 (95.3%) |
| 55 to 64 Years | 0 (0.0%) | 120 (93.8%) |
| 65 to 74 Years | 28 (100.0%) | 22 (78.6%) |
| 75 Years and over | 12 (100.0%) | 9 (75.0%) |
| Total | 72 (9.5%) | 671 (88.8%) |
Disability Status by Sex by Age in Opal
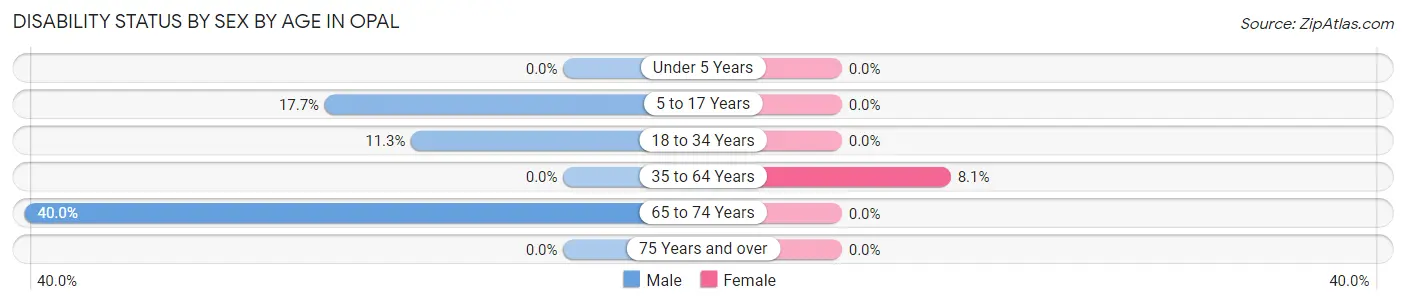
| Age Bracket | Male | Female |
| Under 5 Years | 0 (0.0%) | 0 (0.0%) |
| 5 to 17 Years | 20 (17.7%) | 0 (0.0%) |
| 18 to 34 Years | 7 (11.3%) | 0 (0.0%) |
| 35 to 64 Years | 0 (0.0%) | 14 (8.1%) |
| 65 to 74 Years | 6 (40.0%) | 0 (0.0%) |
| 75 Years and over | 0 (0.0%) | 0 (0.0%) |
Disability Class by Sex by Age in Opal
Disability Class: Hearing Difficulty
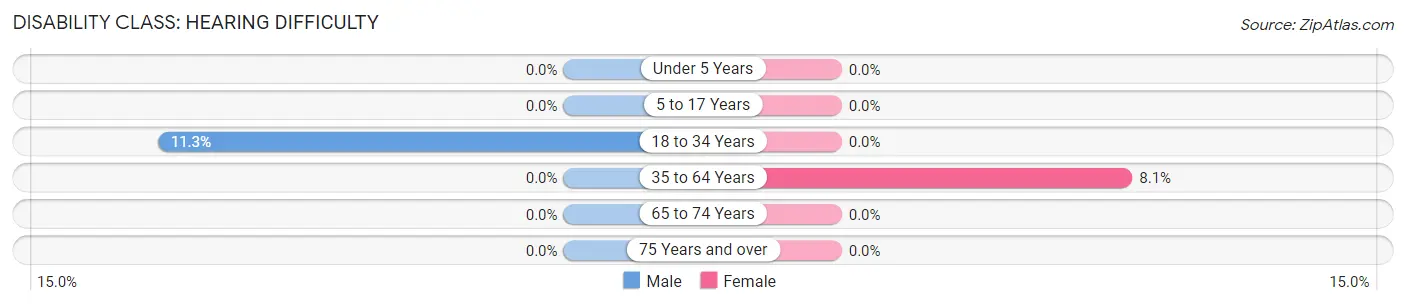
| Age Bracket | Male | Female |
| Under 5 Years | 0 (0.0%) | 0 (0.0%) |
| 5 to 17 Years | 0 (0.0%) | 0 (0.0%) |
| 18 to 34 Years | 7 (11.3%) | 0 (0.0%) |
| 35 to 64 Years | 0 (0.0%) | 14 (8.1%) |
| 65 to 74 Years | 0 (0.0%) | 0 (0.0%) |
| 75 Years and over | 0 (0.0%) | 0 (0.0%) |
Disability Class: Vision Difficulty
| Age Bracket | Male | Female |
| Under 5 Years | 0 (0.0%) | 0 (0.0%) |
| 5 to 17 Years | 0 (0.0%) | 0 (0.0%) |
| 18 to 34 Years | 0 (0.0%) | 0 (0.0%) |
| 35 to 64 Years | 0 (0.0%) | 0 (0.0%) |
| 65 to 74 Years | 0 (0.0%) | 0 (0.0%) |
| 75 Years and over | 0 (0.0%) | 0 (0.0%) |
Disability Class: Cognitive Difficulty
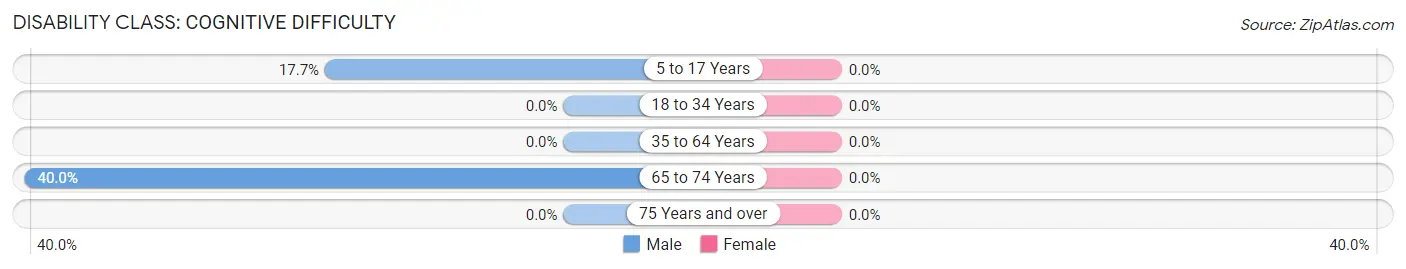
| Age Bracket | Male | Female |
| 5 to 17 Years | 20 (17.7%) | 0 (0.0%) |
| 18 to 34 Years | 0 (0.0%) | 0 (0.0%) |
| 35 to 64 Years | 0 (0.0%) | 0 (0.0%) |
| 65 to 74 Years | 6 (40.0%) | 0 (0.0%) |
| 75 Years and over | 0 (0.0%) | 0 (0.0%) |
Disability Class: Ambulatory Difficulty
| Age Bracket | Male | Female |
| 5 to 17 Years | 0 (0.0%) | 0 (0.0%) |
| 18 to 34 Years | 0 (0.0%) | 0 (0.0%) |
| 35 to 64 Years | 0 (0.0%) | 0 (0.0%) |
| 65 to 74 Years | 0 (0.0%) | 0 (0.0%) |
| 75 Years and over | 0 (0.0%) | 0 (0.0%) |
Disability Class: Self-Care Difficulty
| Age Bracket | Male | Female |
| 5 to 17 Years | 0 (0.0%) | 0 (0.0%) |
| 18 to 34 Years | 0 (0.0%) | 0 (0.0%) |
| 35 to 64 Years | 0 (0.0%) | 0 (0.0%) |
| 65 to 74 Years | 0 (0.0%) | 0 (0.0%) |
| 75 Years and over | 0 (0.0%) | 0 (0.0%) |
Technology Access in Opal
Computing Device Access in Opal
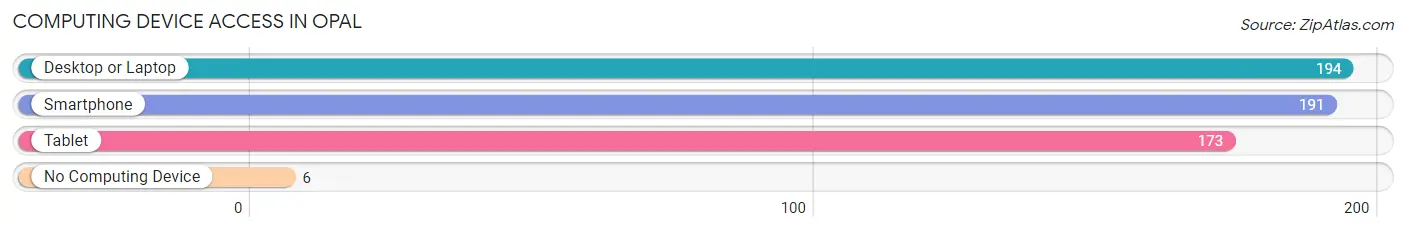
| Device Type | # Households | % Households |
| Desktop or Laptop | 194 | 97.0% |
| Smartphone | 191 | 95.5% |
| Tablet | 173 | 86.5% |
| No Computing Device | 6 | 3.0% |
| Total | 200 | 100.0% |
Internet Access in Opal
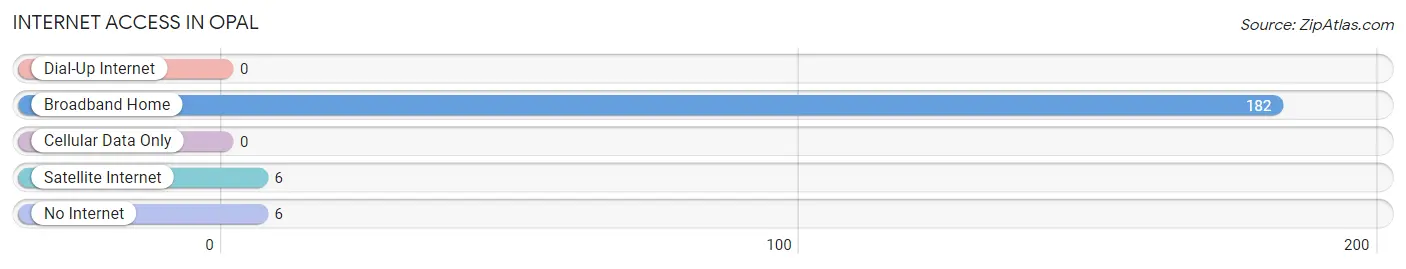
| Internet Type | # Households | % Households |
| Dial-Up Internet | 0 | 0.0% |
| Broadband Home | 182 | 91.0% |
| Cellular Data Only | 0 | 0.0% |
| Satellite Internet | 6 | 3.0% |
| No Internet | 6 | 3.0% |
| Total | 200 | 100.0% |
Opal Summary
Opal, Virginia is a small unincorporated community located in Fauquier County, Virginia. It is situated in the foothills of the Blue Ridge Mountains, approximately 30 miles west of Washington, D.C. The community is home to a population of approximately 500 people, and is known for its rural charm and close-knit community.
History
The area that is now known as Opal was first settled in the late 1700s by a group of German immigrants. The community was originally known as “Opal’s Crossroads”, named after the local postmaster, John Opal. The area was primarily used for farming and the production of tobacco. In the late 1800s, the community began to grow and develop, with the construction of a school, a church, and a general store.
In the early 1900s, the community was home to a number of businesses, including a blacksmith, a sawmill, and a gristmill. The community also had a post office, which was established in 1902. The post office was named after the local postmaster, John Opal.
In the mid-1900s, the community began to decline as many of the businesses closed and the population began to move away. However, the community has seen a resurgence in recent years, with the opening of a number of new businesses and the construction of new homes.
Geography
Opal is located in the foothills of the Blue Ridge Mountains, approximately 30 miles west of Washington, D.C. The community is situated in a rural area, with rolling hills and lush forests. The area is known for its scenic beauty and is a popular destination for outdoor activities such as hiking, camping, and fishing.
Economy
The economy of Opal is primarily based on agriculture and tourism. The area is home to a number of farms, which produce a variety of crops, including corn, soybeans, and hay. The area is also home to a number of wineries, which produce a variety of wines.
The community is also home to a number of small businesses, including restaurants, shops, and art galleries. The area is also home to a number of bed and breakfasts, which attract visitors from all over the world.
Demographics
As of the 2010 census, the population of Opal was approximately 500 people. The racial makeup of the community was 94.2% White, 2.2% African American, 0.4% Native American, 0.4% Asian, and 2.8% from other races. The median household income was $50,000, and the median age was 44.
Opal is a small, close-knit community with a strong sense of community and pride. The area is known for its rural charm and scenic beauty, and is a popular destination for outdoor activities. The community is also home to a number of small businesses, which provide employment opportunities for the local population.
Common Questions
What is Per Capita Income in Opal?
Per Capita income in Opal is $51,105.
What is the Median Family Income in Opal?
Median Family Income in Opal is $186,719.
What is the Median Household income in Opal?
Median Household Income in Opal is $185,536.
What is Income or Wage Gap in Opal?
Income or Wage Gap in Opal is 23.0%.
Women in Opal earn 77.0 cents for every dollar earned by a man.
What is Inequality or Gini Index in Opal?
Inequality or Gini Index in Opal is 0.29.
What is the Total Population of Opal?
Total Population of Opal is 756.
What is the Total Male Population of Opal?
Total Male Population of Opal is 381.
What is the Total Female Population of Opal?
Total Female Population of Opal is 375.
What is the Ratio of Males per 100 Females in Opal?
There are 101.60 Males per 100 Females in Opal.
What is the Ratio of Females per 100 Males in Opal?
There are 98.43 Females per 100 Males in Opal.
What is the Median Population Age in Opal?
Median Population Age in Opal is 36.7 Years.
What is the Average Family Size in Opal
Average Family Size in Opal is 3.9 People.
What is the Average Household Size in Opal
Average Household Size in Opal is 3.8 People.
How Large is the Labor Force in Opal?
There are 512 People in the Labor Forcein in Opal.
What is the Percentage of People in the Labor Force in Opal?
86.8% of People are in the Labor Force in Opal.
What is the Unemployment Rate in Opal?
Unemployment Rate in Opal is 1.2%.