West Point, VA Map & Demographics
West Point Map
West Point Overview
$37,572
PER CAPITA INCOME
$92,438
AVG FAMILY INCOME
$72,305
AVG HOUSEHOLD INCOME
36.8%
WAGE / INCOME GAP [ % ]
63.2¢/ $1
WAGE / INCOME GAP [ $ ]
0.39
INEQUALITY / GINI INDEX
3,396
TOTAL POPULATION
1,687
MALE POPULATION
1,709
FEMALE POPULATION
98.71
MALES / 100 FEMALES
101.30
FEMALES / 100 MALES
41.4
MEDIAN AGE
3.0
AVG FAMILY SIZE
2.4
AVG HOUSEHOLD SIZE
1,831
LABOR FORCE [ PEOPLE ]
68.9%
PERCENT IN LABOR FORCE
2.6%
UNEMPLOYMENT RATE
West Point Zip Codes
West Point Area Codes
Income in West Point
Income Overview in West Point
Per Capita Income in West Point is $37,572, while median incomes of families and households are $92,438 and $72,305 respectively.
| Characteristic | Number | Measure |
| Per Capita Income | 3,396 | $37,572 |
| Median Family Income | 936 | $92,438 |
| Mean Family Income | 936 | $102,760 |
| Median Household Income | 1,415 | $72,305 |
| Mean Household Income | 1,415 | $83,038 |
| Income Deficit | 936 | $0 |
| Wage / Income Gap (%) | 3,396 | 36.84% |
| Wage / Income Gap ($) | 3,396 | 63.16¢ per $1 |
| Gini / Inequality Index | 3,396 | 0.39 |
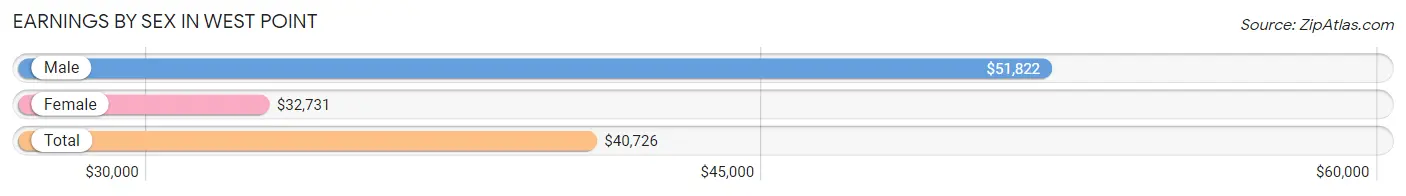
Earnings by Sex in West Point
Average Earnings in West Point are $40,726, $51,822 for men and $32,731 for women, a difference of 36.8%.
| Sex | Number | Average Earnings |
| Male | 838 (45.2%) | $51,822 |
| Female | 1,016 (54.8%) | $32,731 |
| Total | 1,854 (100.0%) | $40,726 |
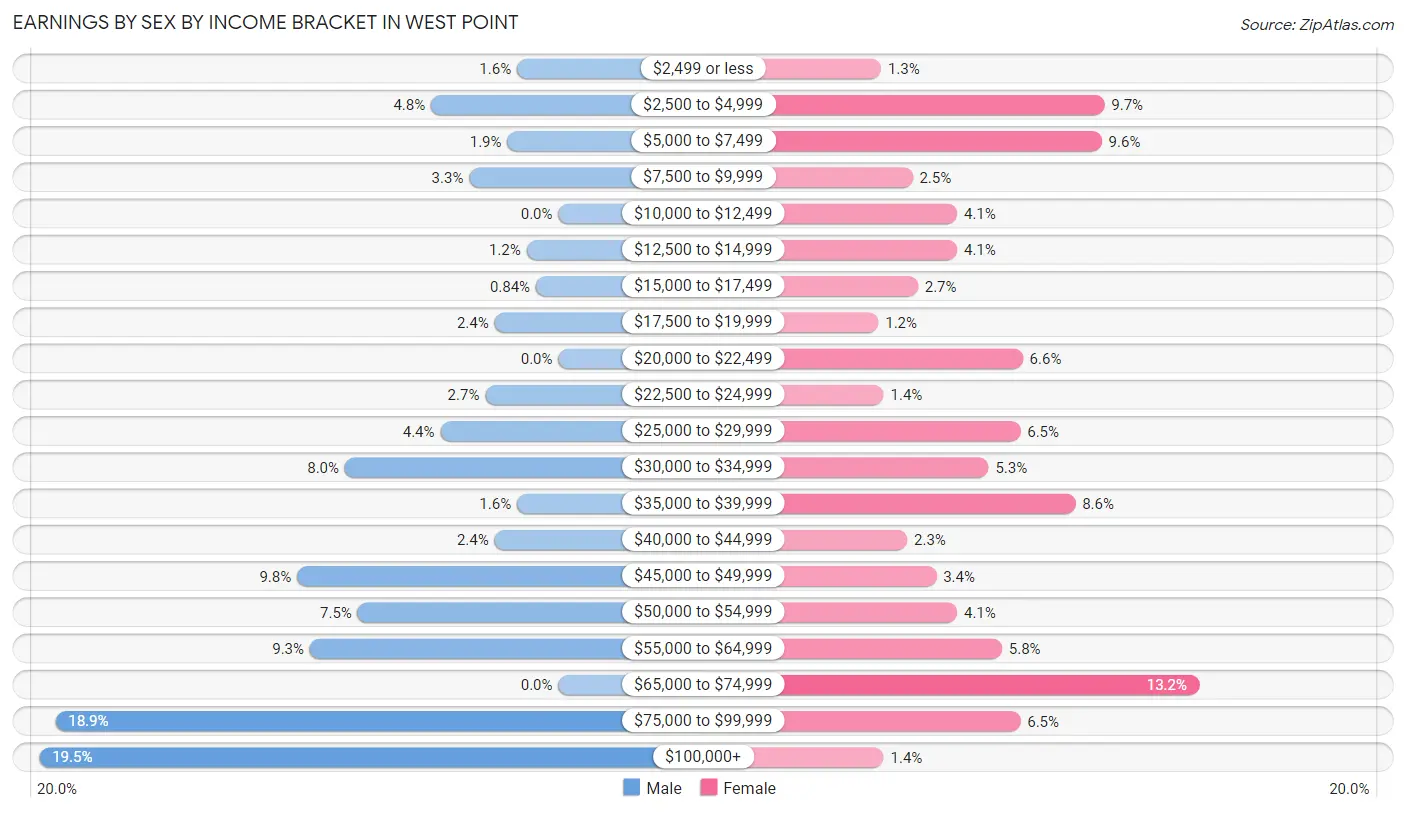
Earnings by Sex by Income Bracket in West Point
The most common earnings brackets in West Point are $100,000+ for men (163 | 19.5%) and $65,000 to $74,999 for women (134 | 13.2%).
| Income | Male | Female |
| $2,499 or less | 13 (1.5%) | 13 (1.3%) |
| $2,500 to $4,999 | 40 (4.8%) | 98 (9.7%) |
| $5,000 to $7,499 | 16 (1.9%) | 97 (9.6%) |
| $7,500 to $9,999 | 28 (3.3%) | 25 (2.5%) |
| $10,000 to $12,499 | 0 (0.0%) | 42 (4.1%) |
| $12,500 to $14,999 | 10 (1.2%) | 42 (4.1%) |
| $15,000 to $17,499 | 7 (0.8%) | 27 (2.7%) |
| $17,500 to $19,999 | 20 (2.4%) | 12 (1.2%) |
| $20,000 to $22,499 | 0 (0.0%) | 67 (6.6%) |
| $22,500 to $24,999 | 23 (2.7%) | 14 (1.4%) |
| $25,000 to $29,999 | 37 (4.4%) | 66 (6.5%) |
| $30,000 to $34,999 | 67 (8.0%) | 54 (5.3%) |
| $35,000 to $39,999 | 13 (1.5%) | 87 (8.6%) |
| $40,000 to $44,999 | 20 (2.4%) | 23 (2.3%) |
| $45,000 to $49,999 | 82 (9.8%) | 34 (3.4%) |
| $50,000 to $54,999 | 63 (7.5%) | 42 (4.1%) |
| $55,000 to $64,999 | 78 (9.3%) | 59 (5.8%) |
| $65,000 to $74,999 | 0 (0.0%) | 134 (13.2%) |
| $75,000 to $99,999 | 158 (18.9%) | 66 (6.5%) |
| $100,000+ | 163 (19.5%) | 14 (1.4%) |
| Total | 838 (100.0%) | 1,016 (100.0%) |
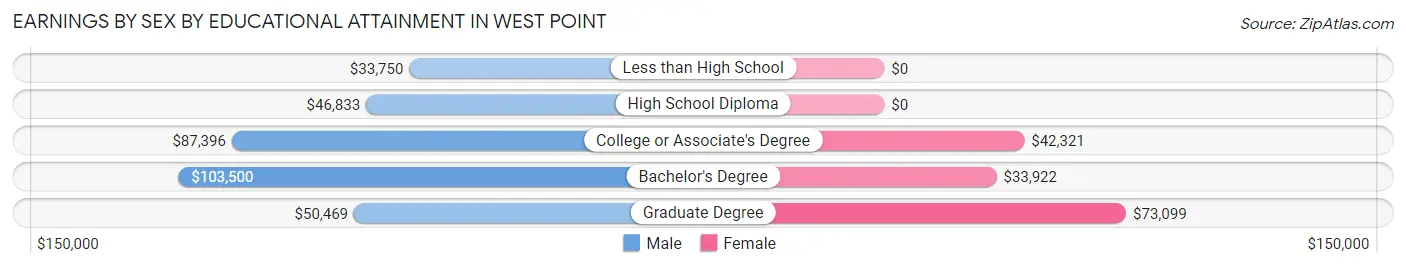
Earnings by Sex by Educational Attainment in West Point
Average earnings in West Point are $57,895 for men and $37,391 for women, a difference of 35.4%. Men with an educational attainment of bachelor's degree enjoy the highest average annual earnings of $103,500, while those with less than high school education earn the least with $33,750. Women with an educational attainment of graduate degree earn the most with the average annual earnings of $73,099, while those with bachelor's degree education have the smallest earnings of $33,922.
| Educational Attainment | Male Income | Female Income |
| Less than High School | $33,750 | $0 |
| High School Diploma | $46,833 | $0 |
| College or Associate's Degree | $87,396 | $42,321 |
| Bachelor's Degree | $103,500 | $33,922 |
| Graduate Degree | $50,469 | $73,099 |
| Total | $57,895 | $37,391 |
Family Income in West Point
Family Income Brackets in West Point
According to the West Point family income data, there are 291 families falling into the $100,000 to $149,999 income range, which is the most common income bracket and makes up 31.1% of all families. Conversely, the $10,000 to $14,999 income bracket is the least frequent group with only 7 families (0.7%) belonging to this category.
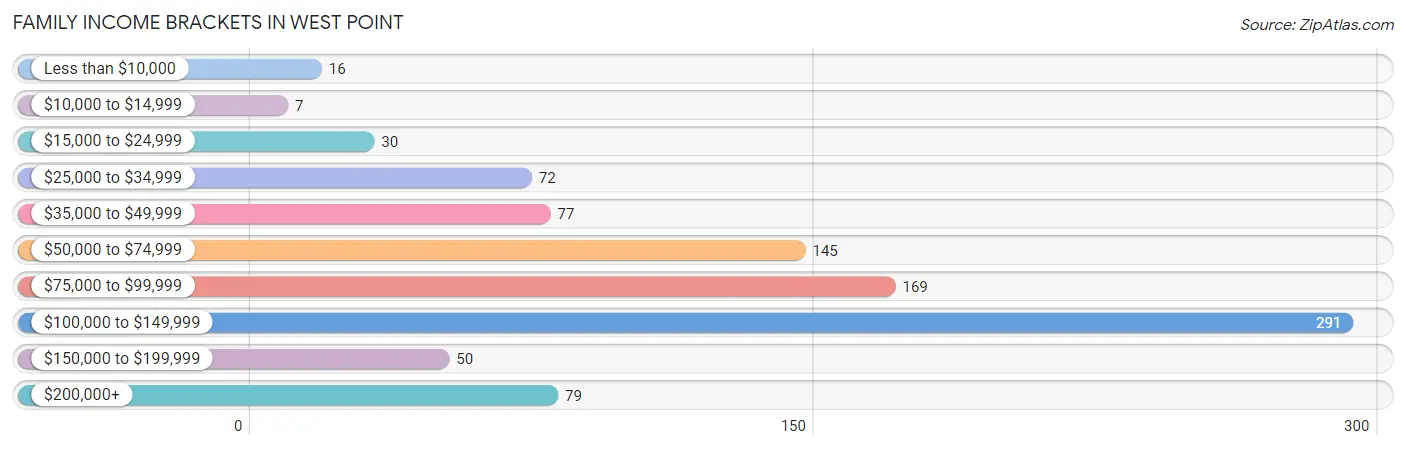
| Income Bracket | # Families | % Families |
| Less than $10,000 | 16 | 1.7% |
| $10,000 to $14,999 | 7 | 0.7% |
| $15,000 to $24,999 | 30 | 3.2% |
| $25,000 to $34,999 | 72 | 7.7% |
| $35,000 to $49,999 | 77 | 8.2% |
| $50,000 to $74,999 | 145 | 15.5% |
| $75,000 to $99,999 | 169 | 18.1% |
| $100,000 to $149,999 | 291 | 31.1% |
| $150,000 to $199,999 | 50 | 5.3% |
| $200,000+ | 79 | 8.4% |
Family Income by Famaliy Size in West Point
3-person families (253 | 27.0%) account for the highest median family income in West Point with $134,219 per family, while 3-person families (253 | 27.0%) have the highest median income of $44,740 per family member.
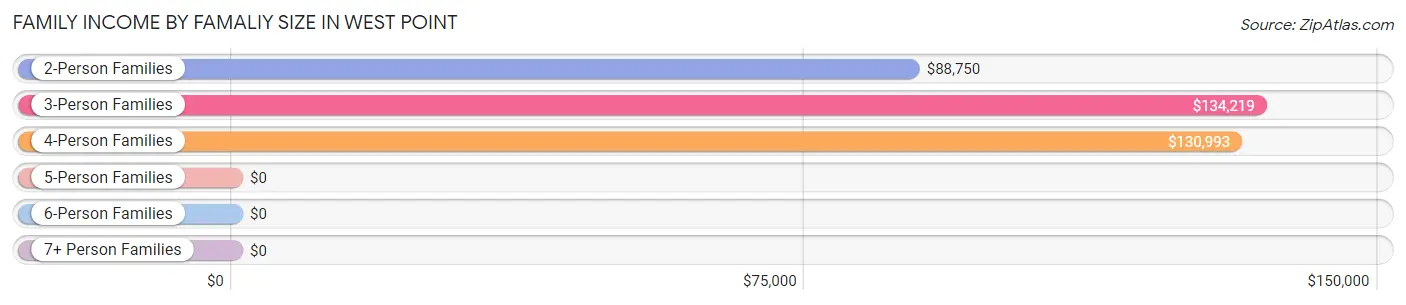
| Income Bracket | # Families | Median Income |
| 2-Person Families | 531 (56.7%) | $88,750 |
| 3-Person Families | 253 (27.0%) | $134,219 |
| 4-Person Families | 123 (13.1%) | $130,993 |
| 5-Person Families | 16 (1.7%) | $0 |
| 6-Person Families | 0 (0.0%) | $0 |
| 7+ Person Families | 13 (1.4%) | $0 |
| Total | 936 (100.0%) | $92,438 |
Family Income by Number of Earners in West Point
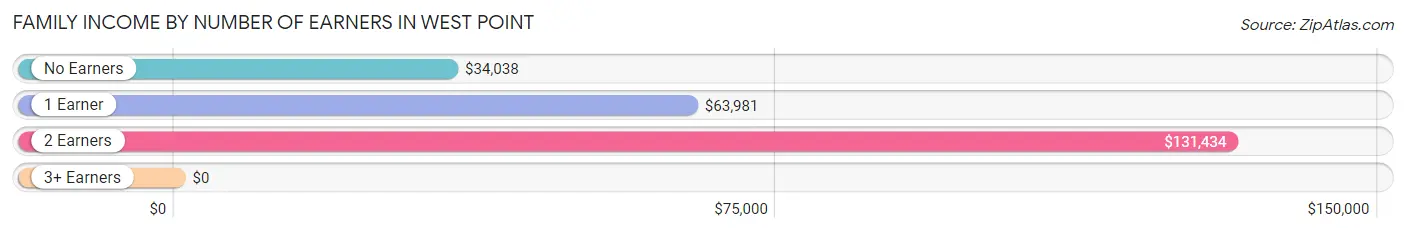
| Number of Earners | # Families | Median Income |
| No Earners | 136 (14.5%) | $34,038 |
| 1 Earner | 232 (24.8%) | $63,981 |
| 2 Earners | 495 (52.9%) | $131,434 |
| 3+ Earners | 73 (7.8%) | $0 |
| Total | 936 (100.0%) | $92,438 |
Household Income in West Point
Household Income Brackets in West Point
With 291 households falling in the category, the $100,000 to $149,999 income range is the most frequent in West Point, accounting for 20.6% of all households. In contrast, only 23 households (1.6%) fall into the $10,000 to $14,999 income bracket, making it the least populous group.
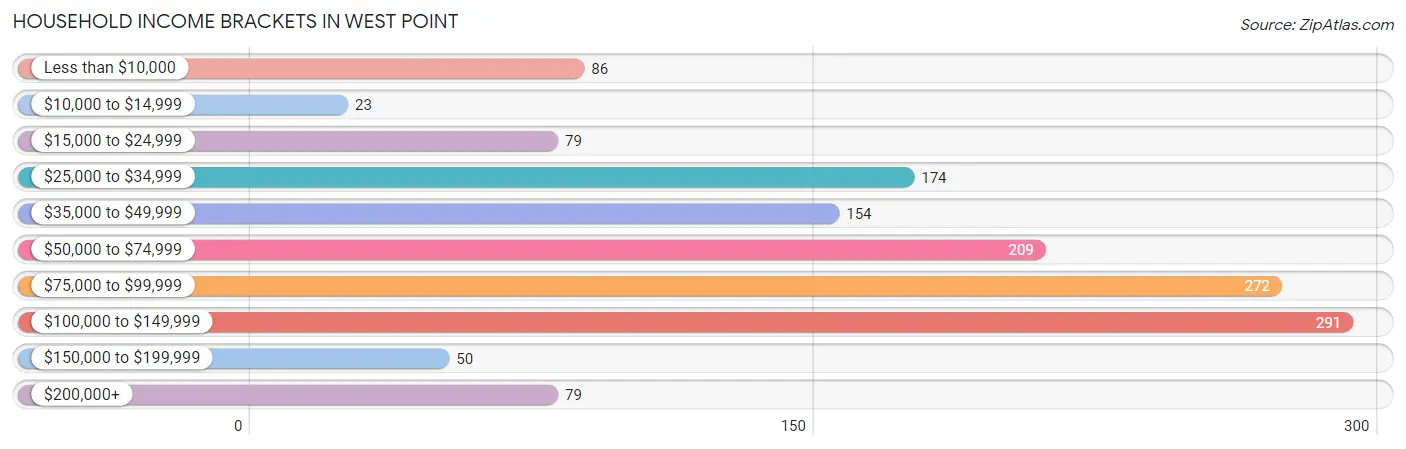
| Income Bracket | # Households | % Households |
| Less than $10,000 | 86 | 6.1% |
| $10,000 to $14,999 | 23 | 1.6% |
| $15,000 to $24,999 | 79 | 5.6% |
| $25,000 to $34,999 | 174 | 12.3% |
| $35,000 to $49,999 | 154 | 10.9% |
| $50,000 to $74,999 | 209 | 14.8% |
| $75,000 to $99,999 | 272 | 19.2% |
| $100,000 to $149,999 | 291 | 20.6% |
| $150,000 to $199,999 | 50 | 3.5% |
| $200,000+ | 79 | 5.6% |
Household Income by Householder Age in West Point
The median household income in West Point is $72,305, with the highest median household income of $131,985 found in the 25 to 44 years age bracket for the primary householder. A total of 366 households (25.9%) fall into this category. Meanwhile, the 15 to 24 years age bracket for the primary householder has the lowest median household income of $0, with 47 households (3.3%) in this group.
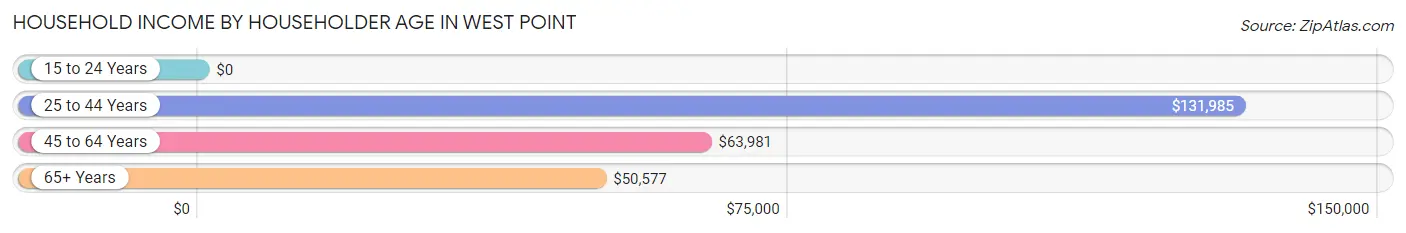
| Income Bracket | # Households | Median Income |
| 15 to 24 Years | 47 (3.3%) | $0 |
| 25 to 44 Years | 366 (25.9%) | $131,985 |
| 45 to 64 Years | 538 (38.0%) | $63,981 |
| 65+ Years | 464 (32.8%) | $50,577 |
| Total | 1,415 (100.0%) | $72,305 |
Poverty in West Point
Income Below Poverty by Sex and Age in West Point
With 7.5% poverty level for males and 7.6% for females among the residents of West Point, 18 to 24 year old males and 55 to 64 year old females are the most vulnerable to poverty, with 32 males (21.8%) and 64 females (32.2%) in their respective age groups living below the poverty level.
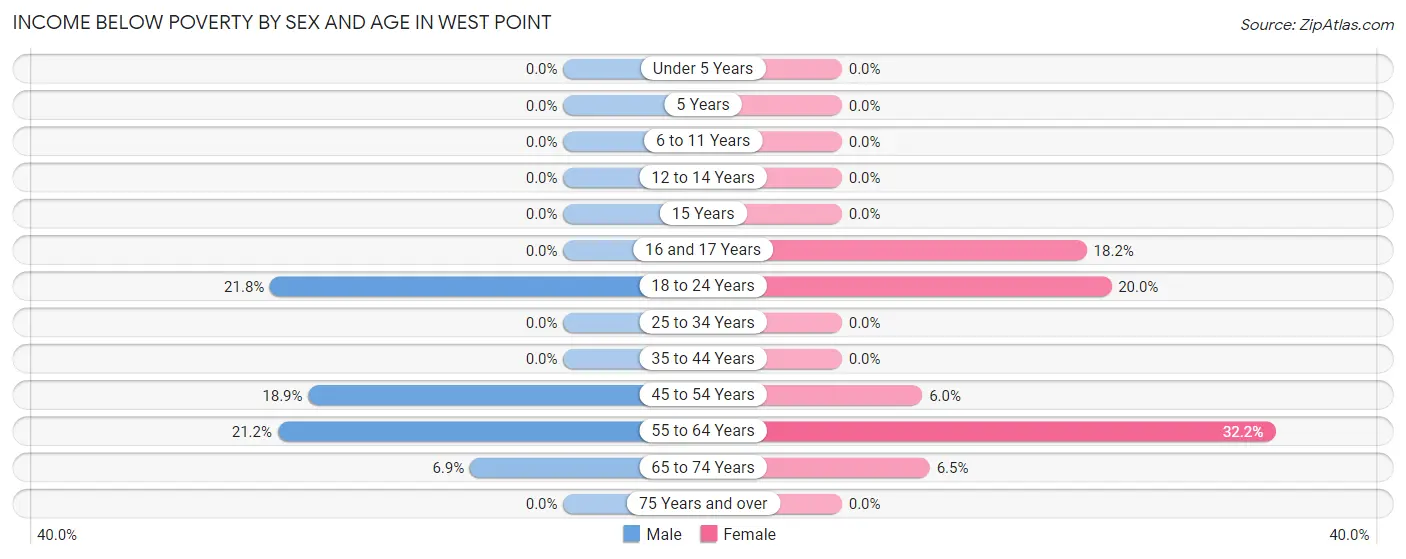
| Age Bracket | Male | Female |
| Under 5 Years | 0 (0.0%) | 0 (0.0%) |
| 5 Years | 0 (0.0%) | 0 (0.0%) |
| 6 to 11 Years | 0 (0.0%) | 0 (0.0%) |
| 12 to 14 Years | 0 (0.0%) | 0 (0.0%) |
| 15 Years | 0 (0.0%) | 0 (0.0%) |
| 16 and 17 Years | 0 (0.0%) | 8 (18.2%) |
| 18 to 24 Years | 32 (21.8%) | 30 (20.0%) |
| 25 to 34 Years | 0 (0.0%) | 0 (0.0%) |
| 35 to 44 Years | 0 (0.0%) | 0 (0.0%) |
| 45 to 54 Years | 39 (18.9%) | 12 (6.0%) |
| 55 to 64 Years | 46 (21.2%) | 64 (32.2%) |
| 65 to 74 Years | 7 (6.9%) | 13 (6.5%) |
| 75 Years and over | 0 (0.0%) | 0 (0.0%) |
| Total | 124 (7.5%) | 127 (7.6%) |
Income Above Poverty by Sex and Age in West Point
According to the poverty statistics in West Point, males aged under 5 years and females aged under 5 years are the age groups that are most secure financially, with 100.0% of males and 100.0% of females in these age groups living above the poverty line.
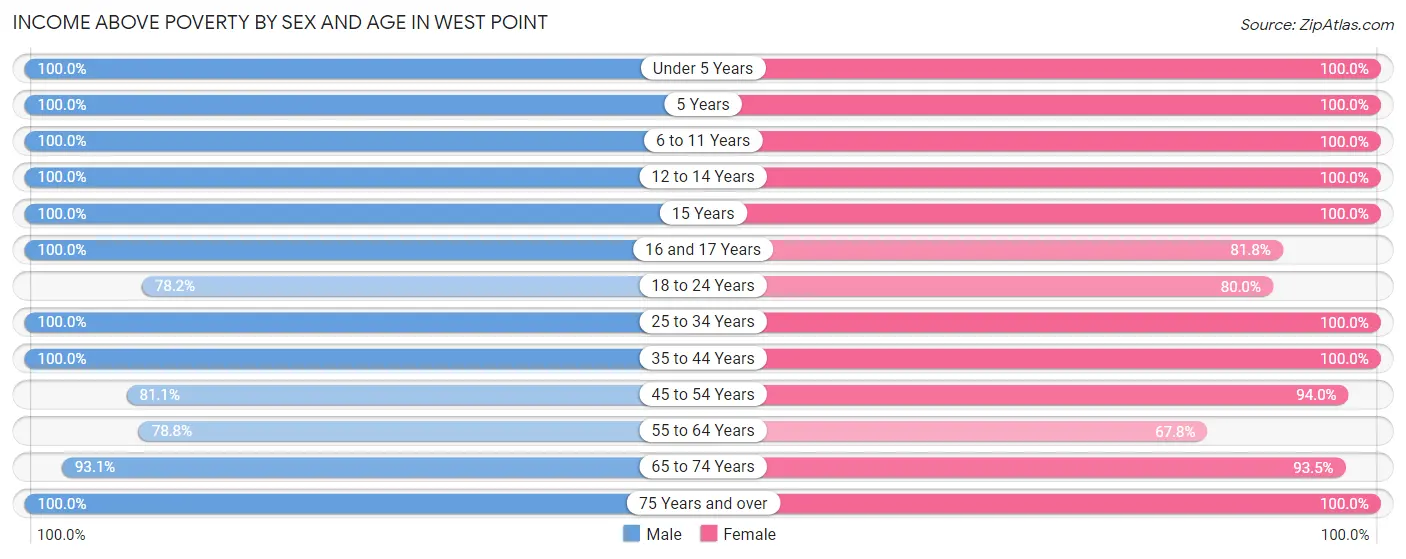
| Age Bracket | Male | Female |
| Under 5 Years | 66 (100.0%) | 56 (100.0%) |
| 5 Years | 34 (100.0%) | 27 (100.0%) |
| 6 to 11 Years | 44 (100.0%) | 86 (100.0%) |
| 12 to 14 Years | 252 (100.0%) | 130 (100.0%) |
| 15 Years | 31 (100.0%) | 12 (100.0%) |
| 16 and 17 Years | 19 (100.0%) | 36 (81.8%) |
| 18 to 24 Years | 115 (78.2%) | 120 (80.0%) |
| 25 to 34 Years | 144 (100.0%) | 214 (100.0%) |
| 35 to 44 Years | 218 (100.0%) | 194 (100.0%) |
| 45 to 54 Years | 167 (81.1%) | 189 (94.0%) |
| 55 to 64 Years | 171 (78.8%) | 135 (67.8%) |
| 65 to 74 Years | 94 (93.1%) | 186 (93.5%) |
| 75 Years and over | 173 (100.0%) | 163 (100.0%) |
| Total | 1,528 (92.5%) | 1,548 (92.4%) |
Income Below Poverty Among Married-Couple Families in West Point
The poverty statistics for married-couple families in West Point show that 7.3% or 51 of the total 700 families live below the poverty line. Families with no children have the highest poverty rate of 11.3%, comprising of 46 families. On the other hand, families with 5 or more children have the lowest poverty rate of 0.0%, which includes 0 families.
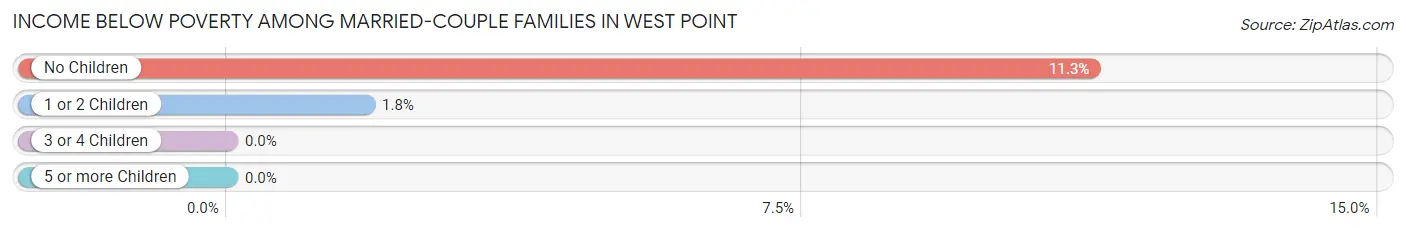
| Children | Above Poverty | Below Poverty |
| No Children | 362 (88.7%) | 46 (11.3%) |
| 1 or 2 Children | 274 (98.2%) | 5 (1.8%) |
| 3 or 4 Children | 0 (0.0%) | 0 (0.0%) |
| 5 or more Children | 13 (100.0%) | 0 (0.0%) |
| Total | 649 (92.7%) | 51 (7.3%) |
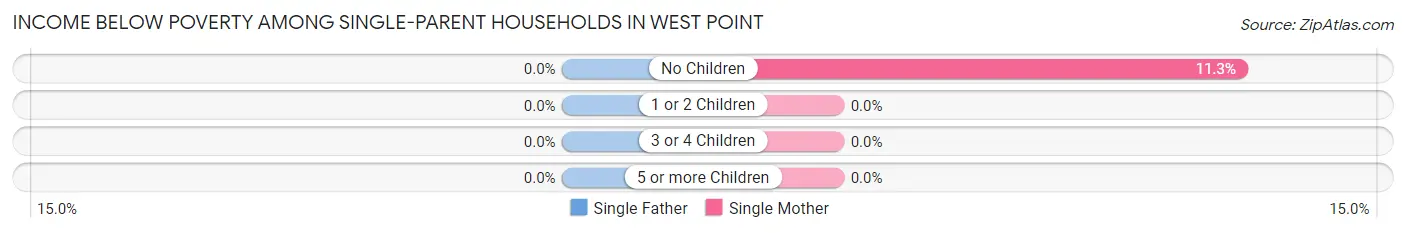
Income Below Poverty Among Single-Parent Households in West Point
| Children | Single Father | Single Mother |
| No Children | 0 (0.0%) | 7 (11.3%) |
| 1 or 2 Children | 0 (0.0%) | 0 (0.0%) |
| 3 or 4 Children | 0 (0.0%) | 0 (0.0%) |
| 5 or more Children | 0 (0.0%) | 0 (0.0%) |
| Total | 0 (0.0%) | 7 (3.0%) |
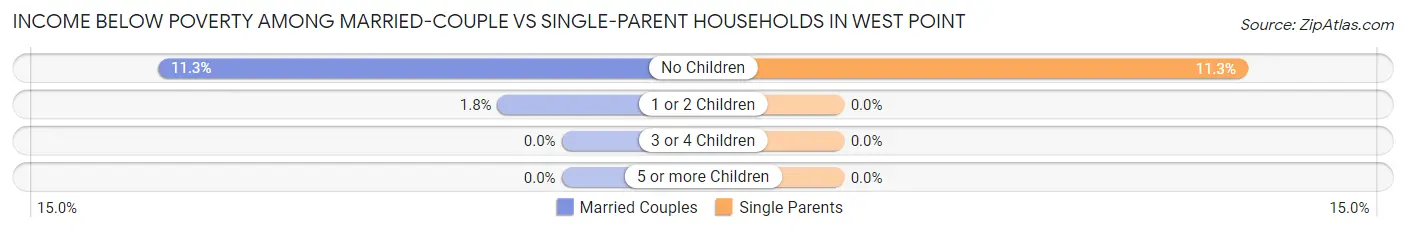
Income Below Poverty Among Married-Couple vs Single-Parent Households in West Point
The poverty data for West Point shows that 51 of the married-couple family households (7.3%) and 7 of the single-parent households (3.0%) are living below the poverty level. Within the married-couple family households, those with no children have the highest poverty rate, with 46 households (11.3%) falling below the poverty line. Among the single-parent households, those with no children have the highest poverty rate, with 7 household (11.3%) living below poverty.
| Children | Married-Couple Families | Single-Parent Households |
| No Children | 46 (11.3%) | 7 (11.3%) |
| 1 or 2 Children | 5 (1.8%) | 0 (0.0%) |
| 3 or 4 Children | 0 (0.0%) | 0 (0.0%) |
| 5 or more Children | 0 (0.0%) | 0 (0.0%) |
| Total | 51 (7.3%) | 7 (3.0%) |
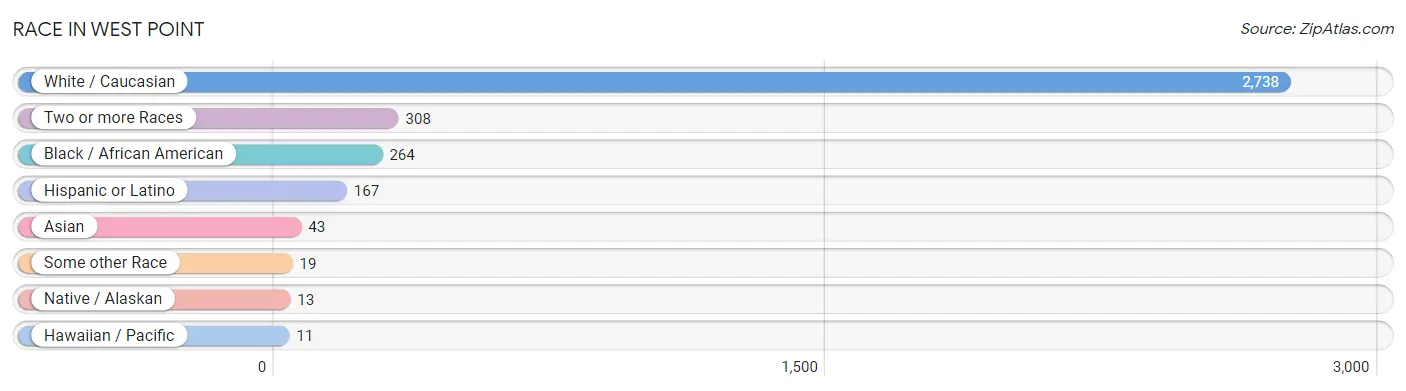
Race in West Point
The most populous races in West Point are White / Caucasian (2,738 | 80.6%), Two or more Races (308 | 9.1%), and Black / African American (264 | 7.8%).
| Race | # Population | % Population |
| Asian | 43 | 1.3% |
| Black / African American | 264 | 7.8% |
| Hawaiian / Pacific | 11 | 0.3% |
| Hispanic or Latino | 167 | 4.9% |
| Native / Alaskan | 13 | 0.4% |
| White / Caucasian | 2,738 | 80.6% |
| Two or more Races | 308 | 9.1% |
| Some other Race | 19 | 0.6% |
| Total | 3,396 | 100.0% |
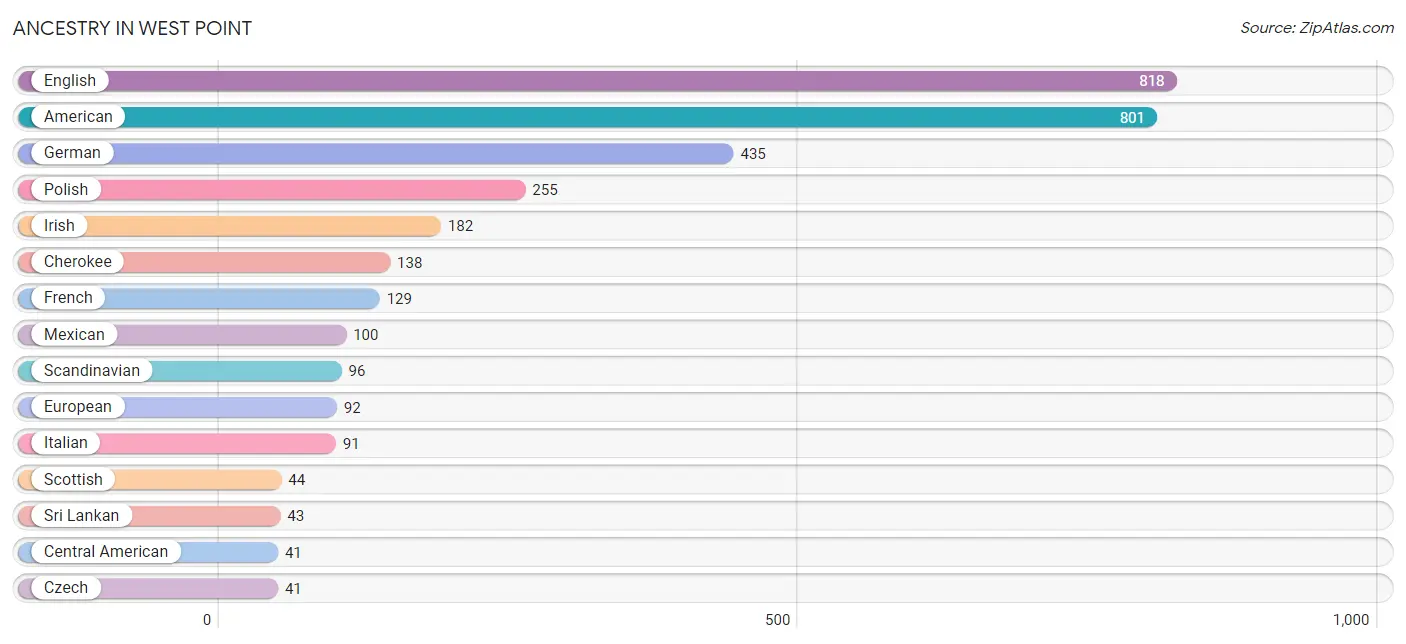
Ancestry in West Point
The most populous ancestries reported in West Point are English (818 | 24.1%), American (801 | 23.6%), German (435 | 12.8%), Polish (255 | 7.5%), and Irish (182 | 5.4%), together accounting for 73.4% of all West Point residents.
| Ancestry | # Population | % Population |
| American | 801 | 23.6% |
| British | 11 | 0.3% |
| Central American | 41 | 1.2% |
| Cherokee | 138 | 4.1% |
| Cuban | 9 | 0.3% |
| Czech | 41 | 1.2% |
| Dutch | 7 | 0.2% |
| English | 818 | 24.1% |
| European | 92 | 2.7% |
| Finnish | 21 | 0.6% |
| French | 129 | 3.8% |
| German | 435 | 12.8% |
| Honduran | 36 | 1.1% |
| Hungarian | 7 | 0.2% |
| Irish | 182 | 5.4% |
| Italian | 91 | 2.7% |
| Mexican | 100 | 2.9% |
| Native Hawaiian | 11 | 0.3% |
| Nicaraguan | 5 | 0.2% |
| Nigerian | 26 | 0.8% |
| Norwegian | 13 | 0.4% |
| Polish | 255 | 7.5% |
| Portuguese | 29 | 0.9% |
| Puerto Rican | 17 | 0.5% |
| Scandinavian | 96 | 2.8% |
| Scotch-Irish | 27 | 0.8% |
| Scottish | 44 | 1.3% |
| Sri Lankan | 43 | 1.3% |
| Subsaharan African | 26 | 0.8% |
| Swedish | 8 | 0.2% |
| Swiss | 26 | 0.8% |
| Welsh | 8 | 0.2% | View All 32 Rows |
Immigrants in West Point
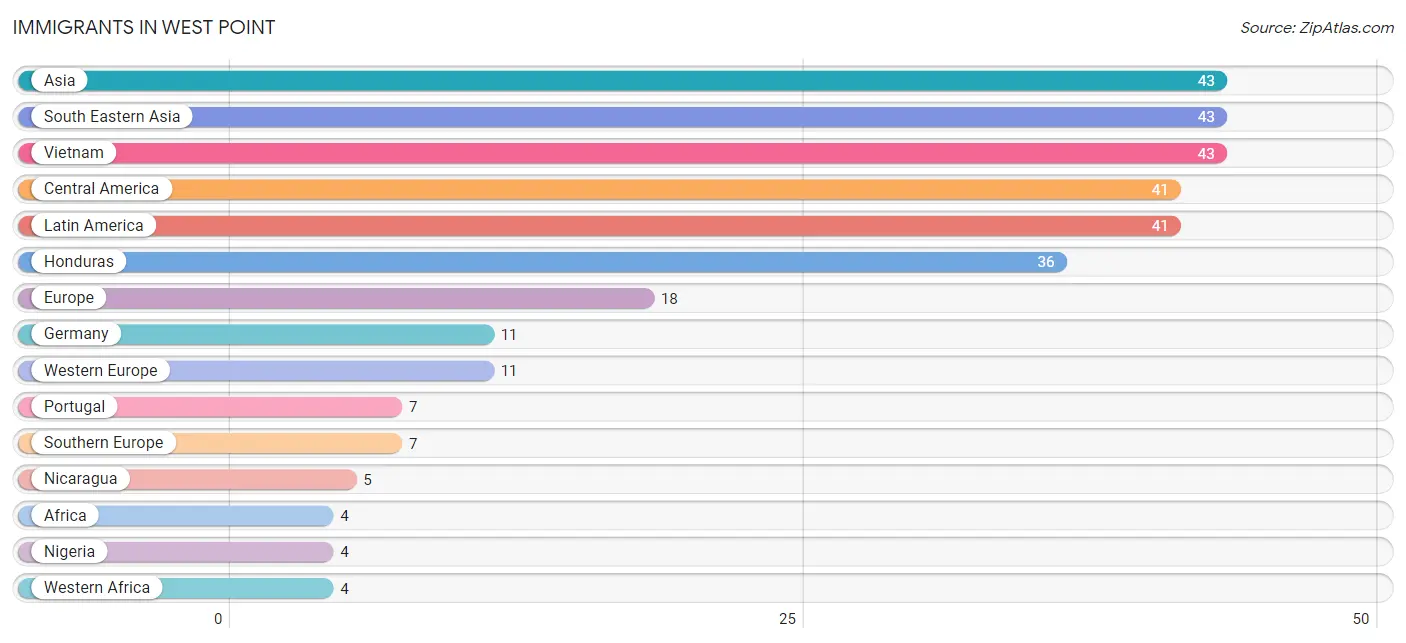
The most numerous immigrant groups reported in West Point came from Asia (43 | 1.3%), South Eastern Asia (43 | 1.3%), Vietnam (43 | 1.3%), Central America (41 | 1.2%), and Latin America (41 | 1.2%), together accounting for 6.2% of all West Point residents.
| Immigration Origin | # Population | % Population |
| Africa | 4 | 0.1% |
| Asia | 43 | 1.3% |
| Central America | 41 | 1.2% |
| Europe | 18 | 0.5% |
| Germany | 11 | 0.3% |
| Honduras | 36 | 1.1% |
| Latin America | 41 | 1.2% |
| Nicaragua | 5 | 0.2% |
| Nigeria | 4 | 0.1% |
| Portugal | 7 | 0.2% |
| South Eastern Asia | 43 | 1.3% |
| Southern Europe | 7 | 0.2% |
| Vietnam | 43 | 1.3% |
| Western Africa | 4 | 0.1% |
| Western Europe | 11 | 0.3% | View All 15 Rows |
Sex and Age in West Point
Sex and Age in West Point
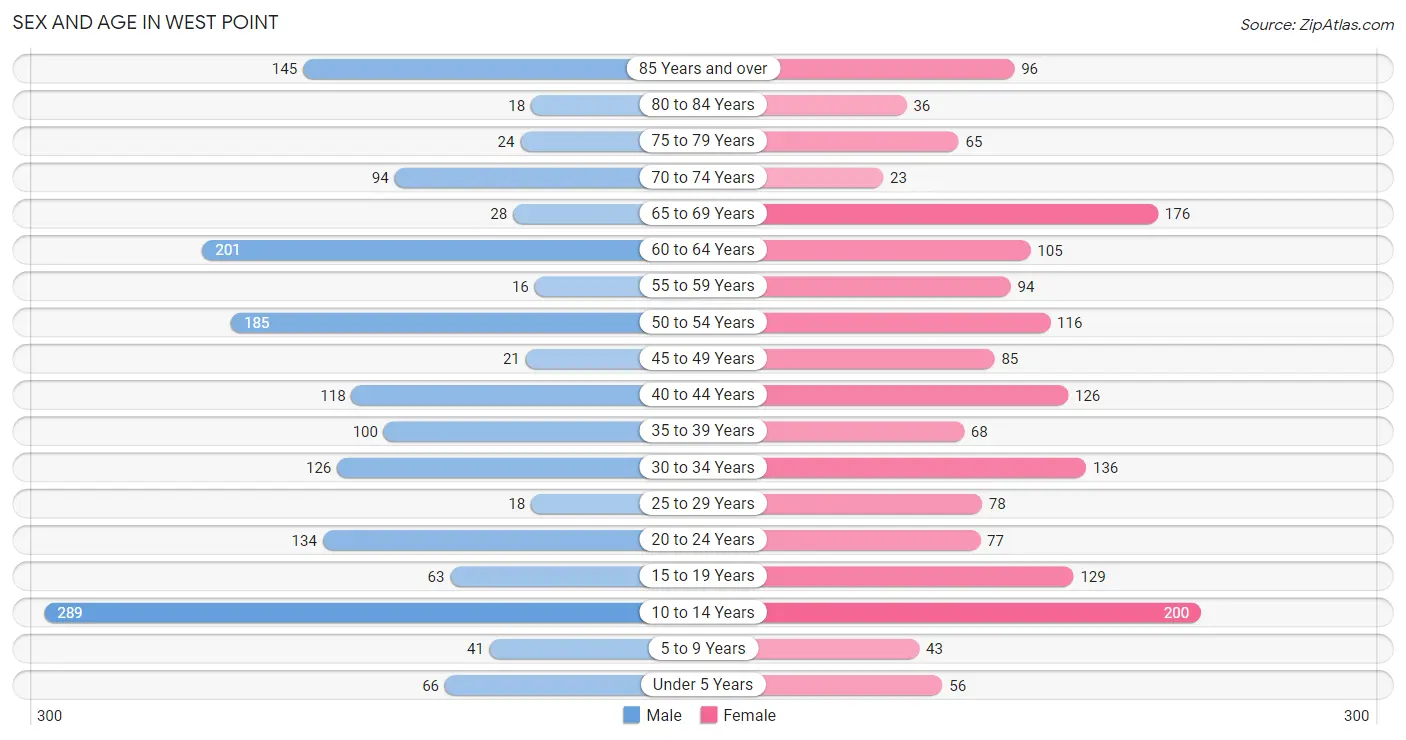
The most populous age groups in West Point are 10 to 14 Years (289 | 17.1%) for men and 10 to 14 Years (200 | 11.7%) for women.
| Age Bracket | Male | Female |
| Under 5 Years | 66 (3.9%) | 56 (3.3%) |
| 5 to 9 Years | 41 (2.4%) | 43 (2.5%) |
| 10 to 14 Years | 289 (17.1%) | 200 (11.7%) |
| 15 to 19 Years | 63 (3.7%) | 129 (7.5%) |
| 20 to 24 Years | 134 (7.9%) | 77 (4.5%) |
| 25 to 29 Years | 18 (1.1%) | 78 (4.6%) |
| 30 to 34 Years | 126 (7.5%) | 136 (8.0%) |
| 35 to 39 Years | 100 (5.9%) | 68 (4.0%) |
| 40 to 44 Years | 118 (7.0%) | 126 (7.4%) |
| 45 to 49 Years | 21 (1.2%) | 85 (5.0%) |
| 50 to 54 Years | 185 (11.0%) | 116 (6.8%) |
| 55 to 59 Years | 16 (0.9%) | 94 (5.5%) |
| 60 to 64 Years | 201 (11.9%) | 105 (6.1%) |
| 65 to 69 Years | 28 (1.7%) | 176 (10.3%) |
| 70 to 74 Years | 94 (5.6%) | 23 (1.3%) |
| 75 to 79 Years | 24 (1.4%) | 65 (3.8%) |
| 80 to 84 Years | 18 (1.1%) | 36 (2.1%) |
| 85 Years and over | 145 (8.6%) | 96 (5.6%) |
| Total | 1,687 (100.0%) | 1,709 (100.0%) |
Families and Households in West Point
Median Family Size in West Point

| Family Type | # Families | Family Size |
| Married-Couple | 700 (74.8%) | 3.17 |
| Single Male/Father | 0 (0.0%) | - |
| Single Female/Mother | 236 (25.2%) | 2.50 |
| Total Families | 936 (100.0%) | 3.00 |
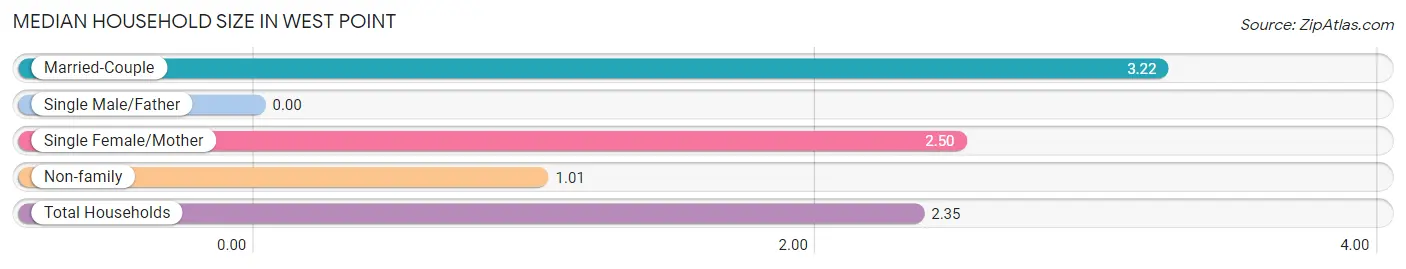
Median Household Size in West Point
| Household Type | # Households | Household Size |
| Married-Couple | 700 (49.5%) | 3.22 |
| Single Male/Father | 0 (0.0%) | - |
| Single Female/Mother | 236 (16.7%) | 2.50 |
| Non-family | 479 (33.9%) | 1.01 |
| Total Households | 1,415 (100.0%) | 2.35 |
Household Size by Marriage Status in West Point
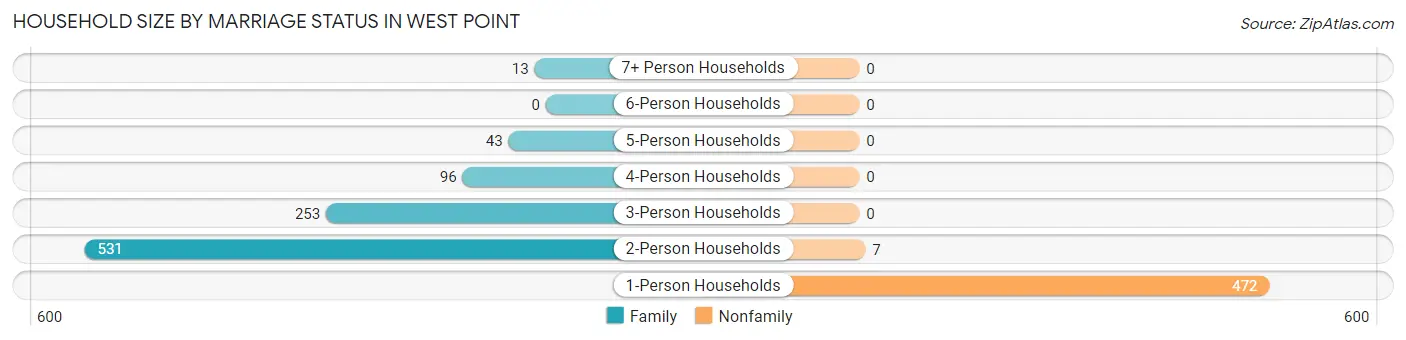
Out of a total of 1,415 households in West Point, 936 (66.1%) are family households, while 479 (33.9%) are nonfamily households. The most numerous type of family households are 2-person households, comprising 531, and the most common type of nonfamily households are 1-person households, comprising 472.
| Household Size | Family Households | Nonfamily Households |
| 1-Person Households | - | 472 (33.4%) |
| 2-Person Households | 531 (37.5%) | 7 (0.5%) |
| 3-Person Households | 253 (17.9%) | 0 (0.0%) |
| 4-Person Households | 96 (6.8%) | 0 (0.0%) |
| 5-Person Households | 43 (3.0%) | 0 (0.0%) |
| 6-Person Households | 0 (0.0%) | 0 (0.0%) |
| 7+ Person Households | 13 (0.9%) | 0 (0.0%) |
| Total | 936 (66.1%) | 479 (33.9%) |
Female Fertility in West Point
Fertility by Age in West Point
Average fertility rate in West Point is 16.0 births per 1,000 women. Women in the age bracket of 35 to 50 years have the highest fertility rate with 39.0 births per 1,000 women. Women in the age bracket of 35 to 50 years acount for 100.0% of all women with births.
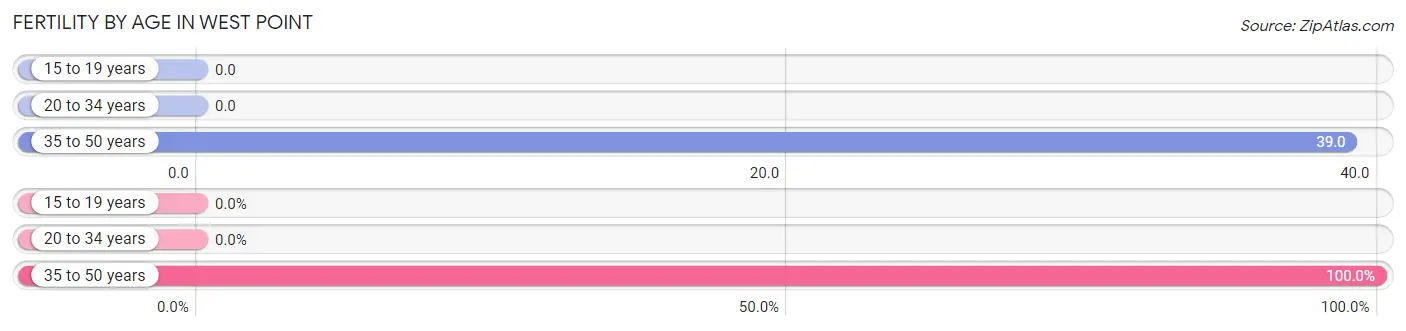
| Age Bracket | Women with Births | Births / 1,000 Women |
| 15 to 19 years | 0 (0.0%) | 0.0 |
| 20 to 34 years | 0 (0.0%) | 0.0 |
| 35 to 50 years | 12 (100.0%) | 39.0 |
| Total | 12 (100.0%) | 16.0 |
Fertility by Age by Marriage Status in West Point
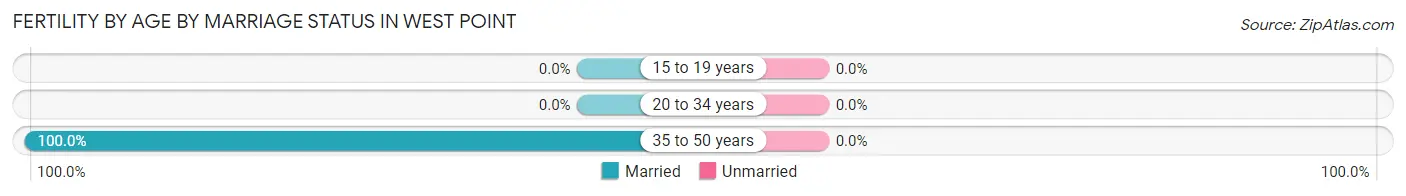
| Age Bracket | Married | Unmarried |
| 15 to 19 years | 0 (0.0%) | 0 (0.0%) |
| 20 to 34 years | 0 (0.0%) | 0 (0.0%) |
| 35 to 50 years | 12 (100.0%) | 0 (0.0%) |
| Total | 12 (100.0%) | 0 (0.0%) |
Fertility by Education in West Point
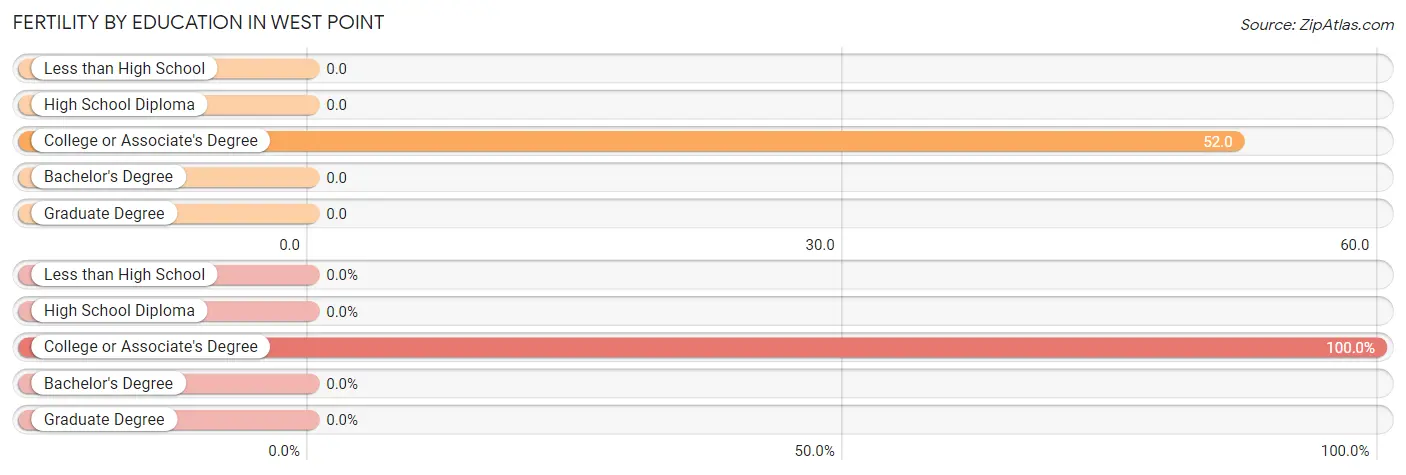
| Educational Attainment | Women with Births | Births / 1,000 Women |
| Less than High School | 0 (0.0%) | 0.0 |
| High School Diploma | 0 (0.0%) | 0.0 |
| College or Associate's Degree | 12 (100.0%) | 52.0 |
| Bachelor's Degree | 0 (0.0%) | 0.0 |
| Graduate Degree | 0 (0.0%) | 0.0 |
| Total | 12 (100.0%) | 16.0 |
Fertility by Education by Marriage Status in West Point
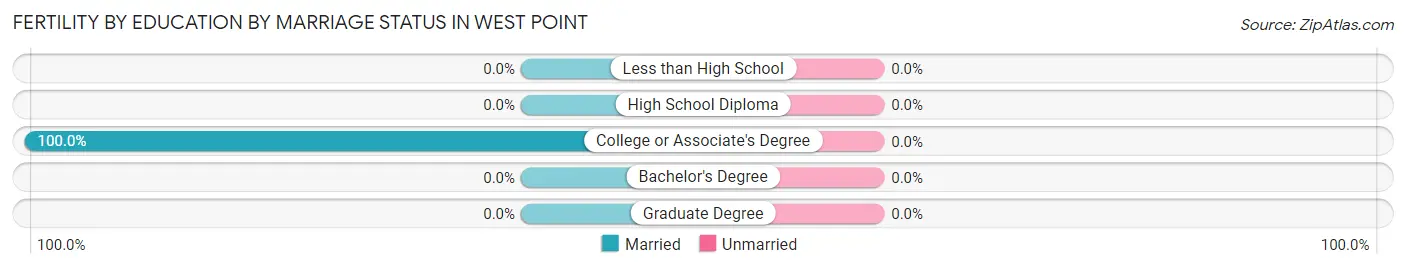
| Educational Attainment | Married | Unmarried |
| Less than High School | 0 (0.0%) | 0 (0.0%) |
| High School Diploma | 0 (0.0%) | 0 (0.0%) |
| College or Associate's Degree | 12 (100.0%) | 0 (0.0%) |
| Bachelor's Degree | 0 (0.0%) | 0 (0.0%) |
| Graduate Degree | 0 (0.0%) | 0 (0.0%) |
| Total | 12 (100.0%) | 0 (0.0%) |
Employment Characteristics in West Point
Employment by Class of Employer in West Point
Among the 1,768 employed individuals in West Point, private company employees (970 | 54.9%), local government employees (211 | 11.9%), and self-employed (not incorporated) (190 | 10.7%) make up the most common classes of employment.
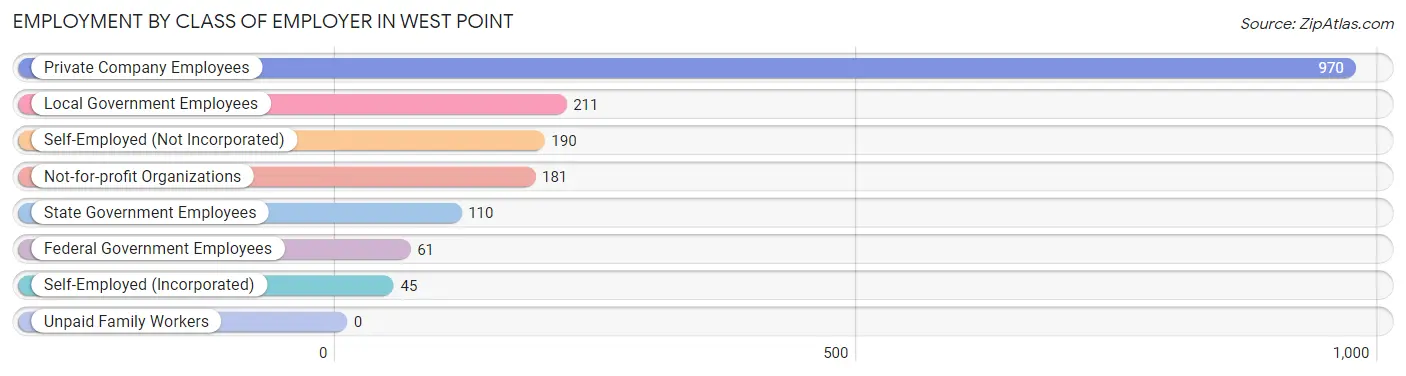
| Employer Class | # Employees | % Employees |
| Private Company Employees | 970 | 54.9% |
| Self-Employed (Incorporated) | 45 | 2.5% |
| Self-Employed (Not Incorporated) | 190 | 10.7% |
| Not-for-profit Organizations | 181 | 10.2% |
| Local Government Employees | 211 | 11.9% |
| State Government Employees | 110 | 6.2% |
| Federal Government Employees | 61 | 3.5% |
| Unpaid Family Workers | 0 | 0.0% |
| Total | 1,768 | 100.0% |
Employment Status by Age in West Point
According to the labor force statistics for West Point, out of the total population over 16 years of age (2,658), 68.9% or 1,831 individuals are in the labor force, with 2.6% or 48 of them unemployed. The age group with the highest labor force participation rate is 25 to 29 years, with 100.0% or 96 individuals in the labor force. Within the labor force, the 25 to 29 years age range has the highest percentage of unemployed individuals, with 11.5% or 11 of them being unemployed.
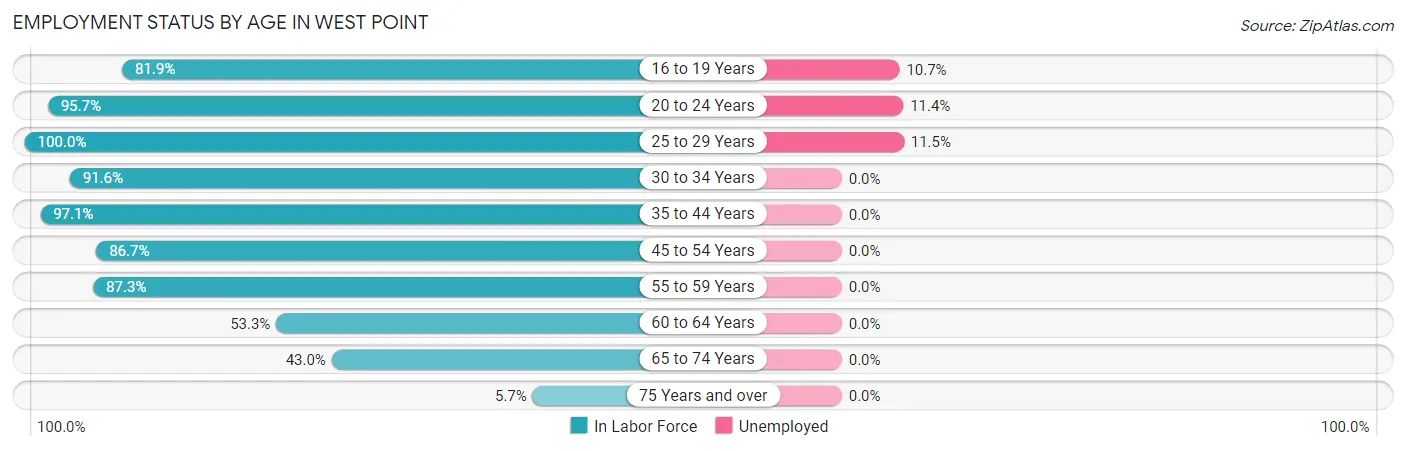
| Age Bracket | In Labor Force | Unemployed |
| 16 to 19 Years | 122 (81.9%) | 13 (10.7%) |
| 20 to 24 Years | 202 (95.7%) | 23 (11.4%) |
| 25 to 29 Years | 96 (100.0%) | 11 (11.5%) |
| 30 to 34 Years | 240 (91.6%) | 0 (0.0%) |
| 35 to 44 Years | 400 (97.1%) | 0 (0.0%) |
| 45 to 54 Years | 353 (86.7%) | 0 (0.0%) |
| 55 to 59 Years | 96 (87.3%) | 0 (0.0%) |
| 60 to 64 Years | 163 (53.3%) | 0 (0.0%) |
| 65 to 74 Years | 138 (43.0%) | 0 (0.0%) |
| 75 Years and over | 22 (5.7%) | 0 (0.0%) |
| Total | 1,831 (68.9%) | 48 (2.6%) |
Employment Status by Educational Attainment in West Point
According to labor force statistics for West Point, 84.6% of individuals (1,348) out of the total population between 25 and 64 years of age (1,593) are in the labor force, with 0.8% or 11 of them being unemployed. The group with the highest labor force participation rate are those with the educational attainment of bachelor's degree or higher, with 94.7% or 532 individuals in the labor force. Within the labor force, individuals with bachelor's degree or higher education have the highest percentage of unemployment, with 2.1% or 11 of them being unemployed.
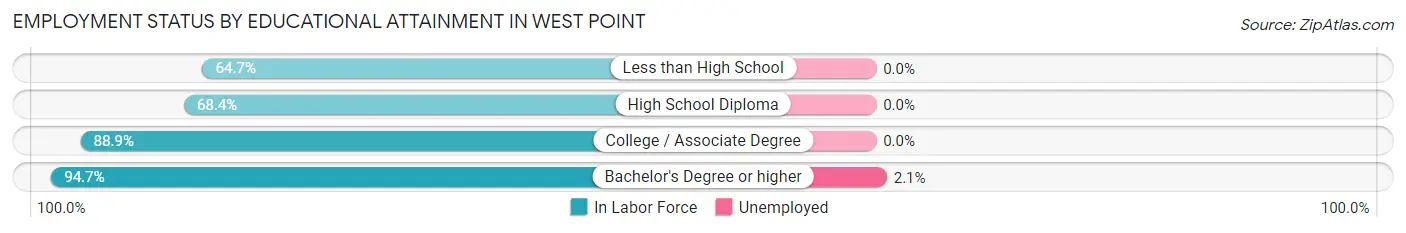
| Educational Attainment | In Labor Force | Unemployed |
| Less than High School | 88 (64.7%) | 0 (0.0%) |
| High School Diploma | 225 (68.4%) | 0 (0.0%) |
| College / Associate Degree | 503 (88.9%) | 0 (0.0%) |
| Bachelor's Degree or higher | 532 (94.7%) | 12 (2.1%) |
| Total | 1,348 (84.6%) | 13 (0.8%) |
Employment Occupations by Sex in West Point
Management, Business, Science and Arts Occupations
The most common Management, Business, Science and Arts occupations in West Point are Management (218 | 12.2%), Community & Social Service (184 | 10.3%), Health Diagnosing & Treating (184 | 10.3%), Education Instruction & Library (134 | 7.5%), and Computers, Engineering & Science (128 | 7.2%).
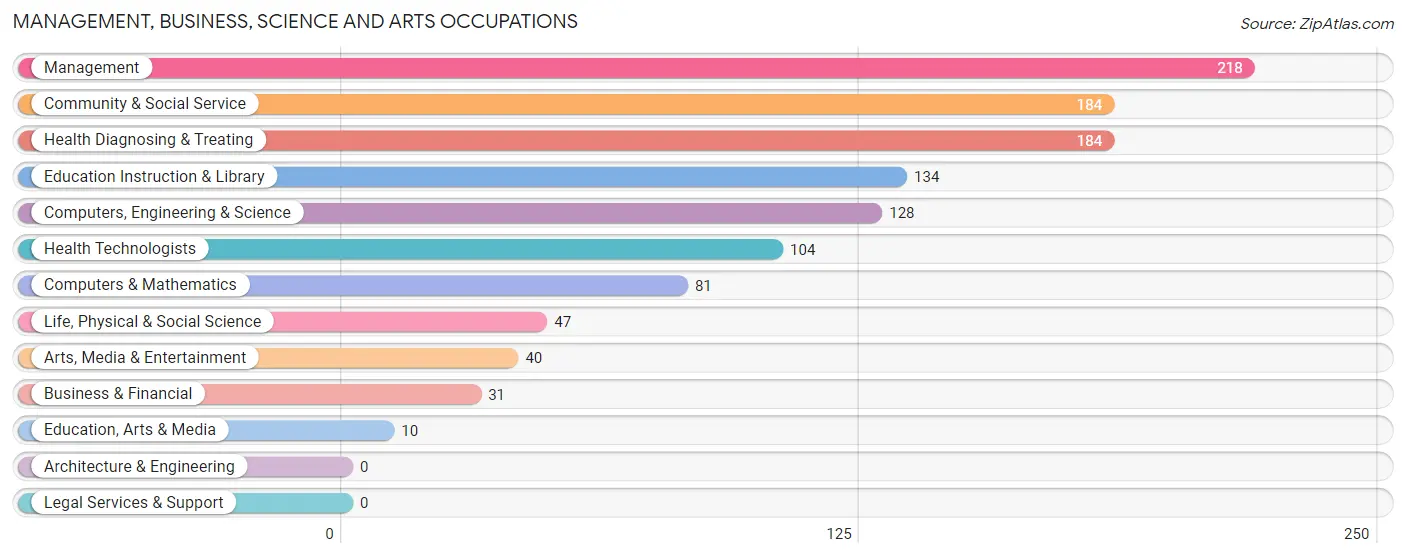
Management, Business, Science and Arts Occupations by Sex
Within the Management, Business, Science and Arts occupations in West Point, the most male-oriented occupations are Life, Physical & Social Science (100.0%), Education, Arts & Media (100.0%), and Computers, Engineering & Science (63.3%), while the most female-oriented occupations are Health Diagnosing & Treating (100.0%), Health Technologists (100.0%), and Education Instruction & Library (82.8%).
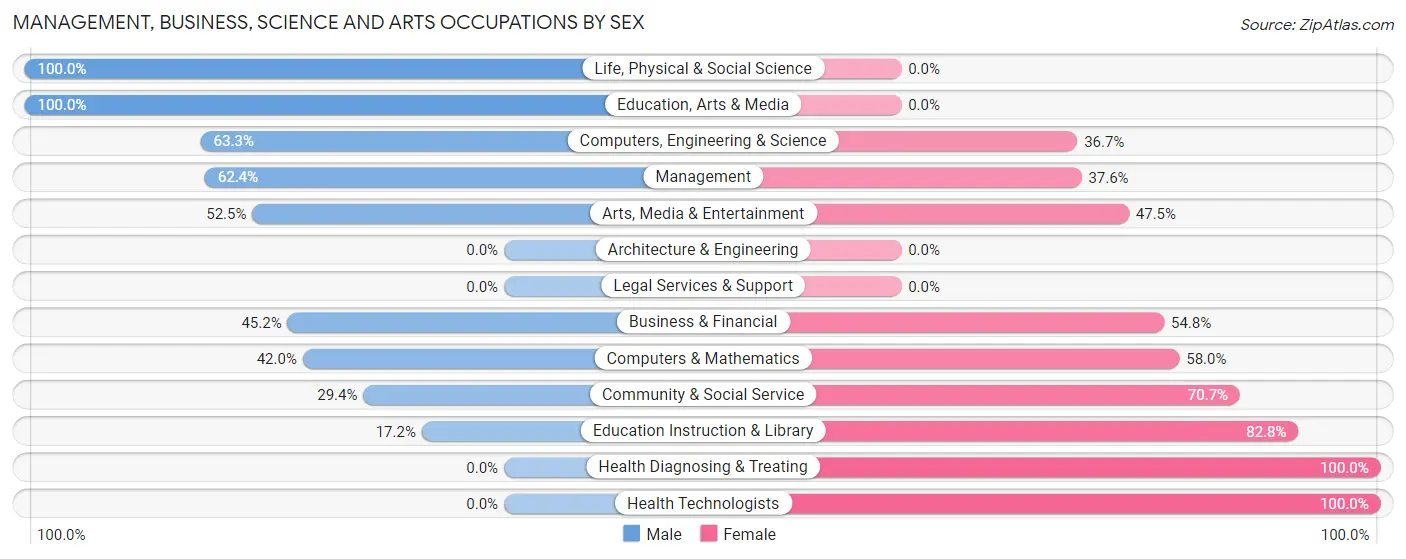
| Occupation | Male | Female |
| Management | 136 (62.4%) | 82 (37.6%) |
| Business & Financial | 14 (45.2%) | 17 (54.8%) |
| Computers, Engineering & Science | 81 (63.3%) | 47 (36.7%) |
| Computers & Mathematics | 34 (42.0%) | 47 (58.0%) |
| Architecture & Engineering | 0 (0.0%) | 0 (0.0%) |
| Life, Physical & Social Science | 47 (100.0%) | 0 (0.0%) |
| Community & Social Service | 54 (29.3%) | 130 (70.7%) |
| Education, Arts & Media | 10 (100.0%) | 0 (0.0%) |
| Legal Services & Support | 0 (0.0%) | 0 (0.0%) |
| Education Instruction & Library | 23 (17.2%) | 111 (82.8%) |
| Arts, Media & Entertainment | 21 (52.5%) | 19 (47.5%) |
| Health Diagnosing & Treating | 0 (0.0%) | 184 (100.0%) |
| Health Technologists | 0 (0.0%) | 104 (100.0%) |
| Total (Category) | 285 (38.3%) | 460 (61.7%) |
| Total (Overall) | 786 (44.0%) | 999 (56.0%) |
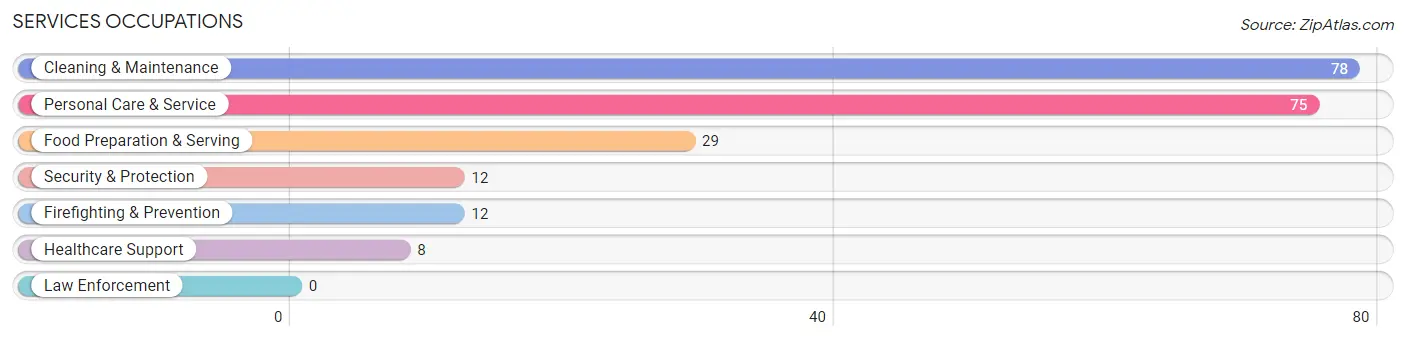
Services Occupations
The most common Services occupations in West Point are Cleaning & Maintenance (78 | 4.4%), Personal Care & Service (75 | 4.2%), Food Preparation & Serving (29 | 1.6%), Security & Protection (12 | 0.7%), and Firefighting & Prevention (12 | 0.7%).
Services Occupations by Sex
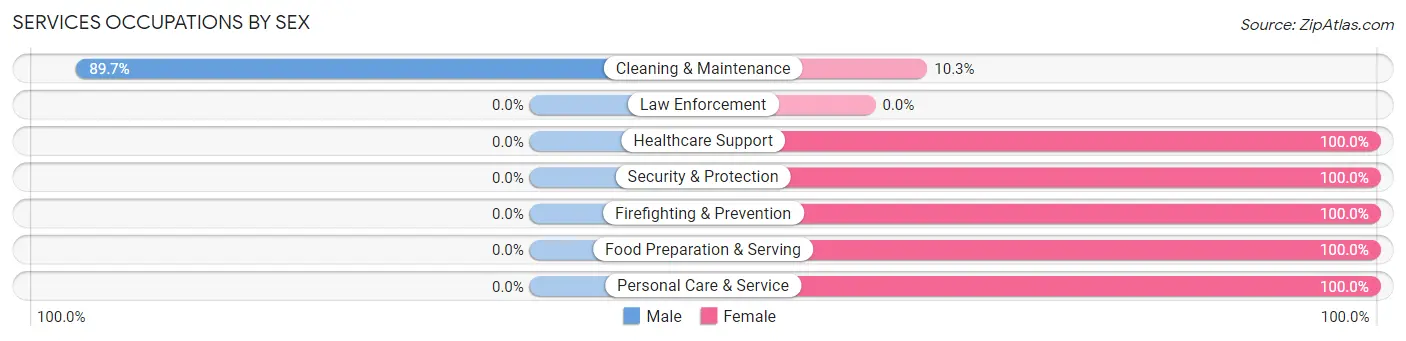
| Occupation | Male | Female |
| Healthcare Support | 0 (0.0%) | 8 (100.0%) |
| Security & Protection | 0 (0.0%) | 12 (100.0%) |
| Firefighting & Prevention | 0 (0.0%) | 12 (100.0%) |
| Law Enforcement | 0 (0.0%) | 0 (0.0%) |
| Food Preparation & Serving | 0 (0.0%) | 29 (100.0%) |
| Cleaning & Maintenance | 70 (89.7%) | 8 (10.3%) |
| Personal Care & Service | 0 (0.0%) | 75 (100.0%) |
| Total (Category) | 70 (34.6%) | 132 (65.3%) |
| Total (Overall) | 786 (44.0%) | 999 (56.0%) |
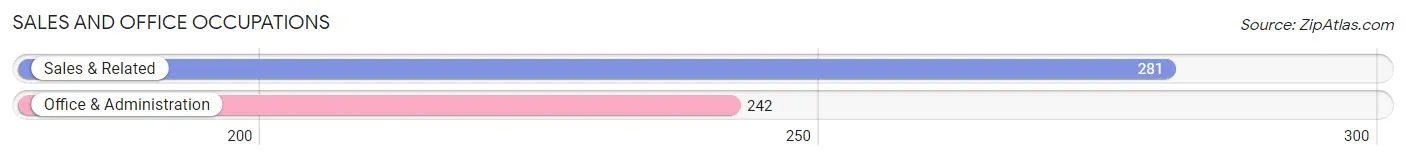
Sales and Office Occupations
The most common Sales and Office occupations in West Point are Sales & Related (281 | 15.7%), and Office & Administration (242 | 13.6%).
Sales and Office Occupations by Sex
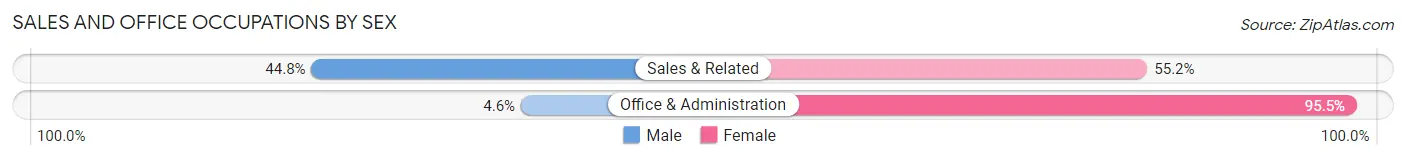
| Occupation | Male | Female |
| Sales & Related | 126 (44.8%) | 155 (55.2%) |
| Office & Administration | 11 (4.5%) | 231 (95.5%) |
| Total (Category) | 137 (26.2%) | 386 (73.8%) |
| Total (Overall) | 786 (44.0%) | 999 (56.0%) |
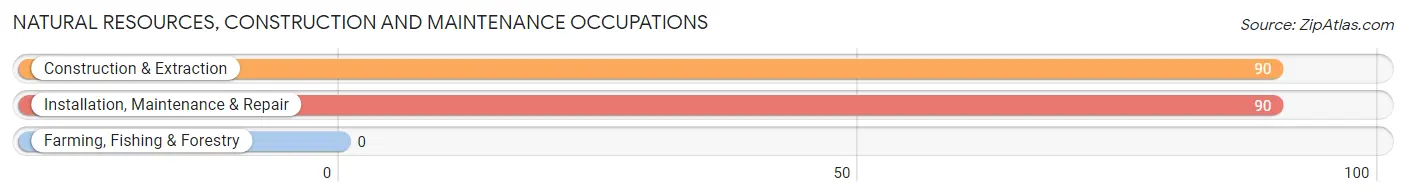
Natural Resources, Construction and Maintenance Occupations
The most common Natural Resources, Construction and Maintenance occupations in West Point are Construction & Extraction (90 | 5.0%), and Installation, Maintenance & Repair (90 | 5.0%).
Natural Resources, Construction and Maintenance Occupations by Sex
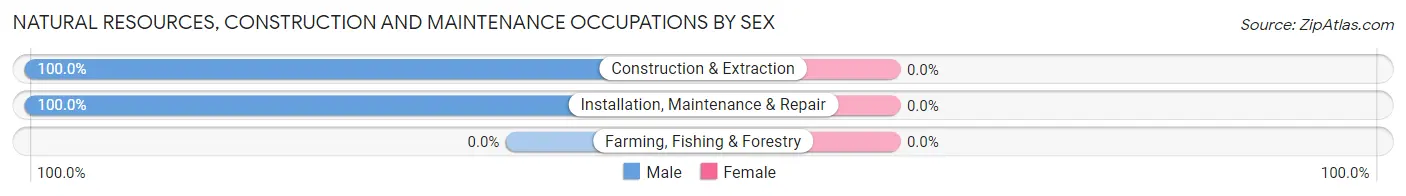
| Occupation | Male | Female |
| Farming, Fishing & Forestry | 0 (0.0%) | 0 (0.0%) |
| Construction & Extraction | 90 (100.0%) | 0 (0.0%) |
| Installation, Maintenance & Repair | 90 (100.0%) | 0 (0.0%) |
| Total (Category) | 180 (100.0%) | 0 (0.0%) |
| Total (Overall) | 786 (44.0%) | 999 (56.0%) |
Production, Transportation and Moving Occupations
The most common Production, Transportation and Moving occupations in West Point are Production (126 | 7.1%), Material Moving (5 | 0.3%), and Transportation (4 | 0.2%).
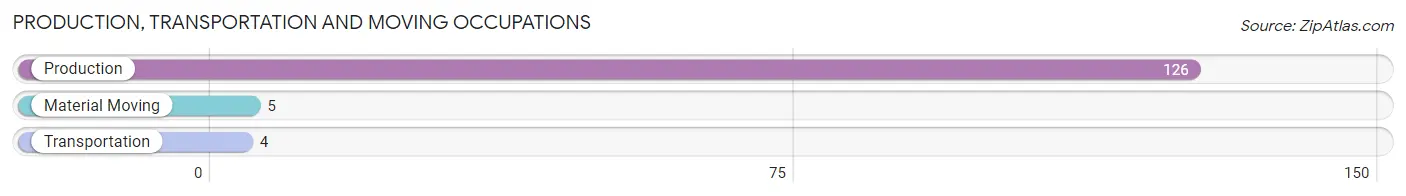
Production, Transportation and Moving Occupations by Sex
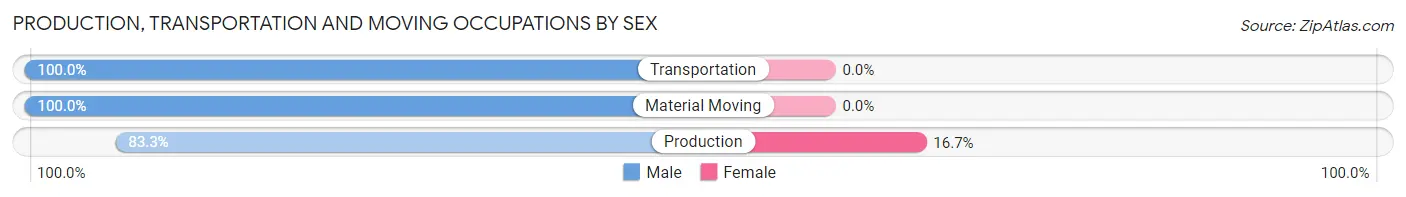
| Occupation | Male | Female |
| Production | 105 (83.3%) | 21 (16.7%) |
| Transportation | 4 (100.0%) | 0 (0.0%) |
| Material Moving | 5 (100.0%) | 0 (0.0%) |
| Total (Category) | 114 (84.4%) | 21 (15.6%) |
| Total (Overall) | 786 (44.0%) | 999 (56.0%) |
Employment Industries by Sex in West Point
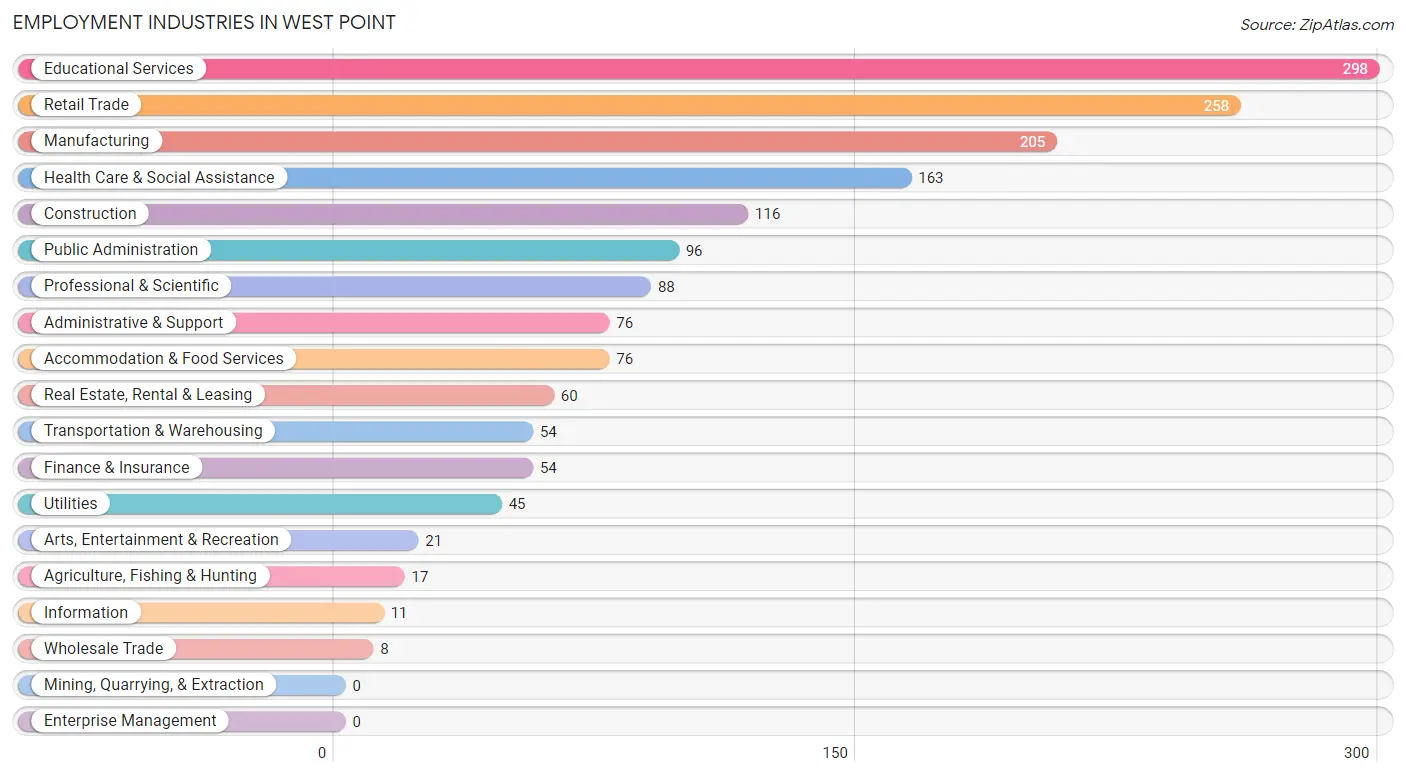
Employment Industries in West Point
The major employment industries in West Point include Educational Services (298 | 16.7%), Retail Trade (258 | 14.4%), Manufacturing (205 | 11.5%), Health Care & Social Assistance (163 | 9.1%), and Construction (116 | 6.5%).
Employment Industries by Sex in West Point
The West Point industries that see more men than women are Agriculture, Fishing & Hunting (100.0%), Utilities (100.0%), and Arts, Entertainment & Recreation (100.0%), whereas the industries that tend to have a higher number of women are Wholesale Trade (100.0%), Information (100.0%), and Finance & Insurance (100.0%).
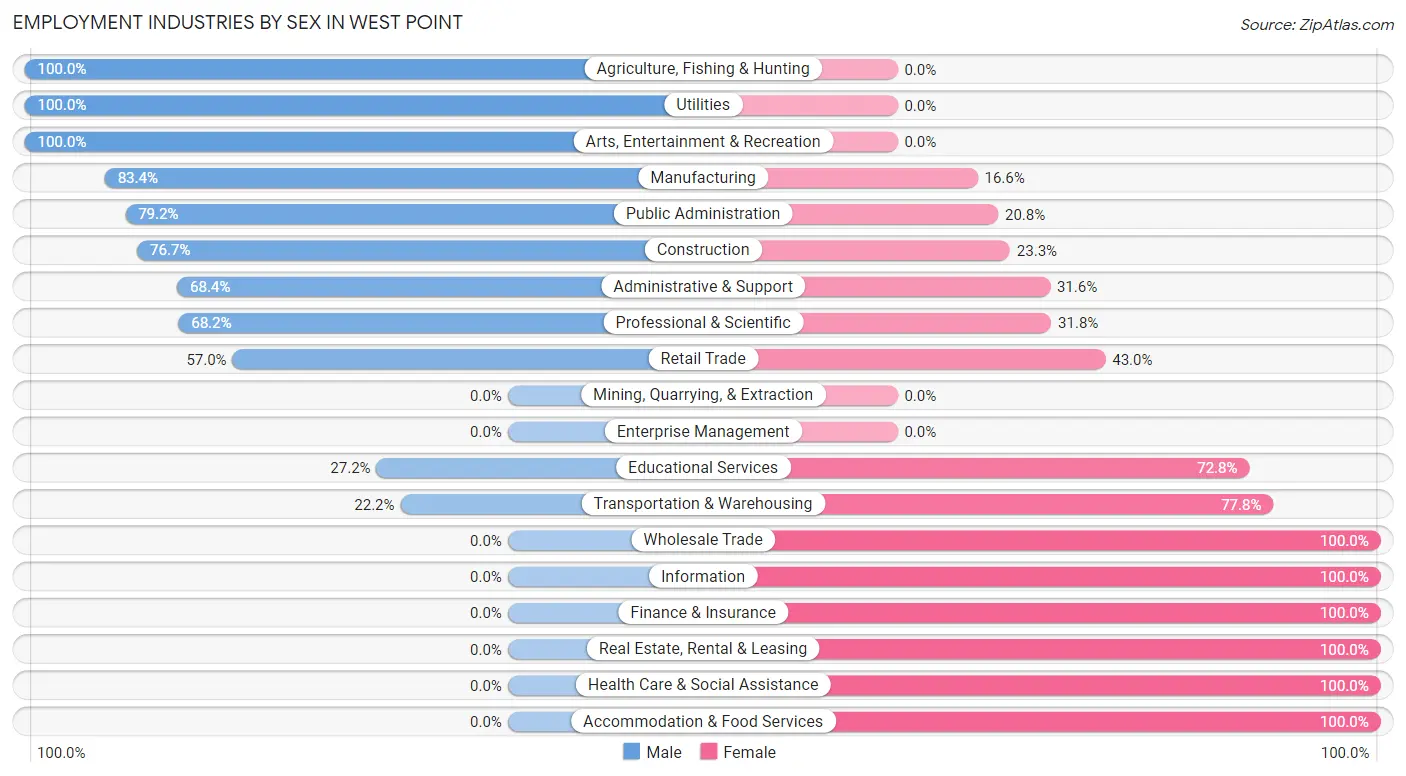
| Industry | Male | Female |
| Agriculture, Fishing & Hunting | 17 (100.0%) | 0 (0.0%) |
| Mining, Quarrying, & Extraction | 0 (0.0%) | 0 (0.0%) |
| Construction | 89 (76.7%) | 27 (23.3%) |
| Manufacturing | 171 (83.4%) | 34 (16.6%) |
| Wholesale Trade | 0 (0.0%) | 8 (100.0%) |
| Retail Trade | 147 (57.0%) | 111 (43.0%) |
| Transportation & Warehousing | 12 (22.2%) | 42 (77.8%) |
| Utilities | 45 (100.0%) | 0 (0.0%) |
| Information | 0 (0.0%) | 11 (100.0%) |
| Finance & Insurance | 0 (0.0%) | 54 (100.0%) |
| Real Estate, Rental & Leasing | 0 (0.0%) | 60 (100.0%) |
| Professional & Scientific | 60 (68.2%) | 28 (31.8%) |
| Enterprise Management | 0 (0.0%) | 0 (0.0%) |
| Administrative & Support | 52 (68.4%) | 24 (31.6%) |
| Educational Services | 81 (27.2%) | 217 (72.8%) |
| Health Care & Social Assistance | 0 (0.0%) | 163 (100.0%) |
| Arts, Entertainment & Recreation | 21 (100.0%) | 0 (0.0%) |
| Accommodation & Food Services | 0 (0.0%) | 76 (100.0%) |
| Public Administration | 76 (79.2%) | 20 (20.8%) |
| Total | 786 (44.0%) | 999 (56.0%) |
Education in West Point
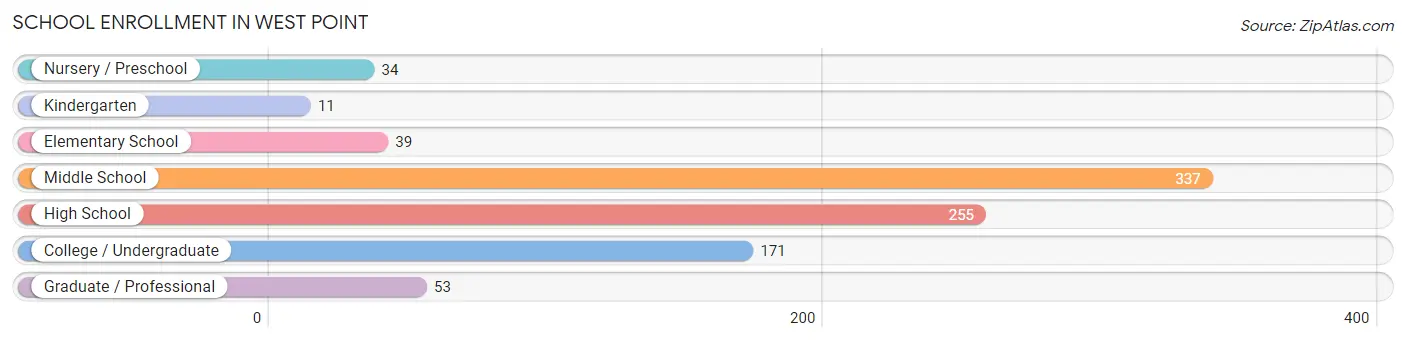
School Enrollment in West Point
The most common levels of schooling among the 900 students in West Point are middle school (337 | 37.4%), high school (255 | 28.3%), and college / undergraduate (171 | 19.0%).
| School Level | # Students | % Students |
| Nursery / Preschool | 34 | 3.8% |
| Kindergarten | 11 | 1.2% |
| Elementary School | 39 | 4.3% |
| Middle School | 337 | 37.4% |
| High School | 255 | 28.3% |
| College / Undergraduate | 171 | 19.0% |
| Graduate / Professional | 53 | 5.9% |
| Total | 900 | 100.0% |
School Enrollment by Age by Funding Source in West Point
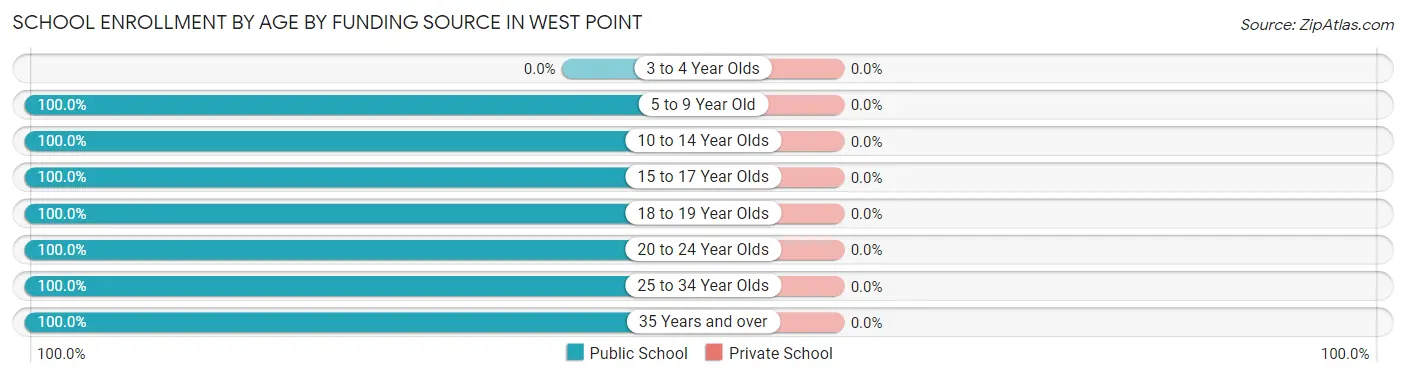
| Age Bracket | Public School | Private School |
| 3 to 4 Year Olds | 0 (0.0%) | 0 (0.0%) |
| 5 to 9 Year Old | 68 (100.0%) | 0 (0.0%) |
| 10 to 14 Year Olds | 489 (100.0%) | 0 (0.0%) |
| 15 to 17 Year Olds | 106 (100.0%) | 0 (0.0%) |
| 18 to 19 Year Olds | 86 (100.0%) | 0 (0.0%) |
| 20 to 24 Year Olds | 81 (100.0%) | 0 (0.0%) |
| 25 to 34 Year Olds | 39 (100.0%) | 0 (0.0%) |
| 35 Years and over | 31 (100.0%) | 0 (0.0%) |
| Total | 900 (100.0%) | 0 (0.0%) |
Educational Attainment by Field of Study in West Point
Social sciences (156 | 17.5%), arts & humanities (98 | 11.0%), science & technology (85 | 9.5%), psychology (82 | 9.2%), and liberal arts & history (81 | 9.1%) are the most common fields of study among 891 individuals in West Point who have obtained a bachelor's degree or higher.
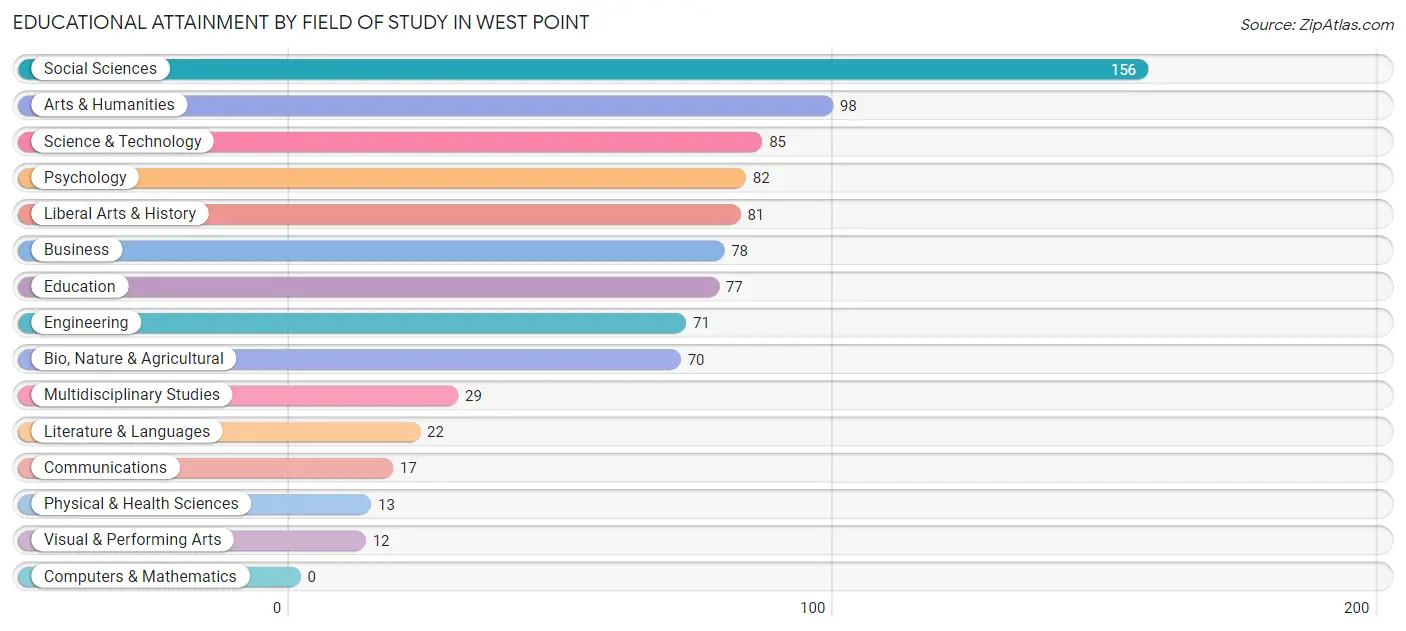
| Field of Study | # Graduates | % Graduates |
| Computers & Mathematics | 0 | 0.0% |
| Bio, Nature & Agricultural | 70 | 7.9% |
| Physical & Health Sciences | 13 | 1.5% |
| Psychology | 82 | 9.2% |
| Social Sciences | 156 | 17.5% |
| Engineering | 71 | 8.0% |
| Multidisciplinary Studies | 29 | 3.3% |
| Science & Technology | 85 | 9.5% |
| Business | 78 | 8.7% |
| Education | 77 | 8.6% |
| Literature & Languages | 22 | 2.5% |
| Liberal Arts & History | 81 | 9.1% |
| Visual & Performing Arts | 12 | 1.3% |
| Communications | 17 | 1.9% |
| Arts & Humanities | 98 | 11.0% |
| Total | 891 | 100.0% |
Transportation & Commute in West Point
Vehicle Availability by Sex in West Point
The most prevalent vehicle ownership categories in West Point are males with 2 vehicles (233, accounting for 29.6%) and females with 2 vehicles (432, making up 23.7%).
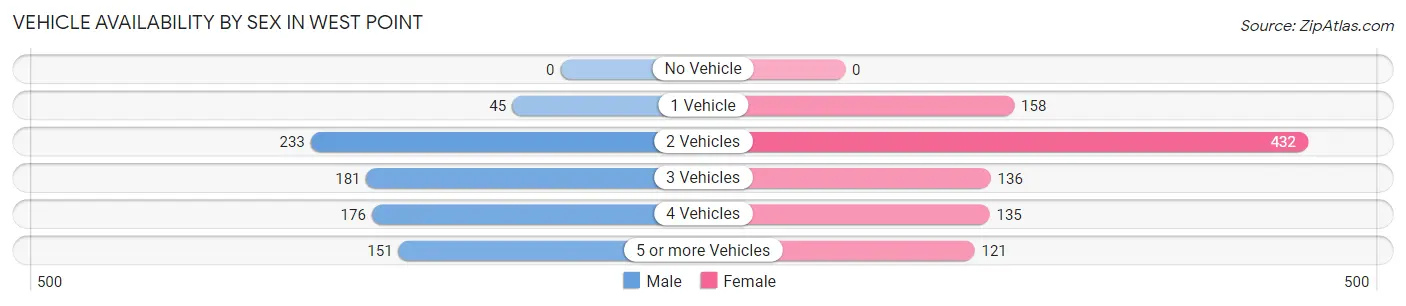
| Vehicles Available | Male | Female |
| No Vehicle | 0 (0.0%) | 0 (0.0%) |
| 1 Vehicle | 45 (5.7%) | 158 (16.1%) |
| 2 Vehicles | 233 (29.6%) | 432 (44.0%) |
| 3 Vehicles | 181 (23.0%) | 136 (13.9%) |
| 4 Vehicles | 176 (22.4%) | 135 (13.8%) |
| 5 or more Vehicles | 151 (19.2%) | 121 (12.3%) |
| Total | 786 (100.0%) | 982 (100.0%) |
Commute Time in West Point
The most frequently occuring commute durations in West Point are 5 to 9 minutes (367 commuters, 23.7%), 45 to 59 minutes (356 commuters, 23.0%), and 20 to 24 minutes (142 commuters, 9.2%).
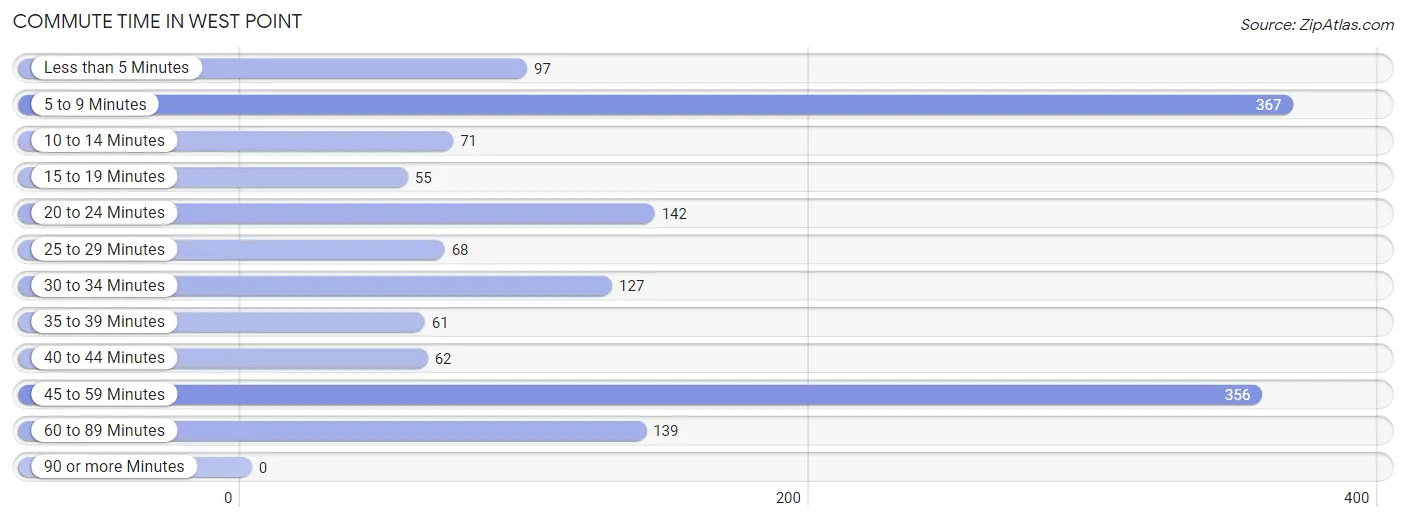
| Commute Time | # Commuters | % Commuters |
| Less than 5 Minutes | 97 | 6.3% |
| 5 to 9 Minutes | 367 | 23.7% |
| 10 to 14 Minutes | 71 | 4.6% |
| 15 to 19 Minutes | 55 | 3.6% |
| 20 to 24 Minutes | 142 | 9.2% |
| 25 to 29 Minutes | 68 | 4.4% |
| 30 to 34 Minutes | 127 | 8.2% |
| 35 to 39 Minutes | 61 | 4.0% |
| 40 to 44 Minutes | 62 | 4.0% |
| 45 to 59 Minutes | 356 | 23.0% |
| 60 to 89 Minutes | 139 | 9.0% |
| 90 or more Minutes | 0 | 0.0% |
Commute Time by Sex in West Point
The most common commute times in West Point are 45 to 59 minutes (186 commuters, 24.9%) for males and 5 to 9 minutes (283 commuters, 35.4%) for females.
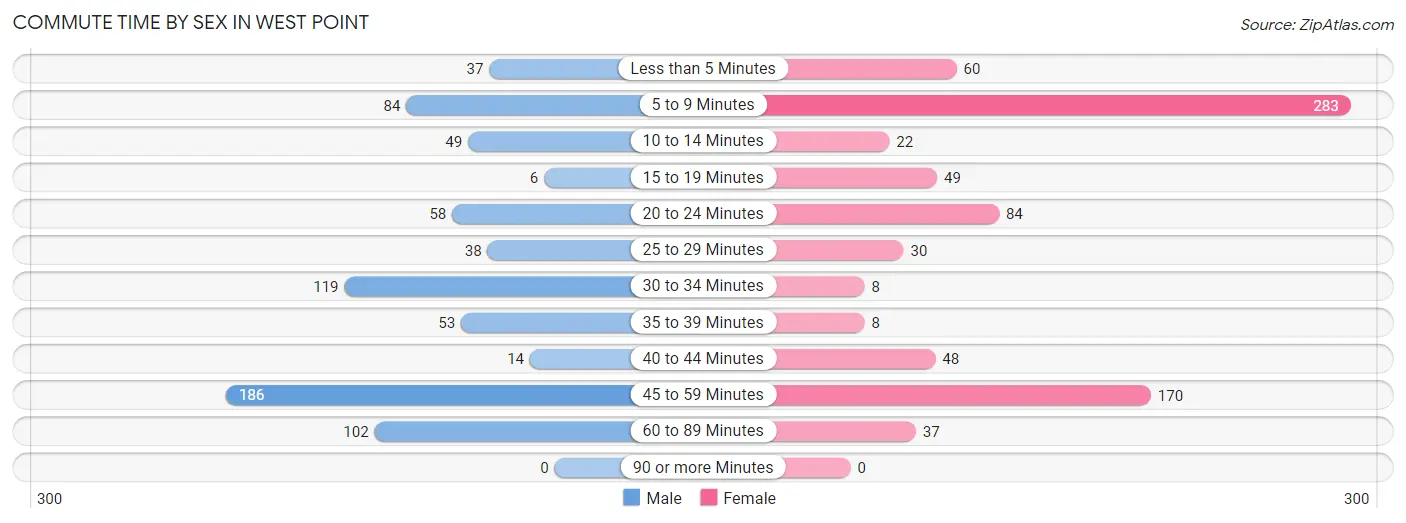
| Commute Time | Male | Female |
| Less than 5 Minutes | 37 (5.0%) | 60 (7.5%) |
| 5 to 9 Minutes | 84 (11.3%) | 283 (35.4%) |
| 10 to 14 Minutes | 49 (6.6%) | 22 (2.8%) |
| 15 to 19 Minutes | 6 (0.8%) | 49 (6.1%) |
| 20 to 24 Minutes | 58 (7.8%) | 84 (10.5%) |
| 25 to 29 Minutes | 38 (5.1%) | 30 (3.7%) |
| 30 to 34 Minutes | 119 (16.0%) | 8 (1.0%) |
| 35 to 39 Minutes | 53 (7.1%) | 8 (1.0%) |
| 40 to 44 Minutes | 14 (1.9%) | 48 (6.0%) |
| 45 to 59 Minutes | 186 (24.9%) | 170 (21.3%) |
| 60 to 89 Minutes | 102 (13.7%) | 37 (4.6%) |
| 90 or more Minutes | 0 (0.0%) | 0 (0.0%) |
Time of Departure to Work by Sex in West Point
The most frequent times of departure to work in West Point are 9:00 AM to 9:59 AM (136, 18.2%) for males and 8:00 AM to 8:29 AM (220, 27.5%) for females.
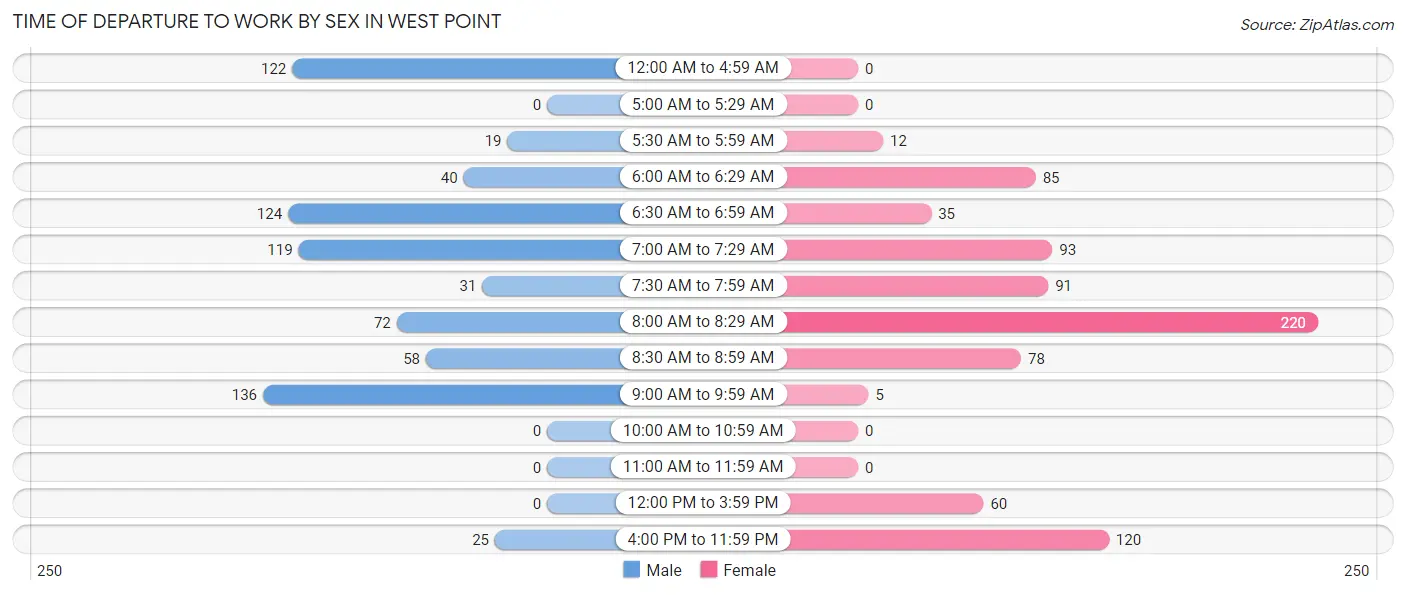
| Time of Departure | Male | Female |
| 12:00 AM to 4:59 AM | 122 (16.4%) | 0 (0.0%) |
| 5:00 AM to 5:29 AM | 0 (0.0%) | 0 (0.0%) |
| 5:30 AM to 5:59 AM | 19 (2.5%) | 12 (1.5%) |
| 6:00 AM to 6:29 AM | 40 (5.4%) | 85 (10.6%) |
| 6:30 AM to 6:59 AM | 124 (16.6%) | 35 (4.4%) |
| 7:00 AM to 7:29 AM | 119 (16.0%) | 93 (11.6%) |
| 7:30 AM to 7:59 AM | 31 (4.2%) | 91 (11.4%) |
| 8:00 AM to 8:29 AM | 72 (9.7%) | 220 (27.5%) |
| 8:30 AM to 8:59 AM | 58 (7.8%) | 78 (9.8%) |
| 9:00 AM to 9:59 AM | 136 (18.2%) | 5 (0.6%) |
| 10:00 AM to 10:59 AM | 0 (0.0%) | 0 (0.0%) |
| 11:00 AM to 11:59 AM | 0 (0.0%) | 0 (0.0%) |
| 12:00 PM to 3:59 PM | 0 (0.0%) | 60 (7.5%) |
| 4:00 PM to 11:59 PM | 25 (3.4%) | 120 (15.0%) |
| Total | 746 (100.0%) | 799 (100.0%) |
Housing Occupancy in West Point
Occupancy by Ownership in West Point
Of the total 1,415 dwellings in West Point, owner-occupied units account for 1,099 (77.7%), while renter-occupied units make up 316 (22.3%).
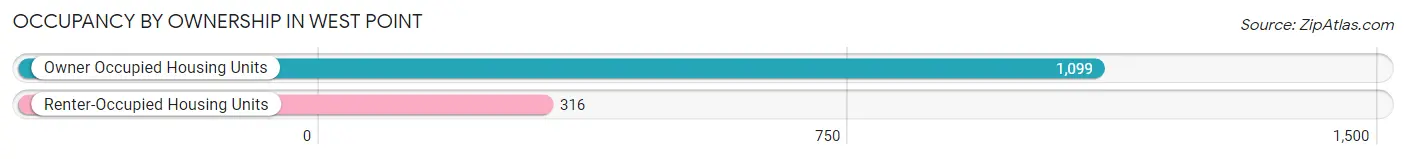
| Occupancy | # Housing Units | % Housing Units |
| Owner Occupied Housing Units | 1,099 | 77.7% |
| Renter-Occupied Housing Units | 316 | 22.3% |
| Total Occupied Housing Units | 1,415 | 100.0% |
Occupancy by Household Size in West Point
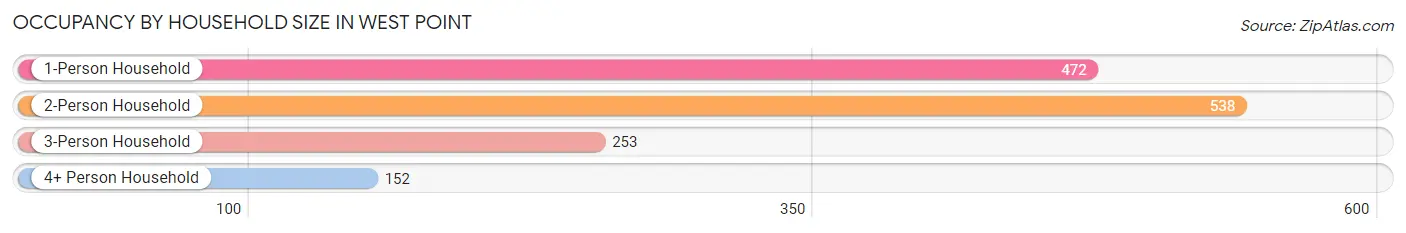
| Household Size | # Housing Units | % Housing Units |
| 1-Person Household | 472 | 33.4% |
| 2-Person Household | 538 | 38.0% |
| 3-Person Household | 253 | 17.9% |
| 4+ Person Household | 152 | 10.7% |
| Total Housing Units | 1,415 | 100.0% |
Occupancy by Ownership by Household Size in West Point
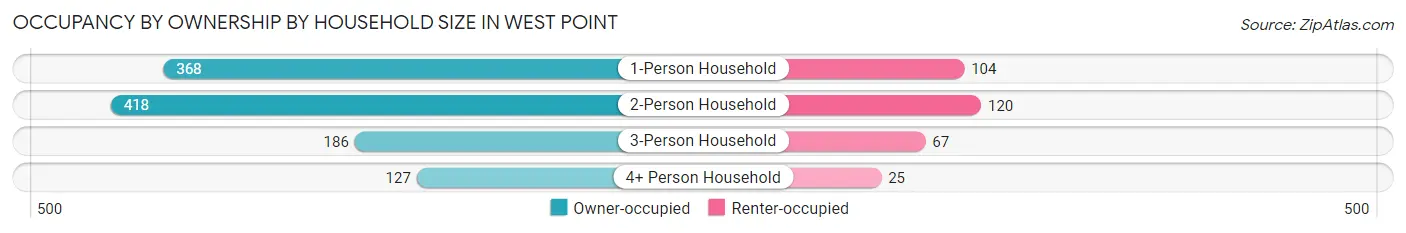
| Household Size | Owner-occupied | Renter-occupied |
| 1-Person Household | 368 (78.0%) | 104 (22.0%) |
| 2-Person Household | 418 (77.7%) | 120 (22.3%) |
| 3-Person Household | 186 (73.5%) | 67 (26.5%) |
| 4+ Person Household | 127 (83.6%) | 25 (16.5%) |
| Total Housing Units | 1,099 (77.7%) | 316 (22.3%) |
Occupancy by Educational Attainment in West Point
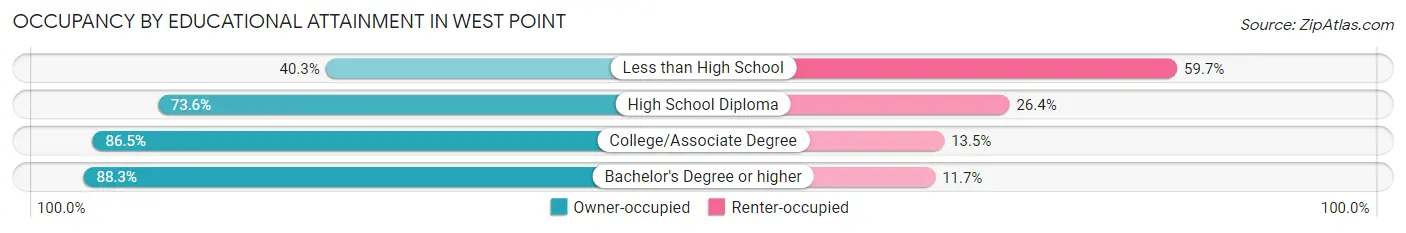
| Household Size | Owner-occupied | Renter-occupied |
| Less than High School | 73 (40.3%) | 108 (59.7%) |
| High School Diploma | 295 (73.6%) | 106 (26.4%) |
| College/Associate Degree | 218 (86.5%) | 34 (13.5%) |
| Bachelor's Degree or higher | 513 (88.3%) | 68 (11.7%) |
Occupancy by Age of Householder in West Point
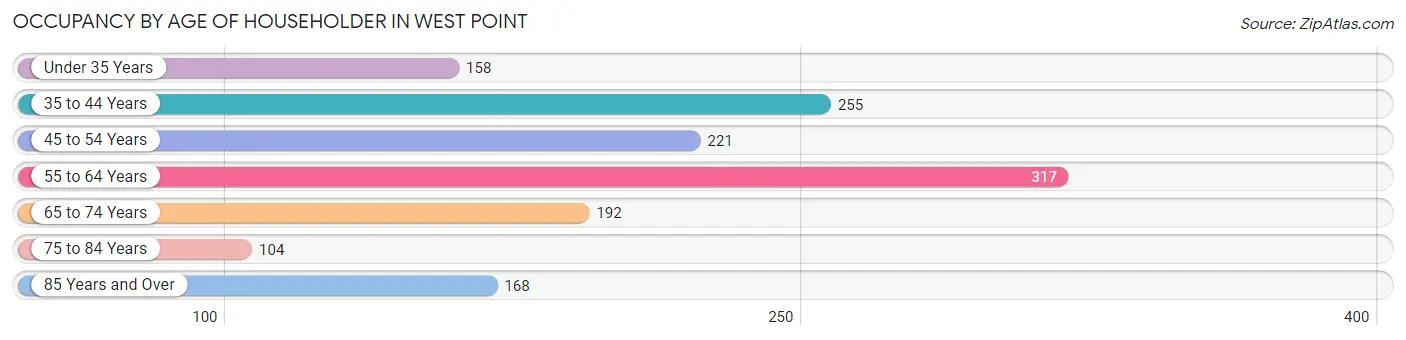
| Age Bracket | # Households | % Households |
| Under 35 Years | 158 | 11.2% |
| 35 to 44 Years | 255 | 18.0% |
| 45 to 54 Years | 221 | 15.6% |
| 55 to 64 Years | 317 | 22.4% |
| 65 to 74 Years | 192 | 13.6% |
| 75 to 84 Years | 104 | 7.3% |
| 85 Years and Over | 168 | 11.9% |
| Total | 1,415 | 100.0% |
Housing Finances in West Point
Median Income by Occupancy in West Point
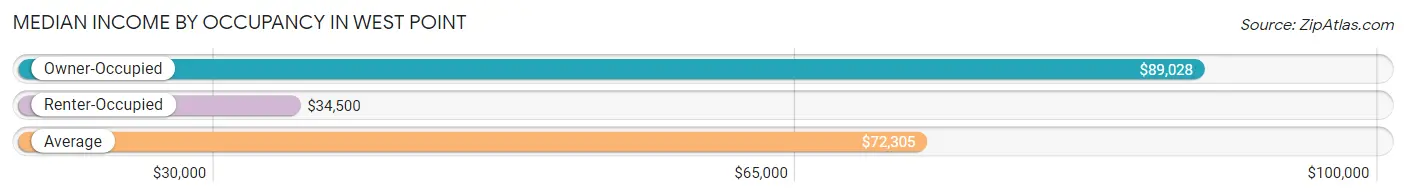
| Occupancy Type | # Households | Median Income |
| Owner-Occupied | 1,099 (77.7%) | $89,028 |
| Renter-Occupied | 316 (22.3%) | $34,500 |
| Average | 1,415 (100.0%) | $72,305 |
Occupancy by Householder Income Bracket in West Point
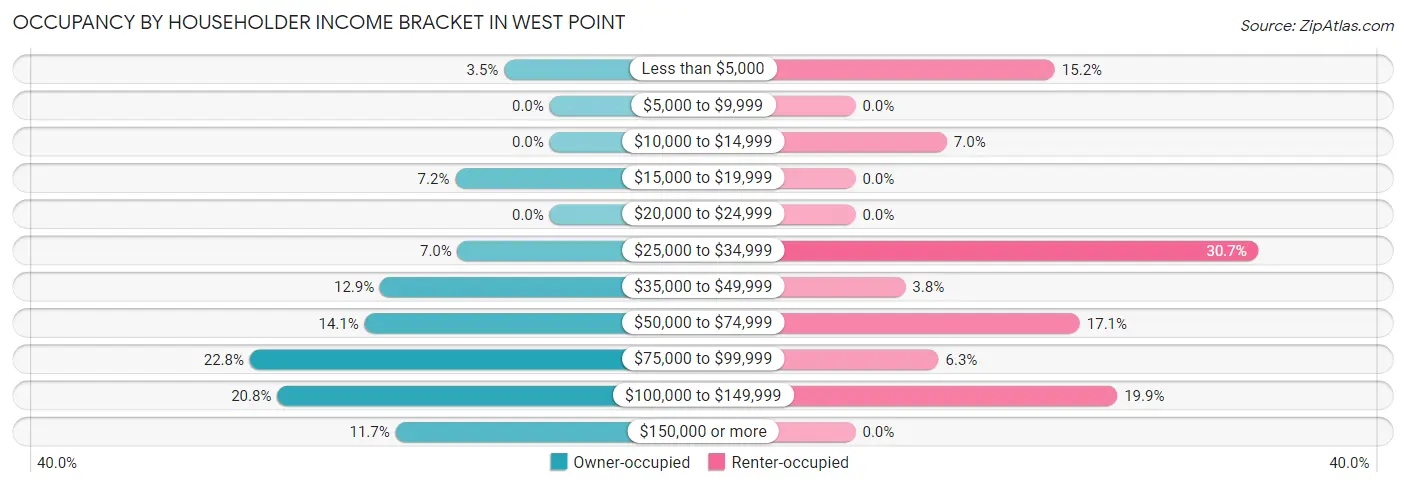
| Income Bracket | Owner-occupied | Renter-occupied |
| Less than $5,000 | 38 (3.5%) | 48 (15.2%) |
| $5,000 to $9,999 | 0 (0.0%) | 0 (0.0%) |
| $10,000 to $14,999 | 0 (0.0%) | 22 (7.0%) |
| $15,000 to $19,999 | 79 (7.2%) | 0 (0.0%) |
| $20,000 to $24,999 | 0 (0.0%) | 0 (0.0%) |
| $25,000 to $34,999 | 77 (7.0%) | 97 (30.7%) |
| $35,000 to $49,999 | 142 (12.9%) | 12 (3.8%) |
| $50,000 to $74,999 | 155 (14.1%) | 54 (17.1%) |
| $75,000 to $99,999 | 251 (22.8%) | 20 (6.3%) |
| $100,000 to $149,999 | 228 (20.7%) | 63 (19.9%) |
| $150,000 or more | 129 (11.7%) | 0 (0.0%) |
| Total | 1,099 (100.0%) | 316 (100.0%) |
Monthly Housing Cost Tiers in West Point
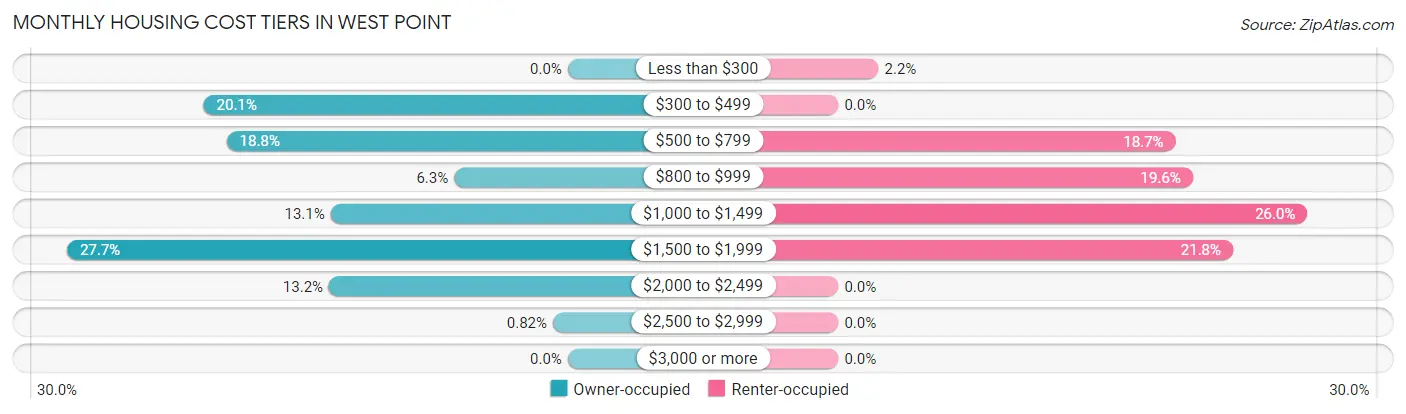
| Monthly Cost | Owner-occupied | Renter-occupied |
| Less than $300 | 0 (0.0%) | 7 (2.2%) |
| $300 to $499 | 221 (20.1%) | 0 (0.0%) |
| $500 to $799 | 207 (18.8%) | 59 (18.7%) |
| $800 to $999 | 69 (6.3%) | 62 (19.6%) |
| $1,000 to $1,499 | 144 (13.1%) | 82 (26.0%) |
| $1,500 to $1,999 | 304 (27.7%) | 69 (21.8%) |
| $2,000 to $2,499 | 145 (13.2%) | 0 (0.0%) |
| $2,500 to $2,999 | 9 (0.8%) | 0 (0.0%) |
| $3,000 or more | 0 (0.0%) | 0 (0.0%) |
| Total | 1,099 (100.0%) | 316 (100.0%) |
Physical Housing Characteristics in West Point
Housing Structures in West Point
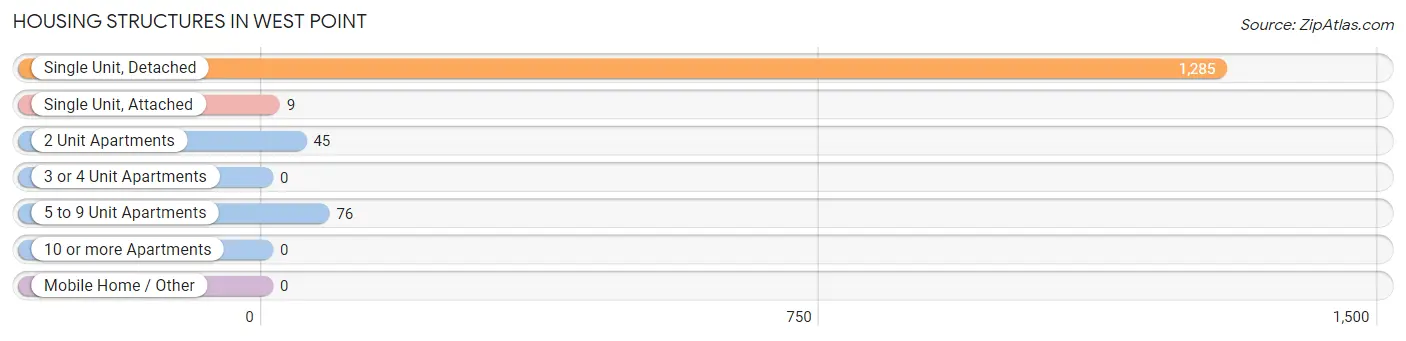
| Structure Type | # Housing Units | % Housing Units |
| Single Unit, Detached | 1,285 | 90.8% |
| Single Unit, Attached | 9 | 0.6% |
| 2 Unit Apartments | 45 | 3.2% |
| 3 or 4 Unit Apartments | 0 | 0.0% |
| 5 to 9 Unit Apartments | 76 | 5.4% |
| 10 or more Apartments | 0 | 0.0% |
| Mobile Home / Other | 0 | 0.0% |
| Total | 1,415 | 100.0% |
Housing Structures by Occupancy in West Point
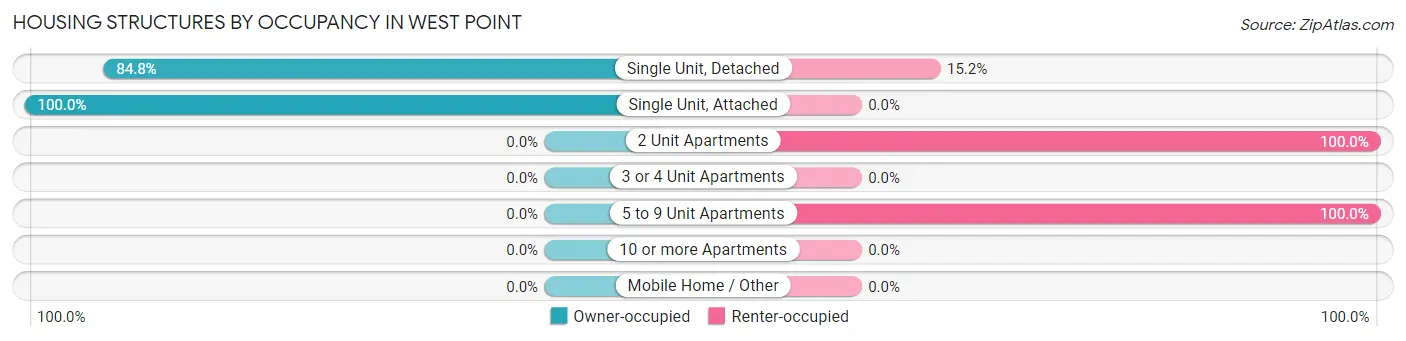
| Structure Type | Owner-occupied | Renter-occupied |
| Single Unit, Detached | 1,090 (84.8%) | 195 (15.2%) |
| Single Unit, Attached | 9 (100.0%) | 0 (0.0%) |
| 2 Unit Apartments | 0 (0.0%) | 45 (100.0%) |
| 3 or 4 Unit Apartments | 0 (0.0%) | 0 (0.0%) |
| 5 to 9 Unit Apartments | 0 (0.0%) | 76 (100.0%) |
| 10 or more Apartments | 0 (0.0%) | 0 (0.0%) |
| Mobile Home / Other | 0 (0.0%) | 0 (0.0%) |
| Total | 1,099 (77.7%) | 316 (22.3%) |
Housing Structures by Number of Rooms in West Point
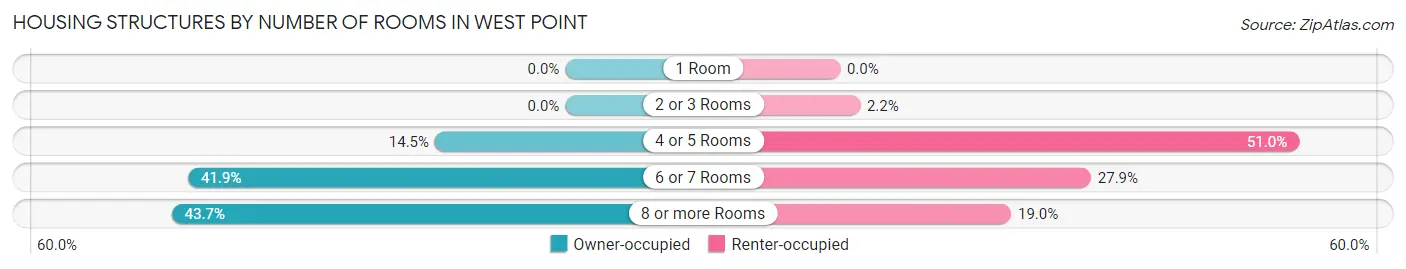
| Number of Rooms | Owner-occupied | Renter-occupied |
| 1 Room | 0 (0.0%) | 0 (0.0%) |
| 2 or 3 Rooms | 0 (0.0%) | 7 (2.2%) |
| 4 or 5 Rooms | 159 (14.5%) | 161 (50.9%) |
| 6 or 7 Rooms | 460 (41.9%) | 88 (27.9%) |
| 8 or more Rooms | 480 (43.7%) | 60 (19.0%) |
| Total | 1,099 (100.0%) | 316 (100.0%) |
Housing Structure by Heating Type in West Point
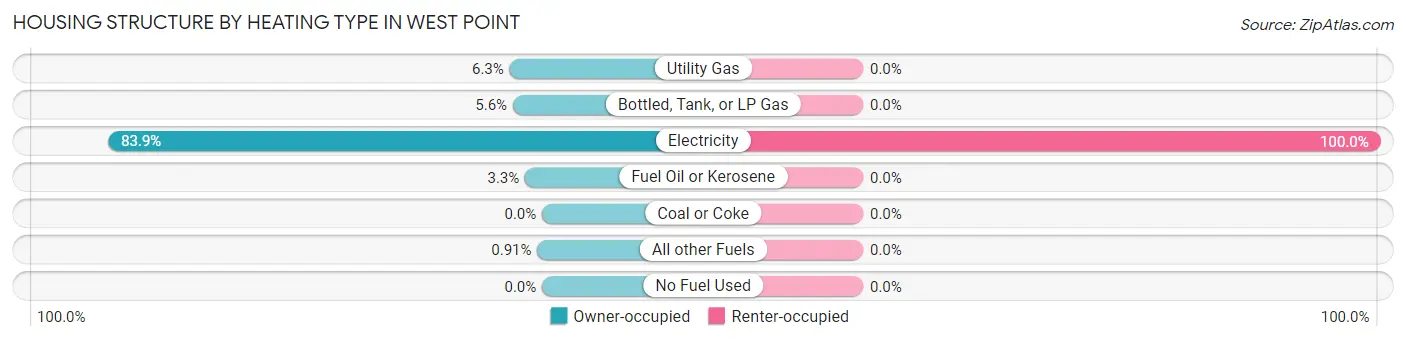
| Heating Type | Owner-occupied | Renter-occupied |
| Utility Gas | 69 (6.3%) | 0 (0.0%) |
| Bottled, Tank, or LP Gas | 62 (5.6%) | 0 (0.0%) |
| Electricity | 922 (83.9%) | 316 (100.0%) |
| Fuel Oil or Kerosene | 36 (3.3%) | 0 (0.0%) |
| Coal or Coke | 0 (0.0%) | 0 (0.0%) |
| All other Fuels | 10 (0.9%) | 0 (0.0%) |
| No Fuel Used | 0 (0.0%) | 0 (0.0%) |
| Total | 1,099 (100.0%) | 316 (100.0%) |
Household Vehicle Usage in West Point
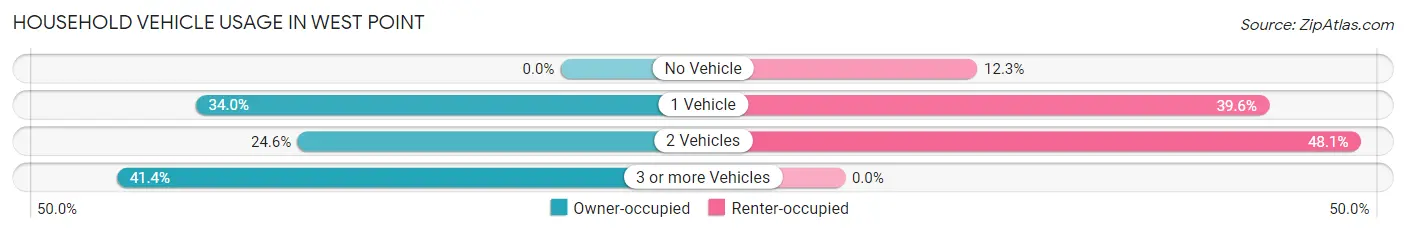
| Vehicles per Household | Owner-occupied | Renter-occupied |
| No Vehicle | 0 (0.0%) | 39 (12.3%) |
| 1 Vehicle | 374 (34.0%) | 125 (39.6%) |
| 2 Vehicles | 270 (24.6%) | 152 (48.1%) |
| 3 or more Vehicles | 455 (41.4%) | 0 (0.0%) |
| Total | 1,099 (100.0%) | 316 (100.0%) |
Real Estate & Mortgages in West Point
Real Estate and Mortgage Overview in West Point
| Characteristic | Without Mortgage | With Mortgage |
| Housing Units | 428 | 671 |
| Median Property Value | $226,000 | $265,600 |
| Median Household Income | $39,569 | $122 |
| Monthly Housing Costs | $494 | $0 |
| Real Estate Taxes | $1,783 | $0 |
Property Value by Mortgage Status in West Point
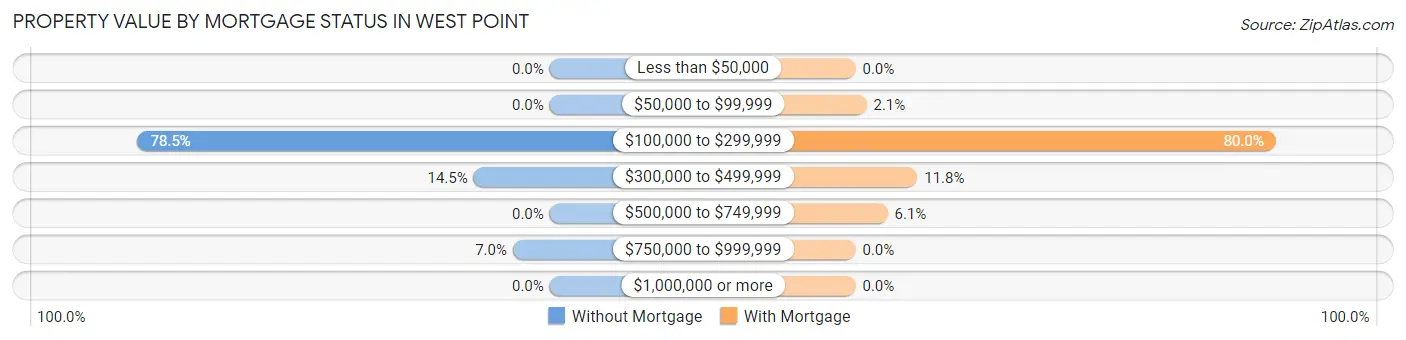
| Property Value | Without Mortgage | With Mortgage |
| Less than $50,000 | 0 (0.0%) | 0 (0.0%) |
| $50,000 to $99,999 | 0 (0.0%) | 14 (2.1%) |
| $100,000 to $299,999 | 336 (78.5%) | 537 (80.0%) |
| $300,000 to $499,999 | 62 (14.5%) | 79 (11.8%) |
| $500,000 to $749,999 | 0 (0.0%) | 41 (6.1%) |
| $750,000 to $999,999 | 30 (7.0%) | 0 (0.0%) |
| $1,000,000 or more | 0 (0.0%) | 0 (0.0%) |
| Total | 428 (100.0%) | 671 (100.0%) |
Household Income by Mortgage Status in West Point
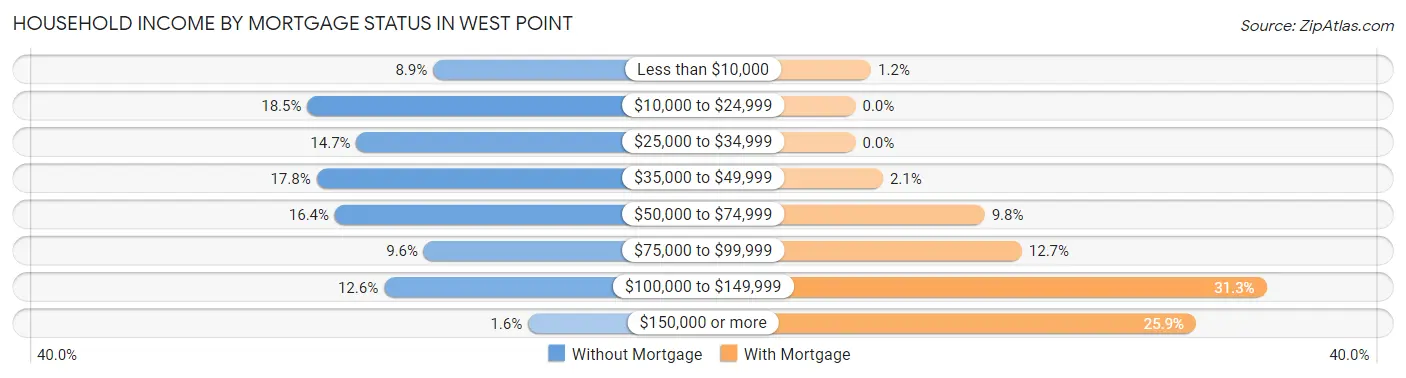
| Household Income | Without Mortgage | With Mortgage |
| Less than $10,000 | 38 (8.9%) | 8 (1.2%) |
| $10,000 to $24,999 | 79 (18.5%) | 0 (0.0%) |
| $25,000 to $34,999 | 63 (14.7%) | 0 (0.0%) |
| $35,000 to $49,999 | 76 (17.8%) | 14 (2.1%) |
| $50,000 to $74,999 | 70 (16.4%) | 66 (9.8%) |
| $75,000 to $99,999 | 41 (9.6%) | 85 (12.7%) |
| $100,000 to $149,999 | 54 (12.6%) | 210 (31.3%) |
| $150,000 or more | 7 (1.6%) | 174 (25.9%) |
| Total | 428 (100.0%) | 671 (100.0%) |
Property Value to Household Income Ratio in West Point
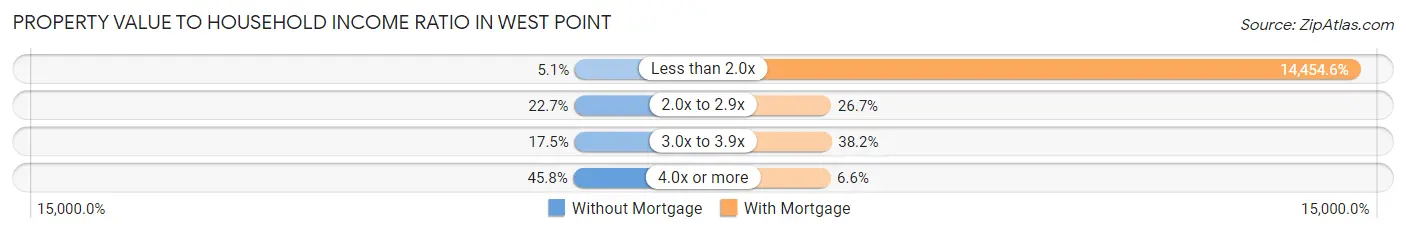
| Value-to-Income Ratio | Without Mortgage | With Mortgage |
| Less than 2.0x | 22 (5.1%) | 96,990 (14,454.6%) |
| 2.0x to 2.9x | 97 (22.7%) | 179 (26.7%) |
| 3.0x to 3.9x | 75 (17.5%) | 256 (38.2%) |
| 4.0x or more | 196 (45.8%) | 44 (6.6%) |
| Total | 428 (100.0%) | 671 (100.0%) |
Real Estate Taxes by Mortgage Status in West Point
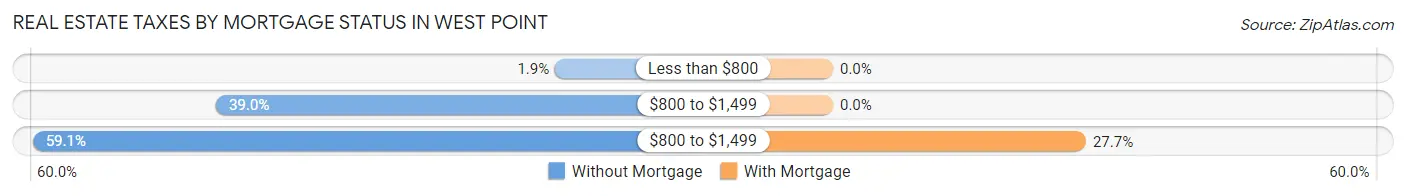
| Property Taxes | Without Mortgage | With Mortgage |
| Less than $800 | 8 (1.9%) | 0 (0.0%) |
| $800 to $1,499 | 167 (39.0%) | 0 (0.0%) |
| $800 to $1,499 | 253 (59.1%) | 186 (27.7%) |
| Total | 428 (100.0%) | 671 (100.0%) |
Health & Disability in West Point
Health Insurance Coverage by Age in West Point
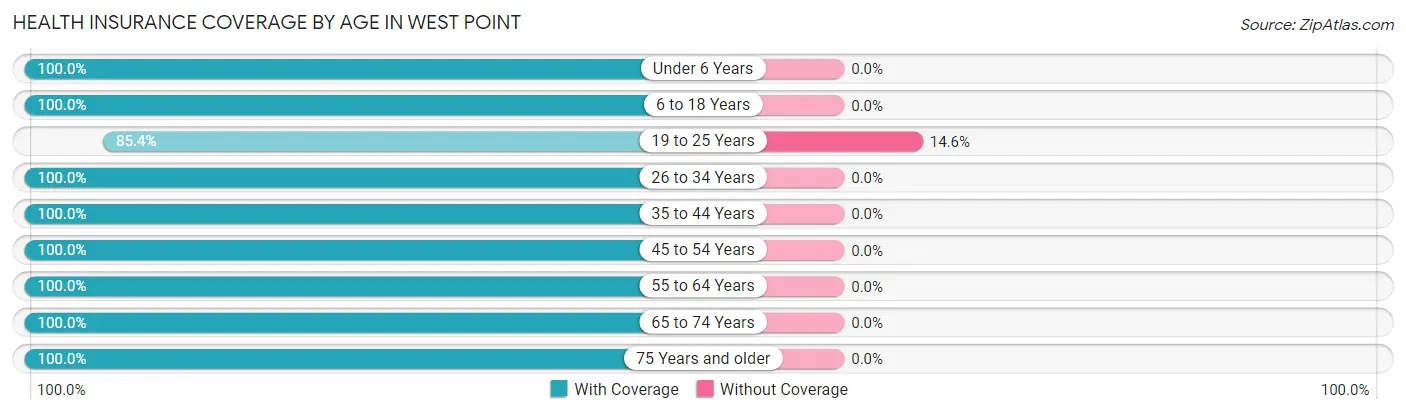
| Age Bracket | With Coverage | Without Coverage |
| Under 6 Years | 183 (100.0%) | 0 (0.0%) |
| 6 to 18 Years | 631 (100.0%) | 0 (0.0%) |
| 19 to 25 Years | 274 (85.4%) | 47 (14.6%) |
| 26 to 34 Years | 321 (100.0%) | 0 (0.0%) |
| 35 to 44 Years | 412 (100.0%) | 0 (0.0%) |
| 45 to 54 Years | 407 (100.0%) | 0 (0.0%) |
| 55 to 64 Years | 416 (100.0%) | 0 (0.0%) |
| 65 to 74 Years | 300 (100.0%) | 0 (0.0%) |
| 75 Years and older | 336 (100.0%) | 0 (0.0%) |
| Total | 3,280 (98.6%) | 47 (1.4%) |
Health Insurance Coverage by Citizenship Status in West Point
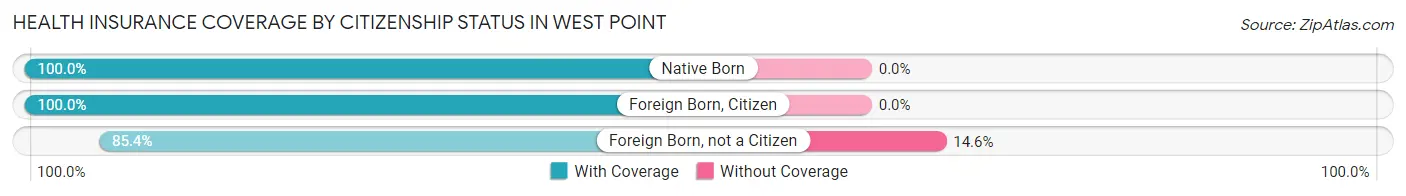
| Citizenship Status | With Coverage | Without Coverage |
| Native Born | 183 (100.0%) | 0 (0.0%) |
| Foreign Born, Citizen | 631 (100.0%) | 0 (0.0%) |
| Foreign Born, not a Citizen | 274 (85.4%) | 47 (14.6%) |
Health Insurance Coverage by Household Income in West Point
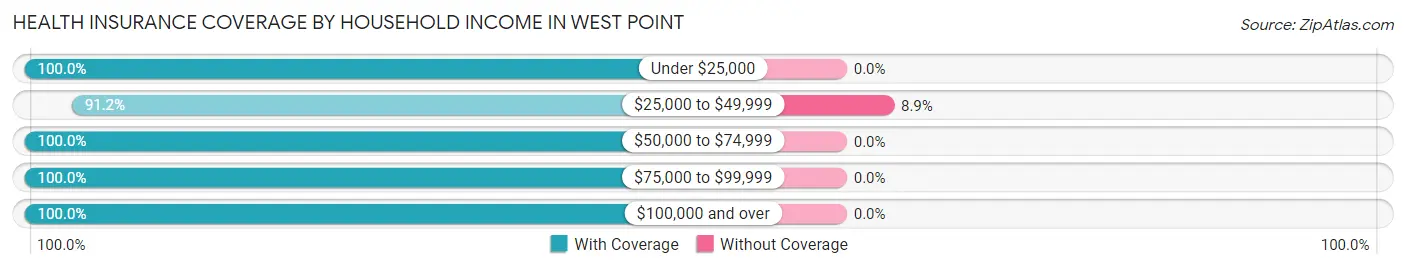
| Household Income | With Coverage | Without Coverage |
| Under $25,000 | 235 (100.0%) | 0 (0.0%) |
| $25,000 to $49,999 | 484 (91.1%) | 47 (8.8%) |
| $50,000 to $74,999 | 474 (100.0%) | 0 (0.0%) |
| $75,000 to $99,999 | 581 (100.0%) | 0 (0.0%) |
| $100,000 and over | 1,506 (100.0%) | 0 (0.0%) |
Public vs Private Health Insurance Coverage by Age in West Point
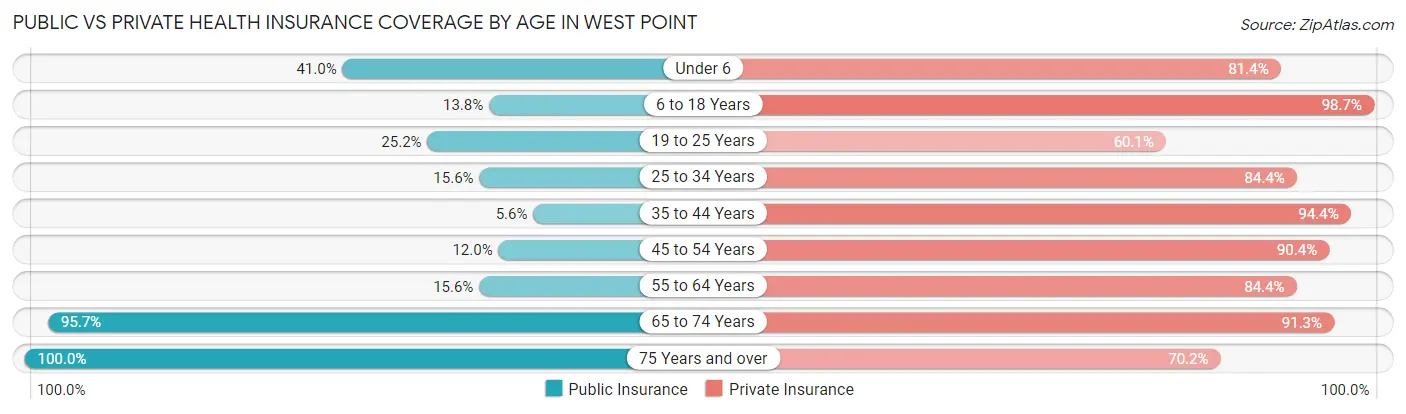
| Age Bracket | Public Insurance | Private Insurance |
| Under 6 | 75 (41.0%) | 149 (81.4%) |
| 6 to 18 Years | 87 (13.8%) | 623 (98.7%) |
| 19 to 25 Years | 81 (25.2%) | 193 (60.1%) |
| 25 to 34 Years | 50 (15.6%) | 271 (84.4%) |
| 35 to 44 Years | 23 (5.6%) | 389 (94.4%) |
| 45 to 54 Years | 49 (12.0%) | 368 (90.4%) |
| 55 to 64 Years | 65 (15.6%) | 351 (84.4%) |
| 65 to 74 Years | 287 (95.7%) | 274 (91.3%) |
| 75 Years and over | 336 (100.0%) | 236 (70.2%) |
| Total | 1,053 (31.7%) | 2,854 (85.8%) |
Disability Status by Sex by Age in West Point
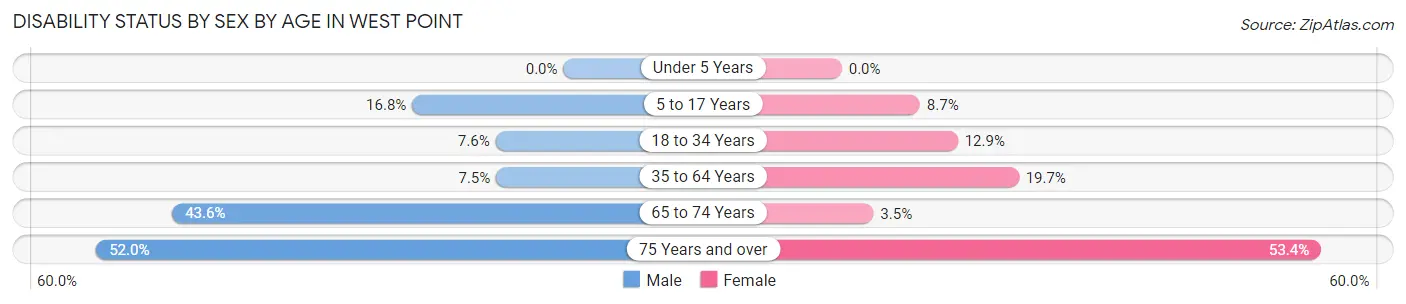
| Age Bracket | Male | Female |
| Under 5 Years | 0 (0.0%) | 0 (0.0%) |
| 5 to 17 Years | 64 (16.8%) | 26 (8.7%) |
| 18 to 34 Years | 22 (7.6%) | 47 (12.9%) |
| 35 to 64 Years | 48 (7.5%) | 117 (19.7%) |
| 65 to 74 Years | 44 (43.6%) | 7 (3.5%) |
| 75 Years and over | 90 (52.0%) | 87 (53.4%) |
Disability Class by Sex by Age in West Point
Disability Class: Hearing Difficulty
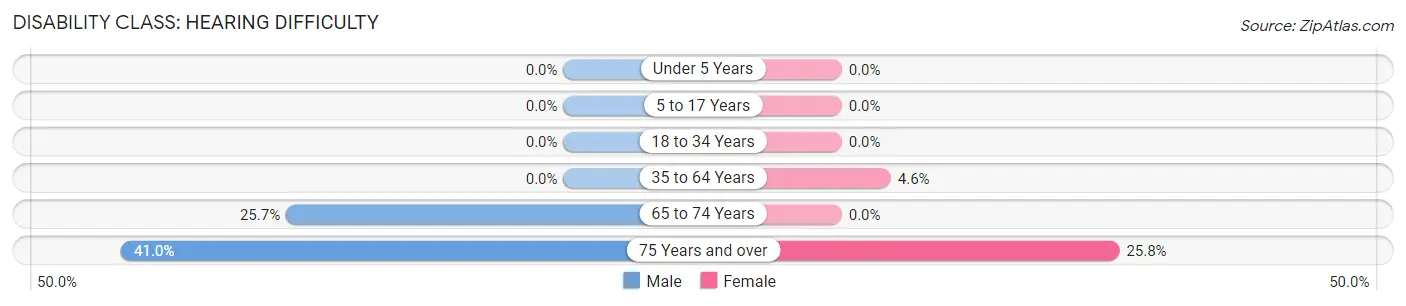
| Age Bracket | Male | Female |
| Under 5 Years | 0 (0.0%) | 0 (0.0%) |
| 5 to 17 Years | 0 (0.0%) | 0 (0.0%) |
| 18 to 34 Years | 0 (0.0%) | 0 (0.0%) |
| 35 to 64 Years | 0 (0.0%) | 27 (4.5%) |
| 65 to 74 Years | 26 (25.7%) | 0 (0.0%) |
| 75 Years and over | 71 (41.0%) | 42 (25.8%) |
Disability Class: Vision Difficulty
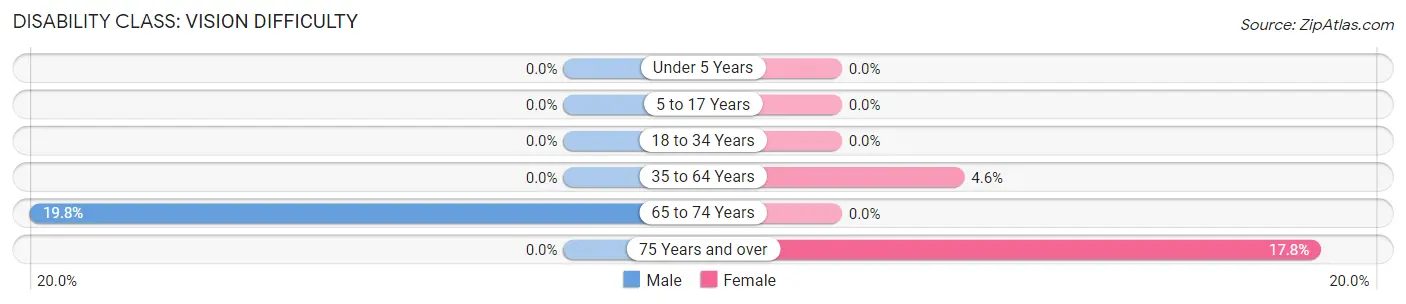
| Age Bracket | Male | Female |
| Under 5 Years | 0 (0.0%) | 0 (0.0%) |
| 5 to 17 Years | 0 (0.0%) | 0 (0.0%) |
| 18 to 34 Years | 0 (0.0%) | 0 (0.0%) |
| 35 to 64 Years | 0 (0.0%) | 27 (4.5%) |
| 65 to 74 Years | 20 (19.8%) | 0 (0.0%) |
| 75 Years and over | 0 (0.0%) | 29 (17.8%) |
Disability Class: Cognitive Difficulty
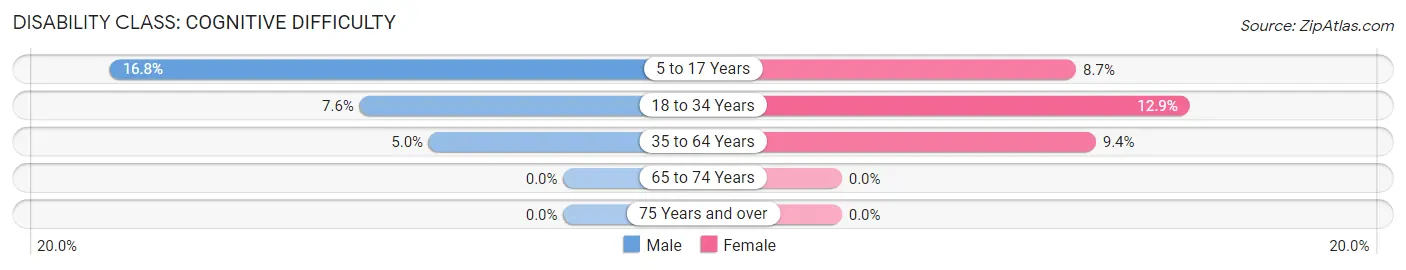
| Age Bracket | Male | Female |
| 5 to 17 Years | 64 (16.8%) | 26 (8.7%) |
| 18 to 34 Years | 22 (7.6%) | 47 (12.9%) |
| 35 to 64 Years | 32 (5.0%) | 56 (9.4%) |
| 65 to 74 Years | 0 (0.0%) | 0 (0.0%) |
| 75 Years and over | 0 (0.0%) | 0 (0.0%) |
Disability Class: Ambulatory Difficulty
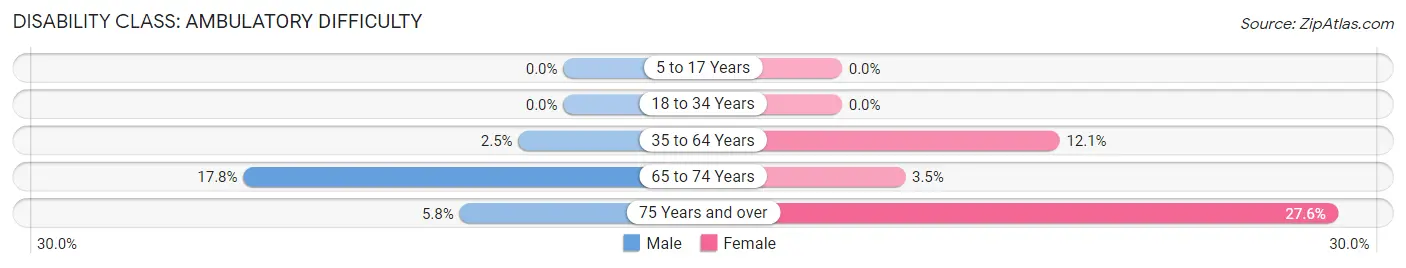
| Age Bracket | Male | Female |
| 5 to 17 Years | 0 (0.0%) | 0 (0.0%) |
| 18 to 34 Years | 0 (0.0%) | 0 (0.0%) |
| 35 to 64 Years | 16 (2.5%) | 72 (12.1%) |
| 65 to 74 Years | 18 (17.8%) | 7 (3.5%) |
| 75 Years and over | 10 (5.8%) | 45 (27.6%) |
Disability Class: Self-Care Difficulty
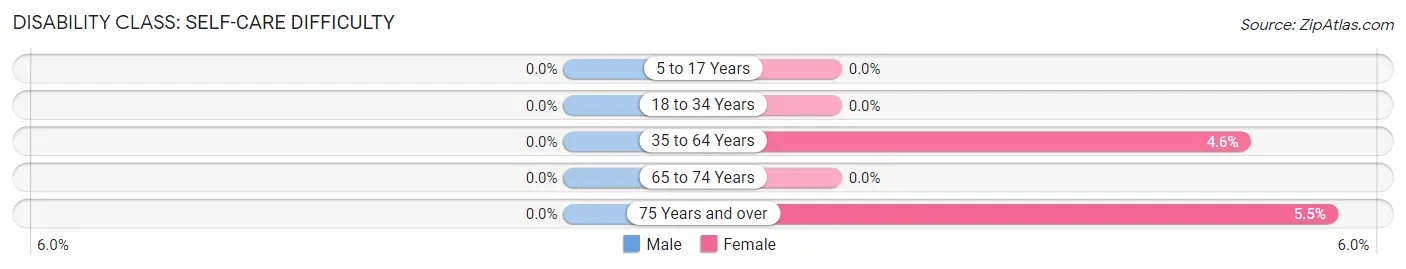
| Age Bracket | Male | Female |
| 5 to 17 Years | 0 (0.0%) | 0 (0.0%) |
| 18 to 34 Years | 0 (0.0%) | 0 (0.0%) |
| 35 to 64 Years | 0 (0.0%) | 27 (4.5%) |
| 65 to 74 Years | 0 (0.0%) | 0 (0.0%) |
| 75 Years and over | 0 (0.0%) | 9 (5.5%) |
Technology Access in West Point
Computing Device Access in West Point
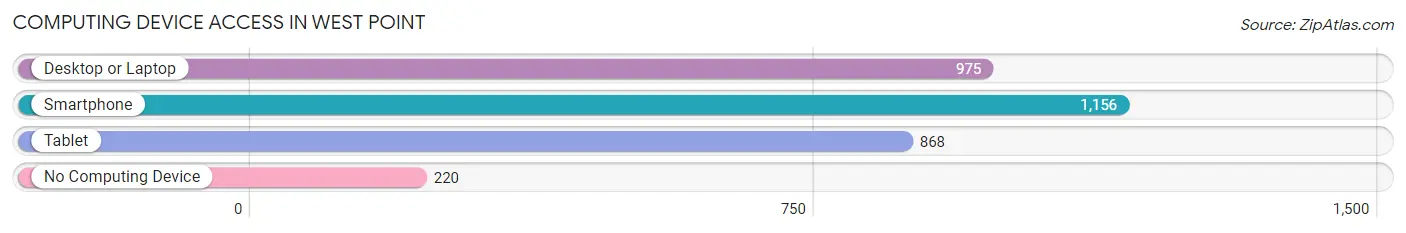
| Device Type | # Households | % Households |
| Desktop or Laptop | 975 | 68.9% |
| Smartphone | 1,156 | 81.7% |
| Tablet | 868 | 61.3% |
| No Computing Device | 220 | 15.5% |
| Total | 1,415 | 100.0% |
Internet Access in West Point
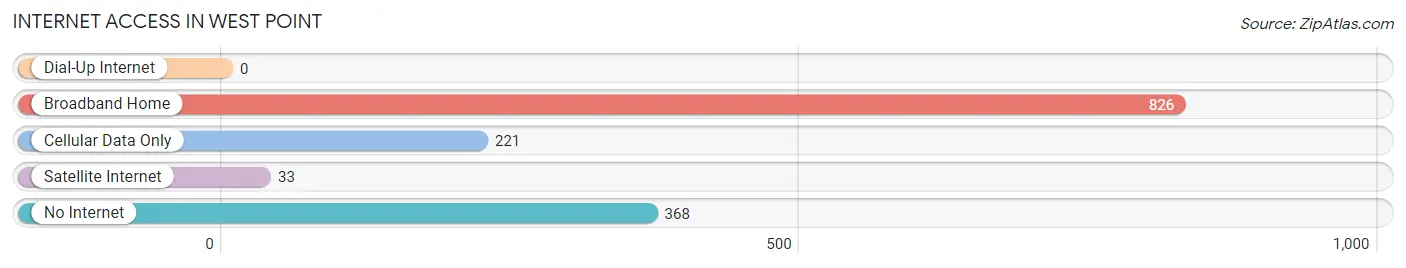
| Internet Type | # Households | % Households |
| Dial-Up Internet | 0 | 0.0% |
| Broadband Home | 826 | 58.4% |
| Cellular Data Only | 221 | 15.6% |
| Satellite Internet | 33 | 2.3% |
| No Internet | 368 | 26.0% |
| Total | 1,415 | 100.0% |
West Point Summary
West Point, Virginia is a small town located in King William County, Virginia. It is situated on the banks of the Mattaponi River, about 40 miles east of Richmond. The town has a population of approximately 3,500 people and is part of the Richmond-Petersburg metropolitan area.
History
West Point was founded in 1607 by Captain John Smith and the Virginia Company of London. The town was originally known as "West Point on the Mattaponi" and was the first English settlement in the area. The town was established as a trading post and was used as a base for trading with the local Native American tribes.
In 1619, the Virginia Company of London established the first representative government in the New World at West Point. This government was known as the House of Burgesses and was the first legislative body in the New World.
In 1676, West Point was the site of Bacon's Rebellion, a revolt against the colonial government of Virginia. The rebellion was led by Nathaniel Bacon and was an attempt to overthrow the colonial government and establish a new government based on the principles of democracy. The rebellion was unsuccessful and Bacon was killed in the fighting.
In 1781, West Point was the site of the Battle of West Point, a major battle in the American Revolutionary War. The battle was fought between the British and American forces and resulted in a victory for the Americans.
Geography
West Point is located in King William County, Virginia. The town is situated on the banks of the Mattaponi River, about 40 miles east of Richmond. The town is surrounded by rolling hills and is located in the Piedmont region of Virginia.
The climate in West Point is humid subtropical, with hot, humid summers and mild winters. The average annual temperature is around 60 degrees Fahrenheit. The average annual precipitation is around 40 inches.
Economy
West Point's economy is largely based on agriculture and tourism. The town is home to several farms, including a dairy farm, a beef farm, and a vegetable farm. The town is also home to several wineries and vineyards.
Tourism is an important part of the local economy. The town is home to several historic sites, including the West Point Historic District, the West Point Museum, and the West Point Lighthouse. The town also hosts several annual festivals and events, including the West Point Oyster Festival and the West Point Watermelon Festival.
Demographics
As of the 2010 census, West Point had a population of 3,476 people. The racial makeup of the town was 79.3% White, 16.2% African American, 0.3% Native American, 0.7% Asian, 0.1% Pacific Islander, and 3.4% from other races. The median household income was $45,938 and the median family income was $51,938.
West Point is served by the King William County Public Schools system. The town is home to West Point High School, West Point Middle School, and West Point Elementary School. The town is also home to several private schools, including West Point Christian Academy and West Point Montessori School.
Common Questions
What is Per Capita Income in West Point?
Per Capita income in West Point is $37,572.
What is the Median Family Income in West Point?
Median Family Income in West Point is $92,438.
What is the Median Household income in West Point?
Median Household Income in West Point is $72,305.
What is Income or Wage Gap in West Point?
Income or Wage Gap in West Point is 36.8%.
Women in West Point earn 63.2 cents for every dollar earned by a man.
What is Inequality or Gini Index in West Point?
Inequality or Gini Index in West Point is 0.39.
What is the Total Population of West Point?
Total Population of West Point is 3,396.
What is the Total Male Population of West Point?
Total Male Population of West Point is 1,687.
What is the Total Female Population of West Point?
Total Female Population of West Point is 1,709.
What is the Ratio of Males per 100 Females in West Point?
There are 98.71 Males per 100 Females in West Point.
What is the Ratio of Females per 100 Males in West Point?
There are 101.30 Females per 100 Males in West Point.
What is the Median Population Age in West Point?
Median Population Age in West Point is 41.4 Years.
What is the Average Family Size in West Point
Average Family Size in West Point is 3.0 People.
What is the Average Household Size in West Point
Average Household Size in West Point is 2.4 People.
How Large is the Labor Force in West Point?
There are 1,831 People in the Labor Forcein in West Point.
What is the Percentage of People in the Labor Force in West Point?
68.9% of People are in the Labor Force in West Point.
What is the Unemployment Rate in West Point?
Unemployment Rate in West Point is 2.6%.