Stephens City, VA Map & Demographics
Stephens City Map
Stephens City Overview
$39,459
PER CAPITA INCOME
$107,500
AVG FAMILY INCOME
$90,588
AVG HOUSEHOLD INCOME
45.2%
WAGE / INCOME GAP [ % ]
54.8¢/ $1
WAGE / INCOME GAP [ $ ]
0.40
INEQUALITY / GINI INDEX
2,107
TOTAL POPULATION
1,026
MALE POPULATION
1,081
FEMALE POPULATION
94.91
MALES / 100 FEMALES
105.36
FEMALES / 100 MALES
34.1
MEDIAN AGE
3.6
AVG FAMILY SIZE
2.7
AVG HOUSEHOLD SIZE
1,270
LABOR FORCE [ PEOPLE ]
79.2%
PERCENT IN LABOR FORCE
3.4%
UNEMPLOYMENT RATE
Stephens City Zip Codes
Stephens City Area Codes
Income in Stephens City
Income Overview in Stephens City
Per Capita Income in Stephens City is $39,459, while median incomes of families and households are $107,500 and $90,588 respectively.
| Characteristic | Number | Measure |
| Per Capita Income | 2,107 | $39,459 |
| Median Family Income | 462 | $107,500 |
| Mean Family Income | 462 | $124,697 |
| Median Household Income | 774 | $90,588 |
| Mean Household Income | 774 | $104,709 |
| Income Deficit | 462 | $0 |
| Wage / Income Gap (%) | 2,107 | 45.24% |
| Wage / Income Gap ($) | 2,107 | 54.76¢ per $1 |
| Gini / Inequality Index | 2,107 | 0.40 |
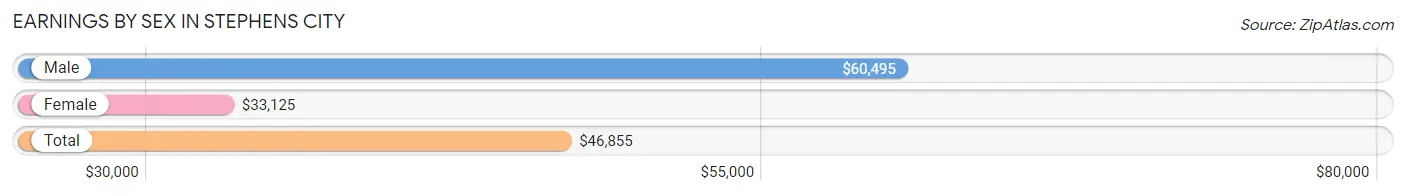
Earnings by Sex in Stephens City
Average Earnings in Stephens City are $46,855, $60,495 for men and $33,125 for women, a difference of 45.2%.
| Sex | Number | Average Earnings |
| Male | 665 (50.9%) | $60,495 |
| Female | 641 (49.1%) | $33,125 |
| Total | 1,306 (100.0%) | $46,855 |
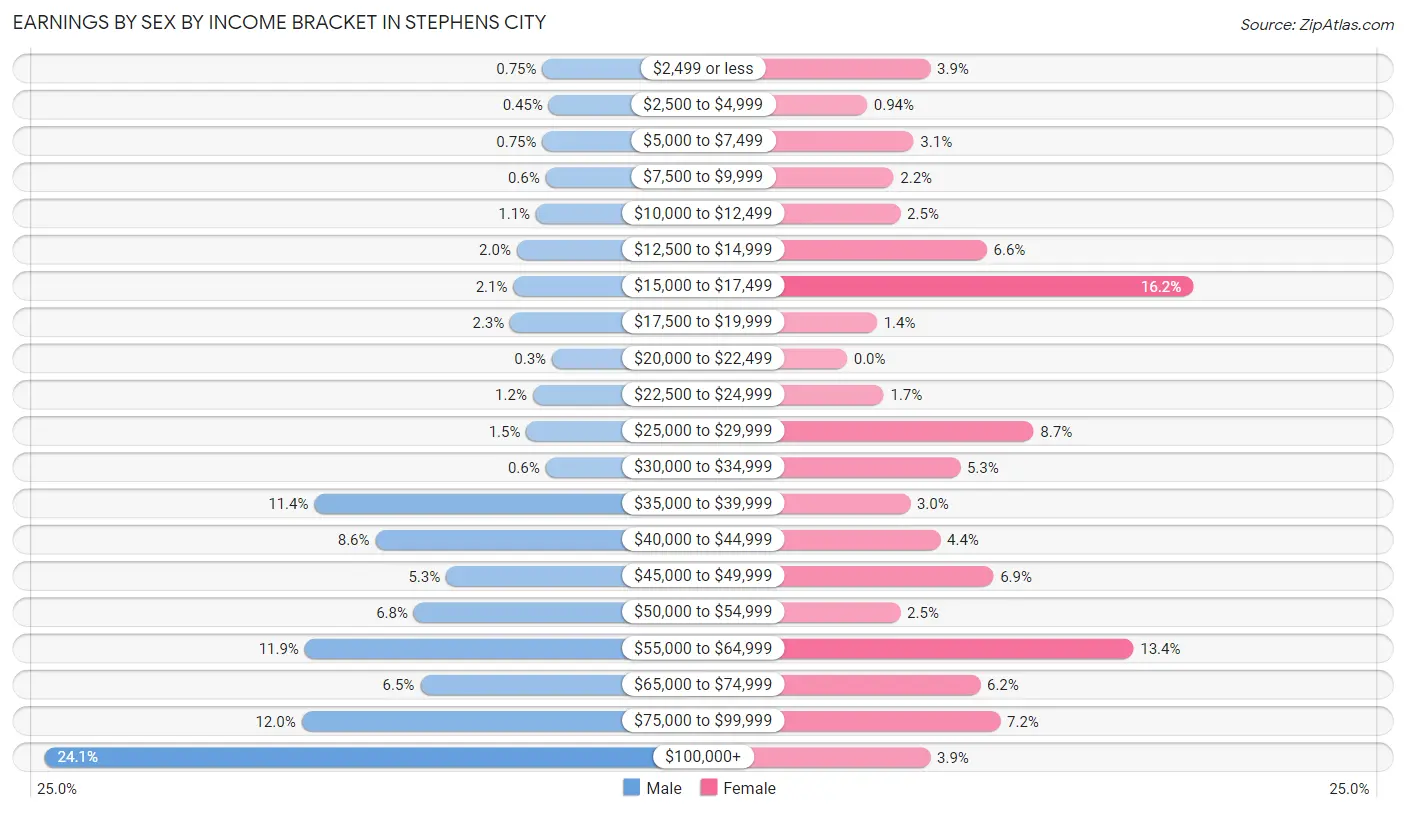
Earnings by Sex by Income Bracket in Stephens City
The most common earnings brackets in Stephens City are $100,000+ for men (160 | 24.1%) and $15,000 to $17,499 for women (104 | 16.2%).
| Income | Male | Female |
| $2,499 or less | 5 (0.7%) | 25 (3.9%) |
| $2,500 to $4,999 | 3 (0.4%) | 6 (0.9%) |
| $5,000 to $7,499 | 5 (0.7%) | 20 (3.1%) |
| $7,500 to $9,999 | 4 (0.6%) | 14 (2.2%) |
| $10,000 to $12,499 | 7 (1.1%) | 16 (2.5%) |
| $12,500 to $14,999 | 13 (1.9%) | 42 (6.6%) |
| $15,000 to $17,499 | 14 (2.1%) | 104 (16.2%) |
| $17,500 to $19,999 | 15 (2.3%) | 9 (1.4%) |
| $20,000 to $22,499 | 2 (0.3%) | 0 (0.0%) |
| $22,500 to $24,999 | 8 (1.2%) | 11 (1.7%) |
| $25,000 to $29,999 | 10 (1.5%) | 56 (8.7%) |
| $30,000 to $34,999 | 4 (0.6%) | 34 (5.3%) |
| $35,000 to $39,999 | 76 (11.4%) | 19 (3.0%) |
| $40,000 to $44,999 | 57 (8.6%) | 28 (4.4%) |
| $45,000 to $49,999 | 35 (5.3%) | 44 (6.9%) |
| $50,000 to $54,999 | 45 (6.8%) | 16 (2.5%) |
| $55,000 to $64,999 | 79 (11.9%) | 86 (13.4%) |
| $65,000 to $74,999 | 43 (6.5%) | 40 (6.2%) |
| $75,000 to $99,999 | 80 (12.0%) | 46 (7.2%) |
| $100,000+ | 160 (24.1%) | 25 (3.9%) |
| Total | 665 (100.0%) | 641 (100.0%) |
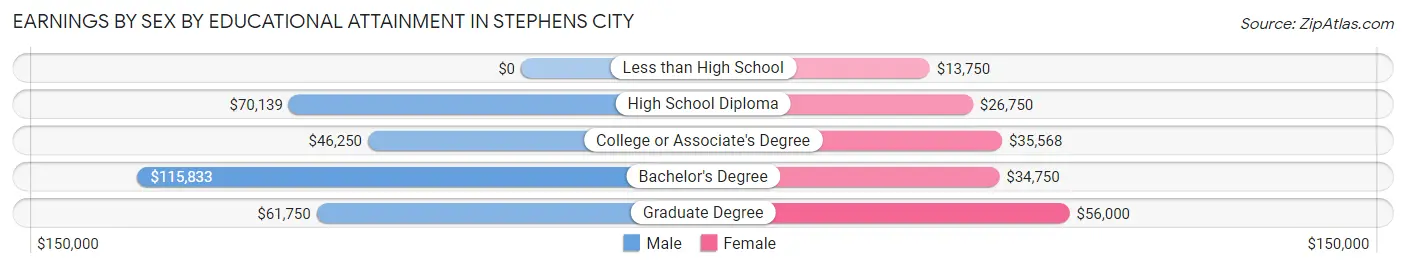
Earnings by Sex by Educational Attainment in Stephens City
Average earnings in Stephens City are $62,146 for men and $36,923 for women, a difference of 40.6%. Men with an educational attainment of bachelor's degree enjoy the highest average annual earnings of $115,833, while those with college or associate's degree education earn the least with $46,250. Women with an educational attainment of graduate degree earn the most with the average annual earnings of $56,000, while those with less than high school education have the smallest earnings of $13,750.
| Educational Attainment | Male Income | Female Income |
| Less than High School | - | - |
| High School Diploma | $70,139 | $26,750 |
| College or Associate's Degree | $46,250 | $35,568 |
| Bachelor's Degree | $115,833 | $34,750 |
| Graduate Degree | $61,750 | $56,000 |
| Total | $62,146 | $36,923 |
Family Income in Stephens City
Family Income Brackets in Stephens City
According to the Stephens City family income data, there are 94 families falling into the $100,000 to $149,999 income range, which is the most common income bracket and makes up 20.3% of all families.
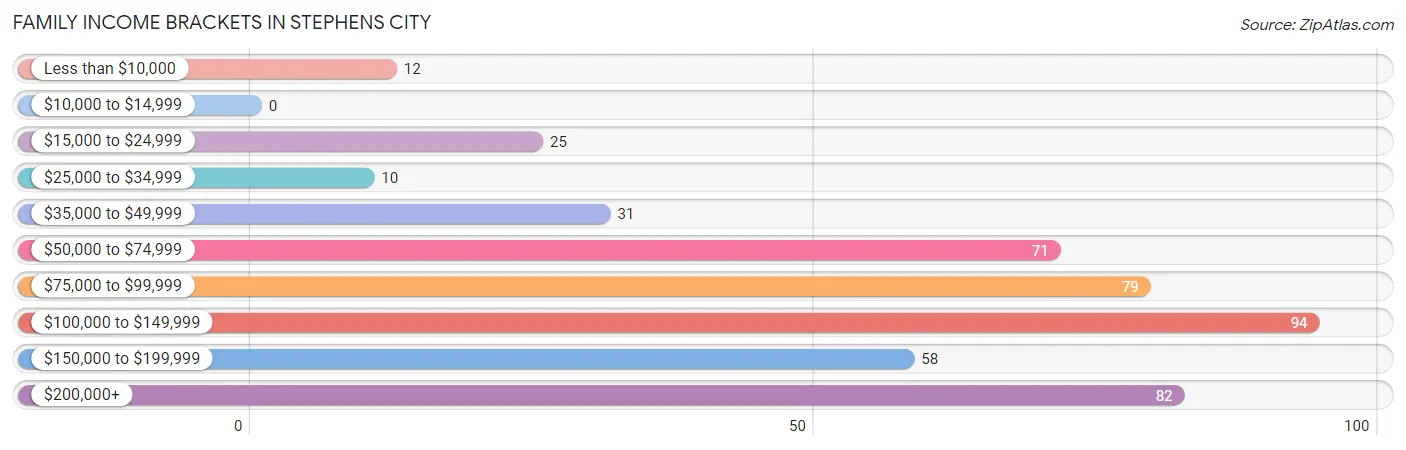
| Income Bracket | # Families | % Families |
| Less than $10,000 | 12 | 2.6% |
| $10,000 to $14,999 | 0 | 0.0% |
| $15,000 to $24,999 | 25 | 5.4% |
| $25,000 to $34,999 | 10 | 2.2% |
| $35,000 to $49,999 | 31 | 6.7% |
| $50,000 to $74,999 | 71 | 15.4% |
| $75,000 to $99,999 | 79 | 17.1% |
| $100,000 to $149,999 | 94 | 20.3% |
| $150,000 to $199,999 | 58 | 12.6% |
| $200,000+ | 82 | 17.7% |
Family Income by Famaliy Size in Stephens City
4-person families (138 | 29.9%) account for the highest median family income in Stephens City with $166,250 per family, while 4-person families (138 | 29.9%) have the highest median income of $41,562 per family member.
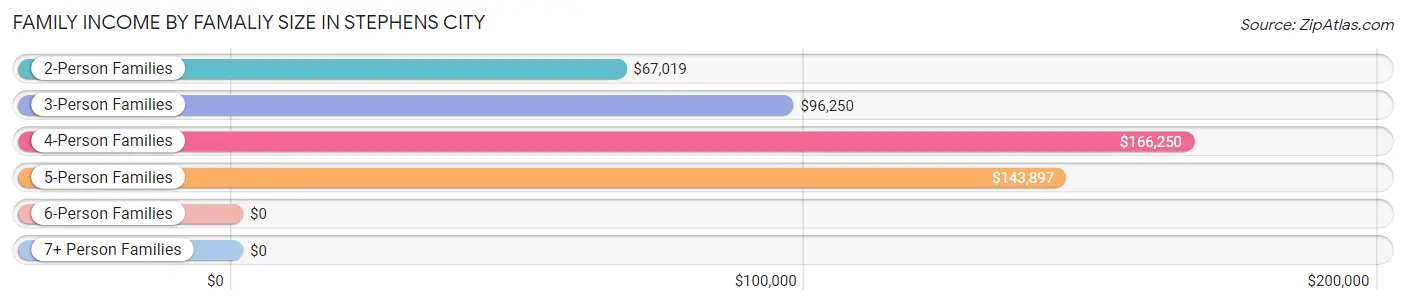
| Income Bracket | # Families | Median Income |
| 2-Person Families | 173 (37.4%) | $67,019 |
| 3-Person Families | 70 (15.1%) | $96,250 |
| 4-Person Families | 138 (29.9%) | $166,250 |
| 5-Person Families | 35 (7.6%) | $143,897 |
| 6-Person Families | 46 (10.0%) | $0 |
| 7+ Person Families | 0 (0.0%) | $0 |
| Total | 462 (100.0%) | $107,500 |
Family Income by Number of Earners in Stephens City
The median family income in Stephens City is $107,500, with families comprising 3+ earners (72) having the highest median family income of $213,125, while families with no earners (30) have the lowest median family income of $19,079, accounting for 15.6% and 6.5% of families, respectively.
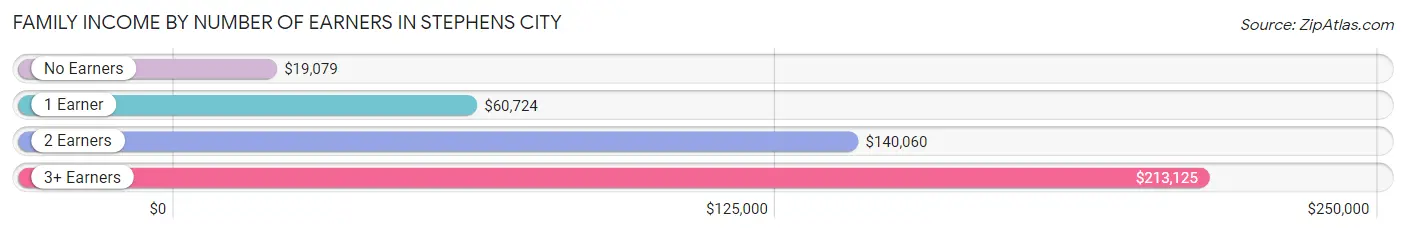
| Number of Earners | # Families | Median Income |
| No Earners | 30 (6.5%) | $19,079 |
| 1 Earner | 113 (24.5%) | $60,724 |
| 2 Earners | 247 (53.5%) | $140,060 |
| 3+ Earners | 72 (15.6%) | $213,125 |
| Total | 462 (100.0%) | $107,500 |
Household Income in Stephens City
Household Income Brackets in Stephens City
With 162 households falling in the category, the $100,000 to $149,999 income range is the most frequent in Stephens City, accounting for 20.9% of all households. In contrast, only 4 households (0.5%) fall into the $10,000 to $14,999 income bracket, making it the least populous group.
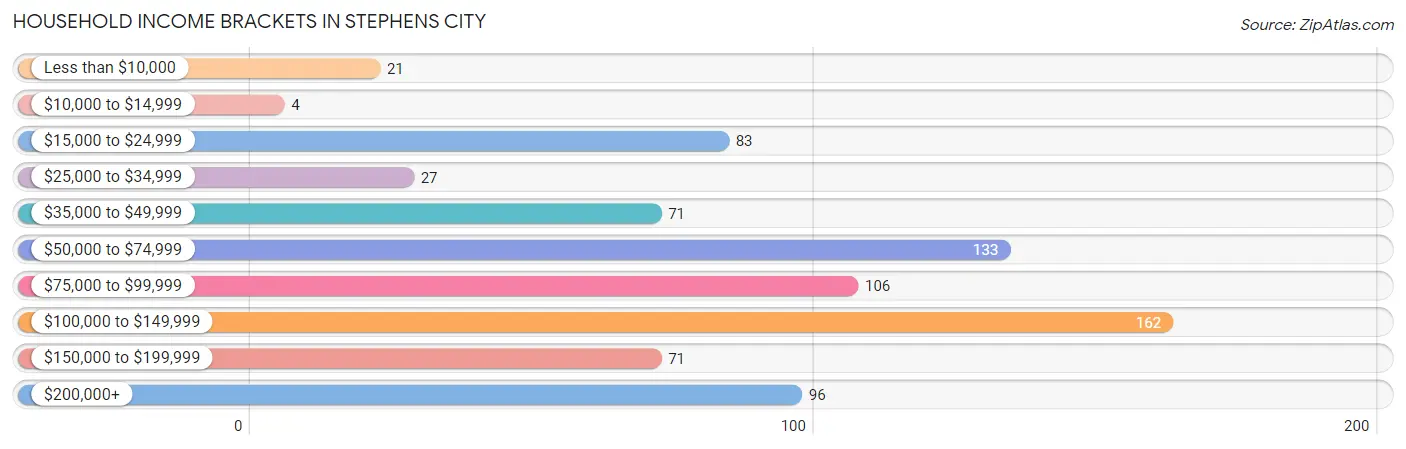
| Income Bracket | # Households | % Households |
| Less than $10,000 | 21 | 2.7% |
| $10,000 to $14,999 | 4 | 0.5% |
| $15,000 to $24,999 | 83 | 10.7% |
| $25,000 to $34,999 | 27 | 3.5% |
| $35,000 to $49,999 | 71 | 9.2% |
| $50,000 to $74,999 | 133 | 17.2% |
| $75,000 to $99,999 | 106 | 13.7% |
| $100,000 to $149,999 | 162 | 20.9% |
| $150,000 to $199,999 | 71 | 9.2% |
| $200,000+ | 96 | 12.4% |
Household Income by Householder Age in Stephens City
The median household income in Stephens City is $90,588, with the highest median household income of $111,607 found in the 45 to 64 years age bracket for the primary householder. A total of 277 households (35.8%) fall into this category. Meanwhile, the 15 to 24 years age bracket for the primary householder has the lowest median household income of $0, with 28 households (3.6%) in this group.
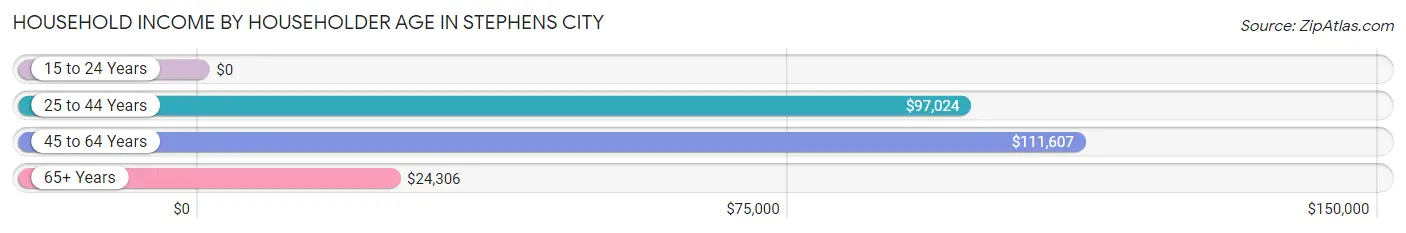
| Income Bracket | # Households | Median Income |
| 15 to 24 Years | 28 (3.6%) | $0 |
| 25 to 44 Years | 346 (44.7%) | $97,024 |
| 45 to 64 Years | 277 (35.8%) | $111,607 |
| 65+ Years | 123 (15.9%) | $24,306 |
| Total | 774 (100.0%) | $90,588 |
Poverty in Stephens City
Income Below Poverty by Sex and Age in Stephens City
With 9.1% poverty level for males and 7.0% for females among the residents of Stephens City, 6 to 11 year old males and 75 year old and over females are the most vulnerable to poverty, with 24 males (33.8%) and 17 females (37.8%) in their respective age groups living below the poverty level.
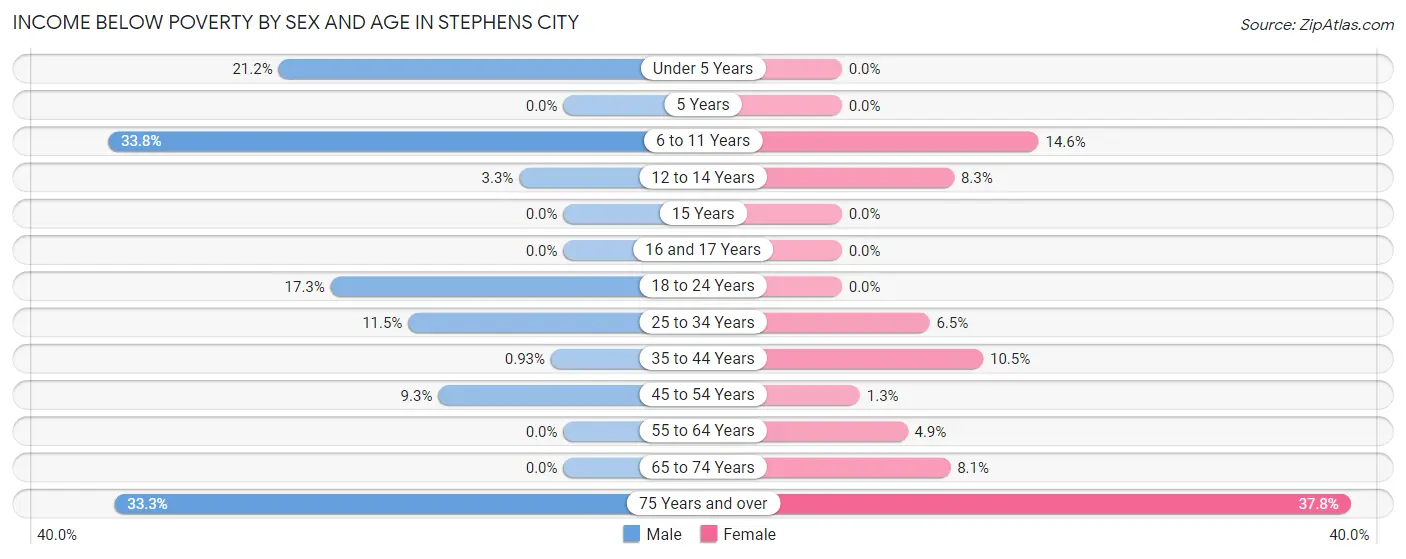
| Age Bracket | Male | Female |
| Under 5 Years | 11 (21.1%) | 0 (0.0%) |
| 5 Years | 0 (0.0%) | 0 (0.0%) |
| 6 to 11 Years | 24 (33.8%) | 13 (14.6%) |
| 12 to 14 Years | 2 (3.3%) | 4 (8.3%) |
| 15 Years | 0 (0.0%) | 0 (0.0%) |
| 16 and 17 Years | 0 (0.0%) | 0 (0.0%) |
| 18 to 24 Years | 14 (17.3%) | 0 (0.0%) |
| 25 to 34 Years | 19 (11.5%) | 14 (6.5%) |
| 35 to 44 Years | 2 (0.9%) | 15 (10.5%) |
| 45 to 54 Years | 13 (9.3%) | 2 (1.3%) |
| 55 to 64 Years | 0 (0.0%) | 4 (4.9%) |
| 65 to 74 Years | 0 (0.0%) | 7 (8.1%) |
| 75 Years and over | 8 (33.3%) | 17 (37.8%) |
| Total | 93 (9.1%) | 76 (7.0%) |
Income Above Poverty by Sex and Age in Stephens City
According to the poverty statistics in Stephens City, males aged 5 years and females aged under 5 years are the age groups that are most secure financially, with 100.0% of males and 100.0% of females in these age groups living above the poverty line.
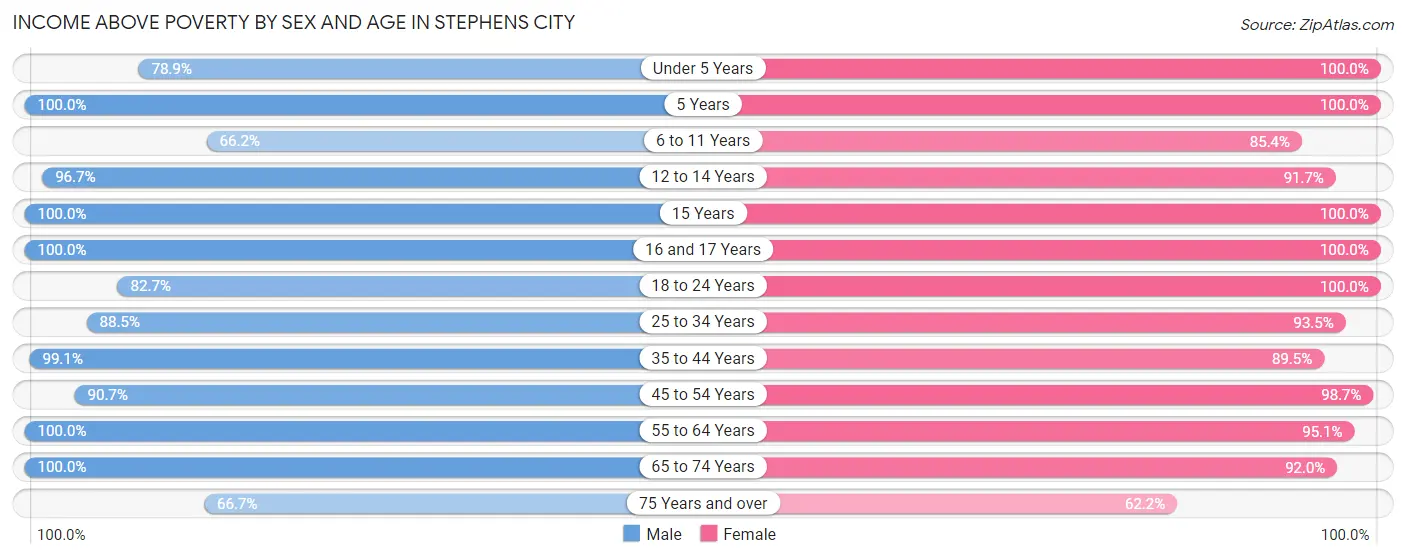
| Age Bracket | Male | Female |
| Under 5 Years | 41 (78.8%) | 69 (100.0%) |
| 5 Years | 7 (100.0%) | 52 (100.0%) |
| 6 to 11 Years | 47 (66.2%) | 76 (85.4%) |
| 12 to 14 Years | 59 (96.7%) | 44 (91.7%) |
| 15 Years | 42 (100.0%) | 12 (100.0%) |
| 16 and 17 Years | 18 (100.0%) | 11 (100.0%) |
| 18 to 24 Years | 67 (82.7%) | 79 (100.0%) |
| 25 to 34 Years | 146 (88.5%) | 201 (93.5%) |
| 35 to 44 Years | 213 (99.1%) | 128 (89.5%) |
| 45 to 54 Years | 127 (90.7%) | 147 (98.7%) |
| 55 to 64 Years | 115 (100.0%) | 78 (95.1%) |
| 65 to 74 Years | 35 (100.0%) | 80 (91.9%) |
| 75 Years and over | 16 (66.7%) | 28 (62.2%) |
| Total | 933 (90.9%) | 1,005 (93.0%) |
Income Below Poverty Among Married-Couple Families in Stephens City
The poverty statistics for married-couple families in Stephens City show that 3.6% or 12 of the total 330 families live below the poverty line. Families with no children have the highest poverty rate of 5.3%, comprising of 8 families. On the other hand, families with 3 or 4 children have the lowest poverty rate of 0.0%, which includes 0 families.
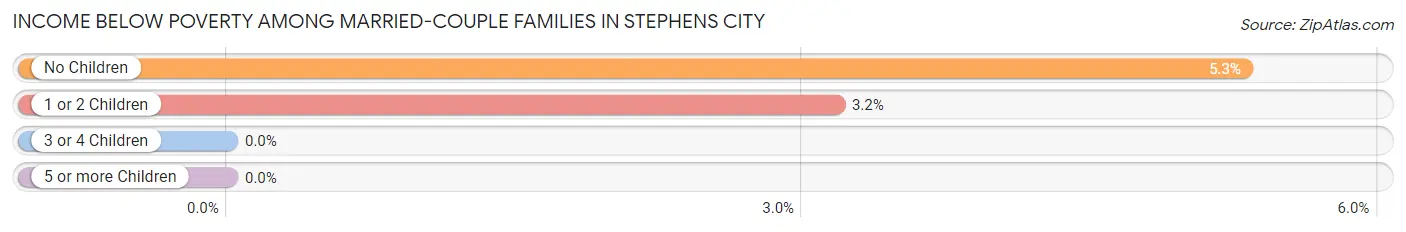
| Children | Above Poverty | Below Poverty |
| No Children | 143 (94.7%) | 8 (5.3%) |
| 1 or 2 Children | 122 (96.8%) | 4 (3.2%) |
| 3 or 4 Children | 53 (100.0%) | 0 (0.0%) |
| 5 or more Children | 0 (0.0%) | 0 (0.0%) |
| Total | 318 (96.4%) | 12 (3.6%) |
Income Below Poverty Among Single-Parent Households in Stephens City
According to the poverty data in Stephens City, 24.2% or 16 single-father households and 13.6% or 9 single-mother households are living below the poverty line. Among single-father households, those with no children have the highest poverty rate, with 14 households (60.9%) experiencing poverty. Likewise, among single-mother households, those with 5 or more children have the highest poverty rate, with 7 households (100.0%) falling below the poverty line.
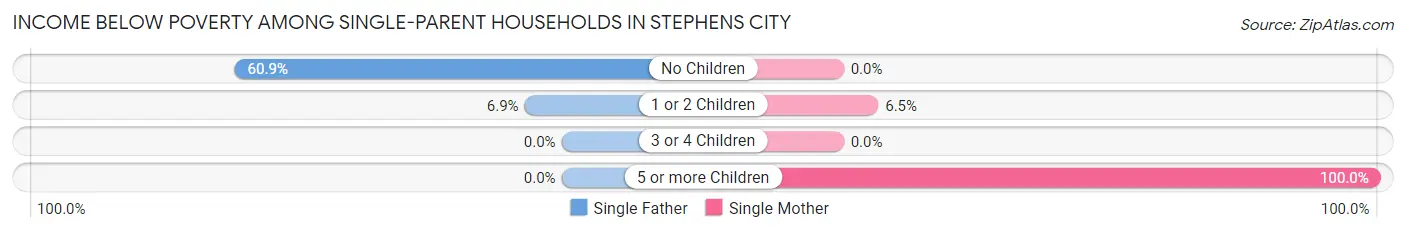
| Children | Single Father | Single Mother |
| No Children | 14 (60.9%) | 0 (0.0%) |
| 1 or 2 Children | 2 (6.9%) | 2 (6.5%) |
| 3 or 4 Children | 0 (0.0%) | 0 (0.0%) |
| 5 or more Children | 0 (0.0%) | 7 (100.0%) |
| Total | 16 (24.2%) | 9 (13.6%) |
Income Below Poverty Among Married-Couple vs Single-Parent Households in Stephens City
The poverty data for Stephens City shows that 12 of the married-couple family households (3.6%) and 25 of the single-parent households (18.9%) are living below the poverty level. Within the married-couple family households, those with no children have the highest poverty rate, with 8 households (5.3%) falling below the poverty line. Among the single-parent households, those with 5 or more children have the highest poverty rate, with 7 household (100.0%) living below poverty.
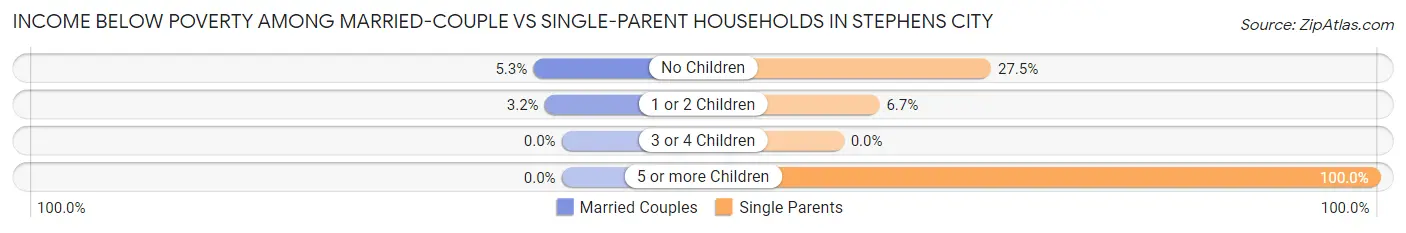
| Children | Married-Couple Families | Single-Parent Households |
| No Children | 8 (5.3%) | 14 (27.5%) |
| 1 or 2 Children | 4 (3.2%) | 4 (6.7%) |
| 3 or 4 Children | 0 (0.0%) | 0 (0.0%) |
| 5 or more Children | 0 (0.0%) | 7 (100.0%) |
| Total | 12 (3.6%) | 25 (18.9%) |
Race in Stephens City
The most populous races in Stephens City are White / Caucasian (1,433 | 68.0%), Hispanic or Latino (520 | 24.7%), and Two or more Races (333 | 15.8%).
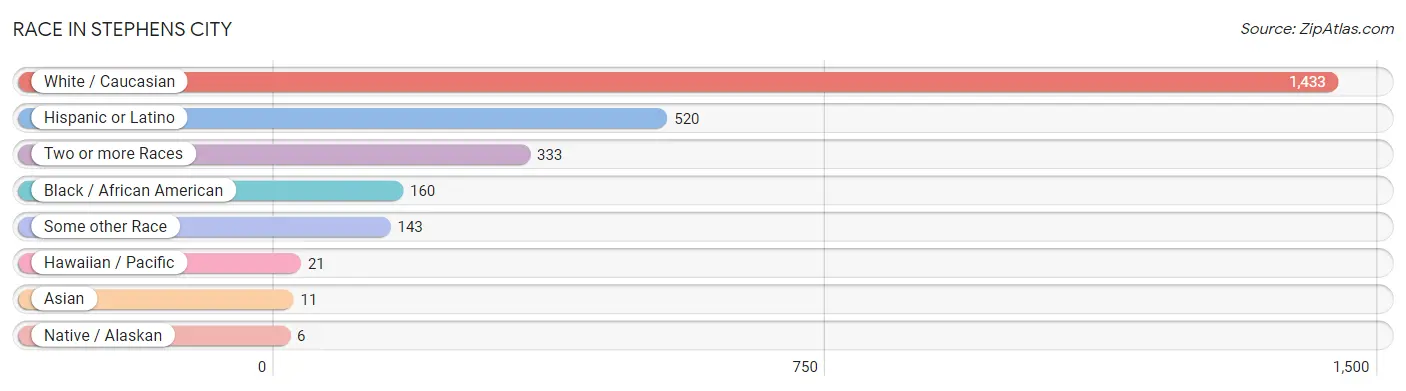
| Race | # Population | % Population |
| Asian | 11 | 0.5% |
| Black / African American | 160 | 7.6% |
| Hawaiian / Pacific | 21 | 1.0% |
| Hispanic or Latino | 520 | 24.7% |
| Native / Alaskan | 6 | 0.3% |
| White / Caucasian | 1,433 | 68.0% |
| Two or more Races | 333 | 15.8% |
| Some other Race | 143 | 6.8% |
| Total | 2,107 | 100.0% |
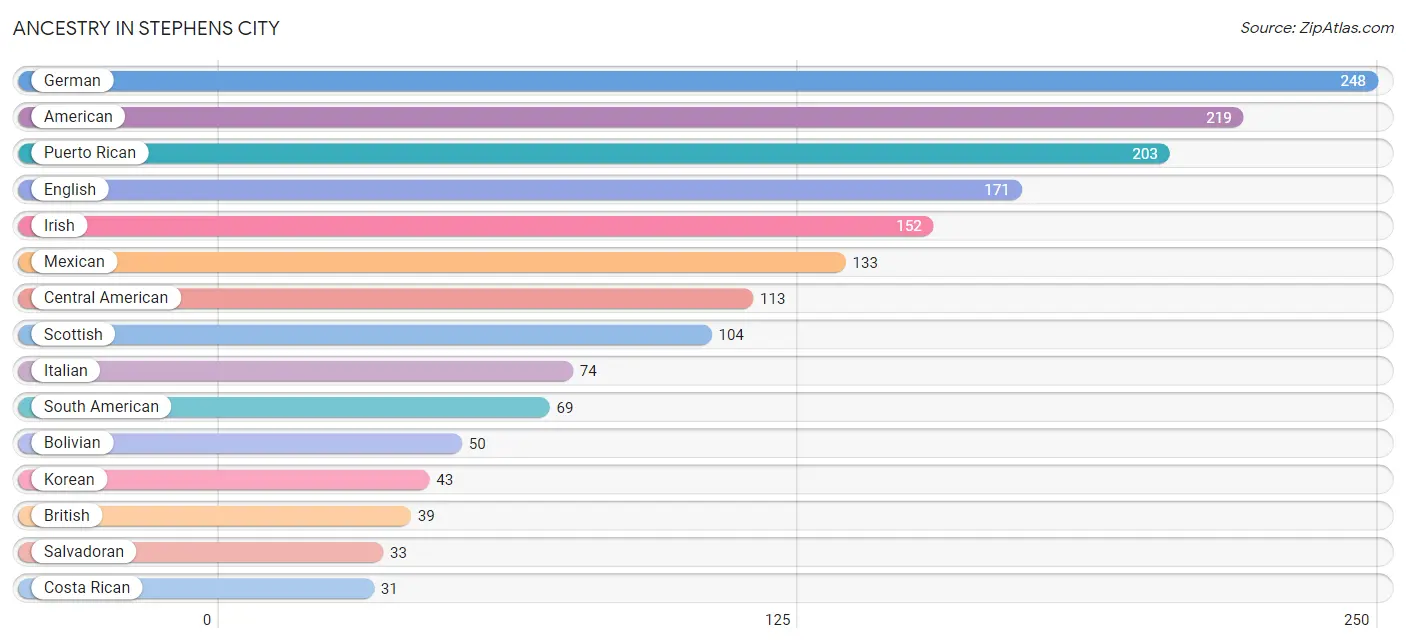
Ancestry in Stephens City
The most populous ancestries reported in Stephens City are German (248 | 11.8%), American (219 | 10.4%), Puerto Rican (203 | 9.6%), English (171 | 8.1%), and Irish (152 | 7.2%), together accounting for 47.1% of all Stephens City residents.
| Ancestry | # Population | % Population |
| African | 11 | 0.5% |
| American | 219 | 10.4% |
| Blackfeet | 1 | 0.1% |
| Bolivian | 50 | 2.4% |
| British | 39 | 1.8% |
| Burmese | 9 | 0.4% |
| Canadian | 3 | 0.1% |
| Celtic | 2 | 0.1% |
| Central American | 113 | 5.4% |
| Cherokee | 11 | 0.5% |
| Colombian | 12 | 0.6% |
| Costa Rican | 31 | 1.5% |
| Czech | 26 | 1.2% |
| Dominican | 2 | 0.1% |
| Dutch | 4 | 0.2% |
| Eastern European | 4 | 0.2% |
| Ecuadorian | 7 | 0.3% |
| English | 171 | 8.1% |
| European | 30 | 1.4% |
| French | 17 | 0.8% |
| French Canadian | 21 | 1.0% |
| German | 248 | 11.8% |
| Ghanaian | 10 | 0.5% |
| Greek | 9 | 0.4% |
| Guatemalan | 20 | 0.9% |
| Honduran | 29 | 1.4% |
| Iranian | 2 | 0.1% |
| Irish | 152 | 7.2% |
| Italian | 74 | 3.5% |
| Korean | 43 | 2.0% |
| Mexican | 133 | 6.3% |
| Polish | 21 | 1.0% |
| Puerto Rican | 203 | 9.6% |
| Russian | 3 | 0.1% |
| Salvadoran | 33 | 1.6% |
| Samoan | 21 | 1.0% |
| Scotch-Irish | 28 | 1.3% |
| Scottish | 104 | 4.9% |
| Slovak | 3 | 0.1% |
| South American | 69 | 3.3% |
| Subsaharan African | 24 | 1.1% |
| Swedish | 12 | 0.6% |
| Welsh | 15 | 0.7% |
| Zimbabwean | 3 | 0.1% | View All 44 Rows |
Immigrants in Stephens City
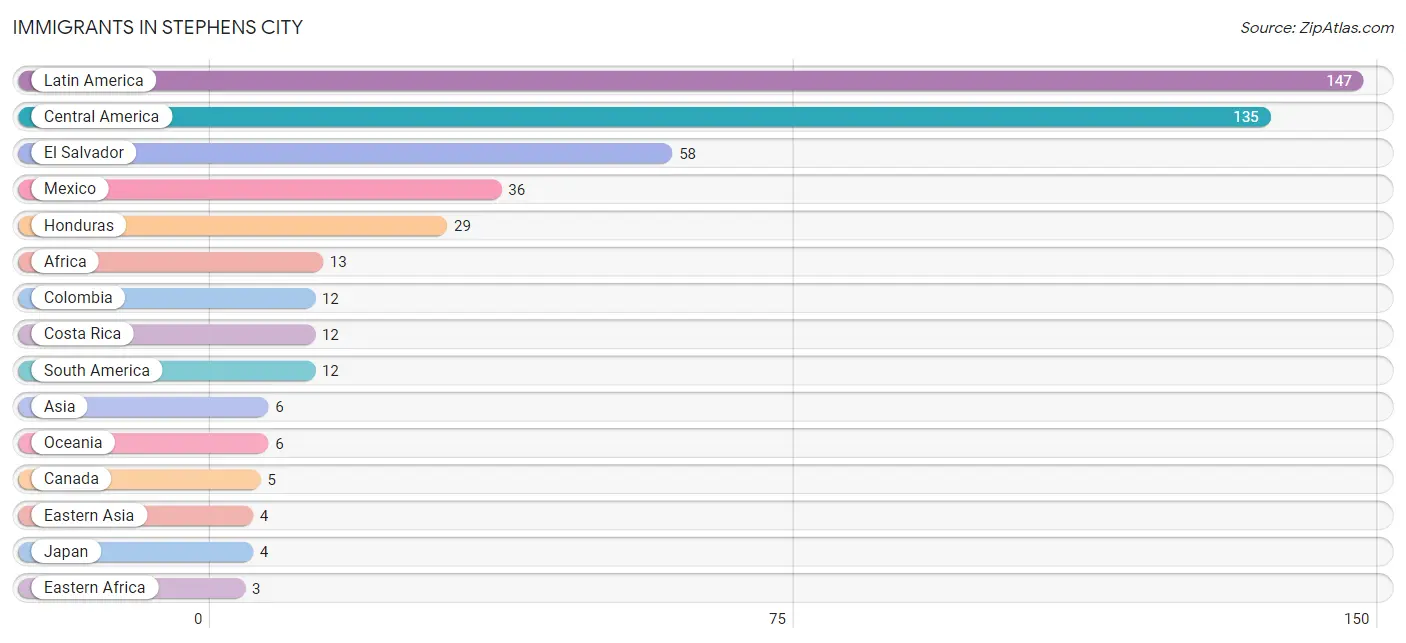
The most numerous immigrant groups reported in Stephens City came from Latin America (147 | 7.0%), Central America (135 | 6.4%), El Salvador (58 | 2.8%), Mexico (36 | 1.7%), and Honduras (29 | 1.4%), together accounting for 19.2% of all Stephens City residents.
| Immigration Origin | # Population | % Population |
| Africa | 13 | 0.6% |
| Asia | 6 | 0.3% |
| Canada | 5 | 0.2% |
| Central America | 135 | 6.4% |
| Colombia | 12 | 0.6% |
| Costa Rica | 12 | 0.6% |
| Eastern Africa | 3 | 0.1% |
| Eastern Asia | 4 | 0.2% |
| El Salvador | 58 | 2.8% |
| Honduras | 29 | 1.4% |
| Iran | 2 | 0.1% |
| Japan | 4 | 0.2% |
| Latin America | 147 | 7.0% |
| Mexico | 36 | 1.7% |
| Oceania | 6 | 0.3% |
| South America | 12 | 0.6% |
| South Central Asia | 2 | 0.1% |
| Zimbabwe | 3 | 0.1% | View All 18 Rows |
Sex and Age in Stephens City
Sex and Age in Stephens City
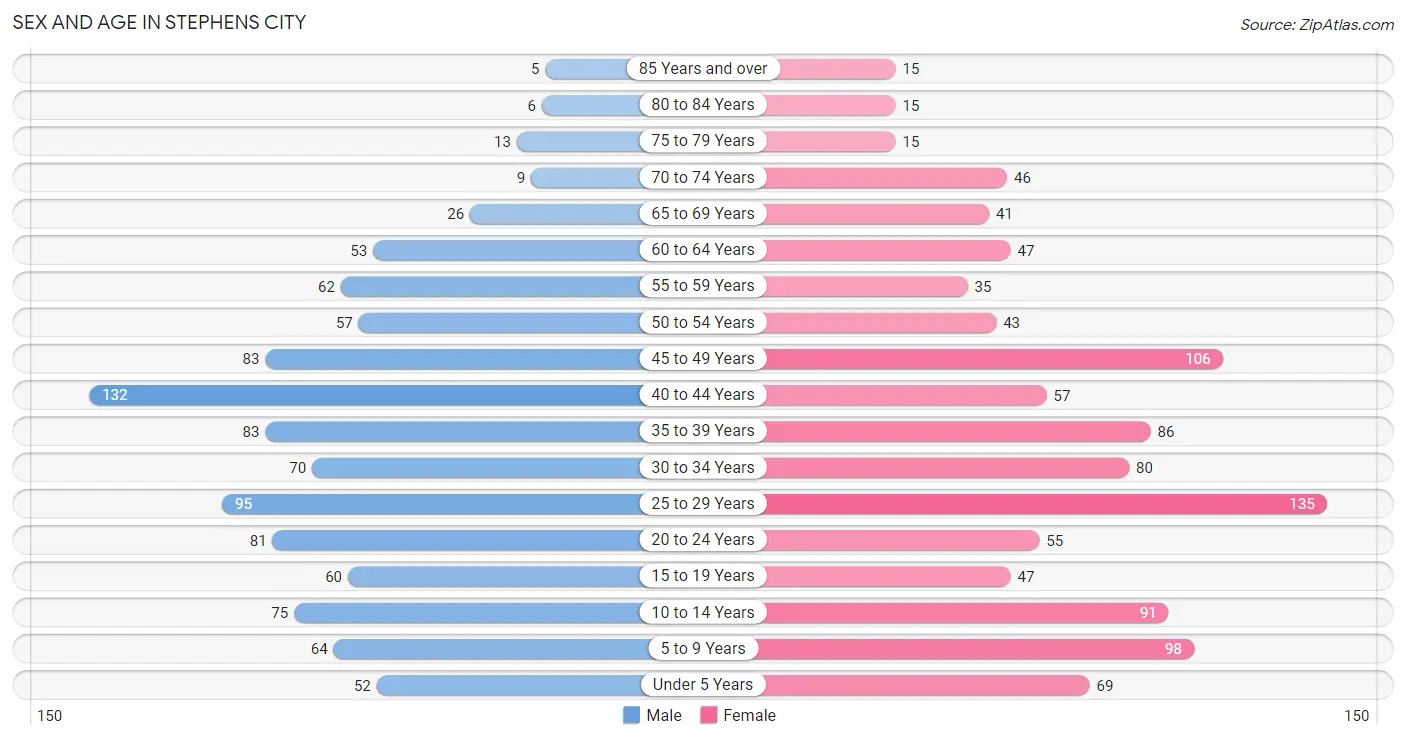
The most populous age groups in Stephens City are 40 to 44 Years (132 | 12.9%) for men and 25 to 29 Years (135 | 12.5%) for women.
| Age Bracket | Male | Female |
| Under 5 Years | 52 (5.1%) | 69 (6.4%) |
| 5 to 9 Years | 64 (6.2%) | 98 (9.1%) |
| 10 to 14 Years | 75 (7.3%) | 91 (8.4%) |
| 15 to 19 Years | 60 (5.9%) | 47 (4.3%) |
| 20 to 24 Years | 81 (7.9%) | 55 (5.1%) |
| 25 to 29 Years | 95 (9.3%) | 135 (12.5%) |
| 30 to 34 Years | 70 (6.8%) | 80 (7.4%) |
| 35 to 39 Years | 83 (8.1%) | 86 (8.0%) |
| 40 to 44 Years | 132 (12.9%) | 57 (5.3%) |
| 45 to 49 Years | 83 (8.1%) | 106 (9.8%) |
| 50 to 54 Years | 57 (5.6%) | 43 (4.0%) |
| 55 to 59 Years | 62 (6.0%) | 35 (3.2%) |
| 60 to 64 Years | 53 (5.2%) | 47 (4.3%) |
| 65 to 69 Years | 26 (2.5%) | 41 (3.8%) |
| 70 to 74 Years | 9 (0.9%) | 46 (4.3%) |
| 75 to 79 Years | 13 (1.3%) | 15 (1.4%) |
| 80 to 84 Years | 6 (0.6%) | 15 (1.4%) |
| 85 Years and over | 5 (0.5%) | 15 (1.4%) |
| Total | 1,026 (100.0%) | 1,081 (100.0%) |
Families and Households in Stephens City
Median Family Size in Stephens City
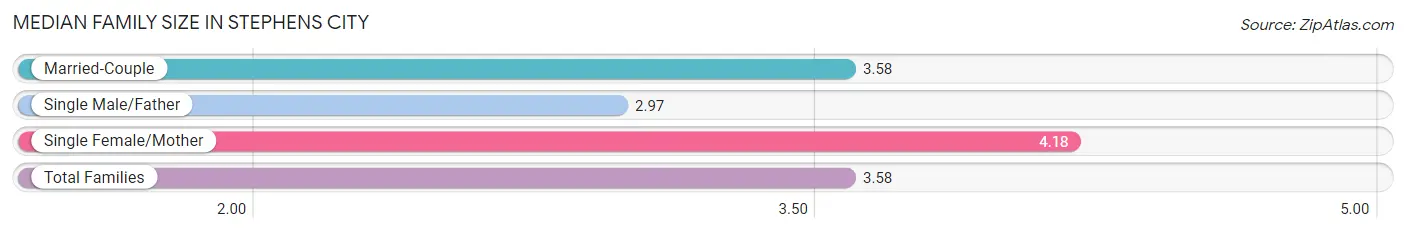
The median family size in Stephens City is 3.58 persons per family, with single female/mother families (66 | 14.3%) accounting for the largest median family size of 4.18 persons per family. On the other hand, single male/father families (66 | 14.3%) represent the smallest median family size with 2.97 persons per family.
| Family Type | # Families | Family Size |
| Married-Couple | 330 (71.4%) | 3.58 |
| Single Male/Father | 66 (14.3%) | 2.97 |
| Single Female/Mother | 66 (14.3%) | 4.18 |
| Total Families | 462 (100.0%) | 3.58 |
Median Household Size in Stephens City
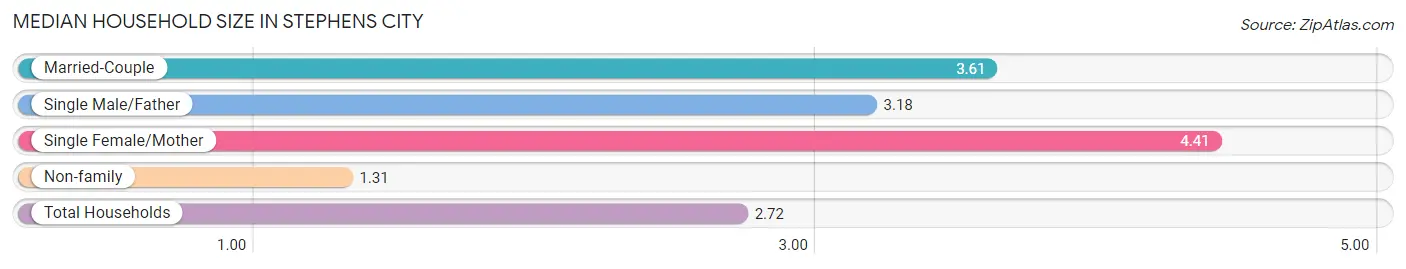
The median household size in Stephens City is 2.72 persons per household, with single female/mother households (66 | 8.5%) accounting for the largest median household size of 4.41 persons per household. non-family households (312 | 40.3%) represent the smallest median household size with 1.31 persons per household.
| Household Type | # Households | Household Size |
| Married-Couple | 330 (42.6%) | 3.61 |
| Single Male/Father | 66 (8.5%) | 3.18 |
| Single Female/Mother | 66 (8.5%) | 4.41 |
| Non-family | 312 (40.3%) | 1.31 |
| Total Households | 774 (100.0%) | 2.72 |
Household Size by Marriage Status in Stephens City
Out of a total of 774 households in Stephens City, 462 (59.7%) are family households, while 312 (40.3%) are nonfamily households. The most numerous type of family households are 2-person households, comprising 152, and the most common type of nonfamily households are 1-person households, comprising 233.
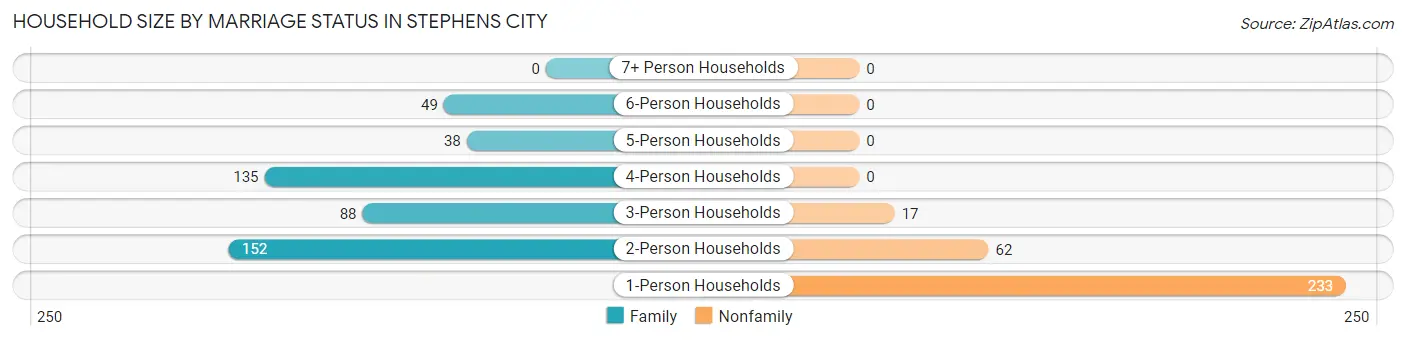
| Household Size | Family Households | Nonfamily Households |
| 1-Person Households | - | 233 (30.1%) |
| 2-Person Households | 152 (19.6%) | 62 (8.0%) |
| 3-Person Households | 88 (11.4%) | 17 (2.2%) |
| 4-Person Households | 135 (17.4%) | 0 (0.0%) |
| 5-Person Households | 38 (4.9%) | 0 (0.0%) |
| 6-Person Households | 49 (6.3%) | 0 (0.0%) |
| 7+ Person Households | 0 (0.0%) | 0 (0.0%) |
| Total | 462 (59.7%) | 312 (40.3%) |
Female Fertility in Stephens City
Fertility by Age in Stephens City
Average fertility rate in Stephens City is 53.0 births per 1,000 women. Women in the age bracket of 20 to 34 years have the highest fertility rate with 89.0 births per 1,000 women. Women in the age bracket of 20 to 34 years acount for 77.4% of all women with births.
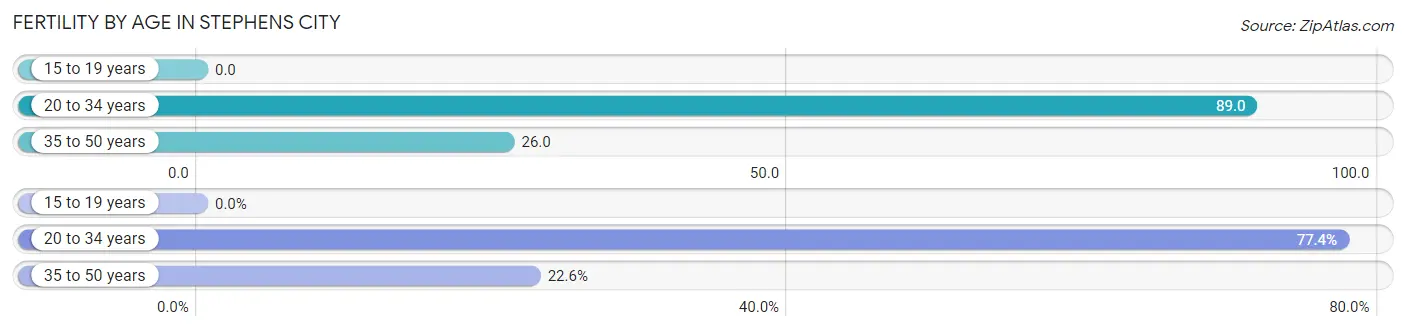
| Age Bracket | Women with Births | Births / 1,000 Women |
| 15 to 19 years | 0 (0.0%) | 0.0 |
| 20 to 34 years | 24 (77.4%) | 89.0 |
| 35 to 50 years | 7 (22.6%) | 26.0 |
| Total | 31 (100.0%) | 53.0 |
Fertility by Age by Marriage Status in Stephens City
41.9% of women with births (31) in Stephens City are married. The highest percentage of unmarried women with births falls into 35 to 50 years age bracket with 100.0% of them unmarried at the time of birth, while the lowest percentage of unmarried women with births belong to 20 to 34 years age bracket with 45.8% of them unmarried.
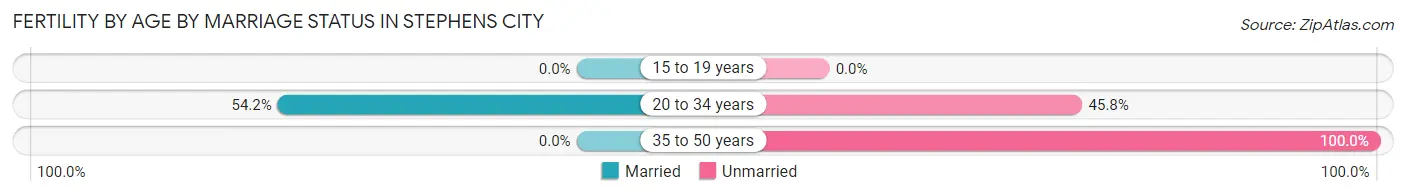
| Age Bracket | Married | Unmarried |
| 15 to 19 years | 0 (0.0%) | 0 (0.0%) |
| 20 to 34 years | 13 (54.2%) | 11 (45.8%) |
| 35 to 50 years | 0 (0.0%) | 7 (100.0%) |
| Total | 13 (41.9%) | 18 (58.1%) |
Fertility by Education in Stephens City
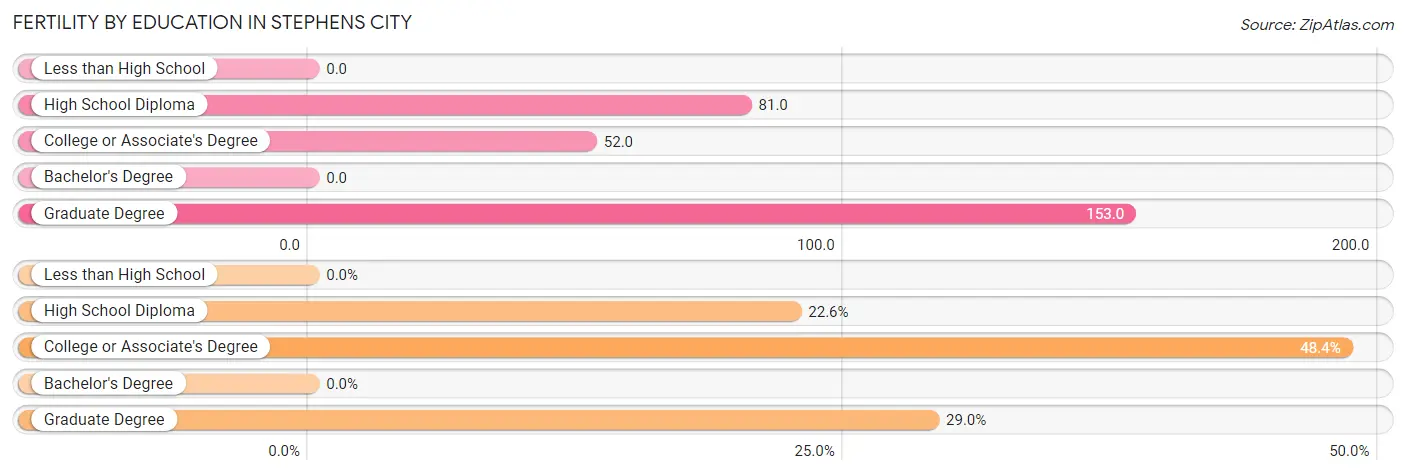
| Educational Attainment | Women with Births | Births / 1,000 Women |
| Less than High School | 0 (0.0%) | 0.0 |
| High School Diploma | 7 (22.6%) | 81.0 |
| College or Associate's Degree | 15 (48.4%) | 52.0 |
| Bachelor's Degree | 0 (0.0%) | 0.0 |
| Graduate Degree | 9 (29.0%) | 153.0 |
| Total | 31 (100.0%) | 53.0 |
Fertility by Education by Marriage Status in Stephens City
58.1% of women with births in Stephens City are unmarried. Women with the educational attainment of graduate degree are most likely to be married with 100.0% of them married at childbirth, while women with the educational attainment of high school diploma are least likely to be married with 100.0% of them unmarried at childbirth.
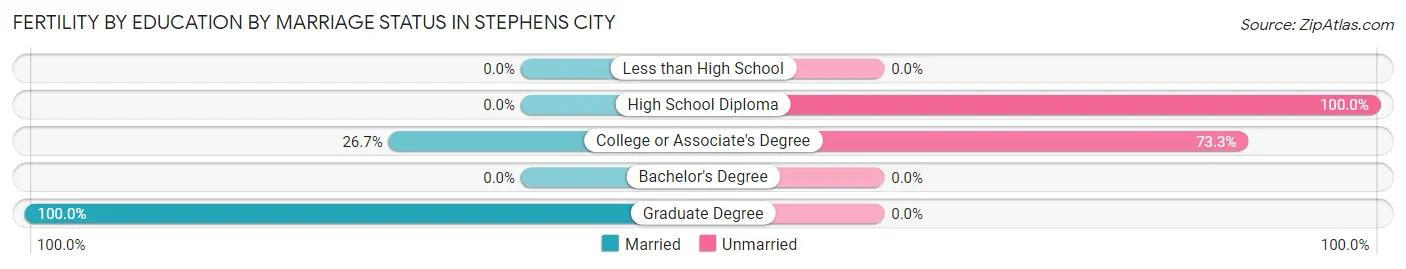
| Educational Attainment | Married | Unmarried |
| Less than High School | 0 (0.0%) | 0 (0.0%) |
| High School Diploma | 0 (0.0%) | 7 (100.0%) |
| College or Associate's Degree | 4 (26.7%) | 11 (73.3%) |
| Bachelor's Degree | 0 (0.0%) | 0 (0.0%) |
| Graduate Degree | 9 (100.0%) | 0 (0.0%) |
| Total | 13 (41.9%) | 18 (58.1%) |
Employment Characteristics in Stephens City
Employment by Class of Employer in Stephens City
Among the 1,228 employed individuals in Stephens City, private company employees (845 | 68.8%), local government employees (118 | 9.6%), and not-for-profit organizations (101 | 8.2%) make up the most common classes of employment.
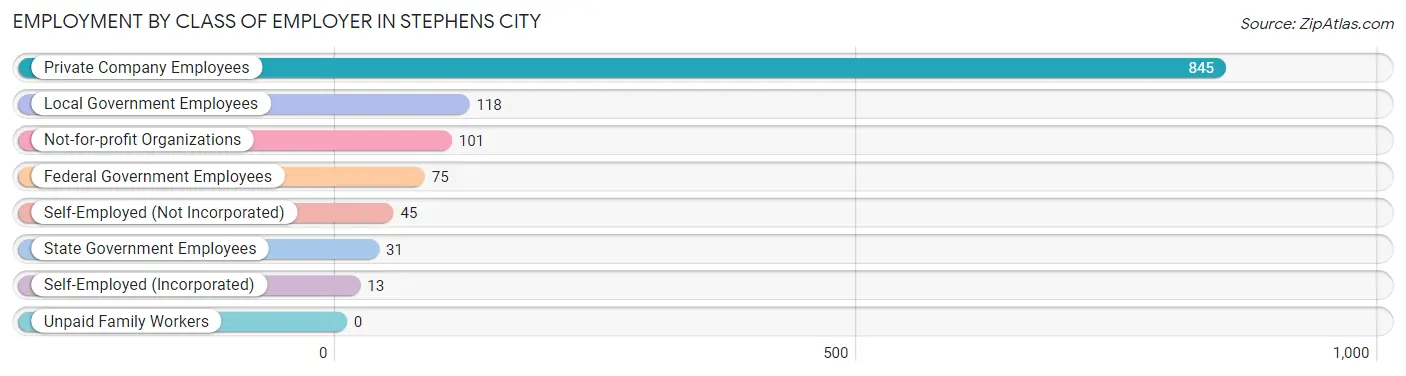
| Employer Class | # Employees | % Employees |
| Private Company Employees | 845 | 68.8% |
| Self-Employed (Incorporated) | 13 | 1.1% |
| Self-Employed (Not Incorporated) | 45 | 3.7% |
| Not-for-profit Organizations | 101 | 8.2% |
| Local Government Employees | 118 | 9.6% |
| State Government Employees | 31 | 2.5% |
| Federal Government Employees | 75 | 6.1% |
| Unpaid Family Workers | 0 | 0.0% |
| Total | 1,228 | 100.0% |
Employment Status by Age in Stephens City
According to the labor force statistics for Stephens City, out of the total population over 16 years of age (1,604), 79.2% or 1,270 individuals are in the labor force, with 3.4% or 43 of them unemployed. The age group with the highest labor force participation rate is 30 to 34 years, with 98.0% or 147 individuals in the labor force. Within the labor force, the 55 to 59 years age range has the highest percentage of unemployed individuals, with 11.8% or 10 of them being unemployed.
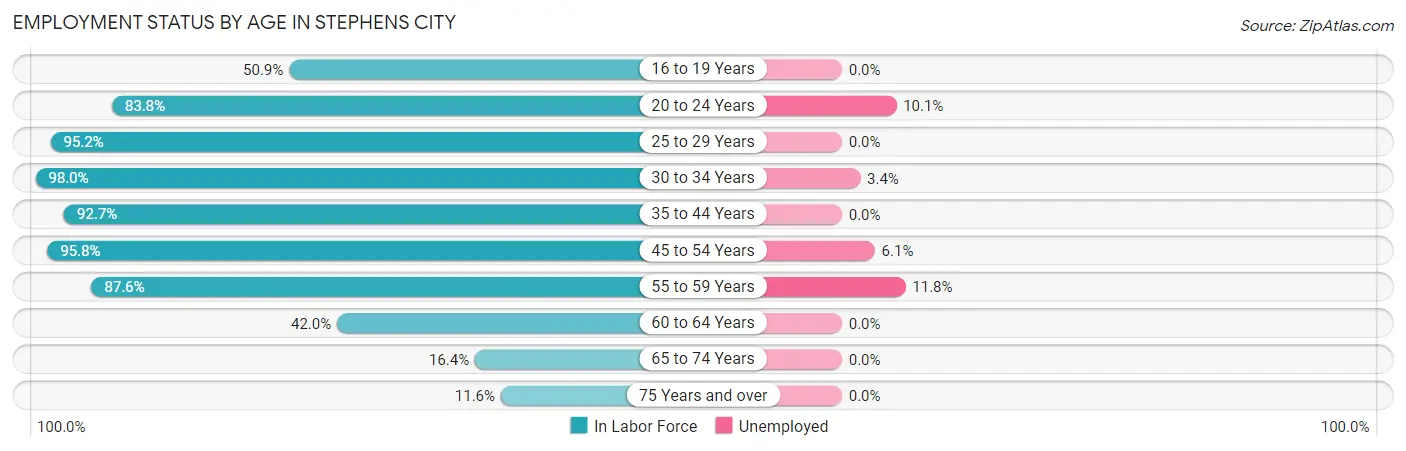
| Age Bracket | In Labor Force | Unemployed |
| 16 to 19 Years | 27 (50.9%) | 0 (0.0%) |
| 20 to 24 Years | 114 (83.8%) | 12 (10.1%) |
| 25 to 29 Years | 219 (95.2%) | 0 (0.0%) |
| 30 to 34 Years | 147 (98.0%) | 5 (3.4%) |
| 35 to 44 Years | 332 (92.7%) | 0 (0.0%) |
| 45 to 54 Years | 277 (95.8%) | 17 (6.1%) |
| 55 to 59 Years | 85 (87.6%) | 10 (11.8%) |
| 60 to 64 Years | 42 (42.0%) | 0 (0.0%) |
| 65 to 74 Years | 20 (16.4%) | 0 (0.0%) |
| 75 Years and over | 8 (11.6%) | 0 (0.0%) |
| Total | 1,270 (79.2%) | 43 (3.4%) |
Employment Status by Educational Attainment in Stephens City
According to labor force statistics for Stephens City, 90.0% of individuals (1,102) out of the total population between 25 and 64 years of age (1,224) are in the labor force, with 2.9% or 32 of them being unemployed. The group with the highest labor force participation rate are those with the educational attainment of bachelor's degree or higher, with 94.6% or 347 individuals in the labor force. Within the labor force, individuals with college / associate degree education have the highest percentage of unemployment, with 5.1% or 23 of them being unemployed.
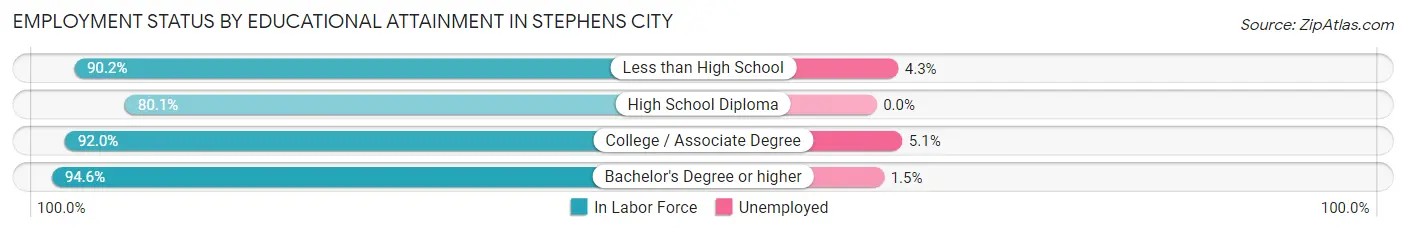
| Educational Attainment | In Labor Force | Unemployed |
| Less than High School | 92 (90.2%) | 4 (4.3%) |
| High School Diploma | 213 (80.1%) | 0 (0.0%) |
| College / Associate Degree | 450 (92.0%) | 25 (5.1%) |
| Bachelor's Degree or higher | 347 (94.6%) | 6 (1.5%) |
| Total | 1,102 (90.0%) | 35 (2.9%) |
Employment Occupations by Sex in Stephens City
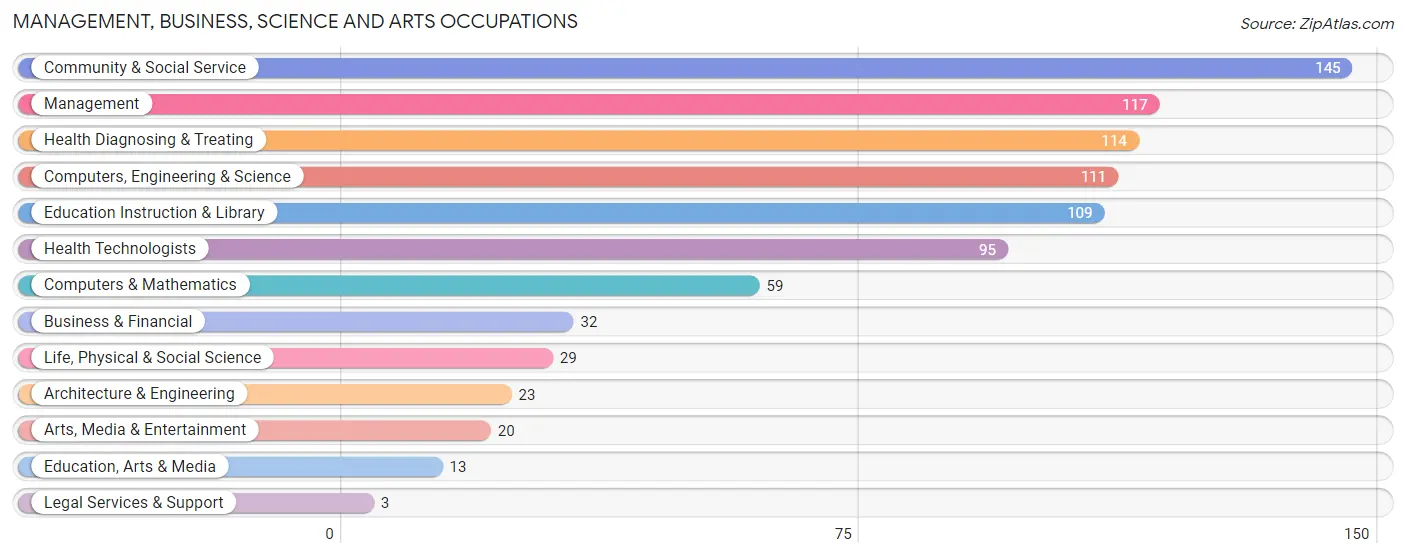
Management, Business, Science and Arts Occupations
The most common Management, Business, Science and Arts occupations in Stephens City are Community & Social Service (145 | 11.9%), Management (117 | 9.6%), Health Diagnosing & Treating (114 | 9.3%), Computers, Engineering & Science (111 | 9.1%), and Education Instruction & Library (109 | 8.9%).
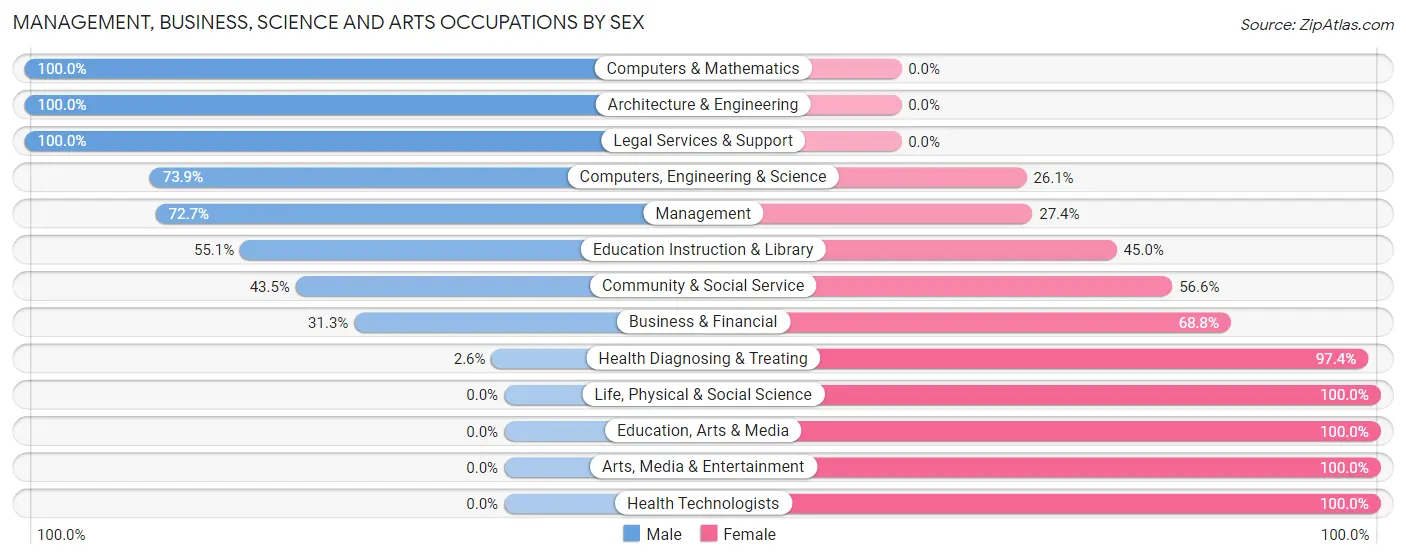
Management, Business, Science and Arts Occupations by Sex
Within the Management, Business, Science and Arts occupations in Stephens City, the most male-oriented occupations are Computers & Mathematics (100.0%), Architecture & Engineering (100.0%), and Legal Services & Support (100.0%), while the most female-oriented occupations are Life, Physical & Social Science (100.0%), Education, Arts & Media (100.0%), and Arts, Media & Entertainment (100.0%).
| Occupation | Male | Female |
| Management | 85 (72.7%) | 32 (27.4%) |
| Business & Financial | 10 (31.2%) | 22 (68.8%) |
| Computers, Engineering & Science | 82 (73.9%) | 29 (26.1%) |
| Computers & Mathematics | 59 (100.0%) | 0 (0.0%) |
| Architecture & Engineering | 23 (100.0%) | 0 (0.0%) |
| Life, Physical & Social Science | 0 (0.0%) | 29 (100.0%) |
| Community & Social Service | 63 (43.4%) | 82 (56.6%) |
| Education, Arts & Media | 0 (0.0%) | 13 (100.0%) |
| Legal Services & Support | 3 (100.0%) | 0 (0.0%) |
| Education Instruction & Library | 60 (55.0%) | 49 (45.0%) |
| Arts, Media & Entertainment | 0 (0.0%) | 20 (100.0%) |
| Health Diagnosing & Treating | 3 (2.6%) | 111 (97.4%) |
| Health Technologists | 0 (0.0%) | 95 (100.0%) |
| Total (Category) | 243 (46.8%) | 276 (53.2%) |
| Total (Overall) | 596 (48.8%) | 624 (51.1%) |
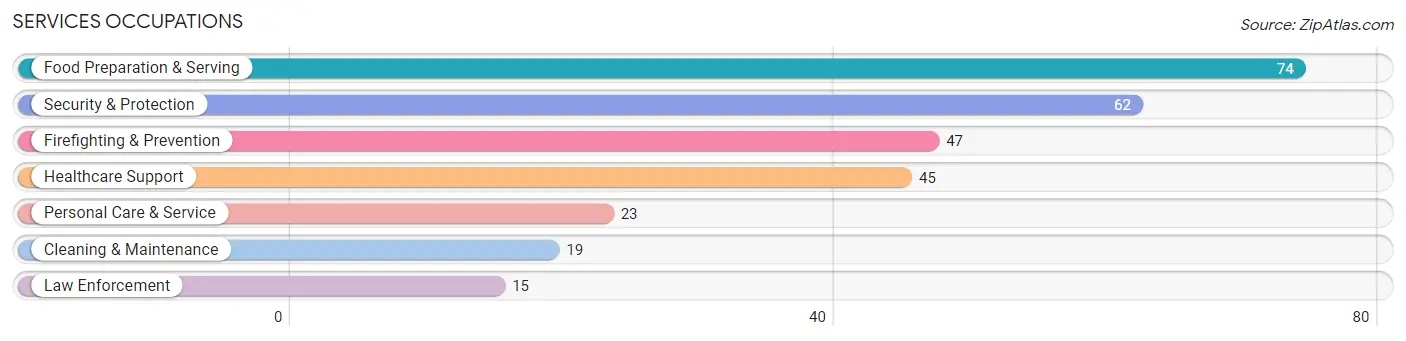
Services Occupations
The most common Services occupations in Stephens City are Food Preparation & Serving (74 | 6.1%), Security & Protection (62 | 5.1%), Firefighting & Prevention (47 | 3.8%), Healthcare Support (45 | 3.7%), and Personal Care & Service (23 | 1.9%).
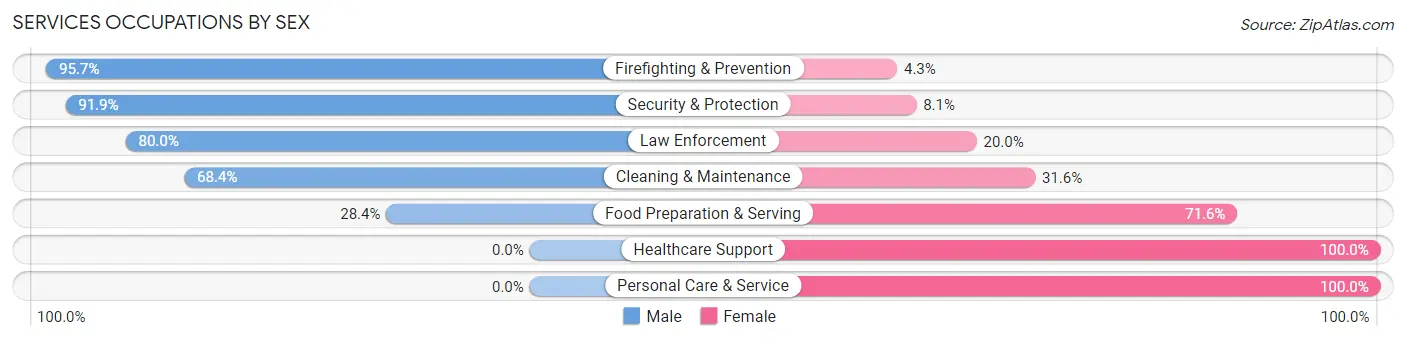
Services Occupations by Sex
Within the Services occupations in Stephens City, the most male-oriented occupations are Firefighting & Prevention (95.7%), Security & Protection (91.9%), and Law Enforcement (80.0%), while the most female-oriented occupations are Healthcare Support (100.0%), Personal Care & Service (100.0%), and Food Preparation & Serving (71.6%).
| Occupation | Male | Female |
| Healthcare Support | 0 (0.0%) | 45 (100.0%) |
| Security & Protection | 57 (91.9%) | 5 (8.1%) |
| Firefighting & Prevention | 45 (95.7%) | 2 (4.3%) |
| Law Enforcement | 12 (80.0%) | 3 (20.0%) |
| Food Preparation & Serving | 21 (28.4%) | 53 (71.6%) |
| Cleaning & Maintenance | 13 (68.4%) | 6 (31.6%) |
| Personal Care & Service | 0 (0.0%) | 23 (100.0%) |
| Total (Category) | 91 (40.8%) | 132 (59.2%) |
| Total (Overall) | 596 (48.8%) | 624 (51.1%) |
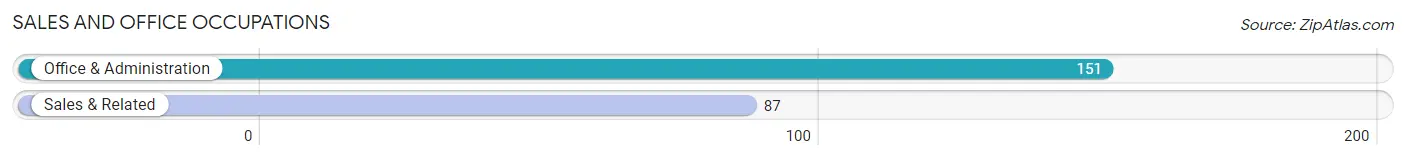
Sales and Office Occupations
The most common Sales and Office occupations in Stephens City are Office & Administration (151 | 12.4%), and Sales & Related (87 | 7.1%).
Sales and Office Occupations by Sex
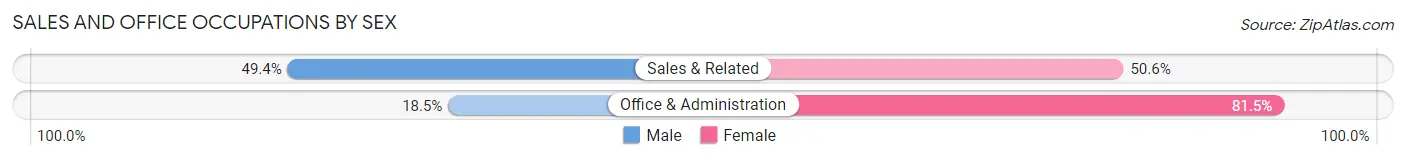
| Occupation | Male | Female |
| Sales & Related | 43 (49.4%) | 44 (50.6%) |
| Office & Administration | 28 (18.5%) | 123 (81.5%) |
| Total (Category) | 71 (29.8%) | 167 (70.2%) |
| Total (Overall) | 596 (48.8%) | 624 (51.1%) |
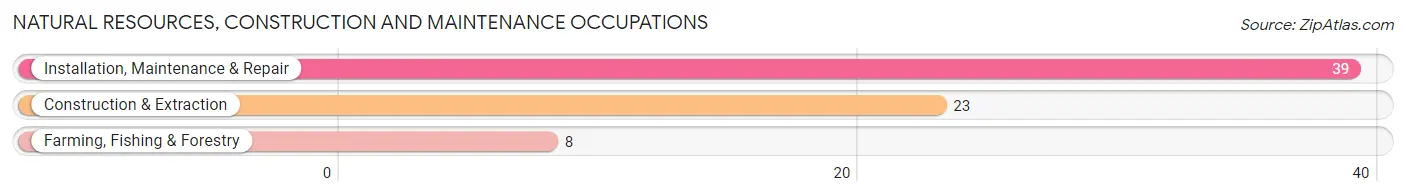
Natural Resources, Construction and Maintenance Occupations
The most common Natural Resources, Construction and Maintenance occupations in Stephens City are Installation, Maintenance & Repair (39 | 3.2%), Construction & Extraction (23 | 1.9%), and Farming, Fishing & Forestry (8 | 0.7%).
Natural Resources, Construction and Maintenance Occupations by Sex
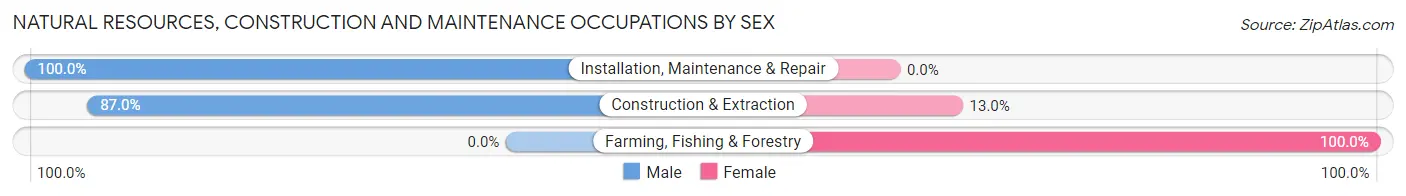
| Occupation | Male | Female |
| Farming, Fishing & Forestry | 0 (0.0%) | 8 (100.0%) |
| Construction & Extraction | 20 (87.0%) | 3 (13.0%) |
| Installation, Maintenance & Repair | 39 (100.0%) | 0 (0.0%) |
| Total (Category) | 59 (84.3%) | 11 (15.7%) |
| Total (Overall) | 596 (48.8%) | 624 (51.1%) |
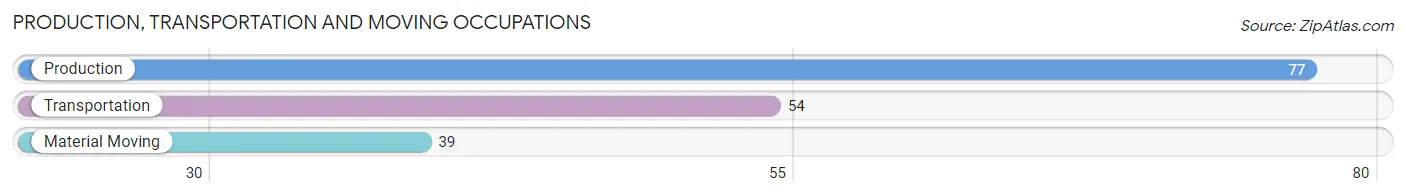
Production, Transportation and Moving Occupations
The most common Production, Transportation and Moving occupations in Stephens City are Production (77 | 6.3%), Transportation (54 | 4.4%), and Material Moving (39 | 3.2%).
Production, Transportation and Moving Occupations by Sex
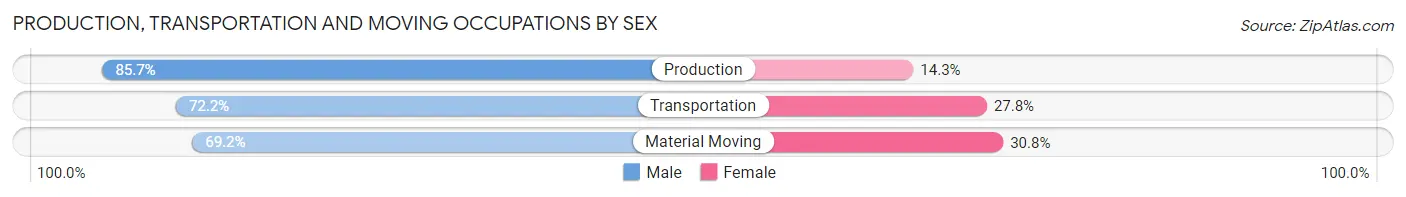
| Occupation | Male | Female |
| Production | 66 (85.7%) | 11 (14.3%) |
| Transportation | 39 (72.2%) | 15 (27.8%) |
| Material Moving | 27 (69.2%) | 12 (30.8%) |
| Total (Category) | 132 (77.6%) | 38 (22.4%) |
| Total (Overall) | 596 (48.8%) | 624 (51.1%) |
Employment Industries by Sex in Stephens City
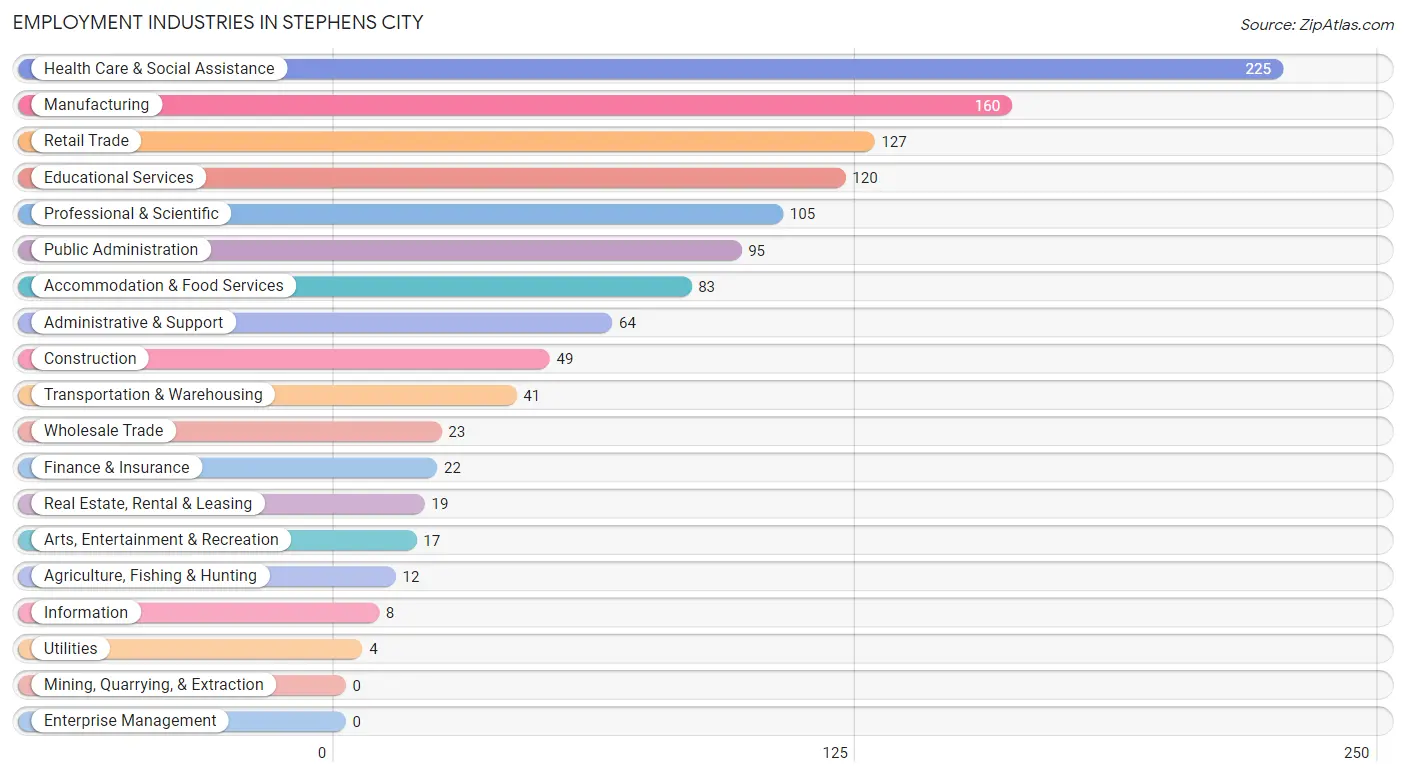
Employment Industries in Stephens City
The major employment industries in Stephens City include Health Care & Social Assistance (225 | 18.4%), Manufacturing (160 | 13.1%), Retail Trade (127 | 10.4%), Educational Services (120 | 9.8%), and Professional & Scientific (105 | 8.6%).
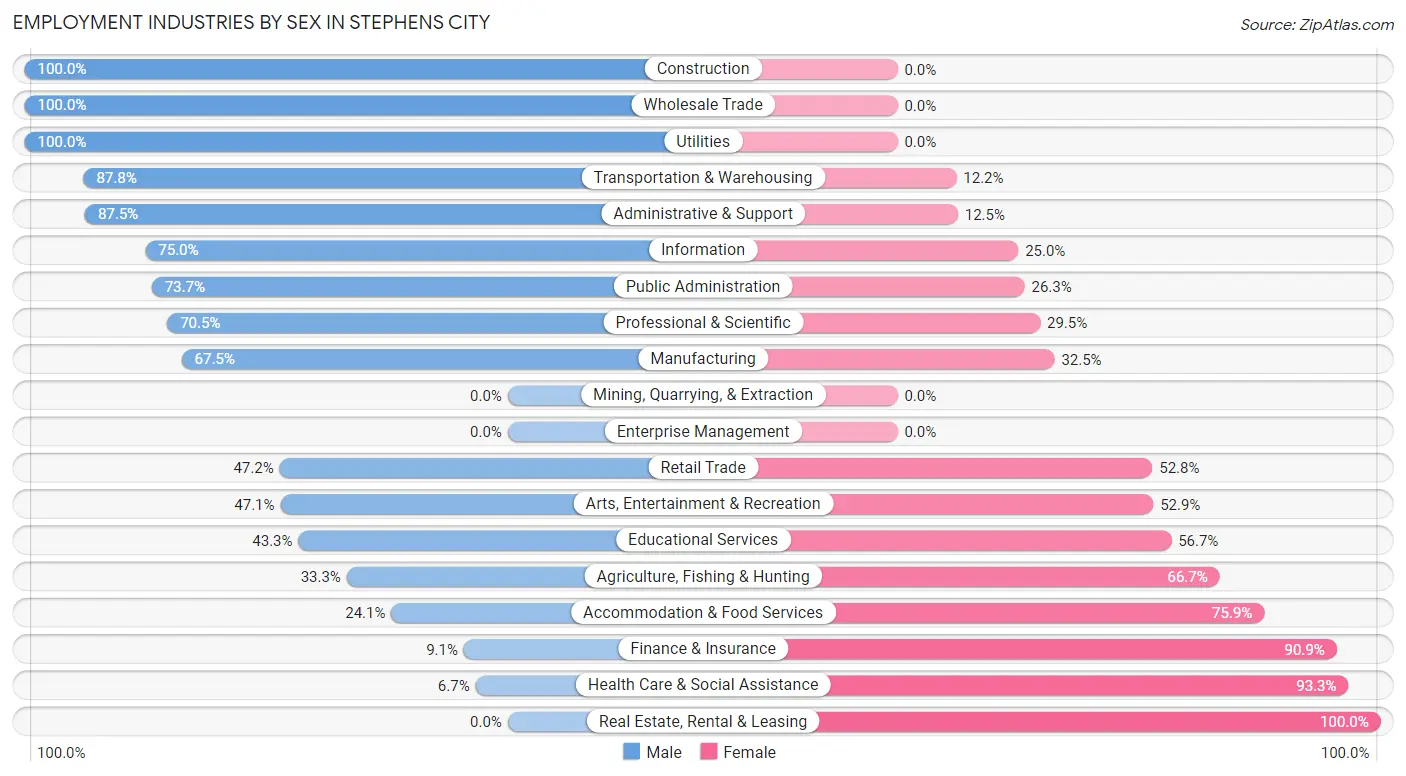
Employment Industries by Sex in Stephens City
The Stephens City industries that see more men than women are Construction (100.0%), Wholesale Trade (100.0%), and Utilities (100.0%), whereas the industries that tend to have a higher number of women are Real Estate, Rental & Leasing (100.0%), Health Care & Social Assistance (93.3%), and Finance & Insurance (90.9%).
| Industry | Male | Female |
| Agriculture, Fishing & Hunting | 4 (33.3%) | 8 (66.7%) |
| Mining, Quarrying, & Extraction | 0 (0.0%) | 0 (0.0%) |
| Construction | 49 (100.0%) | 0 (0.0%) |
| Manufacturing | 108 (67.5%) | 52 (32.5%) |
| Wholesale Trade | 23 (100.0%) | 0 (0.0%) |
| Retail Trade | 60 (47.2%) | 67 (52.8%) |
| Transportation & Warehousing | 36 (87.8%) | 5 (12.2%) |
| Utilities | 4 (100.0%) | 0 (0.0%) |
| Information | 6 (75.0%) | 2 (25.0%) |
| Finance & Insurance | 2 (9.1%) | 20 (90.9%) |
| Real Estate, Rental & Leasing | 0 (0.0%) | 19 (100.0%) |
| Professional & Scientific | 74 (70.5%) | 31 (29.5%) |
| Enterprise Management | 0 (0.0%) | 0 (0.0%) |
| Administrative & Support | 56 (87.5%) | 8 (12.5%) |
| Educational Services | 52 (43.3%) | 68 (56.7%) |
| Health Care & Social Assistance | 15 (6.7%) | 210 (93.3%) |
| Arts, Entertainment & Recreation | 8 (47.1%) | 9 (52.9%) |
| Accommodation & Food Services | 20 (24.1%) | 63 (75.9%) |
| Public Administration | 70 (73.7%) | 25 (26.3%) |
| Total | 596 (48.8%) | 624 (51.1%) |
Education in Stephens City
School Enrollment in Stephens City
The most common levels of schooling among the 600 students in Stephens City are middle school (151 | 25.2%), elementary school (106 | 17.7%), and graduate / professional (97 | 16.2%).
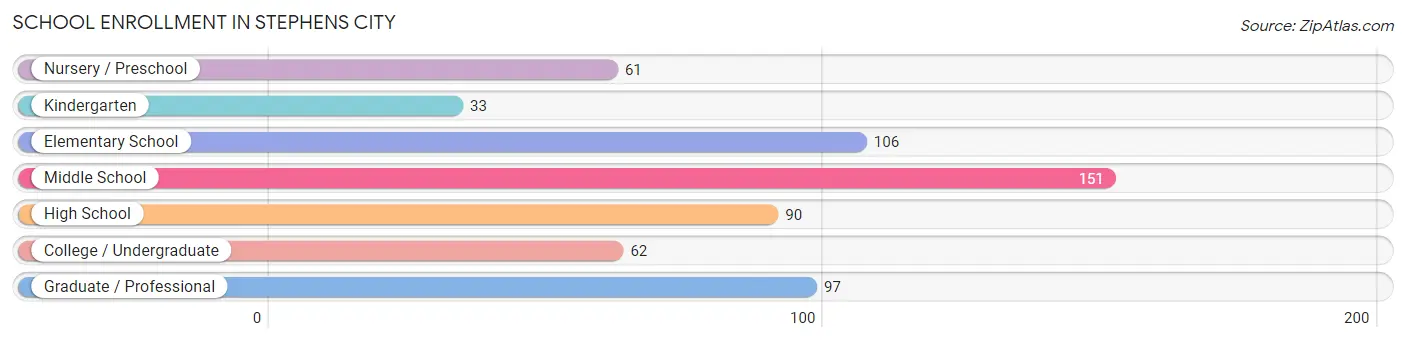
| School Level | # Students | % Students |
| Nursery / Preschool | 61 | 10.2% |
| Kindergarten | 33 | 5.5% |
| Elementary School | 106 | 17.7% |
| Middle School | 151 | 25.2% |
| High School | 90 | 15.0% |
| College / Undergraduate | 62 | 10.3% |
| Graduate / Professional | 97 | 16.2% |
| Total | 600 | 100.0% |
School Enrollment by Age by Funding Source in Stephens City
Out of a total of 600 students who are enrolled in schools in Stephens City, 168 (28.0%) attend a private institution, while the remaining 432 (72.0%) are enrolled in public schools. The age group of 35 years and over has the highest likelihood of being enrolled in private schools, with 31 (86.1% in the age bracket) enrolled. Conversely, the age group of 18 to 19 year olds has the lowest likelihood of being enrolled in a private school, with 10 (100.0% in the age bracket) attending a public institution.
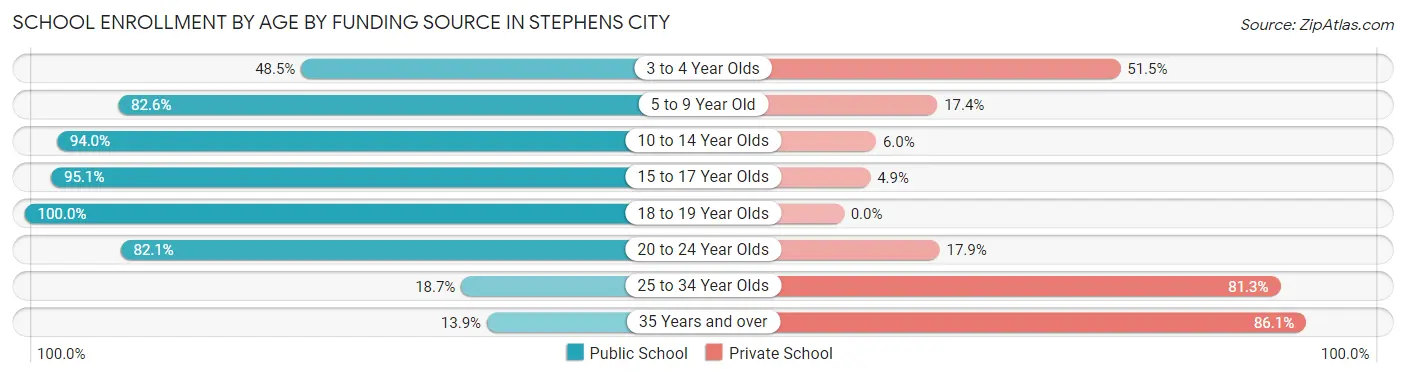
| Age Bracket | Public School | Private School |
| 3 to 4 Year Olds | 16 (48.5%) | 17 (51.5%) |
| 5 to 9 Year Old | 128 (82.6%) | 27 (17.4%) |
| 10 to 14 Year Olds | 156 (94.0%) | 10 (6.0%) |
| 15 to 17 Year Olds | 77 (95.1%) | 4 (4.9%) |
| 18 to 19 Year Olds | 10 (100.0%) | 0 (0.0%) |
| 20 to 24 Year Olds | 23 (82.1%) | 5 (17.9%) |
| 25 to 34 Year Olds | 17 (18.7%) | 74 (81.3%) |
| 35 Years and over | 5 (13.9%) | 31 (86.1%) |
| Total | 432 (72.0%) | 168 (28.0%) |
Educational Attainment by Field of Study in Stephens City
Education (85 | 18.8%), business (50 | 11.0%), computers & mathematics (49 | 10.8%), bio, nature & agricultural (45 | 9.9%), and social sciences (44 | 9.7%) are the most common fields of study among 453 individuals in Stephens City who have obtained a bachelor's degree or higher.
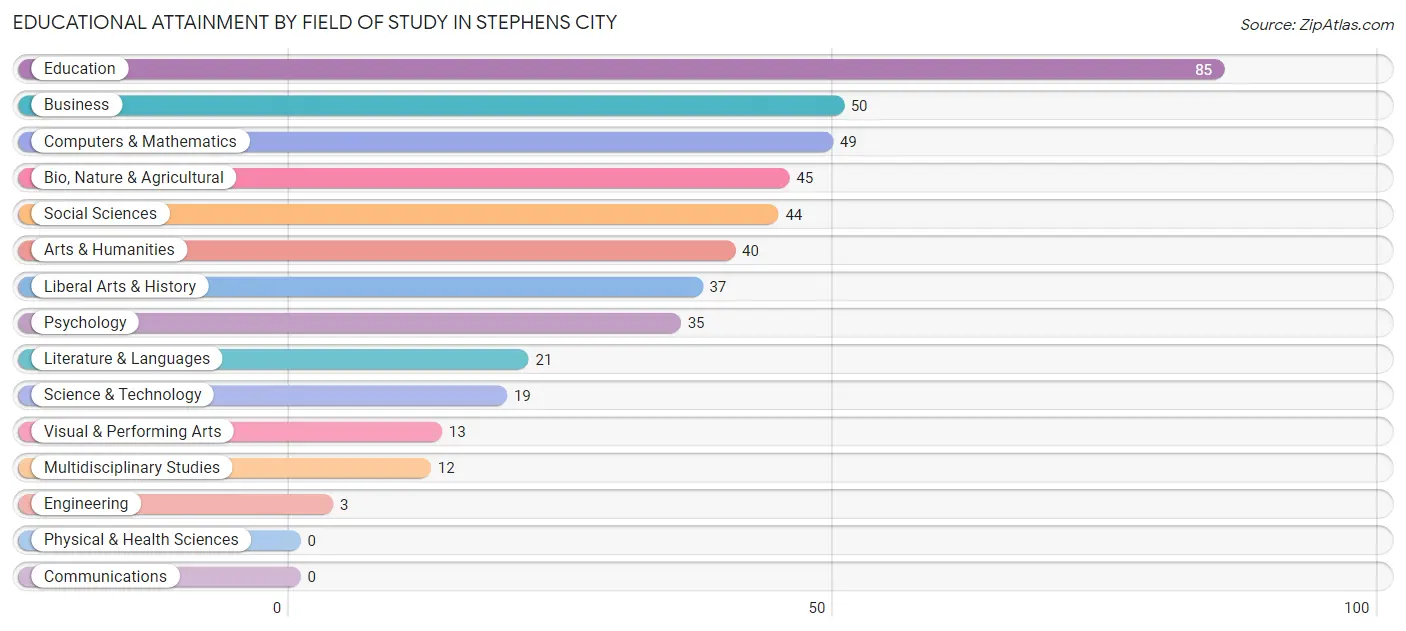
| Field of Study | # Graduates | % Graduates |
| Computers & Mathematics | 49 | 10.8% |
| Bio, Nature & Agricultural | 45 | 9.9% |
| Physical & Health Sciences | 0 | 0.0% |
| Psychology | 35 | 7.7% |
| Social Sciences | 44 | 9.7% |
| Engineering | 3 | 0.7% |
| Multidisciplinary Studies | 12 | 2.6% |
| Science & Technology | 19 | 4.2% |
| Business | 50 | 11.0% |
| Education | 85 | 18.8% |
| Literature & Languages | 21 | 4.6% |
| Liberal Arts & History | 37 | 8.2% |
| Visual & Performing Arts | 13 | 2.9% |
| Communications | 0 | 0.0% |
| Arts & Humanities | 40 | 8.8% |
| Total | 453 | 100.0% |
Transportation & Commute in Stephens City
Vehicle Availability by Sex in Stephens City
The most prevalent vehicle ownership categories in Stephens City are males with 2 vehicles (254, accounting for 42.0%) and females with 2 vehicles (224, making up 40.7%).
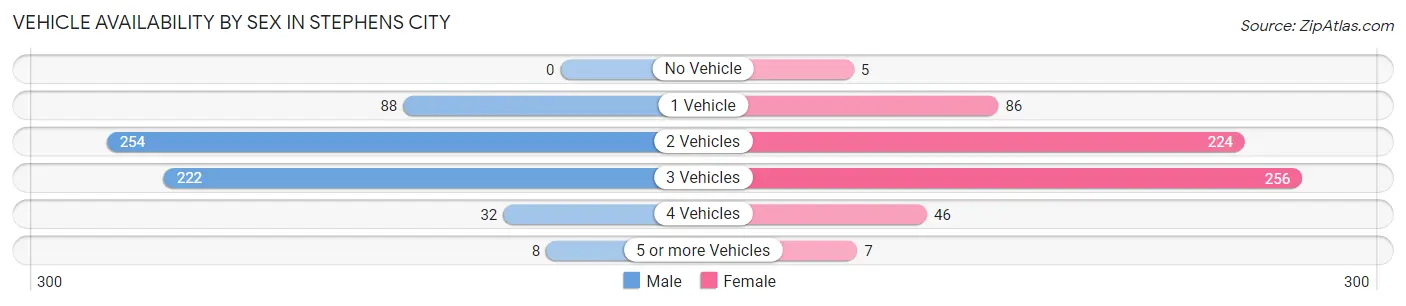
| Vehicles Available | Male | Female |
| No Vehicle | 0 (0.0%) | 5 (0.8%) |
| 1 Vehicle | 88 (14.6%) | 86 (13.8%) |
| 2 Vehicles | 254 (42.0%) | 224 (35.9%) |
| 3 Vehicles | 222 (36.7%) | 256 (41.0%) |
| 4 Vehicles | 32 (5.3%) | 46 (7.4%) |
| 5 or more Vehicles | 8 (1.3%) | 7 (1.1%) |
| Total | 604 (100.0%) | 624 (100.0%) |
Commute Time in Stephens City
The most frequently occuring commute durations in Stephens City are 15 to 19 minutes (263 commuters, 23.5%), 90 or more minutes (170 commuters, 15.2%), and 10 to 14 minutes (131 commuters, 11.7%).
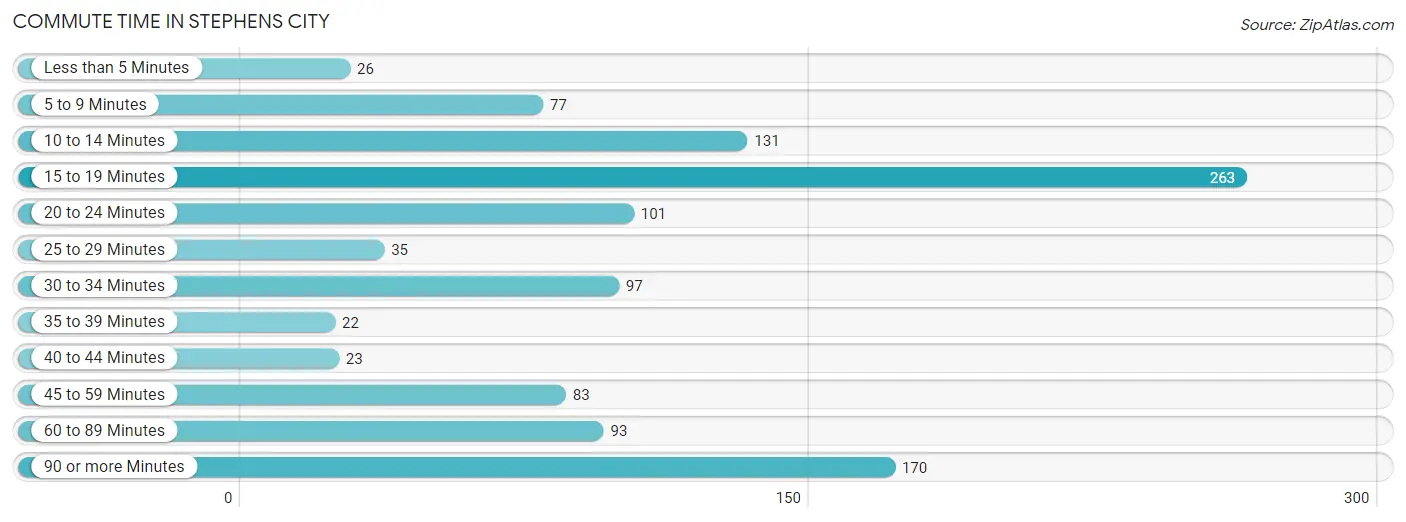
| Commute Time | # Commuters | % Commuters |
| Less than 5 Minutes | 26 | 2.3% |
| 5 to 9 Minutes | 77 | 6.9% |
| 10 to 14 Minutes | 131 | 11.7% |
| 15 to 19 Minutes | 263 | 23.5% |
| 20 to 24 Minutes | 101 | 9.0% |
| 25 to 29 Minutes | 35 | 3.1% |
| 30 to 34 Minutes | 97 | 8.6% |
| 35 to 39 Minutes | 22 | 2.0% |
| 40 to 44 Minutes | 23 | 2.1% |
| 45 to 59 Minutes | 83 | 7.4% |
| 60 to 89 Minutes | 93 | 8.3% |
| 90 or more Minutes | 170 | 15.2% |
Commute Time by Sex in Stephens City
The most common commute times in Stephens City are 90 or more minutes (113 commuters, 20.3%) for males and 15 to 19 minutes (189 commuters, 33.6%) for females.
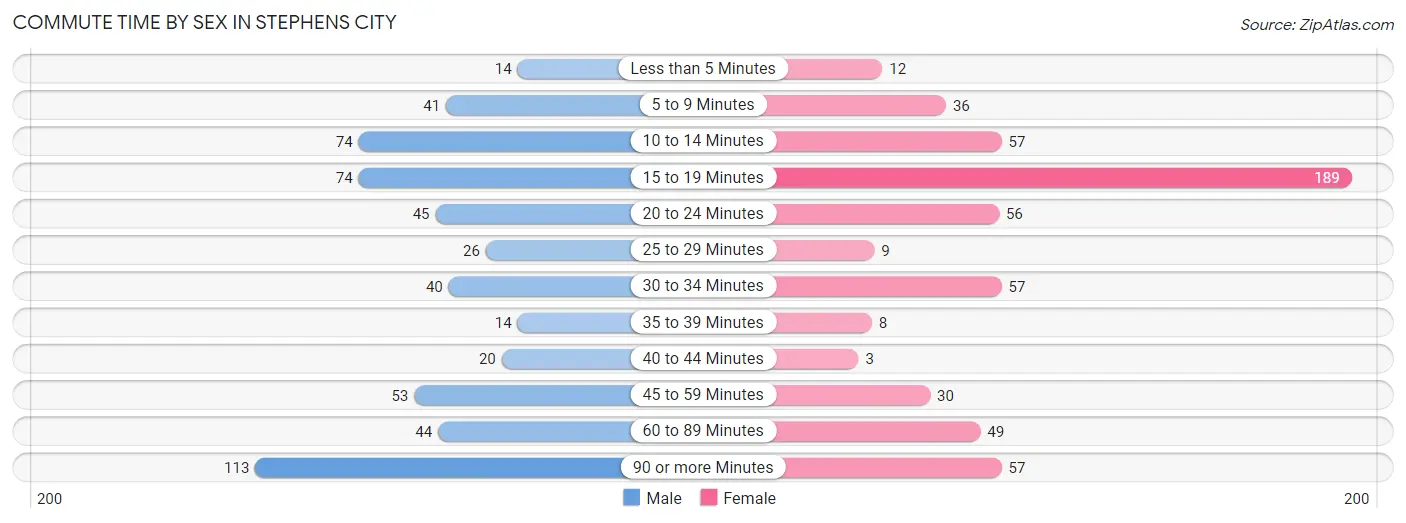
| Commute Time | Male | Female |
| Less than 5 Minutes | 14 (2.5%) | 12 (2.1%) |
| 5 to 9 Minutes | 41 (7.3%) | 36 (6.4%) |
| 10 to 14 Minutes | 74 (13.3%) | 57 (10.1%) |
| 15 to 19 Minutes | 74 (13.3%) | 189 (33.6%) |
| 20 to 24 Minutes | 45 (8.1%) | 56 (10.0%) |
| 25 to 29 Minutes | 26 (4.7%) | 9 (1.6%) |
| 30 to 34 Minutes | 40 (7.2%) | 57 (10.1%) |
| 35 to 39 Minutes | 14 (2.5%) | 8 (1.4%) |
| 40 to 44 Minutes | 20 (3.6%) | 3 (0.5%) |
| 45 to 59 Minutes | 53 (9.5%) | 30 (5.3%) |
| 60 to 89 Minutes | 44 (7.9%) | 49 (8.7%) |
| 90 or more Minutes | 113 (20.3%) | 57 (10.1%) |
Time of Departure to Work by Sex in Stephens City
The most frequent times of departure to work in Stephens City are 7:00 AM to 7:29 AM (73, 13.1%) for males and 4:00 PM to 11:59 PM (129, 22.9%) for females.
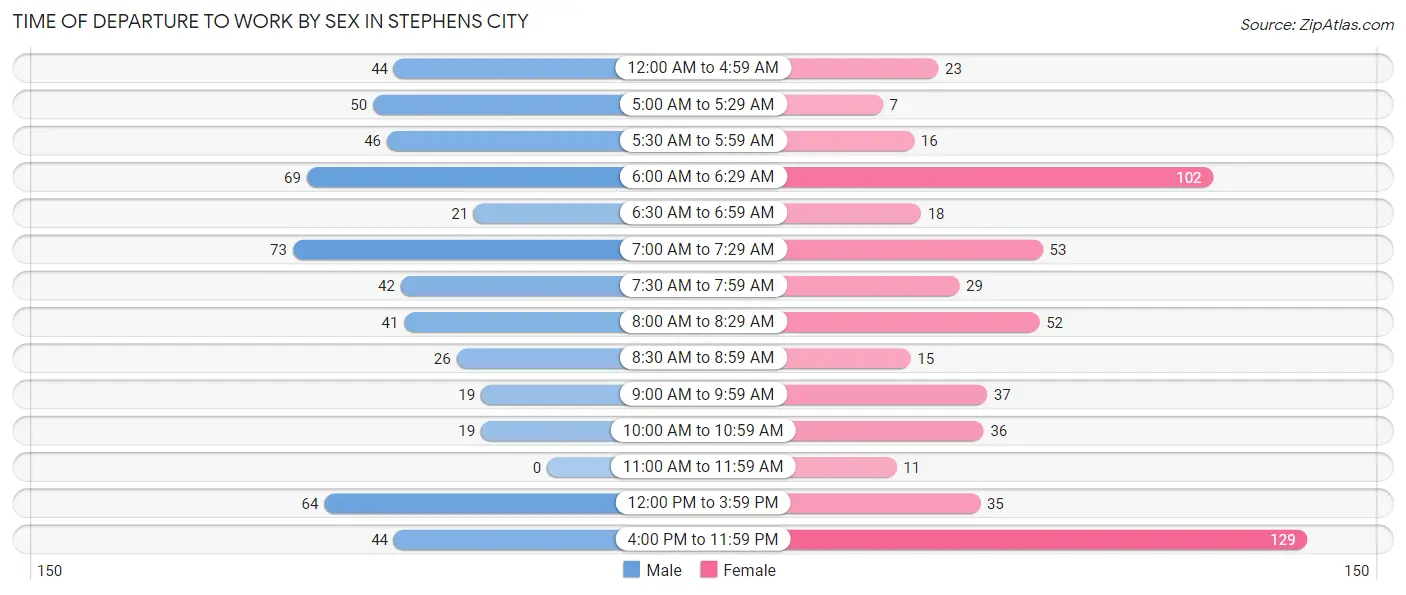
| Time of Departure | Male | Female |
| 12:00 AM to 4:59 AM | 44 (7.9%) | 23 (4.1%) |
| 5:00 AM to 5:29 AM | 50 (9.0%) | 7 (1.2%) |
| 5:30 AM to 5:59 AM | 46 (8.2%) | 16 (2.8%) |
| 6:00 AM to 6:29 AM | 69 (12.4%) | 102 (18.1%) |
| 6:30 AM to 6:59 AM | 21 (3.8%) | 18 (3.2%) |
| 7:00 AM to 7:29 AM | 73 (13.1%) | 53 (9.4%) |
| 7:30 AM to 7:59 AM | 42 (7.5%) | 29 (5.1%) |
| 8:00 AM to 8:29 AM | 41 (7.3%) | 52 (9.2%) |
| 8:30 AM to 8:59 AM | 26 (4.7%) | 15 (2.7%) |
| 9:00 AM to 9:59 AM | 19 (3.4%) | 37 (6.6%) |
| 10:00 AM to 10:59 AM | 19 (3.4%) | 36 (6.4%) |
| 11:00 AM to 11:59 AM | 0 (0.0%) | 11 (1.9%) |
| 12:00 PM to 3:59 PM | 64 (11.5%) | 35 (6.2%) |
| 4:00 PM to 11:59 PM | 44 (7.9%) | 129 (22.9%) |
| Total | 558 (100.0%) | 563 (100.0%) |
Housing Occupancy in Stephens City
Occupancy by Ownership in Stephens City
Of the total 774 dwellings in Stephens City, owner-occupied units account for 443 (57.2%), while renter-occupied units make up 331 (42.8%).
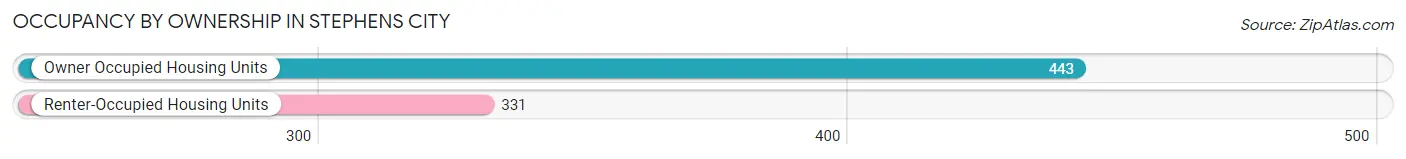
| Occupancy | # Housing Units | % Housing Units |
| Owner Occupied Housing Units | 443 | 57.2% |
| Renter-Occupied Housing Units | 331 | 42.8% |
| Total Occupied Housing Units | 774 | 100.0% |
Occupancy by Household Size in Stephens City
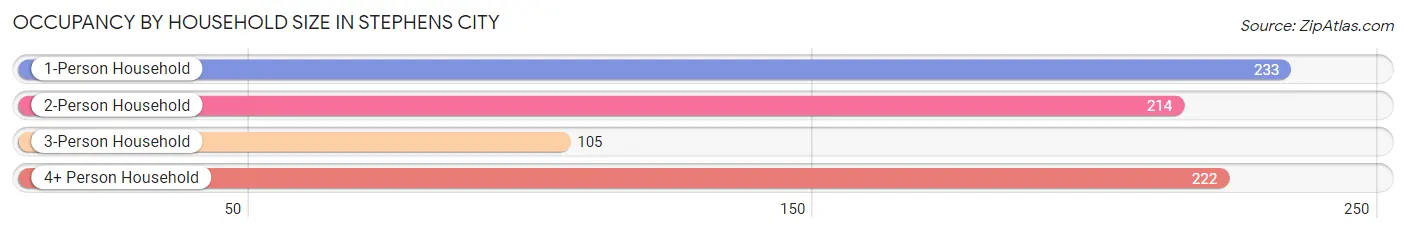
| Household Size | # Housing Units | % Housing Units |
| 1-Person Household | 233 | 30.1% |
| 2-Person Household | 214 | 27.7% |
| 3-Person Household | 105 | 13.6% |
| 4+ Person Household | 222 | 28.7% |
| Total Housing Units | 774 | 100.0% |
Occupancy by Ownership by Household Size in Stephens City
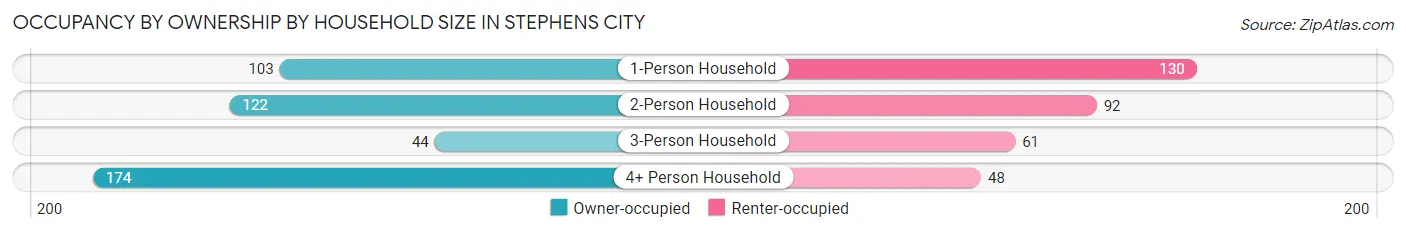
| Household Size | Owner-occupied | Renter-occupied |
| 1-Person Household | 103 (44.2%) | 130 (55.8%) |
| 2-Person Household | 122 (57.0%) | 92 (43.0%) |
| 3-Person Household | 44 (41.9%) | 61 (58.1%) |
| 4+ Person Household | 174 (78.4%) | 48 (21.6%) |
| Total Housing Units | 443 (57.2%) | 331 (42.8%) |
Occupancy by Educational Attainment in Stephens City
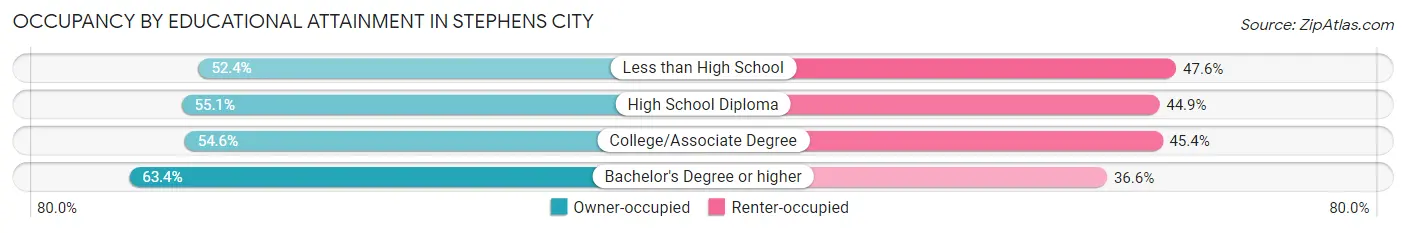
| Household Size | Owner-occupied | Renter-occupied |
| Less than High School | 65 (52.4%) | 59 (47.6%) |
| High School Diploma | 92 (55.1%) | 75 (44.9%) |
| College/Associate Degree | 125 (54.6%) | 104 (45.4%) |
| Bachelor's Degree or higher | 161 (63.4%) | 93 (36.6%) |
Occupancy by Age of Householder in Stephens City
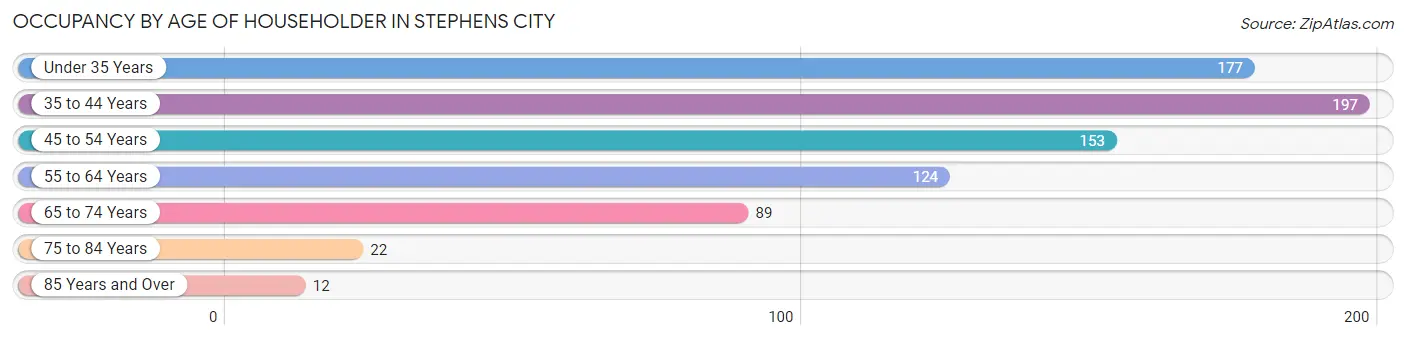
| Age Bracket | # Households | % Households |
| Under 35 Years | 177 | 22.9% |
| 35 to 44 Years | 197 | 25.5% |
| 45 to 54 Years | 153 | 19.8% |
| 55 to 64 Years | 124 | 16.0% |
| 65 to 74 Years | 89 | 11.5% |
| 75 to 84 Years | 22 | 2.8% |
| 85 Years and Over | 12 | 1.5% |
| Total | 774 | 100.0% |
Housing Finances in Stephens City
Median Income by Occupancy in Stephens City
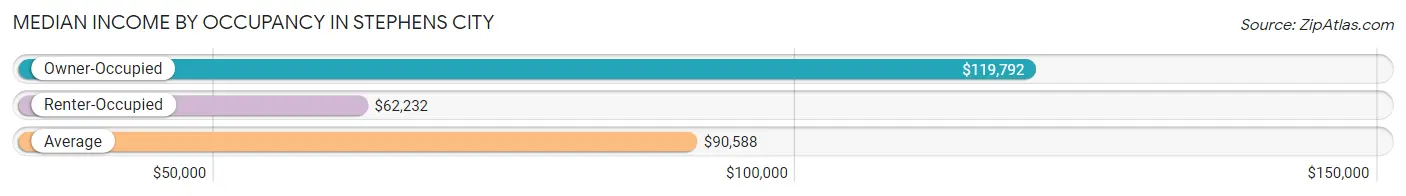
| Occupancy Type | # Households | Median Income |
| Owner-Occupied | 443 (57.2%) | $119,792 |
| Renter-Occupied | 331 (42.8%) | $62,232 |
| Average | 774 (100.0%) | $90,588 |
Occupancy by Householder Income Bracket in Stephens City
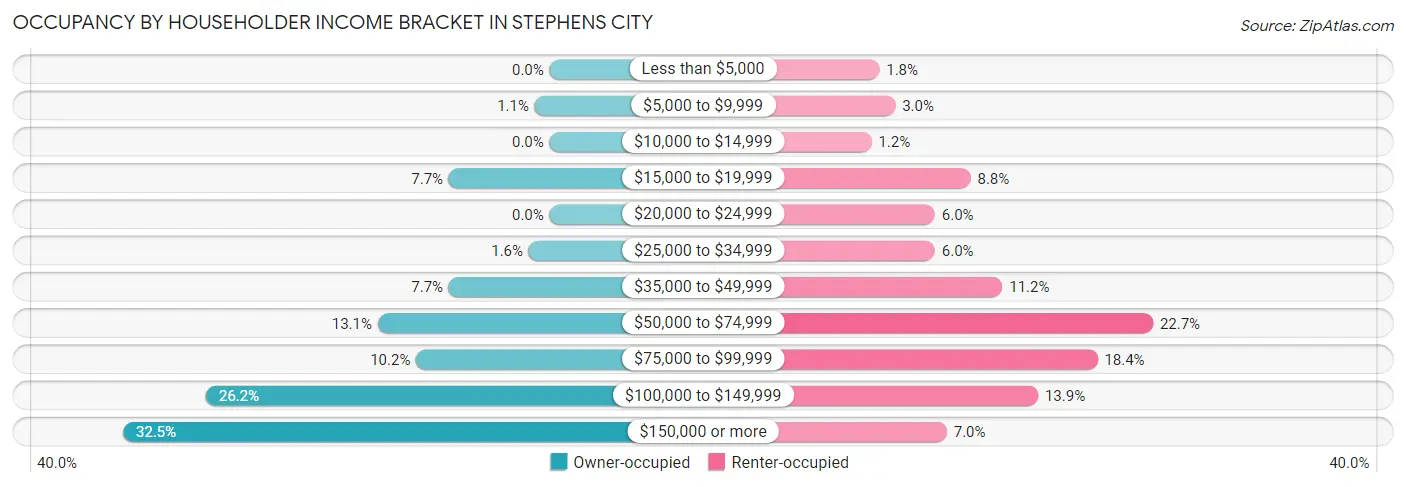
| Income Bracket | Owner-occupied | Renter-occupied |
| Less than $5,000 | 0 (0.0%) | 6 (1.8%) |
| $5,000 to $9,999 | 5 (1.1%) | 10 (3.0%) |
| $10,000 to $14,999 | 0 (0.0%) | 4 (1.2%) |
| $15,000 to $19,999 | 34 (7.7%) | 29 (8.8%) |
| $20,000 to $24,999 | 0 (0.0%) | 20 (6.0%) |
| $25,000 to $34,999 | 7 (1.6%) | 20 (6.0%) |
| $35,000 to $49,999 | 34 (7.7%) | 37 (11.2%) |
| $50,000 to $74,999 | 58 (13.1%) | 75 (22.7%) |
| $75,000 to $99,999 | 45 (10.2%) | 61 (18.4%) |
| $100,000 to $149,999 | 116 (26.2%) | 46 (13.9%) |
| $150,000 or more | 144 (32.5%) | 23 (7.0%) |
| Total | 443 (100.0%) | 331 (100.0%) |
Monthly Housing Cost Tiers in Stephens City
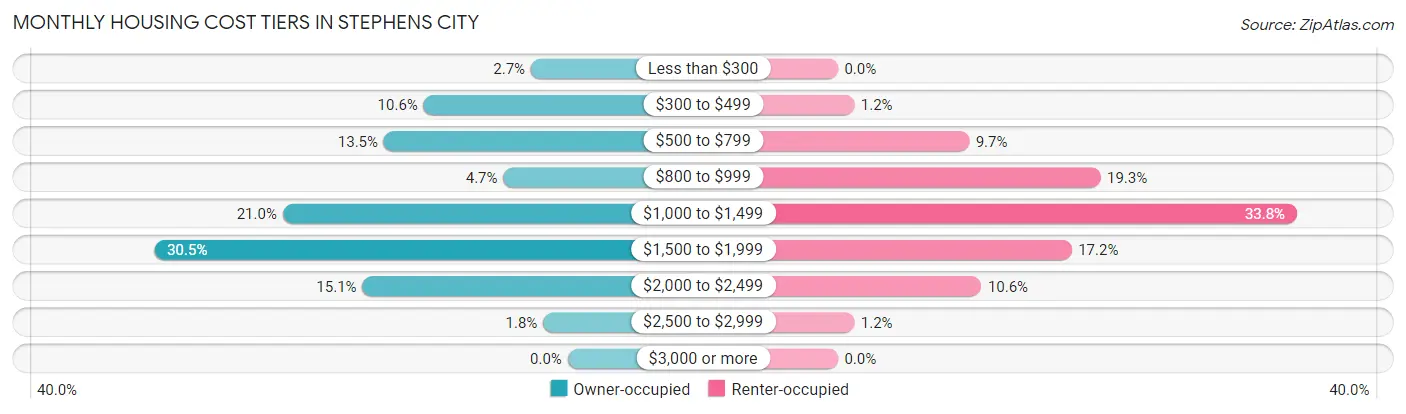
| Monthly Cost | Owner-occupied | Renter-occupied |
| Less than $300 | 12 (2.7%) | 0 (0.0%) |
| $300 to $499 | 47 (10.6%) | 4 (1.2%) |
| $500 to $799 | 60 (13.5%) | 32 (9.7%) |
| $800 to $999 | 21 (4.7%) | 64 (19.3%) |
| $1,000 to $1,499 | 93 (21.0%) | 112 (33.8%) |
| $1,500 to $1,999 | 135 (30.5%) | 57 (17.2%) |
| $2,000 to $2,499 | 67 (15.1%) | 35 (10.6%) |
| $2,500 to $2,999 | 8 (1.8%) | 4 (1.2%) |
| $3,000 or more | 0 (0.0%) | 0 (0.0%) |
| Total | 443 (100.0%) | 331 (100.0%) |
Physical Housing Characteristics in Stephens City
Housing Structures in Stephens City
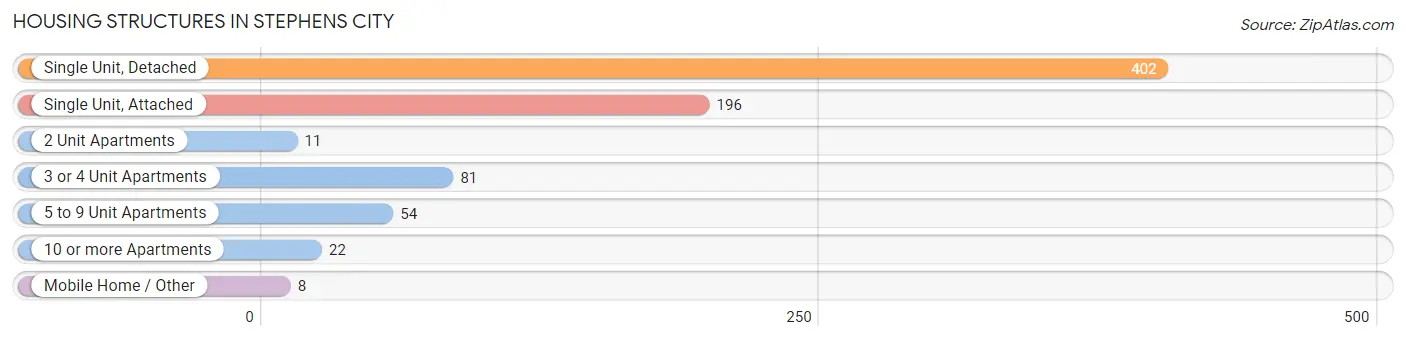
| Structure Type | # Housing Units | % Housing Units |
| Single Unit, Detached | 402 | 51.9% |
| Single Unit, Attached | 196 | 25.3% |
| 2 Unit Apartments | 11 | 1.4% |
| 3 or 4 Unit Apartments | 81 | 10.5% |
| 5 to 9 Unit Apartments | 54 | 7.0% |
| 10 or more Apartments | 22 | 2.8% |
| Mobile Home / Other | 8 | 1.0% |
| Total | 774 | 100.0% |
Housing Structures by Occupancy in Stephens City
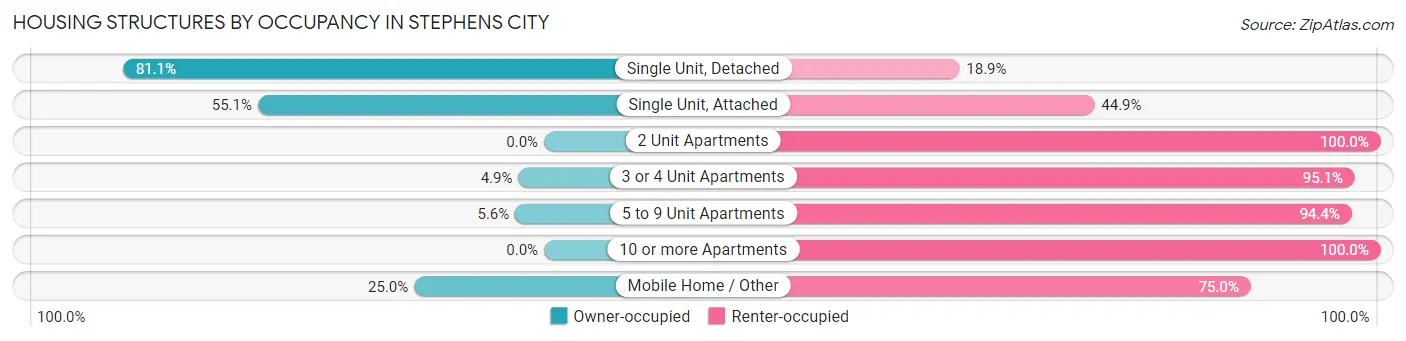
| Structure Type | Owner-occupied | Renter-occupied |
| Single Unit, Detached | 326 (81.1%) | 76 (18.9%) |
| Single Unit, Attached | 108 (55.1%) | 88 (44.9%) |
| 2 Unit Apartments | 0 (0.0%) | 11 (100.0%) |
| 3 or 4 Unit Apartments | 4 (4.9%) | 77 (95.1%) |
| 5 to 9 Unit Apartments | 3 (5.6%) | 51 (94.4%) |
| 10 or more Apartments | 0 (0.0%) | 22 (100.0%) |
| Mobile Home / Other | 2 (25.0%) | 6 (75.0%) |
| Total | 443 (57.2%) | 331 (42.8%) |
Housing Structures by Number of Rooms in Stephens City
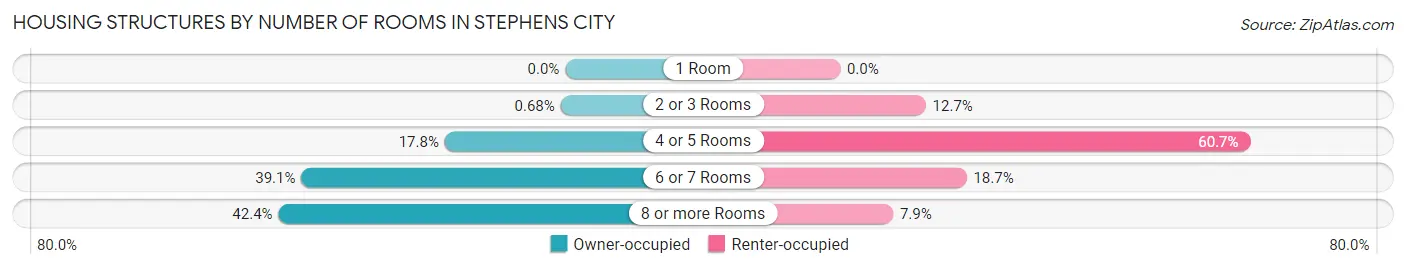
| Number of Rooms | Owner-occupied | Renter-occupied |
| 1 Room | 0 (0.0%) | 0 (0.0%) |
| 2 or 3 Rooms | 3 (0.7%) | 42 (12.7%) |
| 4 or 5 Rooms | 79 (17.8%) | 201 (60.7%) |
| 6 or 7 Rooms | 173 (39.1%) | 62 (18.7%) |
| 8 or more Rooms | 188 (42.4%) | 26 (7.9%) |
| Total | 443 (100.0%) | 331 (100.0%) |
Housing Structure by Heating Type in Stephens City
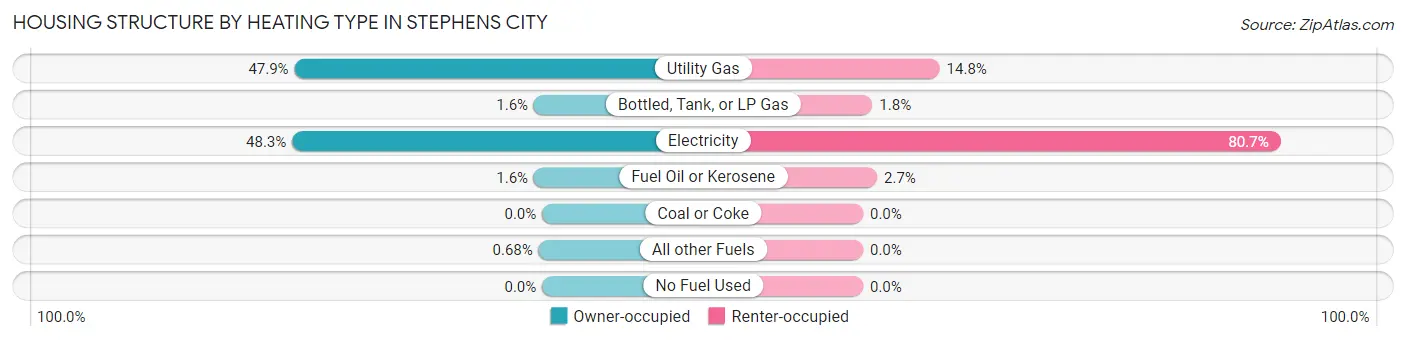
| Heating Type | Owner-occupied | Renter-occupied |
| Utility Gas | 212 (47.9%) | 49 (14.8%) |
| Bottled, Tank, or LP Gas | 7 (1.6%) | 6 (1.8%) |
| Electricity | 214 (48.3%) | 267 (80.7%) |
| Fuel Oil or Kerosene | 7 (1.6%) | 9 (2.7%) |
| Coal or Coke | 0 (0.0%) | 0 (0.0%) |
| All other Fuels | 3 (0.7%) | 0 (0.0%) |
| No Fuel Used | 0 (0.0%) | 0 (0.0%) |
| Total | 443 (100.0%) | 331 (100.0%) |
Household Vehicle Usage in Stephens City
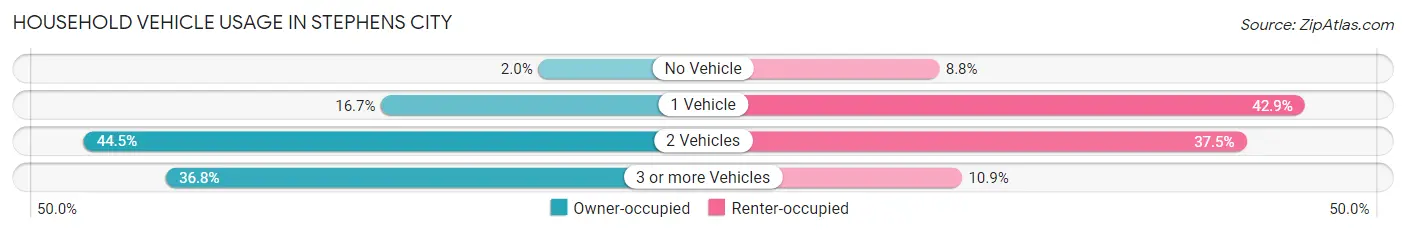
| Vehicles per Household | Owner-occupied | Renter-occupied |
| No Vehicle | 9 (2.0%) | 29 (8.8%) |
| 1 Vehicle | 74 (16.7%) | 142 (42.9%) |
| 2 Vehicles | 197 (44.5%) | 124 (37.5%) |
| 3 or more Vehicles | 163 (36.8%) | 36 (10.9%) |
| Total | 443 (100.0%) | 331 (100.0%) |
Real Estate & Mortgages in Stephens City
Real Estate and Mortgage Overview in Stephens City
| Characteristic | Without Mortgage | With Mortgage |
| Housing Units | 98 | 345 |
| Median Property Value | $252,800 | $298,200 |
| Median Household Income | - | - |
| Monthly Housing Costs | $466 | $0 |
| Real Estate Taxes | $1,220 | $16 |
Property Value by Mortgage Status in Stephens City
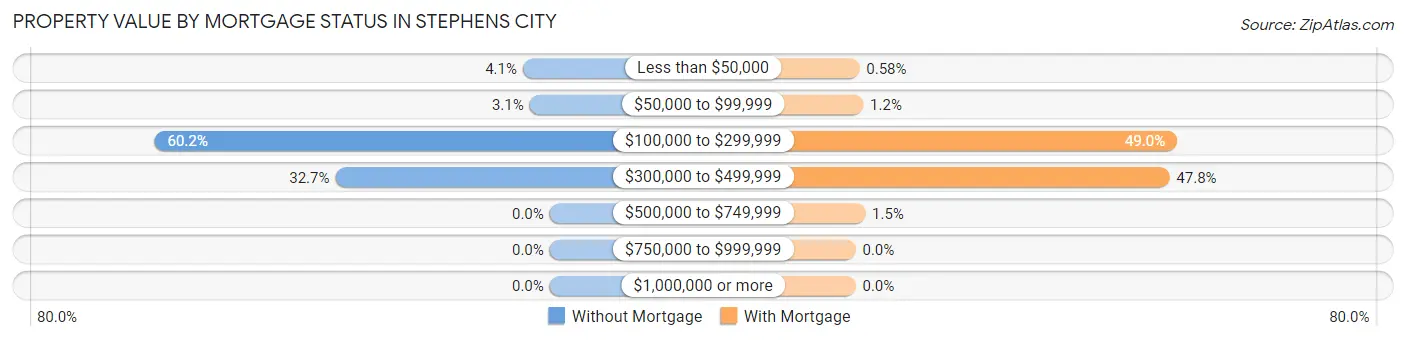
| Property Value | Without Mortgage | With Mortgage |
| Less than $50,000 | 4 (4.1%) | 2 (0.6%) |
| $50,000 to $99,999 | 3 (3.1%) | 4 (1.2%) |
| $100,000 to $299,999 | 59 (60.2%) | 169 (49.0%) |
| $300,000 to $499,999 | 32 (32.7%) | 165 (47.8%) |
| $500,000 to $749,999 | 0 (0.0%) | 5 (1.5%) |
| $750,000 to $999,999 | 0 (0.0%) | 0 (0.0%) |
| $1,000,000 or more | 0 (0.0%) | 0 (0.0%) |
| Total | 98 (100.0%) | 345 (100.0%) |
Household Income by Mortgage Status in Stephens City
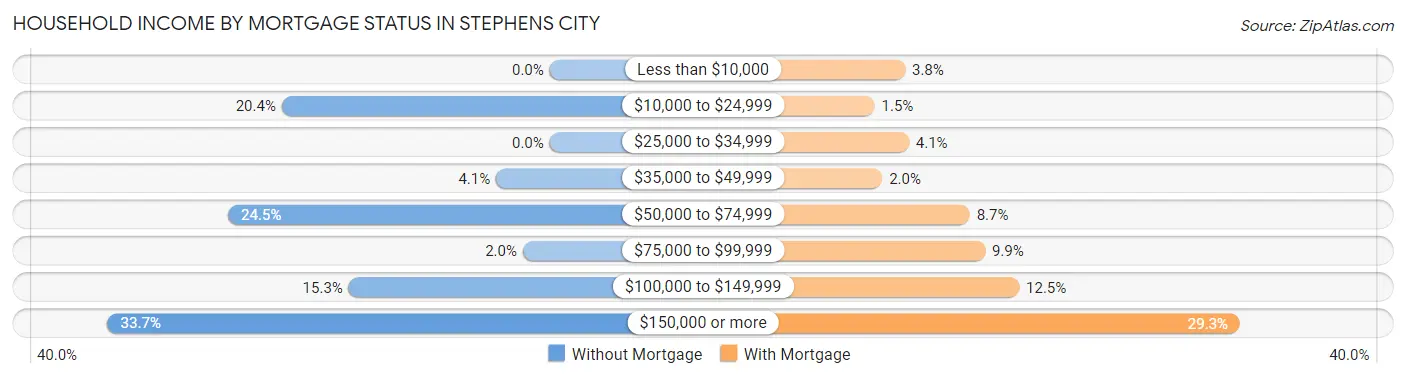
| Household Income | Without Mortgage | With Mortgage |
| Less than $10,000 | 0 (0.0%) | 13 (3.8%) |
| $10,000 to $24,999 | 20 (20.4%) | 5 (1.5%) |
| $25,000 to $34,999 | 0 (0.0%) | 14 (4.1%) |
| $35,000 to $49,999 | 4 (4.1%) | 7 (2.0%) |
| $50,000 to $74,999 | 24 (24.5%) | 30 (8.7%) |
| $75,000 to $99,999 | 2 (2.0%) | 34 (9.9%) |
| $100,000 to $149,999 | 15 (15.3%) | 43 (12.5%) |
| $150,000 or more | 33 (33.7%) | 101 (29.3%) |
| Total | 98 (100.0%) | 345 (100.0%) |
Property Value to Household Income Ratio in Stephens City
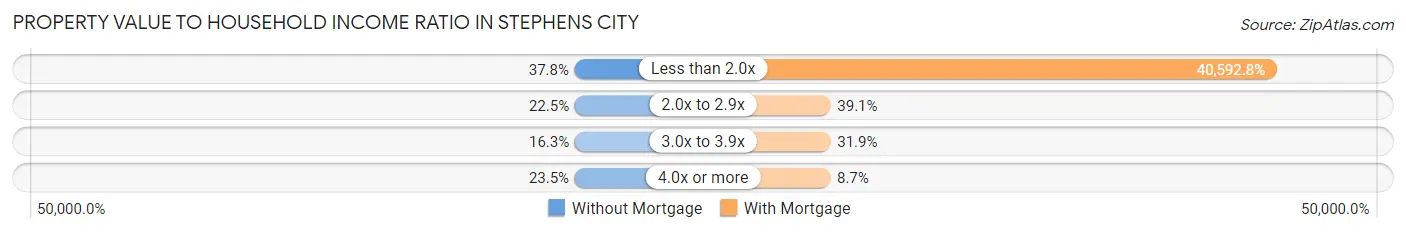
| Value-to-Income Ratio | Without Mortgage | With Mortgage |
| Less than 2.0x | 37 (37.8%) | 140,045 (40,592.8%) |
| 2.0x to 2.9x | 22 (22.5%) | 135 (39.1%) |
| 3.0x to 3.9x | 16 (16.3%) | 110 (31.9%) |
| 4.0x or more | 23 (23.5%) | 30 (8.7%) |
| Total | 98 (100.0%) | 345 (100.0%) |
Real Estate Taxes by Mortgage Status in Stephens City
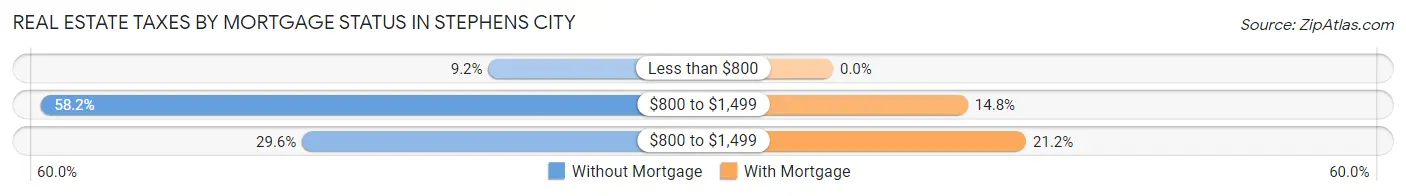
| Property Taxes | Without Mortgage | With Mortgage |
| Less than $800 | 9 (9.2%) | 0 (0.0%) |
| $800 to $1,499 | 57 (58.2%) | 51 (14.8%) |
| $800 to $1,499 | 29 (29.6%) | 73 (21.2%) |
| Total | 98 (100.0%) | 345 (100.0%) |
Health & Disability in Stephens City
Health Insurance Coverage by Age in Stephens City
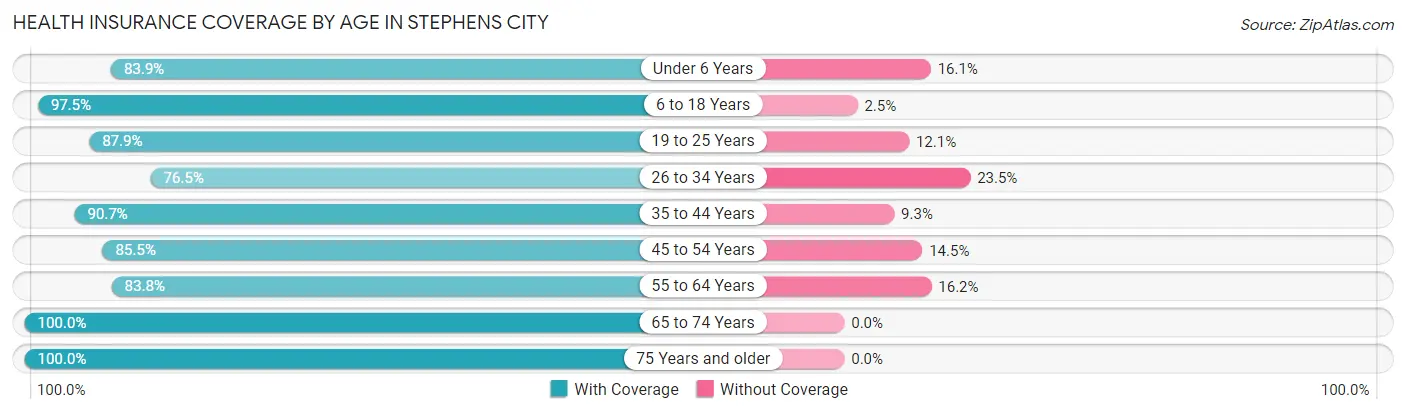
| Age Bracket | With Coverage | Without Coverage |
| Under 6 Years | 151 (83.9%) | 29 (16.1%) |
| 6 to 18 Years | 357 (97.5%) | 9 (2.5%) |
| 19 to 25 Years | 226 (87.9%) | 31 (12.1%) |
| 26 to 34 Years | 202 (76.5%) | 62 (23.5%) |
| 35 to 44 Years | 322 (90.7%) | 33 (9.3%) |
| 45 to 54 Years | 247 (85.5%) | 42 (14.5%) |
| 55 to 64 Years | 165 (83.8%) | 32 (16.2%) |
| 65 to 74 Years | 122 (100.0%) | 0 (0.0%) |
| 75 Years and older | 69 (100.0%) | 0 (0.0%) |
| Total | 1,861 (88.7%) | 238 (11.3%) |
Health Insurance Coverage by Citizenship Status in Stephens City
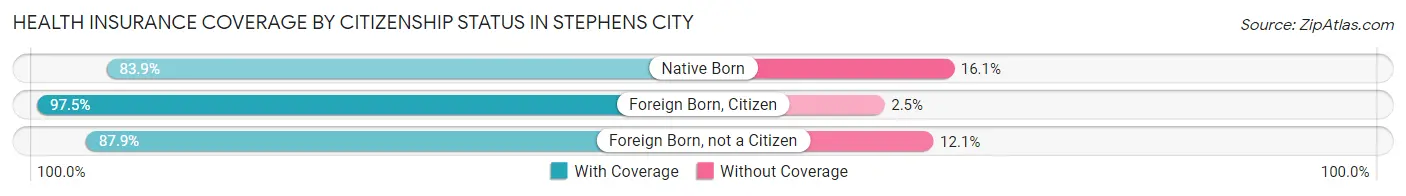
| Citizenship Status | With Coverage | Without Coverage |
| Native Born | 151 (83.9%) | 29 (16.1%) |
| Foreign Born, Citizen | 357 (97.5%) | 9 (2.5%) |
| Foreign Born, not a Citizen | 226 (87.9%) | 31 (12.1%) |
Health Insurance Coverage by Household Income in Stephens City
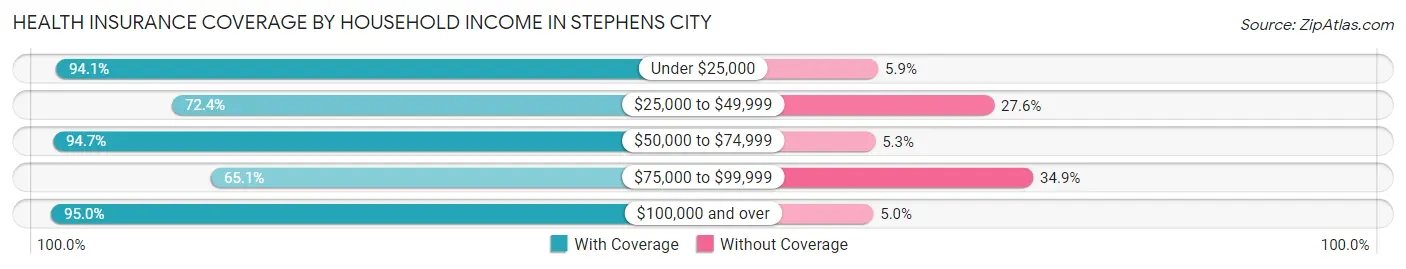
| Household Income | With Coverage | Without Coverage |
| Under $25,000 | 176 (94.1%) | 11 (5.9%) |
| $25,000 to $49,999 | 118 (72.4%) | 45 (27.6%) |
| $50,000 to $74,999 | 285 (94.7%) | 16 (5.3%) |
| $75,000 to $99,999 | 205 (65.1%) | 110 (34.9%) |
| $100,000 and over | 1,072 (95.0%) | 56 (5.0%) |
Public vs Private Health Insurance Coverage by Age in Stephens City
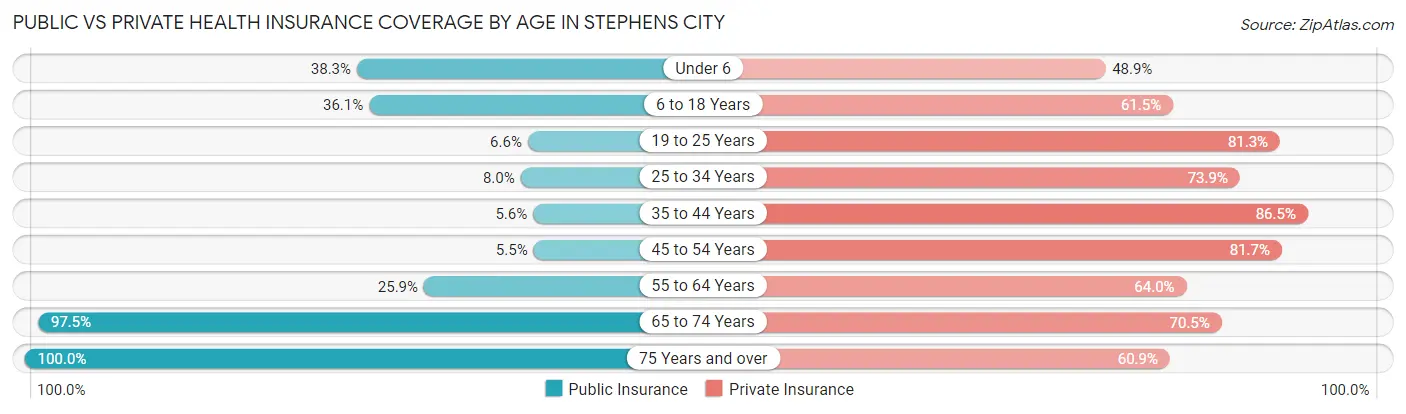
| Age Bracket | Public Insurance | Private Insurance |
| Under 6 | 69 (38.3%) | 88 (48.9%) |
| 6 to 18 Years | 132 (36.1%) | 225 (61.5%) |
| 19 to 25 Years | 17 (6.6%) | 209 (81.3%) |
| 25 to 34 Years | 21 (8.0%) | 195 (73.9%) |
| 35 to 44 Years | 20 (5.6%) | 307 (86.5%) |
| 45 to 54 Years | 16 (5.5%) | 236 (81.7%) |
| 55 to 64 Years | 51 (25.9%) | 126 (64.0%) |
| 65 to 74 Years | 119 (97.5%) | 86 (70.5%) |
| 75 Years and over | 69 (100.0%) | 42 (60.9%) |
| Total | 514 (24.5%) | 1,514 (72.1%) |
Disability Status by Sex by Age in Stephens City
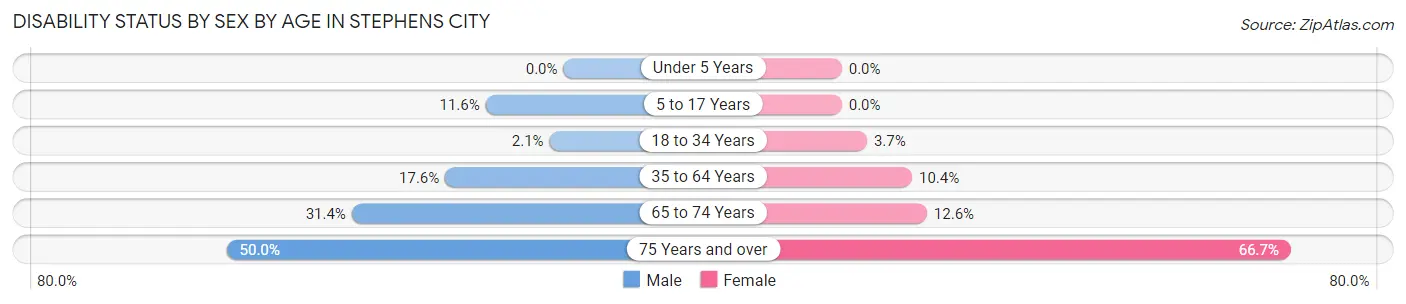
| Age Bracket | Male | Female |
| Under 5 Years | 0 (0.0%) | 0 (0.0%) |
| 5 to 17 Years | 23 (11.6%) | 0 (0.0%) |
| 18 to 34 Years | 5 (2.1%) | 11 (3.7%) |
| 35 to 64 Years | 82 (17.6%) | 39 (10.4%) |
| 65 to 74 Years | 11 (31.4%) | 11 (12.6%) |
| 75 Years and over | 12 (50.0%) | 30 (66.7%) |
Disability Class by Sex by Age in Stephens City
Disability Class: Hearing Difficulty
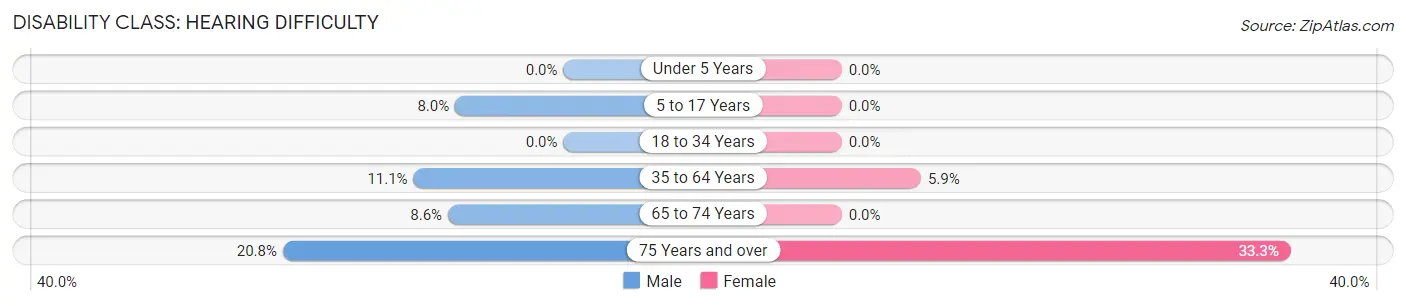
| Age Bracket | Male | Female |
| Under 5 Years | 0 (0.0%) | 0 (0.0%) |
| 5 to 17 Years | 16 (8.0%) | 0 (0.0%) |
| 18 to 34 Years | 0 (0.0%) | 0 (0.0%) |
| 35 to 64 Years | 52 (11.1%) | 22 (5.9%) |
| 65 to 74 Years | 3 (8.6%) | 0 (0.0%) |
| 75 Years and over | 5 (20.8%) | 15 (33.3%) |
Disability Class: Vision Difficulty
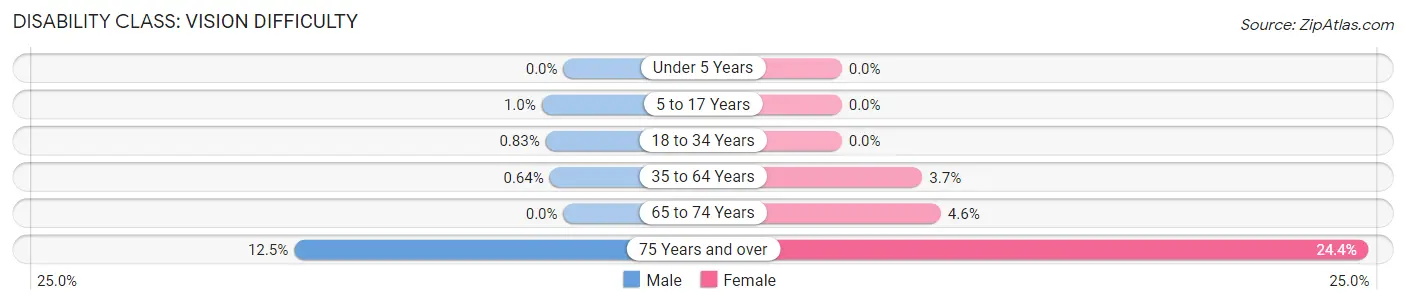
| Age Bracket | Male | Female |
| Under 5 Years | 0 (0.0%) | 0 (0.0%) |
| 5 to 17 Years | 2 (1.0%) | 0 (0.0%) |
| 18 to 34 Years | 2 (0.8%) | 0 (0.0%) |
| 35 to 64 Years | 3 (0.6%) | 14 (3.7%) |
| 65 to 74 Years | 0 (0.0%) | 4 (4.6%) |
| 75 Years and over | 3 (12.5%) | 11 (24.4%) |
Disability Class: Cognitive Difficulty
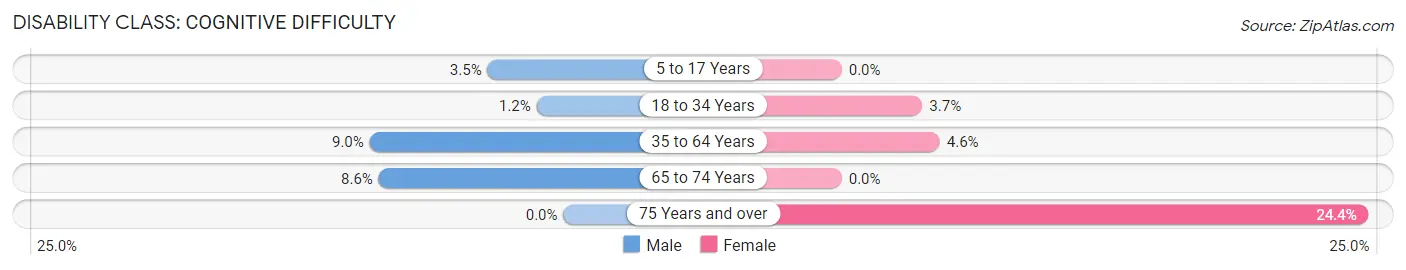
| Age Bracket | Male | Female |
| 5 to 17 Years | 7 (3.5%) | 0 (0.0%) |
| 18 to 34 Years | 3 (1.2%) | 11 (3.7%) |
| 35 to 64 Years | 42 (9.0%) | 17 (4.5%) |
| 65 to 74 Years | 3 (8.6%) | 0 (0.0%) |
| 75 Years and over | 0 (0.0%) | 11 (24.4%) |
Disability Class: Ambulatory Difficulty
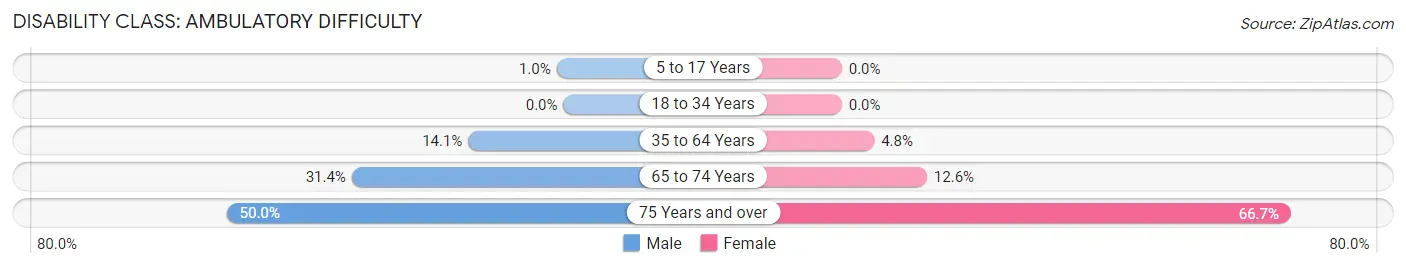
| Age Bracket | Male | Female |
| 5 to 17 Years | 2 (1.0%) | 0 (0.0%) |
| 18 to 34 Years | 0 (0.0%) | 0 (0.0%) |
| 35 to 64 Years | 66 (14.1%) | 18 (4.8%) |
| 65 to 74 Years | 11 (31.4%) | 11 (12.6%) |
| 75 Years and over | 12 (50.0%) | 30 (66.7%) |
Disability Class: Self-Care Difficulty
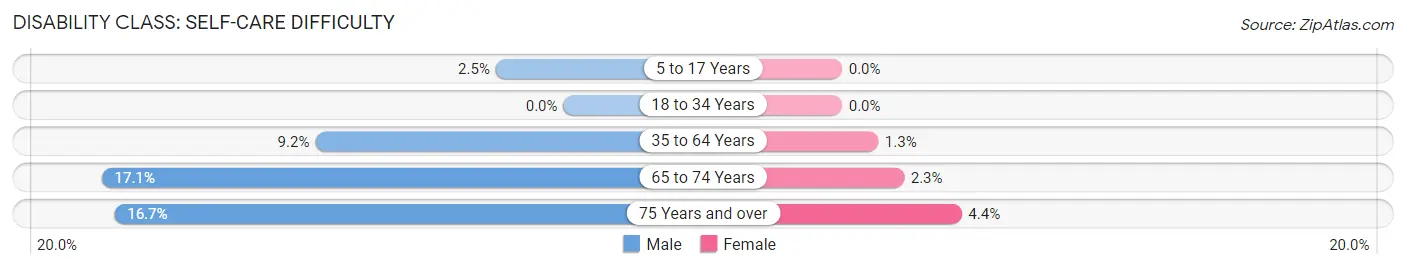
| Age Bracket | Male | Female |
| 5 to 17 Years | 5 (2.5%) | 0 (0.0%) |
| 18 to 34 Years | 0 (0.0%) | 0 (0.0%) |
| 35 to 64 Years | 43 (9.2%) | 5 (1.3%) |
| 65 to 74 Years | 6 (17.1%) | 2 (2.3%) |
| 75 Years and over | 4 (16.7%) | 2 (4.4%) |
Technology Access in Stephens City
Computing Device Access in Stephens City
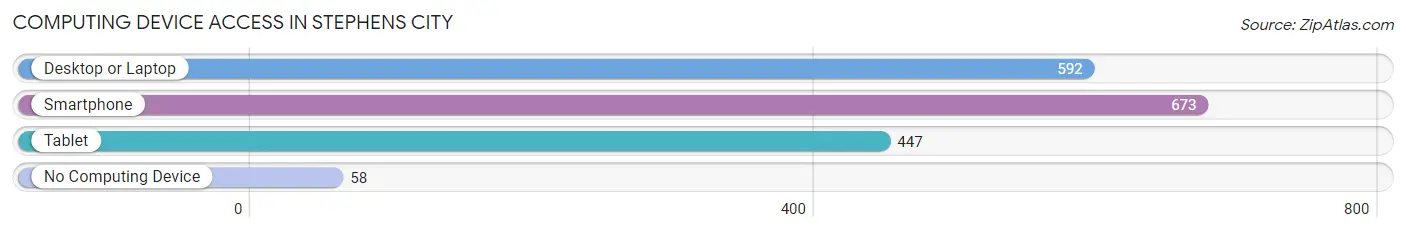
| Device Type | # Households | % Households |
| Desktop or Laptop | 592 | 76.5% |
| Smartphone | 673 | 87.0% |
| Tablet | 447 | 57.8% |
| No Computing Device | 58 | 7.5% |
| Total | 774 | 100.0% |
Internet Access in Stephens City
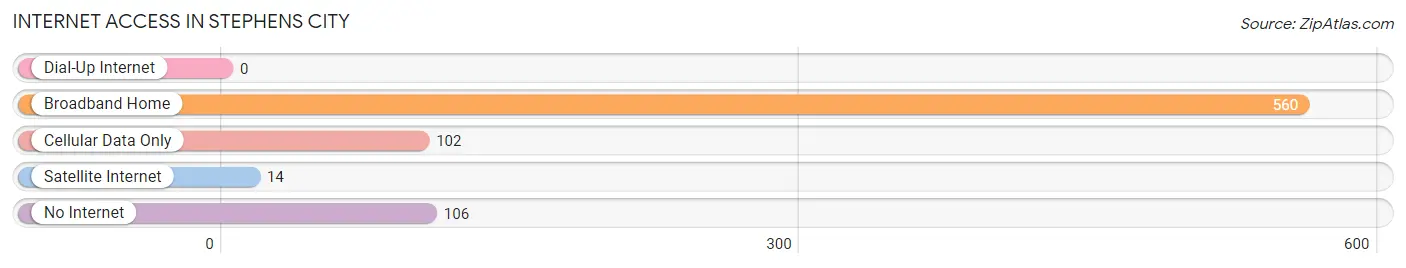
| Internet Type | # Households | % Households |
| Dial-Up Internet | 0 | 0.0% |
| Broadband Home | 560 | 72.4% |
| Cellular Data Only | 102 | 13.2% |
| Satellite Internet | 14 | 1.8% |
| No Internet | 106 | 13.7% |
| Total | 774 | 100.0% |
Stephens City Summary
Stephens City is a town located in the northern part of the Shenandoah Valley in the state of Virginia. It is part of Frederick County and is located about 10 miles south of Winchester. The town was founded in 1758 and is named after General Adam Stephen, a Revolutionary War hero. The population of Stephens City was estimated to be 2,717 in 2019.
Geography
Stephens City is located in the northern part of the Shenandoah Valley in the state of Virginia. It is part of Frederick County and is located about 10 miles south of Winchester. The town is situated in the foothills of the Blue Ridge Mountains and is surrounded by rolling hills and farmland. The town is located along the banks of the Shenandoah River and is close to the Appalachian Trail. The climate in Stephens City is humid subtropical, with hot summers and mild winters.
Economy
Stephens City is a small town with a diverse economy. The town is home to several small businesses, including restaurants, retail stores, and professional services. The town is also home to several manufacturing companies, including a furniture factory and a printing company. The town is also home to a number of wineries and vineyards, as well as a brewery. The town is also home to a number of farms, which produce a variety of fruits and vegetables.
Demographics
The population of Stephens City was estimated to be 2,717 in 2019. The town has a diverse population, with a mix of races and ethnicities. The majority of the population is white (83.3%), followed by African American (9.2%), Hispanic (3.7%), and Asian (2.2%). The median household income in Stephens City is $50,945, and the median home value is $219,400.
History
Stephens City was founded in 1758 and is named after General Adam Stephen, a Revolutionary War hero. The town was originally a trading post and was a popular stop for travelers on the Great Wagon Road. During the Civil War, the town was the site of several battles, including the Battle of Cedar Creek. After the war, the town experienced a period of growth and prosperity, and many of the town’s historic buildings were built during this time. In the late 19th century, the town was home to a number of factories, including a furniture factory and a printing company. The town continued to grow and prosper throughout the 20th century, and today it is a vibrant and thriving community.
Common Questions
What is Per Capita Income in Stephens City?
Per Capita income in Stephens City is $39,459.
What is the Median Family Income in Stephens City?
Median Family Income in Stephens City is $107,500.
What is the Median Household income in Stephens City?
Median Household Income in Stephens City is $90,588.
What is Income or Wage Gap in Stephens City?
Income or Wage Gap in Stephens City is 45.2%.
Women in Stephens City earn 54.8 cents for every dollar earned by a man.
What is Inequality or Gini Index in Stephens City?
Inequality or Gini Index in Stephens City is 0.40.
What is the Total Population of Stephens City?
Total Population of Stephens City is 2,107.
What is the Total Male Population of Stephens City?
Total Male Population of Stephens City is 1,026.
What is the Total Female Population of Stephens City?
Total Female Population of Stephens City is 1,081.
What is the Ratio of Males per 100 Females in Stephens City?
There are 94.91 Males per 100 Females in Stephens City.
What is the Ratio of Females per 100 Males in Stephens City?
There are 105.36 Females per 100 Males in Stephens City.
What is the Median Population Age in Stephens City?
Median Population Age in Stephens City is 34.1 Years.
What is the Average Family Size in Stephens City
Average Family Size in Stephens City is 3.6 People.
What is the Average Household Size in Stephens City
Average Household Size in Stephens City is 2.7 People.
How Large is the Labor Force in Stephens City?
There are 1,270 People in the Labor Forcein in Stephens City.
What is the Percentage of People in the Labor Force in Stephens City?
79.2% of People are in the Labor Force in Stephens City.
What is the Unemployment Rate in Stephens City?
Unemployment Rate in Stephens City is 3.4%.