Charlottesville, VA Map & Demographics
Charlottesville Map
Charlottesville Overview
$45,625
PER CAPITA INCOME
$105,994
AVG FAMILY INCOME
$67,177
AVG HOUSEHOLD INCOME
19.1%
WAGE / INCOME GAP [ % ]
80.9¢/ $1
WAGE / INCOME GAP [ $ ]
$15,434
FAMILY INCOME DEFICIT
0.54
INEQUALITY / GINI INDEX
46,289
TOTAL POPULATION
22,528
MALE POPULATION
23,761
FEMALE POPULATION
94.81
MALES / 100 FEMALES
105.47
FEMALES / 100 MALES
32.4
MEDIAN AGE
2.9
AVG FAMILY SIZE
2.2
AVG HOUSEHOLD SIZE
25,377
LABOR FORCE [ PEOPLE ]
64.0%
PERCENT IN LABOR FORCE
5.1%
UNEMPLOYMENT RATE
Charlottesville Area Codes
Income in Charlottesville
Income Overview in Charlottesville
Per Capita Income in Charlottesville is $45,625, while median incomes of families and households are $105,994 and $67,177 respectively.
| Characteristic | Number | Measure |
| Per Capita Income | 46,289 | $45,625 |
| Median Family Income | 8,805 | $105,994 |
| Mean Family Income | 8,805 | $149,460 |
| Median Household Income | 19,511 | $67,177 |
| Mean Household Income | 19,511 | $104,674 |
| Income Deficit | 8,805 | $15,434 |
| Wage / Income Gap (%) | 46,289 | 19.14% |
| Wage / Income Gap ($) | 46,289 | 80.86¢ per $1 |
| Gini / Inequality Index | 46,289 | 0.54 |
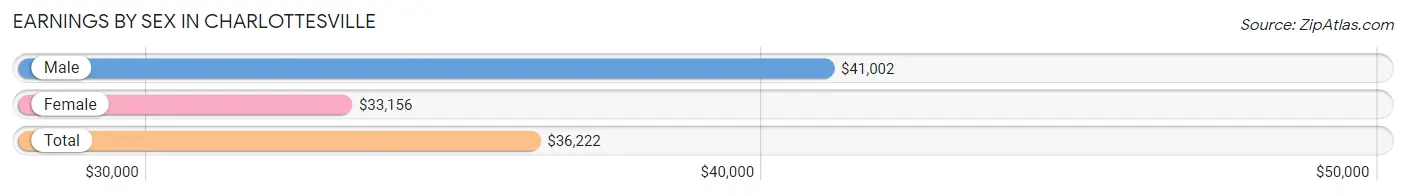
Earnings by Sex in Charlottesville
Average Earnings in Charlottesville are $36,222, $41,002 for men and $33,156 for women, a difference of 19.1%.
| Sex | Number | Average Earnings |
| Male | 13,847 (48.5%) | $41,002 |
| Female | 14,699 (51.5%) | $33,156 |
| Total | 28,546 (100.0%) | $36,222 |
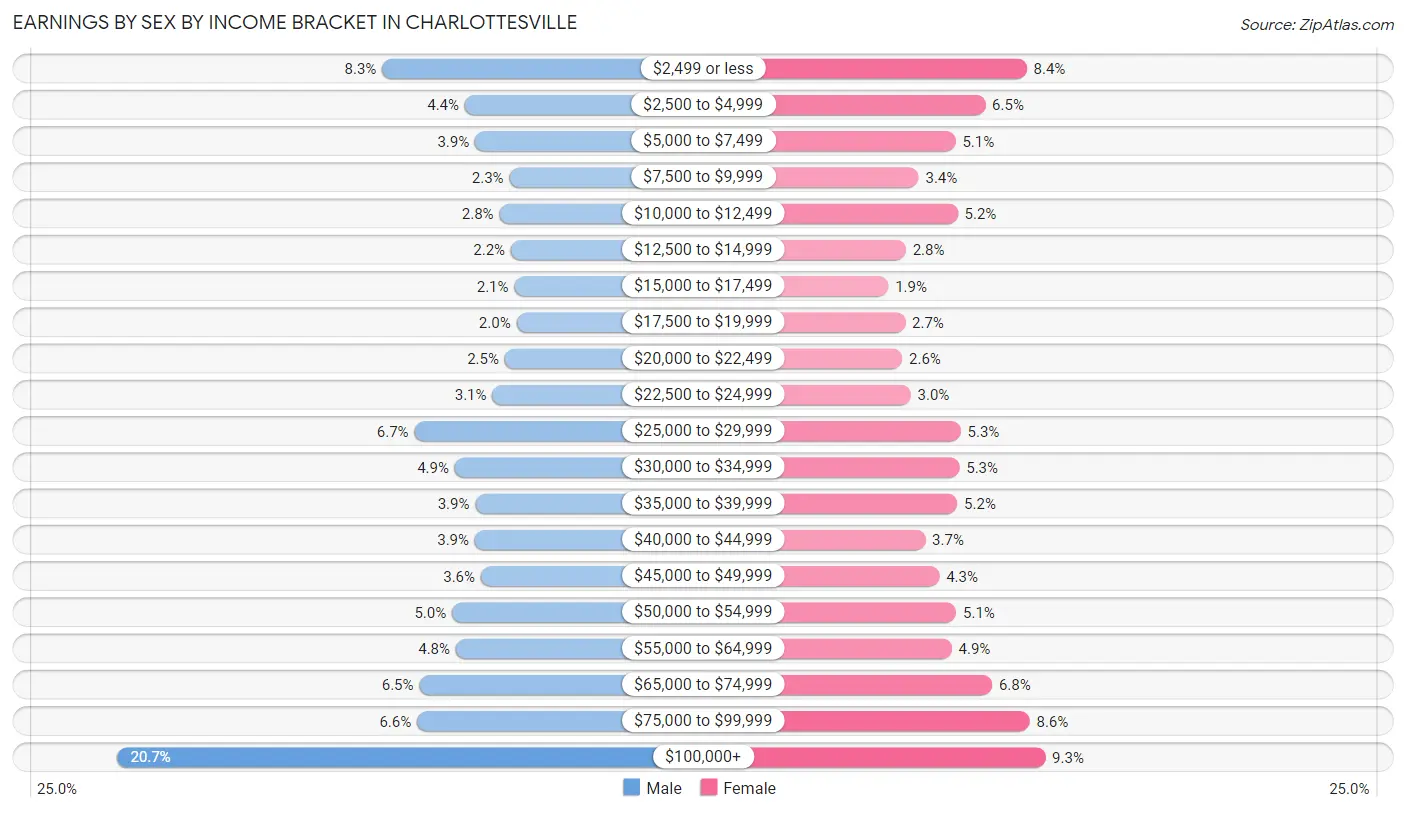
Earnings by Sex by Income Bracket in Charlottesville
The most common earnings brackets in Charlottesville are $100,000+ for men (2,860 | 20.6%) and $100,000+ for women (1,366 | 9.3%).
| Income | Male | Female |
| $2,499 or less | 1,143 (8.3%) | 1,238 (8.4%) |
| $2,500 to $4,999 | 606 (4.4%) | 953 (6.5%) |
| $5,000 to $7,499 | 540 (3.9%) | 748 (5.1%) |
| $7,500 to $9,999 | 317 (2.3%) | 494 (3.4%) |
| $10,000 to $12,499 | 382 (2.8%) | 763 (5.2%) |
| $12,500 to $14,999 | 308 (2.2%) | 405 (2.8%) |
| $15,000 to $17,499 | 285 (2.1%) | 285 (1.9%) |
| $17,500 to $19,999 | 272 (2.0%) | 402 (2.7%) |
| $20,000 to $22,499 | 348 (2.5%) | 381 (2.6%) |
| $22,500 to $24,999 | 428 (3.1%) | 440 (3.0%) |
| $25,000 to $29,999 | 933 (6.7%) | 783 (5.3%) |
| $30,000 to $34,999 | 672 (4.9%) | 774 (5.3%) |
| $35,000 to $39,999 | 538 (3.9%) | 760 (5.2%) |
| $40,000 to $44,999 | 541 (3.9%) | 539 (3.7%) |
| $45,000 to $49,999 | 502 (3.6%) | 636 (4.3%) |
| $50,000 to $54,999 | 689 (5.0%) | 753 (5.1%) |
| $55,000 to $64,999 | 665 (4.8%) | 721 (4.9%) |
| $65,000 to $74,999 | 901 (6.5%) | 1,000 (6.8%) |
| $75,000 to $99,999 | 917 (6.6%) | 1,258 (8.6%) |
| $100,000+ | 2,860 (20.6%) | 1,366 (9.3%) |
| Total | 13,847 (100.0%) | 14,699 (100.0%) |
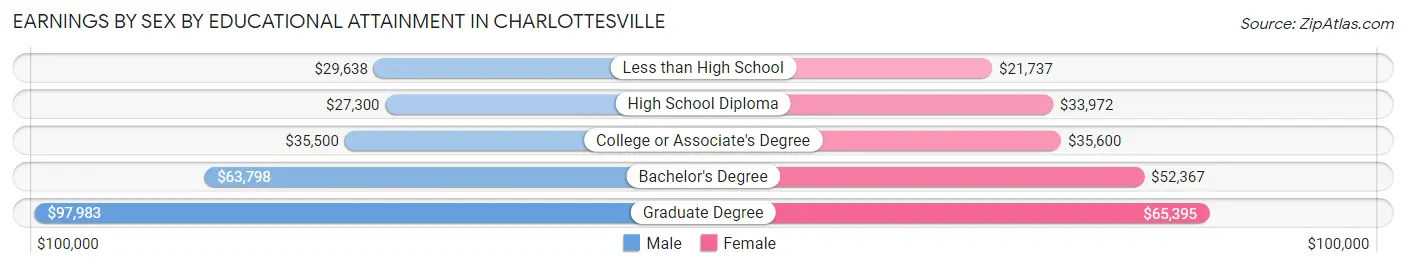
Earnings by Sex by Educational Attainment in Charlottesville
Average earnings in Charlottesville are $54,220 for men and $46,639 for women, a difference of 14.0%. Men with an educational attainment of graduate degree enjoy the highest average annual earnings of $97,983, while those with high school diploma education earn the least with $27,300. Women with an educational attainment of graduate degree earn the most with the average annual earnings of $65,395, while those with less than high school education have the smallest earnings of $21,737.
| Educational Attainment | Male Income | Female Income |
| Less than High School | $29,638 | $21,737 |
| High School Diploma | $27,300 | $33,972 |
| College or Associate's Degree | $35,500 | $35,600 |
| Bachelor's Degree | $63,798 | $52,367 |
| Graduate Degree | $97,983 | $65,395 |
| Total | $54,220 | $46,639 |
Family Income in Charlottesville
Family Income Brackets in Charlottesville
According to the Charlottesville family income data, there are 1,911 families falling into the $200,000+ income range, which is the most common income bracket and makes up 21.7% of all families. Conversely, the $15,000 to $24,999 income bracket is the least frequent group with only 167 families (1.9%) belonging to this category.
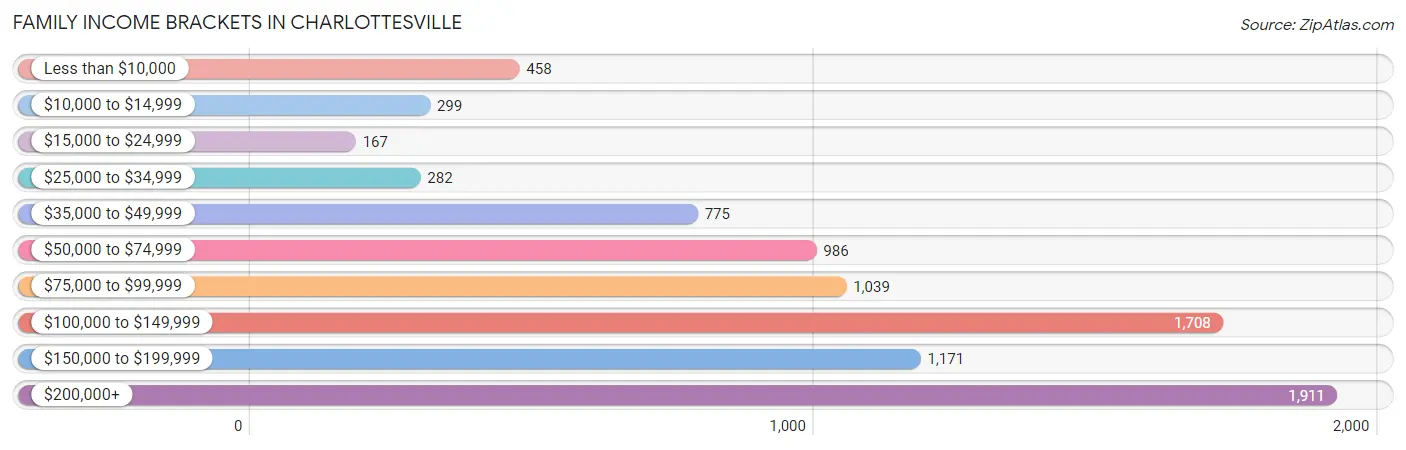
| Income Bracket | # Families | % Families |
| Less than $10,000 | 458 | 5.2% |
| $10,000 to $14,999 | 299 | 3.4% |
| $15,000 to $24,999 | 167 | 1.9% |
| $25,000 to $34,999 | 282 | 3.2% |
| $35,000 to $49,999 | 775 | 8.8% |
| $50,000 to $74,999 | 986 | 11.2% |
| $75,000 to $99,999 | 1,039 | 11.8% |
| $100,000 to $149,999 | 1,708 | 19.4% |
| $150,000 to $199,999 | 1,171 | 13.3% |
| $200,000+ | 1,911 | 21.7% |
Family Income by Famaliy Size in Charlottesville
3-person families (1,899 | 21.6%) account for the highest median family income in Charlottesville with $118,094 per family, while 2-person families (4,521 | 51.3%) have the highest median income of $52,528 per family member.
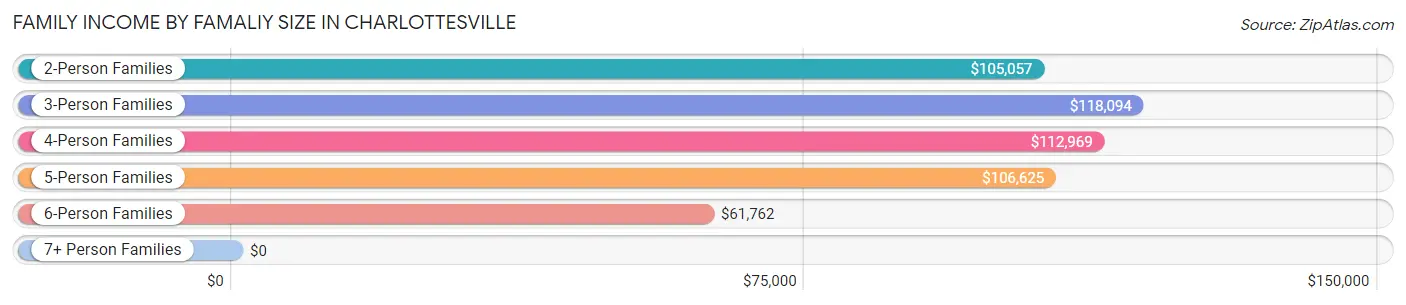
| Income Bracket | # Families | Median Income |
| 2-Person Families | 4,521 (51.3%) | $105,057 |
| 3-Person Families | 1,899 (21.6%) | $118,094 |
| 4-Person Families | 1,552 (17.6%) | $112,969 |
| 5-Person Families | 523 (5.9%) | $106,625 |
| 6-Person Families | 294 (3.3%) | $61,762 |
| 7+ Person Families | 16 (0.2%) | $0 |
| Total | 8,805 (100.0%) | $105,994 |
Family Income by Number of Earners in Charlottesville
The median family income in Charlottesville is $105,994, with families comprising 2 earners (4,372) having the highest median family income of $148,622, while families with no earners (1,110) have the lowest median family income of $55,294, accounting for 49.6% and 12.6% of families, respectively.
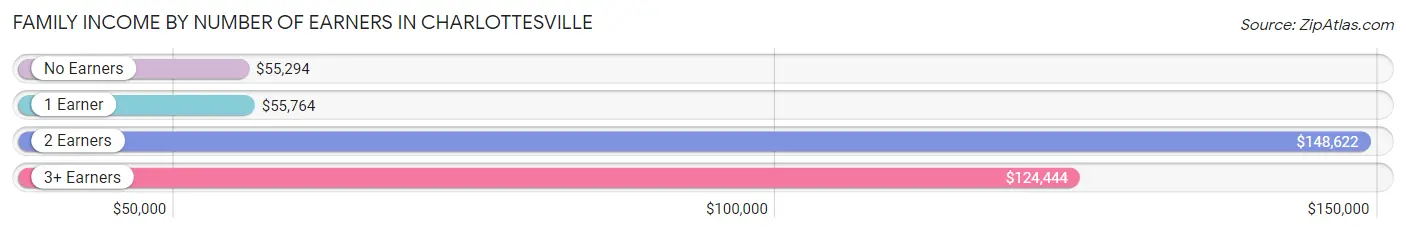
| Number of Earners | # Families | Median Income |
| No Earners | 1,110 (12.6%) | $55,294 |
| 1 Earner | 2,551 (29.0%) | $55,764 |
| 2 Earners | 4,372 (49.6%) | $148,622 |
| 3+ Earners | 772 (8.8%) | $124,444 |
| Total | 8,805 (100.0%) | $105,994 |
Household Income in Charlottesville
Household Income Brackets in Charlottesville
With 2,810 households falling in the category, the $100,000 to $149,999 income range is the most frequent in Charlottesville, accounting for 14.4% of all households. In contrast, only 956 households (4.9%) fall into the $10,000 to $14,999 income bracket, making it the least populous group.
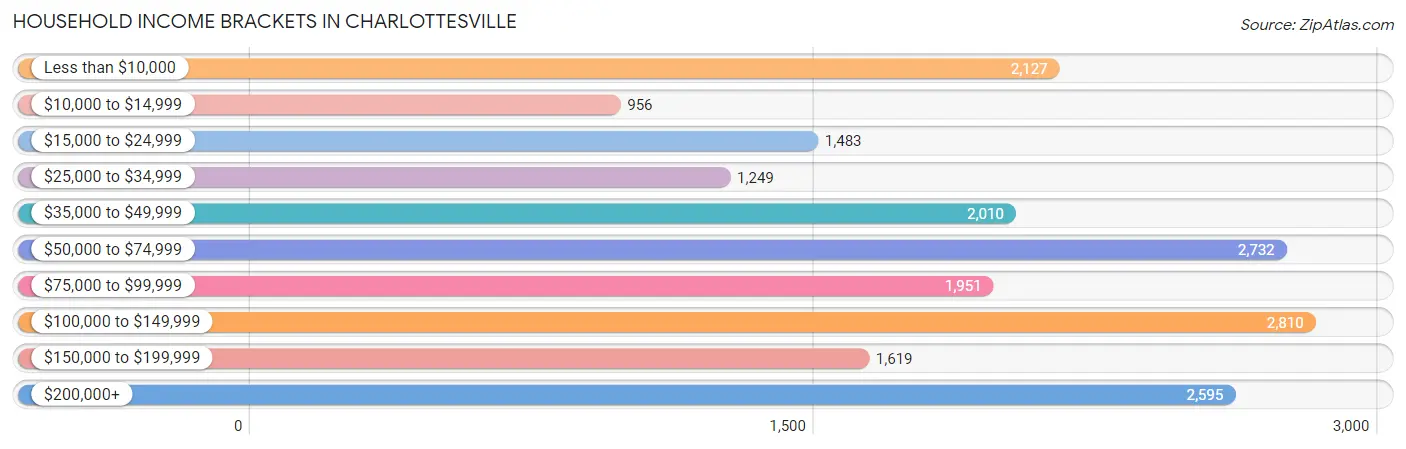
| Income Bracket | # Households | % Households |
| Less than $10,000 | 2,127 | 10.9% |
| $10,000 to $14,999 | 956 | 4.9% |
| $15,000 to $24,999 | 1,483 | 7.6% |
| $25,000 to $34,999 | 1,249 | 6.4% |
| $35,000 to $49,999 | 2,010 | 10.3% |
| $50,000 to $74,999 | 2,732 | 14.0% |
| $75,000 to $99,999 | 1,951 | 10.0% |
| $100,000 to $149,999 | 2,810 | 14.4% |
| $150,000 to $199,999 | 1,619 | 8.3% |
| $200,000+ | 2,595 | 13.3% |
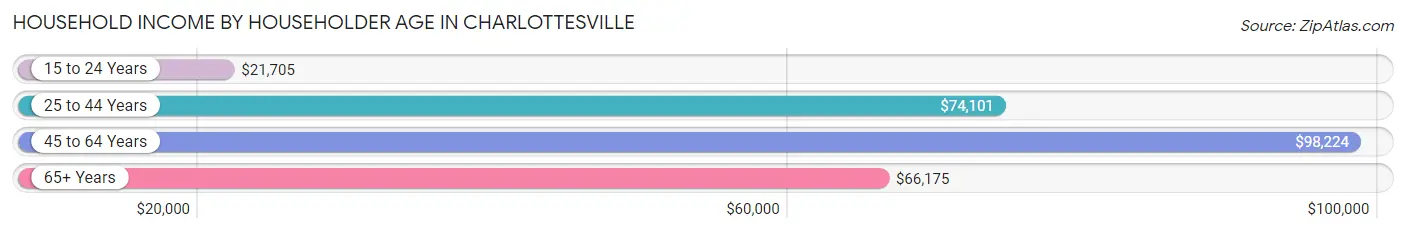
Household Income by Householder Age in Charlottesville
The median household income in Charlottesville is $67,177, with the highest median household income of $98,224 found in the 45 to 64 years age bracket for the primary householder. A total of 5,651 households (29.0%) fall into this category. Meanwhile, the 15 to 24 years age bracket for the primary householder has the lowest median household income of $21,705, with 2,210 households (11.3%) in this group.
| Income Bracket | # Households | Median Income |
| 15 to 24 Years | 2,210 (11.3%) | $21,705 |
| 25 to 44 Years | 7,783 (39.9%) | $74,101 |
| 45 to 64 Years | 5,651 (29.0%) | $98,224 |
| 65+ Years | 3,867 (19.8%) | $66,175 |
| Total | 19,511 (100.0%) | $67,177 |
Poverty in Charlottesville
Income Below Poverty by Sex and Age in Charlottesville
With 22.1% poverty level for males and 25.1% for females among the residents of Charlottesville, 18 to 24 year old males and 18 to 24 year old females are the most vulnerable to poverty, with 2,457 males (63.1%) and 2,281 females (68.6%) in their respective age groups living below the poverty level.
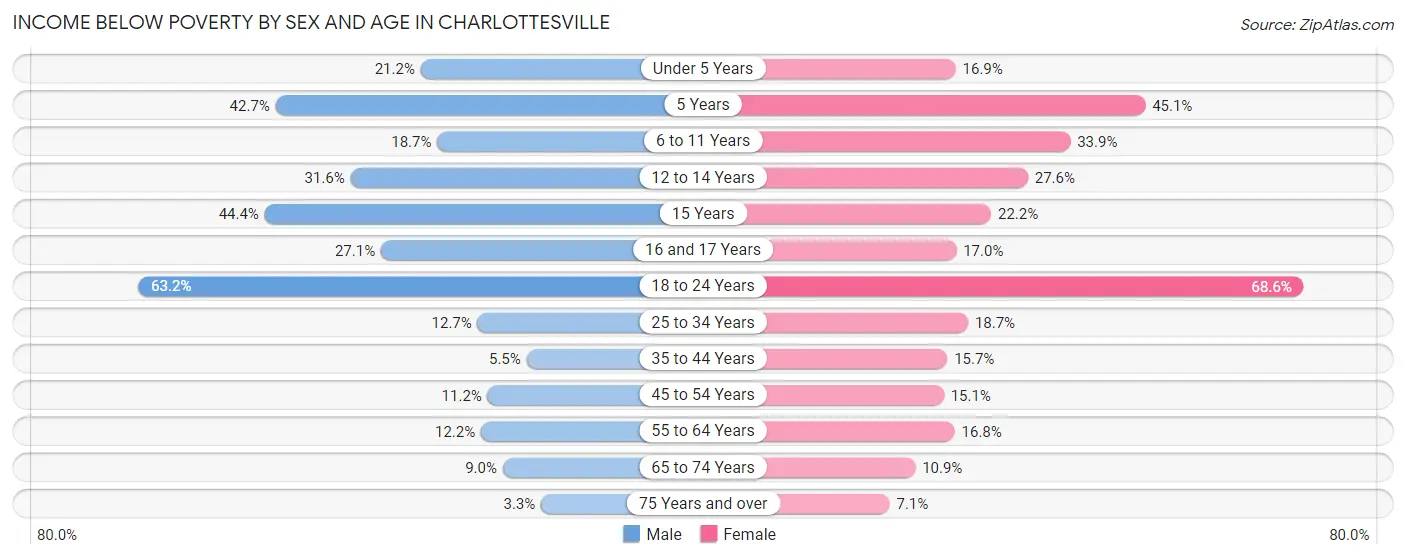
| Age Bracket | Male | Female |
| Under 5 Years | 294 (21.2%) | 167 (16.9%) |
| 5 Years | 91 (42.7%) | 50 (45.1%) |
| 6 to 11 Years | 201 (18.7%) | 460 (33.9%) |
| 12 to 14 Years | 206 (31.6%) | 132 (27.6%) |
| 15 Years | 51 (44.4%) | 41 (22.2%) |
| 16 and 17 Years | 65 (27.1%) | 52 (17.0%) |
| 18 to 24 Years | 2,457 (63.1%) | 2,281 (68.6%) |
| 25 to 34 Years | 523 (12.7%) | 795 (18.7%) |
| 35 to 44 Years | 156 (5.4%) | 475 (15.7%) |
| 45 to 54 Years | 245 (11.2%) | 355 (15.1%) |
| 55 to 64 Years | 278 (12.2%) | 404 (16.8%) |
| 65 to 74 Years | 147 (9.0%) | 213 (10.9%) |
| 75 Years and over | 28 (3.3%) | 87 (7.1%) |
| Total | 4,742 (22.1%) | 5,512 (25.1%) |
Income Above Poverty by Sex and Age in Charlottesville
According to the poverty statistics in Charlottesville, males aged 75 years and over and females aged 75 years and over are the age groups that are most secure financially, with 96.7% of males and 92.9% of females in these age groups living above the poverty line.
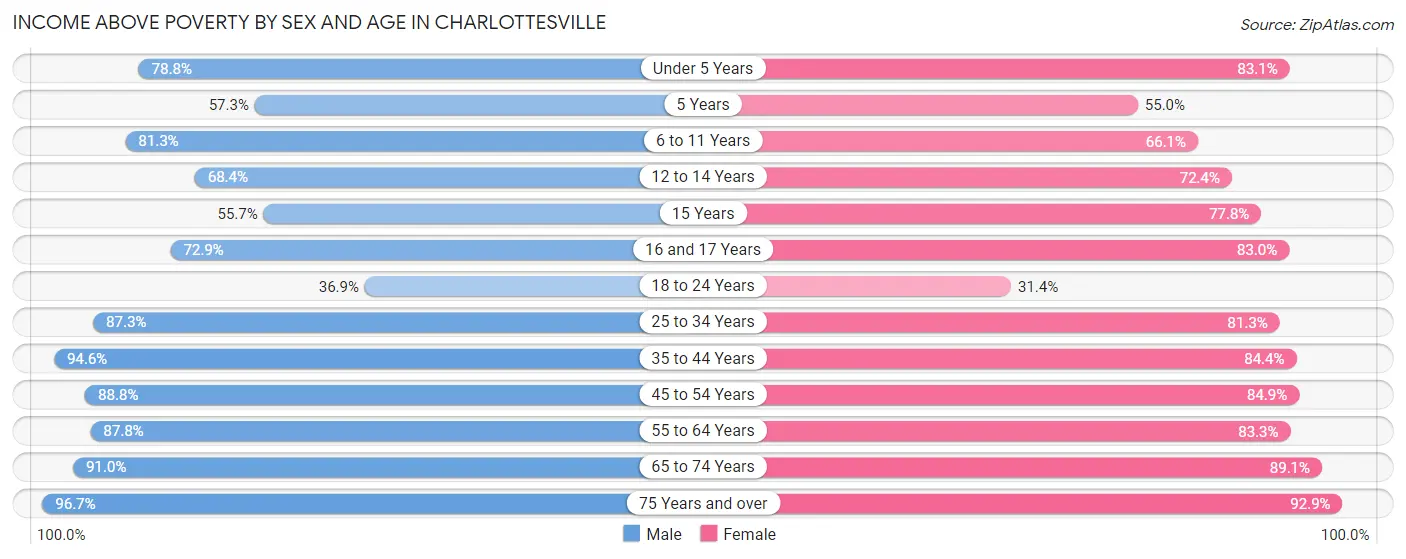
| Age Bracket | Male | Female |
| Under 5 Years | 1,094 (78.8%) | 821 (83.1%) |
| 5 Years | 122 (57.3%) | 61 (54.9%) |
| 6 to 11 Years | 873 (81.3%) | 896 (66.1%) |
| 12 to 14 Years | 446 (68.4%) | 346 (72.4%) |
| 15 Years | 64 (55.6%) | 144 (77.8%) |
| 16 and 17 Years | 175 (72.9%) | 254 (83.0%) |
| 18 to 24 Years | 1,434 (36.8%) | 1,045 (31.4%) |
| 25 to 34 Years | 3,586 (87.3%) | 3,450 (81.3%) |
| 35 to 44 Years | 2,707 (94.6%) | 2,561 (84.4%) |
| 45 to 54 Years | 1,935 (88.8%) | 1,991 (84.9%) |
| 55 to 64 Years | 1,997 (87.8%) | 2,008 (83.3%) |
| 65 to 74 Years | 1,489 (91.0%) | 1,742 (89.1%) |
| 75 Years and over | 821 (96.7%) | 1,140 (92.9%) |
| Total | 16,743 (77.9%) | 16,459 (74.9%) |
Income Below Poverty Among Married-Couple Families in Charlottesville
The poverty statistics for married-couple families in Charlottesville show that 3.4% or 212 of the total 6,240 families live below the poverty line. Families with 5 or more children have the highest poverty rate of 100.0%, comprising of 10 families. On the other hand, families with no children have the lowest poverty rate of 2.4%, which includes 86 families.
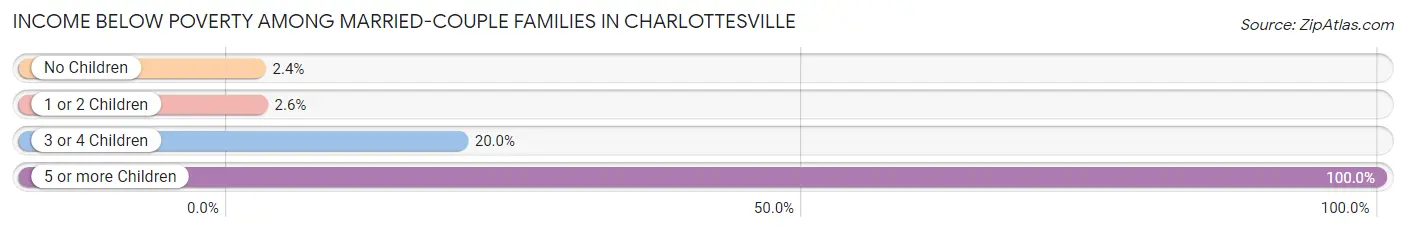
| Children | Above Poverty | Below Poverty |
| No Children | 3,498 (97.6%) | 86 (2.4%) |
| 1 or 2 Children | 2,310 (97.4%) | 61 (2.6%) |
| 3 or 4 Children | 220 (80.0%) | 55 (20.0%) |
| 5 or more Children | 0 (0.0%) | 10 (100.0%) |
| Total | 6,028 (96.6%) | 212 (3.4%) |
Income Below Poverty Among Single-Parent Households in Charlottesville
According to the poverty data in Charlottesville, 7.6% or 53 single-father households and 32.2% or 603 single-mother households are living below the poverty line. Among single-father households, those with no children have the highest poverty rate, with 42 households (17.8%) experiencing poverty. Likewise, among single-mother households, those with 5 or more children have the highest poverty rate, with 92 households (91.1%) falling below the poverty line.
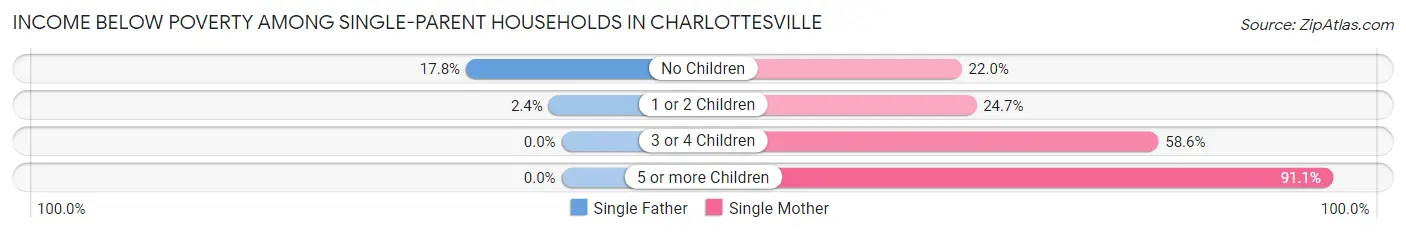
| Children | Single Father | Single Mother |
| No Children | 42 (17.8%) | 153 (22.0%) |
| 1 or 2 Children | 11 (2.4%) | 198 (24.7%) |
| 3 or 4 Children | 0 (0.0%) | 160 (58.6%) |
| 5 or more Children | 0 (0.0%) | 92 (91.1%) |
| Total | 53 (7.6%) | 603 (32.2%) |
Income Below Poverty Among Married-Couple vs Single-Parent Households in Charlottesville
The poverty data for Charlottesville shows that 212 of the married-couple family households (3.4%) and 656 of the single-parent households (25.6%) are living below the poverty level. Within the married-couple family households, those with 5 or more children have the highest poverty rate, with 10 households (100.0%) falling below the poverty line. Among the single-parent households, those with 5 or more children have the highest poverty rate, with 92 household (91.1%) living below poverty.
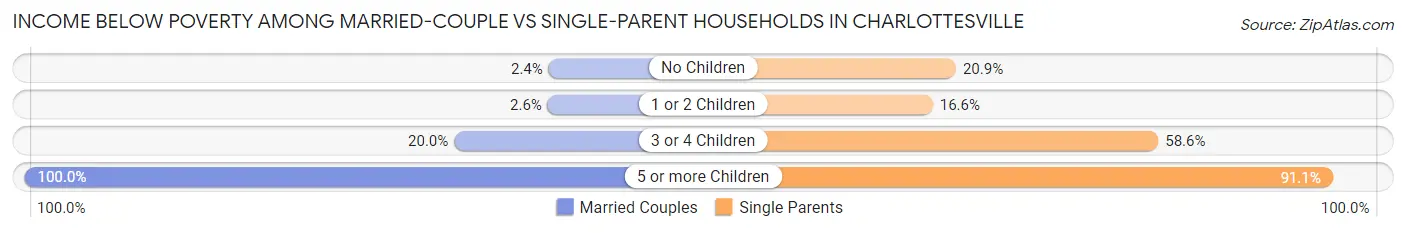
| Children | Married-Couple Families | Single-Parent Households |
| No Children | 86 (2.4%) | 195 (20.9%) |
| 1 or 2 Children | 61 (2.6%) | 209 (16.6%) |
| 3 or 4 Children | 55 (20.0%) | 160 (58.6%) |
| 5 or more Children | 10 (100.0%) | 92 (91.1%) |
| Total | 212 (3.4%) | 656 (25.6%) |
Race in Charlottesville
The most populous races in Charlottesville are White / Caucasian (31,716 | 68.5%), Black / African American (7,945 | 17.2%), and Asian (3,237 | 7.0%).
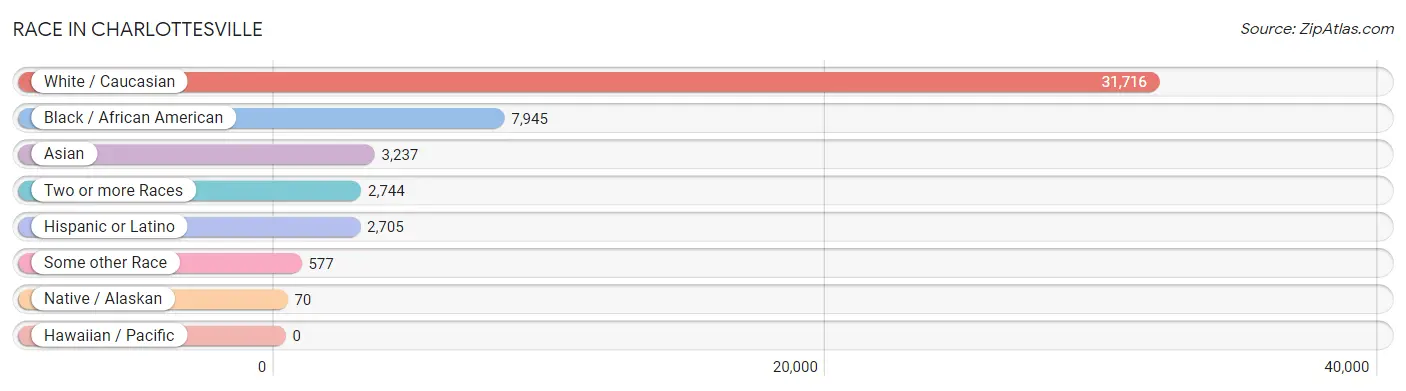
| Race | # Population | % Population |
| Asian | 3,237 | 7.0% |
| Black / African American | 7,945 | 17.2% |
| Hawaiian / Pacific | 0 | 0.0% |
| Hispanic or Latino | 2,705 | 5.8% |
| Native / Alaskan | 70 | 0.2% |
| White / Caucasian | 31,716 | 68.5% |
| Two or more Races | 2,744 | 5.9% |
| Some other Race | 577 | 1.3% |
| Total | 46,289 | 100.0% |
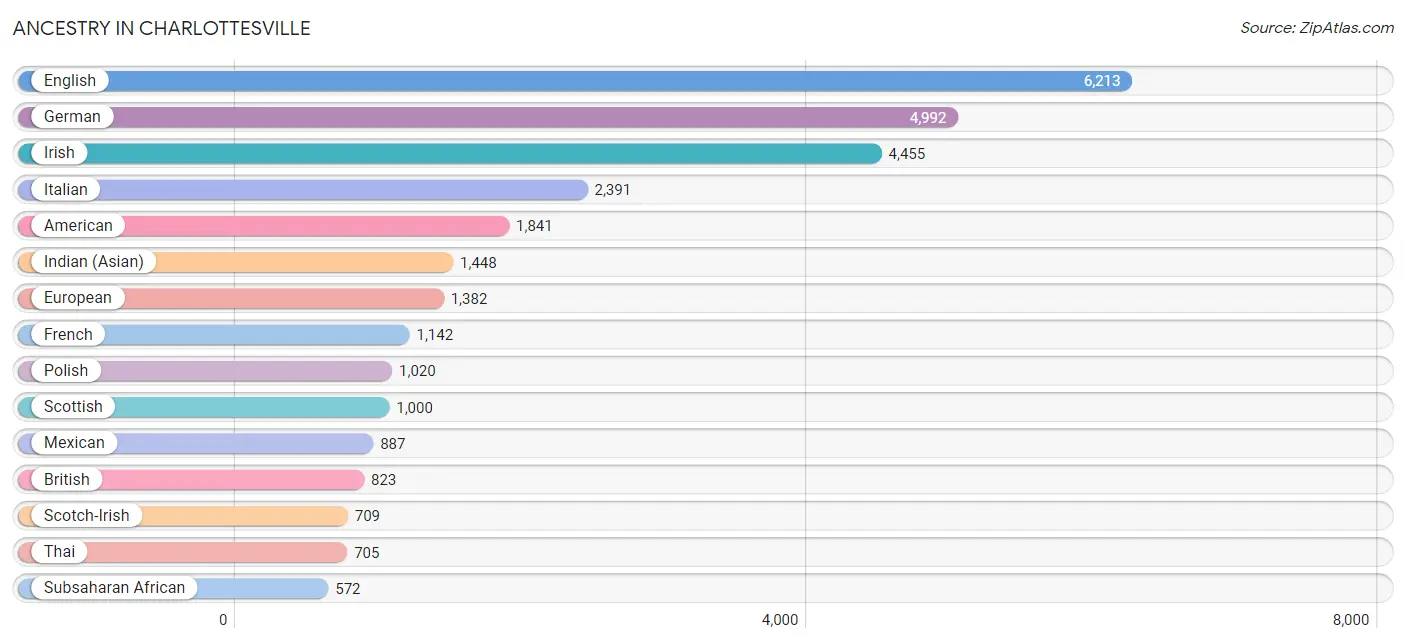
Ancestry in Charlottesville
The most populous ancestries reported in Charlottesville are English (6,213 | 13.4%), German (4,992 | 10.8%), Irish (4,455 | 9.6%), Italian (2,391 | 5.2%), and American (1,841 | 4.0%), together accounting for 43.0% of all Charlottesville residents.
| Ancestry | # Population | % Population |
| Afghan | 270 | 0.6% |
| African | 164 | 0.4% |
| American | 1,841 | 4.0% |
| Apache | 78 | 0.2% |
| Arab | 502 | 1.1% |
| Argentinean | 68 | 0.2% |
| Armenian | 54 | 0.1% |
| Australian | 9 | 0.0% |
| Austrian | 53 | 0.1% |
| Basque | 7 | 0.0% |
| Belgian | 4 | 0.0% |
| Bhutanese | 142 | 0.3% |
| Bolivian | 125 | 0.3% |
| Brazilian | 379 | 0.8% |
| British | 823 | 1.8% |
| Bulgarian | 32 | 0.1% |
| Burmese | 294 | 0.6% |
| Cambodian | 9 | 0.0% |
| Canadian | 40 | 0.1% |
| Central American | 474 | 1.0% |
| Cherokee | 197 | 0.4% |
| Chilean | 54 | 0.1% |
| Colombian | 68 | 0.2% |
| Creek | 25 | 0.1% |
| Croatian | 25 | 0.1% |
| Cuban | 312 | 0.7% |
| Czech | 232 | 0.5% |
| Danish | 86 | 0.2% |
| Dutch | 520 | 1.1% |
| Eastern European | 124 | 0.3% |
| Ecuadorian | 28 | 0.1% |
| Egyptian | 22 | 0.1% |
| English | 6,213 | 13.4% |
| Ethiopian | 135 | 0.3% |
| European | 1,382 | 3.0% |
| Filipino | 151 | 0.3% |
| Finnish | 93 | 0.2% |
| French | 1,142 | 2.5% |
| French American Indian | 4 | 0.0% |
| French Canadian | 202 | 0.4% |
| German | 4,992 | 10.8% |
| Ghanaian | 30 | 0.1% |
| Greek | 346 | 0.7% |
| Guamanian / Chamorro | 31 | 0.1% |
| Guatemalan | 44 | 0.1% |
| Haitian | 10 | 0.0% |
| Honduran | 146 | 0.3% |
| Hungarian | 223 | 0.5% |
| Icelander | 8 | 0.0% |
| Indian (Asian) | 1,448 | 3.1% |
| Indonesian | 239 | 0.5% |
| Iranian | 98 | 0.2% |
| Iraqi | 85 | 0.2% |
| Irish | 4,455 | 9.6% |
| Iroquois | 71 | 0.2% |
| Israeli | 10 | 0.0% |
| Italian | 2,391 | 5.2% |
| Jamaican | 39 | 0.1% |
| Kenyan | 5 | 0.0% |
| Korean | 288 | 0.6% |
| Latvian | 40 | 0.1% |
| Lebanese | 81 | 0.2% |
| Liberian | 73 | 0.2% |
| Lithuanian | 75 | 0.2% |
| Lumbee | 17 | 0.0% |
| Mexican | 887 | 1.9% |
| Moroccan | 47 | 0.1% |
| Native Hawaiian | 17 | 0.0% |
| Nicaraguan | 151 | 0.3% |
| Nigerian | 135 | 0.3% |
| Northern European | 109 | 0.2% |
| Norwegian | 251 | 0.5% |
| Pakistani | 29 | 0.1% |
| Panamanian | 79 | 0.2% |
| Pennsylvania German | 50 | 0.1% |
| Peruvian | 93 | 0.2% |
| Polish | 1,020 | 2.2% |
| Portuguese | 125 | 0.3% |
| Puerto Rican | 261 | 0.6% |
| Romanian | 159 | 0.3% |
| Russian | 523 | 1.1% |
| Salvadoran | 54 | 0.1% |
| Samoan | 19 | 0.0% |
| Scandinavian | 46 | 0.1% |
| Scotch-Irish | 709 | 1.5% |
| Scottish | 1,000 | 2.2% |
| Serbian | 55 | 0.1% |
| Slavic | 15 | 0.0% |
| Slovak | 97 | 0.2% |
| Slovene | 12 | 0.0% |
| South American | 473 | 1.0% |
| Spaniard | 104 | 0.2% |
| Spanish | 100 | 0.2% |
| Sri Lankan | 157 | 0.3% |
| Subsaharan African | 572 | 1.2% |
| Swedish | 404 | 0.9% |
| Swiss | 250 | 0.5% |
| Syrian | 143 | 0.3% |
| Thai | 705 | 1.5% |
| Trinidadian and Tobagonian | 12 | 0.0% |
| Tsimshian | 16 | 0.0% |
| Turkish | 68 | 0.2% |
| Ukrainian | 159 | 0.3% |
| Venezuelan | 37 | 0.1% |
| Vietnamese | 4 | 0.0% |
| Welsh | 175 | 0.4% |
| West Indian | 9 | 0.0% |
| Yugoslavian | 4 | 0.0% | View All 108 Rows |
Immigrants in Charlottesville
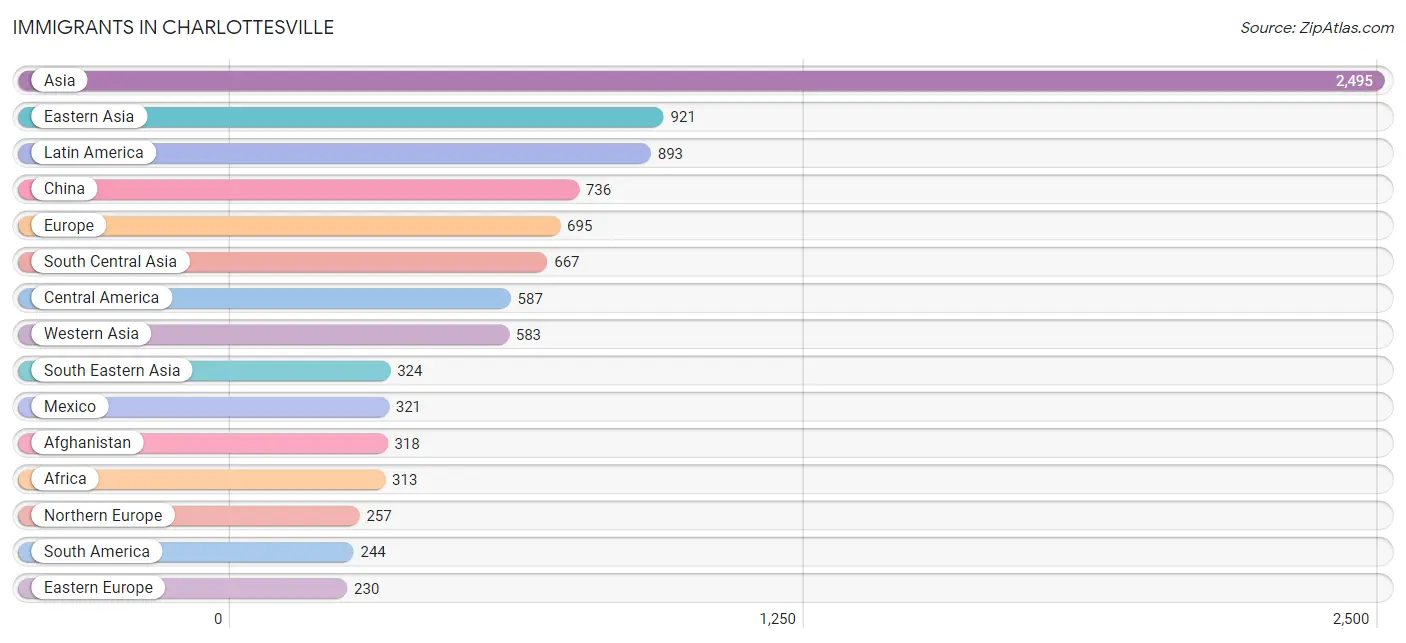
The most numerous immigrant groups reported in Charlottesville came from Asia (2,495 | 5.4%), Eastern Asia (921 | 2.0%), Latin America (893 | 1.9%), China (736 | 1.6%), and Europe (695 | 1.5%), together accounting for 12.4% of all Charlottesville residents.
| Immigration Origin | # Population | % Population |
| Afghanistan | 318 | 0.7% |
| Africa | 313 | 0.7% |
| Argentina | 42 | 0.1% |
| Asia | 2,495 | 5.4% |
| Bangladesh | 49 | 0.1% |
| Belarus | 7 | 0.0% |
| Bolivia | 34 | 0.1% |
| Bosnia and Herzegovina | 4 | 0.0% |
| Brazil | 74 | 0.2% |
| Bulgaria | 58 | 0.1% |
| Canada | 213 | 0.5% |
| Caribbean | 62 | 0.1% |
| Central America | 587 | 1.3% |
| China | 736 | 1.6% |
| Colombia | 31 | 0.1% |
| Costa Rica | 23 | 0.1% |
| Croatia | 15 | 0.0% |
| Cuba | 29 | 0.1% |
| Czechoslovakia | 7 | 0.0% |
| Eastern Africa | 122 | 0.3% |
| Eastern Asia | 921 | 2.0% |
| Eastern Europe | 230 | 0.5% |
| Egypt | 15 | 0.0% |
| El Salvador | 19 | 0.0% |
| England | 158 | 0.3% |
| Ethiopia | 93 | 0.2% |
| Europe | 695 | 1.5% |
| France | 76 | 0.2% |
| Germany | 46 | 0.1% |
| Guatemala | 44 | 0.1% |
| Honduras | 143 | 0.3% |
| Hong Kong | 19 | 0.0% |
| Hungary | 25 | 0.1% |
| India | 224 | 0.5% |
| Iran | 10 | 0.0% |
| Iraq | 133 | 0.3% |
| Ireland | 27 | 0.1% |
| Israel | 12 | 0.0% |
| Italy | 41 | 0.1% |
| Jamaica | 33 | 0.1% |
| Japan | 27 | 0.1% |
| Jordan | 34 | 0.1% |
| Kenya | 24 | 0.1% |
| Korea | 149 | 0.3% |
| Latin America | 893 | 1.9% |
| Lebanon | 20 | 0.0% |
| Liberia | 73 | 0.2% |
| Lithuania | 7 | 0.0% |
| Mexico | 321 | 0.7% |
| Middle Africa | 19 | 0.0% |
| Morocco | 13 | 0.0% |
| Nepal | 6 | 0.0% |
| Netherlands | 45 | 0.1% |
| Nicaragua | 7 | 0.0% |
| Nigeria | 27 | 0.1% |
| Northern Africa | 28 | 0.1% |
| Northern Europe | 257 | 0.6% |
| Oceania | 12 | 0.0% |
| Pakistan | 47 | 0.1% |
| Panama | 30 | 0.1% |
| Peru | 30 | 0.1% |
| Philippines | 8 | 0.0% |
| Russia | 45 | 0.1% |
| Serbia | 32 | 0.1% |
| Singapore | 78 | 0.2% |
| South Africa | 4 | 0.0% |
| South America | 244 | 0.5% |
| South Central Asia | 667 | 1.4% |
| South Eastern Asia | 324 | 0.7% |
| Southern Europe | 41 | 0.1% |
| Syria | 216 | 0.5% |
| Taiwan | 82 | 0.2% |
| Thailand | 54 | 0.1% |
| Turkey | 61 | 0.1% |
| Uganda | 5 | 0.0% |
| Ukraine | 11 | 0.0% |
| Venezuela | 33 | 0.1% |
| Vietnam | 61 | 0.1% |
| Western Africa | 100 | 0.2% |
| Western Asia | 583 | 1.3% |
| Western Europe | 167 | 0.4% |
| Zaire | 19 | 0.0% | View All 82 Rows |
Sex and Age in Charlottesville
Sex and Age in Charlottesville
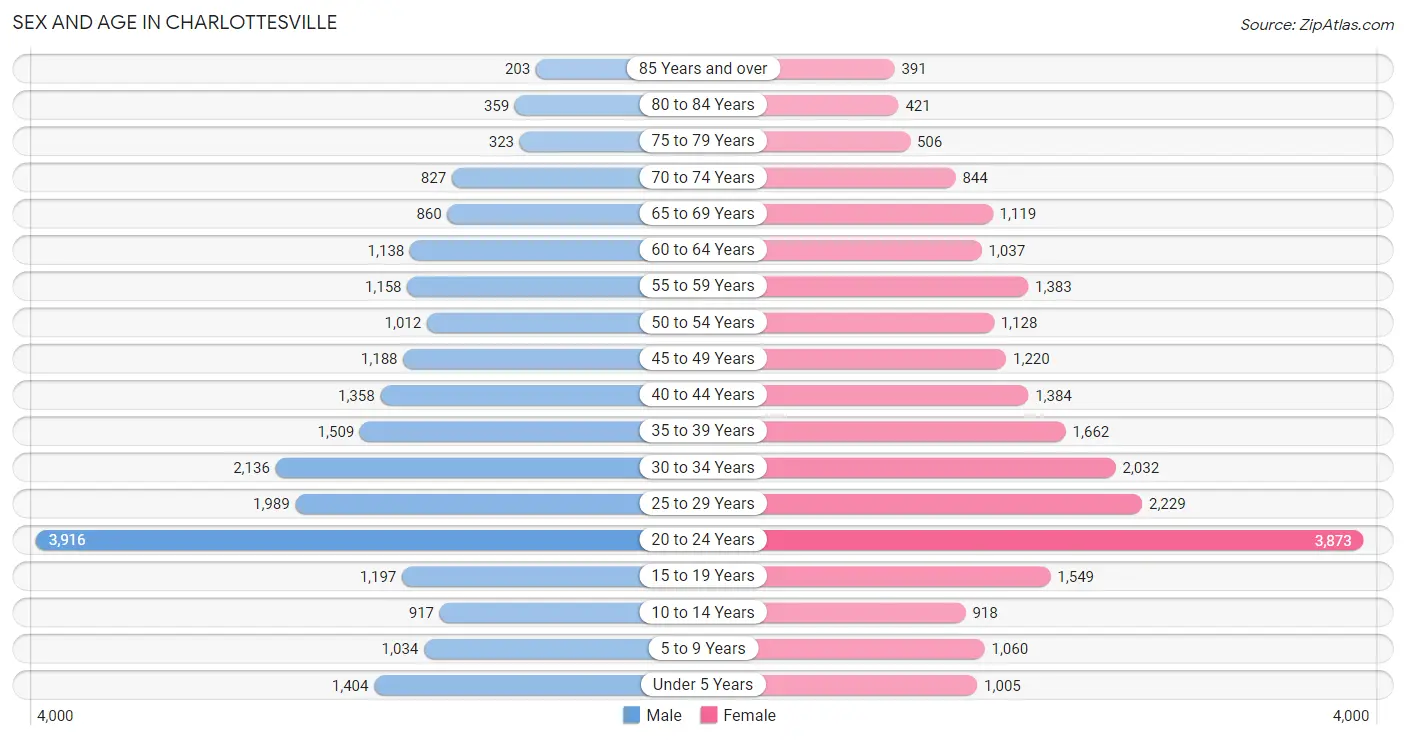
The most populous age groups in Charlottesville are 20 to 24 Years (3,916 | 17.4%) for men and 20 to 24 Years (3,873 | 16.3%) for women.
| Age Bracket | Male | Female |
| Under 5 Years | 1,404 (6.2%) | 1,005 (4.2%) |
| 5 to 9 Years | 1,034 (4.6%) | 1,060 (4.5%) |
| 10 to 14 Years | 917 (4.1%) | 918 (3.9%) |
| 15 to 19 Years | 1,197 (5.3%) | 1,549 (6.5%) |
| 20 to 24 Years | 3,916 (17.4%) | 3,873 (16.3%) |
| 25 to 29 Years | 1,989 (8.8%) | 2,229 (9.4%) |
| 30 to 34 Years | 2,136 (9.5%) | 2,032 (8.6%) |
| 35 to 39 Years | 1,509 (6.7%) | 1,662 (7.0%) |
| 40 to 44 Years | 1,358 (6.0%) | 1,384 (5.8%) |
| 45 to 49 Years | 1,188 (5.3%) | 1,220 (5.1%) |
| 50 to 54 Years | 1,012 (4.5%) | 1,128 (4.8%) |
| 55 to 59 Years | 1,158 (5.1%) | 1,383 (5.8%) |
| 60 to 64 Years | 1,138 (5.1%) | 1,037 (4.4%) |
| 65 to 69 Years | 860 (3.8%) | 1,119 (4.7%) |
| 70 to 74 Years | 827 (3.7%) | 844 (3.5%) |
| 75 to 79 Years | 323 (1.4%) | 506 (2.1%) |
| 80 to 84 Years | 359 (1.6%) | 421 (1.8%) |
| 85 Years and over | 203 (0.9%) | 391 (1.7%) |
| Total | 22,528 (100.0%) | 23,761 (100.0%) |
Families and Households in Charlottesville
Median Family Size in Charlottesville
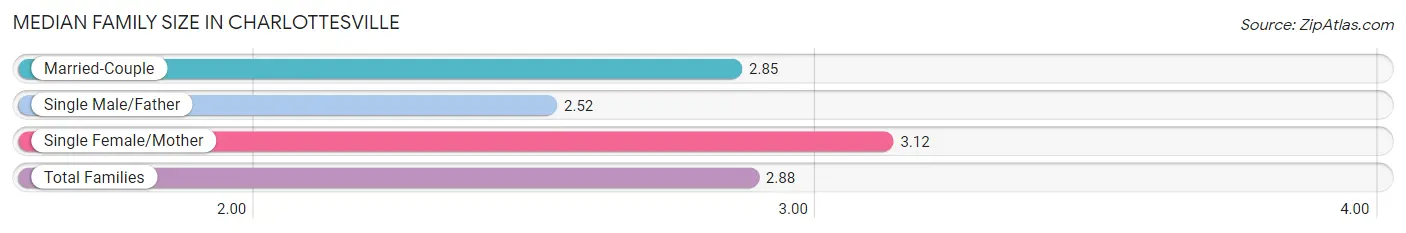
The median family size in Charlottesville is 2.88 persons per family, with single female/mother families (1,872 | 21.3%) accounting for the largest median family size of 3.12 persons per family. On the other hand, single male/father families (693 | 7.9%) represent the smallest median family size with 2.52 persons per family.
| Family Type | # Families | Family Size |
| Married-Couple | 6,240 (70.9%) | 2.85 |
| Single Male/Father | 693 (7.9%) | 2.52 |
| Single Female/Mother | 1,872 (21.3%) | 3.12 |
| Total Families | 8,805 (100.0%) | 2.88 |
Median Household Size in Charlottesville
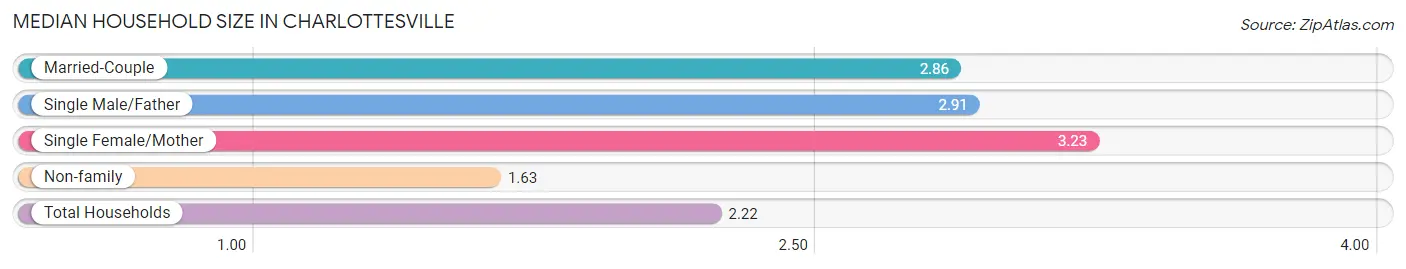
The median household size in Charlottesville is 2.22 persons per household, with single female/mother households (1,872 | 9.6%) accounting for the largest median household size of 3.23 persons per household. non-family households (10,706 | 54.9%) represent the smallest median household size with 1.63 persons per household.
| Household Type | # Households | Household Size |
| Married-Couple | 6,240 (32.0%) | 2.86 |
| Single Male/Father | 693 (3.5%) | 2.91 |
| Single Female/Mother | 1,872 (9.6%) | 3.23 |
| Non-family | 10,706 (54.9%) | 1.63 |
| Total Households | 19,511 (100.0%) | 2.22 |
Household Size by Marriage Status in Charlottesville
Out of a total of 19,511 households in Charlottesville, 8,805 (45.1%) are family households, while 10,706 (54.9%) are nonfamily households. The most numerous type of family households are 2-person households, comprising 4,240, and the most common type of nonfamily households are 1-person households, comprising 7,372.
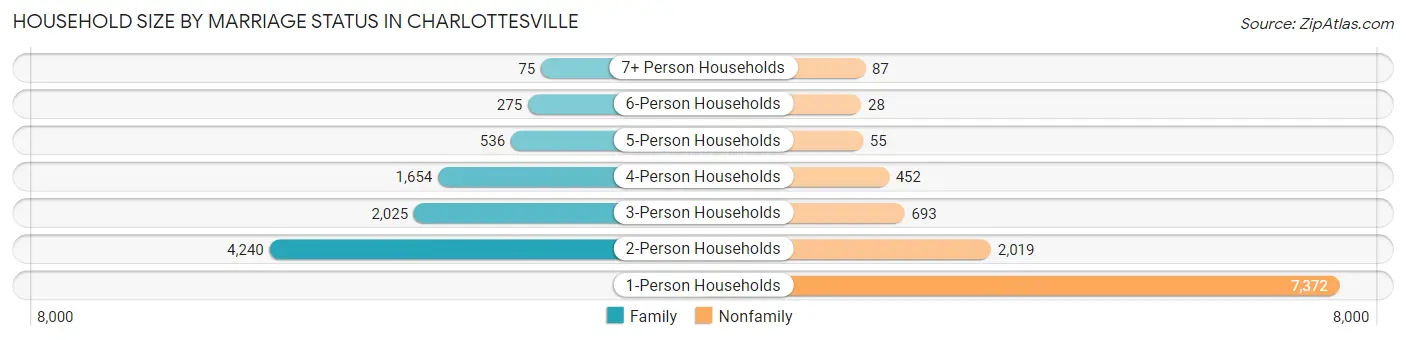
| Household Size | Family Households | Nonfamily Households |
| 1-Person Households | - | 7,372 (37.8%) |
| 2-Person Households | 4,240 (21.7%) | 2,019 (10.3%) |
| 3-Person Households | 2,025 (10.4%) | 693 (3.5%) |
| 4-Person Households | 1,654 (8.5%) | 452 (2.3%) |
| 5-Person Households | 536 (2.8%) | 55 (0.3%) |
| 6-Person Households | 275 (1.4%) | 28 (0.1%) |
| 7+ Person Households | 75 (0.4%) | 87 (0.4%) |
| Total | 8,805 (45.1%) | 10,706 (54.9%) |
Female Fertility in Charlottesville
Fertility by Age in Charlottesville
Average fertility rate in Charlottesville is 35.0 births per 1,000 women. Women in the age bracket of 20 to 34 years have the highest fertility rate with 51.0 births per 1,000 women. Women in the age bracket of 20 to 34 years acount for 83.1% of all women with births.
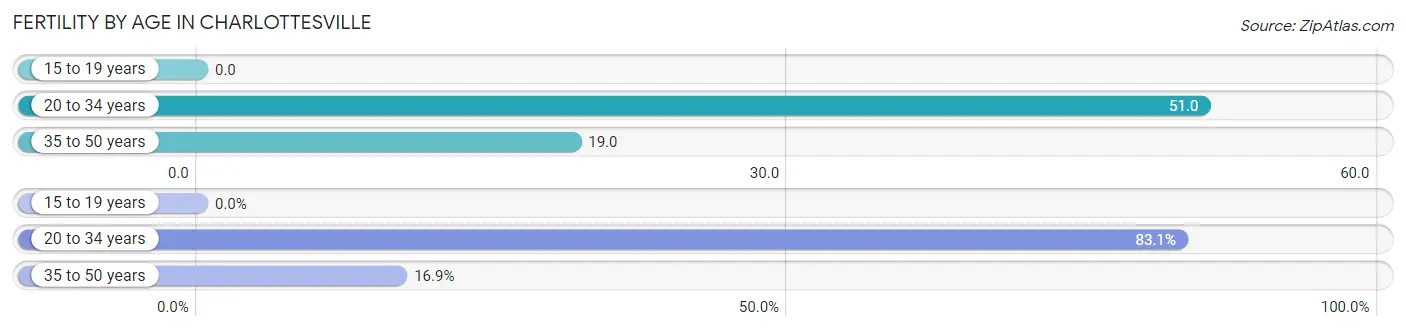
| Age Bracket | Women with Births | Births / 1,000 Women |
| 15 to 19 years | 0 (0.0%) | 0.0 |
| 20 to 34 years | 413 (83.1%) | 51.0 |
| 35 to 50 years | 84 (16.9%) | 19.0 |
| Total | 497 (100.0%) | 35.0 |
Fertility by Age by Marriage Status in Charlottesville
80.3% of women with births (497) in Charlottesville are married. The highest percentage of unmarried women with births falls into 35 to 50 years age bracket with 36.9% of them unmarried at the time of birth, while the lowest percentage of unmarried women with births belong to 20 to 34 years age bracket with 16.2% of them unmarried.
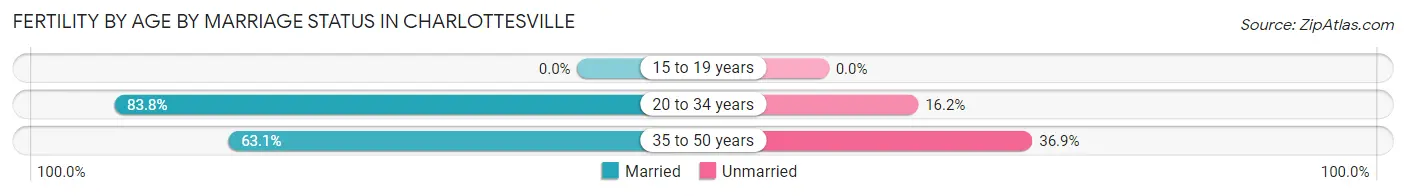
| Age Bracket | Married | Unmarried |
| 15 to 19 years | 0 (0.0%) | 0 (0.0%) |
| 20 to 34 years | 346 (83.8%) | 67 (16.2%) |
| 35 to 50 years | 53 (63.1%) | 31 (36.9%) |
| Total | 399 (80.3%) | 98 (19.7%) |
Fertility by Education in Charlottesville
Average fertility rate in Charlottesville is 35.0 births per 1,000 women. Women with the education attainment of less than high school have the highest fertility rate of 59.0 births per 1,000 women, while women with the education attainment of bachelor's degree have the lowest fertility at 18.0 births per 1,000 women. Women with the education attainment of graduate degree represent 33.2% of all women with births.
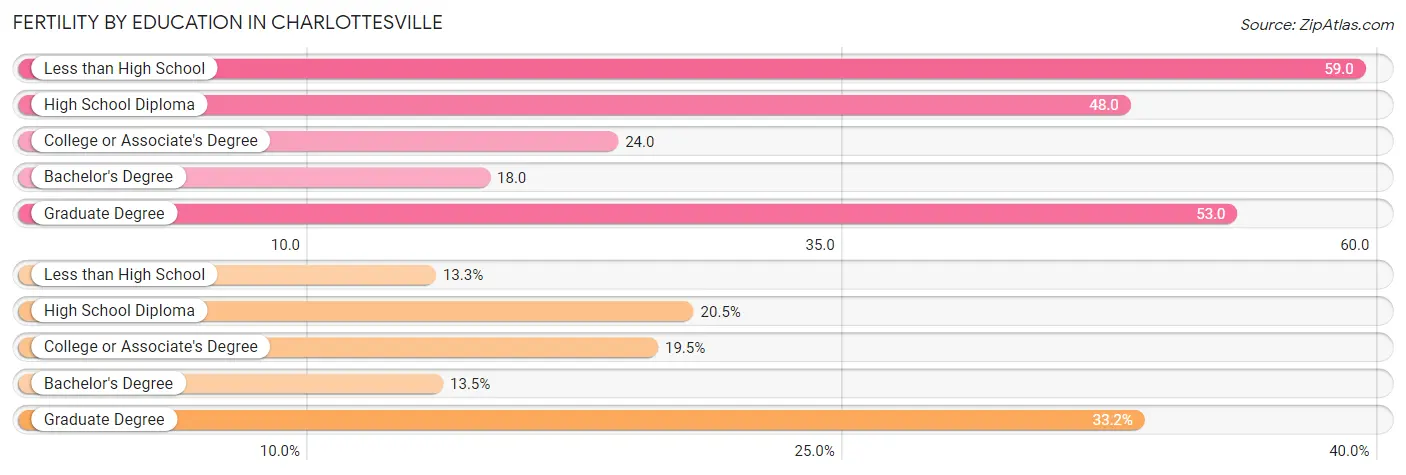
| Educational Attainment | Women with Births | Births / 1,000 Women |
| Less than High School | 66 (13.3%) | 59.0 |
| High School Diploma | 102 (20.5%) | 48.0 |
| College or Associate's Degree | 97 (19.5%) | 24.0 |
| Bachelor's Degree | 67 (13.5%) | 18.0 |
| Graduate Degree | 165 (33.2%) | 53.0 |
| Total | 497 (100.0%) | 35.0 |
Fertility by Education by Marriage Status in Charlottesville
19.7% of women with births in Charlottesville are unmarried. Women with the educational attainment of less than high school are most likely to be married with 100.0% of them married at childbirth, while women with the educational attainment of college or associate's degree are least likely to be married with 59.8% of them unmarried at childbirth.
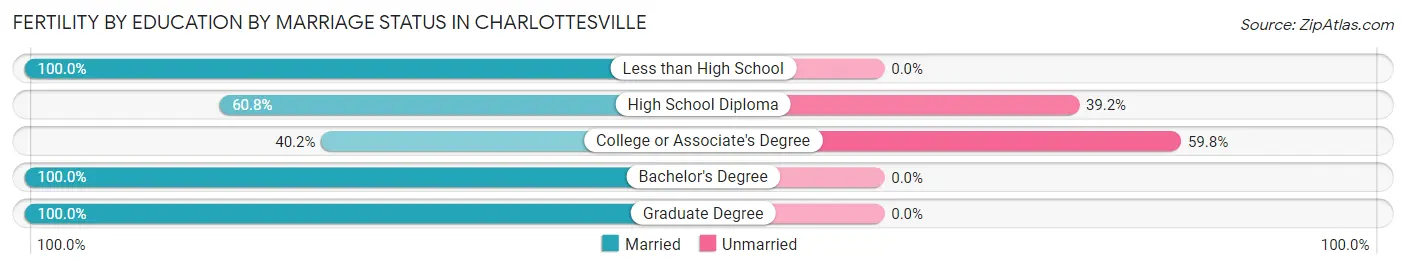
| Educational Attainment | Married | Unmarried |
| Less than High School | 66 (100.0%) | 0 (0.0%) |
| High School Diploma | 62 (60.8%) | 40 (39.2%) |
| College or Associate's Degree | 39 (40.2%) | 58 (59.8%) |
| Bachelor's Degree | 67 (100.0%) | 0 (0.0%) |
| Graduate Degree | 165 (100.0%) | 0 (0.0%) |
| Total | 399 (80.3%) | 98 (19.7%) |
Employment Characteristics in Charlottesville
Employment by Class of Employer in Charlottesville
Among the 23,670 employed individuals in Charlottesville, private company employees (11,439 | 48.3%), state government employees (4,278 | 18.1%), and not-for-profit organizations (3,624 | 15.3%) make up the most common classes of employment.
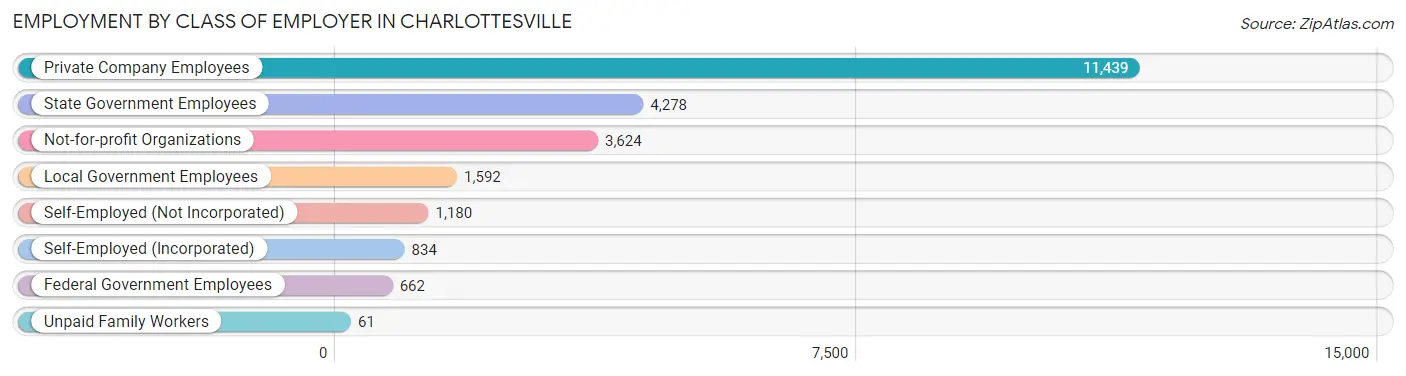
| Employer Class | # Employees | % Employees |
| Private Company Employees | 11,439 | 48.3% |
| Self-Employed (Incorporated) | 834 | 3.5% |
| Self-Employed (Not Incorporated) | 1,180 | 5.0% |
| Not-for-profit Organizations | 3,624 | 15.3% |
| Local Government Employees | 1,592 | 6.7% |
| State Government Employees | 4,278 | 18.1% |
| Federal Government Employees | 662 | 2.8% |
| Unpaid Family Workers | 61 | 0.3% |
| Total | 23,670 | 100.0% |
Employment Status by Age in Charlottesville
According to the labor force statistics for Charlottesville, out of the total population over 16 years of age (39,651), 64.0% or 25,377 individuals are in the labor force, with 5.1% or 1,294 of them unemployed. The age group with the highest labor force participation rate is 35 to 44 years, with 87.6% or 5,180 individuals in the labor force. Within the labor force, the 35 to 44 years age range has the highest percentage of unemployed individuals, with 9.2% or 477 of them being unemployed.
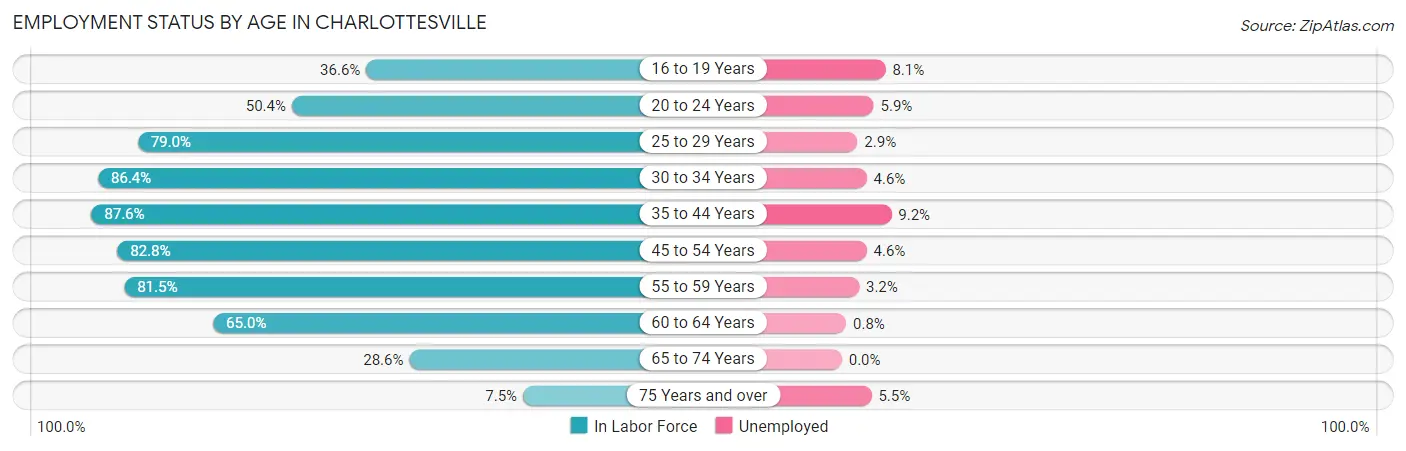
| Age Bracket | In Labor Force | Unemployed |
| 16 to 19 Years | 895 (36.6%) | 72 (8.1%) |
| 20 to 24 Years | 3,926 (50.4%) | 232 (5.9%) |
| 25 to 29 Years | 3,332 (79.0%) | 97 (2.9%) |
| 30 to 34 Years | 3,601 (86.4%) | 166 (4.6%) |
| 35 to 44 Years | 5,180 (87.6%) | 477 (9.2%) |
| 45 to 54 Years | 3,766 (82.8%) | 173 (4.6%) |
| 55 to 59 Years | 2,071 (81.5%) | 66 (3.2%) |
| 60 to 64 Years | 1,414 (65.0%) | 11 (0.8%) |
| 65 to 74 Years | 1,044 (28.6%) | 0 (0.0%) |
| 75 Years and over | 165 (7.5%) | 9 (5.5%) |
| Total | 25,377 (64.0%) | 1,294 (5.1%) |
Employment Status by Educational Attainment in Charlottesville
According to labor force statistics for Charlottesville, 82.2% of individuals (19,369) out of the total population between 25 and 64 years of age (23,563) are in the labor force, with 5.1% or 988 of them being unemployed. The group with the highest labor force participation rate are those with the educational attainment of bachelor's degree or higher, with 85.6% or 12,359 individuals in the labor force. Within the labor force, individuals with less than high school education have the highest percentage of unemployment, with 23.7% or 296 of them being unemployed.
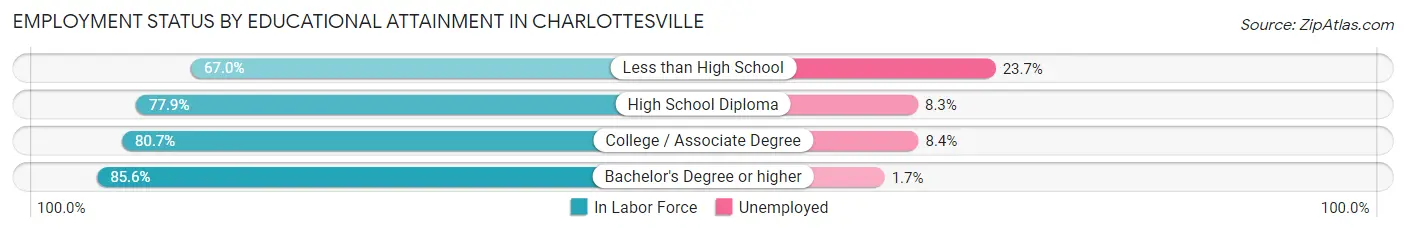
| Educational Attainment | In Labor Force | Unemployed |
| Less than High School | 1,247 (67.0%) | 441 (23.7%) |
| High School Diploma | 2,786 (77.9%) | 297 (8.3%) |
| College / Associate Degree | 2,975 (80.7%) | 310 (8.4%) |
| Bachelor's Degree or higher | 12,359 (85.6%) | 245 (1.7%) |
| Total | 19,369 (82.2%) | 1,202 (5.1%) |
Employment Occupations by Sex in Charlottesville
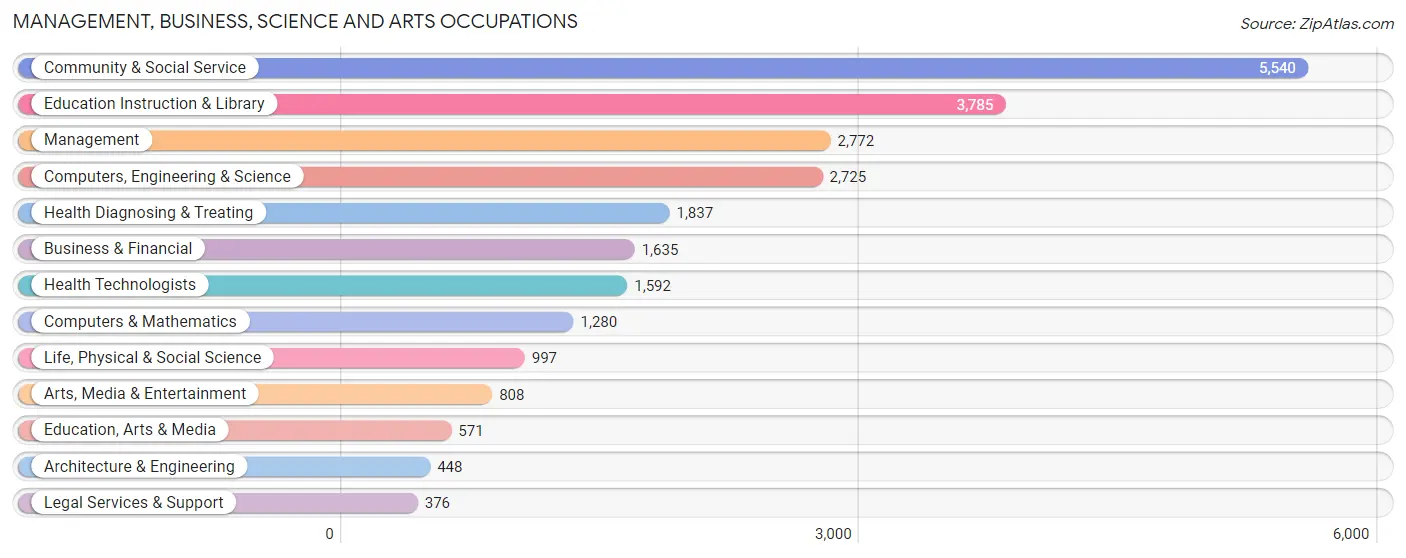
Management, Business, Science and Arts Occupations
The most common Management, Business, Science and Arts occupations in Charlottesville are Community & Social Service (5,540 | 23.1%), Education Instruction & Library (3,785 | 15.8%), Management (2,772 | 11.6%), Computers, Engineering & Science (2,725 | 11.4%), and Health Diagnosing & Treating (1,837 | 7.7%).
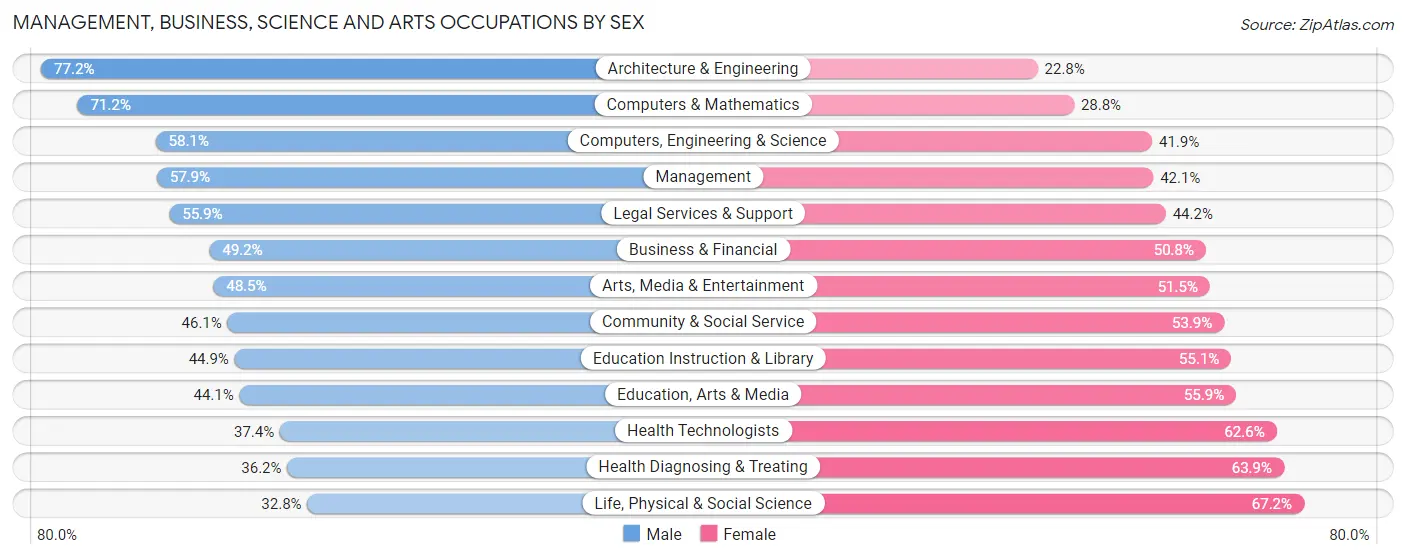
Management, Business, Science and Arts Occupations by Sex
Within the Management, Business, Science and Arts occupations in Charlottesville, the most male-oriented occupations are Architecture & Engineering (77.2%), Computers & Mathematics (71.2%), and Computers, Engineering & Science (58.1%), while the most female-oriented occupations are Life, Physical & Social Science (67.2%), Health Diagnosing & Treating (63.8%), and Health Technologists (62.6%).
| Occupation | Male | Female |
| Management | 1,606 (57.9%) | 1,166 (42.1%) |
| Business & Financial | 804 (49.2%) | 831 (50.8%) |
| Computers, Engineering & Science | 1,584 (58.1%) | 1,141 (41.9%) |
| Computers & Mathematics | 911 (71.2%) | 369 (28.8%) |
| Architecture & Engineering | 346 (77.2%) | 102 (22.8%) |
| Life, Physical & Social Science | 327 (32.8%) | 670 (67.2%) |
| Community & Social Service | 2,555 (46.1%) | 2,985 (53.9%) |
| Education, Arts & Media | 252 (44.1%) | 319 (55.9%) |
| Legal Services & Support | 210 (55.8%) | 166 (44.2%) |
| Education Instruction & Library | 1,701 (44.9%) | 2,084 (55.1%) |
| Arts, Media & Entertainment | 392 (48.5%) | 416 (51.5%) |
| Health Diagnosing & Treating | 664 (36.1%) | 1,173 (63.8%) |
| Health Technologists | 595 (37.4%) | 997 (62.6%) |
| Total (Category) | 7,213 (49.7%) | 7,296 (50.3%) |
| Total (Overall) | 11,720 (48.9%) | 12,255 (51.1%) |
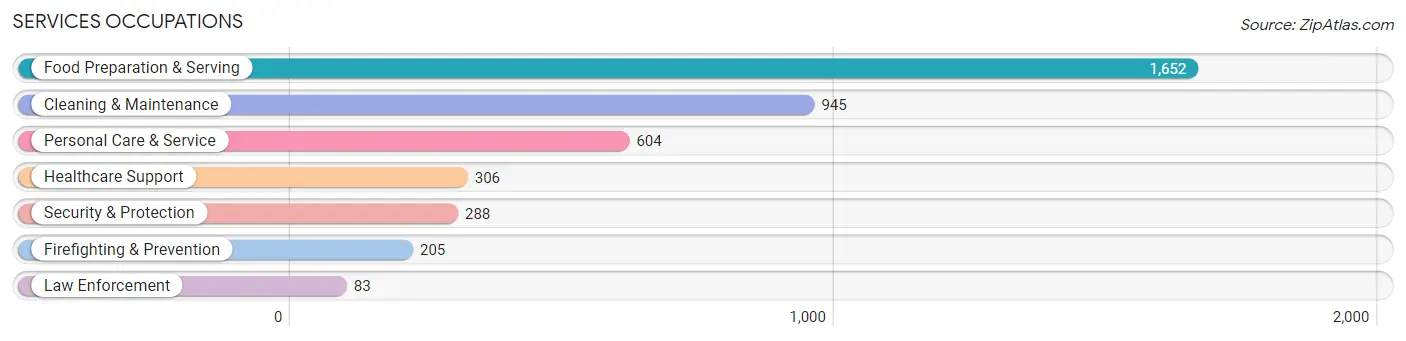
Services Occupations
The most common Services occupations in Charlottesville are Food Preparation & Serving (1,652 | 6.9%), Cleaning & Maintenance (945 | 3.9%), Personal Care & Service (604 | 2.5%), Healthcare Support (306 | 1.3%), and Security & Protection (288 | 1.2%).
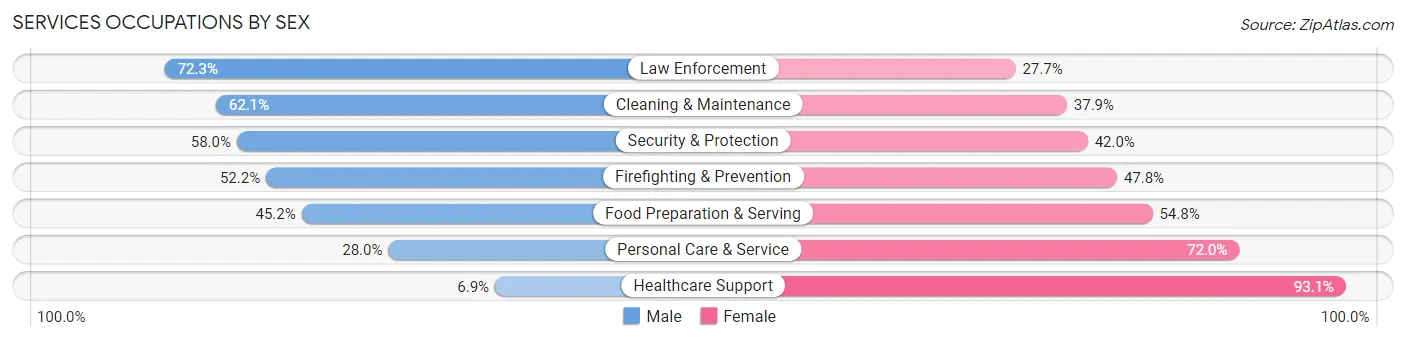
Services Occupations by Sex
Within the Services occupations in Charlottesville, the most male-oriented occupations are Law Enforcement (72.3%), Cleaning & Maintenance (62.1%), and Security & Protection (58.0%), while the most female-oriented occupations are Healthcare Support (93.1%), Personal Care & Service (72.0%), and Food Preparation & Serving (54.8%).
| Occupation | Male | Female |
| Healthcare Support | 21 (6.9%) | 285 (93.1%) |
| Security & Protection | 167 (58.0%) | 121 (42.0%) |
| Firefighting & Prevention | 107 (52.2%) | 98 (47.8%) |
| Law Enforcement | 60 (72.3%) | 23 (27.7%) |
| Food Preparation & Serving | 746 (45.2%) | 906 (54.8%) |
| Cleaning & Maintenance | 587 (62.1%) | 358 (37.9%) |
| Personal Care & Service | 169 (28.0%) | 435 (72.0%) |
| Total (Category) | 1,690 (44.5%) | 2,105 (55.5%) |
| Total (Overall) | 11,720 (48.9%) | 12,255 (51.1%) |
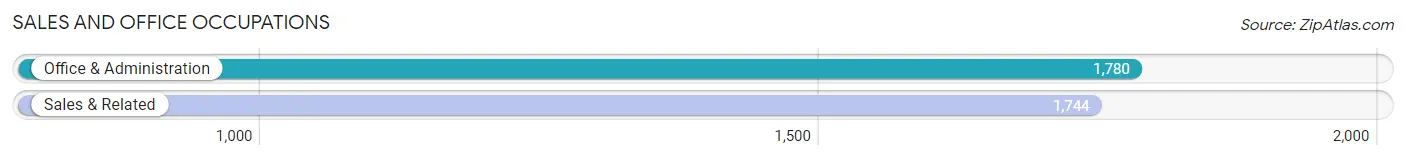
Sales and Office Occupations
The most common Sales and Office occupations in Charlottesville are Office & Administration (1,780 | 7.4%), and Sales & Related (1,744 | 7.3%).
Sales and Office Occupations by Sex
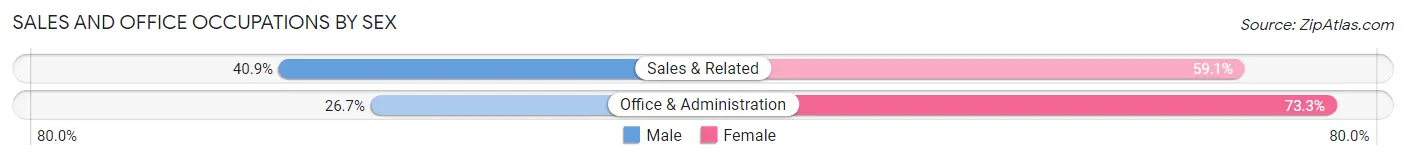
| Occupation | Male | Female |
| Sales & Related | 713 (40.9%) | 1,031 (59.1%) |
| Office & Administration | 476 (26.7%) | 1,304 (73.3%) |
| Total (Category) | 1,189 (33.7%) | 2,335 (66.3%) |
| Total (Overall) | 11,720 (48.9%) | 12,255 (51.1%) |
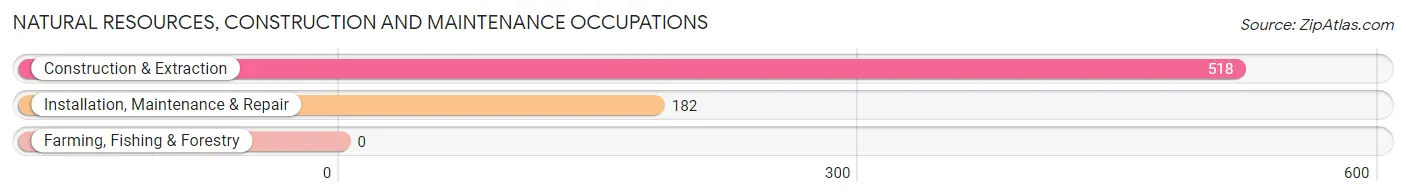
Natural Resources, Construction and Maintenance Occupations
The most common Natural Resources, Construction and Maintenance occupations in Charlottesville are Construction & Extraction (518 | 2.2%), and Installation, Maintenance & Repair (182 | 0.8%).
Natural Resources, Construction and Maintenance Occupations by Sex
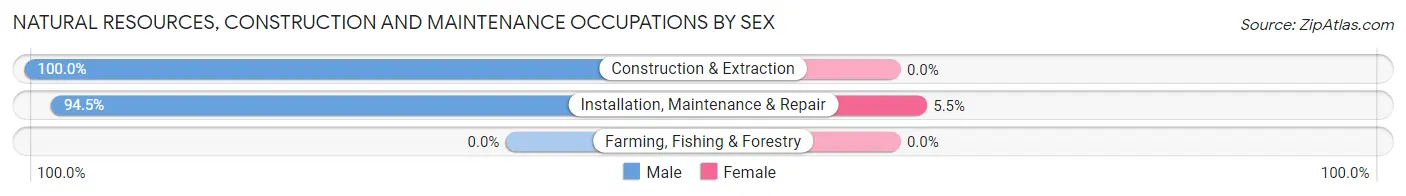
| Occupation | Male | Female |
| Farming, Fishing & Forestry | 0 (0.0%) | 0 (0.0%) |
| Construction & Extraction | 518 (100.0%) | 0 (0.0%) |
| Installation, Maintenance & Repair | 172 (94.5%) | 10 (5.5%) |
| Total (Category) | 690 (98.6%) | 10 (1.4%) |
| Total (Overall) | 11,720 (48.9%) | 12,255 (51.1%) |
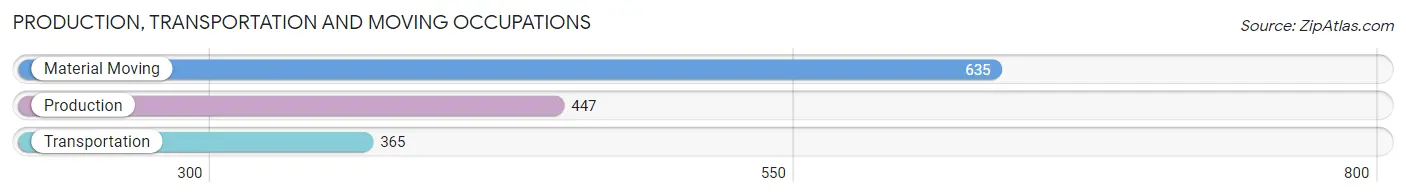
Production, Transportation and Moving Occupations
The most common Production, Transportation and Moving occupations in Charlottesville are Material Moving (635 | 2.6%), Production (447 | 1.9%), and Transportation (365 | 1.5%).
Production, Transportation and Moving Occupations by Sex
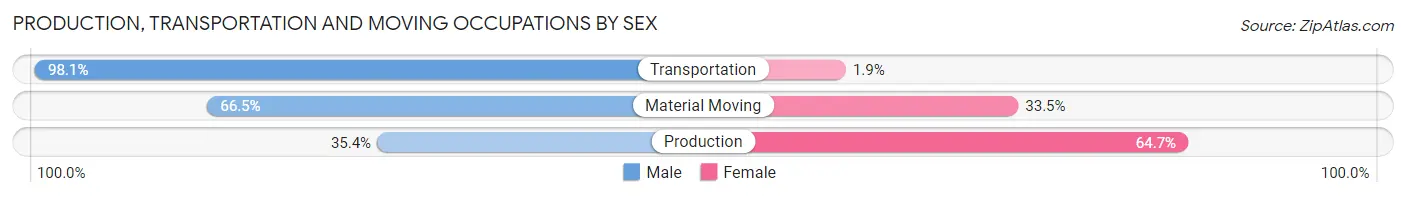
| Occupation | Male | Female |
| Production | 158 (35.3%) | 289 (64.6%) |
| Transportation | 358 (98.1%) | 7 (1.9%) |
| Material Moving | 422 (66.5%) | 213 (33.5%) |
| Total (Category) | 938 (64.8%) | 509 (35.2%) |
| Total (Overall) | 11,720 (48.9%) | 12,255 (51.1%) |
Employment Industries by Sex in Charlottesville
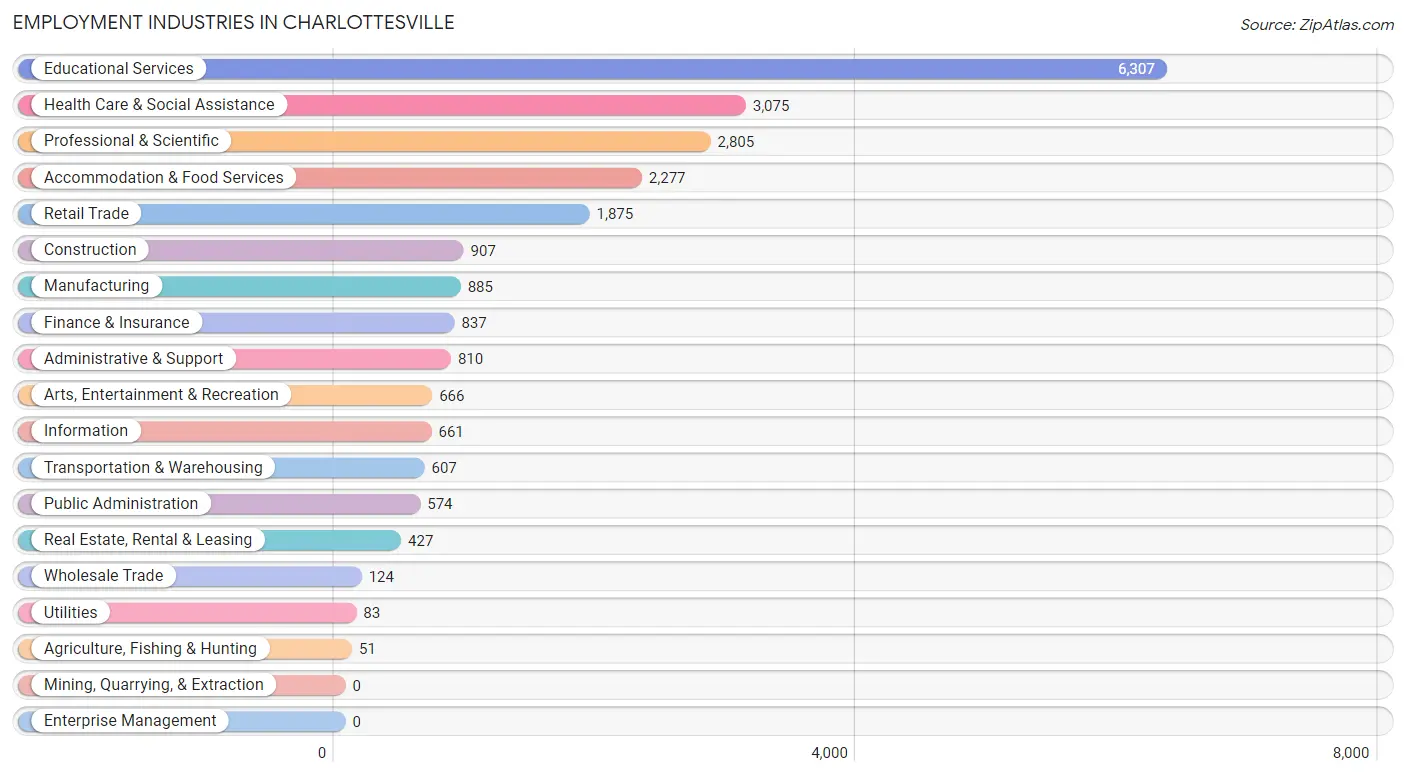
Employment Industries in Charlottesville
The major employment industries in Charlottesville include Educational Services (6,307 | 26.3%), Health Care & Social Assistance (3,075 | 12.8%), Professional & Scientific (2,805 | 11.7%), Accommodation & Food Services (2,277 | 9.5%), and Retail Trade (1,875 | 7.8%).
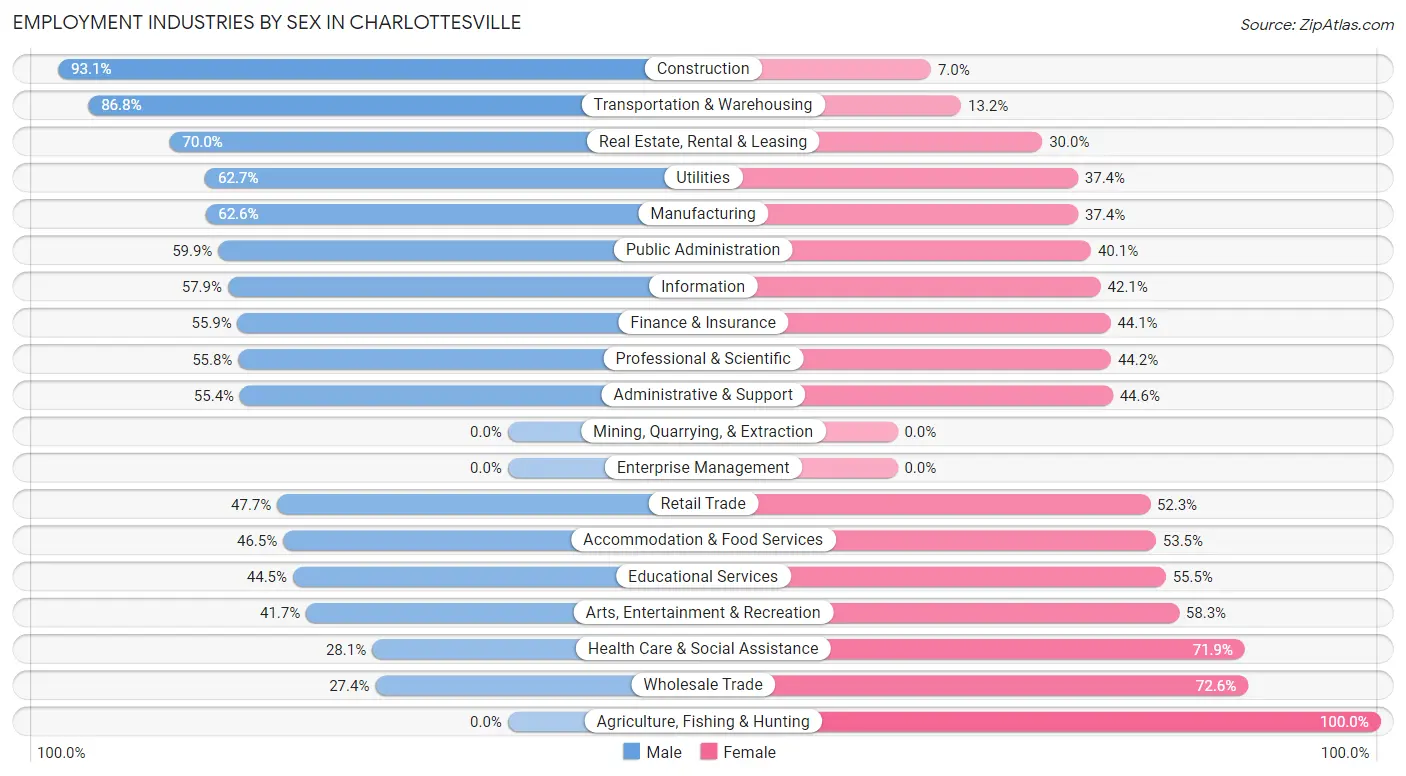
Employment Industries by Sex in Charlottesville
The Charlottesville industries that see more men than women are Construction (93.0%), Transportation & Warehousing (86.8%), and Real Estate, Rental & Leasing (70.0%), whereas the industries that tend to have a higher number of women are Agriculture, Fishing & Hunting (100.0%), Wholesale Trade (72.6%), and Health Care & Social Assistance (71.9%).
| Industry | Male | Female |
| Agriculture, Fishing & Hunting | 0 (0.0%) | 51 (100.0%) |
| Mining, Quarrying, & Extraction | 0 (0.0%) | 0 (0.0%) |
| Construction | 844 (93.0%) | 63 (7.0%) |
| Manufacturing | 554 (62.6%) | 331 (37.4%) |
| Wholesale Trade | 34 (27.4%) | 90 (72.6%) |
| Retail Trade | 895 (47.7%) | 980 (52.3%) |
| Transportation & Warehousing | 527 (86.8%) | 80 (13.2%) |
| Utilities | 52 (62.6%) | 31 (37.3%) |
| Information | 383 (57.9%) | 278 (42.1%) |
| Finance & Insurance | 468 (55.9%) | 369 (44.1%) |
| Real Estate, Rental & Leasing | 299 (70.0%) | 128 (30.0%) |
| Professional & Scientific | 1,565 (55.8%) | 1,240 (44.2%) |
| Enterprise Management | 0 (0.0%) | 0 (0.0%) |
| Administrative & Support | 449 (55.4%) | 361 (44.6%) |
| Educational Services | 2,805 (44.5%) | 3,502 (55.5%) |
| Health Care & Social Assistance | 864 (28.1%) | 2,211 (71.9%) |
| Arts, Entertainment & Recreation | 278 (41.7%) | 388 (58.3%) |
| Accommodation & Food Services | 1,059 (46.5%) | 1,218 (53.5%) |
| Public Administration | 344 (59.9%) | 230 (40.1%) |
| Total | 11,720 (48.9%) | 12,255 (51.1%) |
Education in Charlottesville
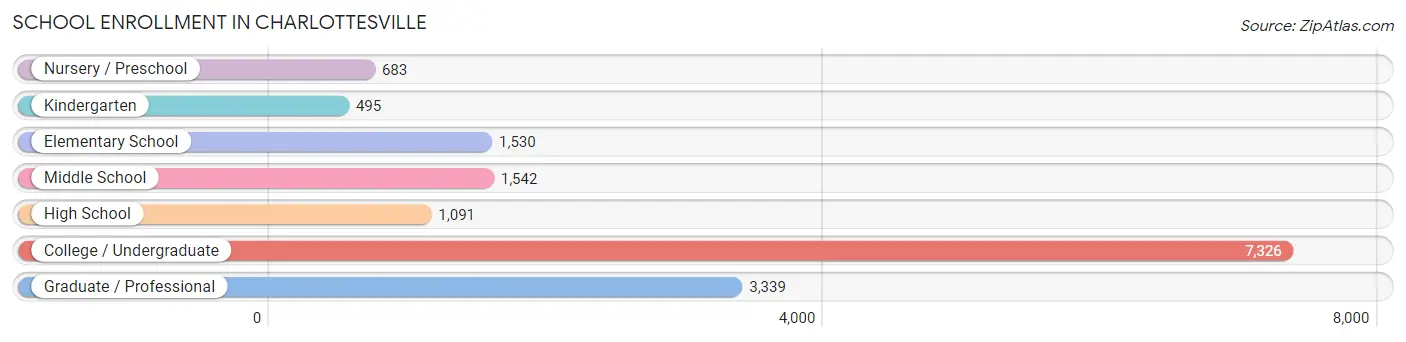
School Enrollment in Charlottesville
The most common levels of schooling among the 16,006 students in Charlottesville are college / undergraduate (7,326 | 45.8%), graduate / professional (3,339 | 20.9%), and middle school (1,542 | 9.6%).
| School Level | # Students | % Students |
| Nursery / Preschool | 683 | 4.3% |
| Kindergarten | 495 | 3.1% |
| Elementary School | 1,530 | 9.6% |
| Middle School | 1,542 | 9.6% |
| High School | 1,091 | 6.8% |
| College / Undergraduate | 7,326 | 45.8% |
| Graduate / Professional | 3,339 | 20.9% |
| Total | 16,006 | 100.0% |
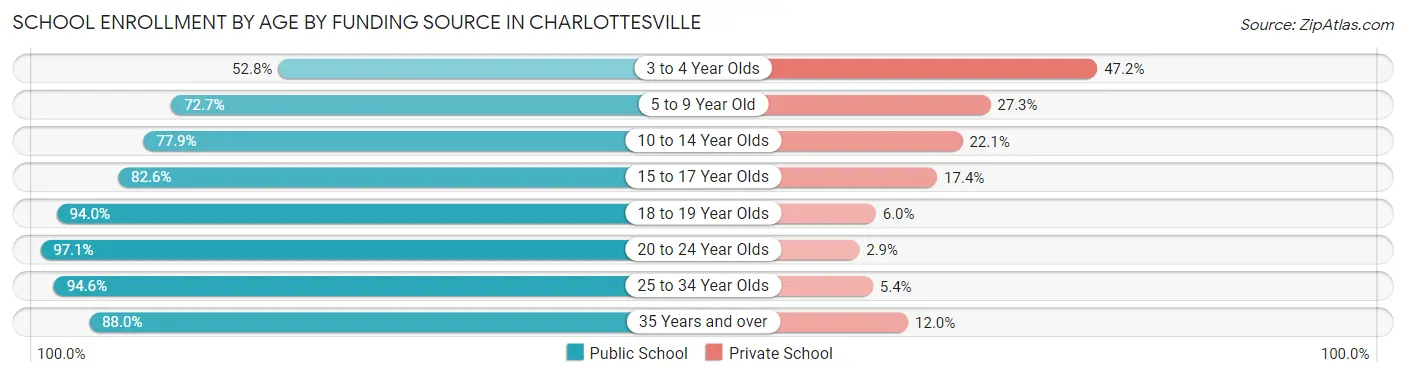
School Enrollment by Age by Funding Source in Charlottesville
Out of a total of 16,006 students who are enrolled in schools in Charlottesville, 1,841 (11.5%) attend a private institution, while the remaining 14,165 (88.5%) are enrolled in public schools. The age group of 3 to 4 year olds has the highest likelihood of being enrolled in private schools, with 290 (47.2% in the age bracket) enrolled. Conversely, the age group of 20 to 24 year olds has the lowest likelihood of being enrolled in a private school, with 6,214 (97.1% in the age bracket) attending a public institution.
| Age Bracket | Public School | Private School |
| 3 to 4 Year Olds | 324 (52.8%) | 290 (47.2%) |
| 5 to 9 Year Old | 1,389 (72.7%) | 522 (27.3%) |
| 10 to 14 Year Olds | 1,429 (77.9%) | 406 (22.1%) |
| 15 to 17 Year Olds | 669 (82.6%) | 141 (17.4%) |
| 18 to 19 Year Olds | 1,619 (94.0%) | 103 (6.0%) |
| 20 to 24 Year Olds | 6,214 (97.1%) | 186 (2.9%) |
| 25 to 34 Year Olds | 1,999 (94.6%) | 115 (5.4%) |
| 35 Years and over | 528 (88.0%) | 72 (12.0%) |
| Total | 14,165 (88.5%) | 1,841 (11.5%) |
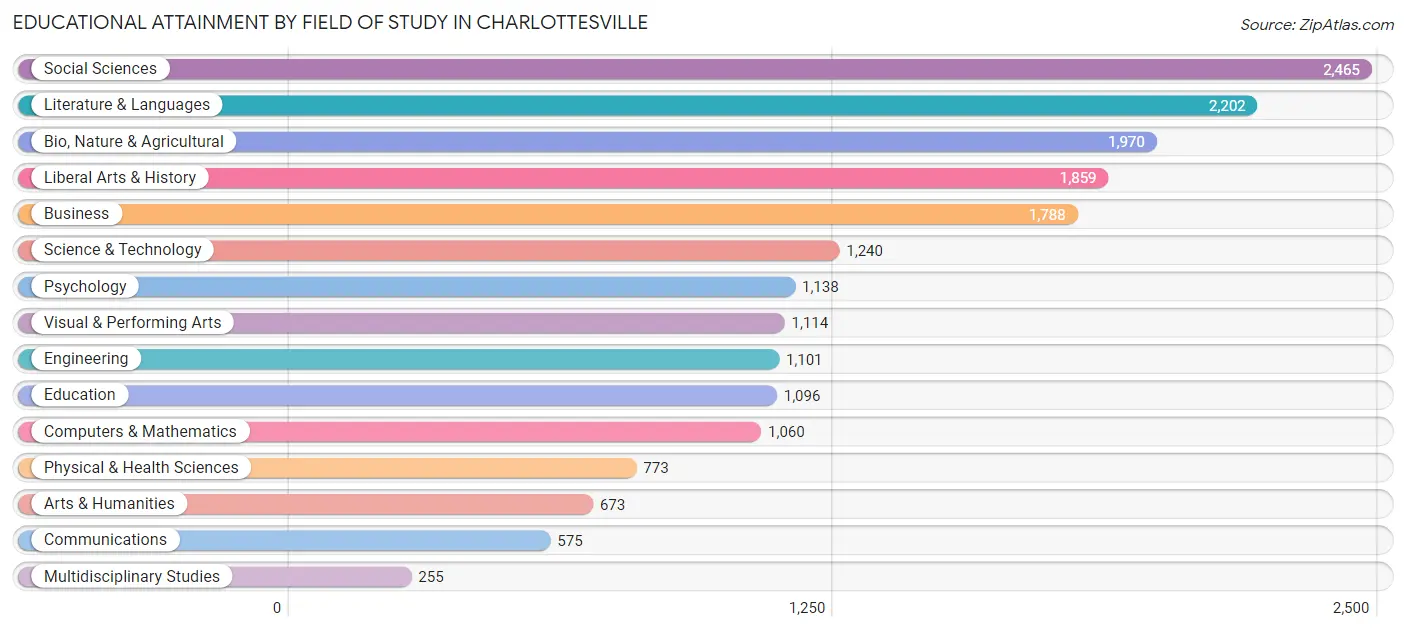
Educational Attainment by Field of Study in Charlottesville
Social sciences (2,465 | 12.8%), literature & languages (2,202 | 11.4%), bio, nature & agricultural (1,970 | 10.2%), liberal arts & history (1,859 | 9.6%), and business (1,788 | 9.3%) are the most common fields of study among 19,309 individuals in Charlottesville who have obtained a bachelor's degree or higher.
| Field of Study | # Graduates | % Graduates |
| Computers & Mathematics | 1,060 | 5.5% |
| Bio, Nature & Agricultural | 1,970 | 10.2% |
| Physical & Health Sciences | 773 | 4.0% |
| Psychology | 1,138 | 5.9% |
| Social Sciences | 2,465 | 12.8% |
| Engineering | 1,101 | 5.7% |
| Multidisciplinary Studies | 255 | 1.3% |
| Science & Technology | 1,240 | 6.4% |
| Business | 1,788 | 9.3% |
| Education | 1,096 | 5.7% |
| Literature & Languages | 2,202 | 11.4% |
| Liberal Arts & History | 1,859 | 9.6% |
| Visual & Performing Arts | 1,114 | 5.8% |
| Communications | 575 | 3.0% |
| Arts & Humanities | 673 | 3.5% |
| Total | 19,309 | 100.0% |
Transportation & Commute in Charlottesville
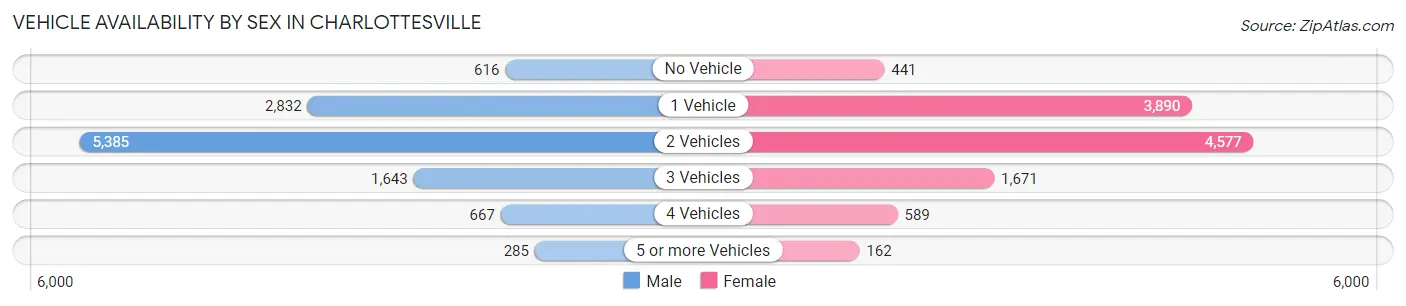
Vehicle Availability by Sex in Charlottesville
The most prevalent vehicle ownership categories in Charlottesville are males with 2 vehicles (5,385, accounting for 47.1%) and females with 2 vehicles (4,577, making up 47.5%).
| Vehicles Available | Male | Female |
| No Vehicle | 616 (5.4%) | 441 (3.9%) |
| 1 Vehicle | 2,832 (24.8%) | 3,890 (34.3%) |
| 2 Vehicles | 5,385 (47.1%) | 4,577 (40.4%) |
| 3 Vehicles | 1,643 (14.4%) | 1,671 (14.7%) |
| 4 Vehicles | 667 (5.8%) | 589 (5.2%) |
| 5 or more Vehicles | 285 (2.5%) | 162 (1.4%) |
| Total | 11,428 (100.0%) | 11,330 (100.0%) |
Commute Time in Charlottesville
The most frequently occuring commute durations in Charlottesville are 10 to 14 minutes (5,466 commuters, 28.2%), 15 to 19 minutes (4,513 commuters, 23.3%), and 5 to 9 minutes (3,347 commuters, 17.3%).
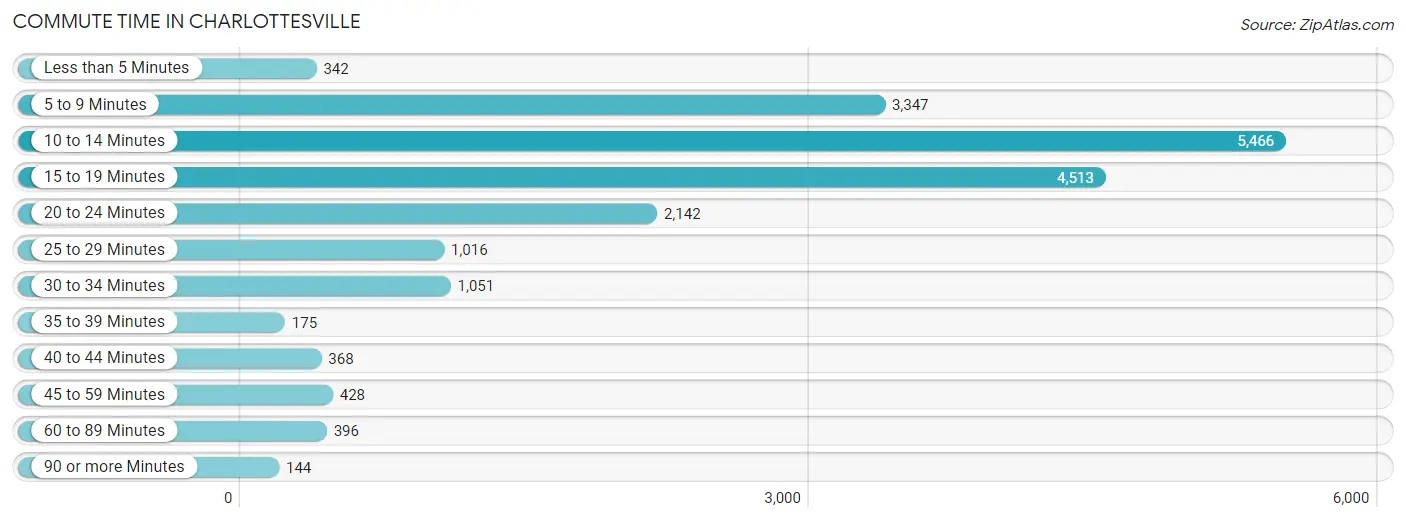
| Commute Time | # Commuters | % Commuters |
| Less than 5 Minutes | 342 | 1.8% |
| 5 to 9 Minutes | 3,347 | 17.3% |
| 10 to 14 Minutes | 5,466 | 28.2% |
| 15 to 19 Minutes | 4,513 | 23.3% |
| 20 to 24 Minutes | 2,142 | 11.1% |
| 25 to 29 Minutes | 1,016 | 5.2% |
| 30 to 34 Minutes | 1,051 | 5.4% |
| 35 to 39 Minutes | 175 | 0.9% |
| 40 to 44 Minutes | 368 | 1.9% |
| 45 to 59 Minutes | 428 | 2.2% |
| 60 to 89 Minutes | 396 | 2.0% |
| 90 or more Minutes | 144 | 0.7% |
Commute Time by Sex in Charlottesville
The most common commute times in Charlottesville are 10 to 14 minutes (2,608 commuters, 27.4%) for males and 10 to 14 minutes (2,858 commuters, 29.0%) for females.
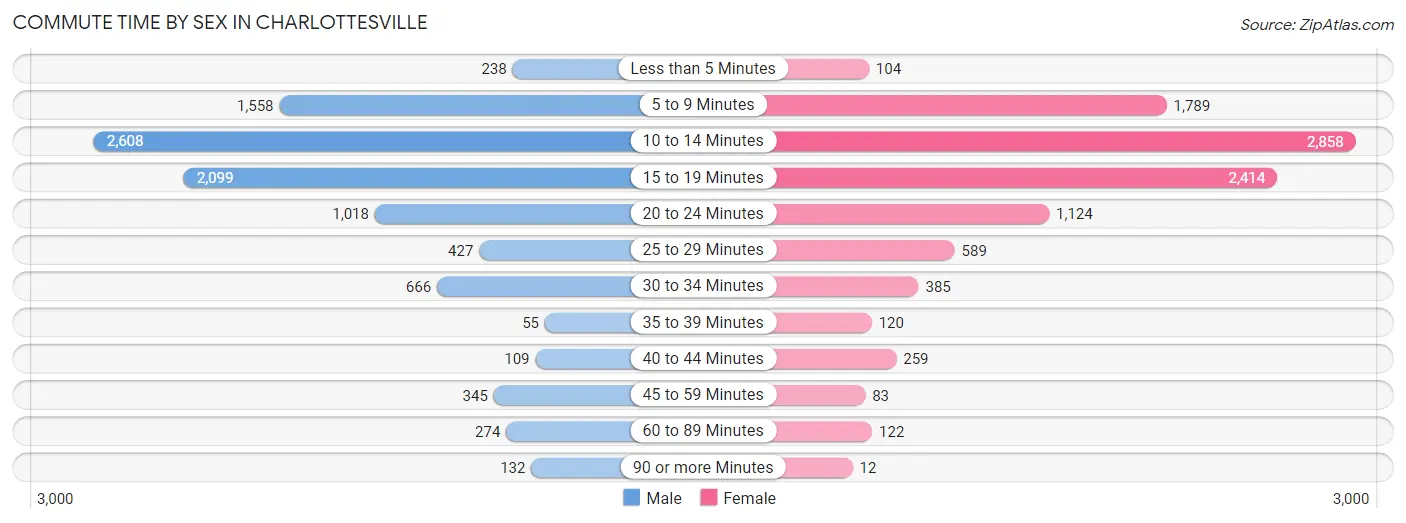
| Commute Time | Male | Female |
| Less than 5 Minutes | 238 (2.5%) | 104 (1.1%) |
| 5 to 9 Minutes | 1,558 (16.4%) | 1,789 (18.1%) |
| 10 to 14 Minutes | 2,608 (27.4%) | 2,858 (29.0%) |
| 15 to 19 Minutes | 2,099 (22.0%) | 2,414 (24.5%) |
| 20 to 24 Minutes | 1,018 (10.7%) | 1,124 (11.4%) |
| 25 to 29 Minutes | 427 (4.5%) | 589 (6.0%) |
| 30 to 34 Minutes | 666 (7.0%) | 385 (3.9%) |
| 35 to 39 Minutes | 55 (0.6%) | 120 (1.2%) |
| 40 to 44 Minutes | 109 (1.1%) | 259 (2.6%) |
| 45 to 59 Minutes | 345 (3.6%) | 83 (0.8%) |
| 60 to 89 Minutes | 274 (2.9%) | 122 (1.2%) |
| 90 or more Minutes | 132 (1.4%) | 12 (0.1%) |
Time of Departure to Work by Sex in Charlottesville
The most frequent times of departure to work in Charlottesville are 8:00 AM to 8:29 AM (1,446, 15.2%) for males and 8:00 AM to 8:29 AM (1,732, 17.6%) for females.
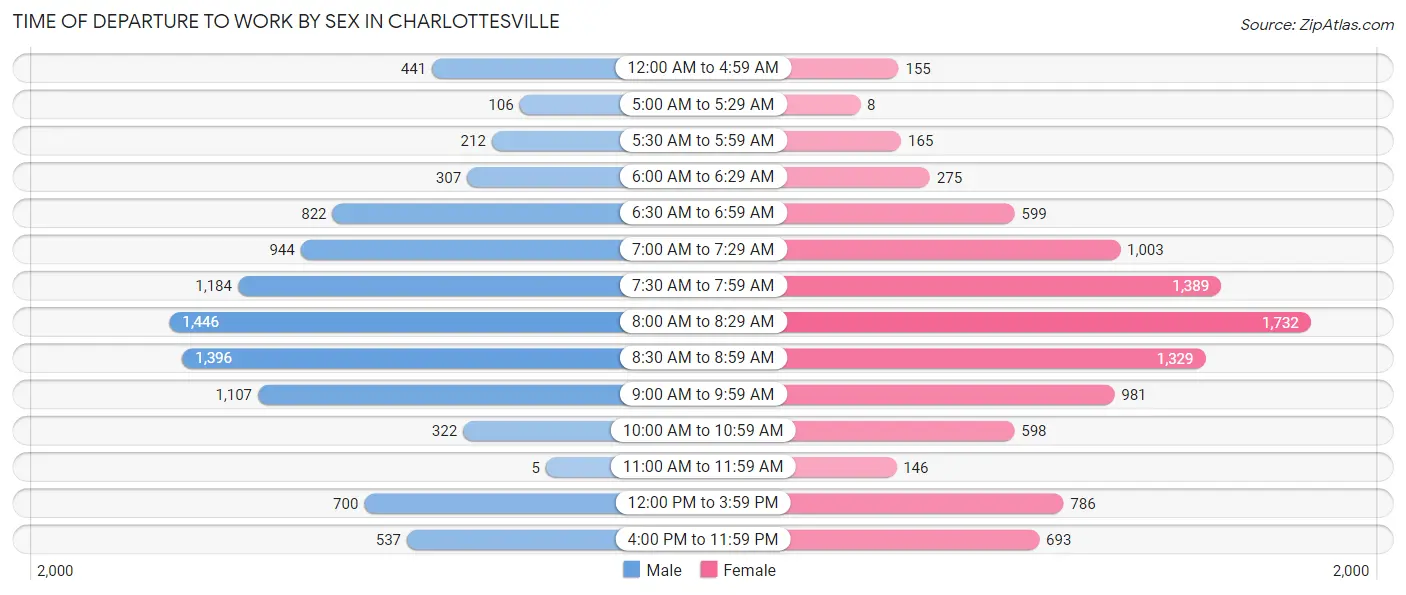
| Time of Departure | Male | Female |
| 12:00 AM to 4:59 AM | 441 (4.6%) | 155 (1.6%) |
| 5:00 AM to 5:29 AM | 106 (1.1%) | 8 (0.1%) |
| 5:30 AM to 5:59 AM | 212 (2.2%) | 165 (1.7%) |
| 6:00 AM to 6:29 AM | 307 (3.2%) | 275 (2.8%) |
| 6:30 AM to 6:59 AM | 822 (8.6%) | 599 (6.1%) |
| 7:00 AM to 7:29 AM | 944 (9.9%) | 1,003 (10.2%) |
| 7:30 AM to 7:59 AM | 1,184 (12.4%) | 1,389 (14.1%) |
| 8:00 AM to 8:29 AM | 1,446 (15.2%) | 1,732 (17.6%) |
| 8:30 AM to 8:59 AM | 1,396 (14.6%) | 1,329 (13.5%) |
| 9:00 AM to 9:59 AM | 1,107 (11.6%) | 981 (10.0%) |
| 10:00 AM to 10:59 AM | 322 (3.4%) | 598 (6.1%) |
| 11:00 AM to 11:59 AM | 5 (0.1%) | 146 (1.5%) |
| 12:00 PM to 3:59 PM | 700 (7.3%) | 786 (8.0%) |
| 4:00 PM to 11:59 PM | 537 (5.6%) | 693 (7.0%) |
| Total | 9,529 (100.0%) | 9,859 (100.0%) |
Housing Occupancy in Charlottesville
Occupancy by Ownership in Charlottesville
Of the total 19,511 dwellings in Charlottesville, owner-occupied units account for 8,262 (42.3%), while renter-occupied units make up 11,249 (57.7%).
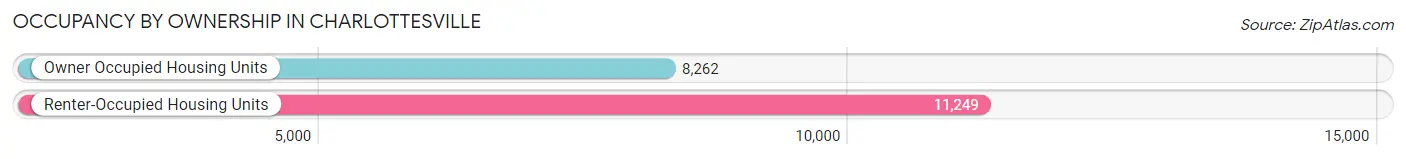
| Occupancy | # Housing Units | % Housing Units |
| Owner Occupied Housing Units | 8,262 | 42.3% |
| Renter-Occupied Housing Units | 11,249 | 57.7% |
| Total Occupied Housing Units | 19,511 | 100.0% |
Occupancy by Household Size in Charlottesville
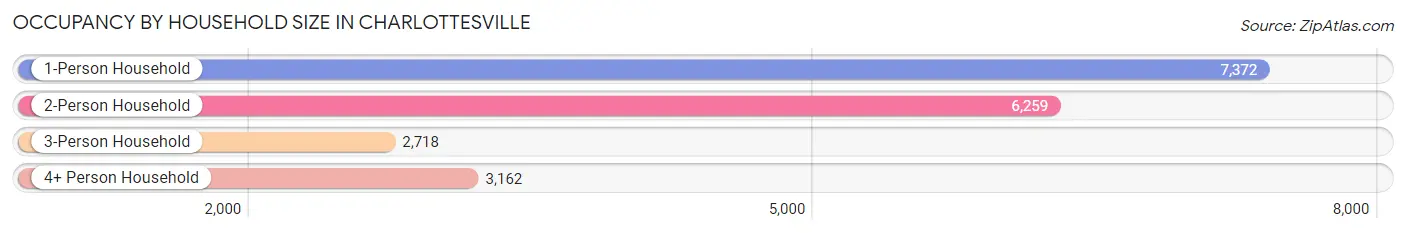
| Household Size | # Housing Units | % Housing Units |
| 1-Person Household | 7,372 | 37.8% |
| 2-Person Household | 6,259 | 32.1% |
| 3-Person Household | 2,718 | 13.9% |
| 4+ Person Household | 3,162 | 16.2% |
| Total Housing Units | 19,511 | 100.0% |
Occupancy by Ownership by Household Size in Charlottesville
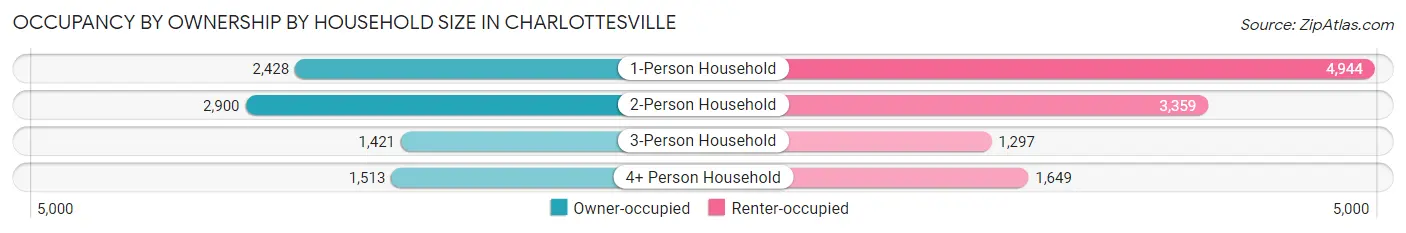
| Household Size | Owner-occupied | Renter-occupied |
| 1-Person Household | 2,428 (32.9%) | 4,944 (67.1%) |
| 2-Person Household | 2,900 (46.3%) | 3,359 (53.7%) |
| 3-Person Household | 1,421 (52.3%) | 1,297 (47.7%) |
| 4+ Person Household | 1,513 (47.8%) | 1,649 (52.1%) |
| Total Housing Units | 8,262 (42.3%) | 11,249 (57.7%) |
Occupancy by Educational Attainment in Charlottesville
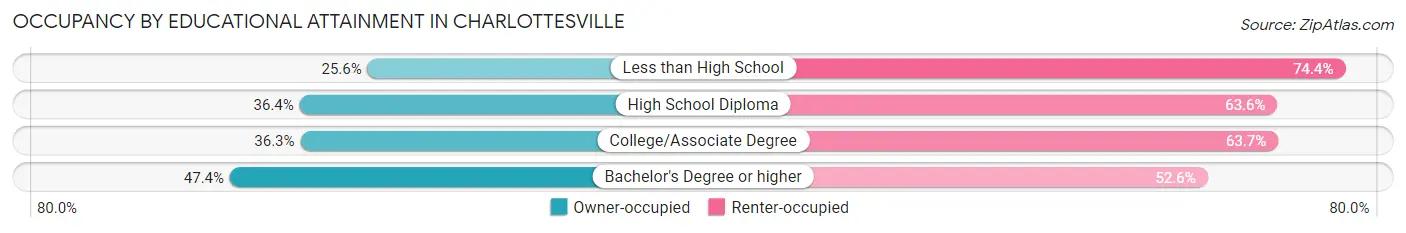
| Household Size | Owner-occupied | Renter-occupied |
| Less than High School | 317 (25.6%) | 921 (74.4%) |
| High School Diploma | 869 (36.4%) | 1,520 (63.6%) |
| College/Associate Degree | 1,489 (36.3%) | 2,617 (63.7%) |
| Bachelor's Degree or higher | 5,587 (47.4%) | 6,191 (52.6%) |
Occupancy by Age of Householder in Charlottesville
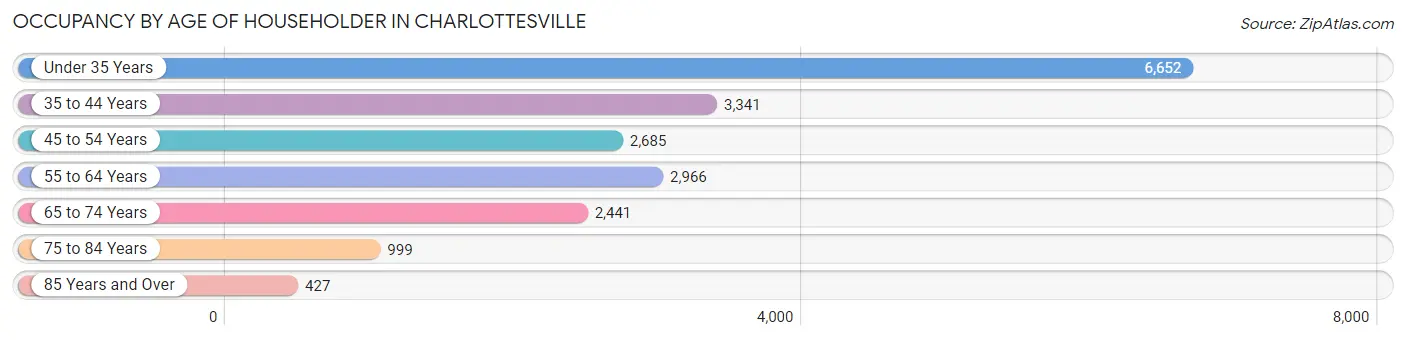
| Age Bracket | # Households | % Households |
| Under 35 Years | 6,652 | 34.1% |
| 35 to 44 Years | 3,341 | 17.1% |
| 45 to 54 Years | 2,685 | 13.8% |
| 55 to 64 Years | 2,966 | 15.2% |
| 65 to 74 Years | 2,441 | 12.5% |
| 75 to 84 Years | 999 | 5.1% |
| 85 Years and Over | 427 | 2.2% |
| Total | 19,511 | 100.0% |
Housing Finances in Charlottesville
Median Income by Occupancy in Charlottesville
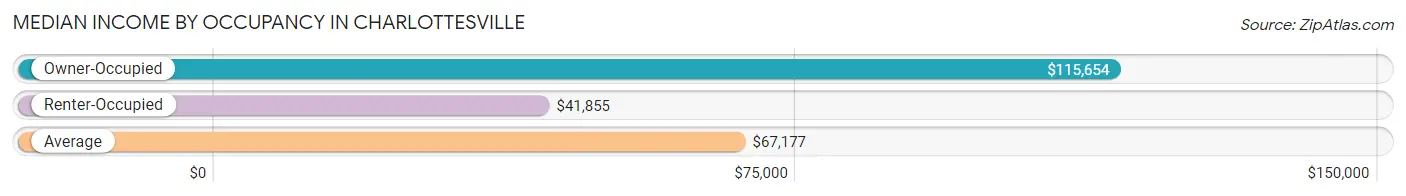
| Occupancy Type | # Households | Median Income |
| Owner-Occupied | 8,262 (42.3%) | $115,654 |
| Renter-Occupied | 11,249 (57.7%) | $41,855 |
| Average | 19,511 (100.0%) | $67,177 |
Occupancy by Householder Income Bracket in Charlottesville
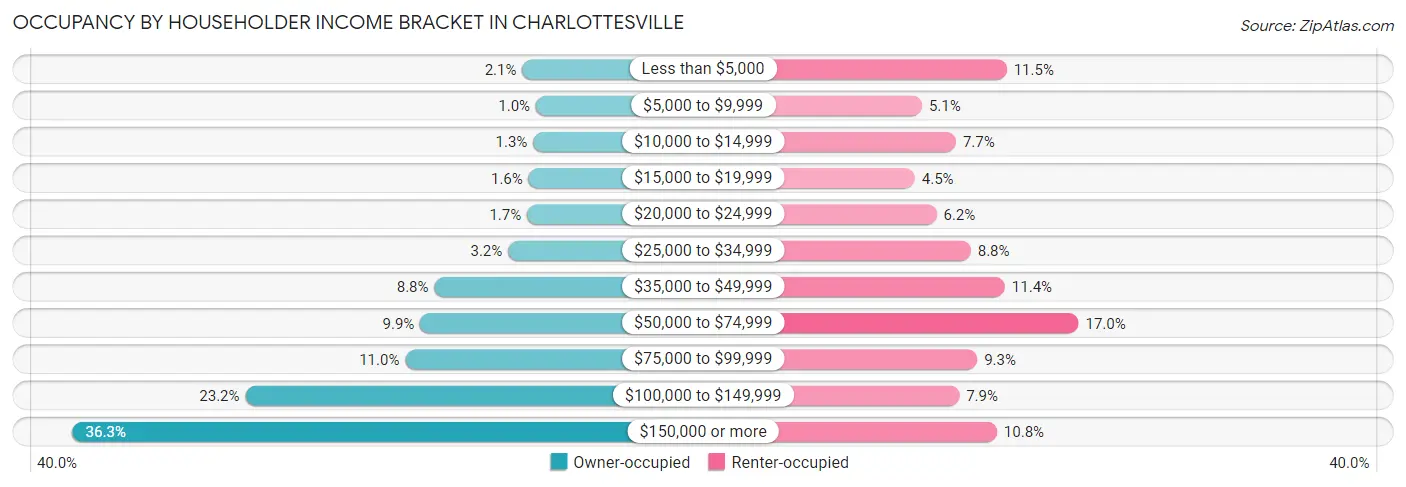
| Income Bracket | Owner-occupied | Renter-occupied |
| Less than $5,000 | 172 (2.1%) | 1,296 (11.5%) |
| $5,000 to $9,999 | 86 (1.0%) | 569 (5.1%) |
| $10,000 to $14,999 | 103 (1.3%) | 860 (7.6%) |
| $15,000 to $19,999 | 132 (1.6%) | 508 (4.5%) |
| $20,000 to $24,999 | 142 (1.7%) | 694 (6.2%) |
| $25,000 to $34,999 | 261 (3.2%) | 988 (8.8%) |
| $35,000 to $49,999 | 725 (8.8%) | 1,280 (11.4%) |
| $50,000 to $74,999 | 815 (9.9%) | 1,911 (17.0%) |
| $75,000 to $99,999 | 909 (11.0%) | 1,043 (9.3%) |
| $100,000 to $149,999 | 1,915 (23.2%) | 889 (7.9%) |
| $150,000 or more | 3,002 (36.3%) | 1,211 (10.8%) |
| Total | 8,262 (100.0%) | 11,249 (100.0%) |
Monthly Housing Cost Tiers in Charlottesville
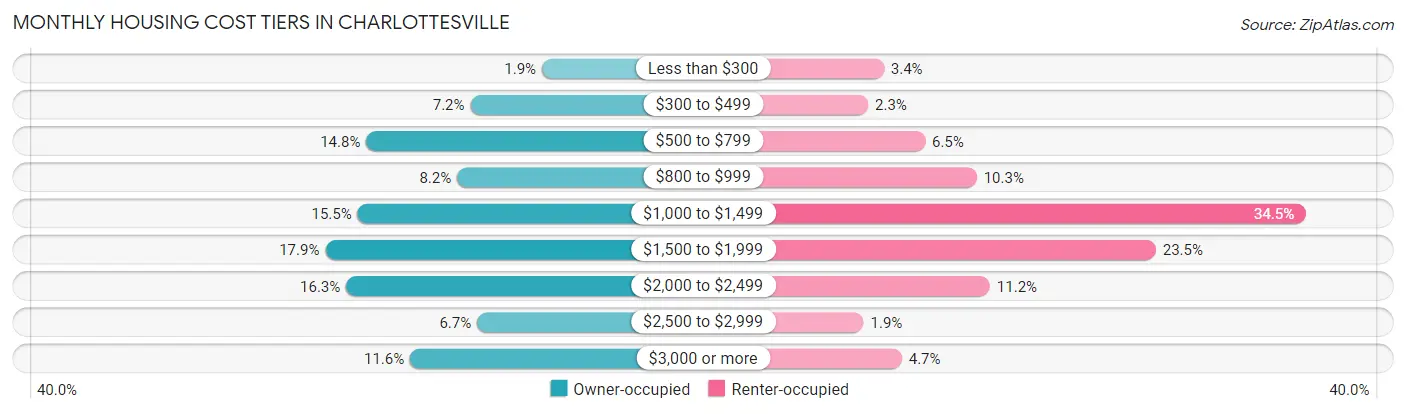
| Monthly Cost | Owner-occupied | Renter-occupied |
| Less than $300 | 157 (1.9%) | 385 (3.4%) |
| $300 to $499 | 592 (7.2%) | 254 (2.3%) |
| $500 to $799 | 1,226 (14.8%) | 725 (6.5%) |
| $800 to $999 | 673 (8.2%) | 1,154 (10.3%) |
| $1,000 to $1,499 | 1,279 (15.5%) | 3,882 (34.5%) |
| $1,500 to $1,999 | 1,476 (17.9%) | 2,638 (23.4%) |
| $2,000 to $2,499 | 1,348 (16.3%) | 1,263 (11.2%) |
| $2,500 to $2,999 | 552 (6.7%) | 217 (1.9%) |
| $3,000 or more | 959 (11.6%) | 533 (4.7%) |
| Total | 8,262 (100.0%) | 11,249 (100.0%) |
Physical Housing Characteristics in Charlottesville
Housing Structures in Charlottesville
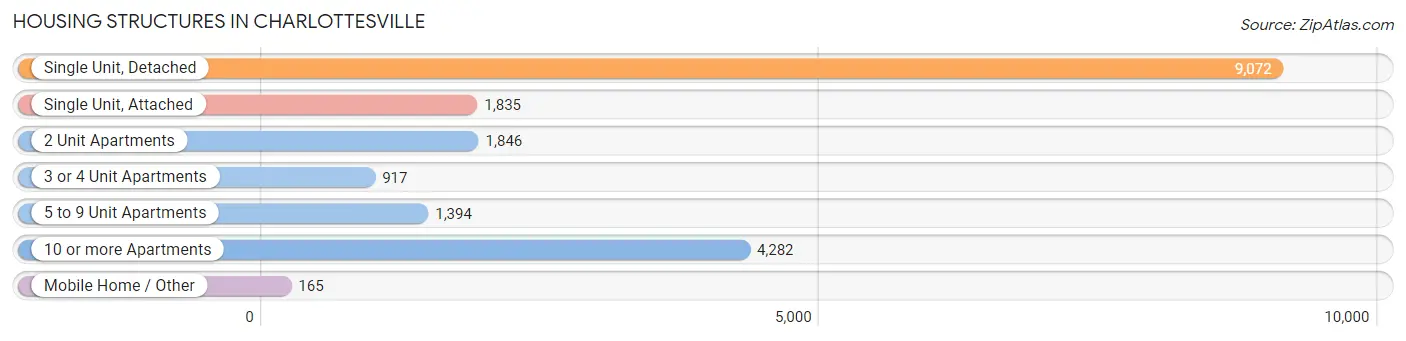
| Structure Type | # Housing Units | % Housing Units |
| Single Unit, Detached | 9,072 | 46.5% |
| Single Unit, Attached | 1,835 | 9.4% |
| 2 Unit Apartments | 1,846 | 9.5% |
| 3 or 4 Unit Apartments | 917 | 4.7% |
| 5 to 9 Unit Apartments | 1,394 | 7.1% |
| 10 or more Apartments | 4,282 | 22.0% |
| Mobile Home / Other | 165 | 0.9% |
| Total | 19,511 | 100.0% |
Housing Structures by Occupancy in Charlottesville
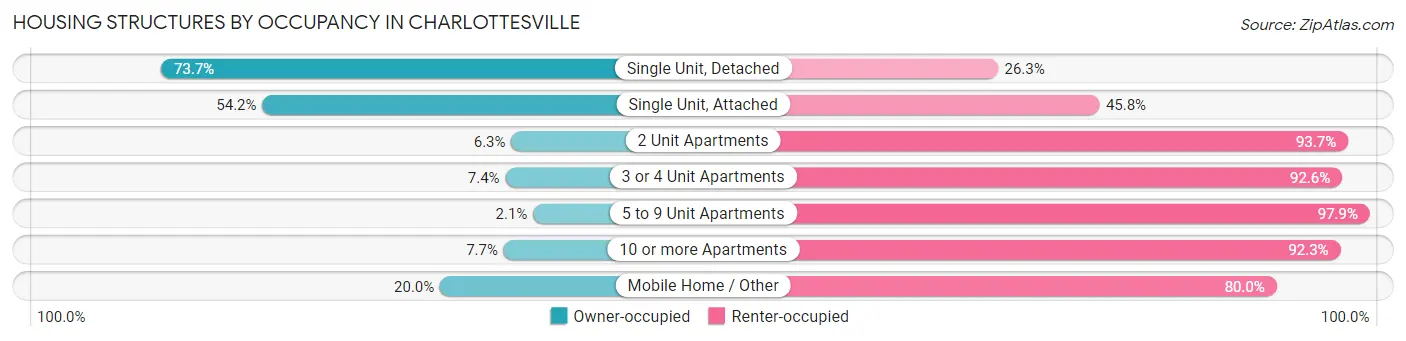
| Structure Type | Owner-occupied | Renter-occupied |
| Single Unit, Detached | 6,690 (73.7%) | 2,382 (26.3%) |
| Single Unit, Attached | 995 (54.2%) | 840 (45.8%) |
| 2 Unit Apartments | 116 (6.3%) | 1,730 (93.7%) |
| 3 or 4 Unit Apartments | 68 (7.4%) | 849 (92.6%) |
| 5 to 9 Unit Apartments | 29 (2.1%) | 1,365 (97.9%) |
| 10 or more Apartments | 331 (7.7%) | 3,951 (92.3%) |
| Mobile Home / Other | 33 (20.0%) | 132 (80.0%) |
| Total | 8,262 (42.3%) | 11,249 (57.7%) |
Housing Structures by Number of Rooms in Charlottesville
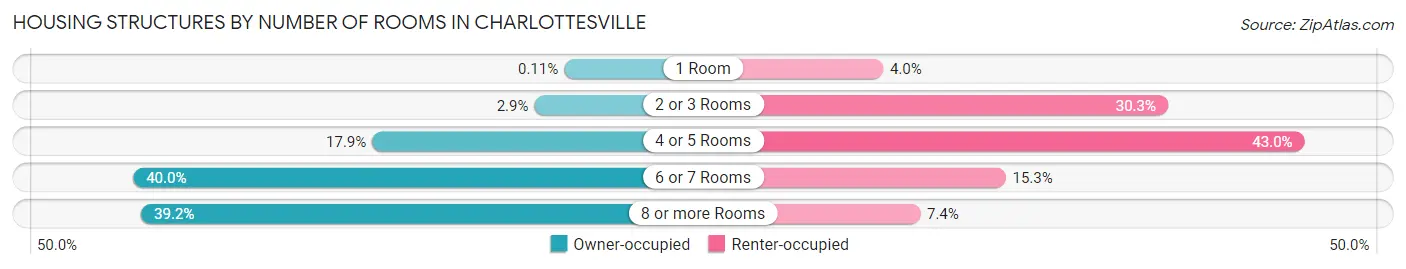
| Number of Rooms | Owner-occupied | Renter-occupied |
| 1 Room | 9 (0.1%) | 448 (4.0%) |
| 2 or 3 Rooms | 236 (2.9%) | 3,411 (30.3%) |
| 4 or 5 Rooms | 1,476 (17.9%) | 4,833 (43.0%) |
| 6 or 7 Rooms | 3,301 (40.0%) | 1,723 (15.3%) |
| 8 or more Rooms | 3,240 (39.2%) | 834 (7.4%) |
| Total | 8,262 (100.0%) | 11,249 (100.0%) |
Housing Structure by Heating Type in Charlottesville
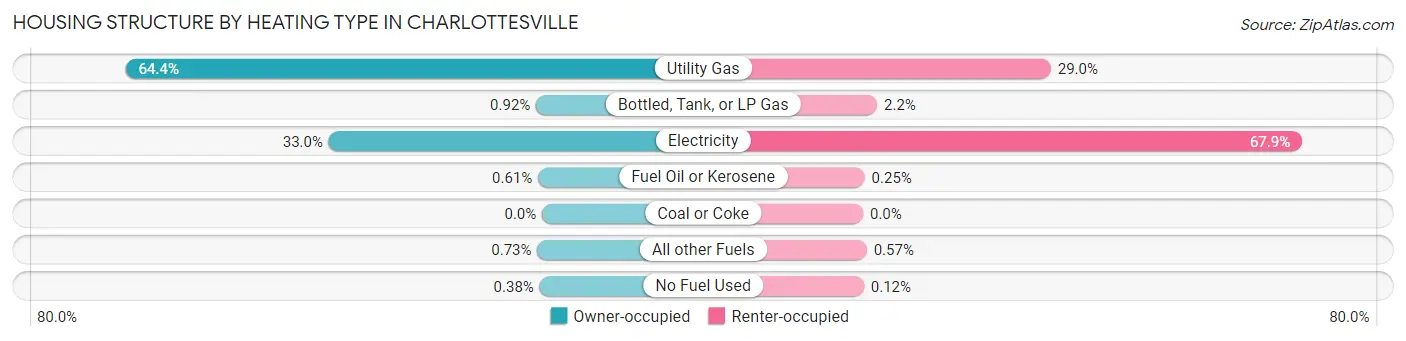
| Heating Type | Owner-occupied | Renter-occupied |
| Utility Gas | 5,321 (64.4%) | 3,266 (29.0%) |
| Bottled, Tank, or LP Gas | 76 (0.9%) | 244 (2.2%) |
| Electricity | 2,724 (33.0%) | 7,633 (67.8%) |
| Fuel Oil or Kerosene | 50 (0.6%) | 28 (0.3%) |
| Coal or Coke | 0 (0.0%) | 0 (0.0%) |
| All other Fuels | 60 (0.7%) | 64 (0.6%) |
| No Fuel Used | 31 (0.4%) | 14 (0.1%) |
| Total | 8,262 (100.0%) | 11,249 (100.0%) |
Household Vehicle Usage in Charlottesville
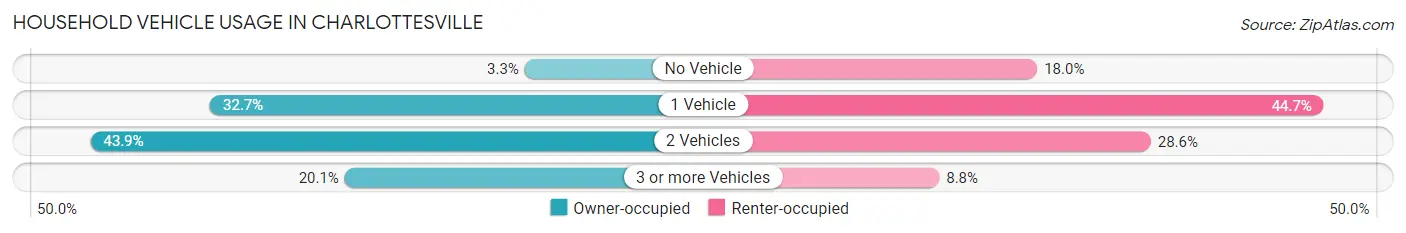
| Vehicles per Household | Owner-occupied | Renter-occupied |
| No Vehicle | 274 (3.3%) | 2,019 (17.9%) |
| 1 Vehicle | 2,702 (32.7%) | 5,027 (44.7%) |
| 2 Vehicles | 3,624 (43.9%) | 3,212 (28.5%) |
| 3 or more Vehicles | 1,662 (20.1%) | 991 (8.8%) |
| Total | 8,262 (100.0%) | 11,249 (100.0%) |
Real Estate & Mortgages in Charlottesville
Real Estate and Mortgage Overview in Charlottesville
| Characteristic | Without Mortgage | With Mortgage |
| Housing Units | 2,700 | 5,562 |
| Median Property Value | $408,200 | $394,600 |
| Median Household Income | $102,741 | $2,199 |
| Monthly Housing Costs | $662 | $950 |
| Real Estate Taxes | $3,496 | $29 |
Property Value by Mortgage Status in Charlottesville
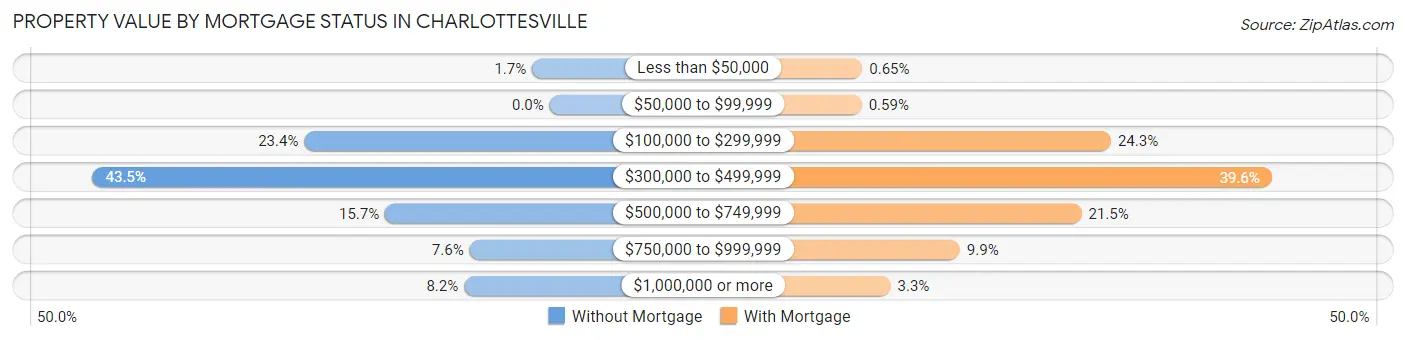
| Property Value | Without Mortgage | With Mortgage |
| Less than $50,000 | 45 (1.7%) | 36 (0.6%) |
| $50,000 to $99,999 | 0 (0.0%) | 33 (0.6%) |
| $100,000 to $299,999 | 631 (23.4%) | 1,353 (24.3%) |
| $300,000 to $499,999 | 1,175 (43.5%) | 2,204 (39.6%) |
| $500,000 to $749,999 | 423 (15.7%) | 1,197 (21.5%) |
| $750,000 to $999,999 | 206 (7.6%) | 553 (9.9%) |
| $1,000,000 or more | 220 (8.2%) | 186 (3.3%) |
| Total | 2,700 (100.0%) | 5,562 (100.0%) |
Household Income by Mortgage Status in Charlottesville
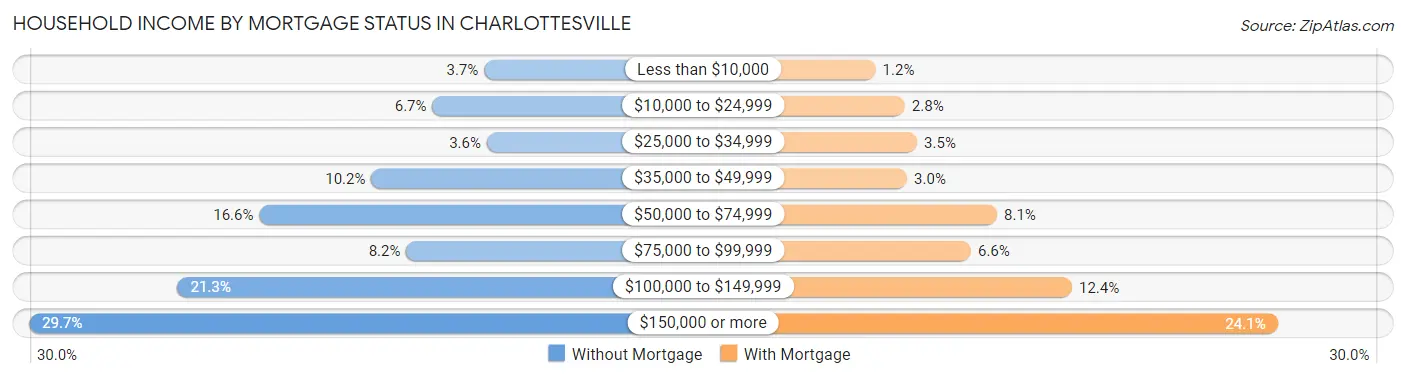
| Household Income | Without Mortgage | With Mortgage |
| Less than $10,000 | 101 (3.7%) | 64 (1.1%) |
| $10,000 to $24,999 | 181 (6.7%) | 157 (2.8%) |
| $25,000 to $34,999 | 97 (3.6%) | 196 (3.5%) |
| $35,000 to $49,999 | 275 (10.2%) | 164 (2.9%) |
| $50,000 to $74,999 | 448 (16.6%) | 450 (8.1%) |
| $75,000 to $99,999 | 221 (8.2%) | 367 (6.6%) |
| $100,000 to $149,999 | 574 (21.3%) | 688 (12.4%) |
| $150,000 or more | 803 (29.7%) | 1,341 (24.1%) |
| Total | 2,700 (100.0%) | 5,562 (100.0%) |
Property Value to Household Income Ratio in Charlottesville
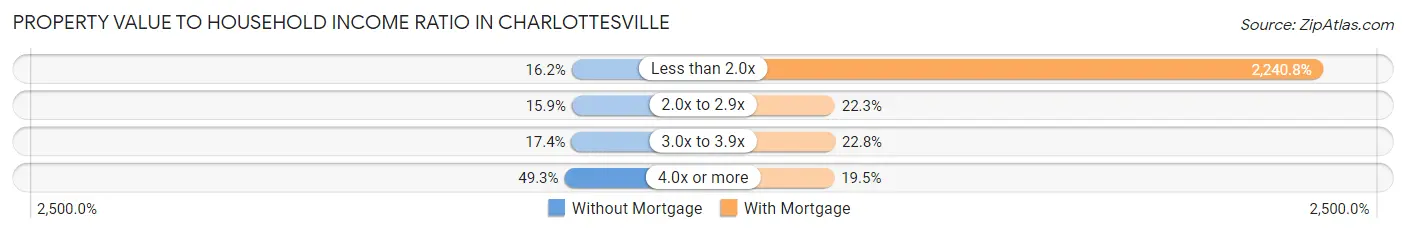
| Value-to-Income Ratio | Without Mortgage | With Mortgage |
| Less than 2.0x | 436 (16.2%) | 124,633 (2,240.8%) |
| 2.0x to 2.9x | 430 (15.9%) | 1,242 (22.3%) |
| 3.0x to 3.9x | 469 (17.4%) | 1,267 (22.8%) |
| 4.0x or more | 1,331 (49.3%) | 1,086 (19.5%) |
| Total | 2,700 (100.0%) | 5,562 (100.0%) |
Real Estate Taxes by Mortgage Status in Charlottesville
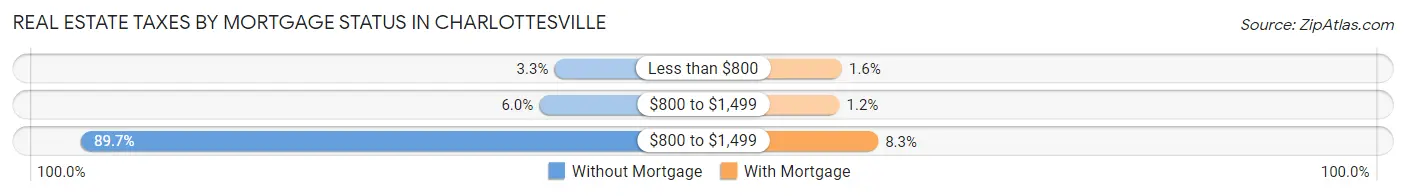
| Property Taxes | Without Mortgage | With Mortgage |
| Less than $800 | 88 (3.3%) | 91 (1.6%) |
| $800 to $1,499 | 163 (6.0%) | 67 (1.2%) |
| $800 to $1,499 | 2,421 (89.7%) | 459 (8.3%) |
| Total | 2,700 (100.0%) | 5,562 (100.0%) |
Health & Disability in Charlottesville
Health Insurance Coverage by Age in Charlottesville
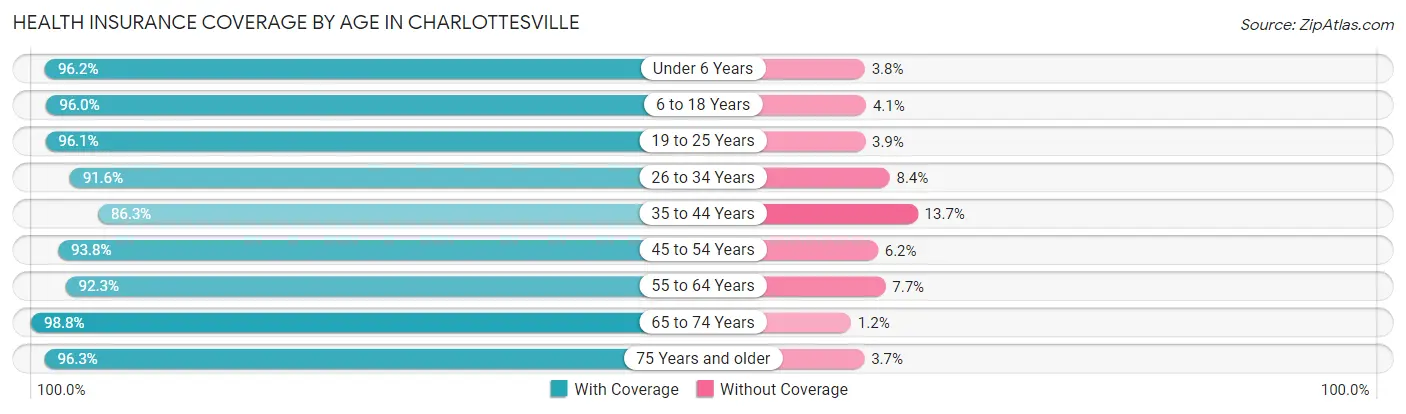
| Age Bracket | With Coverage | Without Coverage |
| Under 6 Years | 2,629 (96.2%) | 104 (3.8%) |
| 6 to 18 Years | 4,548 (96.0%) | 192 (4.1%) |
| 19 to 25 Years | 10,056 (96.1%) | 405 (3.9%) |
| 26 to 34 Years | 6,627 (91.6%) | 611 (8.4%) |
| 35 to 44 Years | 5,065 (86.3%) | 803 (13.7%) |
| 45 to 54 Years | 4,238 (93.8%) | 282 (6.2%) |
| 55 to 64 Years | 4,328 (92.3%) | 359 (7.7%) |
| 65 to 74 Years | 3,547 (98.8%) | 44 (1.2%) |
| 75 Years and older | 1,999 (96.3%) | 77 (3.7%) |
| Total | 43,037 (93.7%) | 2,877 (6.3%) |
Health Insurance Coverage by Citizenship Status in Charlottesville
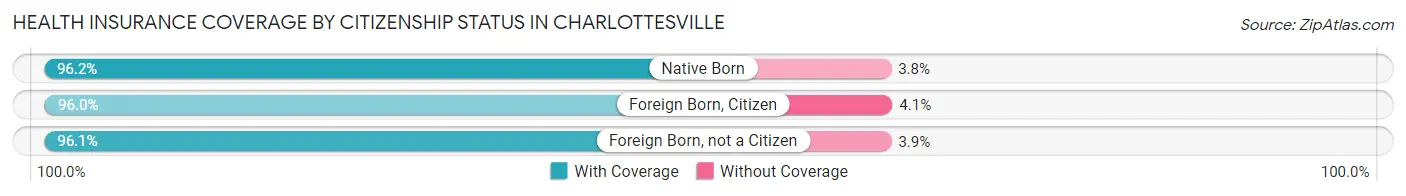
| Citizenship Status | With Coverage | Without Coverage |
| Native Born | 2,629 (96.2%) | 104 (3.8%) |
| Foreign Born, Citizen | 4,548 (96.0%) | 192 (4.1%) |
| Foreign Born, not a Citizen | 10,056 (96.1%) | 405 (3.9%) |
Health Insurance Coverage by Household Income in Charlottesville
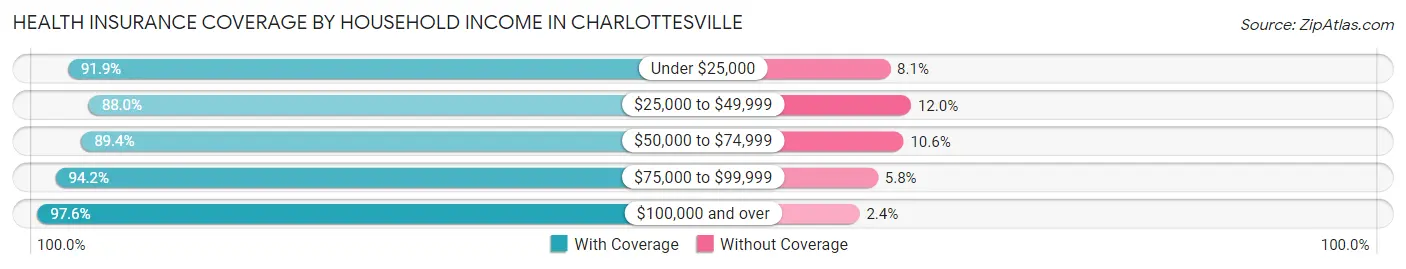
| Household Income | With Coverage | Without Coverage |
| Under $25,000 | 8,039 (91.9%) | 710 (8.1%) |
| $25,000 to $49,999 | 5,581 (88.0%) | 763 (12.0%) |
| $50,000 to $74,999 | 5,032 (89.4%) | 598 (10.6%) |
| $75,000 to $99,999 | 4,078 (94.2%) | 252 (5.8%) |
| $100,000 and over | 17,743 (97.6%) | 432 (2.4%) |
Public vs Private Health Insurance Coverage by Age in Charlottesville
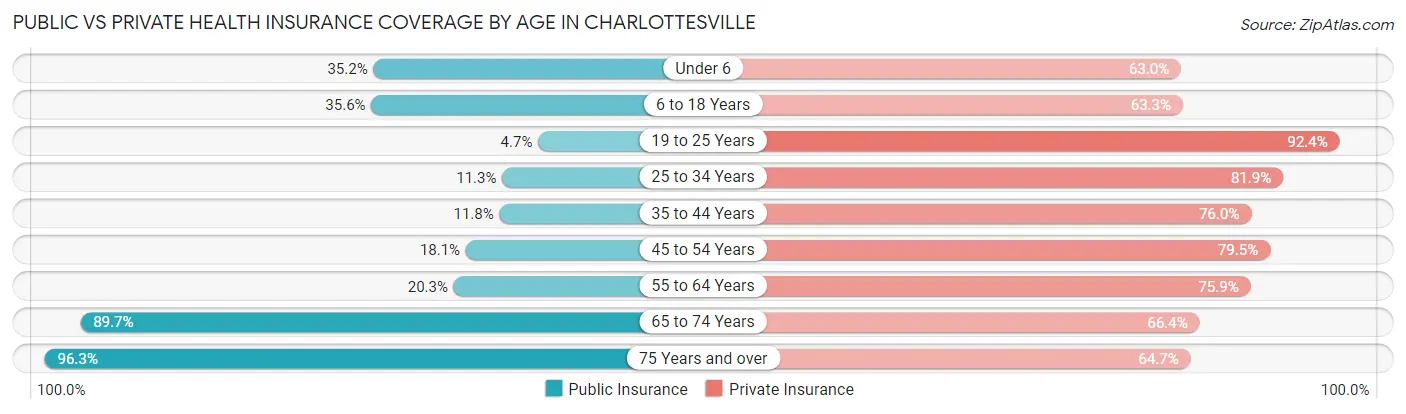
| Age Bracket | Public Insurance | Private Insurance |
| Under 6 | 963 (35.2%) | 1,721 (63.0%) |
| 6 to 18 Years | 1,689 (35.6%) | 3,000 (63.3%) |
| 19 to 25 Years | 488 (4.7%) | 9,665 (92.4%) |
| 25 to 34 Years | 820 (11.3%) | 5,928 (81.9%) |
| 35 to 44 Years | 695 (11.8%) | 4,459 (76.0%) |
| 45 to 54 Years | 817 (18.1%) | 3,592 (79.5%) |
| 55 to 64 Years | 953 (20.3%) | 3,555 (75.8%) |
| 65 to 74 Years | 3,220 (89.7%) | 2,384 (66.4%) |
| 75 Years and over | 1,999 (96.3%) | 1,344 (64.7%) |
| Total | 11,644 (25.4%) | 35,648 (77.6%) |
Disability Status by Sex by Age in Charlottesville
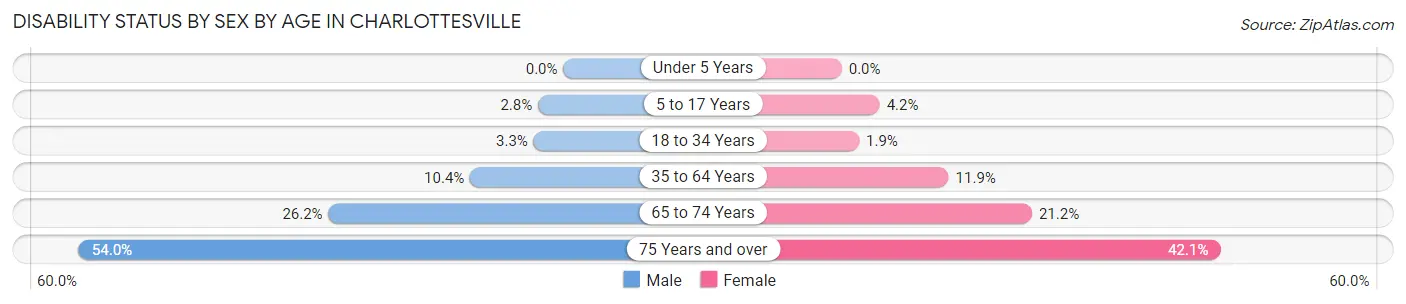
| Age Bracket | Male | Female |
| Under 5 Years | 0 (0.0%) | 0 (0.0%) |
| 5 to 17 Years | 65 (2.8%) | 104 (4.2%) |
| 18 to 34 Years | 291 (3.3%) | 177 (1.9%) |
| 35 to 64 Years | 755 (10.4%) | 929 (11.9%) |
| 65 to 74 Years | 428 (26.2%) | 414 (21.2%) |
| 75 Years and over | 458 (53.9%) | 517 (42.1%) |
Disability Class by Sex by Age in Charlottesville
Disability Class: Hearing Difficulty
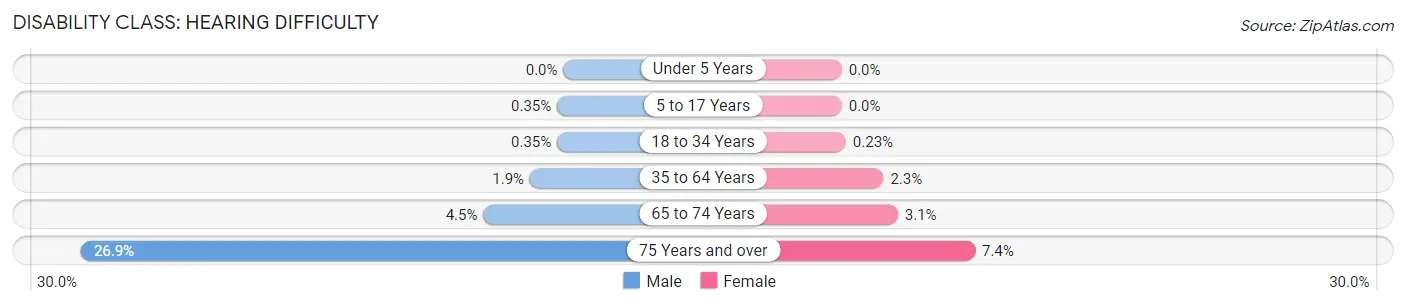
| Age Bracket | Male | Female |
| Under 5 Years | 0 (0.0%) | 0 (0.0%) |
| 5 to 17 Years | 8 (0.4%) | 0 (0.0%) |
| 18 to 34 Years | 31 (0.4%) | 21 (0.2%) |
| 35 to 64 Years | 135 (1.9%) | 181 (2.3%) |
| 65 to 74 Years | 73 (4.5%) | 61 (3.1%) |
| 75 Years and over | 228 (26.9%) | 91 (7.4%) |
Disability Class: Vision Difficulty
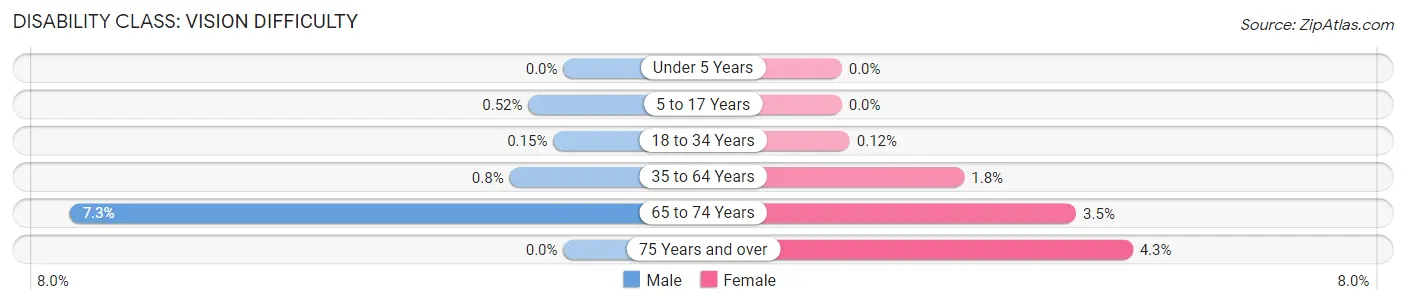
| Age Bracket | Male | Female |
| Under 5 Years | 0 (0.0%) | 0 (0.0%) |
| 5 to 17 Years | 12 (0.5%) | 0 (0.0%) |
| 18 to 34 Years | 13 (0.2%) | 11 (0.1%) |
| 35 to 64 Years | 58 (0.8%) | 142 (1.8%) |
| 65 to 74 Years | 120 (7.3%) | 68 (3.5%) |
| 75 Years and over | 0 (0.0%) | 53 (4.3%) |
Disability Class: Cognitive Difficulty
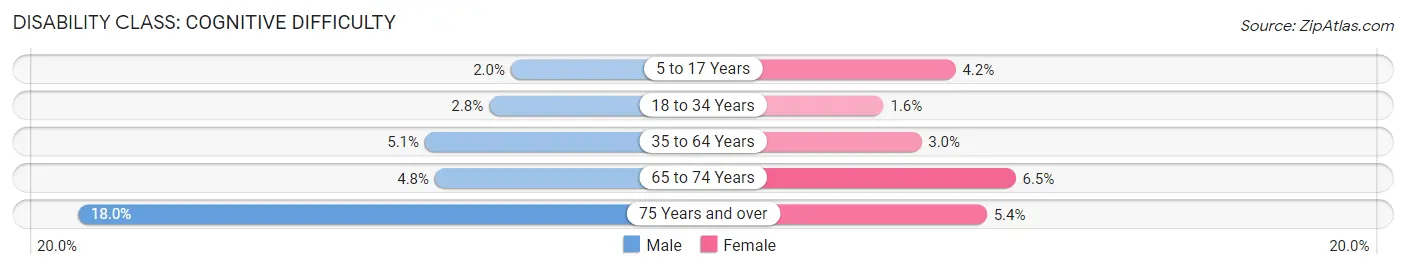
| Age Bracket | Male | Female |
| 5 to 17 Years | 45 (1.9%) | 104 (4.2%) |
| 18 to 34 Years | 243 (2.8%) | 142 (1.5%) |
| 35 to 64 Years | 374 (5.1%) | 230 (2.9%) |
| 65 to 74 Years | 78 (4.8%) | 126 (6.5%) |
| 75 Years and over | 153 (18.0%) | 66 (5.4%) |
Disability Class: Ambulatory Difficulty
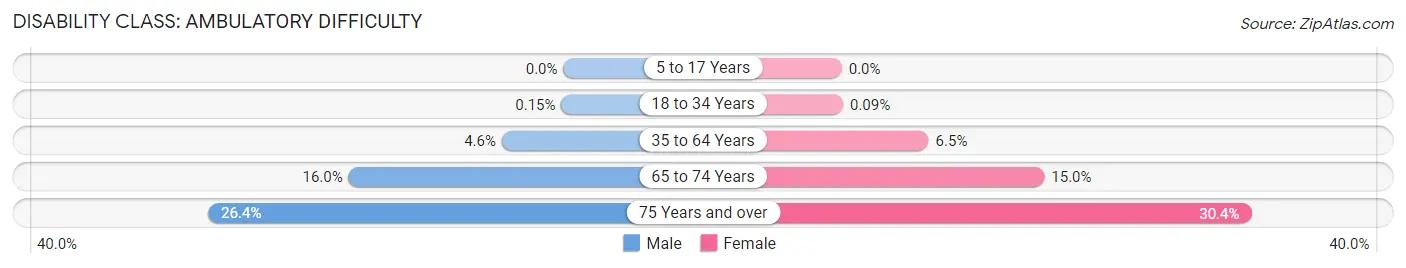
| Age Bracket | Male | Female |
| 5 to 17 Years | 0 (0.0%) | 0 (0.0%) |
| 18 to 34 Years | 13 (0.2%) | 8 (0.1%) |
| 35 to 64 Years | 332 (4.6%) | 503 (6.5%) |
| 65 to 74 Years | 261 (16.0%) | 294 (15.0%) |
| 75 Years and over | 224 (26.4%) | 373 (30.4%) |
Disability Class: Self-Care Difficulty
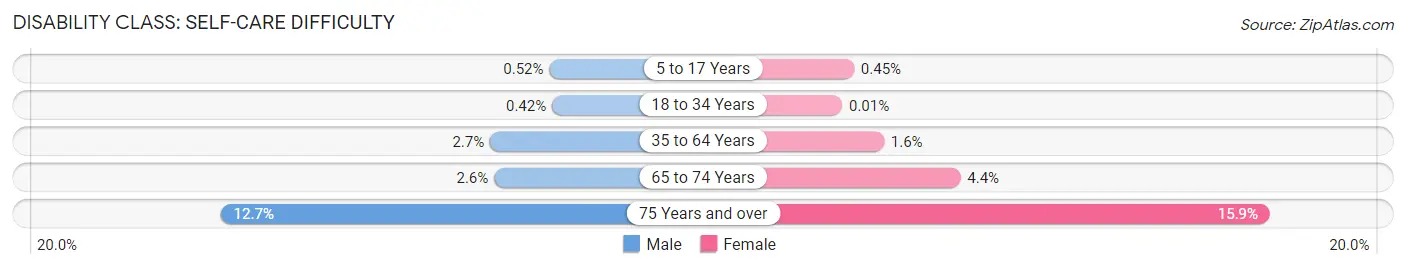
| Age Bracket | Male | Female |
| 5 to 17 Years | 12 (0.5%) | 11 (0.4%) |
| 18 to 34 Years | 37 (0.4%) | 1 (0.0%) |
| 35 to 64 Years | 198 (2.7%) | 122 (1.6%) |
| 65 to 74 Years | 42 (2.6%) | 86 (4.4%) |
| 75 Years and over | 108 (12.7%) | 195 (15.9%) |
Technology Access in Charlottesville
Computing Device Access in Charlottesville
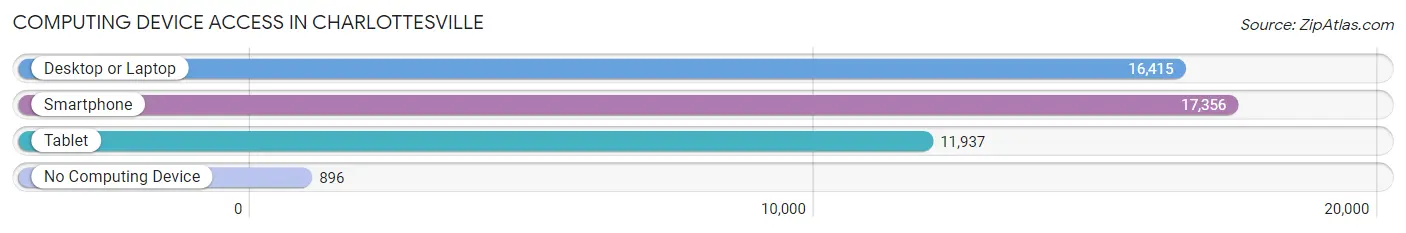
| Device Type | # Households | % Households |
| Desktop or Laptop | 16,415 | 84.1% |
| Smartphone | 17,356 | 88.9% |
| Tablet | 11,937 | 61.2% |
| No Computing Device | 896 | 4.6% |
| Total | 19,511 | 100.0% |
Internet Access in Charlottesville
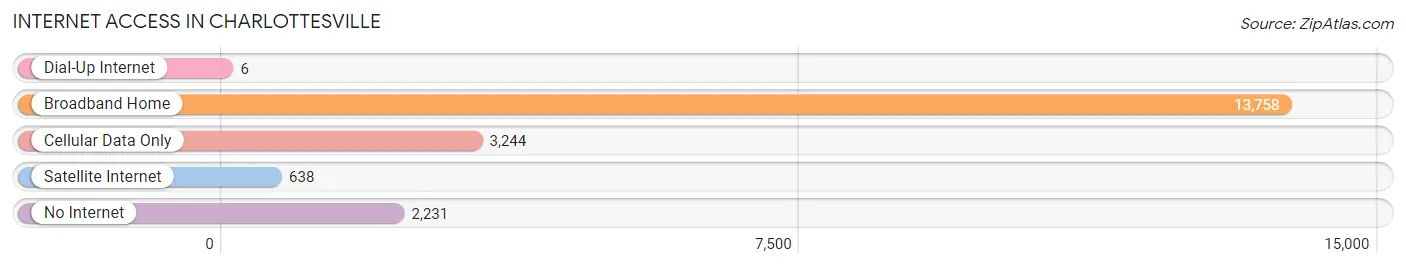
| Internet Type | # Households | % Households |
| Dial-Up Internet | 6 | 0.0% |
| Broadband Home | 13,758 | 70.5% |
| Cellular Data Only | 3,244 | 16.6% |
| Satellite Internet | 638 | 3.3% |
| No Internet | 2,231 | 11.4% |
| Total | 19,511 | 100.0% |
Charlottesville Summary
Charlottesville, Virginia is a city located in the foothills of the Blue Ridge Mountains in the central part of the state. It is the county seat of Albemarle County and is home to the University of Virginia. Charlottesville is a vibrant city with a rich history, diverse geography, and a thriving economy.
History
Charlottesville was founded in 1762 by Colonel William Byrd II, who named it after his father, William Byrd I. The city was originally a trading post and was later incorporated in 1788. During the American Revolution, Charlottesville served as a supply depot for the Continental Army. After the war, the city became a center of commerce and industry, with the University of Virginia being established in 1819.
In the 19th century, Charlottesville was a major center of the slave trade, with many plantations in the surrounding area. After the Civil War, the city experienced a period of economic growth, with the University of Virginia becoming a major employer. In the early 20th century, Charlottesville was a center of the civil rights movement, with the University of Virginia becoming a major hub for civil rights activism.
Geography
Charlottesville is located in the foothills of the Blue Ridge Mountains in the central part of the state. The city is situated on the Rivanna River, which flows through the city and is a major source of drinking water. The city is surrounded by Albemarle County, which is home to many farms and vineyards. The city is also close to the Shenandoah National Park, which offers a variety of outdoor activities.
The city has a humid subtropical climate, with hot, humid summers and mild winters. The average temperature in the summer is around 80 degrees Fahrenheit, while the average temperature in the winter is around 40 degrees Fahrenheit.
Economy
Charlottesville has a thriving economy, with a variety of industries and businesses. The University of Virginia is the largest employer in the city, with over 20,000 employees. Other major employers include the University of Virginia Medical Center, the City of Charlottesville, and the Albemarle County Public Schools.
The city is also home to a number of technology companies, including the software company Cvent, the online retailer Amazon, and the software company Oracle. The city is also home to a number of wineries and breweries, as well as a variety of restaurants and shops.
Demographics
As of the 2010 census, the population of Charlottesville was 43,475. The city is racially diverse, with the largest racial group being white (63.3%), followed by African American (20.2%), Hispanic (7.2%), and Asian (4.3%). The median household income in the city is $50,837, and the median age is 33.
Conclusion
Charlottesville, Virginia is a vibrant city with a rich history, diverse geography, and a thriving economy. The city is home to the University of Virginia, which is the largest employer in the city. The city is also home to a number of technology companies, wineries, breweries, restaurants, and shops. The city is racially diverse, with the largest racial group being white. Charlottesville is a great place to live, work, and visit.
Common Questions
What is Per Capita Income in Charlottesville?
Per Capita income in Charlottesville is $45,625.
What is the Median Family Income in Charlottesville?
Median Family Income in Charlottesville is $105,994.
What is the Median Household income in Charlottesville?
Median Household Income in Charlottesville is $67,177.
What is Income or Wage Gap in Charlottesville?
Income or Wage Gap in Charlottesville is 19.1%.
Women in Charlottesville earn 80.9 cents for every dollar earned by a man.
What is Family Income Deficit in Charlottesville?
Family Income Deficit in Charlottesville is $15,434.
Families that are below poverty line in Charlottesville earn $15,434 less on average than the poverty threshold level.
What is Inequality or Gini Index in Charlottesville?
Inequality or Gini Index in Charlottesville is 0.54.
What is the Total Population of Charlottesville?
Total Population of Charlottesville is 46,289.
What is the Total Male Population of Charlottesville?
Total Male Population of Charlottesville is 22,528.
What is the Total Female Population of Charlottesville?
Total Female Population of Charlottesville is 23,761.
What is the Ratio of Males per 100 Females in Charlottesville?
There are 94.81 Males per 100 Females in Charlottesville.
What is the Ratio of Females per 100 Males in Charlottesville?
There are 105.47 Females per 100 Males in Charlottesville.
What is the Median Population Age in Charlottesville?
Median Population Age in Charlottesville is 32.4 Years.
What is the Average Family Size in Charlottesville
Average Family Size in Charlottesville is 2.9 People.
What is the Average Household Size in Charlottesville
Average Household Size in Charlottesville is 2.2 People.
How Large is the Labor Force in Charlottesville?
There are 25,377 People in the Labor Forcein in Charlottesville.
What is the Percentage of People in the Labor Force in Charlottesville?
64.0% of People are in the Labor Force in Charlottesville.
What is the Unemployment Rate in Charlottesville?
Unemployment Rate in Charlottesville is 5.1%.