Fincastle, VA Map & Demographics
Fincastle Map
Fincastle Overview
$27,621
PER CAPITA INCOME
$76,719
AVG FAMILY INCOME
$59,861
AVG HOUSEHOLD INCOME
44.4%
WAGE / INCOME GAP [ % ]
55.6¢/ $1
WAGE / INCOME GAP [ $ ]
0.34
INEQUALITY / GINI INDEX
621
TOTAL POPULATION
355
MALE POPULATION
266
FEMALE POPULATION
133.46
MALES / 100 FEMALES
74.93
FEMALES / 100 MALES
33.0
MEDIAN AGE
3.5
AVG FAMILY SIZE
2.5
AVG HOUSEHOLD SIZE
240
LABOR FORCE [ PEOPLE ]
50.5%
PERCENT IN LABOR FORCE
1.3%
UNEMPLOYMENT RATE
Fincastle Zip Codes
Fincastle Area Codes
Income in Fincastle
Income Overview in Fincastle
Per Capita Income in Fincastle is $27,621, while median incomes of families and households are $76,719 and $59,861 respectively.
| Characteristic | Number | Measure |
| Per Capita Income | 621 | $27,621 |
| Median Family Income | 112 | $76,719 |
| Mean Family Income | 112 | $91,586 |
| Median Household Income | 203 | $59,861 |
| Mean Household Income | 203 | $74,975 |
| Income Deficit | 112 | $0 |
| Wage / Income Gap (%) | 621 | 44.36% |
| Wage / Income Gap ($) | 621 | 55.64¢ per $1 |
| Gini / Inequality Index | 621 | 0.34 |
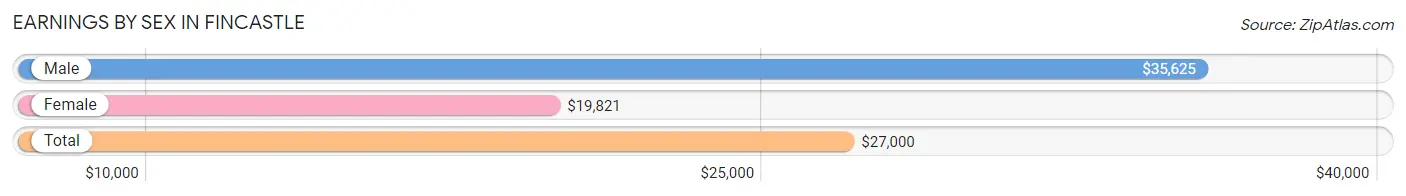
Earnings by Sex in Fincastle
Average Earnings in Fincastle are $27,000, $35,625 for men and $19,821 for women, a difference of 44.4%.
| Sex | Number | Average Earnings |
| Male | 161 (52.6%) | $35,625 |
| Female | 145 (47.4%) | $19,821 |
| Total | 306 (100.0%) | $27,000 |
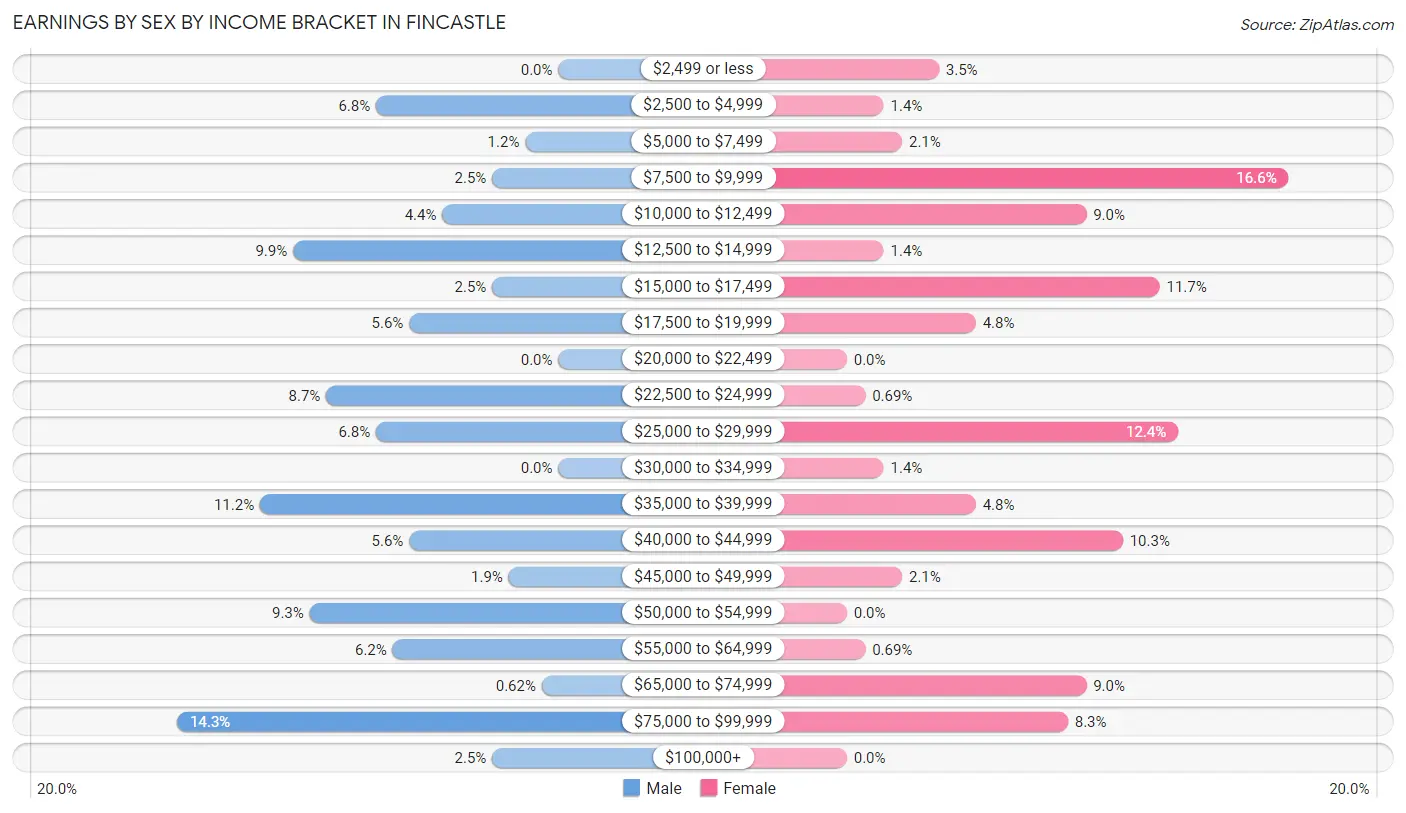
Earnings by Sex by Income Bracket in Fincastle
The most common earnings brackets in Fincastle are $75,000 to $99,999 for men (23 | 14.3%) and $7,500 to $9,999 for women (24 | 16.6%).
| Income | Male | Female |
| $2,499 or less | 0 (0.0%) | 5 (3.5%) |
| $2,500 to $4,999 | 11 (6.8%) | 2 (1.4%) |
| $5,000 to $7,499 | 2 (1.2%) | 3 (2.1%) |
| $7,500 to $9,999 | 4 (2.5%) | 24 (16.6%) |
| $10,000 to $12,499 | 7 (4.3%) | 13 (9.0%) |
| $12,500 to $14,999 | 16 (9.9%) | 2 (1.4%) |
| $15,000 to $17,499 | 4 (2.5%) | 17 (11.7%) |
| $17,500 to $19,999 | 9 (5.6%) | 7 (4.8%) |
| $20,000 to $22,499 | 0 (0.0%) | 0 (0.0%) |
| $22,500 to $24,999 | 14 (8.7%) | 1 (0.7%) |
| $25,000 to $29,999 | 11 (6.8%) | 18 (12.4%) |
| $30,000 to $34,999 | 0 (0.0%) | 2 (1.4%) |
| $35,000 to $39,999 | 18 (11.2%) | 7 (4.8%) |
| $40,000 to $44,999 | 9 (5.6%) | 15 (10.3%) |
| $45,000 to $49,999 | 3 (1.9%) | 3 (2.1%) |
| $50,000 to $54,999 | 15 (9.3%) | 0 (0.0%) |
| $55,000 to $64,999 | 10 (6.2%) | 1 (0.7%) |
| $65,000 to $74,999 | 1 (0.6%) | 13 (9.0%) |
| $75,000 to $99,999 | 23 (14.3%) | 12 (8.3%) |
| $100,000+ | 4 (2.5%) | 0 (0.0%) |
| Total | 161 (100.0%) | 145 (100.0%) |
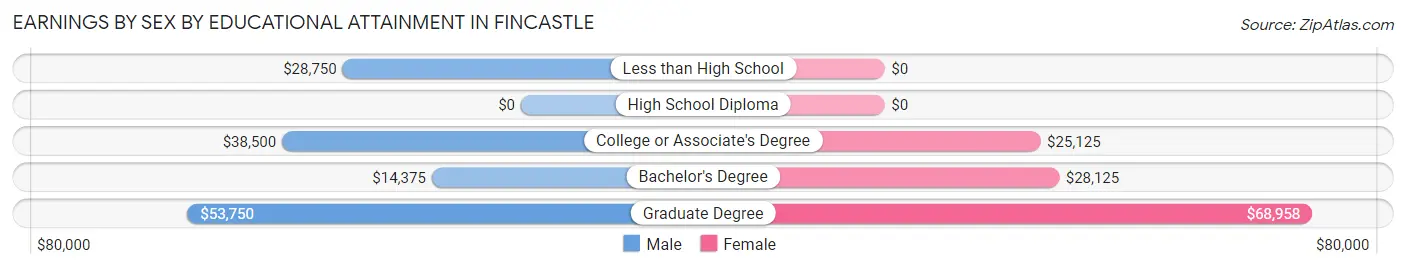
Earnings by Sex by Educational Attainment in Fincastle
Average earnings in Fincastle are $36,250 for men and $25,333 for women, a difference of 30.1%. Men with an educational attainment of graduate degree enjoy the highest average annual earnings of $53,750, while those with bachelor's degree education earn the least with $14,375. Women with an educational attainment of graduate degree earn the most with the average annual earnings of $68,958, while those with college or associate's degree education have the smallest earnings of $25,125.
| Educational Attainment | Male Income | Female Income |
| Less than High School | $28,750 | $0 |
| High School Diploma | - | - |
| College or Associate's Degree | $38,500 | $25,125 |
| Bachelor's Degree | $14,375 | $28,125 |
| Graduate Degree | $53,750 | $68,958 |
| Total | $36,250 | $25,333 |
Family Income in Fincastle
Family Income Brackets in Fincastle
According to the Fincastle family income data, there are 26 families falling into the $75,000 to $99,999 income range, which is the most common income bracket and makes up 23.2% of all families.
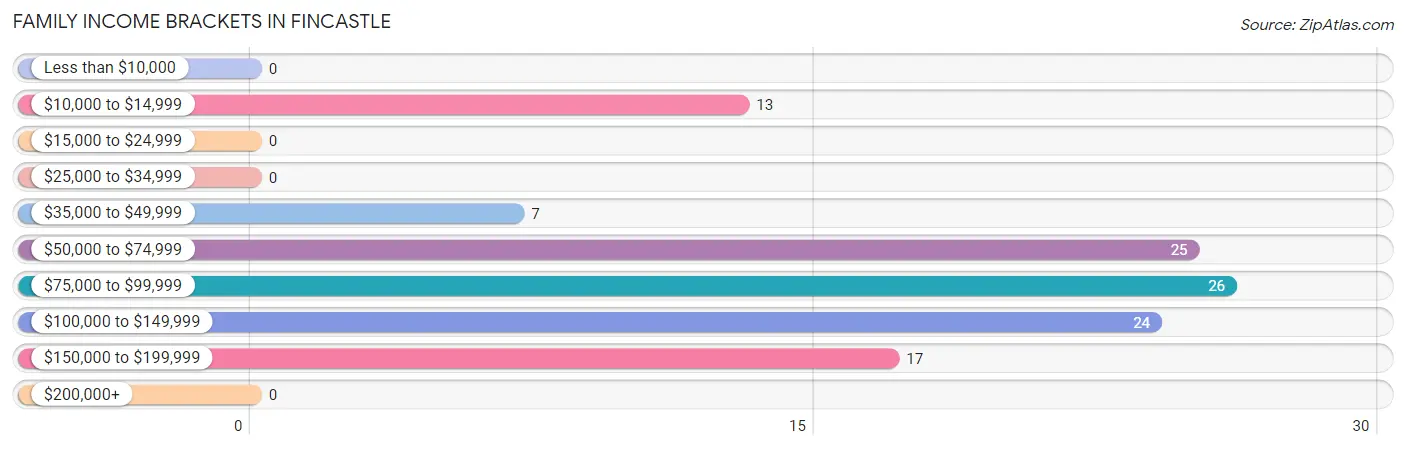
| Income Bracket | # Families | % Families |
| Less than $10,000 | 0 | 0.0% |
| $10,000 to $14,999 | 13 | 11.6% |
| $15,000 to $24,999 | 0 | 0.0% |
| $25,000 to $34,999 | 0 | 0.0% |
| $35,000 to $49,999 | 7 | 6.3% |
| $50,000 to $74,999 | 25 | 22.3% |
| $75,000 to $99,999 | 26 | 23.2% |
| $100,000 to $149,999 | 24 | 21.4% |
| $150,000 to $199,999 | 17 | 15.2% |
| $200,000+ | 0 | 0.0% |
Family Income by Famaliy Size in Fincastle
2-person families (59 | 52.7%) account for the highest median family income in Fincastle with $86,250 per family, while 2-person families (59 | 52.7%) have the highest median income of $43,125 per family member.
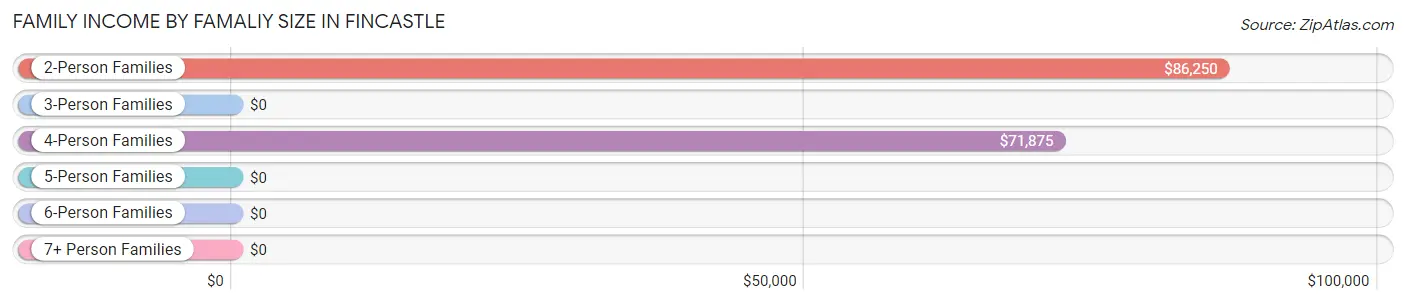
| Income Bracket | # Families | Median Income |
| 2-Person Families | 59 (52.7%) | $86,250 |
| 3-Person Families | 41 (36.6%) | $0 |
| 4-Person Families | 11 (9.8%) | $71,875 |
| 5-Person Families | 0 (0.0%) | $0 |
| 6-Person Families | 0 (0.0%) | $0 |
| 7+ Person Families | 1 (0.9%) | $0 |
| Total | 112 (100.0%) | $76,719 |
Family Income by Number of Earners in Fincastle
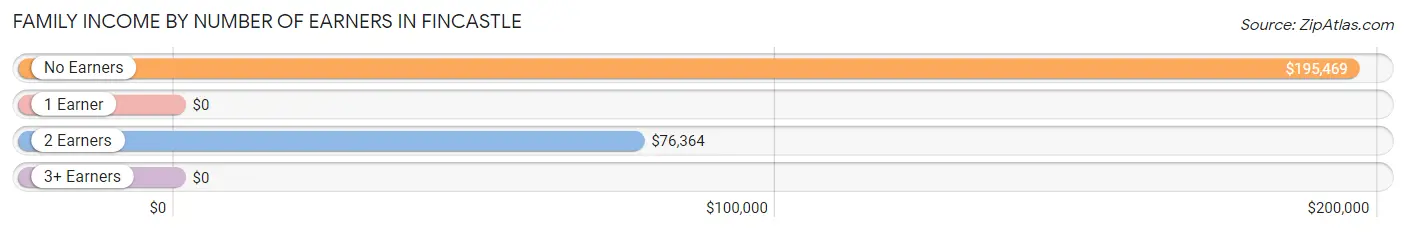
| Number of Earners | # Families | Median Income |
| No Earners | 13 (11.6%) | $195,469 |
| 1 Earner | 30 (26.8%) | $0 |
| 2 Earners | 66 (58.9%) | $76,364 |
| 3+ Earners | 3 (2.7%) | $0 |
| Total | 112 (100.0%) | $76,719 |
Household Income in Fincastle
Household Income Brackets in Fincastle
With 71 households falling in the category, the $50,000 to $74,999 income range is the most frequent in Fincastle, accounting for 35.0% of all households. In contrast, only 1 households (0.5%) fall into the $200,000+ income bracket, making it the least populous group.
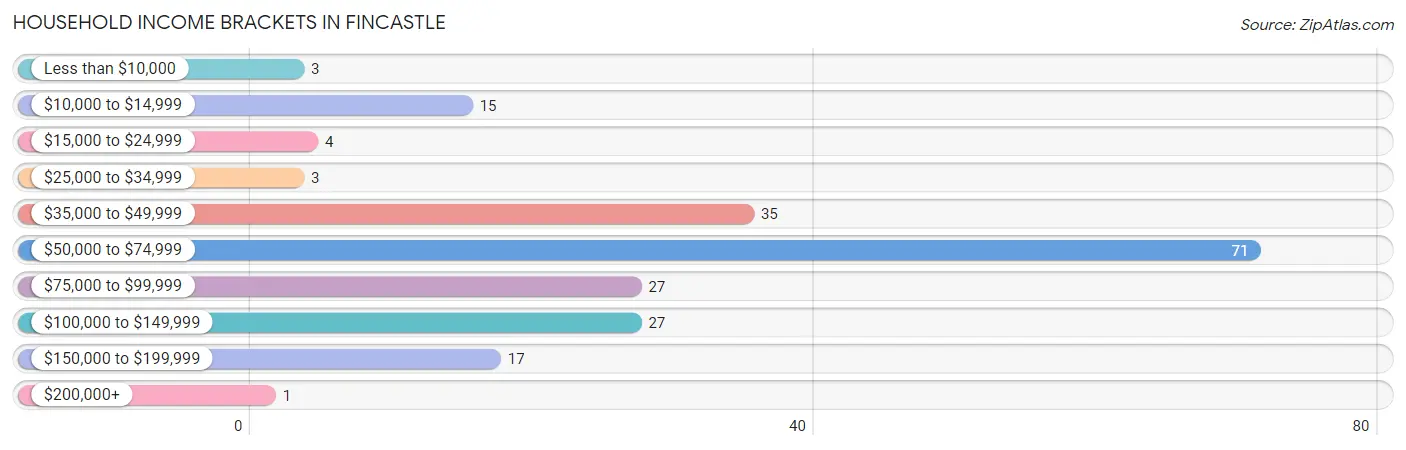
| Income Bracket | # Households | % Households |
| Less than $10,000 | 3 | 1.5% |
| $10,000 to $14,999 | 15 | 7.4% |
| $15,000 to $24,999 | 4 | 2.0% |
| $25,000 to $34,999 | 3 | 1.5% |
| $35,000 to $49,999 | 35 | 17.2% |
| $50,000 to $74,999 | 71 | 35.0% |
| $75,000 to $99,999 | 27 | 13.3% |
| $100,000 to $149,999 | 27 | 13.3% |
| $150,000 to $199,999 | 17 | 8.4% |
| $200,000+ | 1 | 0.5% |
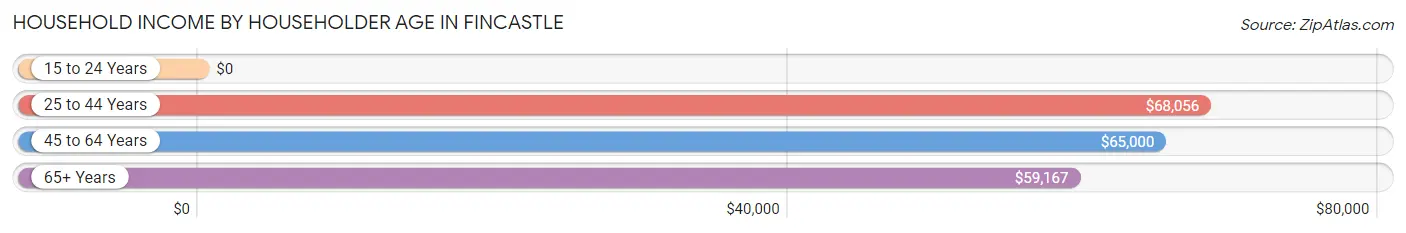
Household Income by Householder Age in Fincastle
The median household income in Fincastle is $59,861, with the highest median household income of $68,056 found in the 25 to 44 years age bracket for the primary householder. A total of 52 households (25.6%) fall into this category. Meanwhile, the 15 to 24 years age bracket for the primary householder has the lowest median household income of $0, with 7 households (3.5%) in this group.
| Income Bracket | # Households | Median Income |
| 15 to 24 Years | 7 (3.5%) | $0 |
| 25 to 44 Years | 52 (25.6%) | $68,056 |
| 45 to 64 Years | 56 (27.6%) | $65,000 |
| 65+ Years | 88 (43.3%) | $59,167 |
| Total | 203 (100.0%) | $59,861 |
Poverty in Fincastle
Income Below Poverty by Sex and Age in Fincastle
With 34.1% poverty level for males and 14.3% for females among the residents of Fincastle, 6 to 11 year old males and under 5 year old females are the most vulnerable to poverty, with 82 males (96.5%) and 12 females (52.2%) in their respective age groups living below the poverty level.
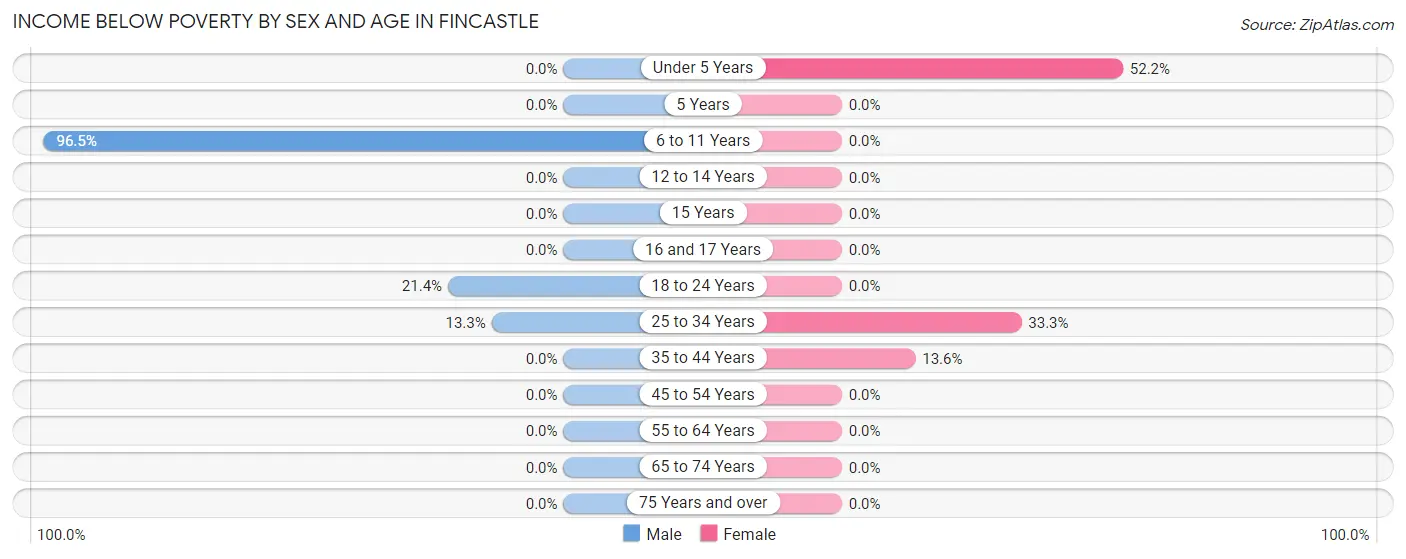
| Age Bracket | Male | Female |
| Under 5 Years | 0 (0.0%) | 12 (52.2%) |
| 5 Years | 0 (0.0%) | 0 (0.0%) |
| 6 to 11 Years | 82 (96.5%) | 0 (0.0%) |
| 12 to 14 Years | 0 (0.0%) | 0 (0.0%) |
| 15 Years | 0 (0.0%) | 0 (0.0%) |
| 16 and 17 Years | 0 (0.0%) | 0 (0.0%) |
| 18 to 24 Years | 3 (21.4%) | 0 (0.0%) |
| 25 to 34 Years | 2 (13.3%) | 21 (33.3%) |
| 35 to 44 Years | 0 (0.0%) | 3 (13.6%) |
| 45 to 54 Years | 0 (0.0%) | 0 (0.0%) |
| 55 to 64 Years | 0 (0.0%) | 0 (0.0%) |
| 65 to 74 Years | 0 (0.0%) | 0 (0.0%) |
| 75 Years and over | 0 (0.0%) | 0 (0.0%) |
| Total | 87 (34.1%) | 36 (14.3%) |
Income Above Poverty by Sex and Age in Fincastle
According to the poverty statistics in Fincastle, males aged under 5 years and females aged 6 to 11 years are the age groups that are most secure financially, with 100.0% of males and 100.0% of females in these age groups living above the poverty line.
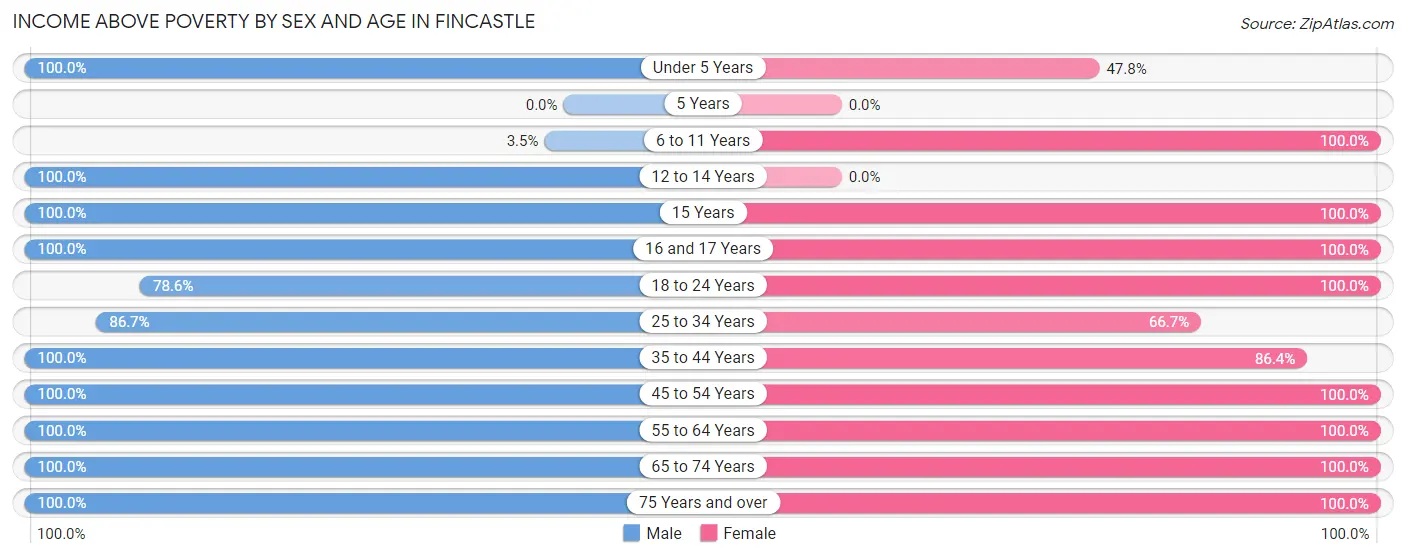
| Age Bracket | Male | Female |
| Under 5 Years | 12 (100.0%) | 11 (47.8%) |
| 5 Years | 0 (0.0%) | 0 (0.0%) |
| 6 to 11 Years | 3 (3.5%) | 18 (100.0%) |
| 12 to 14 Years | 3 (100.0%) | 0 (0.0%) |
| 15 Years | 1 (100.0%) | 1 (100.0%) |
| 16 and 17 Years | 13 (100.0%) | 3 (100.0%) |
| 18 to 24 Years | 11 (78.6%) | 7 (100.0%) |
| 25 to 34 Years | 13 (86.7%) | 42 (66.7%) |
| 35 to 44 Years | 9 (100.0%) | 19 (86.4%) |
| 45 to 54 Years | 31 (100.0%) | 15 (100.0%) |
| 55 to 64 Years | 24 (100.0%) | 33 (100.0%) |
| 65 to 74 Years | 36 (100.0%) | 50 (100.0%) |
| 75 Years and over | 12 (100.0%) | 16 (100.0%) |
| Total | 168 (65.9%) | 215 (85.7%) |
Income Below Poverty Among Married-Couple Families in Fincastle
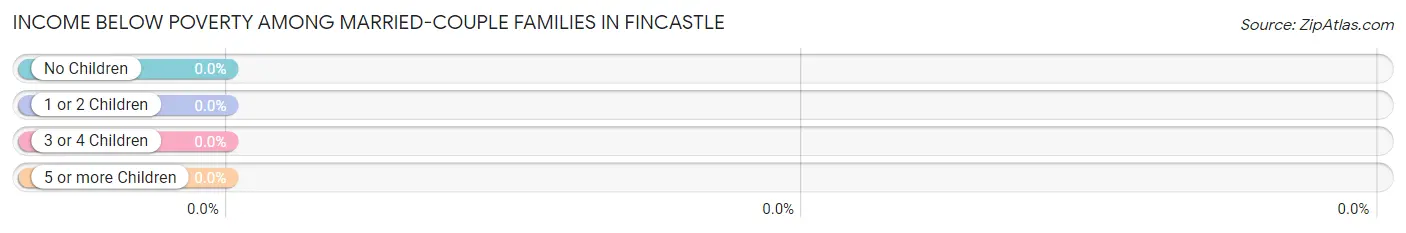
| Children | Above Poverty | Below Poverty |
| No Children | 54 (100.0%) | 0 (0.0%) |
| 1 or 2 Children | 32 (100.0%) | 0 (0.0%) |
| 3 or 4 Children | 0 (0.0%) | 0 (0.0%) |
| 5 or more Children | 1 (100.0%) | 0 (0.0%) |
| Total | 87 (100.0%) | 0 (0.0%) |
Income Below Poverty Among Single-Parent Households in Fincastle
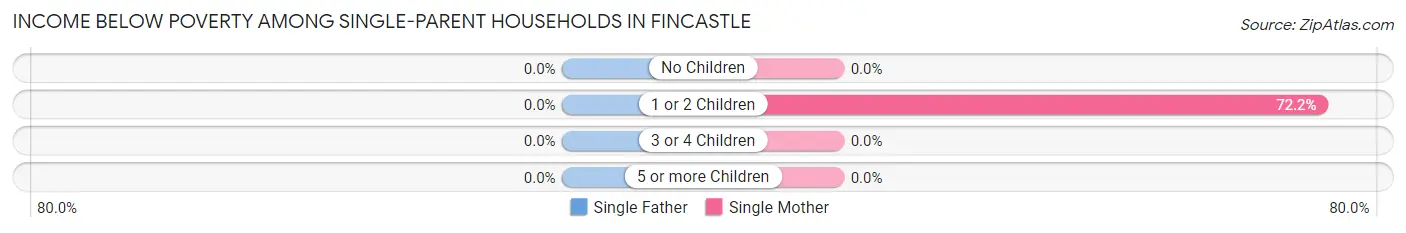
| Children | Single Father | Single Mother |
| No Children | 0 (0.0%) | 0 (0.0%) |
| 1 or 2 Children | 0 (0.0%) | 13 (72.2%) |
| 3 or 4 Children | 0 (0.0%) | 0 (0.0%) |
| 5 or more Children | 0 (0.0%) | 0 (0.0%) |
| Total | 0 (0.0%) | 13 (56.5%) |
Income Below Poverty Among Married-Couple vs Single-Parent Households in Fincastle
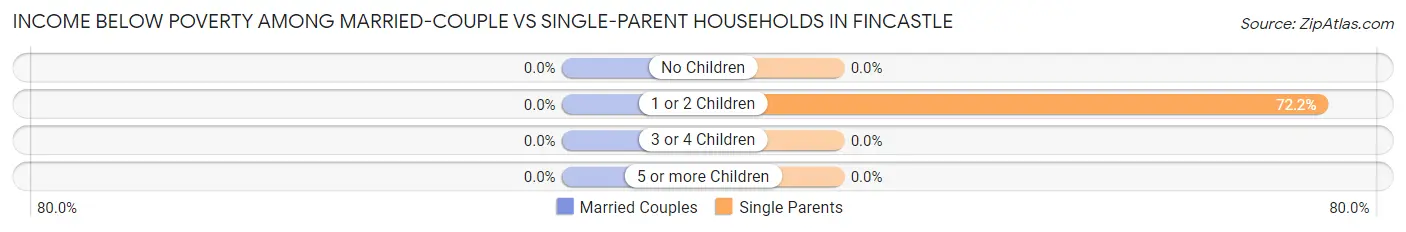
| Children | Married-Couple Families | Single-Parent Households |
| No Children | 0 (0.0%) | 0 (0.0%) |
| 1 or 2 Children | 0 (0.0%) | 13 (72.2%) |
| 3 or 4 Children | 0 (0.0%) | 0 (0.0%) |
| 5 or more Children | 0 (0.0%) | 0 (0.0%) |
| Total | 0 (0.0%) | 13 (52.0%) |
Race in Fincastle
The most populous races in Fincastle are White / Caucasian (539 | 86.8%), Black / African American (42 | 6.8%), and Asian (12 | 1.9%).
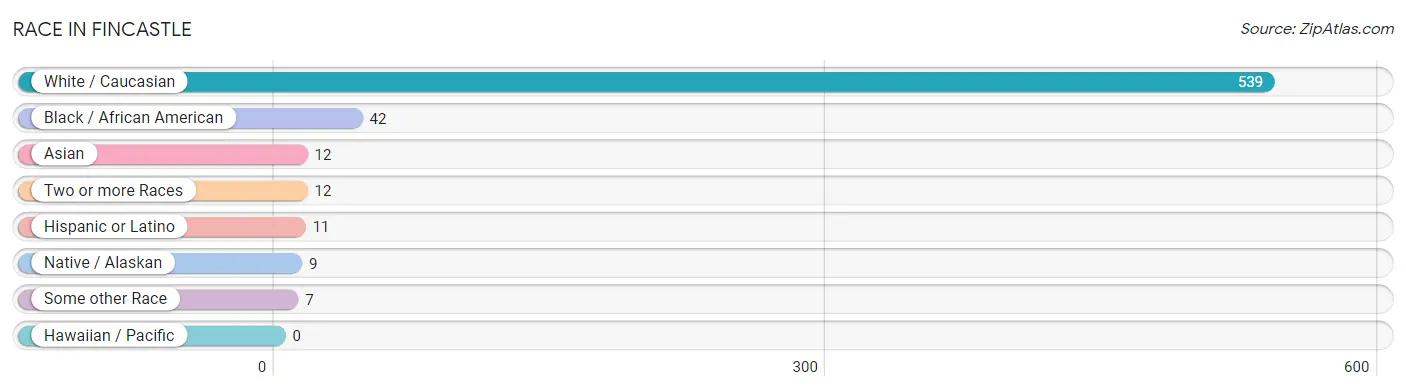
| Race | # Population | % Population |
| Asian | 12 | 1.9% |
| Black / African American | 42 | 6.8% |
| Hawaiian / Pacific | 0 | 0.0% |
| Hispanic or Latino | 11 | 1.8% |
| Native / Alaskan | 9 | 1.5% |
| White / Caucasian | 539 | 86.8% |
| Two or more Races | 12 | 1.9% |
| Some other Race | 7 | 1.1% |
| Total | 621 | 100.0% |
Ancestry in Fincastle
The most populous ancestries reported in Fincastle are English (68 | 11.0%), American (66 | 10.6%), Irish (55 | 8.9%), German (53 | 8.5%), and Scotch-Irish (24 | 3.9%), together accounting for 42.8% of all Fincastle residents.
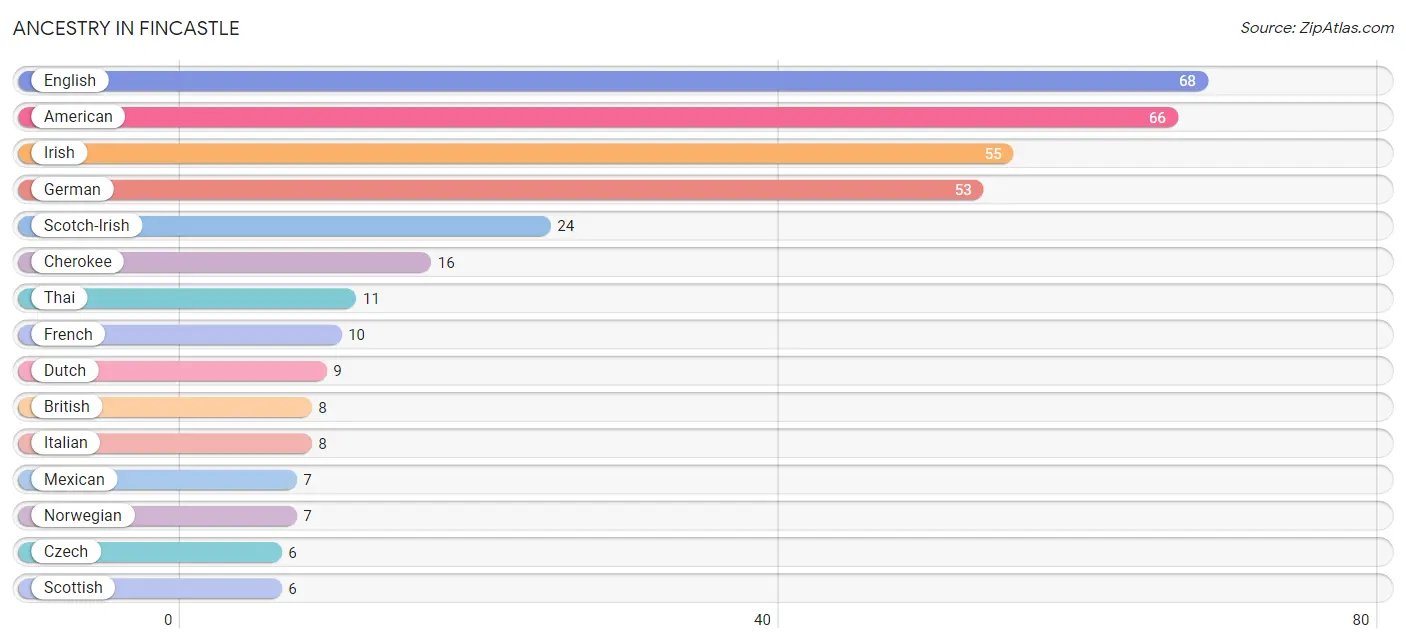
| Ancestry | # Population | % Population |
| American | 66 | 10.6% |
| Austrian | 2 | 0.3% |
| Blackfeet | 1 | 0.2% |
| British | 8 | 1.3% |
| Celtic | 1 | 0.2% |
| Central American | 4 | 0.6% |
| Cherokee | 16 | 2.6% |
| Czech | 6 | 1.0% |
| Dutch | 9 | 1.5% |
| English | 68 | 11.0% |
| French | 10 | 1.6% |
| German | 53 | 8.5% |
| Indian (Asian) | 1 | 0.2% |
| Irish | 55 | 8.9% |
| Italian | 8 | 1.3% |
| Mexican | 7 | 1.1% |
| Norwegian | 7 | 1.1% |
| Salvadoran | 4 | 0.6% |
| Scotch-Irish | 24 | 3.9% |
| Scottish | 6 | 1.0% |
| Sioux | 1 | 0.2% |
| Slovene | 5 | 0.8% |
| Swedish | 4 | 0.6% |
| Thai | 11 | 1.8% |
| Welsh | 3 | 0.5% | View All 25 Rows |
Immigrants in Fincastle
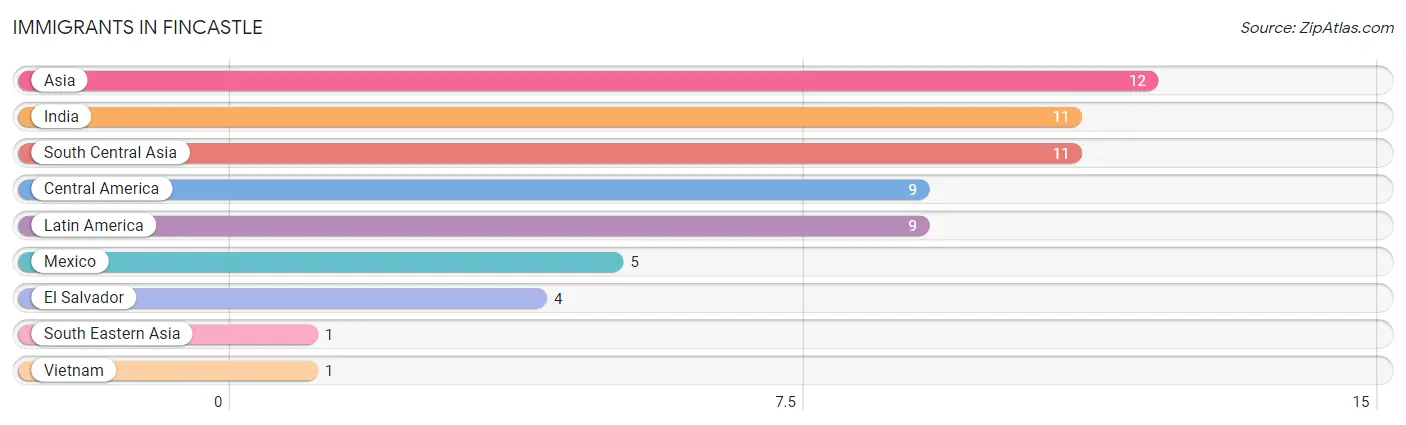
The most numerous immigrant groups reported in Fincastle came from Asia (12 | 1.9%), India (11 | 1.8%), South Central Asia (11 | 1.8%), Central America (9 | 1.5%), and Latin America (9 | 1.5%), together accounting for 8.4% of all Fincastle residents.
| Immigration Origin | # Population | % Population |
| Asia | 12 | 1.9% |
| Central America | 9 | 1.5% |
| El Salvador | 4 | 0.6% |
| India | 11 | 1.8% |
| Latin America | 9 | 1.5% |
| Mexico | 5 | 0.8% |
| South Central Asia | 11 | 1.8% |
| South Eastern Asia | 1 | 0.2% |
| Vietnam | 1 | 0.2% | View All 9 Rows |
Sex and Age in Fincastle
Sex and Age in Fincastle
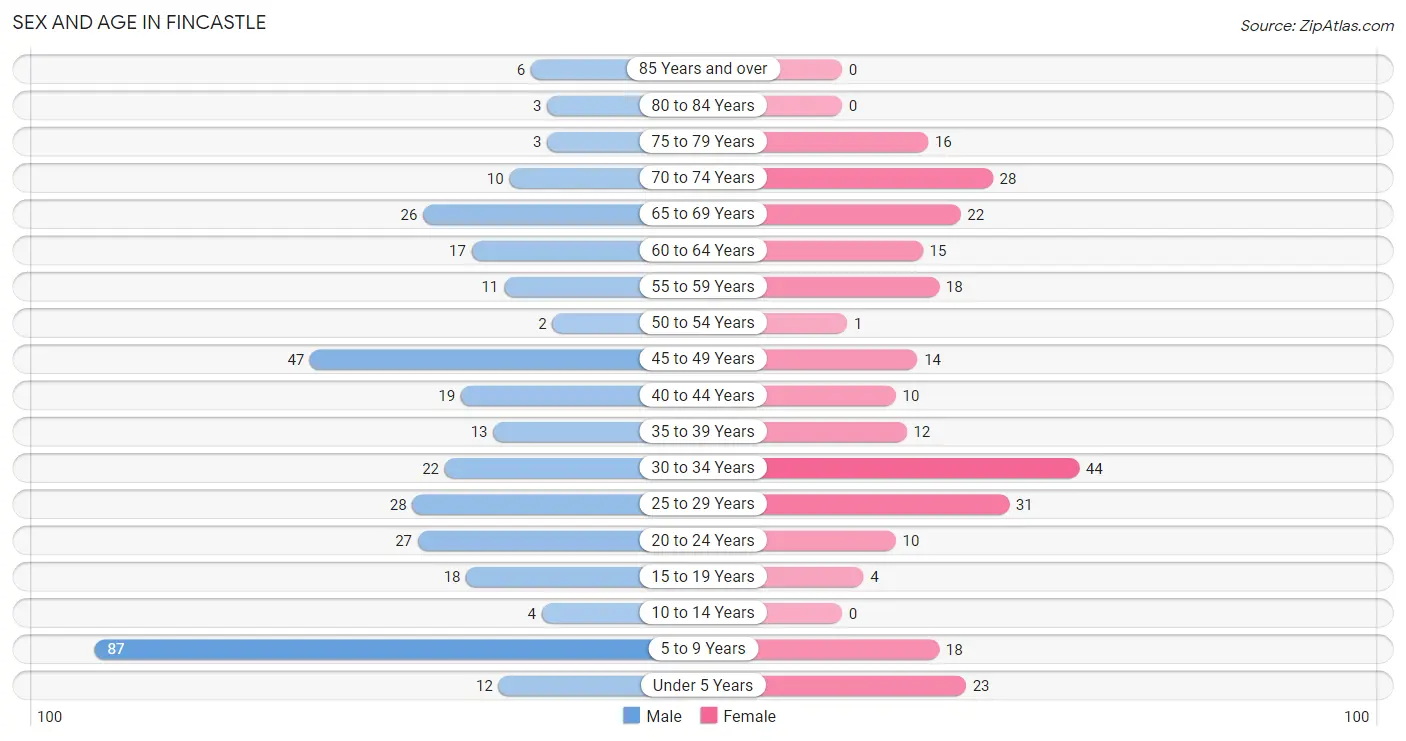
The most populous age groups in Fincastle are 5 to 9 Years (87 | 24.5%) for men and 30 to 34 Years (44 | 16.5%) for women.
| Age Bracket | Male | Female |
| Under 5 Years | 12 (3.4%) | 23 (8.6%) |
| 5 to 9 Years | 87 (24.5%) | 18 (6.8%) |
| 10 to 14 Years | 4 (1.1%) | 0 (0.0%) |
| 15 to 19 Years | 18 (5.1%) | 4 (1.5%) |
| 20 to 24 Years | 27 (7.6%) | 10 (3.8%) |
| 25 to 29 Years | 28 (7.9%) | 31 (11.7%) |
| 30 to 34 Years | 22 (6.2%) | 44 (16.5%) |
| 35 to 39 Years | 13 (3.7%) | 12 (4.5%) |
| 40 to 44 Years | 19 (5.3%) | 10 (3.8%) |
| 45 to 49 Years | 47 (13.2%) | 14 (5.3%) |
| 50 to 54 Years | 2 (0.6%) | 1 (0.4%) |
| 55 to 59 Years | 11 (3.1%) | 18 (6.8%) |
| 60 to 64 Years | 17 (4.8%) | 15 (5.6%) |
| 65 to 69 Years | 26 (7.3%) | 22 (8.3%) |
| 70 to 74 Years | 10 (2.8%) | 28 (10.5%) |
| 75 to 79 Years | 3 (0.9%) | 16 (6.0%) |
| 80 to 84 Years | 3 (0.9%) | 0 (0.0%) |
| 85 Years and over | 6 (1.7%) | 0 (0.0%) |
| Total | 355 (100.0%) | 266 (100.0%) |
Families and Households in Fincastle
Median Family Size in Fincastle
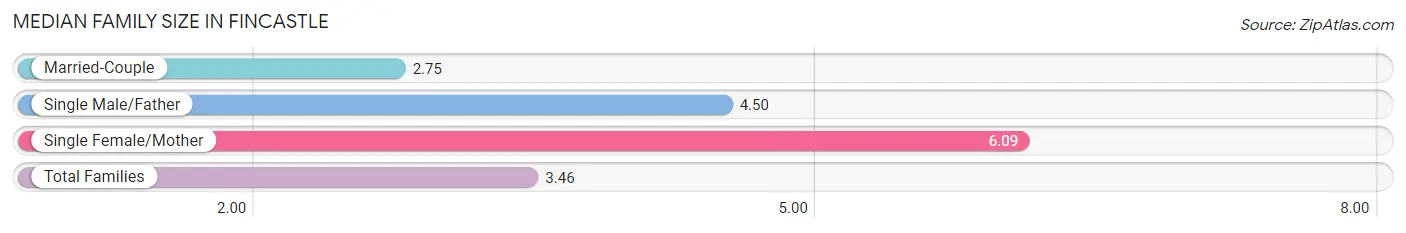
The median family size in Fincastle is 3.46 persons per family, with single female/mother families (23 | 20.5%) accounting for the largest median family size of 6.09 persons per family. On the other hand, married-couple families (87 | 77.7%) represent the smallest median family size with 2.75 persons per family.
| Family Type | # Families | Family Size |
| Married-Couple | 87 (77.7%) | 2.75 |
| Single Male/Father | 2 (1.8%) | 4.50 |
| Single Female/Mother | 23 (20.5%) | 6.09 |
| Total Families | 112 (100.0%) | 3.46 |
Median Household Size in Fincastle
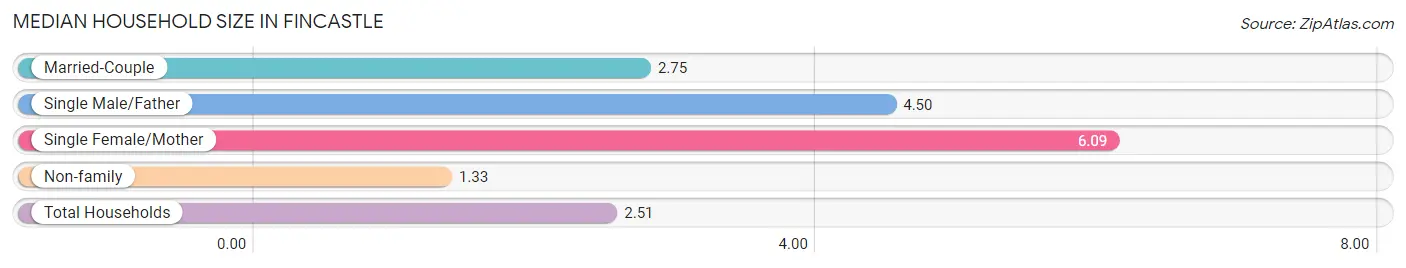
The median household size in Fincastle is 2.51 persons per household, with single female/mother households (23 | 11.3%) accounting for the largest median household size of 6.09 persons per household. non-family households (91 | 44.8%) represent the smallest median household size with 1.33 persons per household.
| Household Type | # Households | Household Size |
| Married-Couple | 87 (42.9%) | 2.75 |
| Single Male/Father | 2 (1.0%) | 4.50 |
| Single Female/Mother | 23 (11.3%) | 6.09 |
| Non-family | 91 (44.8%) | 1.33 |
| Total Households | 203 (100.0%) | 2.51 |
Household Size by Marriage Status in Fincastle
Out of a total of 203 households in Fincastle, 112 (55.2%) are family households, while 91 (44.8%) are nonfamily households. The most numerous type of family households are 2-person households, comprising 59, and the most common type of nonfamily households are 1-person households, comprising 75.
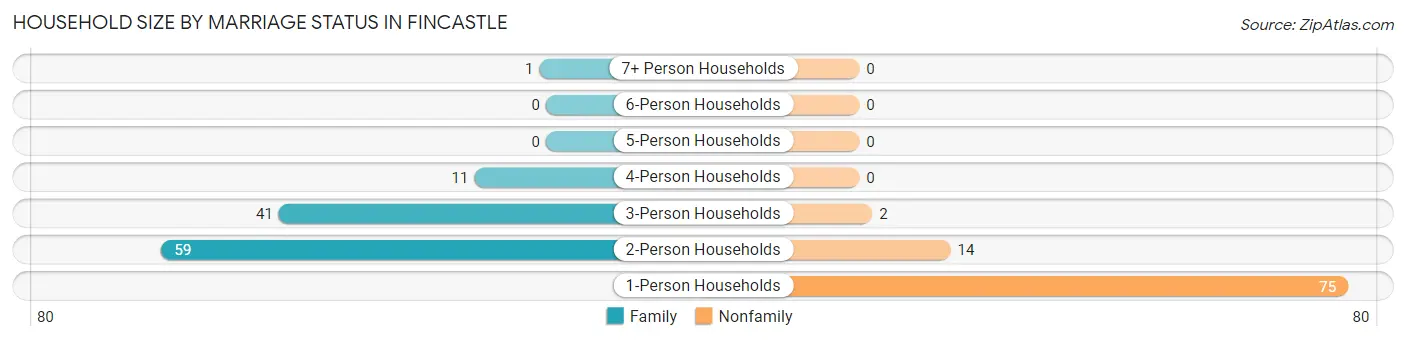
| Household Size | Family Households | Nonfamily Households |
| 1-Person Households | - | 75 (36.9%) |
| 2-Person Households | 59 (29.1%) | 14 (6.9%) |
| 3-Person Households | 41 (20.2%) | 2 (1.0%) |
| 4-Person Households | 11 (5.4%) | 0 (0.0%) |
| 5-Person Households | 0 (0.0%) | 0 (0.0%) |
| 6-Person Households | 0 (0.0%) | 0 (0.0%) |
| 7+ Person Households | 1 (0.5%) | 0 (0.0%) |
| Total | 112 (55.2%) | 91 (44.8%) |
Female Fertility in Fincastle
Fertility by Age in Fincastle
Average fertility rate in Fincastle is 104.0 births per 1,000 women. Women in the age bracket of 20 to 34 years have the highest fertility rate with 118.0 births per 1,000 women. Women in the age bracket of 20 to 34 years acount for 76.9% of all women with births.
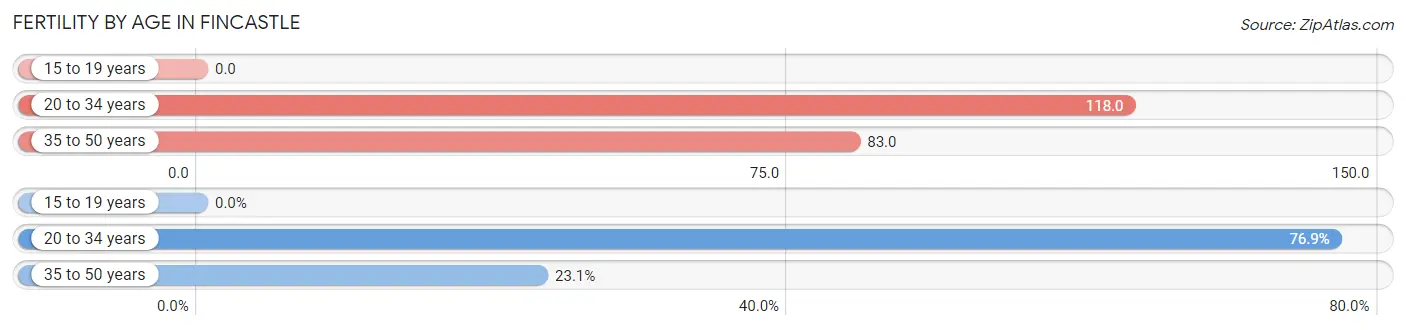
| Age Bracket | Women with Births | Births / 1,000 Women |
| 15 to 19 years | 0 (0.0%) | 0.0 |
| 20 to 34 years | 10 (76.9%) | 118.0 |
| 35 to 50 years | 3 (23.1%) | 83.0 |
| Total | 13 (100.0%) | 104.0 |
Fertility by Age by Marriage Status in Fincastle
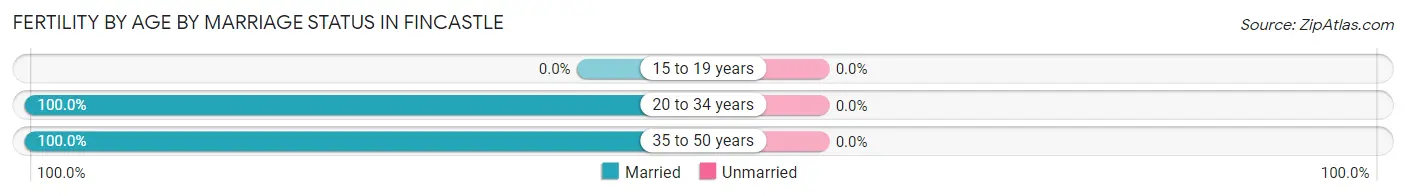
| Age Bracket | Married | Unmarried |
| 15 to 19 years | 0 (0.0%) | 0 (0.0%) |
| 20 to 34 years | 10 (100.0%) | 0 (0.0%) |
| 35 to 50 years | 3 (100.0%) | 0 (0.0%) |
| Total | 13 (100.0%) | 0 (0.0%) |
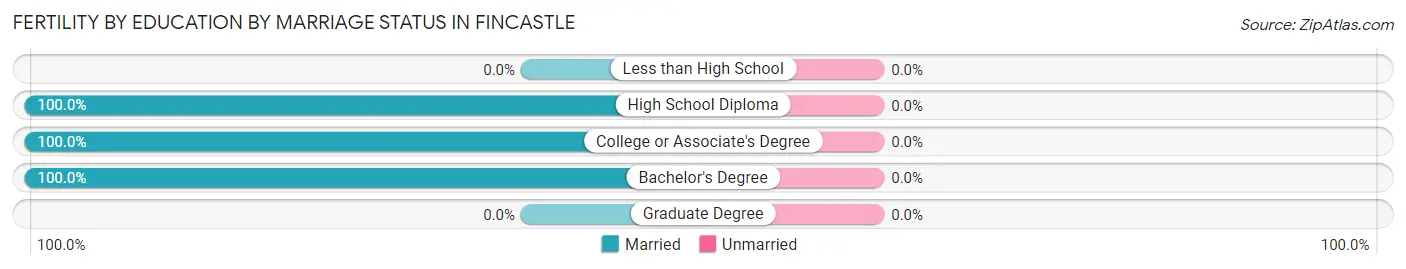
Fertility by Education in Fincastle
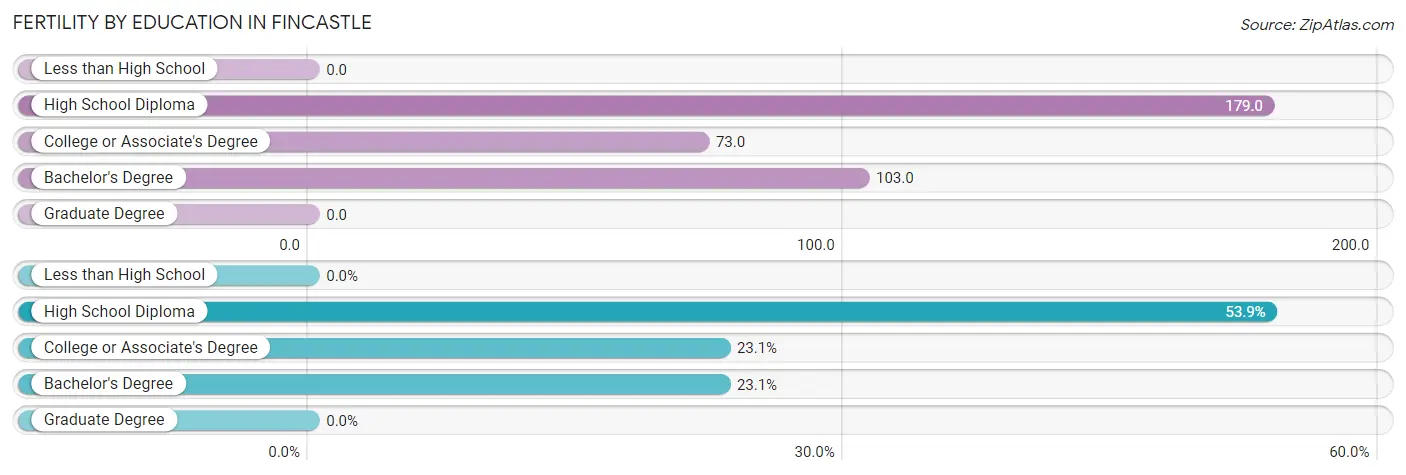
| Educational Attainment | Women with Births | Births / 1,000 Women |
| Less than High School | 0 (0.0%) | 0.0 |
| High School Diploma | 7 (53.8%) | 179.0 |
| College or Associate's Degree | 3 (23.1%) | 73.0 |
| Bachelor's Degree | 3 (23.1%) | 103.0 |
| Graduate Degree | 0 (0.0%) | 0.0 |
| Total | 13 (100.0%) | 104.0 |
Fertility by Education by Marriage Status in Fincastle
| Educational Attainment | Married | Unmarried |
| Less than High School | 0 (0.0%) | 0 (0.0%) |
| High School Diploma | 7 (100.0%) | 0 (0.0%) |
| College or Associate's Degree | 3 (100.0%) | 0 (0.0%) |
| Bachelor's Degree | 3 (100.0%) | 0 (0.0%) |
| Graduate Degree | 0 (0.0%) | 0 (0.0%) |
| Total | 13 (100.0%) | 0 (0.0%) |
Employment Characteristics in Fincastle
Employment by Class of Employer in Fincastle
Among the 237 employed individuals in Fincastle, private company employees (145 | 61.2%), local government employees (51 | 21.5%), and self-employed (incorporated) (11 | 4.6%) make up the most common classes of employment.
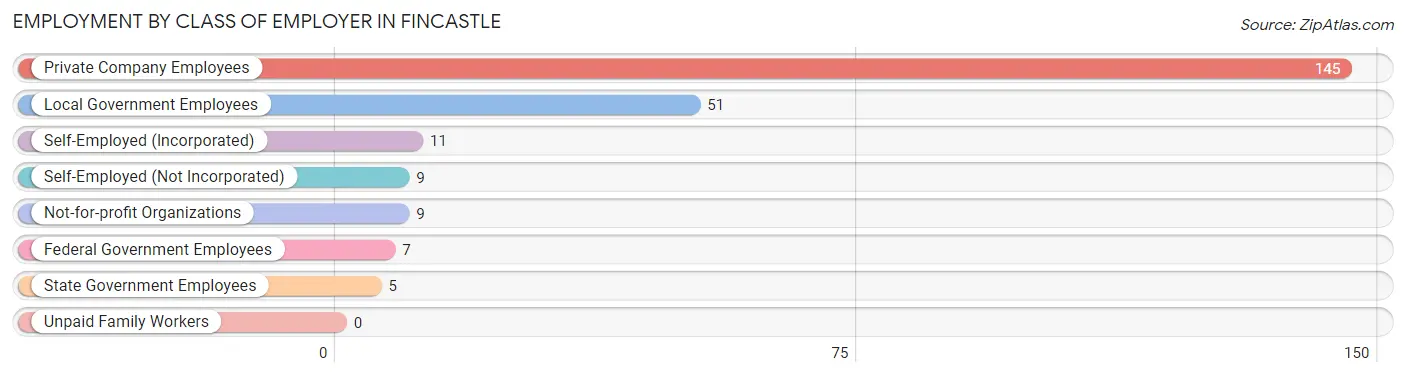
| Employer Class | # Employees | % Employees |
| Private Company Employees | 145 | 61.2% |
| Self-Employed (Incorporated) | 11 | 4.6% |
| Self-Employed (Not Incorporated) | 9 | 3.8% |
| Not-for-profit Organizations | 9 | 3.8% |
| Local Government Employees | 51 | 21.5% |
| State Government Employees | 5 | 2.1% |
| Federal Government Employees | 7 | 2.9% |
| Unpaid Family Workers | 0 | 0.0% |
| Total | 237 | 100.0% |
Employment Status by Age in Fincastle
According to the labor force statistics for Fincastle, out of the total population over 16 years of age (475), 50.5% or 240 individuals are in the labor force, with 1.3% or 3 of them unemployed. The age group with the highest labor force participation rate is 55 to 59 years, with 86.2% or 25 individuals in the labor force. Within the labor force, the 65 to 74 years age range has the highest percentage of unemployed individuals, with 8.8% or 3 of them being unemployed.
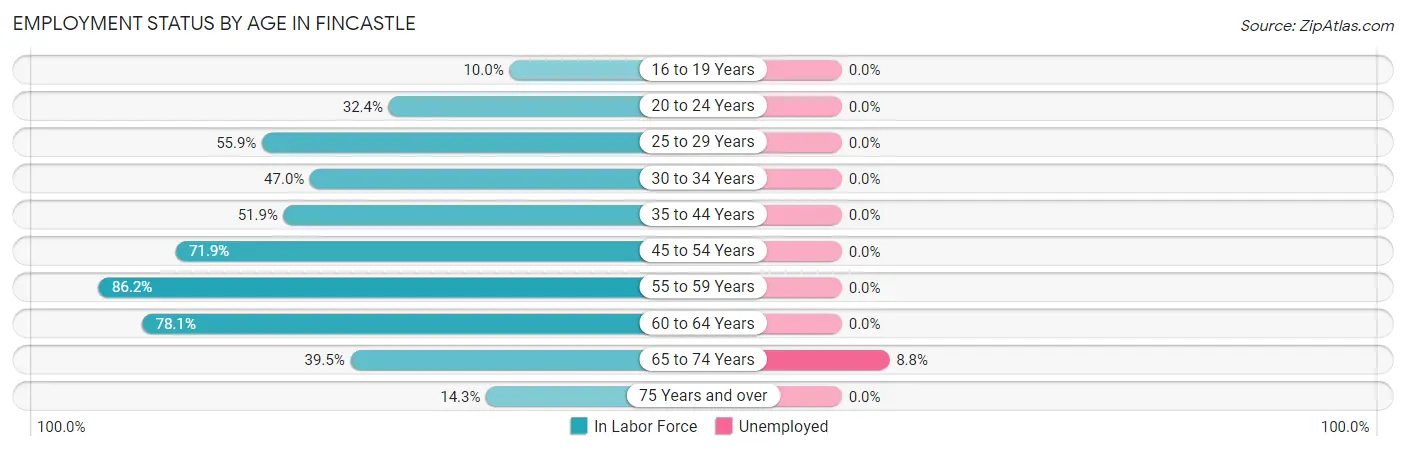
| Age Bracket | In Labor Force | Unemployed |
| 16 to 19 Years | 2 (10.0%) | 0 (0.0%) |
| 20 to 24 Years | 12 (32.4%) | 0 (0.0%) |
| 25 to 29 Years | 33 (55.9%) | 0 (0.0%) |
| 30 to 34 Years | 31 (47.0%) | 0 (0.0%) |
| 35 to 44 Years | 28 (51.9%) | 0 (0.0%) |
| 45 to 54 Years | 46 (71.9%) | 0 (0.0%) |
| 55 to 59 Years | 25 (86.2%) | 0 (0.0%) |
| 60 to 64 Years | 25 (78.1%) | 0 (0.0%) |
| 65 to 74 Years | 34 (39.5%) | 3 (8.8%) |
| 75 Years and over | 4 (14.3%) | 0 (0.0%) |
| Total | 240 (50.5%) | 3 (1.3%) |
Employment Status by Educational Attainment in Fincastle
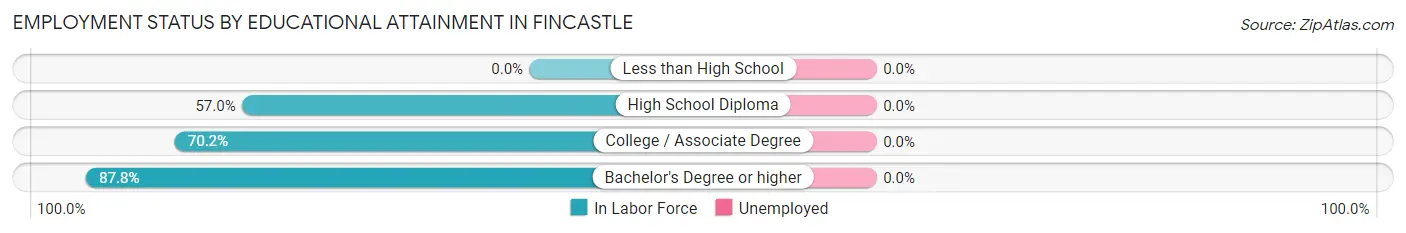
| Educational Attainment | In Labor Force | Unemployed |
| Less than High School | 0 (0.0%) | 0 (0.0%) |
| High School Diploma | 57 (57.0%) | 0 (0.0%) |
| College / Associate Degree | 59 (70.2%) | 0 (0.0%) |
| Bachelor's Degree or higher | 72 (87.8%) | 0 (0.0%) |
| Total | 188 (61.8%) | 0 (0.0%) |
Employment Occupations by Sex in Fincastle
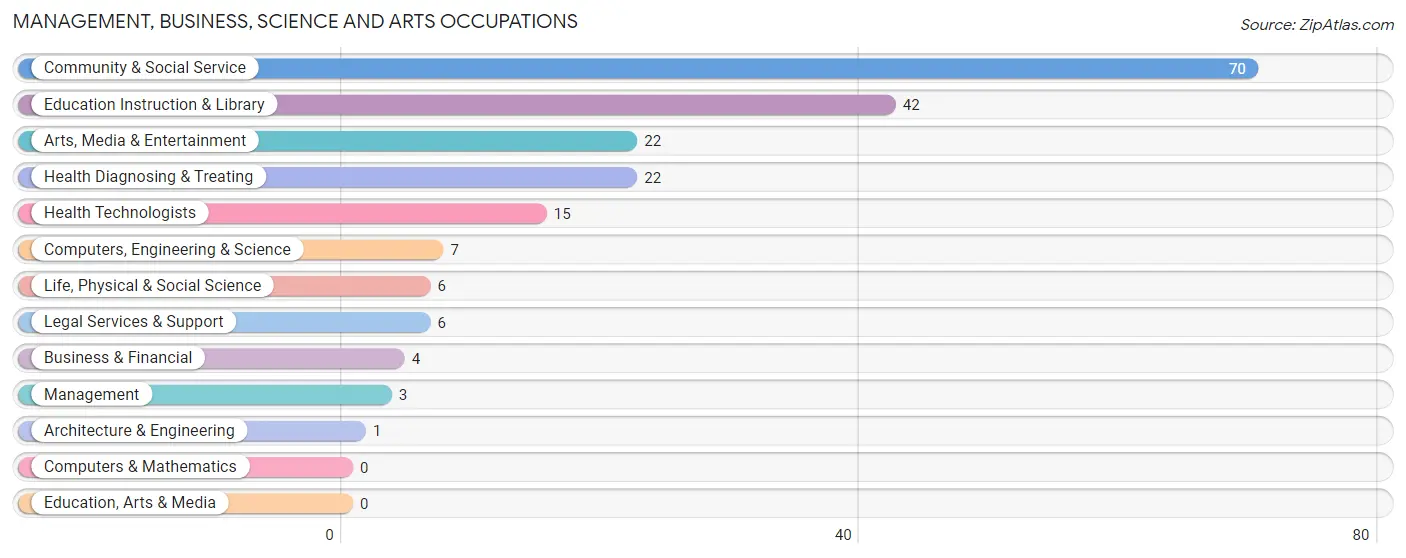
Management, Business, Science and Arts Occupations
The most common Management, Business, Science and Arts occupations in Fincastle are Community & Social Service (70 | 29.5%), Education Instruction & Library (42 | 17.7%), Arts, Media & Entertainment (22 | 9.3%), Health Diagnosing & Treating (22 | 9.3%), and Health Technologists (15 | 6.3%).
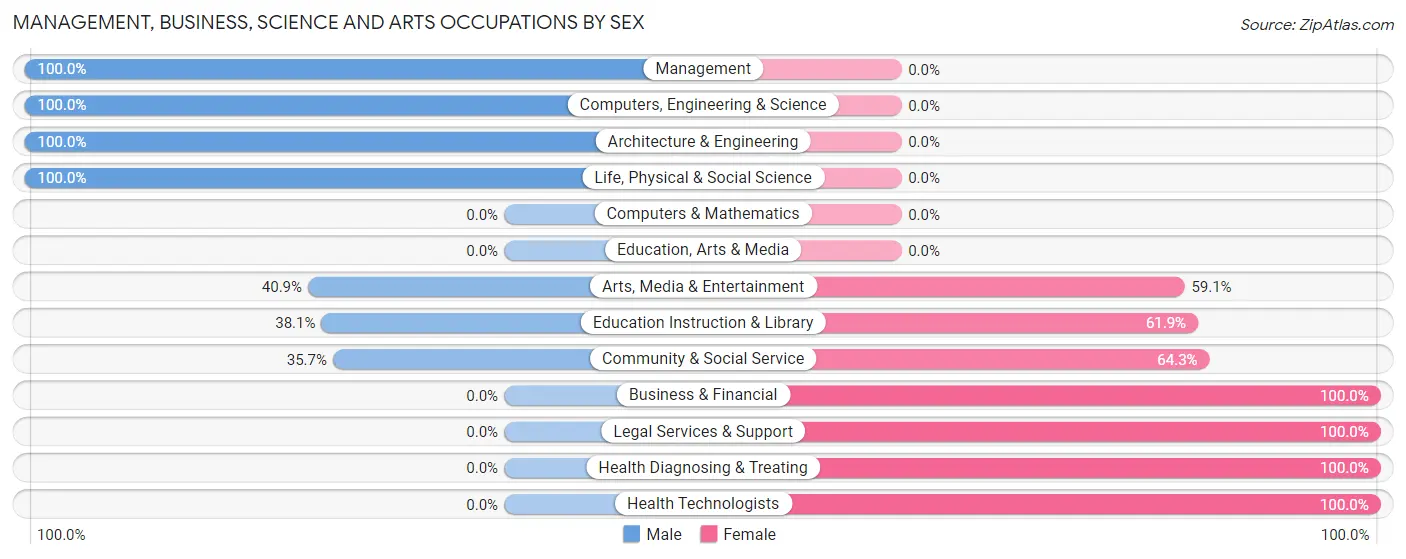
Management, Business, Science and Arts Occupations by Sex
Within the Management, Business, Science and Arts occupations in Fincastle, the most male-oriented occupations are Management (100.0%), Computers, Engineering & Science (100.0%), and Architecture & Engineering (100.0%), while the most female-oriented occupations are Business & Financial (100.0%), Legal Services & Support (100.0%), and Health Diagnosing & Treating (100.0%).
| Occupation | Male | Female |
| Management | 3 (100.0%) | 0 (0.0%) |
| Business & Financial | 0 (0.0%) | 4 (100.0%) |
| Computers, Engineering & Science | 7 (100.0%) | 0 (0.0%) |
| Computers & Mathematics | 0 (0.0%) | 0 (0.0%) |
| Architecture & Engineering | 1 (100.0%) | 0 (0.0%) |
| Life, Physical & Social Science | 6 (100.0%) | 0 (0.0%) |
| Community & Social Service | 25 (35.7%) | 45 (64.3%) |
| Education, Arts & Media | 0 (0.0%) | 0 (0.0%) |
| Legal Services & Support | 0 (0.0%) | 6 (100.0%) |
| Education Instruction & Library | 16 (38.1%) | 26 (61.9%) |
| Arts, Media & Entertainment | 9 (40.9%) | 13 (59.1%) |
| Health Diagnosing & Treating | 0 (0.0%) | 22 (100.0%) |
| Health Technologists | 0 (0.0%) | 15 (100.0%) |
| Total (Category) | 35 (33.0%) | 71 (67.0%) |
| Total (Overall) | 100 (42.2%) | 137 (57.8%) |
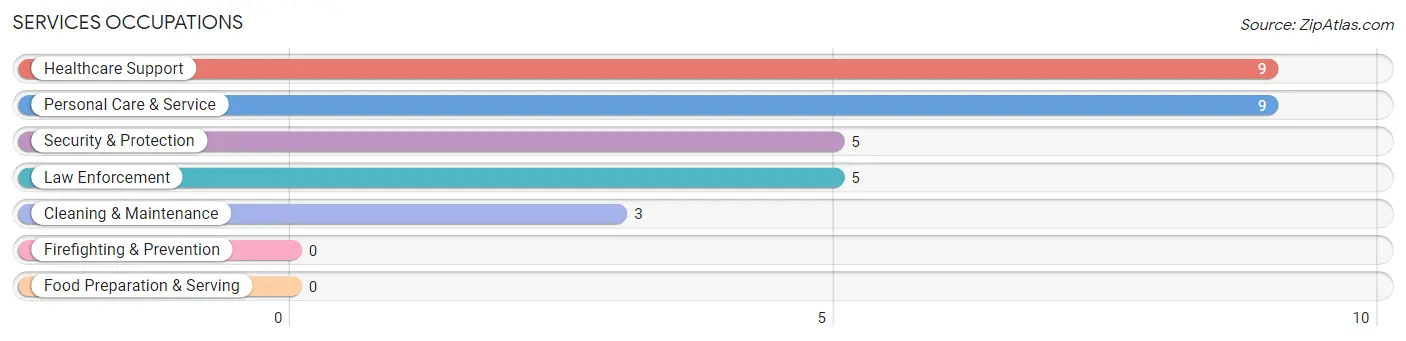
Services Occupations
The most common Services occupations in Fincastle are Healthcare Support (9 | 3.8%), Personal Care & Service (9 | 3.8%), Security & Protection (5 | 2.1%), Law Enforcement (5 | 2.1%), and Cleaning & Maintenance (3 | 1.3%).
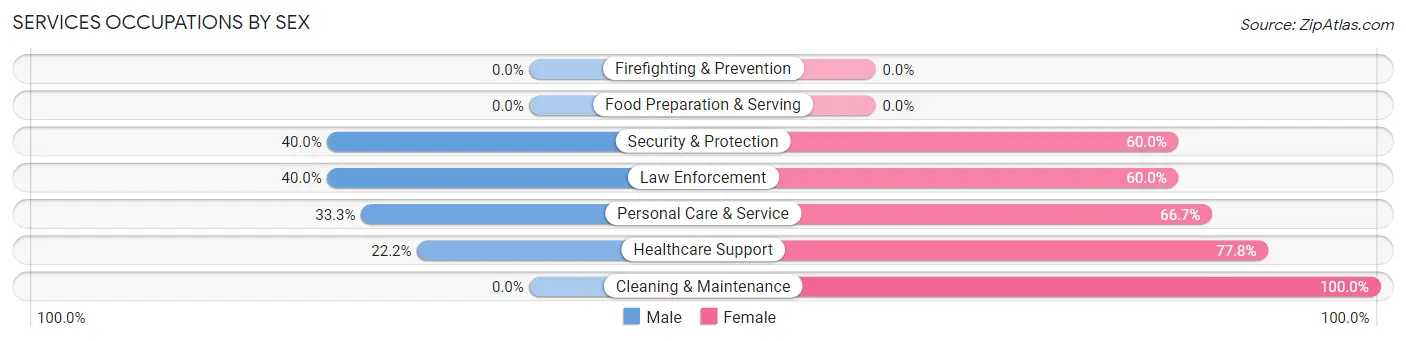
Services Occupations by Sex
Within the Services occupations in Fincastle, the most male-oriented occupations are Security & Protection (40.0%), Law Enforcement (40.0%), and Personal Care & Service (33.3%), while the most female-oriented occupations are Cleaning & Maintenance (100.0%), Healthcare Support (77.8%), and Personal Care & Service (66.7%).
| Occupation | Male | Female |
| Healthcare Support | 2 (22.2%) | 7 (77.8%) |
| Security & Protection | 2 (40.0%) | 3 (60.0%) |
| Firefighting & Prevention | 0 (0.0%) | 0 (0.0%) |
| Law Enforcement | 2 (40.0%) | 3 (60.0%) |
| Food Preparation & Serving | 0 (0.0%) | 0 (0.0%) |
| Cleaning & Maintenance | 0 (0.0%) | 3 (100.0%) |
| Personal Care & Service | 3 (33.3%) | 6 (66.7%) |
| Total (Category) | 7 (26.9%) | 19 (73.1%) |
| Total (Overall) | 100 (42.2%) | 137 (57.8%) |
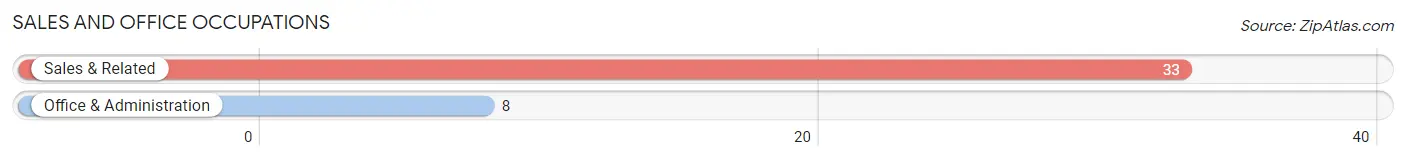
Sales and Office Occupations
The most common Sales and Office occupations in Fincastle are Sales & Related (33 | 13.9%), and Office & Administration (8 | 3.4%).
Sales and Office Occupations by Sex
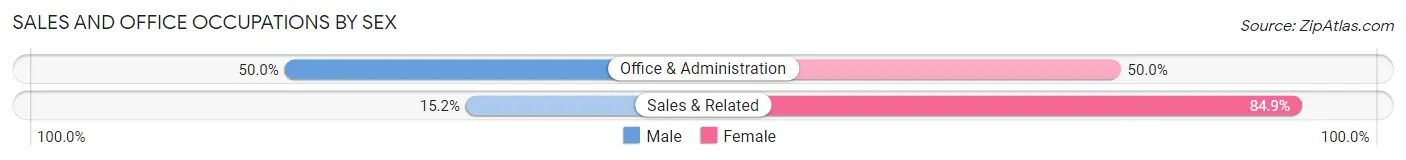
| Occupation | Male | Female |
| Sales & Related | 5 (15.1%) | 28 (84.9%) |
| Office & Administration | 4 (50.0%) | 4 (50.0%) |
| Total (Category) | 9 (22.0%) | 32 (78.0%) |
| Total (Overall) | 100 (42.2%) | 137 (57.8%) |
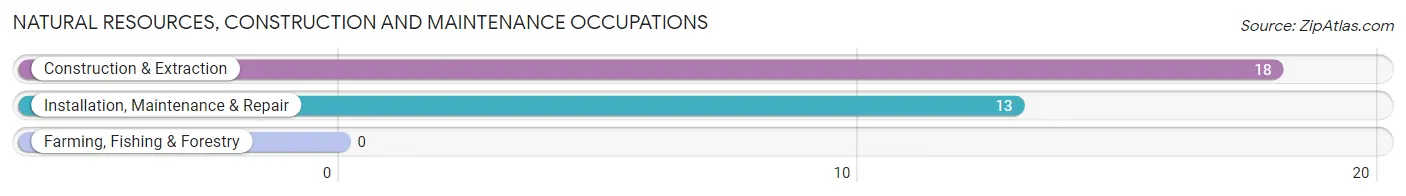
Natural Resources, Construction and Maintenance Occupations
The most common Natural Resources, Construction and Maintenance occupations in Fincastle are Construction & Extraction (18 | 7.6%), and Installation, Maintenance & Repair (13 | 5.5%).
Natural Resources, Construction and Maintenance Occupations by Sex
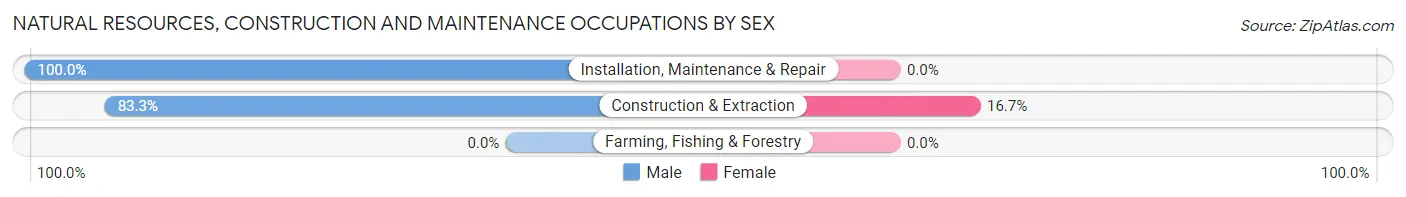
| Occupation | Male | Female |
| Farming, Fishing & Forestry | 0 (0.0%) | 0 (0.0%) |
| Construction & Extraction | 15 (83.3%) | 3 (16.7%) |
| Installation, Maintenance & Repair | 13 (100.0%) | 0 (0.0%) |
| Total (Category) | 28 (90.3%) | 3 (9.7%) |
| Total (Overall) | 100 (42.2%) | 137 (57.8%) |
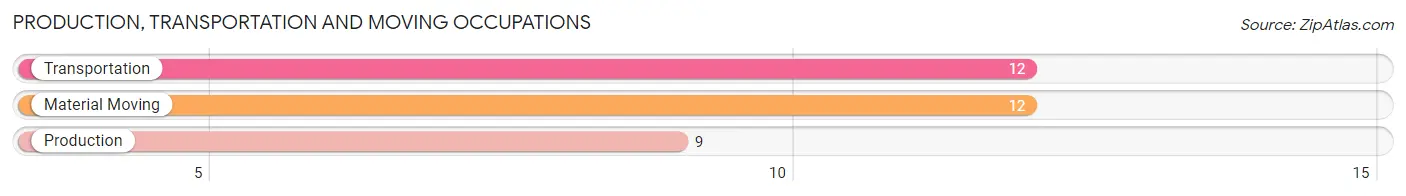
Production, Transportation and Moving Occupations
The most common Production, Transportation and Moving occupations in Fincastle are Transportation (12 | 5.1%), Material Moving (12 | 5.1%), and Production (9 | 3.8%).
Production, Transportation and Moving Occupations by Sex
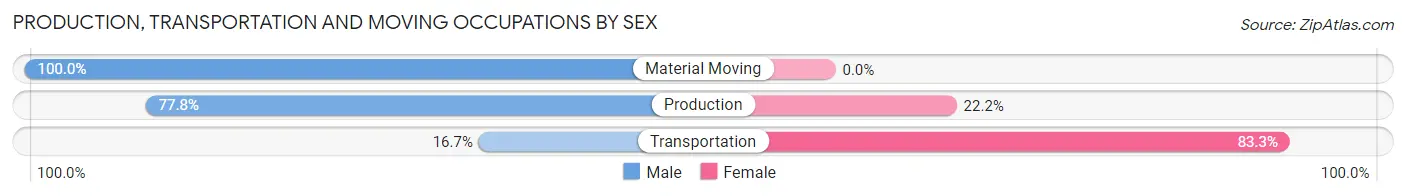
| Occupation | Male | Female |
| Production | 7 (77.8%) | 2 (22.2%) |
| Transportation | 2 (16.7%) | 10 (83.3%) |
| Material Moving | 12 (100.0%) | 0 (0.0%) |
| Total (Category) | 21 (63.6%) | 12 (36.4%) |
| Total (Overall) | 100 (42.2%) | 137 (57.8%) |
Employment Industries by Sex in Fincastle
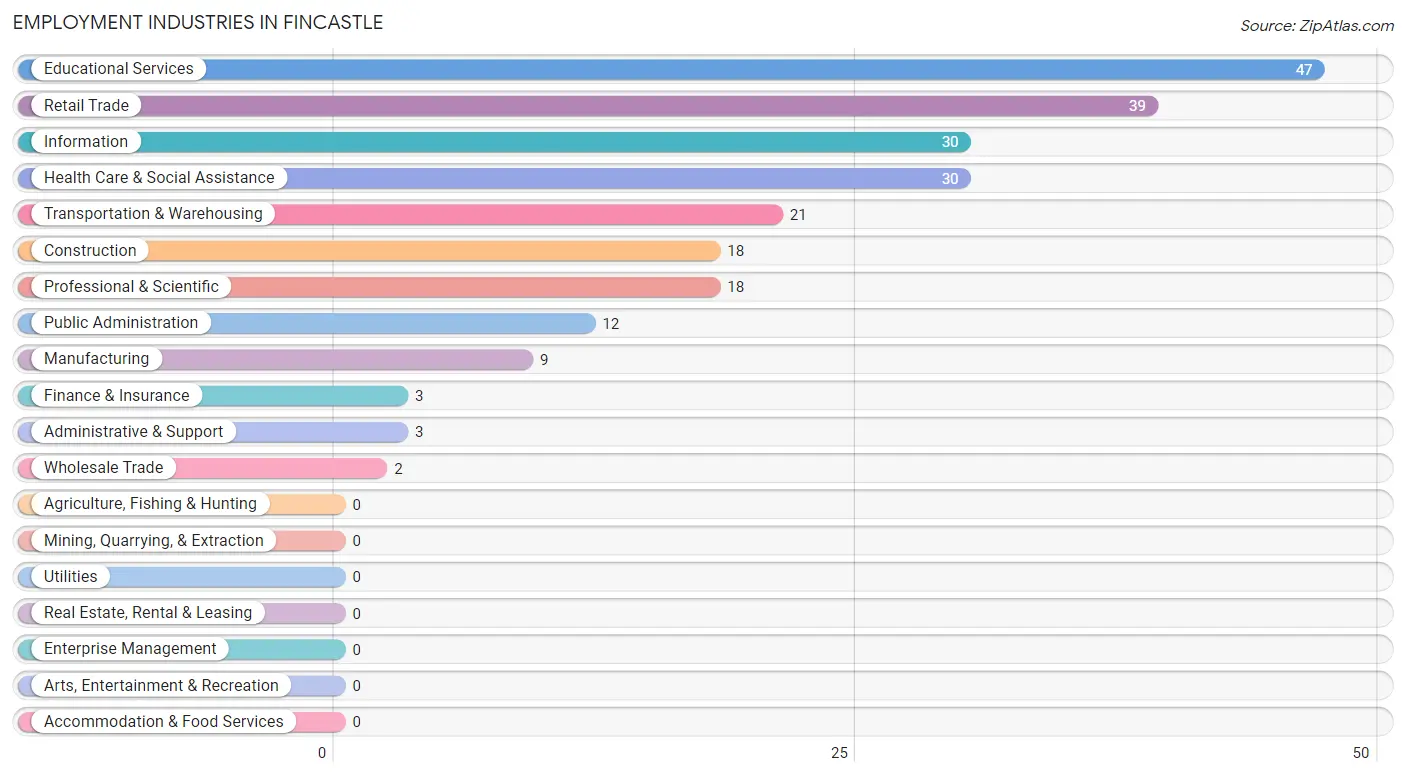
Employment Industries in Fincastle
The major employment industries in Fincastle include Educational Services (47 | 19.8%), Retail Trade (39 | 16.5%), Information (30 | 12.7%), Health Care & Social Assistance (30 | 12.7%), and Transportation & Warehousing (21 | 8.9%).
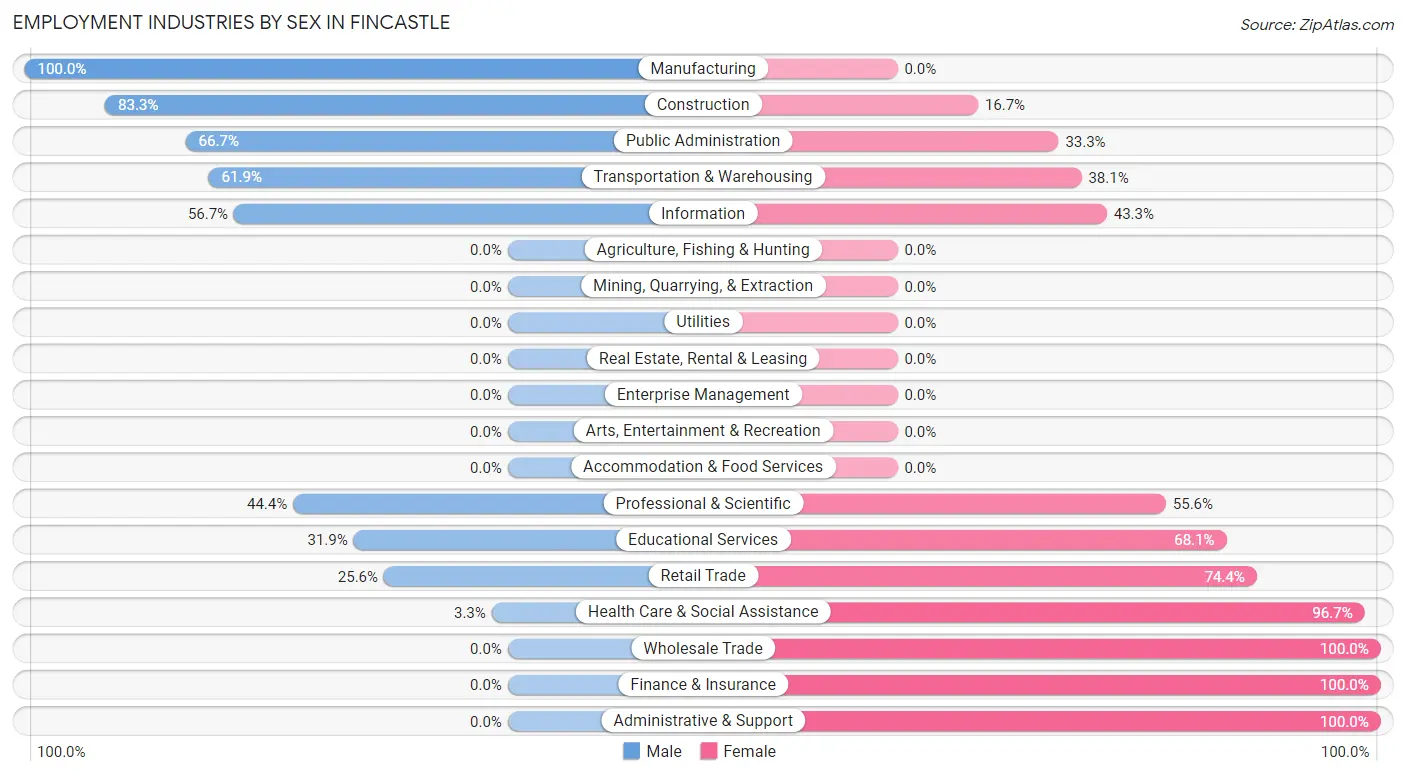
Employment Industries by Sex in Fincastle
The Fincastle industries that see more men than women are Manufacturing (100.0%), Construction (83.3%), and Public Administration (66.7%), whereas the industries that tend to have a higher number of women are Wholesale Trade (100.0%), Finance & Insurance (100.0%), and Administrative & Support (100.0%).
| Industry | Male | Female |
| Agriculture, Fishing & Hunting | 0 (0.0%) | 0 (0.0%) |
| Mining, Quarrying, & Extraction | 0 (0.0%) | 0 (0.0%) |
| Construction | 15 (83.3%) | 3 (16.7%) |
| Manufacturing | 9 (100.0%) | 0 (0.0%) |
| Wholesale Trade | 0 (0.0%) | 2 (100.0%) |
| Retail Trade | 10 (25.6%) | 29 (74.4%) |
| Transportation & Warehousing | 13 (61.9%) | 8 (38.1%) |
| Utilities | 0 (0.0%) | 0 (0.0%) |
| Information | 17 (56.7%) | 13 (43.3%) |
| Finance & Insurance | 0 (0.0%) | 3 (100.0%) |
| Real Estate, Rental & Leasing | 0 (0.0%) | 0 (0.0%) |
| Professional & Scientific | 8 (44.4%) | 10 (55.6%) |
| Enterprise Management | 0 (0.0%) | 0 (0.0%) |
| Administrative & Support | 0 (0.0%) | 3 (100.0%) |
| Educational Services | 15 (31.9%) | 32 (68.1%) |
| Health Care & Social Assistance | 1 (3.3%) | 29 (96.7%) |
| Arts, Entertainment & Recreation | 0 (0.0%) | 0 (0.0%) |
| Accommodation & Food Services | 0 (0.0%) | 0 (0.0%) |
| Public Administration | 8 (66.7%) | 4 (33.3%) |
| Total | 100 (42.2%) | 137 (57.8%) |
Education in Fincastle
School Enrollment in Fincastle
The most common levels of schooling among the 55 students in Fincastle are elementary school (22 | 40.0%), high school (18 | 32.7%), and nursery / preschool (5 | 9.1%).
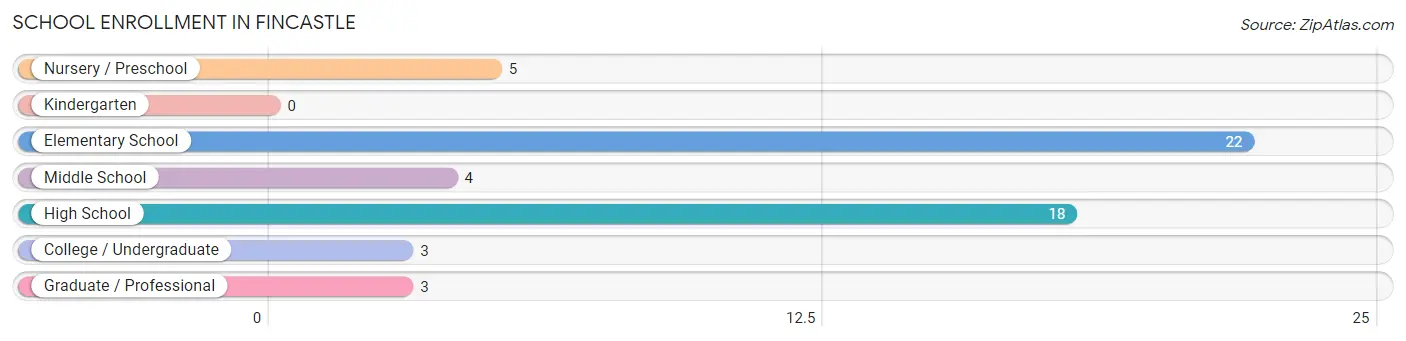
| School Level | # Students | % Students |
| Nursery / Preschool | 5 | 9.1% |
| Kindergarten | 0 | 0.0% |
| Elementary School | 22 | 40.0% |
| Middle School | 4 | 7.3% |
| High School | 18 | 32.7% |
| College / Undergraduate | 3 | 5.4% |
| Graduate / Professional | 3 | 5.4% |
| Total | 55 | 100.0% |
School Enrollment by Age by Funding Source in Fincastle
Out of a total of 55 students who are enrolled in schools in Fincastle, 20 (36.4%) attend a private institution, while the remaining 35 (63.6%) are enrolled in public schools. The age group of 5 to 9 year old has the highest likelihood of being enrolled in private schools, with 18 (81.8% in the age bracket) enrolled. Conversely, the age group of 3 to 4 year olds has the lowest likelihood of being enrolled in a private school, with 5 (100.0% in the age bracket) attending a public institution.
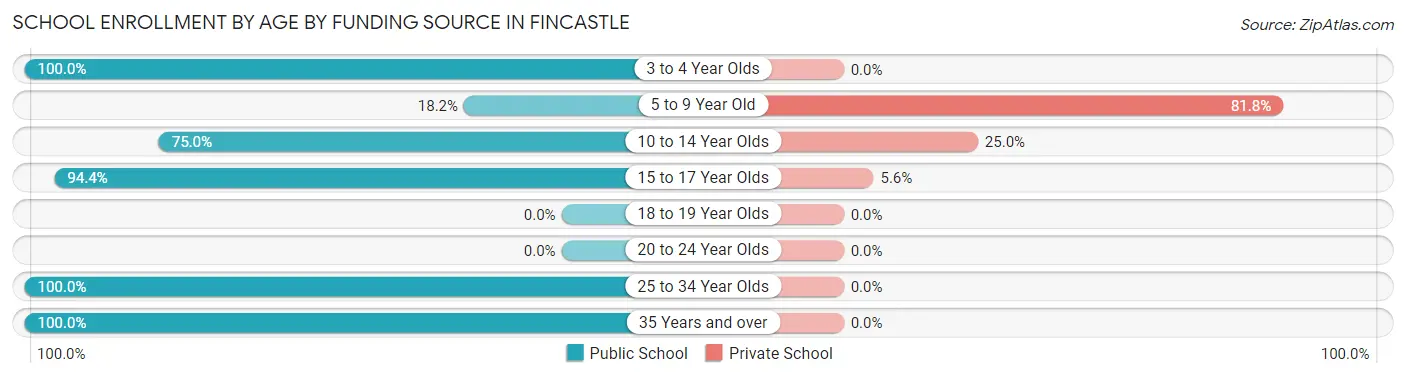
| Age Bracket | Public School | Private School |
| 3 to 4 Year Olds | 5 (100.0%) | 0 (0.0%) |
| 5 to 9 Year Old | 4 (18.2%) | 18 (81.8%) |
| 10 to 14 Year Olds | 3 (75.0%) | 1 (25.0%) |
| 15 to 17 Year Olds | 17 (94.4%) | 1 (5.6%) |
| 18 to 19 Year Olds | 0 (0.0%) | 0 (0.0%) |
| 20 to 24 Year Olds | 0 (0.0%) | 0 (0.0%) |
| 25 to 34 Year Olds | 3 (100.0%) | 0 (0.0%) |
| 35 Years and over | 3 (100.0%) | 0 (0.0%) |
| Total | 35 (63.6%) | 20 (36.4%) |
Educational Attainment by Field of Study in Fincastle
Education (46 | 29.7%), social sciences (34 | 21.9%), bio, nature & agricultural (24 | 15.5%), business (15 | 9.7%), and science & technology (8 | 5.2%) are the most common fields of study among 155 individuals in Fincastle who have obtained a bachelor's degree or higher.
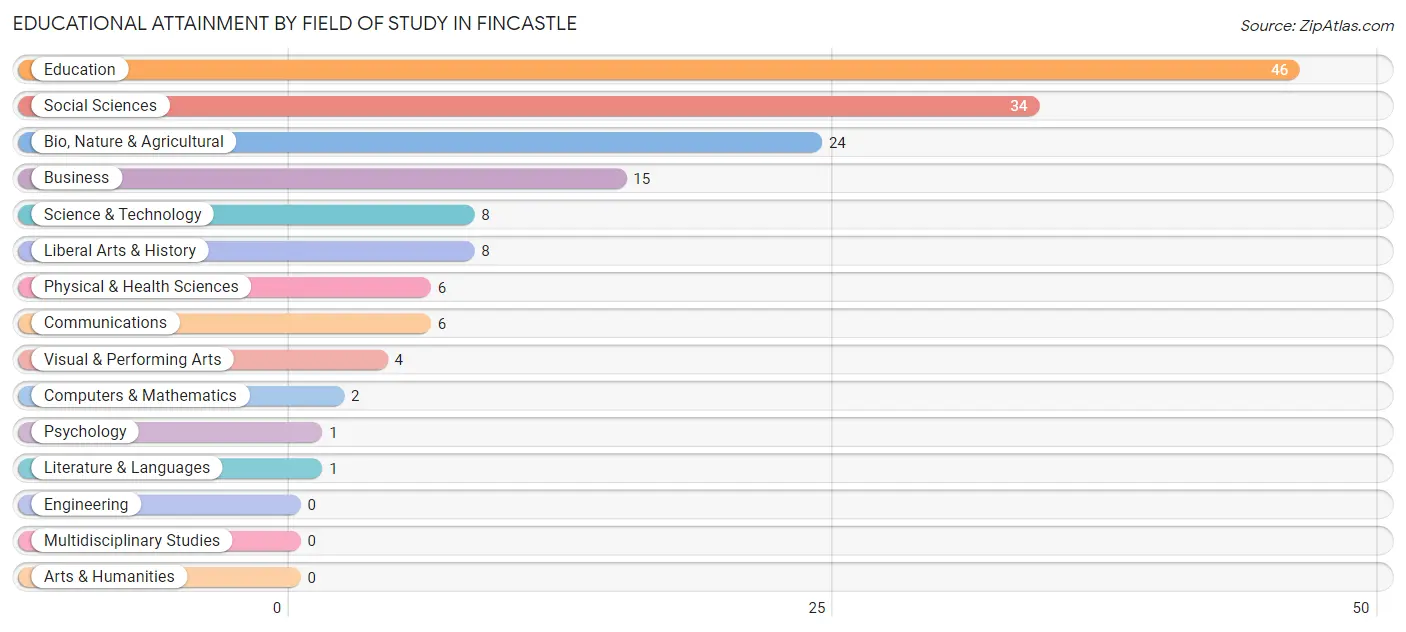
| Field of Study | # Graduates | % Graduates |
| Computers & Mathematics | 2 | 1.3% |
| Bio, Nature & Agricultural | 24 | 15.5% |
| Physical & Health Sciences | 6 | 3.9% |
| Psychology | 1 | 0.6% |
| Social Sciences | 34 | 21.9% |
| Engineering | 0 | 0.0% |
| Multidisciplinary Studies | 0 | 0.0% |
| Science & Technology | 8 | 5.2% |
| Business | 15 | 9.7% |
| Education | 46 | 29.7% |
| Literature & Languages | 1 | 0.6% |
| Liberal Arts & History | 8 | 5.2% |
| Visual & Performing Arts | 4 | 2.6% |
| Communications | 6 | 3.9% |
| Arts & Humanities | 0 | 0.0% |
| Total | 155 | 100.0% |
Transportation & Commute in Fincastle
Vehicle Availability by Sex in Fincastle
The most prevalent vehicle ownership categories in Fincastle are males with 2 vehicles (57, accounting for 57.0%) and females with 2 vehicles (56, making up 41.6%).
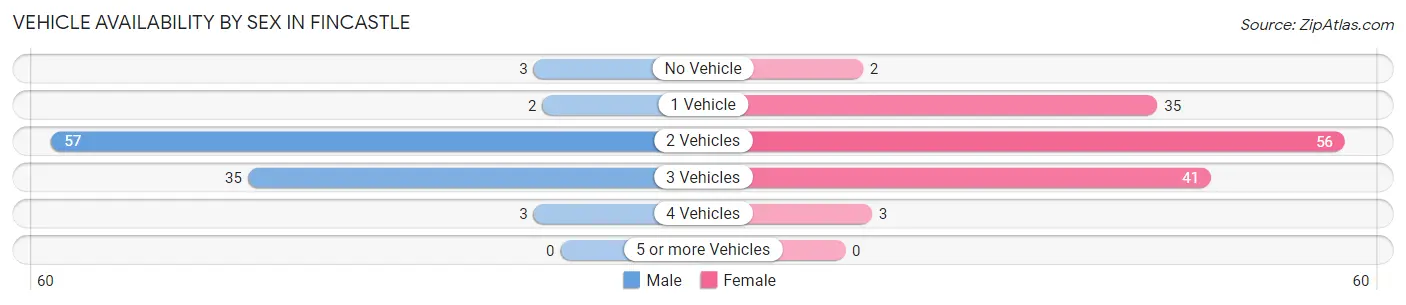
| Vehicles Available | Male | Female |
| No Vehicle | 3 (3.0%) | 2 (1.5%) |
| 1 Vehicle | 2 (2.0%) | 35 (25.6%) |
| 2 Vehicles | 57 (57.0%) | 56 (40.9%) |
| 3 Vehicles | 35 (35.0%) | 41 (29.9%) |
| 4 Vehicles | 3 (3.0%) | 3 (2.2%) |
| 5 or more Vehicles | 0 (0.0%) | 0 (0.0%) |
| Total | 100 (100.0%) | 137 (100.0%) |
Commute Time in Fincastle
The most frequently occuring commute durations in Fincastle are 30 to 34 minutes (55 commuters, 24.8%), less than 5 minutes (32 commuters, 14.4%), and 35 to 39 minutes (30 commuters, 13.5%).
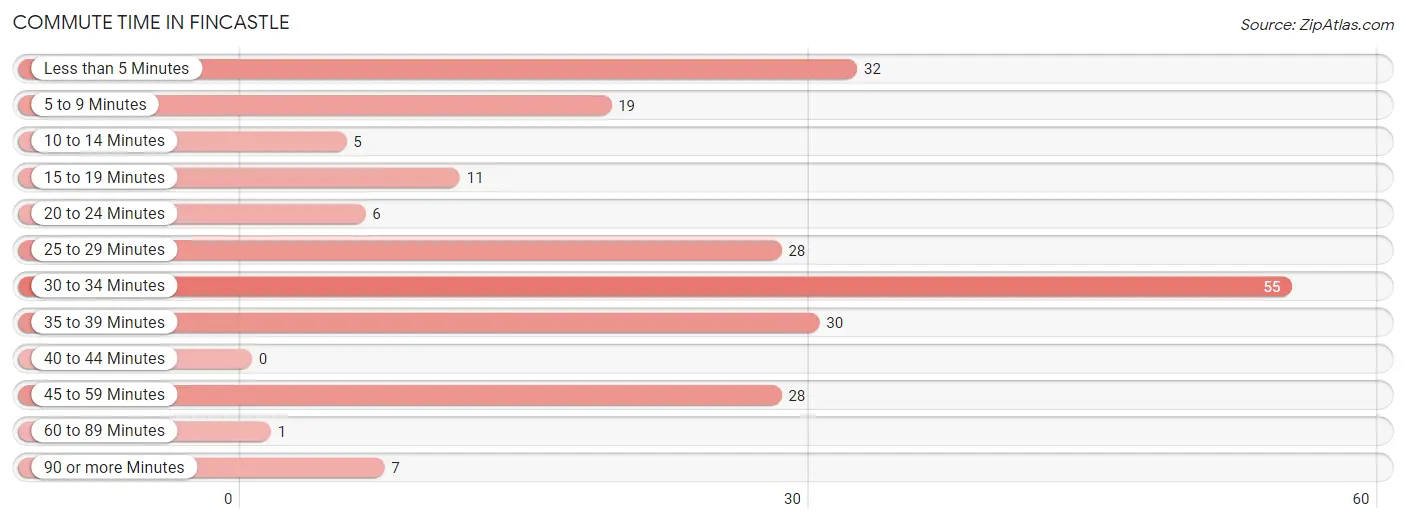
| Commute Time | # Commuters | % Commuters |
| Less than 5 Minutes | 32 | 14.4% |
| 5 to 9 Minutes | 19 | 8.6% |
| 10 to 14 Minutes | 5 | 2.2% |
| 15 to 19 Minutes | 11 | 5.0% |
| 20 to 24 Minutes | 6 | 2.7% |
| 25 to 29 Minutes | 28 | 12.6% |
| 30 to 34 Minutes | 55 | 24.8% |
| 35 to 39 Minutes | 30 | 13.5% |
| 40 to 44 Minutes | 0 | 0.0% |
| 45 to 59 Minutes | 28 | 12.6% |
| 60 to 89 Minutes | 1 | 0.4% |
| 90 or more Minutes | 7 | 3.2% |
Commute Time by Sex in Fincastle
The most common commute times in Fincastle are 35 to 39 minutes (19 commuters, 20.2%) for males and 30 to 34 minutes (50 commuters, 39.1%) for females.
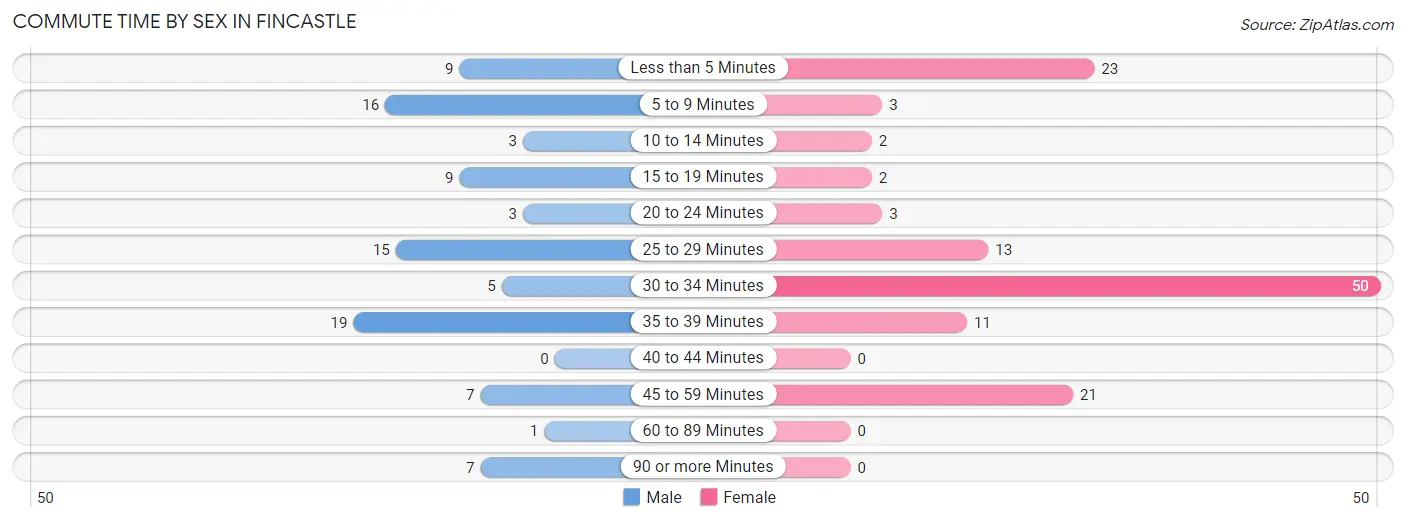
| Commute Time | Male | Female |
| Less than 5 Minutes | 9 (9.6%) | 23 (18.0%) |
| 5 to 9 Minutes | 16 (17.0%) | 3 (2.3%) |
| 10 to 14 Minutes | 3 (3.2%) | 2 (1.6%) |
| 15 to 19 Minutes | 9 (9.6%) | 2 (1.6%) |
| 20 to 24 Minutes | 3 (3.2%) | 3 (2.3%) |
| 25 to 29 Minutes | 15 (16.0%) | 13 (10.2%) |
| 30 to 34 Minutes | 5 (5.3%) | 50 (39.1%) |
| 35 to 39 Minutes | 19 (20.2%) | 11 (8.6%) |
| 40 to 44 Minutes | 0 (0.0%) | 0 (0.0%) |
| 45 to 59 Minutes | 7 (7.4%) | 21 (16.4%) |
| 60 to 89 Minutes | 1 (1.1%) | 0 (0.0%) |
| 90 or more Minutes | 7 (7.4%) | 0 (0.0%) |
Time of Departure to Work by Sex in Fincastle
The most frequent times of departure to work in Fincastle are 6:30 AM to 6:59 AM (28, 29.8%) for males and 7:00 AM to 7:29 AM (42, 32.8%) for females.
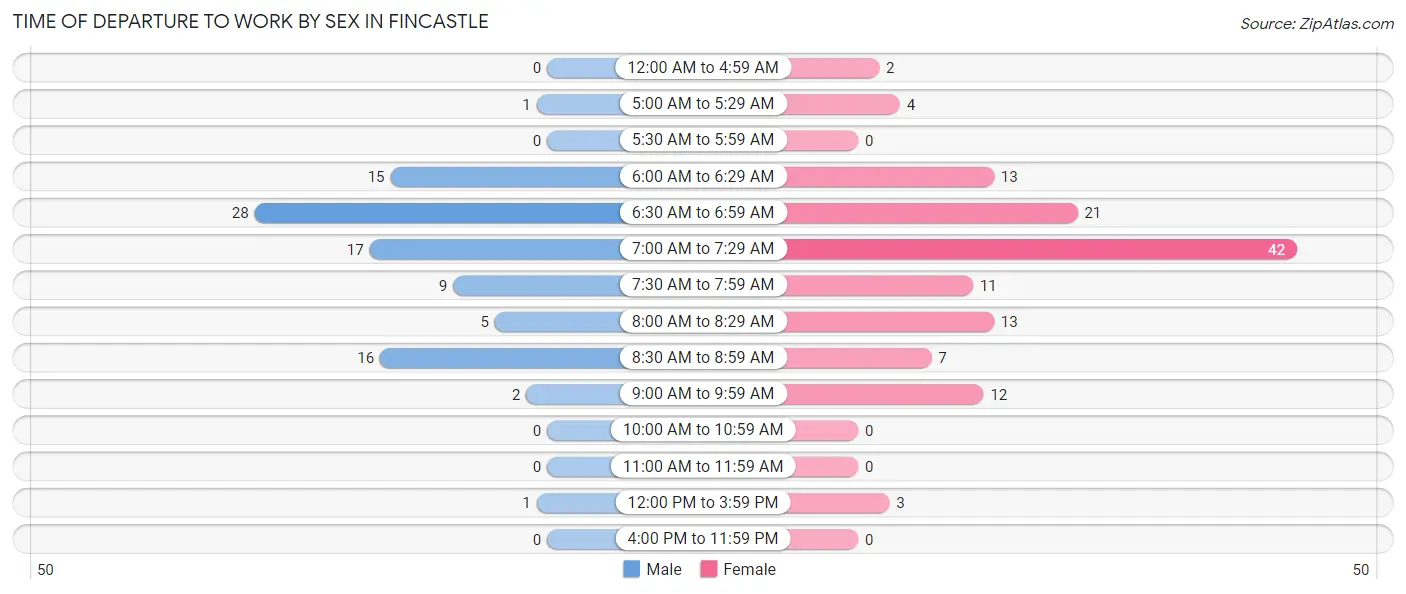
| Time of Departure | Male | Female |
| 12:00 AM to 4:59 AM | 0 (0.0%) | 2 (1.6%) |
| 5:00 AM to 5:29 AM | 1 (1.1%) | 4 (3.1%) |
| 5:30 AM to 5:59 AM | 0 (0.0%) | 0 (0.0%) |
| 6:00 AM to 6:29 AM | 15 (16.0%) | 13 (10.2%) |
| 6:30 AM to 6:59 AM | 28 (29.8%) | 21 (16.4%) |
| 7:00 AM to 7:29 AM | 17 (18.1%) | 42 (32.8%) |
| 7:30 AM to 7:59 AM | 9 (9.6%) | 11 (8.6%) |
| 8:00 AM to 8:29 AM | 5 (5.3%) | 13 (10.2%) |
| 8:30 AM to 8:59 AM | 16 (17.0%) | 7 (5.5%) |
| 9:00 AM to 9:59 AM | 2 (2.1%) | 12 (9.4%) |
| 10:00 AM to 10:59 AM | 0 (0.0%) | 0 (0.0%) |
| 11:00 AM to 11:59 AM | 0 (0.0%) | 0 (0.0%) |
| 12:00 PM to 3:59 PM | 1 (1.1%) | 3 (2.3%) |
| 4:00 PM to 11:59 PM | 0 (0.0%) | 0 (0.0%) |
| Total | 94 (100.0%) | 128 (100.0%) |
Housing Occupancy in Fincastle
Occupancy by Ownership in Fincastle
Of the total 203 dwellings in Fincastle, owner-occupied units account for 125 (61.6%), while renter-occupied units make up 78 (38.4%).
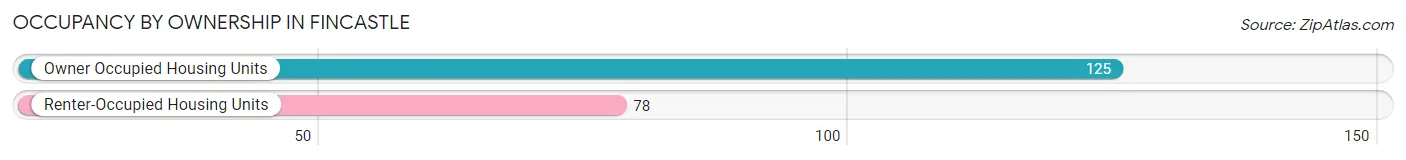
| Occupancy | # Housing Units | % Housing Units |
| Owner Occupied Housing Units | 125 | 61.6% |
| Renter-Occupied Housing Units | 78 | 38.4% |
| Total Occupied Housing Units | 203 | 100.0% |
Occupancy by Household Size in Fincastle
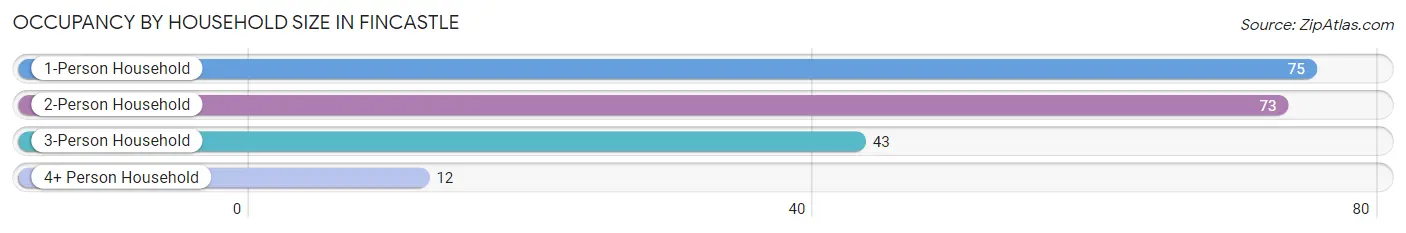
| Household Size | # Housing Units | % Housing Units |
| 1-Person Household | 75 | 36.9% |
| 2-Person Household | 73 | 36.0% |
| 3-Person Household | 43 | 21.2% |
| 4+ Person Household | 12 | 5.9% |
| Total Housing Units | 203 | 100.0% |
Occupancy by Ownership by Household Size in Fincastle
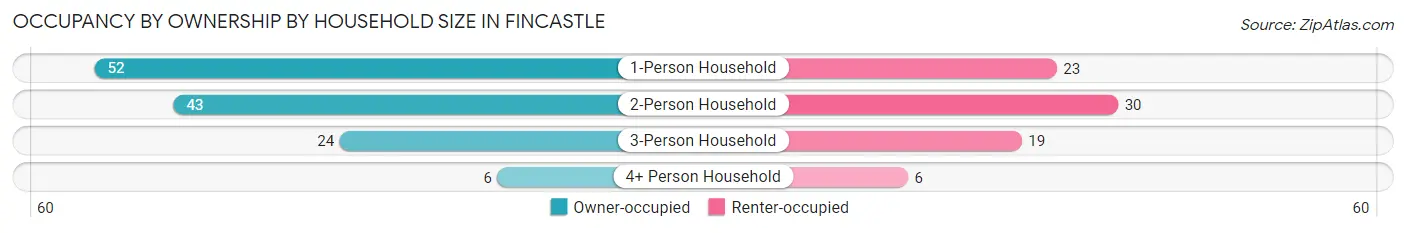
| Household Size | Owner-occupied | Renter-occupied |
| 1-Person Household | 52 (69.3%) | 23 (30.7%) |
| 2-Person Household | 43 (58.9%) | 30 (41.1%) |
| 3-Person Household | 24 (55.8%) | 19 (44.2%) |
| 4+ Person Household | 6 (50.0%) | 6 (50.0%) |
| Total Housing Units | 125 (61.6%) | 78 (38.4%) |
Occupancy by Educational Attainment in Fincastle
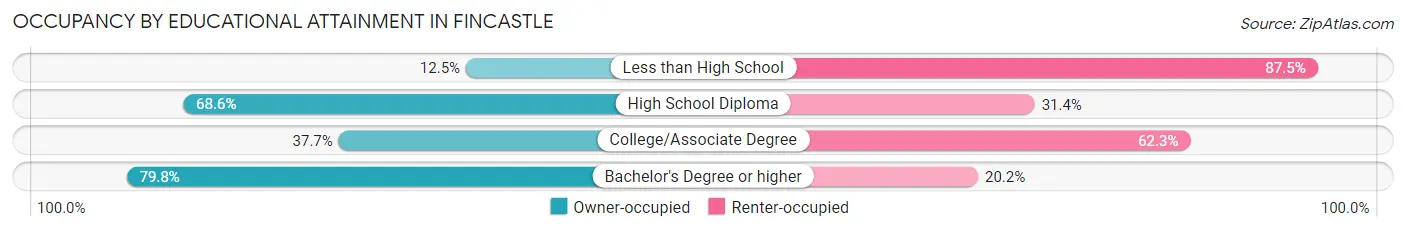
| Household Size | Owner-occupied | Renter-occupied |
| Less than High School | 2 (12.5%) | 14 (87.5%) |
| High School Diploma | 24 (68.6%) | 11 (31.4%) |
| College/Associate Degree | 20 (37.7%) | 33 (62.3%) |
| Bachelor's Degree or higher | 79 (79.8%) | 20 (20.2%) |
Occupancy by Age of Householder in Fincastle
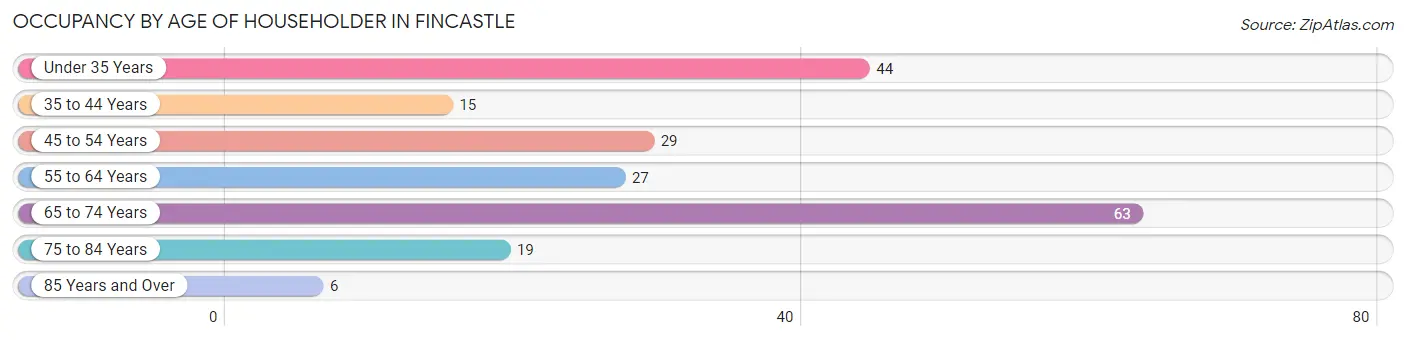
| Age Bracket | # Households | % Households |
| Under 35 Years | 44 | 21.7% |
| 35 to 44 Years | 15 | 7.4% |
| 45 to 54 Years | 29 | 14.3% |
| 55 to 64 Years | 27 | 13.3% |
| 65 to 74 Years | 63 | 31.0% |
| 75 to 84 Years | 19 | 9.4% |
| 85 Years and Over | 6 | 3.0% |
| Total | 203 | 100.0% |
Housing Finances in Fincastle
Median Income by Occupancy in Fincastle
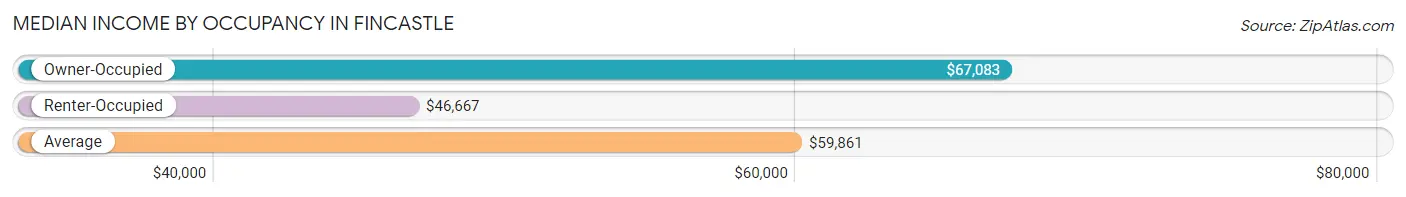
| Occupancy Type | # Households | Median Income |
| Owner-Occupied | 125 (61.6%) | $67,083 |
| Renter-Occupied | 78 (38.4%) | $46,667 |
| Average | 203 (100.0%) | $59,861 |
Occupancy by Householder Income Bracket in Fincastle
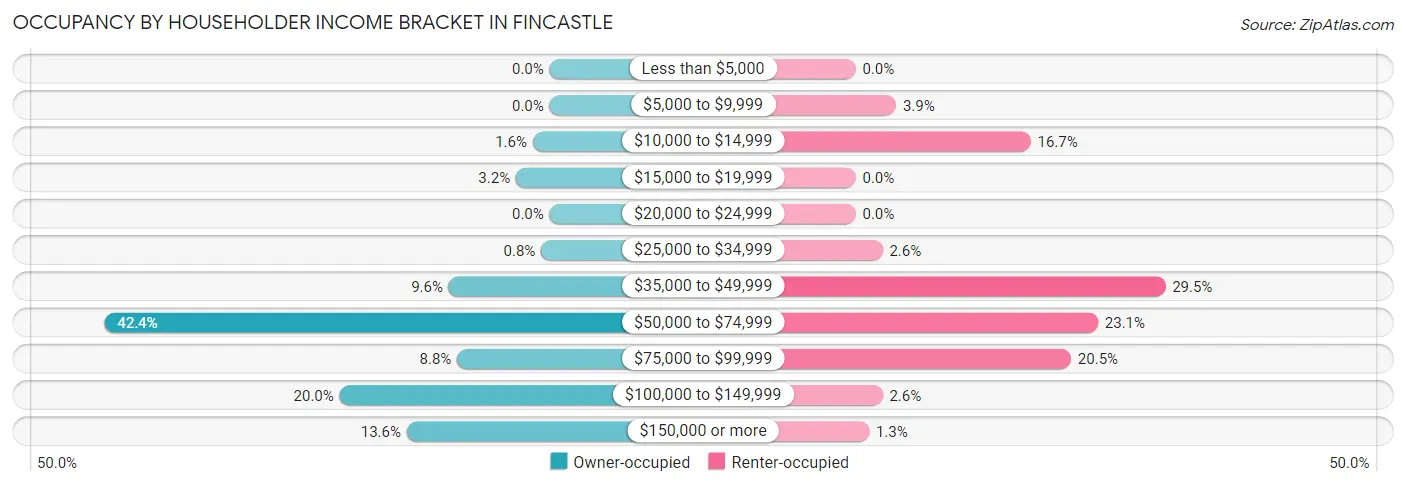
| Income Bracket | Owner-occupied | Renter-occupied |
| Less than $5,000 | 0 (0.0%) | 0 (0.0%) |
| $5,000 to $9,999 | 0 (0.0%) | 3 (3.8%) |
| $10,000 to $14,999 | 2 (1.6%) | 13 (16.7%) |
| $15,000 to $19,999 | 4 (3.2%) | 0 (0.0%) |
| $20,000 to $24,999 | 0 (0.0%) | 0 (0.0%) |
| $25,000 to $34,999 | 1 (0.8%) | 2 (2.6%) |
| $35,000 to $49,999 | 12 (9.6%) | 23 (29.5%) |
| $50,000 to $74,999 | 53 (42.4%) | 18 (23.1%) |
| $75,000 to $99,999 | 11 (8.8%) | 16 (20.5%) |
| $100,000 to $149,999 | 25 (20.0%) | 2 (2.6%) |
| $150,000 or more | 17 (13.6%) | 1 (1.3%) |
| Total | 125 (100.0%) | 78 (100.0%) |
Monthly Housing Cost Tiers in Fincastle
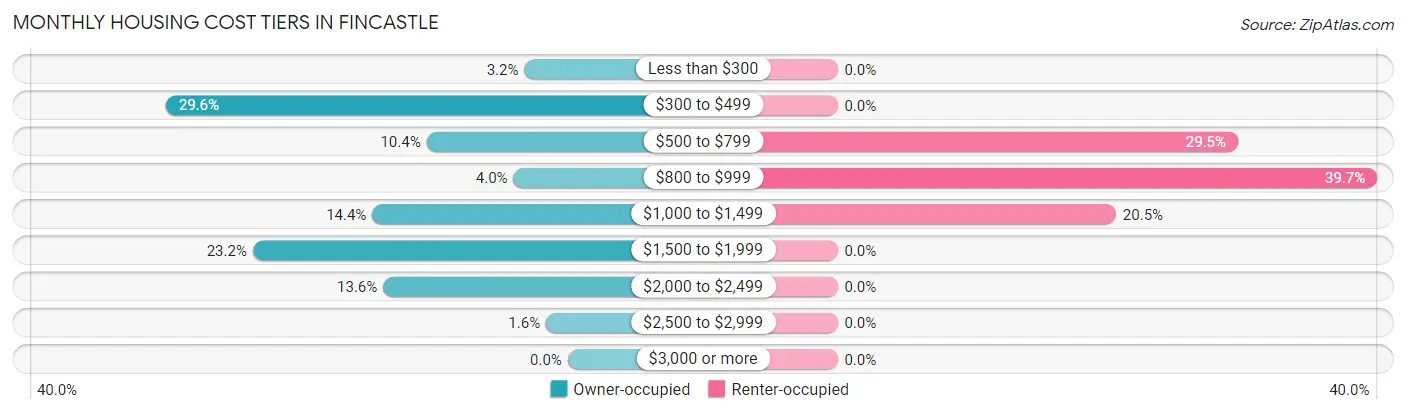
| Monthly Cost | Owner-occupied | Renter-occupied |
| Less than $300 | 4 (3.2%) | 0 (0.0%) |
| $300 to $499 | 37 (29.6%) | 0 (0.0%) |
| $500 to $799 | 13 (10.4%) | 23 (29.5%) |
| $800 to $999 | 5 (4.0%) | 31 (39.7%) |
| $1,000 to $1,499 | 18 (14.4%) | 16 (20.5%) |
| $1,500 to $1,999 | 29 (23.2%) | 0 (0.0%) |
| $2,000 to $2,499 | 17 (13.6%) | 0 (0.0%) |
| $2,500 to $2,999 | 2 (1.6%) | 0 (0.0%) |
| $3,000 or more | 0 (0.0%) | 0 (0.0%) |
| Total | 125 (100.0%) | 78 (100.0%) |
Physical Housing Characteristics in Fincastle
Housing Structures in Fincastle
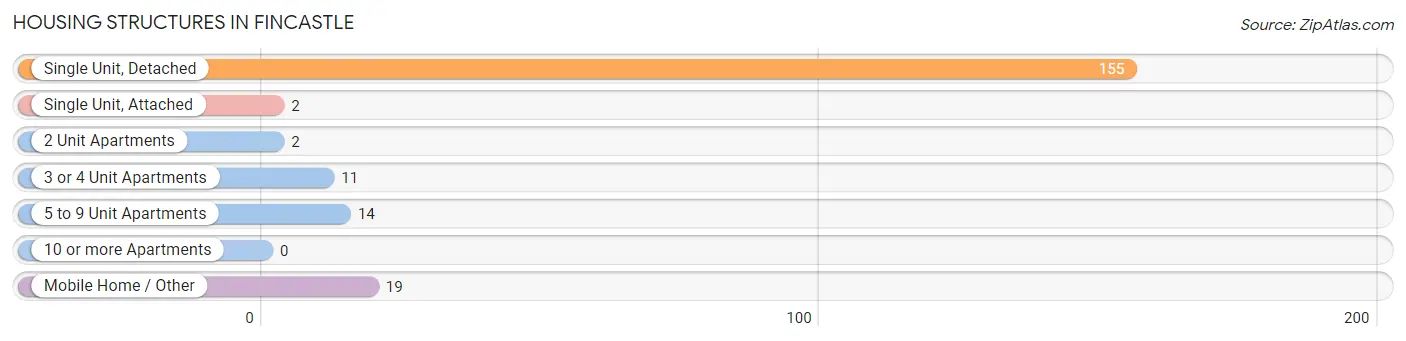
| Structure Type | # Housing Units | % Housing Units |
| Single Unit, Detached | 155 | 76.3% |
| Single Unit, Attached | 2 | 1.0% |
| 2 Unit Apartments | 2 | 1.0% |
| 3 or 4 Unit Apartments | 11 | 5.4% |
| 5 to 9 Unit Apartments | 14 | 6.9% |
| 10 or more Apartments | 0 | 0.0% |
| Mobile Home / Other | 19 | 9.4% |
| Total | 203 | 100.0% |
Housing Structures by Occupancy in Fincastle
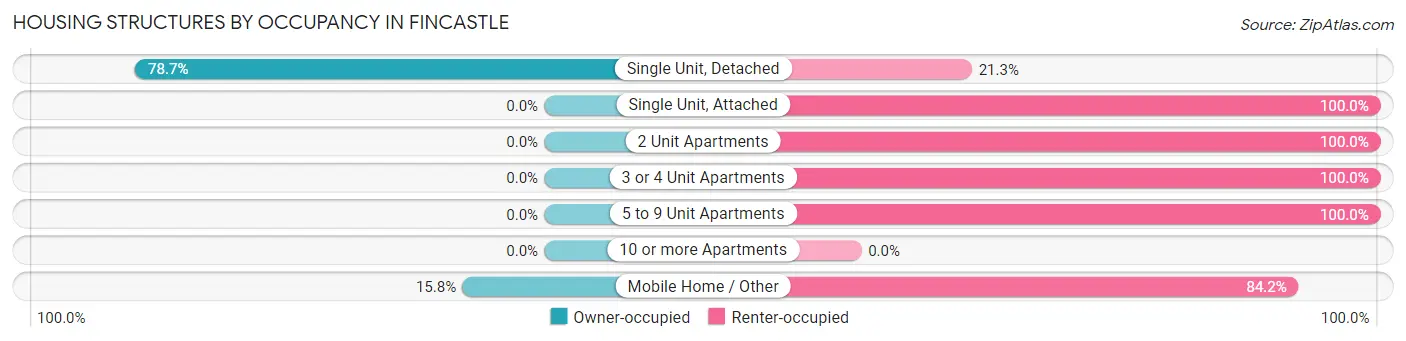
| Structure Type | Owner-occupied | Renter-occupied |
| Single Unit, Detached | 122 (78.7%) | 33 (21.3%) |
| Single Unit, Attached | 0 (0.0%) | 2 (100.0%) |
| 2 Unit Apartments | 0 (0.0%) | 2 (100.0%) |
| 3 or 4 Unit Apartments | 0 (0.0%) | 11 (100.0%) |
| 5 to 9 Unit Apartments | 0 (0.0%) | 14 (100.0%) |
| 10 or more Apartments | 0 (0.0%) | 0 (0.0%) |
| Mobile Home / Other | 3 (15.8%) | 16 (84.2%) |
| Total | 125 (61.6%) | 78 (38.4%) |
Housing Structures by Number of Rooms in Fincastle
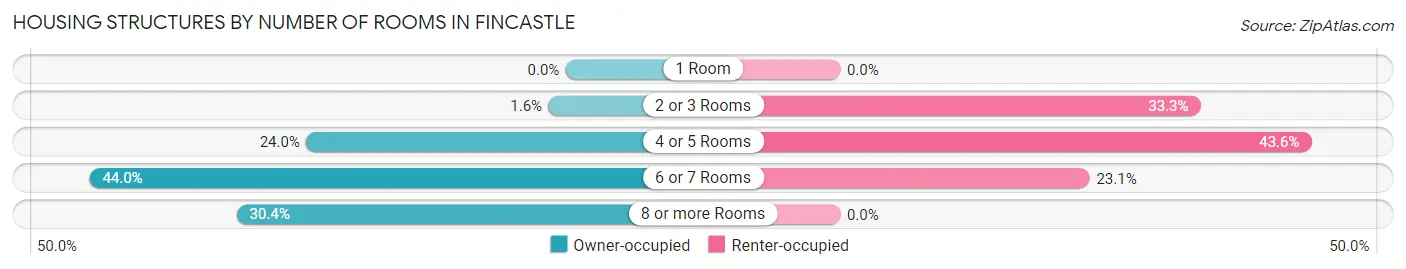
| Number of Rooms | Owner-occupied | Renter-occupied |
| 1 Room | 0 (0.0%) | 0 (0.0%) |
| 2 or 3 Rooms | 2 (1.6%) | 26 (33.3%) |
| 4 or 5 Rooms | 30 (24.0%) | 34 (43.6%) |
| 6 or 7 Rooms | 55 (44.0%) | 18 (23.1%) |
| 8 or more Rooms | 38 (30.4%) | 0 (0.0%) |
| Total | 125 (100.0%) | 78 (100.0%) |
Housing Structure by Heating Type in Fincastle
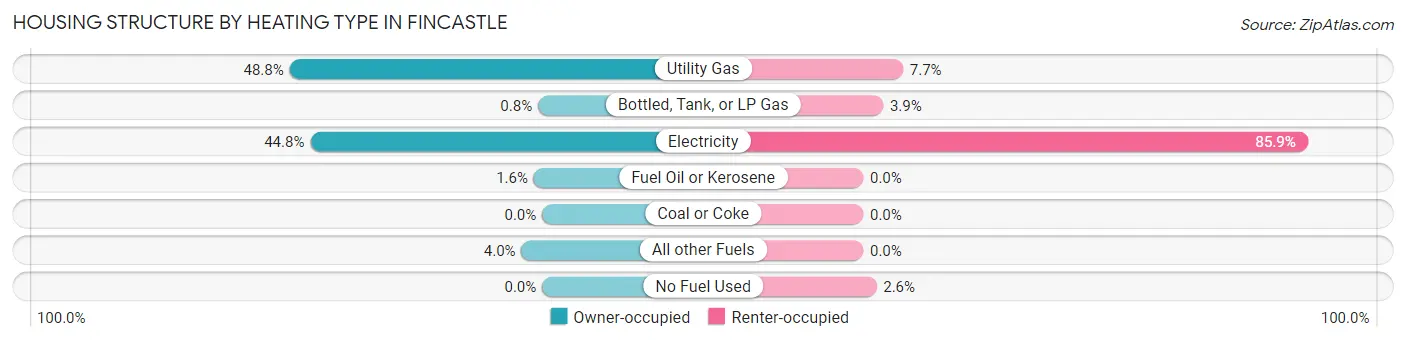
| Heating Type | Owner-occupied | Renter-occupied |
| Utility Gas | 61 (48.8%) | 6 (7.7%) |
| Bottled, Tank, or LP Gas | 1 (0.8%) | 3 (3.8%) |
| Electricity | 56 (44.8%) | 67 (85.9%) |
| Fuel Oil or Kerosene | 2 (1.6%) | 0 (0.0%) |
| Coal or Coke | 0 (0.0%) | 0 (0.0%) |
| All other Fuels | 5 (4.0%) | 0 (0.0%) |
| No Fuel Used | 0 (0.0%) | 2 (2.6%) |
| Total | 125 (100.0%) | 78 (100.0%) |
Household Vehicle Usage in Fincastle
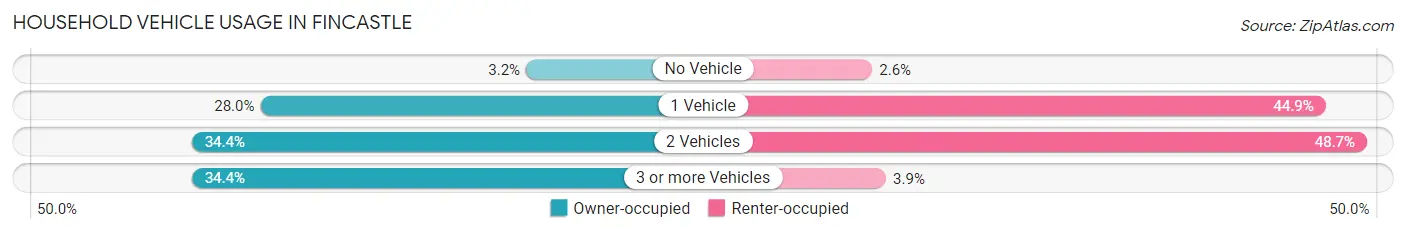
| Vehicles per Household | Owner-occupied | Renter-occupied |
| No Vehicle | 4 (3.2%) | 2 (2.6%) |
| 1 Vehicle | 35 (28.0%) | 35 (44.9%) |
| 2 Vehicles | 43 (34.4%) | 38 (48.7%) |
| 3 or more Vehicles | 43 (34.4%) | 3 (3.8%) |
| Total | 125 (100.0%) | 78 (100.0%) |
Real Estate & Mortgages in Fincastle
Real Estate and Mortgage Overview in Fincastle
| Characteristic | Without Mortgage | With Mortgage |
| Housing Units | 49 | 76 |
| Median Property Value | $211,400 | $323,100 |
| Median Household Income | $59,236 | $10 |
| Monthly Housing Costs | $428 | $0 |
| Real Estate Taxes | $1,550 | $2 |
Property Value by Mortgage Status in Fincastle
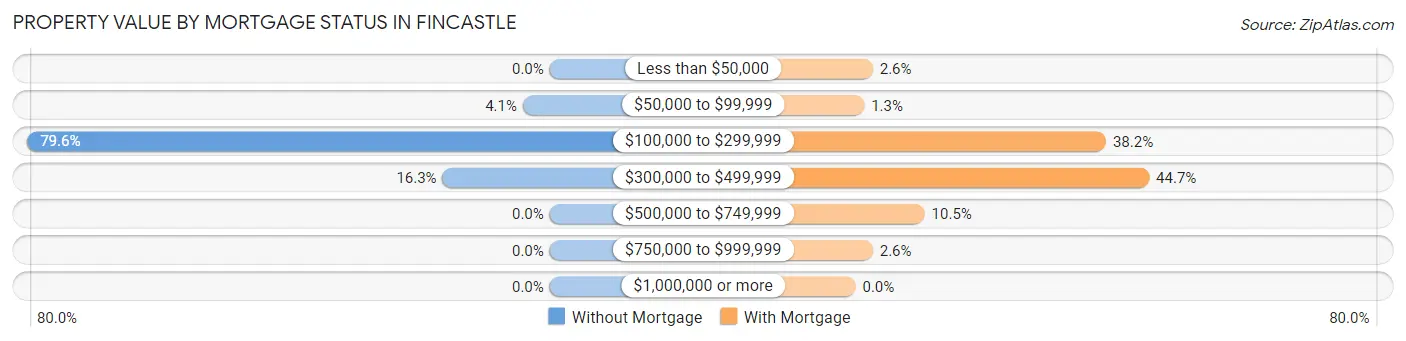
| Property Value | Without Mortgage | With Mortgage |
| Less than $50,000 | 0 (0.0%) | 2 (2.6%) |
| $50,000 to $99,999 | 2 (4.1%) | 1 (1.3%) |
| $100,000 to $299,999 | 39 (79.6%) | 29 (38.2%) |
| $300,000 to $499,999 | 8 (16.3%) | 34 (44.7%) |
| $500,000 to $749,999 | 0 (0.0%) | 8 (10.5%) |
| $750,000 to $999,999 | 0 (0.0%) | 2 (2.6%) |
| $1,000,000 or more | 0 (0.0%) | 0 (0.0%) |
| Total | 49 (100.0%) | 76 (100.0%) |
Household Income by Mortgage Status in Fincastle
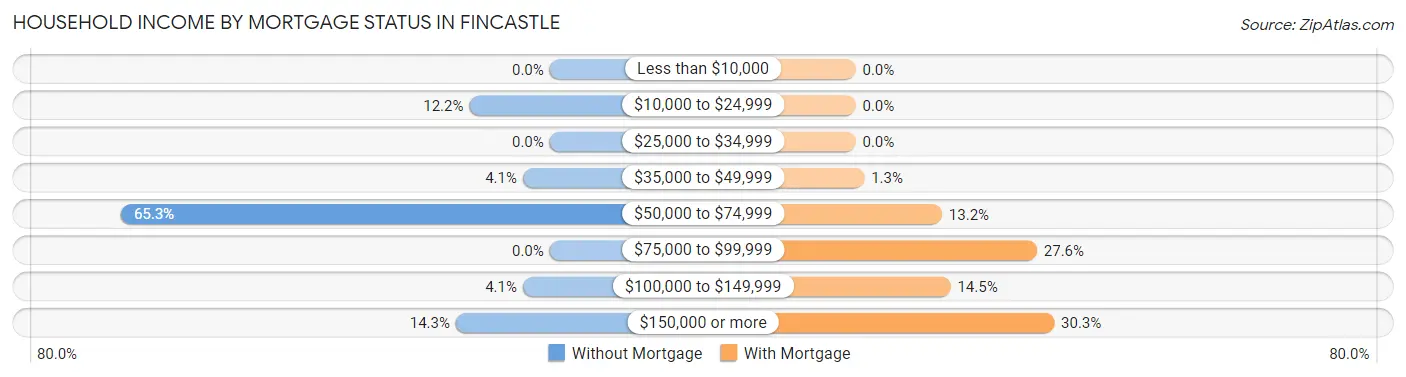
| Household Income | Without Mortgage | With Mortgage |
| Less than $10,000 | 0 (0.0%) | 0 (0.0%) |
| $10,000 to $24,999 | 6 (12.2%) | 0 (0.0%) |
| $25,000 to $34,999 | 0 (0.0%) | 0 (0.0%) |
| $35,000 to $49,999 | 2 (4.1%) | 1 (1.3%) |
| $50,000 to $74,999 | 32 (65.3%) | 10 (13.2%) |
| $75,000 to $99,999 | 0 (0.0%) | 21 (27.6%) |
| $100,000 to $149,999 | 2 (4.1%) | 11 (14.5%) |
| $150,000 or more | 7 (14.3%) | 23 (30.3%) |
| Total | 49 (100.0%) | 76 (100.0%) |
Property Value to Household Income Ratio in Fincastle
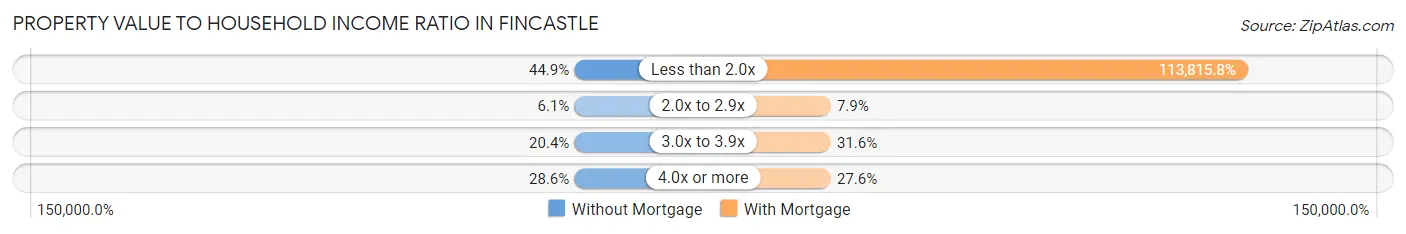
| Value-to-Income Ratio | Without Mortgage | With Mortgage |
| Less than 2.0x | 22 (44.9%) | 86,500 (113,815.8%) |
| 2.0x to 2.9x | 3 (6.1%) | 6 (7.9%) |
| 3.0x to 3.9x | 10 (20.4%) | 24 (31.6%) |
| 4.0x or more | 14 (28.6%) | 21 (27.6%) |
| Total | 49 (100.0%) | 76 (100.0%) |
Real Estate Taxes by Mortgage Status in Fincastle
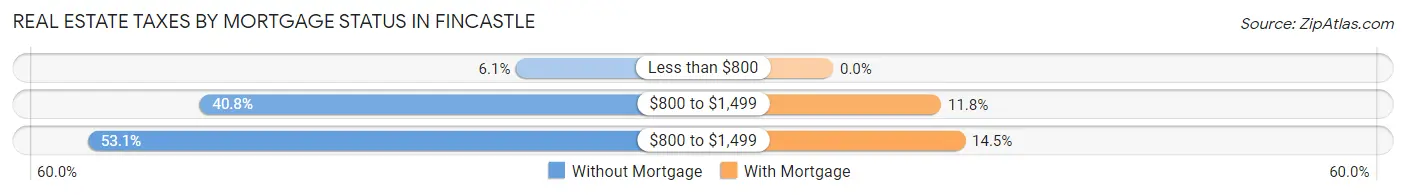
| Property Taxes | Without Mortgage | With Mortgage |
| Less than $800 | 3 (6.1%) | 0 (0.0%) |
| $800 to $1,499 | 20 (40.8%) | 9 (11.8%) |
| $800 to $1,499 | 26 (53.1%) | 11 (14.5%) |
| Total | 49 (100.0%) | 76 (100.0%) |
Health & Disability in Fincastle
Health Insurance Coverage by Age in Fincastle
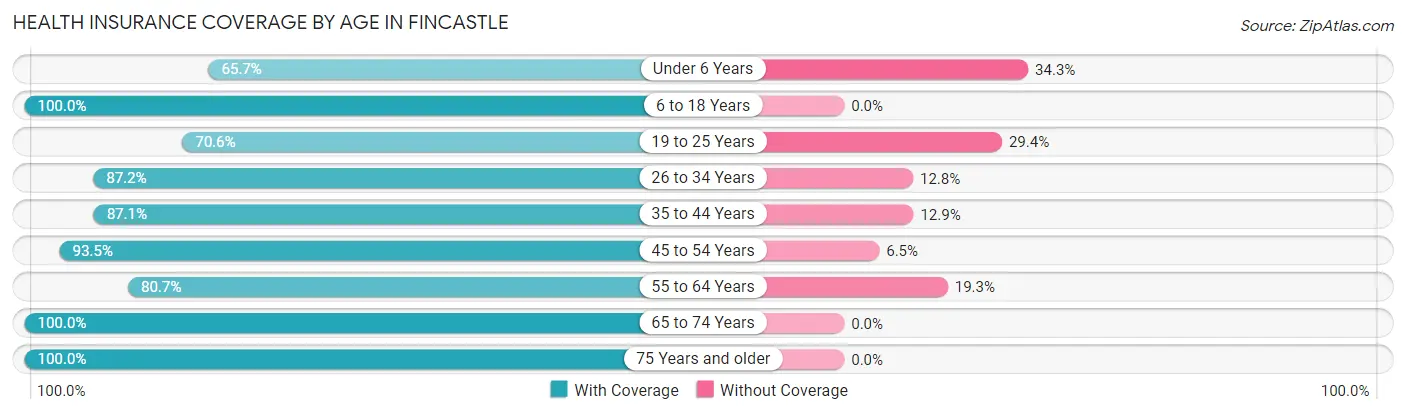
| Age Bracket | With Coverage | Without Coverage |
| Under 6 Years | 23 (65.7%) | 12 (34.3%) |
| 6 to 18 Years | 131 (100.0%) | 0 (0.0%) |
| 19 to 25 Years | 12 (70.6%) | 5 (29.4%) |
| 26 to 34 Years | 68 (87.2%) | 10 (12.8%) |
| 35 to 44 Years | 27 (87.1%) | 4 (12.9%) |
| 45 to 54 Years | 43 (93.5%) | 3 (6.5%) |
| 55 to 64 Years | 46 (80.7%) | 11 (19.3%) |
| 65 to 74 Years | 86 (100.0%) | 0 (0.0%) |
| 75 Years and older | 28 (100.0%) | 0 (0.0%) |
| Total | 464 (91.2%) | 45 (8.8%) |
Health Insurance Coverage by Citizenship Status in Fincastle
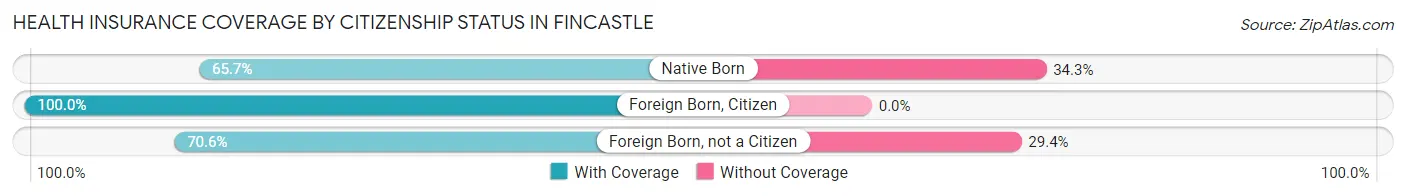
| Citizenship Status | With Coverage | Without Coverage |
| Native Born | 23 (65.7%) | 12 (34.3%) |
| Foreign Born, Citizen | 131 (100.0%) | 0 (0.0%) |
| Foreign Born, not a Citizen | 12 (70.6%) | 5 (29.4%) |
Health Insurance Coverage by Household Income in Fincastle
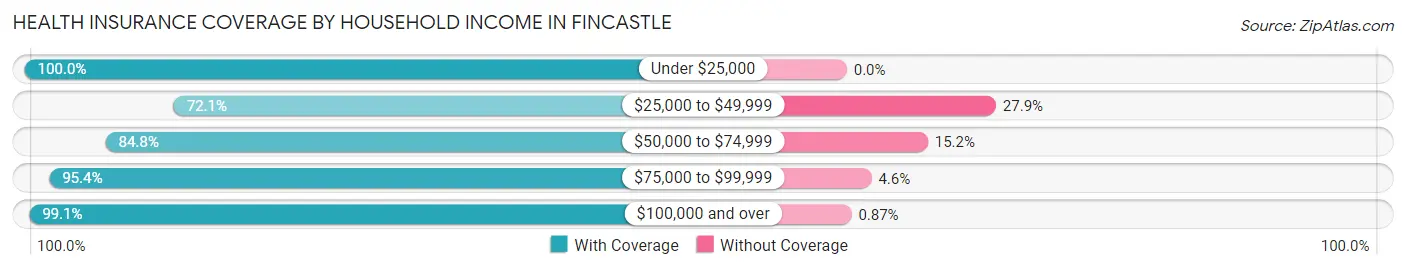
| Household Income | With Coverage | Without Coverage |
| Under $25,000 | 116 (100.0%) | 0 (0.0%) |
| $25,000 to $49,999 | 49 (72.1%) | 19 (27.9%) |
| $50,000 to $74,999 | 123 (84.8%) | 22 (15.2%) |
| $75,000 to $99,999 | 62 (95.4%) | 3 (4.6%) |
| $100,000 and over | 114 (99.1%) | 1 (0.9%) |
Public vs Private Health Insurance Coverage by Age in Fincastle
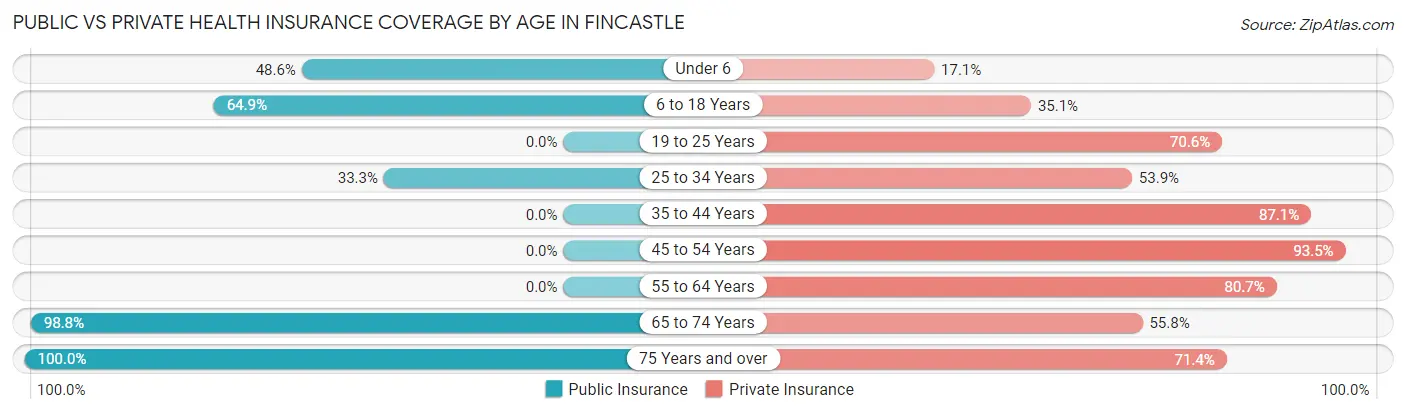
| Age Bracket | Public Insurance | Private Insurance |
| Under 6 | 17 (48.6%) | 6 (17.1%) |
| 6 to 18 Years | 85 (64.9%) | 46 (35.1%) |
| 19 to 25 Years | 0 (0.0%) | 12 (70.6%) |
| 25 to 34 Years | 26 (33.3%) | 42 (53.8%) |
| 35 to 44 Years | 0 (0.0%) | 27 (87.1%) |
| 45 to 54 Years | 0 (0.0%) | 43 (93.5%) |
| 55 to 64 Years | 0 (0.0%) | 46 (80.7%) |
| 65 to 74 Years | 85 (98.8%) | 48 (55.8%) |
| 75 Years and over | 28 (100.0%) | 20 (71.4%) |
| Total | 241 (47.3%) | 290 (57.0%) |
Disability Status by Sex by Age in Fincastle
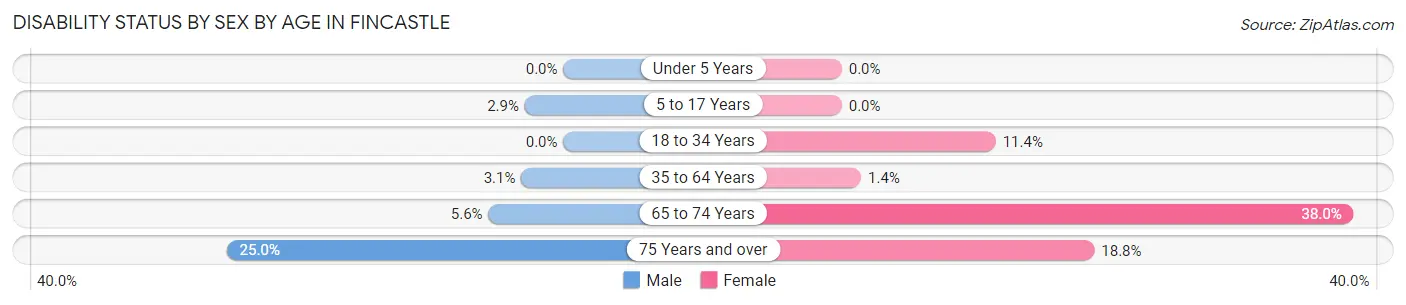
| Age Bracket | Male | Female |
| Under 5 Years | 0 (0.0%) | 0 (0.0%) |
| 5 to 17 Years | 3 (2.9%) | 0 (0.0%) |
| 18 to 34 Years | 0 (0.0%) | 8 (11.4%) |
| 35 to 64 Years | 2 (3.1%) | 1 (1.4%) |
| 65 to 74 Years | 2 (5.6%) | 19 (38.0%) |
| 75 Years and over | 3 (25.0%) | 3 (18.8%) |
Disability Class by Sex by Age in Fincastle
Disability Class: Hearing Difficulty
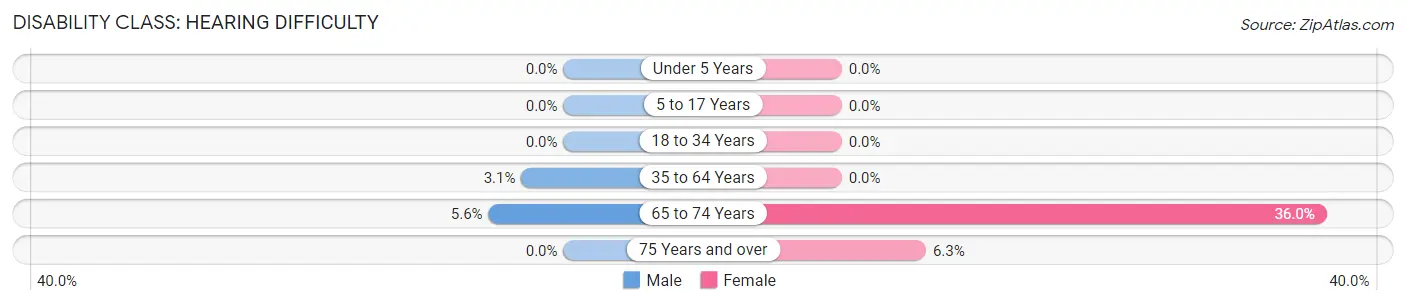
| Age Bracket | Male | Female |
| Under 5 Years | 0 (0.0%) | 0 (0.0%) |
| 5 to 17 Years | 0 (0.0%) | 0 (0.0%) |
| 18 to 34 Years | 0 (0.0%) | 0 (0.0%) |
| 35 to 64 Years | 2 (3.1%) | 0 (0.0%) |
| 65 to 74 Years | 2 (5.6%) | 18 (36.0%) |
| 75 Years and over | 0 (0.0%) | 1 (6.2%) |
Disability Class: Vision Difficulty
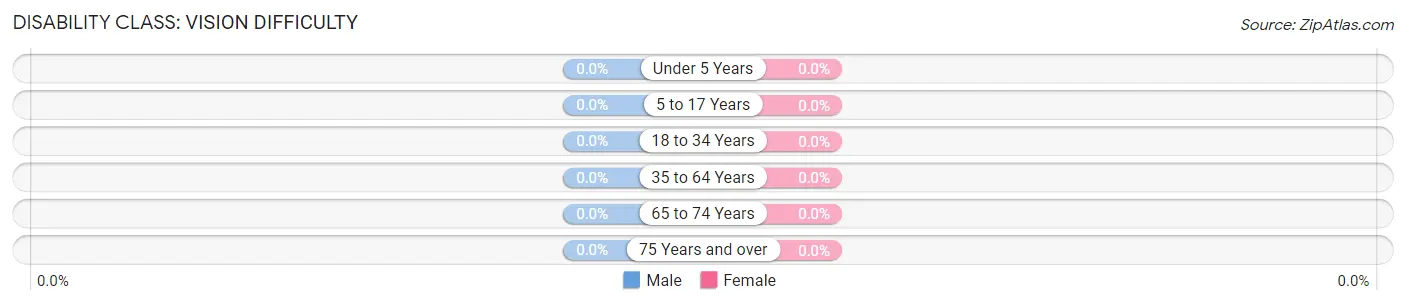
| Age Bracket | Male | Female |
| Under 5 Years | 0 (0.0%) | 0 (0.0%) |
| 5 to 17 Years | 0 (0.0%) | 0 (0.0%) |
| 18 to 34 Years | 0 (0.0%) | 0 (0.0%) |
| 35 to 64 Years | 0 (0.0%) | 0 (0.0%) |
| 65 to 74 Years | 0 (0.0%) | 0 (0.0%) |
| 75 Years and over | 0 (0.0%) | 0 (0.0%) |
Disability Class: Cognitive Difficulty
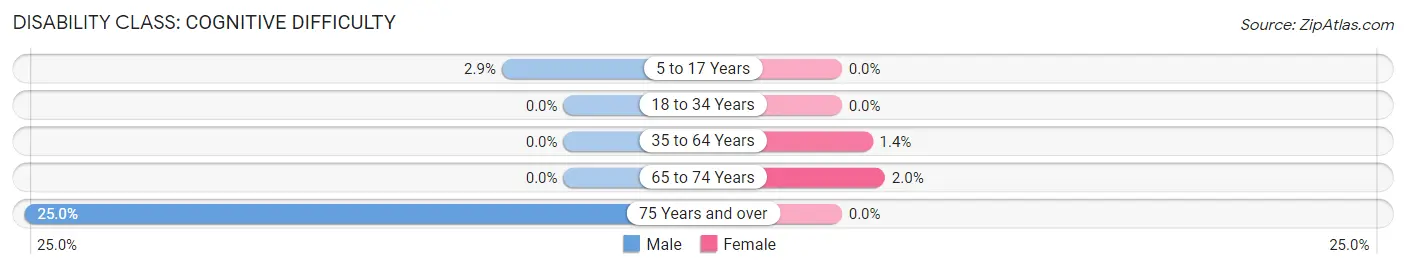
| Age Bracket | Male | Female |
| 5 to 17 Years | 3 (2.9%) | 0 (0.0%) |
| 18 to 34 Years | 0 (0.0%) | 0 (0.0%) |
| 35 to 64 Years | 0 (0.0%) | 1 (1.4%) |
| 65 to 74 Years | 0 (0.0%) | 1 (2.0%) |
| 75 Years and over | 3 (25.0%) | 0 (0.0%) |
Disability Class: Ambulatory Difficulty
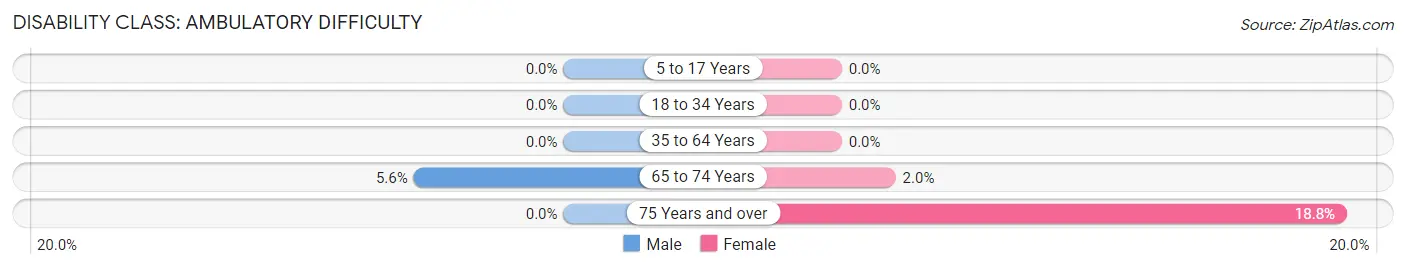
| Age Bracket | Male | Female |
| 5 to 17 Years | 0 (0.0%) | 0 (0.0%) |
| 18 to 34 Years | 0 (0.0%) | 0 (0.0%) |
| 35 to 64 Years | 0 (0.0%) | 0 (0.0%) |
| 65 to 74 Years | 2 (5.6%) | 1 (2.0%) |
| 75 Years and over | 0 (0.0%) | 3 (18.8%) |
Disability Class: Self-Care Difficulty
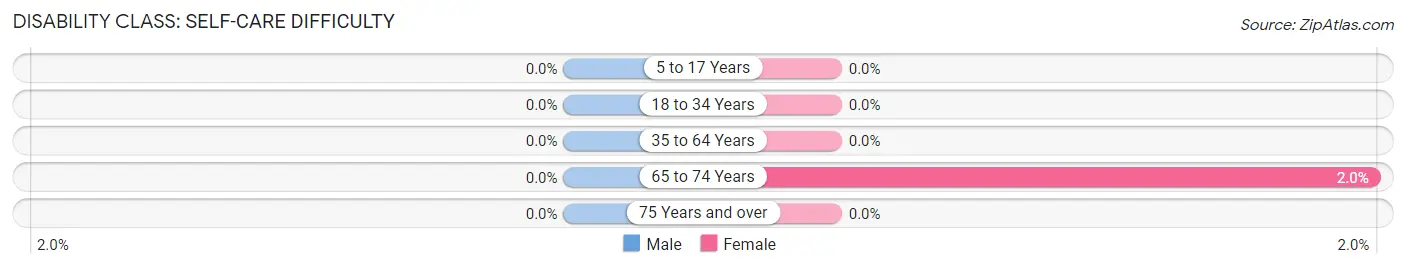
| Age Bracket | Male | Female |
| 5 to 17 Years | 0 (0.0%) | 0 (0.0%) |
| 18 to 34 Years | 0 (0.0%) | 0 (0.0%) |
| 35 to 64 Years | 0 (0.0%) | 0 (0.0%) |
| 65 to 74 Years | 0 (0.0%) | 1 (2.0%) |
| 75 Years and over | 0 (0.0%) | 0 (0.0%) |
Technology Access in Fincastle
Computing Device Access in Fincastle
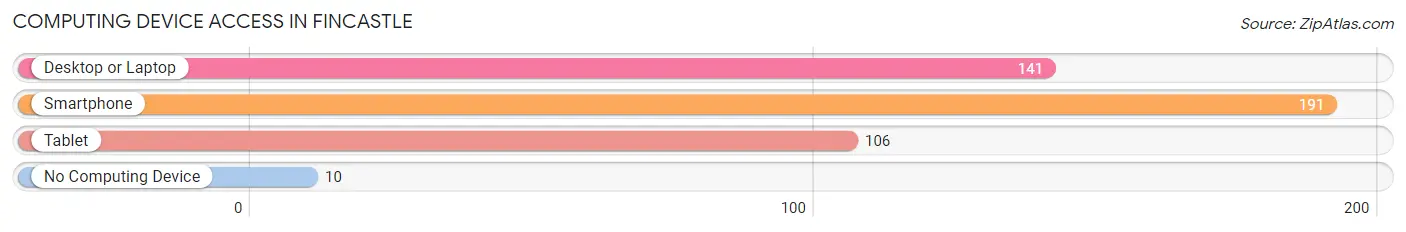
| Device Type | # Households | % Households |
| Desktop or Laptop | 141 | 69.5% |
| Smartphone | 191 | 94.1% |
| Tablet | 106 | 52.2% |
| No Computing Device | 10 | 4.9% |
| Total | 203 | 100.0% |
Internet Access in Fincastle
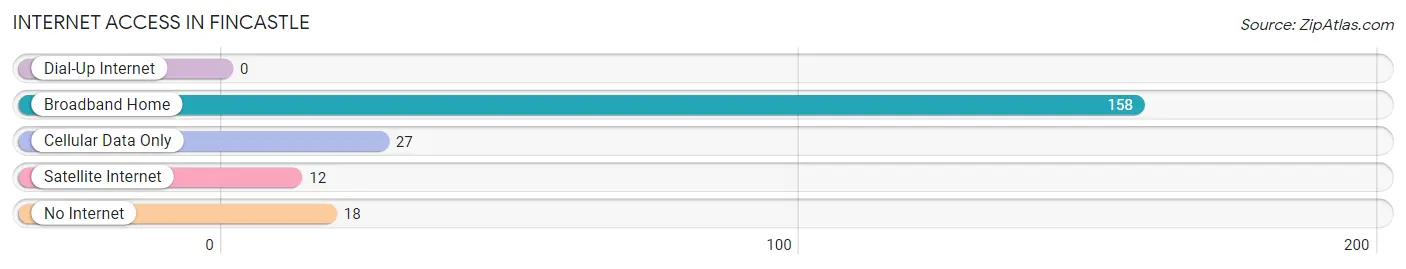
| Internet Type | # Households | % Households |
| Dial-Up Internet | 0 | 0.0% |
| Broadband Home | 158 | 77.8% |
| Cellular Data Only | 27 | 13.3% |
| Satellite Internet | 12 | 5.9% |
| No Internet | 18 | 8.9% |
| Total | 203 | 100.0% |
Fincastle Summary
Fincastle, Virginia is a small town located in Botetourt County, Virginia. It is situated in the foothills of the Blue Ridge Mountains and is part of the Roanoke Metropolitan Statistical Area. The town has a population of 1,845 as of the 2010 census.
History
Fincastle was founded in 1772 by Colonel William Preston, who named it after his ancestral home in Scotland. The town was originally part of Augusta County, Virginia, but was later annexed to Botetourt County in 1770. Fincastle was the first county seat of Botetourt County and served as such until 1839 when the county seat was moved to Fincastle.
During the American Revolution, Fincastle was the site of a major battle between the British and American forces. The Battle of Fincastle was fought on January 7, 1781 and resulted in a victory for the American forces.
In the 19th century, Fincastle was a major stop on the Great Wagon Road, which connected the Shenandoah Valley to the Piedmont region of Virginia. The town was also a major stop on the Virginia and Tennessee Railroad, which connected the Shenandoah Valley to the Tennessee River.
Geography
Fincastle is located in the foothills of the Blue Ridge Mountains in southwestern Virginia. The town is situated at the intersection of US Route 11 and State Route 43. The town is located approximately 25 miles south of Roanoke and approximately 50 miles west of Lynchburg.
The town is situated at an elevation of 1,845 feet above sea level. The town is located in a valley surrounded by the Blue Ridge Mountains to the east and the Allegheny Mountains to the west. The town is located in a humid subtropical climate zone and experiences hot, humid summers and mild winters.
Economy
The economy of Fincastle is largely based on agriculture and tourism. The town is home to several farms, including the Fincastle Farm, which produces beef, pork, and poultry. The town is also home to several wineries, including the Fincastle Winery, which produces a variety of wines.
The town is also home to several small businesses, including restaurants, antique stores, and gift shops. The town is also home to several bed and breakfasts, which attract tourists from all over the world.
Demographics
As of the 2010 census, the population of Fincastle was 1,845. The racial makeup of the town was 95.3% White, 1.2% African American, 0.3% Native American, 0.3% Asian, 0.1% Pacific Islander, 0.7% from other races, and 2.1% from two or more races. Hispanic or Latino of any race were 1.7% of the population.
The median household income in Fincastle was $41,250, and the median family income was $50,000. The per capita income for the town was $20,945. About 11.2% of families and 14.2% of the population were below the poverty line, including 18.2% of those under age 18 and 8.3% of those age 65 or over.
Common Questions
What is Per Capita Income in Fincastle?
Per Capita income in Fincastle is $27,621.
What is the Median Family Income in Fincastle?
Median Family Income in Fincastle is $76,719.
What is the Median Household income in Fincastle?
Median Household Income in Fincastle is $59,861.
What is Income or Wage Gap in Fincastle?
Income or Wage Gap in Fincastle is 44.4%.
Women in Fincastle earn 55.6 cents for every dollar earned by a man.
What is Inequality or Gini Index in Fincastle?
Inequality or Gini Index in Fincastle is 0.34.
What is the Total Population of Fincastle?
Total Population of Fincastle is 621.
What is the Total Male Population of Fincastle?
Total Male Population of Fincastle is 355.
What is the Total Female Population of Fincastle?
Total Female Population of Fincastle is 266.
What is the Ratio of Males per 100 Females in Fincastle?
There are 133.46 Males per 100 Females in Fincastle.
What is the Ratio of Females per 100 Males in Fincastle?
There are 74.93 Females per 100 Males in Fincastle.
What is the Median Population Age in Fincastle?
Median Population Age in Fincastle is 33.0 Years.
What is the Average Family Size in Fincastle
Average Family Size in Fincastle is 3.5 People.
What is the Average Household Size in Fincastle
Average Household Size in Fincastle is 2.5 People.
How Large is the Labor Force in Fincastle?
There are 240 People in the Labor Forcein in Fincastle.
What is the Percentage of People in the Labor Force in Fincastle?
50.5% of People are in the Labor Force in Fincastle.
What is the Unemployment Rate in Fincastle?
Unemployment Rate in Fincastle is 1.3%.