St Paul, VA Map & Demographics
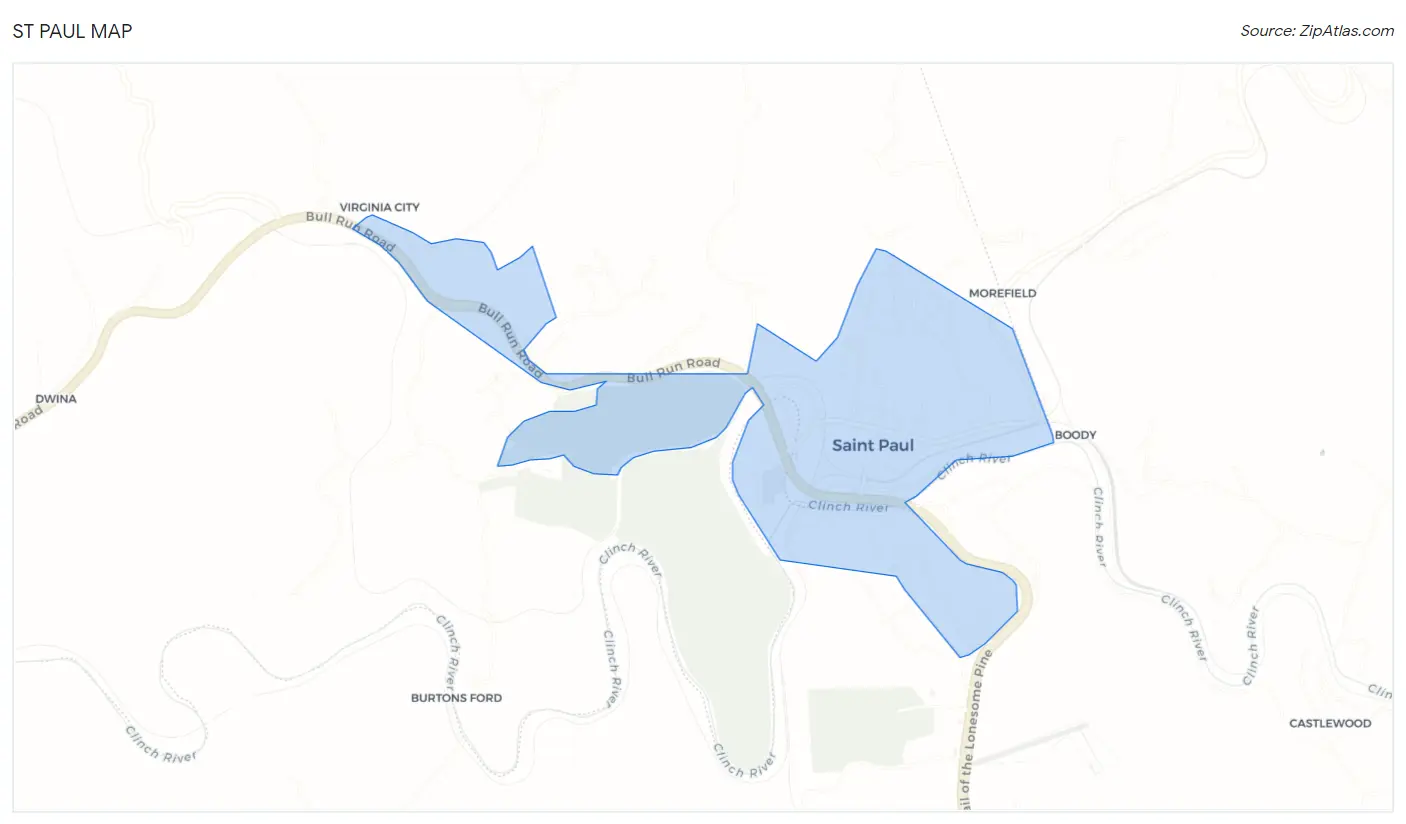
St Paul Map
St Paul Overview
$22,718
PER CAPITA INCOME
$51,339
AVG FAMILY INCOME
$24,886
AVG HOUSEHOLD INCOME
26.8%
WAGE / INCOME GAP [ % ]
73.2¢/ $1
WAGE / INCOME GAP [ $ ]
0.55
INEQUALITY / GINI INDEX
1,129
TOTAL POPULATION
572
MALE POPULATION
557
FEMALE POPULATION
102.69
MALES / 100 FEMALES
97.38
FEMALES / 100 MALES
44.2
MEDIAN AGE
2.9
AVG FAMILY SIZE
2.4
AVG HOUSEHOLD SIZE
396
LABOR FORCE [ PEOPLE ]
41.3%
PERCENT IN LABOR FORCE
20.5%
UNEMPLOYMENT RATE
Income in St Paul
Income Overview in St Paul
Per Capita Income in St Paul is $22,718, while median incomes of families and households are $51,339 and $24,886 respectively.
| Characteristic | Number | Measure |
| Per Capita Income | 1,129 | $22,718 |
| Median Family Income | 333 | $51,339 |
| Mean Family Income | 333 | $65,188 |
| Median Household Income | 481 | $24,886 |
| Mean Household Income | 481 | $51,400 |
| Income Deficit | 333 | $0 |
| Wage / Income Gap (%) | 1,129 | 26.82% |
| Wage / Income Gap ($) | 1,129 | 73.18¢ per $1 |
| Gini / Inequality Index | 1,129 | 0.55 |
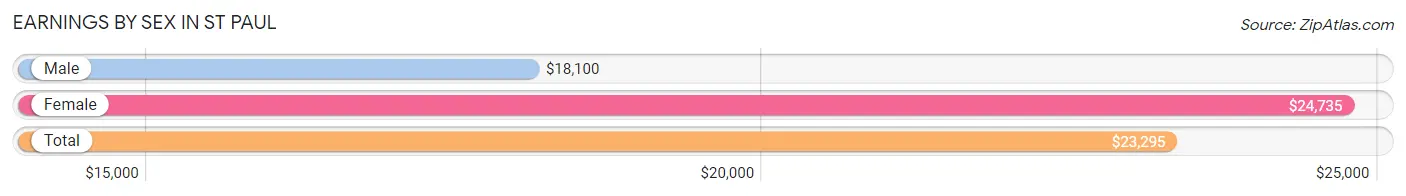
Earnings by Sex in St Paul
Average Earnings in St Paul are $23,295, $18,100 for men and $24,735 for women, a difference of 26.8%.
| Sex | Number | Average Earnings |
| Male | 208 (49.2%) | $18,100 |
| Female | 215 (50.8%) | $24,735 |
| Total | 423 (100.0%) | $23,295 |
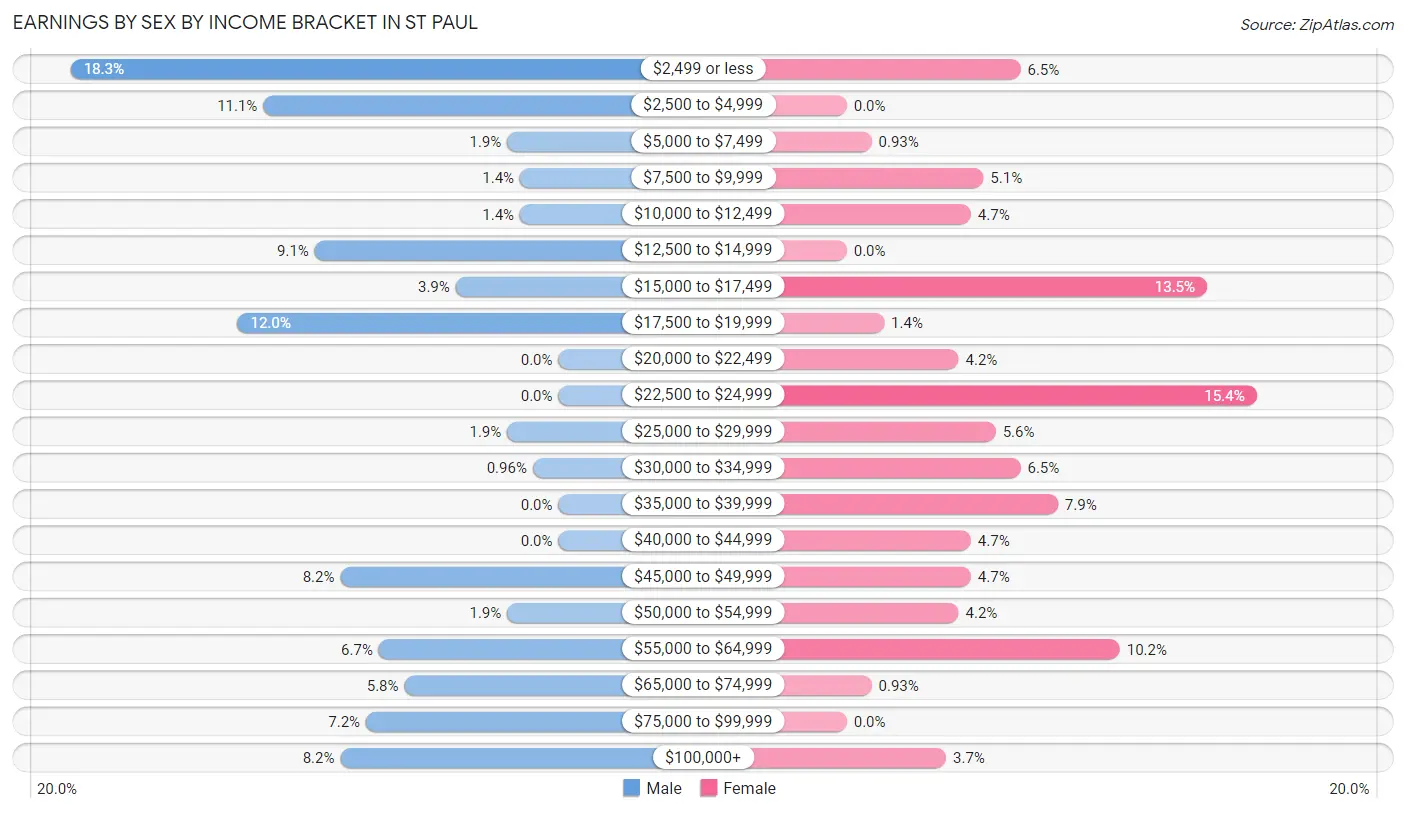
Earnings by Sex by Income Bracket in St Paul
The most common earnings brackets in St Paul are $2,499 or less for men (38 | 18.3%) and $22,500 to $24,999 for women (33 | 15.3%).
| Income | Male | Female |
| $2,499 or less | 38 (18.3%) | 14 (6.5%) |
| $2,500 to $4,999 | 23 (11.1%) | 0 (0.0%) |
| $5,000 to $7,499 | 4 (1.9%) | 2 (0.9%) |
| $7,500 to $9,999 | 3 (1.4%) | 11 (5.1%) |
| $10,000 to $12,499 | 3 (1.4%) | 10 (4.6%) |
| $12,500 to $14,999 | 19 (9.1%) | 0 (0.0%) |
| $15,000 to $17,499 | 8 (3.8%) | 29 (13.5%) |
| $17,500 to $19,999 | 25 (12.0%) | 3 (1.4%) |
| $20,000 to $22,499 | 0 (0.0%) | 9 (4.2%) |
| $22,500 to $24,999 | 0 (0.0%) | 33 (15.3%) |
| $25,000 to $29,999 | 4 (1.9%) | 12 (5.6%) |
| $30,000 to $34,999 | 2 (1.0%) | 14 (6.5%) |
| $35,000 to $39,999 | 0 (0.0%) | 17 (7.9%) |
| $40,000 to $44,999 | 0 (0.0%) | 10 (4.6%) |
| $45,000 to $49,999 | 17 (8.2%) | 10 (4.6%) |
| $50,000 to $54,999 | 4 (1.9%) | 9 (4.2%) |
| $55,000 to $64,999 | 14 (6.7%) | 22 (10.2%) |
| $65,000 to $74,999 | 12 (5.8%) | 2 (0.9%) |
| $75,000 to $99,999 | 15 (7.2%) | 0 (0.0%) |
| $100,000+ | 17 (8.2%) | 8 (3.7%) |
| Total | 208 (100.0%) | 215 (100.0%) |
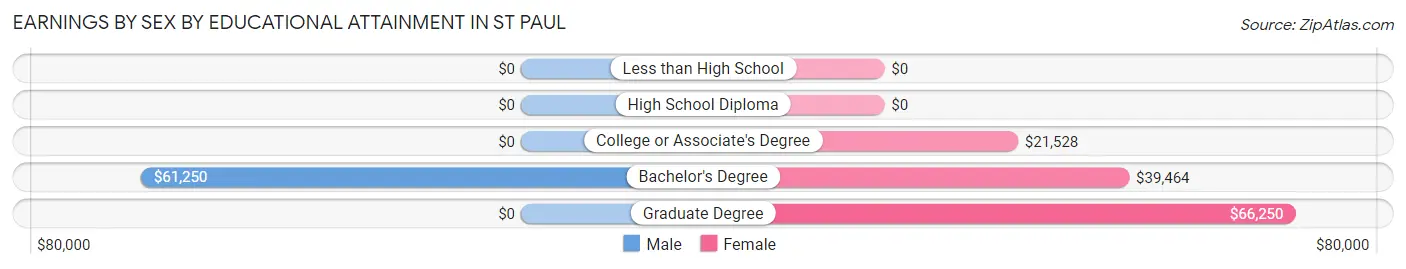
Earnings by Sex by Educational Attainment in St Paul
| Educational Attainment | Male Income | Female Income |
| Less than High School | - | - |
| High School Diploma | - | - |
| College or Associate's Degree | - | - |
| Bachelor's Degree | $61,250 | $39,464 |
| Graduate Degree | - | - |
| Total | - | - |
Family Income in St Paul
Family Income Brackets in St Paul
According to the St Paul family income data, there are 85 families falling into the $50,000 to $74,999 income range, which is the most common income bracket and makes up 25.5% of all families. Conversely, the $200,000+ income bracket is the least frequent group with only 6 families (1.8%) belonging to this category.
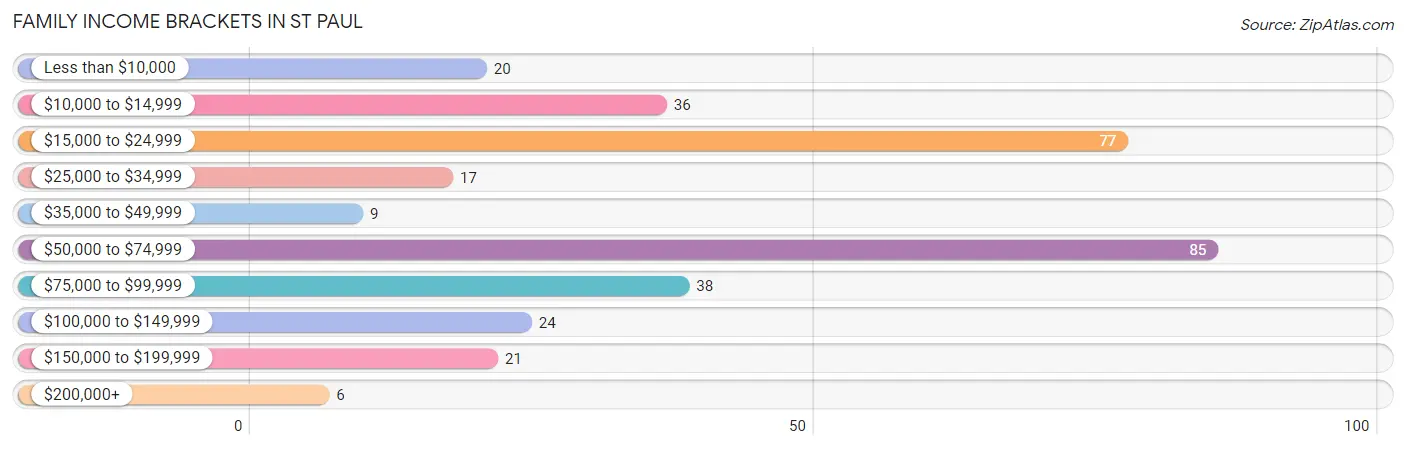
| Income Bracket | # Families | % Families |
| Less than $10,000 | 20 | 6.0% |
| $10,000 to $14,999 | 36 | 10.8% |
| $15,000 to $24,999 | 77 | 23.1% |
| $25,000 to $34,999 | 17 | 5.1% |
| $35,000 to $49,999 | 9 | 2.7% |
| $50,000 to $74,999 | 85 | 25.5% |
| $75,000 to $99,999 | 38 | 11.4% |
| $100,000 to $149,999 | 24 | 7.2% |
| $150,000 to $199,999 | 21 | 6.3% |
| $200,000+ | 6 | 1.8% |
Family Income by Famaliy Size in St Paul
5-person families (13 | 3.9%) account for the highest median family income in St Paul with $83,750 per family, while 2-person families (172 | 51.6%) have the highest median income of $30,000 per family member.
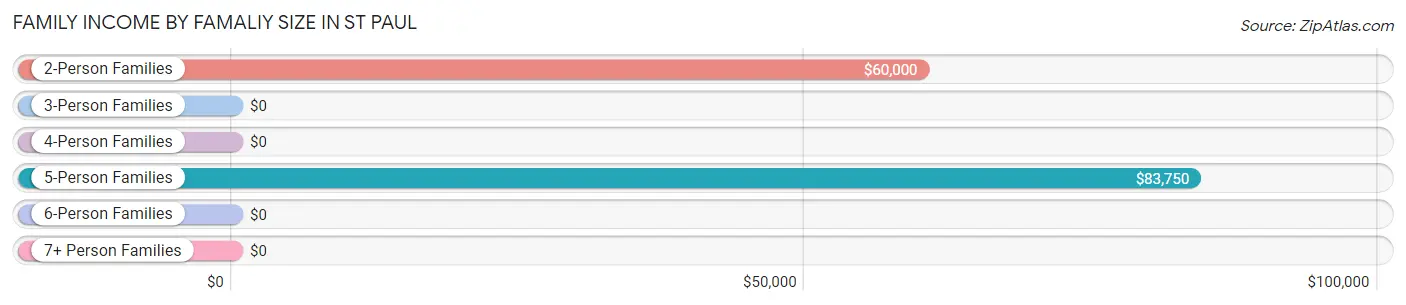
| Income Bracket | # Families | Median Income |
| 2-Person Families | 172 (51.6%) | $60,000 |
| 3-Person Families | 111 (33.3%) | $0 |
| 4-Person Families | 30 (9.0%) | $0 |
| 5-Person Families | 13 (3.9%) | $83,750 |
| 6-Person Families | 7 (2.1%) | $0 |
| 7+ Person Families | 0 (0.0%) | $0 |
| Total | 333 (100.0%) | $51,339 |
Family Income by Number of Earners in St Paul
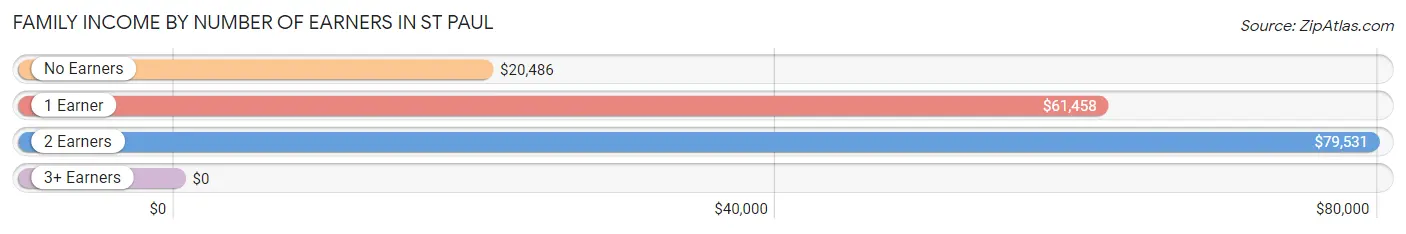
| Number of Earners | # Families | Median Income |
| No Earners | 141 (42.3%) | $20,486 |
| 1 Earner | 60 (18.0%) | $61,458 |
| 2 Earners | 127 (38.1%) | $79,531 |
| 3+ Earners | 5 (1.5%) | $0 |
| Total | 333 (100.0%) | $51,339 |
Household Income in St Paul
Household Income Brackets in St Paul
With 105 households falling in the category, the $15,000 to $24,999 income range is the most frequent in St Paul, accounting for 21.8% of all households. In contrast, only 6 households (1.3%) fall into the $200,000+ income bracket, making it the least populous group.
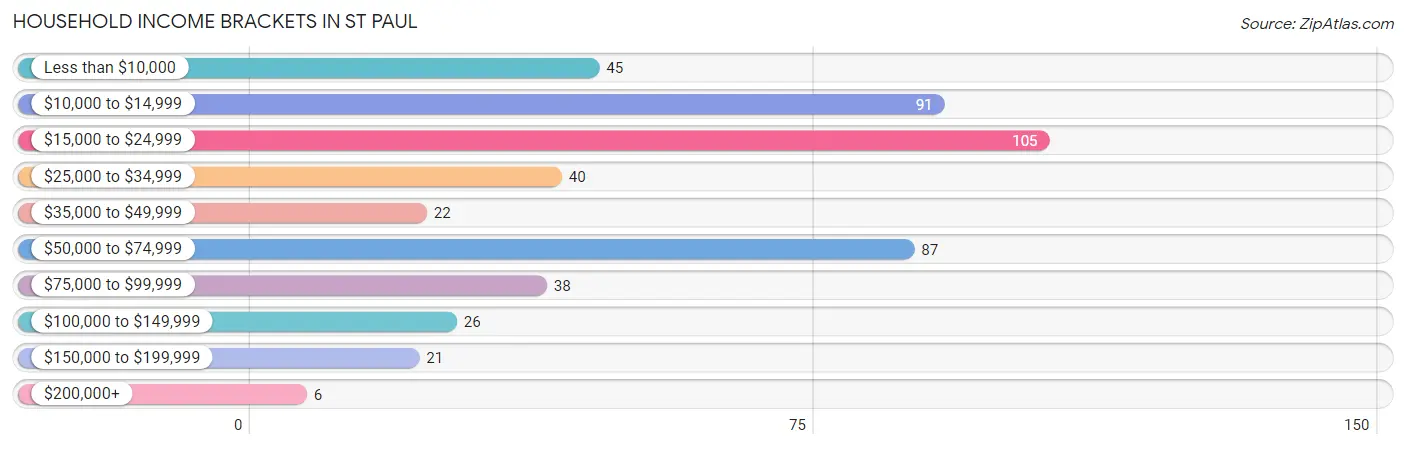
| Income Bracket | # Households | % Households |
| Less than $10,000 | 45 | 9.4% |
| $10,000 to $14,999 | 91 | 18.9% |
| $15,000 to $24,999 | 105 | 21.8% |
| $25,000 to $34,999 | 40 | 8.3% |
| $35,000 to $49,999 | 22 | 4.6% |
| $50,000 to $74,999 | 87 | 18.1% |
| $75,000 to $99,999 | 38 | 7.9% |
| $100,000 to $149,999 | 26 | 5.4% |
| $150,000 to $199,999 | 21 | 4.4% |
| $200,000+ | 6 | 1.2% |
Household Income by Householder Age in St Paul
The median household income in St Paul is $24,886, with the highest median household income of $32,750 found in the 65+ years age bracket for the primary householder. A total of 156 households (32.4%) fall into this category. Meanwhile, the 15 to 24 years age bracket for the primary householder has the lowest median household income of $0, with 20 households (4.2%) in this group.
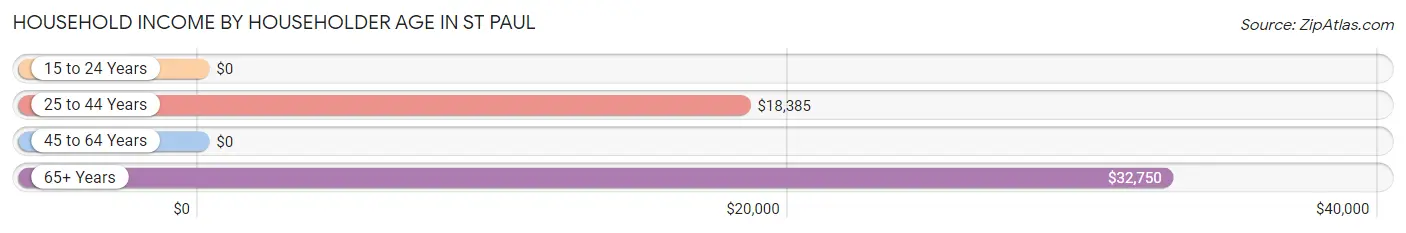
| Income Bracket | # Households | Median Income |
| 15 to 24 Years | 20 (4.2%) | $0 |
| 25 to 44 Years | 125 (26.0%) | $18,385 |
| 45 to 64 Years | 180 (37.4%) | $0 |
| 65+ Years | 156 (32.4%) | $32,750 |
| Total | 481 (100.0%) | $24,886 |
Poverty in St Paul
Income Below Poverty by Sex and Age in St Paul
With 34.6% poverty level for males and 41.3% for females among the residents of St Paul, 15 year old males and 6 to 11 year old females are the most vulnerable to poverty, with 12 males (85.7%) and 22 females (78.6%) in their respective age groups living below the poverty level.
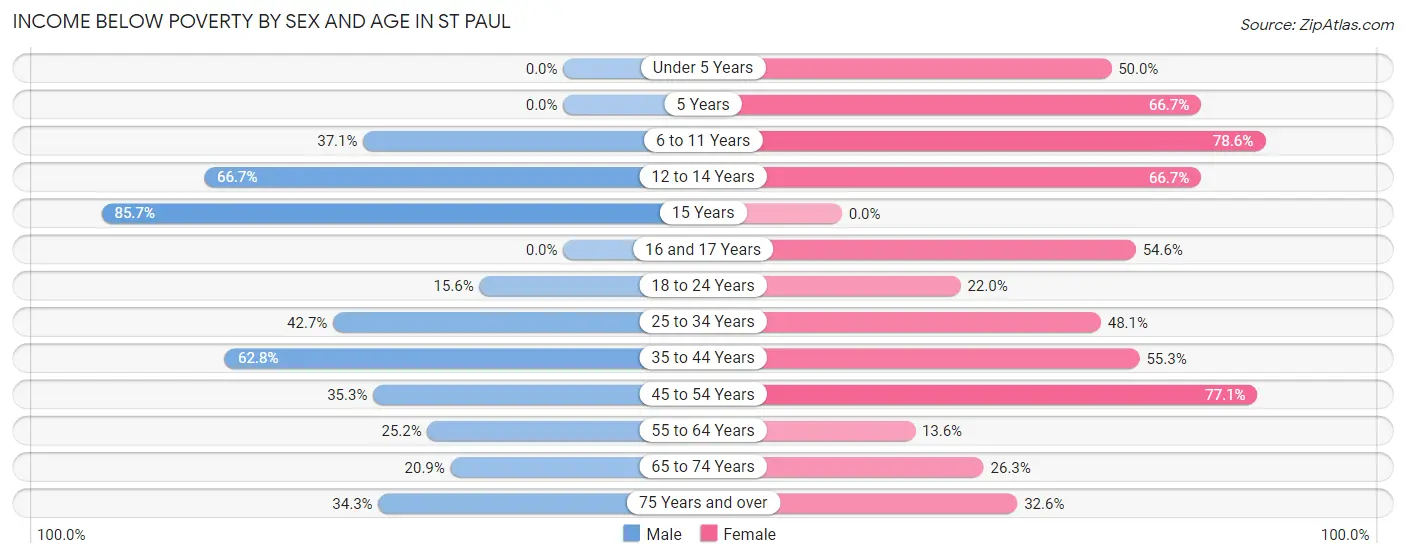
| Age Bracket | Male | Female |
| Under 5 Years | 0 (0.0%) | 13 (50.0%) |
| 5 Years | 0 (0.0%) | 6 (66.7%) |
| 6 to 11 Years | 13 (37.1%) | 22 (78.6%) |
| 12 to 14 Years | 12 (66.7%) | 10 (66.7%) |
| 15 Years | 12 (85.7%) | 0 (0.0%) |
| 16 and 17 Years | 0 (0.0%) | 18 (54.5%) |
| 18 to 24 Years | 7 (15.6%) | 13 (22.0%) |
| 25 to 34 Years | 47 (42.7%) | 25 (48.1%) |
| 35 to 44 Years | 27 (62.8%) | 42 (55.3%) |
| 45 to 54 Years | 18 (35.3%) | 27 (77.1%) |
| 55 to 64 Years | 30 (25.2%) | 11 (13.6%) |
| 65 to 74 Years | 9 (20.9%) | 15 (26.3%) |
| 75 Years and over | 23 (34.3%) | 28 (32.6%) |
| Total | 198 (34.6%) | 230 (41.3%) |
Income Above Poverty by Sex and Age in St Paul
According to the poverty statistics in St Paul, males aged under 5 years and females aged 55 to 64 years are the age groups that are most secure financially, with 100.0% of males and 86.4% of females in these age groups living above the poverty line.
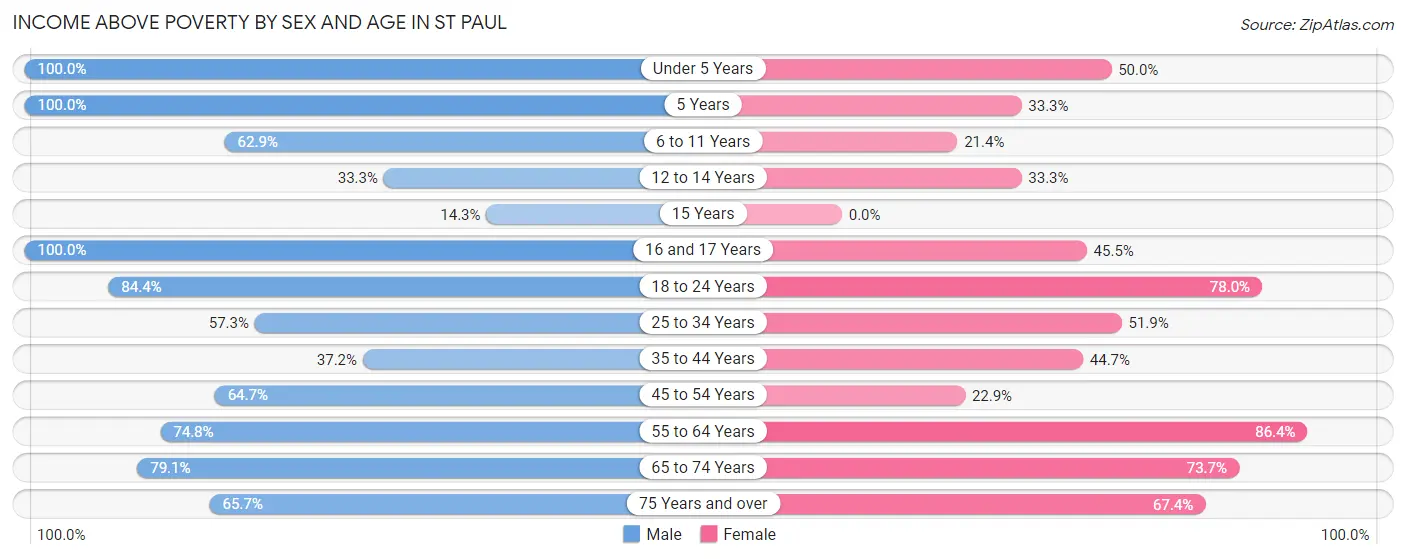
| Age Bracket | Male | Female |
| Under 5 Years | 16 (100.0%) | 13 (50.0%) |
| 5 Years | 8 (100.0%) | 3 (33.3%) |
| 6 to 11 Years | 22 (62.9%) | 6 (21.4%) |
| 12 to 14 Years | 6 (33.3%) | 5 (33.3%) |
| 15 Years | 2 (14.3%) | 0 (0.0%) |
| 16 and 17 Years | 3 (100.0%) | 15 (45.5%) |
| 18 to 24 Years | 38 (84.4%) | 46 (78.0%) |
| 25 to 34 Years | 63 (57.3%) | 27 (51.9%) |
| 35 to 44 Years | 16 (37.2%) | 34 (44.7%) |
| 45 to 54 Years | 33 (64.7%) | 8 (22.9%) |
| 55 to 64 Years | 89 (74.8%) | 70 (86.4%) |
| 65 to 74 Years | 34 (79.1%) | 42 (73.7%) |
| 75 Years and over | 44 (65.7%) | 58 (67.4%) |
| Total | 374 (65.4%) | 327 (58.7%) |
Income Below Poverty Among Married-Couple Families in St Paul
The poverty statistics for married-couple families in St Paul show that 30.0% or 71 of the total 237 families live below the poverty line. Families with 1 or 2 children have the highest poverty rate of 60.4%, comprising of 29 families. On the other hand, families with 3 or 4 children have the lowest poverty rate of 0.0%, which includes 0 families.
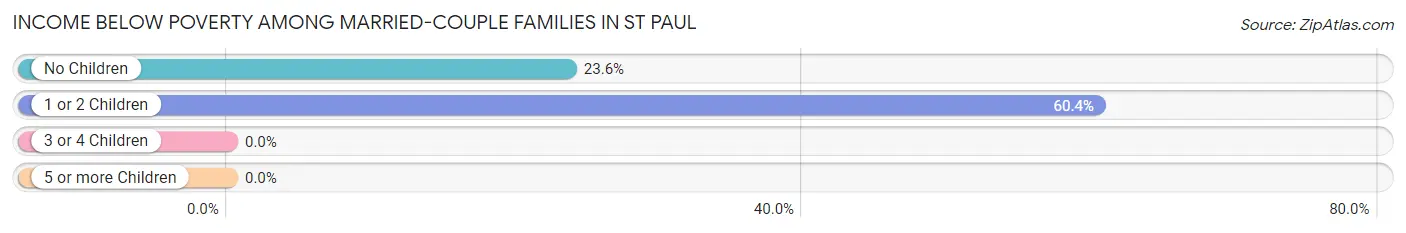
| Children | Above Poverty | Below Poverty |
| No Children | 136 (76.4%) | 42 (23.6%) |
| 1 or 2 Children | 19 (39.6%) | 29 (60.4%) |
| 3 or 4 Children | 11 (100.0%) | 0 (0.0%) |
| 5 or more Children | 0 (0.0%) | 0 (0.0%) |
| Total | 166 (70.0%) | 71 (30.0%) |
Income Below Poverty Among Single-Parent Households in St Paul
According to the poverty data in St Paul, 81.8% or 18 single-father households and 36.5% or 27 single-mother households are living below the poverty line. Among single-father households, those with 1 or 2 children have the highest poverty rate, with 9 households (100.0%) experiencing poverty. Likewise, among single-mother households, those with 3 or 4 children have the highest poverty rate, with 14 households (100.0%) falling below the poverty line.
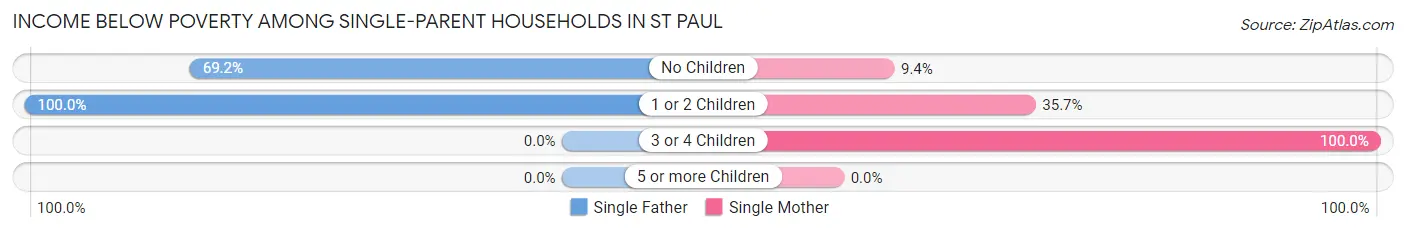
| Children | Single Father | Single Mother |
| No Children | 9 (69.2%) | 3 (9.4%) |
| 1 or 2 Children | 9 (100.0%) | 10 (35.7%) |
| 3 or 4 Children | 0 (0.0%) | 14 (100.0%) |
| 5 or more Children | 0 (0.0%) | 0 (0.0%) |
| Total | 18 (81.8%) | 27 (36.5%) |
Income Below Poverty Among Married-Couple vs Single-Parent Households in St Paul
The poverty data for St Paul shows that 71 of the married-couple family households (30.0%) and 45 of the single-parent households (46.9%) are living below the poverty level. Within the married-couple family households, those with 1 or 2 children have the highest poverty rate, with 29 households (60.4%) falling below the poverty line. Among the single-parent households, those with 3 or 4 children have the highest poverty rate, with 14 household (100.0%) living below poverty.
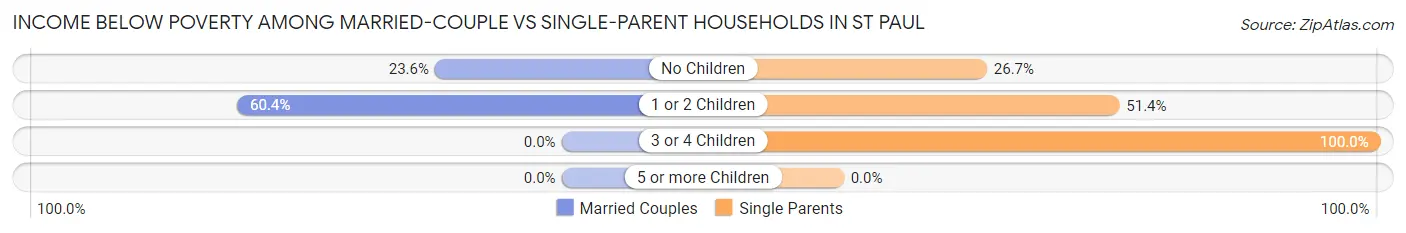
| Children | Married-Couple Families | Single-Parent Households |
| No Children | 42 (23.6%) | 12 (26.7%) |
| 1 or 2 Children | 29 (60.4%) | 19 (51.3%) |
| 3 or 4 Children | 0 (0.0%) | 14 (100.0%) |
| 5 or more Children | 0 (0.0%) | 0 (0.0%) |
| Total | 71 (30.0%) | 45 (46.9%) |
Race in St Paul
The most populous races in St Paul are White / Caucasian (1,089 | 96.5%), Two or more Races (36 | 3.2%), and Hispanic or Latino (23 | 2.0%).
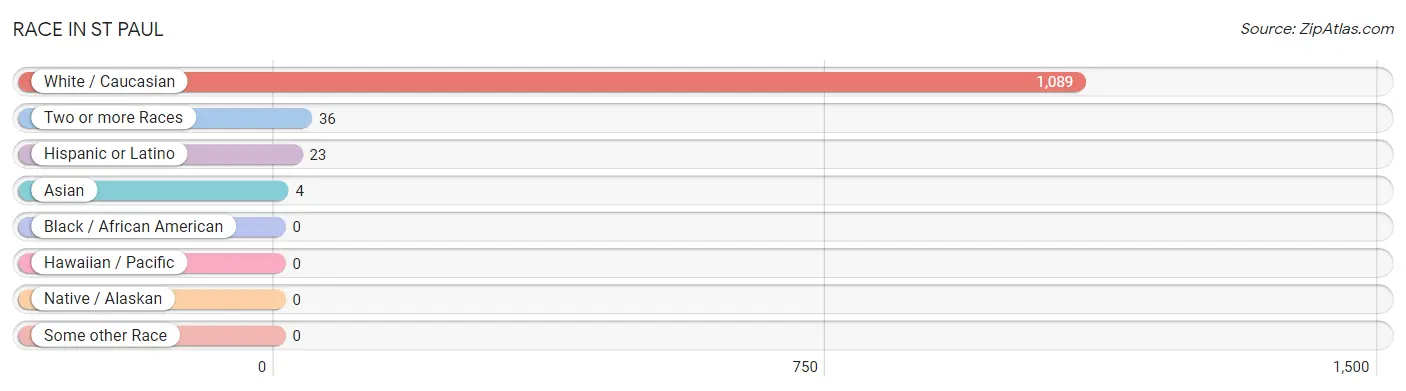
| Race | # Population | % Population |
| Asian | 4 | 0.4% |
| Black / African American | 0 | 0.0% |
| Hawaiian / Pacific | 0 | 0.0% |
| Hispanic or Latino | 23 | 2.0% |
| Native / Alaskan | 0 | 0.0% |
| White / Caucasian | 1,089 | 96.5% |
| Two or more Races | 36 | 3.2% |
| Some other Race | 0 | 0.0% |
| Total | 1,129 | 100.0% |
Ancestry in St Paul
The most populous ancestries reported in St Paul are American (279 | 24.7%), English (144 | 12.8%), Irish (129 | 11.4%), German (45 | 4.0%), and Scotch-Irish (40 | 3.5%), together accounting for 56.4% of all St Paul residents.
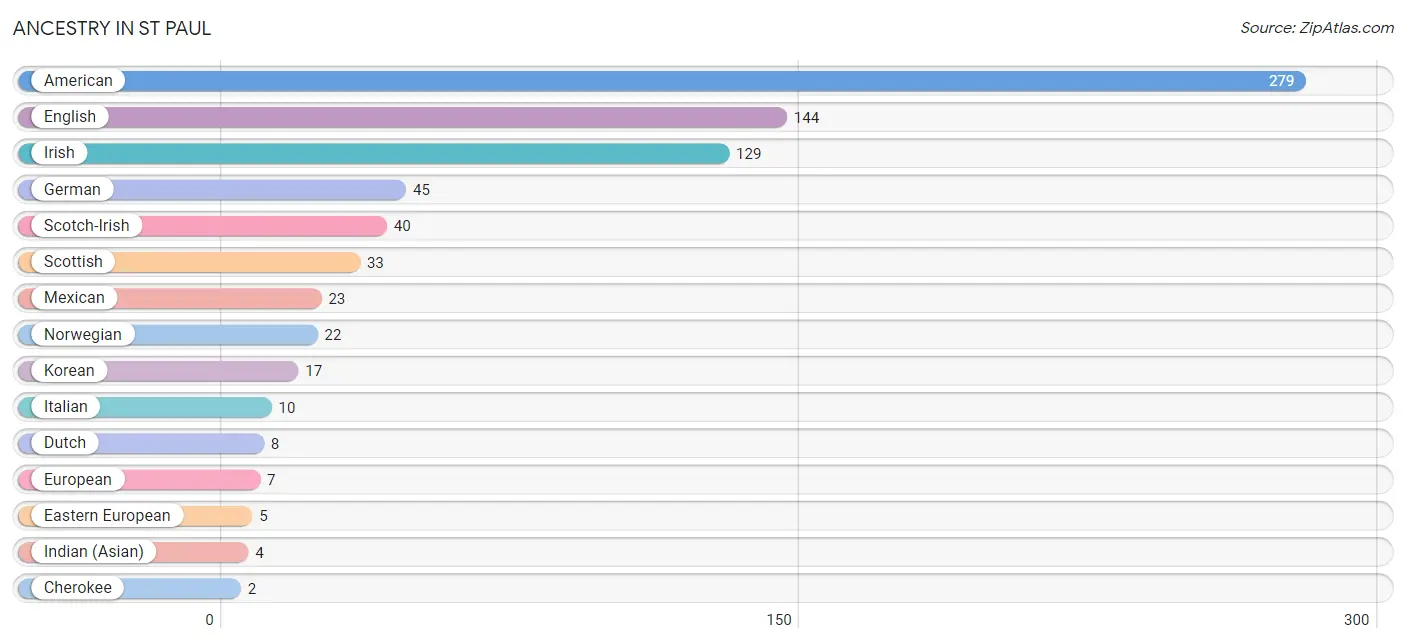
| Ancestry | # Population | % Population |
| American | 279 | 24.7% |
| Cherokee | 2 | 0.2% |
| Dutch | 8 | 0.7% |
| Eastern European | 5 | 0.4% |
| English | 144 | 12.8% |
| European | 7 | 0.6% |
| German | 45 | 4.0% |
| Indian (Asian) | 4 | 0.4% |
| Irish | 129 | 11.4% |
| Italian | 10 | 0.9% |
| Korean | 17 | 1.5% |
| Mexican | 23 | 2.0% |
| Norwegian | 22 | 1.9% |
| Russian | 2 | 0.2% |
| Scotch-Irish | 40 | 3.5% |
| Scottish | 33 | 2.9% |
| Swedish | 1 | 0.1% | View All 17 Rows |
Immigrants in St Paul
The most numerous immigrant groups reported in St Paul came from Asia (4 | 0.4%), China (4 | 0.4%), Eastern Asia (4 | 0.4%), Taiwan (4 | 0.4%), and Canada (2 | 0.2%), together accounting for 1.6% of all St Paul residents.
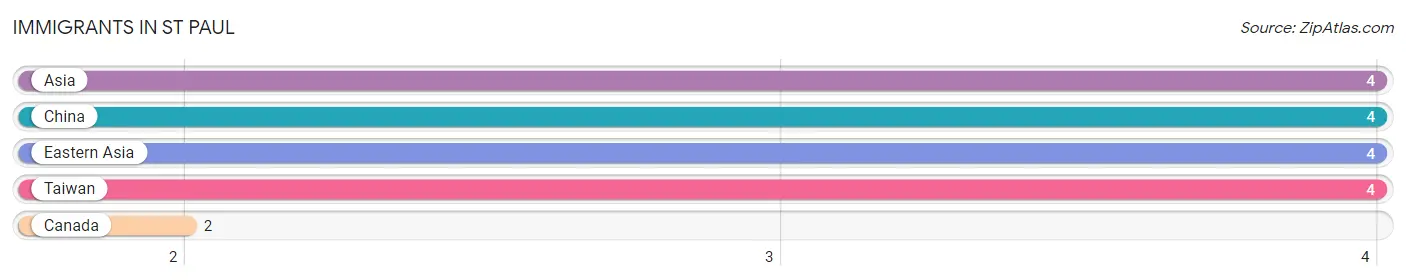
| Immigration Origin | # Population | % Population |
| Asia | 4 | 0.4% |
| Canada | 2 | 0.2% |
| China | 4 | 0.4% |
| Eastern Asia | 4 | 0.4% |
| Taiwan | 4 | 0.4% | View All 5 Rows |
Sex and Age in St Paul
Sex and Age in St Paul
The most populous age groups in St Paul are 60 to 64 Years (73 | 12.8%) for men and 20 to 24 Years (59 | 10.6%) for women.
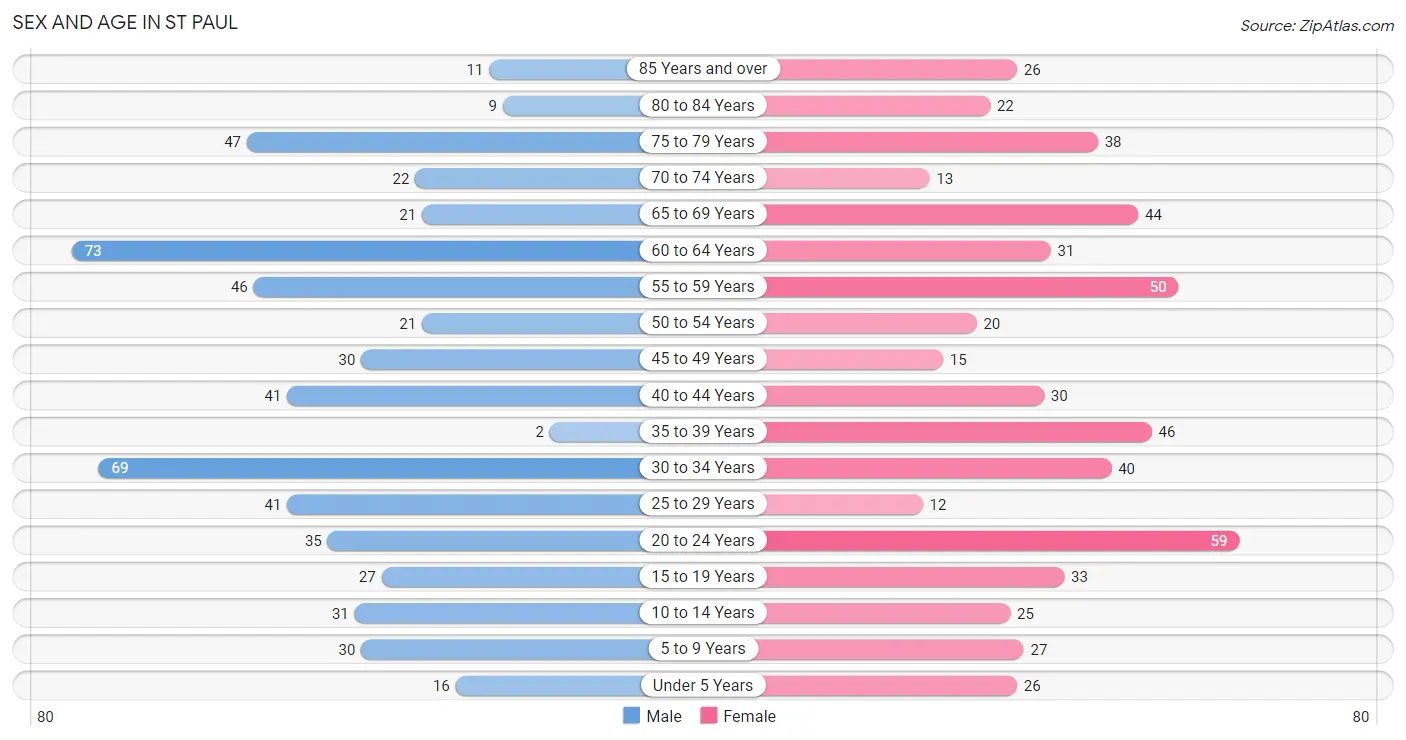
| Age Bracket | Male | Female |
| Under 5 Years | 16 (2.8%) | 26 (4.7%) |
| 5 to 9 Years | 30 (5.2%) | 27 (4.9%) |
| 10 to 14 Years | 31 (5.4%) | 25 (4.5%) |
| 15 to 19 Years | 27 (4.7%) | 33 (5.9%) |
| 20 to 24 Years | 35 (6.1%) | 59 (10.6%) |
| 25 to 29 Years | 41 (7.2%) | 12 (2.1%) |
| 30 to 34 Years | 69 (12.1%) | 40 (7.2%) |
| 35 to 39 Years | 2 (0.4%) | 46 (8.3%) |
| 40 to 44 Years | 41 (7.2%) | 30 (5.4%) |
| 45 to 49 Years | 30 (5.2%) | 15 (2.7%) |
| 50 to 54 Years | 21 (3.7%) | 20 (3.6%) |
| 55 to 59 Years | 46 (8.0%) | 50 (9.0%) |
| 60 to 64 Years | 73 (12.8%) | 31 (5.6%) |
| 65 to 69 Years | 21 (3.7%) | 44 (7.9%) |
| 70 to 74 Years | 22 (3.8%) | 13 (2.3%) |
| 75 to 79 Years | 47 (8.2%) | 38 (6.8%) |
| 80 to 84 Years | 9 (1.6%) | 22 (4.0%) |
| 85 Years and over | 11 (1.9%) | 26 (4.7%) |
| Total | 572 (100.0%) | 557 (100.0%) |
Families and Households in St Paul
Median Family Size in St Paul
The median family size in St Paul is 2.92 persons per family, with single male/father families (22 | 6.6%) accounting for the largest median family size of 3.32 persons per family. On the other hand, married-couple families (237 | 71.2%) represent the smallest median family size with 2.87 persons per family.
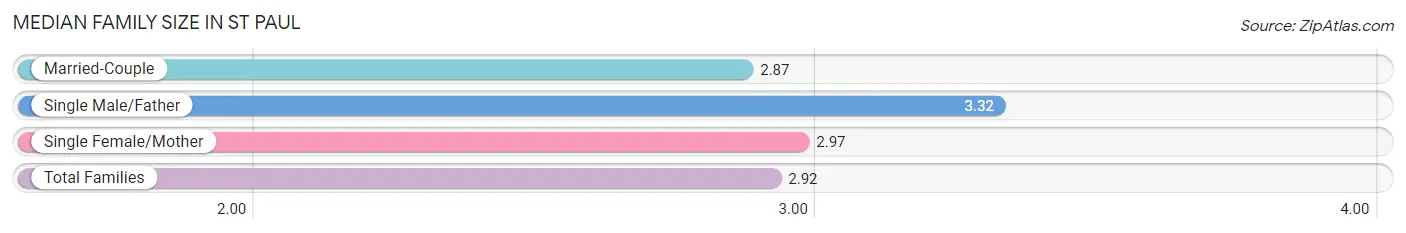
| Family Type | # Families | Family Size |
| Married-Couple | 237 (71.2%) | 2.87 |
| Single Male/Father | 22 (6.6%) | 3.32 |
| Single Female/Mother | 74 (22.2%) | 2.97 |
| Total Families | 333 (100.0%) | 2.92 |
Median Household Size in St Paul
The median household size in St Paul is 2.35 persons per household, with single male/father households (22 | 4.6%) accounting for the largest median household size of 3.32 persons per household. non-family households (148 | 30.8%) represent the smallest median household size with 1.04 persons per household.
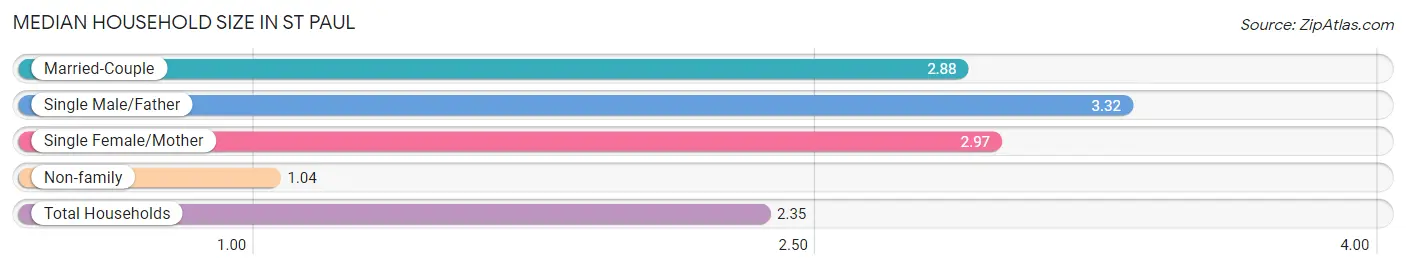
| Household Type | # Households | Household Size |
| Married-Couple | 237 (49.3%) | 2.88 |
| Single Male/Father | 22 (4.6%) | 3.32 |
| Single Female/Mother | 74 (15.4%) | 2.97 |
| Non-family | 148 (30.8%) | 1.04 |
| Total Households | 481 (100.0%) | 2.35 |
Household Size by Marriage Status in St Paul
Out of a total of 481 households in St Paul, 333 (69.2%) are family households, while 148 (30.8%) are nonfamily households. The most numerous type of family households are 2-person households, comprising 172, and the most common type of nonfamily households are 1-person households, comprising 142.
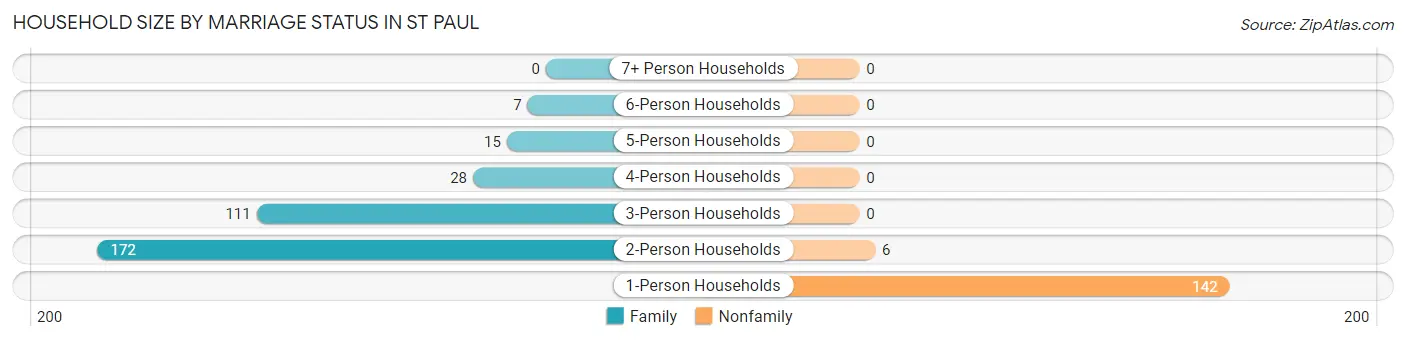
| Household Size | Family Households | Nonfamily Households |
| 1-Person Households | - | 142 (29.5%) |
| 2-Person Households | 172 (35.8%) | 6 (1.3%) |
| 3-Person Households | 111 (23.1%) | 0 (0.0%) |
| 4-Person Households | 28 (5.8%) | 0 (0.0%) |
| 5-Person Households | 15 (3.1%) | 0 (0.0%) |
| 6-Person Households | 7 (1.5%) | 0 (0.0%) |
| 7+ Person Households | 0 (0.0%) | 0 (0.0%) |
| Total | 333 (69.2%) | 148 (30.8%) |
Female Fertility in St Paul
Fertility by Age in St Paul
Average fertility rate in St Paul is 26.0 births per 1,000 women. Women in the age bracket of 20 to 34 years have the highest fertility rate with 54.0 births per 1,000 women. Women in the age bracket of 20 to 34 years acount for 100.0% of all women with births.
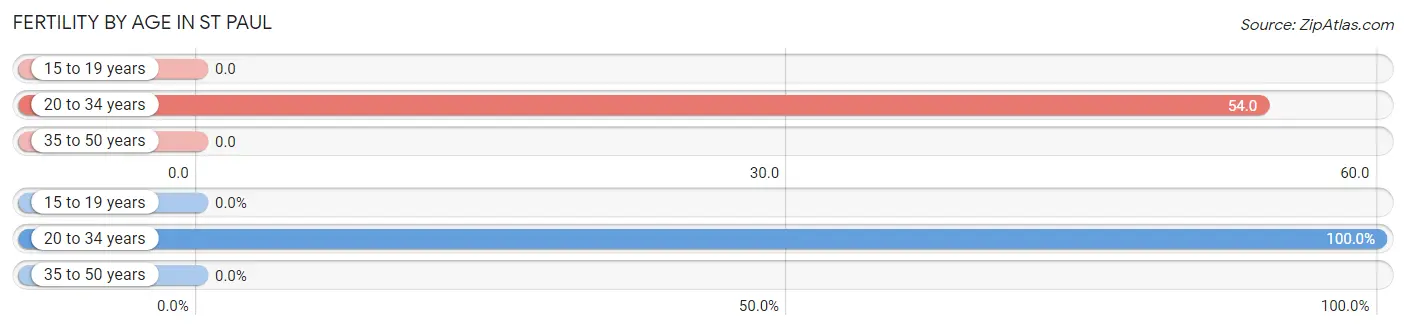
| Age Bracket | Women with Births | Births / 1,000 Women |
| 15 to 19 years | 0 (0.0%) | 0.0 |
| 20 to 34 years | 6 (100.0%) | 54.0 |
| 35 to 50 years | 0 (0.0%) | 0.0 |
| Total | 6 (100.0%) | 26.0 |
Fertility by Age by Marriage Status in St Paul
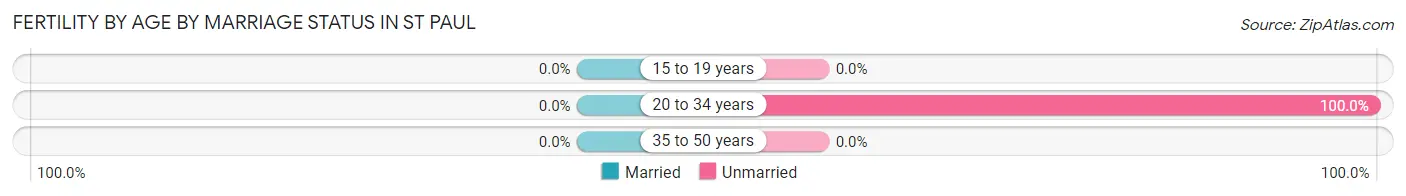
| Age Bracket | Married | Unmarried |
| 15 to 19 years | 0 (0.0%) | 0 (0.0%) |
| 20 to 34 years | 0 (0.0%) | 6 (100.0%) |
| 35 to 50 years | 0 (0.0%) | 0 (0.0%) |
| Total | 0 (0.0%) | 6 (100.0%) |
Fertility by Education in St Paul
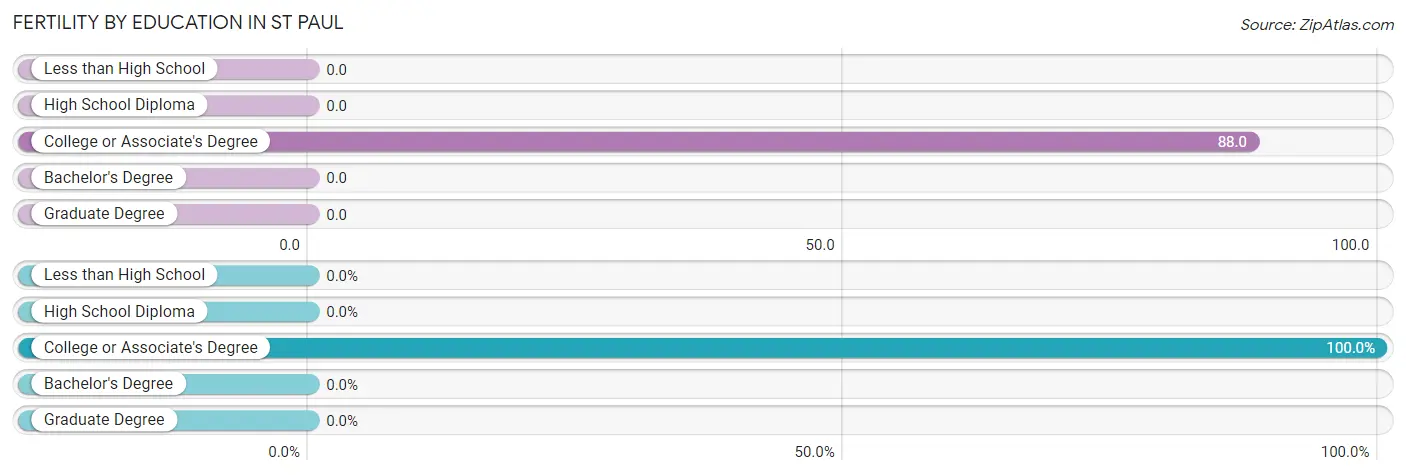
| Educational Attainment | Women with Births | Births / 1,000 Women |
| Less than High School | 0 (0.0%) | 0.0 |
| High School Diploma | 0 (0.0%) | 0.0 |
| College or Associate's Degree | 6 (100.0%) | 88.0 |
| Bachelor's Degree | 0 (0.0%) | 0.0 |
| Graduate Degree | 0 (0.0%) | 0.0 |
| Total | 6 (100.0%) | 26.0 |
Fertility by Education by Marriage Status in St Paul
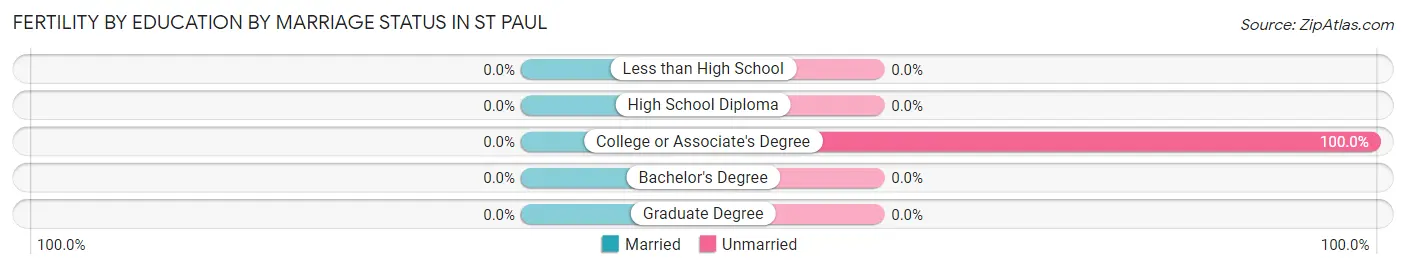
| Educational Attainment | Married | Unmarried |
| Less than High School | 0 (0.0%) | 0 (0.0%) |
| High School Diploma | 0 (0.0%) | 0 (0.0%) |
| College or Associate's Degree | 0 (0.0%) | 6 (100.0%) |
| Bachelor's Degree | 0 (0.0%) | 0 (0.0%) |
| Graduate Degree | 0 (0.0%) | 0 (0.0%) |
| Total | 0 (0.0%) | 6 (100.0%) |
Employment Characteristics in St Paul
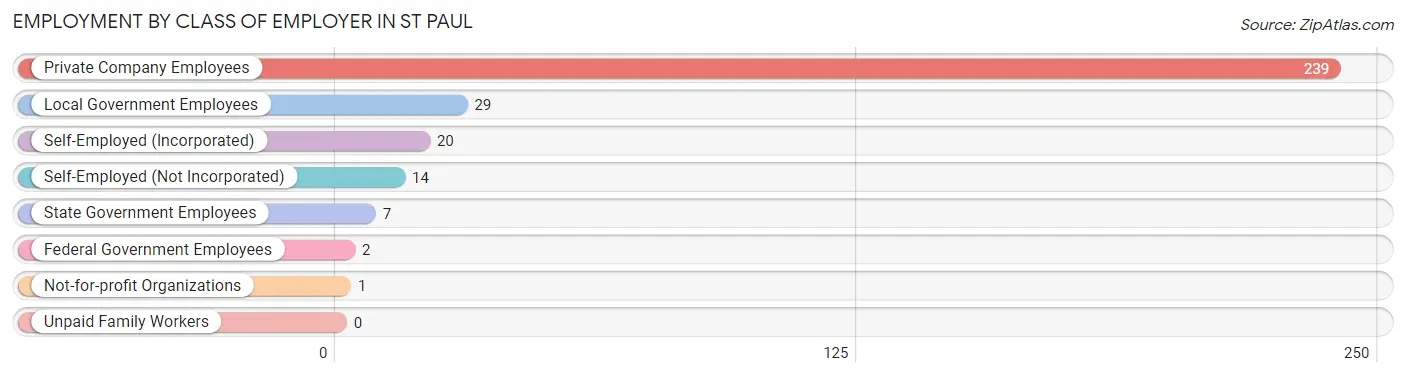
Employment by Class of Employer in St Paul
Among the 312 employed individuals in St Paul, private company employees (239 | 76.6%), local government employees (29 | 9.3%), and self-employed (incorporated) (20 | 6.4%) make up the most common classes of employment.
| Employer Class | # Employees | % Employees |
| Private Company Employees | 239 | 76.6% |
| Self-Employed (Incorporated) | 20 | 6.4% |
| Self-Employed (Not Incorporated) | 14 | 4.5% |
| Not-for-profit Organizations | 1 | 0.3% |
| Local Government Employees | 29 | 9.3% |
| State Government Employees | 7 | 2.2% |
| Federal Government Employees | 2 | 0.6% |
| Unpaid Family Workers | 0 | 0.0% |
| Total | 312 | 100.0% |
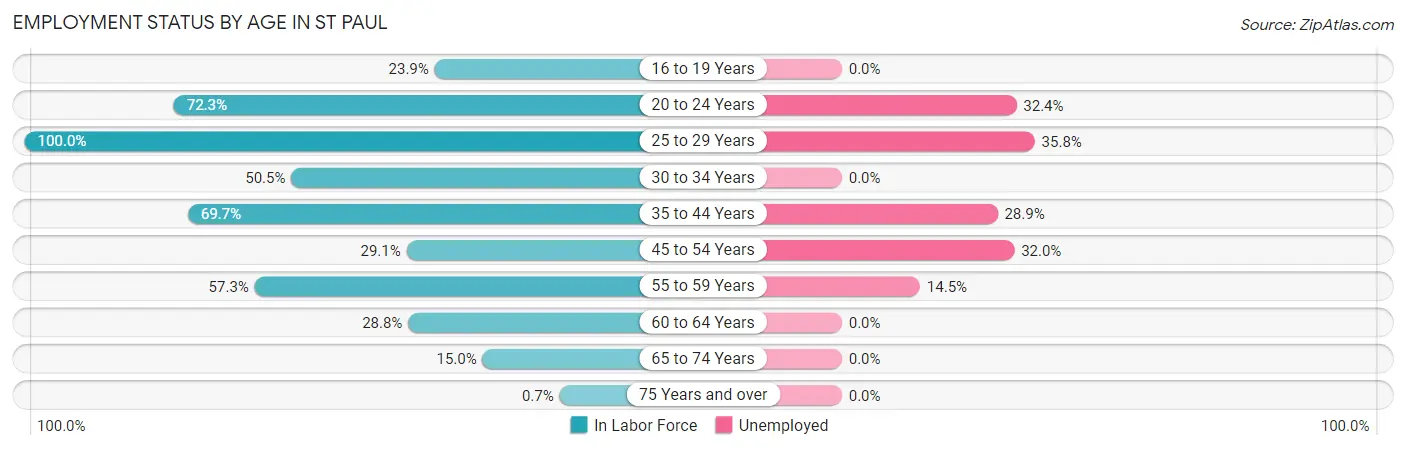
Employment Status by Age in St Paul
According to the labor force statistics for St Paul, out of the total population over 16 years of age (960), 41.3% or 396 individuals are in the labor force, with 20.5% or 81 of them unemployed. The age group with the highest labor force participation rate is 25 to 29 years, with 100.0% or 53 individuals in the labor force. Within the labor force, the 25 to 29 years age range has the highest percentage of unemployed individuals, with 35.8% or 19 of them being unemployed.
| Age Bracket | In Labor Force | Unemployed |
| 16 to 19 Years | 11 (23.9%) | 0 (0.0%) |
| 20 to 24 Years | 68 (72.3%) | 22 (32.4%) |
| 25 to 29 Years | 53 (100.0%) | 19 (35.8%) |
| 30 to 34 Years | 55 (50.5%) | 0 (0.0%) |
| 35 to 44 Years | 83 (69.7%) | 24 (28.9%) |
| 45 to 54 Years | 25 (29.1%) | 8 (32.0%) |
| 55 to 59 Years | 55 (57.3%) | 8 (14.5%) |
| 60 to 64 Years | 30 (28.8%) | 0 (0.0%) |
| 65 to 74 Years | 15 (15.0%) | 0 (0.0%) |
| 75 Years and over | 1 (0.7%) | 0 (0.0%) |
| Total | 396 (41.3%) | 81 (20.5%) |
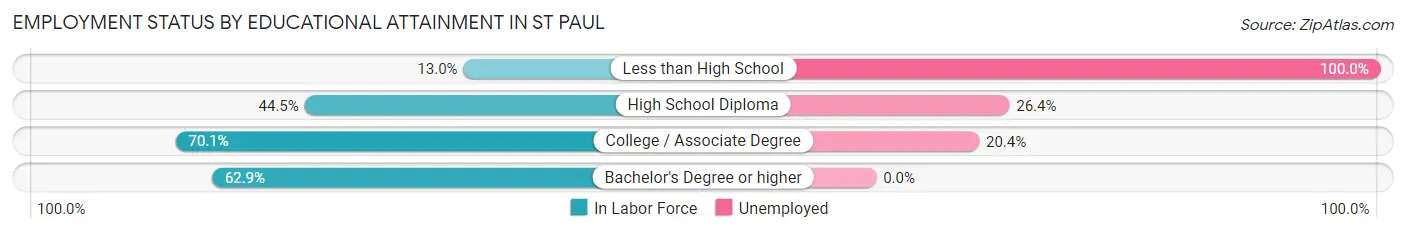
Employment Status by Educational Attainment in St Paul
According to labor force statistics for St Paul, 53.1% of individuals (301) out of the total population between 25 and 64 years of age (567) are in the labor force, with 19.6% or 59 of them being unemployed. The group with the highest labor force participation rate are those with the educational attainment of college / associate degree, with 70.1% or 157 individuals in the labor force. Within the labor force, individuals with less than high school education have the highest percentage of unemployment, with 100.0% or 13 of them being unemployed.
| Educational Attainment | In Labor Force | Unemployed |
| Less than High School | 13 (13.0%) | 100 (100.0%) |
| High School Diploma | 53 (44.5%) | 31 (26.4%) |
| College / Associate Degree | 157 (70.1%) | 46 (20.4%) |
| Bachelor's Degree or higher | 78 (62.9%) | 0 (0.0%) |
| Total | 301 (53.1%) | 111 (19.6%) |
Employment Occupations by Sex in St Paul
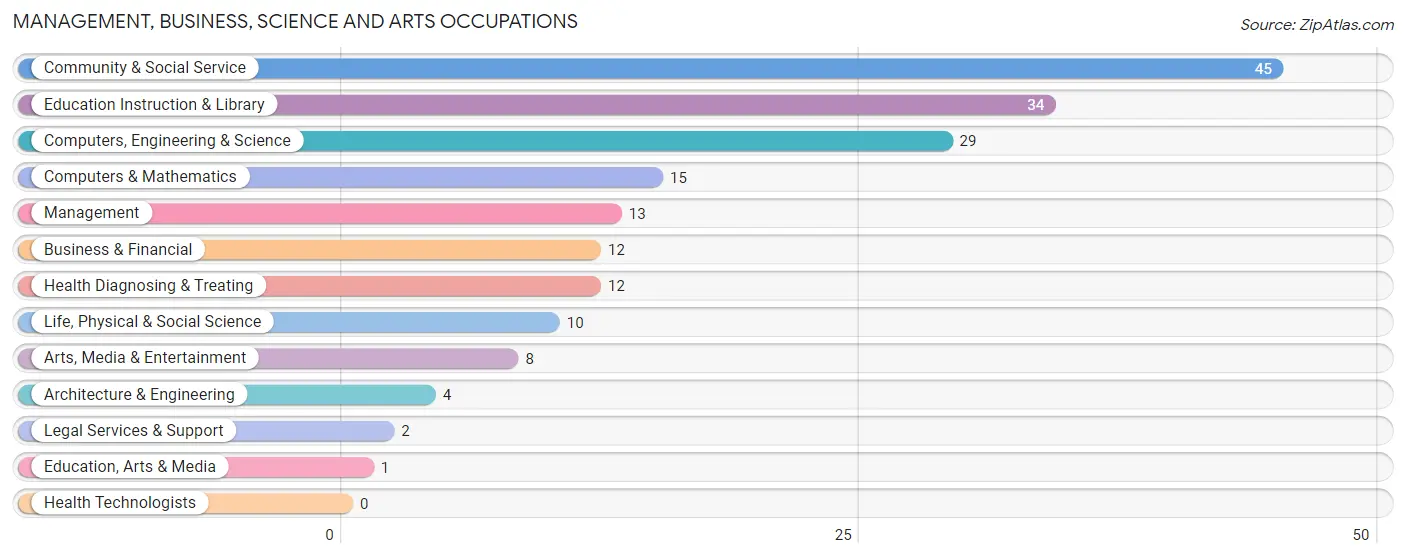
Management, Business, Science and Arts Occupations
The most common Management, Business, Science and Arts occupations in St Paul are Community & Social Service (45 | 14.3%), Education Instruction & Library (34 | 10.8%), Computers, Engineering & Science (29 | 9.2%), Computers & Mathematics (15 | 4.8%), and Management (13 | 4.1%).
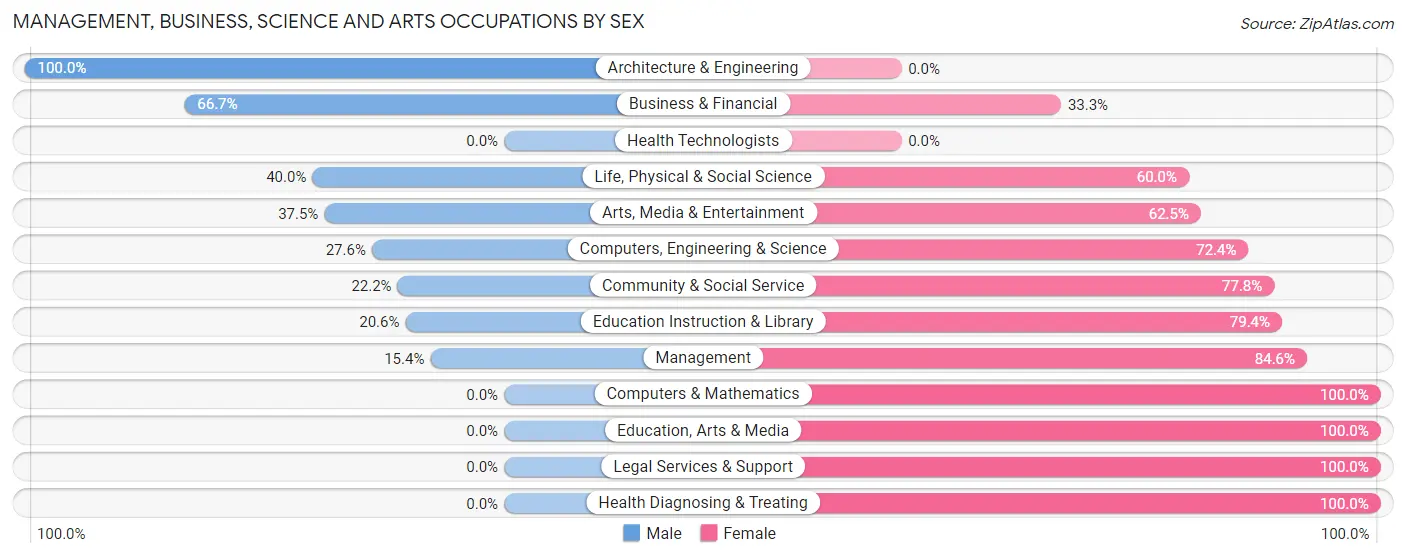
Management, Business, Science and Arts Occupations by Sex
Within the Management, Business, Science and Arts occupations in St Paul, the most male-oriented occupations are Architecture & Engineering (100.0%), Business & Financial (66.7%), and Life, Physical & Social Science (40.0%), while the most female-oriented occupations are Computers & Mathematics (100.0%), Education, Arts & Media (100.0%), and Legal Services & Support (100.0%).
| Occupation | Male | Female |
| Management | 2 (15.4%) | 11 (84.6%) |
| Business & Financial | 8 (66.7%) | 4 (33.3%) |
| Computers, Engineering & Science | 8 (27.6%) | 21 (72.4%) |
| Computers & Mathematics | 0 (0.0%) | 15 (100.0%) |
| Architecture & Engineering | 4 (100.0%) | 0 (0.0%) |
| Life, Physical & Social Science | 4 (40.0%) | 6 (60.0%) |
| Community & Social Service | 10 (22.2%) | 35 (77.8%) |
| Education, Arts & Media | 0 (0.0%) | 1 (100.0%) |
| Legal Services & Support | 0 (0.0%) | 2 (100.0%) |
| Education Instruction & Library | 7 (20.6%) | 27 (79.4%) |
| Arts, Media & Entertainment | 3 (37.5%) | 5 (62.5%) |
| Health Diagnosing & Treating | 0 (0.0%) | 12 (100.0%) |
| Health Technologists | 0 (0.0%) | 0 (0.0%) |
| Total (Category) | 28 (25.2%) | 83 (74.8%) |
| Total (Overall) | 152 (48.2%) | 163 (51.7%) |
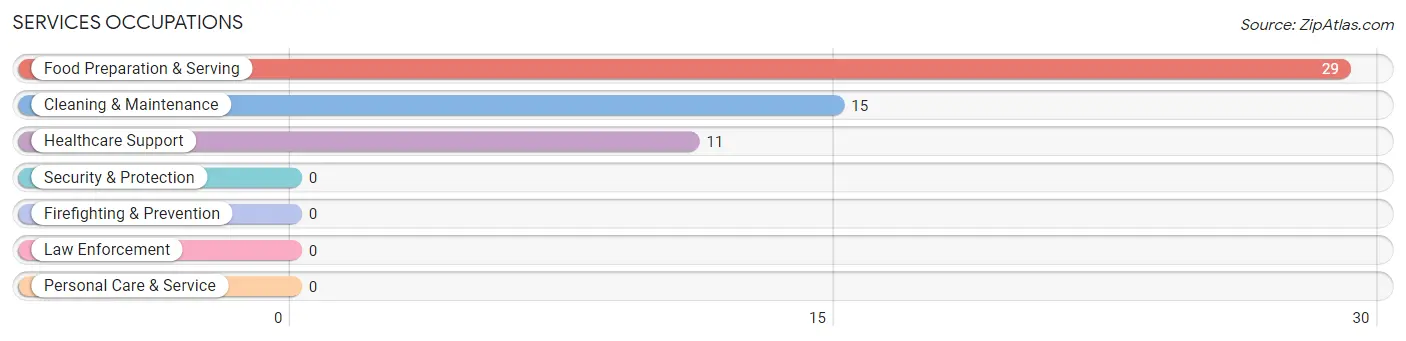
Services Occupations
The most common Services occupations in St Paul are Food Preparation & Serving (29 | 9.2%), Cleaning & Maintenance (15 | 4.8%), and Healthcare Support (11 | 3.5%).
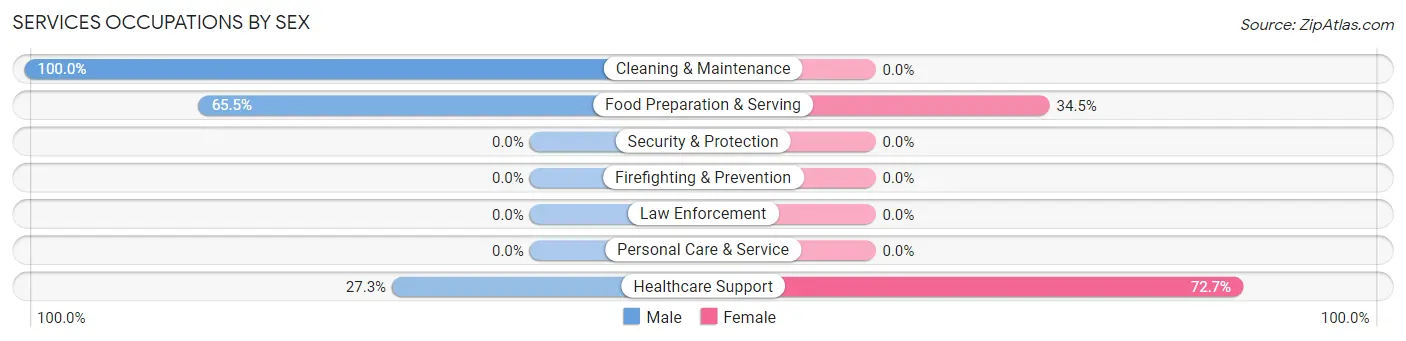
Services Occupations by Sex
Within the Services occupations in St Paul, the most male-oriented occupations are Cleaning & Maintenance (100.0%), Food Preparation & Serving (65.5%), and Healthcare Support (27.3%), while the most female-oriented occupations are Healthcare Support (72.7%), and Food Preparation & Serving (34.5%).
| Occupation | Male | Female |
| Healthcare Support | 3 (27.3%) | 8 (72.7%) |
| Security & Protection | 0 (0.0%) | 0 (0.0%) |
| Firefighting & Prevention | 0 (0.0%) | 0 (0.0%) |
| Law Enforcement | 0 (0.0%) | 0 (0.0%) |
| Food Preparation & Serving | 19 (65.5%) | 10 (34.5%) |
| Cleaning & Maintenance | 15 (100.0%) | 0 (0.0%) |
| Personal Care & Service | 0 (0.0%) | 0 (0.0%) |
| Total (Category) | 37 (67.3%) | 18 (32.7%) |
| Total (Overall) | 152 (48.2%) | 163 (51.7%) |
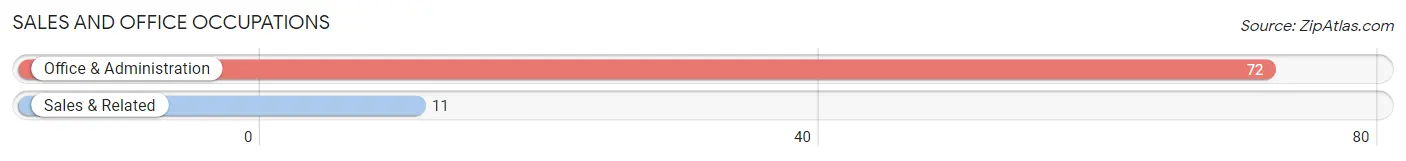
Sales and Office Occupations
The most common Sales and Office occupations in St Paul are Office & Administration (72 | 22.9%), and Sales & Related (11 | 3.5%).
Sales and Office Occupations by Sex
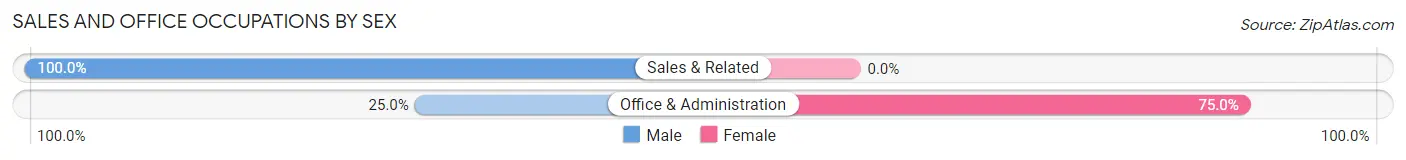
| Occupation | Male | Female |
| Sales & Related | 11 (100.0%) | 0 (0.0%) |
| Office & Administration | 18 (25.0%) | 54 (75.0%) |
| Total (Category) | 29 (34.9%) | 54 (65.1%) |
| Total (Overall) | 152 (48.2%) | 163 (51.7%) |
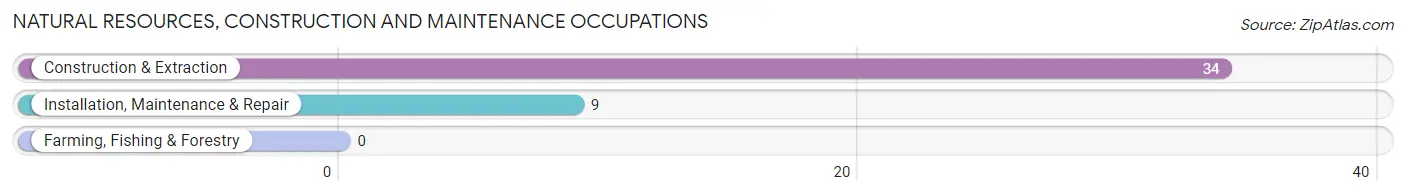
Natural Resources, Construction and Maintenance Occupations
The most common Natural Resources, Construction and Maintenance occupations in St Paul are Construction & Extraction (34 | 10.8%), and Installation, Maintenance & Repair (9 | 2.9%).
Natural Resources, Construction and Maintenance Occupations by Sex
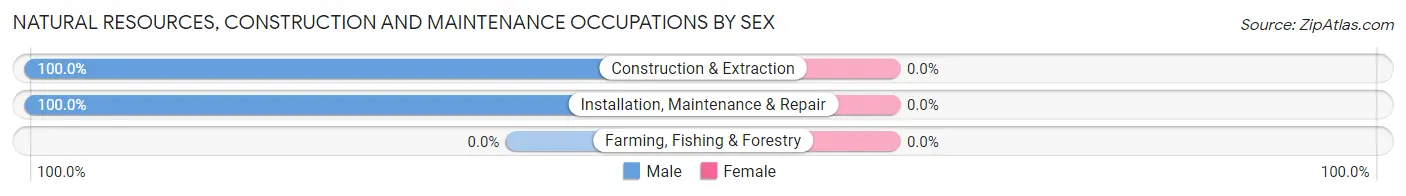
| Occupation | Male | Female |
| Farming, Fishing & Forestry | 0 (0.0%) | 0 (0.0%) |
| Construction & Extraction | 34 (100.0%) | 0 (0.0%) |
| Installation, Maintenance & Repair | 9 (100.0%) | 0 (0.0%) |
| Total (Category) | 43 (100.0%) | 0 (0.0%) |
| Total (Overall) | 152 (48.2%) | 163 (51.7%) |
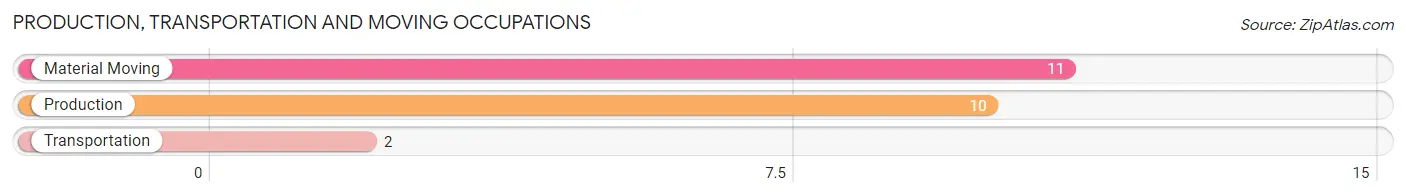
Production, Transportation and Moving Occupations
The most common Production, Transportation and Moving occupations in St Paul are Material Moving (11 | 3.5%), Production (10 | 3.2%), and Transportation (2 | 0.6%).
Production, Transportation and Moving Occupations by Sex
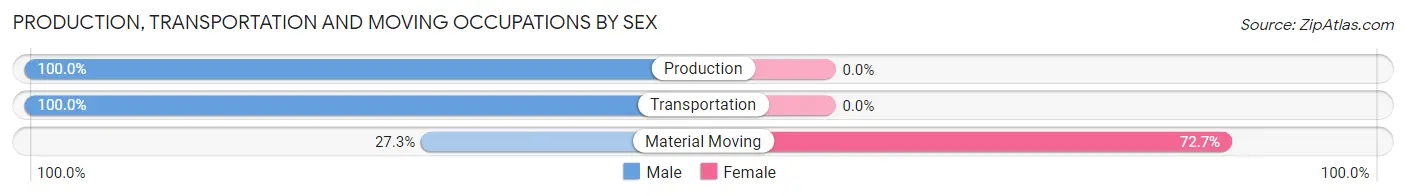
| Occupation | Male | Female |
| Production | 10 (100.0%) | 0 (0.0%) |
| Transportation | 2 (100.0%) | 0 (0.0%) |
| Material Moving | 3 (27.3%) | 8 (72.7%) |
| Total (Category) | 15 (65.2%) | 8 (34.8%) |
| Total (Overall) | 152 (48.2%) | 163 (51.7%) |
Employment Industries by Sex in St Paul
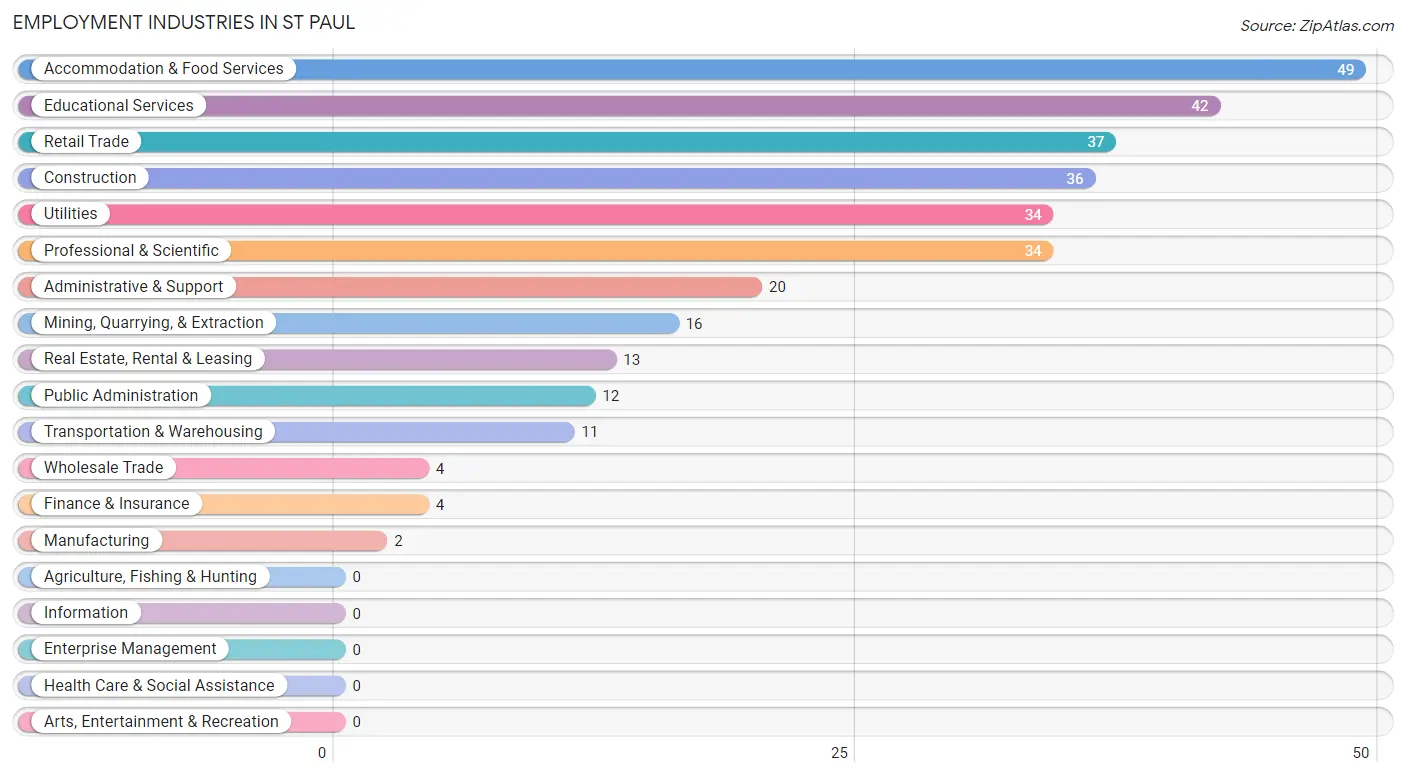
Employment Industries in St Paul
The major employment industries in St Paul include Accommodation & Food Services (49 | 15.6%), Educational Services (42 | 13.3%), Retail Trade (37 | 11.7%), Construction (36 | 11.4%), and Utilities (34 | 10.8%).
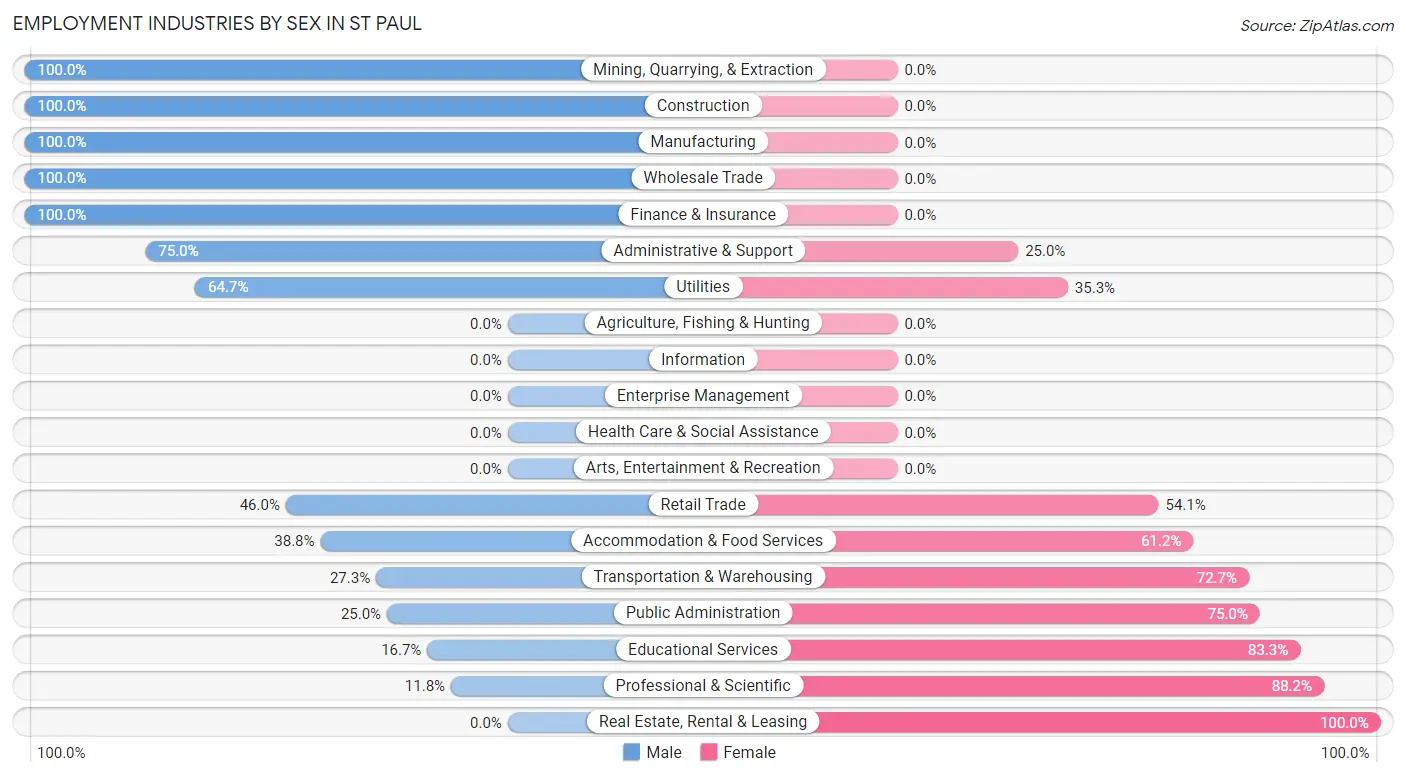
Employment Industries by Sex in St Paul
The St Paul industries that see more men than women are Mining, Quarrying, & Extraction (100.0%), Construction (100.0%), and Manufacturing (100.0%), whereas the industries that tend to have a higher number of women are Real Estate, Rental & Leasing (100.0%), Professional & Scientific (88.2%), and Educational Services (83.3%).
| Industry | Male | Female |
| Agriculture, Fishing & Hunting | 0 (0.0%) | 0 (0.0%) |
| Mining, Quarrying, & Extraction | 16 (100.0%) | 0 (0.0%) |
| Construction | 36 (100.0%) | 0 (0.0%) |
| Manufacturing | 2 (100.0%) | 0 (0.0%) |
| Wholesale Trade | 4 (100.0%) | 0 (0.0%) |
| Retail Trade | 17 (46.0%) | 20 (54.0%) |
| Transportation & Warehousing | 3 (27.3%) | 8 (72.7%) |
| Utilities | 22 (64.7%) | 12 (35.3%) |
| Information | 0 (0.0%) | 0 (0.0%) |
| Finance & Insurance | 4 (100.0%) | 0 (0.0%) |
| Real Estate, Rental & Leasing | 0 (0.0%) | 13 (100.0%) |
| Professional & Scientific | 4 (11.8%) | 30 (88.2%) |
| Enterprise Management | 0 (0.0%) | 0 (0.0%) |
| Administrative & Support | 15 (75.0%) | 5 (25.0%) |
| Educational Services | 7 (16.7%) | 35 (83.3%) |
| Health Care & Social Assistance | 0 (0.0%) | 0 (0.0%) |
| Arts, Entertainment & Recreation | 0 (0.0%) | 0 (0.0%) |
| Accommodation & Food Services | 19 (38.8%) | 30 (61.2%) |
| Public Administration | 3 (25.0%) | 9 (75.0%) |
| Total | 152 (48.2%) | 163 (51.7%) |
Education in St Paul
School Enrollment in St Paul
The most common levels of schooling among the 197 students in St Paul are high school (59 | 29.9%), college / undergraduate (45 | 22.8%), and elementary school (39 | 19.8%).
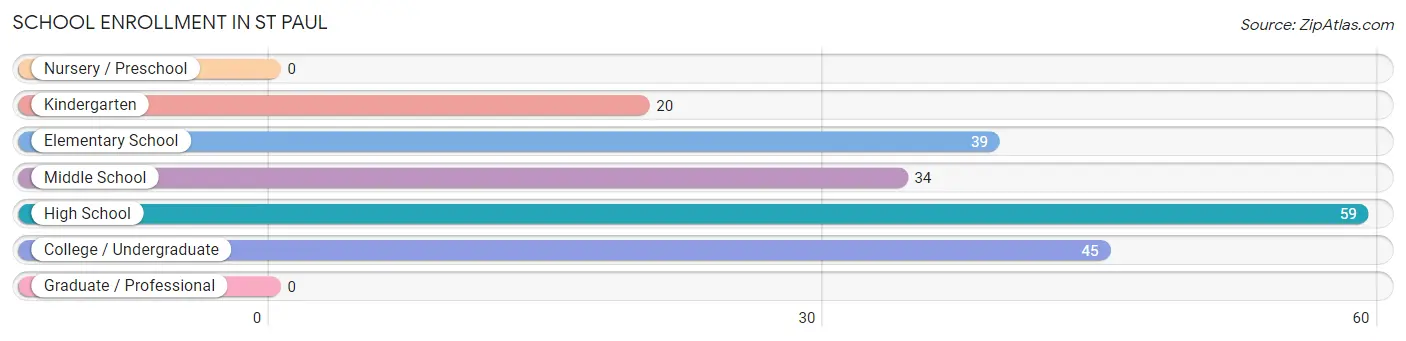
| School Level | # Students | % Students |
| Nursery / Preschool | 0 | 0.0% |
| Kindergarten | 20 | 10.2% |
| Elementary School | 39 | 19.8% |
| Middle School | 34 | 17.3% |
| High School | 59 | 29.9% |
| College / Undergraduate | 45 | 22.8% |
| Graduate / Professional | 0 | 0.0% |
| Total | 197 | 100.0% |
School Enrollment by Age by Funding Source in St Paul
Out of a total of 197 students who are enrolled in schools in St Paul, 46 (23.4%) attend a private institution, while the remaining 151 (76.6%) are enrolled in public schools. The age group of 25 to 34 year olds has the highest likelihood of being enrolled in private schools, with 11 (50.0% in the age bracket) enrolled. Conversely, the age group of 18 to 19 year olds has the lowest likelihood of being enrolled in a private school, with 8 (100.0% in the age bracket) attending a public institution.
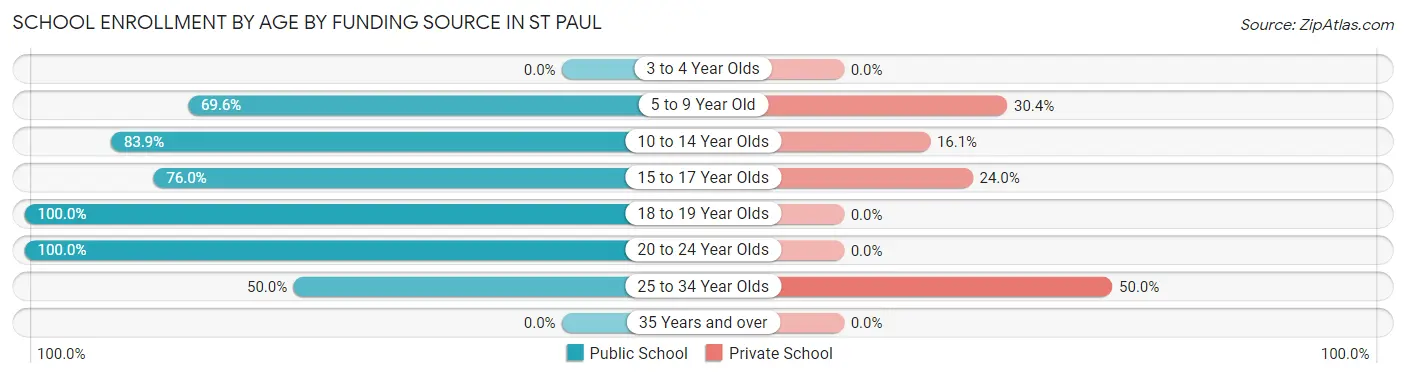
| Age Bracket | Public School | Private School |
| 3 to 4 Year Olds | 0 (0.0%) | 0 (0.0%) |
| 5 to 9 Year Old | 32 (69.6%) | 14 (30.4%) |
| 10 to 14 Year Olds | 47 (83.9%) | 9 (16.1%) |
| 15 to 17 Year Olds | 38 (76.0%) | 12 (24.0%) |
| 18 to 19 Year Olds | 8 (100.0%) | 0 (0.0%) |
| 20 to 24 Year Olds | 15 (100.0%) | 0 (0.0%) |
| 25 to 34 Year Olds | 11 (50.0%) | 11 (50.0%) |
| 35 Years and over | 0 (0.0%) | 0 (0.0%) |
| Total | 151 (76.6%) | 46 (23.4%) |
Educational Attainment by Field of Study in St Paul
Business (54 | 28.6%), education (50 | 26.5%), science & technology (38 | 20.1%), bio, nature & agricultural (14 | 7.4%), and computers & mathematics (10 | 5.3%) are the most common fields of study among 189 individuals in St Paul who have obtained a bachelor's degree or higher.
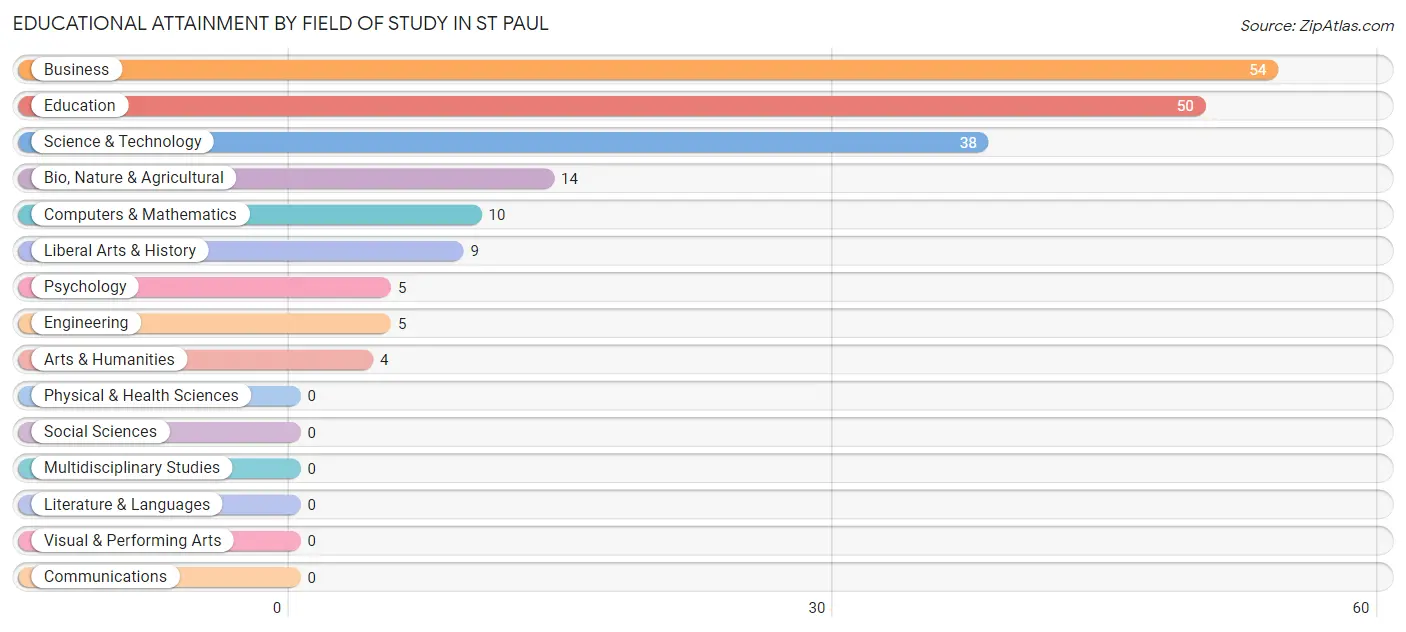
| Field of Study | # Graduates | % Graduates |
| Computers & Mathematics | 10 | 5.3% |
| Bio, Nature & Agricultural | 14 | 7.4% |
| Physical & Health Sciences | 0 | 0.0% |
| Psychology | 5 | 2.6% |
| Social Sciences | 0 | 0.0% |
| Engineering | 5 | 2.6% |
| Multidisciplinary Studies | 0 | 0.0% |
| Science & Technology | 38 | 20.1% |
| Business | 54 | 28.6% |
| Education | 50 | 26.5% |
| Literature & Languages | 0 | 0.0% |
| Liberal Arts & History | 9 | 4.8% |
| Visual & Performing Arts | 0 | 0.0% |
| Communications | 0 | 0.0% |
| Arts & Humanities | 4 | 2.1% |
| Total | 189 | 100.0% |
Transportation & Commute in St Paul
Vehicle Availability by Sex in St Paul
The most prevalent vehicle ownership categories in St Paul are males with 2 vehicles (56, accounting for 36.8%) and females with 2 vehicles (68, making up 35.0%).
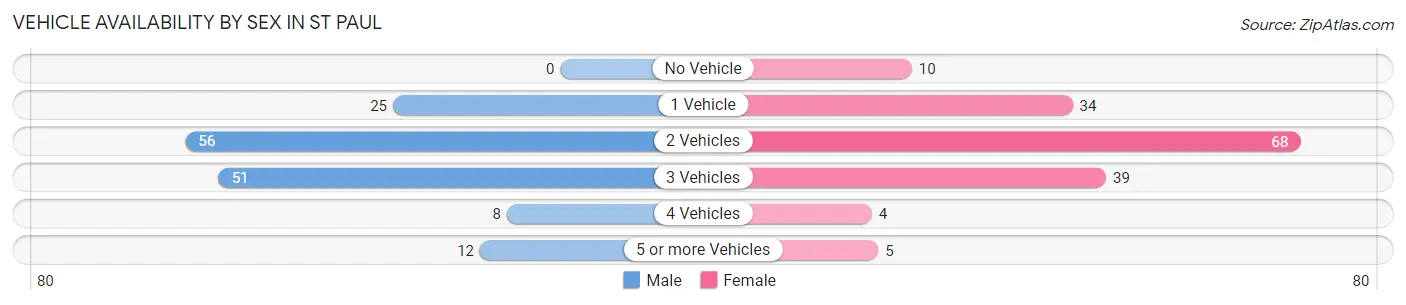
| Vehicles Available | Male | Female |
| No Vehicle | 0 (0.0%) | 10 (6.2%) |
| 1 Vehicle | 25 (16.5%) | 34 (21.2%) |
| 2 Vehicles | 56 (36.8%) | 68 (42.5%) |
| 3 Vehicles | 51 (33.6%) | 39 (24.4%) |
| 4 Vehicles | 8 (5.3%) | 4 (2.5%) |
| 5 or more Vehicles | 12 (7.9%) | 5 (3.1%) |
| Total | 152 (100.0%) | 160 (100.0%) |
Commute Time in St Paul
The most frequently occuring commute durations in St Paul are 10 to 14 minutes (84 commuters, 29.9%), 5 to 9 minutes (44 commuters, 15.7%), and 30 to 34 minutes (40 commuters, 14.2%).
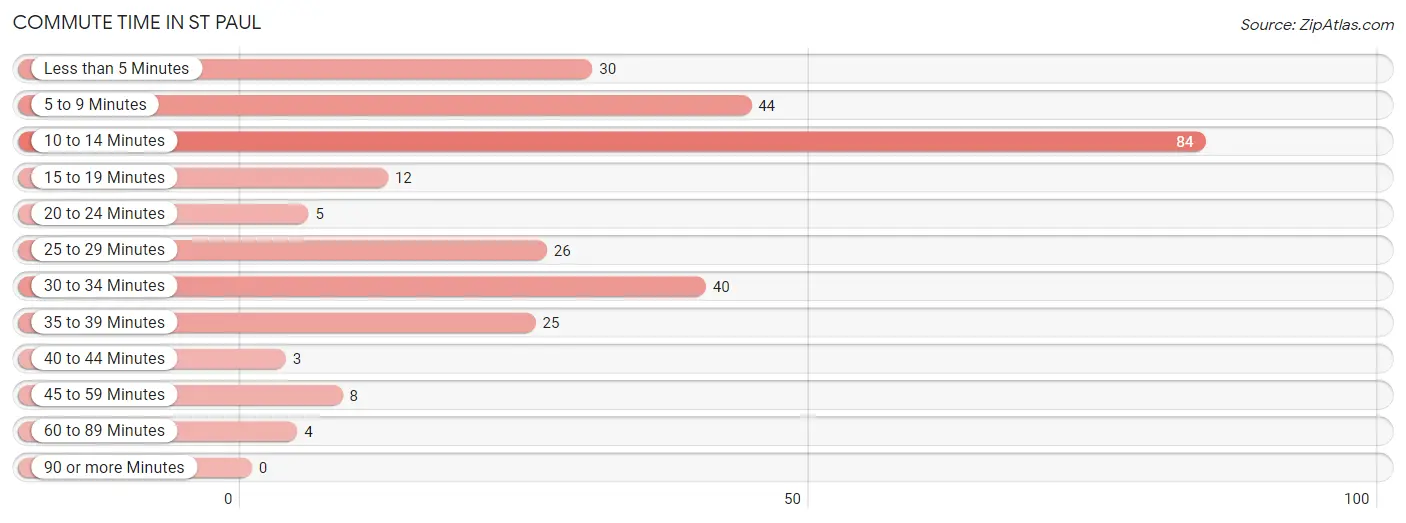
| Commute Time | # Commuters | % Commuters |
| Less than 5 Minutes | 30 | 10.7% |
| 5 to 9 Minutes | 44 | 15.7% |
| 10 to 14 Minutes | 84 | 29.9% |
| 15 to 19 Minutes | 12 | 4.3% |
| 20 to 24 Minutes | 5 | 1.8% |
| 25 to 29 Minutes | 26 | 9.2% |
| 30 to 34 Minutes | 40 | 14.2% |
| 35 to 39 Minutes | 25 | 8.9% |
| 40 to 44 Minutes | 3 | 1.1% |
| 45 to 59 Minutes | 8 | 2.9% |
| 60 to 89 Minutes | 4 | 1.4% |
| 90 or more Minutes | 0 | 0.0% |
Commute Time by Sex in St Paul
The most common commute times in St Paul are 10 to 14 minutes (44 commuters, 31.0%) for males and 10 to 14 minutes (40 commuters, 28.8%) for females.
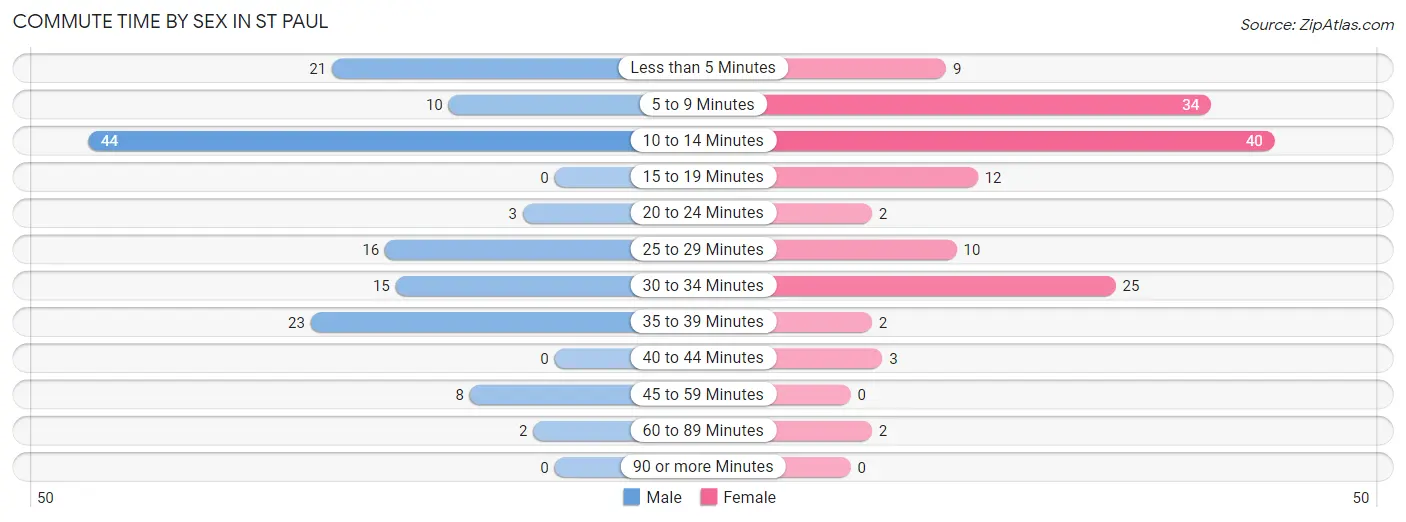
| Commute Time | Male | Female |
| Less than 5 Minutes | 21 (14.8%) | 9 (6.5%) |
| 5 to 9 Minutes | 10 (7.0%) | 34 (24.5%) |
| 10 to 14 Minutes | 44 (31.0%) | 40 (28.8%) |
| 15 to 19 Minutes | 0 (0.0%) | 12 (8.6%) |
| 20 to 24 Minutes | 3 (2.1%) | 2 (1.4%) |
| 25 to 29 Minutes | 16 (11.3%) | 10 (7.2%) |
| 30 to 34 Minutes | 15 (10.6%) | 25 (18.0%) |
| 35 to 39 Minutes | 23 (16.2%) | 2 (1.4%) |
| 40 to 44 Minutes | 0 (0.0%) | 3 (2.2%) |
| 45 to 59 Minutes | 8 (5.6%) | 0 (0.0%) |
| 60 to 89 Minutes | 2 (1.4%) | 2 (1.4%) |
| 90 or more Minutes | 0 (0.0%) | 0 (0.0%) |
Time of Departure to Work by Sex in St Paul
The most frequent times of departure to work in St Paul are 5:30 AM to 5:59 AM (34, 23.9%) for males and 7:30 AM to 7:59 AM (44, 31.7%) for females.
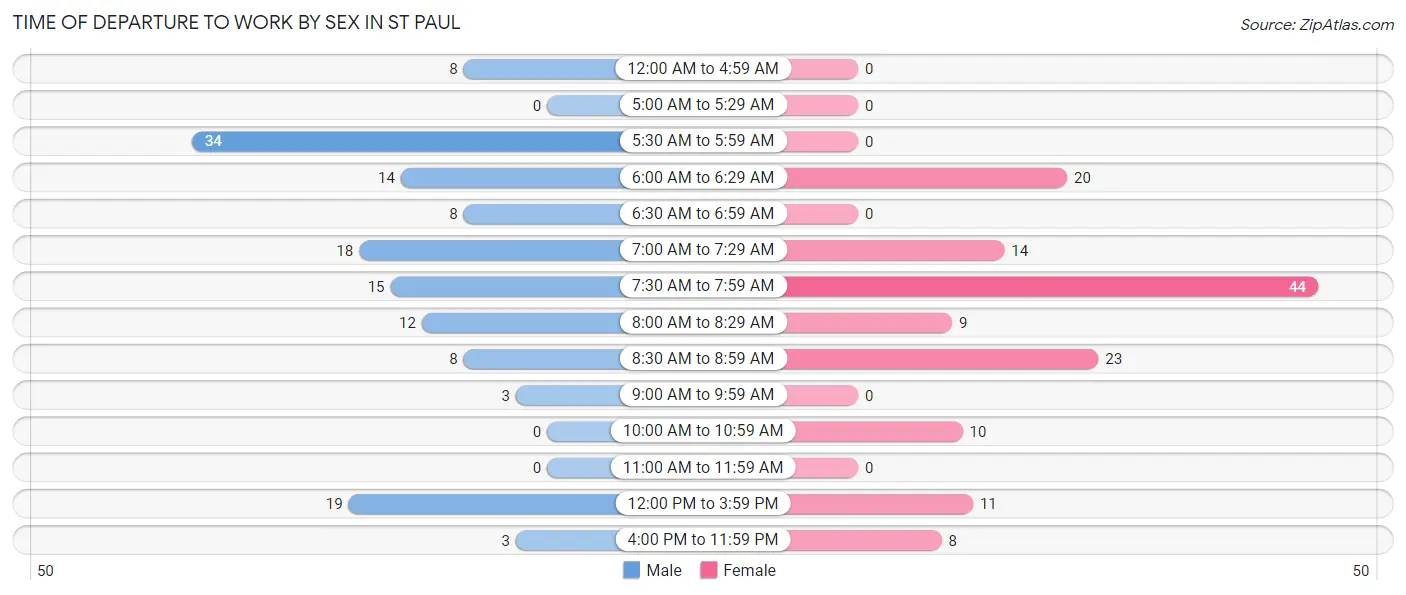
| Time of Departure | Male | Female |
| 12:00 AM to 4:59 AM | 8 (5.6%) | 0 (0.0%) |
| 5:00 AM to 5:29 AM | 0 (0.0%) | 0 (0.0%) |
| 5:30 AM to 5:59 AM | 34 (23.9%) | 0 (0.0%) |
| 6:00 AM to 6:29 AM | 14 (9.9%) | 20 (14.4%) |
| 6:30 AM to 6:59 AM | 8 (5.6%) | 0 (0.0%) |
| 7:00 AM to 7:29 AM | 18 (12.7%) | 14 (10.1%) |
| 7:30 AM to 7:59 AM | 15 (10.6%) | 44 (31.7%) |
| 8:00 AM to 8:29 AM | 12 (8.5%) | 9 (6.5%) |
| 8:30 AM to 8:59 AM | 8 (5.6%) | 23 (16.6%) |
| 9:00 AM to 9:59 AM | 3 (2.1%) | 0 (0.0%) |
| 10:00 AM to 10:59 AM | 0 (0.0%) | 10 (7.2%) |
| 11:00 AM to 11:59 AM | 0 (0.0%) | 0 (0.0%) |
| 12:00 PM to 3:59 PM | 19 (13.4%) | 11 (7.9%) |
| 4:00 PM to 11:59 PM | 3 (2.1%) | 8 (5.8%) |
| Total | 142 (100.0%) | 139 (100.0%) |
Housing Occupancy in St Paul
Occupancy by Ownership in St Paul
Of the total 481 dwellings in St Paul, owner-occupied units account for 289 (60.1%), while renter-occupied units make up 192 (39.9%).
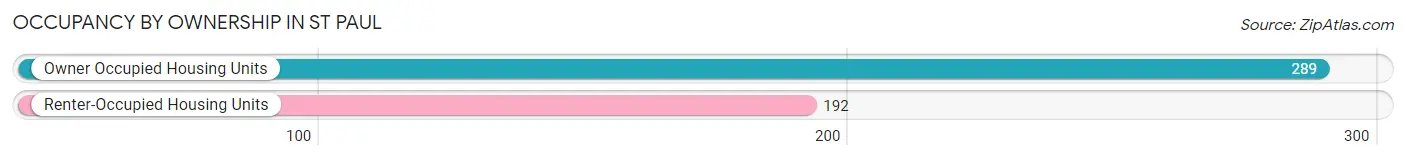
| Occupancy | # Housing Units | % Housing Units |
| Owner Occupied Housing Units | 289 | 60.1% |
| Renter-Occupied Housing Units | 192 | 39.9% |
| Total Occupied Housing Units | 481 | 100.0% |
Occupancy by Household Size in St Paul
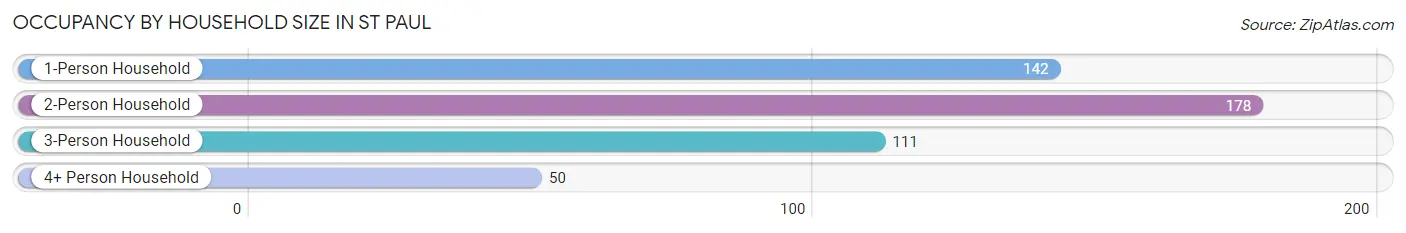
| Household Size | # Housing Units | % Housing Units |
| 1-Person Household | 142 | 29.5% |
| 2-Person Household | 178 | 37.0% |
| 3-Person Household | 111 | 23.1% |
| 4+ Person Household | 50 | 10.4% |
| Total Housing Units | 481 | 100.0% |
Occupancy by Ownership by Household Size in St Paul
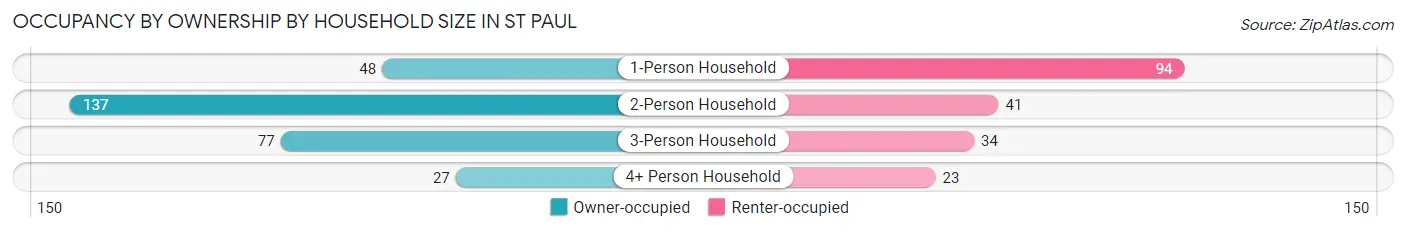
| Household Size | Owner-occupied | Renter-occupied |
| 1-Person Household | 48 (33.8%) | 94 (66.2%) |
| 2-Person Household | 137 (77.0%) | 41 (23.0%) |
| 3-Person Household | 77 (69.4%) | 34 (30.6%) |
| 4+ Person Household | 27 (54.0%) | 23 (46.0%) |
| Total Housing Units | 289 (60.1%) | 192 (39.9%) |
Occupancy by Educational Attainment in St Paul
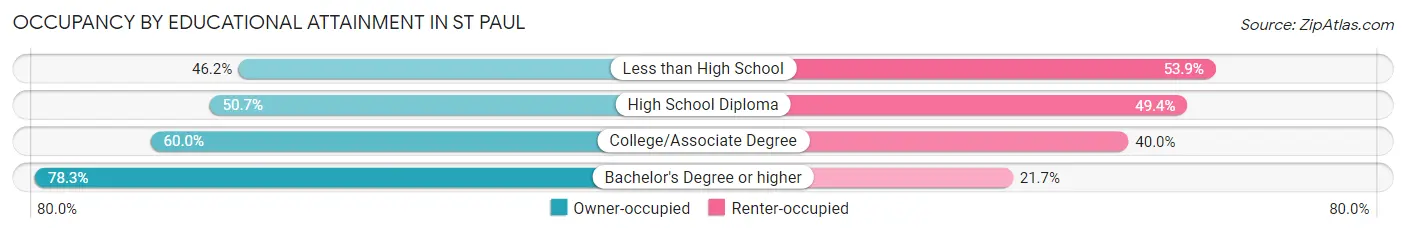
| Household Size | Owner-occupied | Renter-occupied |
| Less than High School | 48 (46.2%) | 56 (53.8%) |
| High School Diploma | 39 (50.6%) | 38 (49.3%) |
| College/Associate Degree | 108 (60.0%) | 72 (40.0%) |
| Bachelor's Degree or higher | 94 (78.3%) | 26 (21.7%) |
Occupancy by Age of Householder in St Paul
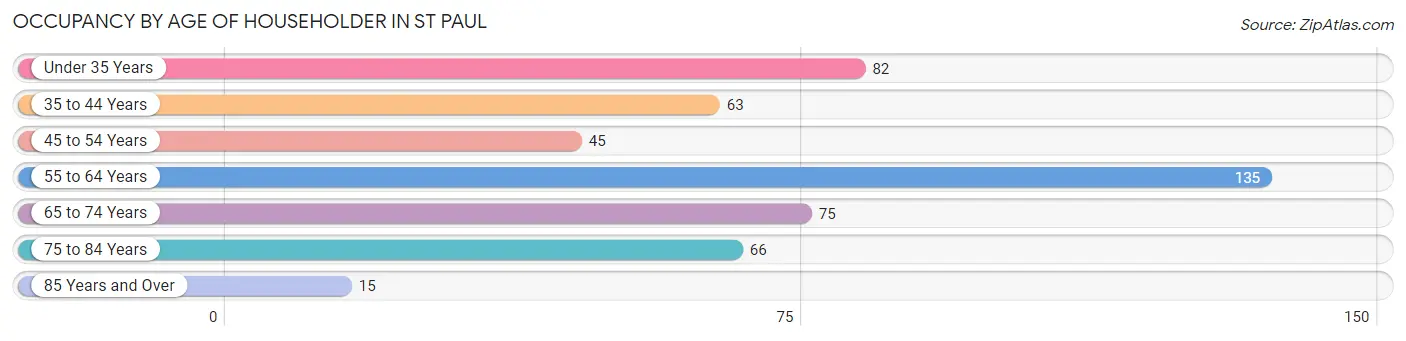
| Age Bracket | # Households | % Households |
| Under 35 Years | 82 | 17.1% |
| 35 to 44 Years | 63 | 13.1% |
| 45 to 54 Years | 45 | 9.4% |
| 55 to 64 Years | 135 | 28.1% |
| 65 to 74 Years | 75 | 15.6% |
| 75 to 84 Years | 66 | 13.7% |
| 85 Years and Over | 15 | 3.1% |
| Total | 481 | 100.0% |
Housing Finances in St Paul
Median Income by Occupancy in St Paul
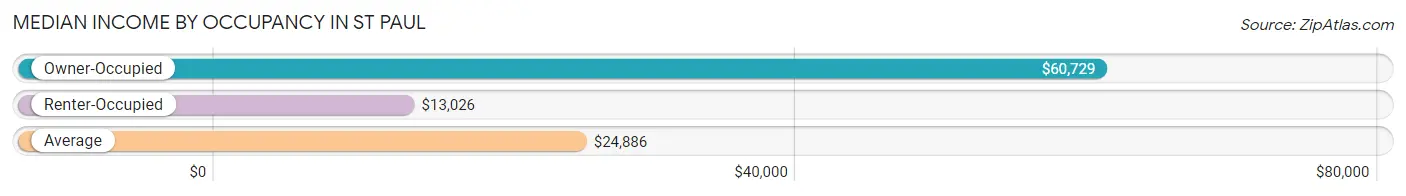
| Occupancy Type | # Households | Median Income |
| Owner-Occupied | 289 (60.1%) | $60,729 |
| Renter-Occupied | 192 (39.9%) | $13,026 |
| Average | 481 (100.0%) | $24,886 |
Occupancy by Householder Income Bracket in St Paul
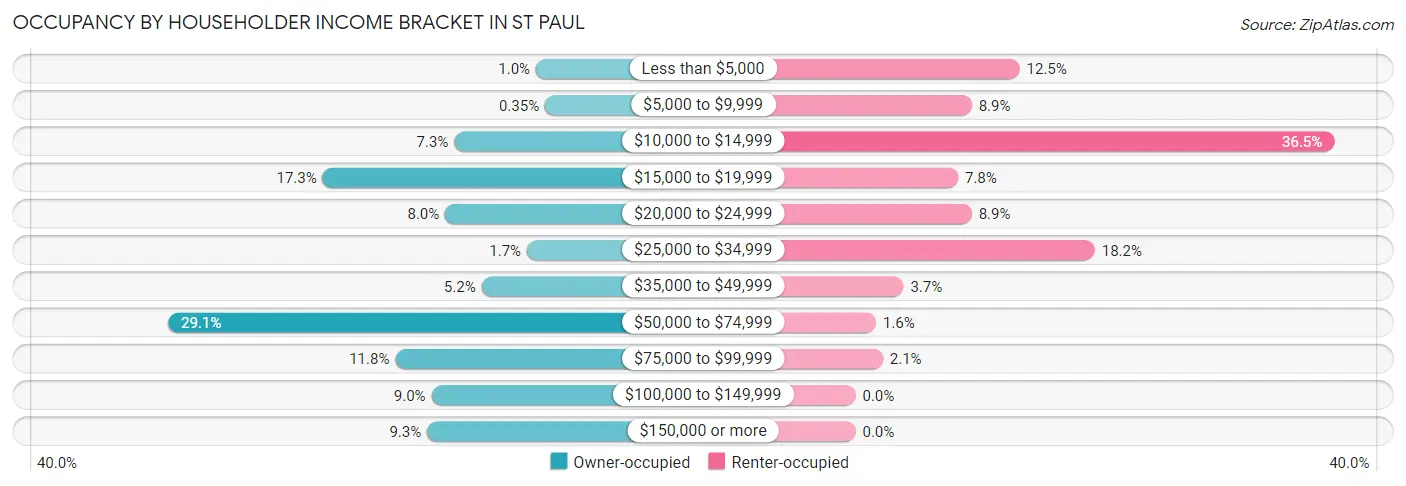
| Income Bracket | Owner-occupied | Renter-occupied |
| Less than $5,000 | 3 (1.0%) | 24 (12.5%) |
| $5,000 to $9,999 | 1 (0.4%) | 17 (8.8%) |
| $10,000 to $14,999 | 21 (7.3%) | 70 (36.5%) |
| $15,000 to $19,999 | 50 (17.3%) | 15 (7.8%) |
| $20,000 to $24,999 | 23 (8.0%) | 17 (8.8%) |
| $25,000 to $34,999 | 5 (1.7%) | 35 (18.2%) |
| $35,000 to $49,999 | 15 (5.2%) | 7 (3.6%) |
| $50,000 to $74,999 | 84 (29.1%) | 3 (1.6%) |
| $75,000 to $99,999 | 34 (11.8%) | 4 (2.1%) |
| $100,000 to $149,999 | 26 (9.0%) | 0 (0.0%) |
| $150,000 or more | 27 (9.3%) | 0 (0.0%) |
| Total | 289 (100.0%) | 192 (100.0%) |
Monthly Housing Cost Tiers in St Paul
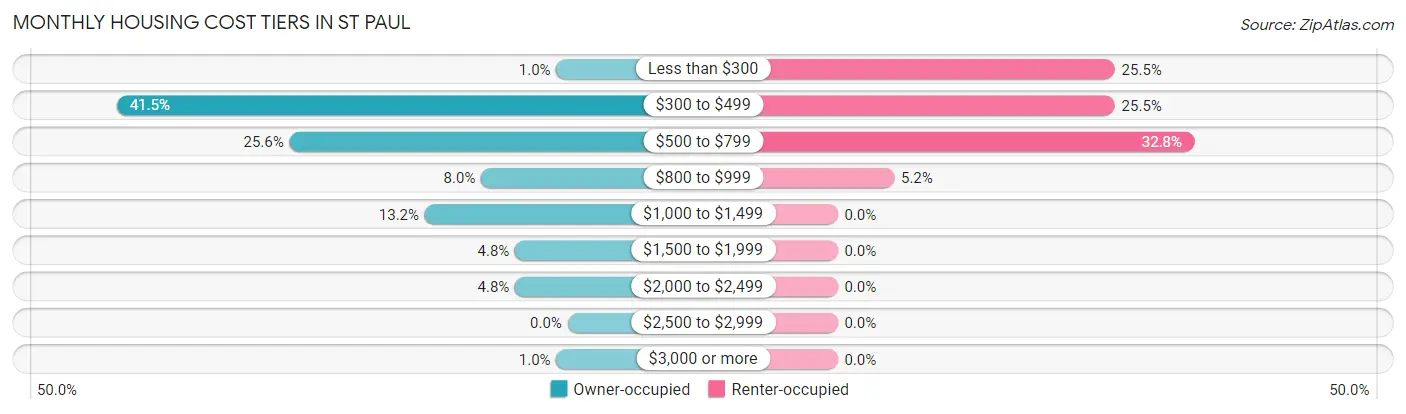
| Monthly Cost | Owner-occupied | Renter-occupied |
| Less than $300 | 3 (1.0%) | 49 (25.5%) |
| $300 to $499 | 120 (41.5%) | 49 (25.5%) |
| $500 to $799 | 74 (25.6%) | 63 (32.8%) |
| $800 to $999 | 23 (8.0%) | 10 (5.2%) |
| $1,000 to $1,499 | 38 (13.2%) | 0 (0.0%) |
| $1,500 to $1,999 | 14 (4.8%) | 0 (0.0%) |
| $2,000 to $2,499 | 14 (4.8%) | 0 (0.0%) |
| $2,500 to $2,999 | 0 (0.0%) | 0 (0.0%) |
| $3,000 or more | 3 (1.0%) | 0 (0.0%) |
| Total | 289 (100.0%) | 192 (100.0%) |
Physical Housing Characteristics in St Paul
Housing Structures in St Paul

| Structure Type | # Housing Units | % Housing Units |
| Single Unit, Detached | 304 | 63.2% |
| Single Unit, Attached | 0 | 0.0% |
| 2 Unit Apartments | 11 | 2.3% |
| 3 or 4 Unit Apartments | 15 | 3.1% |
| 5 to 9 Unit Apartments | 106 | 22.0% |
| 10 or more Apartments | 32 | 6.7% |
| Mobile Home / Other | 13 | 2.7% |
| Total | 481 | 100.0% |
Housing Structures by Occupancy in St Paul
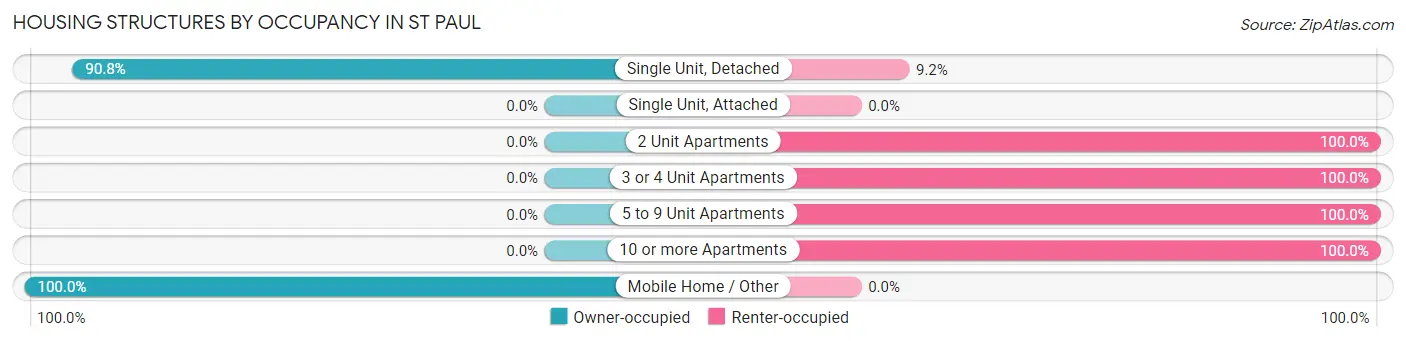
| Structure Type | Owner-occupied | Renter-occupied |
| Single Unit, Detached | 276 (90.8%) | 28 (9.2%) |
| Single Unit, Attached | 0 (0.0%) | 0 (0.0%) |
| 2 Unit Apartments | 0 (0.0%) | 11 (100.0%) |
| 3 or 4 Unit Apartments | 0 (0.0%) | 15 (100.0%) |
| 5 to 9 Unit Apartments | 0 (0.0%) | 106 (100.0%) |
| 10 or more Apartments | 0 (0.0%) | 32 (100.0%) |
| Mobile Home / Other | 13 (100.0%) | 0 (0.0%) |
| Total | 289 (60.1%) | 192 (39.9%) |
Housing Structures by Number of Rooms in St Paul
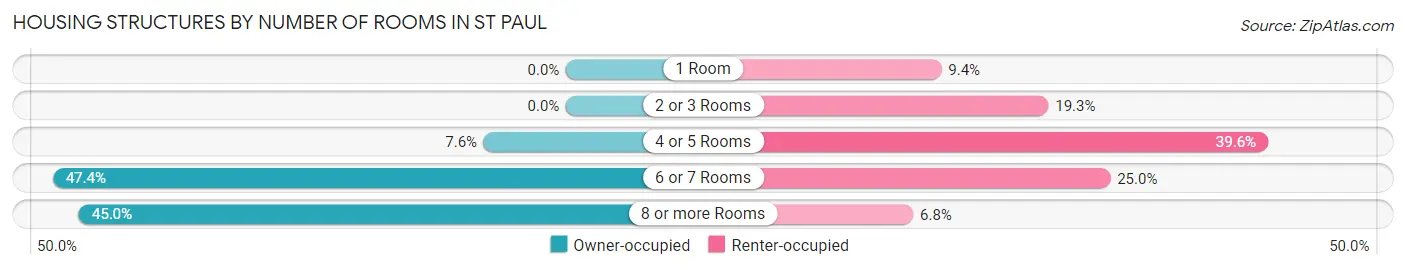
| Number of Rooms | Owner-occupied | Renter-occupied |
| 1 Room | 0 (0.0%) | 18 (9.4%) |
| 2 or 3 Rooms | 0 (0.0%) | 37 (19.3%) |
| 4 or 5 Rooms | 22 (7.6%) | 76 (39.6%) |
| 6 or 7 Rooms | 137 (47.4%) | 48 (25.0%) |
| 8 or more Rooms | 130 (45.0%) | 13 (6.8%) |
| Total | 289 (100.0%) | 192 (100.0%) |
Housing Structure by Heating Type in St Paul
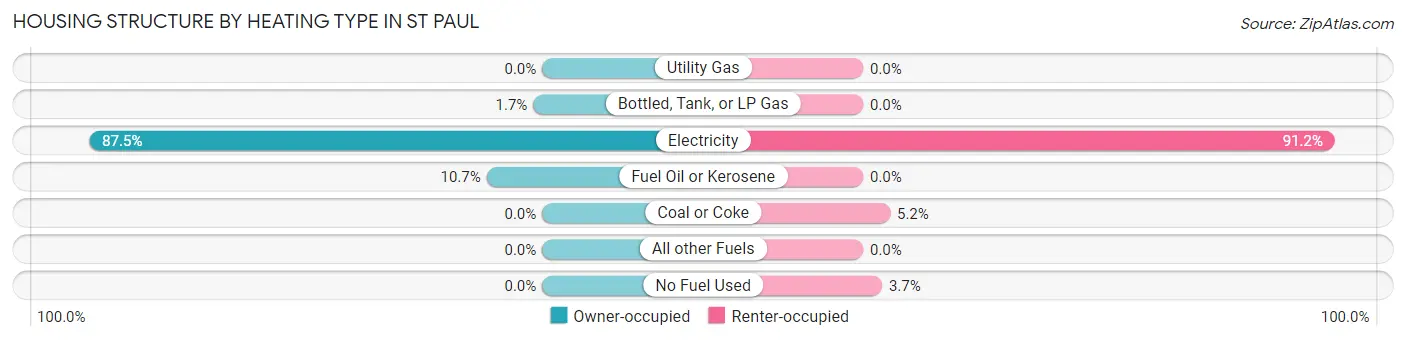
| Heating Type | Owner-occupied | Renter-occupied |
| Utility Gas | 0 (0.0%) | 0 (0.0%) |
| Bottled, Tank, or LP Gas | 5 (1.7%) | 0 (0.0%) |
| Electricity | 253 (87.5%) | 175 (91.1%) |
| Fuel Oil or Kerosene | 31 (10.7%) | 0 (0.0%) |
| Coal or Coke | 0 (0.0%) | 10 (5.2%) |
| All other Fuels | 0 (0.0%) | 0 (0.0%) |
| No Fuel Used | 0 (0.0%) | 7 (3.6%) |
| Total | 289 (100.0%) | 192 (100.0%) |
Household Vehicle Usage in St Paul
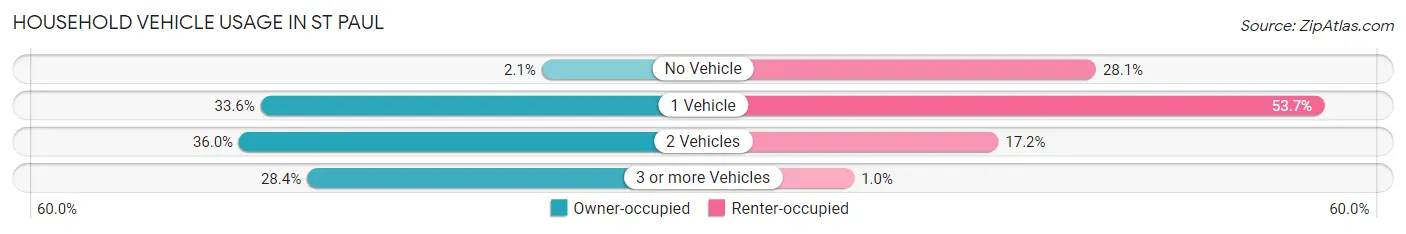
| Vehicles per Household | Owner-occupied | Renter-occupied |
| No Vehicle | 6 (2.1%) | 54 (28.1%) |
| 1 Vehicle | 97 (33.6%) | 103 (53.6%) |
| 2 Vehicles | 104 (36.0%) | 33 (17.2%) |
| 3 or more Vehicles | 82 (28.4%) | 2 (1.0%) |
| Total | 289 (100.0%) | 192 (100.0%) |
Real Estate & Mortgages in St Paul
Real Estate and Mortgage Overview in St Paul
| Characteristic | Without Mortgage | With Mortgage |
| Housing Units | 170 | 119 |
| Median Property Value | $157,600 | $195,500 |
| Median Household Income | - | - |
| Monthly Housing Costs | $452 | $3 |
| Real Estate Taxes | $1,104 | $0 |
Property Value by Mortgage Status in St Paul
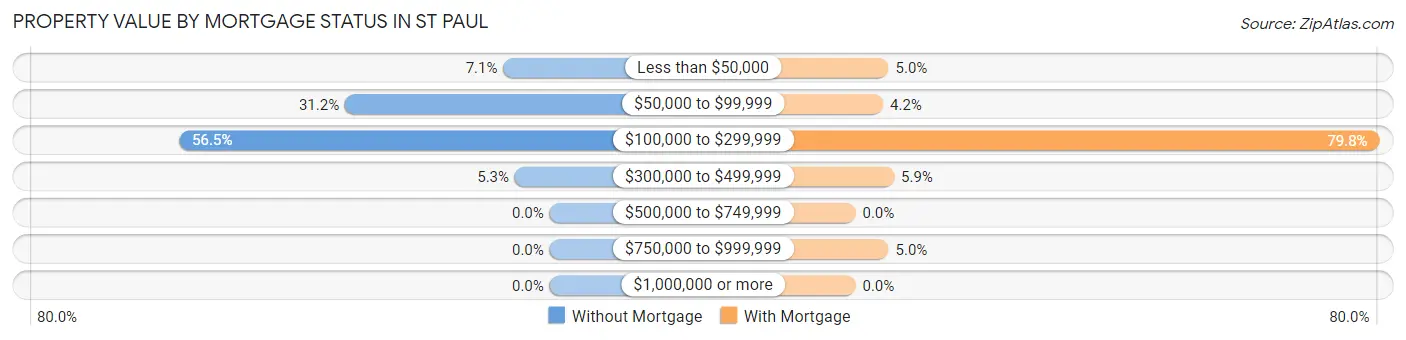
| Property Value | Without Mortgage | With Mortgage |
| Less than $50,000 | 12 (7.1%) | 6 (5.0%) |
| $50,000 to $99,999 | 53 (31.2%) | 5 (4.2%) |
| $100,000 to $299,999 | 96 (56.5%) | 95 (79.8%) |
| $300,000 to $499,999 | 9 (5.3%) | 7 (5.9%) |
| $500,000 to $749,999 | 0 (0.0%) | 0 (0.0%) |
| $750,000 to $999,999 | 0 (0.0%) | 6 (5.0%) |
| $1,000,000 or more | 0 (0.0%) | 0 (0.0%) |
| Total | 170 (100.0%) | 119 (100.0%) |
Household Income by Mortgage Status in St Paul
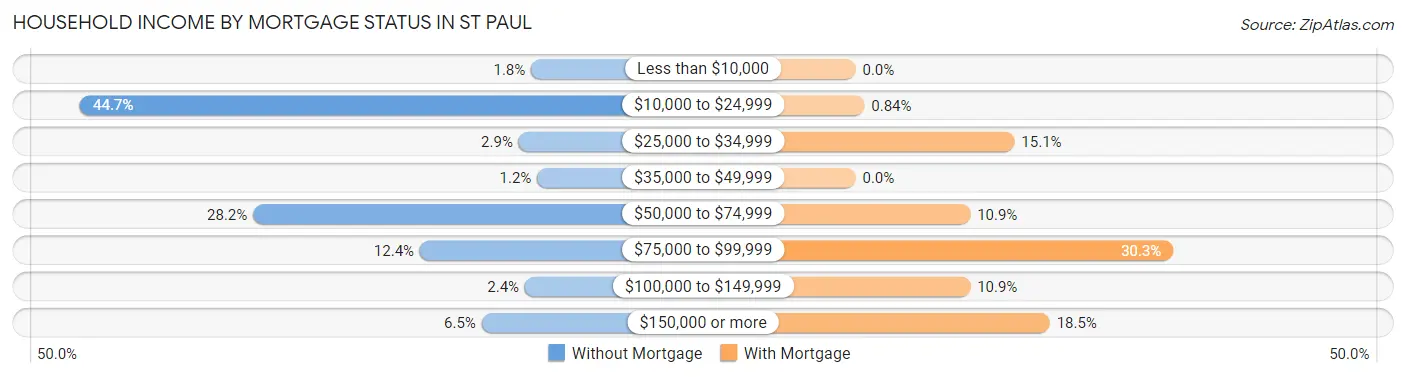
| Household Income | Without Mortgage | With Mortgage |
| Less than $10,000 | 3 (1.8%) | 0 (0.0%) |
| $10,000 to $24,999 | 76 (44.7%) | 1 (0.8%) |
| $25,000 to $34,999 | 5 (2.9%) | 18 (15.1%) |
| $35,000 to $49,999 | 2 (1.2%) | 0 (0.0%) |
| $50,000 to $74,999 | 48 (28.2%) | 13 (10.9%) |
| $75,000 to $99,999 | 21 (12.3%) | 36 (30.2%) |
| $100,000 to $149,999 | 4 (2.4%) | 13 (10.9%) |
| $150,000 or more | 11 (6.5%) | 22 (18.5%) |
| Total | 170 (100.0%) | 119 (100.0%) |
Property Value to Household Income Ratio in St Paul
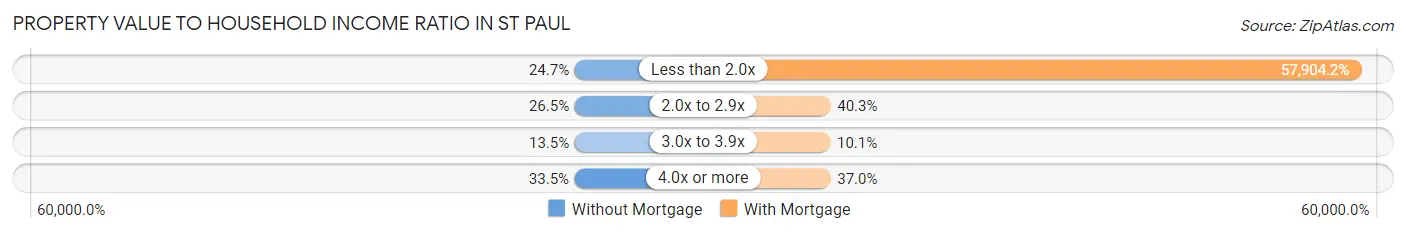
| Value-to-Income Ratio | Without Mortgage | With Mortgage |
| Less than 2.0x | 42 (24.7%) | 68,906 (57,904.2%) |
| 2.0x to 2.9x | 45 (26.5%) | 48 (40.3%) |
| 3.0x to 3.9x | 23 (13.5%) | 12 (10.1%) |
| 4.0x or more | 57 (33.5%) | 44 (37.0%) |
| Total | 170 (100.0%) | 119 (100.0%) |
Real Estate Taxes by Mortgage Status in St Paul
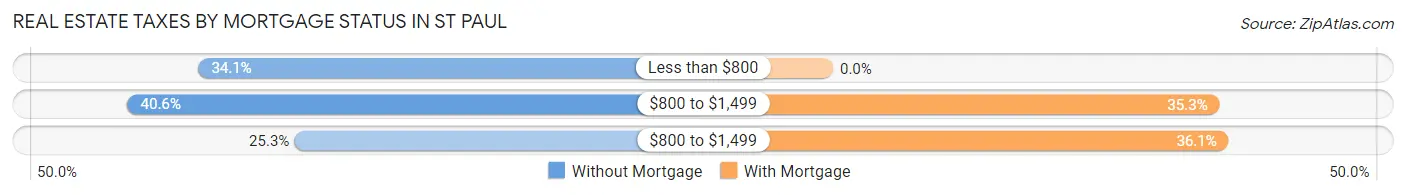
| Property Taxes | Without Mortgage | With Mortgage |
| Less than $800 | 58 (34.1%) | 0 (0.0%) |
| $800 to $1,499 | 69 (40.6%) | 42 (35.3%) |
| $800 to $1,499 | 43 (25.3%) | 43 (36.1%) |
| Total | 170 (100.0%) | 119 (100.0%) |
Health & Disability in St Paul
Health Insurance Coverage by Age in St Paul
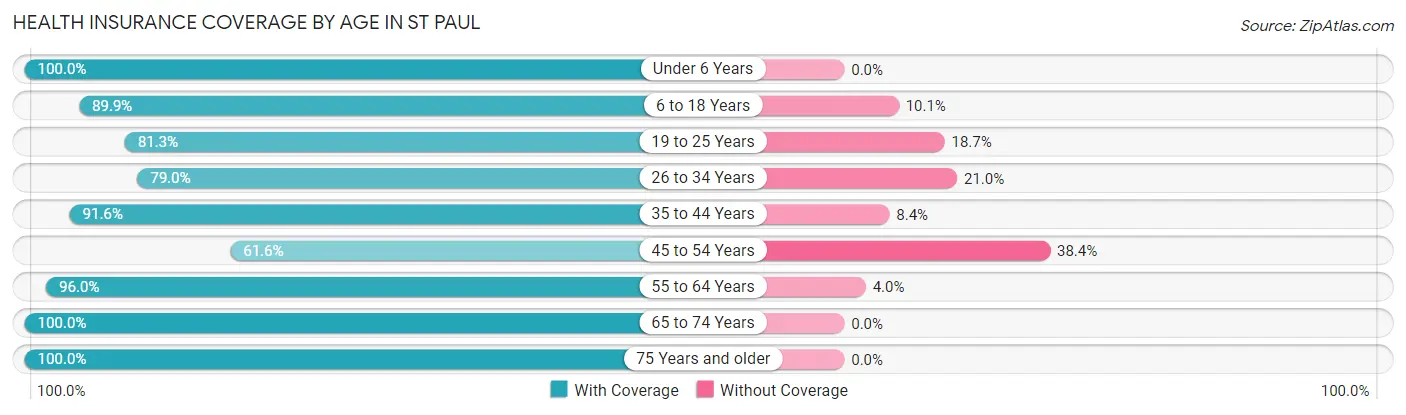
| Age Bracket | With Coverage | Without Coverage |
| Under 6 Years | 59 (100.0%) | 0 (0.0%) |
| 6 to 18 Years | 133 (89.9%) | 15 (10.1%) |
| 19 to 25 Years | 87 (81.3%) | 20 (18.7%) |
| 26 to 34 Years | 124 (79.0%) | 33 (21.0%) |
| 35 to 44 Years | 109 (91.6%) | 10 (8.4%) |
| 45 to 54 Years | 53 (61.6%) | 33 (38.4%) |
| 55 to 64 Years | 192 (96.0%) | 8 (4.0%) |
| 65 to 74 Years | 100 (100.0%) | 0 (0.0%) |
| 75 Years and older | 153 (100.0%) | 0 (0.0%) |
| Total | 1,010 (89.5%) | 119 (10.5%) |
Health Insurance Coverage by Citizenship Status in St Paul
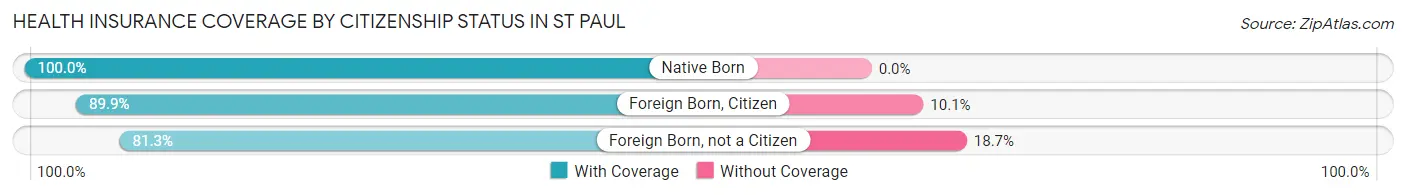
| Citizenship Status | With Coverage | Without Coverage |
| Native Born | 59 (100.0%) | 0 (0.0%) |
| Foreign Born, Citizen | 133 (89.9%) | 15 (10.1%) |
| Foreign Born, not a Citizen | 87 (81.3%) | 20 (18.7%) |
Health Insurance Coverage by Household Income in St Paul
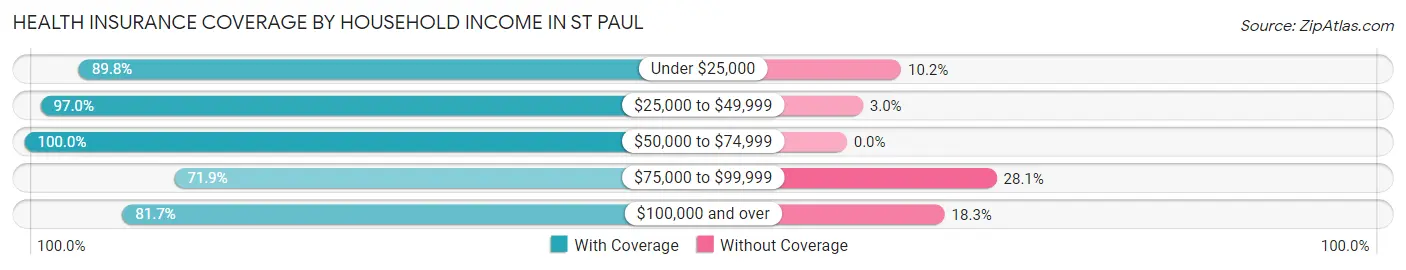
| Household Income | With Coverage | Without Coverage |
| Under $25,000 | 441 (89.8%) | 50 (10.2%) |
| $25,000 to $49,999 | 129 (97.0%) | 4 (3.0%) |
| $50,000 to $74,999 | 211 (100.0%) | 0 (0.0%) |
| $75,000 to $99,999 | 82 (71.9%) | 32 (28.1%) |
| $100,000 and over | 147 (81.7%) | 33 (18.3%) |
Public vs Private Health Insurance Coverage by Age in St Paul
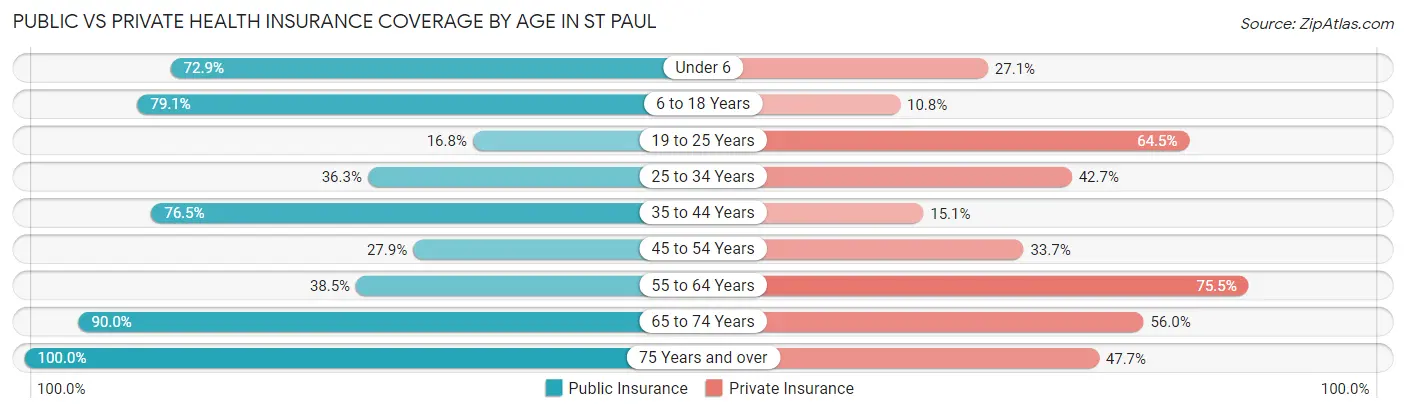
| Age Bracket | Public Insurance | Private Insurance |
| Under 6 | 43 (72.9%) | 16 (27.1%) |
| 6 to 18 Years | 117 (79.0%) | 16 (10.8%) |
| 19 to 25 Years | 18 (16.8%) | 69 (64.5%) |
| 25 to 34 Years | 57 (36.3%) | 67 (42.7%) |
| 35 to 44 Years | 91 (76.5%) | 18 (15.1%) |
| 45 to 54 Years | 24 (27.9%) | 29 (33.7%) |
| 55 to 64 Years | 77 (38.5%) | 151 (75.5%) |
| 65 to 74 Years | 90 (90.0%) | 56 (56.0%) |
| 75 Years and over | 153 (100.0%) | 73 (47.7%) |
| Total | 670 (59.3%) | 495 (43.8%) |
Disability Status by Sex by Age in St Paul
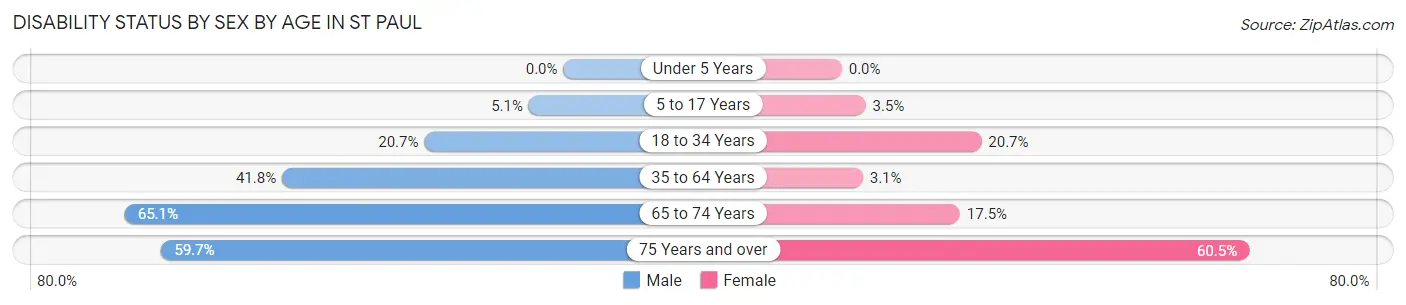
| Age Bracket | Male | Female |
| Under 5 Years | 0 (0.0%) | 0 (0.0%) |
| 5 to 17 Years | 4 (5.1%) | 3 (3.5%) |
| 18 to 34 Years | 32 (20.6%) | 23 (20.7%) |
| 35 to 64 Years | 89 (41.8%) | 6 (3.1%) |
| 65 to 74 Years | 28 (65.1%) | 10 (17.5%) |
| 75 Years and over | 40 (59.7%) | 52 (60.5%) |
Disability Class by Sex by Age in St Paul
Disability Class: Hearing Difficulty
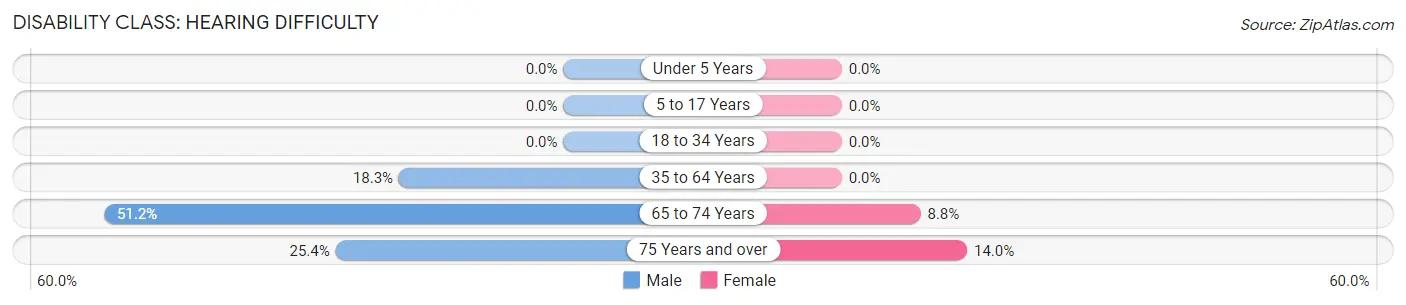
| Age Bracket | Male | Female |
| Under 5 Years | 0 (0.0%) | 0 (0.0%) |
| 5 to 17 Years | 0 (0.0%) | 0 (0.0%) |
| 18 to 34 Years | 0 (0.0%) | 0 (0.0%) |
| 35 to 64 Years | 39 (18.3%) | 0 (0.0%) |
| 65 to 74 Years | 22 (51.2%) | 5 (8.8%) |
| 75 Years and over | 17 (25.4%) | 12 (14.0%) |
Disability Class: Vision Difficulty
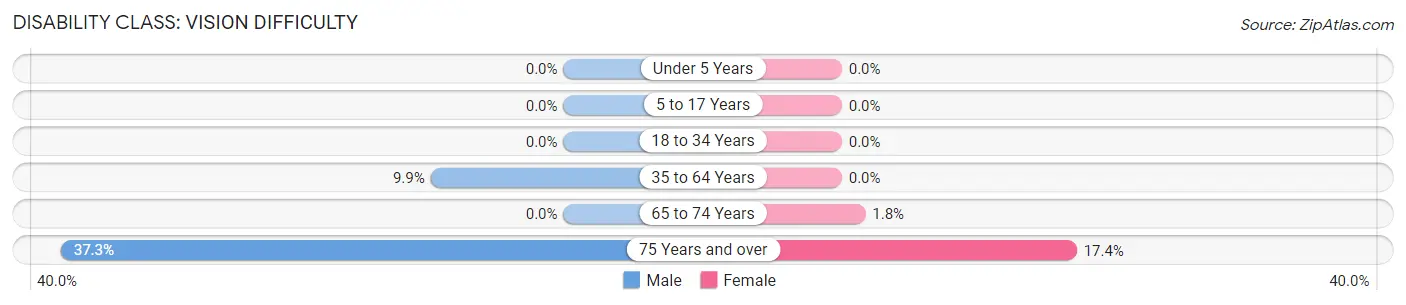
| Age Bracket | Male | Female |
| Under 5 Years | 0 (0.0%) | 0 (0.0%) |
| 5 to 17 Years | 0 (0.0%) | 0 (0.0%) |
| 18 to 34 Years | 0 (0.0%) | 0 (0.0%) |
| 35 to 64 Years | 21 (9.9%) | 0 (0.0%) |
| 65 to 74 Years | 0 (0.0%) | 1 (1.8%) |
| 75 Years and over | 25 (37.3%) | 15 (17.4%) |
Disability Class: Cognitive Difficulty
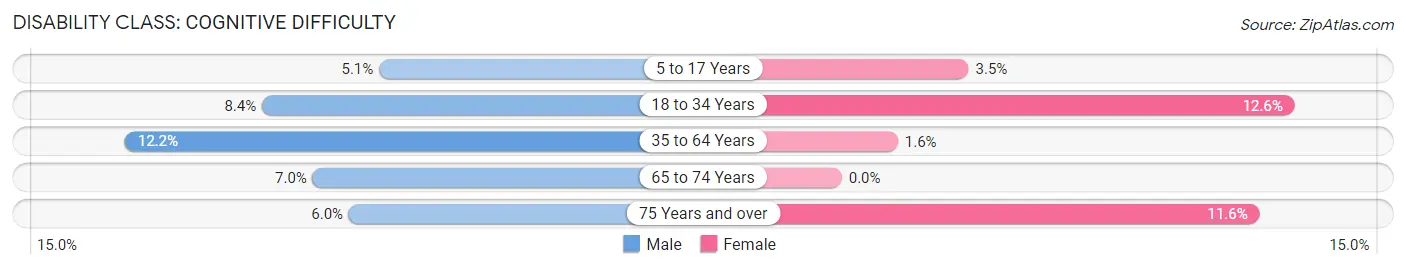
| Age Bracket | Male | Female |
| 5 to 17 Years | 4 (5.1%) | 3 (3.5%) |
| 18 to 34 Years | 13 (8.4%) | 14 (12.6%) |
| 35 to 64 Years | 26 (12.2%) | 3 (1.6%) |
| 65 to 74 Years | 3 (7.0%) | 0 (0.0%) |
| 75 Years and over | 4 (6.0%) | 10 (11.6%) |
Disability Class: Ambulatory Difficulty
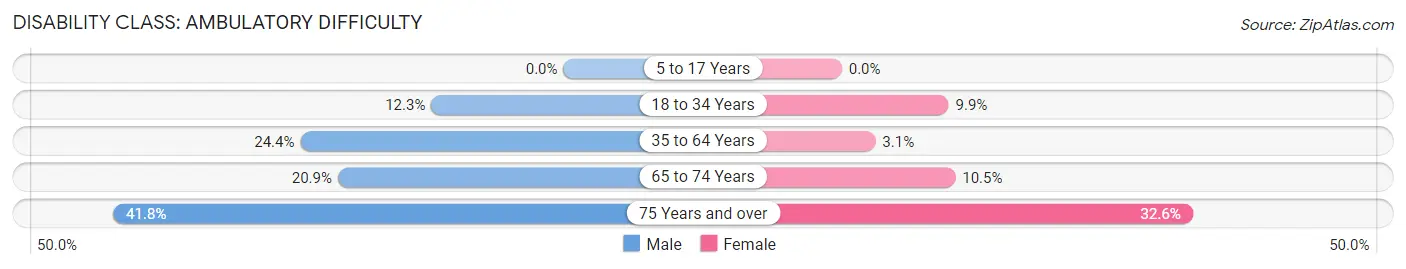
| Age Bracket | Male | Female |
| 5 to 17 Years | 0 (0.0%) | 0 (0.0%) |
| 18 to 34 Years | 19 (12.3%) | 11 (9.9%) |
| 35 to 64 Years | 52 (24.4%) | 6 (3.1%) |
| 65 to 74 Years | 9 (20.9%) | 6 (10.5%) |
| 75 Years and over | 28 (41.8%) | 28 (32.6%) |
Disability Class: Self-Care Difficulty
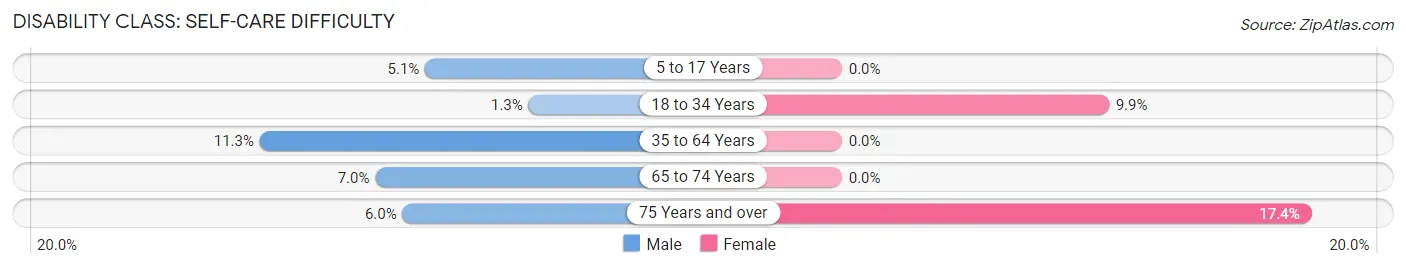
| Age Bracket | Male | Female |
| 5 to 17 Years | 4 (5.1%) | 0 (0.0%) |
| 18 to 34 Years | 2 (1.3%) | 11 (9.9%) |
| 35 to 64 Years | 24 (11.3%) | 0 (0.0%) |
| 65 to 74 Years | 3 (7.0%) | 0 (0.0%) |
| 75 Years and over | 4 (6.0%) | 15 (17.4%) |
Technology Access in St Paul
Computing Device Access in St Paul
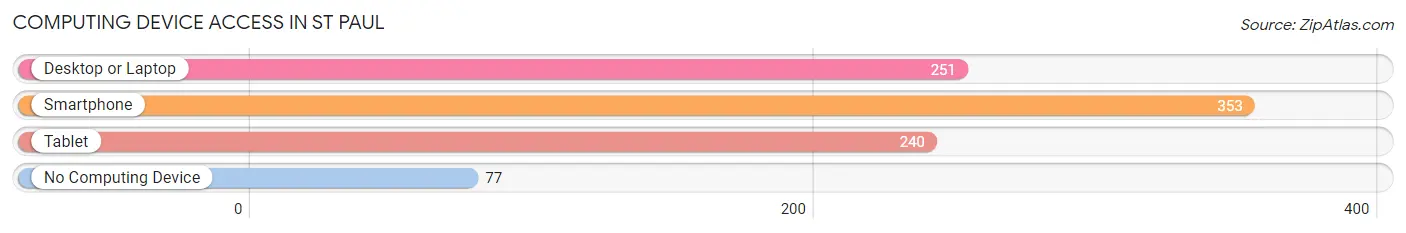
| Device Type | # Households | % Households |
| Desktop or Laptop | 251 | 52.2% |
| Smartphone | 353 | 73.4% |
| Tablet | 240 | 49.9% |
| No Computing Device | 77 | 16.0% |
| Total | 481 | 100.0% |
Internet Access in St Paul
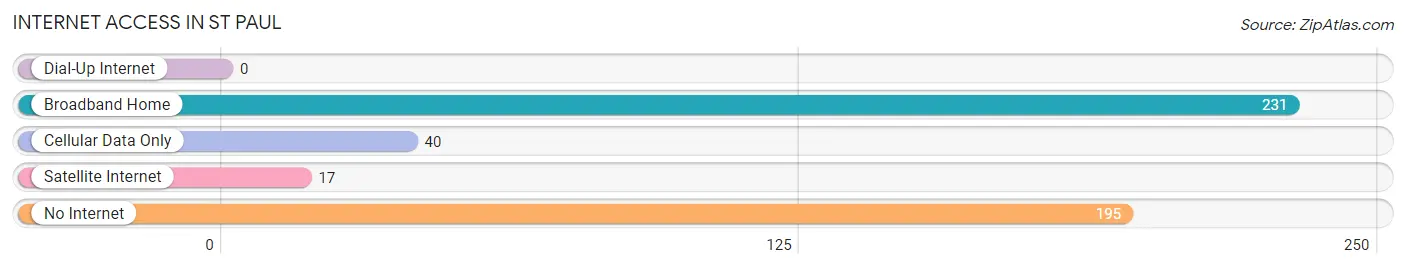
| Internet Type | # Households | % Households |
| Dial-Up Internet | 0 | 0.0% |
| Broadband Home | 231 | 48.0% |
| Cellular Data Only | 40 | 8.3% |
| Satellite Internet | 17 | 3.5% |
| No Internet | 195 | 40.5% |
| Total | 481 | 100.0% |
St Paul Summary
St. Paul is a town located in the southwestern part of Virginia in the United States. It is the county seat of Wise County and is part of the Big Stone Gap Micropolitan Statistical Area. The town is located in the Appalachian Mountains and is known for its scenic beauty and outdoor recreation opportunities.
Geography
St. Paul is located in the Appalachian Mountains of southwestern Virginia. It is situated in the valley of the Clinch River, which is a tributary of the Tennessee River. The town is surrounded by the Cumberland Mountains to the east and the Powell Mountains to the west. The town is located at an elevation of 1,890 feet (576 m) above sea level.
The climate in St. Paul is humid subtropical, with hot summers and mild winters. The average annual temperature is 57°F (14°C). The average annual precipitation is 44 inches (112 cm).
History
St. Paul was founded in 1882 by the Virginia and Tennessee Railroad. The town was named after St. Paul, Minnesota, which was the hometown of the railroad's president. The town quickly grew and became an important center for the coal mining industry.
The town was incorporated in 1891 and by the early 1900s, it had become the largest town in Wise County. The town was home to several coal mines, including the St. Paul Coal and Coke Company, which was the largest coal mine in the county.
The town was also home to several other industries, including a furniture factory, a brickyard, and a canning factory. The town also had several stores, banks, and churches.
In the 1950s, the coal industry began to decline and the town's population began to decline as well. The town's economy shifted to tourism and outdoor recreation.
Economy
St. Paul's economy is largely based on tourism and outdoor recreation. The town is home to several outdoor recreation areas, including the Clinch River State Park, the High Knob Recreation Area, and the St. Paul Mountain Bike Trail.
The town is also home to several businesses, including restaurants, hotels, and retail stores. The town is also home to several manufacturing companies, including a furniture factory and a canning factory.
Demographics
As of the 2010 census, St. Paul had a population of 1,845. The racial makeup of the town was 95.3% White, 2.2% African American, 0.2% Native American, 0.2% Asian, 0.2% from other races, and 1.9% from two or more races. Hispanic or Latino of any race were 0.7% of the population.
The median income for a household in St. Paul was $30,938, and the median income for a family was $37,500. The per capita income for the town was $17,845. About 17.2% of families and 20.2% of the population were below the poverty line, including 28.3% of those under age 18 and 11.2% of those age 65 or over.
Common Questions
What is Per Capita Income in St Paul?
Per Capita income in St Paul is $22,718.
What is the Median Family Income in St Paul?
Median Family Income in St Paul is $51,339.
What is the Median Household income in St Paul?
Median Household Income in St Paul is $24,886.
What is Income or Wage Gap in St Paul?
Income or Wage Gap in St Paul is 26.8%.
Women in St Paul earn 73.2 cents for every dollar earned by a man.
What is Inequality or Gini Index in St Paul?
Inequality or Gini Index in St Paul is 0.55.
What is the Total Population of St Paul?
Total Population of St Paul is 1,129.
What is the Total Male Population of St Paul?
Total Male Population of St Paul is 572.
What is the Total Female Population of St Paul?
Total Female Population of St Paul is 557.
What is the Ratio of Males per 100 Females in St Paul?
There are 102.69 Males per 100 Females in St Paul.
What is the Ratio of Females per 100 Males in St Paul?
There are 97.38 Females per 100 Males in St Paul.
What is the Median Population Age in St Paul?
Median Population Age in St Paul is 44.2 Years.
What is the Average Family Size in St Paul
Average Family Size in St Paul is 2.9 People.
What is the Average Household Size in St Paul
Average Household Size in St Paul is 2.4 People.
How Large is the Labor Force in St Paul?
There are 396 People in the Labor Forcein in St Paul.
What is the Percentage of People in the Labor Force in St Paul?
41.3% of People are in the Labor Force in St Paul.
What is the Unemployment Rate in St Paul?
Unemployment Rate in St Paul is 20.5%.