Scottsville, VA Map & Demographics
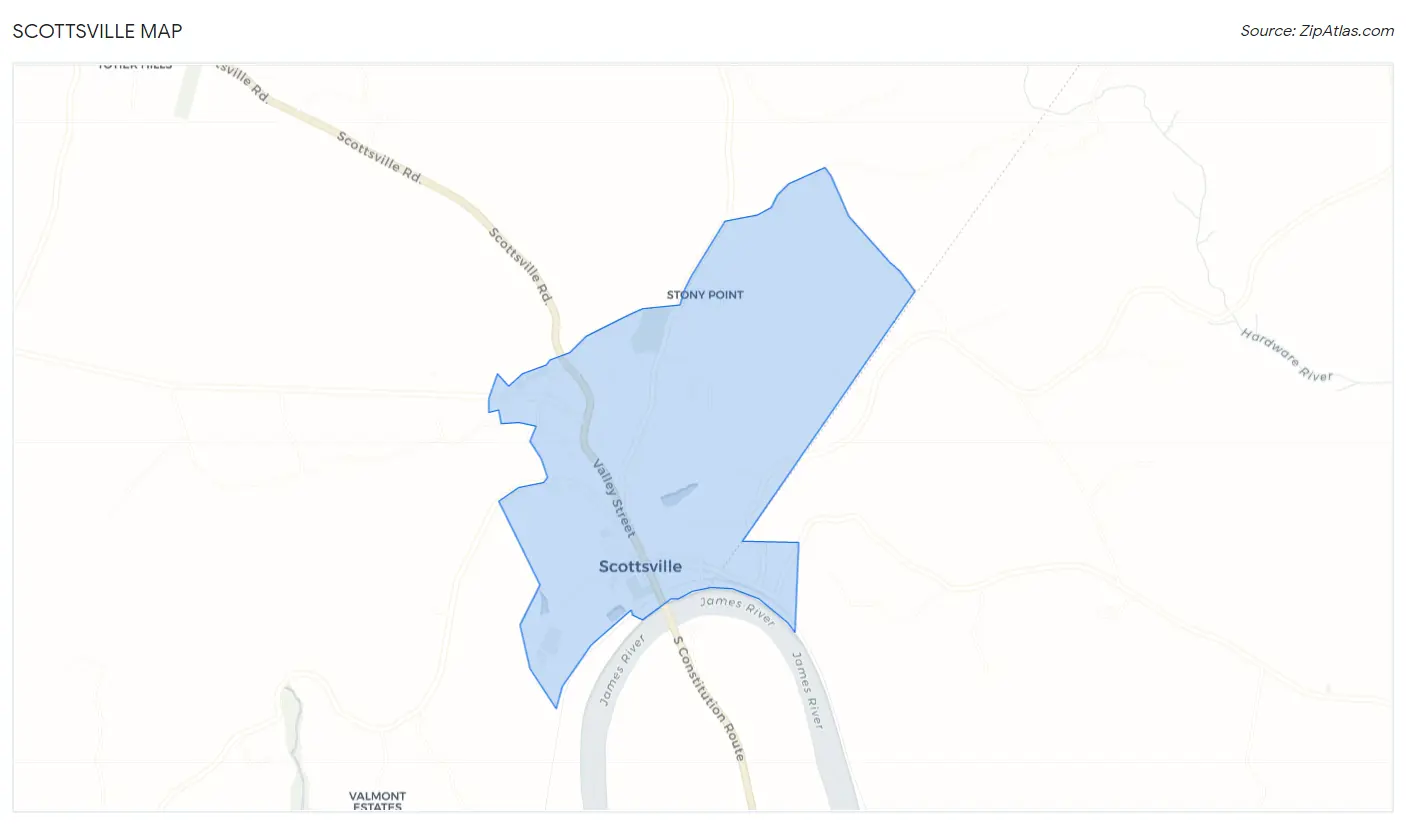
Scottsville Map
Scottsville Overview
$34,240
PER CAPITA INCOME
$78,000
AVG FAMILY INCOME
$52,206
AVG HOUSEHOLD INCOME
37.2%
WAGE / INCOME GAP [ % ]
62.8¢/ $1
WAGE / INCOME GAP [ $ ]
0.41
INEQUALITY / GINI INDEX
571
TOTAL POPULATION
243
MALE POPULATION
328
FEMALE POPULATION
74.09
MALES / 100 FEMALES
134.98
FEMALES / 100 MALES
43.9
MEDIAN AGE
2.9
AVG FAMILY SIZE
2.1
AVG HOUSEHOLD SIZE
283
LABOR FORCE [ PEOPLE ]
61.8%
PERCENT IN LABOR FORCE
1.1%
UNEMPLOYMENT RATE
Scottsville Zip Codes
Scottsville Area Codes
Income in Scottsville
Income Overview in Scottsville
Per Capita Income in Scottsville is $34,240, while median incomes of families and households are $78,000 and $52,206 respectively.
| Characteristic | Number | Measure |
| Per Capita Income | 571 | $34,240 |
| Median Family Income | 140 | $78,000 |
| Mean Family Income | 140 | $82,902 |
| Median Household Income | 270 | $52,206 |
| Mean Household Income | 270 | $70,836 |
| Income Deficit | 140 | $0 |
| Wage / Income Gap (%) | 571 | 37.24% |
| Wage / Income Gap ($) | 571 | 62.76¢ per $1 |
| Gini / Inequality Index | 571 | 0.41 |
Earnings by Sex in Scottsville
Average Earnings in Scottsville are $37,500, $27,500 for men and $43,816 for women, a difference of 37.2%.
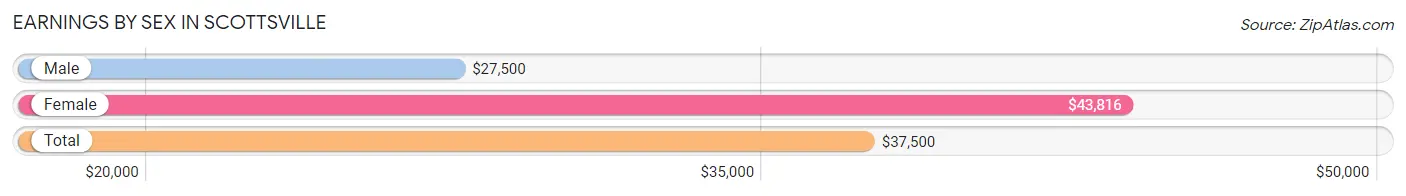
| Sex | Number | Average Earnings |
| Male | 146 (48.0%) | $27,500 |
| Female | 158 (52.0%) | $43,816 |
| Total | 304 (100.0%) | $37,500 |
Earnings by Sex by Income Bracket in Scottsville
The most common earnings brackets in Scottsville are $12,500 to $14,999 for men (23 | 15.8%) and $75,000 to $99,999 for women (23 | 14.6%).
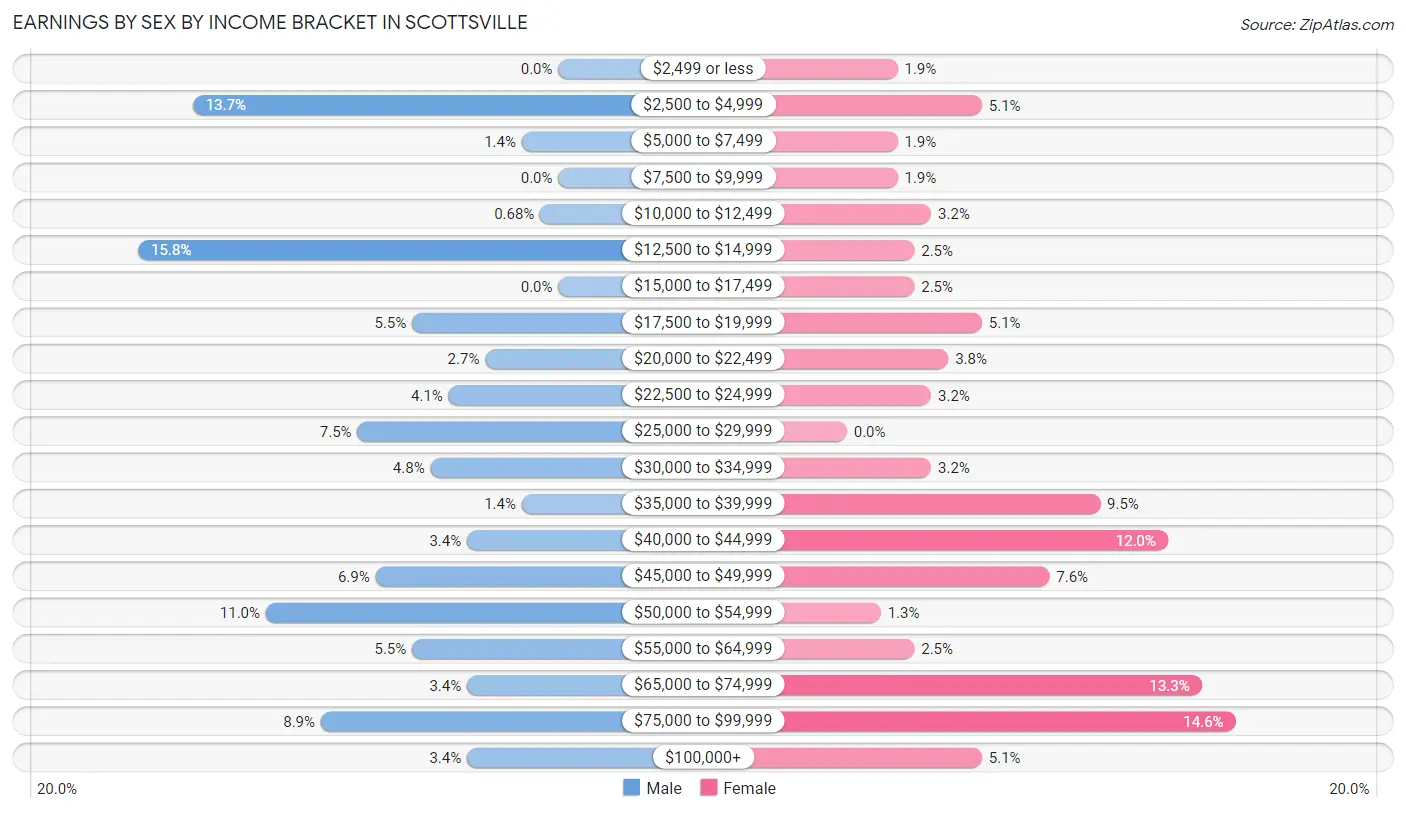
| Income | Male | Female |
| $2,499 or less | 0 (0.0%) | 3 (1.9%) |
| $2,500 to $4,999 | 20 (13.7%) | 8 (5.1%) |
| $5,000 to $7,499 | 2 (1.4%) | 3 (1.9%) |
| $7,500 to $9,999 | 0 (0.0%) | 3 (1.9%) |
| $10,000 to $12,499 | 1 (0.7%) | 5 (3.2%) |
| $12,500 to $14,999 | 23 (15.8%) | 4 (2.5%) |
| $15,000 to $17,499 | 0 (0.0%) | 4 (2.5%) |
| $17,500 to $19,999 | 8 (5.5%) | 8 (5.1%) |
| $20,000 to $22,499 | 4 (2.7%) | 6 (3.8%) |
| $22,500 to $24,999 | 6 (4.1%) | 5 (3.2%) |
| $25,000 to $29,999 | 11 (7.5%) | 0 (0.0%) |
| $30,000 to $34,999 | 7 (4.8%) | 5 (3.2%) |
| $35,000 to $39,999 | 2 (1.4%) | 15 (9.5%) |
| $40,000 to $44,999 | 5 (3.4%) | 19 (12.0%) |
| $45,000 to $49,999 | 10 (6.9%) | 12 (7.6%) |
| $50,000 to $54,999 | 16 (11.0%) | 2 (1.3%) |
| $55,000 to $64,999 | 8 (5.5%) | 4 (2.5%) |
| $65,000 to $74,999 | 5 (3.4%) | 21 (13.3%) |
| $75,000 to $99,999 | 13 (8.9%) | 23 (14.6%) |
| $100,000+ | 5 (3.4%) | 8 (5.1%) |
| Total | 146 (100.0%) | 158 (100.0%) |
Earnings by Sex by Educational Attainment in Scottsville
Average earnings in Scottsville are $28,750 for men and $44,342 for women, a difference of 35.2%. Men with an educational attainment of bachelor's degree enjoy the highest average annual earnings of $51,250, while those with college or associate's degree education earn the least with $23,125. Women with an educational attainment of graduate degree earn the most with the average annual earnings of $69,063, while those with college or associate's degree education have the smallest earnings of $42,917.
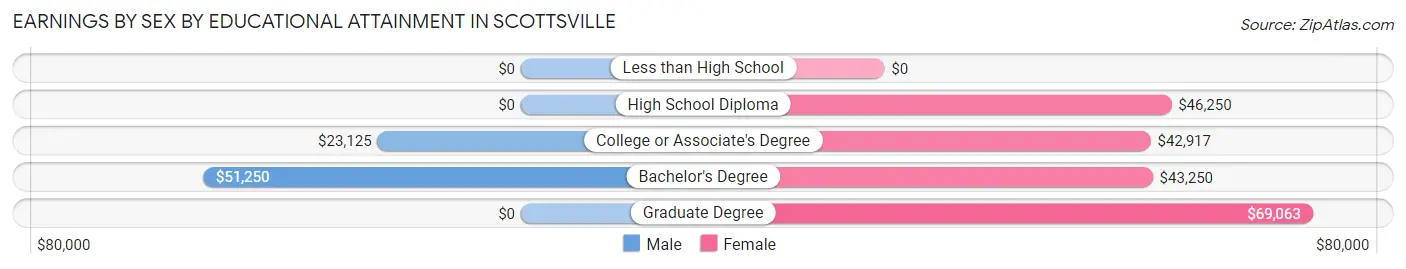
| Educational Attainment | Male Income | Female Income |
| Less than High School | - | - |
| High School Diploma | - | - |
| College or Associate's Degree | $23,125 | $42,917 |
| Bachelor's Degree | $51,250 | $43,250 |
| Graduate Degree | - | - |
| Total | $28,750 | $44,342 |
Family Income in Scottsville
Family Income Brackets in Scottsville
According to the Scottsville family income data, there are 54 families falling into the $100,000 to $149,999 income range, which is the most common income bracket and makes up 38.6% of all families.
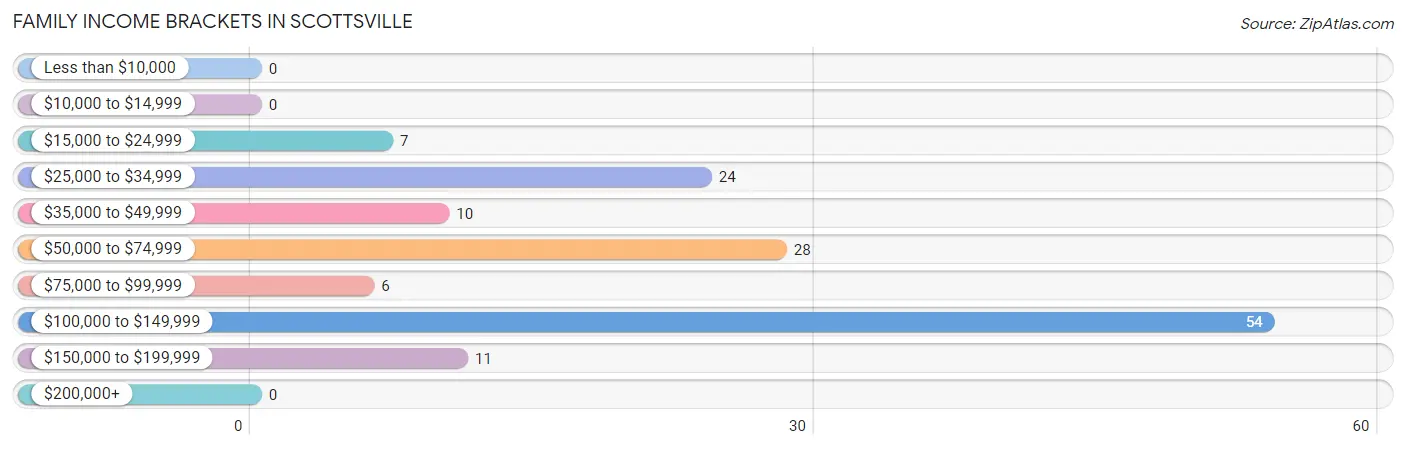
| Income Bracket | # Families | % Families |
| Less than $10,000 | 0 | 0.0% |
| $10,000 to $14,999 | 0 | 0.0% |
| $15,000 to $24,999 | 7 | 5.0% |
| $25,000 to $34,999 | 24 | 17.1% |
| $35,000 to $49,999 | 10 | 7.1% |
| $50,000 to $74,999 | 28 | 20.0% |
| $75,000 to $99,999 | 6 | 4.3% |
| $100,000 to $149,999 | 54 | 38.6% |
| $150,000 to $199,999 | 11 | 7.9% |
| $200,000+ | 0 | 0.0% |
Family Income by Famaliy Size in Scottsville
4-person families (18 | 12.9%) account for the highest median family income in Scottsville with $139,167 per family, while 4-person families (18 | 12.9%) have the highest median income of $34,792 per family member.
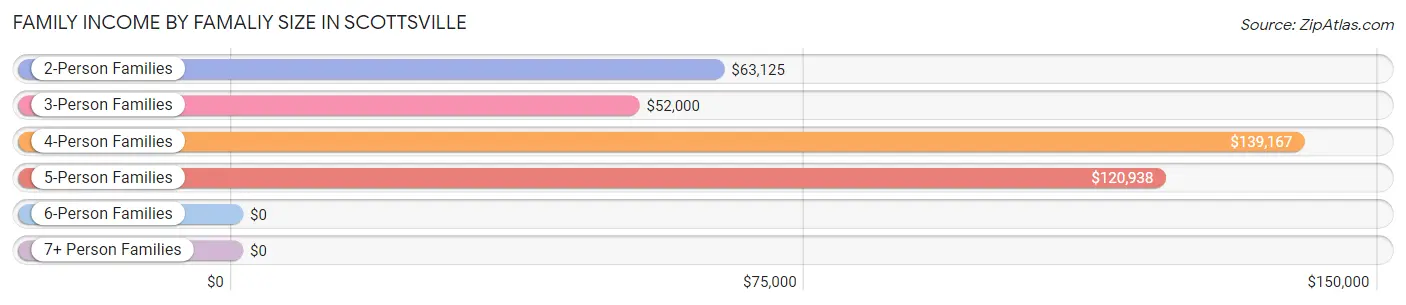
| Income Bracket | # Families | Median Income |
| 2-Person Families | 76 (54.3%) | $63,125 |
| 3-Person Families | 28 (20.0%) | $52,000 |
| 4-Person Families | 18 (12.9%) | $139,167 |
| 5-Person Families | 18 (12.9%) | $120,938 |
| 6-Person Families | 0 (0.0%) | $0 |
| 7+ Person Families | 0 (0.0%) | $0 |
| Total | 140 (100.0%) | $78,000 |
Family Income by Number of Earners in Scottsville
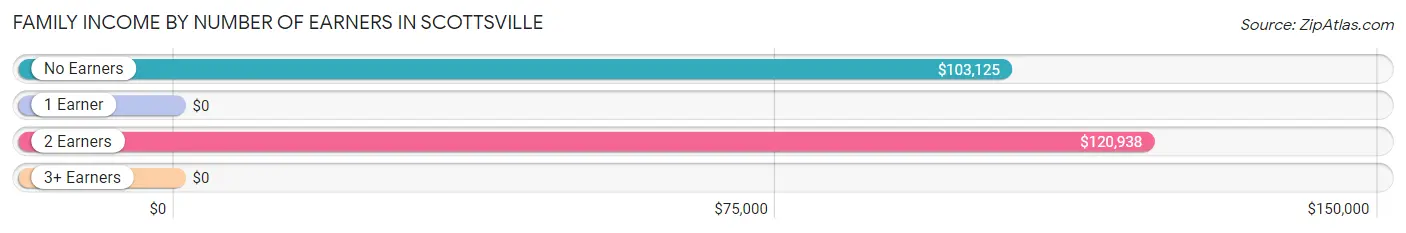
| Number of Earners | # Families | Median Income |
| No Earners | 20 (14.3%) | $103,125 |
| 1 Earner | 60 (42.9%) | $0 |
| 2 Earners | 60 (42.9%) | $120,938 |
| 3+ Earners | 0 (0.0%) | $0 |
| Total | 140 (100.0%) | $78,000 |
Household Income in Scottsville
Household Income Brackets in Scottsville
With 66 households falling in the category, the $100,000 to $149,999 income range is the most frequent in Scottsville, accounting for 24.4% of all households. In contrast, only 4 households (1.5%) fall into the less than $10,000 income bracket, making it the least populous group.
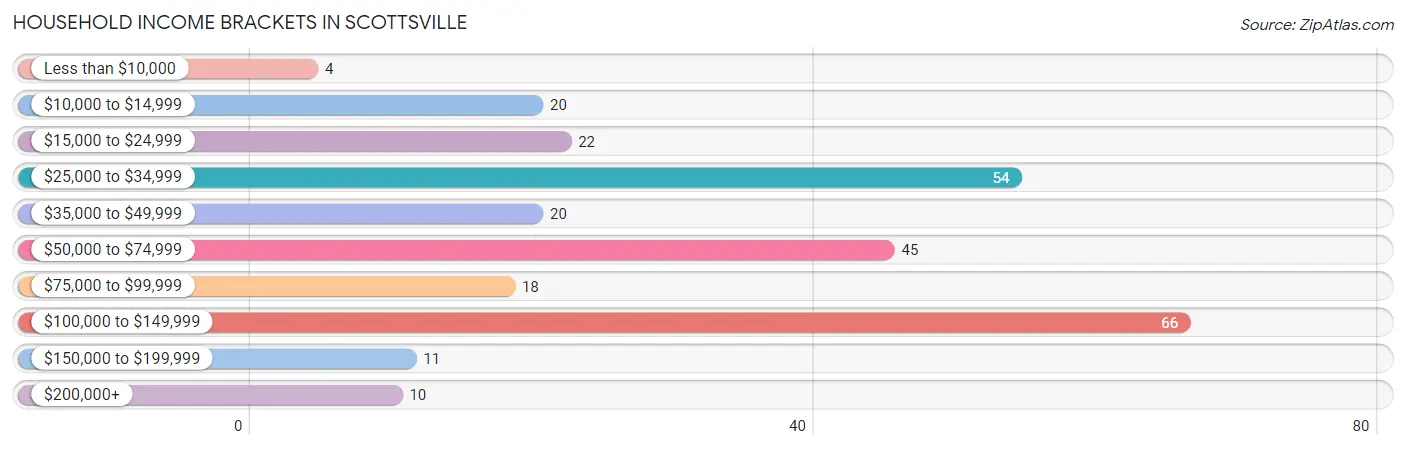
| Income Bracket | # Households | % Households |
| Less than $10,000 | 4 | 1.5% |
| $10,000 to $14,999 | 20 | 7.4% |
| $15,000 to $24,999 | 22 | 8.1% |
| $25,000 to $34,999 | 54 | 20.0% |
| $35,000 to $49,999 | 20 | 7.4% |
| $50,000 to $74,999 | 45 | 16.7% |
| $75,000 to $99,999 | 18 | 6.7% |
| $100,000 to $149,999 | 66 | 24.4% |
| $150,000 to $199,999 | 11 | 4.1% |
| $200,000+ | 10 | 3.7% |
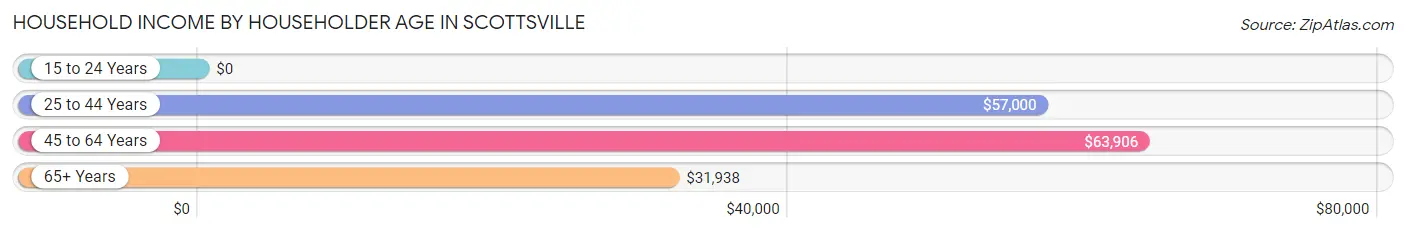
Household Income by Householder Age in Scottsville
The median household income in Scottsville is $52,206, with the highest median household income of $63,906 found in the 45 to 64 years age bracket for the primary householder. A total of 105 households (38.9%) fall into this category.
| Income Bracket | # Households | Median Income |
| 15 to 24 Years | 0 (0.0%) | $0 |
| 25 to 44 Years | 76 (28.1%) | $57,000 |
| 45 to 64 Years | 105 (38.9%) | $63,906 |
| 65+ Years | 89 (33.0%) | $31,938 |
| Total | 270 (100.0%) | $52,206 |
Poverty in Scottsville
Income Below Poverty by Sex and Age in Scottsville
With 16.5% poverty level for males and 10.7% for females among the residents of Scottsville, 6 to 11 year old males and 65 to 74 year old females are the most vulnerable to poverty, with 6 males (40.0%) and 10 females (24.4%) in their respective age groups living below the poverty level.
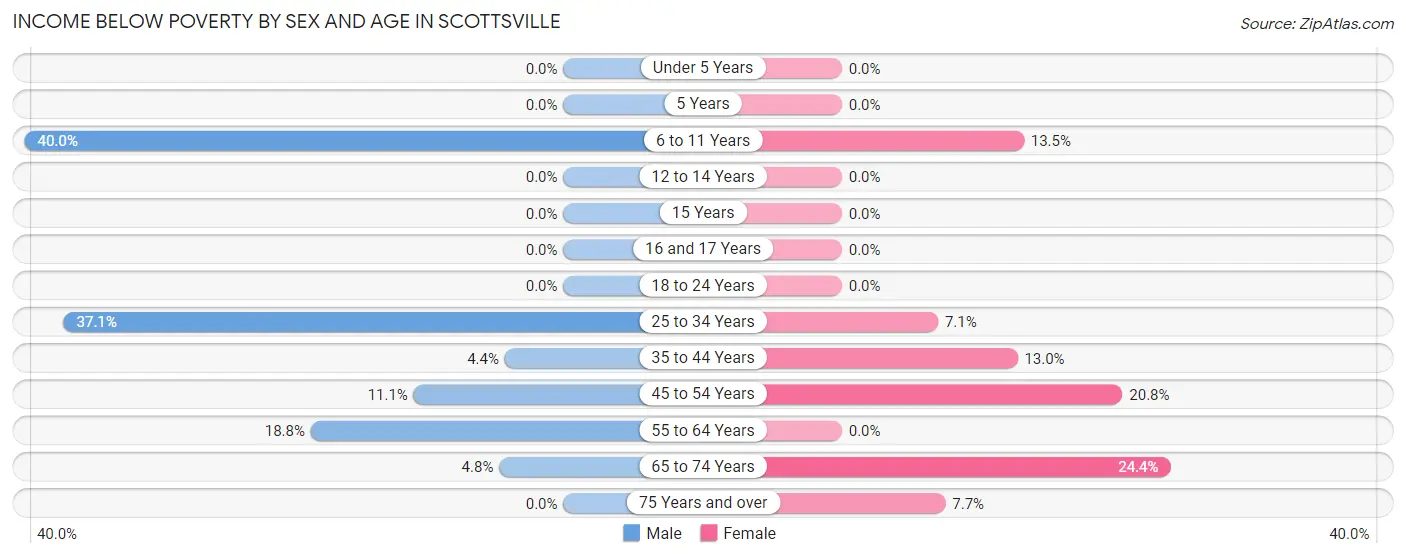
| Age Bracket | Male | Female |
| Under 5 Years | 0 (0.0%) | 0 (0.0%) |
| 5 Years | 0 (0.0%) | 0 (0.0%) |
| 6 to 11 Years | 6 (40.0%) | 5 (13.5%) |
| 12 to 14 Years | 0 (0.0%) | 0 (0.0%) |
| 15 Years | 0 (0.0%) | 0 (0.0%) |
| 16 and 17 Years | 0 (0.0%) | 0 (0.0%) |
| 18 to 24 Years | 0 (0.0%) | 0 (0.0%) |
| 25 to 34 Years | 23 (37.1%) | 2 (7.1%) |
| 35 to 44 Years | 1 (4.3%) | 6 (13.0%) |
| 45 to 54 Years | 2 (11.1%) | 10 (20.8%) |
| 55 to 64 Years | 6 (18.8%) | 0 (0.0%) |
| 65 to 74 Years | 2 (4.8%) | 10 (24.4%) |
| 75 Years and over | 0 (0.0%) | 2 (7.7%) |
| Total | 40 (16.5%) | 35 (10.7%) |
Income Above Poverty by Sex and Age in Scottsville
According to the poverty statistics in Scottsville, males aged under 5 years and females aged under 5 years are the age groups that are most secure financially, with 100.0% of males and 100.0% of females in these age groups living above the poverty line.
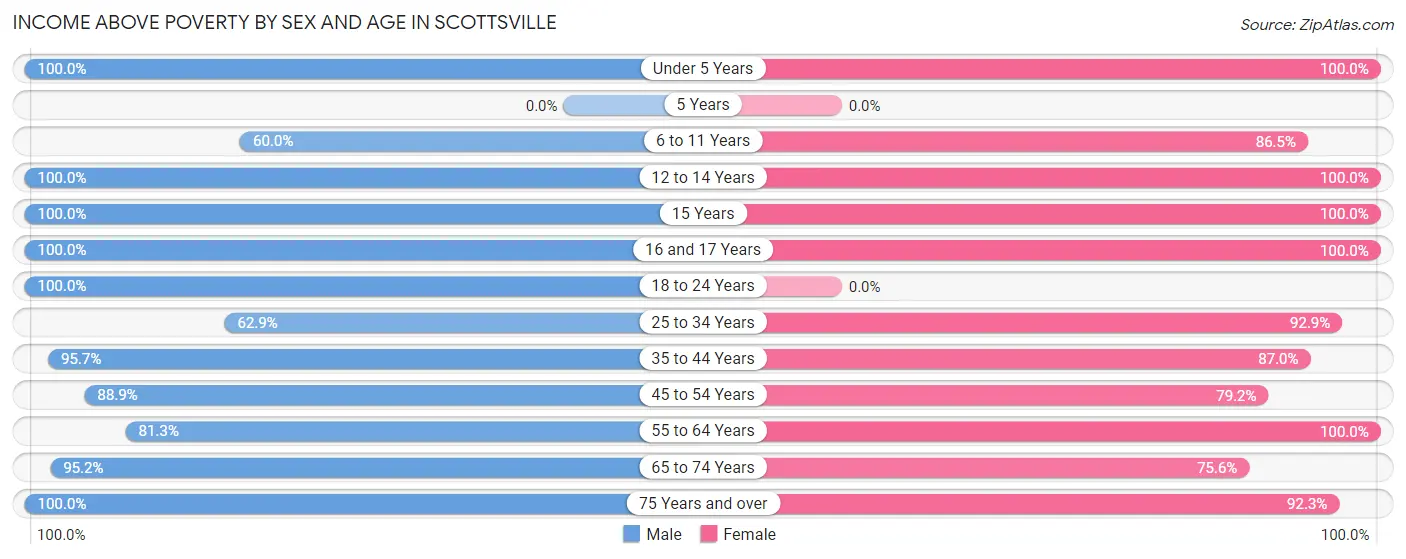
| Age Bracket | Male | Female |
| Under 5 Years | 7 (100.0%) | 15 (100.0%) |
| 5 Years | 0 (0.0%) | 0 (0.0%) |
| 6 to 11 Years | 9 (60.0%) | 32 (86.5%) |
| 12 to 14 Years | 13 (100.0%) | 15 (100.0%) |
| 15 Years | 5 (100.0%) | 5 (100.0%) |
| 16 and 17 Years | 3 (100.0%) | 16 (100.0%) |
| 18 to 24 Years | 4 (100.0%) | 0 (0.0%) |
| 25 to 34 Years | 39 (62.9%) | 26 (92.9%) |
| 35 to 44 Years | 22 (95.7%) | 40 (87.0%) |
| 45 to 54 Years | 16 (88.9%) | 38 (79.2%) |
| 55 to 64 Years | 26 (81.2%) | 51 (100.0%) |
| 65 to 74 Years | 40 (95.2%) | 31 (75.6%) |
| 75 Years and over | 18 (100.0%) | 24 (92.3%) |
| Total | 202 (83.5%) | 293 (89.3%) |
Income Below Poverty Among Married-Couple Families in Scottsville
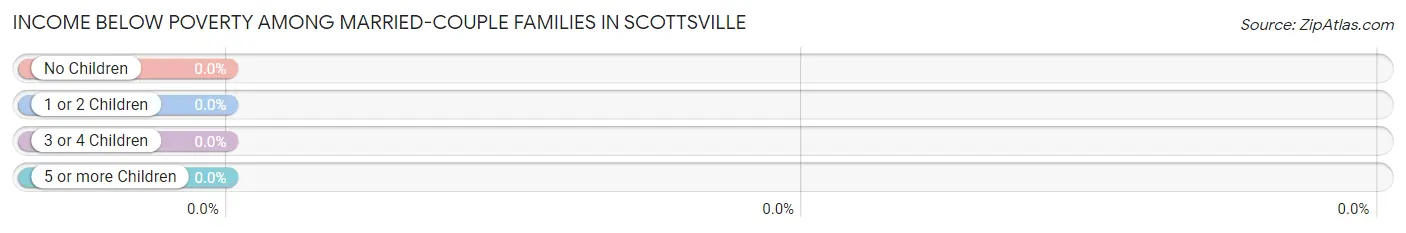
| Children | Above Poverty | Below Poverty |
| No Children | 69 (100.0%) | 0 (0.0%) |
| 1 or 2 Children | 26 (100.0%) | 0 (0.0%) |
| 3 or 4 Children | 4 (100.0%) | 0 (0.0%) |
| 5 or more Children | 0 (0.0%) | 0 (0.0%) |
| Total | 99 (100.0%) | 0 (0.0%) |
Income Below Poverty Among Single-Parent Households in Scottsville
According to the poverty data in Scottsville, 25.0% or 1 single-father households and 16.2% or 6 single-mother households are living below the poverty line. Among single-father households, those with 1 or 2 children have the highest poverty rate, with 1 households (25.0%) experiencing poverty. Likewise, among single-mother households, those with 1 or 2 children have the highest poverty rate, with 6 households (24.0%) falling below the poverty line.
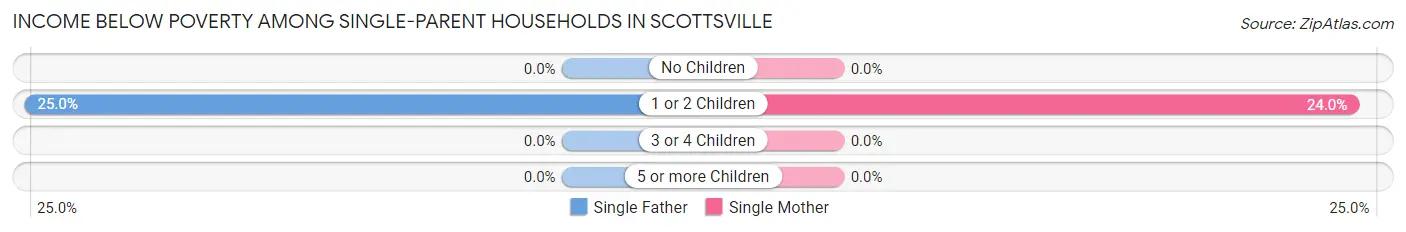
| Children | Single Father | Single Mother |
| No Children | 0 (0.0%) | 0 (0.0%) |
| 1 or 2 Children | 1 (25.0%) | 6 (24.0%) |
| 3 or 4 Children | 0 (0.0%) | 0 (0.0%) |
| 5 or more Children | 0 (0.0%) | 0 (0.0%) |
| Total | 1 (25.0%) | 6 (16.2%) |
Income Below Poverty Among Married-Couple vs Single-Parent Households in Scottsville
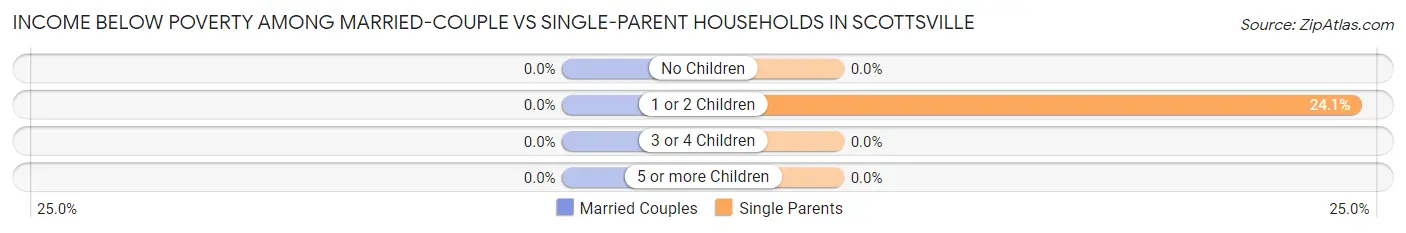
| Children | Married-Couple Families | Single-Parent Households |
| No Children | 0 (0.0%) | 0 (0.0%) |
| 1 or 2 Children | 0 (0.0%) | 7 (24.1%) |
| 3 or 4 Children | 0 (0.0%) | 0 (0.0%) |
| 5 or more Children | 0 (0.0%) | 0 (0.0%) |
| Total | 0 (0.0%) | 7 (17.1%) |
Race in Scottsville
The most populous races in Scottsville are White / Caucasian (443 | 77.6%), Black / African American (118 | 20.7%), and Two or more Races (10 | 1.8%).
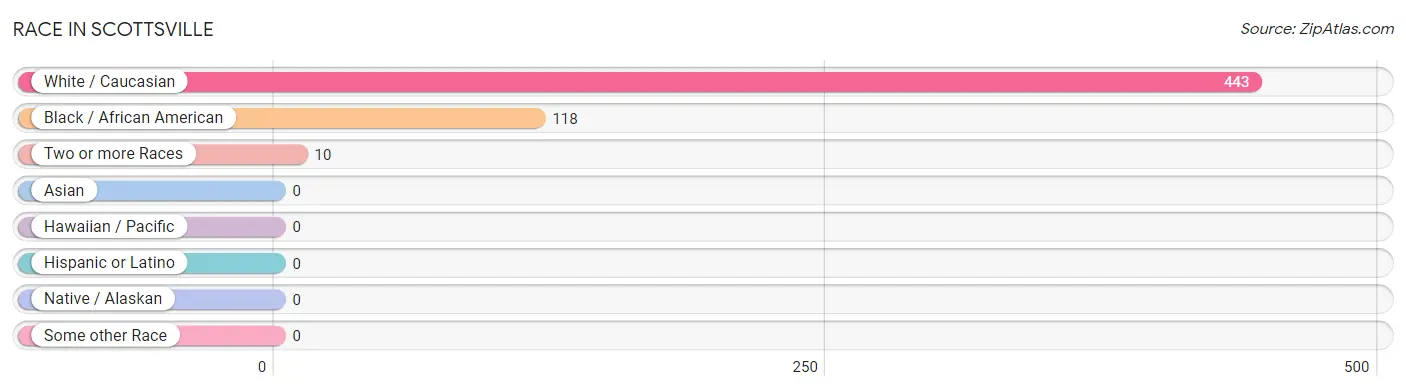
| Race | # Population | % Population |
| Asian | 0 | 0.0% |
| Black / African American | 118 | 20.7% |
| Hawaiian / Pacific | 0 | 0.0% |
| Hispanic or Latino | 0 | 0.0% |
| Native / Alaskan | 0 | 0.0% |
| White / Caucasian | 443 | 77.6% |
| Two or more Races | 10 | 1.8% |
| Some other Race | 0 | 0.0% |
| Total | 571 | 100.0% |
Ancestry in Scottsville
The most populous ancestries reported in Scottsville are English (110 | 19.3%), German (73 | 12.8%), Irish (54 | 9.5%), Scotch-Irish (35 | 6.1%), and Italian (29 | 5.1%), together accounting for 52.7% of all Scottsville residents.
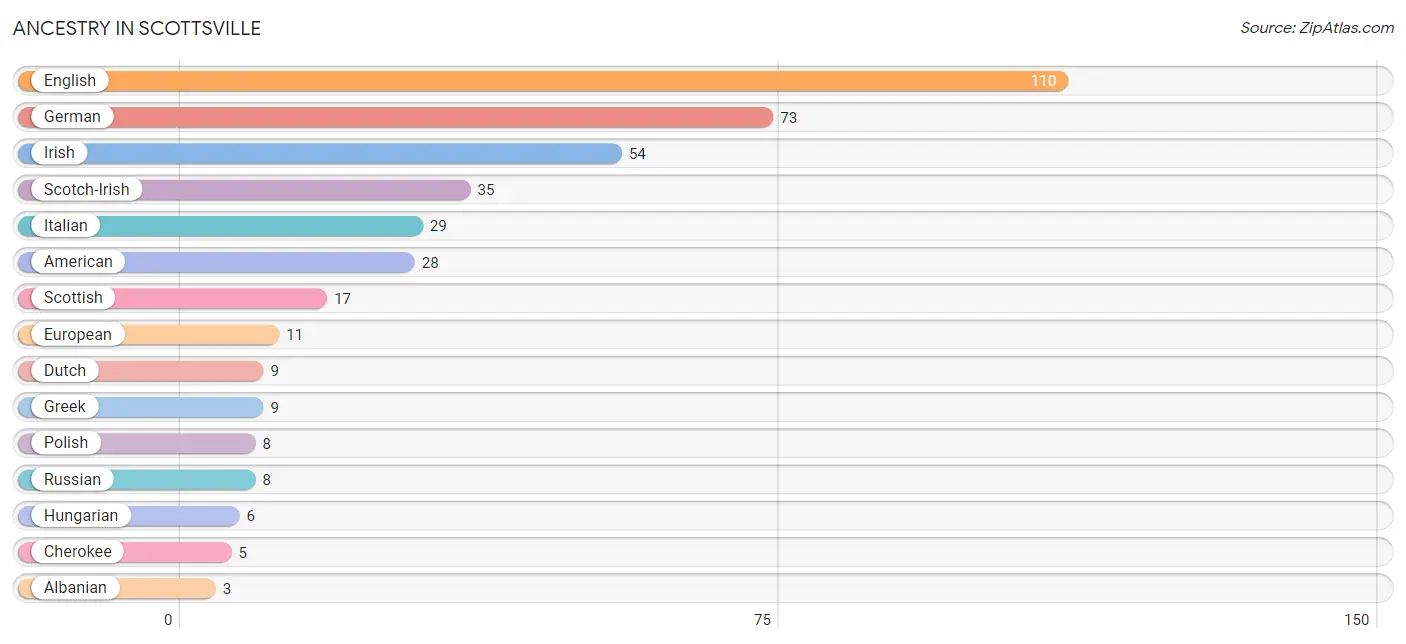
| Ancestry | # Population | % Population |
| Albanian | 3 | 0.5% |
| American | 28 | 4.9% |
| Armenian | 3 | 0.5% |
| Cherokee | 5 | 0.9% |
| Danish | 2 | 0.4% |
| Dutch | 9 | 1.6% |
| Eastern European | 2 | 0.4% |
| English | 110 | 19.3% |
| European | 11 | 1.9% |
| French | 2 | 0.4% |
| German | 73 | 12.8% |
| Greek | 9 | 1.6% |
| Hungarian | 6 | 1.1% |
| Irish | 54 | 9.5% |
| Italian | 29 | 5.1% |
| Lithuanian | 3 | 0.5% |
| Norwegian | 2 | 0.4% |
| Polish | 8 | 1.4% |
| Portuguese | 2 | 0.4% |
| Russian | 8 | 1.4% |
| Scotch-Irish | 35 | 6.1% |
| Scottish | 17 | 3.0% |
| Slavic | 2 | 0.4% |
| Swedish | 2 | 0.4% |
| Welsh | 3 | 0.5% | View All 25 Rows |
Immigrants in Scottsville
The most numerous immigrant groups reported in Scottsville came from Europe (6 | 1.1%), Northern Europe (4 | 0.7%), Eastern Europe (2 | 0.4%), and Ukraine (2 | 0.4%), together accounting for 2.5% of all Scottsville residents.
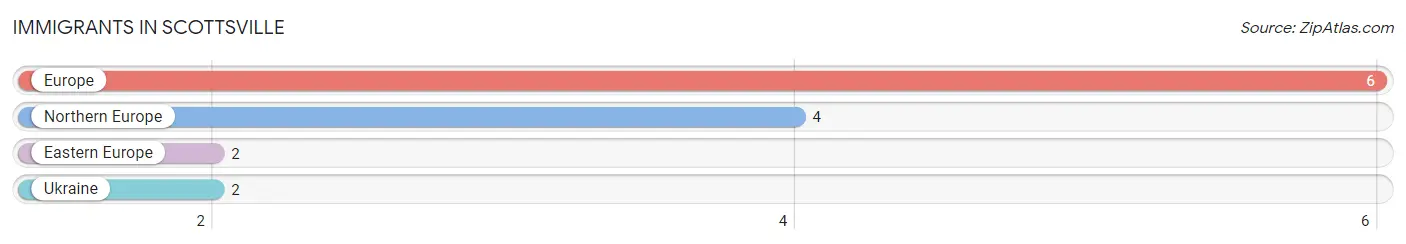
| Immigration Origin | # Population | % Population |
| Eastern Europe | 2 | 0.4% |
| Europe | 6 | 1.1% |
| Northern Europe | 4 | 0.7% |
| Ukraine | 2 | 0.4% | View All 4 Rows |
Sex and Age in Scottsville
Sex and Age in Scottsville
The most populous age groups in Scottsville are 25 to 29 Years (34 | 14.0%) for men and 5 to 9 Years (31 | 9.5%) for women.
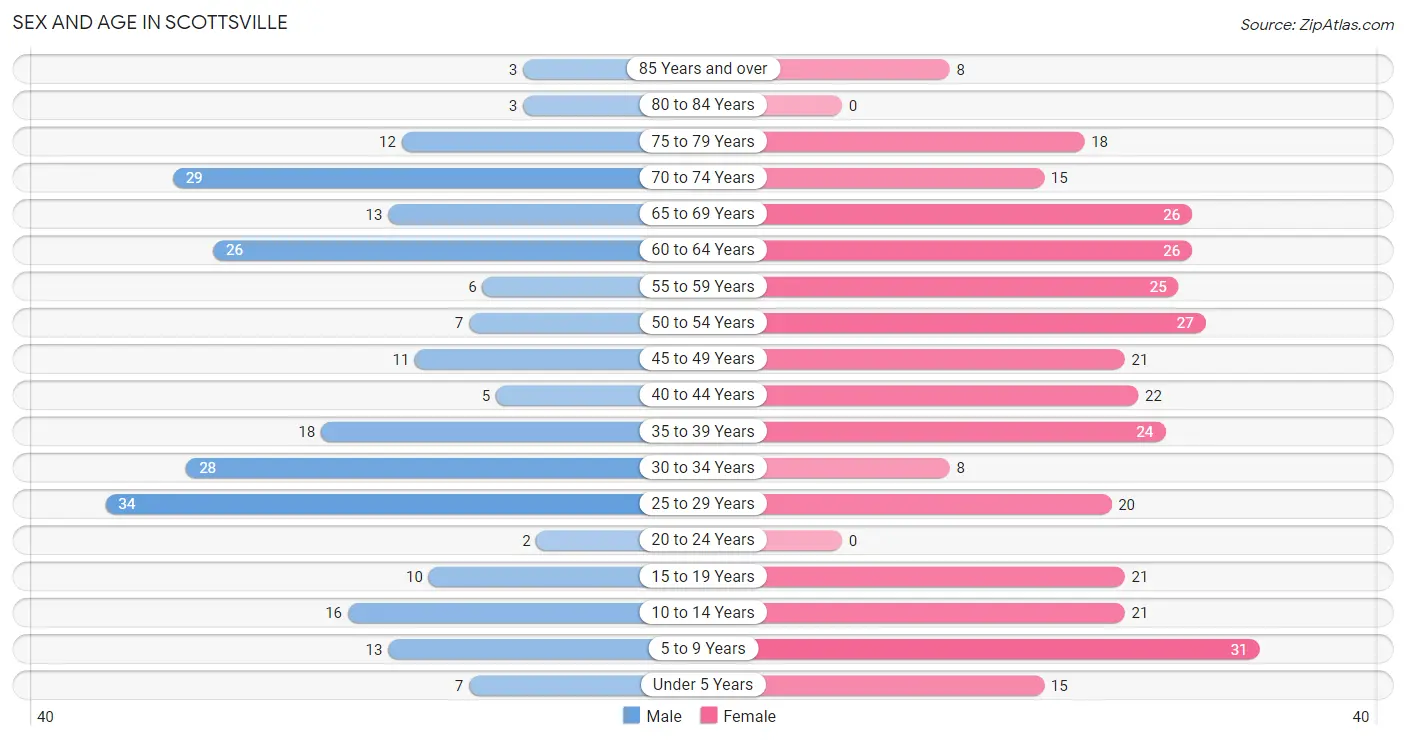
| Age Bracket | Male | Female |
| Under 5 Years | 7 (2.9%) | 15 (4.6%) |
| 5 to 9 Years | 13 (5.3%) | 31 (9.5%) |
| 10 to 14 Years | 16 (6.6%) | 21 (6.4%) |
| 15 to 19 Years | 10 (4.1%) | 21 (6.4%) |
| 20 to 24 Years | 2 (0.8%) | 0 (0.0%) |
| 25 to 29 Years | 34 (14.0%) | 20 (6.1%) |
| 30 to 34 Years | 28 (11.5%) | 8 (2.4%) |
| 35 to 39 Years | 18 (7.4%) | 24 (7.3%) |
| 40 to 44 Years | 5 (2.1%) | 22 (6.7%) |
| 45 to 49 Years | 11 (4.5%) | 21 (6.4%) |
| 50 to 54 Years | 7 (2.9%) | 27 (8.2%) |
| 55 to 59 Years | 6 (2.5%) | 25 (7.6%) |
| 60 to 64 Years | 26 (10.7%) | 26 (7.9%) |
| 65 to 69 Years | 13 (5.3%) | 26 (7.9%) |
| 70 to 74 Years | 29 (11.9%) | 15 (4.6%) |
| 75 to 79 Years | 12 (4.9%) | 18 (5.5%) |
| 80 to 84 Years | 3 (1.2%) | 0 (0.0%) |
| 85 Years and over | 3 (1.2%) | 8 (2.4%) |
| Total | 243 (100.0%) | 328 (100.0%) |
Families and Households in Scottsville
Median Family Size in Scottsville
The median family size in Scottsville is 2.85 persons per family, with single female/mother families (37 | 26.4%) accounting for the largest median family size of 3.19 persons per family. On the other hand, single male/father families (4 | 2.9%) represent the smallest median family size with 1.75 persons per family.
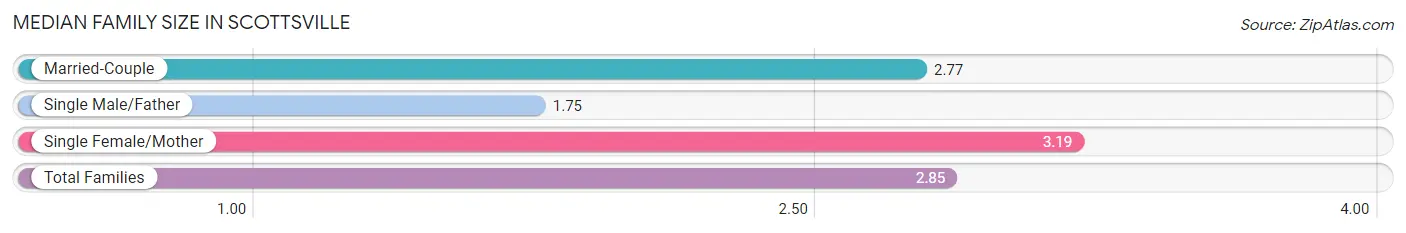
| Family Type | # Families | Family Size |
| Married-Couple | 99 (70.7%) | 2.77 |
| Single Male/Father | 4 (2.9%) | 1.75 |
| Single Female/Mother | 37 (26.4%) | 3.19 |
| Total Families | 140 (100.0%) | 2.85 |
Median Household Size in Scottsville
The median household size in Scottsville is 2.11 persons per household, with single female/mother households (37 | 13.7%) accounting for the largest median household size of 3.43 persons per household. non-family households (130 | 48.1%) represent the smallest median household size with 1.23 persons per household.
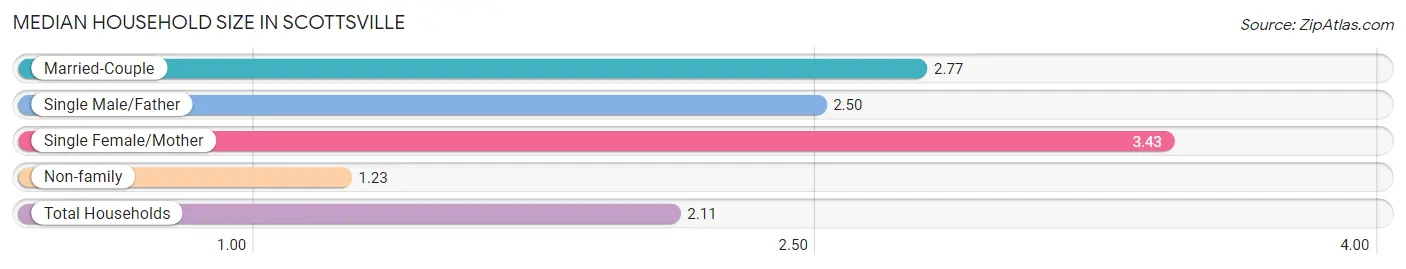
| Household Type | # Households | Household Size |
| Married-Couple | 99 (36.7%) | 2.77 |
| Single Male/Father | 4 (1.5%) | 2.50 |
| Single Female/Mother | 37 (13.7%) | 3.43 |
| Non-family | 130 (48.1%) | 1.23 |
| Total Households | 270 (100.0%) | 2.11 |
Household Size by Marriage Status in Scottsville
Out of a total of 270 households in Scottsville, 140 (51.8%) are family households, while 130 (48.1%) are nonfamily households. The most numerous type of family households are 2-person households, comprising 68, and the most common type of nonfamily households are 1-person households, comprising 98.
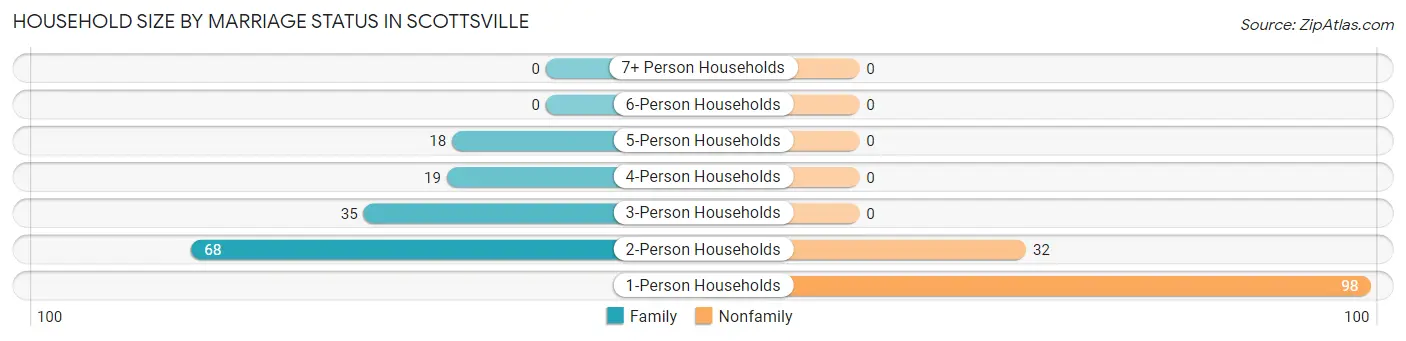
| Household Size | Family Households | Nonfamily Households |
| 1-Person Households | - | 98 (36.3%) |
| 2-Person Households | 68 (25.2%) | 32 (11.8%) |
| 3-Person Households | 35 (13.0%) | 0 (0.0%) |
| 4-Person Households | 19 (7.0%) | 0 (0.0%) |
| 5-Person Households | 18 (6.7%) | 0 (0.0%) |
| 6-Person Households | 0 (0.0%) | 0 (0.0%) |
| 7+ Person Households | 0 (0.0%) | 0 (0.0%) |
| Total | 140 (51.8%) | 130 (48.1%) |
Female Fertility in Scottsville
Fertility by Age in Scottsville
Average fertility rate in Scottsville is 44.0 births per 1,000 women. Women in the age bracket of 35 to 50 years have the highest fertility rate with 69.0 births per 1,000 women. Women in the age bracket of 35 to 50 years acount for 100.0% of all women with births.
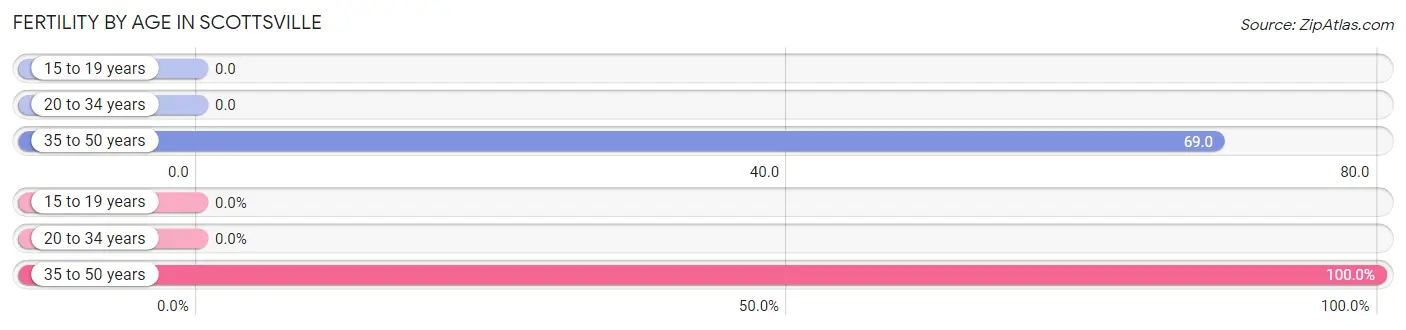
| Age Bracket | Women with Births | Births / 1,000 Women |
| 15 to 19 years | 0 (0.0%) | 0.0 |
| 20 to 34 years | 0 (0.0%) | 0.0 |
| 35 to 50 years | 6 (100.0%) | 69.0 |
| Total | 6 (100.0%) | 44.0 |
Fertility by Age by Marriage Status in Scottsville
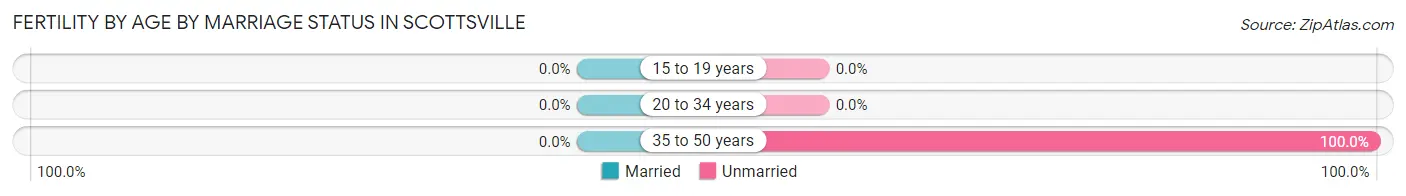
| Age Bracket | Married | Unmarried |
| 15 to 19 years | 0 (0.0%) | 0 (0.0%) |
| 20 to 34 years | 0 (0.0%) | 0 (0.0%) |
| 35 to 50 years | 0 (0.0%) | 6 (100.0%) |
| Total | 0 (0.0%) | 6 (100.0%) |
Fertility by Education in Scottsville
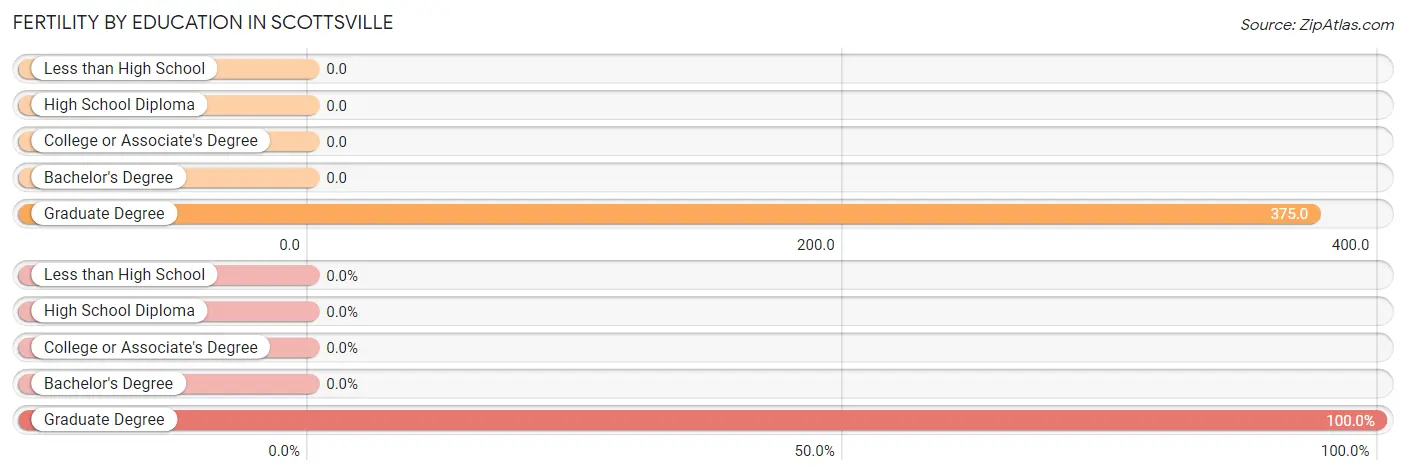
| Educational Attainment | Women with Births | Births / 1,000 Women |
| Less than High School | 0 (0.0%) | 0.0 |
| High School Diploma | 0 (0.0%) | 0.0 |
| College or Associate's Degree | 0 (0.0%) | 0.0 |
| Bachelor's Degree | 0 (0.0%) | 0.0 |
| Graduate Degree | 6 (100.0%) | 375.0 |
| Total | 6 (100.0%) | 44.0 |
Fertility by Education by Marriage Status in Scottsville
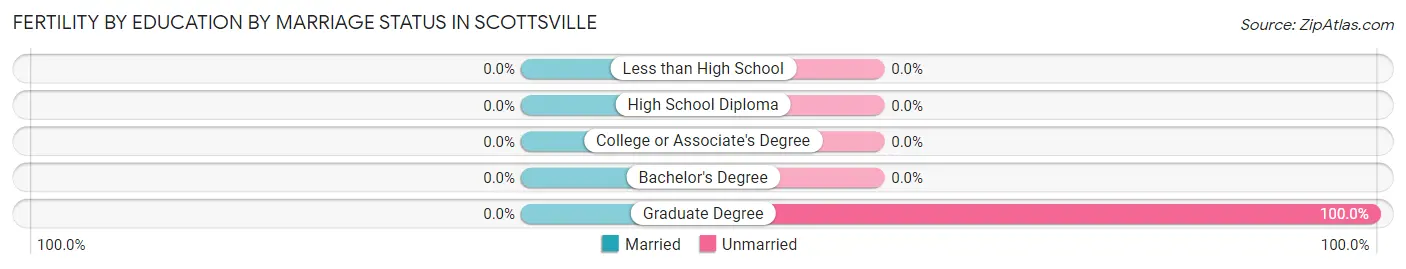
| Educational Attainment | Married | Unmarried |
| Less than High School | 0 (0.0%) | 0 (0.0%) |
| High School Diploma | 0 (0.0%) | 0 (0.0%) |
| College or Associate's Degree | 0 (0.0%) | 0 (0.0%) |
| Bachelor's Degree | 0 (0.0%) | 0 (0.0%) |
| Graduate Degree | 0 (0.0%) | 6 (100.0%) |
| Total | 0 (0.0%) | 6 (100.0%) |
Employment Characteristics in Scottsville
Employment by Class of Employer in Scottsville
Among the 266 employed individuals in Scottsville, private company employees (150 | 56.4%), not-for-profit organizations (39 | 14.7%), and self-employed (not incorporated) (25 | 9.4%) make up the most common classes of employment.
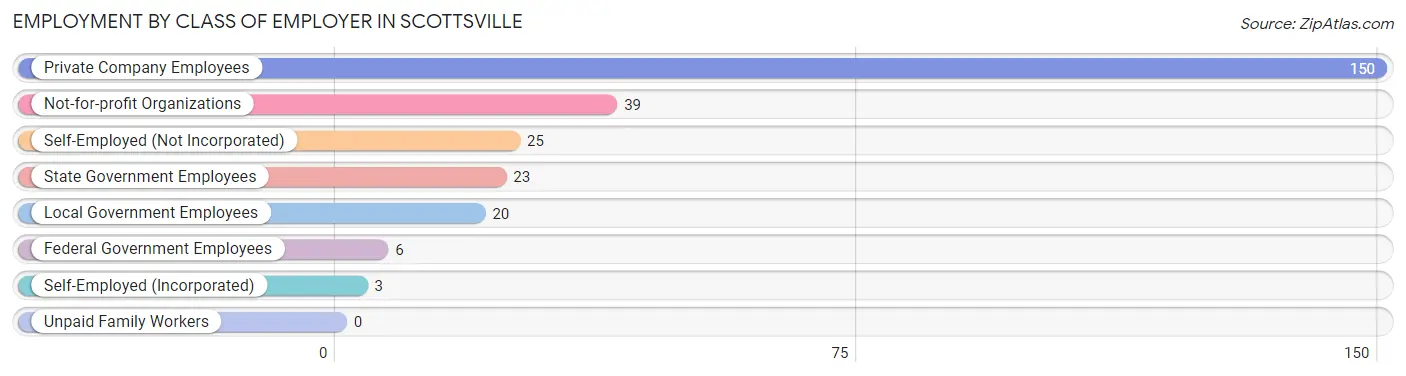
| Employer Class | # Employees | % Employees |
| Private Company Employees | 150 | 56.4% |
| Self-Employed (Incorporated) | 3 | 1.1% |
| Self-Employed (Not Incorporated) | 25 | 9.4% |
| Not-for-profit Organizations | 39 | 14.7% |
| Local Government Employees | 20 | 7.5% |
| State Government Employees | 23 | 8.6% |
| Federal Government Employees | 6 | 2.3% |
| Unpaid Family Workers | 0 | 0.0% |
| Total | 266 | 100.0% |
Employment Status by Age in Scottsville
According to the labor force statistics for Scottsville, out of the total population over 16 years of age (458), 61.8% or 283 individuals are in the labor force, with 1.1% or 3 of them unemployed. The age group with the highest labor force participation rate is 20 to 24 years, with 100.0% or 2 individuals in the labor force. Within the labor force, the 45 to 54 years age range has the highest percentage of unemployed individuals, with 7.1% or 3 of them being unemployed.
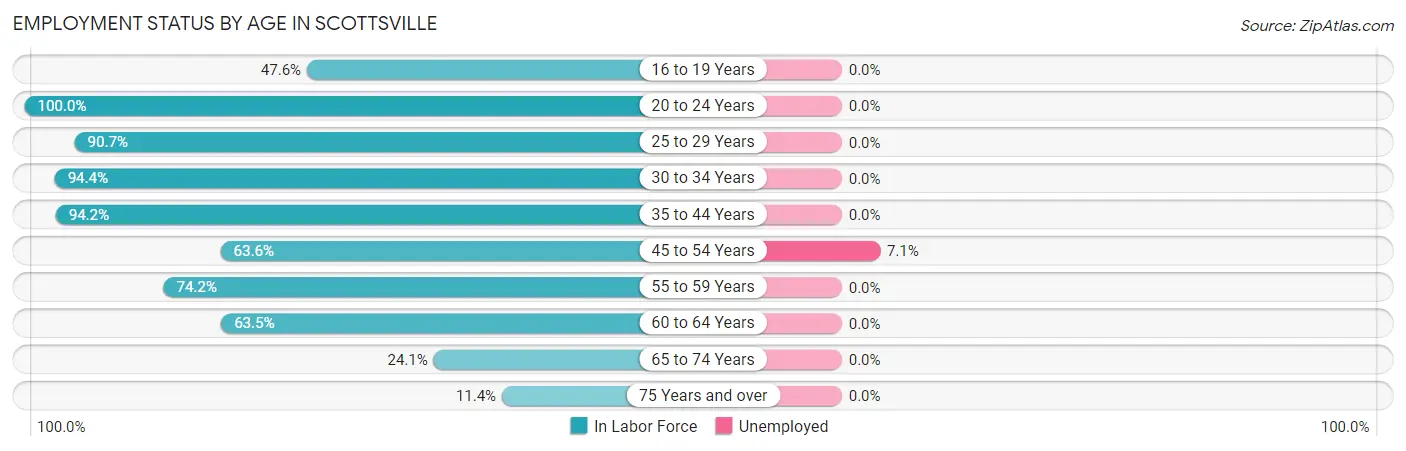
| Age Bracket | In Labor Force | Unemployed |
| 16 to 19 Years | 10 (47.6%) | 0 (0.0%) |
| 20 to 24 Years | 2 (100.0%) | 0 (0.0%) |
| 25 to 29 Years | 49 (90.7%) | 0 (0.0%) |
| 30 to 34 Years | 34 (94.4%) | 0 (0.0%) |
| 35 to 44 Years | 65 (94.2%) | 0 (0.0%) |
| 45 to 54 Years | 42 (63.6%) | 3 (7.1%) |
| 55 to 59 Years | 23 (74.2%) | 0 (0.0%) |
| 60 to 64 Years | 33 (63.5%) | 0 (0.0%) |
| 65 to 74 Years | 20 (24.1%) | 0 (0.0%) |
| 75 Years and over | 5 (11.4%) | 0 (0.0%) |
| Total | 283 (61.8%) | 3 (1.1%) |
Employment Status by Educational Attainment in Scottsville
According to labor force statistics for Scottsville, 79.9% of individuals (246) out of the total population between 25 and 64 years of age (308) are in the labor force, with 1.2% or 3 of them being unemployed. The group with the highest labor force participation rate are those with the educational attainment of bachelor's degree or higher, with 91.0% or 101 individuals in the labor force. Within the labor force, individuals with less than high school education have the highest percentage of unemployment, with 20.0% or 1 of them being unemployed.
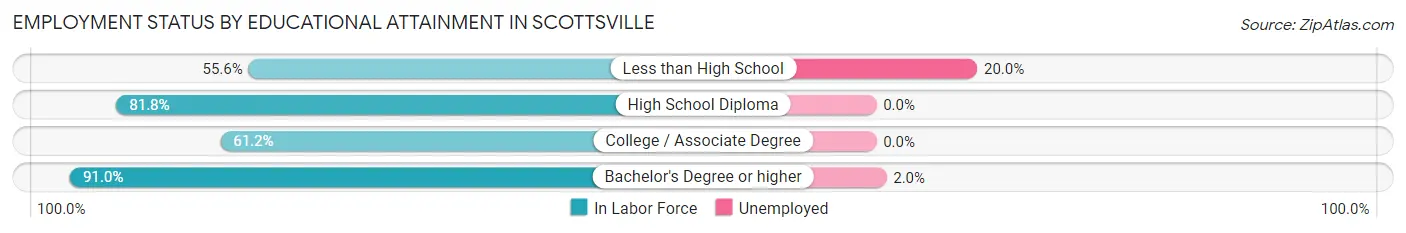
| Educational Attainment | In Labor Force | Unemployed |
| Less than High School | 5 (55.6%) | 2 (20.0%) |
| High School Diploma | 99 (81.8%) | 0 (0.0%) |
| College / Associate Degree | 41 (61.2%) | 0 (0.0%) |
| Bachelor's Degree or higher | 101 (91.0%) | 2 (2.0%) |
| Total | 246 (79.9%) | 4 (1.2%) |
Employment Occupations by Sex in Scottsville
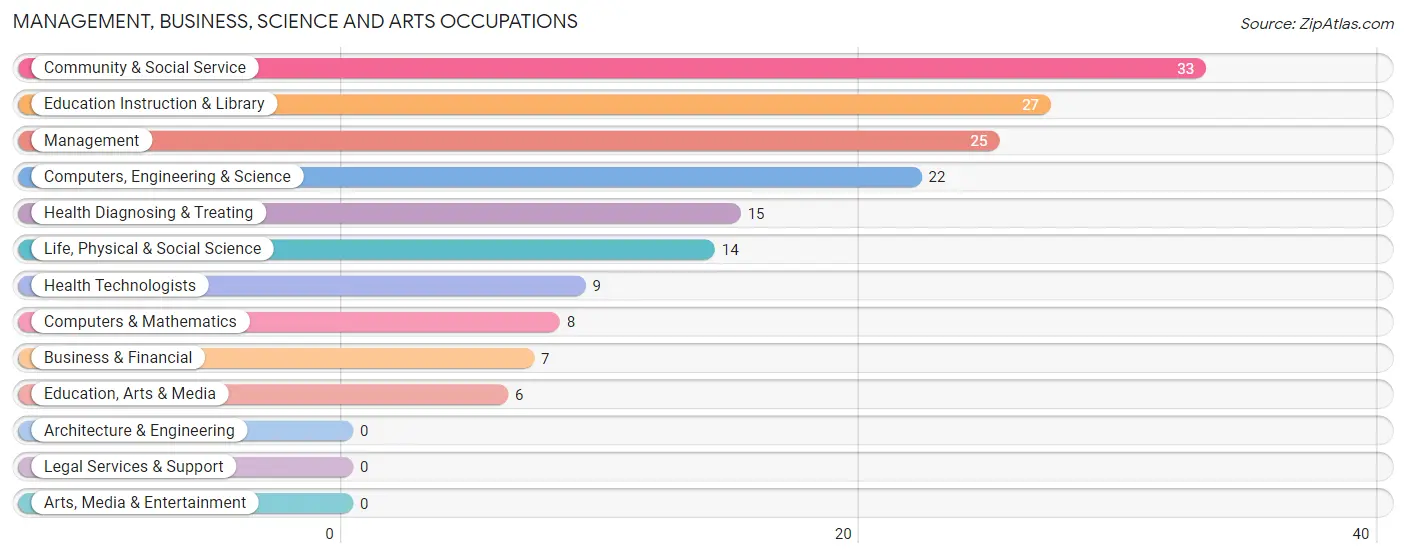
Management, Business, Science and Arts Occupations
The most common Management, Business, Science and Arts occupations in Scottsville are Community & Social Service (33 | 11.8%), Education Instruction & Library (27 | 9.6%), Management (25 | 8.9%), Computers, Engineering & Science (22 | 7.9%), and Health Diagnosing & Treating (15 | 5.4%).
Management, Business, Science and Arts Occupations by Sex
Within the Management, Business, Science and Arts occupations in Scottsville, the most male-oriented occupations are Life, Physical & Social Science (85.7%), Computers, Engineering & Science (63.6%), and Management (56.0%), while the most female-oriented occupations are Education, Arts & Media (100.0%), Community & Social Service (87.9%), and Education Instruction & Library (85.2%).
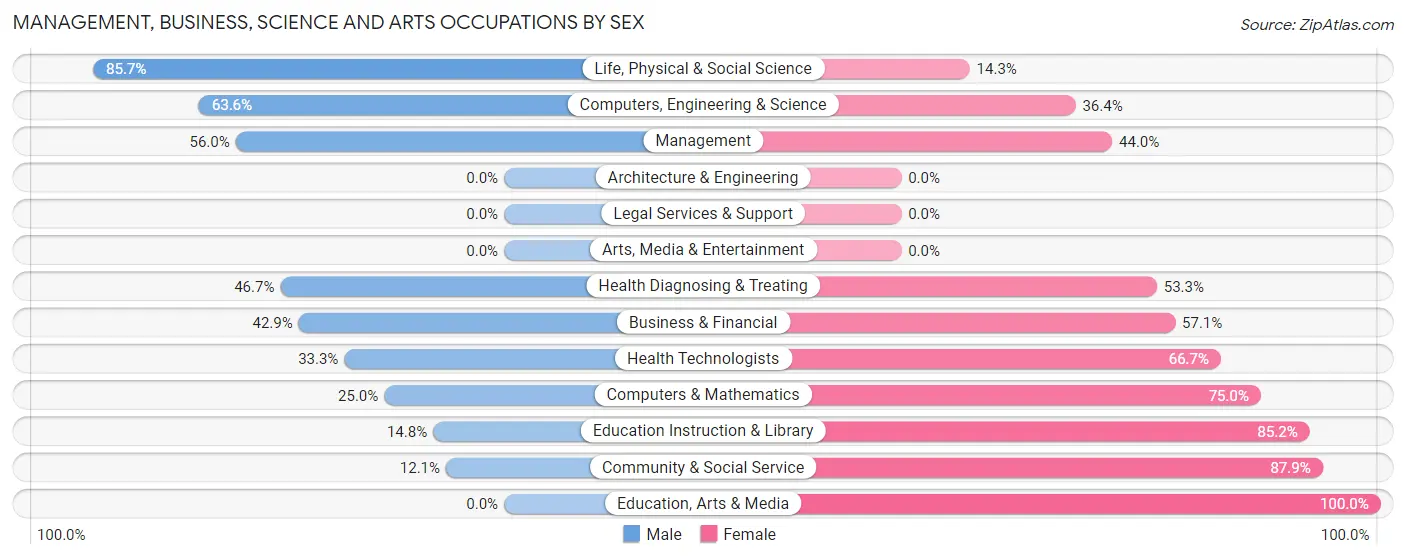
| Occupation | Male | Female |
| Management | 14 (56.0%) | 11 (44.0%) |
| Business & Financial | 3 (42.9%) | 4 (57.1%) |
| Computers, Engineering & Science | 14 (63.6%) | 8 (36.4%) |
| Computers & Mathematics | 2 (25.0%) | 6 (75.0%) |
| Architecture & Engineering | 0 (0.0%) | 0 (0.0%) |
| Life, Physical & Social Science | 12 (85.7%) | 2 (14.3%) |
| Community & Social Service | 4 (12.1%) | 29 (87.9%) |
| Education, Arts & Media | 0 (0.0%) | 6 (100.0%) |
| Legal Services & Support | 0 (0.0%) | 0 (0.0%) |
| Education Instruction & Library | 4 (14.8%) | 23 (85.2%) |
| Arts, Media & Entertainment | 0 (0.0%) | 0 (0.0%) |
| Health Diagnosing & Treating | 7 (46.7%) | 8 (53.3%) |
| Health Technologists | 3 (33.3%) | 6 (66.7%) |
| Total (Category) | 42 (41.2%) | 60 (58.8%) |
| Total (Overall) | 141 (50.4%) | 139 (49.6%) |
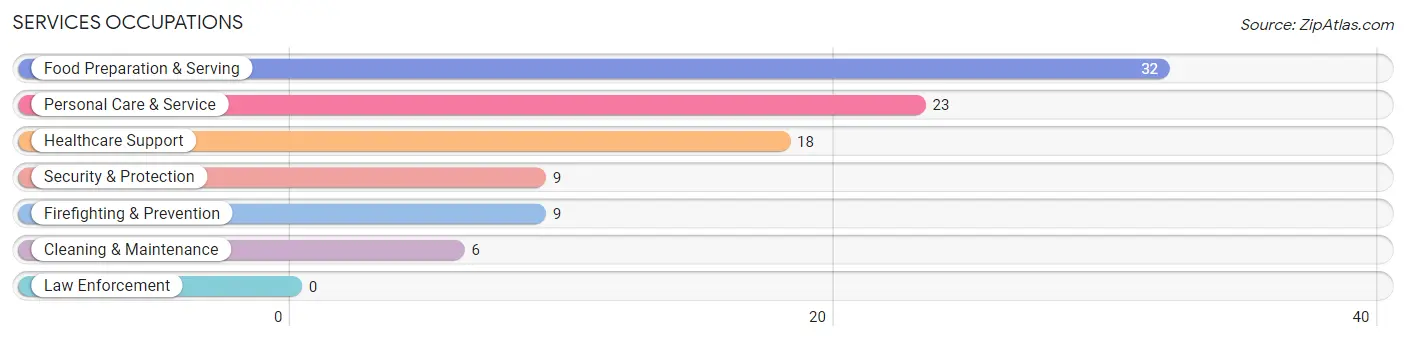
Services Occupations
The most common Services occupations in Scottsville are Food Preparation & Serving (32 | 11.4%), Personal Care & Service (23 | 8.2%), Healthcare Support (18 | 6.4%), Security & Protection (9 | 3.2%), and Firefighting & Prevention (9 | 3.2%).
Services Occupations by Sex
Within the Services occupations in Scottsville, the most male-oriented occupations are Food Preparation & Serving (100.0%), Personal Care & Service (87.0%), and Security & Protection (77.8%), while the most female-oriented occupations are Healthcare Support (100.0%), Cleaning & Maintenance (100.0%), and Security & Protection (22.2%).
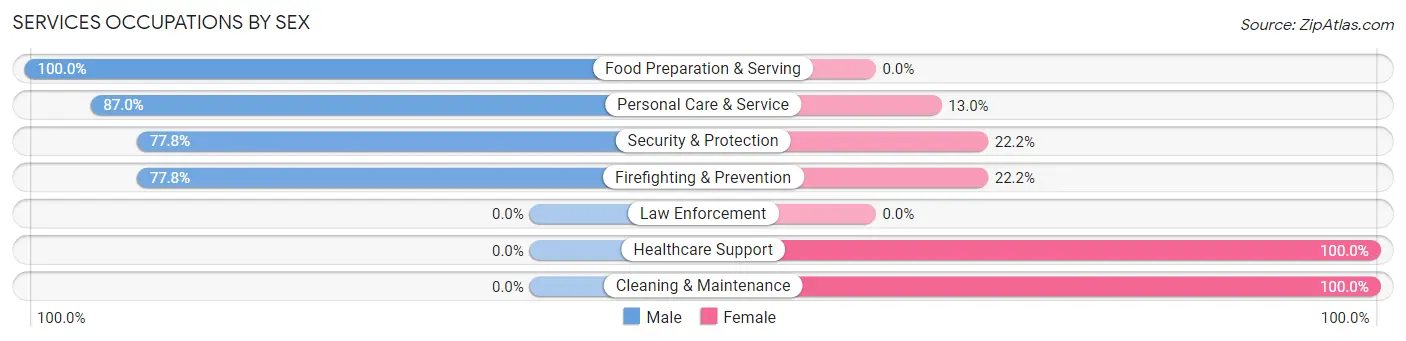
| Occupation | Male | Female |
| Healthcare Support | 0 (0.0%) | 18 (100.0%) |
| Security & Protection | 7 (77.8%) | 2 (22.2%) |
| Firefighting & Prevention | 7 (77.8%) | 2 (22.2%) |
| Law Enforcement | 0 (0.0%) | 0 (0.0%) |
| Food Preparation & Serving | 32 (100.0%) | 0 (0.0%) |
| Cleaning & Maintenance | 0 (0.0%) | 6 (100.0%) |
| Personal Care & Service | 20 (87.0%) | 3 (13.0%) |
| Total (Category) | 59 (67.0%) | 29 (33.0%) |
| Total (Overall) | 141 (50.4%) | 139 (49.6%) |
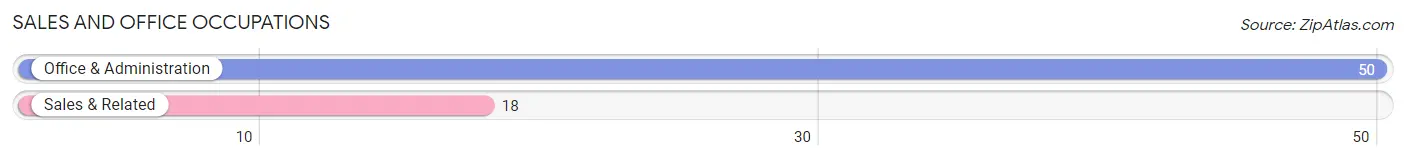
Sales and Office Occupations
The most common Sales and Office occupations in Scottsville are Office & Administration (50 | 17.9%), and Sales & Related (18 | 6.4%).
Sales and Office Occupations by Sex
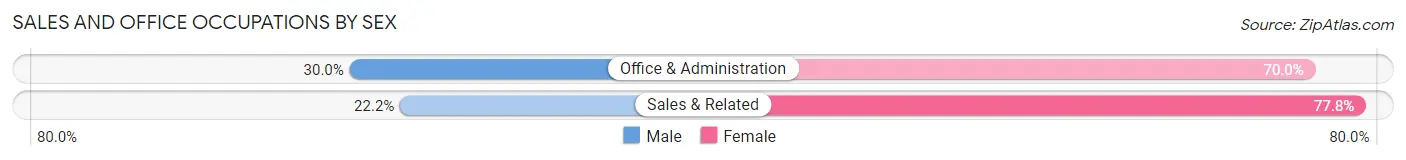
| Occupation | Male | Female |
| Sales & Related | 4 (22.2%) | 14 (77.8%) |
| Office & Administration | 15 (30.0%) | 35 (70.0%) |
| Total (Category) | 19 (27.9%) | 49 (72.1%) |
| Total (Overall) | 141 (50.4%) | 139 (49.6%) |
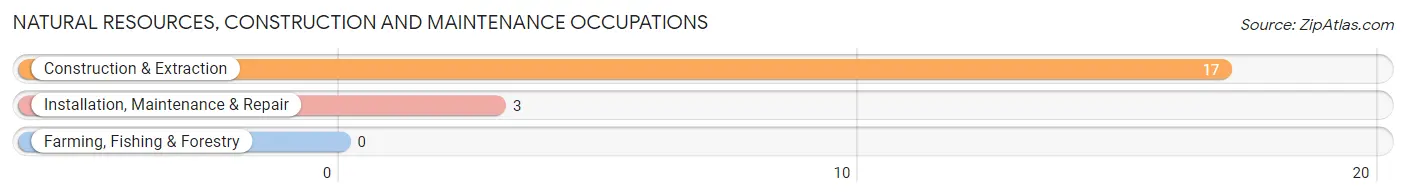
Natural Resources, Construction and Maintenance Occupations
The most common Natural Resources, Construction and Maintenance occupations in Scottsville are Construction & Extraction (17 | 6.1%), and Installation, Maintenance & Repair (3 | 1.1%).
Natural Resources, Construction and Maintenance Occupations by Sex
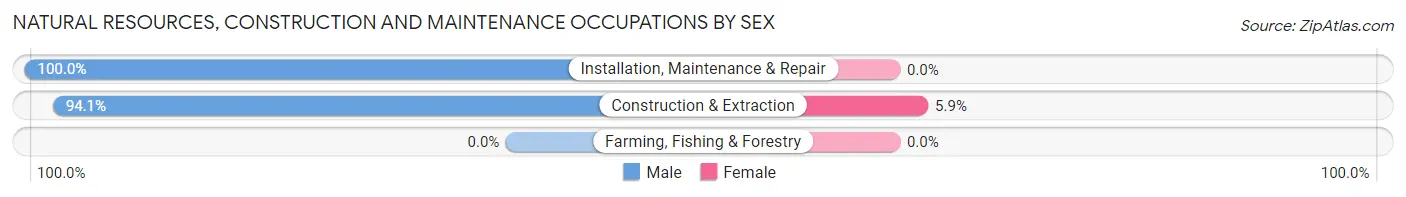
| Occupation | Male | Female |
| Farming, Fishing & Forestry | 0 (0.0%) | 0 (0.0%) |
| Construction & Extraction | 16 (94.1%) | 1 (5.9%) |
| Installation, Maintenance & Repair | 3 (100.0%) | 0 (0.0%) |
| Total (Category) | 19 (95.0%) | 1 (5.0%) |
| Total (Overall) | 141 (50.4%) | 139 (49.6%) |
Production, Transportation and Moving Occupations
The most common Production, Transportation and Moving occupations in Scottsville are , and Production (2 | 0.7%).
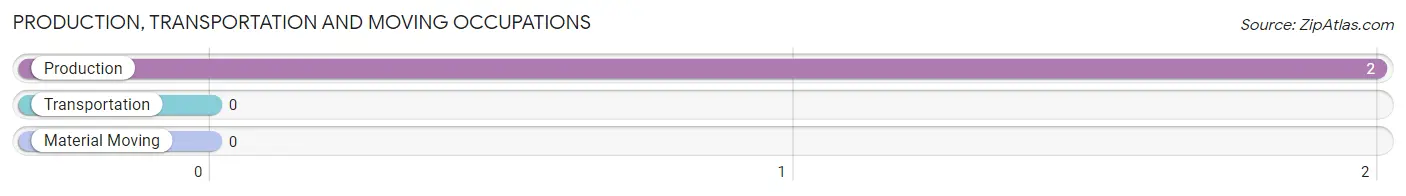
Production, Transportation and Moving Occupations by Sex
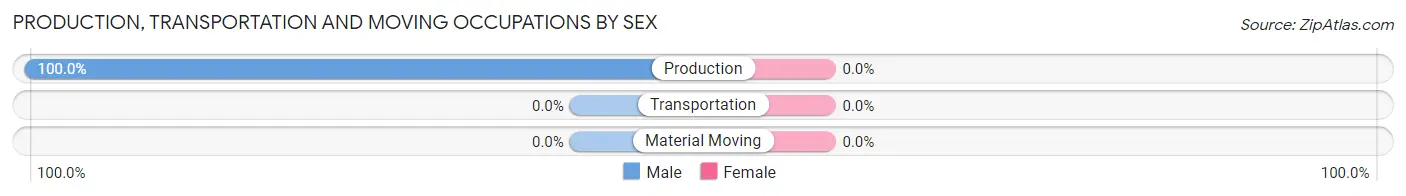
| Occupation | Male | Female |
| Production | 2 (100.0%) | 0 (0.0%) |
| Transportation | 0 (0.0%) | 0 (0.0%) |
| Material Moving | 0 (0.0%) | 0 (0.0%) |
| Total (Category) | 2 (100.0%) | 0 (0.0%) |
| Total (Overall) | 141 (50.4%) | 139 (49.6%) |
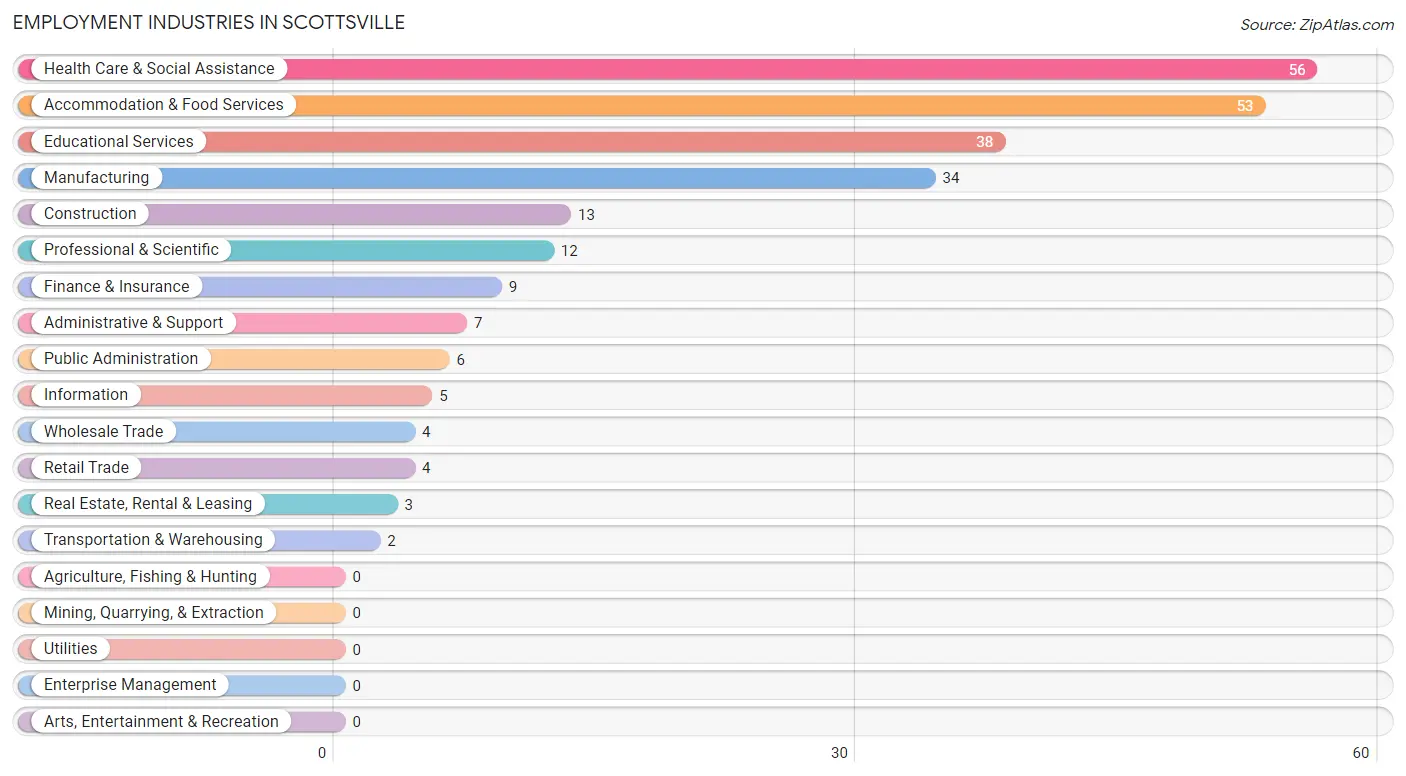
Employment Industries by Sex in Scottsville
Employment Industries in Scottsville
The major employment industries in Scottsville include Health Care & Social Assistance (56 | 20.0%), Accommodation & Food Services (53 | 18.9%), Educational Services (38 | 13.6%), Manufacturing (34 | 12.1%), and Construction (13 | 4.6%).
Employment Industries by Sex in Scottsville
The Scottsville industries that see more men than women are Wholesale Trade (100.0%), Retail Trade (100.0%), and Transportation & Warehousing (100.0%), whereas the industries that tend to have a higher number of women are Information (100.0%), Finance & Insurance (100.0%), and Real Estate, Rental & Leasing (100.0%).
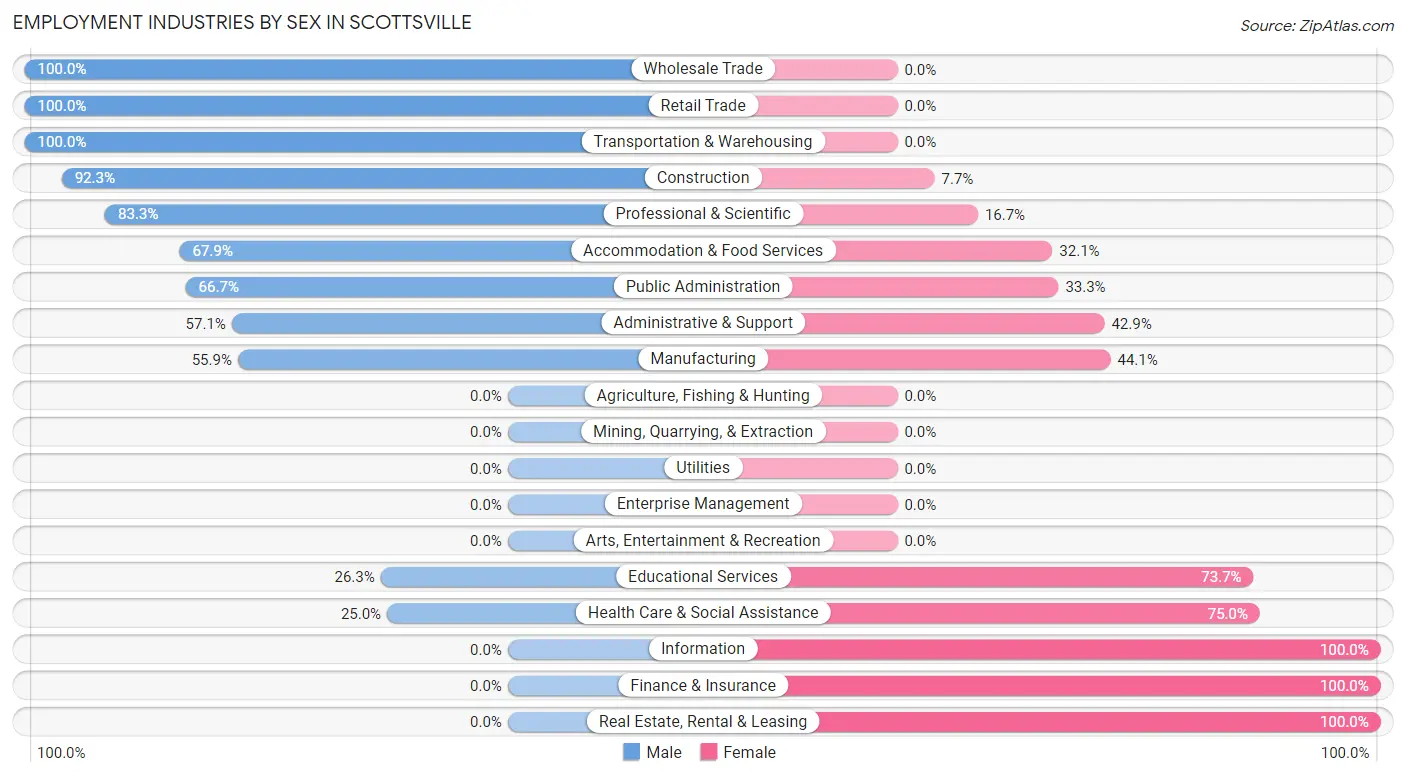
| Industry | Male | Female |
| Agriculture, Fishing & Hunting | 0 (0.0%) | 0 (0.0%) |
| Mining, Quarrying, & Extraction | 0 (0.0%) | 0 (0.0%) |
| Construction | 12 (92.3%) | 1 (7.7%) |
| Manufacturing | 19 (55.9%) | 15 (44.1%) |
| Wholesale Trade | 4 (100.0%) | 0 (0.0%) |
| Retail Trade | 4 (100.0%) | 0 (0.0%) |
| Transportation & Warehousing | 2 (100.0%) | 0 (0.0%) |
| Utilities | 0 (0.0%) | 0 (0.0%) |
| Information | 0 (0.0%) | 5 (100.0%) |
| Finance & Insurance | 0 (0.0%) | 9 (100.0%) |
| Real Estate, Rental & Leasing | 0 (0.0%) | 3 (100.0%) |
| Professional & Scientific | 10 (83.3%) | 2 (16.7%) |
| Enterprise Management | 0 (0.0%) | 0 (0.0%) |
| Administrative & Support | 4 (57.1%) | 3 (42.9%) |
| Educational Services | 10 (26.3%) | 28 (73.7%) |
| Health Care & Social Assistance | 14 (25.0%) | 42 (75.0%) |
| Arts, Entertainment & Recreation | 0 (0.0%) | 0 (0.0%) |
| Accommodation & Food Services | 36 (67.9%) | 17 (32.1%) |
| Public Administration | 4 (66.7%) | 2 (33.3%) |
| Total | 141 (50.4%) | 139 (49.6%) |
Education in Scottsville
School Enrollment in Scottsville
The most common levels of schooling among the 127 students in Scottsville are elementary school (48 | 37.8%), high school (32 | 25.2%), and middle school (30 | 23.6%).
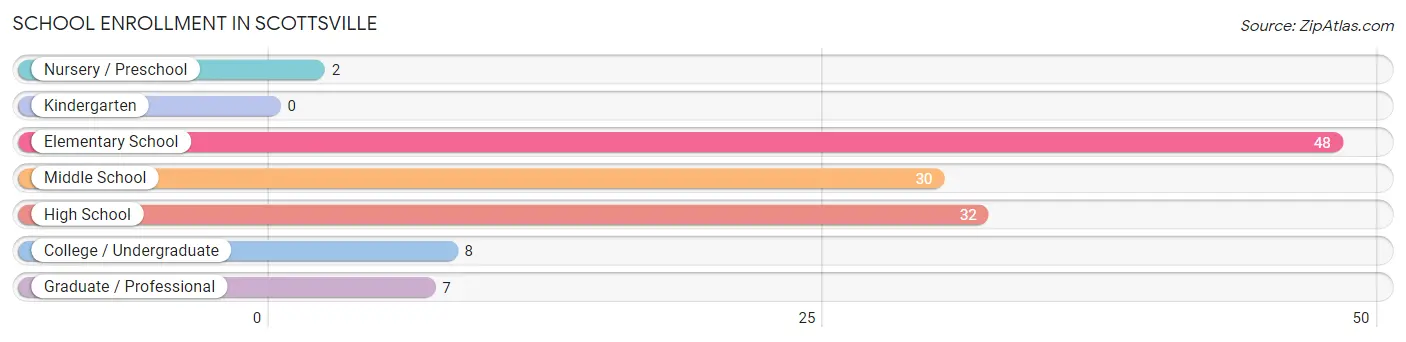
| School Level | # Students | % Students |
| Nursery / Preschool | 2 | 1.6% |
| Kindergarten | 0 | 0.0% |
| Elementary School | 48 | 37.8% |
| Middle School | 30 | 23.6% |
| High School | 32 | 25.2% |
| College / Undergraduate | 8 | 6.3% |
| Graduate / Professional | 7 | 5.5% |
| Total | 127 | 100.0% |
School Enrollment by Age by Funding Source in Scottsville
Out of a total of 127 students who are enrolled in schools in Scottsville, 35 (27.6%) attend a private institution, while the remaining 92 (72.4%) are enrolled in public schools. The age group of 3 to 4 year olds has the highest likelihood of being enrolled in private schools, with 2 (100.0% in the age bracket) enrolled. Conversely, the age group of 10 to 14 year olds has the lowest likelihood of being enrolled in a private school, with 34 (91.9% in the age bracket) attending a public institution.

| Age Bracket | Public School | Private School |
| 3 to 4 Year Olds | 0 (0.0%) | 2 (100.0%) |
| 5 to 9 Year Old | 25 (56.8%) | 19 (43.2%) |
| 10 to 14 Year Olds | 34 (91.9%) | 3 (8.1%) |
| 15 to 17 Year Olds | 23 (79.3%) | 6 (20.7%) |
| 18 to 19 Year Olds | 0 (0.0%) | 0 (0.0%) |
| 20 to 24 Year Olds | 0 (0.0%) | 0 (0.0%) |
| 25 to 34 Year Olds | 7 (77.8%) | 2 (22.2%) |
| 35 Years and over | 3 (50.0%) | 3 (50.0%) |
| Total | 92 (72.4%) | 35 (27.6%) |
Educational Attainment by Field of Study in Scottsville
Business (29 | 17.7%), science & technology (19 | 11.6%), social sciences (18 | 11.0%), education (17 | 10.4%), and liberal arts & history (14 | 8.5%) are the most common fields of study among 164 individuals in Scottsville who have obtained a bachelor's degree or higher.
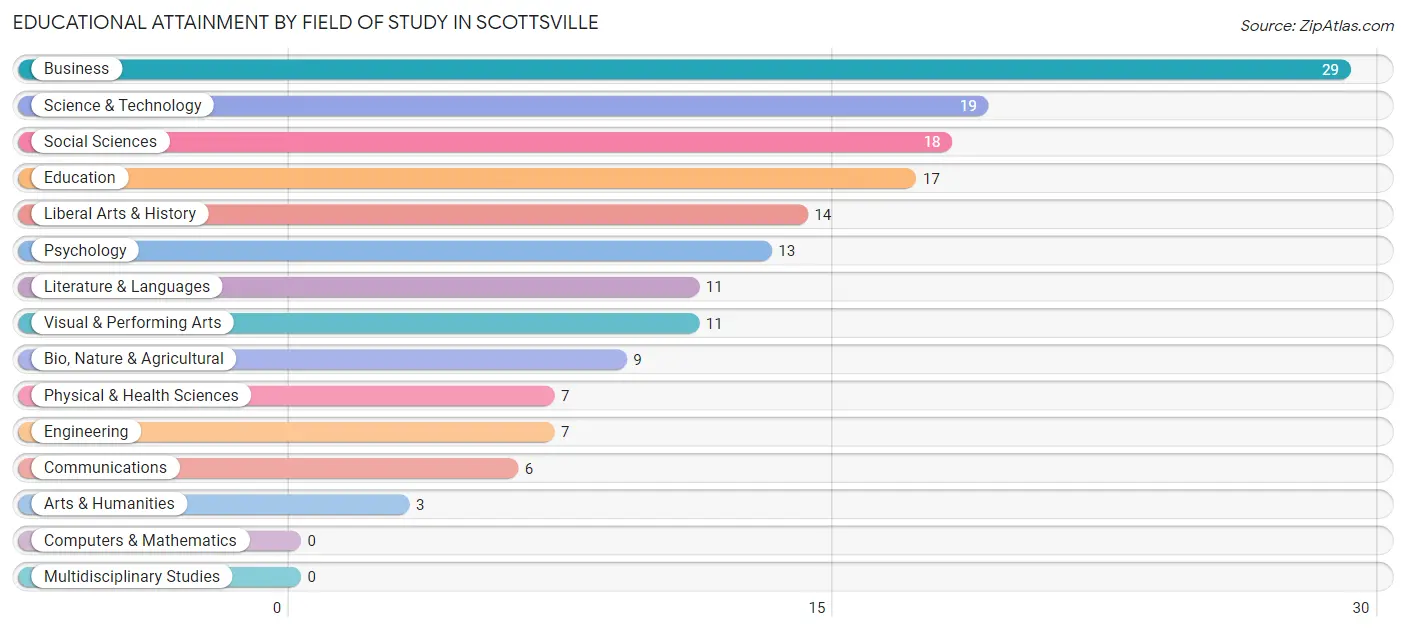
| Field of Study | # Graduates | % Graduates |
| Computers & Mathematics | 0 | 0.0% |
| Bio, Nature & Agricultural | 9 | 5.5% |
| Physical & Health Sciences | 7 | 4.3% |
| Psychology | 13 | 7.9% |
| Social Sciences | 18 | 11.0% |
| Engineering | 7 | 4.3% |
| Multidisciplinary Studies | 0 | 0.0% |
| Science & Technology | 19 | 11.6% |
| Business | 29 | 17.7% |
| Education | 17 | 10.4% |
| Literature & Languages | 11 | 6.7% |
| Liberal Arts & History | 14 | 8.5% |
| Visual & Performing Arts | 11 | 6.7% |
| Communications | 6 | 3.7% |
| Arts & Humanities | 3 | 1.8% |
| Total | 164 | 100.0% |
Transportation & Commute in Scottsville
Vehicle Availability by Sex in Scottsville
The most prevalent vehicle ownership categories in Scottsville are males with 1 vehicle (45, accounting for 31.9%) and females with 1 vehicle (23, making up 36.0%).
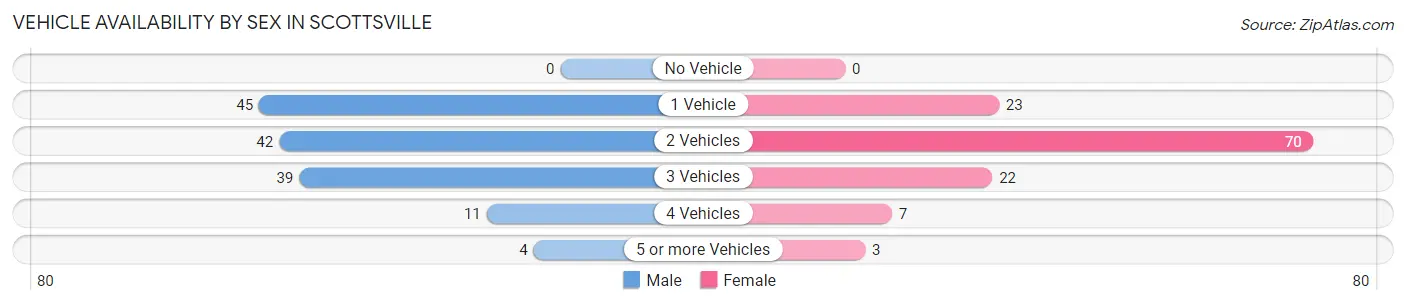
| Vehicles Available | Male | Female |
| No Vehicle | 0 (0.0%) | 0 (0.0%) |
| 1 Vehicle | 45 (31.9%) | 23 (18.4%) |
| 2 Vehicles | 42 (29.8%) | 70 (56.0%) |
| 3 Vehicles | 39 (27.7%) | 22 (17.6%) |
| 4 Vehicles | 11 (7.8%) | 7 (5.6%) |
| 5 or more Vehicles | 4 (2.8%) | 3 (2.4%) |
| Total | 141 (100.0%) | 125 (100.0%) |
Commute Time in Scottsville
The most frequently occuring commute durations in Scottsville are 30 to 34 minutes (47 commuters, 18.9%), 40 to 44 minutes (43 commuters, 17.3%), and less than 5 minutes (29 commuters, 11.7%).
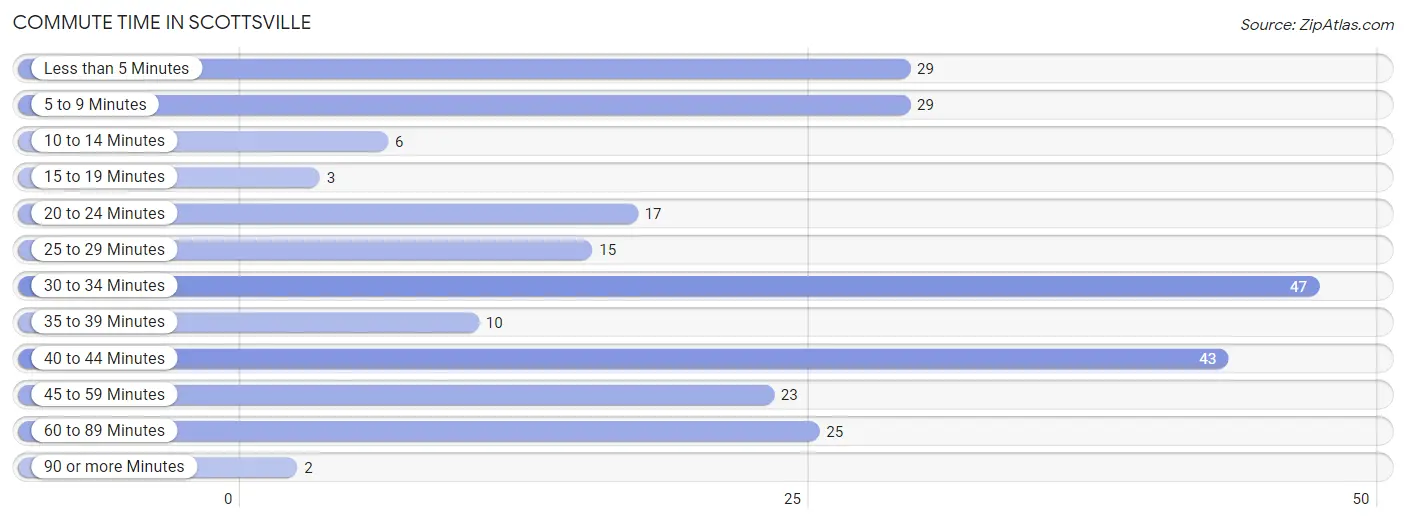
| Commute Time | # Commuters | % Commuters |
| Less than 5 Minutes | 29 | 11.7% |
| 5 to 9 Minutes | 29 | 11.7% |
| 10 to 14 Minutes | 6 | 2.4% |
| 15 to 19 Minutes | 3 | 1.2% |
| 20 to 24 Minutes | 17 | 6.8% |
| 25 to 29 Minutes | 15 | 6.0% |
| 30 to 34 Minutes | 47 | 18.9% |
| 35 to 39 Minutes | 10 | 4.0% |
| 40 to 44 Minutes | 43 | 17.3% |
| 45 to 59 Minutes | 23 | 9.2% |
| 60 to 89 Minutes | 25 | 10.0% |
| 90 or more Minutes | 2 | 0.8% |
Commute Time by Sex in Scottsville
The most common commute times in Scottsville are 5 to 9 minutes (28 commuters, 21.2%) for males and 40 to 44 minutes (36 commuters, 30.8%) for females.
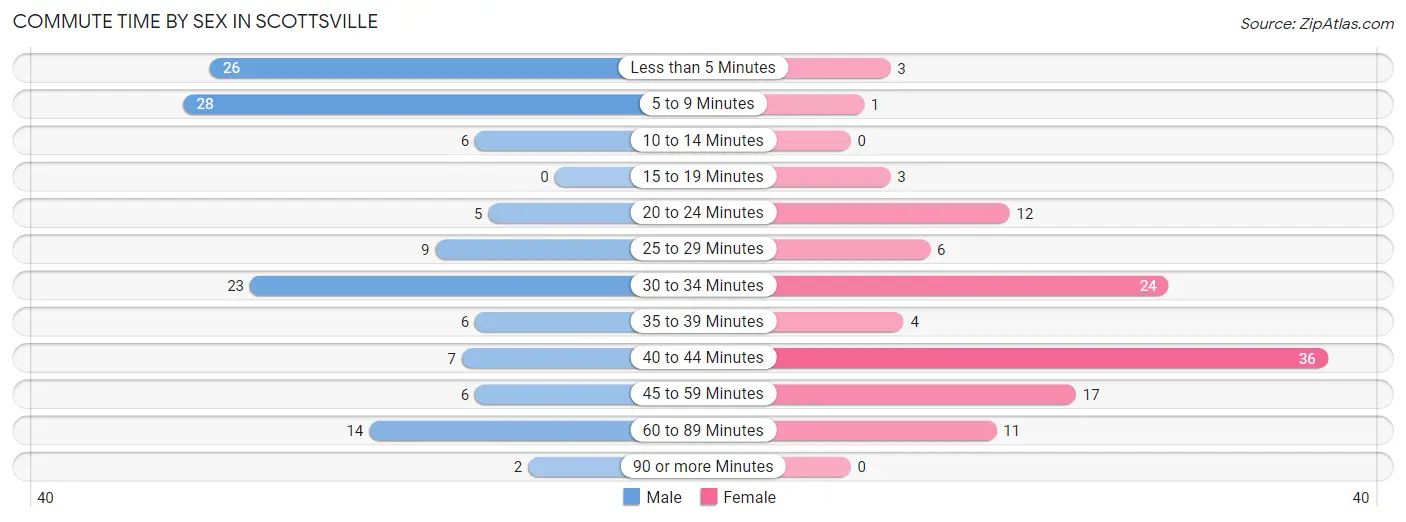
| Commute Time | Male | Female |
| Less than 5 Minutes | 26 (19.7%) | 3 (2.6%) |
| 5 to 9 Minutes | 28 (21.2%) | 1 (0.9%) |
| 10 to 14 Minutes | 6 (4.5%) | 0 (0.0%) |
| 15 to 19 Minutes | 0 (0.0%) | 3 (2.6%) |
| 20 to 24 Minutes | 5 (3.8%) | 12 (10.3%) |
| 25 to 29 Minutes | 9 (6.8%) | 6 (5.1%) |
| 30 to 34 Minutes | 23 (17.4%) | 24 (20.5%) |
| 35 to 39 Minutes | 6 (4.5%) | 4 (3.4%) |
| 40 to 44 Minutes | 7 (5.3%) | 36 (30.8%) |
| 45 to 59 Minutes | 6 (4.5%) | 17 (14.5%) |
| 60 to 89 Minutes | 14 (10.6%) | 11 (9.4%) |
| 90 or more Minutes | 2 (1.5%) | 0 (0.0%) |
Time of Departure to Work by Sex in Scottsville
The most frequent times of departure to work in Scottsville are 7:00 AM to 7:29 AM (53, 40.2%) for males and 8:00 AM to 8:29 AM (31, 26.5%) for females.
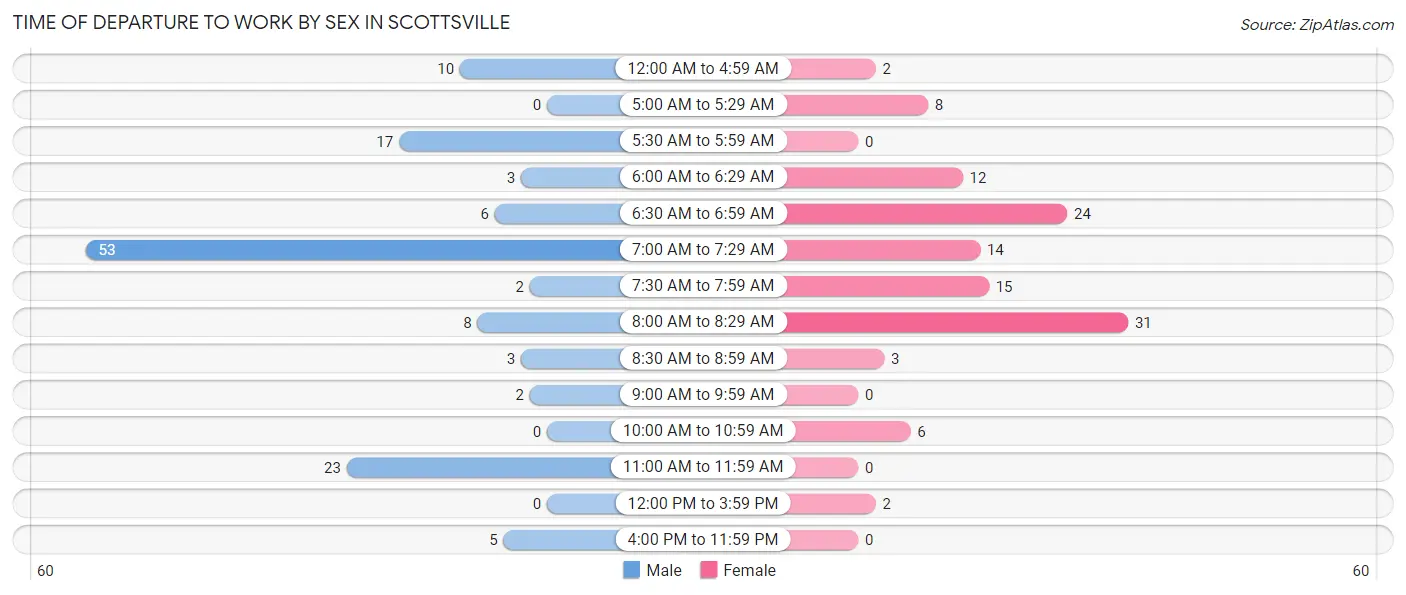
| Time of Departure | Male | Female |
| 12:00 AM to 4:59 AM | 10 (7.6%) | 2 (1.7%) |
| 5:00 AM to 5:29 AM | 0 (0.0%) | 8 (6.8%) |
| 5:30 AM to 5:59 AM | 17 (12.9%) | 0 (0.0%) |
| 6:00 AM to 6:29 AM | 3 (2.3%) | 12 (10.3%) |
| 6:30 AM to 6:59 AM | 6 (4.5%) | 24 (20.5%) |
| 7:00 AM to 7:29 AM | 53 (40.2%) | 14 (12.0%) |
| 7:30 AM to 7:59 AM | 2 (1.5%) | 15 (12.8%) |
| 8:00 AM to 8:29 AM | 8 (6.1%) | 31 (26.5%) |
| 8:30 AM to 8:59 AM | 3 (2.3%) | 3 (2.6%) |
| 9:00 AM to 9:59 AM | 2 (1.5%) | 0 (0.0%) |
| 10:00 AM to 10:59 AM | 0 (0.0%) | 6 (5.1%) |
| 11:00 AM to 11:59 AM | 23 (17.4%) | 0 (0.0%) |
| 12:00 PM to 3:59 PM | 0 (0.0%) | 2 (1.7%) |
| 4:00 PM to 11:59 PM | 5 (3.8%) | 0 (0.0%) |
| Total | 132 (100.0%) | 117 (100.0%) |
Housing Occupancy in Scottsville
Occupancy by Ownership in Scottsville
Of the total 270 dwellings in Scottsville, owner-occupied units account for 153 (56.7%), while renter-occupied units make up 117 (43.3%).
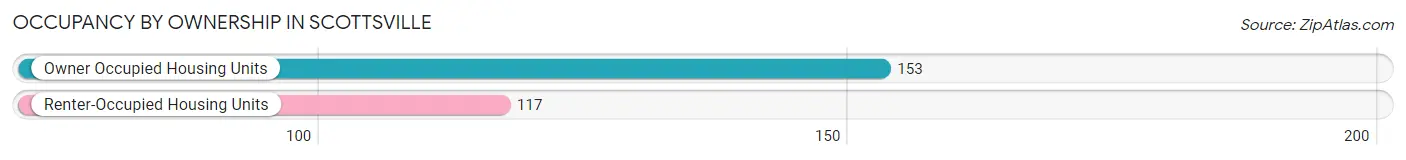
| Occupancy | # Housing Units | % Housing Units |
| Owner Occupied Housing Units | 153 | 56.7% |
| Renter-Occupied Housing Units | 117 | 43.3% |
| Total Occupied Housing Units | 270 | 100.0% |
Occupancy by Household Size in Scottsville
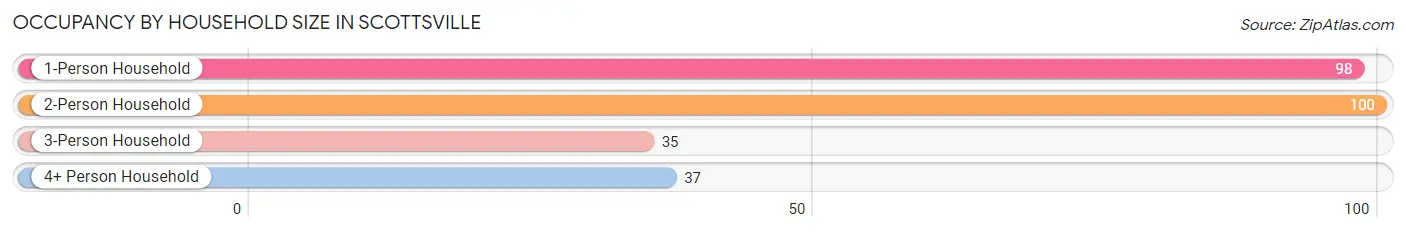
| Household Size | # Housing Units | % Housing Units |
| 1-Person Household | 98 | 36.3% |
| 2-Person Household | 100 | 37.0% |
| 3-Person Household | 35 | 13.0% |
| 4+ Person Household | 37 | 13.7% |
| Total Housing Units | 270 | 100.0% |
Occupancy by Ownership by Household Size in Scottsville
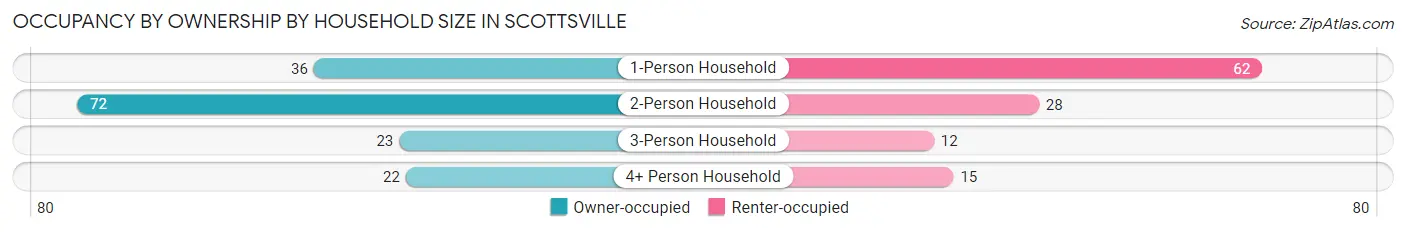
| Household Size | Owner-occupied | Renter-occupied |
| 1-Person Household | 36 (36.7%) | 62 (63.3%) |
| 2-Person Household | 72 (72.0%) | 28 (28.0%) |
| 3-Person Household | 23 (65.7%) | 12 (34.3%) |
| 4+ Person Household | 22 (59.5%) | 15 (40.5%) |
| Total Housing Units | 153 (56.7%) | 117 (43.3%) |
Occupancy by Educational Attainment in Scottsville
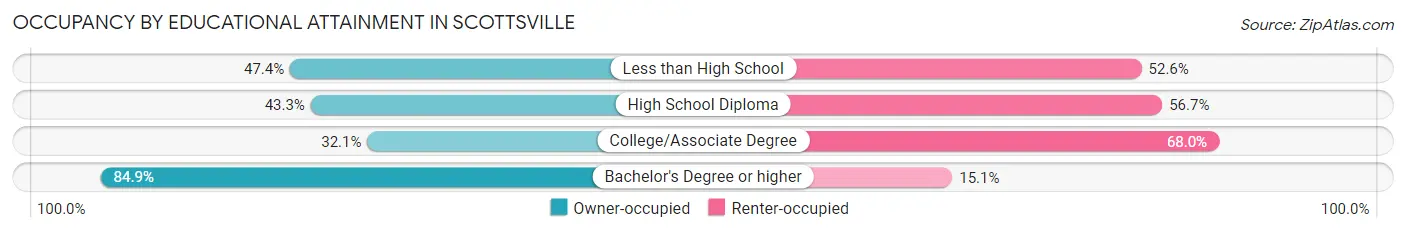
| Household Size | Owner-occupied | Renter-occupied |
| Less than High School | 9 (47.4%) | 10 (52.6%) |
| High School Diploma | 29 (43.3%) | 38 (56.7%) |
| College/Associate Degree | 25 (32.1%) | 53 (67.9%) |
| Bachelor's Degree or higher | 90 (84.9%) | 16 (15.1%) |
Occupancy by Age of Householder in Scottsville
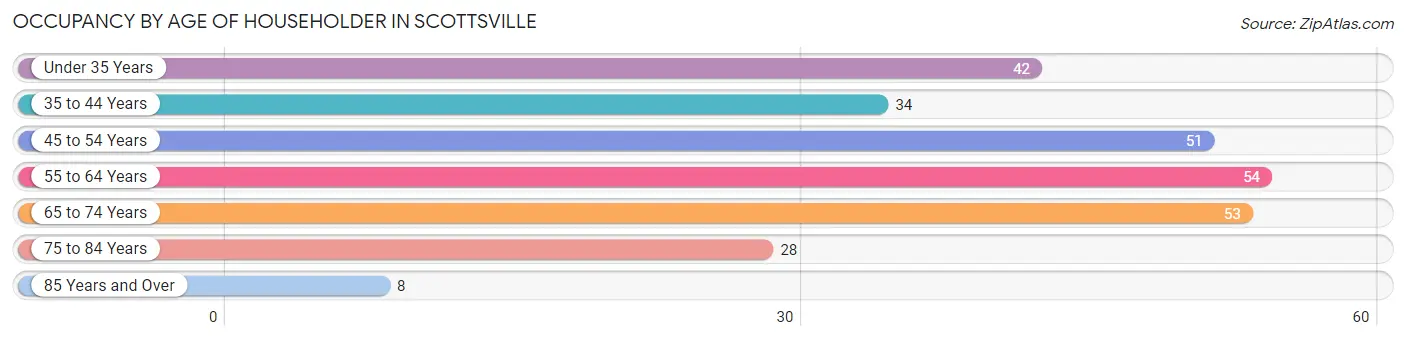
| Age Bracket | # Households | % Households |
| Under 35 Years | 42 | 15.6% |
| 35 to 44 Years | 34 | 12.6% |
| 45 to 54 Years | 51 | 18.9% |
| 55 to 64 Years | 54 | 20.0% |
| 65 to 74 Years | 53 | 19.6% |
| 75 to 84 Years | 28 | 10.4% |
| 85 Years and Over | 8 | 3.0% |
| Total | 270 | 100.0% |
Housing Finances in Scottsville
Median Income by Occupancy in Scottsville
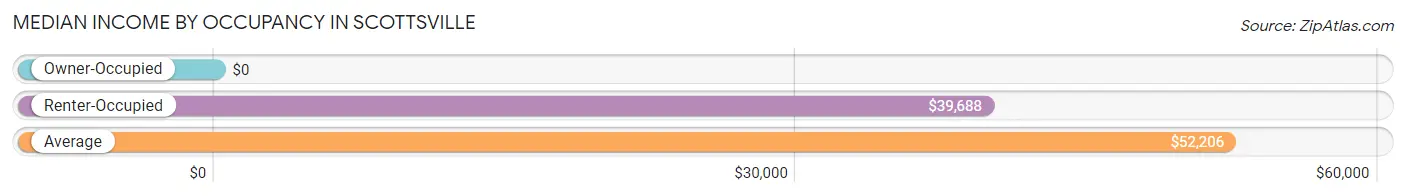
| Occupancy Type | # Households | Median Income |
| Owner-Occupied | 153 (56.7%) | $0 |
| Renter-Occupied | 117 (43.3%) | $39,688 |
| Average | 270 (100.0%) | $52,206 |
Occupancy by Householder Income Bracket in Scottsville
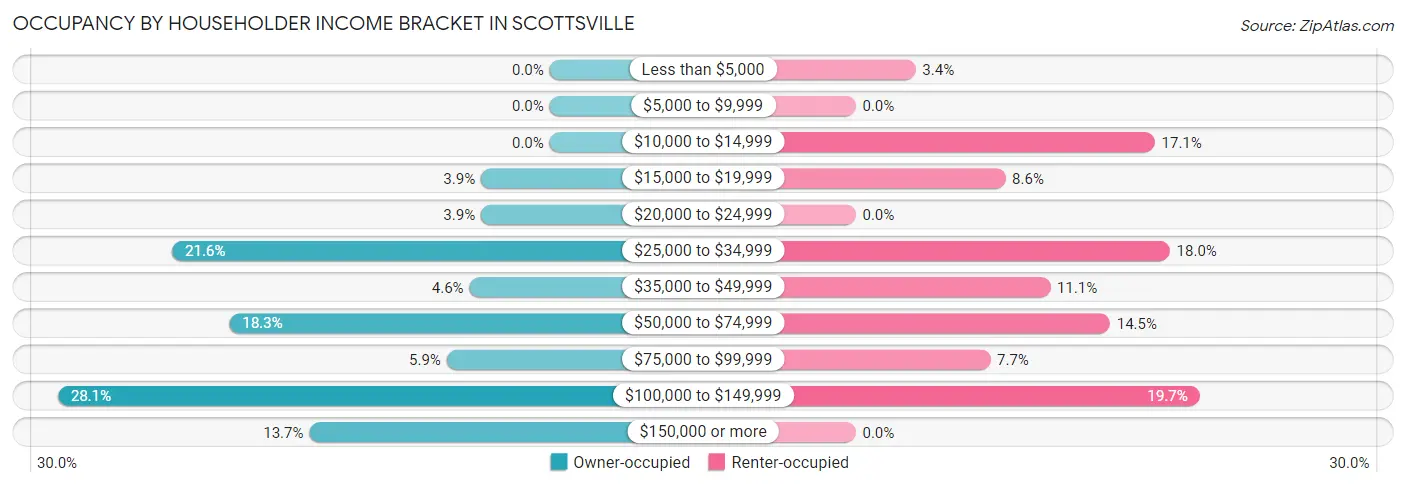
| Income Bracket | Owner-occupied | Renter-occupied |
| Less than $5,000 | 0 (0.0%) | 4 (3.4%) |
| $5,000 to $9,999 | 0 (0.0%) | 0 (0.0%) |
| $10,000 to $14,999 | 0 (0.0%) | 20 (17.1%) |
| $15,000 to $19,999 | 6 (3.9%) | 10 (8.6%) |
| $20,000 to $24,999 | 6 (3.9%) | 0 (0.0%) |
| $25,000 to $34,999 | 33 (21.6%) | 21 (17.9%) |
| $35,000 to $49,999 | 7 (4.6%) | 13 (11.1%) |
| $50,000 to $74,999 | 28 (18.3%) | 17 (14.5%) |
| $75,000 to $99,999 | 9 (5.9%) | 9 (7.7%) |
| $100,000 to $149,999 | 43 (28.1%) | 23 (19.7%) |
| $150,000 or more | 21 (13.7%) | 0 (0.0%) |
| Total | 153 (100.0%) | 117 (100.0%) |
Monthly Housing Cost Tiers in Scottsville
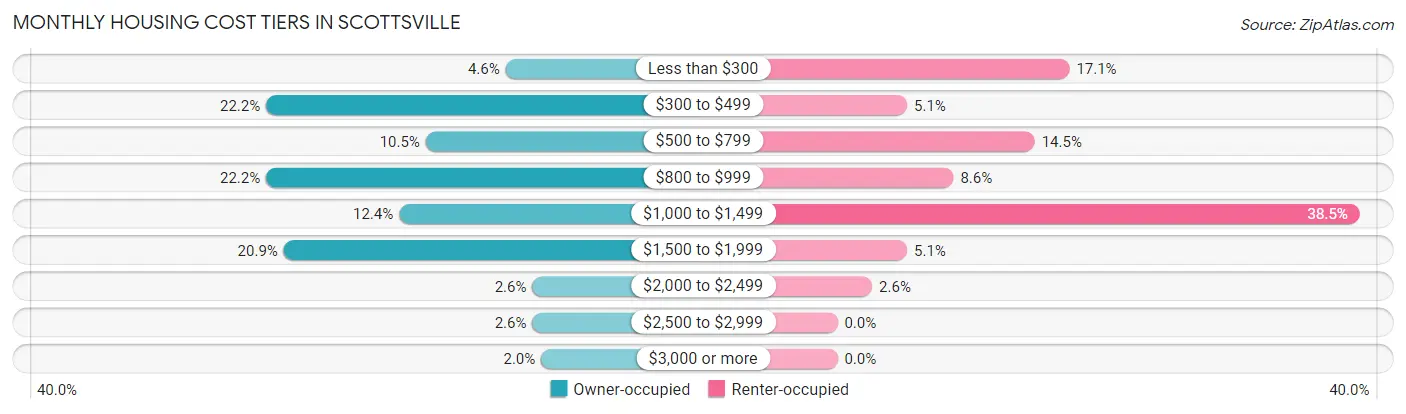
| Monthly Cost | Owner-occupied | Renter-occupied |
| Less than $300 | 7 (4.6%) | 20 (17.1%) |
| $300 to $499 | 34 (22.2%) | 6 (5.1%) |
| $500 to $799 | 16 (10.5%) | 17 (14.5%) |
| $800 to $999 | 34 (22.2%) | 10 (8.6%) |
| $1,000 to $1,499 | 19 (12.4%) | 45 (38.5%) |
| $1,500 to $1,999 | 32 (20.9%) | 6 (5.1%) |
| $2,000 to $2,499 | 4 (2.6%) | 3 (2.6%) |
| $2,500 to $2,999 | 4 (2.6%) | 0 (0.0%) |
| $3,000 or more | 3 (2.0%) | 0 (0.0%) |
| Total | 153 (100.0%) | 117 (100.0%) |
Physical Housing Characteristics in Scottsville
Housing Structures in Scottsville
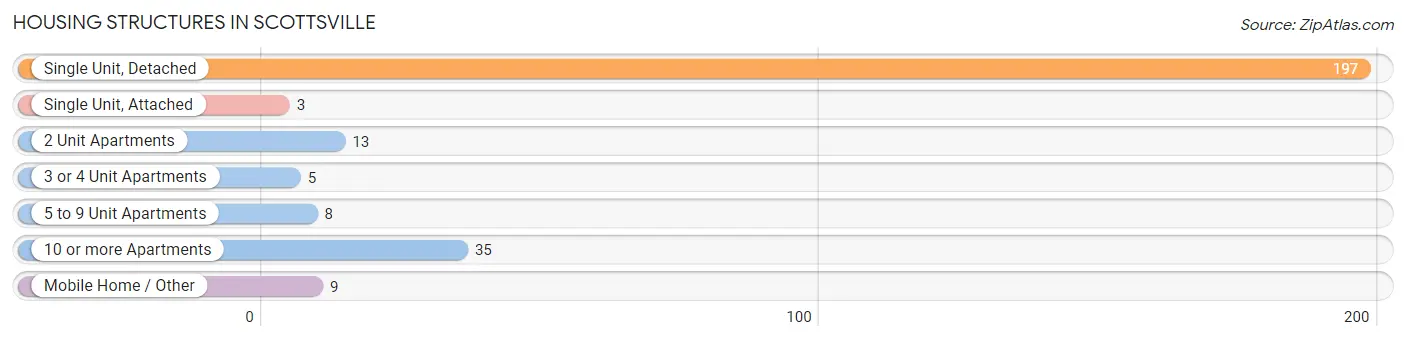
| Structure Type | # Housing Units | % Housing Units |
| Single Unit, Detached | 197 | 73.0% |
| Single Unit, Attached | 3 | 1.1% |
| 2 Unit Apartments | 13 | 4.8% |
| 3 or 4 Unit Apartments | 5 | 1.8% |
| 5 to 9 Unit Apartments | 8 | 3.0% |
| 10 or more Apartments | 35 | 13.0% |
| Mobile Home / Other | 9 | 3.3% |
| Total | 270 | 100.0% |
Housing Structures by Occupancy in Scottsville
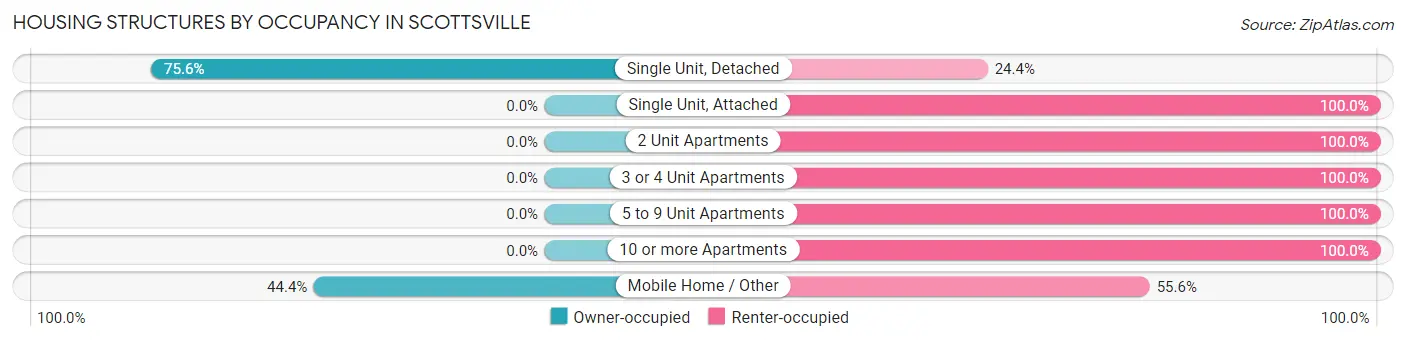
| Structure Type | Owner-occupied | Renter-occupied |
| Single Unit, Detached | 149 (75.6%) | 48 (24.4%) |
| Single Unit, Attached | 0 (0.0%) | 3 (100.0%) |
| 2 Unit Apartments | 0 (0.0%) | 13 (100.0%) |
| 3 or 4 Unit Apartments | 0 (0.0%) | 5 (100.0%) |
| 5 to 9 Unit Apartments | 0 (0.0%) | 8 (100.0%) |
| 10 or more Apartments | 0 (0.0%) | 35 (100.0%) |
| Mobile Home / Other | 4 (44.4%) | 5 (55.6%) |
| Total | 153 (56.7%) | 117 (43.3%) |
Housing Structures by Number of Rooms in Scottsville
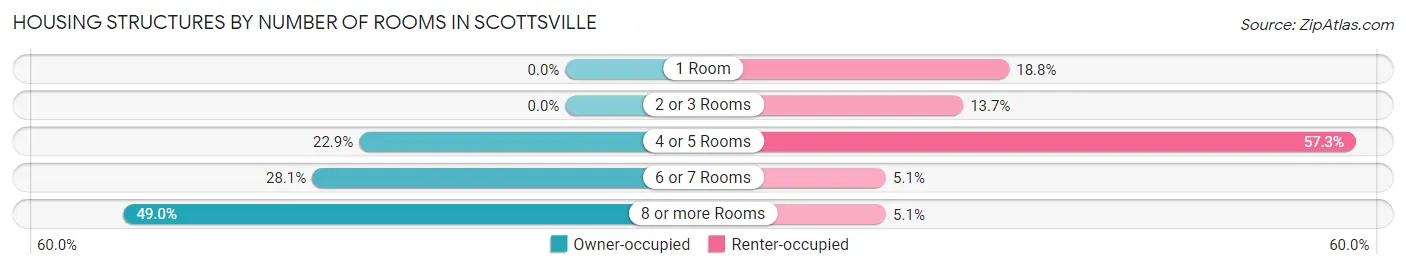
| Number of Rooms | Owner-occupied | Renter-occupied |
| 1 Room | 0 (0.0%) | 22 (18.8%) |
| 2 or 3 Rooms | 0 (0.0%) | 16 (13.7%) |
| 4 or 5 Rooms | 35 (22.9%) | 67 (57.3%) |
| 6 or 7 Rooms | 43 (28.1%) | 6 (5.1%) |
| 8 or more Rooms | 75 (49.0%) | 6 (5.1%) |
| Total | 153 (100.0%) | 117 (100.0%) |
Housing Structure by Heating Type in Scottsville
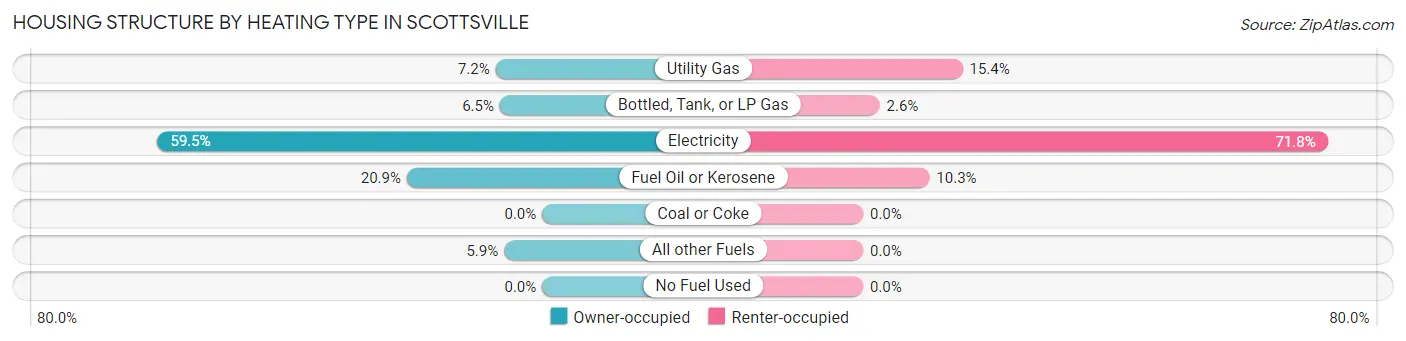
| Heating Type | Owner-occupied | Renter-occupied |
| Utility Gas | 11 (7.2%) | 18 (15.4%) |
| Bottled, Tank, or LP Gas | 10 (6.5%) | 3 (2.6%) |
| Electricity | 91 (59.5%) | 84 (71.8%) |
| Fuel Oil or Kerosene | 32 (20.9%) | 12 (10.3%) |
| Coal or Coke | 0 (0.0%) | 0 (0.0%) |
| All other Fuels | 9 (5.9%) | 0 (0.0%) |
| No Fuel Used | 0 (0.0%) | 0 (0.0%) |
| Total | 153 (100.0%) | 117 (100.0%) |
Household Vehicle Usage in Scottsville

| Vehicles per Household | Owner-occupied | Renter-occupied |
| No Vehicle | 0 (0.0%) | 26 (22.2%) |
| 1 Vehicle | 36 (23.5%) | 41 (35.0%) |
| 2 Vehicles | 48 (31.4%) | 41 (35.0%) |
| 3 or more Vehicles | 69 (45.1%) | 9 (7.7%) |
| Total | 153 (100.0%) | 117 (100.0%) |
Real Estate & Mortgages in Scottsville
Real Estate and Mortgage Overview in Scottsville
| Characteristic | Without Mortgage | With Mortgage |
| Housing Units | 84 | 69 |
| Median Property Value | $328,600 | $247,700 |
| Median Household Income | - | - |
| Monthly Housing Costs | - | - |
| Real Estate Taxes | - | - |
Property Value by Mortgage Status in Scottsville
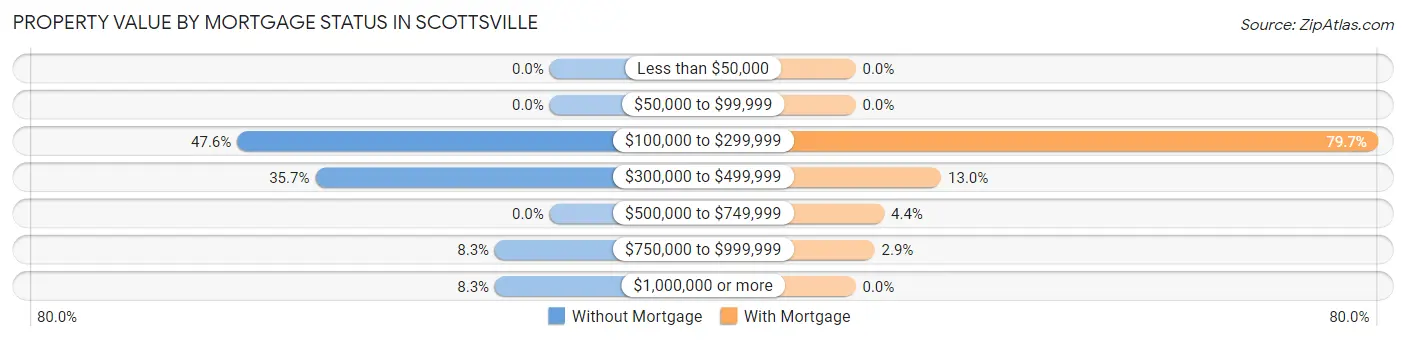
| Property Value | Without Mortgage | With Mortgage |
| Less than $50,000 | 0 (0.0%) | 0 (0.0%) |
| $50,000 to $99,999 | 0 (0.0%) | 0 (0.0%) |
| $100,000 to $299,999 | 40 (47.6%) | 55 (79.7%) |
| $300,000 to $499,999 | 30 (35.7%) | 9 (13.0%) |
| $500,000 to $749,999 | 0 (0.0%) | 3 (4.3%) |
| $750,000 to $999,999 | 7 (8.3%) | 2 (2.9%) |
| $1,000,000 or more | 7 (8.3%) | 0 (0.0%) |
| Total | 84 (100.0%) | 69 (100.0%) |
Household Income by Mortgage Status in Scottsville
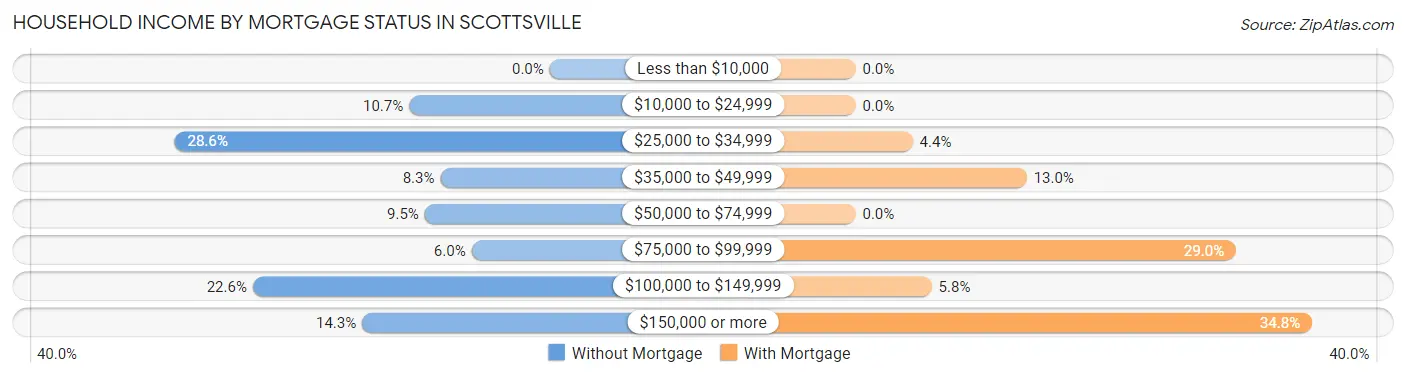
| Household Income | Without Mortgage | With Mortgage |
| Less than $10,000 | 0 (0.0%) | 0 (0.0%) |
| $10,000 to $24,999 | 9 (10.7%) | 0 (0.0%) |
| $25,000 to $34,999 | 24 (28.6%) | 3 (4.3%) |
| $35,000 to $49,999 | 7 (8.3%) | 9 (13.0%) |
| $50,000 to $74,999 | 8 (9.5%) | 0 (0.0%) |
| $75,000 to $99,999 | 5 (5.9%) | 20 (29.0%) |
| $100,000 to $149,999 | 19 (22.6%) | 4 (5.8%) |
| $150,000 or more | 12 (14.3%) | 24 (34.8%) |
| Total | 84 (100.0%) | 69 (100.0%) |
Property Value to Household Income Ratio in Scottsville
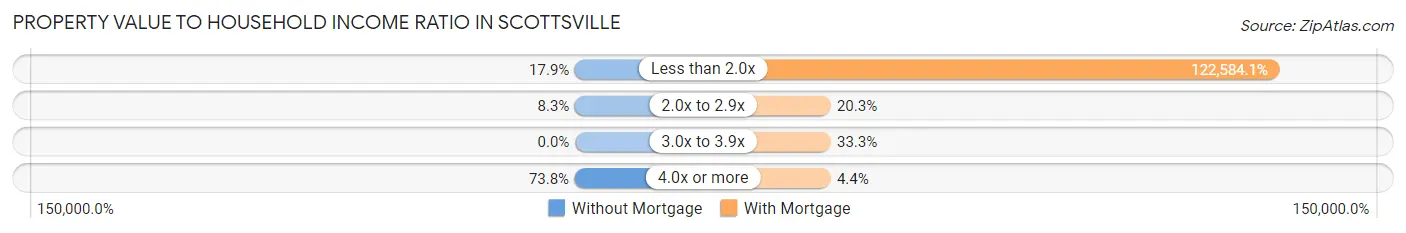
| Value-to-Income Ratio | Without Mortgage | With Mortgage |
| Less than 2.0x | 15 (17.9%) | 84,583 (122,584.1%) |
| 2.0x to 2.9x | 7 (8.3%) | 14 (20.3%) |
| 3.0x to 3.9x | 0 (0.0%) | 23 (33.3%) |
| 4.0x or more | 62 (73.8%) | 3 (4.3%) |
| Total | 84 (100.0%) | 69 (100.0%) |
Real Estate Taxes by Mortgage Status in Scottsville
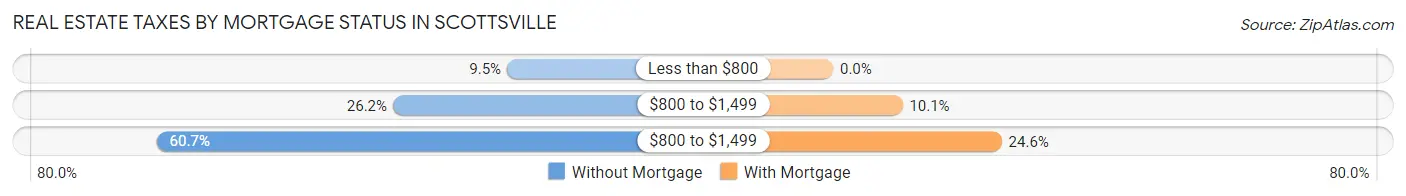
| Property Taxes | Without Mortgage | With Mortgage |
| Less than $800 | 8 (9.5%) | 0 (0.0%) |
| $800 to $1,499 | 22 (26.2%) | 7 (10.1%) |
| $800 to $1,499 | 51 (60.7%) | 17 (24.6%) |
| Total | 84 (100.0%) | 69 (100.0%) |
Health & Disability in Scottsville
Health Insurance Coverage by Age in Scottsville
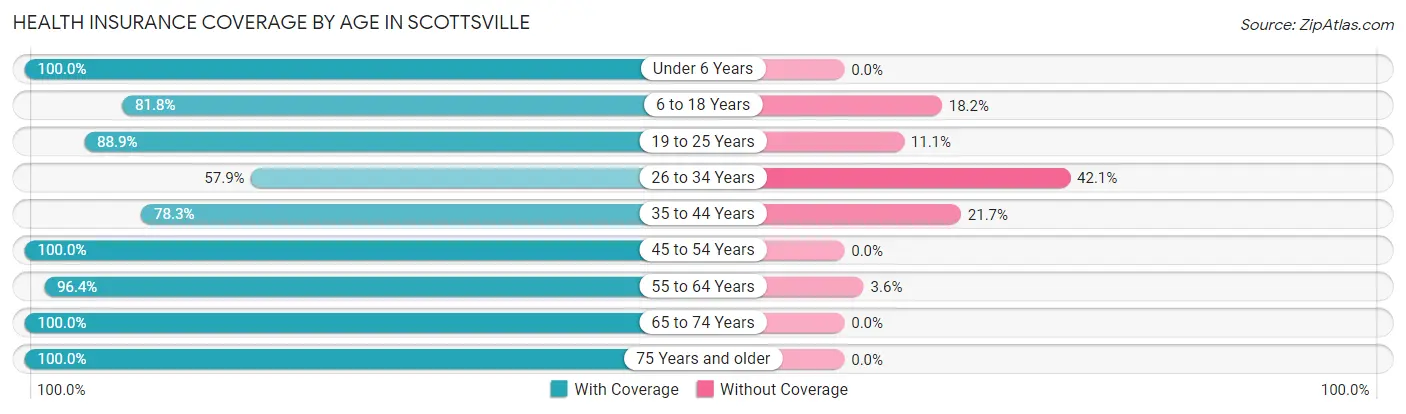
| Age Bracket | With Coverage | Without Coverage |
| Under 6 Years | 22 (100.0%) | 0 (0.0%) |
| 6 to 18 Years | 90 (81.8%) | 20 (18.2%) |
| 19 to 25 Years | 16 (88.9%) | 2 (11.1%) |
| 26 to 34 Years | 44 (57.9%) | 32 (42.1%) |
| 35 to 44 Years | 54 (78.3%) | 15 (21.7%) |
| 45 to 54 Years | 66 (100.0%) | 0 (0.0%) |
| 55 to 64 Years | 80 (96.4%) | 3 (3.6%) |
| 65 to 74 Years | 83 (100.0%) | 0 (0.0%) |
| 75 Years and older | 44 (100.0%) | 0 (0.0%) |
| Total | 499 (87.4%) | 72 (12.6%) |
Health Insurance Coverage by Citizenship Status in Scottsville
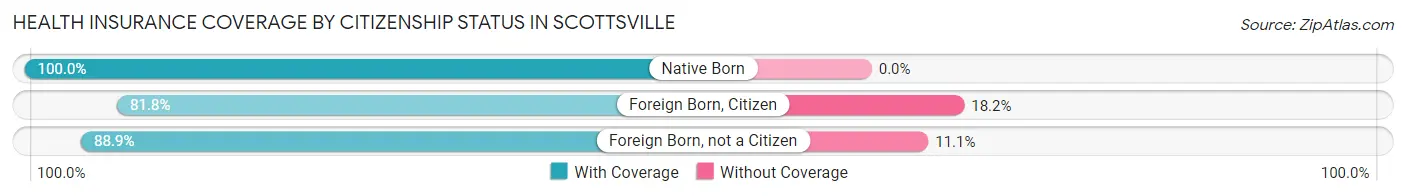
| Citizenship Status | With Coverage | Without Coverage |
| Native Born | 22 (100.0%) | 0 (0.0%) |
| Foreign Born, Citizen | 90 (81.8%) | 20 (18.2%) |
| Foreign Born, not a Citizen | 16 (88.9%) | 2 (11.1%) |
Health Insurance Coverage by Household Income in Scottsville
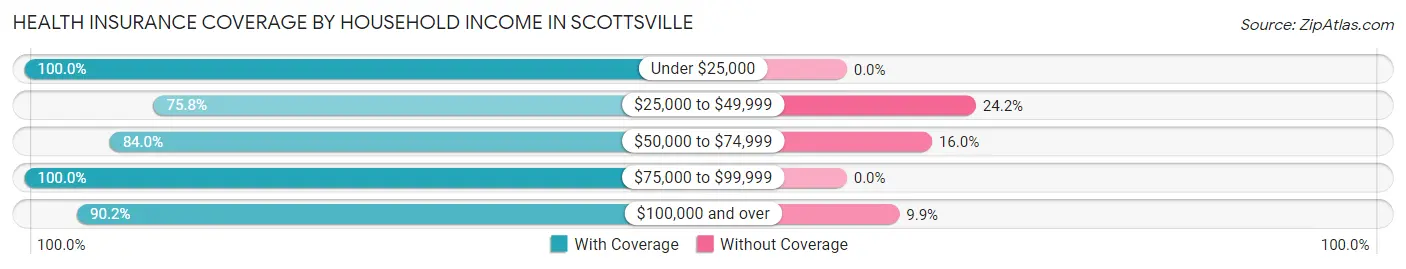
| Household Income | With Coverage | Without Coverage |
| Under $25,000 | 56 (100.0%) | 0 (0.0%) |
| $25,000 to $49,999 | 94 (75.8%) | 30 (24.2%) |
| $50,000 to $74,999 | 79 (84.0%) | 15 (16.0%) |
| $75,000 to $99,999 | 23 (100.0%) | 0 (0.0%) |
| $100,000 and over | 247 (90.1%) | 27 (9.9%) |
Public vs Private Health Insurance Coverage by Age in Scottsville
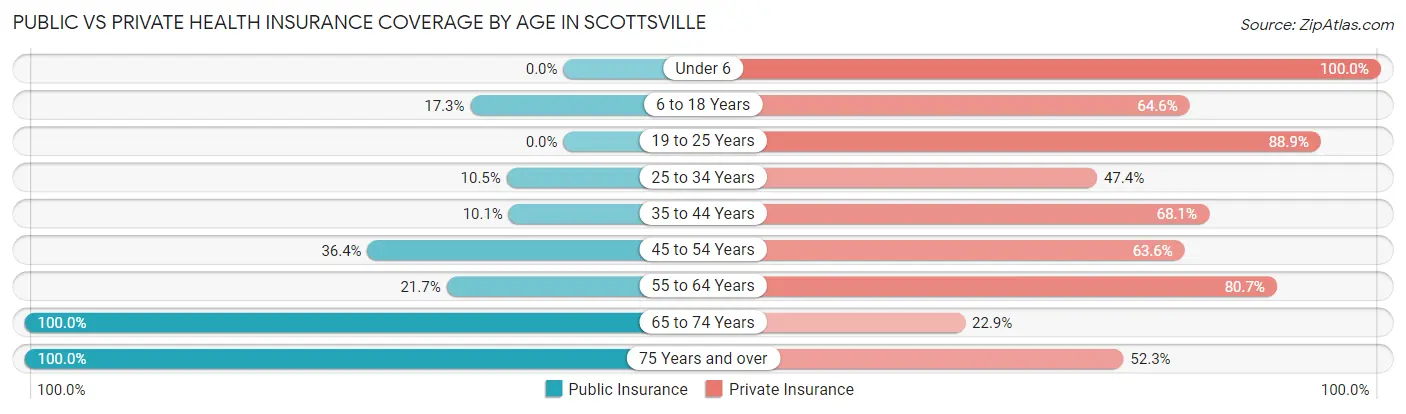
| Age Bracket | Public Insurance | Private Insurance |
| Under 6 | 0 (0.0%) | 22 (100.0%) |
| 6 to 18 Years | 19 (17.3%) | 71 (64.5%) |
| 19 to 25 Years | 0 (0.0%) | 16 (88.9%) |
| 25 to 34 Years | 8 (10.5%) | 36 (47.4%) |
| 35 to 44 Years | 7 (10.1%) | 47 (68.1%) |
| 45 to 54 Years | 24 (36.4%) | 42 (63.6%) |
| 55 to 64 Years | 18 (21.7%) | 67 (80.7%) |
| 65 to 74 Years | 83 (100.0%) | 19 (22.9%) |
| 75 Years and over | 44 (100.0%) | 23 (52.3%) |
| Total | 203 (35.5%) | 343 (60.1%) |
Disability Status by Sex by Age in Scottsville
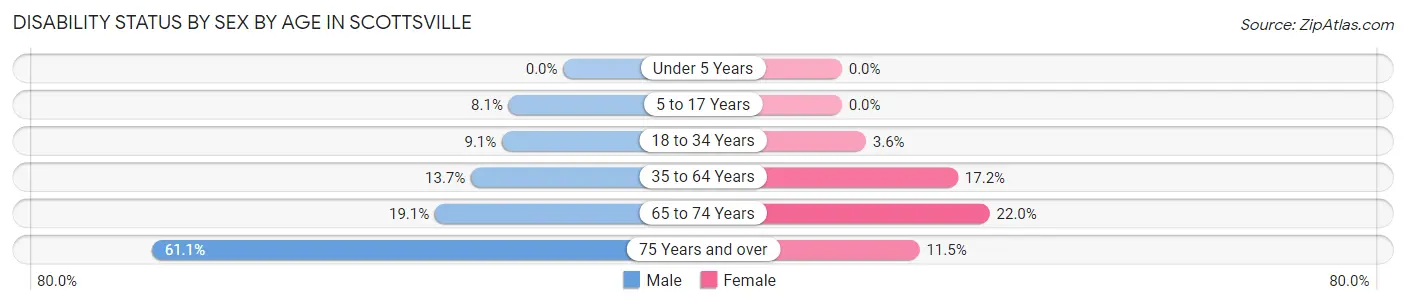
| Age Bracket | Male | Female |
| Under 5 Years | 0 (0.0%) | 0 (0.0%) |
| 5 to 17 Years | 3 (8.1%) | 0 (0.0%) |
| 18 to 34 Years | 6 (9.1%) | 1 (3.6%) |
| 35 to 64 Years | 10 (13.7%) | 25 (17.2%) |
| 65 to 74 Years | 8 (19.1%) | 9 (22.0%) |
| 75 Years and over | 11 (61.1%) | 3 (11.5%) |
Disability Class by Sex by Age in Scottsville
Disability Class: Hearing Difficulty
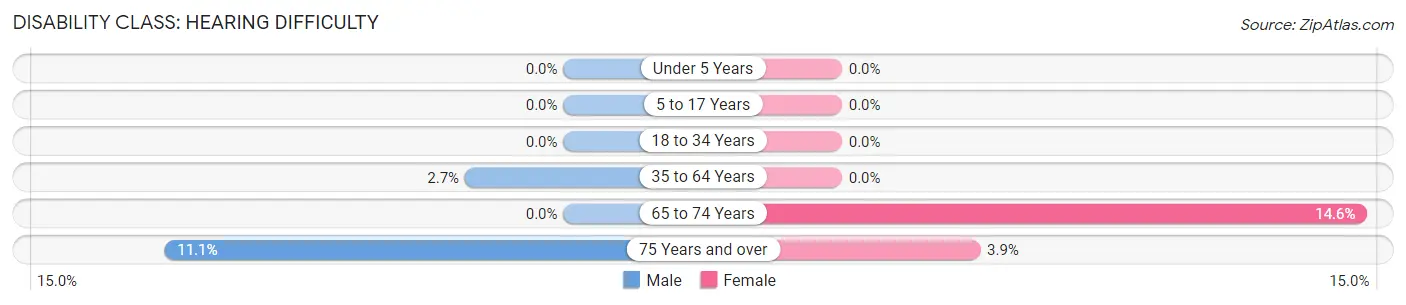
| Age Bracket | Male | Female |
| Under 5 Years | 0 (0.0%) | 0 (0.0%) |
| 5 to 17 Years | 0 (0.0%) | 0 (0.0%) |
| 18 to 34 Years | 0 (0.0%) | 0 (0.0%) |
| 35 to 64 Years | 2 (2.7%) | 0 (0.0%) |
| 65 to 74 Years | 0 (0.0%) | 6 (14.6%) |
| 75 Years and over | 2 (11.1%) | 1 (3.8%) |
Disability Class: Vision Difficulty
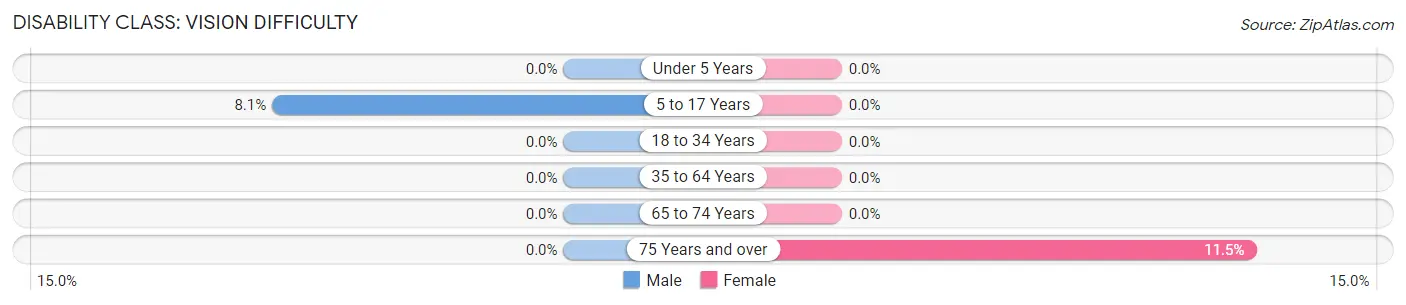
| Age Bracket | Male | Female |
| Under 5 Years | 0 (0.0%) | 0 (0.0%) |
| 5 to 17 Years | 3 (8.1%) | 0 (0.0%) |
| 18 to 34 Years | 0 (0.0%) | 0 (0.0%) |
| 35 to 64 Years | 0 (0.0%) | 0 (0.0%) |
| 65 to 74 Years | 0 (0.0%) | 0 (0.0%) |
| 75 Years and over | 0 (0.0%) | 3 (11.5%) |
Disability Class: Cognitive Difficulty
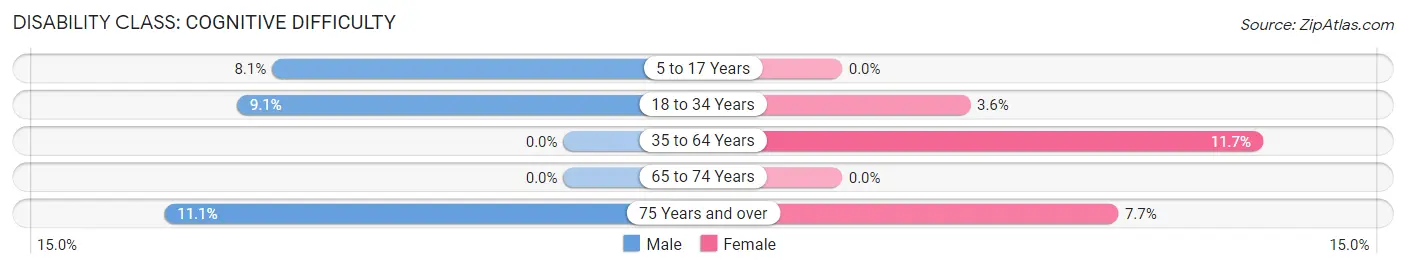
| Age Bracket | Male | Female |
| 5 to 17 Years | 3 (8.1%) | 0 (0.0%) |
| 18 to 34 Years | 6 (9.1%) | 1 (3.6%) |
| 35 to 64 Years | 0 (0.0%) | 17 (11.7%) |
| 65 to 74 Years | 0 (0.0%) | 0 (0.0%) |
| 75 Years and over | 2 (11.1%) | 2 (7.7%) |
Disability Class: Ambulatory Difficulty
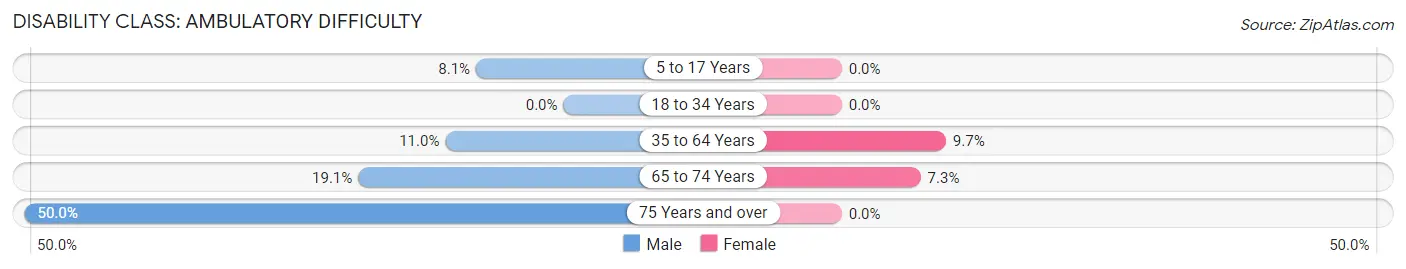
| Age Bracket | Male | Female |
| 5 to 17 Years | 3 (8.1%) | 0 (0.0%) |
| 18 to 34 Years | 0 (0.0%) | 0 (0.0%) |
| 35 to 64 Years | 8 (11.0%) | 14 (9.7%) |
| 65 to 74 Years | 8 (19.1%) | 3 (7.3%) |
| 75 Years and over | 9 (50.0%) | 0 (0.0%) |
Disability Class: Self-Care Difficulty
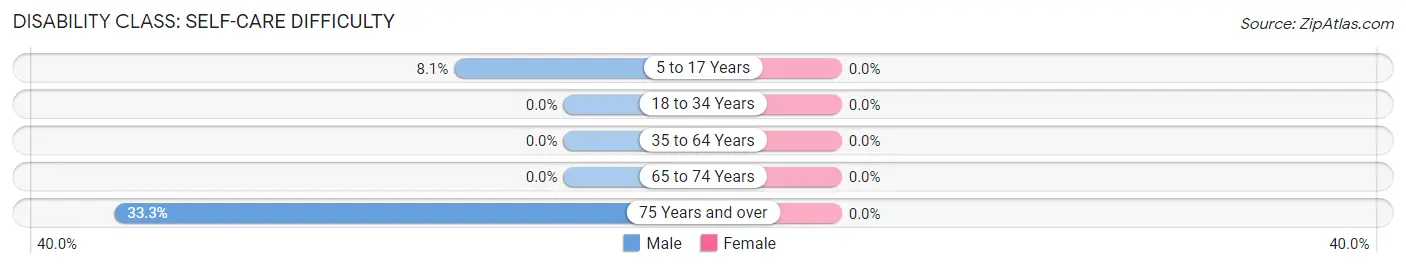
| Age Bracket | Male | Female |
| 5 to 17 Years | 3 (8.1%) | 0 (0.0%) |
| 18 to 34 Years | 0 (0.0%) | 0 (0.0%) |
| 35 to 64 Years | 0 (0.0%) | 0 (0.0%) |
| 65 to 74 Years | 0 (0.0%) | 0 (0.0%) |
| 75 Years and over | 6 (33.3%) | 0 (0.0%) |
Technology Access in Scottsville
Computing Device Access in Scottsville
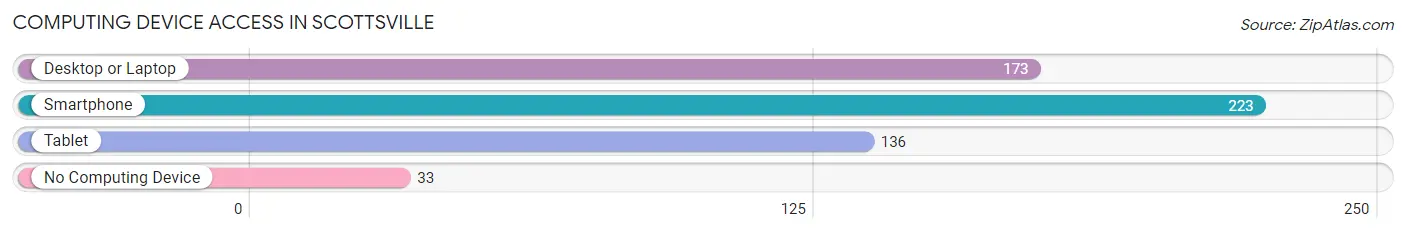
| Device Type | # Households | % Households |
| Desktop or Laptop | 173 | 64.1% |
| Smartphone | 223 | 82.6% |
| Tablet | 136 | 50.4% |
| No Computing Device | 33 | 12.2% |
| Total | 270 | 100.0% |
Internet Access in Scottsville
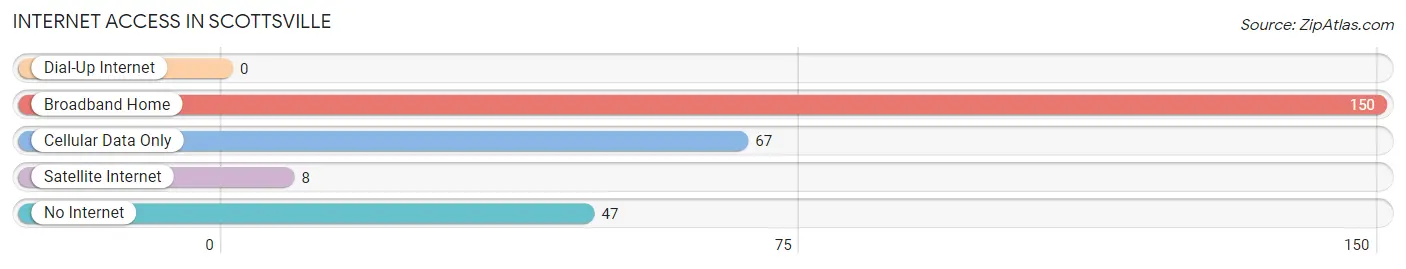
| Internet Type | # Households | % Households |
| Dial-Up Internet | 0 | 0.0% |
| Broadband Home | 150 | 55.6% |
| Cellular Data Only | 67 | 24.8% |
| Satellite Internet | 8 | 3.0% |
| No Internet | 47 | 17.4% |
| Total | 270 | 100.0% |
Scottsville Summary
Scottsville, Virginia is a small town located in Albemarle County, Virginia. It is situated on the James River, about 25 miles northwest of Charlottesville. The town has a population of 1,717 people, according to the 2010 census.
History
Scottsville was founded in 1744 by William Scott, a Scottish immigrant. The town was originally known as Scott's Mill, and was the first settlement in Albemarle County. The town was officially incorporated in 1818.
During the Civil War, Scottsville was a major supply depot for the Confederate Army. The town was also the site of a major battle in 1864, when Union forces attempted to capture the town. The battle was unsuccessful, and the town remained in Confederate hands.
Geography
Scottsville is located in the foothills of the Blue Ridge Mountains, and is surrounded by rolling hills and farmland. The town is situated on the James River, and is about 25 miles northwest of Charlottesville. The town is located in the Piedmont region of Virginia, and has a humid subtropical climate.
Economy
The economy of Scottsville is largely based on agriculture and tourism. The town is home to several farms, and is a popular destination for outdoor activities such as fishing, hunting, and camping. The town is also home to several small businesses, including restaurants, shops, and a local brewery.
Demographics
According to the 2010 census, Scottsville has a population of 1,717 people. The town is predominantly white, with a population that is 94.3% white, 2.2% African American, 0.7% Asian, and 0.6% Hispanic or Latino. The median household income is $45,000, and the median age is 41.
Conclusion
Scottsville, Virginia is a small town with a rich history and a vibrant economy. The town is situated on the James River, and is surrounded by rolling hills and farmland. The town is predominantly white, and the economy is largely based on agriculture and tourism. Scottsville is a popular destination for outdoor activities, and is home to several small businesses.
Common Questions
What is Per Capita Income in Scottsville?
Per Capita income in Scottsville is $34,240.
What is the Median Family Income in Scottsville?
Median Family Income in Scottsville is $78,000.
What is the Median Household income in Scottsville?
Median Household Income in Scottsville is $52,206.
What is Income or Wage Gap in Scottsville?
Income or Wage Gap in Scottsville is 37.2%.
Women in Scottsville earn 62.8 cents for every dollar earned by a man.
What is Inequality or Gini Index in Scottsville?
Inequality or Gini Index in Scottsville is 0.41.
What is the Total Population of Scottsville?
Total Population of Scottsville is 571.
What is the Total Male Population of Scottsville?
Total Male Population of Scottsville is 243.
What is the Total Female Population of Scottsville?
Total Female Population of Scottsville is 328.
What is the Ratio of Males per 100 Females in Scottsville?
There are 74.09 Males per 100 Females in Scottsville.
What is the Ratio of Females per 100 Males in Scottsville?
There are 134.98 Females per 100 Males in Scottsville.
What is the Median Population Age in Scottsville?
Median Population Age in Scottsville is 43.9 Years.
What is the Average Family Size in Scottsville
Average Family Size in Scottsville is 2.9 People.
What is the Average Household Size in Scottsville
Average Household Size in Scottsville is 2.1 People.
How Large is the Labor Force in Scottsville?
There are 283 People in the Labor Forcein in Scottsville.
What is the Percentage of People in the Labor Force in Scottsville?
61.8% of People are in the Labor Force in Scottsville.
What is the Unemployment Rate in Scottsville?
Unemployment Rate in Scottsville is 1.1%.