Wintergreen, VA Map & Demographics
Wintergreen Map
Wintergreen Overview
$90,668
PER CAPITA INCOME
$144,952
AVG FAMILY INCOME
$142,548
AVG HOUSEHOLD INCOME
0.36
INEQUALITY / GINI INDEX
413
TOTAL POPULATION
234
MALE POPULATION
179
FEMALE POPULATION
130.73
MALES / 100 FEMALES
76.50
FEMALES / 100 MALES
67.5
MEDIAN AGE
2.0
AVG FAMILY SIZE
1.6
AVG HOUSEHOLD SIZE
258
LABOR FORCE [ PEOPLE ]
62.5%
PERCENT IN LABOR FORCE
Income in Wintergreen
Income Overview in Wintergreen
Per Capita Income in Wintergreen is $90,668, while median incomes of families and households are $144,952 and $142,548 respectively.
| Characteristic | Number | Measure |
| Per Capita Income | 413 | $90,668 |
| Median Family Income | 149 | $144,952 |
| Mean Family Income | 149 | $199,957 |
| Median Household Income | 243 | $142,548 |
| Mean Household Income | 243 | $154,694 |
| Income Deficit | 149 | $0 |
| Wage / Income Gap (%) | 413 | 0.00% |
| Wage / Income Gap ($) | 413 | 100.00¢ per $1 |
| Gini / Inequality Index | 413 | 0.36 |
Earnings by Sex in Wintergreen
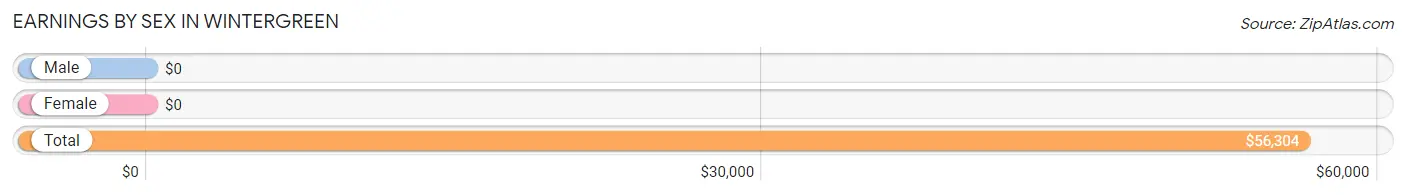
| Sex | Number | Average Earnings |
| Male | 158 (61.2%) | $0 |
| Female | 100 (38.8%) | $0 |
| Total | 258 (100.0%) | $56,304 |
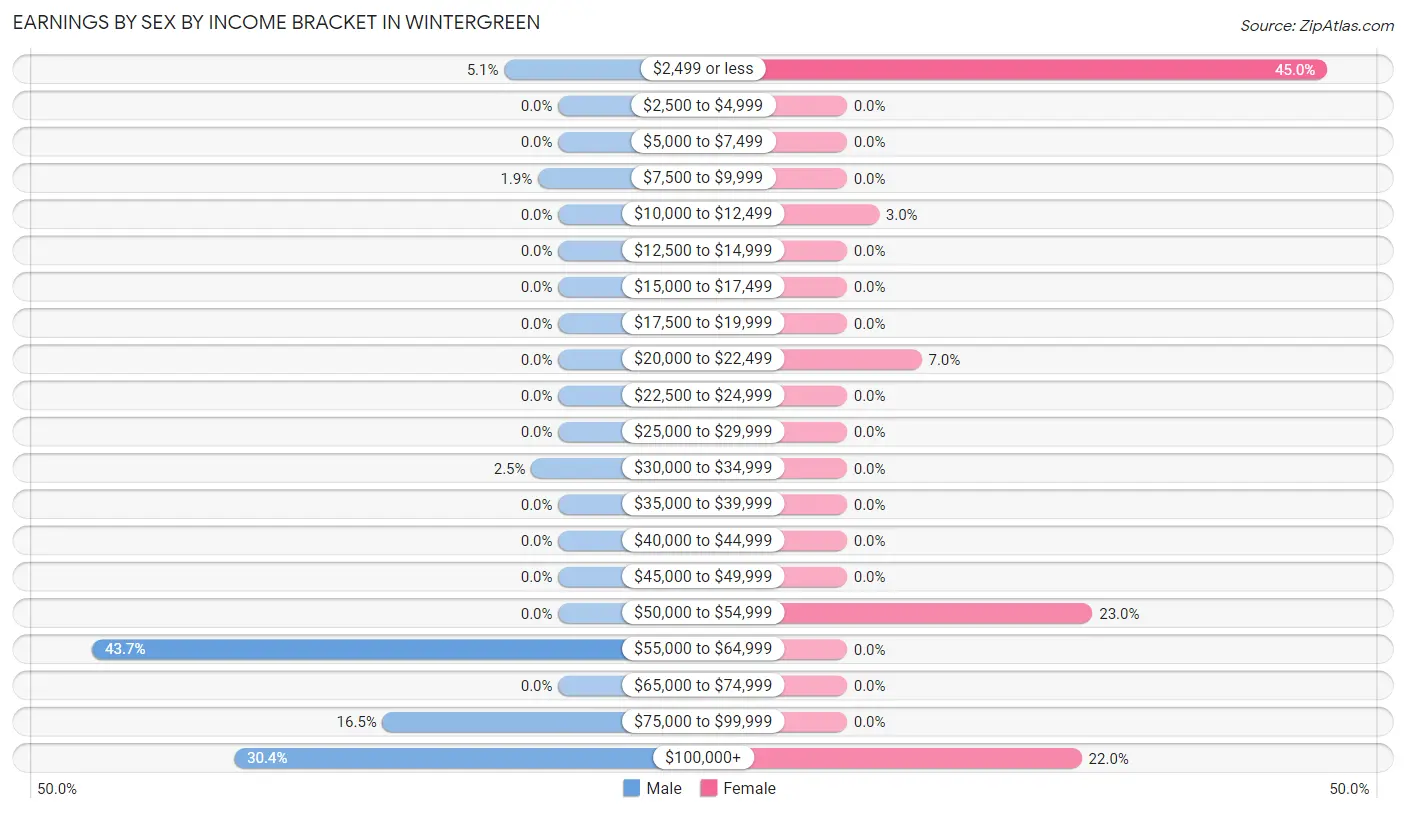
Earnings by Sex by Income Bracket in Wintergreen
The most common earnings brackets in Wintergreen are $55,000 to $64,999 for men (69 | 43.7%) and $2,499 or less for women (45 | 45.0%).
| Income | Male | Female |
| $2,499 or less | 8 (5.1%) | 45 (45.0%) |
| $2,500 to $4,999 | 0 (0.0%) | 0 (0.0%) |
| $5,000 to $7,499 | 0 (0.0%) | 0 (0.0%) |
| $7,500 to $9,999 | 3 (1.9%) | 0 (0.0%) |
| $10,000 to $12,499 | 0 (0.0%) | 3 (3.0%) |
| $12,500 to $14,999 | 0 (0.0%) | 0 (0.0%) |
| $15,000 to $17,499 | 0 (0.0%) | 0 (0.0%) |
| $17,500 to $19,999 | 0 (0.0%) | 0 (0.0%) |
| $20,000 to $22,499 | 0 (0.0%) | 7 (7.0%) |
| $22,500 to $24,999 | 0 (0.0%) | 0 (0.0%) |
| $25,000 to $29,999 | 0 (0.0%) | 0 (0.0%) |
| $30,000 to $34,999 | 4 (2.5%) | 0 (0.0%) |
| $35,000 to $39,999 | 0 (0.0%) | 0 (0.0%) |
| $40,000 to $44,999 | 0 (0.0%) | 0 (0.0%) |
| $45,000 to $49,999 | 0 (0.0%) | 0 (0.0%) |
| $50,000 to $54,999 | 0 (0.0%) | 23 (23.0%) |
| $55,000 to $64,999 | 69 (43.7%) | 0 (0.0%) |
| $65,000 to $74,999 | 0 (0.0%) | 0 (0.0%) |
| $75,000 to $99,999 | 26 (16.5%) | 0 (0.0%) |
| $100,000+ | 48 (30.4%) | 22 (22.0%) |
| Total | 158 (100.0%) | 100 (100.0%) |
Earnings by Sex by Educational Attainment in Wintergreen
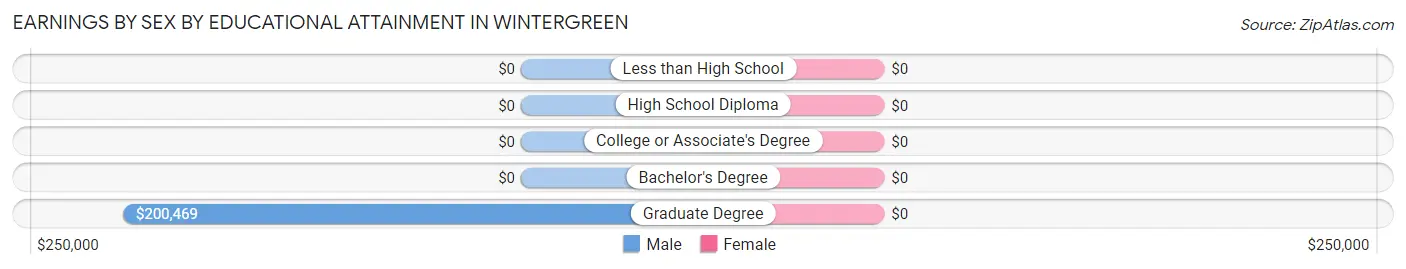
| Educational Attainment | Male Income | Female Income |
| Less than High School | - | - |
| High School Diploma | - | - |
| College or Associate's Degree | - | - |
| Bachelor's Degree | - | - |
| Graduate Degree | $200,469 | $0 |
| Total | - | - |
Family Income in Wintergreen
Family Income Brackets in Wintergreen
According to the Wintergreen family income data, there are 57 families falling into the $100,000 to $149,999 income range, which is the most common income bracket and makes up 38.3% of all families.
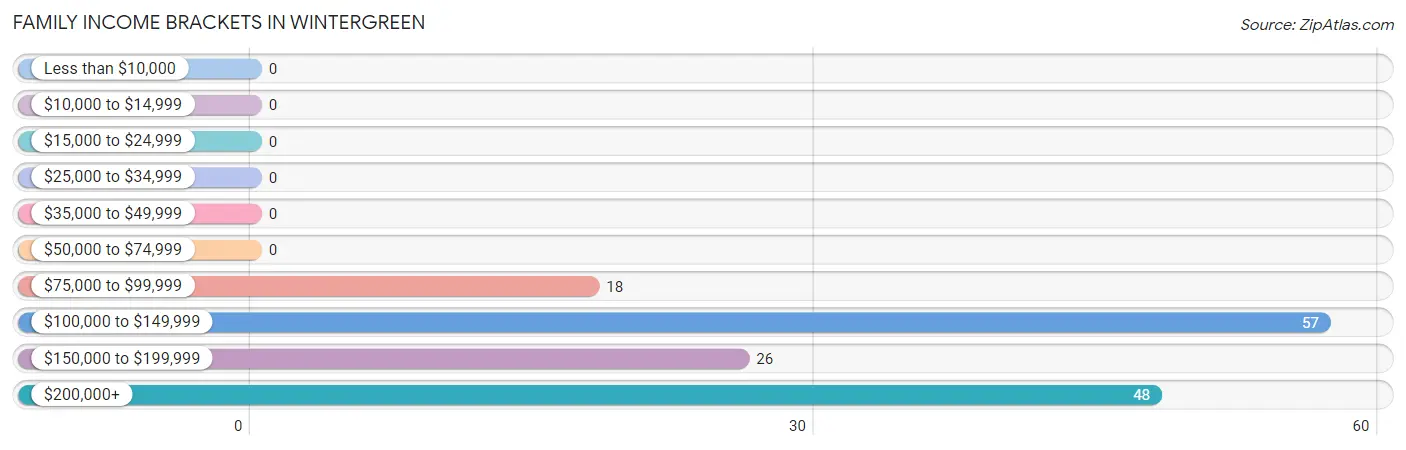
| Income Bracket | # Families | % Families |
| Less than $10,000 | 0 | 0.0% |
| $10,000 to $14,999 | 0 | 0.0% |
| $15,000 to $24,999 | 0 | 0.0% |
| $25,000 to $34,999 | 0 | 0.0% |
| $35,000 to $49,999 | 0 | 0.0% |
| $50,000 to $74,999 | 0 | 0.0% |
| $75,000 to $99,999 | 18 | 12.1% |
| $100,000 to $149,999 | 57 | 38.3% |
| $150,000 to $199,999 | 26 | 17.4% |
| $200,000+ | 48 | 32.2% |
Family Income by Famaliy Size in Wintergreen
2-person families (149 | 100.0%) account for the highest median family income in Wintergreen with $144,952 per family, while 2-person families (149 | 100.0%) have the highest median income of $72,476 per family member.
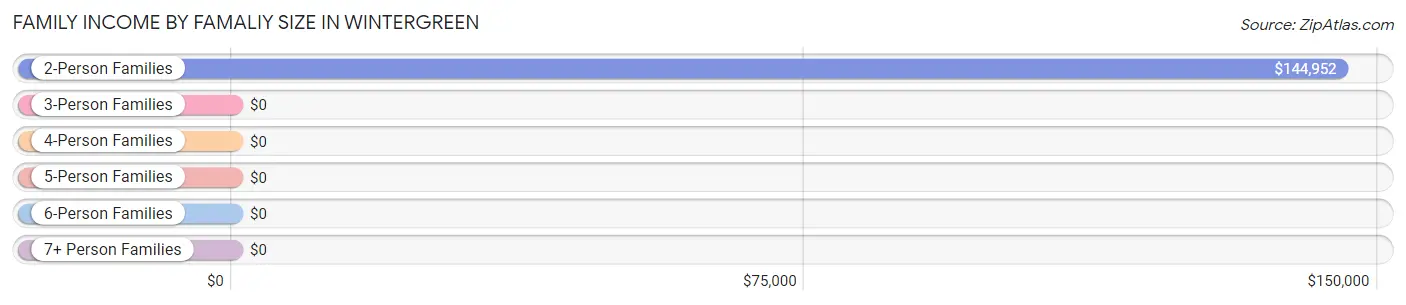
| Income Bracket | # Families | Median Income |
| 2-Person Families | 149 (100.0%) | $144,952 |
| 3-Person Families | 0 (0.0%) | $0 |
| 4-Person Families | 0 (0.0%) | $0 |
| 5-Person Families | 0 (0.0%) | $0 |
| 6-Person Families | 0 (0.0%) | $0 |
| 7+ Person Families | 0 (0.0%) | $0 |
| Total | 149 (100.0%) | $144,952 |
Family Income by Number of Earners in Wintergreen
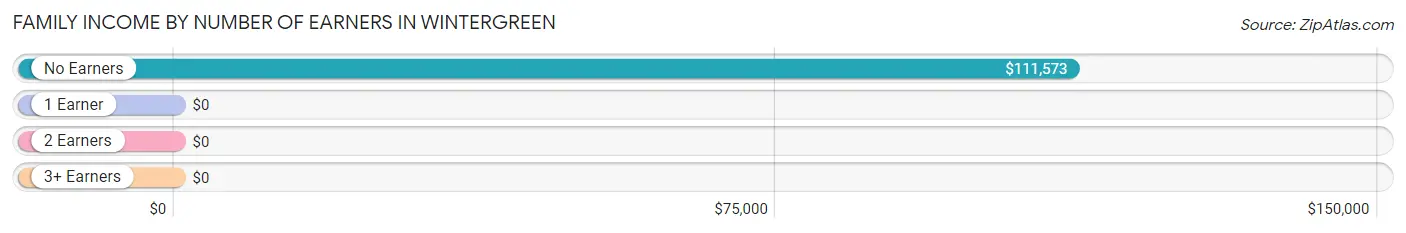
| Number of Earners | # Families | Median Income |
| No Earners | 75 (50.3%) | $111,573 |
| 1 Earner | 0 (0.0%) | $0 |
| 2 Earners | 74 (49.7%) | $0 |
| 3+ Earners | 0 (0.0%) | $0 |
| Total | 149 (100.0%) | $144,952 |
Household Income in Wintergreen
Household Income Brackets in Wintergreen
With 65 households falling in the category, the $50,000 to $74,999 income range is the most frequent in Wintergreen, accounting for 26.8% of all households.
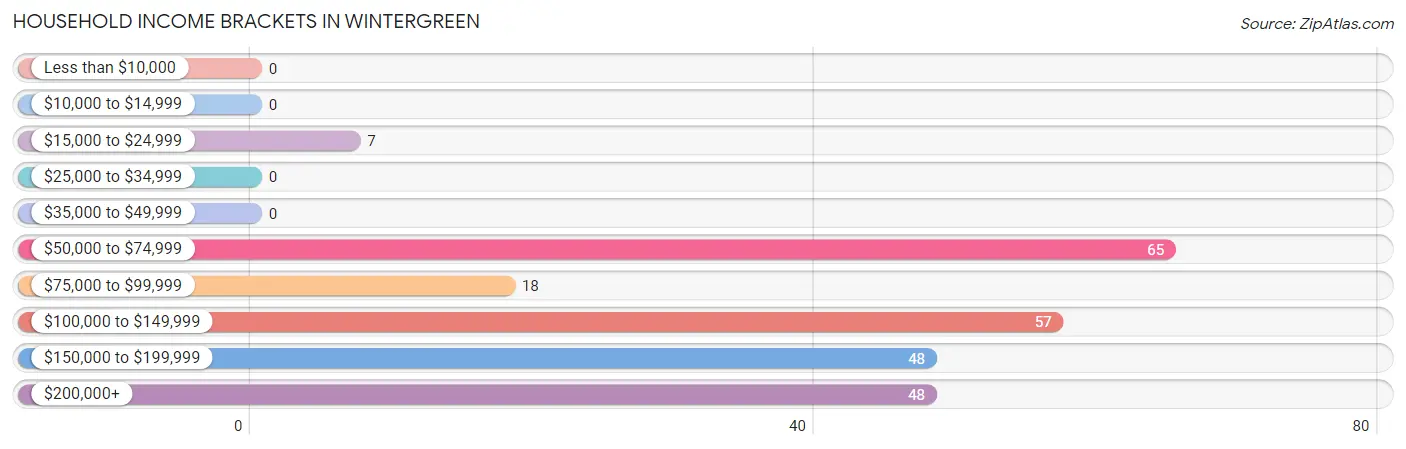
| Income Bracket | # Households | % Households |
| Less than $10,000 | 0 | 0.0% |
| $10,000 to $14,999 | 0 | 0.0% |
| $15,000 to $24,999 | 7 | 2.9% |
| $25,000 to $34,999 | 0 | 0.0% |
| $35,000 to $49,999 | 0 | 0.0% |
| $50,000 to $74,999 | 65 | 26.7% |
| $75,000 to $99,999 | 18 | 7.4% |
| $100,000 to $149,999 | 57 | 23.5% |
| $150,000 to $199,999 | 48 | 19.8% |
| $200,000+ | 48 | 19.8% |
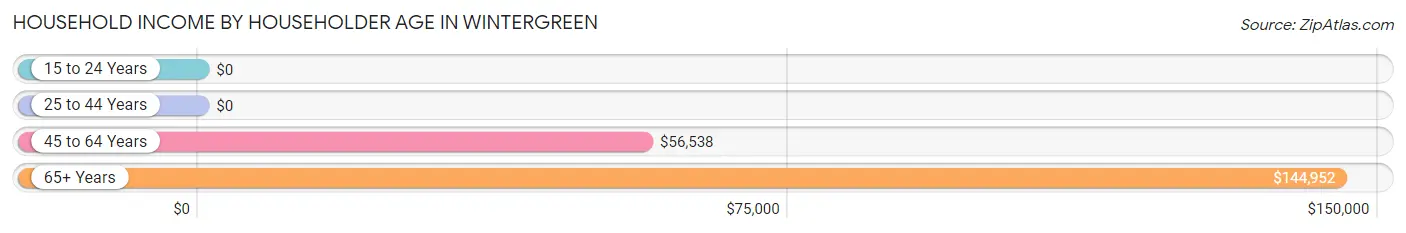
Household Income by Householder Age in Wintergreen
The median household income in Wintergreen is $142,548, with the highest median household income of $144,952 found in the 65+ years age bracket for the primary householder. A total of 149 households (61.3%) fall into this category.
| Income Bracket | # Households | Median Income |
| 15 to 24 Years | 0 (0.0%) | $0 |
| 25 to 44 Years | 0 (0.0%) | $0 |
| 45 to 64 Years | 94 (38.7%) | $56,538 |
| 65+ Years | 149 (61.3%) | $144,952 |
| Total | 243 (100.0%) | $142,548 |
Poverty in Wintergreen
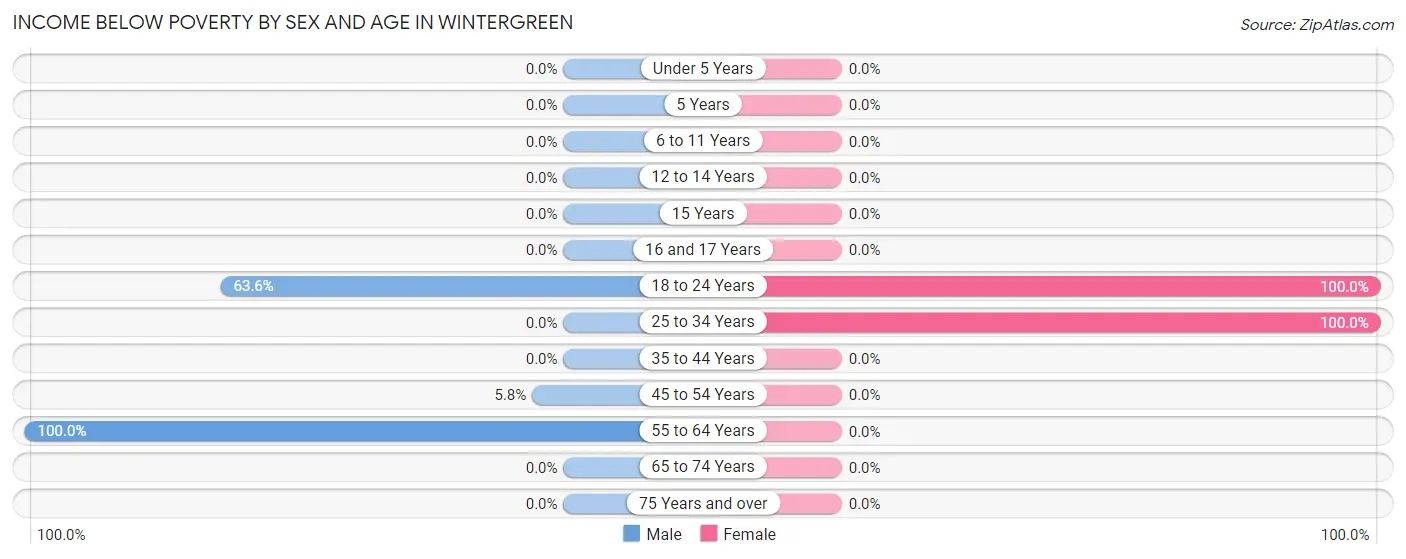
Income Below Poverty by Sex and Age in Wintergreen
With 5.1% poverty level for males and 3.4% for females among the residents of Wintergreen, 55 to 64 year old males and 18 to 24 year old females are the most vulnerable to poverty, with 1 males (100.0%) and 3 females (100.0%) in their respective age groups living below the poverty level.
| Age Bracket | Male | Female |
| Under 5 Years | 0 (0.0%) | 0 (0.0%) |
| 5 Years | 0 (0.0%) | 0 (0.0%) |
| 6 to 11 Years | 0 (0.0%) | 0 (0.0%) |
| 12 to 14 Years | 0 (0.0%) | 0 (0.0%) |
| 15 Years | 0 (0.0%) | 0 (0.0%) |
| 16 and 17 Years | 0 (0.0%) | 0 (0.0%) |
| 18 to 24 Years | 7 (63.6%) | 3 (100.0%) |
| 25 to 34 Years | 0 (0.0%) | 3 (100.0%) |
| 35 to 44 Years | 0 (0.0%) | 0 (0.0%) |
| 45 to 54 Years | 4 (5.8%) | 0 (0.0%) |
| 55 to 64 Years | 1 (100.0%) | 0 (0.0%) |
| 65 to 74 Years | 0 (0.0%) | 0 (0.0%) |
| 75 Years and over | 0 (0.0%) | 0 (0.0%) |
| Total | 12 (5.1%) | 6 (3.4%) |
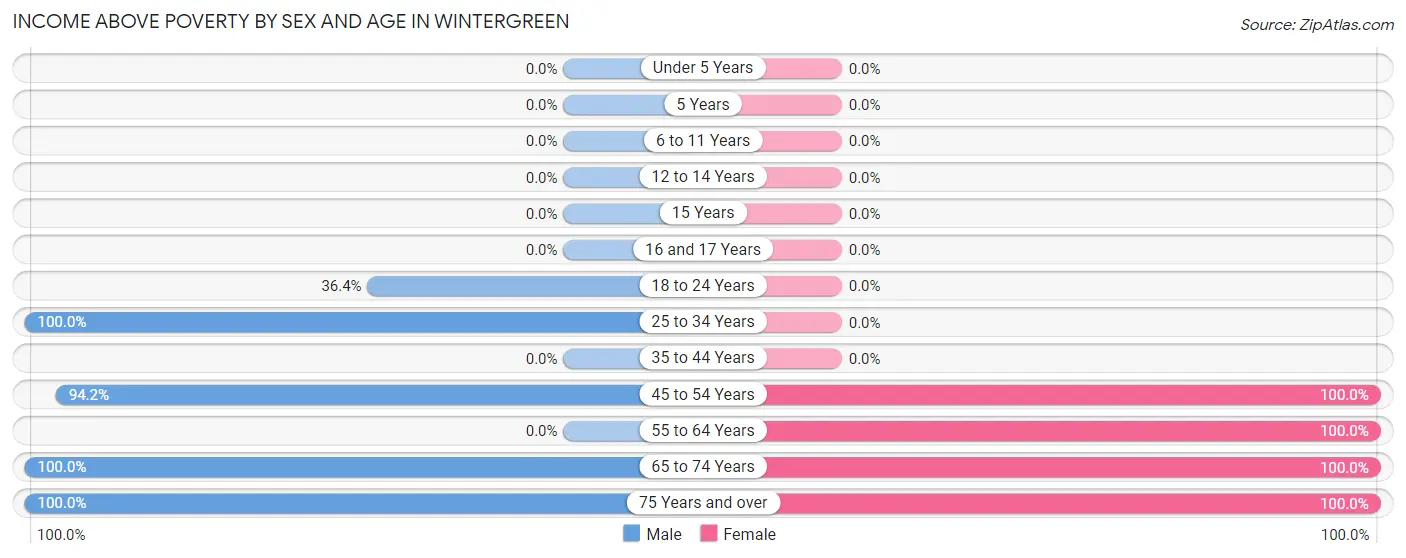
Income Above Poverty by Sex and Age in Wintergreen
According to the poverty statistics in Wintergreen, males aged 25 to 34 years and females aged 45 to 54 years are the age groups that are most secure financially, with 100.0% of males and 100.0% of females in these age groups living above the poverty line.
| Age Bracket | Male | Female |
| Under 5 Years | 0 (0.0%) | 0 (0.0%) |
| 5 Years | 0 (0.0%) | 0 (0.0%) |
| 6 to 11 Years | 0 (0.0%) | 0 (0.0%) |
| 12 to 14 Years | 0 (0.0%) | 0 (0.0%) |
| 15 Years | 0 (0.0%) | 0 (0.0%) |
| 16 and 17 Years | 0 (0.0%) | 0 (0.0%) |
| 18 to 24 Years | 4 (36.4%) | 0 (0.0%) |
| 25 to 34 Years | 4 (100.0%) | 0 (0.0%) |
| 35 to 44 Years | 0 (0.0%) | 0 (0.0%) |
| 45 to 54 Years | 65 (94.2%) | 25 (100.0%) |
| 55 to 64 Years | 0 (0.0%) | 29 (100.0%) |
| 65 to 74 Years | 118 (100.0%) | 88 (100.0%) |
| 75 Years and over | 31 (100.0%) | 31 (100.0%) |
| Total | 222 (94.9%) | 173 (96.7%) |
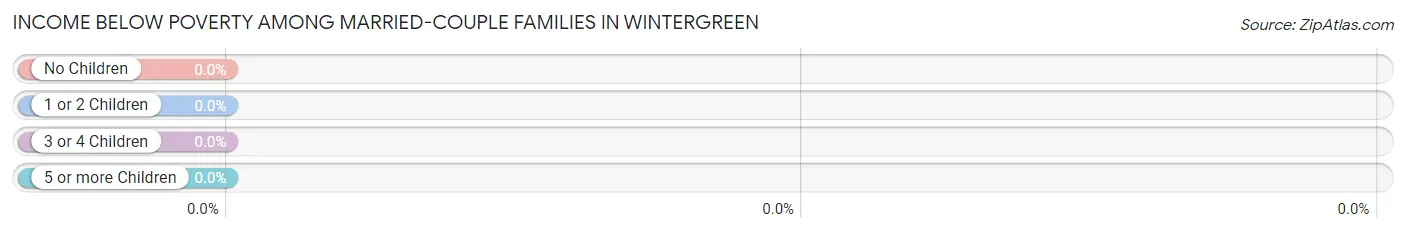
Income Below Poverty Among Married-Couple Families in Wintergreen
| Children | Above Poverty | Below Poverty |
| No Children | 149 (100.0%) | 0 (0.0%) |
| 1 or 2 Children | 0 (0.0%) | 0 (0.0%) |
| 3 or 4 Children | 0 (0.0%) | 0 (0.0%) |
| 5 or more Children | 0 (0.0%) | 0 (0.0%) |
| Total | 149 (100.0%) | 0 (0.0%) |
Income Below Poverty Among Single-Parent Households in Wintergreen
| Children | Single Father | Single Mother |
| No Children | 0 (0.0%) | 0 (0.0%) |
| 1 or 2 Children | 0 (0.0%) | 0 (0.0%) |
| 3 or 4 Children | 0 (0.0%) | 0 (0.0%) |
| 5 or more Children | 0 (0.0%) | 0 (0.0%) |
| Total | 0 (0.0%) | 0 (0.0%) |
Income Below Poverty Among Married-Couple vs Single-Parent Households in Wintergreen
| Children | Married-Couple Families | Single-Parent Households |
| No Children | 0 (0.0%) | 0 (0.0%) |
| 1 or 2 Children | 0 (0.0%) | 0 (0.0%) |
| 3 or 4 Children | 0 (0.0%) | 0 (0.0%) |
| 5 or more Children | 0 (0.0%) | 0 (0.0%) |
| Total | 0 (0.0%) | 0 (0.0%) |
Race in Wintergreen
The most populous races in Wintergreen are White / Caucasian (286 | 69.3%), Black / African American (95 | 23.0%), and Two or more Races (22 | 5.3%).
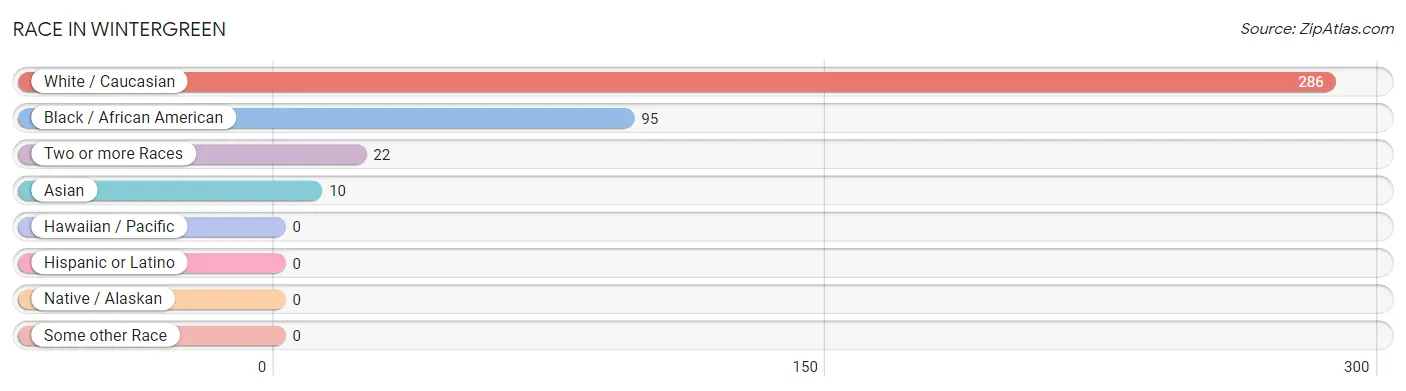
| Race | # Population | % Population |
| Asian | 10 | 2.4% |
| Black / African American | 95 | 23.0% |
| Hawaiian / Pacific | 0 | 0.0% |
| Hispanic or Latino | 0 | 0.0% |
| Native / Alaskan | 0 | 0.0% |
| White / Caucasian | 286 | 69.3% |
| Two or more Races | 22 | 5.3% |
| Some other Race | 0 | 0.0% |
| Total | 413 | 100.0% |
Ancestry in Wintergreen
The most populous ancestries reported in Wintergreen are English (105 | 25.4%), Irish (64 | 15.5%), Polish (30 | 7.3%), French (26 | 6.3%), and Jamaican (26 | 6.3%), together accounting for 60.8% of all Wintergreen residents.
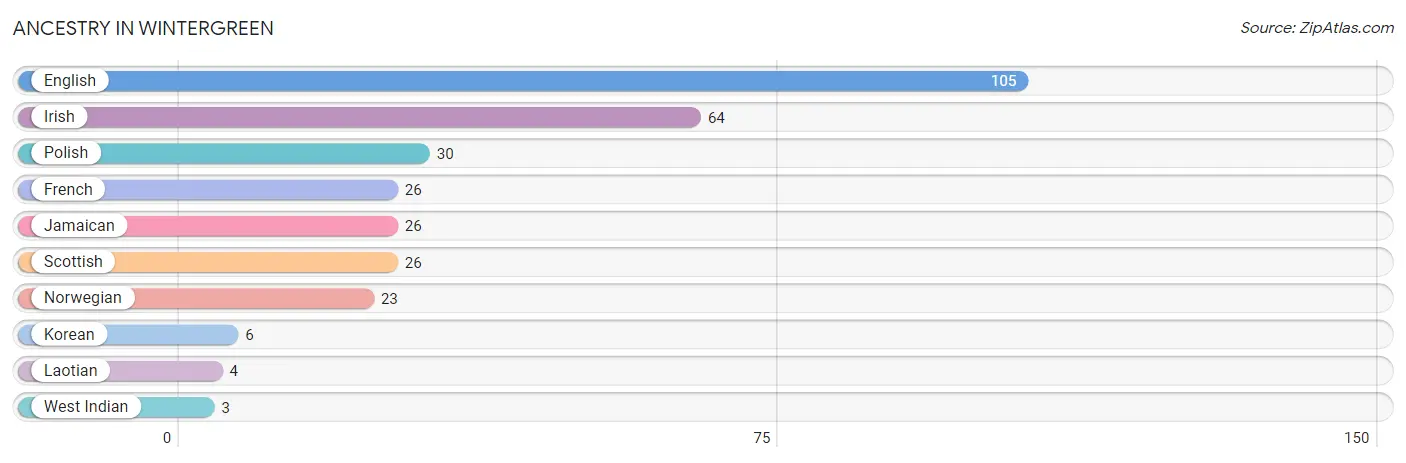
| Ancestry | # Population | % Population |
| English | 105 | 25.4% |
| French | 26 | 6.3% |
| Irish | 64 | 15.5% |
| Jamaican | 26 | 6.3% |
| Korean | 6 | 1.5% |
| Laotian | 4 | 1.0% |
| Norwegian | 23 | 5.6% |
| Polish | 30 | 7.3% |
| Scottish | 26 | 6.3% |
| West Indian | 3 | 0.7% | View All 10 Rows |
Immigrants in Wintergreen
The most numerous immigrant groups reported in Wintergreen came from Caribbean (29 | 7.0%), Jamaica (29 | 7.0%), Latin America (29 | 7.0%), Asia (10 | 2.4%), and South Eastern Asia (10 | 2.4%), together accounting for 25.9% of all Wintergreen residents.
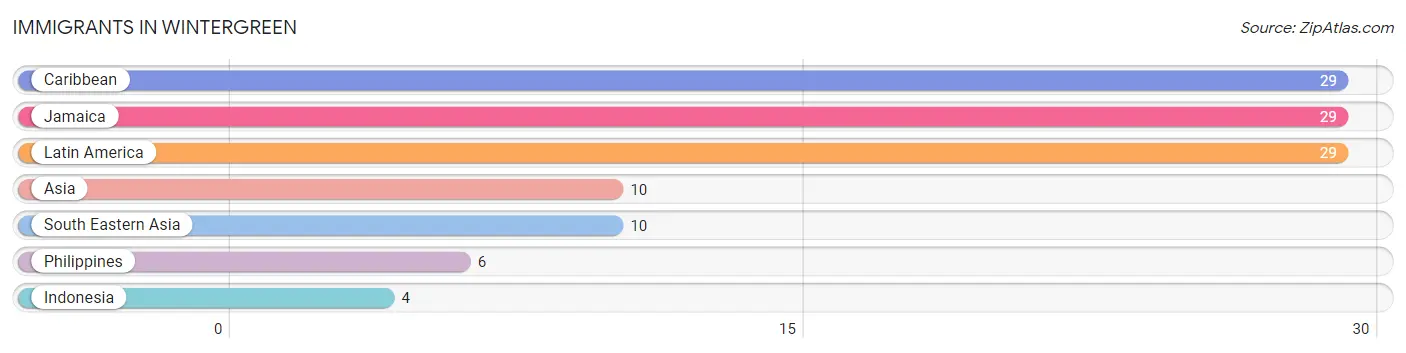
| Immigration Origin | # Population | % Population |
| Asia | 10 | 2.4% |
| Caribbean | 29 | 7.0% |
| Indonesia | 4 | 1.0% |
| Jamaica | 29 | 7.0% |
| Latin America | 29 | 7.0% |
| Philippines | 6 | 1.5% |
| South Eastern Asia | 10 | 2.4% | View All 7 Rows |
Sex and Age in Wintergreen
Sex and Age in Wintergreen
The most populous age groups in Wintergreen are 65 to 69 Years (70 | 29.9%) for men and 65 to 69 Years (46 | 25.7%) for women.
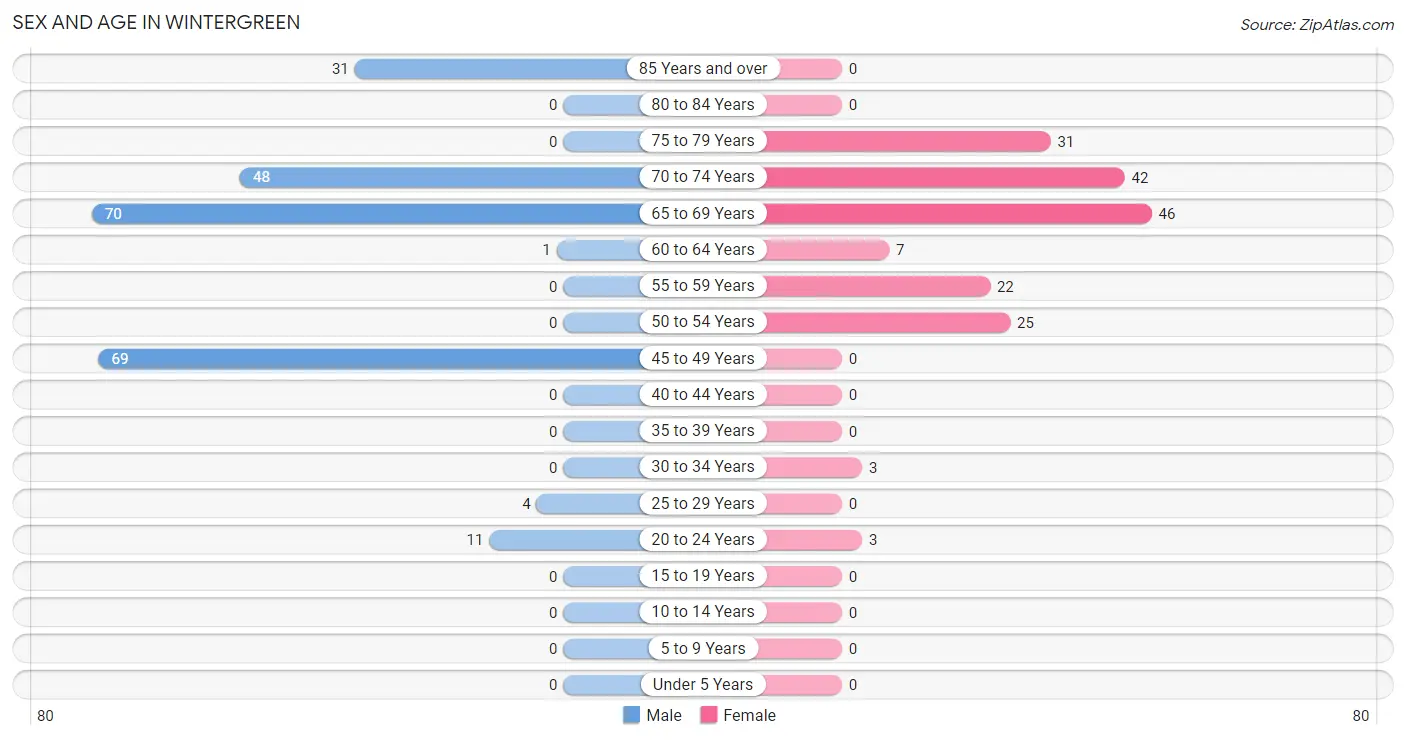
| Age Bracket | Male | Female |
| Under 5 Years | 0 (0.0%) | 0 (0.0%) |
| 5 to 9 Years | 0 (0.0%) | 0 (0.0%) |
| 10 to 14 Years | 0 (0.0%) | 0 (0.0%) |
| 15 to 19 Years | 0 (0.0%) | 0 (0.0%) |
| 20 to 24 Years | 11 (4.7%) | 3 (1.7%) |
| 25 to 29 Years | 4 (1.7%) | 0 (0.0%) |
| 30 to 34 Years | 0 (0.0%) | 3 (1.7%) |
| 35 to 39 Years | 0 (0.0%) | 0 (0.0%) |
| 40 to 44 Years | 0 (0.0%) | 0 (0.0%) |
| 45 to 49 Years | 69 (29.5%) | 0 (0.0%) |
| 50 to 54 Years | 0 (0.0%) | 25 (14.0%) |
| 55 to 59 Years | 0 (0.0%) | 22 (12.3%) |
| 60 to 64 Years | 1 (0.4%) | 7 (3.9%) |
| 65 to 69 Years | 70 (29.9%) | 46 (25.7%) |
| 70 to 74 Years | 48 (20.5%) | 42 (23.5%) |
| 75 to 79 Years | 0 (0.0%) | 31 (17.3%) |
| 80 to 84 Years | 0 (0.0%) | 0 (0.0%) |
| 85 Years and over | 31 (13.3%) | 0 (0.0%) |
| Total | 234 (100.0%) | 179 (100.0%) |
Families and Households in Wintergreen
Median Family Size in Wintergreen
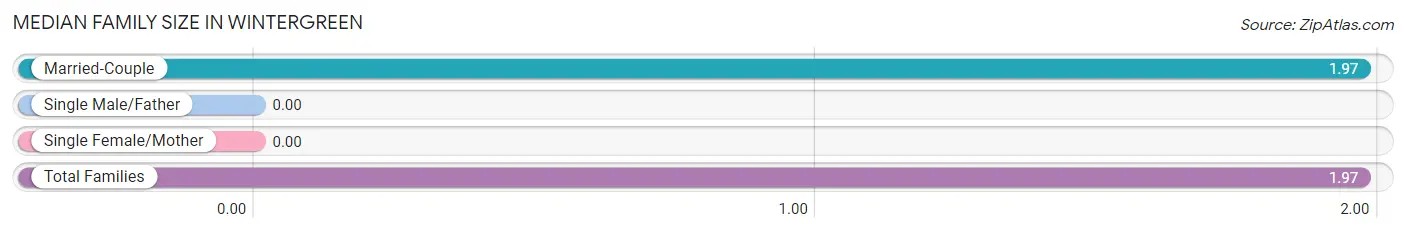
| Family Type | # Families | Family Size |
| Married-Couple | 149 (100.0%) | 1.97 |
| Single Male/Father | 0 (0.0%) | - |
| Single Female/Mother | 0 (0.0%) | - |
| Total Families | 149 (100.0%) | 1.97 |
Median Household Size in Wintergreen
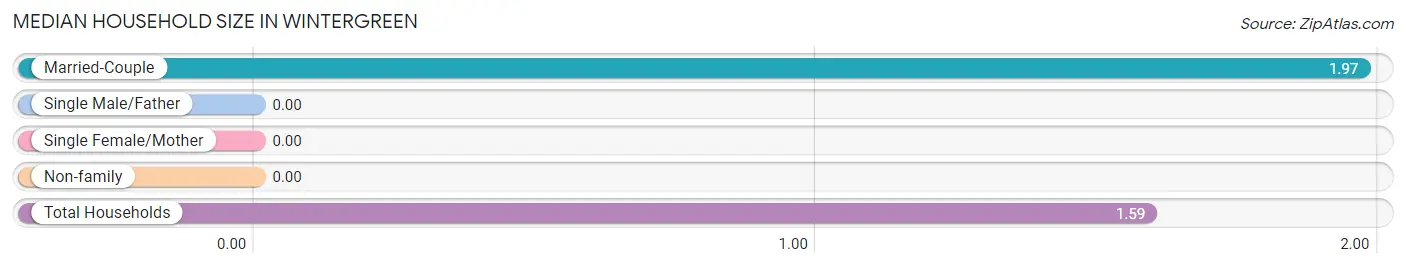
| Household Type | # Households | Household Size |
| Married-Couple | 149 (61.3%) | 1.97 |
| Single Male/Father | 0 (0.0%) | - |
| Single Female/Mother | 0 (0.0%) | - |
| Non-family | 94 (38.7%) | - |
| Total Households | 243 (100.0%) | 1.59 |
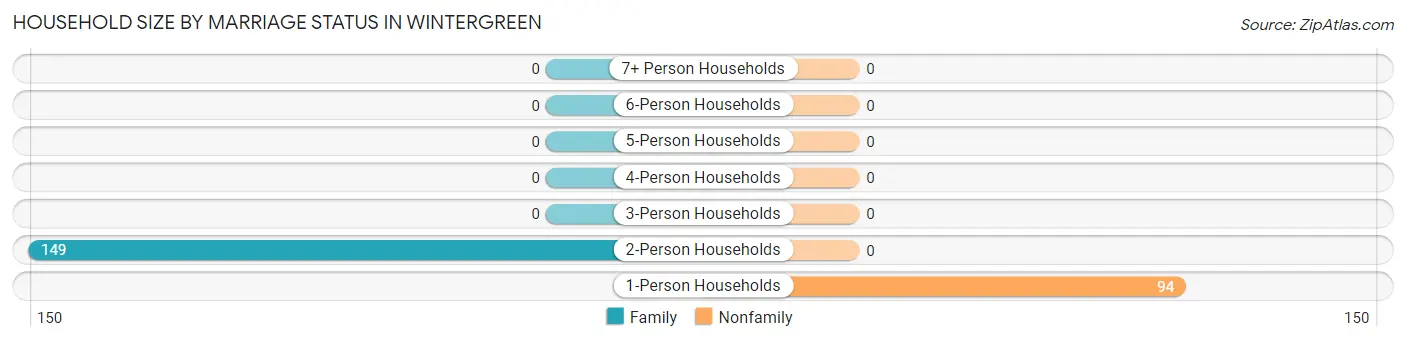
Household Size by Marriage Status in Wintergreen
Out of a total of 243 households in Wintergreen, 149 (61.3%) are family households, while 94 (38.7%) are nonfamily households. The most numerous type of family households are 2-person households, comprising 149, and the most common type of nonfamily households are 1-person households, comprising 94.
| Household Size | Family Households | Nonfamily Households |
| 1-Person Households | - | 94 (38.7%) |
| 2-Person Households | 149 (61.3%) | 0 (0.0%) |
| 3-Person Households | 0 (0.0%) | 0 (0.0%) |
| 4-Person Households | 0 (0.0%) | 0 (0.0%) |
| 5-Person Households | 0 (0.0%) | 0 (0.0%) |
| 6-Person Households | 0 (0.0%) | 0 (0.0%) |
| 7+ Person Households | 0 (0.0%) | 0 (0.0%) |
| Total | 149 (61.3%) | 94 (38.7%) |
Female Fertility in Wintergreen
Fertility by Age in Wintergreen
| Age Bracket | Women with Births | Births / 1,000 Women |
| 15 to 19 years | 0 (0.0%) | 0.0 |
| 20 to 34 years | 0 (0.0%) | 0.0 |
| 35 to 50 years | 0 (0.0%) | 0.0 |
| Total | 0 (0.0%) | 0.0 |
Fertility by Age by Marriage Status in Wintergreen
| Age Bracket | Married | Unmarried |
| 15 to 19 years | 0 (0.0%) | 0 (0.0%) |
| 20 to 34 years | 0 (0.0%) | 0 (0.0%) |
| 35 to 50 years | 0 (0.0%) | 0 (0.0%) |
| Total | 0 (0.0%) | 0 (0.0%) |
Fertility by Education in Wintergreen
| Educational Attainment | Women with Births | Births / 1,000 Women |
| Less than High School | 0 (0.0%) | 0.0 |
| High School Diploma | 0 (0.0%) | 0.0 |
| College or Associate's Degree | 0 (0.0%) | 0.0 |
| Bachelor's Degree | 0 (0.0%) | 0.0 |
| Graduate Degree | 0 (0.0%) | 0.0 |
| Total | 0 (0.0%) | 0.0 |
Fertility by Education by Marriage Status in Wintergreen
| Educational Attainment | Married | Unmarried |
| Less than High School | 0 (0.0%) | 0 (0.0%) |
| High School Diploma | 0 (0.0%) | 0 (0.0%) |
| College or Associate's Degree | 0 (0.0%) | 0 (0.0%) |
| Bachelor's Degree | 0 (0.0%) | 0 (0.0%) |
| Graduate Degree | 0 (0.0%) | 0 (0.0%) |
| Total | 0 (0.0%) | 0 (0.0%) |
Employment Characteristics in Wintergreen
Employment by Class of Employer in Wintergreen
Among the 258 employed individuals in Wintergreen, private company employees (112 | 43.4%), self-employed (not incorporated) (93 | 36.0%), and self-employed (incorporated) (49 | 19.0%) make up the most common classes of employment.
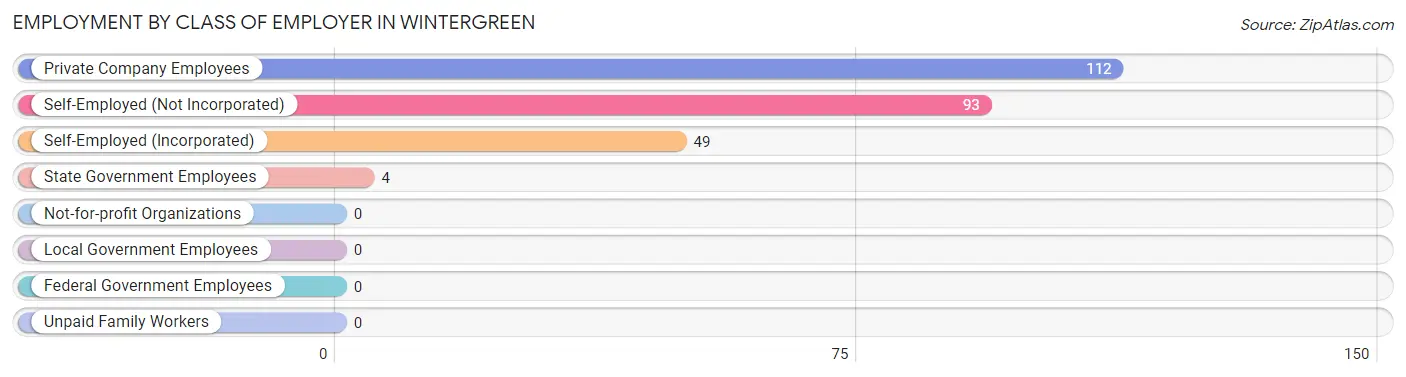
| Employer Class | # Employees | % Employees |
| Private Company Employees | 112 | 43.4% |
| Self-Employed (Incorporated) | 49 | 19.0% |
| Self-Employed (Not Incorporated) | 93 | 36.0% |
| Not-for-profit Organizations | 0 | 0.0% |
| Local Government Employees | 0 | 0.0% |
| State Government Employees | 4 | 1.5% |
| Federal Government Employees | 0 | 0.0% |
| Unpaid Family Workers | 0 | 0.0% |
| Total | 258 | 100.0% |
Employment Status by Age in Wintergreen
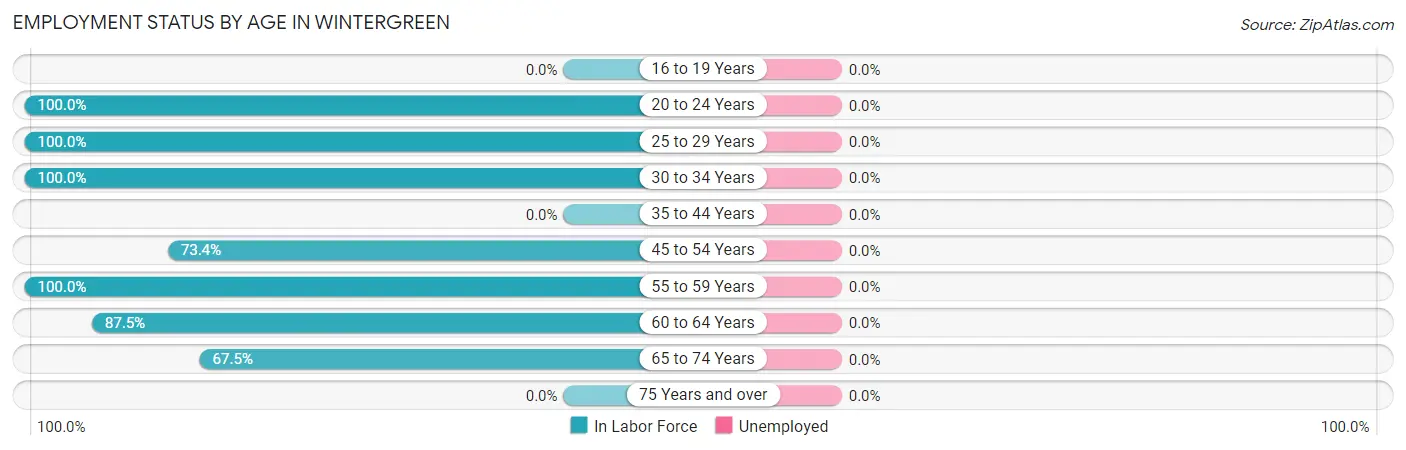
| Age Bracket | In Labor Force | Unemployed |
| 16 to 19 Years | 0 (0.0%) | 0 (0.0%) |
| 20 to 24 Years | 14 (100.0%) | 0 (0.0%) |
| 25 to 29 Years | 4 (100.0%) | 0 (0.0%) |
| 30 to 34 Years | 3 (100.0%) | 0 (0.0%) |
| 35 to 44 Years | 0 (0.0%) | 0 (0.0%) |
| 45 to 54 Years | 69 (73.4%) | 0 (0.0%) |
| 55 to 59 Years | 22 (100.0%) | 0 (0.0%) |
| 60 to 64 Years | 7 (87.5%) | 0 (0.0%) |
| 65 to 74 Years | 139 (67.5%) | 0 (0.0%) |
| 75 Years and over | 0 (0.0%) | 0 (0.0%) |
| Total | 258 (62.5%) | 0 (0.0%) |
Employment Status by Educational Attainment in Wintergreen
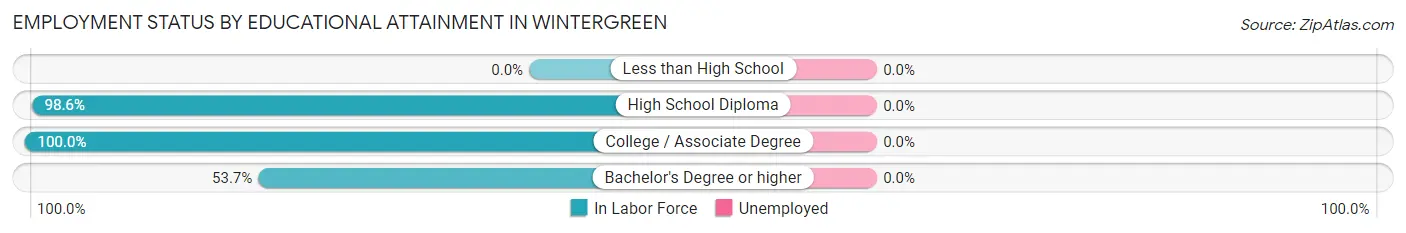
| Educational Attainment | In Labor Force | Unemployed |
| Less than High School | 0 (0.0%) | 0 (0.0%) |
| High School Diploma | 72 (98.6%) | 0 (0.0%) |
| College / Associate Degree | 4 (100.0%) | 0 (0.0%) |
| Bachelor's Degree or higher | 29 (53.7%) | 0 (0.0%) |
| Total | 105 (80.2%) | 0 (0.0%) |
Employment Occupations by Sex in Wintergreen
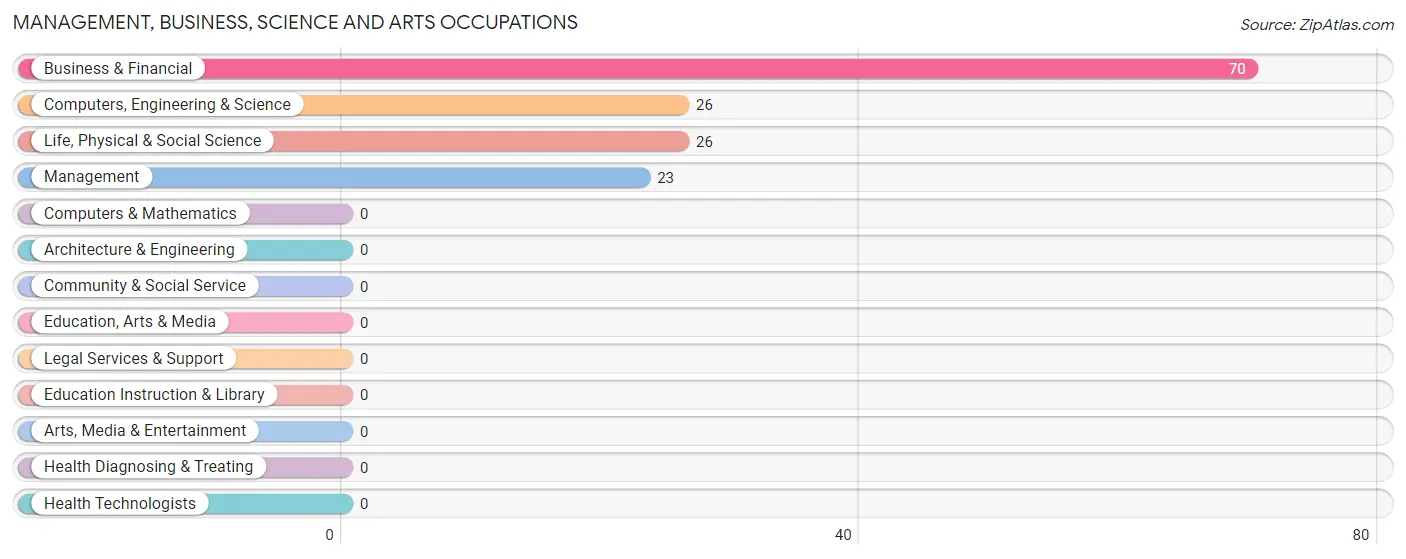
Management, Business, Science and Arts Occupations
The most common Management, Business, Science and Arts occupations in Wintergreen are Business & Financial (70 | 27.1%), Computers, Engineering & Science (26 | 10.1%), Life, Physical & Social Science (26 | 10.1%), and Management (23 | 8.9%).
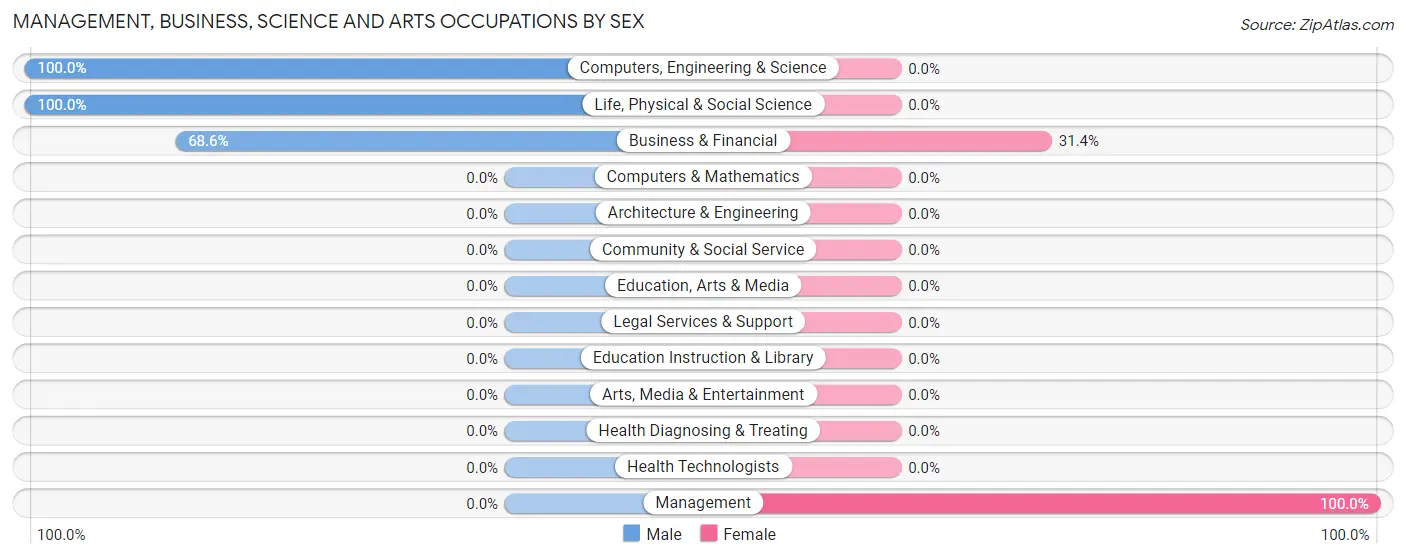
Management, Business, Science and Arts Occupations by Sex
Within the Management, Business, Science and Arts occupations in Wintergreen, the most male-oriented occupations are Computers, Engineering & Science (100.0%), Life, Physical & Social Science (100.0%), and Business & Financial (68.6%), while the most female-oriented occupations are Management (100.0%), and Business & Financial (31.4%).
| Occupation | Male | Female |
| Management | 0 (0.0%) | 23 (100.0%) |
| Business & Financial | 48 (68.6%) | 22 (31.4%) |
| Computers, Engineering & Science | 26 (100.0%) | 0 (0.0%) |
| Computers & Mathematics | 0 (0.0%) | 0 (0.0%) |
| Architecture & Engineering | 0 (0.0%) | 0 (0.0%) |
| Life, Physical & Social Science | 26 (100.0%) | 0 (0.0%) |
| Community & Social Service | 0 (0.0%) | 0 (0.0%) |
| Education, Arts & Media | 0 (0.0%) | 0 (0.0%) |
| Legal Services & Support | 0 (0.0%) | 0 (0.0%) |
| Education Instruction & Library | 0 (0.0%) | 0 (0.0%) |
| Arts, Media & Entertainment | 0 (0.0%) | 0 (0.0%) |
| Health Diagnosing & Treating | 0 (0.0%) | 0 (0.0%) |
| Health Technologists | 0 (0.0%) | 0 (0.0%) |
| Total (Category) | 74 (62.2%) | 45 (37.8%) |
| Total (Overall) | 158 (61.2%) | 100 (38.8%) |
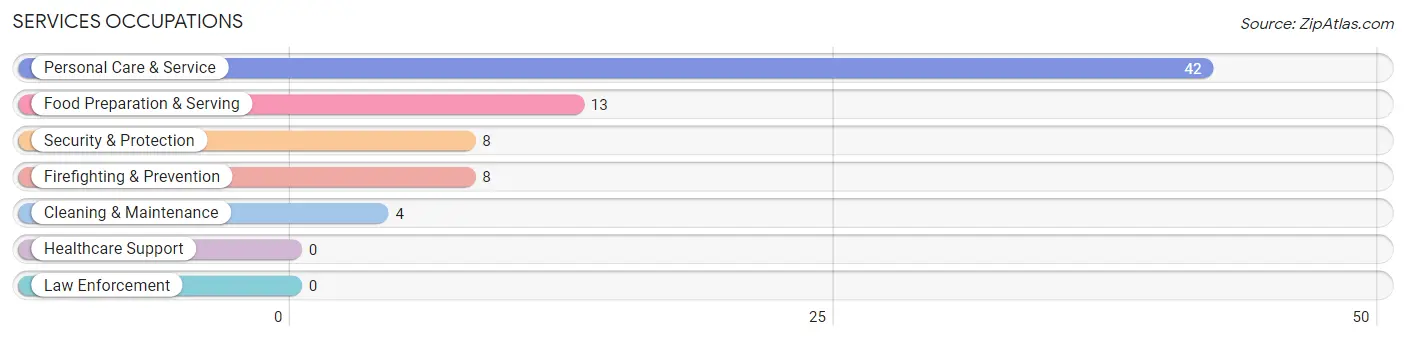
Services Occupations
The most common Services occupations in Wintergreen are Personal Care & Service (42 | 16.3%), Food Preparation & Serving (13 | 5.0%), Security & Protection (8 | 3.1%), Firefighting & Prevention (8 | 3.1%), and Cleaning & Maintenance (4 | 1.5%).
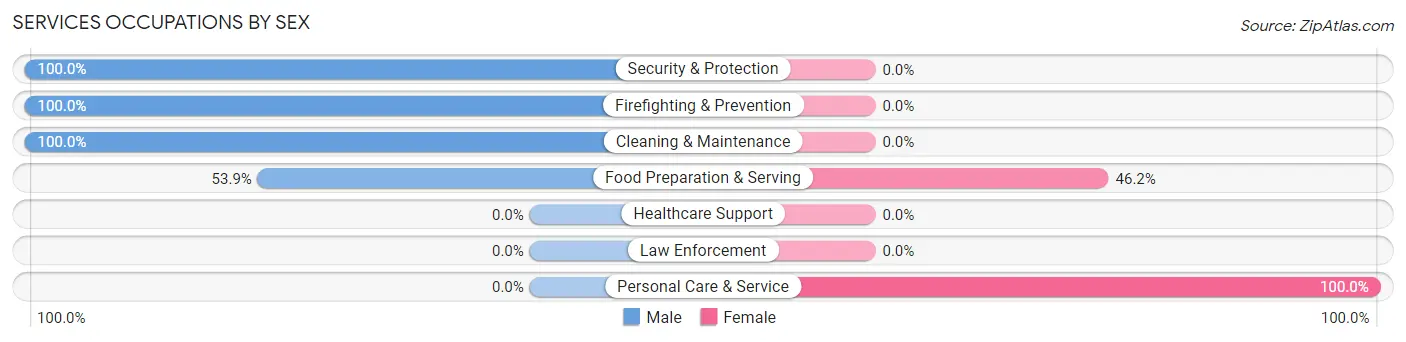
Services Occupations by Sex
Within the Services occupations in Wintergreen, the most male-oriented occupations are Security & Protection (100.0%), Firefighting & Prevention (100.0%), and Cleaning & Maintenance (100.0%), while the most female-oriented occupations are Personal Care & Service (100.0%), and Food Preparation & Serving (46.2%).
| Occupation | Male | Female |
| Healthcare Support | 0 (0.0%) | 0 (0.0%) |
| Security & Protection | 8 (100.0%) | 0 (0.0%) |
| Firefighting & Prevention | 8 (100.0%) | 0 (0.0%) |
| Law Enforcement | 0 (0.0%) | 0 (0.0%) |
| Food Preparation & Serving | 7 (53.8%) | 6 (46.2%) |
| Cleaning & Maintenance | 4 (100.0%) | 0 (0.0%) |
| Personal Care & Service | 0 (0.0%) | 42 (100.0%) |
| Total (Category) | 19 (28.4%) | 48 (71.6%) |
| Total (Overall) | 158 (61.2%) | 100 (38.8%) |
Sales and Office Occupations
The most common Sales and Office occupations in Wintergreen are , and Sales & Related (7 | 2.7%).
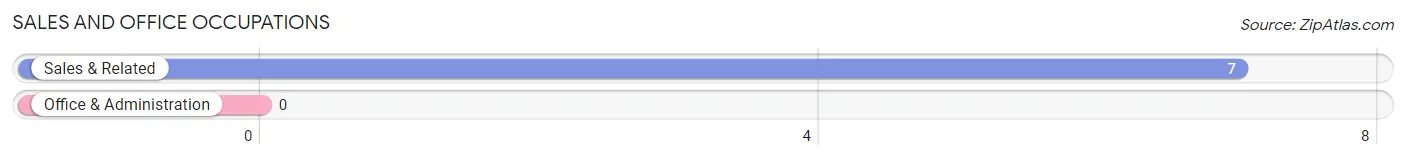
Sales and Office Occupations by Sex
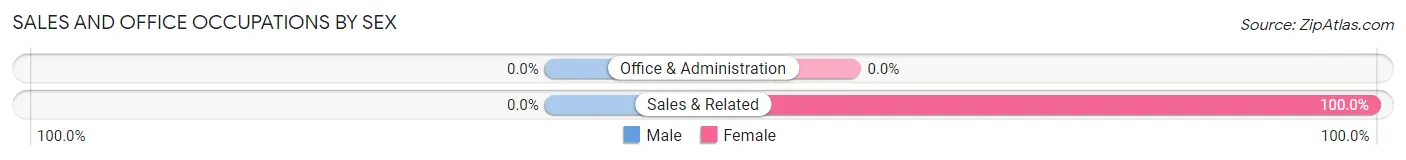
| Occupation | Male | Female |
| Sales & Related | 0 (0.0%) | 7 (100.0%) |
| Office & Administration | 0 (0.0%) | 0 (0.0%) |
| Total (Category) | 0 (0.0%) | 7 (100.0%) |
| Total (Overall) | 158 (61.2%) | 100 (38.8%) |
Natural Resources, Construction and Maintenance Occupations
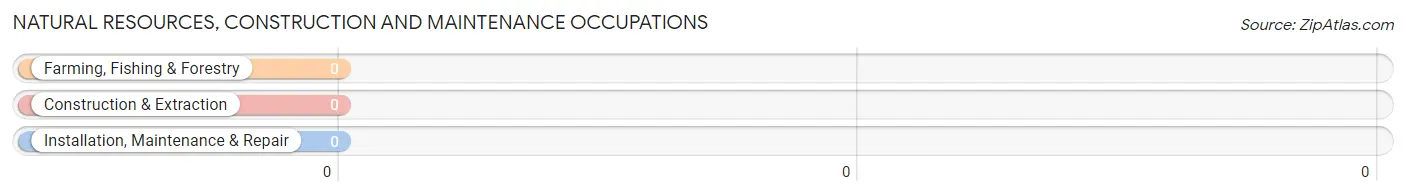
Natural Resources, Construction and Maintenance Occupations by Sex
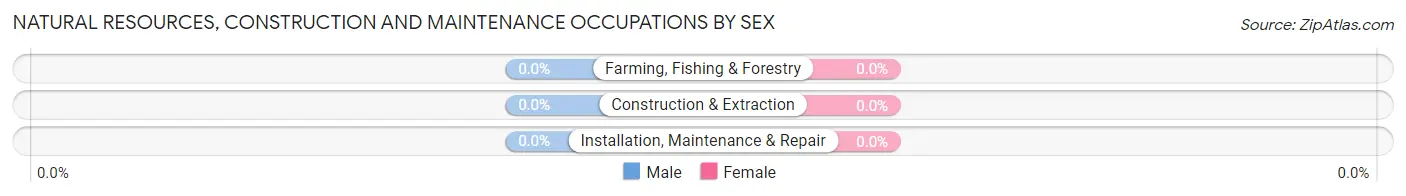
| Occupation | Male | Female |
| Farming, Fishing & Forestry | 0 (0.0%) | 0 (0.0%) |
| Construction & Extraction | 0 (0.0%) | 0 (0.0%) |
| Installation, Maintenance & Repair | 0 (0.0%) | 0 (0.0%) |
| Total (Category) | 0 (0.0%) | 0 (0.0%) |
| Total (Overall) | 158 (61.2%) | 100 (38.8%) |
Production, Transportation and Moving Occupations
The most common Production, Transportation and Moving occupations in Wintergreen are , and Production (65 | 25.2%).
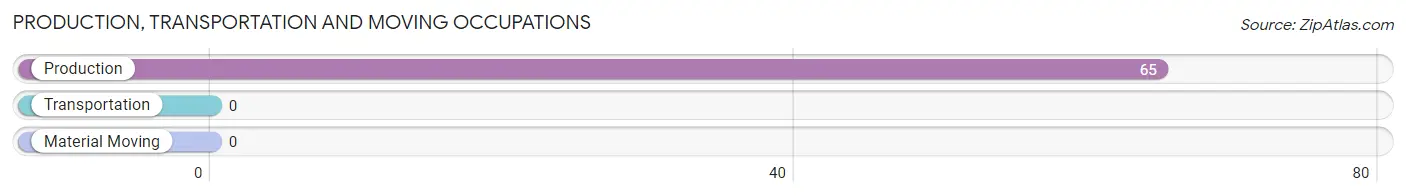
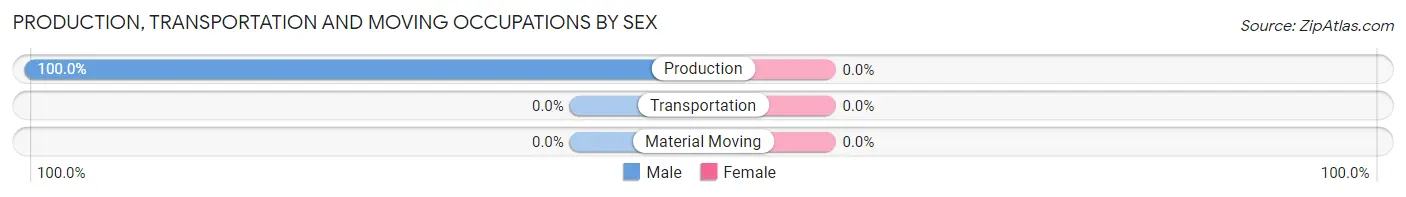
Production, Transportation and Moving Occupations by Sex
| Occupation | Male | Female |
| Production | 65 (100.0%) | 0 (0.0%) |
| Transportation | 0 (0.0%) | 0 (0.0%) |
| Material Moving | 0 (0.0%) | 0 (0.0%) |
| Total (Category) | 65 (100.0%) | 0 (0.0%) |
| Total (Overall) | 158 (61.2%) | 100 (38.8%) |
Employment Industries by Sex in Wintergreen
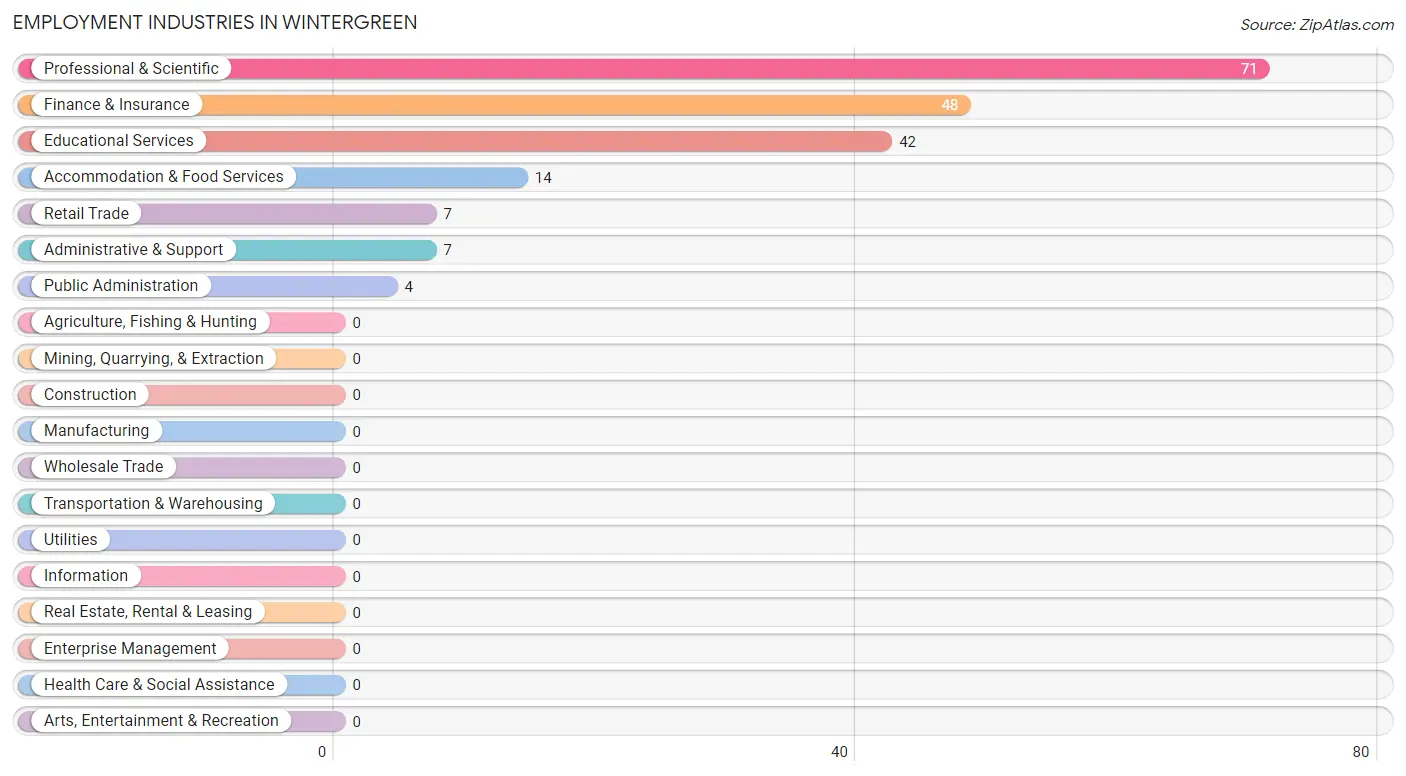
Employment Industries in Wintergreen
The major employment industries in Wintergreen include Professional & Scientific (71 | 27.5%), Finance & Insurance (48 | 18.6%), Educational Services (42 | 16.3%), Accommodation & Food Services (14 | 5.4%), and Retail Trade (7 | 2.7%).
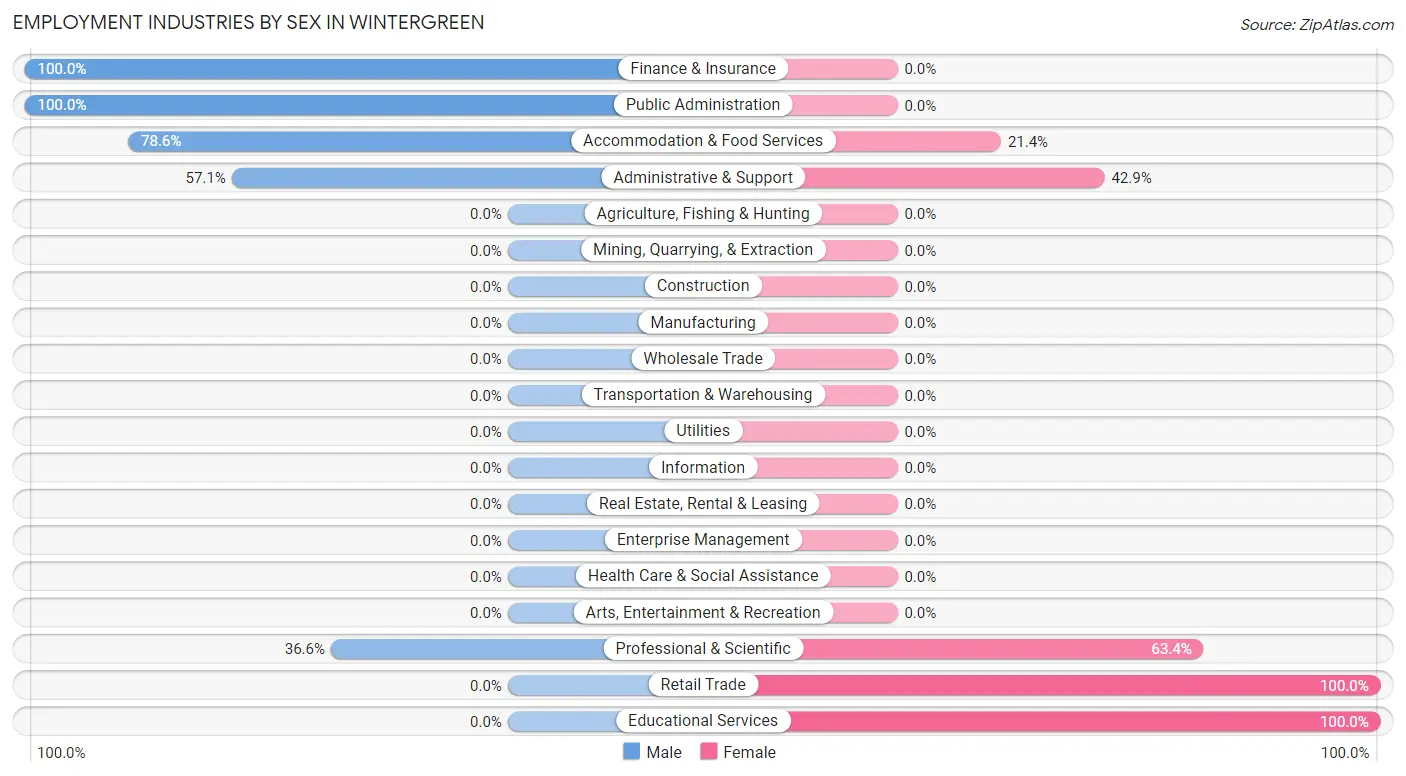
Employment Industries by Sex in Wintergreen
The Wintergreen industries that see more men than women are Finance & Insurance (100.0%), Public Administration (100.0%), and Accommodation & Food Services (78.6%), whereas the industries that tend to have a higher number of women are Retail Trade (100.0%), Educational Services (100.0%), and Professional & Scientific (63.4%).
| Industry | Male | Female |
| Agriculture, Fishing & Hunting | 0 (0.0%) | 0 (0.0%) |
| Mining, Quarrying, & Extraction | 0 (0.0%) | 0 (0.0%) |
| Construction | 0 (0.0%) | 0 (0.0%) |
| Manufacturing | 0 (0.0%) | 0 (0.0%) |
| Wholesale Trade | 0 (0.0%) | 0 (0.0%) |
| Retail Trade | 0 (0.0%) | 7 (100.0%) |
| Transportation & Warehousing | 0 (0.0%) | 0 (0.0%) |
| Utilities | 0 (0.0%) | 0 (0.0%) |
| Information | 0 (0.0%) | 0 (0.0%) |
| Finance & Insurance | 48 (100.0%) | 0 (0.0%) |
| Real Estate, Rental & Leasing | 0 (0.0%) | 0 (0.0%) |
| Professional & Scientific | 26 (36.6%) | 45 (63.4%) |
| Enterprise Management | 0 (0.0%) | 0 (0.0%) |
| Administrative & Support | 4 (57.1%) | 3 (42.9%) |
| Educational Services | 0 (0.0%) | 42 (100.0%) |
| Health Care & Social Assistance | 0 (0.0%) | 0 (0.0%) |
| Arts, Entertainment & Recreation | 0 (0.0%) | 0 (0.0%) |
| Accommodation & Food Services | 11 (78.6%) | 3 (21.4%) |
| Public Administration | 4 (100.0%) | 0 (0.0%) |
| Total | 158 (61.2%) | 100 (38.8%) |
Education in Wintergreen
School Enrollment in Wintergreen
| School Level | # Students | % Students |
| Nursery / Preschool | 0 | 0.0% |
| Kindergarten | 0 | 0.0% |
| Elementary School | 0 | 0.0% |
| Middle School | 0 | 0.0% |
| High School | 0 | 0.0% |
| College / Undergraduate | 0 | 0.0% |
| Graduate / Professional | 0 | 0.0% |
| Total | 0 | 0.0% |
School Enrollment by Age by Funding Source in Wintergreen
| Age Bracket | Public School | Private School |
| 3 to 4 Year Olds | 0 (0.0%) | 0 (0.0%) |
| 5 to 9 Year Old | 0 (0.0%) | 0 (0.0%) |
| 10 to 14 Year Olds | 0 (0.0%) | 0 (0.0%) |
| 15 to 17 Year Olds | 0 (0.0%) | 0 (0.0%) |
| 18 to 19 Year Olds | 0 (0.0%) | 0 (0.0%) |
| 20 to 24 Year Olds | 0 (0.0%) | 0 (0.0%) |
| 25 to 34 Year Olds | 0 (0.0%) | 0 (0.0%) |
| 35 Years and over | 0 (0.0%) | 0 (0.0%) |
| Total | 0 (0.0%) | 0 (0.0%) |
Educational Attainment by Field of Study in Wintergreen
Business (56 | 19.2%), engineering (48 | 16.5%), computers & mathematics (43 | 14.8%), education (42 | 14.4%), and bio, nature & agricultural (26 | 8.9%) are the most common fields of study among 291 individuals in Wintergreen who have obtained a bachelor's degree or higher.
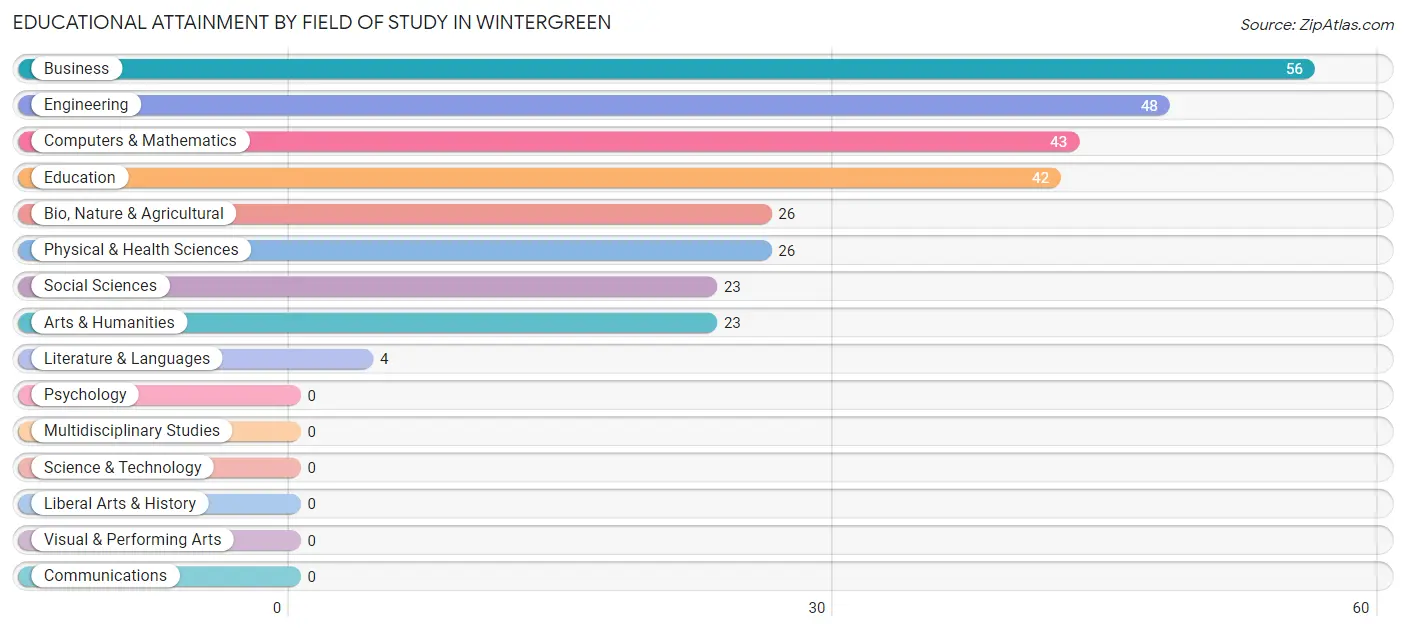
| Field of Study | # Graduates | % Graduates |
| Computers & Mathematics | 43 | 14.8% |
| Bio, Nature & Agricultural | 26 | 8.9% |
| Physical & Health Sciences | 26 | 8.9% |
| Psychology | 0 | 0.0% |
| Social Sciences | 23 | 7.9% |
| Engineering | 48 | 16.5% |
| Multidisciplinary Studies | 0 | 0.0% |
| Science & Technology | 0 | 0.0% |
| Business | 56 | 19.2% |
| Education | 42 | 14.4% |
| Literature & Languages | 4 | 1.4% |
| Liberal Arts & History | 0 | 0.0% |
| Visual & Performing Arts | 0 | 0.0% |
| Communications | 0 | 0.0% |
| Arts & Humanities | 23 | 7.9% |
| Total | 291 | 100.0% |
Transportation & Commute in Wintergreen
Vehicle Availability by Sex in Wintergreen
The most prevalent vehicle ownership categories in Wintergreen are males with 2 vehicles (74, accounting for 53.2%) and females with 2 vehicles (65, making up 78.7%).
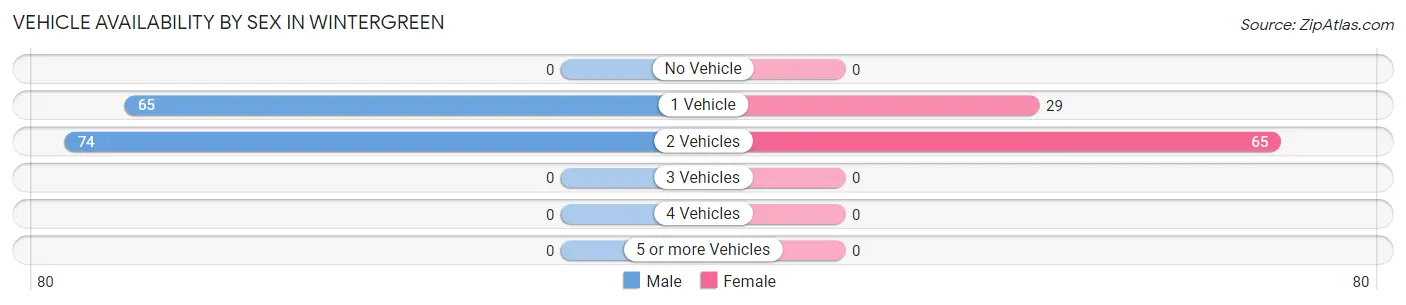
| Vehicles Available | Male | Female |
| No Vehicle | 0 (0.0%) | 0 (0.0%) |
| 1 Vehicle | 65 (46.8%) | 29 (30.8%) |
| 2 Vehicles | 74 (53.2%) | 65 (69.2%) |
| 3 Vehicles | 0 (0.0%) | 0 (0.0%) |
| 4 Vehicles | 0 (0.0%) | 0 (0.0%) |
| 5 or more Vehicles | 0 (0.0%) | 0 (0.0%) |
| Total | 139 (100.0%) | 94 (100.0%) |
Commute Time in Wintergreen
The most frequently occuring commute durations in Wintergreen are 10 to 14 minutes (65 commuters, 69.2%), 5 to 9 minutes (18 commuters, 19.2%), and 15 to 19 minutes (11 commuters, 11.7%).
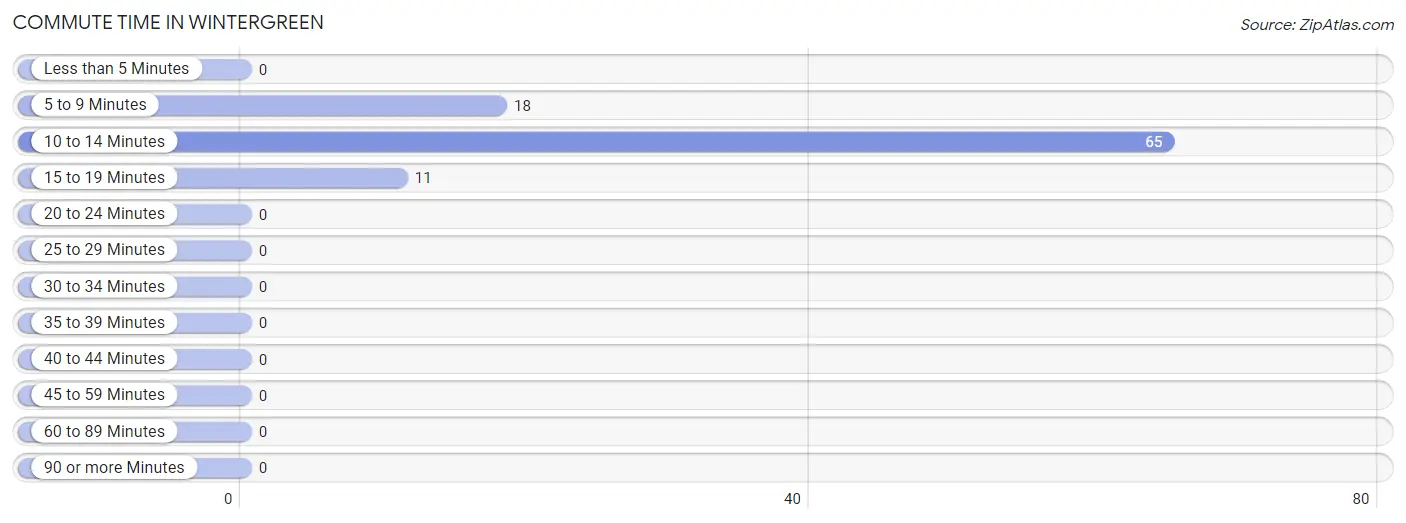
| Commute Time | # Commuters | % Commuters |
| Less than 5 Minutes | 0 | 0.0% |
| 5 to 9 Minutes | 18 | 19.2% |
| 10 to 14 Minutes | 65 | 69.2% |
| 15 to 19 Minutes | 11 | 11.7% |
| 20 to 24 Minutes | 0 | 0.0% |
| 25 to 29 Minutes | 0 | 0.0% |
| 30 to 34 Minutes | 0 | 0.0% |
| 35 to 39 Minutes | 0 | 0.0% |
| 40 to 44 Minutes | 0 | 0.0% |
| 45 to 59 Minutes | 0 | 0.0% |
| 60 to 89 Minutes | 0 | 0.0% |
| 90 or more Minutes | 0 | 0.0% |
Commute Time by Sex in Wintergreen
The most common commute times in Wintergreen are 10 to 14 minutes (65 commuters, 77.4%) for males and 15 to 19 minutes (7 commuters, 70.0%) for females.
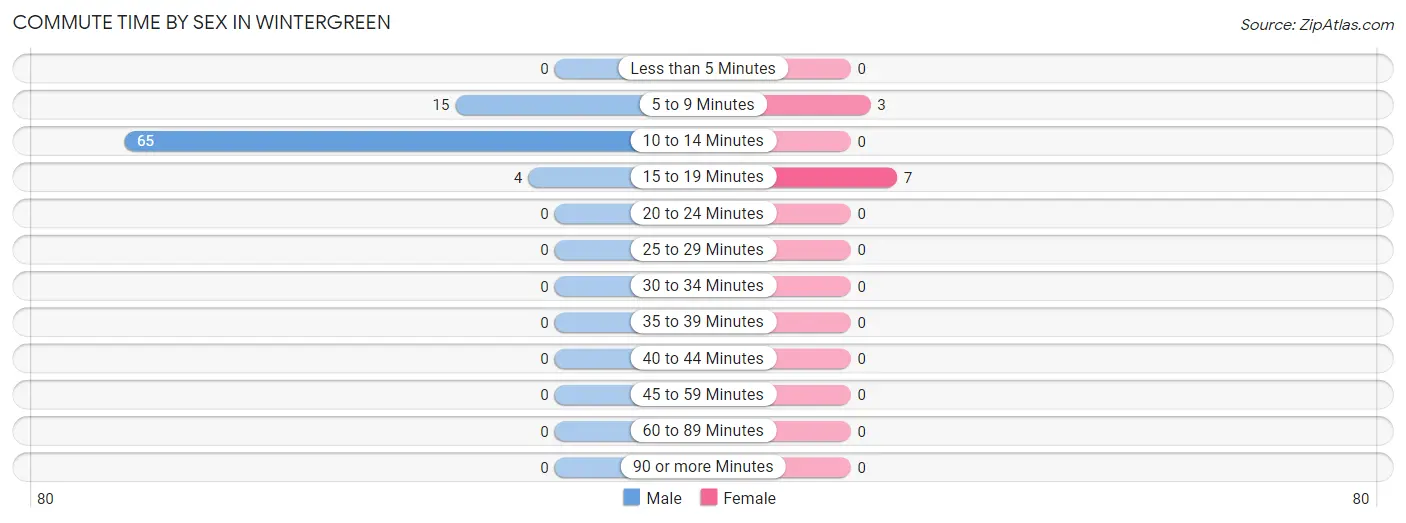
| Commute Time | Male | Female |
| Less than 5 Minutes | 0 (0.0%) | 0 (0.0%) |
| 5 to 9 Minutes | 15 (17.9%) | 3 (30.0%) |
| 10 to 14 Minutes | 65 (77.4%) | 0 (0.0%) |
| 15 to 19 Minutes | 4 (4.8%) | 7 (70.0%) |
| 20 to 24 Minutes | 0 (0.0%) | 0 (0.0%) |
| 25 to 29 Minutes | 0 (0.0%) | 0 (0.0%) |
| 30 to 34 Minutes | 0 (0.0%) | 0 (0.0%) |
| 35 to 39 Minutes | 0 (0.0%) | 0 (0.0%) |
| 40 to 44 Minutes | 0 (0.0%) | 0 (0.0%) |
| 45 to 59 Minutes | 0 (0.0%) | 0 (0.0%) |
| 60 to 89 Minutes | 0 (0.0%) | 0 (0.0%) |
| 90 or more Minutes | 0 (0.0%) | 0 (0.0%) |
Time of Departure to Work by Sex in Wintergreen
The most frequent times of departure to work in Wintergreen are 8:00 AM to 8:29 AM (65, 77.4%) for males and 8:00 AM to 8:29 AM (7, 70.0%) for females.
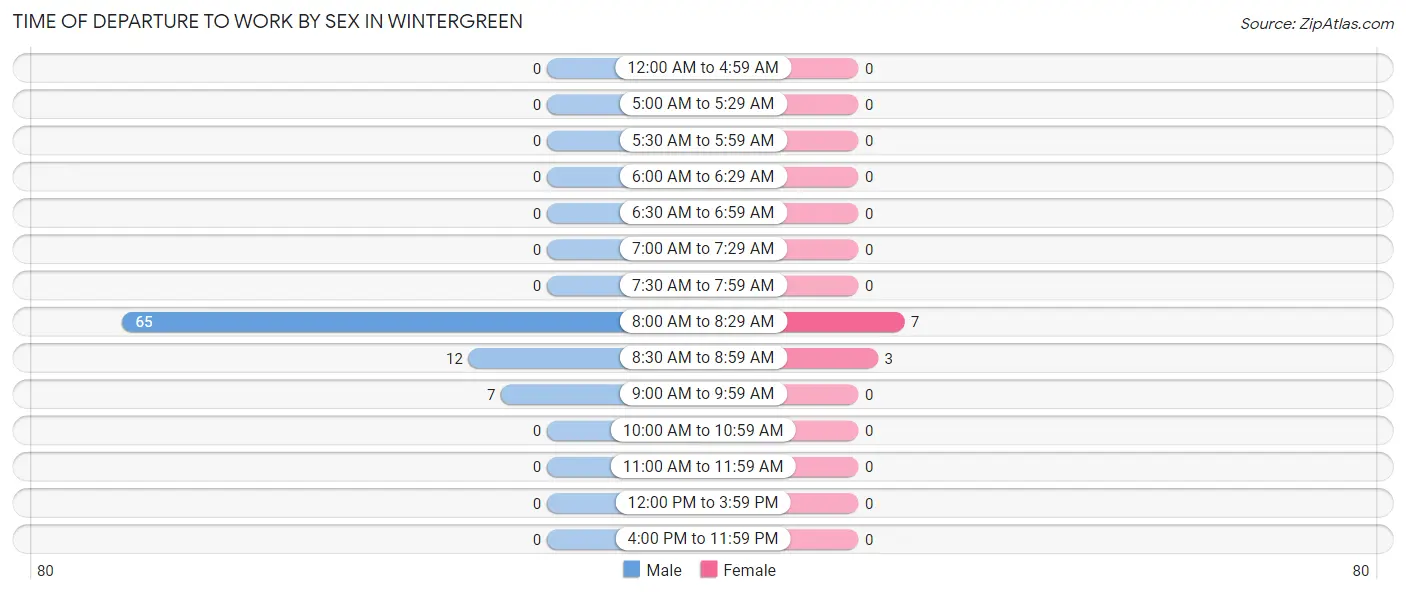
| Time of Departure | Male | Female |
| 12:00 AM to 4:59 AM | 0 (0.0%) | 0 (0.0%) |
| 5:00 AM to 5:29 AM | 0 (0.0%) | 0 (0.0%) |
| 5:30 AM to 5:59 AM | 0 (0.0%) | 0 (0.0%) |
| 6:00 AM to 6:29 AM | 0 (0.0%) | 0 (0.0%) |
| 6:30 AM to 6:59 AM | 0 (0.0%) | 0 (0.0%) |
| 7:00 AM to 7:29 AM | 0 (0.0%) | 0 (0.0%) |
| 7:30 AM to 7:59 AM | 0 (0.0%) | 0 (0.0%) |
| 8:00 AM to 8:29 AM | 65 (77.4%) | 7 (70.0%) |
| 8:30 AM to 8:59 AM | 12 (14.3%) | 3 (30.0%) |
| 9:00 AM to 9:59 AM | 7 (8.3%) | 0 (0.0%) |
| 10:00 AM to 10:59 AM | 0 (0.0%) | 0 (0.0%) |
| 11:00 AM to 11:59 AM | 0 (0.0%) | 0 (0.0%) |
| 12:00 PM to 3:59 PM | 0 (0.0%) | 0 (0.0%) |
| 4:00 PM to 11:59 PM | 0 (0.0%) | 0 (0.0%) |
| Total | 84 (100.0%) | 10 (100.0%) |
Housing Occupancy in Wintergreen
Occupancy by Ownership in Wintergreen
Of the total 243 dwellings in Wintergreen, owner-occupied units account for 178 (73.3%), while renter-occupied units make up 65 (26.8%).
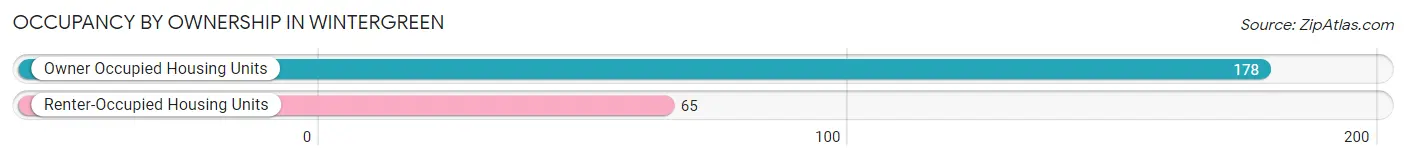
| Occupancy | # Housing Units | % Housing Units |
| Owner Occupied Housing Units | 178 | 73.3% |
| Renter-Occupied Housing Units | 65 | 26.8% |
| Total Occupied Housing Units | 243 | 100.0% |
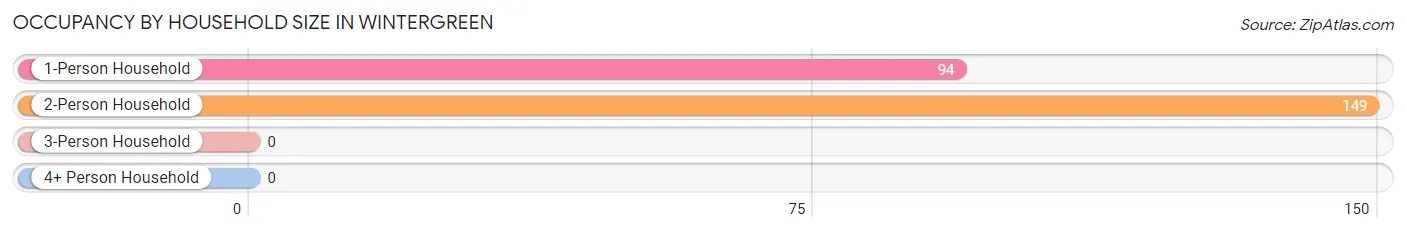
Occupancy by Household Size in Wintergreen
| Household Size | # Housing Units | % Housing Units |
| 1-Person Household | 94 | 38.7% |
| 2-Person Household | 149 | 61.3% |
| 3-Person Household | 0 | 0.0% |
| 4+ Person Household | 0 | 0.0% |
| Total Housing Units | 243 | 100.0% |
Occupancy by Ownership by Household Size in Wintergreen
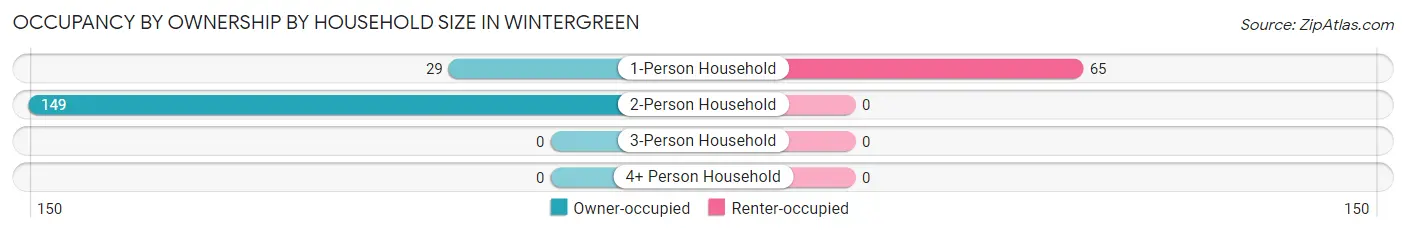
| Household Size | Owner-occupied | Renter-occupied |
| 1-Person Household | 29 (30.8%) | 65 (69.2%) |
| 2-Person Household | 149 (100.0%) | 0 (0.0%) |
| 3-Person Household | 0 (0.0%) | 0 (0.0%) |
| 4+ Person Household | 0 (0.0%) | 0 (0.0%) |
| Total Housing Units | 178 (73.3%) | 65 (26.8%) |
Occupancy by Educational Attainment in Wintergreen
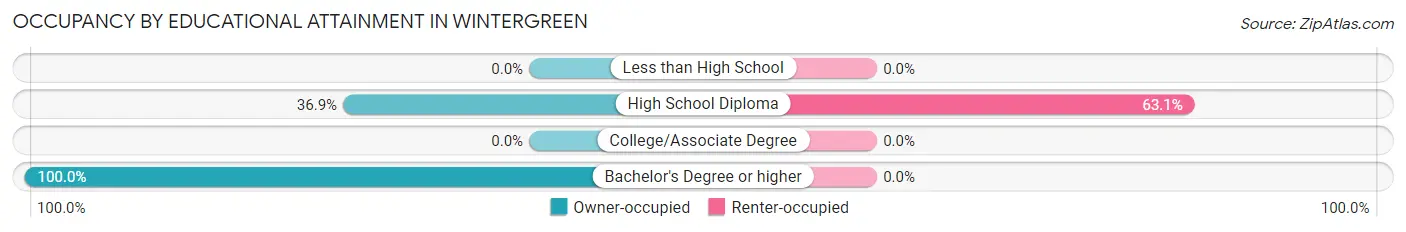
| Household Size | Owner-occupied | Renter-occupied |
| Less than High School | 0 (0.0%) | 0 (0.0%) |
| High School Diploma | 38 (36.9%) | 65 (63.1%) |
| College/Associate Degree | 0 (0.0%) | 0 (0.0%) |
| Bachelor's Degree or higher | 140 (100.0%) | 0 (0.0%) |
Occupancy by Age of Householder in Wintergreen
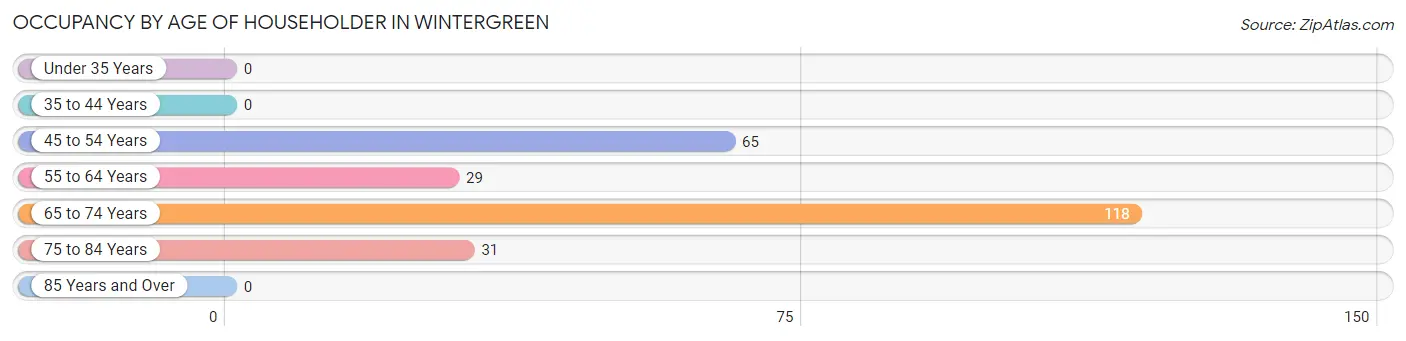
| Age Bracket | # Households | % Households |
| Under 35 Years | 0 | 0.0% |
| 35 to 44 Years | 0 | 0.0% |
| 45 to 54 Years | 65 | 26.8% |
| 55 to 64 Years | 29 | 11.9% |
| 65 to 74 Years | 118 | 48.6% |
| 75 to 84 Years | 31 | 12.8% |
| 85 Years and Over | 0 | 0.0% |
| Total | 243 | 100.0% |
Housing Finances in Wintergreen
Median Income by Occupancy in Wintergreen
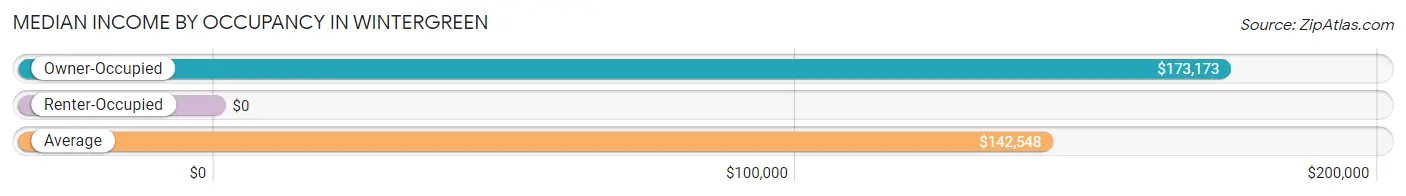
| Occupancy Type | # Households | Median Income |
| Owner-Occupied | 178 (73.3%) | $173,173 |
| Renter-Occupied | 65 (26.8%) | $0 |
| Average | 243 (100.0%) | $142,548 |
Occupancy by Householder Income Bracket in Wintergreen
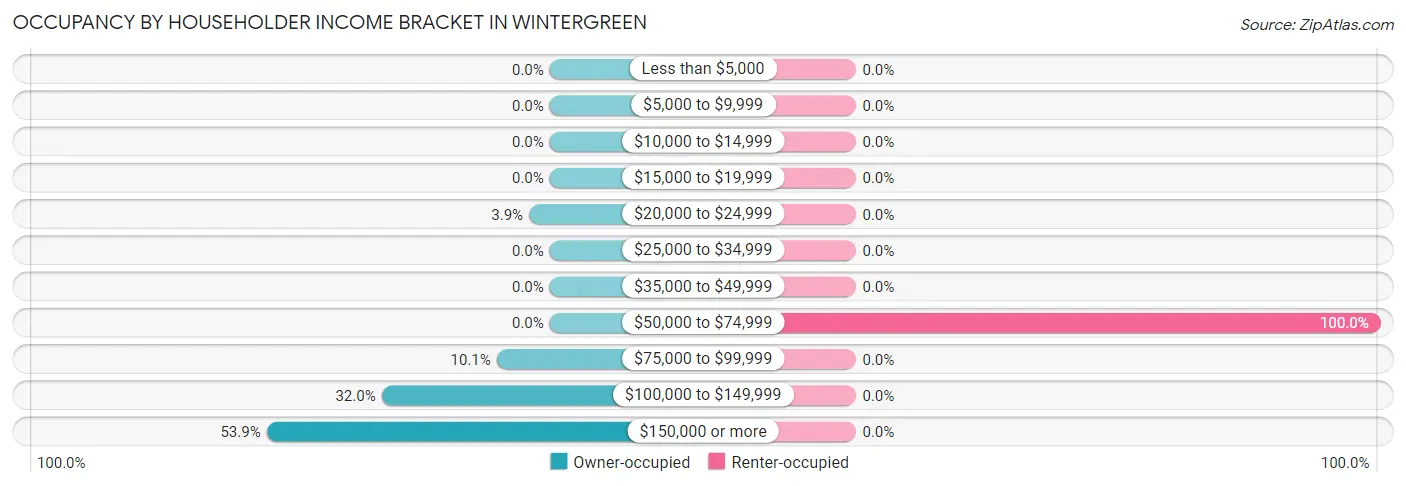
| Income Bracket | Owner-occupied | Renter-occupied |
| Less than $5,000 | 0 (0.0%) | 0 (0.0%) |
| $5,000 to $9,999 | 0 (0.0%) | 0 (0.0%) |
| $10,000 to $14,999 | 0 (0.0%) | 0 (0.0%) |
| $15,000 to $19,999 | 0 (0.0%) | 0 (0.0%) |
| $20,000 to $24,999 | 7 (3.9%) | 0 (0.0%) |
| $25,000 to $34,999 | 0 (0.0%) | 0 (0.0%) |
| $35,000 to $49,999 | 0 (0.0%) | 0 (0.0%) |
| $50,000 to $74,999 | 0 (0.0%) | 65 (100.0%) |
| $75,000 to $99,999 | 18 (10.1%) | 0 (0.0%) |
| $100,000 to $149,999 | 57 (32.0%) | 0 (0.0%) |
| $150,000 or more | 96 (53.9%) | 0 (0.0%) |
| Total | 178 (100.0%) | 65 (100.0%) |
Monthly Housing Cost Tiers in Wintergreen
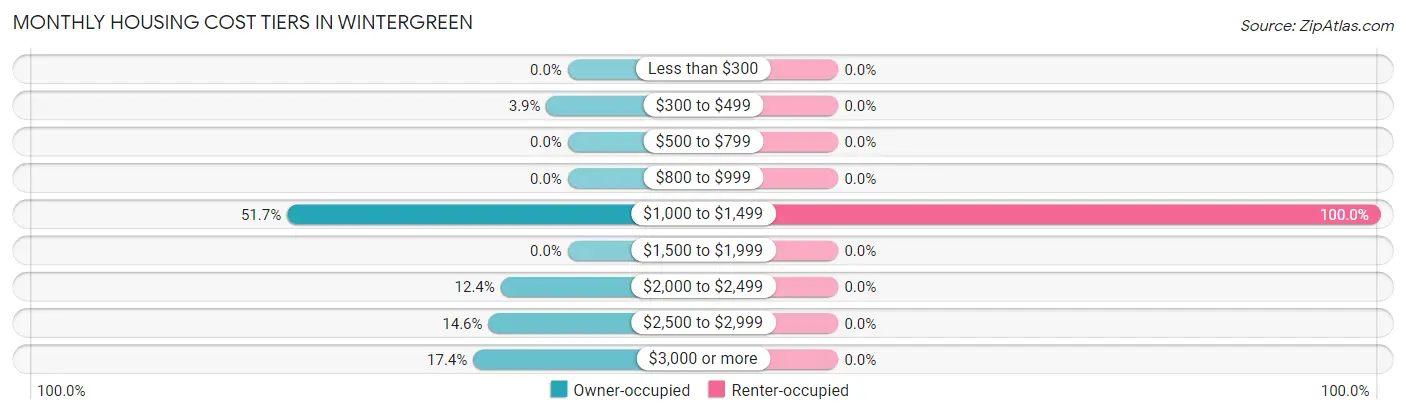
| Monthly Cost | Owner-occupied | Renter-occupied |
| Less than $300 | 0 (0.0%) | 0 (0.0%) |
| $300 to $499 | 7 (3.9%) | 0 (0.0%) |
| $500 to $799 | 0 (0.0%) | 0 (0.0%) |
| $800 to $999 | 0 (0.0%) | 0 (0.0%) |
| $1,000 to $1,499 | 92 (51.7%) | 65 (100.0%) |
| $1,500 to $1,999 | 0 (0.0%) | 0 (0.0%) |
| $2,000 to $2,499 | 22 (12.4%) | 0 (0.0%) |
| $2,500 to $2,999 | 26 (14.6%) | 0 (0.0%) |
| $3,000 or more | 31 (17.4%) | 0 (0.0%) |
| Total | 178 (100.0%) | 65 (100.0%) |
Physical Housing Characteristics in Wintergreen
Housing Structures in Wintergreen
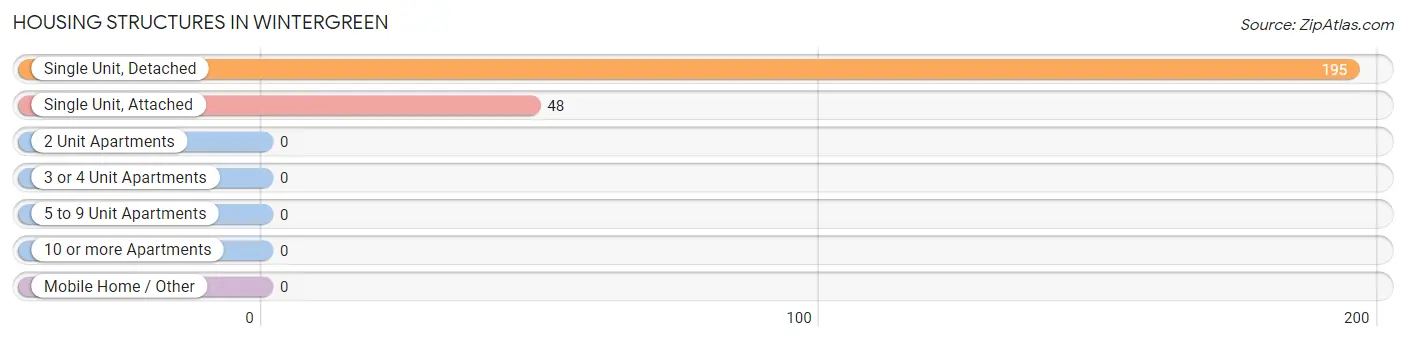
| Structure Type | # Housing Units | % Housing Units |
| Single Unit, Detached | 195 | 80.2% |
| Single Unit, Attached | 48 | 19.8% |
| 2 Unit Apartments | 0 | 0.0% |
| 3 or 4 Unit Apartments | 0 | 0.0% |
| 5 to 9 Unit Apartments | 0 | 0.0% |
| 10 or more Apartments | 0 | 0.0% |
| Mobile Home / Other | 0 | 0.0% |
| Total | 243 | 100.0% |
Housing Structures by Occupancy in Wintergreen
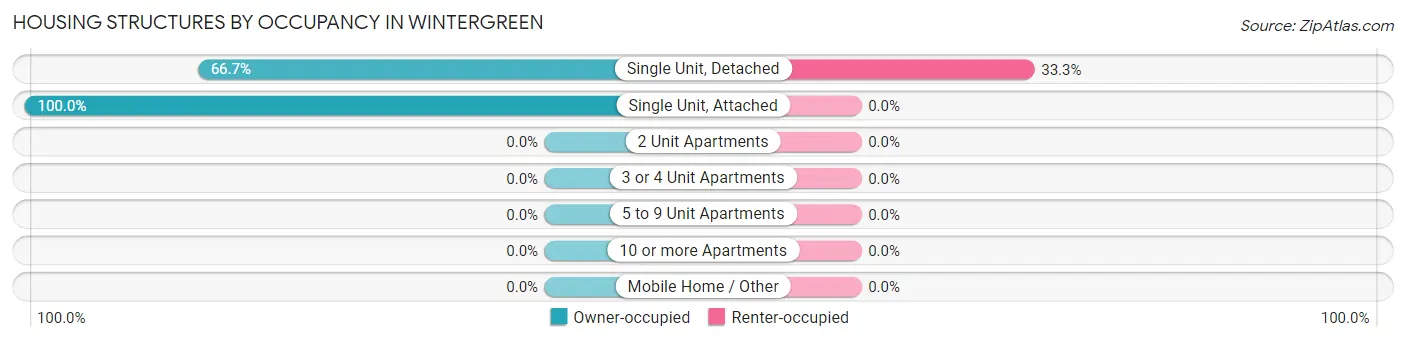
| Structure Type | Owner-occupied | Renter-occupied |
| Single Unit, Detached | 130 (66.7%) | 65 (33.3%) |
| Single Unit, Attached | 48 (100.0%) | 0 (0.0%) |
| 2 Unit Apartments | 0 (0.0%) | 0 (0.0%) |
| 3 or 4 Unit Apartments | 0 (0.0%) | 0 (0.0%) |
| 5 to 9 Unit Apartments | 0 (0.0%) | 0 (0.0%) |
| 10 or more Apartments | 0 (0.0%) | 0 (0.0%) |
| Mobile Home / Other | 0 (0.0%) | 0 (0.0%) |
| Total | 178 (73.3%) | 65 (26.8%) |
Housing Structures by Number of Rooms in Wintergreen
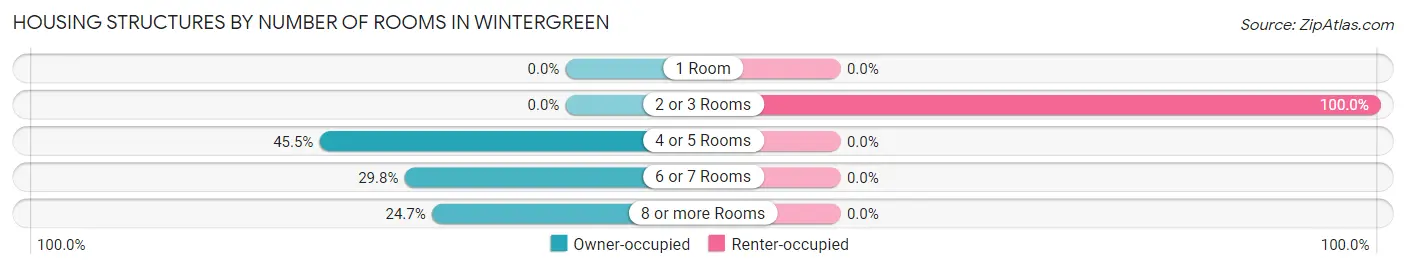
| Number of Rooms | Owner-occupied | Renter-occupied |
| 1 Room | 0 (0.0%) | 0 (0.0%) |
| 2 or 3 Rooms | 0 (0.0%) | 65 (100.0%) |
| 4 or 5 Rooms | 81 (45.5%) | 0 (0.0%) |
| 6 or 7 Rooms | 53 (29.8%) | 0 (0.0%) |
| 8 or more Rooms | 44 (24.7%) | 0 (0.0%) |
| Total | 178 (100.0%) | 65 (100.0%) |
Housing Structure by Heating Type in Wintergreen
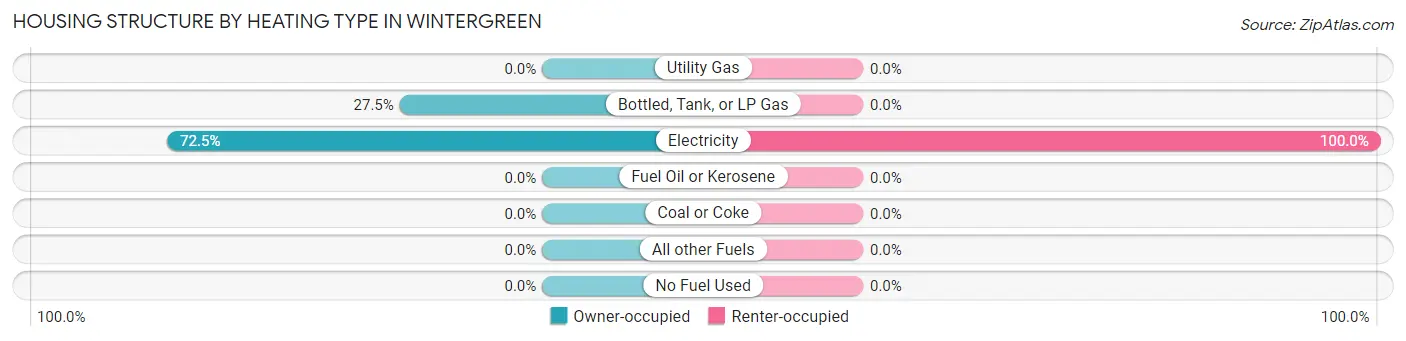
| Heating Type | Owner-occupied | Renter-occupied |
| Utility Gas | 0 (0.0%) | 0 (0.0%) |
| Bottled, Tank, or LP Gas | 49 (27.5%) | 0 (0.0%) |
| Electricity | 129 (72.5%) | 65 (100.0%) |
| Fuel Oil or Kerosene | 0 (0.0%) | 0 (0.0%) |
| Coal or Coke | 0 (0.0%) | 0 (0.0%) |
| All other Fuels | 0 (0.0%) | 0 (0.0%) |
| No Fuel Used | 0 (0.0%) | 0 (0.0%) |
| Total | 178 (100.0%) | 65 (100.0%) |
Household Vehicle Usage in Wintergreen
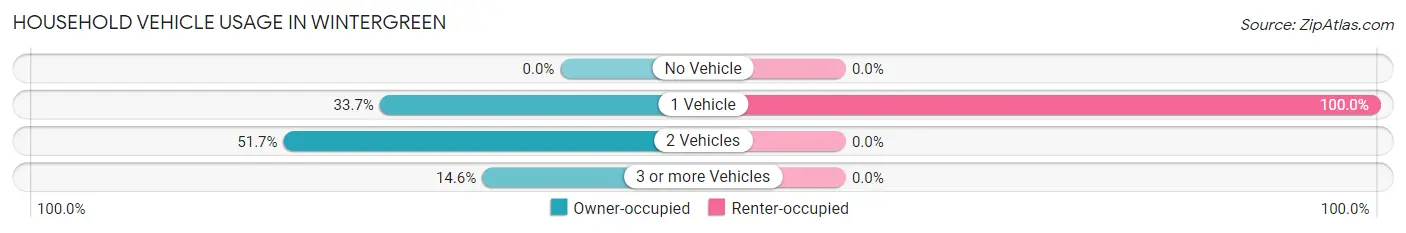
| Vehicles per Household | Owner-occupied | Renter-occupied |
| No Vehicle | 0 (0.0%) | 0 (0.0%) |
| 1 Vehicle | 60 (33.7%) | 65 (100.0%) |
| 2 Vehicles | 92 (51.7%) | 0 (0.0%) |
| 3 or more Vehicles | 26 (14.6%) | 0 (0.0%) |
| Total | 178 (100.0%) | 65 (100.0%) |
Real Estate & Mortgages in Wintergreen
Real Estate and Mortgage Overview in Wintergreen
| Characteristic | Without Mortgage | With Mortgage |
| Housing Units | 51 | 127 |
| Median Property Value | $1,004,800 | $0 |
| Median Household Income | - | - |
| Monthly Housing Costs | $1,042 | $31 |
| Real Estate Taxes | $5,048 | $0 |
Property Value by Mortgage Status in Wintergreen
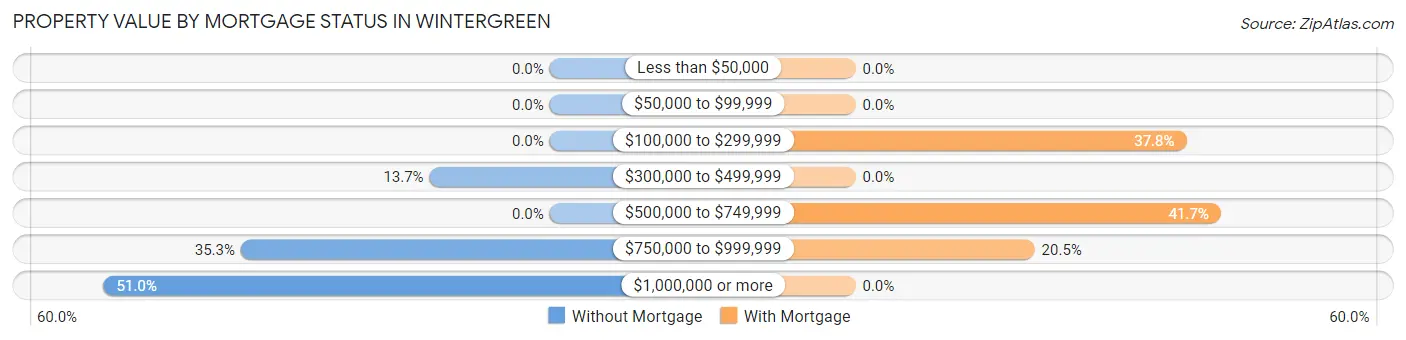
| Property Value | Without Mortgage | With Mortgage |
| Less than $50,000 | 0 (0.0%) | 0 (0.0%) |
| $50,000 to $99,999 | 0 (0.0%) | 0 (0.0%) |
| $100,000 to $299,999 | 0 (0.0%) | 48 (37.8%) |
| $300,000 to $499,999 | 7 (13.7%) | 0 (0.0%) |
| $500,000 to $749,999 | 0 (0.0%) | 53 (41.7%) |
| $750,000 to $999,999 | 18 (35.3%) | 26 (20.5%) |
| $1,000,000 or more | 26 (51.0%) | 0 (0.0%) |
| Total | 51 (100.0%) | 127 (100.0%) |
Household Income by Mortgage Status in Wintergreen
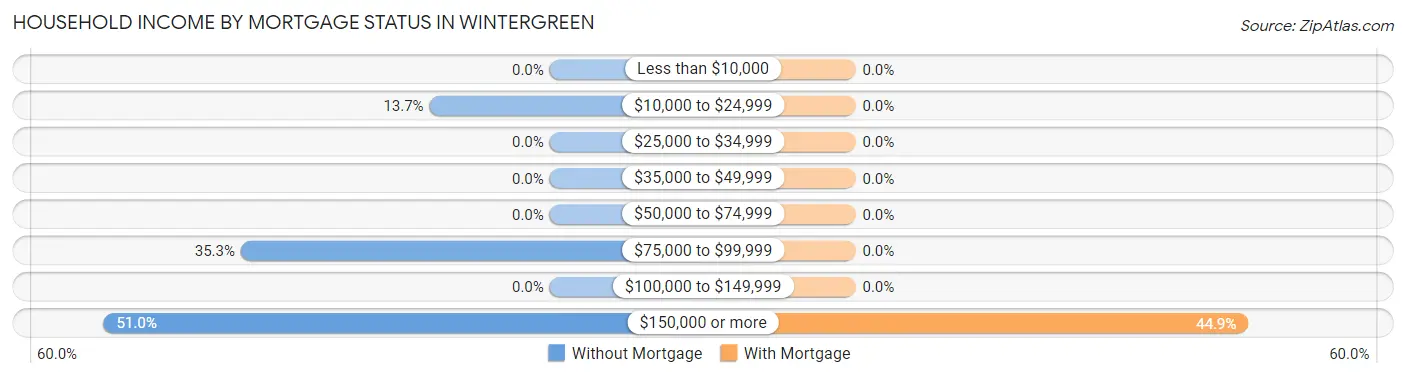
| Household Income | Without Mortgage | With Mortgage |
| Less than $10,000 | 0 (0.0%) | 0 (0.0%) |
| $10,000 to $24,999 | 7 (13.7%) | 0 (0.0%) |
| $25,000 to $34,999 | 0 (0.0%) | 0 (0.0%) |
| $35,000 to $49,999 | 0 (0.0%) | 0 (0.0%) |
| $50,000 to $74,999 | 0 (0.0%) | 0 (0.0%) |
| $75,000 to $99,999 | 18 (35.3%) | 0 (0.0%) |
| $100,000 to $149,999 | 0 (0.0%) | 0 (0.0%) |
| $150,000 or more | 26 (51.0%) | 57 (44.9%) |
| Total | 51 (100.0%) | 127 (100.0%) |
Property Value to Household Income Ratio in Wintergreen
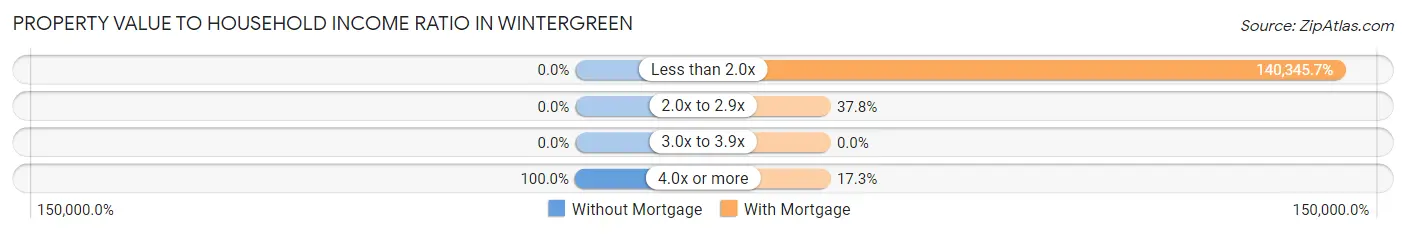
| Value-to-Income Ratio | Without Mortgage | With Mortgage |
| Less than 2.0x | 0 (0.0%) | 178,239 (140,345.7%) |
| 2.0x to 2.9x | 0 (0.0%) | 48 (37.8%) |
| 3.0x to 3.9x | 0 (0.0%) | 0 (0.0%) |
| 4.0x or more | 51 (100.0%) | 22 (17.3%) |
| Total | 51 (100.0%) | 127 (100.0%) |
Real Estate Taxes by Mortgage Status in Wintergreen
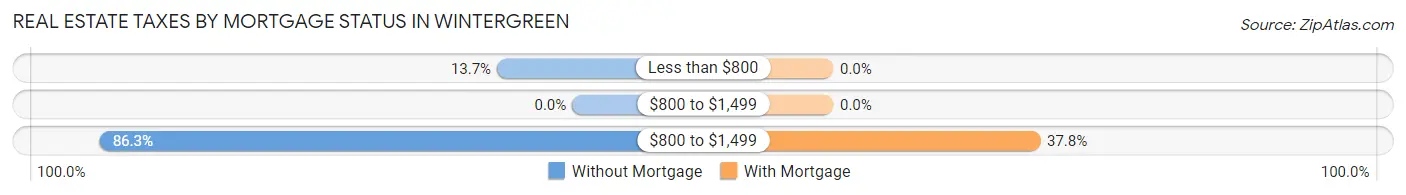
| Property Taxes | Without Mortgage | With Mortgage |
| Less than $800 | 7 (13.7%) | 0 (0.0%) |
| $800 to $1,499 | 0 (0.0%) | 0 (0.0%) |
| $800 to $1,499 | 44 (86.3%) | 48 (37.8%) |
| Total | 51 (100.0%) | 127 (100.0%) |
Health & Disability in Wintergreen
Health Insurance Coverage by Age in Wintergreen
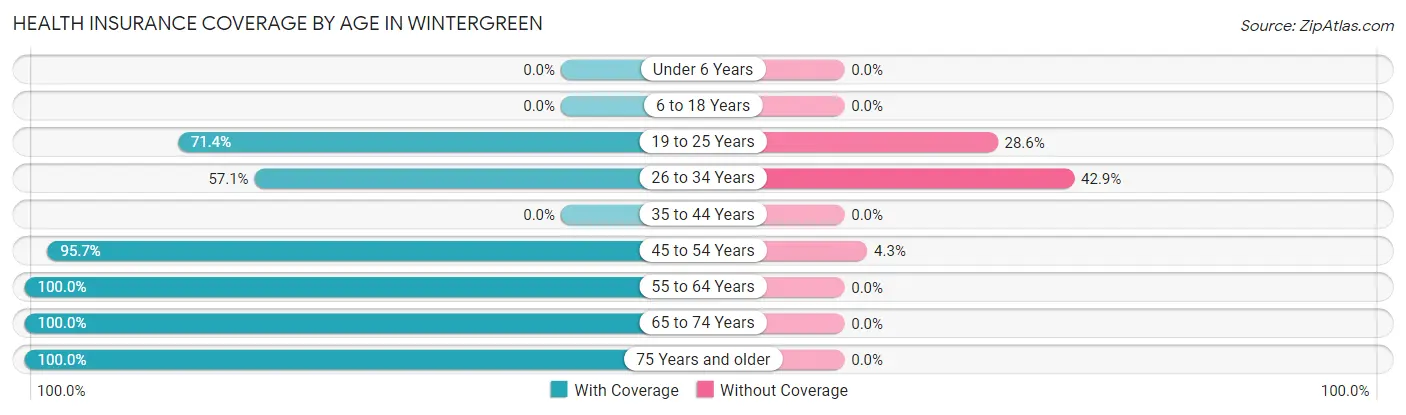
| Age Bracket | With Coverage | Without Coverage |
| Under 6 Years | 0 (0.0%) | 0 (0.0%) |
| 6 to 18 Years | 0 (0.0%) | 0 (0.0%) |
| 19 to 25 Years | 10 (71.4%) | 4 (28.6%) |
| 26 to 34 Years | 4 (57.1%) | 3 (42.9%) |
| 35 to 44 Years | 0 (0.0%) | 0 (0.0%) |
| 45 to 54 Years | 90 (95.7%) | 4 (4.3%) |
| 55 to 64 Years | 30 (100.0%) | 0 (0.0%) |
| 65 to 74 Years | 206 (100.0%) | 0 (0.0%) |
| 75 Years and older | 62 (100.0%) | 0 (0.0%) |
| Total | 402 (97.3%) | 11 (2.7%) |
Health Insurance Coverage by Citizenship Status in Wintergreen
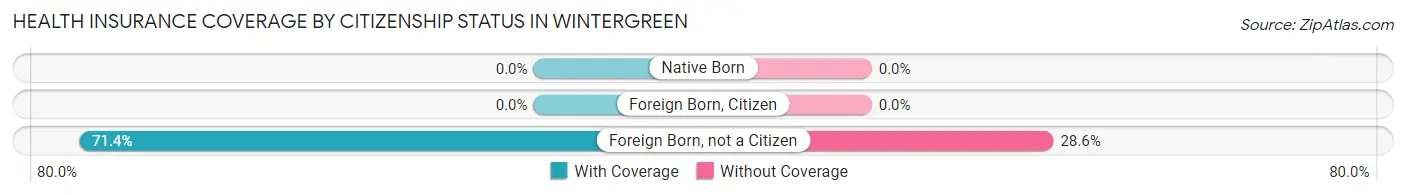
| Citizenship Status | With Coverage | Without Coverage |
| Native Born | 0 (0.0%) | 0 (0.0%) |
| Foreign Born, Citizen | 0 (0.0%) | 0 (0.0%) |
| Foreign Born, not a Citizen | 10 (71.4%) | 4 (28.6%) |
Health Insurance Coverage by Household Income in Wintergreen
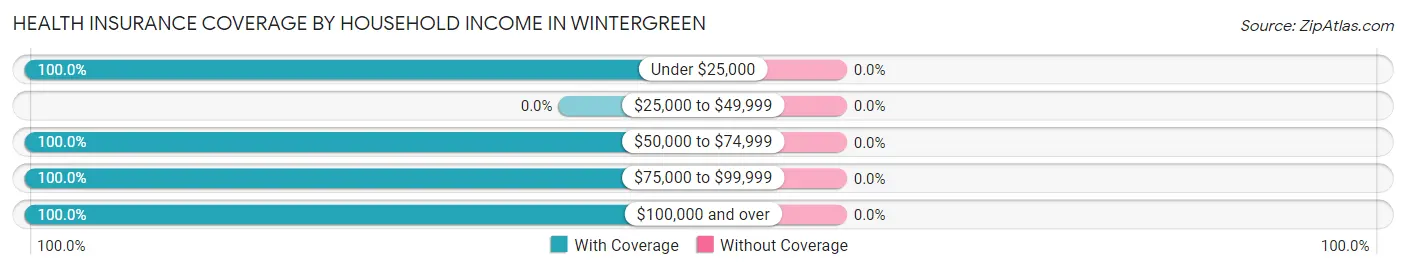
| Household Income | With Coverage | Without Coverage |
| Under $25,000 | 7 (100.0%) | 0 (0.0%) |
| $25,000 to $49,999 | 0 (0.0%) | 0 (0.0%) |
| $50,000 to $74,999 | 65 (100.0%) | 0 (0.0%) |
| $75,000 to $99,999 | 43 (100.0%) | 0 (0.0%) |
| $100,000 and over | 272 (100.0%) | 0 (0.0%) |
Public vs Private Health Insurance Coverage by Age in Wintergreen
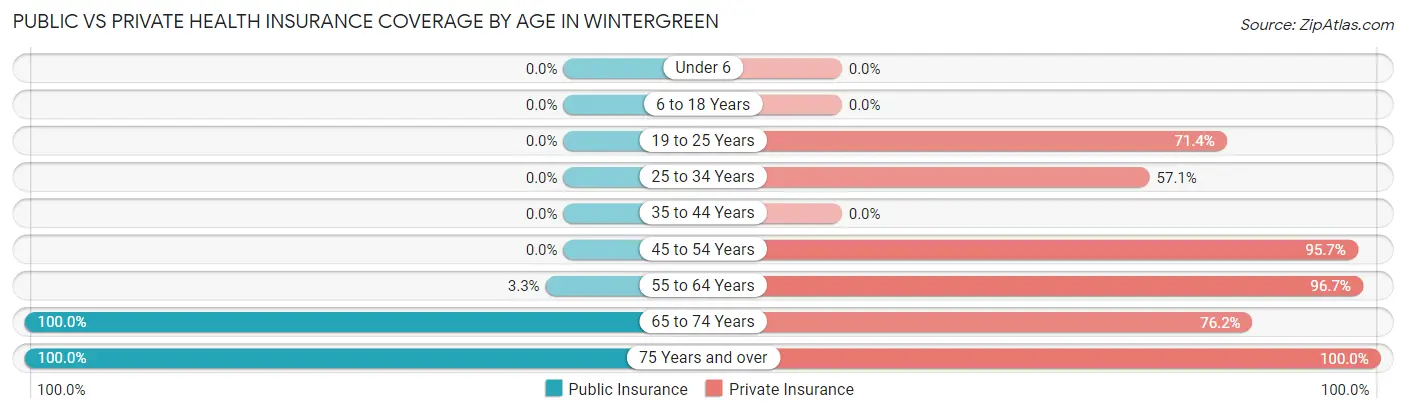
| Age Bracket | Public Insurance | Private Insurance |
| Under 6 | 0 (0.0%) | 0 (0.0%) |
| 6 to 18 Years | 0 (0.0%) | 0 (0.0%) |
| 19 to 25 Years | 0 (0.0%) | 10 (71.4%) |
| 25 to 34 Years | 0 (0.0%) | 4 (57.1%) |
| 35 to 44 Years | 0 (0.0%) | 0 (0.0%) |
| 45 to 54 Years | 0 (0.0%) | 90 (95.7%) |
| 55 to 64 Years | 1 (3.3%) | 29 (96.7%) |
| 65 to 74 Years | 206 (100.0%) | 157 (76.2%) |
| 75 Years and over | 62 (100.0%) | 62 (100.0%) |
| Total | 269 (65.1%) | 352 (85.2%) |
Disability Status by Sex by Age in Wintergreen
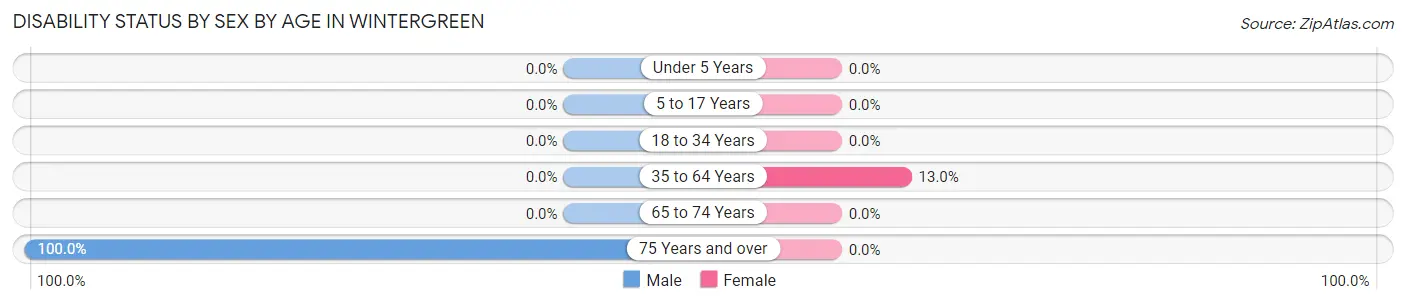
| Age Bracket | Male | Female |
| Under 5 Years | 0 (0.0%) | 0 (0.0%) |
| 5 to 17 Years | 0 (0.0%) | 0 (0.0%) |
| 18 to 34 Years | 0 (0.0%) | 0 (0.0%) |
| 35 to 64 Years | 0 (0.0%) | 7 (13.0%) |
| 65 to 74 Years | 0 (0.0%) | 0 (0.0%) |
| 75 Years and over | 31 (100.0%) | 0 (0.0%) |
Disability Class by Sex by Age in Wintergreen
Disability Class: Hearing Difficulty
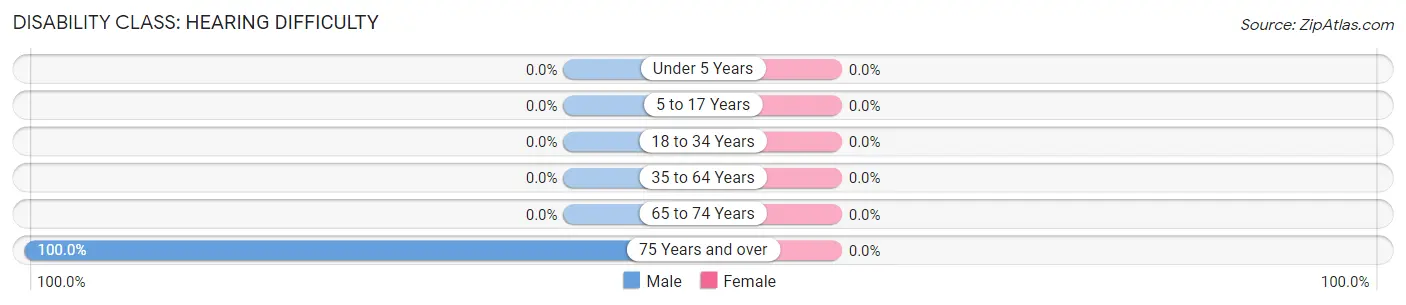
| Age Bracket | Male | Female |
| Under 5 Years | 0 (0.0%) | 0 (0.0%) |
| 5 to 17 Years | 0 (0.0%) | 0 (0.0%) |
| 18 to 34 Years | 0 (0.0%) | 0 (0.0%) |
| 35 to 64 Years | 0 (0.0%) | 0 (0.0%) |
| 65 to 74 Years | 0 (0.0%) | 0 (0.0%) |
| 75 Years and over | 31 (100.0%) | 0 (0.0%) |
Disability Class: Vision Difficulty
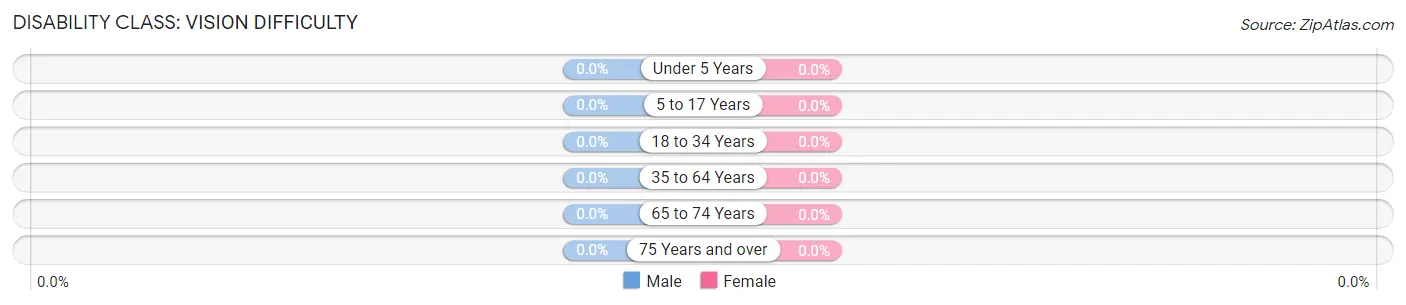
| Age Bracket | Male | Female |
| Under 5 Years | 0 (0.0%) | 0 (0.0%) |
| 5 to 17 Years | 0 (0.0%) | 0 (0.0%) |
| 18 to 34 Years | 0 (0.0%) | 0 (0.0%) |
| 35 to 64 Years | 0 (0.0%) | 0 (0.0%) |
| 65 to 74 Years | 0 (0.0%) | 0 (0.0%) |
| 75 Years and over | 0 (0.0%) | 0 (0.0%) |
Disability Class: Cognitive Difficulty
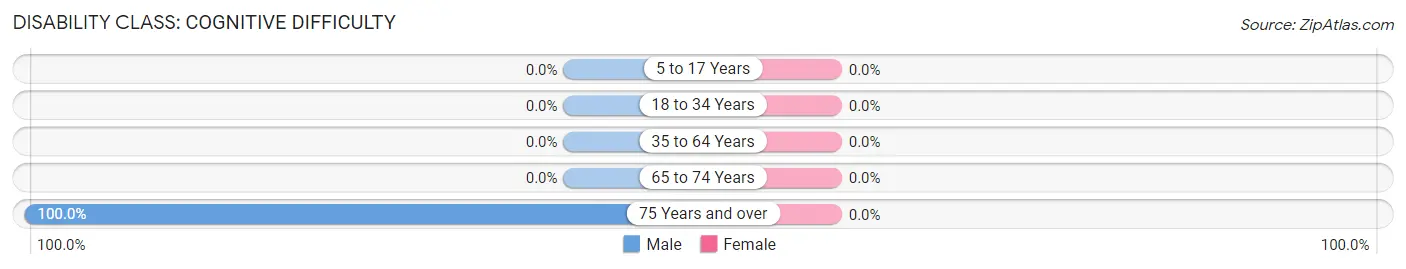
| Age Bracket | Male | Female |
| 5 to 17 Years | 0 (0.0%) | 0 (0.0%) |
| 18 to 34 Years | 0 (0.0%) | 0 (0.0%) |
| 35 to 64 Years | 0 (0.0%) | 0 (0.0%) |
| 65 to 74 Years | 0 (0.0%) | 0 (0.0%) |
| 75 Years and over | 31 (100.0%) | 0 (0.0%) |
Disability Class: Ambulatory Difficulty
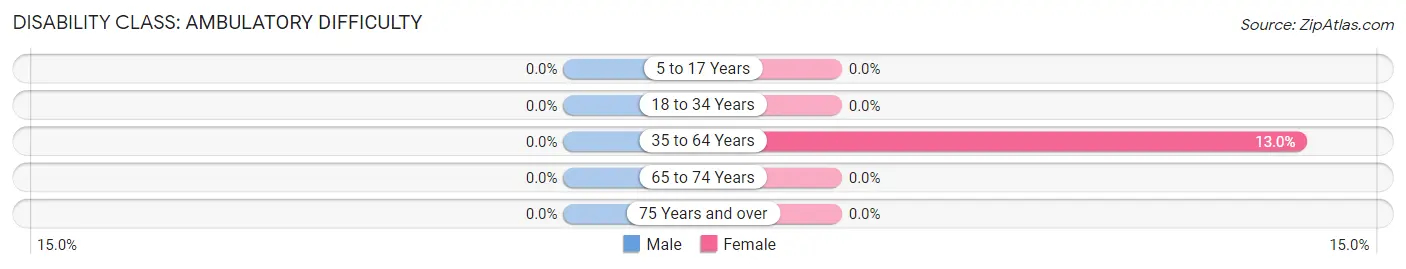
| Age Bracket | Male | Female |
| 5 to 17 Years | 0 (0.0%) | 0 (0.0%) |
| 18 to 34 Years | 0 (0.0%) | 0 (0.0%) |
| 35 to 64 Years | 0 (0.0%) | 7 (13.0%) |
| 65 to 74 Years | 0 (0.0%) | 0 (0.0%) |
| 75 Years and over | 0 (0.0%) | 0 (0.0%) |
Disability Class: Self-Care Difficulty
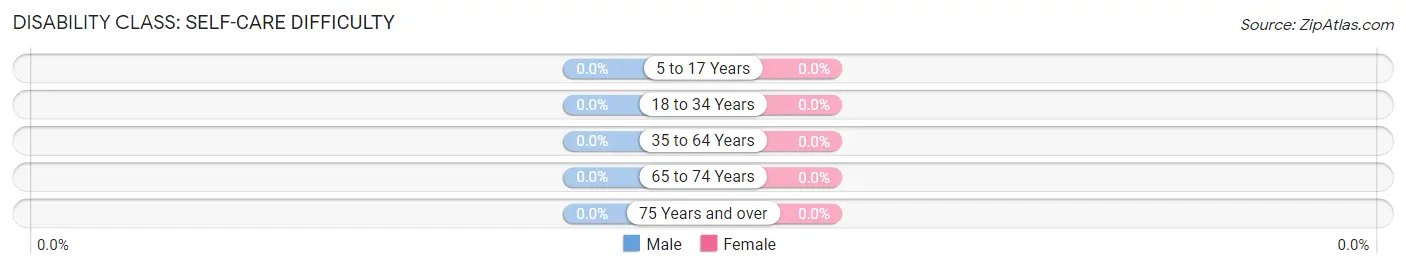
| Age Bracket | Male | Female |
| 5 to 17 Years | 0 (0.0%) | 0 (0.0%) |
| 18 to 34 Years | 0 (0.0%) | 0 (0.0%) |
| 35 to 64 Years | 0 (0.0%) | 0 (0.0%) |
| 65 to 74 Years | 0 (0.0%) | 0 (0.0%) |
| 75 Years and over | 0 (0.0%) | 0 (0.0%) |
Technology Access in Wintergreen
Computing Device Access in Wintergreen
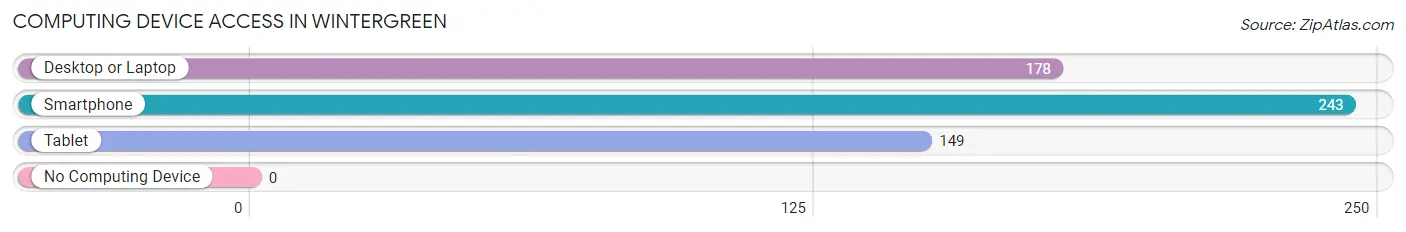
| Device Type | # Households | % Households |
| Desktop or Laptop | 178 | 73.3% |
| Smartphone | 243 | 100.0% |
| Tablet | 149 | 61.3% |
| No Computing Device | 0 | 0.0% |
| Total | 243 | 100.0% |
Internet Access in Wintergreen
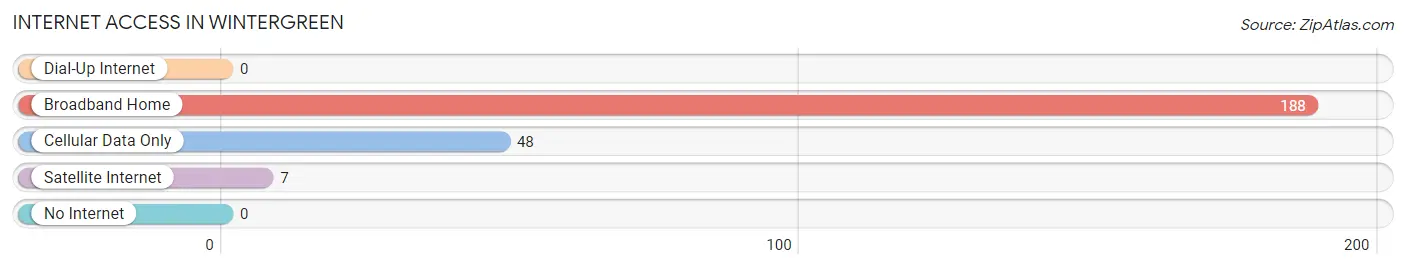
| Internet Type | # Households | % Households |
| Dial-Up Internet | 0 | 0.0% |
| Broadband Home | 188 | 77.4% |
| Cellular Data Only | 48 | 19.8% |
| Satellite Internet | 7 | 2.9% |
| No Internet | 0 | 0.0% |
| Total | 243 | 100.0% |
Wintergreen Summary
History
Wintergreen, Virginia is a small mountain resort community located in the Blue Ridge Mountains of Nelson County. It is situated at an elevation of 3,500 feet and is surrounded by the George Washington and Jefferson National Forests. The area was first settled in the late 1700s by the Monacan Indians, who were later joined by European settlers. The first permanent settlement was established in 1822 by a group of German immigrants. The town was originally known as Hamburg, but was later renamed Wintergreen in the early 1900s.
The area was primarily used for farming and logging until the 1950s, when the Wintergreen Resort was established. The resort was developed by a group of investors who wanted to create a ski resort in the area. The resort opened in 1959 and quickly became a popular destination for skiing, golfing, and other outdoor activities.
The town of Wintergreen was incorporated in 1975 and has since grown to a population of over 500 people. The town is home to a variety of businesses, including restaurants, shops, and lodging. The Wintergreen Resort is still a major attraction in the area, and the town is also home to a number of other attractions, including the Wintergreen Nature Foundation, the Wintergreen Winery, and the Wintergreen Music Festival.
Geography
Wintergreen is located in the Blue Ridge Mountains of Nelson County, Virginia. It is situated at an elevation of 3,500 feet and is surrounded by the George Washington and Jefferson National Forests. The town is located approximately 25 miles from Charlottesville and is accessible via US Route 29.
The area is characterized by rolling hills and valleys, with the highest point in the area being the summit of Wintergreen Mountain at 4,062 feet. The area is also home to a variety of wildlife, including black bears, deer, and wild turkeys.
Economy
The economy of Wintergreen is largely driven by tourism. The Wintergreen Resort is the main attraction in the area, and it is a popular destination for skiing, golfing, and other outdoor activities. The resort also offers lodging, restaurants, and shops.
In addition to the resort, the town is home to a number of other businesses, including restaurants, shops, and lodging. The town is also home to the Wintergreen Winery, which produces a variety of wines.
Demographics
As of the 2010 census, the population of Wintergreen was 511. The racial makeup of the town was 94.2% White, 2.2% African American, 0.4% Native American, 0.8% Asian, 0.2% Pacific Islander, and 1.2% from other races. The median household income was $50,000, and the median age was 44.
Conclusion
Wintergreen, Virginia is a small mountain resort community located in the Blue Ridge Mountains of Nelson County. It is situated at an elevation of 3,500 feet and is surrounded by the George Washington and Jefferson National Forests. The area was first settled in the late 1700s by the Monacan Indians, and the town was incorporated in 1975. The economy of Wintergreen is largely driven by tourism, with the Wintergreen Resort being the main attraction in the area. As of the 2010 census, the population of Wintergreen was 511, with a median household income of $50,000 and a median age of 44.
Common Questions
What is Per Capita Income in Wintergreen?
Per Capita income in Wintergreen is $90,668.
What is the Median Family Income in Wintergreen?
Median Family Income in Wintergreen is $144,952.
What is the Median Household income in Wintergreen?
Median Household Income in Wintergreen is $142,548.
What is Inequality or Gini Index in Wintergreen?
Inequality or Gini Index in Wintergreen is 0.36.
What is the Total Population of Wintergreen?
Total Population of Wintergreen is 413.
What is the Total Male Population of Wintergreen?
Total Male Population of Wintergreen is 234.
What is the Total Female Population of Wintergreen?
Total Female Population of Wintergreen is 179.
What is the Ratio of Males per 100 Females in Wintergreen?
There are 130.73 Males per 100 Females in Wintergreen.
What is the Ratio of Females per 100 Males in Wintergreen?
There are 76.50 Females per 100 Males in Wintergreen.
What is the Median Population Age in Wintergreen?
Median Population Age in Wintergreen is 67.5 Years.
What is the Average Family Size in Wintergreen
Average Family Size in Wintergreen is 2.0 People.
What is the Average Household Size in Wintergreen
Average Household Size in Wintergreen is 1.6 People.
How Large is the Labor Force in Wintergreen?
There are 258 People in the Labor Forcein in Wintergreen.
What is the Percentage of People in the Labor Force in Wintergreen?
62.5% of People are in the Labor Force in Wintergreen.