Belle Haven, VA Map & Demographics
Belle Haven Map
Belle Haven Overview
$99,520
PER CAPITA INCOME
$190,469
AVG FAMILY INCOME
$129,495
AVG HOUSEHOLD INCOME
26.0%
WAGE / INCOME GAP [ % ]
74.0¢/ $1
WAGE / INCOME GAP [ $ ]
0.53
INEQUALITY / GINI INDEX
6,359
TOTAL POPULATION
3,130
MALE POPULATION
3,229
FEMALE POPULATION
96.93
MALES / 100 FEMALES
103.16
FEMALES / 100 MALES
41.5
MEDIAN AGE
3.1
AVG FAMILY SIZE
2.3
AVG HOUSEHOLD SIZE
3,530
LABOR FORCE [ PEOPLE ]
72.4%
PERCENT IN LABOR FORCE
3.3%
UNEMPLOYMENT RATE
Belle Haven Zip Codes
Belle Haven Area Codes
Income in Belle Haven
Income Overview in Belle Haven
Per Capita Income in Belle Haven is $99,520, while median incomes of families and households are $190,469 and $129,495 respectively.
| Characteristic | Number | Measure |
| Per Capita Income | 6,359 | $99,520 |
| Median Family Income | 1,597 | $190,469 |
| Mean Family Income | 1,597 | $317,535 |
| Median Household Income | 2,747 | $129,495 |
| Mean Household Income | 2,747 | $225,821 |
| Income Deficit | 1,597 | $0 |
| Wage / Income Gap (%) | 6,359 | 26.03% |
| Wage / Income Gap ($) | 6,359 | 73.97¢ per $1 |
| Gini / Inequality Index | 6,359 | 0.53 |
Earnings by Sex in Belle Haven
Average Earnings in Belle Haven are $94,328, $108,835 for men and $80,500 for women, a difference of 26.0%.
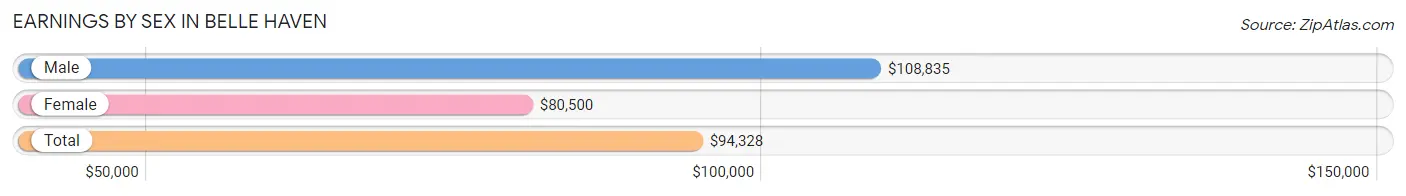
| Sex | Number | Average Earnings |
| Male | 1,909 (52.5%) | $108,835 |
| Female | 1,730 (47.5%) | $80,500 |
| Total | 3,639 (100.0%) | $94,328 |
Earnings by Sex by Income Bracket in Belle Haven
The most common earnings brackets in Belle Haven are $100,000+ for men (1,096 | 57.4%) and $100,000+ for women (635 | 36.7%).
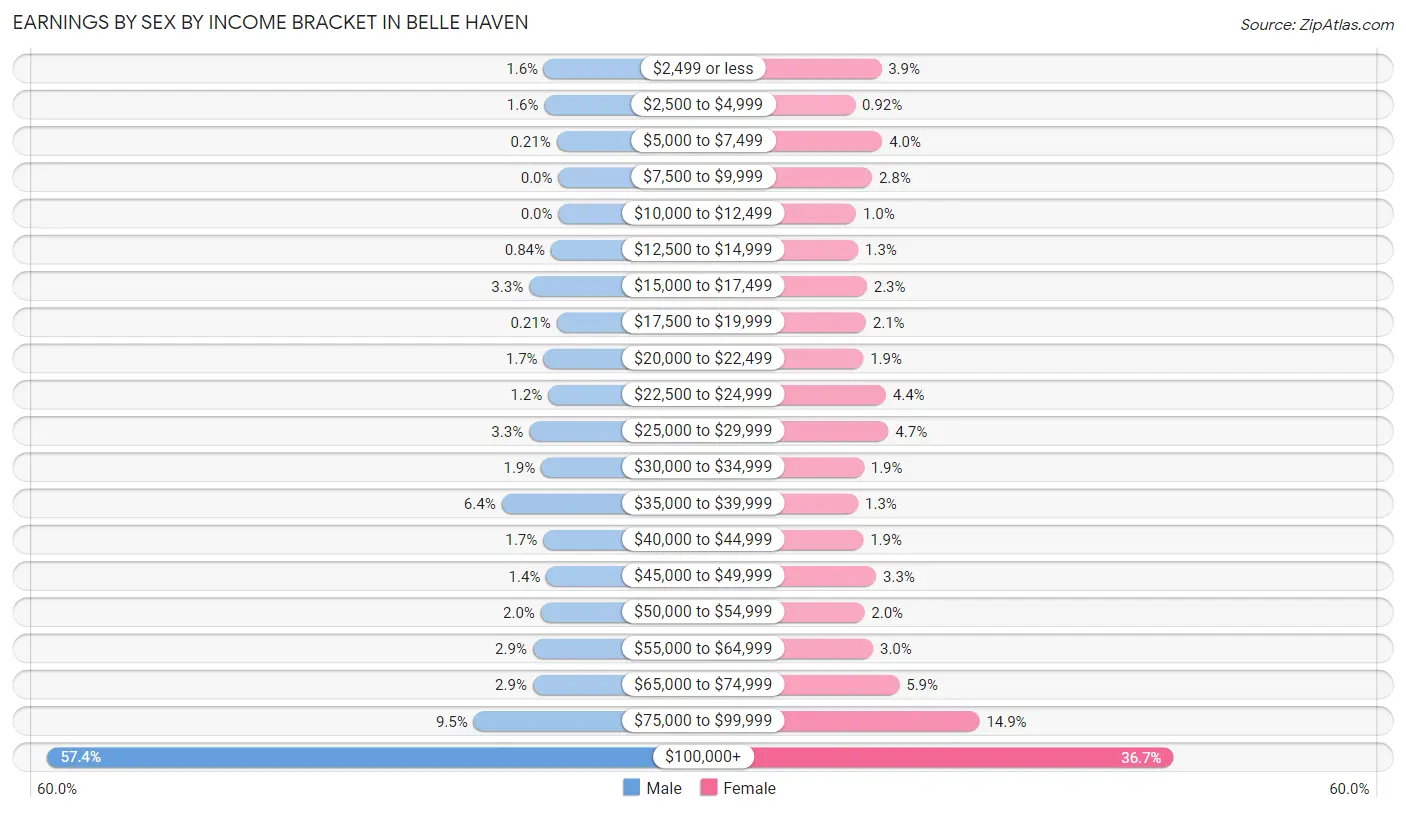
| Income | Male | Female |
| $2,499 or less | 31 (1.6%) | 67 (3.9%) |
| $2,500 to $4,999 | 30 (1.6%) | 16 (0.9%) |
| $5,000 to $7,499 | 4 (0.2%) | 69 (4.0%) |
| $7,500 to $9,999 | 0 (0.0%) | 49 (2.8%) |
| $10,000 to $12,499 | 0 (0.0%) | 18 (1.0%) |
| $12,500 to $14,999 | 16 (0.8%) | 22 (1.3%) |
| $15,000 to $17,499 | 63 (3.3%) | 39 (2.2%) |
| $17,500 to $19,999 | 4 (0.2%) | 37 (2.1%) |
| $20,000 to $22,499 | 32 (1.7%) | 32 (1.8%) |
| $22,500 to $24,999 | 22 (1.1%) | 76 (4.4%) |
| $25,000 to $29,999 | 63 (3.3%) | 81 (4.7%) |
| $30,000 to $34,999 | 37 (1.9%) | 33 (1.9%) |
| $35,000 to $39,999 | 122 (6.4%) | 22 (1.3%) |
| $40,000 to $44,999 | 33 (1.7%) | 32 (1.8%) |
| $45,000 to $49,999 | 26 (1.4%) | 57 (3.3%) |
| $50,000 to $54,999 | 38 (2.0%) | 34 (2.0%) |
| $55,000 to $64,999 | 55 (2.9%) | 51 (2.9%) |
| $65,000 to $74,999 | 55 (2.9%) | 102 (5.9%) |
| $75,000 to $99,999 | 182 (9.5%) | 258 (14.9%) |
| $100,000+ | 1,096 (57.4%) | 635 (36.7%) |
| Total | 1,909 (100.0%) | 1,730 (100.0%) |
Earnings by Sex by Educational Attainment in Belle Haven
Average earnings in Belle Haven are $112,197 for men and $89,401 for women, a difference of 20.3%. Men with an educational attainment of graduate degree enjoy the highest average annual earnings of $178,382, while those with high school diploma education earn the least with $35,161. Women with an educational attainment of graduate degree earn the most with the average annual earnings of $104,615, while those with high school diploma education have the smallest earnings of $19,773.
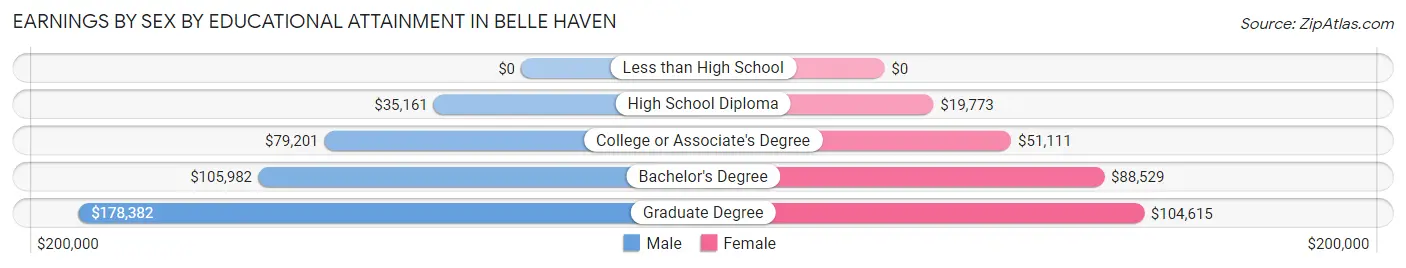
| Educational Attainment | Male Income | Female Income |
| Less than High School | - | - |
| High School Diploma | $35,161 | $19,773 |
| College or Associate's Degree | $79,201 | $51,111 |
| Bachelor's Degree | $105,982 | $88,529 |
| Graduate Degree | $178,382 | $104,615 |
| Total | $112,197 | $89,401 |
Family Income in Belle Haven
Family Income Brackets in Belle Haven
According to the Belle Haven family income data, there are 779 families falling into the $200,000+ income range, which is the most common income bracket and makes up 48.8% of all families.
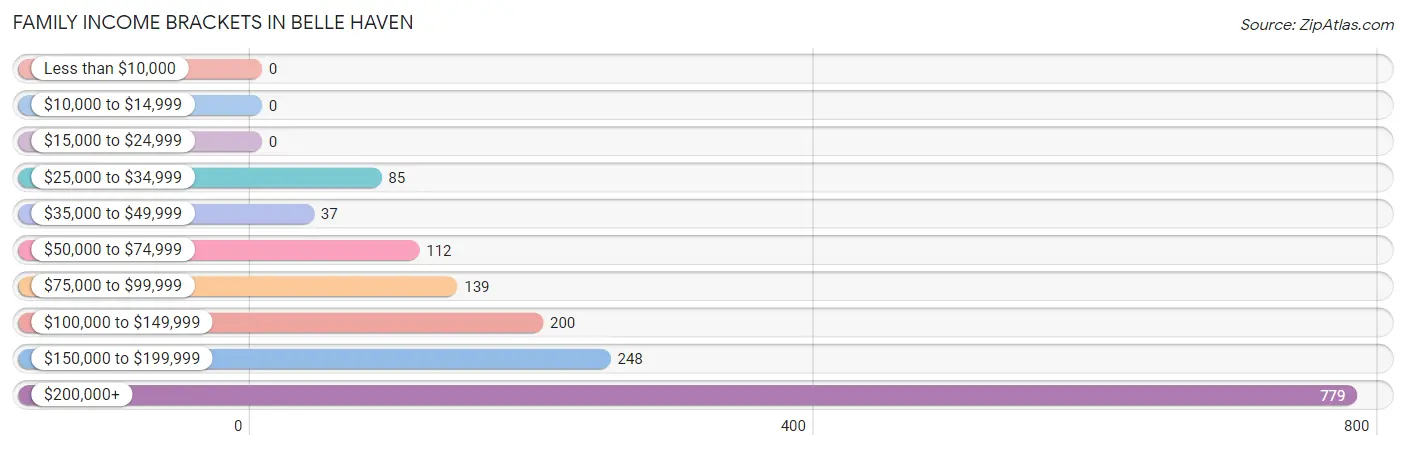
| Income Bracket | # Families | % Families |
| Less than $10,000 | 0 | 0.0% |
| $10,000 to $14,999 | 0 | 0.0% |
| $15,000 to $24,999 | 0 | 0.0% |
| $25,000 to $34,999 | 85 | 5.3% |
| $35,000 to $49,999 | 37 | 2.3% |
| $50,000 to $74,999 | 112 | 7.0% |
| $75,000 to $99,999 | 139 | 8.7% |
| $100,000 to $149,999 | 200 | 12.5% |
| $150,000 to $199,999 | 248 | 15.5% |
| $200,000+ | 779 | 48.8% |
Family Income by Famaliy Size in Belle Haven
3-person families (447 | 28.0%) account for the highest median family income in Belle Haven with $250,001 per family, while 2-person families (792 | 49.6%) have the highest median income of $84,166 per family member.
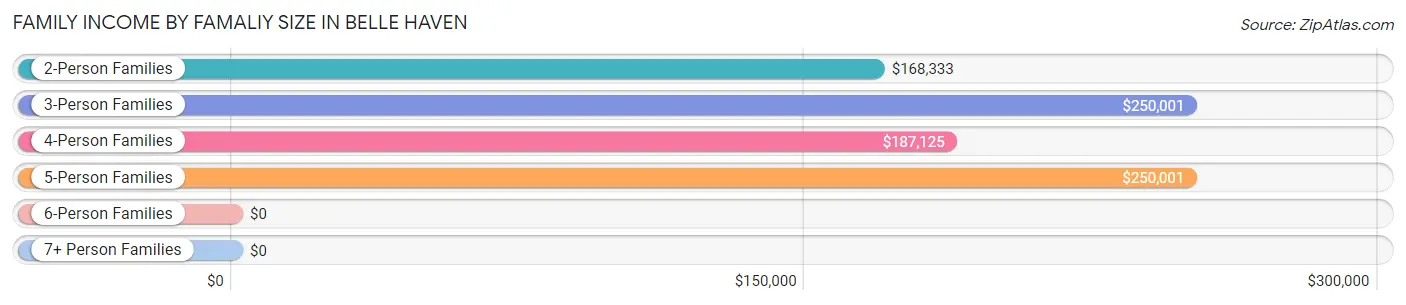
| Income Bracket | # Families | Median Income |
| 2-Person Families | 792 (49.6%) | $168,333 |
| 3-Person Families | 447 (28.0%) | $250,001 |
| 4-Person Families | 235 (14.7%) | $187,125 |
| 5-Person Families | 74 (4.6%) | $250,001 |
| 6-Person Families | 19 (1.2%) | $0 |
| 7+ Person Families | 30 (1.9%) | $0 |
| Total | 1,597 (100.0%) | $190,469 |
Family Income by Number of Earners in Belle Haven
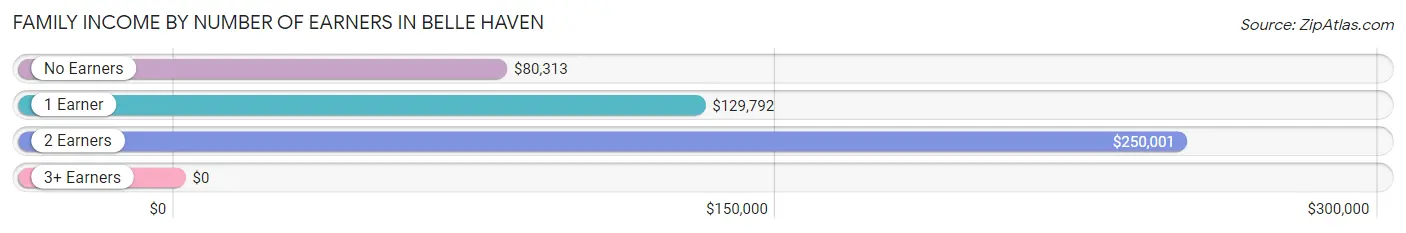
| Number of Earners | # Families | Median Income |
| No Earners | 116 (7.3%) | $80,313 |
| 1 Earner | 478 (29.9%) | $129,792 |
| 2 Earners | 929 (58.2%) | $250,001 |
| 3+ Earners | 74 (4.6%) | $0 |
| Total | 1,597 (100.0%) | $190,469 |
Household Income in Belle Haven
Household Income Brackets in Belle Haven
With 857 households falling in the category, the $200,000+ income range is the most frequent in Belle Haven, accounting for 31.2% of all households.
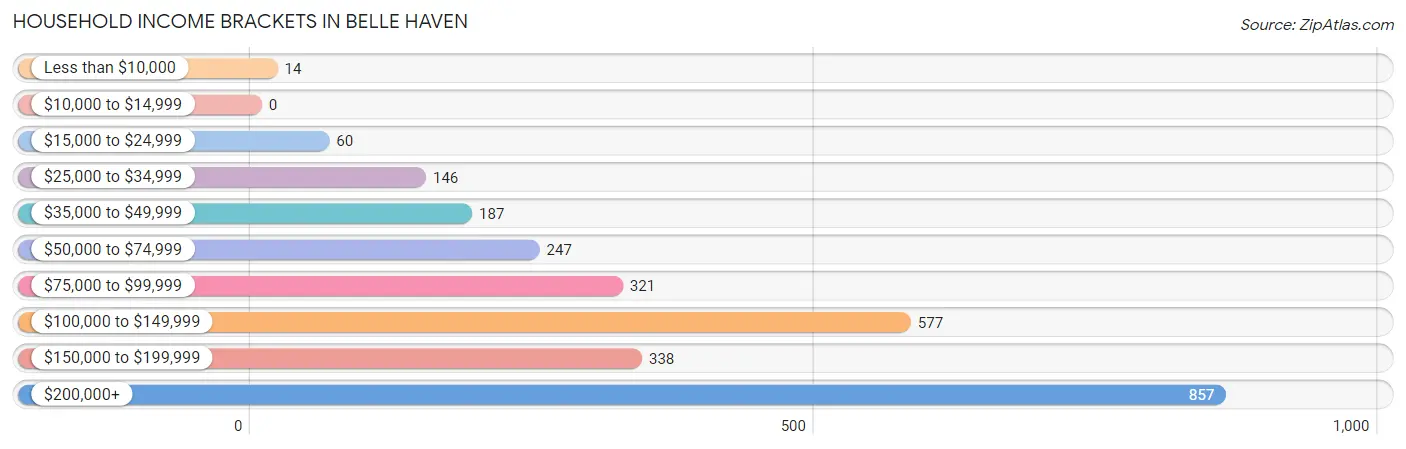
| Income Bracket | # Households | % Households |
| Less than $10,000 | 14 | 0.5% |
| $10,000 to $14,999 | 0 | 0.0% |
| $15,000 to $24,999 | 60 | 2.2% |
| $25,000 to $34,999 | 146 | 5.3% |
| $35,000 to $49,999 | 187 | 6.8% |
| $50,000 to $74,999 | 247 | 9.0% |
| $75,000 to $99,999 | 321 | 11.7% |
| $100,000 to $149,999 | 577 | 21.0% |
| $150,000 to $199,999 | 338 | 12.3% |
| $200,000+ | 857 | 31.2% |
Household Income by Householder Age in Belle Haven
The median household income in Belle Haven is $129,495, with the highest median household income of $158,750 found in the 25 to 44 years age bracket for the primary householder. A total of 856 households (31.2%) fall into this category. Meanwhile, the 15 to 24 years age bracket for the primary householder has the lowest median household income of $0, with 13 households (0.5%) in this group.
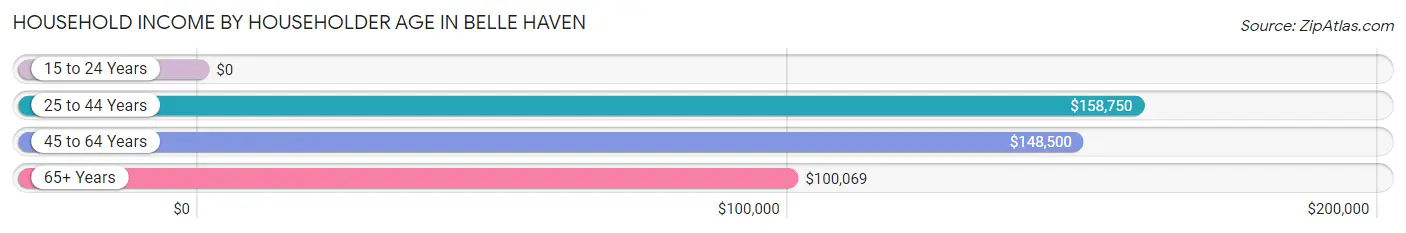
| Income Bracket | # Households | Median Income |
| 15 to 24 Years | 13 (0.5%) | $0 |
| 25 to 44 Years | 856 (31.2%) | $158,750 |
| 45 to 64 Years | 1,156 (42.1%) | $148,500 |
| 65+ Years | 722 (26.3%) | $100,069 |
| Total | 2,747 (100.0%) | $129,495 |
Poverty in Belle Haven
Income Below Poverty by Sex and Age in Belle Haven
With 2.9% poverty level for males and 3.1% for females among the residents of Belle Haven, 15 year old males and 18 to 24 year old females are the most vulnerable to poverty, with 16 males (37.2%) and 42 females (23.9%) in their respective age groups living below the poverty level.
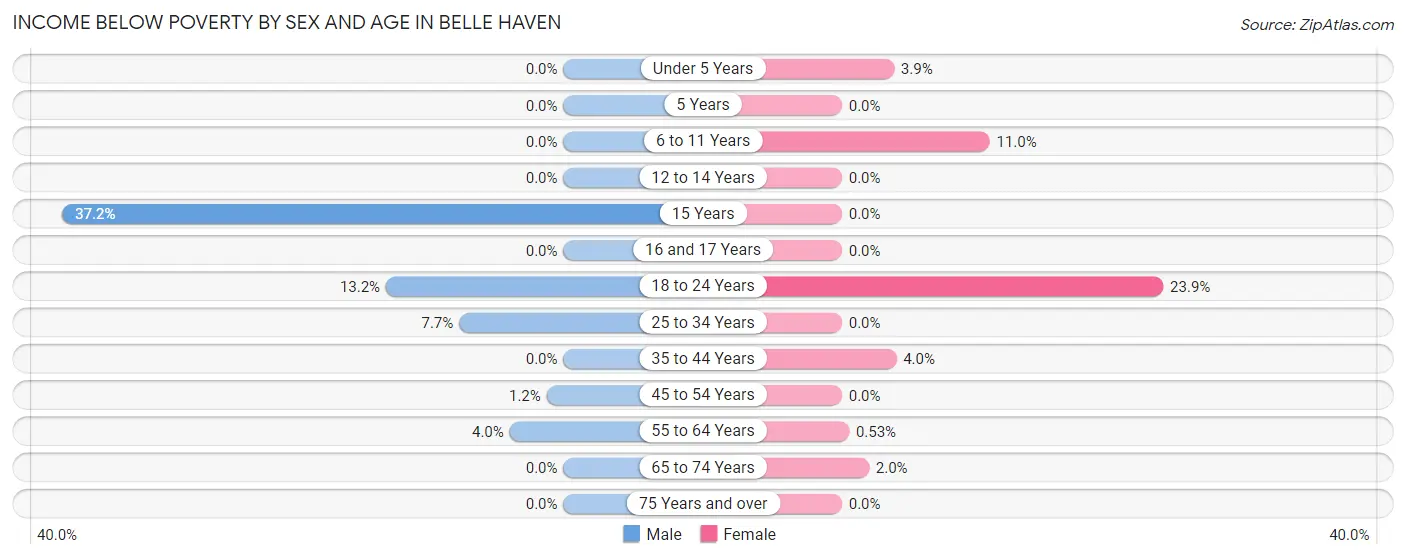
| Age Bracket | Male | Female |
| Under 5 Years | 0 (0.0%) | 17 (3.9%) |
| 5 Years | 0 (0.0%) | 0 (0.0%) |
| 6 to 11 Years | 0 (0.0%) | 17 (11.0%) |
| 12 to 14 Years | 0 (0.0%) | 0 (0.0%) |
| 15 Years | 16 (37.2%) | 0 (0.0%) |
| 16 and 17 Years | 0 (0.0%) | 0 (0.0%) |
| 18 to 24 Years | 22 (13.2%) | 42 (23.9%) |
| 25 to 34 Years | 25 (7.7%) | 0 (0.0%) |
| 35 to 44 Years | 0 (0.0%) | 16 (4.0%) |
| 45 to 54 Years | 5 (1.2%) | 0 (0.0%) |
| 55 to 64 Years | 22 (4.0%) | 3 (0.5%) |
| 65 to 74 Years | 0 (0.0%) | 6 (2.0%) |
| 75 Years and over | 0 (0.0%) | 0 (0.0%) |
| Total | 90 (2.9%) | 101 (3.1%) |
Income Above Poverty by Sex and Age in Belle Haven
According to the poverty statistics in Belle Haven, males aged under 5 years and females aged 5 years are the age groups that are most secure financially, with 100.0% of males and 100.0% of females in these age groups living above the poverty line.
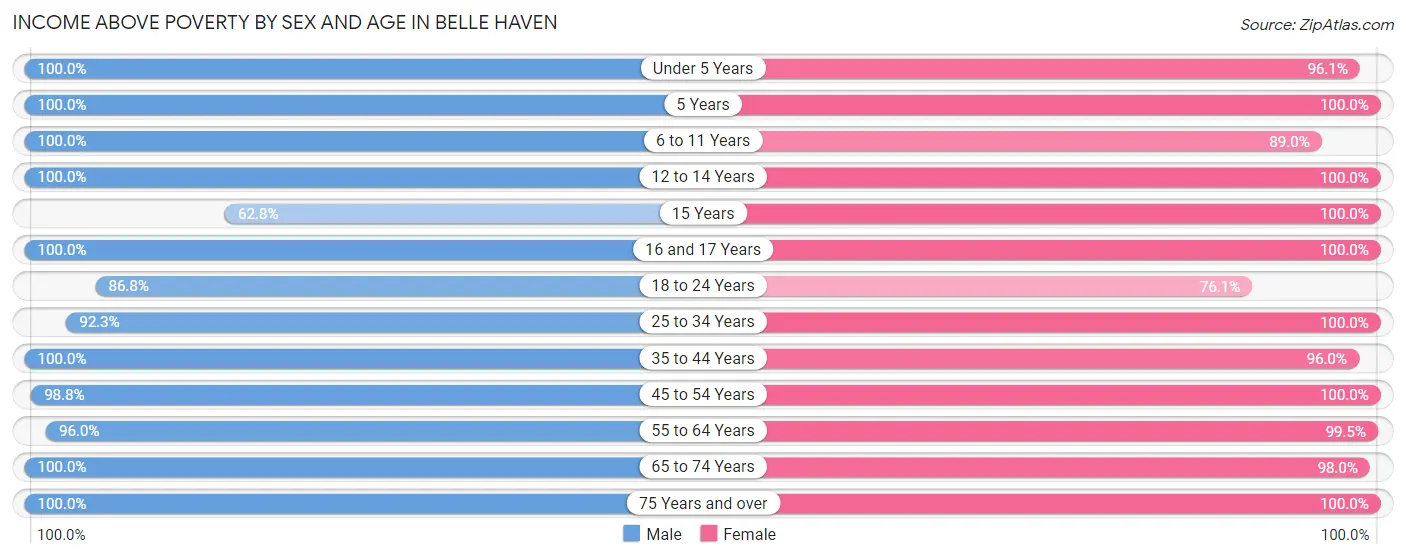
| Age Bracket | Male | Female |
| Under 5 Years | 271 (100.0%) | 422 (96.1%) |
| 5 Years | 24 (100.0%) | 37 (100.0%) |
| 6 to 11 Years | 291 (100.0%) | 138 (89.0%) |
| 12 to 14 Years | 116 (100.0%) | 66 (100.0%) |
| 15 Years | 27 (62.8%) | 35 (100.0%) |
| 16 and 17 Years | 30 (100.0%) | 40 (100.0%) |
| 18 to 24 Years | 145 (86.8%) | 134 (76.1%) |
| 25 to 34 Years | 298 (92.3%) | 393 (100.0%) |
| 35 to 44 Years | 466 (100.0%) | 380 (96.0%) |
| 45 to 54 Years | 397 (98.8%) | 344 (100.0%) |
| 55 to 64 Years | 530 (96.0%) | 560 (99.5%) |
| 65 to 74 Years | 282 (100.0%) | 292 (98.0%) |
| 75 Years and over | 160 (100.0%) | 283 (100.0%) |
| Total | 3,037 (97.1%) | 3,124 (96.9%) |
Income Below Poverty Among Married-Couple Families in Belle Haven
The poverty statistics for married-couple families in Belle Haven show that 1.4% or 19 of the total 1,321 families live below the poverty line. Families with 3 or 4 children have the highest poverty rate of 24.7%, comprising of 19 families. On the other hand, families with no children have the lowest poverty rate of 0.0%, which includes 0 families.
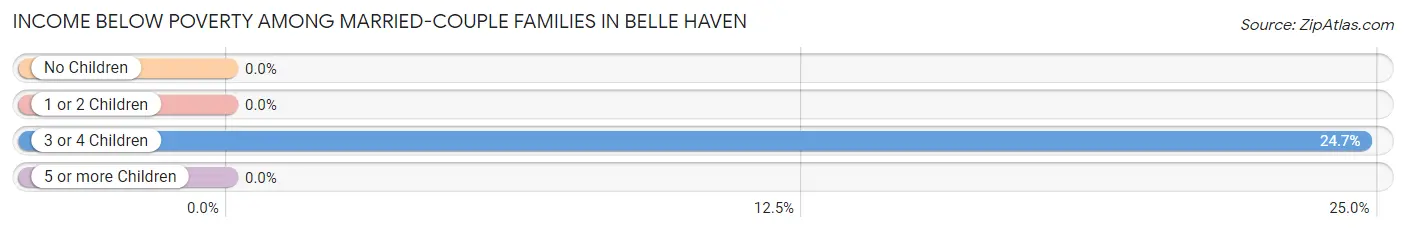
| Children | Above Poverty | Below Poverty |
| No Children | 794 (100.0%) | 0 (0.0%) |
| 1 or 2 Children | 423 (100.0%) | 0 (0.0%) |
| 3 or 4 Children | 58 (75.3%) | 19 (24.7%) |
| 5 or more Children | 27 (100.0%) | 0 (0.0%) |
| Total | 1,302 (98.6%) | 19 (1.4%) |
Income Below Poverty Among Single-Parent Households in Belle Haven
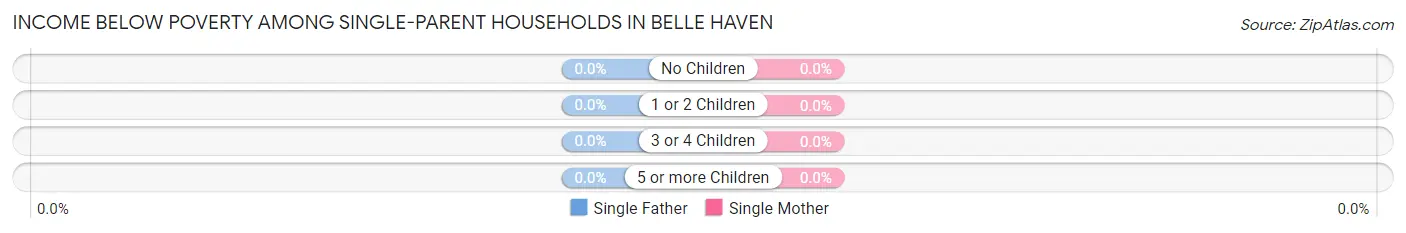
| Children | Single Father | Single Mother |
| No Children | 0 (0.0%) | 0 (0.0%) |
| 1 or 2 Children | 0 (0.0%) | 0 (0.0%) |
| 3 or 4 Children | 0 (0.0%) | 0 (0.0%) |
| 5 or more Children | 0 (0.0%) | 0 (0.0%) |
| Total | 0 (0.0%) | 0 (0.0%) |
Income Below Poverty Among Married-Couple vs Single-Parent Households in Belle Haven
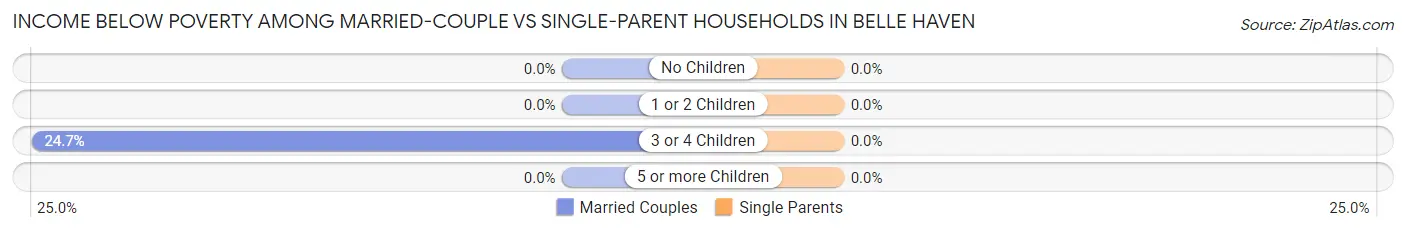
| Children | Married-Couple Families | Single-Parent Households |
| No Children | 0 (0.0%) | 0 (0.0%) |
| 1 or 2 Children | 0 (0.0%) | 0 (0.0%) |
| 3 or 4 Children | 19 (24.7%) | 0 (0.0%) |
| 5 or more Children | 0 (0.0%) | 0 (0.0%) |
| Total | 19 (1.4%) | 0 (0.0%) |
Race in Belle Haven
The most populous races in Belle Haven are White / Caucasian (5,122 | 80.5%), Hispanic or Latino (865 | 13.6%), and Two or more Races (628 | 9.9%).
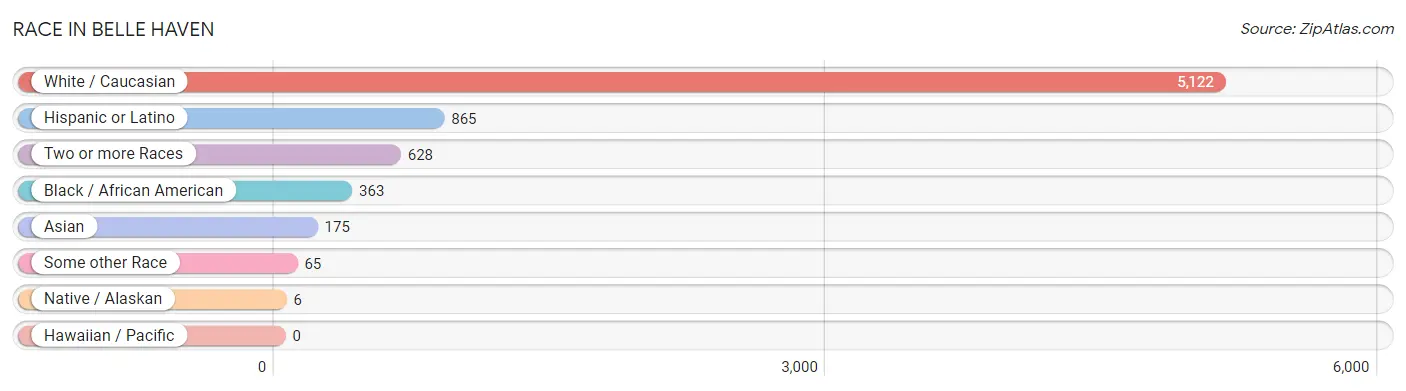
| Race | # Population | % Population |
| Asian | 175 | 2.8% |
| Black / African American | 363 | 5.7% |
| Hawaiian / Pacific | 0 | 0.0% |
| Hispanic or Latino | 865 | 13.6% |
| Native / Alaskan | 6 | 0.1% |
| White / Caucasian | 5,122 | 80.5% |
| Two or more Races | 628 | 9.9% |
| Some other Race | 65 | 1.0% |
| Total | 6,359 | 100.0% |
Ancestry in Belle Haven
The most populous ancestries reported in Belle Haven are Irish (1,785 | 28.1%), English (916 | 14.4%), German (898 | 14.1%), Italian (807 | 12.7%), and South American (333 | 5.2%), together accounting for 74.5% of all Belle Haven residents.
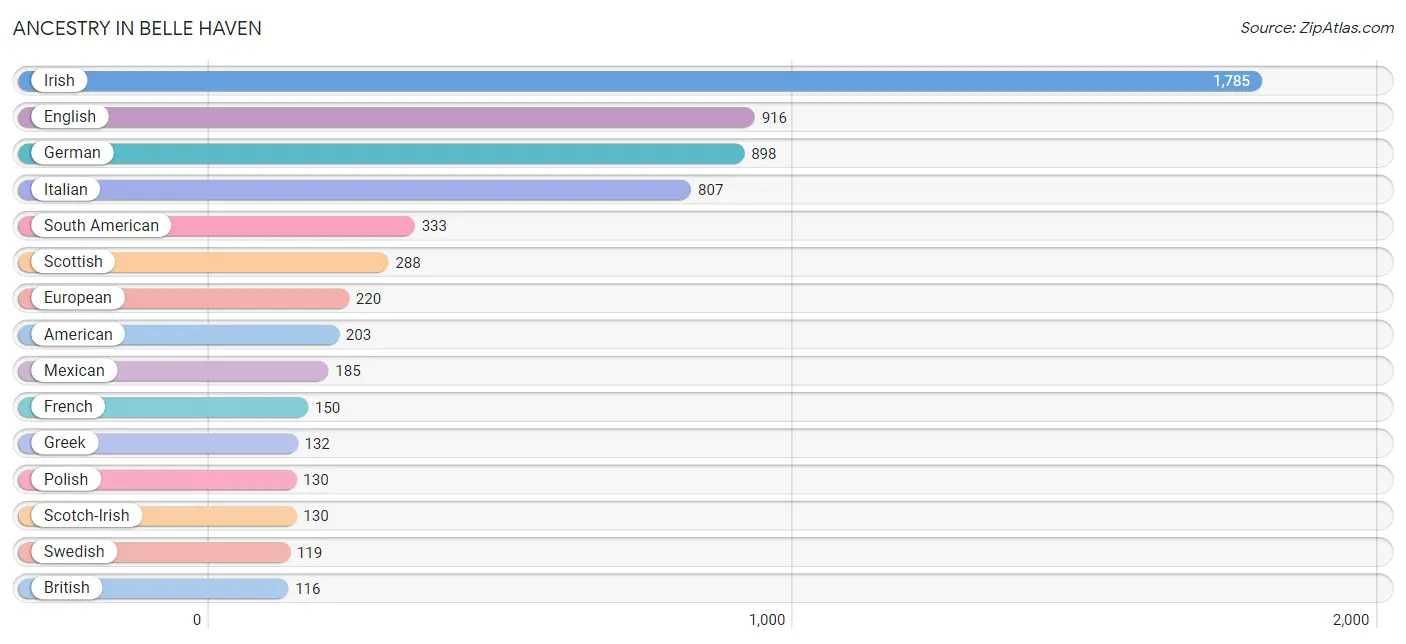
| Ancestry | # Population | % Population |
| Afghan | 18 | 0.3% |
| African | 12 | 0.2% |
| American | 203 | 3.2% |
| Arab | 37 | 0.6% |
| Argentinean | 63 | 1.0% |
| Armenian | 10 | 0.2% |
| Australian | 12 | 0.2% |
| Austrian | 10 | 0.2% |
| Bhutanese | 34 | 0.5% |
| Bolivian | 109 | 1.7% |
| British | 116 | 1.8% |
| Bulgarian | 10 | 0.2% |
| Burmese | 79 | 1.2% |
| Cajun | 9 | 0.1% |
| Canadian | 27 | 0.4% |
| Central American | 103 | 1.6% |
| Cherokee | 6 | 0.1% |
| Chickasaw | 6 | 0.1% |
| Chilean | 8 | 0.1% |
| Colombian | 41 | 0.6% |
| Cuban | 15 | 0.2% |
| Czech | 89 | 1.4% |
| Czechoslovakian | 9 | 0.1% |
| Danish | 29 | 0.5% |
| Dutch | 9 | 0.1% |
| Eastern European | 15 | 0.2% |
| Ecuadorian | 14 | 0.2% |
| English | 916 | 14.4% |
| Estonian | 33 | 0.5% |
| European | 220 | 3.5% |
| French | 150 | 2.4% |
| French Canadian | 89 | 1.4% |
| German | 898 | 14.1% |
| Ghanaian | 91 | 1.4% |
| Greek | 132 | 2.1% |
| Hopi | 7 | 0.1% |
| Hungarian | 45 | 0.7% |
| Indian (Asian) | 76 | 1.2% |
| Iranian | 8 | 0.1% |
| Irish | 1,785 | 28.1% |
| Italian | 807 | 12.7% |
| Jamaican | 14 | 0.2% |
| Korean | 11 | 0.2% |
| Lebanese | 23 | 0.4% |
| Maltese | 3 | 0.1% |
| Mexican | 185 | 2.9% |
| Moroccan | 14 | 0.2% |
| Native Hawaiian | 11 | 0.2% |
| Nicaraguan | 11 | 0.2% |
| Northern European | 42 | 0.7% |
| Norwegian | 57 | 0.9% |
| Pakistani | 38 | 0.6% |
| Panamanian | 51 | 0.8% |
| Peruvian | 79 | 1.2% |
| Polish | 130 | 2.0% |
| Portuguese | 11 | 0.2% |
| Puerto Rican | 110 | 1.7% |
| Romanian | 14 | 0.2% |
| Russian | 51 | 0.8% |
| Salvadoran | 41 | 0.6% |
| Scandinavian | 18 | 0.3% |
| Scotch-Irish | 130 | 2.0% |
| Scottish | 288 | 4.5% |
| Sioux | 9 | 0.1% |
| Slovak | 85 | 1.3% |
| South American | 333 | 5.2% |
| Spaniard | 2 | 0.0% |
| Spanish | 20 | 0.3% |
| Sri Lankan | 47 | 0.7% |
| Subsaharan African | 103 | 1.6% |
| Swedish | 119 | 1.9% |
| Swiss | 36 | 0.6% |
| Thai | 49 | 0.8% |
| Trinidadian and Tobagonian | 11 | 0.2% |
| Turkish | 42 | 0.7% |
| Ukrainian | 25 | 0.4% |
| Uruguayan | 19 | 0.3% |
| Welsh | 39 | 0.6% | View All 78 Rows |
Immigrants in Belle Haven
The most numerous immigrant groups reported in Belle Haven came from Latin America (397 | 6.2%), South America (253 | 4.0%), Europe (172 | 2.7%), Asia (160 | 2.5%), and Central America (133 | 2.1%), together accounting for 17.5% of all Belle Haven residents.
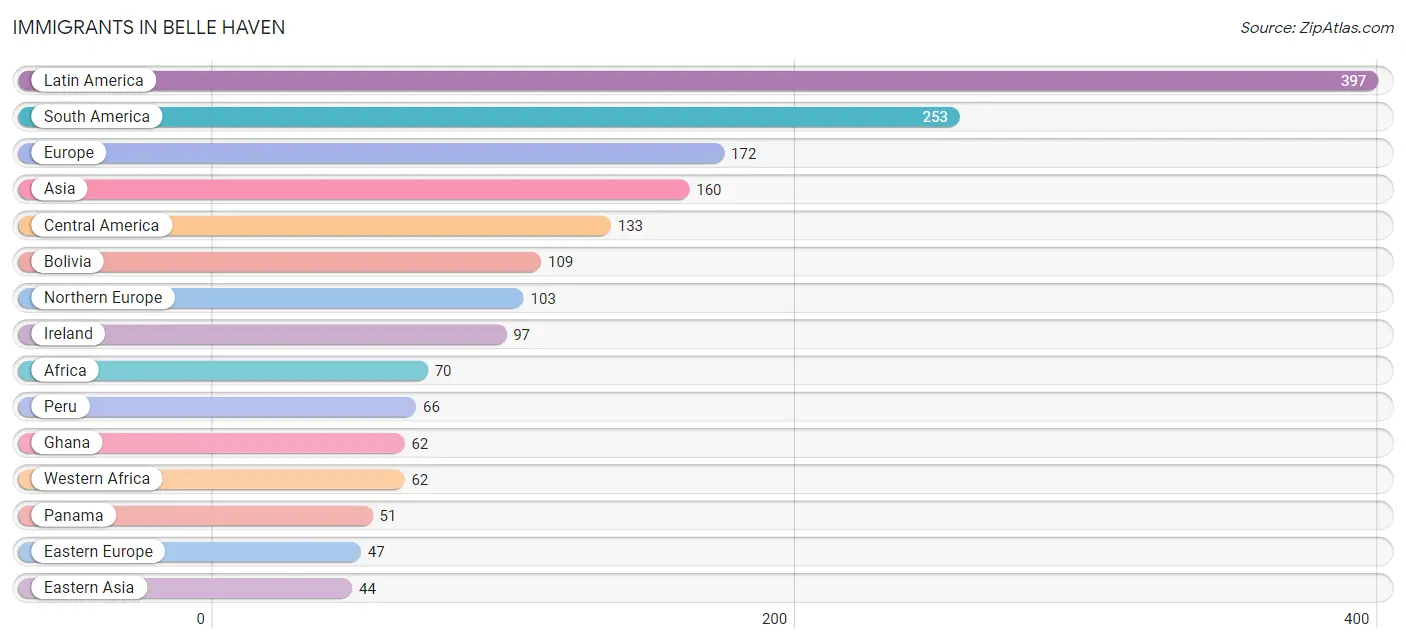
| Immigration Origin | # Population | % Population |
| Afghanistan | 18 | 0.3% |
| Africa | 70 | 1.1% |
| Argentina | 37 | 0.6% |
| Asia | 160 | 2.5% |
| Bolivia | 109 | 1.7% |
| Bulgaria | 10 | 0.2% |
| Canada | 31 | 0.5% |
| Caribbean | 11 | 0.2% |
| Central America | 133 | 2.1% |
| Chile | 8 | 0.1% |
| China | 1 | 0.0% |
| Colombia | 8 | 0.1% |
| Eastern Asia | 44 | 0.7% |
| Eastern Europe | 47 | 0.7% |
| El Salvador | 36 | 0.6% |
| Europe | 172 | 2.7% |
| Germany | 10 | 0.2% |
| Ghana | 62 | 1.0% |
| Guyana | 6 | 0.1% |
| Hong Kong | 1 | 0.0% |
| Hungary | 7 | 0.1% |
| India | 16 | 0.3% |
| Iran | 9 | 0.1% |
| Ireland | 97 | 1.5% |
| Jamaica | 3 | 0.1% |
| Korea | 43 | 0.7% |
| Latin America | 397 | 6.2% |
| Mexico | 35 | 0.5% |
| Nicaragua | 11 | 0.2% |
| Northern Europe | 103 | 1.6% |
| Panama | 51 | 0.8% |
| Peru | 66 | 1.0% |
| South Africa | 8 | 0.1% |
| South America | 253 | 4.0% |
| South Central Asia | 43 | 0.7% |
| South Eastern Asia | 31 | 0.5% |
| Switzerland | 12 | 0.2% |
| Thailand | 21 | 0.3% |
| Trinidad and Tobago | 8 | 0.1% |
| Turkey | 42 | 0.7% |
| Uruguay | 19 | 0.3% |
| Vietnam | 10 | 0.2% |
| Western Africa | 62 | 1.0% |
| Western Asia | 42 | 0.7% |
| Western Europe | 22 | 0.4% | View All 45 Rows |
Sex and Age in Belle Haven
Sex and Age in Belle Haven
The most populous age groups in Belle Haven are 5 to 9 Years (302 | 9.7%) for men and Under 5 Years (439 | 13.6%) for women.
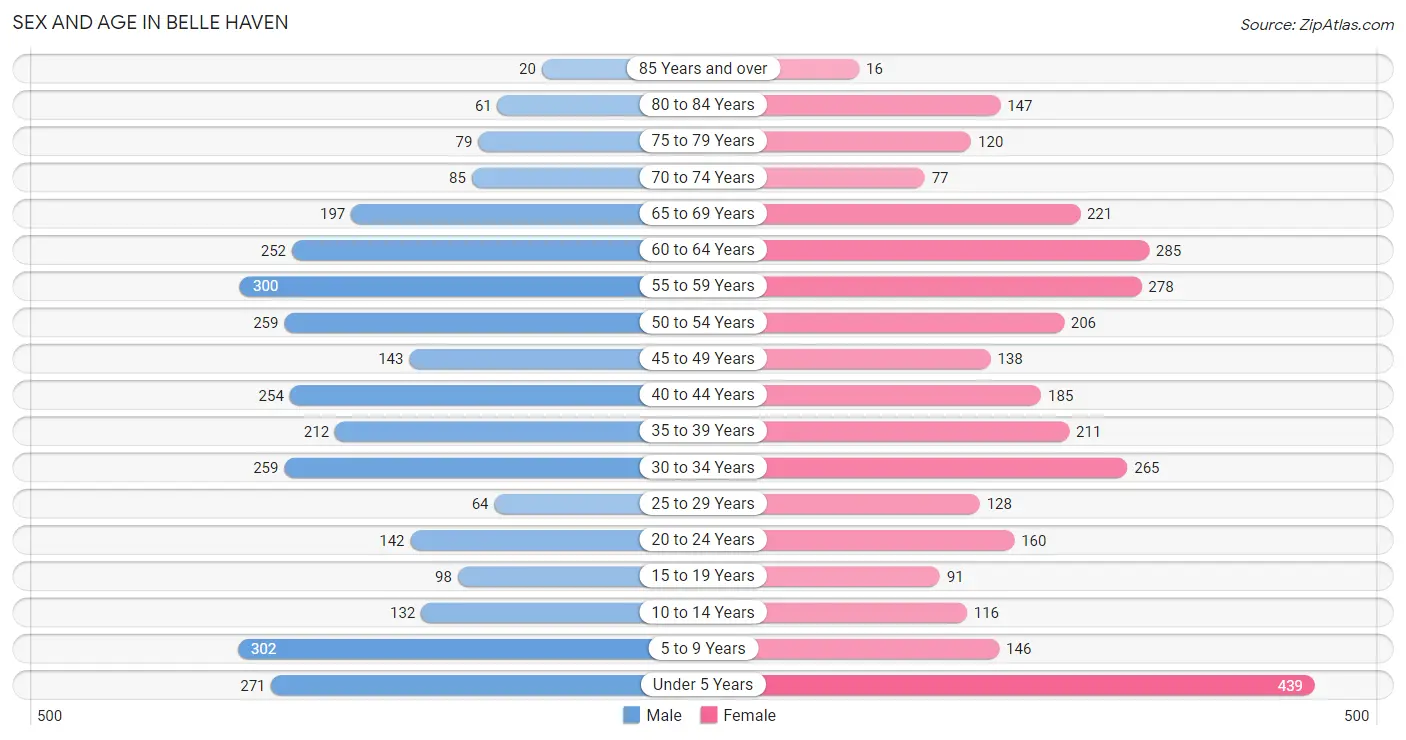
| Age Bracket | Male | Female |
| Under 5 Years | 271 (8.7%) | 439 (13.6%) |
| 5 to 9 Years | 302 (9.7%) | 146 (4.5%) |
| 10 to 14 Years | 132 (4.2%) | 116 (3.6%) |
| 15 to 19 Years | 98 (3.1%) | 91 (2.8%) |
| 20 to 24 Years | 142 (4.5%) | 160 (5.0%) |
| 25 to 29 Years | 64 (2.0%) | 128 (4.0%) |
| 30 to 34 Years | 259 (8.3%) | 265 (8.2%) |
| 35 to 39 Years | 212 (6.8%) | 211 (6.5%) |
| 40 to 44 Years | 254 (8.1%) | 185 (5.7%) |
| 45 to 49 Years | 143 (4.6%) | 138 (4.3%) |
| 50 to 54 Years | 259 (8.3%) | 206 (6.4%) |
| 55 to 59 Years | 300 (9.6%) | 278 (8.6%) |
| 60 to 64 Years | 252 (8.1%) | 285 (8.8%) |
| 65 to 69 Years | 197 (6.3%) | 221 (6.8%) |
| 70 to 74 Years | 85 (2.7%) | 77 (2.4%) |
| 75 to 79 Years | 79 (2.5%) | 120 (3.7%) |
| 80 to 84 Years | 61 (1.9%) | 147 (4.5%) |
| 85 Years and over | 20 (0.6%) | 16 (0.5%) |
| Total | 3,130 (100.0%) | 3,229 (100.0%) |
Families and Households in Belle Haven
Median Family Size in Belle Haven
The median family size in Belle Haven is 3.15 persons per family, with married-couple families (1,321 | 82.7%) accounting for the largest median family size of 3.26 persons per family. On the other hand, single male/father families (147 | 9.2%) represent the smallest median family size with 2.48 persons per family.
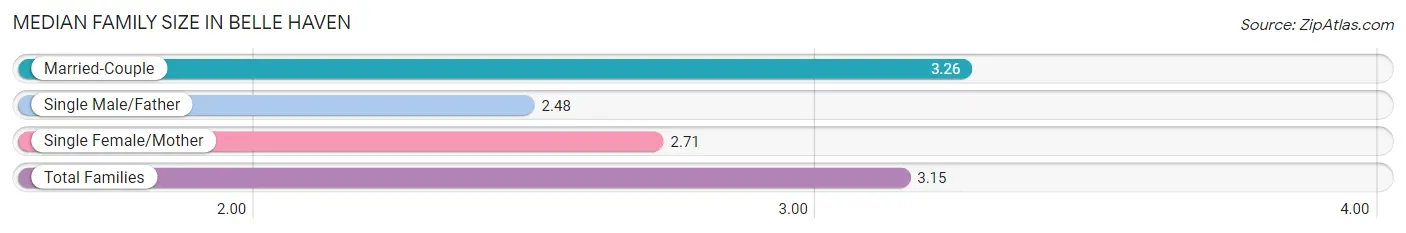
| Family Type | # Families | Family Size |
| Married-Couple | 1,321 (82.7%) | 3.26 |
| Single Male/Father | 147 (9.2%) | 2.48 |
| Single Female/Mother | 129 (8.1%) | 2.71 |
| Total Families | 1,597 (100.0%) | 3.15 |
Median Household Size in Belle Haven
The median household size in Belle Haven is 2.31 persons per household, with married-couple households (1,321 | 48.1%) accounting for the largest median household size of 3.3 persons per household. non-family households (1,150 | 41.9%) represent the smallest median household size with 1.06 persons per household.
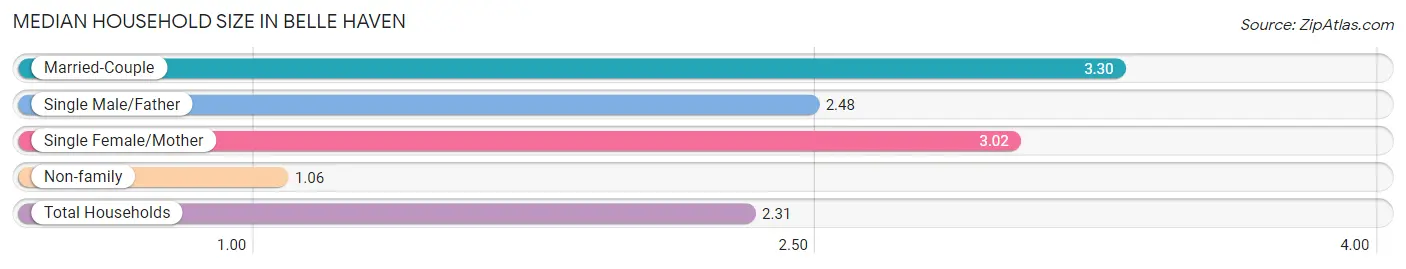
| Household Type | # Households | Household Size |
| Married-Couple | 1,321 (48.1%) | 3.30 |
| Single Male/Father | 147 (5.3%) | 2.48 |
| Single Female/Mother | 129 (4.7%) | 3.02 |
| Non-family | 1,150 (41.9%) | 1.06 |
| Total Households | 2,747 (100.0%) | 2.31 |
Household Size by Marriage Status in Belle Haven
Out of a total of 2,747 households in Belle Haven, 1,597 (58.1%) are family households, while 1,150 (41.9%) are nonfamily households. The most numerous type of family households are 2-person households, comprising 787, and the most common type of nonfamily households are 1-person households, comprising 1,081.
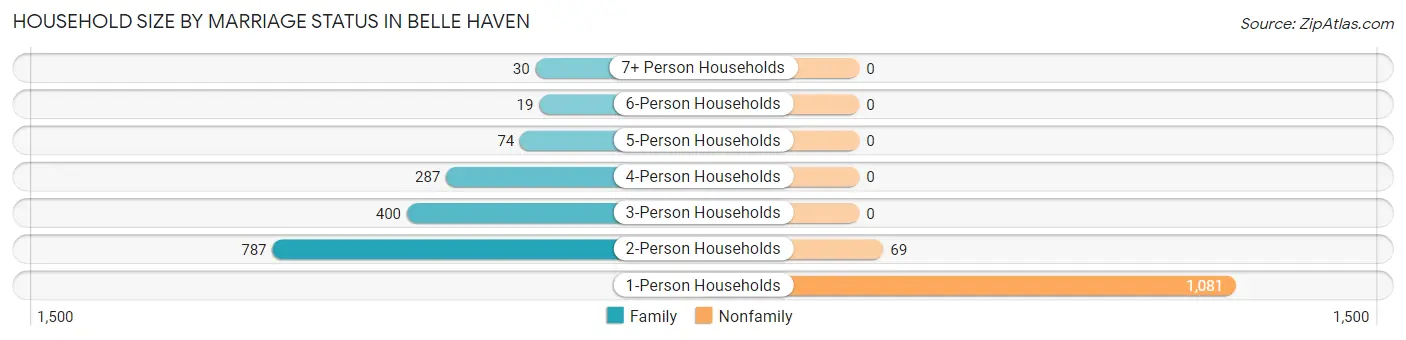
| Household Size | Family Households | Nonfamily Households |
| 1-Person Households | - | 1,081 (39.4%) |
| 2-Person Households | 787 (28.6%) | 69 (2.5%) |
| 3-Person Households | 400 (14.6%) | 0 (0.0%) |
| 4-Person Households | 287 (10.4%) | 0 (0.0%) |
| 5-Person Households | 74 (2.7%) | 0 (0.0%) |
| 6-Person Households | 19 (0.7%) | 0 (0.0%) |
| 7+ Person Households | 30 (1.1%) | 0 (0.0%) |
| Total | 1,597 (58.1%) | 1,150 (41.9%) |
Female Fertility in Belle Haven
Fertility by Age in Belle Haven
Average fertility rate in Belle Haven is 52.0 births per 1,000 women. Women in the age bracket of 20 to 34 years have the highest fertility rate with 92.0 births per 1,000 women. Women in the age bracket of 20 to 34 years acount for 80.9% of all women with births.
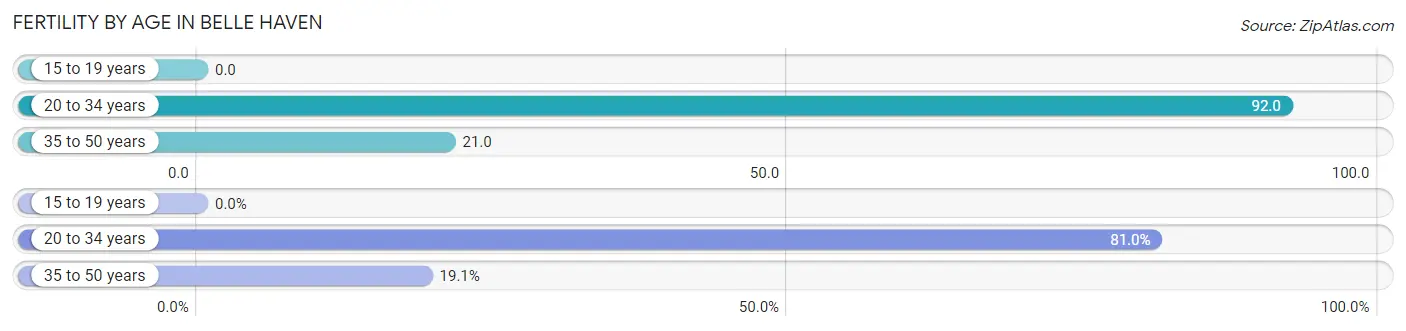
| Age Bracket | Women with Births | Births / 1,000 Women |
| 15 to 19 years | 0 (0.0%) | 0.0 |
| 20 to 34 years | 51 (80.9%) | 92.0 |
| 35 to 50 years | 12 (19.1%) | 21.0 |
| Total | 63 (100.0%) | 52.0 |
Fertility by Age by Marriage Status in Belle Haven
81.0% of women with births (63) in Belle Haven are married. The highest percentage of unmarried women with births falls into 35 to 50 years age bracket with 100.0% of them unmarried at the time of birth, while the lowest percentage of unmarried women with births belong to 20 to 34 years age bracket with 0.0% of them unmarried.
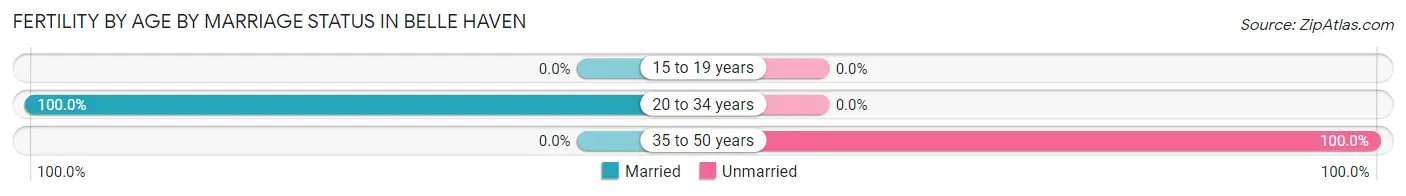
| Age Bracket | Married | Unmarried |
| 15 to 19 years | 0 (0.0%) | 0 (0.0%) |
| 20 to 34 years | 51 (100.0%) | 0 (0.0%) |
| 35 to 50 years | 0 (0.0%) | 12 (100.0%) |
| Total | 51 (80.9%) | 12 (19.1%) |
Fertility by Education in Belle Haven
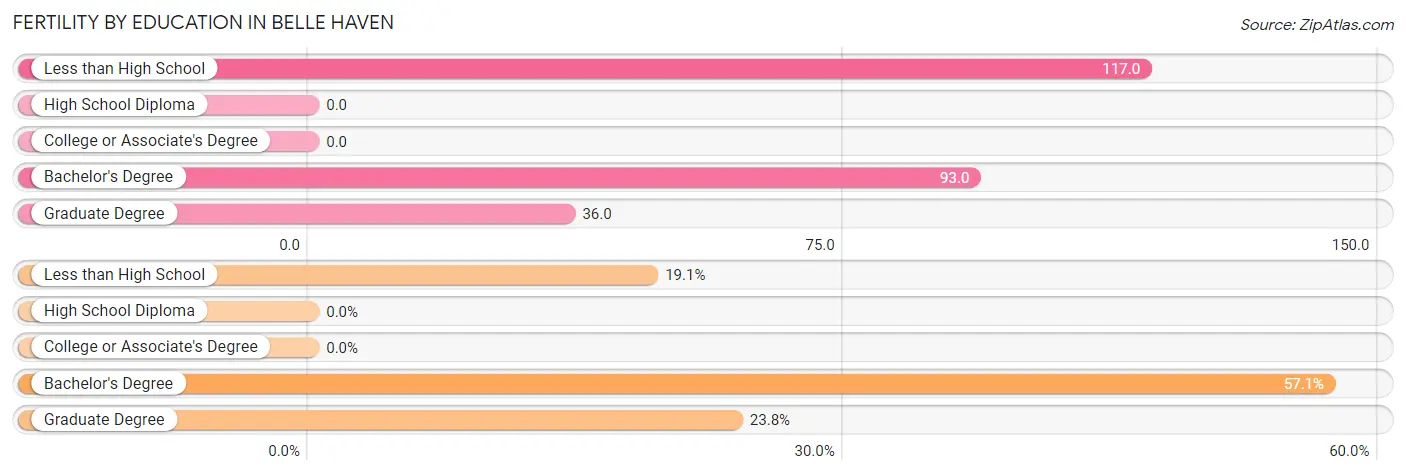
| Educational Attainment | Women with Births | Births / 1,000 Women |
| Less than High School | 12 (19.1%) | 117.0 |
| High School Diploma | 0 (0.0%) | 0.0 |
| College or Associate's Degree | 0 (0.0%) | 0.0 |
| Bachelor's Degree | 36 (57.1%) | 93.0 |
| Graduate Degree | 15 (23.8%) | 36.0 |
| Total | 63 (100.0%) | 52.0 |
Fertility by Education by Marriage Status in Belle Haven
19.1% of women with births in Belle Haven are unmarried. Women with the educational attainment of bachelor's degree are most likely to be married with 100.0% of them married at childbirth, while women with the educational attainment of less than high school are least likely to be married with 100.0% of them unmarried at childbirth.
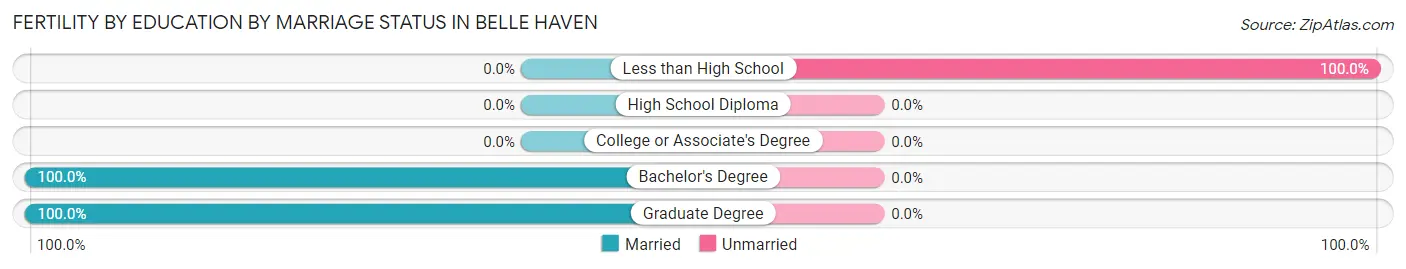
| Educational Attainment | Married | Unmarried |
| Less than High School | 0 (0.0%) | 12 (100.0%) |
| High School Diploma | 0 (0.0%) | 0 (0.0%) |
| College or Associate's Degree | 0 (0.0%) | 0 (0.0%) |
| Bachelor's Degree | 36 (100.0%) | 0 (0.0%) |
| Graduate Degree | 15 (100.0%) | 0 (0.0%) |
| Total | 51 (80.9%) | 12 (19.1%) |
Employment Characteristics in Belle Haven
Employment by Class of Employer in Belle Haven
Among the 3,378 employed individuals in Belle Haven, private company employees (1,751 | 51.8%), federal government employees (663 | 19.6%), and not-for-profit organizations (378 | 11.2%) make up the most common classes of employment.
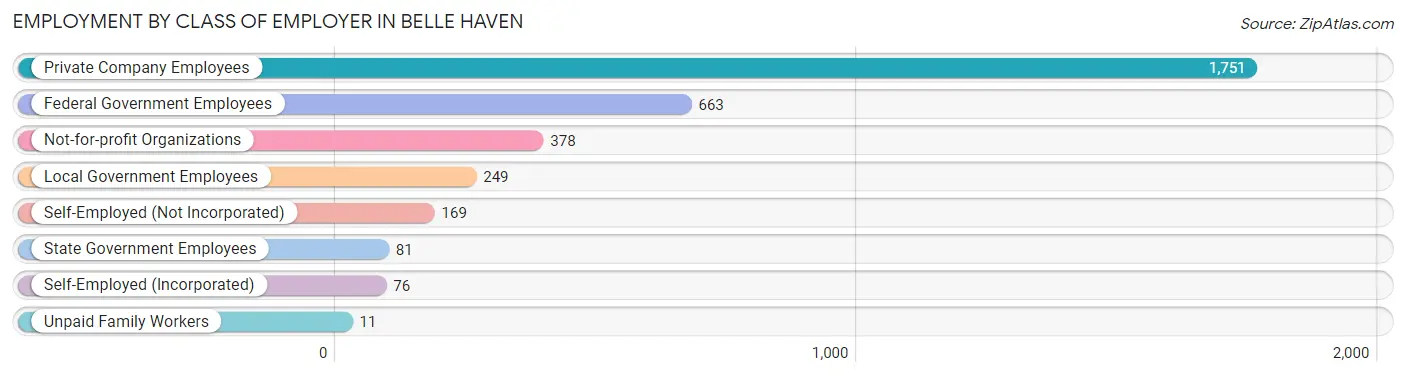
| Employer Class | # Employees | % Employees |
| Private Company Employees | 1,751 | 51.8% |
| Self-Employed (Incorporated) | 76 | 2.2% |
| Self-Employed (Not Incorporated) | 169 | 5.0% |
| Not-for-profit Organizations | 378 | 11.2% |
| Local Government Employees | 249 | 7.4% |
| State Government Employees | 81 | 2.4% |
| Federal Government Employees | 663 | 19.6% |
| Unpaid Family Workers | 11 | 0.3% |
| Total | 3,378 | 100.0% |
Employment Status by Age in Belle Haven
According to the labor force statistics for Belle Haven, out of the total population over 16 years of age (4,875), 72.4% or 3,530 individuals are in the labor force, with 3.3% or 116 of them unemployed. The age group with the highest labor force participation rate is 25 to 29 years, with 99.0% or 190 individuals in the labor force. Within the labor force, the 30 to 34 years age range has the highest percentage of unemployed individuals, with 9.3% or 43 of them being unemployed.
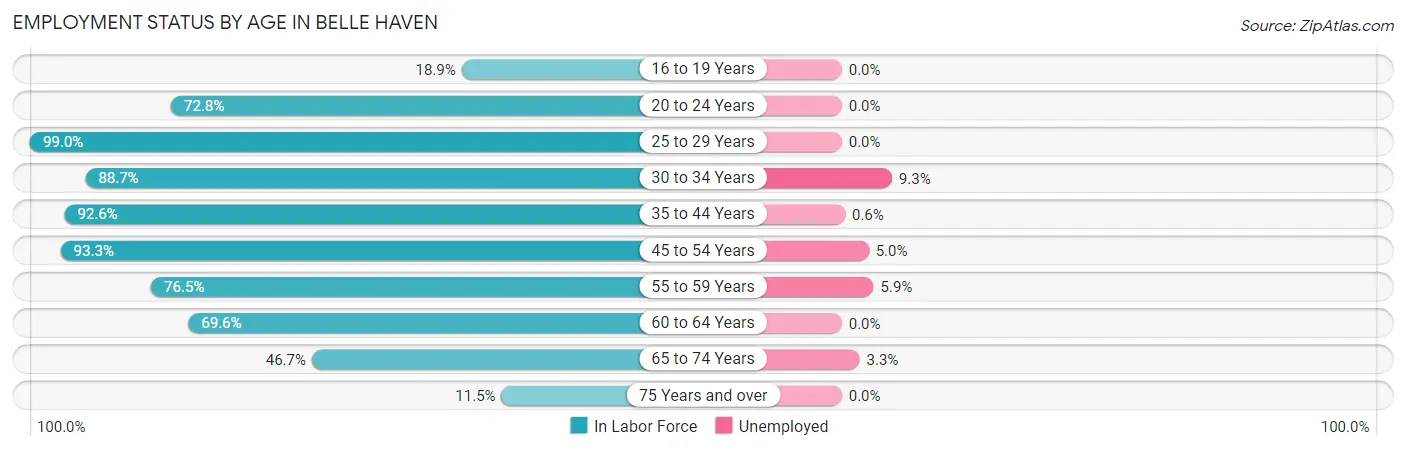
| Age Bracket | In Labor Force | Unemployed |
| 16 to 19 Years | 21 (18.9%) | 0 (0.0%) |
| 20 to 24 Years | 220 (72.8%) | 0 (0.0%) |
| 25 to 29 Years | 190 (99.0%) | 0 (0.0%) |
| 30 to 34 Years | 465 (88.7%) | 43 (9.3%) |
| 35 to 44 Years | 798 (92.6%) | 5 (0.6%) |
| 45 to 54 Years | 696 (93.3%) | 35 (5.0%) |
| 55 to 59 Years | 442 (76.5%) | 26 (5.9%) |
| 60 to 64 Years | 374 (69.6%) | 0 (0.0%) |
| 65 to 74 Years | 271 (46.7%) | 9 (3.3%) |
| 75 Years and over | 51 (11.5%) | 0 (0.0%) |
| Total | 3,530 (72.4%) | 116 (3.3%) |
Employment Status by Educational Attainment in Belle Haven
According to labor force statistics for Belle Haven, 86.2% of individuals (2,964) out of the total population between 25 and 64 years of age (3,439) are in the labor force, with 3.7% or 110 of them being unemployed. The group with the highest labor force participation rate are those with the educational attainment of bachelor's degree or higher, with 89.4% or 2,228 individuals in the labor force. Within the labor force, individuals with high school diploma education have the highest percentage of unemployment, with 11.5% or 37 of them being unemployed.
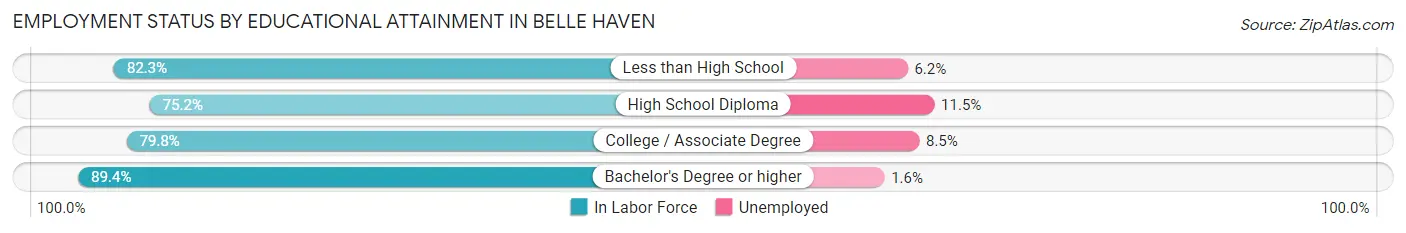
| Educational Attainment | In Labor Force | Unemployed |
| Less than High School | 65 (82.3%) | 5 (6.2%) |
| High School Diploma | 322 (75.2%) | 49 (11.5%) |
| College / Associate Degree | 351 (79.8%) | 37 (8.5%) |
| Bachelor's Degree or higher | 2,228 (89.4%) | 40 (1.6%) |
| Total | 2,964 (86.2%) | 127 (3.7%) |
Employment Occupations by Sex in Belle Haven
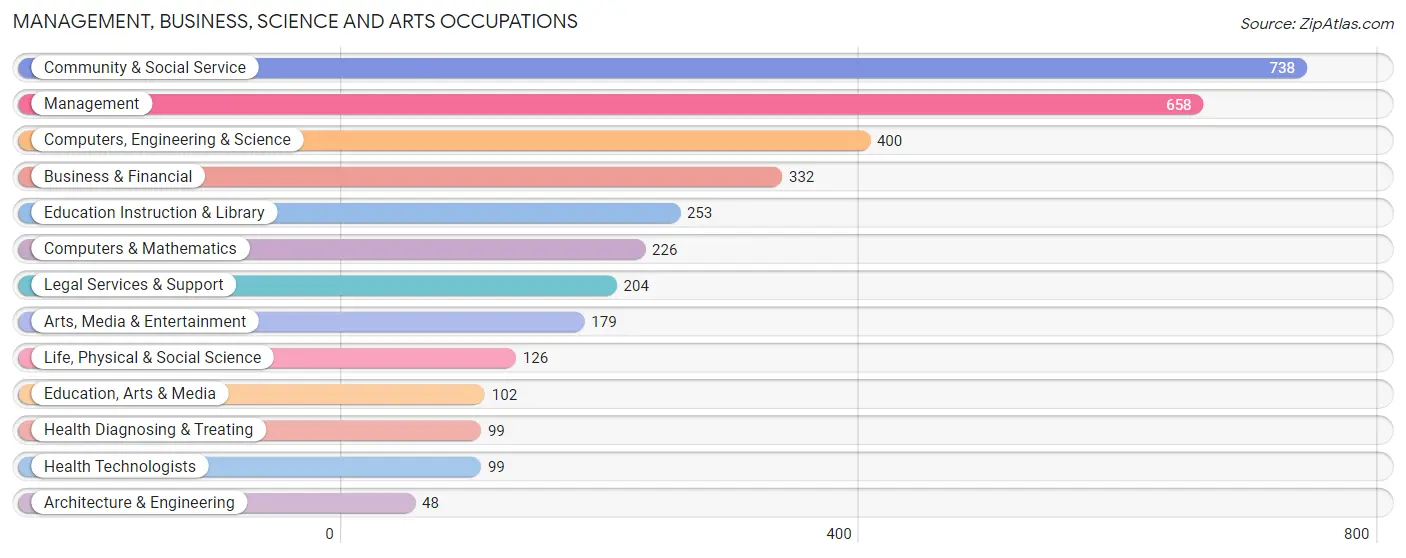
Management, Business, Science and Arts Occupations
The most common Management, Business, Science and Arts occupations in Belle Haven are Community & Social Service (738 | 22.2%), Management (658 | 19.8%), Computers, Engineering & Science (400 | 12.0%), Business & Financial (332 | 10.0%), and Education Instruction & Library (253 | 7.6%).
Management, Business, Science and Arts Occupations by Sex
Within the Management, Business, Science and Arts occupations in Belle Haven, the most male-oriented occupations are Architecture & Engineering (100.0%), Computers, Engineering & Science (78.0%), and Life, Physical & Social Science (77.0%), while the most female-oriented occupations are Education, Arts & Media (81.4%), Education Instruction & Library (71.9%), and Health Diagnosing & Treating (70.7%).
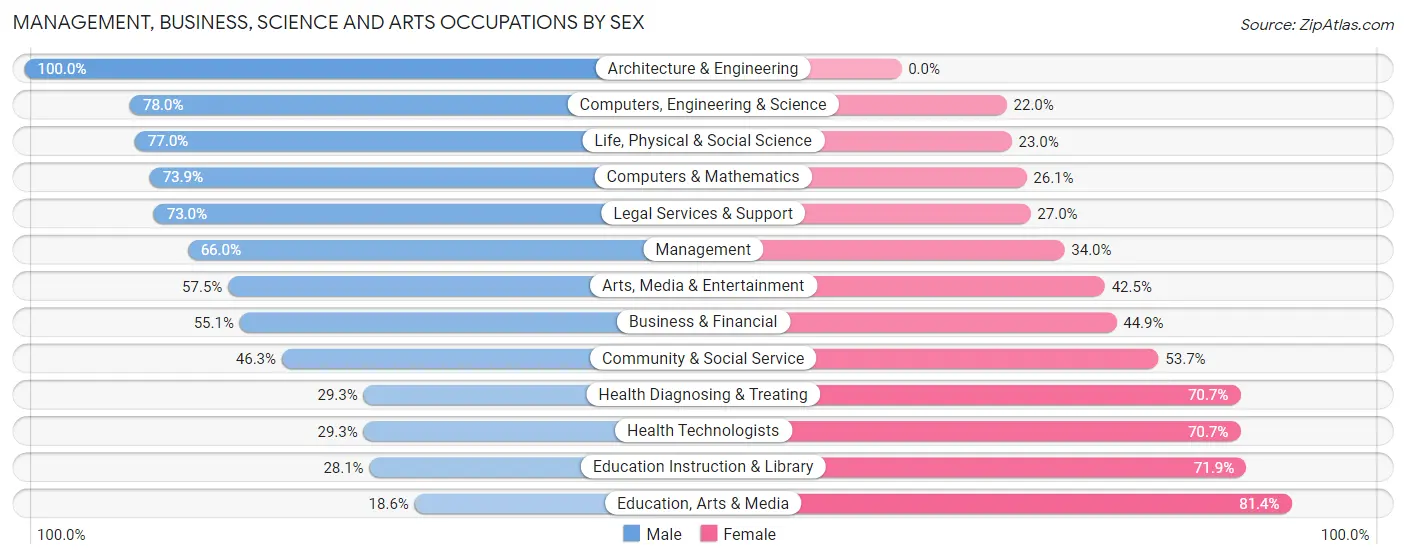
| Occupation | Male | Female |
| Management | 434 (66.0%) | 224 (34.0%) |
| Business & Financial | 183 (55.1%) | 149 (44.9%) |
| Computers, Engineering & Science | 312 (78.0%) | 88 (22.0%) |
| Computers & Mathematics | 167 (73.9%) | 59 (26.1%) |
| Architecture & Engineering | 48 (100.0%) | 0 (0.0%) |
| Life, Physical & Social Science | 97 (77.0%) | 29 (23.0%) |
| Community & Social Service | 342 (46.3%) | 396 (53.7%) |
| Education, Arts & Media | 19 (18.6%) | 83 (81.4%) |
| Legal Services & Support | 149 (73.0%) | 55 (27.0%) |
| Education Instruction & Library | 71 (28.1%) | 182 (71.9%) |
| Arts, Media & Entertainment | 103 (57.5%) | 76 (42.5%) |
| Health Diagnosing & Treating | 29 (29.3%) | 70 (70.7%) |
| Health Technologists | 29 (29.3%) | 70 (70.7%) |
| Total (Category) | 1,300 (58.4%) | 927 (41.6%) |
| Total (Overall) | 1,771 (53.2%) | 1,560 (46.8%) |
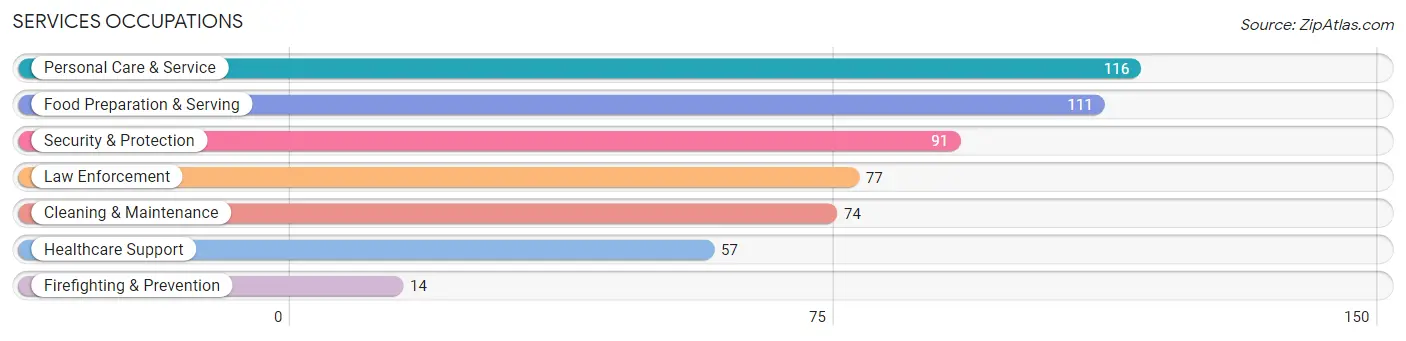
Services Occupations
The most common Services occupations in Belle Haven are Personal Care & Service (116 | 3.5%), Food Preparation & Serving (111 | 3.3%), Security & Protection (91 | 2.7%), Law Enforcement (77 | 2.3%), and Cleaning & Maintenance (74 | 2.2%).
Services Occupations by Sex
Within the Services occupations in Belle Haven, the most male-oriented occupations are Firefighting & Prevention (100.0%), Security & Protection (60.4%), and Law Enforcement (53.2%), while the most female-oriented occupations are Healthcare Support (100.0%), Personal Care & Service (96.6%), and Food Preparation & Serving (92.8%).
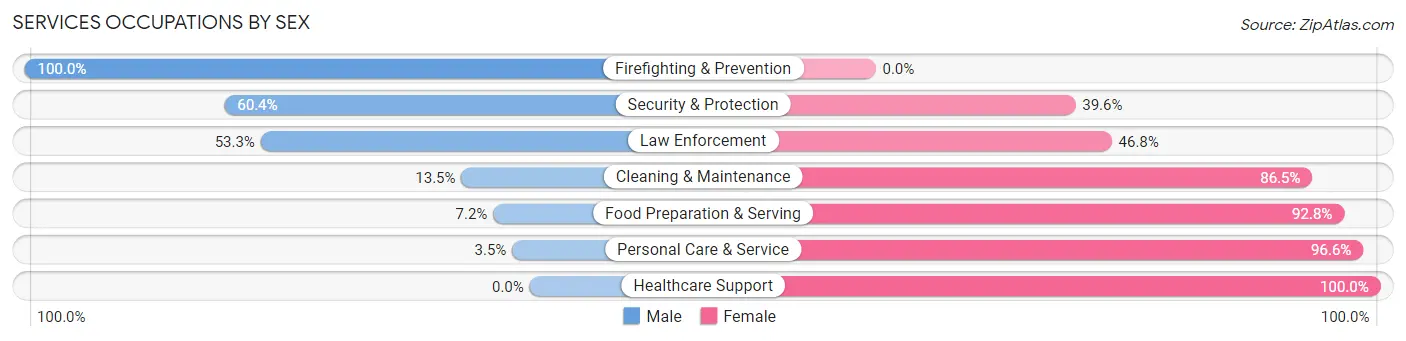
| Occupation | Male | Female |
| Healthcare Support | 0 (0.0%) | 57 (100.0%) |
| Security & Protection | 55 (60.4%) | 36 (39.6%) |
| Firefighting & Prevention | 14 (100.0%) | 0 (0.0%) |
| Law Enforcement | 41 (53.2%) | 36 (46.8%) |
| Food Preparation & Serving | 8 (7.2%) | 103 (92.8%) |
| Cleaning & Maintenance | 10 (13.5%) | 64 (86.5%) |
| Personal Care & Service | 4 (3.5%) | 112 (96.6%) |
| Total (Category) | 77 (17.2%) | 372 (82.9%) |
| Total (Overall) | 1,771 (53.2%) | 1,560 (46.8%) |
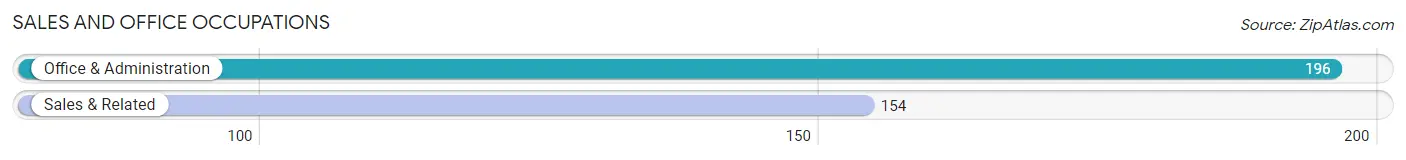
Sales and Office Occupations
The most common Sales and Office occupations in Belle Haven are Office & Administration (196 | 5.9%), and Sales & Related (154 | 4.6%).
Sales and Office Occupations by Sex
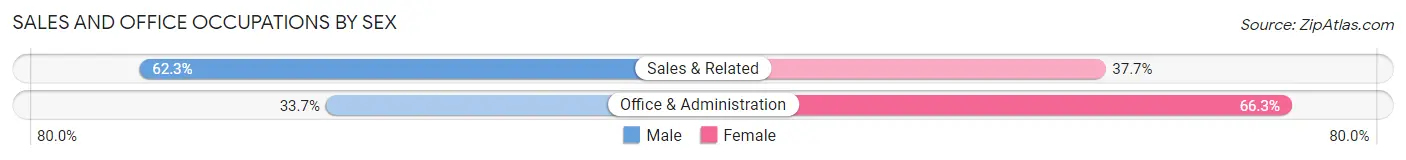
| Occupation | Male | Female |
| Sales & Related | 96 (62.3%) | 58 (37.7%) |
| Office & Administration | 66 (33.7%) | 130 (66.3%) |
| Total (Category) | 162 (46.3%) | 188 (53.7%) |
| Total (Overall) | 1,771 (53.2%) | 1,560 (46.8%) |
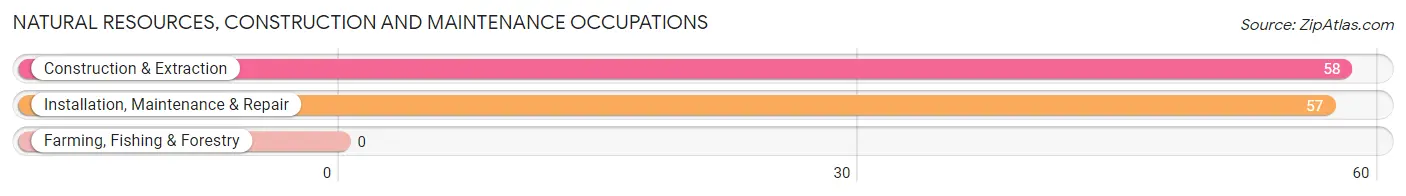
Natural Resources, Construction and Maintenance Occupations
The most common Natural Resources, Construction and Maintenance occupations in Belle Haven are Construction & Extraction (58 | 1.7%), and Installation, Maintenance & Repair (57 | 1.7%).
Natural Resources, Construction and Maintenance Occupations by Sex
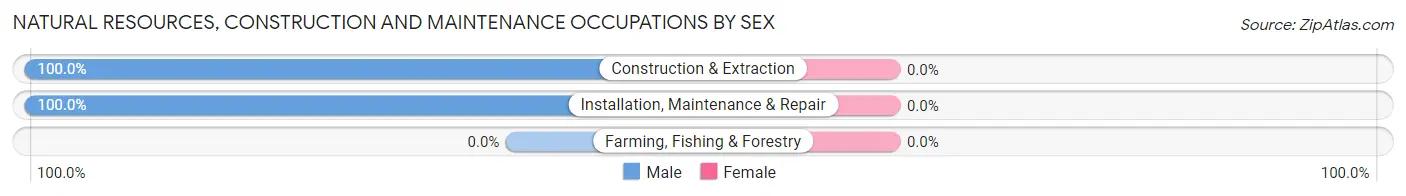
| Occupation | Male | Female |
| Farming, Fishing & Forestry | 0 (0.0%) | 0 (0.0%) |
| Construction & Extraction | 58 (100.0%) | 0 (0.0%) |
| Installation, Maintenance & Repair | 57 (100.0%) | 0 (0.0%) |
| Total (Category) | 115 (100.0%) | 0 (0.0%) |
| Total (Overall) | 1,771 (53.2%) | 1,560 (46.8%) |
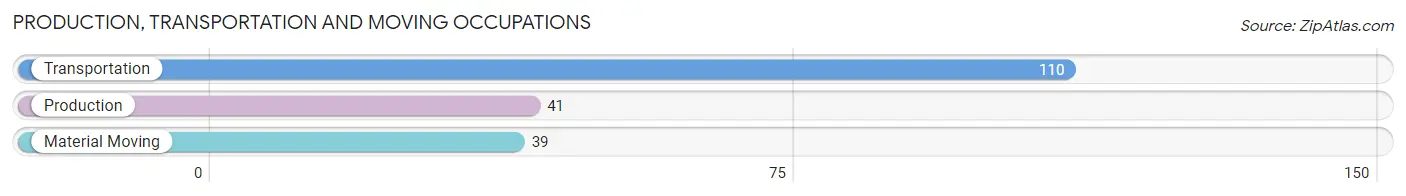
Production, Transportation and Moving Occupations
The most common Production, Transportation and Moving occupations in Belle Haven are Transportation (110 | 3.3%), Production (41 | 1.2%), and Material Moving (39 | 1.2%).
Production, Transportation and Moving Occupations by Sex
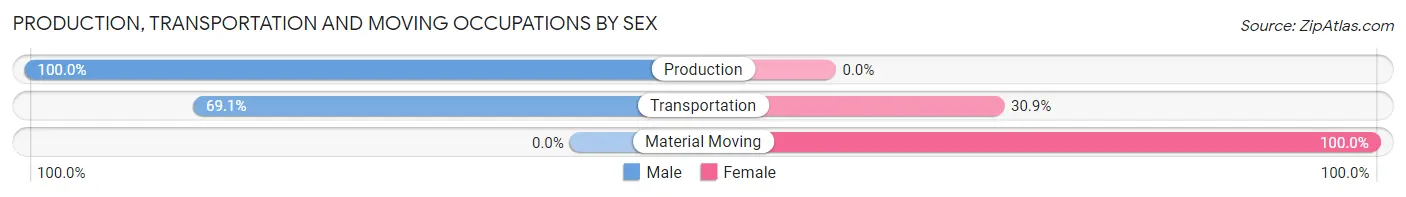
| Occupation | Male | Female |
| Production | 41 (100.0%) | 0 (0.0%) |
| Transportation | 76 (69.1%) | 34 (30.9%) |
| Material Moving | 0 (0.0%) | 39 (100.0%) |
| Total (Category) | 117 (61.6%) | 73 (38.4%) |
| Total (Overall) | 1,771 (53.2%) | 1,560 (46.8%) |
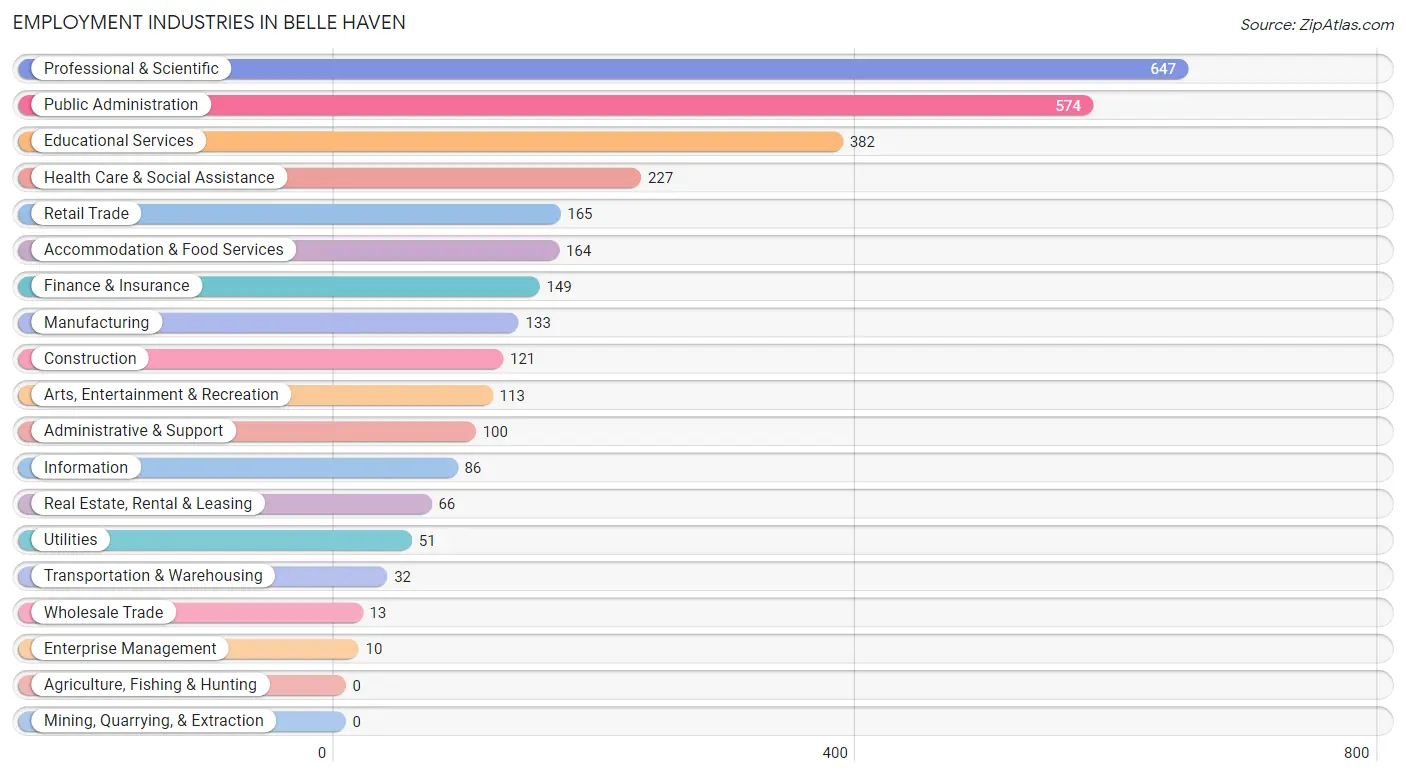
Employment Industries by Sex in Belle Haven
Employment Industries in Belle Haven
The major employment industries in Belle Haven include Professional & Scientific (647 | 19.4%), Public Administration (574 | 17.2%), Educational Services (382 | 11.5%), Health Care & Social Assistance (227 | 6.8%), and Retail Trade (165 | 5.0%).
Employment Industries by Sex in Belle Haven
The Belle Haven industries that see more men than women are Wholesale Trade (100.0%), Utilities (100.0%), and Enterprise Management (100.0%), whereas the industries that tend to have a higher number of women are Accommodation & Food Services (88.4%), Health Care & Social Assistance (77.5%), and Transportation & Warehousing (68.8%).
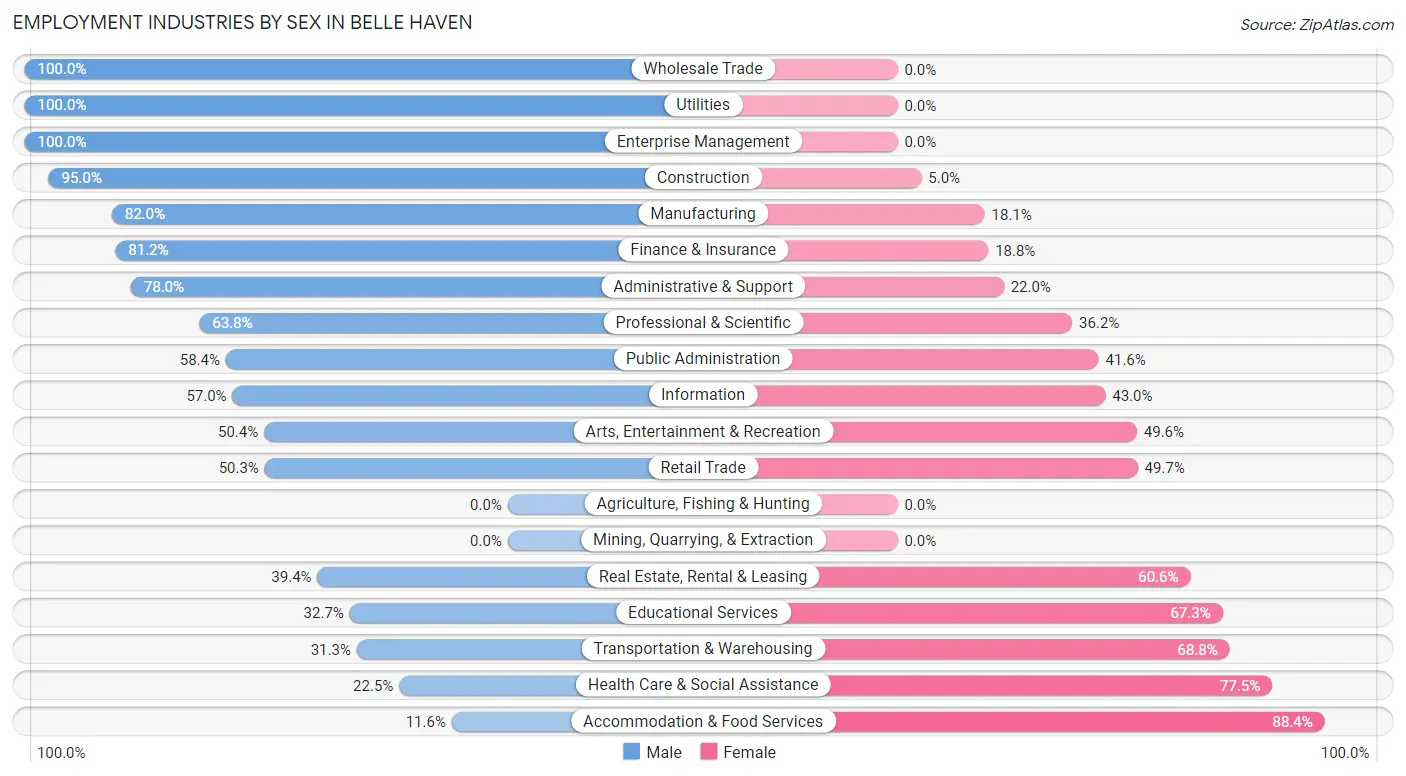
| Industry | Male | Female |
| Agriculture, Fishing & Hunting | 0 (0.0%) | 0 (0.0%) |
| Mining, Quarrying, & Extraction | 0 (0.0%) | 0 (0.0%) |
| Construction | 115 (95.0%) | 6 (5.0%) |
| Manufacturing | 109 (82.0%) | 24 (18.0%) |
| Wholesale Trade | 13 (100.0%) | 0 (0.0%) |
| Retail Trade | 83 (50.3%) | 82 (49.7%) |
| Transportation & Warehousing | 10 (31.2%) | 22 (68.8%) |
| Utilities | 51 (100.0%) | 0 (0.0%) |
| Information | 49 (57.0%) | 37 (43.0%) |
| Finance & Insurance | 121 (81.2%) | 28 (18.8%) |
| Real Estate, Rental & Leasing | 26 (39.4%) | 40 (60.6%) |
| Professional & Scientific | 413 (63.8%) | 234 (36.2%) |
| Enterprise Management | 10 (100.0%) | 0 (0.0%) |
| Administrative & Support | 78 (78.0%) | 22 (22.0%) |
| Educational Services | 125 (32.7%) | 257 (67.3%) |
| Health Care & Social Assistance | 51 (22.5%) | 176 (77.5%) |
| Arts, Entertainment & Recreation | 57 (50.4%) | 56 (49.6%) |
| Accommodation & Food Services | 19 (11.6%) | 145 (88.4%) |
| Public Administration | 335 (58.4%) | 239 (41.6%) |
| Total | 1,771 (53.2%) | 1,560 (46.8%) |
Education in Belle Haven
School Enrollment in Belle Haven
The most common levels of schooling among the 1,262 students in Belle Haven are elementary school (369 | 29.2%), middle school (214 | 17.0%), and college / undergraduate (187 | 14.8%).
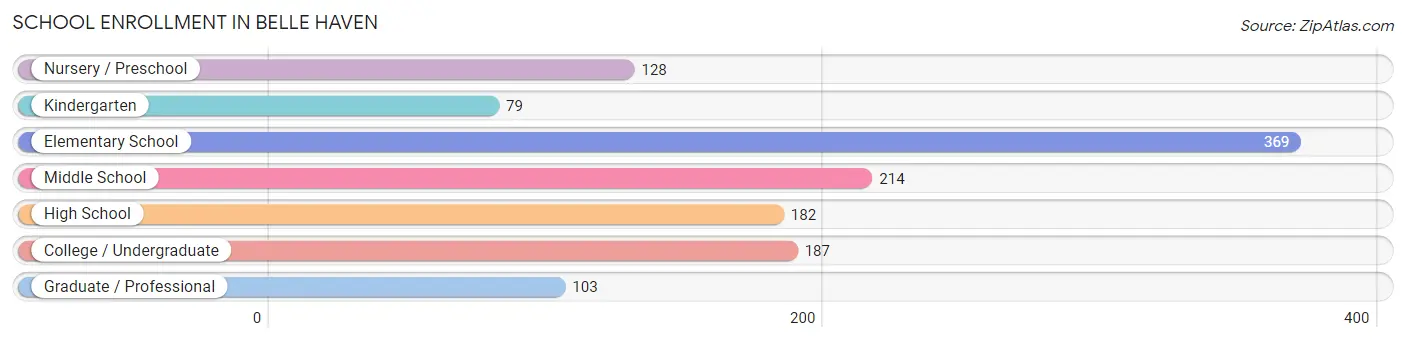
| School Level | # Students | % Students |
| Nursery / Preschool | 128 | 10.1% |
| Kindergarten | 79 | 6.3% |
| Elementary School | 369 | 29.2% |
| Middle School | 214 | 17.0% |
| High School | 182 | 14.4% |
| College / Undergraduate | 187 | 14.8% |
| Graduate / Professional | 103 | 8.2% |
| Total | 1,262 | 100.0% |
School Enrollment by Age by Funding Source in Belle Haven
Out of a total of 1,262 students who are enrolled in schools in Belle Haven, 521 (41.3%) attend a private institution, while the remaining 741 (58.7%) are enrolled in public schools. The age group of 18 to 19 year olds has the highest likelihood of being enrolled in private schools, with 25 (100.0% in the age bracket) enrolled. Conversely, the age group of 25 to 34 year olds has the lowest likelihood of being enrolled in a private school, with 78 (87.6% in the age bracket) attending a public institution.
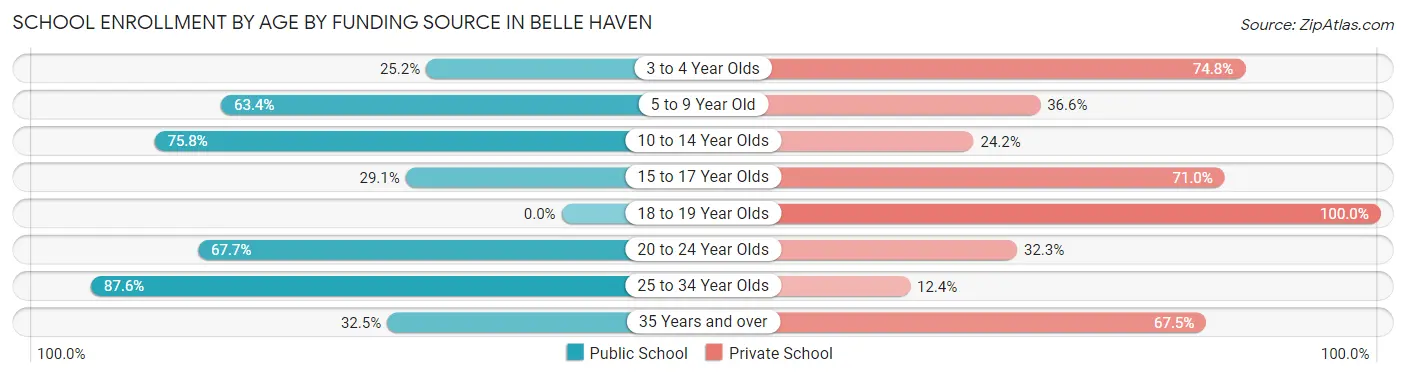
| Age Bracket | Public School | Private School |
| 3 to 4 Year Olds | 26 (25.2%) | 77 (74.8%) |
| 5 to 9 Year Old | 284 (63.4%) | 164 (36.6%) |
| 10 to 14 Year Olds | 188 (75.8%) | 60 (24.2%) |
| 15 to 17 Year Olds | 43 (29.0%) | 105 (71.0%) |
| 18 to 19 Year Olds | 0 (0.0%) | 25 (100.0%) |
| 20 to 24 Year Olds | 109 (67.7%) | 52 (32.3%) |
| 25 to 34 Year Olds | 78 (87.6%) | 11 (12.4%) |
| 35 Years and over | 13 (32.5%) | 27 (67.5%) |
| Total | 741 (58.7%) | 521 (41.3%) |
Educational Attainment by Field of Study in Belle Haven
Social sciences (560 | 15.6%), business (497 | 13.9%), liberal arts & history (381 | 10.6%), literature & languages (360 | 10.1%), and education (283 | 7.9%) are the most common fields of study among 3,582 individuals in Belle Haven who have obtained a bachelor's degree or higher.
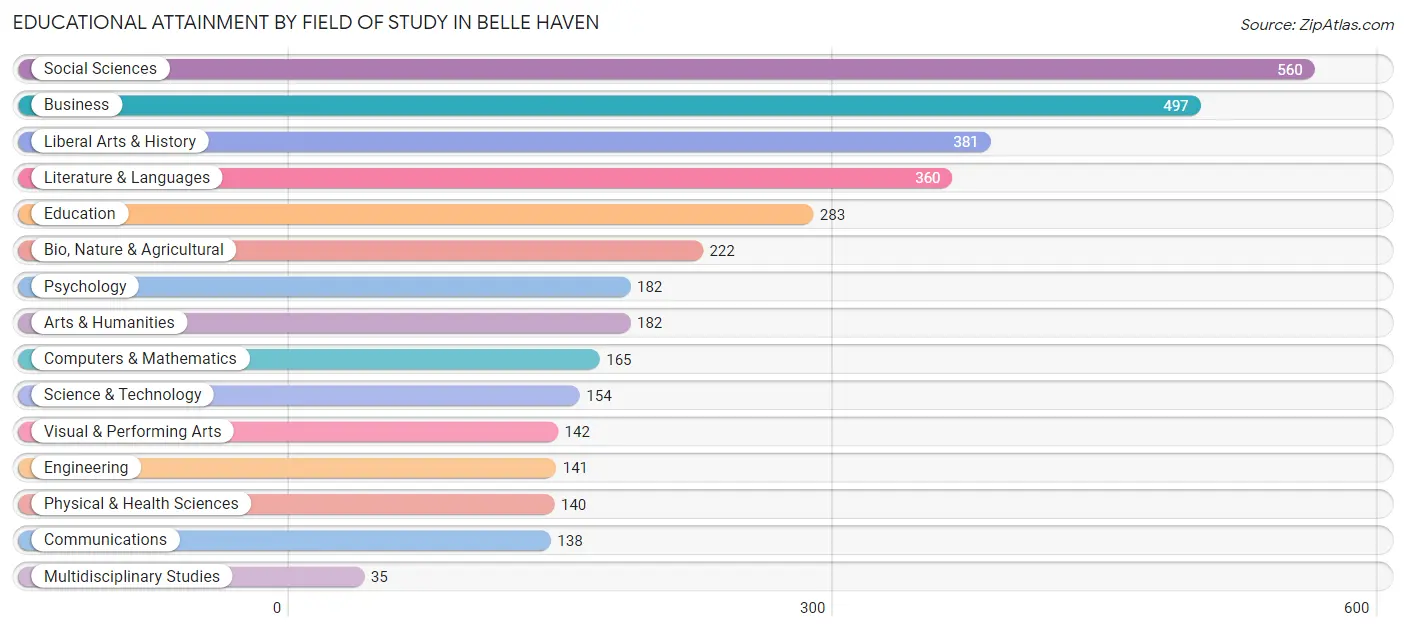
| Field of Study | # Graduates | % Graduates |
| Computers & Mathematics | 165 | 4.6% |
| Bio, Nature & Agricultural | 222 | 6.2% |
| Physical & Health Sciences | 140 | 3.9% |
| Psychology | 182 | 5.1% |
| Social Sciences | 560 | 15.6% |
| Engineering | 141 | 3.9% |
| Multidisciplinary Studies | 35 | 1.0% |
| Science & Technology | 154 | 4.3% |
| Business | 497 | 13.9% |
| Education | 283 | 7.9% |
| Literature & Languages | 360 | 10.1% |
| Liberal Arts & History | 381 | 10.6% |
| Visual & Performing Arts | 142 | 4.0% |
| Communications | 138 | 3.8% |
| Arts & Humanities | 182 | 5.1% |
| Total | 3,582 | 100.0% |
Transportation & Commute in Belle Haven
Vehicle Availability by Sex in Belle Haven
The most prevalent vehicle ownership categories in Belle Haven are males with 2 vehicles (833, accounting for 46.4%) and females with 2 vehicles (700, making up 52.7%).
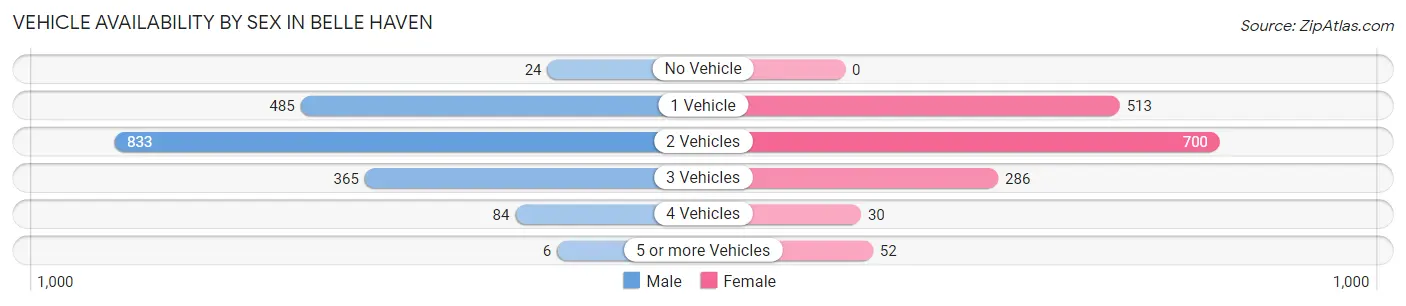
| Vehicles Available | Male | Female |
| No Vehicle | 24 (1.3%) | 0 (0.0%) |
| 1 Vehicle | 485 (27.0%) | 513 (32.5%) |
| 2 Vehicles | 833 (46.4%) | 700 (44.3%) |
| 3 Vehicles | 365 (20.3%) | 286 (18.1%) |
| 4 Vehicles | 84 (4.7%) | 30 (1.9%) |
| 5 or more Vehicles | 6 (0.3%) | 52 (3.3%) |
| Total | 1,797 (100.0%) | 1,581 (100.0%) |
Commute Time in Belle Haven
The most frequently occuring commute durations in Belle Haven are 45 to 59 minutes (445 commuters, 16.2%), 30 to 34 minutes (439 commuters, 15.9%), and 10 to 14 minutes (292 commuters, 10.6%).
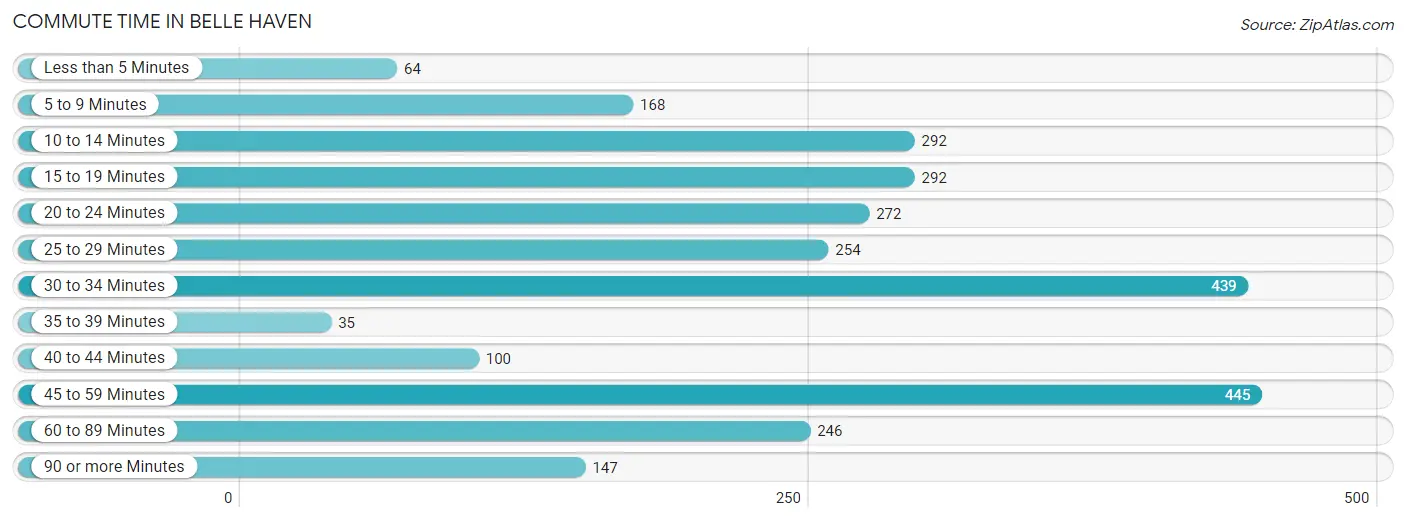
| Commute Time | # Commuters | % Commuters |
| Less than 5 Minutes | 64 | 2.3% |
| 5 to 9 Minutes | 168 | 6.1% |
| 10 to 14 Minutes | 292 | 10.6% |
| 15 to 19 Minutes | 292 | 10.6% |
| 20 to 24 Minutes | 272 | 9.9% |
| 25 to 29 Minutes | 254 | 9.2% |
| 30 to 34 Minutes | 439 | 15.9% |
| 35 to 39 Minutes | 35 | 1.3% |
| 40 to 44 Minutes | 100 | 3.6% |
| 45 to 59 Minutes | 445 | 16.2% |
| 60 to 89 Minutes | 246 | 8.9% |
| 90 or more Minutes | 147 | 5.3% |
Commute Time by Sex in Belle Haven
The most common commute times in Belle Haven are 30 to 34 minutes (308 commuters, 21.1%) for males and 10 to 14 minutes (196 commuters, 15.1%) for females.
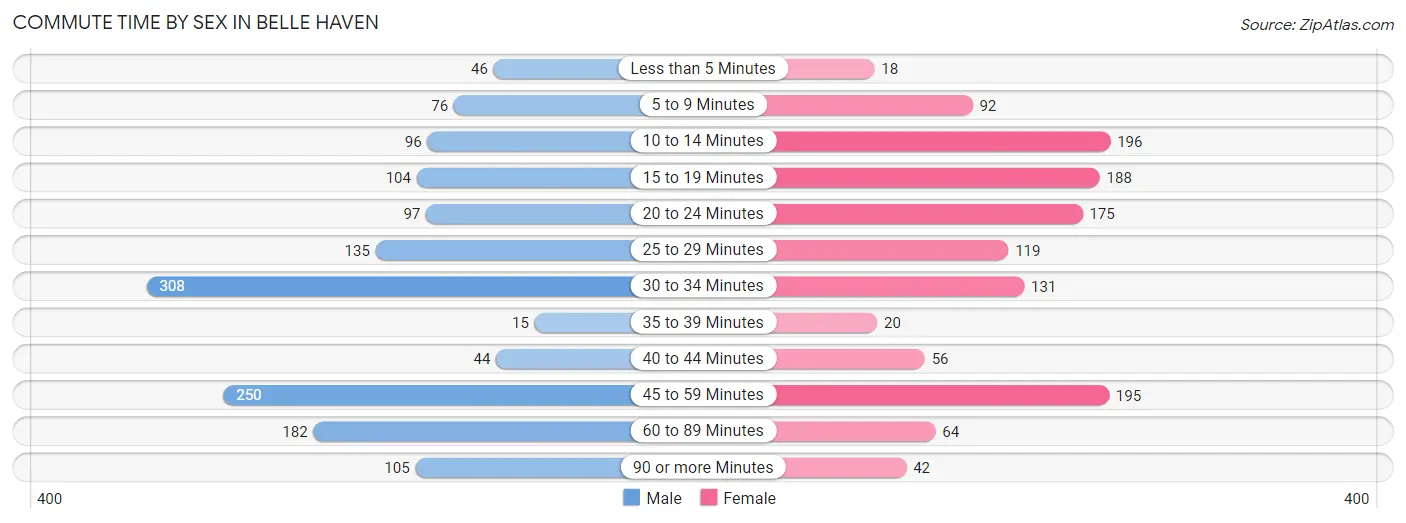
| Commute Time | Male | Female |
| Less than 5 Minutes | 46 (3.2%) | 18 (1.4%) |
| 5 to 9 Minutes | 76 (5.2%) | 92 (7.1%) |
| 10 to 14 Minutes | 96 (6.6%) | 196 (15.1%) |
| 15 to 19 Minutes | 104 (7.1%) | 188 (14.5%) |
| 20 to 24 Minutes | 97 (6.7%) | 175 (13.5%) |
| 25 to 29 Minutes | 135 (9.3%) | 119 (9.2%) |
| 30 to 34 Minutes | 308 (21.1%) | 131 (10.1%) |
| 35 to 39 Minutes | 15 (1.0%) | 20 (1.5%) |
| 40 to 44 Minutes | 44 (3.0%) | 56 (4.3%) |
| 45 to 59 Minutes | 250 (17.2%) | 195 (15.0%) |
| 60 to 89 Minutes | 182 (12.5%) | 64 (4.9%) |
| 90 or more Minutes | 105 (7.2%) | 42 (3.2%) |
Time of Departure to Work by Sex in Belle Haven
The most frequent times of departure to work in Belle Haven are 7:00 AM to 7:29 AM (254, 17.4%) for males and 7:30 AM to 7:59 AM (258, 19.9%) for females.
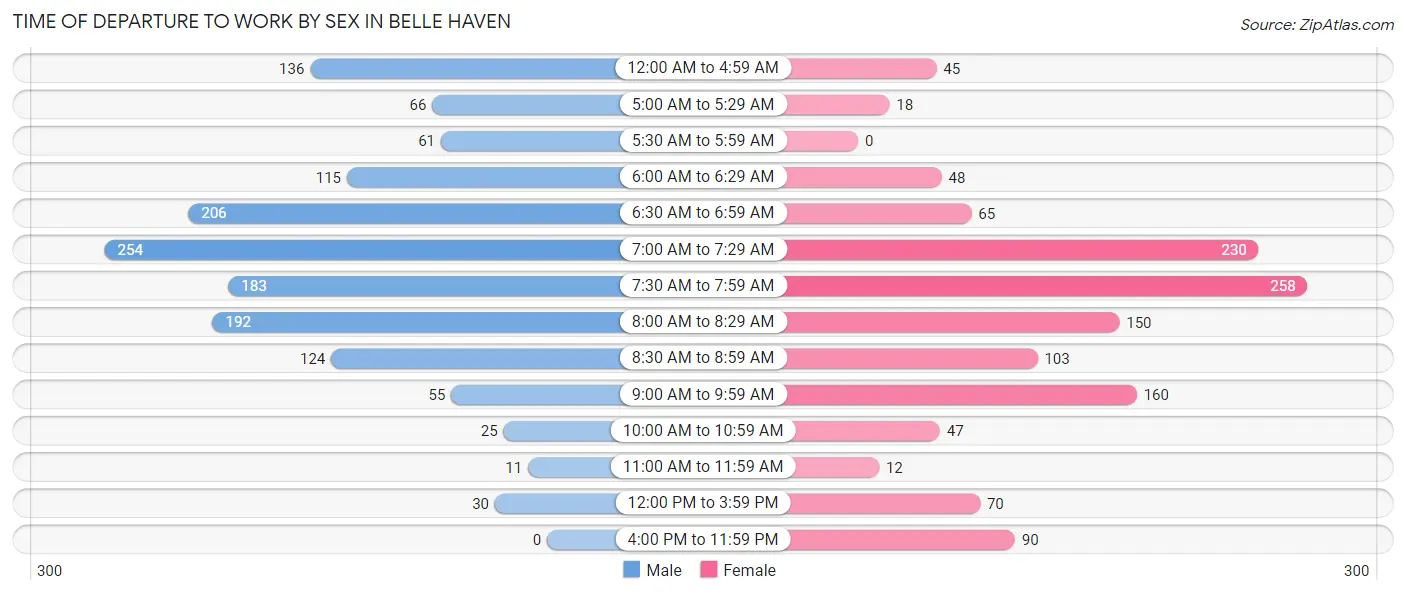
| Time of Departure | Male | Female |
| 12:00 AM to 4:59 AM | 136 (9.3%) | 45 (3.5%) |
| 5:00 AM to 5:29 AM | 66 (4.5%) | 18 (1.4%) |
| 5:30 AM to 5:59 AM | 61 (4.2%) | 0 (0.0%) |
| 6:00 AM to 6:29 AM | 115 (7.9%) | 48 (3.7%) |
| 6:30 AM to 6:59 AM | 206 (14.1%) | 65 (5.0%) |
| 7:00 AM to 7:29 AM | 254 (17.4%) | 230 (17.7%) |
| 7:30 AM to 7:59 AM | 183 (12.6%) | 258 (19.9%) |
| 8:00 AM to 8:29 AM | 192 (13.2%) | 150 (11.6%) |
| 8:30 AM to 8:59 AM | 124 (8.5%) | 103 (8.0%) |
| 9:00 AM to 9:59 AM | 55 (3.8%) | 160 (12.3%) |
| 10:00 AM to 10:59 AM | 25 (1.7%) | 47 (3.6%) |
| 11:00 AM to 11:59 AM | 11 (0.7%) | 12 (0.9%) |
| 12:00 PM to 3:59 PM | 30 (2.1%) | 70 (5.4%) |
| 4:00 PM to 11:59 PM | 0 (0.0%) | 90 (6.9%) |
| Total | 1,458 (100.0%) | 1,296 (100.0%) |
Housing Occupancy in Belle Haven
Occupancy by Ownership in Belle Haven
Of the total 2,747 dwellings in Belle Haven, owner-occupied units account for 2,147 (78.2%), while renter-occupied units make up 600 (21.8%).
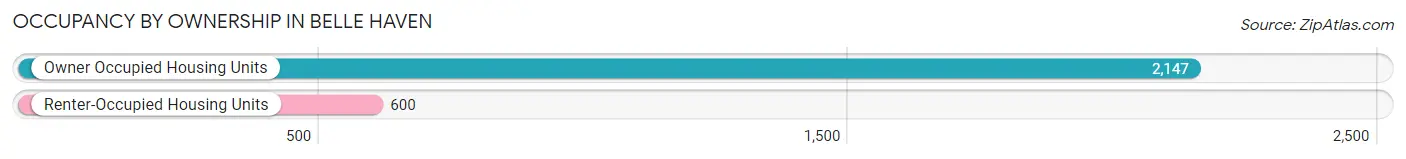
| Occupancy | # Housing Units | % Housing Units |
| Owner Occupied Housing Units | 2,147 | 78.2% |
| Renter-Occupied Housing Units | 600 | 21.8% |
| Total Occupied Housing Units | 2,747 | 100.0% |
Occupancy by Household Size in Belle Haven
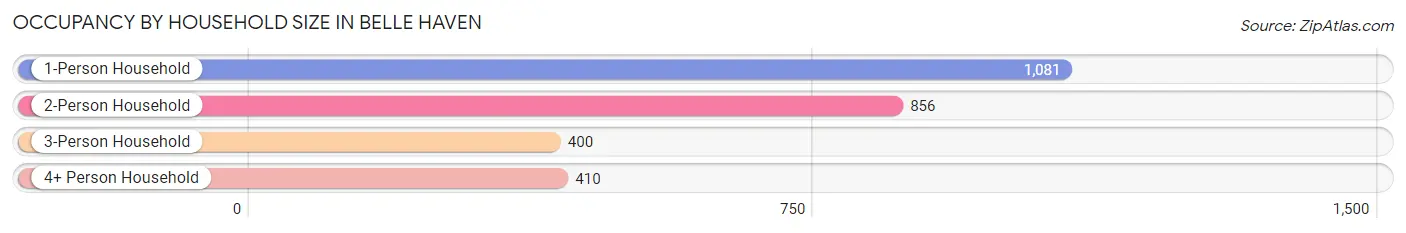
| Household Size | # Housing Units | % Housing Units |
| 1-Person Household | 1,081 | 39.4% |
| 2-Person Household | 856 | 31.2% |
| 3-Person Household | 400 | 14.6% |
| 4+ Person Household | 410 | 14.9% |
| Total Housing Units | 2,747 | 100.0% |
Occupancy by Ownership by Household Size in Belle Haven
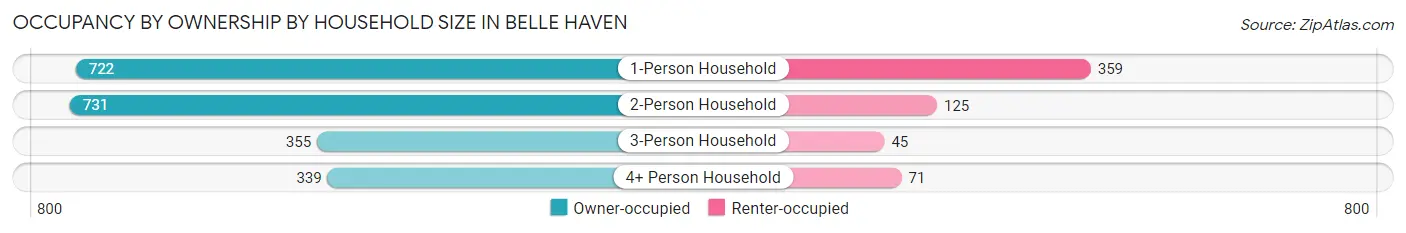
| Household Size | Owner-occupied | Renter-occupied |
| 1-Person Household | 722 (66.8%) | 359 (33.2%) |
| 2-Person Household | 731 (85.4%) | 125 (14.6%) |
| 3-Person Household | 355 (88.7%) | 45 (11.3%) |
| 4+ Person Household | 339 (82.7%) | 71 (17.3%) |
| Total Housing Units | 2,147 (78.2%) | 600 (21.8%) |
Occupancy by Educational Attainment in Belle Haven
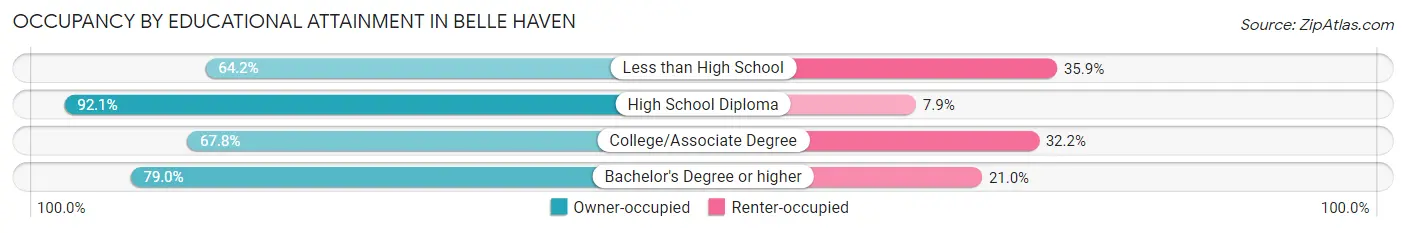
| Household Size | Owner-occupied | Renter-occupied |
| Less than High School | 34 (64.1%) | 19 (35.8%) |
| High School Diploma | 222 (92.1%) | 19 (7.9%) |
| College/Associate Degree | 286 (67.8%) | 136 (32.2%) |
| Bachelor's Degree or higher | 1,605 (79.0%) | 426 (21.0%) |
Occupancy by Age of Householder in Belle Haven
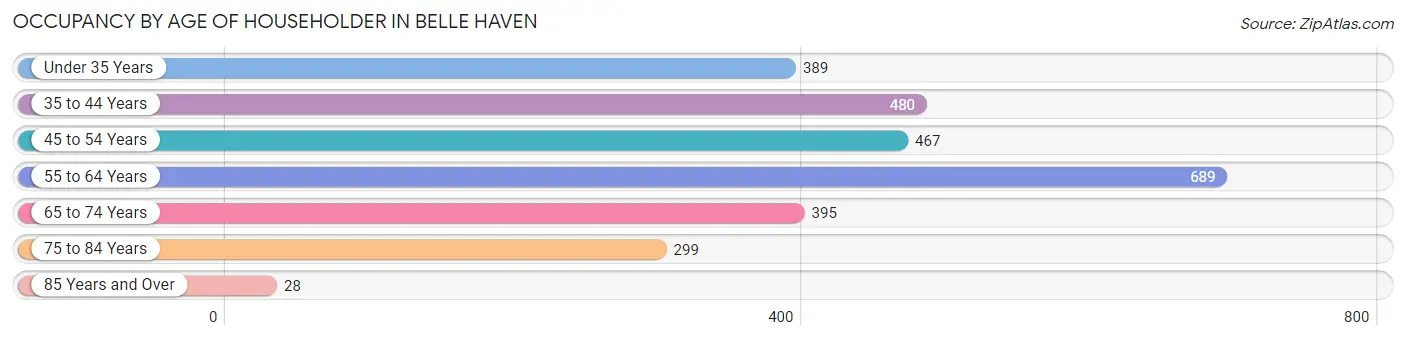
| Age Bracket | # Households | % Households |
| Under 35 Years | 389 | 14.2% |
| 35 to 44 Years | 480 | 17.5% |
| 45 to 54 Years | 467 | 17.0% |
| 55 to 64 Years | 689 | 25.1% |
| 65 to 74 Years | 395 | 14.4% |
| 75 to 84 Years | 299 | 10.9% |
| 85 Years and Over | 28 | 1.0% |
| Total | 2,747 | 100.0% |
Housing Finances in Belle Haven
Median Income by Occupancy in Belle Haven
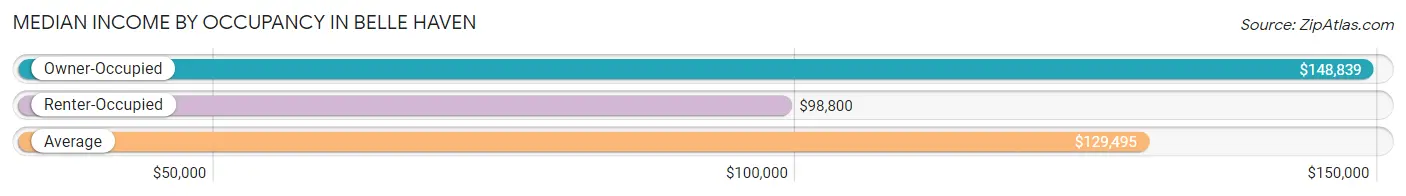
| Occupancy Type | # Households | Median Income |
| Owner-Occupied | 2,147 (78.2%) | $148,839 |
| Renter-Occupied | 600 (21.8%) | $98,800 |
| Average | 2,747 (100.0%) | $129,495 |
Occupancy by Householder Income Bracket in Belle Haven
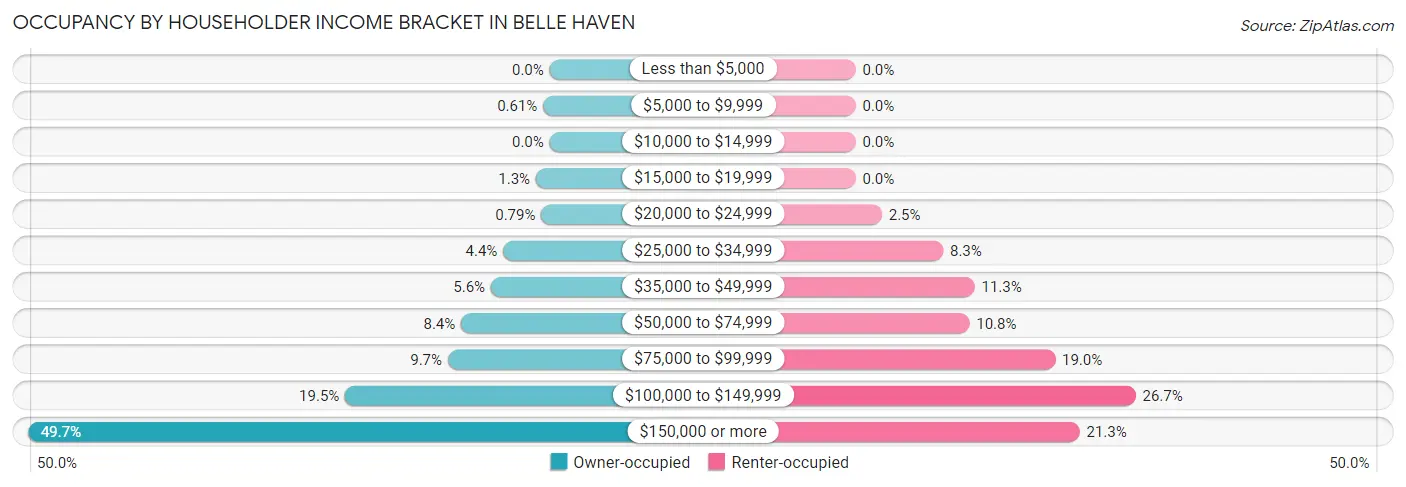
| Income Bracket | Owner-occupied | Renter-occupied |
| Less than $5,000 | 0 (0.0%) | 0 (0.0%) |
| $5,000 to $9,999 | 13 (0.6%) | 0 (0.0%) |
| $10,000 to $14,999 | 0 (0.0%) | 0 (0.0%) |
| $15,000 to $19,999 | 28 (1.3%) | 0 (0.0%) |
| $20,000 to $24,999 | 17 (0.8%) | 15 (2.5%) |
| $25,000 to $34,999 | 95 (4.4%) | 50 (8.3%) |
| $35,000 to $49,999 | 120 (5.6%) | 68 (11.3%) |
| $50,000 to $74,999 | 181 (8.4%) | 65 (10.8%) |
| $75,000 to $99,999 | 208 (9.7%) | 114 (19.0%) |
| $100,000 to $149,999 | 418 (19.5%) | 160 (26.7%) |
| $150,000 or more | 1,067 (49.7%) | 128 (21.3%) |
| Total | 2,147 (100.0%) | 600 (100.0%) |
Monthly Housing Cost Tiers in Belle Haven
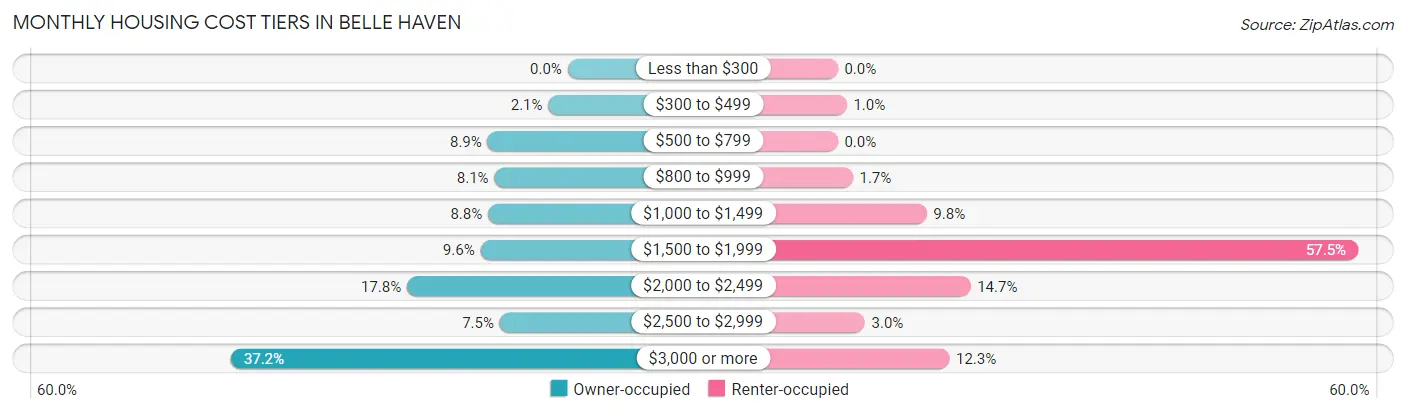
| Monthly Cost | Owner-occupied | Renter-occupied |
| Less than $300 | 0 (0.0%) | 0 (0.0%) |
| $300 to $499 | 46 (2.1%) | 6 (1.0%) |
| $500 to $799 | 190 (8.8%) | 0 (0.0%) |
| $800 to $999 | 174 (8.1%) | 10 (1.7%) |
| $1,000 to $1,499 | 189 (8.8%) | 59 (9.8%) |
| $1,500 to $1,999 | 207 (9.6%) | 345 (57.5%) |
| $2,000 to $2,499 | 381 (17.7%) | 88 (14.7%) |
| $2,500 to $2,999 | 161 (7.5%) | 18 (3.0%) |
| $3,000 or more | 799 (37.2%) | 74 (12.3%) |
| Total | 2,147 (100.0%) | 600 (100.0%) |
Physical Housing Characteristics in Belle Haven
Housing Structures in Belle Haven
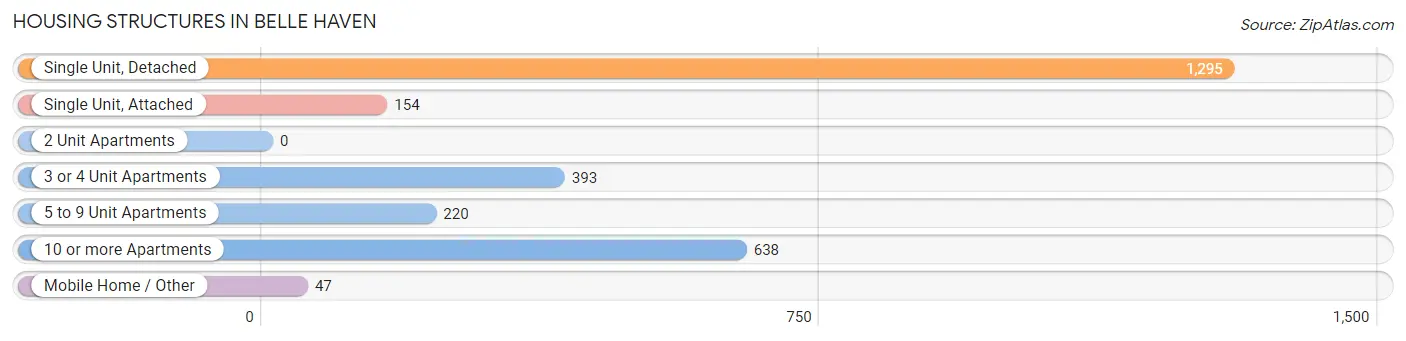
| Structure Type | # Housing Units | % Housing Units |
| Single Unit, Detached | 1,295 | 47.1% |
| Single Unit, Attached | 154 | 5.6% |
| 2 Unit Apartments | 0 | 0.0% |
| 3 or 4 Unit Apartments | 393 | 14.3% |
| 5 to 9 Unit Apartments | 220 | 8.0% |
| 10 or more Apartments | 638 | 23.2% |
| Mobile Home / Other | 47 | 1.7% |
| Total | 2,747 | 100.0% |
Housing Structures by Occupancy in Belle Haven
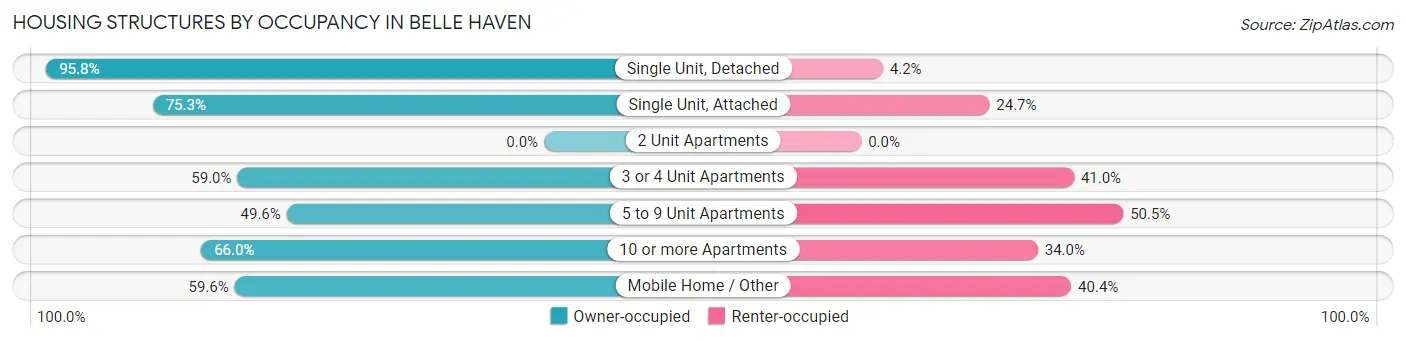
| Structure Type | Owner-occupied | Renter-occupied |
| Single Unit, Detached | 1,241 (95.8%) | 54 (4.2%) |
| Single Unit, Attached | 116 (75.3%) | 38 (24.7%) |
| 2 Unit Apartments | 0 (0.0%) | 0 (0.0%) |
| 3 or 4 Unit Apartments | 232 (59.0%) | 161 (41.0%) |
| 5 to 9 Unit Apartments | 109 (49.5%) | 111 (50.4%) |
| 10 or more Apartments | 421 (66.0%) | 217 (34.0%) |
| Mobile Home / Other | 28 (59.6%) | 19 (40.4%) |
| Total | 2,147 (78.2%) | 600 (21.8%) |
Housing Structures by Number of Rooms in Belle Haven
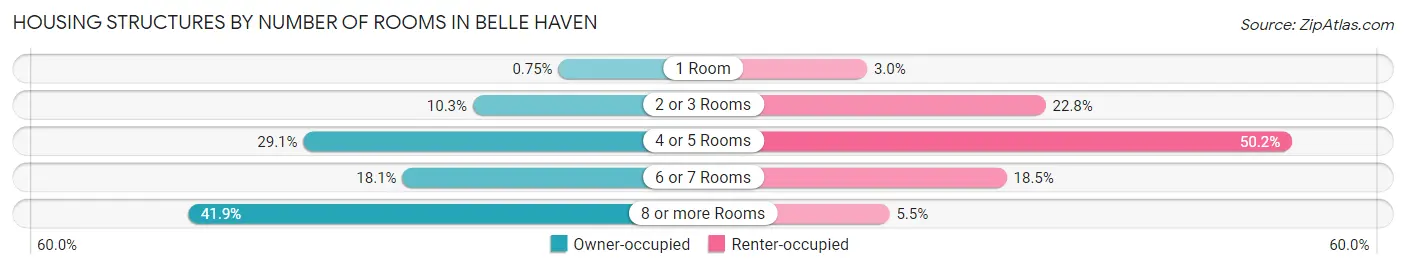
| Number of Rooms | Owner-occupied | Renter-occupied |
| 1 Room | 16 (0.7%) | 18 (3.0%) |
| 2 or 3 Rooms | 220 (10.2%) | 137 (22.8%) |
| 4 or 5 Rooms | 624 (29.1%) | 301 (50.2%) |
| 6 or 7 Rooms | 388 (18.1%) | 111 (18.5%) |
| 8 or more Rooms | 899 (41.9%) | 33 (5.5%) |
| Total | 2,147 (100.0%) | 600 (100.0%) |
Housing Structure by Heating Type in Belle Haven
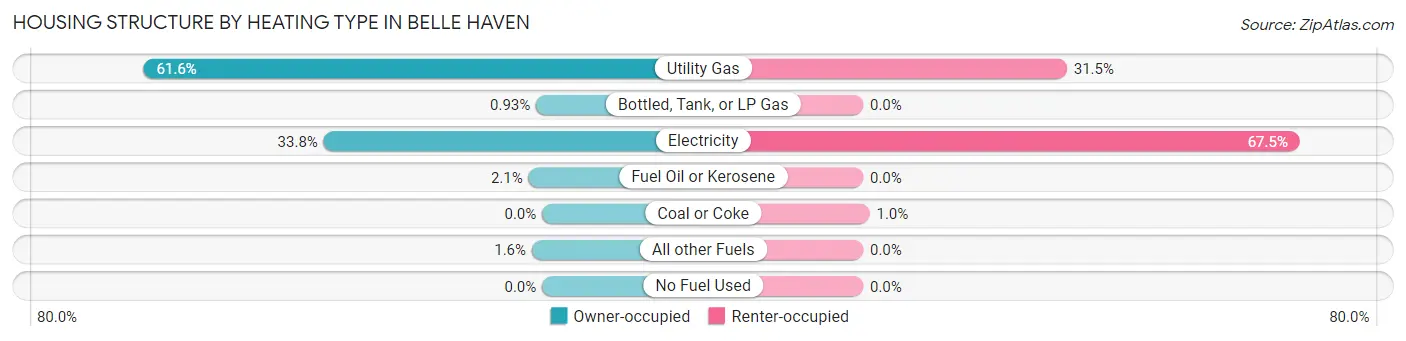
| Heating Type | Owner-occupied | Renter-occupied |
| Utility Gas | 1,323 (61.6%) | 189 (31.5%) |
| Bottled, Tank, or LP Gas | 20 (0.9%) | 0 (0.0%) |
| Electricity | 725 (33.8%) | 405 (67.5%) |
| Fuel Oil or Kerosene | 45 (2.1%) | 0 (0.0%) |
| Coal or Coke | 0 (0.0%) | 6 (1.0%) |
| All other Fuels | 34 (1.6%) | 0 (0.0%) |
| No Fuel Used | 0 (0.0%) | 0 (0.0%) |
| Total | 2,147 (100.0%) | 600 (100.0%) |
Household Vehicle Usage in Belle Haven
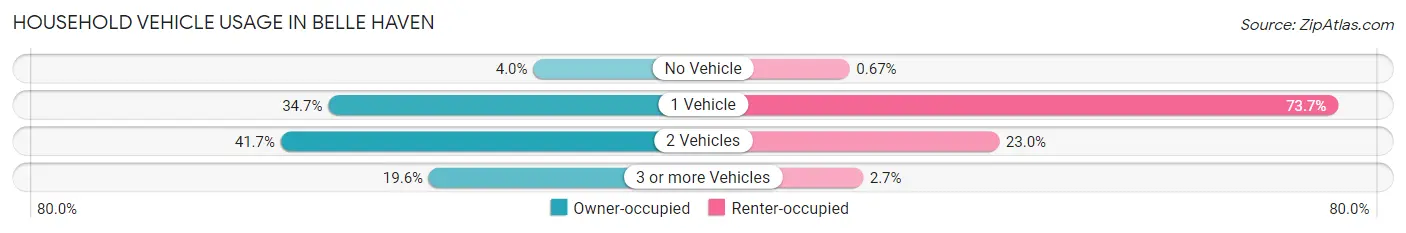
| Vehicles per Household | Owner-occupied | Renter-occupied |
| No Vehicle | 86 (4.0%) | 4 (0.7%) |
| 1 Vehicle | 744 (34.6%) | 442 (73.7%) |
| 2 Vehicles | 896 (41.7%) | 138 (23.0%) |
| 3 or more Vehicles | 421 (19.6%) | 16 (2.7%) |
| Total | 2,147 (100.0%) | 600 (100.0%) |
Real Estate & Mortgages in Belle Haven
Real Estate and Mortgage Overview in Belle Haven
| Characteristic | Without Mortgage | With Mortgage |
| Housing Units | 512 | 1,635 |
| Median Property Value | $339,300 | $682,400 |
| Median Household Income | $106,765 | $930 |
| Monthly Housing Costs | $848 | $791 |
| Real Estate Taxes | $3,827 | $49 |
Property Value by Mortgage Status in Belle Haven
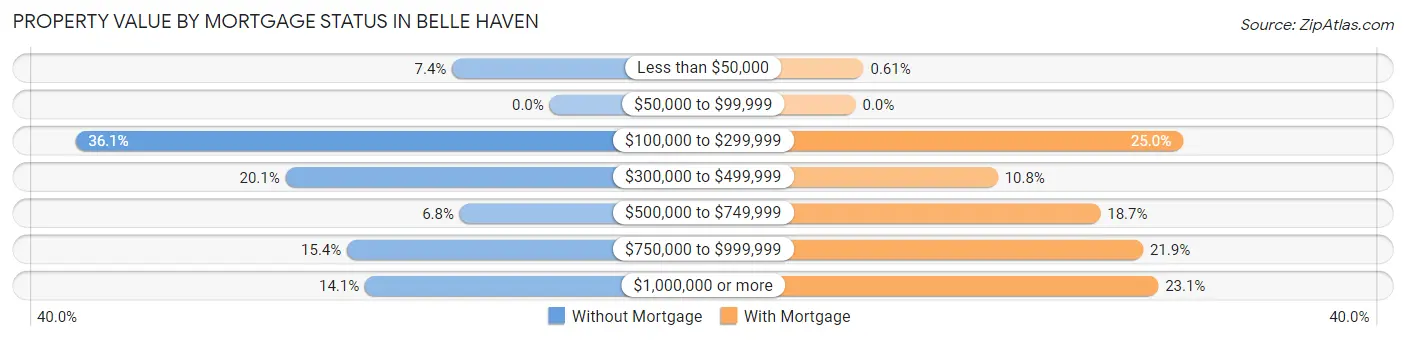
| Property Value | Without Mortgage | With Mortgage |
| Less than $50,000 | 38 (7.4%) | 10 (0.6%) |
| $50,000 to $99,999 | 0 (0.0%) | 0 (0.0%) |
| $100,000 to $299,999 | 185 (36.1%) | 408 (24.9%) |
| $300,000 to $499,999 | 103 (20.1%) | 177 (10.8%) |
| $500,000 to $749,999 | 35 (6.8%) | 305 (18.6%) |
| $750,000 to $999,999 | 79 (15.4%) | 358 (21.9%) |
| $1,000,000 or more | 72 (14.1%) | 377 (23.1%) |
| Total | 512 (100.0%) | 1,635 (100.0%) |
Household Income by Mortgage Status in Belle Haven
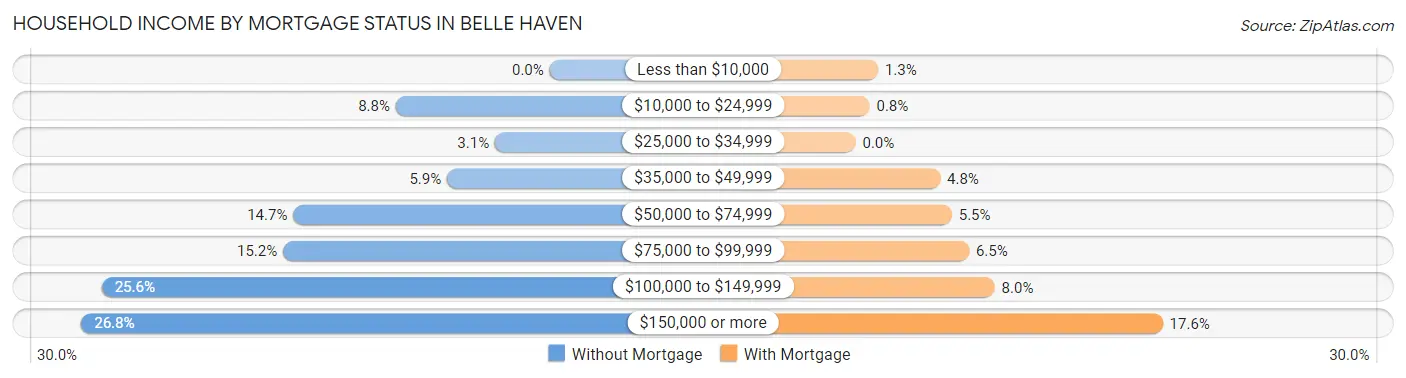
| Household Income | Without Mortgage | With Mortgage |
| Less than $10,000 | 0 (0.0%) | 21 (1.3%) |
| $10,000 to $24,999 | 45 (8.8%) | 13 (0.8%) |
| $25,000 to $34,999 | 16 (3.1%) | 0 (0.0%) |
| $35,000 to $49,999 | 30 (5.9%) | 79 (4.8%) |
| $50,000 to $74,999 | 75 (14.6%) | 90 (5.5%) |
| $75,000 to $99,999 | 78 (15.2%) | 106 (6.5%) |
| $100,000 to $149,999 | 131 (25.6%) | 130 (8.0%) |
| $150,000 or more | 137 (26.8%) | 287 (17.5%) |
| Total | 512 (100.0%) | 1,635 (100.0%) |
Property Value to Household Income Ratio in Belle Haven
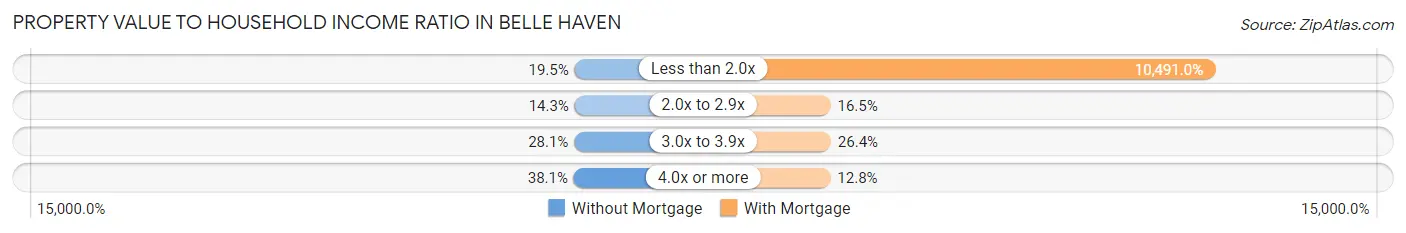
| Value-to-Income Ratio | Without Mortgage | With Mortgage |
| Less than 2.0x | 100 (19.5%) | 171,528 (10,491.0%) |
| 2.0x to 2.9x | 73 (14.3%) | 270 (16.5%) |
| 3.0x to 3.9x | 144 (28.1%) | 432 (26.4%) |
| 4.0x or more | 195 (38.1%) | 209 (12.8%) |
| Total | 512 (100.0%) | 1,635 (100.0%) |
Real Estate Taxes by Mortgage Status in Belle Haven
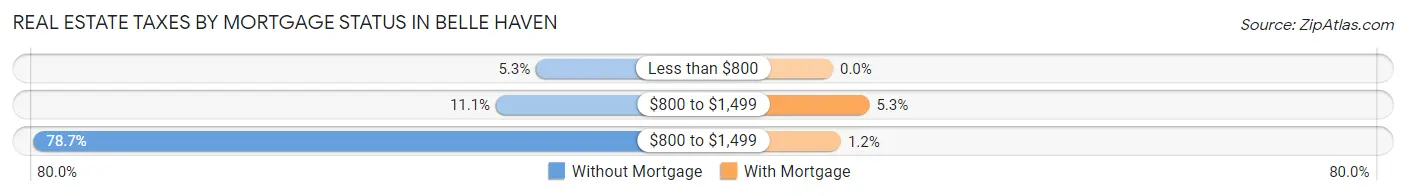
| Property Taxes | Without Mortgage | With Mortgage |
| Less than $800 | 27 (5.3%) | 0 (0.0%) |
| $800 to $1,499 | 57 (11.1%) | 87 (5.3%) |
| $800 to $1,499 | 403 (78.7%) | 19 (1.2%) |
| Total | 512 (100.0%) | 1,635 (100.0%) |
Health & Disability in Belle Haven
Health Insurance Coverage by Age in Belle Haven
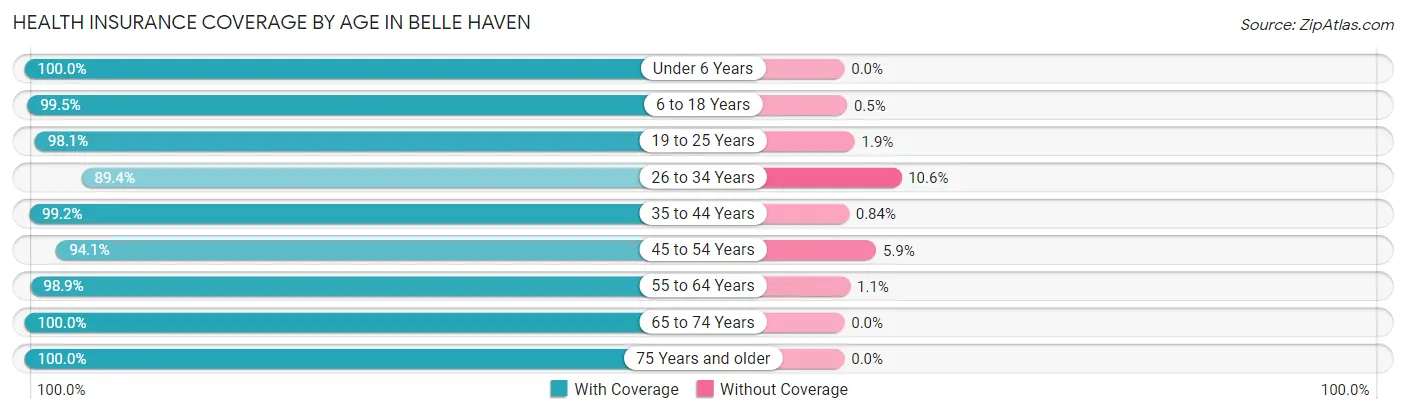
| Age Bracket | With Coverage | Without Coverage |
| Under 6 Years | 771 (100.0%) | 0 (0.0%) |
| 6 to 18 Years | 790 (99.5%) | 4 (0.5%) |
| 19 to 25 Years | 357 (98.1%) | 7 (1.9%) |
| 26 to 34 Years | 581 (89.4%) | 69 (10.6%) |
| 35 to 44 Years | 827 (99.2%) | 7 (0.8%) |
| 45 to 54 Years | 683 (94.1%) | 43 (5.9%) |
| 55 to 64 Years | 1,103 (98.9%) | 12 (1.1%) |
| 65 to 74 Years | 580 (100.0%) | 0 (0.0%) |
| 75 Years and older | 443 (100.0%) | 0 (0.0%) |
| Total | 6,135 (97.7%) | 142 (2.3%) |
Health Insurance Coverage by Citizenship Status in Belle Haven
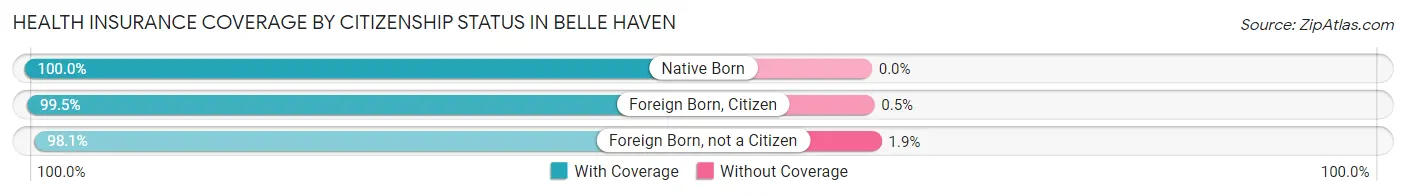
| Citizenship Status | With Coverage | Without Coverage |
| Native Born | 771 (100.0%) | 0 (0.0%) |
| Foreign Born, Citizen | 790 (99.5%) | 4 (0.5%) |
| Foreign Born, not a Citizen | 357 (98.1%) | 7 (1.9%) |
Health Insurance Coverage by Household Income in Belle Haven
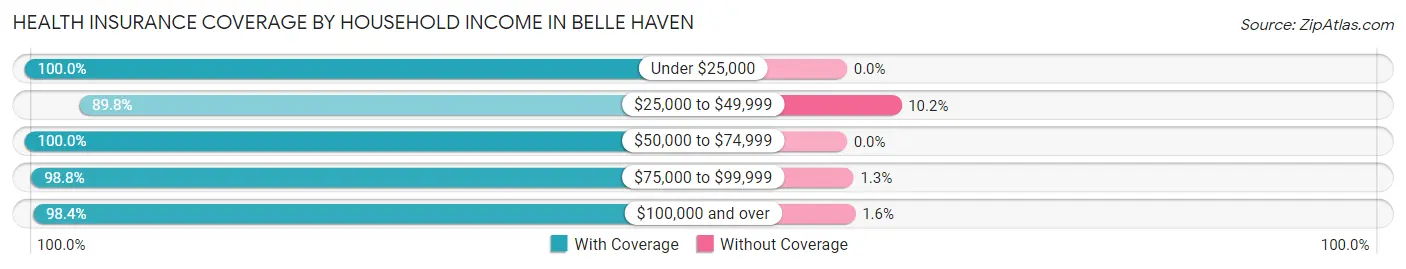
| Household Income | With Coverage | Without Coverage |
| Under $25,000 | 73 (100.0%) | 0 (0.0%) |
| $25,000 to $49,999 | 537 (89.8%) | 61 (10.2%) |
| $50,000 to $74,999 | 338 (100.0%) | 0 (0.0%) |
| $75,000 to $99,999 | 555 (98.8%) | 7 (1.3%) |
| $100,000 and over | 4,605 (98.4%) | 74 (1.6%) |
Public vs Private Health Insurance Coverage by Age in Belle Haven
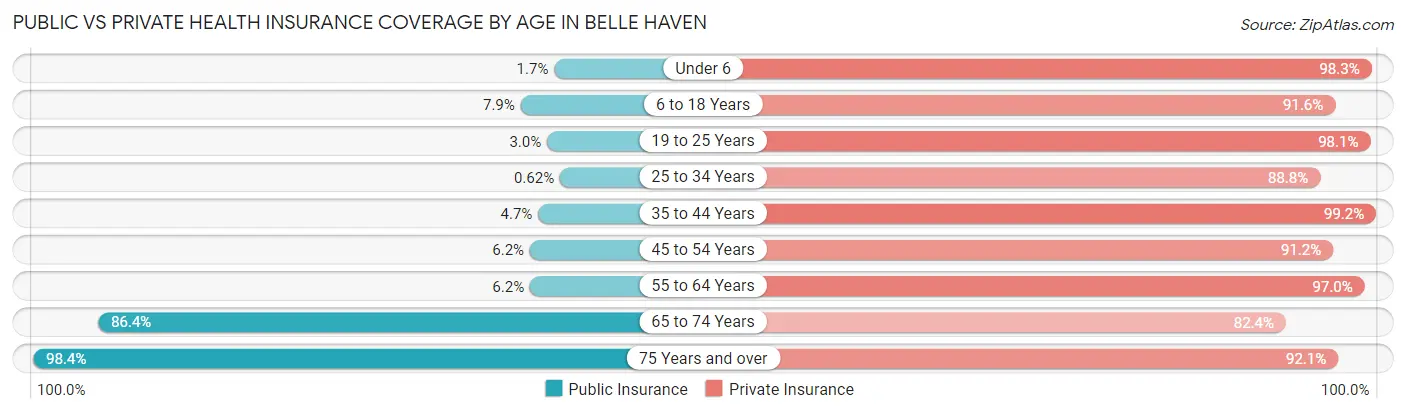
| Age Bracket | Public Insurance | Private Insurance |
| Under 6 | 13 (1.7%) | 758 (98.3%) |
| 6 to 18 Years | 63 (7.9%) | 727 (91.6%) |
| 19 to 25 Years | 11 (3.0%) | 357 (98.1%) |
| 25 to 34 Years | 4 (0.6%) | 577 (88.8%) |
| 35 to 44 Years | 39 (4.7%) | 827 (99.2%) |
| 45 to 54 Years | 45 (6.2%) | 662 (91.2%) |
| 55 to 64 Years | 69 (6.2%) | 1,082 (97.0%) |
| 65 to 74 Years | 501 (86.4%) | 478 (82.4%) |
| 75 Years and over | 436 (98.4%) | 408 (92.1%) |
| Total | 1,181 (18.8%) | 5,876 (93.6%) |
Disability Status by Sex by Age in Belle Haven
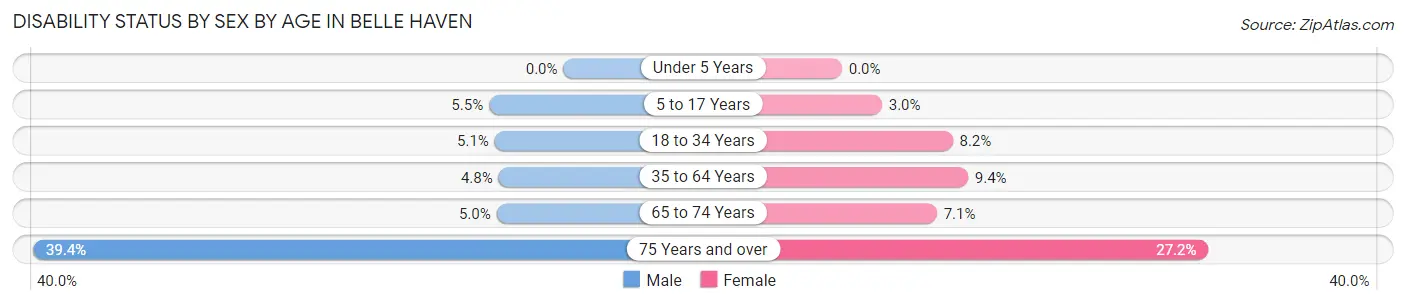
| Age Bracket | Male | Female |
| Under 5 Years | 0 (0.0%) | 0 (0.0%) |
| 5 to 17 Years | 28 (5.5%) | 10 (3.0%) |
| 18 to 34 Years | 25 (5.1%) | 44 (8.2%) |
| 35 to 64 Years | 66 (4.8%) | 122 (9.4%) |
| 65 to 74 Years | 14 (5.0%) | 21 (7.0%) |
| 75 Years and over | 63 (39.4%) | 77 (27.2%) |
Disability Class by Sex by Age in Belle Haven
Disability Class: Hearing Difficulty
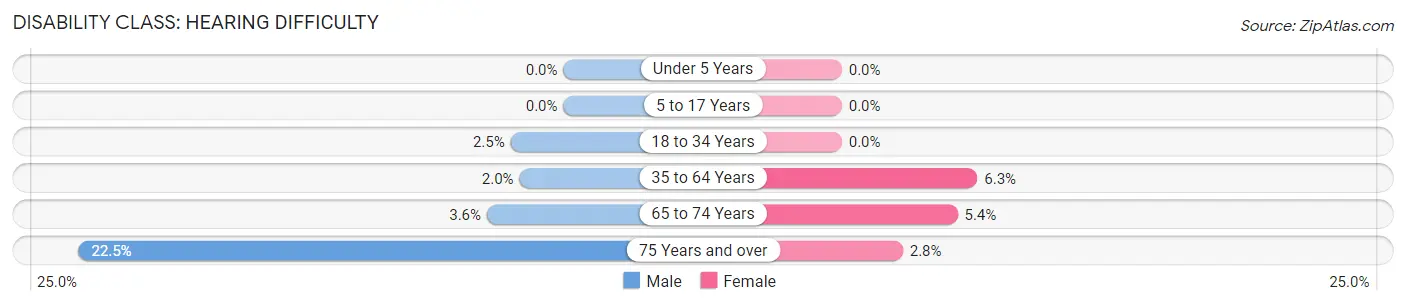
| Age Bracket | Male | Female |
| Under 5 Years | 0 (0.0%) | 0 (0.0%) |
| 5 to 17 Years | 0 (0.0%) | 0 (0.0%) |
| 18 to 34 Years | 12 (2.5%) | 0 (0.0%) |
| 35 to 64 Years | 28 (2.0%) | 82 (6.3%) |
| 65 to 74 Years | 10 (3.5%) | 16 (5.4%) |
| 75 Years and over | 36 (22.5%) | 8 (2.8%) |
Disability Class: Vision Difficulty
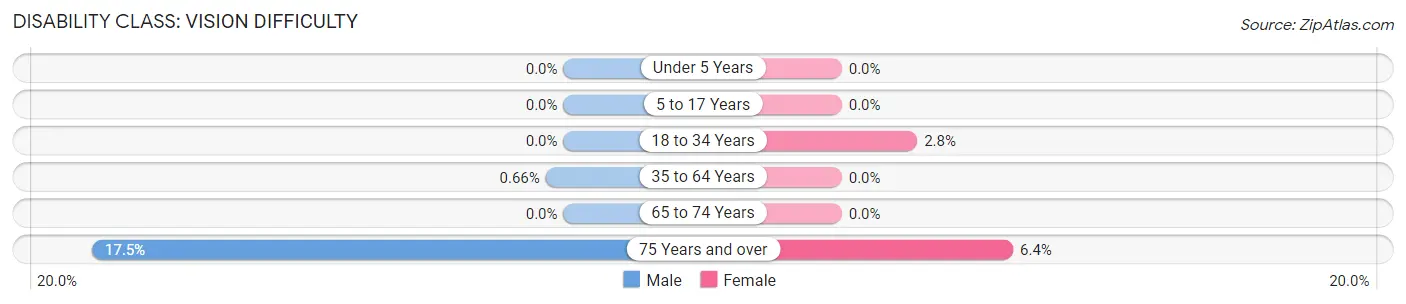
| Age Bracket | Male | Female |
| Under 5 Years | 0 (0.0%) | 0 (0.0%) |
| 5 to 17 Years | 0 (0.0%) | 0 (0.0%) |
| 18 to 34 Years | 0 (0.0%) | 15 (2.8%) |
| 35 to 64 Years | 9 (0.7%) | 0 (0.0%) |
| 65 to 74 Years | 0 (0.0%) | 0 (0.0%) |
| 75 Years and over | 28 (17.5%) | 18 (6.4%) |
Disability Class: Cognitive Difficulty
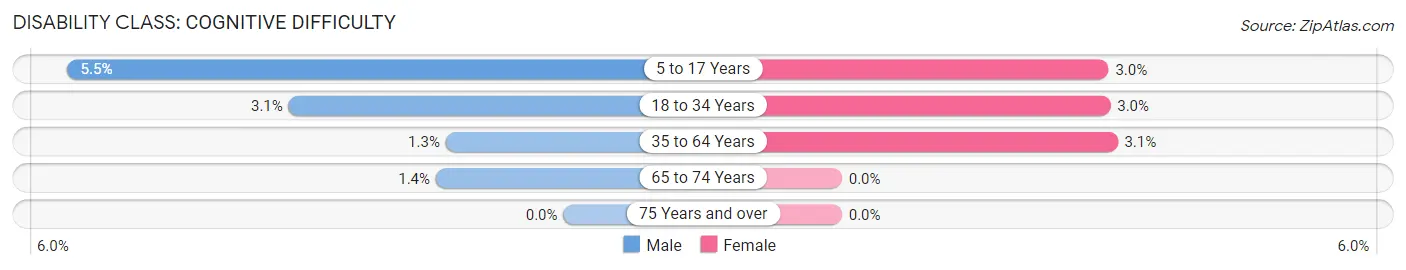
| Age Bracket | Male | Female |
| 5 to 17 Years | 28 (5.5%) | 10 (3.0%) |
| 18 to 34 Years | 15 (3.1%) | 16 (3.0%) |
| 35 to 64 Years | 18 (1.3%) | 40 (3.1%) |
| 65 to 74 Years | 4 (1.4%) | 0 (0.0%) |
| 75 Years and over | 0 (0.0%) | 0 (0.0%) |
Disability Class: Ambulatory Difficulty
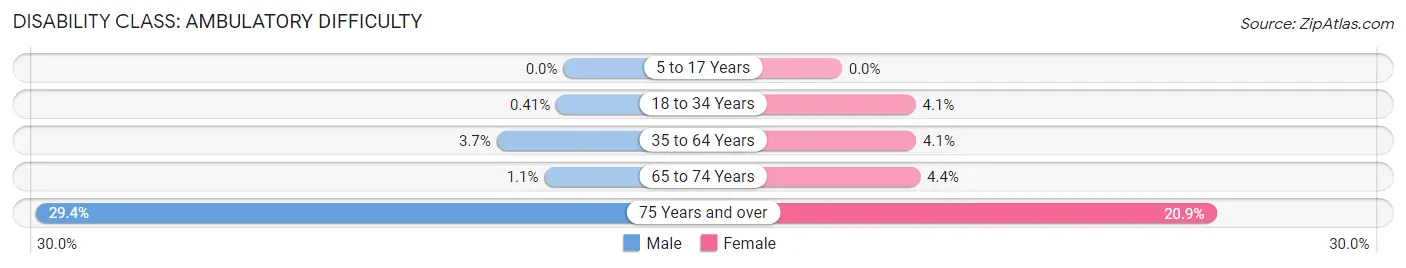
| Age Bracket | Male | Female |
| 5 to 17 Years | 0 (0.0%) | 0 (0.0%) |
| 18 to 34 Years | 2 (0.4%) | 22 (4.1%) |
| 35 to 64 Years | 51 (3.7%) | 54 (4.1%) |
| 65 to 74 Years | 3 (1.1%) | 13 (4.4%) |
| 75 Years and over | 47 (29.4%) | 59 (20.8%) |
Disability Class: Self-Care Difficulty
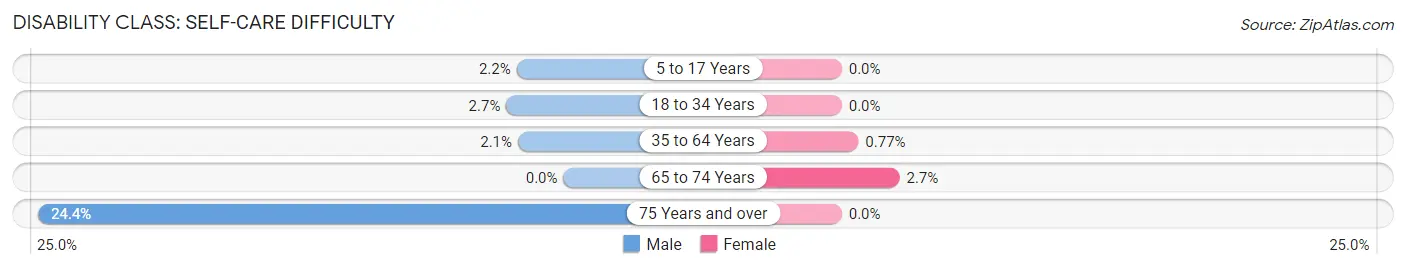
| Age Bracket | Male | Female |
| 5 to 17 Years | 11 (2.2%) | 0 (0.0%) |
| 18 to 34 Years | 13 (2.6%) | 0 (0.0%) |
| 35 to 64 Years | 29 (2.1%) | 10 (0.8%) |
| 65 to 74 Years | 0 (0.0%) | 8 (2.7%) |
| 75 Years and over | 39 (24.4%) | 0 (0.0%) |
Technology Access in Belle Haven
Computing Device Access in Belle Haven
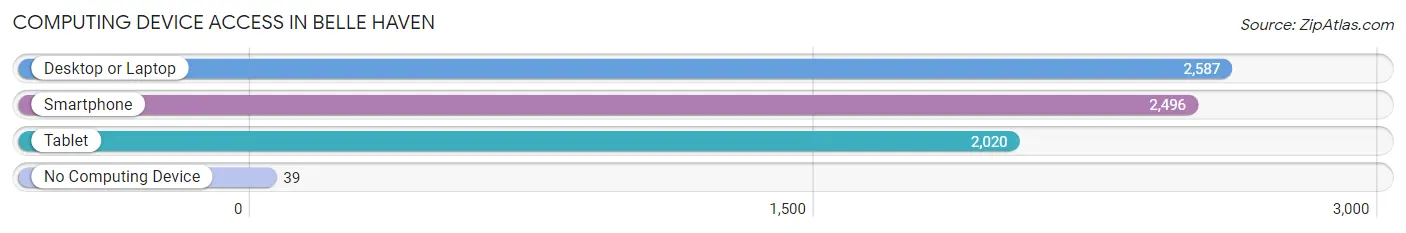
| Device Type | # Households | % Households |
| Desktop or Laptop | 2,587 | 94.2% |
| Smartphone | 2,496 | 90.9% |
| Tablet | 2,020 | 73.5% |
| No Computing Device | 39 | 1.4% |
| Total | 2,747 | 100.0% |
Internet Access in Belle Haven
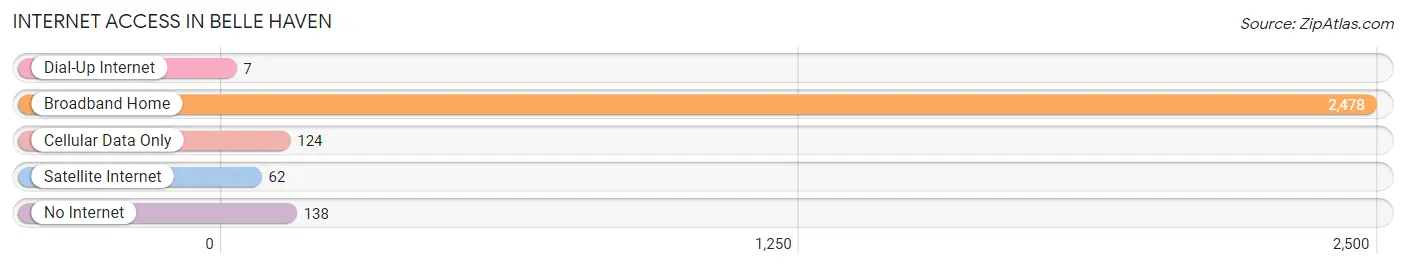
| Internet Type | # Households | % Households |
| Dial-Up Internet | 7 | 0.3% |
| Broadband Home | 2,478 | 90.2% |
| Cellular Data Only | 124 | 4.5% |
| Satellite Internet | 62 | 2.3% |
| No Internet | 138 | 5.0% |
| Total | 2,747 | 100.0% |
Belle Haven Summary
Belle Haven is a small town located in the eastern part of Virginia, in the United States. It is situated in the Accomack County, and is part of the Hampton Roads metropolitan area. The town has a population of about 1,000 people, and is known for its rural charm and small-town atmosphere.
History
Belle Haven was first settled in the early 1700s by English colonists. The town was originally known as “Belle Haven Plantation” and was owned by the prominent Custis family. The Custis family owned much of the land in the area, and the town was named after their daughter, Belle. The town was officially incorporated in 1883.
In the late 1800s, Belle Haven became a popular destination for wealthy families from the North. The town was known for its beautiful scenery and its proximity to the Chesapeake Bay. Many of the wealthy families built large homes in the area, and the town became known as a summer resort.
In the early 1900s, Belle Haven began to decline in popularity as a resort town. The town’s economy shifted to focus on agriculture and fishing. The town’s population began to decline as well, and by the 1950s, the population had dropped to just over 500 people.
Geography
Belle Haven is located in the eastern part of Virginia, in the United States. It is situated in the Accomack County, and is part of the Hampton Roads metropolitan area. The town is located on the Chesapeake Bay, and is bordered by the towns of Exmore, Painter, and Onancock. The town is located about 30 miles from the city of Norfolk.
The town has a total area of 1.2 square miles, all of which is land. The town is located at an elevation of about 10 feet above sea level. The town is located in a humid subtropical climate zone, and experiences hot, humid summers and mild winters.
Economy
The economy of Belle Haven is largely based on agriculture and fishing. The town is home to several farms, which produce a variety of crops, including corn, soybeans, and wheat. The town is also home to several seafood processing plants, which process and package seafood for sale in the local area.
The town is also home to several small businesses, including restaurants, retail stores, and other services. The town is also home to a small marina, which provides boat rentals and other services.
Demographics
As of the 2010 census, the population of Belle Haven was 1,000 people. The town has a population density of 833 people per square mile. The median age of the population is 44.7 years, and the median household income is $41,250.
The town is predominantly white, with about 87% of the population identifying as white. The town is also home to a small African American population, with about 8% of the population identifying as African American. The town is also home to a small Hispanic population, with about 4% of the population identifying as Hispanic or Latino.
Belle Haven is a small town with a rich history and a unique atmosphere. The town is known for its rural charm and its proximity to the Chesapeake Bay. The town’s economy is largely based on agriculture and fishing, and the town is home to several small businesses. The town has a population of about 1,000 people, and is predominantly white.
Common Questions
What is Per Capita Income in Belle Haven?
Per Capita income in Belle Haven is $99,520.
What is the Median Family Income in Belle Haven?
Median Family Income in Belle Haven is $190,469.
What is the Median Household income in Belle Haven?
Median Household Income in Belle Haven is $129,495.
What is Income or Wage Gap in Belle Haven?
Income or Wage Gap in Belle Haven is 26.0%.
Women in Belle Haven earn 74.0 cents for every dollar earned by a man.
What is Inequality or Gini Index in Belle Haven?
Inequality or Gini Index in Belle Haven is 0.53.
What is the Total Population of Belle Haven?
Total Population of Belle Haven is 6,359.
What is the Total Male Population of Belle Haven?
Total Male Population of Belle Haven is 3,130.
What is the Total Female Population of Belle Haven?
Total Female Population of Belle Haven is 3,229.
What is the Ratio of Males per 100 Females in Belle Haven?
There are 96.93 Males per 100 Females in Belle Haven.
What is the Ratio of Females per 100 Males in Belle Haven?
There are 103.16 Females per 100 Males in Belle Haven.
What is the Median Population Age in Belle Haven?
Median Population Age in Belle Haven is 41.5 Years.
What is the Average Family Size in Belle Haven
Average Family Size in Belle Haven is 3.1 People.
What is the Average Household Size in Belle Haven
Average Household Size in Belle Haven is 2.3 People.
How Large is the Labor Force in Belle Haven?
There are 3,530 People in the Labor Forcein in Belle Haven.
What is the Percentage of People in the Labor Force in Belle Haven?
72.4% of People are in the Labor Force in Belle Haven.
What is the Unemployment Rate in Belle Haven?
Unemployment Rate in Belle Haven is 3.3%.