West Springfield, VA Map & Demographics
West Springfield Map
West Springfield Overview
$58,540
PER CAPITA INCOME
$167,204
AVG FAMILY INCOME
$154,497
AVG HOUSEHOLD INCOME
20.0%
WAGE / INCOME GAP [ % ]
80.0¢/ $1
WAGE / INCOME GAP [ $ ]
0.34
INEQUALITY / GINI INDEX
23,372
TOTAL POPULATION
11,700
MALE POPULATION
11,672
FEMALE POPULATION
100.24
MALES / 100 FEMALES
99.76
FEMALES / 100 MALES
38.7
MEDIAN AGE
3.5
AVG FAMILY SIZE
3.0
AVG HOUSEHOLD SIZE
12,876
LABOR FORCE [ PEOPLE ]
71.5%
PERCENT IN LABOR FORCE
2.7%
UNEMPLOYMENT RATE
Income in West Springfield
Income Overview in West Springfield
Per Capita Income in West Springfield is $58,540, while median incomes of families and households are $167,204 and $154,497 respectively.
| Characteristic | Number | Measure |
| Per Capita Income | 23,372 | $58,540 |
| Median Family Income | 5,913 | $167,204 |
| Mean Family Income | 5,913 | $187,464 |
| Median Household Income | 7,776 | $154,497 |
| Mean Household Income | 7,776 | $172,740 |
| Income Deficit | 5,913 | $0 |
| Wage / Income Gap (%) | 23,372 | 19.99% |
| Wage / Income Gap ($) | 23,372 | 80.01¢ per $1 |
| Gini / Inequality Index | 23,372 | 0.34 |
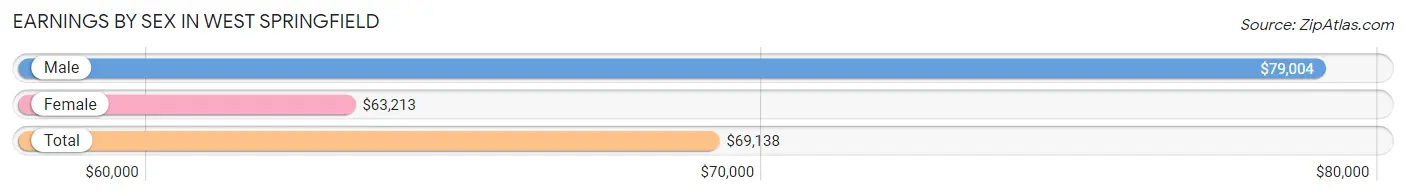
Earnings by Sex in West Springfield
Average Earnings in West Springfield are $69,138, $79,004 for men and $63,213 for women, a difference of 20.0%.
| Sex | Number | Average Earnings |
| Male | 7,007 (52.5%) | $79,004 |
| Female | 6,343 (47.5%) | $63,213 |
| Total | 13,350 (100.0%) | $69,138 |
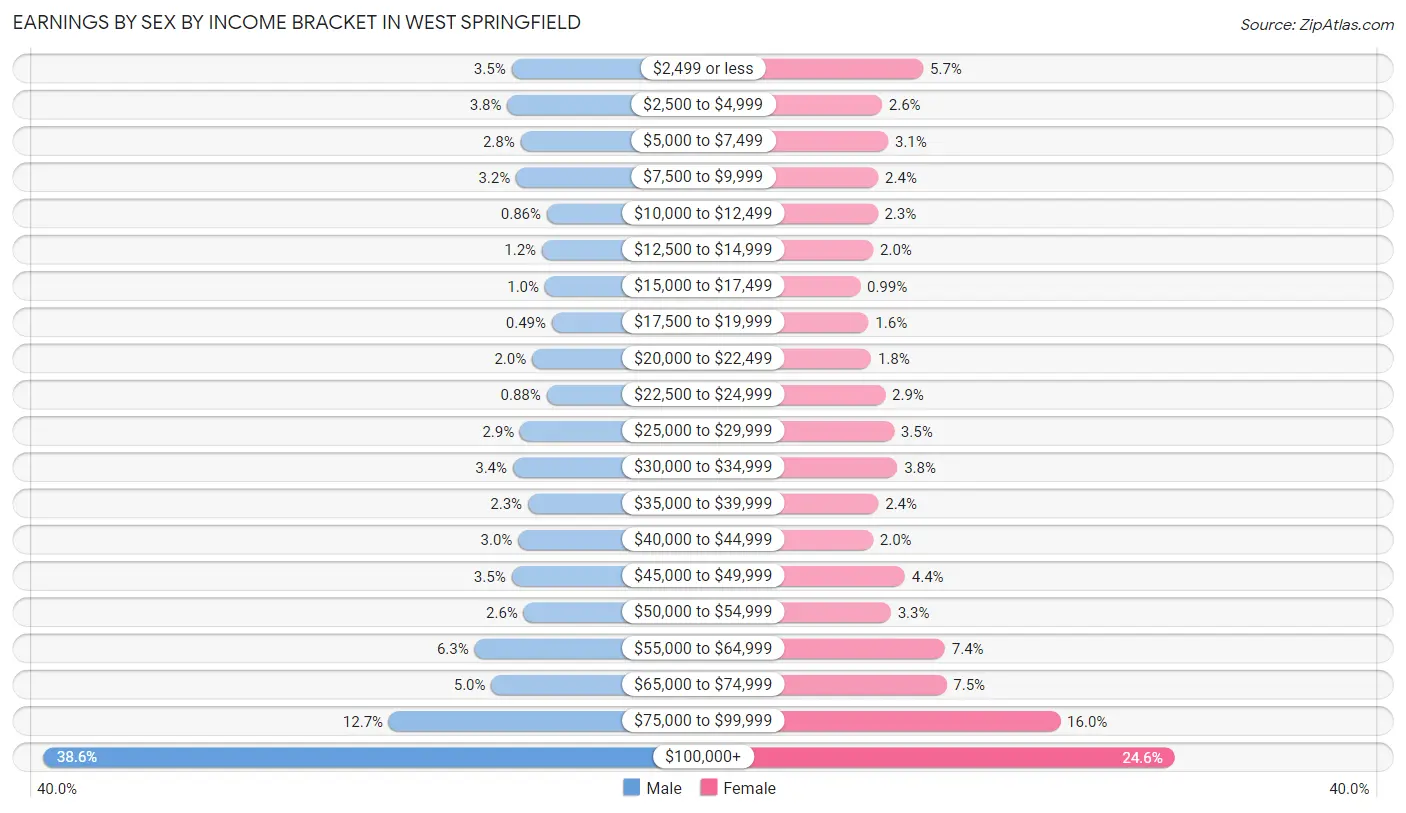
Earnings by Sex by Income Bracket in West Springfield
The most common earnings brackets in West Springfield are $100,000+ for men (2,701 | 38.6%) and $100,000+ for women (1,558 | 24.6%).
| Income | Male | Female |
| $2,499 or less | 246 (3.5%) | 363 (5.7%) |
| $2,500 to $4,999 | 268 (3.8%) | 167 (2.6%) |
| $5,000 to $7,499 | 198 (2.8%) | 196 (3.1%) |
| $7,500 to $9,999 | 222 (3.2%) | 149 (2.4%) |
| $10,000 to $12,499 | 60 (0.9%) | 146 (2.3%) |
| $12,500 to $14,999 | 86 (1.2%) | 125 (2.0%) |
| $15,000 to $17,499 | 71 (1.0%) | 63 (1.0%) |
| $17,500 to $19,999 | 34 (0.5%) | 103 (1.6%) |
| $20,000 to $22,499 | 138 (2.0%) | 115 (1.8%) |
| $22,500 to $24,999 | 62 (0.9%) | 182 (2.9%) |
| $25,000 to $29,999 | 201 (2.9%) | 224 (3.5%) |
| $30,000 to $34,999 | 239 (3.4%) | 240 (3.8%) |
| $35,000 to $39,999 | 160 (2.3%) | 150 (2.4%) |
| $40,000 to $44,999 | 211 (3.0%) | 124 (1.9%) |
| $45,000 to $49,999 | 246 (3.5%) | 276 (4.3%) |
| $50,000 to $54,999 | 182 (2.6%) | 209 (3.3%) |
| $55,000 to $64,999 | 440 (6.3%) | 466 (7.3%) |
| $65,000 to $74,999 | 352 (5.0%) | 473 (7.5%) |
| $75,000 to $99,999 | 890 (12.7%) | 1,014 (16.0%) |
| $100,000+ | 2,701 (38.6%) | 1,558 (24.6%) |
| Total | 7,007 (100.0%) | 6,343 (100.0%) |
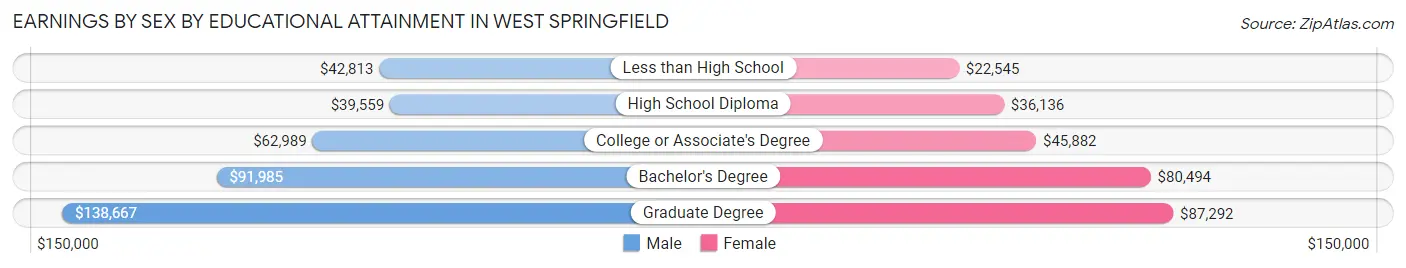
Earnings by Sex by Educational Attainment in West Springfield
Average earnings in West Springfield are $87,027 for men and $70,815 for women, a difference of 18.6%. Men with an educational attainment of graduate degree enjoy the highest average annual earnings of $138,667, while those with high school diploma education earn the least with $39,559. Women with an educational attainment of graduate degree earn the most with the average annual earnings of $87,292, while those with less than high school education have the smallest earnings of $22,545.
| Educational Attainment | Male Income | Female Income |
| Less than High School | $42,813 | $22,545 |
| High School Diploma | $39,559 | $36,136 |
| College or Associate's Degree | $62,989 | $45,882 |
| Bachelor's Degree | $91,985 | $80,494 |
| Graduate Degree | $138,667 | $87,292 |
| Total | $87,027 | $70,815 |
Family Income in West Springfield
Family Income Brackets in West Springfield
According to the West Springfield family income data, there are 2,087 families falling into the $200,000+ income range, which is the most common income bracket and makes up 35.3% of all families. Conversely, the less than $10,000 income bracket is the least frequent group with only 18 families (0.3%) belonging to this category.
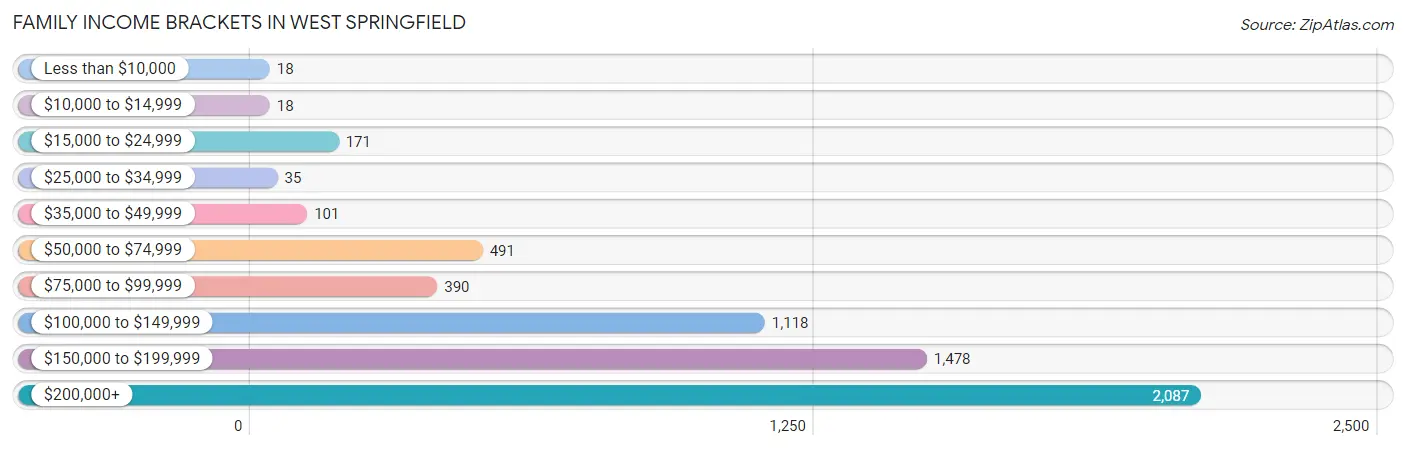
| Income Bracket | # Families | % Families |
| Less than $10,000 | 18 | 0.3% |
| $10,000 to $14,999 | 18 | 0.3% |
| $15,000 to $24,999 | 171 | 2.9% |
| $25,000 to $34,999 | 35 | 0.6% |
| $35,000 to $49,999 | 101 | 1.7% |
| $50,000 to $74,999 | 491 | 8.3% |
| $75,000 to $99,999 | 390 | 6.6% |
| $100,000 to $149,999 | 1,118 | 18.9% |
| $150,000 to $199,999 | 1,478 | 25.0% |
| $200,000+ | 2,087 | 35.3% |
Family Income by Famaliy Size in West Springfield
6-person families (294 | 5.0%) account for the highest median family income in West Springfield with $189,833 per family, while 2-person families (2,374 | 40.2%) have the highest median income of $80,794 per family member.
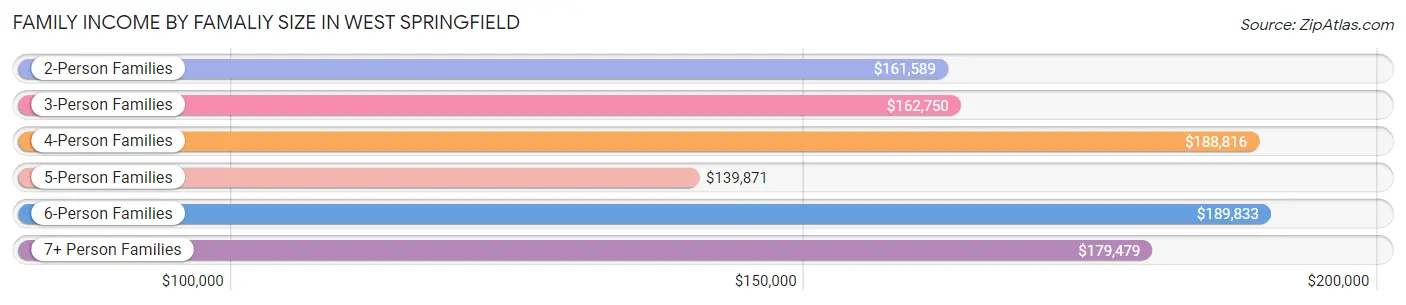
| Income Bracket | # Families | Median Income |
| 2-Person Families | 2,374 (40.2%) | $161,589 |
| 3-Person Families | 1,241 (21.0%) | $162,750 |
| 4-Person Families | 1,322 (22.4%) | $188,816 |
| 5-Person Families | 663 (11.2%) | $139,871 |
| 6-Person Families | 294 (5.0%) | $189,833 |
| 7+ Person Families | 19 (0.3%) | $179,479 |
| Total | 5,913 (100.0%) | $167,204 |
Family Income by Number of Earners in West Springfield
The median family income in West Springfield is $167,204, with families comprising 2 earners (2,720) having the highest median family income of $190,733, while families with 1 earner (1,617) have the lowest median family income of $142,793, accounting for 46.0% and 27.4% of families, respectively.
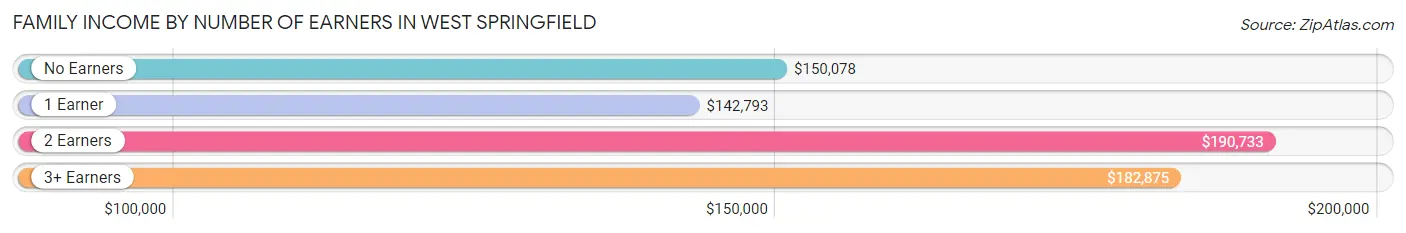
| Number of Earners | # Families | Median Income |
| No Earners | 555 (9.4%) | $150,078 |
| 1 Earner | 1,617 (27.4%) | $142,793 |
| 2 Earners | 2,720 (46.0%) | $190,733 |
| 3+ Earners | 1,021 (17.3%) | $182,875 |
| Total | 5,913 (100.0%) | $167,204 |
Household Income in West Springfield
Household Income Brackets in West Springfield
With 2,348 households falling in the category, the $200,000+ income range is the most frequent in West Springfield, accounting for 30.2% of all households. In contrast, only 39 households (0.5%) fall into the $10,000 to $14,999 income bracket, making it the least populous group.
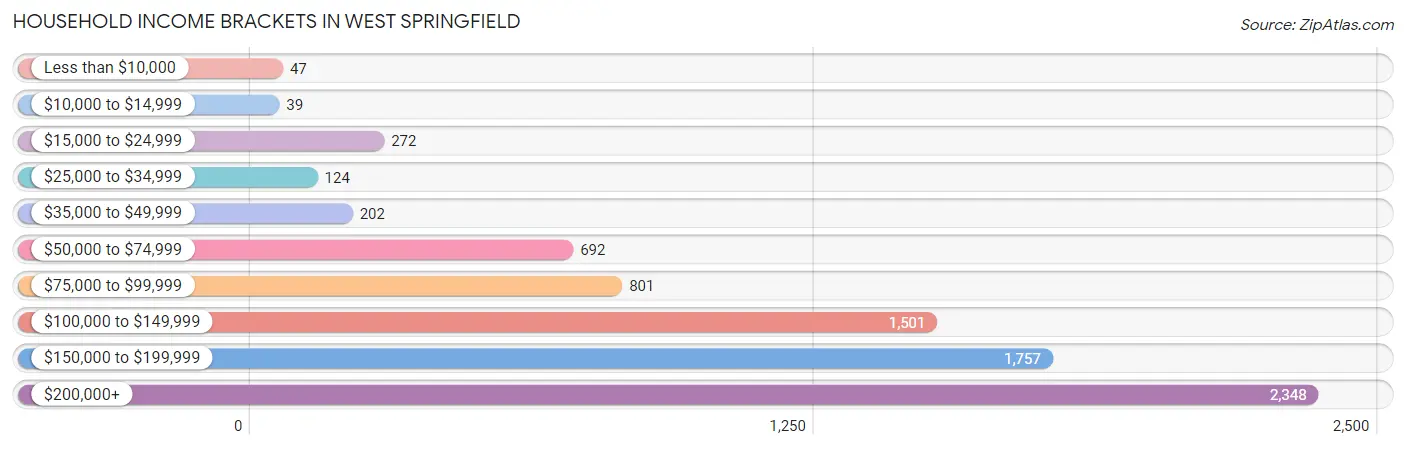
| Income Bracket | # Households | % Households |
| Less than $10,000 | 47 | 0.6% |
| $10,000 to $14,999 | 39 | 0.5% |
| $15,000 to $24,999 | 272 | 3.5% |
| $25,000 to $34,999 | 124 | 1.6% |
| $35,000 to $49,999 | 202 | 2.6% |
| $50,000 to $74,999 | 692 | 8.9% |
| $75,000 to $99,999 | 801 | 10.3% |
| $100,000 to $149,999 | 1,501 | 19.3% |
| $150,000 to $199,999 | 1,757 | 22.6% |
| $200,000+ | 2,348 | 30.2% |
Household Income by Householder Age in West Springfield
The median household income in West Springfield is $154,497, with the highest median household income of $167,396 found in the 25 to 44 years age bracket for the primary householder. A total of 2,462 households (31.7%) fall into this category. Meanwhile, the 15 to 24 years age bracket for the primary householder has the lowest median household income of $0, with 69 households (0.9%) in this group.
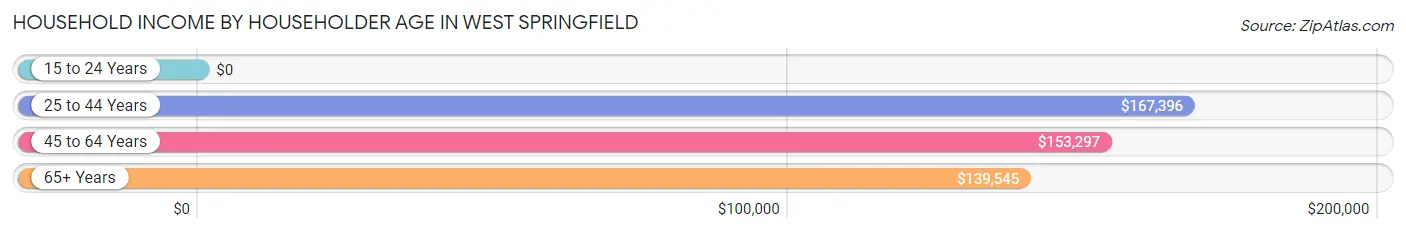
| Income Bracket | # Households | Median Income |
| 15 to 24 Years | 69 (0.9%) | $0 |
| 25 to 44 Years | 2,462 (31.7%) | $167,396 |
| 45 to 64 Years | 3,267 (42.0%) | $153,297 |
| 65+ Years | 1,978 (25.4%) | $139,545 |
| Total | 7,776 (100.0%) | $154,497 |
Poverty in West Springfield
Income Below Poverty by Sex and Age in West Springfield
With 3.7% poverty level for males and 3.6% for females among the residents of West Springfield, 16 and 17 year old males and 12 to 14 year old females are the most vulnerable to poverty, with 52 males (15.2%) and 54 females (10.0%) in their respective age groups living below the poverty level.
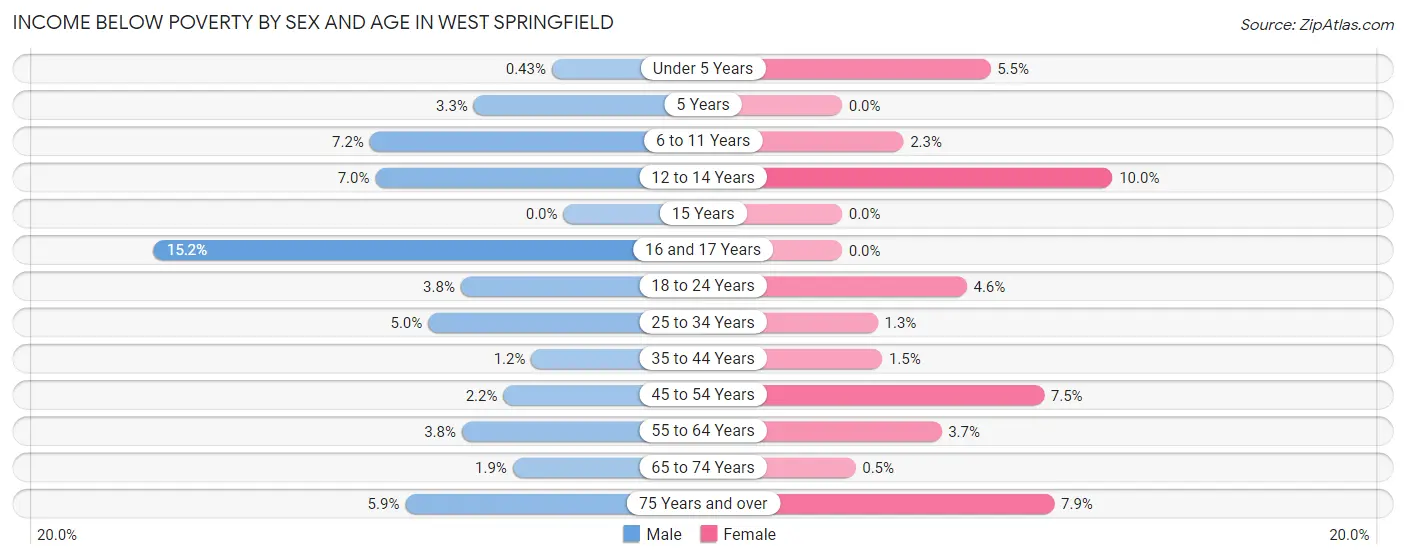
| Age Bracket | Male | Female |
| Under 5 Years | 3 (0.4%) | 31 (5.5%) |
| 5 Years | 2 (3.3%) | 0 (0.0%) |
| 6 to 11 Years | 86 (7.2%) | 20 (2.3%) |
| 12 to 14 Years | 28 (7.0%) | 54 (10.0%) |
| 15 Years | 0 (0.0%) | 0 (0.0%) |
| 16 and 17 Years | 52 (15.2%) | 0 (0.0%) |
| 18 to 24 Years | 37 (3.8%) | 33 (4.6%) |
| 25 to 34 Years | 61 (5.0%) | 19 (1.3%) |
| 35 to 44 Years | 20 (1.2%) | 25 (1.5%) |
| 45 to 54 Years | 36 (2.2%) | 137 (7.5%) |
| 55 to 64 Years | 52 (3.8%) | 44 (3.7%) |
| 65 to 74 Years | 21 (1.9%) | 6 (0.5%) |
| 75 Years and over | 36 (5.9%) | 55 (7.9%) |
| Total | 434 (3.7%) | 424 (3.6%) |
Income Above Poverty by Sex and Age in West Springfield
According to the poverty statistics in West Springfield, males aged 15 years and females aged 5 years are the age groups that are most secure financially, with 100.0% of males and 100.0% of females in these age groups living above the poverty line.
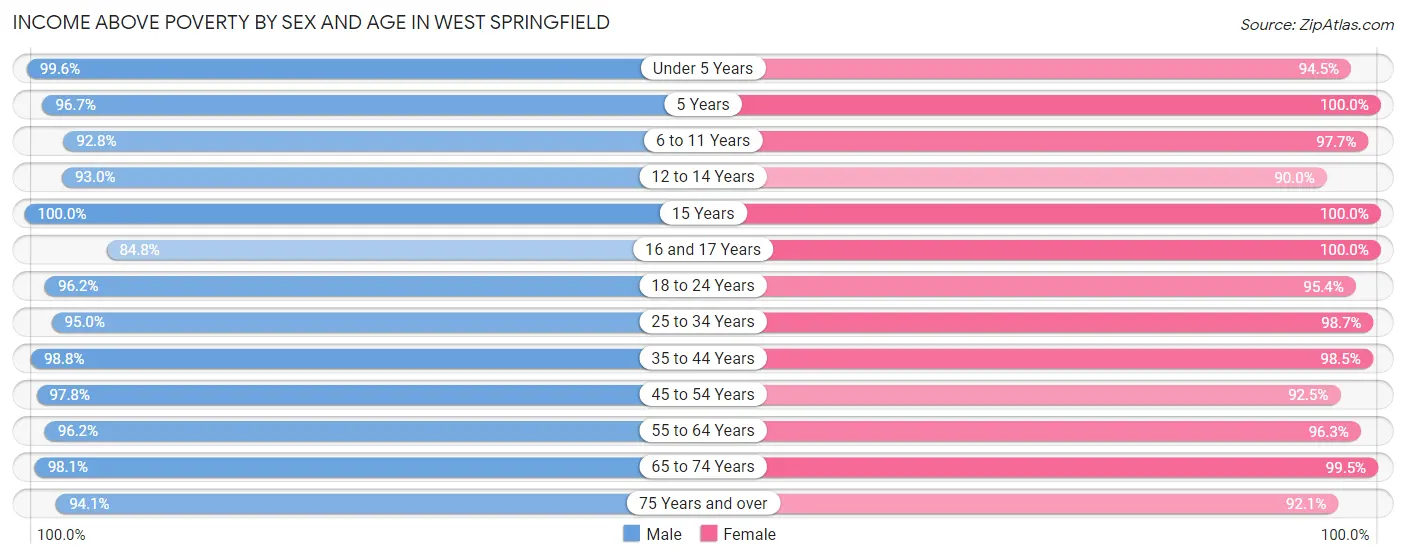
| Age Bracket | Male | Female |
| Under 5 Years | 699 (99.6%) | 532 (94.5%) |
| 5 Years | 58 (96.7%) | 106 (100.0%) |
| 6 to 11 Years | 1,110 (92.8%) | 856 (97.7%) |
| 12 to 14 Years | 373 (93.0%) | 484 (90.0%) |
| 15 Years | 377 (100.0%) | 508 (100.0%) |
| 16 and 17 Years | 290 (84.8%) | 340 (100.0%) |
| 18 to 24 Years | 933 (96.2%) | 679 (95.4%) |
| 25 to 34 Years | 1,153 (95.0%) | 1,409 (98.7%) |
| 35 to 44 Years | 1,665 (98.8%) | 1,656 (98.5%) |
| 45 to 54 Years | 1,578 (97.8%) | 1,689 (92.5%) |
| 55 to 64 Years | 1,327 (96.2%) | 1,149 (96.3%) |
| 65 to 74 Years | 1,099 (98.1%) | 1,188 (99.5%) |
| 75 Years and over | 577 (94.1%) | 643 (92.1%) |
| Total | 11,239 (96.3%) | 11,239 (96.4%) |
Income Below Poverty Among Married-Couple Families in West Springfield
The poverty statistics for married-couple families in West Springfield show that 2.5% or 115 of the total 4,676 families live below the poverty line. Families with 1 or 2 children have the highest poverty rate of 4.1%, comprising of 82 families. On the other hand, families with 3 or 4 children have the lowest poverty rate of 0.0%, which includes 0 families.
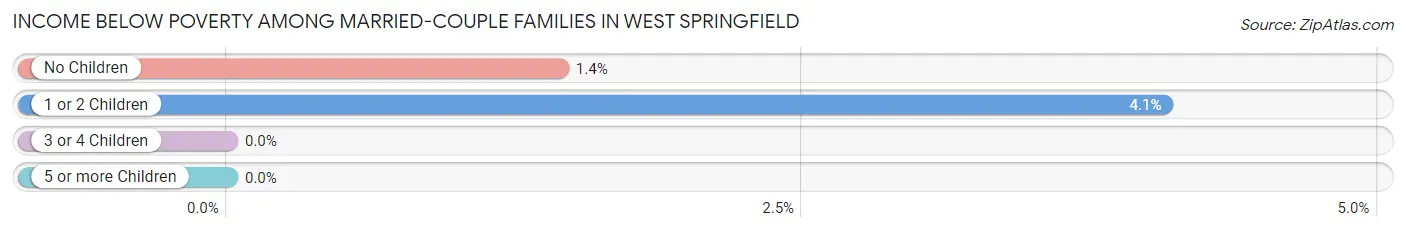
| Children | Above Poverty | Below Poverty |
| No Children | 2,256 (98.6%) | 33 (1.4%) |
| 1 or 2 Children | 1,933 (95.9%) | 82 (4.1%) |
| 3 or 4 Children | 367 (100.0%) | 0 (0.0%) |
| 5 or more Children | 5 (100.0%) | 0 (0.0%) |
| Total | 4,561 (97.5%) | 115 (2.5%) |
Income Below Poverty Among Single-Parent Households in West Springfield
According to the poverty data in West Springfield, 2.5% or 10 single-father households and 6.2% or 52 single-mother households are living below the poverty line. Among single-father households, those with no children have the highest poverty rate, with 10 households (3.5%) experiencing poverty. Likewise, among single-mother households, those with 5 or more children have the highest poverty rate, with 23 households (100.0%) falling below the poverty line.
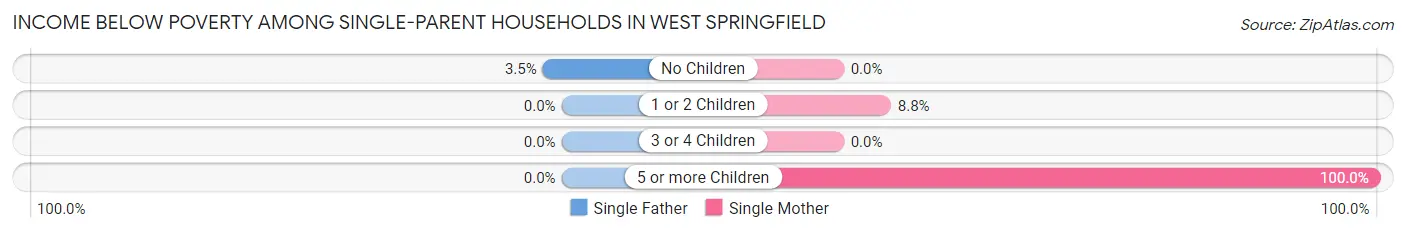
| Children | Single Father | Single Mother |
| No Children | 10 (3.5%) | 0 (0.0%) |
| 1 or 2 Children | 0 (0.0%) | 29 (8.8%) |
| 3 or 4 Children | 0 (0.0%) | 0 (0.0%) |
| 5 or more Children | 0 (0.0%) | 23 (100.0%) |
| Total | 10 (2.5%) | 52 (6.2%) |
Income Below Poverty Among Married-Couple vs Single-Parent Households in West Springfield
The poverty data for West Springfield shows that 115 of the married-couple family households (2.5%) and 62 of the single-parent households (5.0%) are living below the poverty level. Within the married-couple family households, those with 1 or 2 children have the highest poverty rate, with 82 households (4.1%) falling below the poverty line. Among the single-parent households, those with 5 or more children have the highest poverty rate, with 23 household (100.0%) living below poverty.
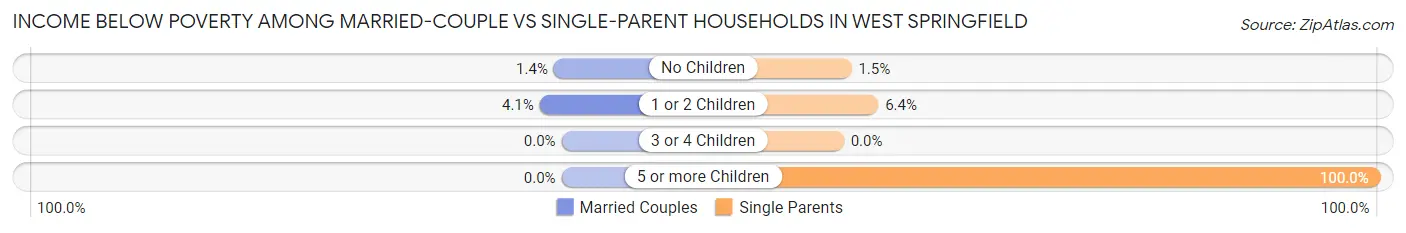
| Children | Married-Couple Families | Single-Parent Households |
| No Children | 33 (1.4%) | 10 (1.5%) |
| 1 or 2 Children | 82 (4.1%) | 29 (6.4%) |
| 3 or 4 Children | 0 (0.0%) | 0 (0.0%) |
| 5 or more Children | 0 (0.0%) | 23 (100.0%) |
| Total | 115 (2.5%) | 62 (5.0%) |
Race in West Springfield
The most populous races in West Springfield are White / Caucasian (13,121 | 56.1%), Hispanic or Latino (4,267 | 18.3%), and Asian (3,676 | 15.7%).
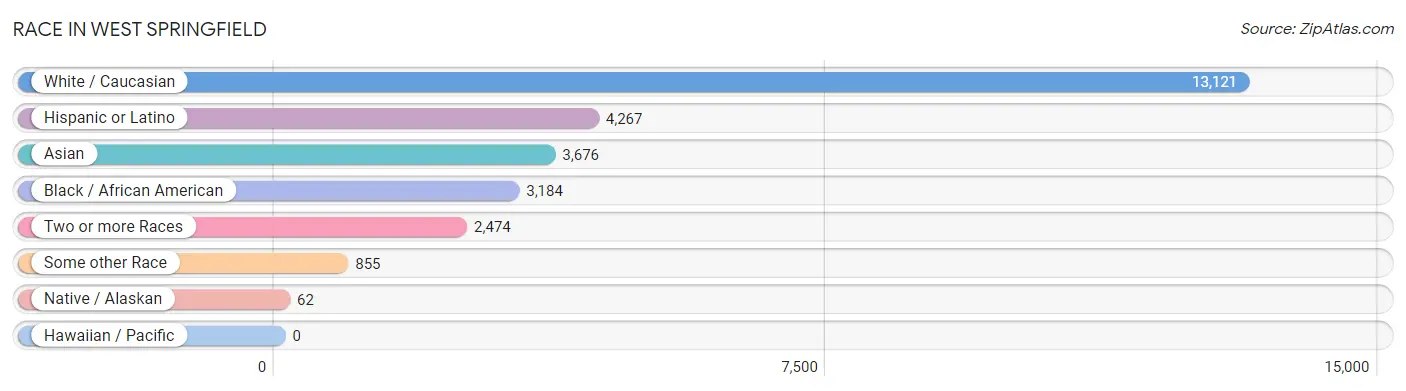
| Race | # Population | % Population |
| Asian | 3,676 | 15.7% |
| Black / African American | 3,184 | 13.6% |
| Hawaiian / Pacific | 0 | 0.0% |
| Hispanic or Latino | 4,267 | 18.3% |
| Native / Alaskan | 62 | 0.3% |
| White / Caucasian | 13,121 | 56.1% |
| Two or more Races | 2,474 | 10.6% |
| Some other Race | 855 | 3.7% |
| Total | 23,372 | 100.0% |
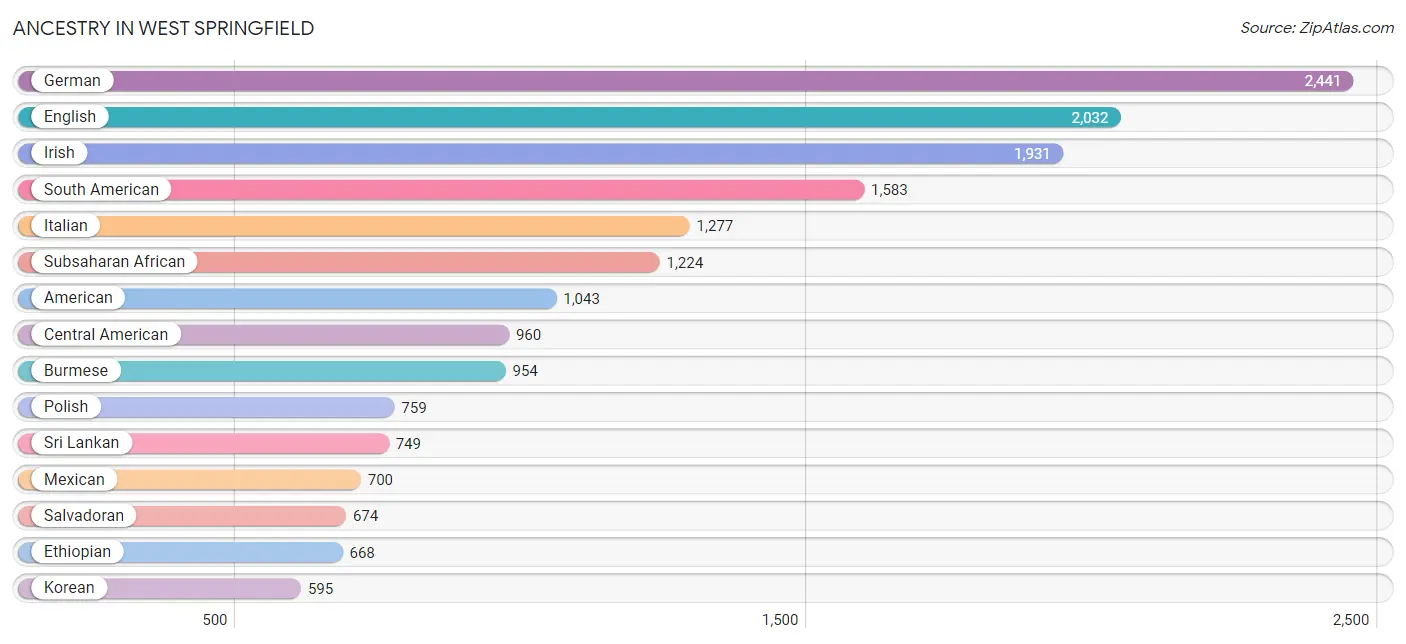
Ancestry in West Springfield
The most populous ancestries reported in West Springfield are German (2,441 | 10.4%), English (2,032 | 8.7%), Irish (1,931 | 8.3%), South American (1,583 | 6.8%), and Italian (1,277 | 5.5%), together accounting for 39.6% of all West Springfield residents.
| Ancestry | # Population | % Population |
| Afghan | 290 | 1.2% |
| African | 171 | 0.7% |
| Albanian | 70 | 0.3% |
| American | 1,043 | 4.5% |
| Arab | 567 | 2.4% |
| Argentinean | 116 | 0.5% |
| Armenian | 33 | 0.1% |
| Assyrian / Chaldean / Syriac | 6 | 0.0% |
| Austrian | 106 | 0.4% |
| Belgian | 11 | 0.1% |
| Belizean | 16 | 0.1% |
| Bhutanese | 129 | 0.5% |
| Bolivian | 425 | 1.8% |
| British | 177 | 0.8% |
| Bulgarian | 14 | 0.1% |
| Burmese | 954 | 4.1% |
| Cambodian | 39 | 0.2% |
| Canadian | 48 | 0.2% |
| Central American | 960 | 4.1% |
| Central American Indian | 396 | 1.7% |
| Cherokee | 76 | 0.3% |
| Chilean | 37 | 0.2% |
| Chinese | 9 | 0.0% |
| Colombian | 520 | 2.2% |
| Comanche | 13 | 0.1% |
| Costa Rican | 9 | 0.0% |
| Croatian | 29 | 0.1% |
| Cuban | 81 | 0.4% |
| Czech | 41 | 0.2% |
| Czechoslovakian | 11 | 0.1% |
| Danish | 39 | 0.2% |
| Dominican | 87 | 0.4% |
| Dutch | 333 | 1.4% |
| Eastern European | 94 | 0.4% |
| Ecuadorian | 80 | 0.3% |
| Egyptian | 61 | 0.3% |
| English | 2,032 | 8.7% |
| Ethiopian | 668 | 2.9% |
| European | 488 | 2.1% |
| Filipino | 5 | 0.0% |
| Finnish | 16 | 0.1% |
| French | 357 | 1.5% |
| French Canadian | 93 | 0.4% |
| German | 2,441 | 10.4% |
| Ghanaian | 4 | 0.0% |
| Greek | 156 | 0.7% |
| Guamanian / Chamorro | 14 | 0.1% |
| Guatemalan | 18 | 0.1% |
| Haitian | 46 | 0.2% |
| Honduran | 77 | 0.3% |
| Hungarian | 85 | 0.4% |
| Icelander | 11 | 0.1% |
| Indian (Asian) | 289 | 1.2% |
| Iraqi | 84 | 0.4% |
| Irish | 1,931 | 8.3% |
| Italian | 1,277 | 5.5% |
| Jamaican | 44 | 0.2% |
| Japanese | 45 | 0.2% |
| Kenyan | 170 | 0.7% |
| Korean | 595 | 2.5% |
| Latvian | 60 | 0.3% |
| Lebanese | 71 | 0.3% |
| Lithuanian | 85 | 0.4% |
| Macedonian | 9 | 0.0% |
| Malaysian | 5 | 0.0% |
| Mexican | 700 | 3.0% |
| Mexican American Indian | 379 | 1.6% |
| Mongolian | 7 | 0.0% |
| Moroccan | 178 | 0.8% |
| Nicaraguan | 38 | 0.2% |
| Nigerian | 36 | 0.2% |
| Northern European | 141 | 0.6% |
| Norwegian | 179 | 0.8% |
| Pakistani | 91 | 0.4% |
| Palestinian | 8 | 0.0% |
| Panamanian | 144 | 0.6% |
| Paraguayan | 30 | 0.1% |
| Pennsylvania German | 9 | 0.0% |
| Peruvian | 331 | 1.4% |
| Polish | 759 | 3.3% |
| Portuguese | 95 | 0.4% |
| Puerto Rican | 432 | 1.8% |
| Romanian | 41 | 0.2% |
| Russian | 184 | 0.8% |
| Salvadoran | 674 | 2.9% |
| Scandinavian | 46 | 0.2% |
| Scotch-Irish | 187 | 0.8% |
| Scottish | 317 | 1.4% |
| Sioux | 14 | 0.1% |
| Slavic | 10 | 0.0% |
| Slovak | 109 | 0.5% |
| Slovene | 13 | 0.1% |
| Somali | 167 | 0.7% |
| South American | 1,583 | 6.8% |
| South American Indian | 76 | 0.3% |
| Spaniard | 53 | 0.2% |
| Spanish | 41 | 0.2% |
| Sri Lankan | 749 | 3.2% |
| Subsaharan African | 1,224 | 5.2% |
| Swedish | 223 | 0.9% |
| Swiss | 53 | 0.2% |
| Syrian | 89 | 0.4% |
| Thai | 294 | 1.3% |
| Trinidadian and Tobagonian | 19 | 0.1% |
| Turkish | 127 | 0.5% |
| Ukrainian | 156 | 0.7% |
| Uruguayan | 7 | 0.0% |
| Venezuelan | 37 | 0.2% |
| Vietnamese | 110 | 0.5% |
| Welsh | 179 | 0.8% | View All 110 Rows |
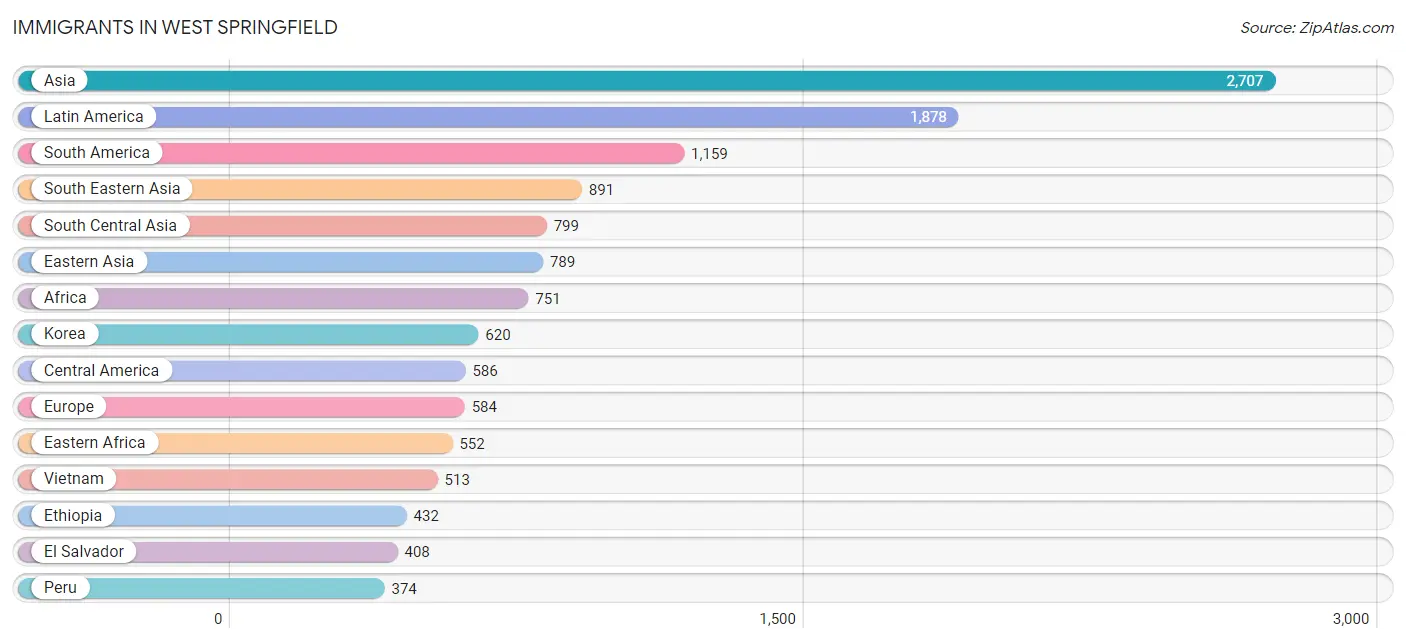
Immigrants in West Springfield
The most numerous immigrant groups reported in West Springfield came from Asia (2,707 | 11.6%), Latin America (1,878 | 8.0%), South America (1,159 | 5.0%), South Eastern Asia (891 | 3.8%), and South Central Asia (799 | 3.4%), together accounting for 31.8% of all West Springfield residents.
| Immigration Origin | # Population | % Population |
| Afghanistan | 188 | 0.8% |
| Africa | 751 | 3.2% |
| Albania | 53 | 0.2% |
| Argentina | 91 | 0.4% |
| Asia | 2,707 | 11.6% |
| Australia | 6 | 0.0% |
| Austria | 80 | 0.3% |
| Bangladesh | 68 | 0.3% |
| Barbados | 12 | 0.1% |
| Bolivia | 183 | 0.8% |
| Brazil | 61 | 0.3% |
| Bulgaria | 14 | 0.1% |
| Cambodia | 13 | 0.1% |
| Canada | 33 | 0.1% |
| Caribbean | 133 | 0.6% |
| Central America | 586 | 2.5% |
| Chile | 30 | 0.1% |
| China | 81 | 0.4% |
| Colombia | 263 | 1.1% |
| Costa Rica | 9 | 0.0% |
| Cuba | 62 | 0.3% |
| Czechoslovakia | 17 | 0.1% |
| Denmark | 9 | 0.0% |
| Dominican Republic | 35 | 0.2% |
| Eastern Africa | 552 | 2.4% |
| Eastern Asia | 789 | 3.4% |
| Eastern Europe | 268 | 1.1% |
| Ecuador | 29 | 0.1% |
| Egypt | 41 | 0.2% |
| El Salvador | 408 | 1.8% |
| England | 18 | 0.1% |
| Eritrea | 17 | 0.1% |
| Ethiopia | 432 | 1.8% |
| Europe | 584 | 2.5% |
| Germany | 54 | 0.2% |
| Ghana | 19 | 0.1% |
| Greece | 42 | 0.2% |
| Guatemala | 18 | 0.1% |
| Haiti | 13 | 0.1% |
| Honduras | 32 | 0.1% |
| India | 202 | 0.9% |
| Iran | 14 | 0.1% |
| Iraq | 41 | 0.2% |
| Italy | 8 | 0.0% |
| Jamaica | 11 | 0.1% |
| Japan | 56 | 0.2% |
| Kenya | 66 | 0.3% |
| Korea | 620 | 2.6% |
| Kuwait | 4 | 0.0% |
| Latin America | 1,878 | 8.0% |
| Lebanon | 15 | 0.1% |
| Malaysia | 7 | 0.0% |
| Mexico | 59 | 0.3% |
| Moldova | 11 | 0.1% |
| Morocco | 60 | 0.3% |
| Nepal | 16 | 0.1% |
| Netherlands | 10 | 0.0% |
| Nicaragua | 29 | 0.1% |
| North Macedonia | 9 | 0.0% |
| Northern Africa | 145 | 0.6% |
| Northern Europe | 106 | 0.4% |
| Oceania | 6 | 0.0% |
| Pakistan | 311 | 1.3% |
| Panama | 31 | 0.1% |
| Peru | 374 | 1.6% |
| Philippines | 299 | 1.3% |
| Poland | 90 | 0.4% |
| Portugal | 9 | 0.0% |
| Romania | 22 | 0.1% |
| Russia | 12 | 0.1% |
| Saudi Arabia | 11 | 0.1% |
| Somalia | 37 | 0.2% |
| South America | 1,159 | 5.0% |
| South Central Asia | 799 | 3.4% |
| South Eastern Asia | 891 | 3.8% |
| Southern Europe | 66 | 0.3% |
| Spain | 7 | 0.0% |
| Sudan | 42 | 0.2% |
| Sweden | 36 | 0.2% |
| Syria | 35 | 0.2% |
| Taiwan | 19 | 0.1% |
| Thailand | 59 | 0.3% |
| Turkey | 78 | 0.3% |
| Ukraine | 40 | 0.2% |
| Uruguay | 7 | 0.0% |
| Venezuela | 110 | 0.5% |
| Vietnam | 513 | 2.2% |
| Western Africa | 19 | 0.1% |
| Western Asia | 228 | 1.0% |
| Western Europe | 144 | 0.6% |
| Yemen | 25 | 0.1% | View All 91 Rows |
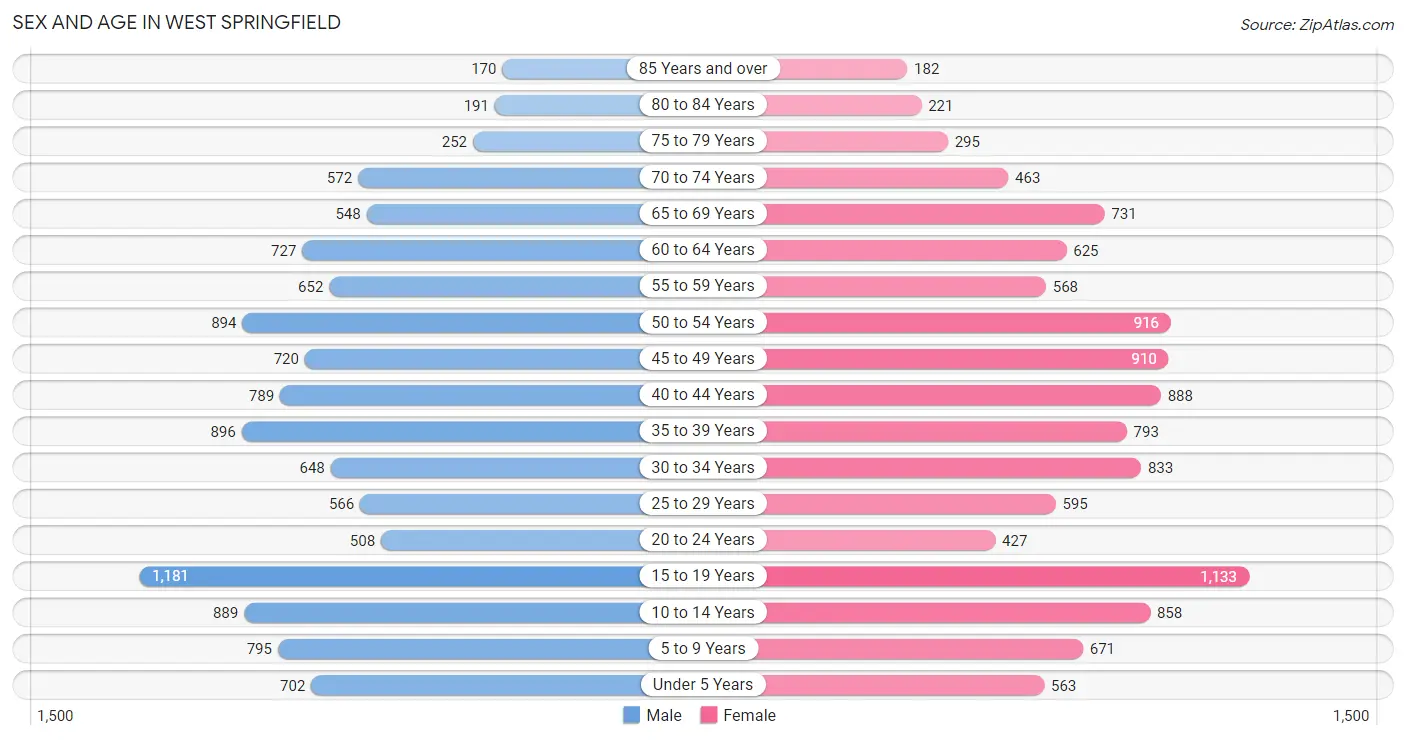
Sex and Age in West Springfield
Sex and Age in West Springfield
The most populous age groups in West Springfield are 15 to 19 Years (1,181 | 10.1%) for men and 15 to 19 Years (1,133 | 9.7%) for women.
| Age Bracket | Male | Female |
| Under 5 Years | 702 (6.0%) | 563 (4.8%) |
| 5 to 9 Years | 795 (6.8%) | 671 (5.8%) |
| 10 to 14 Years | 889 (7.6%) | 858 (7.3%) |
| 15 to 19 Years | 1,181 (10.1%) | 1,133 (9.7%) |
| 20 to 24 Years | 508 (4.3%) | 427 (3.7%) |
| 25 to 29 Years | 566 (4.8%) | 595 (5.1%) |
| 30 to 34 Years | 648 (5.5%) | 833 (7.1%) |
| 35 to 39 Years | 896 (7.7%) | 793 (6.8%) |
| 40 to 44 Years | 789 (6.7%) | 888 (7.6%) |
| 45 to 49 Years | 720 (6.1%) | 910 (7.8%) |
| 50 to 54 Years | 894 (7.6%) | 916 (7.9%) |
| 55 to 59 Years | 652 (5.6%) | 568 (4.9%) |
| 60 to 64 Years | 727 (6.2%) | 625 (5.3%) |
| 65 to 69 Years | 548 (4.7%) | 731 (6.3%) |
| 70 to 74 Years | 572 (4.9%) | 463 (4.0%) |
| 75 to 79 Years | 252 (2.1%) | 295 (2.5%) |
| 80 to 84 Years | 191 (1.6%) | 221 (1.9%) |
| 85 Years and over | 170 (1.5%) | 182 (1.6%) |
| Total | 11,700 (100.0%) | 11,672 (100.0%) |
Families and Households in West Springfield
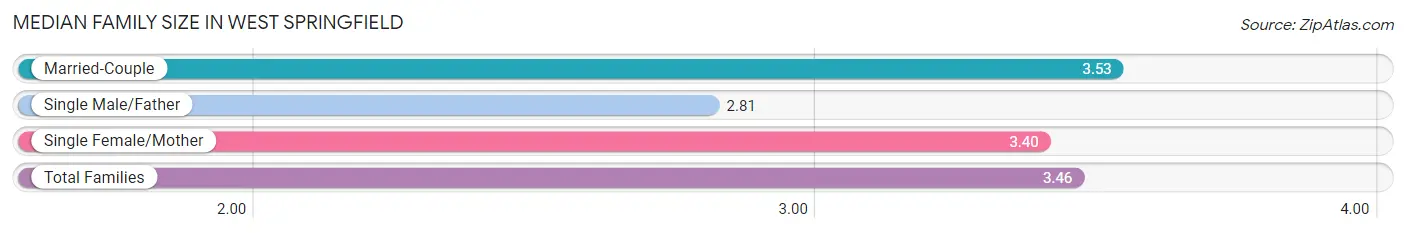
Median Family Size in West Springfield
The median family size in West Springfield is 3.46 persons per family, with married-couple families (4,676 | 79.1%) accounting for the largest median family size of 3.53 persons per family. On the other hand, single male/father families (405 | 6.9%) represent the smallest median family size with 2.81 persons per family.
| Family Type | # Families | Family Size |
| Married-Couple | 4,676 (79.1%) | 3.53 |
| Single Male/Father | 405 (6.9%) | 2.81 |
| Single Female/Mother | 832 (14.1%) | 3.40 |
| Total Families | 5,913 (100.0%) | 3.46 |
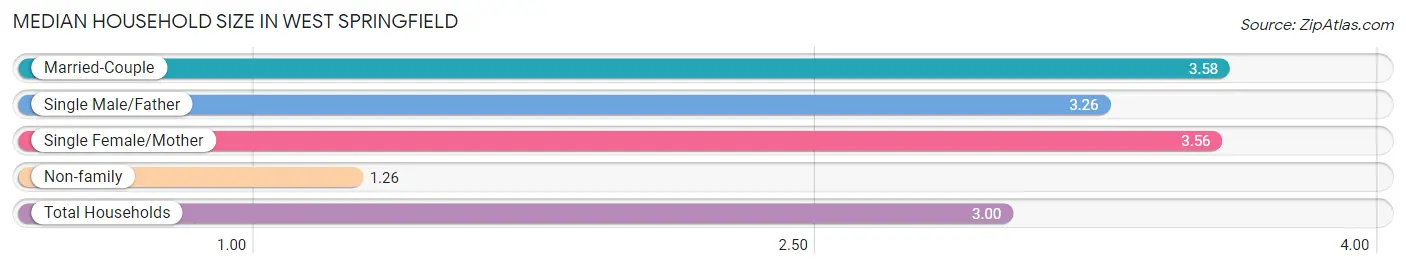
Median Household Size in West Springfield
The median household size in West Springfield is 3.00 persons per household, with married-couple households (4,676 | 60.1%) accounting for the largest median household size of 3.58 persons per household. non-family households (1,863 | 24.0%) represent the smallest median household size with 1.26 persons per household.
| Household Type | # Households | Household Size |
| Married-Couple | 4,676 (60.1%) | 3.58 |
| Single Male/Father | 405 (5.2%) | 3.26 |
| Single Female/Mother | 832 (10.7%) | 3.56 |
| Non-family | 1,863 (24.0%) | 1.26 |
| Total Households | 7,776 (100.0%) | 3.00 |
Household Size by Marriage Status in West Springfield
Out of a total of 7,776 households in West Springfield, 5,913 (76.0%) are family households, while 1,863 (24.0%) are nonfamily households. The most numerous type of family households are 2-person households, comprising 2,171, and the most common type of nonfamily households are 1-person households, comprising 1,540.
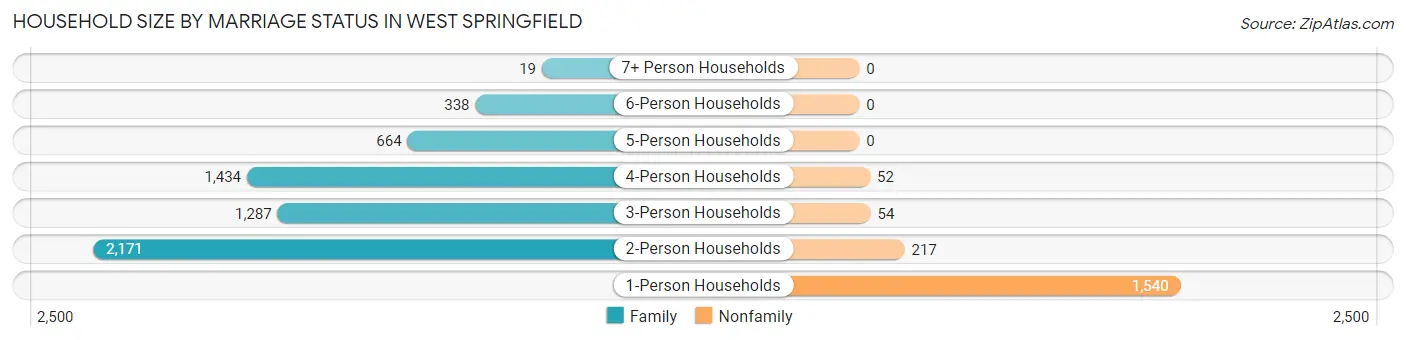
| Household Size | Family Households | Nonfamily Households |
| 1-Person Households | - | 1,540 (19.8%) |
| 2-Person Households | 2,171 (27.9%) | 217 (2.8%) |
| 3-Person Households | 1,287 (16.6%) | 54 (0.7%) |
| 4-Person Households | 1,434 (18.4%) | 52 (0.7%) |
| 5-Person Households | 664 (8.5%) | 0 (0.0%) |
| 6-Person Households | 338 (4.3%) | 0 (0.0%) |
| 7+ Person Households | 19 (0.2%) | 0 (0.0%) |
| Total | 5,913 (76.0%) | 1,863 (24.0%) |
Female Fertility in West Springfield
Fertility by Age in West Springfield
Average fertility rate in West Springfield is 50.0 births per 1,000 women. Women in the age bracket of 20 to 34 years have the highest fertility rate with 72.0 births per 1,000 women. Women in the age bracket of 35 to 50 years acount for 53.6% of all women with births.
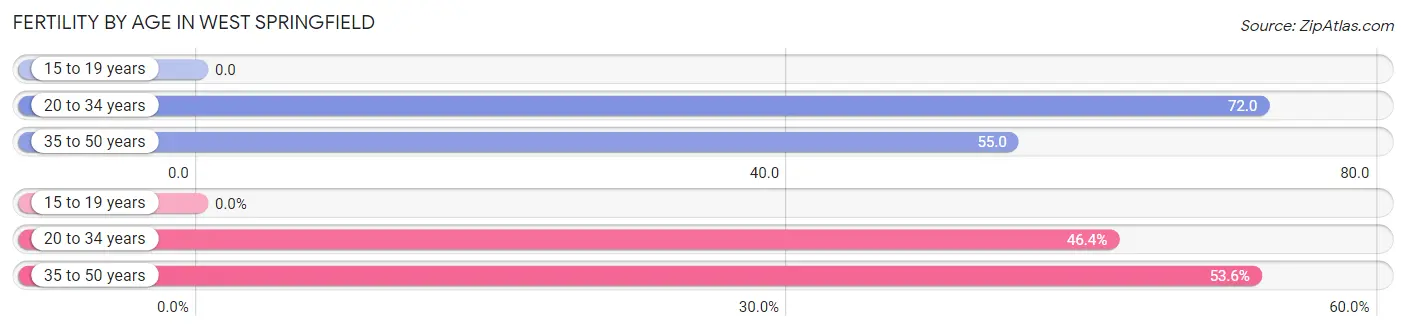
| Age Bracket | Women with Births | Births / 1,000 Women |
| 15 to 19 years | 0 (0.0%) | 0.0 |
| 20 to 34 years | 134 (46.4%) | 72.0 |
| 35 to 50 years | 155 (53.6%) | 55.0 |
| Total | 289 (100.0%) | 50.0 |
Fertility by Age by Marriage Status in West Springfield
87.2% of women with births (289) in West Springfield are married. The highest percentage of unmarried women with births falls into 35 to 50 years age bracket with 18.7% of them unmarried at the time of birth, while the lowest percentage of unmarried women with births belong to 20 to 34 years age bracket with 6.0% of them unmarried.
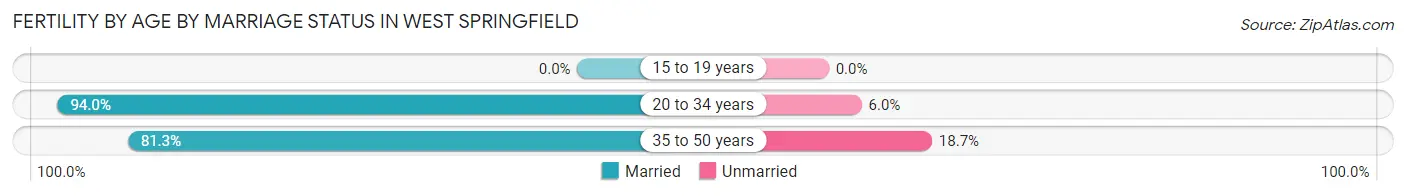
| Age Bracket | Married | Unmarried |
| 15 to 19 years | 0 (0.0%) | 0 (0.0%) |
| 20 to 34 years | 126 (94.0%) | 8 (6.0%) |
| 35 to 50 years | 126 (81.3%) | 29 (18.7%) |
| Total | 252 (87.2%) | 37 (12.8%) |
Fertility by Education in West Springfield
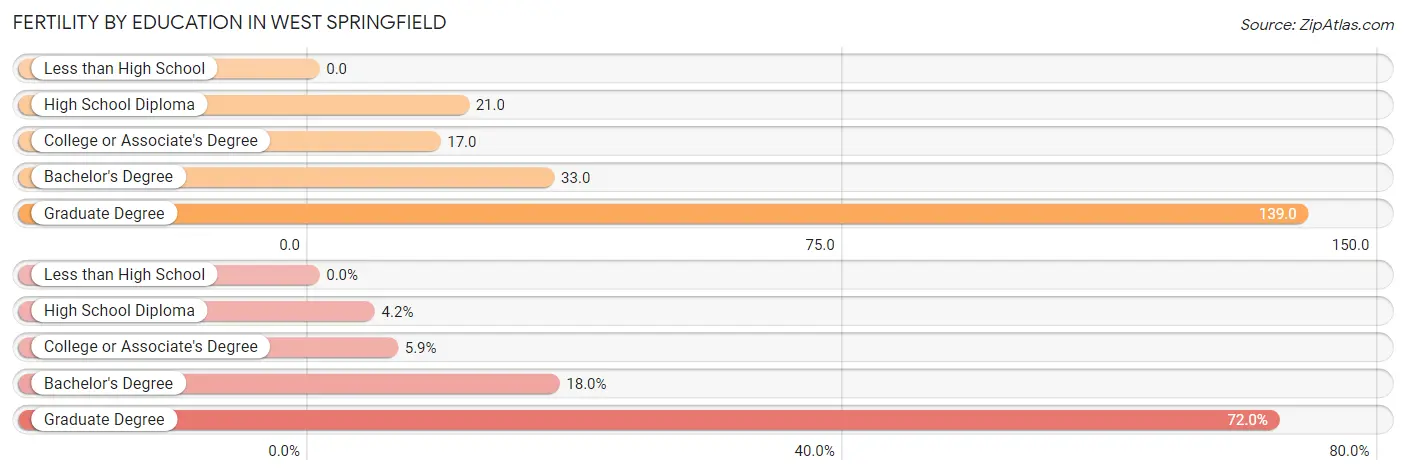
| Educational Attainment | Women with Births | Births / 1,000 Women |
| Less than High School | 0 (0.0%) | 0.0 |
| High School Diploma | 12 (4.2%) | 21.0 |
| College or Associate's Degree | 17 (5.9%) | 17.0 |
| Bachelor's Degree | 52 (18.0%) | 33.0 |
| Graduate Degree | 208 (72.0%) | 139.0 |
| Total | 289 (100.0%) | 50.0 |
Fertility by Education by Marriage Status in West Springfield
12.8% of women with births in West Springfield are unmarried. Women with the educational attainment of college or associate's degree are most likely to be married with 100.0% of them married at childbirth, while women with the educational attainment of high school diploma are least likely to be married with 100.0% of them unmarried at childbirth.
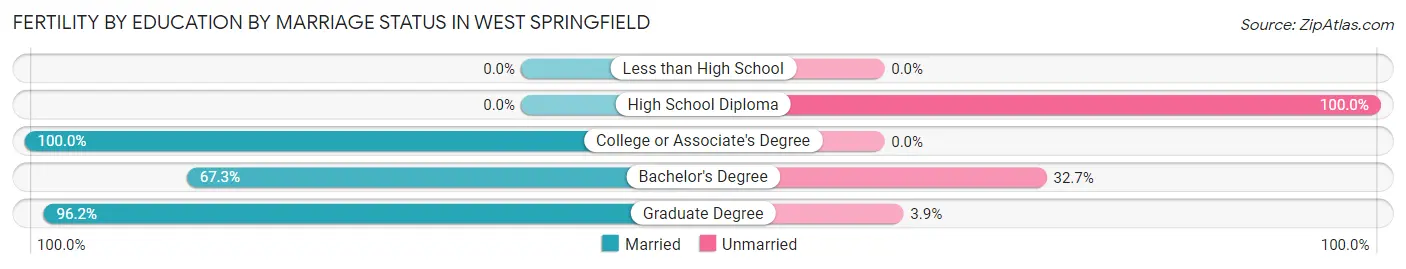
| Educational Attainment | Married | Unmarried |
| Less than High School | 0 (0.0%) | 0 (0.0%) |
| High School Diploma | 0 (0.0%) | 12 (100.0%) |
| College or Associate's Degree | 17 (100.0%) | 0 (0.0%) |
| Bachelor's Degree | 35 (67.3%) | 17 (32.7%) |
| Graduate Degree | 200 (96.2%) | 8 (3.8%) |
| Total | 252 (87.2%) | 37 (12.8%) |
Employment Characteristics in West Springfield
Employment by Class of Employer in West Springfield
Among the 12,282 employed individuals in West Springfield, private company employees (5,870 | 47.8%), federal government employees (2,592 | 21.1%), and not-for-profit organizations (1,346 | 11.0%) make up the most common classes of employment.
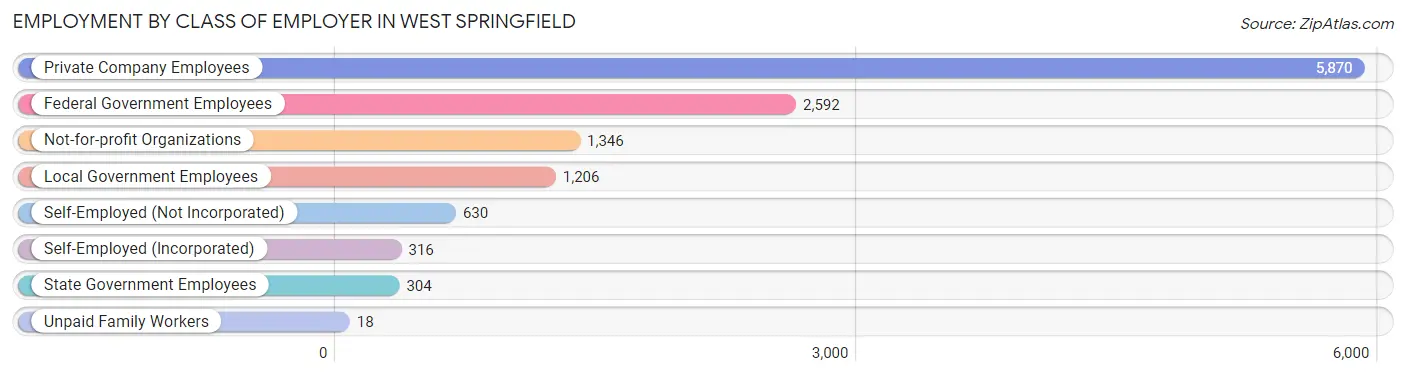
| Employer Class | # Employees | % Employees |
| Private Company Employees | 5,870 | 47.8% |
| Self-Employed (Incorporated) | 316 | 2.6% |
| Self-Employed (Not Incorporated) | 630 | 5.1% |
| Not-for-profit Organizations | 1,346 | 11.0% |
| Local Government Employees | 1,206 | 9.8% |
| State Government Employees | 304 | 2.5% |
| Federal Government Employees | 2,592 | 21.1% |
| Unpaid Family Workers | 18 | 0.2% |
| Total | 12,282 | 100.0% |
Employment Status by Age in West Springfield
According to the labor force statistics for West Springfield, out of the total population over 16 years of age (18,009), 71.5% or 12,876 individuals are in the labor force, with 2.7% or 348 of them unemployed. The age group with the highest labor force participation rate is 25 to 29 years, with 91.4% or 1,061 individuals in the labor force. Within the labor force, the 16 to 19 years age range has the highest percentage of unemployed individuals, with 10.4% or 65 of them being unemployed.
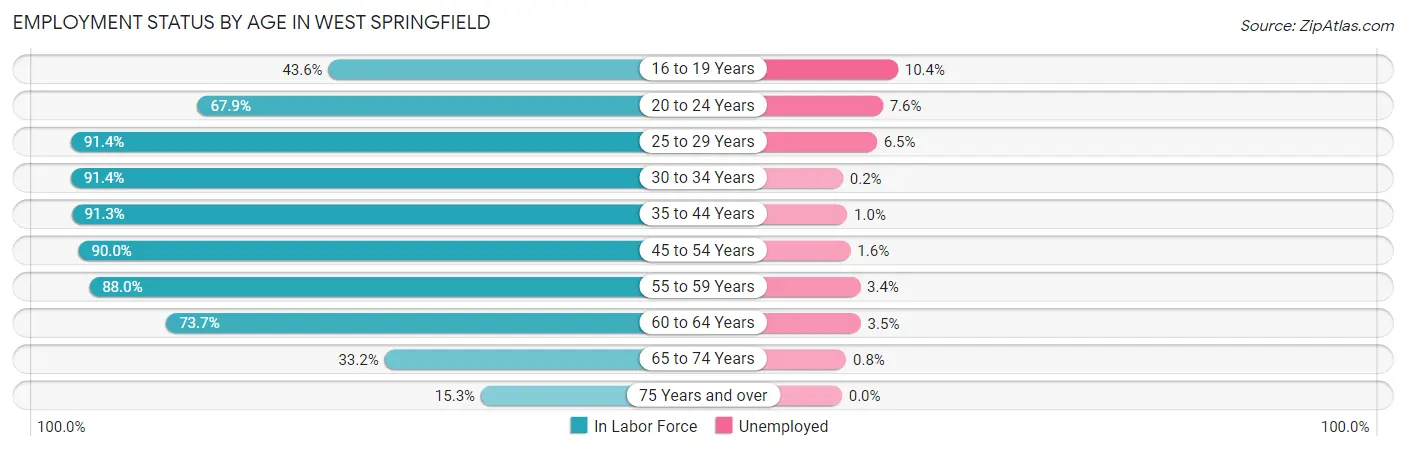
| Age Bracket | In Labor Force | Unemployed |
| 16 to 19 Years | 623 (43.6%) | 65 (10.4%) |
| 20 to 24 Years | 635 (67.9%) | 48 (7.6%) |
| 25 to 29 Years | 1,061 (91.4%) | 69 (6.5%) |
| 30 to 34 Years | 1,354 (91.4%) | 3 (0.2%) |
| 35 to 44 Years | 3,073 (91.3%) | 31 (1.0%) |
| 45 to 54 Years | 3,096 (90.0%) | 50 (1.6%) |
| 55 to 59 Years | 1,074 (88.0%) | 37 (3.4%) |
| 60 to 64 Years | 996 (73.7%) | 35 (3.5%) |
| 65 to 74 Years | 768 (33.2%) | 6 (0.8%) |
| 75 Years and over | 201 (15.3%) | 0 (0.0%) |
| Total | 12,876 (71.5%) | 348 (2.7%) |
Employment Status by Educational Attainment in West Springfield
According to labor force statistics for West Springfield, 88.6% of individuals (10,650) out of the total population between 25 and 64 years of age (12,020) are in the labor force, with 2.1% or 224 of them being unemployed. The group with the highest labor force participation rate are those with the educational attainment of bachelor's degree or higher, with 90.8% or 7,010 individuals in the labor force. Within the labor force, individuals with college / associate degree education have the highest percentage of unemployment, with 2.3% or 45 of them being unemployed.
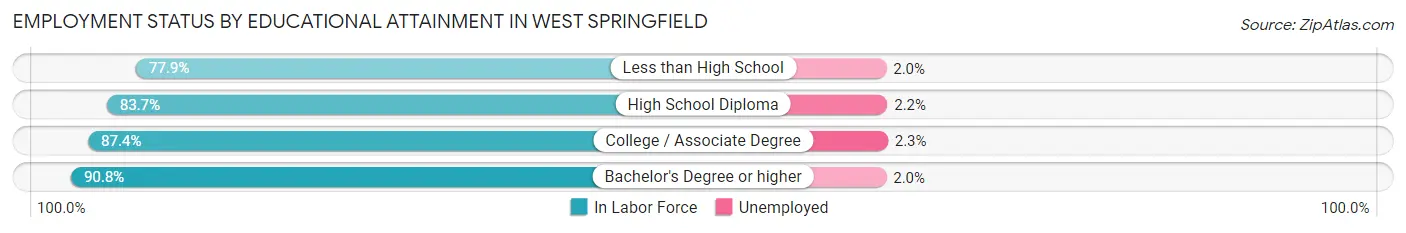
| Educational Attainment | In Labor Force | Unemployed |
| Less than High School | 497 (77.9%) | 13 (2.0%) |
| High School Diploma | 1,196 (83.7%) | 31 (2.2%) |
| College / Associate Degree | 1,952 (87.4%) | 51 (2.3%) |
| Bachelor's Degree or higher | 7,010 (90.8%) | 154 (2.0%) |
| Total | 10,650 (88.6%) | 252 (2.1%) |
Employment Occupations by Sex in West Springfield
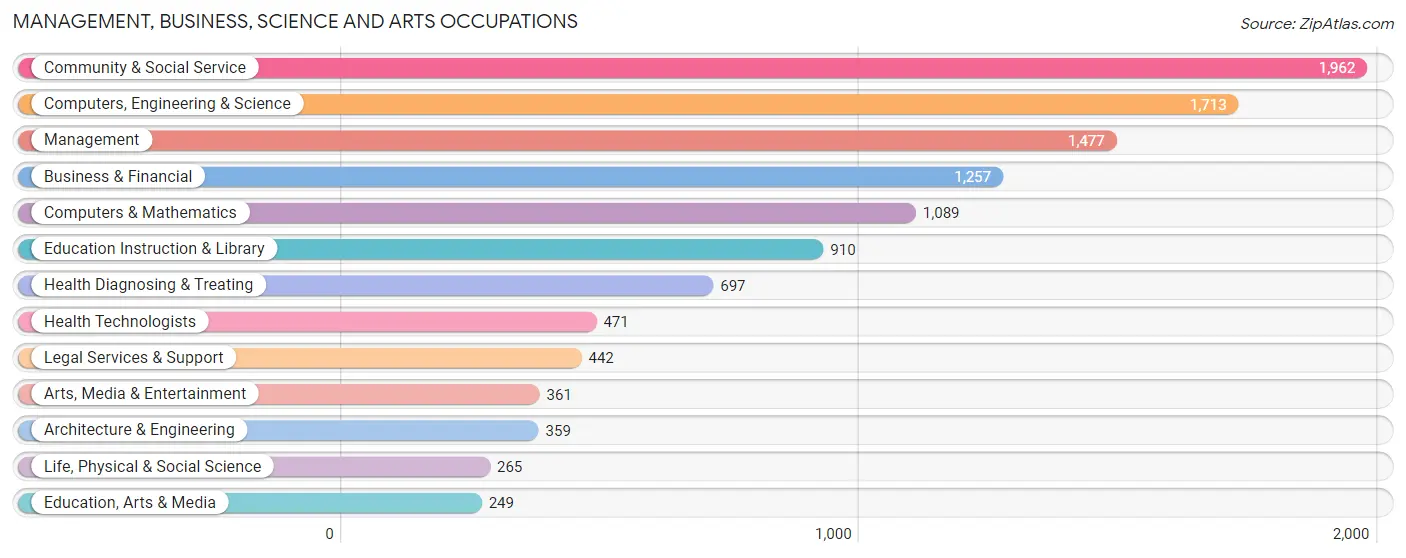
Management, Business, Science and Arts Occupations
The most common Management, Business, Science and Arts occupations in West Springfield are Community & Social Service (1,962 | 16.1%), Computers, Engineering & Science (1,713 | 14.1%), Management (1,477 | 12.1%), Business & Financial (1,257 | 10.3%), and Computers & Mathematics (1,089 | 9.0%).
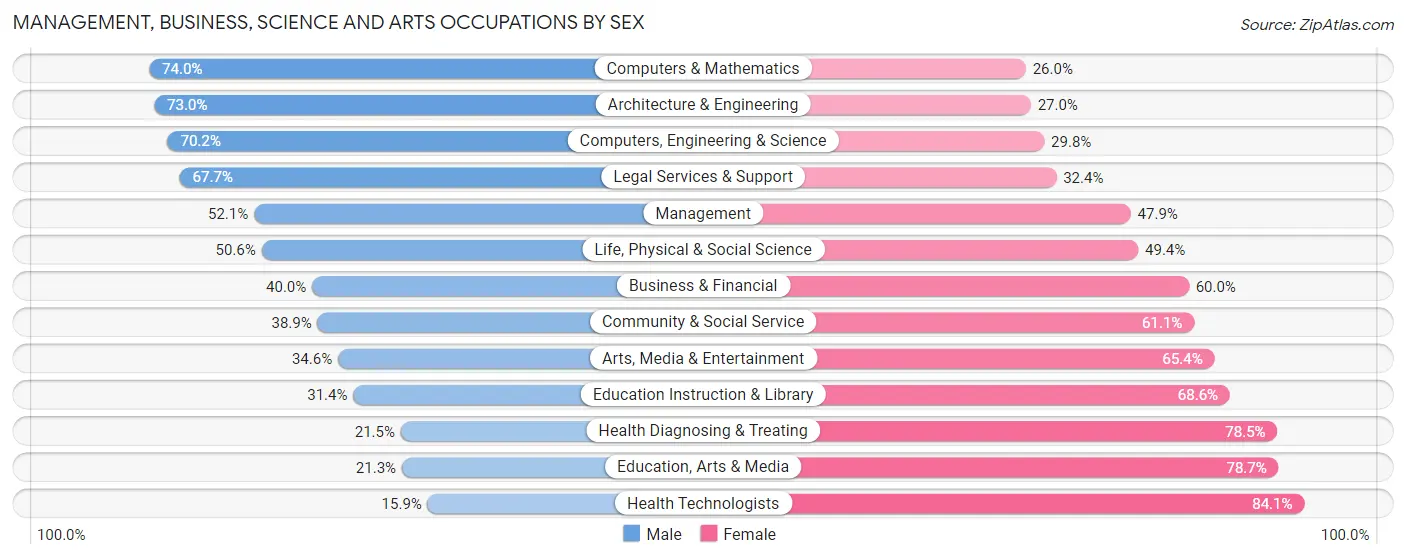
Management, Business, Science and Arts Occupations by Sex
Within the Management, Business, Science and Arts occupations in West Springfield, the most male-oriented occupations are Computers & Mathematics (74.0%), Architecture & Engineering (73.0%), and Computers, Engineering & Science (70.2%), while the most female-oriented occupations are Health Technologists (84.1%), Education, Arts & Media (78.7%), and Health Diagnosing & Treating (78.5%).
| Occupation | Male | Female |
| Management | 770 (52.1%) | 707 (47.9%) |
| Business & Financial | 503 (40.0%) | 754 (60.0%) |
| Computers, Engineering & Science | 1,202 (70.2%) | 511 (29.8%) |
| Computers & Mathematics | 806 (74.0%) | 283 (26.0%) |
| Architecture & Engineering | 262 (73.0%) | 97 (27.0%) |
| Life, Physical & Social Science | 134 (50.6%) | 131 (49.4%) |
| Community & Social Service | 763 (38.9%) | 1,199 (61.1%) |
| Education, Arts & Media | 53 (21.3%) | 196 (78.7%) |
| Legal Services & Support | 299 (67.6%) | 143 (32.4%) |
| Education Instruction & Library | 286 (31.4%) | 624 (68.6%) |
| Arts, Media & Entertainment | 125 (34.6%) | 236 (65.4%) |
| Health Diagnosing & Treating | 150 (21.5%) | 547 (78.5%) |
| Health Technologists | 75 (15.9%) | 396 (84.1%) |
| Total (Category) | 3,388 (47.7%) | 3,718 (52.3%) |
| Total (Overall) | 6,337 (52.1%) | 5,819 (47.9%) |
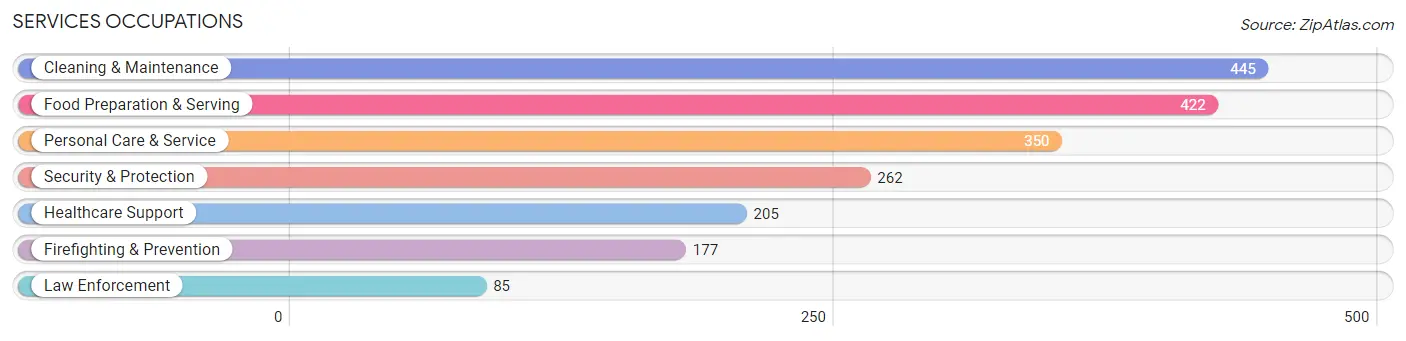
Services Occupations
The most common Services occupations in West Springfield are Cleaning & Maintenance (445 | 3.7%), Food Preparation & Serving (422 | 3.5%), Personal Care & Service (350 | 2.9%), Security & Protection (262 | 2.2%), and Healthcare Support (205 | 1.7%).
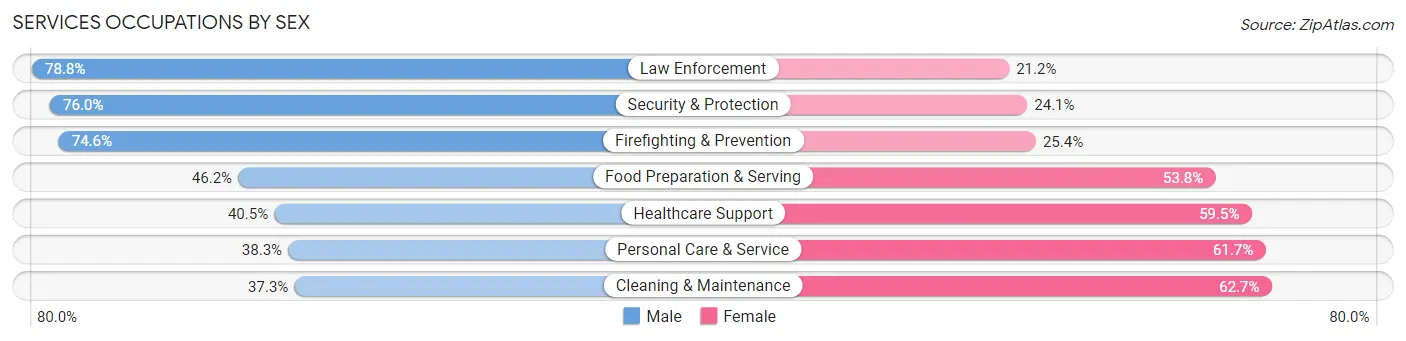
Services Occupations by Sex
Within the Services occupations in West Springfield, the most male-oriented occupations are Law Enforcement (78.8%), Security & Protection (75.9%), and Firefighting & Prevention (74.6%), while the most female-oriented occupations are Cleaning & Maintenance (62.7%), Personal Care & Service (61.7%), and Healthcare Support (59.5%).
| Occupation | Male | Female |
| Healthcare Support | 83 (40.5%) | 122 (59.5%) |
| Security & Protection | 199 (75.9%) | 63 (24.0%) |
| Firefighting & Prevention | 132 (74.6%) | 45 (25.4%) |
| Law Enforcement | 67 (78.8%) | 18 (21.2%) |
| Food Preparation & Serving | 195 (46.2%) | 227 (53.8%) |
| Cleaning & Maintenance | 166 (37.3%) | 279 (62.7%) |
| Personal Care & Service | 134 (38.3%) | 216 (61.7%) |
| Total (Category) | 777 (46.1%) | 907 (53.9%) |
| Total (Overall) | 6,337 (52.1%) | 5,819 (47.9%) |
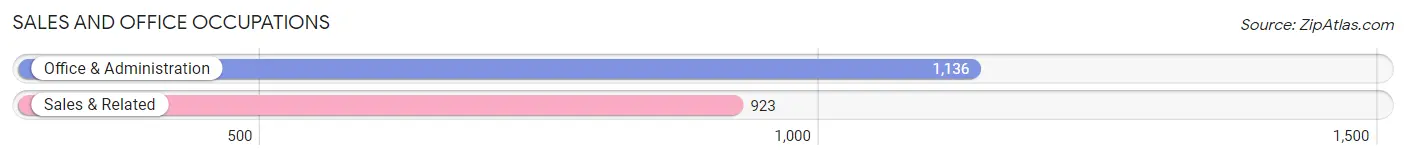
Sales and Office Occupations
The most common Sales and Office occupations in West Springfield are Office & Administration (1,136 | 9.3%), and Sales & Related (923 | 7.6%).
Sales and Office Occupations by Sex
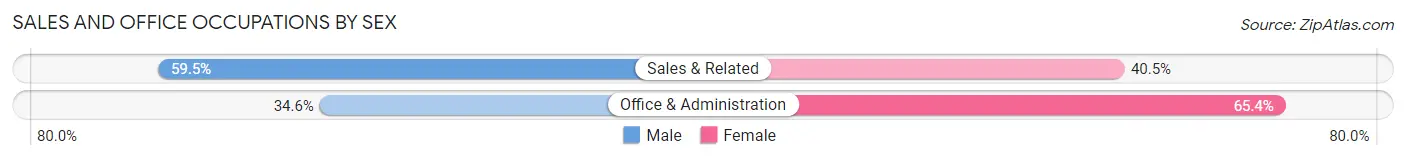
| Occupation | Male | Female |
| Sales & Related | 549 (59.5%) | 374 (40.5%) |
| Office & Administration | 393 (34.6%) | 743 (65.4%) |
| Total (Category) | 942 (45.8%) | 1,117 (54.2%) |
| Total (Overall) | 6,337 (52.1%) | 5,819 (47.9%) |
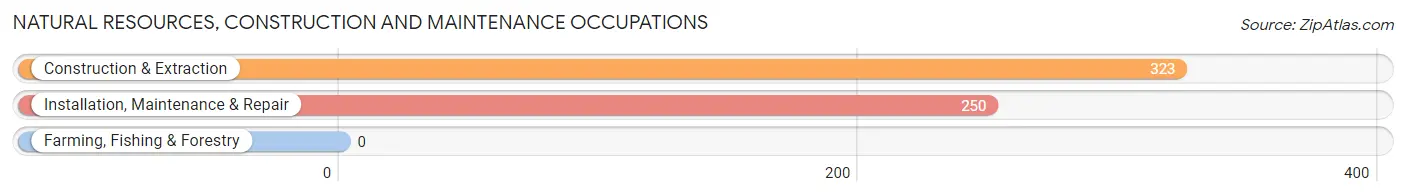
Natural Resources, Construction and Maintenance Occupations
The most common Natural Resources, Construction and Maintenance occupations in West Springfield are Construction & Extraction (323 | 2.7%), and Installation, Maintenance & Repair (250 | 2.1%).
Natural Resources, Construction and Maintenance Occupations by Sex
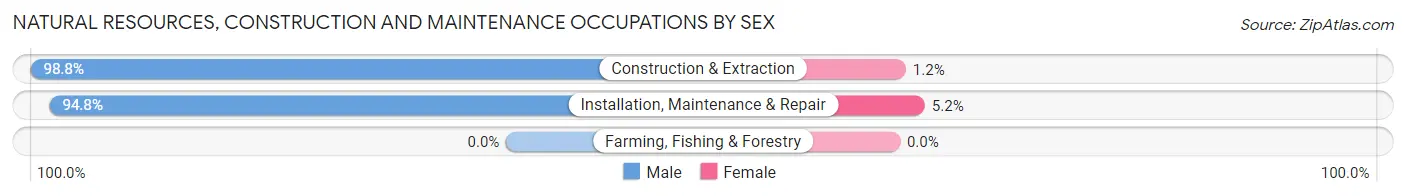
| Occupation | Male | Female |
| Farming, Fishing & Forestry | 0 (0.0%) | 0 (0.0%) |
| Construction & Extraction | 319 (98.8%) | 4 (1.2%) |
| Installation, Maintenance & Repair | 237 (94.8%) | 13 (5.2%) |
| Total (Category) | 556 (97.0%) | 17 (3.0%) |
| Total (Overall) | 6,337 (52.1%) | 5,819 (47.9%) |
Production, Transportation and Moving Occupations
The most common Production, Transportation and Moving occupations in West Springfield are Transportation (330 | 2.7%), Material Moving (298 | 2.5%), and Production (106 | 0.9%).
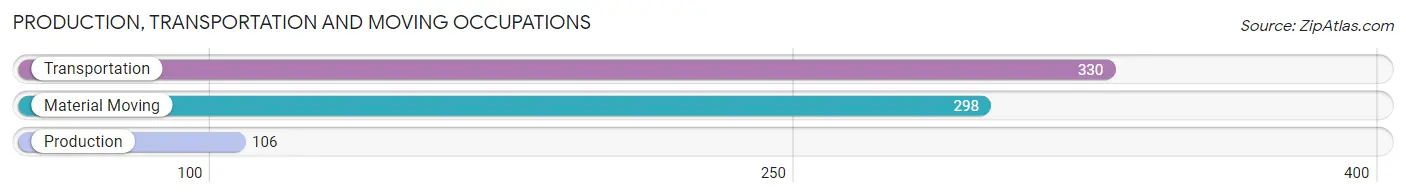
Production, Transportation and Moving Occupations by Sex
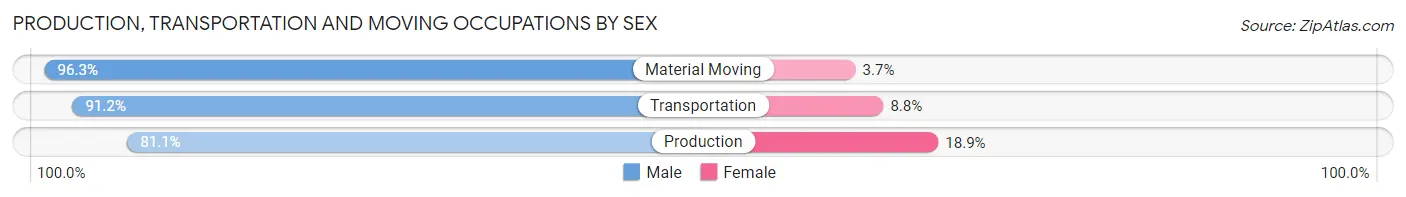
| Occupation | Male | Female |
| Production | 86 (81.1%) | 20 (18.9%) |
| Transportation | 301 (91.2%) | 29 (8.8%) |
| Material Moving | 287 (96.3%) | 11 (3.7%) |
| Total (Category) | 674 (91.8%) | 60 (8.2%) |
| Total (Overall) | 6,337 (52.1%) | 5,819 (47.9%) |
Employment Industries by Sex in West Springfield
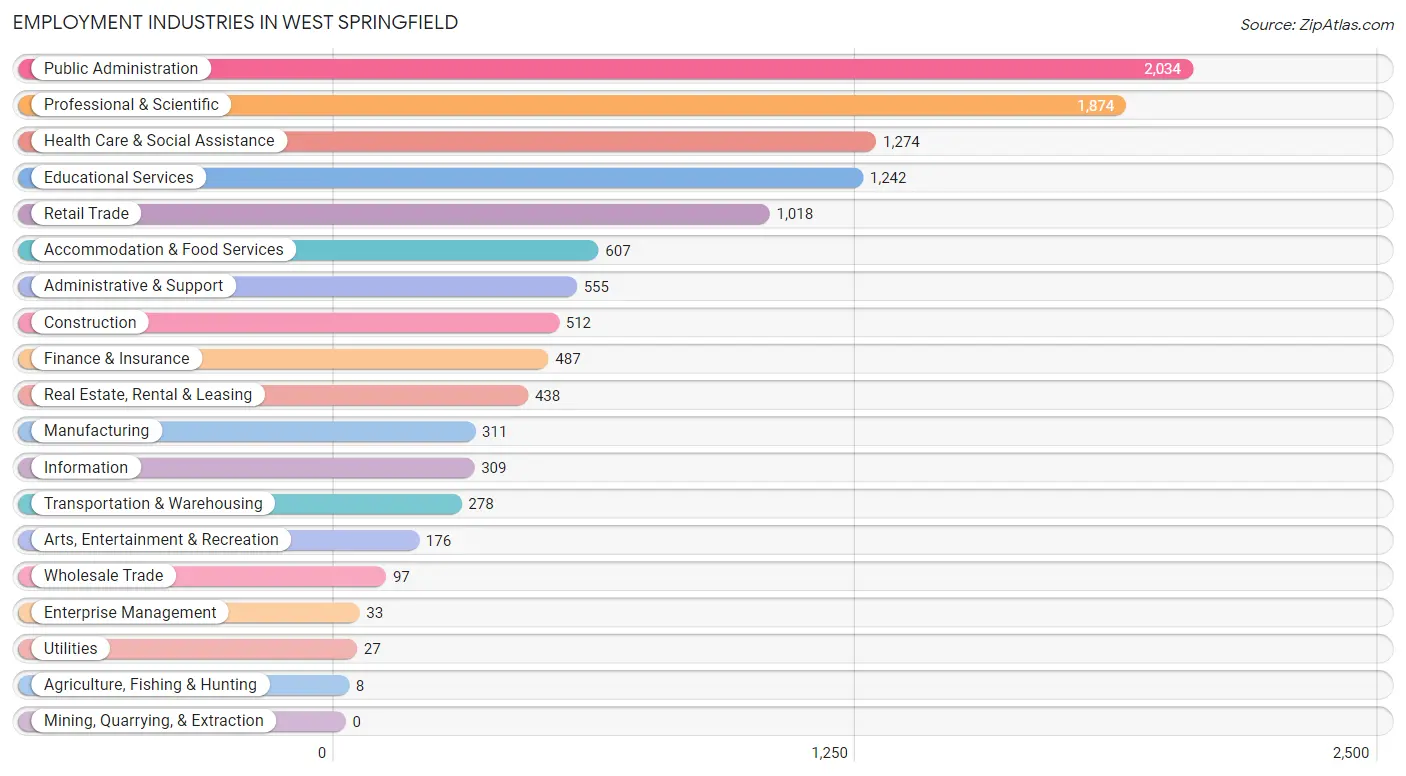
Employment Industries in West Springfield
The major employment industries in West Springfield include Public Administration (2,034 | 16.7%), Professional & Scientific (1,874 | 15.4%), Health Care & Social Assistance (1,274 | 10.5%), Educational Services (1,242 | 10.2%), and Retail Trade (1,018 | 8.4%).
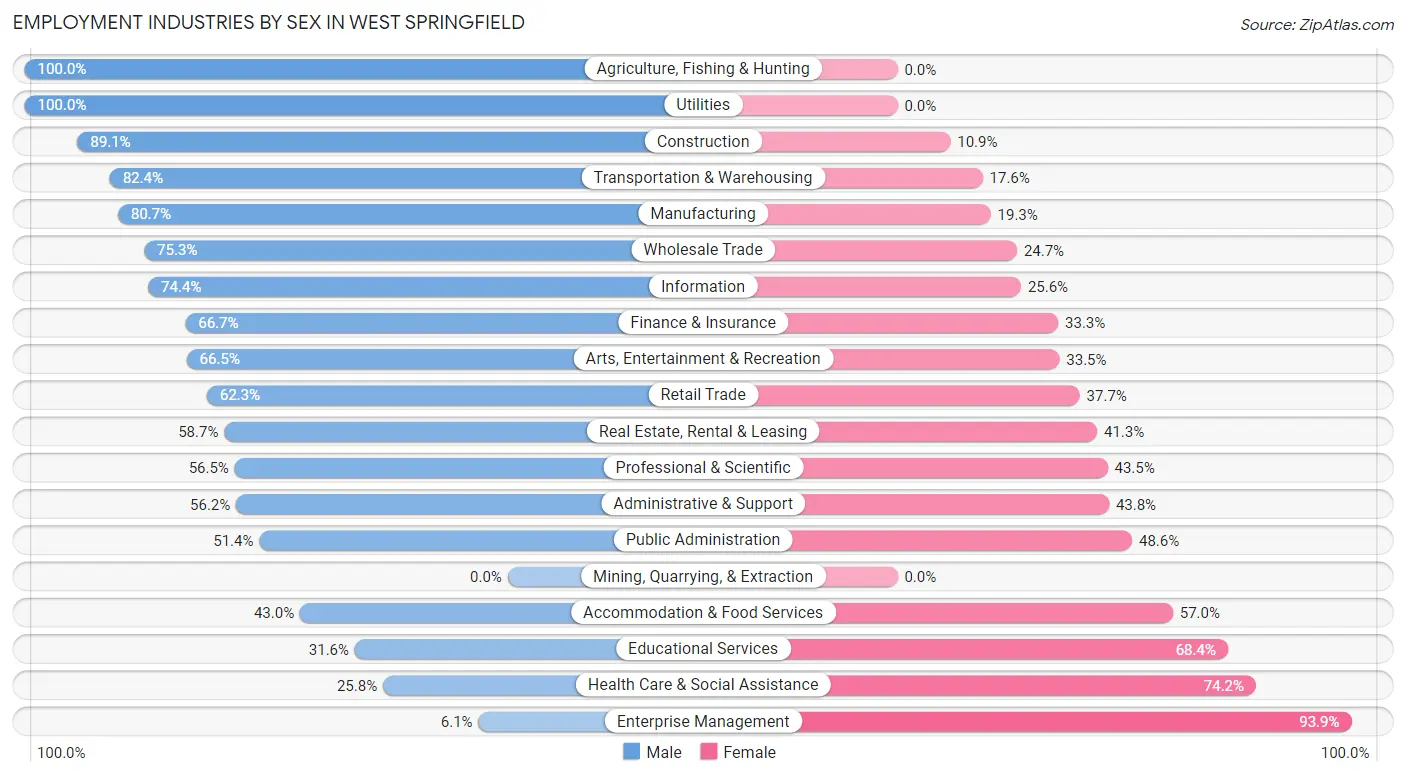
Employment Industries by Sex in West Springfield
The West Springfield industries that see more men than women are Agriculture, Fishing & Hunting (100.0%), Utilities (100.0%), and Construction (89.1%), whereas the industries that tend to have a higher number of women are Enterprise Management (93.9%), Health Care & Social Assistance (74.2%), and Educational Services (68.4%).
| Industry | Male | Female |
| Agriculture, Fishing & Hunting | 8 (100.0%) | 0 (0.0%) |
| Mining, Quarrying, & Extraction | 0 (0.0%) | 0 (0.0%) |
| Construction | 456 (89.1%) | 56 (10.9%) |
| Manufacturing | 251 (80.7%) | 60 (19.3%) |
| Wholesale Trade | 73 (75.3%) | 24 (24.7%) |
| Retail Trade | 634 (62.3%) | 384 (37.7%) |
| Transportation & Warehousing | 229 (82.4%) | 49 (17.6%) |
| Utilities | 27 (100.0%) | 0 (0.0%) |
| Information | 230 (74.4%) | 79 (25.6%) |
| Finance & Insurance | 325 (66.7%) | 162 (33.3%) |
| Real Estate, Rental & Leasing | 257 (58.7%) | 181 (41.3%) |
| Professional & Scientific | 1,059 (56.5%) | 815 (43.5%) |
| Enterprise Management | 2 (6.1%) | 31 (93.9%) |
| Administrative & Support | 312 (56.2%) | 243 (43.8%) |
| Educational Services | 393 (31.6%) | 849 (68.4%) |
| Health Care & Social Assistance | 329 (25.8%) | 945 (74.2%) |
| Arts, Entertainment & Recreation | 117 (66.5%) | 59 (33.5%) |
| Accommodation & Food Services | 261 (43.0%) | 346 (57.0%) |
| Public Administration | 1,046 (51.4%) | 988 (48.6%) |
| Total | 6,337 (52.1%) | 5,819 (47.9%) |
Education in West Springfield
School Enrollment in West Springfield
The most common levels of schooling among the 6,838 students in West Springfield are high school (1,973 | 28.8%), elementary school (1,406 | 20.6%), and middle school (1,203 | 17.6%).
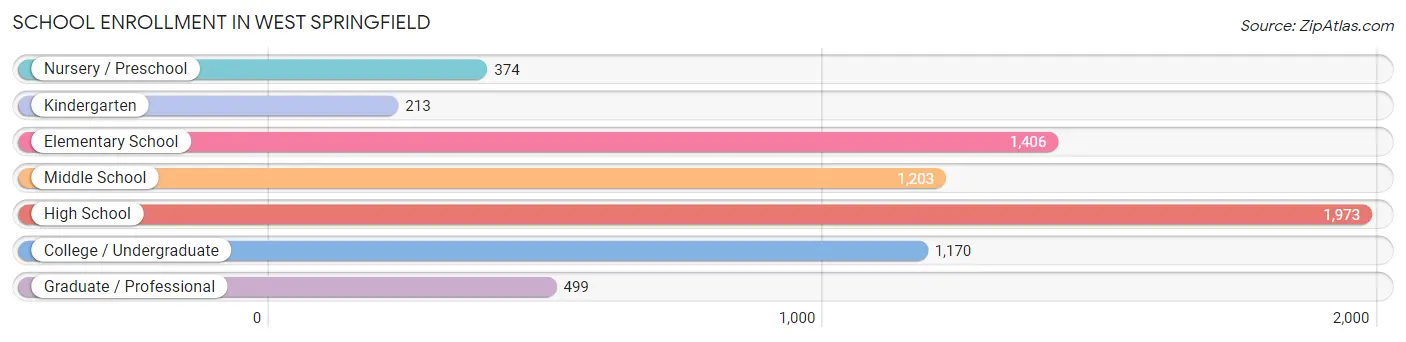
| School Level | # Students | % Students |
| Nursery / Preschool | 374 | 5.5% |
| Kindergarten | 213 | 3.1% |
| Elementary School | 1,406 | 20.6% |
| Middle School | 1,203 | 17.6% |
| High School | 1,973 | 28.8% |
| College / Undergraduate | 1,170 | 17.1% |
| Graduate / Professional | 499 | 7.3% |
| Total | 6,838 | 100.0% |
School Enrollment by Age by Funding Source in West Springfield
Out of a total of 6,838 students who are enrolled in schools in West Springfield, 889 (13.0%) attend a private institution, while the remaining 5,949 (87.0%) are enrolled in public schools. The age group of 3 to 4 year olds has the highest likelihood of being enrolled in private schools, with 266 (77.8% in the age bracket) enrolled. Conversely, the age group of 15 to 17 year olds has the lowest likelihood of being enrolled in a private school, with 1,532 (99.6% in the age bracket) attending a public institution.
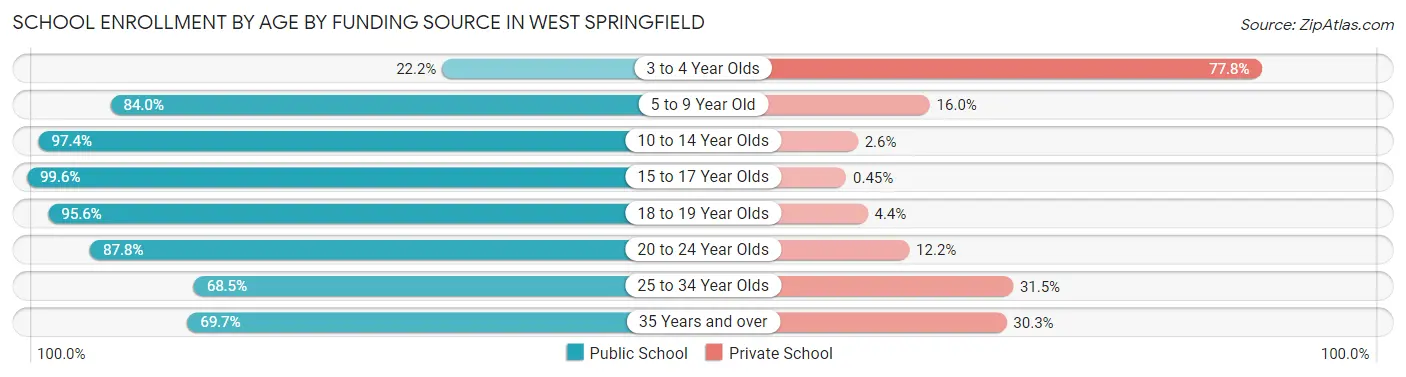
| Age Bracket | Public School | Private School |
| 3 to 4 Year Olds | 76 (22.2%) | 266 (77.8%) |
| 5 to 9 Year Old | 1,185 (84.0%) | 226 (16.0%) |
| 10 to 14 Year Olds | 1,637 (97.4%) | 44 (2.6%) |
| 15 to 17 Year Olds | 1,532 (99.6%) | 7 (0.4%) |
| 18 to 19 Year Olds | 452 (95.6%) | 21 (4.4%) |
| 20 to 24 Year Olds | 475 (87.8%) | 66 (12.2%) |
| 25 to 34 Year Olds | 228 (68.5%) | 105 (31.5%) |
| 35 Years and over | 361 (69.7%) | 157 (30.3%) |
| Total | 5,949 (87.0%) | 889 (13.0%) |
Educational Attainment by Field of Study in West Springfield
Business (1,730 | 16.1%), social sciences (1,533 | 14.3%), engineering (1,108 | 10.3%), psychology (757 | 7.0%), and literature & languages (722 | 6.7%) are the most common fields of study among 10,746 individuals in West Springfield who have obtained a bachelor's degree or higher.
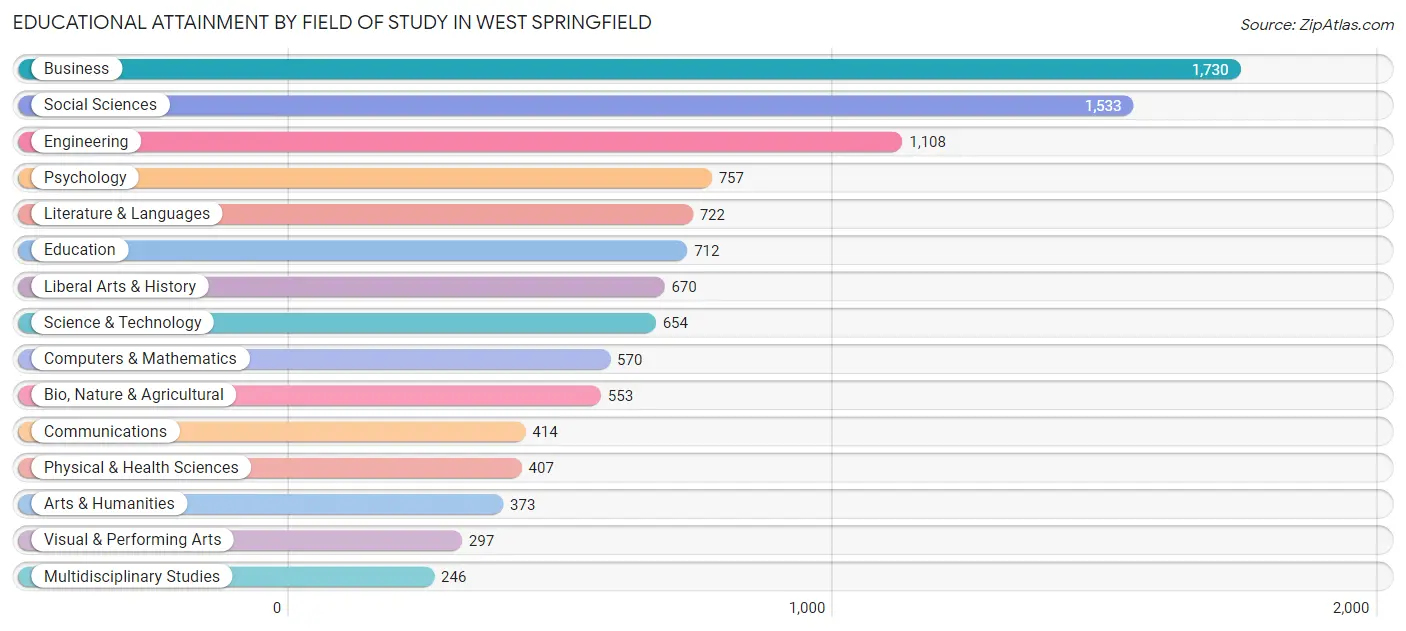
| Field of Study | # Graduates | % Graduates |
| Computers & Mathematics | 570 | 5.3% |
| Bio, Nature & Agricultural | 553 | 5.1% |
| Physical & Health Sciences | 407 | 3.8% |
| Psychology | 757 | 7.0% |
| Social Sciences | 1,533 | 14.3% |
| Engineering | 1,108 | 10.3% |
| Multidisciplinary Studies | 246 | 2.3% |
| Science & Technology | 654 | 6.1% |
| Business | 1,730 | 16.1% |
| Education | 712 | 6.6% |
| Literature & Languages | 722 | 6.7% |
| Liberal Arts & History | 670 | 6.2% |
| Visual & Performing Arts | 297 | 2.8% |
| Communications | 414 | 3.8% |
| Arts & Humanities | 373 | 3.5% |
| Total | 10,746 | 100.0% |
Transportation & Commute in West Springfield
Vehicle Availability by Sex in West Springfield
The most prevalent vehicle ownership categories in West Springfield are males with 2 vehicles (3,180, accounting for 48.6%) and females with 2 vehicles (2,543, making up 55.5%).
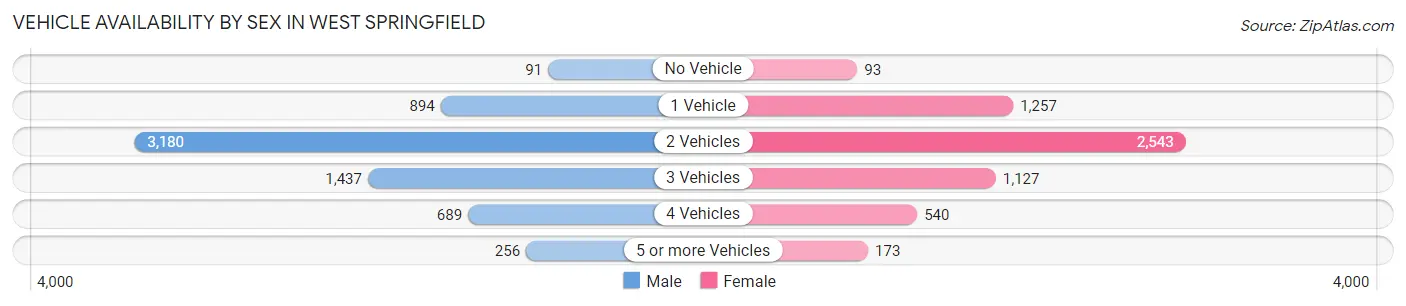
| Vehicles Available | Male | Female |
| No Vehicle | 91 (1.4%) | 93 (1.6%) |
| 1 Vehicle | 894 (13.7%) | 1,257 (21.9%) |
| 2 Vehicles | 3,180 (48.6%) | 2,543 (44.4%) |
| 3 Vehicles | 1,437 (22.0%) | 1,127 (19.7%) |
| 4 Vehicles | 689 (10.5%) | 540 (9.4%) |
| 5 or more Vehicles | 256 (3.9%) | 173 (3.0%) |
| Total | 6,547 (100.0%) | 5,733 (100.0%) |
Commute Time in West Springfield
The most frequently occuring commute durations in West Springfield are 30 to 34 minutes (1,957 commuters, 19.1%), 20 to 24 minutes (1,340 commuters, 13.1%), and 45 to 59 minutes (1,139 commuters, 11.1%).
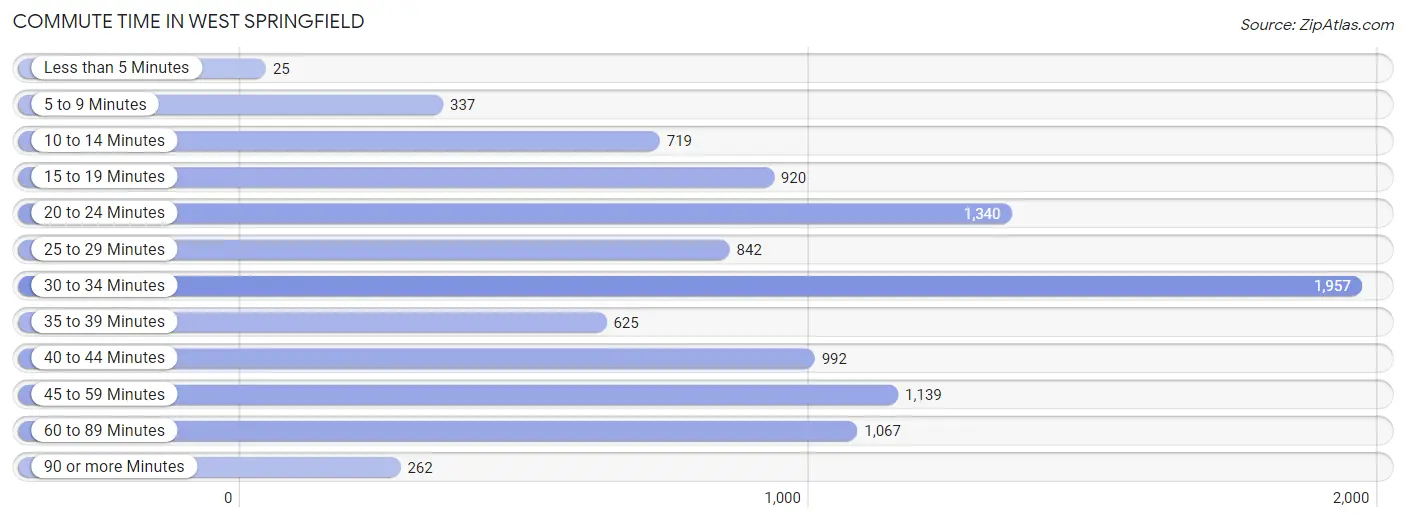
| Commute Time | # Commuters | % Commuters |
| Less than 5 Minutes | 25 | 0.2% |
| 5 to 9 Minutes | 337 | 3.3% |
| 10 to 14 Minutes | 719 | 7.0% |
| 15 to 19 Minutes | 920 | 9.0% |
| 20 to 24 Minutes | 1,340 | 13.1% |
| 25 to 29 Minutes | 842 | 8.2% |
| 30 to 34 Minutes | 1,957 | 19.1% |
| 35 to 39 Minutes | 625 | 6.1% |
| 40 to 44 Minutes | 992 | 9.7% |
| 45 to 59 Minutes | 1,139 | 11.1% |
| 60 to 89 Minutes | 1,067 | 10.4% |
| 90 or more Minutes | 262 | 2.6% |
Commute Time by Sex in West Springfield
The most common commute times in West Springfield are 30 to 34 minutes (1,078 commuters, 19.6%) for males and 30 to 34 minutes (879 commuters, 18.6%) for females.
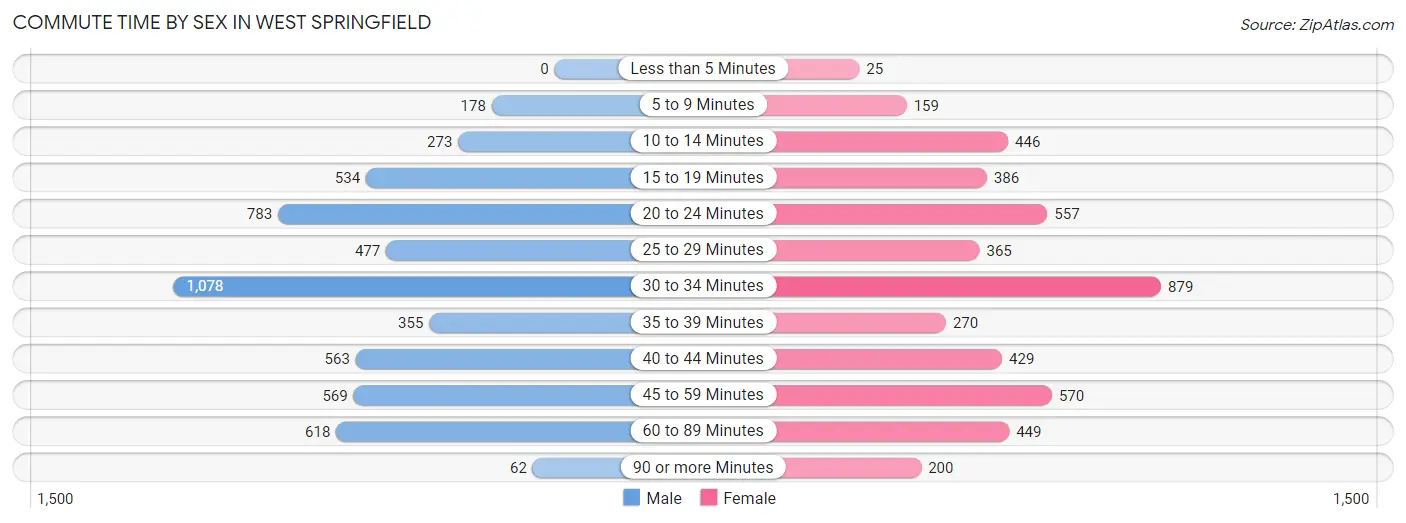
| Commute Time | Male | Female |
| Less than 5 Minutes | 0 (0.0%) | 25 (0.5%) |
| 5 to 9 Minutes | 178 (3.2%) | 159 (3.4%) |
| 10 to 14 Minutes | 273 (5.0%) | 446 (9.4%) |
| 15 to 19 Minutes | 534 (9.7%) | 386 (8.2%) |
| 20 to 24 Minutes | 783 (14.3%) | 557 (11.8%) |
| 25 to 29 Minutes | 477 (8.7%) | 365 (7.7%) |
| 30 to 34 Minutes | 1,078 (19.6%) | 879 (18.6%) |
| 35 to 39 Minutes | 355 (6.5%) | 270 (5.7%) |
| 40 to 44 Minutes | 563 (10.3%) | 429 (9.1%) |
| 45 to 59 Minutes | 569 (10.4%) | 570 (12.0%) |
| 60 to 89 Minutes | 618 (11.3%) | 449 (9.5%) |
| 90 or more Minutes | 62 (1.1%) | 200 (4.2%) |
Time of Departure to Work by Sex in West Springfield
The most frequent times of departure to work in West Springfield are 6:00 AM to 6:29 AM (809, 14.7%) for males and 7:00 AM to 7:29 AM (827, 17.5%) for females.
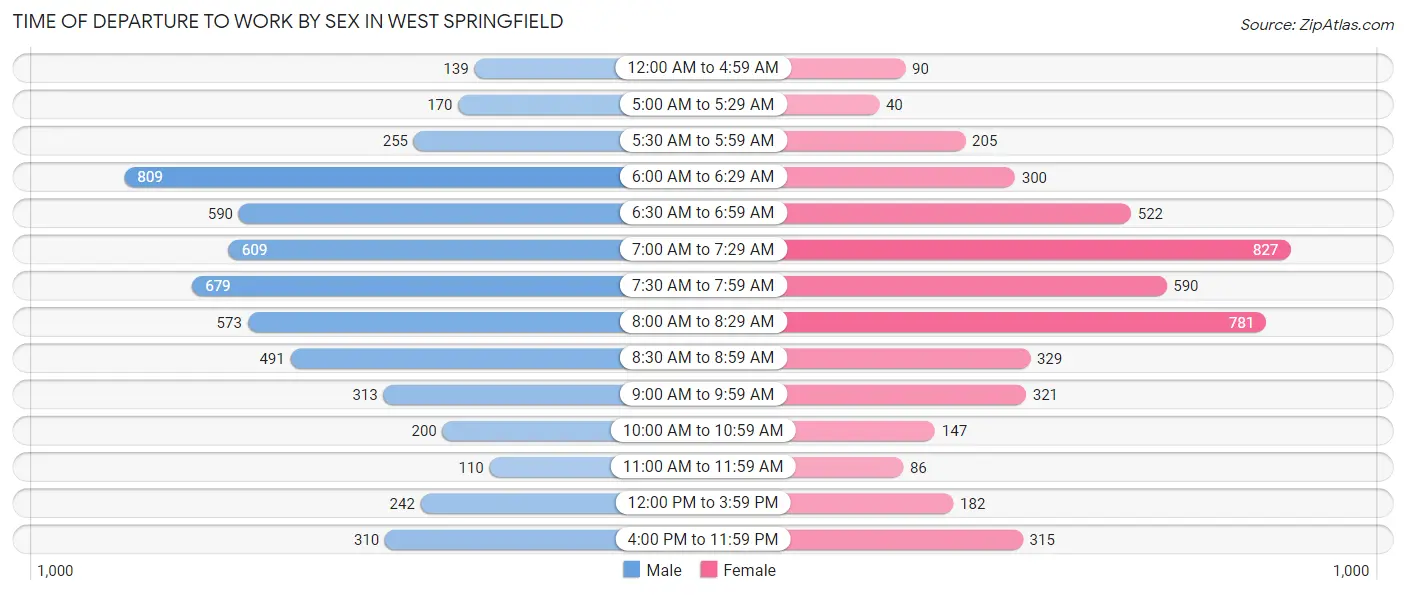
| Time of Departure | Male | Female |
| 12:00 AM to 4:59 AM | 139 (2.5%) | 90 (1.9%) |
| 5:00 AM to 5:29 AM | 170 (3.1%) | 40 (0.8%) |
| 5:30 AM to 5:59 AM | 255 (4.6%) | 205 (4.3%) |
| 6:00 AM to 6:29 AM | 809 (14.7%) | 300 (6.3%) |
| 6:30 AM to 6:59 AM | 590 (10.7%) | 522 (11.0%) |
| 7:00 AM to 7:29 AM | 609 (11.1%) | 827 (17.5%) |
| 7:30 AM to 7:59 AM | 679 (12.4%) | 590 (12.5%) |
| 8:00 AM to 8:29 AM | 573 (10.4%) | 781 (16.5%) |
| 8:30 AM to 8:59 AM | 491 (8.9%) | 329 (7.0%) |
| 9:00 AM to 9:59 AM | 313 (5.7%) | 321 (6.8%) |
| 10:00 AM to 10:59 AM | 200 (3.6%) | 147 (3.1%) |
| 11:00 AM to 11:59 AM | 110 (2.0%) | 86 (1.8%) |
| 12:00 PM to 3:59 PM | 242 (4.4%) | 182 (3.8%) |
| 4:00 PM to 11:59 PM | 310 (5.7%) | 315 (6.7%) |
| Total | 5,490 (100.0%) | 4,735 (100.0%) |
Housing Occupancy in West Springfield
Occupancy by Ownership in West Springfield
Of the total 7,776 dwellings in West Springfield, owner-occupied units account for 6,276 (80.7%), while renter-occupied units make up 1,500 (19.3%).
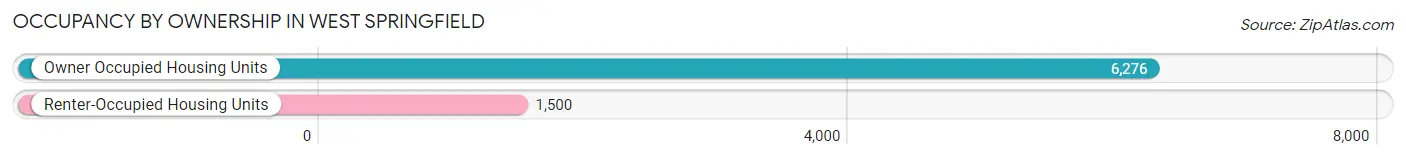
| Occupancy | # Housing Units | % Housing Units |
| Owner Occupied Housing Units | 6,276 | 80.7% |
| Renter-Occupied Housing Units | 1,500 | 19.3% |
| Total Occupied Housing Units | 7,776 | 100.0% |
Occupancy by Household Size in West Springfield
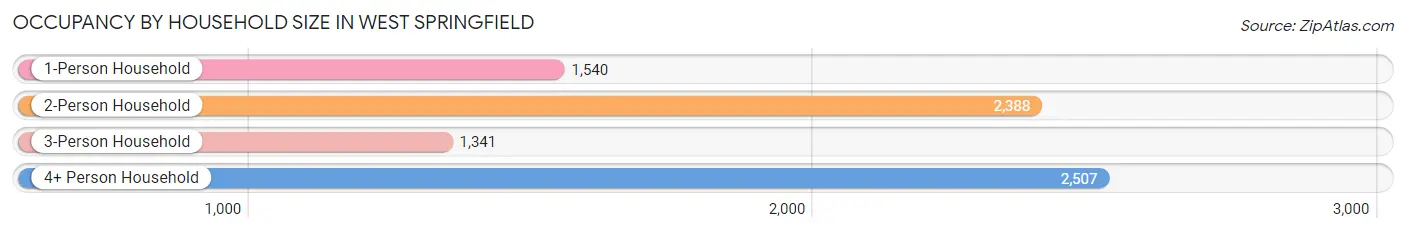
| Household Size | # Housing Units | % Housing Units |
| 1-Person Household | 1,540 | 19.8% |
| 2-Person Household | 2,388 | 30.7% |
| 3-Person Household | 1,341 | 17.2% |
| 4+ Person Household | 2,507 | 32.2% |
| Total Housing Units | 7,776 | 100.0% |
Occupancy by Ownership by Household Size in West Springfield
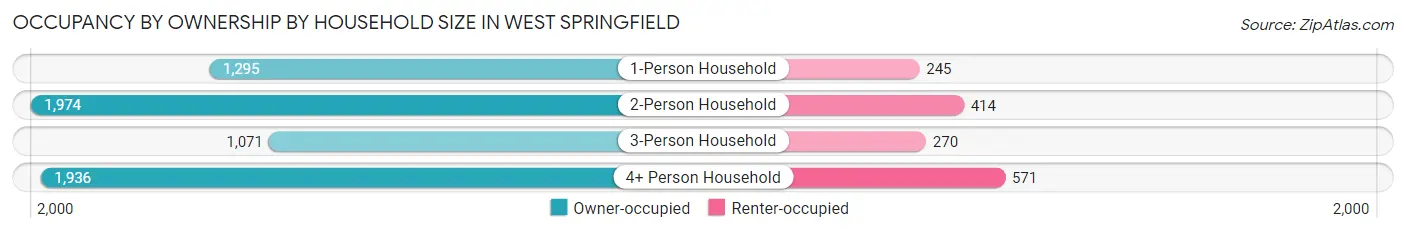
| Household Size | Owner-occupied | Renter-occupied |
| 1-Person Household | 1,295 (84.1%) | 245 (15.9%) |
| 2-Person Household | 1,974 (82.7%) | 414 (17.3%) |
| 3-Person Household | 1,071 (79.9%) | 270 (20.1%) |
| 4+ Person Household | 1,936 (77.2%) | 571 (22.8%) |
| Total Housing Units | 6,276 (80.7%) | 1,500 (19.3%) |
Occupancy by Educational Attainment in West Springfield
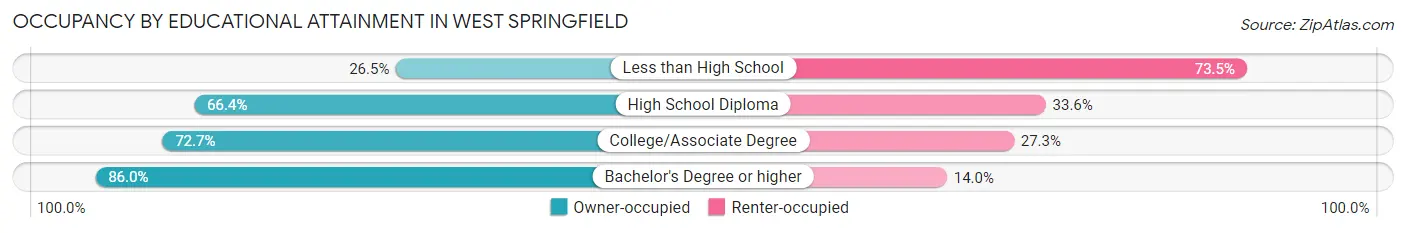
| Household Size | Owner-occupied | Renter-occupied |
| Less than High School | 48 (26.5%) | 133 (73.5%) |
| High School Diploma | 423 (66.4%) | 214 (33.6%) |
| College/Associate Degree | 978 (72.7%) | 367 (27.3%) |
| Bachelor's Degree or higher | 4,827 (86.0%) | 786 (14.0%) |
Occupancy by Age of Householder in West Springfield
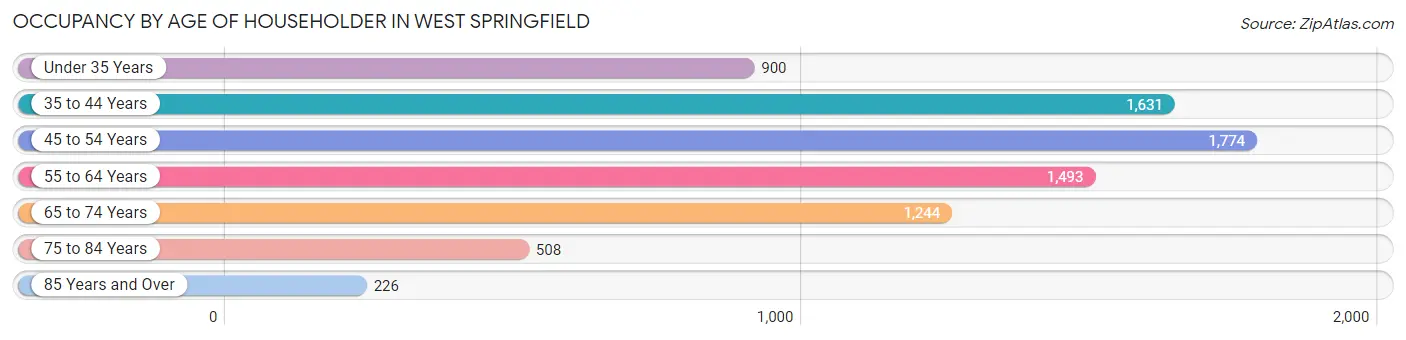
| Age Bracket | # Households | % Households |
| Under 35 Years | 900 | 11.6% |
| 35 to 44 Years | 1,631 | 21.0% |
| 45 to 54 Years | 1,774 | 22.8% |
| 55 to 64 Years | 1,493 | 19.2% |
| 65 to 74 Years | 1,244 | 16.0% |
| 75 to 84 Years | 508 | 6.5% |
| 85 Years and Over | 226 | 2.9% |
| Total | 7,776 | 100.0% |
Housing Finances in West Springfield
Median Income by Occupancy in West Springfield
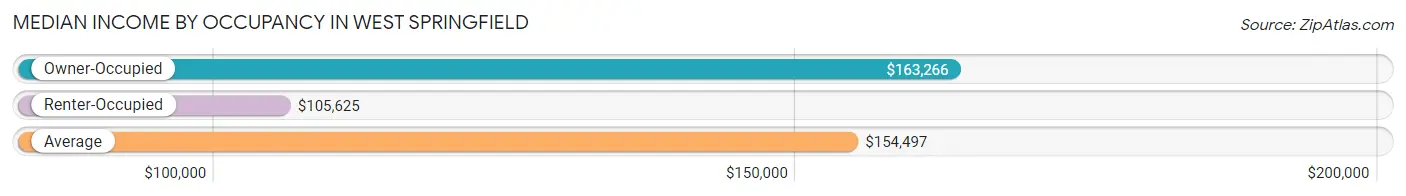
| Occupancy Type | # Households | Median Income |
| Owner-Occupied | 6,276 (80.7%) | $163,266 |
| Renter-Occupied | 1,500 (19.3%) | $105,625 |
| Average | 7,776 (100.0%) | $154,497 |
Occupancy by Householder Income Bracket in West Springfield
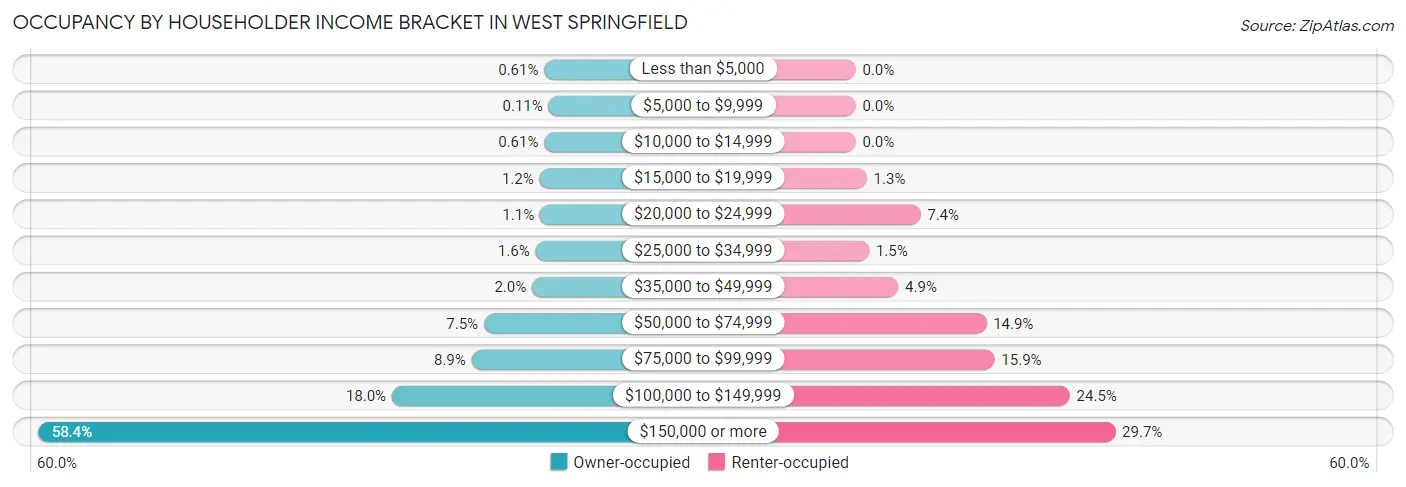
| Income Bracket | Owner-occupied | Renter-occupied |
| Less than $5,000 | 38 (0.6%) | 0 (0.0%) |
| $5,000 to $9,999 | 7 (0.1%) | 0 (0.0%) |
| $10,000 to $14,999 | 38 (0.6%) | 0 (0.0%) |
| $15,000 to $19,999 | 72 (1.1%) | 19 (1.3%) |
| $20,000 to $24,999 | 69 (1.1%) | 111 (7.4%) |
| $25,000 to $34,999 | 101 (1.6%) | 23 (1.5%) |
| $35,000 to $49,999 | 126 (2.0%) | 73 (4.9%) |
| $50,000 to $74,999 | 471 (7.5%) | 224 (14.9%) |
| $75,000 to $99,999 | 560 (8.9%) | 238 (15.9%) |
| $100,000 to $149,999 | 1,131 (18.0%) | 367 (24.5%) |
| $150,000 or more | 3,663 (58.4%) | 445 (29.7%) |
| Total | 6,276 (100.0%) | 1,500 (100.0%) |
Monthly Housing Cost Tiers in West Springfield
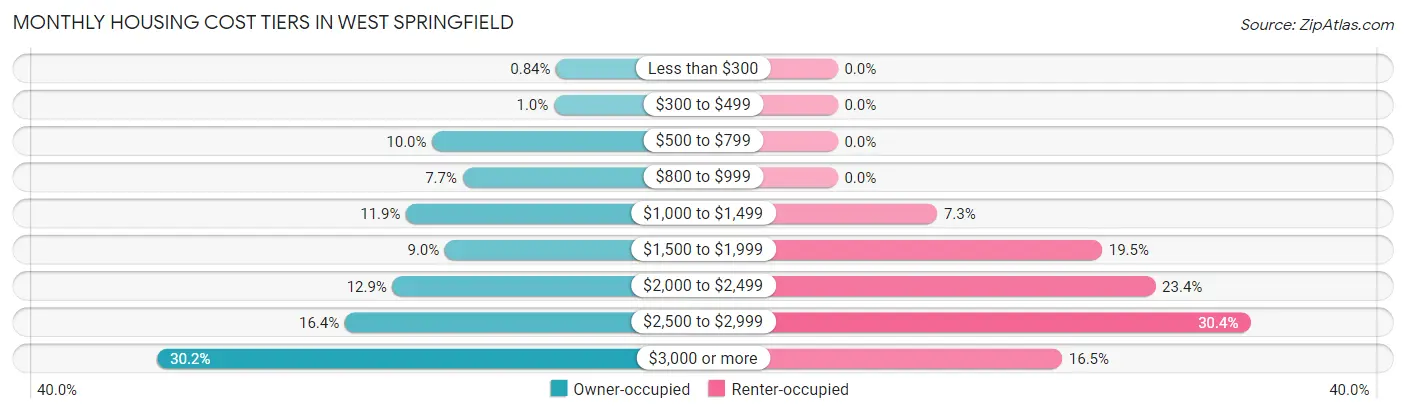
| Monthly Cost | Owner-occupied | Renter-occupied |
| Less than $300 | 53 (0.8%) | 0 (0.0%) |
| $300 to $499 | 63 (1.0%) | 0 (0.0%) |
| $500 to $799 | 626 (10.0%) | 0 (0.0%) |
| $800 to $999 | 485 (7.7%) | 0 (0.0%) |
| $1,000 to $1,499 | 746 (11.9%) | 110 (7.3%) |
| $1,500 to $1,999 | 567 (9.0%) | 292 (19.5%) |
| $2,000 to $2,499 | 809 (12.9%) | 351 (23.4%) |
| $2,500 to $2,999 | 1,029 (16.4%) | 456 (30.4%) |
| $3,000 or more | 1,898 (30.2%) | 248 (16.5%) |
| Total | 6,276 (100.0%) | 1,500 (100.0%) |
Physical Housing Characteristics in West Springfield
Housing Structures in West Springfield
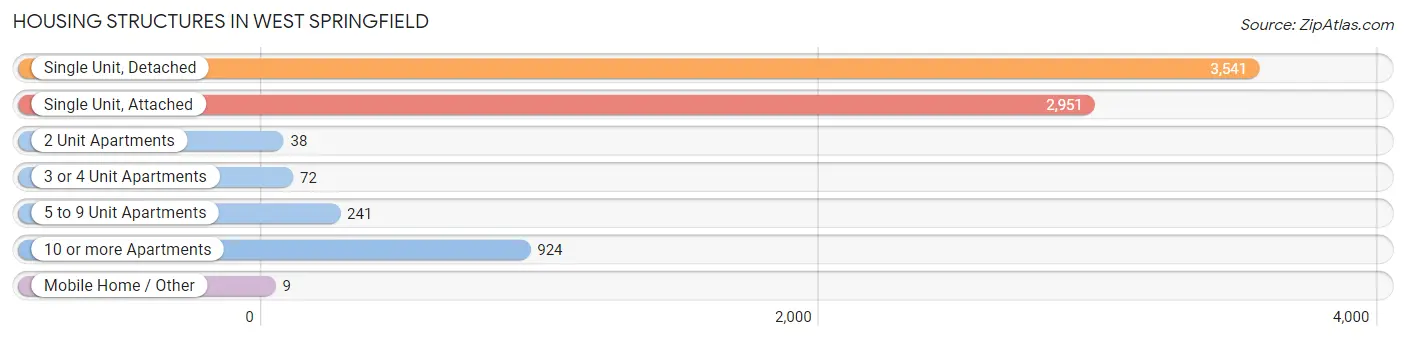
| Structure Type | # Housing Units | % Housing Units |
| Single Unit, Detached | 3,541 | 45.5% |
| Single Unit, Attached | 2,951 | 38.0% |
| 2 Unit Apartments | 38 | 0.5% |
| 3 or 4 Unit Apartments | 72 | 0.9% |
| 5 to 9 Unit Apartments | 241 | 3.1% |
| 10 or more Apartments | 924 | 11.9% |
| Mobile Home / Other | 9 | 0.1% |
| Total | 7,776 | 100.0% |
Housing Structures by Occupancy in West Springfield

| Structure Type | Owner-occupied | Renter-occupied |
| Single Unit, Detached | 3,268 (92.3%) | 273 (7.7%) |
| Single Unit, Attached | 2,363 (80.1%) | 588 (19.9%) |
| 2 Unit Apartments | 38 (100.0%) | 0 (0.0%) |
| 3 or 4 Unit Apartments | 48 (66.7%) | 24 (33.3%) |
| 5 to 9 Unit Apartments | 100 (41.5%) | 141 (58.5%) |
| 10 or more Apartments | 450 (48.7%) | 474 (51.3%) |
| Mobile Home / Other | 9 (100.0%) | 0 (0.0%) |
| Total | 6,276 (80.7%) | 1,500 (19.3%) |
Housing Structures by Number of Rooms in West Springfield
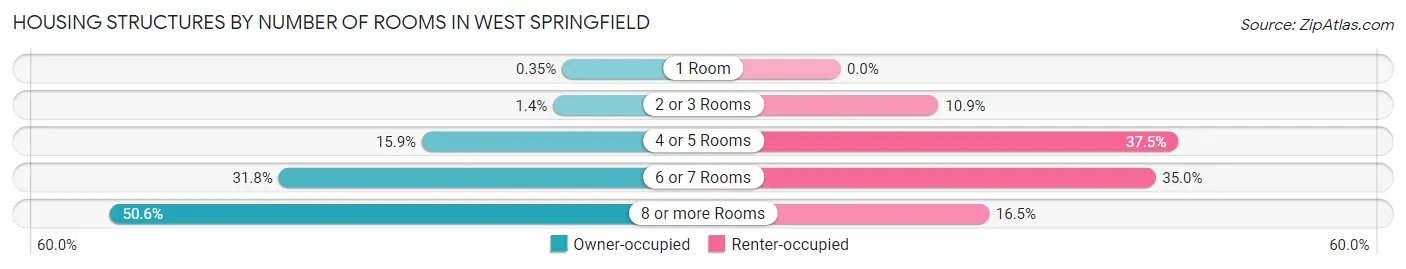
| Number of Rooms | Owner-occupied | Renter-occupied |
| 1 Room | 22 (0.4%) | 0 (0.0%) |
| 2 or 3 Rooms | 85 (1.3%) | 164 (10.9%) |
| 4 or 5 Rooms | 998 (15.9%) | 563 (37.5%) |
| 6 or 7 Rooms | 1,997 (31.8%) | 525 (35.0%) |
| 8 or more Rooms | 3,174 (50.6%) | 248 (16.5%) |
| Total | 6,276 (100.0%) | 1,500 (100.0%) |
Housing Structure by Heating Type in West Springfield
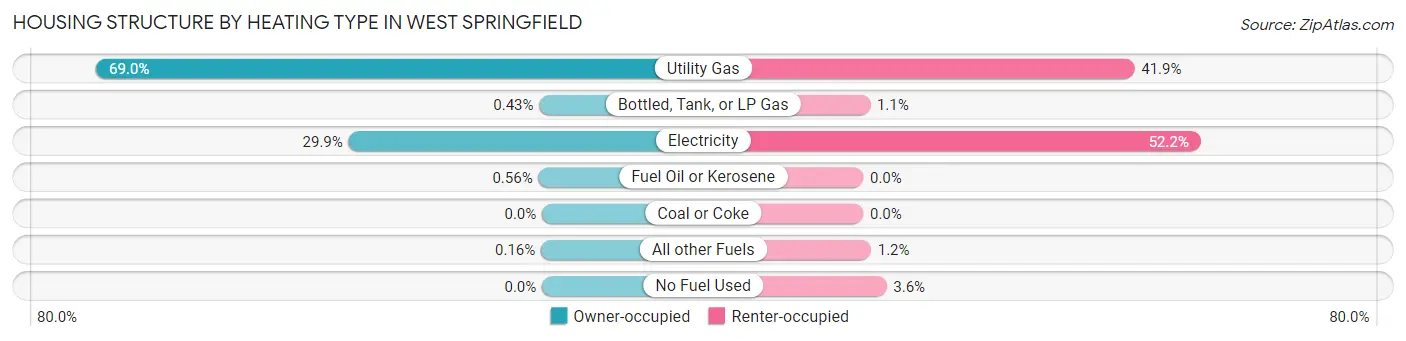
| Heating Type | Owner-occupied | Renter-occupied |
| Utility Gas | 4,327 (69.0%) | 629 (41.9%) |
| Bottled, Tank, or LP Gas | 27 (0.4%) | 16 (1.1%) |
| Electricity | 1,877 (29.9%) | 783 (52.2%) |
| Fuel Oil or Kerosene | 35 (0.6%) | 0 (0.0%) |
| Coal or Coke | 0 (0.0%) | 0 (0.0%) |
| All other Fuels | 10 (0.2%) | 18 (1.2%) |
| No Fuel Used | 0 (0.0%) | 54 (3.6%) |
| Total | 6,276 (100.0%) | 1,500 (100.0%) |
Household Vehicle Usage in West Springfield
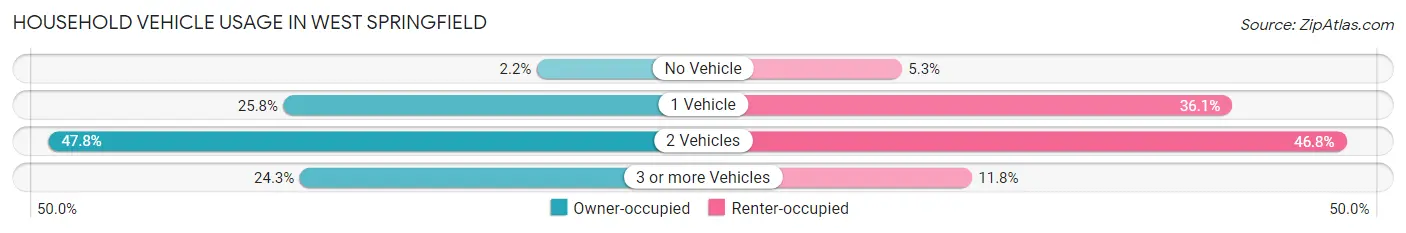
| Vehicles per Household | Owner-occupied | Renter-occupied |
| No Vehicle | 135 (2.1%) | 79 (5.3%) |
| 1 Vehicle | 1,619 (25.8%) | 542 (36.1%) |
| 2 Vehicles | 2,998 (47.8%) | 702 (46.8%) |
| 3 or more Vehicles | 1,524 (24.3%) | 177 (11.8%) |
| Total | 6,276 (100.0%) | 1,500 (100.0%) |
Real Estate & Mortgages in West Springfield
Real Estate and Mortgage Overview in West Springfield
| Characteristic | Without Mortgage | With Mortgage |
| Housing Units | 1,692 | 4,584 |
| Median Property Value | $579,900 | $597,700 |
| Median Household Income | $133,750 | $2,923 |
| Monthly Housing Costs | $868 | $1,898 |
| Real Estate Taxes | $5,851 | $25 |
Property Value by Mortgage Status in West Springfield
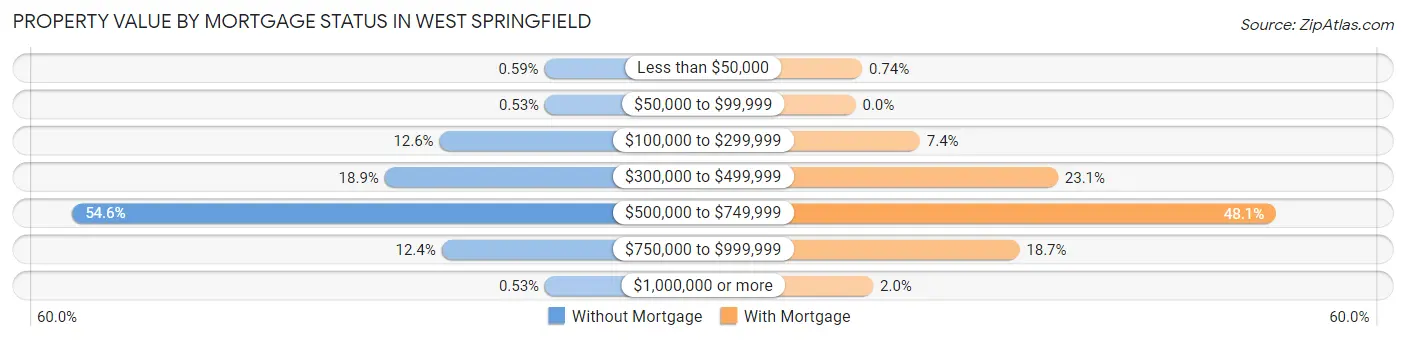
| Property Value | Without Mortgage | With Mortgage |
| Less than $50,000 | 10 (0.6%) | 34 (0.7%) |
| $50,000 to $99,999 | 9 (0.5%) | 0 (0.0%) |
| $100,000 to $299,999 | 213 (12.6%) | 337 (7.3%) |
| $300,000 to $499,999 | 319 (18.9%) | 1,060 (23.1%) |
| $500,000 to $749,999 | 923 (54.5%) | 2,203 (48.1%) |
| $750,000 to $999,999 | 209 (12.3%) | 858 (18.7%) |
| $1,000,000 or more | 9 (0.5%) | 92 (2.0%) |
| Total | 1,692 (100.0%) | 4,584 (100.0%) |
Household Income by Mortgage Status in West Springfield
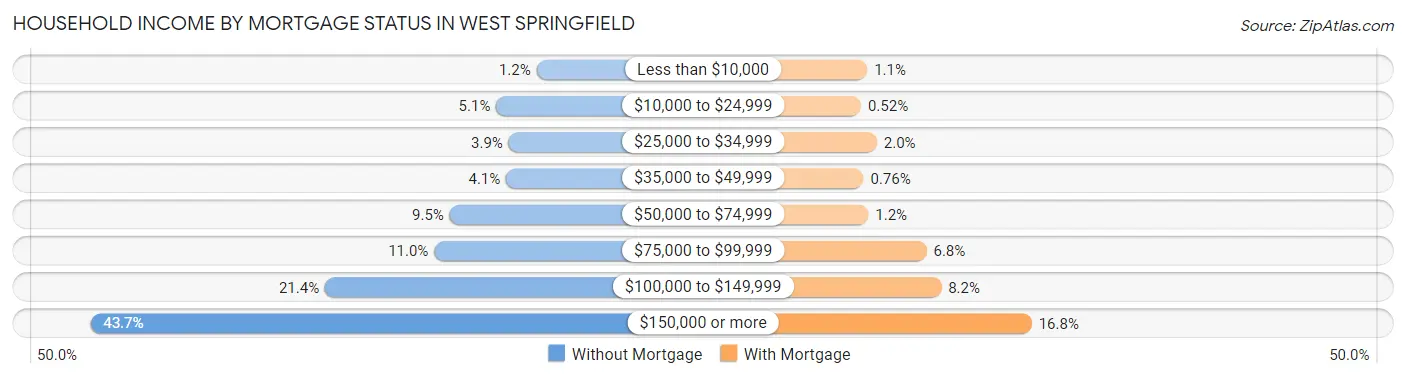
| Household Income | Without Mortgage | With Mortgage |
| Less than $10,000 | 21 (1.2%) | 51 (1.1%) |
| $10,000 to $24,999 | 86 (5.1%) | 24 (0.5%) |
| $25,000 to $34,999 | 66 (3.9%) | 93 (2.0%) |
| $35,000 to $49,999 | 70 (4.1%) | 35 (0.8%) |
| $50,000 to $74,999 | 161 (9.5%) | 56 (1.2%) |
| $75,000 to $99,999 | 186 (11.0%) | 310 (6.8%) |
| $100,000 to $149,999 | 362 (21.4%) | 374 (8.2%) |
| $150,000 or more | 740 (43.7%) | 769 (16.8%) |
| Total | 1,692 (100.0%) | 4,584 (100.0%) |
Property Value to Household Income Ratio in West Springfield
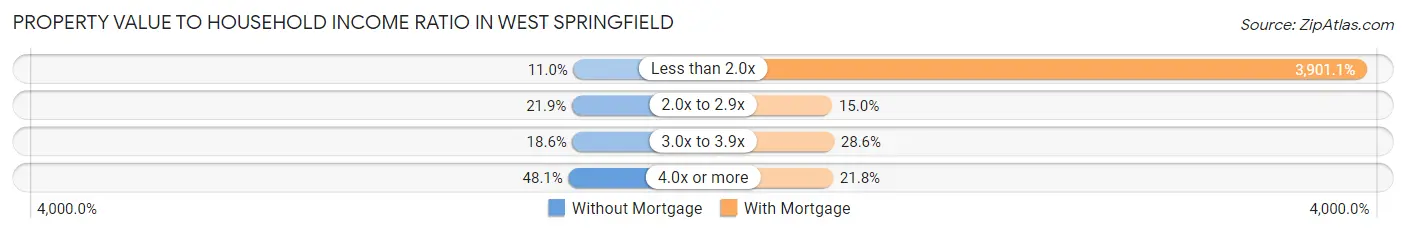
| Value-to-Income Ratio | Without Mortgage | With Mortgage |
| Less than 2.0x | 186 (11.0%) | 178,827 (3,901.1%) |
| 2.0x to 2.9x | 370 (21.9%) | 686 (15.0%) |
| 3.0x to 3.9x | 315 (18.6%) | 1,311 (28.6%) |
| 4.0x or more | 813 (48.0%) | 998 (21.8%) |
| Total | 1,692 (100.0%) | 4,584 (100.0%) |
Real Estate Taxes by Mortgage Status in West Springfield
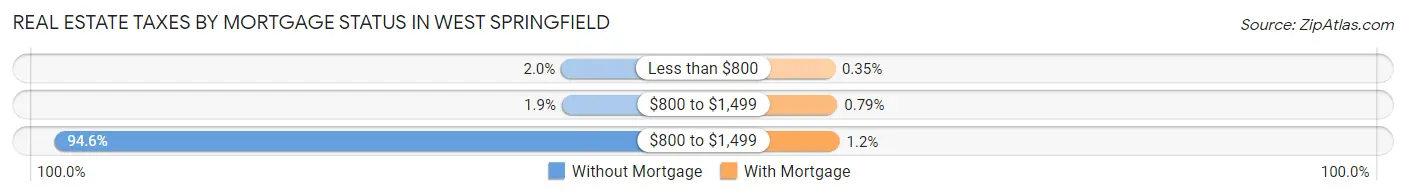
| Property Taxes | Without Mortgage | With Mortgage |
| Less than $800 | 34 (2.0%) | 16 (0.4%) |
| $800 to $1,499 | 32 (1.9%) | 36 (0.8%) |
| $800 to $1,499 | 1,600 (94.6%) | 55 (1.2%) |
| Total | 1,692 (100.0%) | 4,584 (100.0%) |
Health & Disability in West Springfield
Health Insurance Coverage by Age in West Springfield
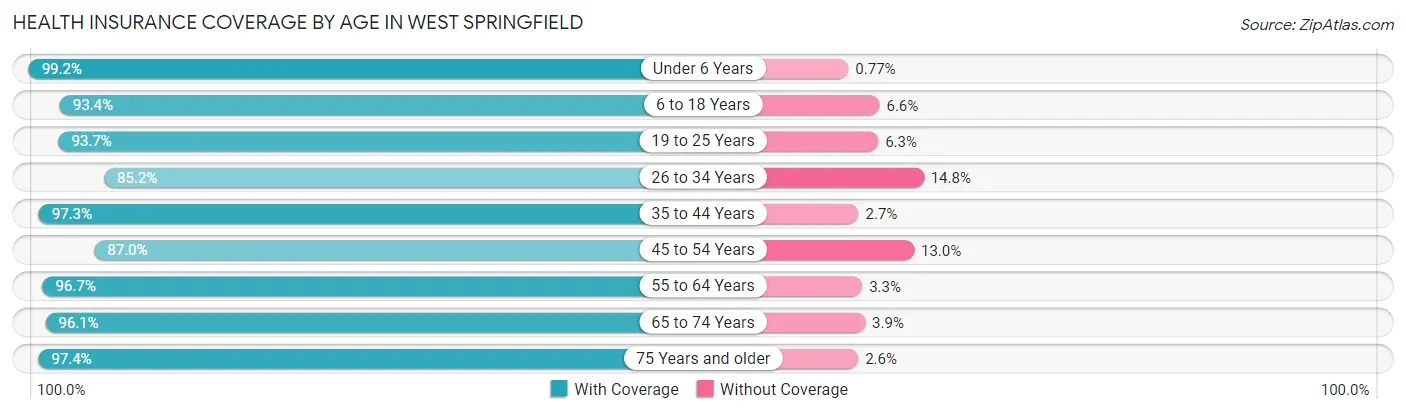
| Age Bracket | With Coverage | Without Coverage |
| Under 6 Years | 1,420 (99.2%) | 11 (0.8%) |
| 6 to 18 Years | 4,690 (93.4%) | 330 (6.6%) |
| 19 to 25 Years | 1,423 (93.7%) | 96 (6.3%) |
| 26 to 34 Years | 1,990 (85.2%) | 346 (14.8%) |
| 35 to 44 Years | 3,113 (97.3%) | 85 (2.7%) |
| 45 to 54 Years | 2,856 (87.0%) | 427 (13.0%) |
| 55 to 64 Years | 2,486 (96.7%) | 86 (3.3%) |
| 65 to 74 Years | 2,224 (96.1%) | 90 (3.9%) |
| 75 Years and older | 1,277 (97.4%) | 34 (2.6%) |
| Total | 21,479 (93.4%) | 1,505 (6.6%) |
Health Insurance Coverage by Citizenship Status in West Springfield
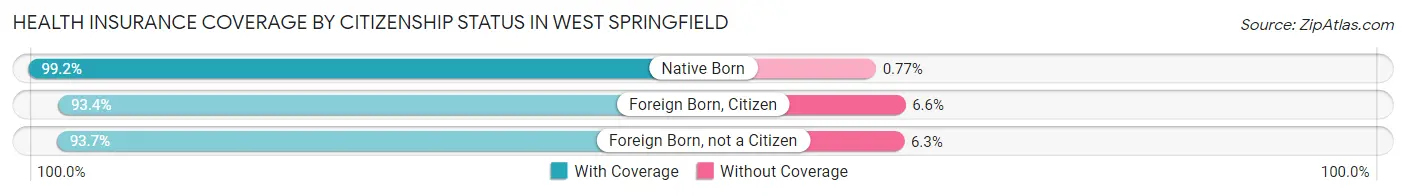
| Citizenship Status | With Coverage | Without Coverage |
| Native Born | 1,420 (99.2%) | 11 (0.8%) |
| Foreign Born, Citizen | 4,690 (93.4%) | 330 (6.6%) |
| Foreign Born, not a Citizen | 1,423 (93.7%) | 96 (6.3%) |
Health Insurance Coverage by Household Income in West Springfield
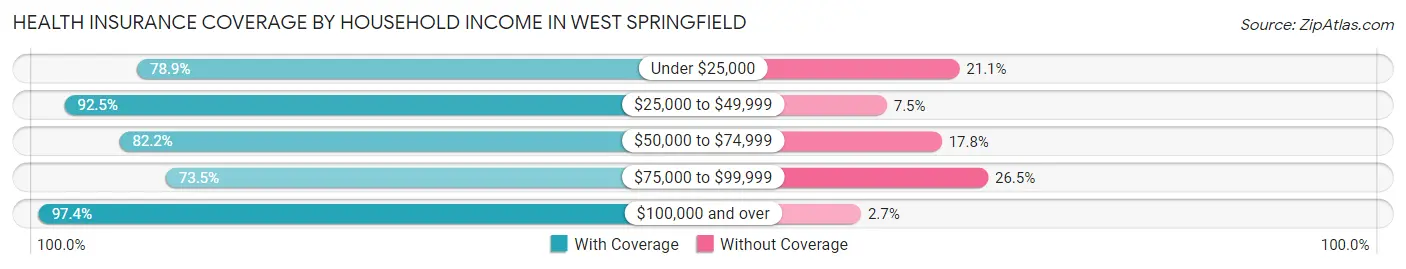
| Household Income | With Coverage | Without Coverage |
| Under $25,000 | 606 (78.9%) | 162 (21.1%) |
| $25,000 to $49,999 | 716 (92.5%) | 58 (7.5%) |
| $50,000 to $74,999 | 1,406 (82.2%) | 304 (17.8%) |
| $75,000 to $99,999 | 1,414 (73.5%) | 509 (26.5%) |
| $100,000 and over | 17,324 (97.4%) | 472 (2.6%) |
Public vs Private Health Insurance Coverage by Age in West Springfield
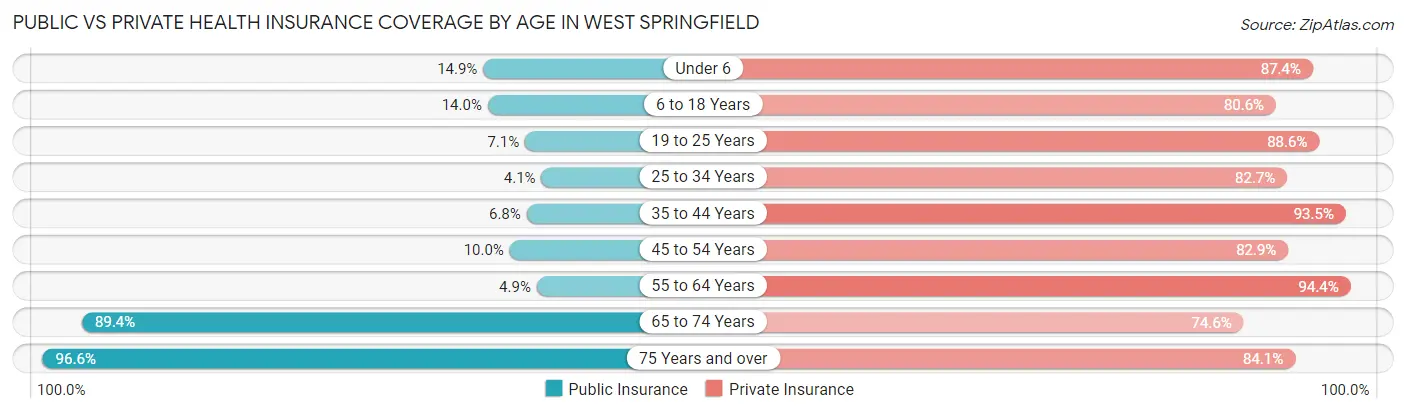
| Age Bracket | Public Insurance | Private Insurance |
| Under 6 | 213 (14.9%) | 1,251 (87.4%) |
| 6 to 18 Years | 705 (14.0%) | 4,045 (80.6%) |
| 19 to 25 Years | 108 (7.1%) | 1,346 (88.6%) |
| 25 to 34 Years | 95 (4.1%) | 1,931 (82.7%) |
| 35 to 44 Years | 218 (6.8%) | 2,991 (93.5%) |
| 45 to 54 Years | 327 (10.0%) | 2,720 (82.9%) |
| 55 to 64 Years | 127 (4.9%) | 2,429 (94.4%) |
| 65 to 74 Years | 2,068 (89.4%) | 1,726 (74.6%) |
| 75 Years and over | 1,267 (96.6%) | 1,103 (84.1%) |
| Total | 5,128 (22.3%) | 19,542 (85.0%) |
Disability Status by Sex by Age in West Springfield
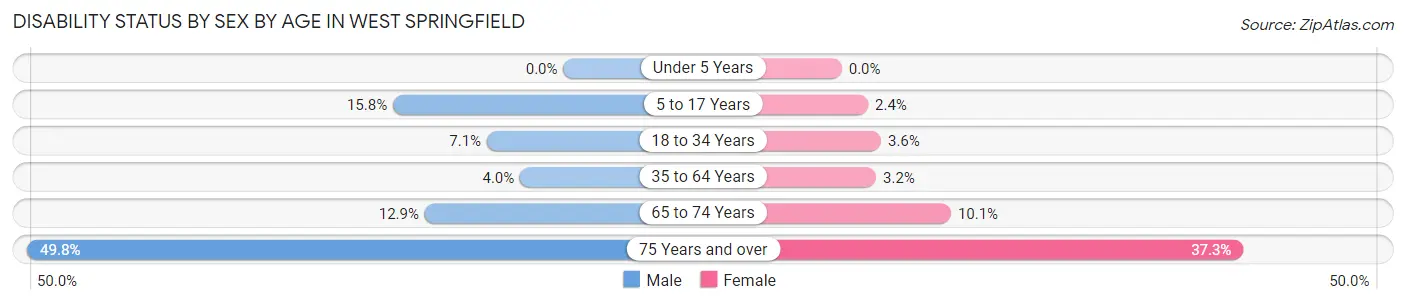
| Age Bracket | Male | Female |
| Under 5 Years | 0 (0.0%) | 0 (0.0%) |
| 5 to 17 Years | 380 (15.8%) | 58 (2.4%) |
| 18 to 34 Years | 154 (7.1%) | 76 (3.6%) |
| 35 to 64 Years | 176 (4.0%) | 148 (3.2%) |
| 65 to 74 Years | 144 (12.9%) | 121 (10.1%) |
| 75 Years and over | 305 (49.8%) | 260 (37.2%) |
Disability Class by Sex by Age in West Springfield
Disability Class: Hearing Difficulty
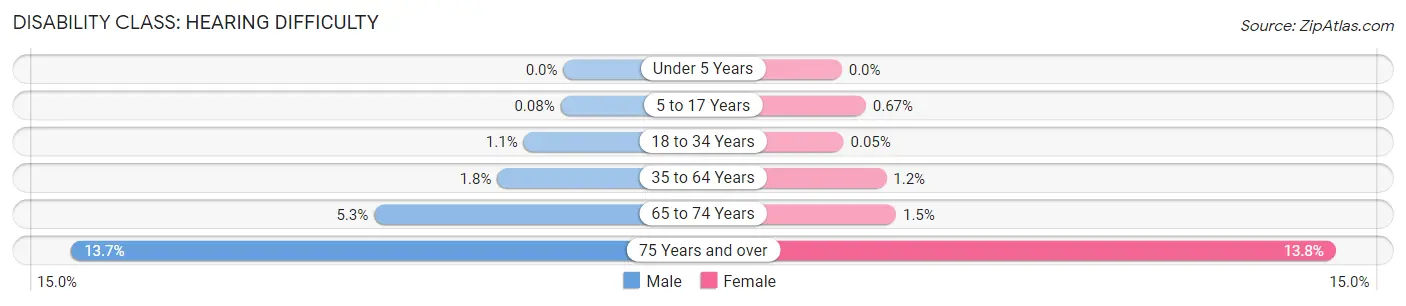
| Age Bracket | Male | Female |
| Under 5 Years | 0 (0.0%) | 0 (0.0%) |
| 5 to 17 Years | 2 (0.1%) | 16 (0.7%) |
| 18 to 34 Years | 24 (1.1%) | 1 (0.1%) |
| 35 to 64 Years | 81 (1.8%) | 58 (1.2%) |
| 65 to 74 Years | 59 (5.3%) | 18 (1.5%) |
| 75 Years and over | 84 (13.7%) | 96 (13.8%) |
Disability Class: Vision Difficulty
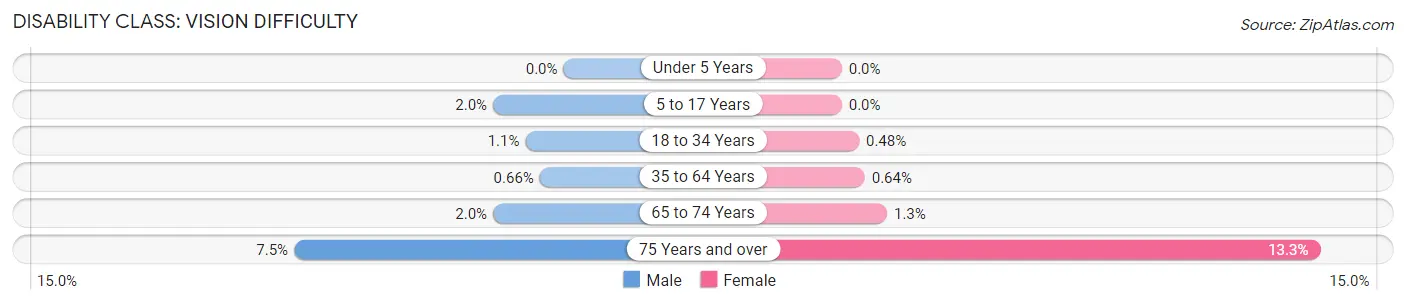
| Age Bracket | Male | Female |
| Under 5 Years | 0 (0.0%) | 0 (0.0%) |
| 5 to 17 Years | 47 (2.0%) | 0 (0.0%) |
| 18 to 34 Years | 23 (1.1%) | 10 (0.5%) |
| 35 to 64 Years | 29 (0.7%) | 30 (0.6%) |
| 65 to 74 Years | 22 (2.0%) | 15 (1.3%) |
| 75 Years and over | 46 (7.5%) | 93 (13.3%) |
Disability Class: Cognitive Difficulty
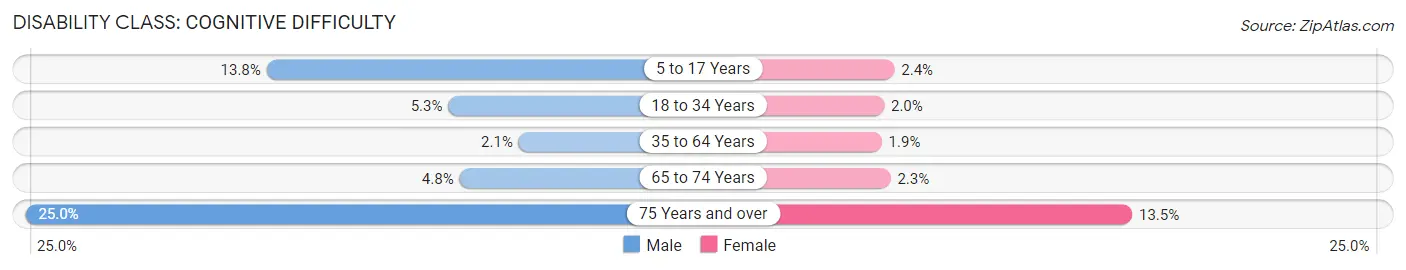
| Age Bracket | Male | Female |
| 5 to 17 Years | 331 (13.8%) | 58 (2.4%) |
| 18 to 34 Years | 116 (5.3%) | 41 (2.0%) |
| 35 to 64 Years | 91 (2.1%) | 86 (1.8%) |
| 65 to 74 Years | 54 (4.8%) | 27 (2.3%) |
| 75 Years and over | 153 (25.0%) | 94 (13.5%) |
Disability Class: Ambulatory Difficulty
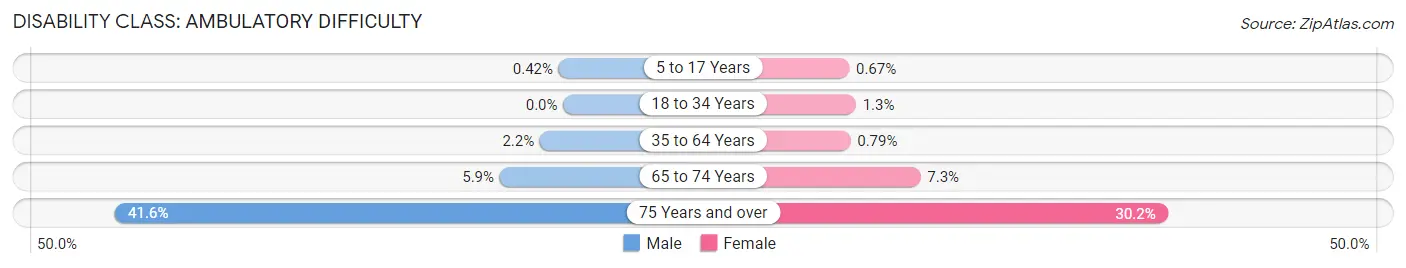
| Age Bracket | Male | Female |
| 5 to 17 Years | 10 (0.4%) | 16 (0.7%) |
| 18 to 34 Years | 0 (0.0%) | 27 (1.3%) |
| 35 to 64 Years | 95 (2.2%) | 37 (0.8%) |
| 65 to 74 Years | 66 (5.9%) | 87 (7.3%) |
| 75 Years and over | 255 (41.6%) | 211 (30.2%) |
Disability Class: Self-Care Difficulty
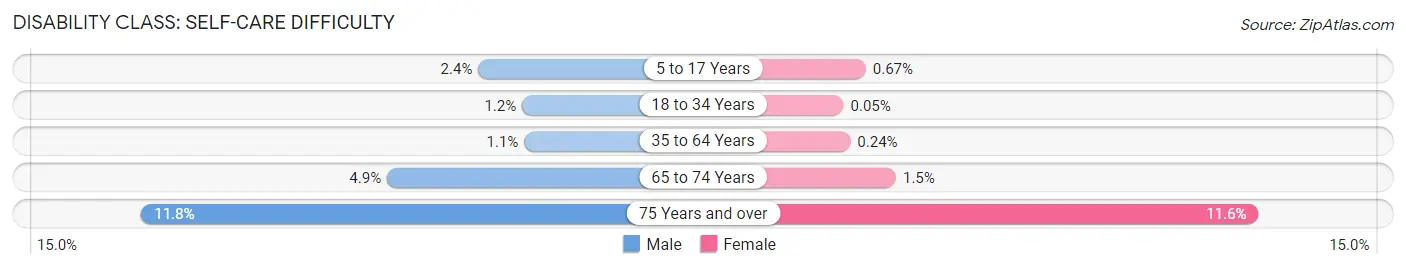
| Age Bracket | Male | Female |
| 5 to 17 Years | 57 (2.4%) | 16 (0.7%) |
| 18 to 34 Years | 25 (1.1%) | 1 (0.1%) |
| 35 to 64 Years | 48 (1.1%) | 11 (0.2%) |
| 65 to 74 Years | 55 (4.9%) | 18 (1.5%) |
| 75 Years and over | 72 (11.7%) | 81 (11.6%) |
Technology Access in West Springfield
Computing Device Access in West Springfield
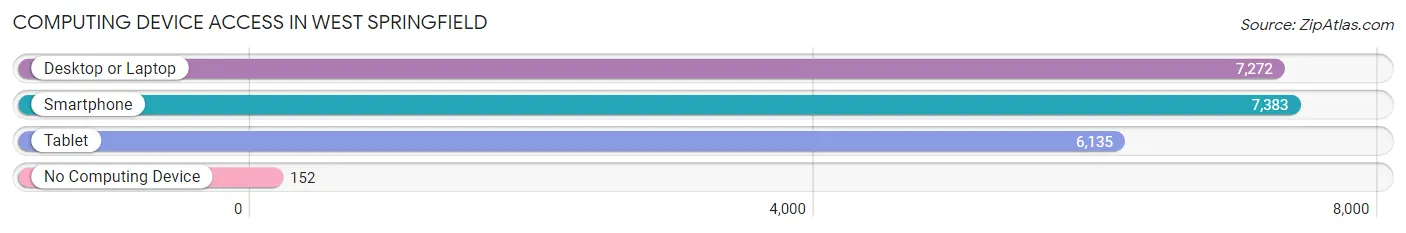
| Device Type | # Households | % Households |
| Desktop or Laptop | 7,272 | 93.5% |
| Smartphone | 7,383 | 95.0% |
| Tablet | 6,135 | 78.9% |
| No Computing Device | 152 | 1.9% |
| Total | 7,776 | 100.0% |
Internet Access in West Springfield
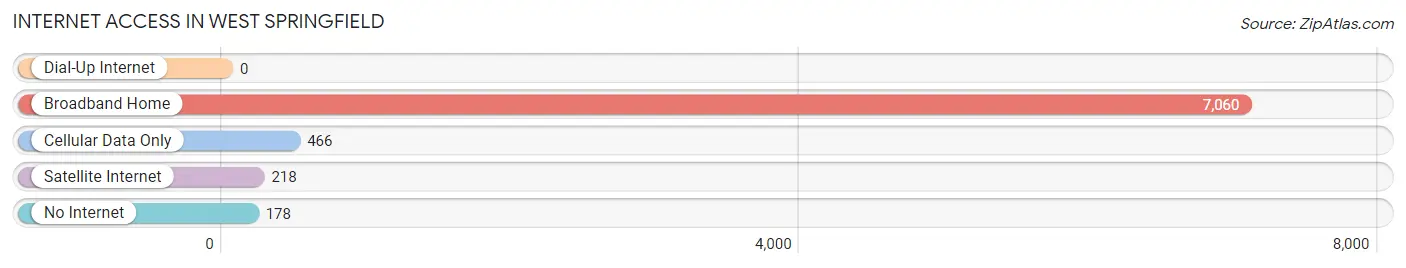
| Internet Type | # Households | % Households |
| Dial-Up Internet | 0 | 0.0% |
| Broadband Home | 7,060 | 90.8% |
| Cellular Data Only | 466 | 6.0% |
| Satellite Internet | 218 | 2.8% |
| No Internet | 178 | 2.3% |
| Total | 7,776 | 100.0% |
West Springfield Summary
West Springfield, Virginia is a census-designated place located in Fairfax County, Virginia. It is a suburb of Washington, D.C. and is part of the Washington metropolitan area. The population of West Springfield was 22,460 as of the 2010 census.
History
West Springfield was first settled in the early 1700s by English settlers. The area was originally known as "Springfield" and was part of the original Fairfax County. In the late 1800s, the area was renamed "West Springfield" to distinguish it from the nearby town of Springfield.
The area was largely rural until the 1950s, when the population began to grow rapidly due to the expansion of the Washington metropolitan area. The area was officially designated as a census-designated place in 1980.
Geography
West Springfield is located in northern Fairfax County, Virginia. It is bordered to the north by the town of Vienna, to the east by the city of Fairfax, to the south by the town of Burke, and to the west by the town of Clifton.
The area is mostly suburban in nature, with a mix of residential and commercial development. The area is served by several major highways, including Interstate 66, Interstate 495, and the Fairfax County Parkway.
Economy
West Springfield is home to a variety of businesses, including retail stores, restaurants, and professional services. The area is also home to several large employers, including the Department of Defense, the Department of Homeland Security, and the National Geospatial-Intelligence Agency.
Demographics
As of the 2010 census, the population of West Springfield was 22,460. The racial makeup of the area was 75.3% White, 11.2% Asian, 8.2% African American, and 4.3% Hispanic or Latino. The median household income was $107,837, and the median home value was $521,000.
West Springfield is served by the Fairfax County Public Schools system. The area is home to several public schools, including West Springfield High School, West Springfield Elementary School, and West Springfield Middle School.
Conclusion
West Springfield, Virginia is a census-designated place located in Fairfax County, Virginia. It is a suburb of Washington, D.C. and is part of the Washington metropolitan area. The area was largely rural until the 1950s, when the population began to grow rapidly due to the expansion of the Washington metropolitan area. The area is mostly suburban in nature, with a mix of residential and commercial development. As of the 2010 census, the population of West Springfield was 22,460. The area is home to several large employers, including the Department of Defense, the Department of Homeland Security, and the National Geospatial-Intelligence Agency. West Springfield is served by the Fairfax County Public Schools system.
Common Questions
What is Per Capita Income in West Springfield?
Per Capita income in West Springfield is $58,540.
What is the Median Family Income in West Springfield?
Median Family Income in West Springfield is $167,204.
What is the Median Household income in West Springfield?
Median Household Income in West Springfield is $154,497.
What is Income or Wage Gap in West Springfield?
Income or Wage Gap in West Springfield is 20.0%.
Women in West Springfield earn 80.0 cents for every dollar earned by a man.
What is Inequality or Gini Index in West Springfield?
Inequality or Gini Index in West Springfield is 0.34.
What is the Total Population of West Springfield?
Total Population of West Springfield is 23,372.
What is the Total Male Population of West Springfield?
Total Male Population of West Springfield is 11,700.
What is the Total Female Population of West Springfield?
Total Female Population of West Springfield is 11,672.
What is the Ratio of Males per 100 Females in West Springfield?
There are 100.24 Males per 100 Females in West Springfield.
What is the Ratio of Females per 100 Males in West Springfield?
There are 99.76 Females per 100 Males in West Springfield.
What is the Median Population Age in West Springfield?
Median Population Age in West Springfield is 38.7 Years.
What is the Average Family Size in West Springfield
Average Family Size in West Springfield is 3.5 People.
What is the Average Household Size in West Springfield
Average Household Size in West Springfield is 3.0 People.
How Large is the Labor Force in West Springfield?
There are 12,876 People in the Labor Forcein in West Springfield.
What is the Percentage of People in the Labor Force in West Springfield?
71.5% of People are in the Labor Force in West Springfield.
What is the Unemployment Rate in West Springfield?
Unemployment Rate in West Springfield is 2.7%.