Shenandoah Shores, VA Map & Demographics
Shenandoah Shores Map
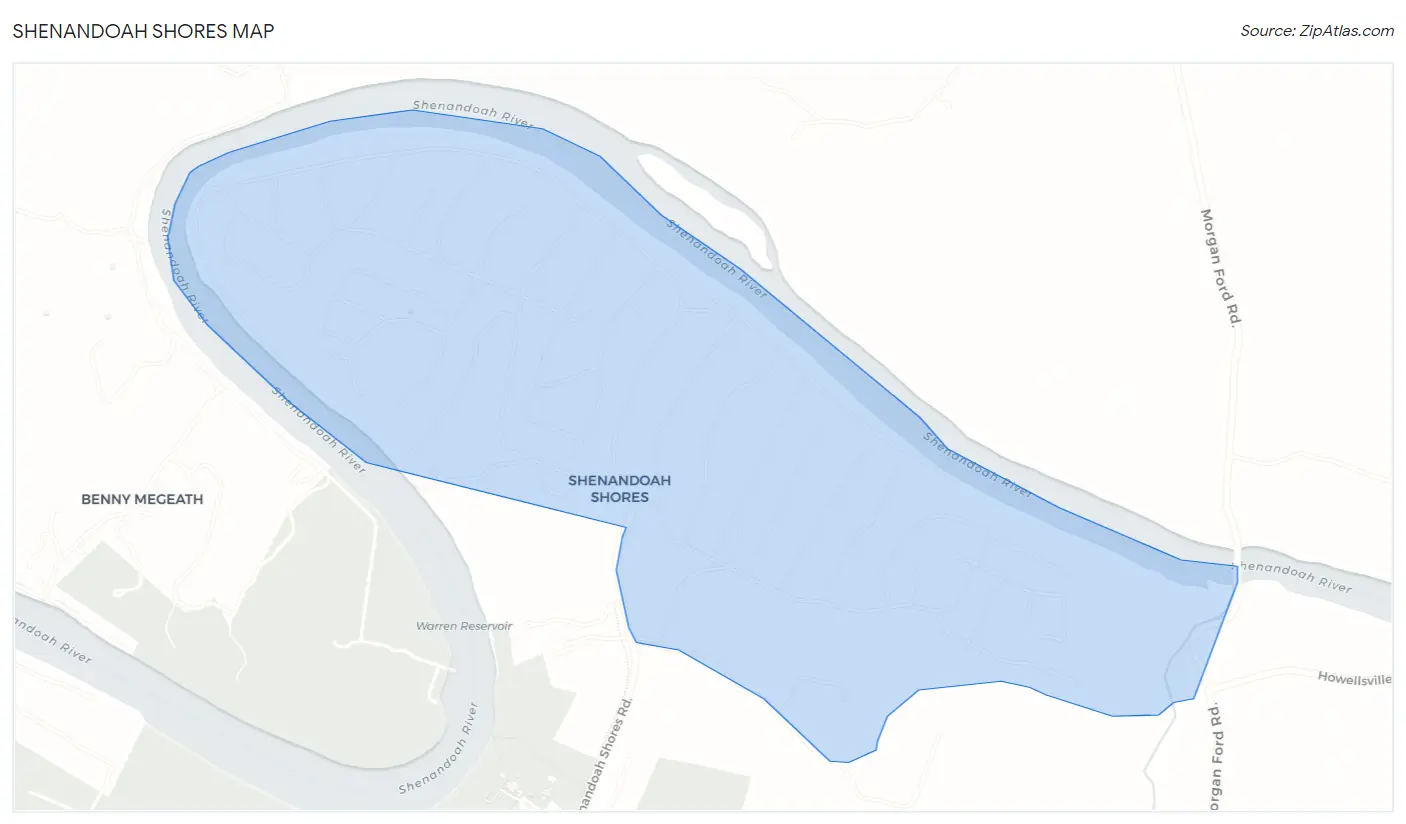
Shenandoah Shores Overview
$28,673
PER CAPITA INCOME
$70,833
AVG HOUSEHOLD INCOME
19.7%
WAGE / INCOME GAP [ % ]
80.3¢/ $1
WAGE / INCOME GAP [ $ ]
0.29
INEQUALITY / GINI INDEX
753
TOTAL POPULATION
389
MALE POPULATION
364
FEMALE POPULATION
106.87
MALES / 100 FEMALES
93.57
FEMALES / 100 MALES
29.2
MEDIAN AGE
3.2
AVG FAMILY SIZE
2.7
AVG HOUSEHOLD SIZE
392
LABOR FORCE [ PEOPLE ]
75.2%
PERCENT IN LABOR FORCE
10.7%
UNEMPLOYMENT RATE
Income in Shenandoah Shores
Income Overview in Shenandoah Shores
| Characteristic | Number | Measure |
| Per Capita Income | 753 | $28,673 |
| Median Family Income | 191 | $0 |
| Mean Family Income | 191 | $84,945 |
| Median Household Income | 280 | $70,833 |
| Mean Household Income | 280 | $82,236 |
| Income Deficit | 191 | $0 |
| Wage / Income Gap (%) | 753 | 19.66% |
| Wage / Income Gap ($) | 753 | 80.34¢ per $1 |
| Gini / Inequality Index | 753 | 0.29 |
Earnings by Sex in Shenandoah Shores
Average Earnings in Shenandoah Shores are $40,417, $38,846 for men and $48,352 for women, a difference of 19.7%.
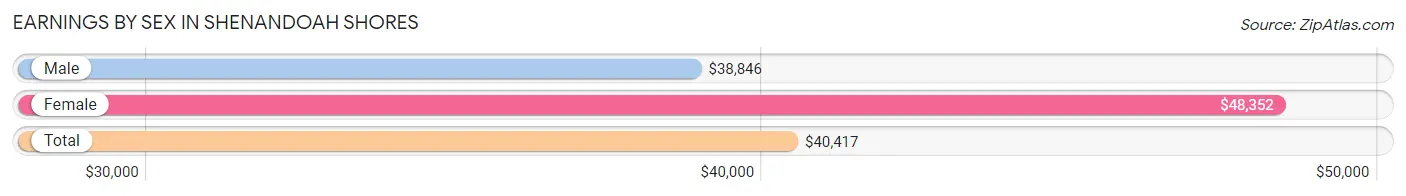
| Sex | Number | Average Earnings |
| Male | 272 (62.8%) | $38,846 |
| Female | 161 (37.2%) | $48,352 |
| Total | 433 (100.0%) | $40,417 |
Earnings by Sex by Income Bracket in Shenandoah Shores
The most common earnings brackets in Shenandoah Shores are $20,000 to $22,499 for men (63 | 23.2%) and $65,000 to $74,999 for women (49 | 30.4%).
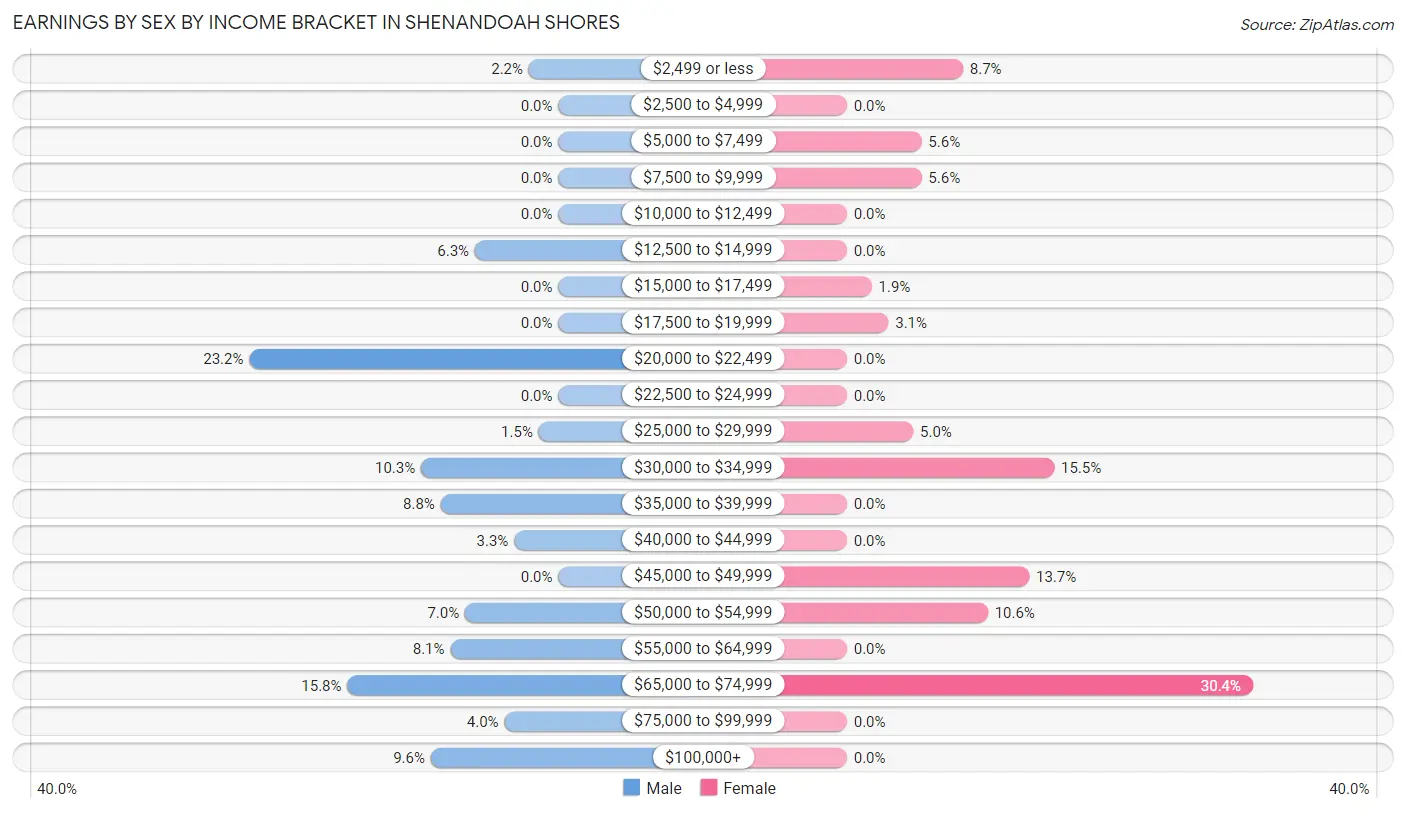
| Income | Male | Female |
| $2,499 or less | 6 (2.2%) | 14 (8.7%) |
| $2,500 to $4,999 | 0 (0.0%) | 0 (0.0%) |
| $5,000 to $7,499 | 0 (0.0%) | 9 (5.6%) |
| $7,500 to $9,999 | 0 (0.0%) | 9 (5.6%) |
| $10,000 to $12,499 | 0 (0.0%) | 0 (0.0%) |
| $12,500 to $14,999 | 17 (6.2%) | 0 (0.0%) |
| $15,000 to $17,499 | 0 (0.0%) | 3 (1.9%) |
| $17,500 to $19,999 | 0 (0.0%) | 5 (3.1%) |
| $20,000 to $22,499 | 63 (23.2%) | 0 (0.0%) |
| $22,500 to $24,999 | 0 (0.0%) | 0 (0.0%) |
| $25,000 to $29,999 | 4 (1.5%) | 8 (5.0%) |
| $30,000 to $34,999 | 28 (10.3%) | 25 (15.5%) |
| $35,000 to $39,999 | 24 (8.8%) | 0 (0.0%) |
| $40,000 to $44,999 | 9 (3.3%) | 0 (0.0%) |
| $45,000 to $49,999 | 0 (0.0%) | 22 (13.7%) |
| $50,000 to $54,999 | 19 (7.0%) | 17 (10.6%) |
| $55,000 to $64,999 | 22 (8.1%) | 0 (0.0%) |
| $65,000 to $74,999 | 43 (15.8%) | 49 (30.4%) |
| $75,000 to $99,999 | 11 (4.0%) | 0 (0.0%) |
| $100,000+ | 26 (9.6%) | 0 (0.0%) |
| Total | 272 (100.0%) | 161 (100.0%) |
Earnings by Sex by Educational Attainment in Shenandoah Shores
Average earnings in Shenandoah Shores are $39,519 for men and $50,956 for women, a difference of 22.4%. Men with an educational attainment of bachelor's degree enjoy the highest average annual earnings of $61,346, while those with bachelor's degree education earn the least with $61,346. Women with an educational attainment of bachelor's degree earn the most with the average annual earnings of $70,263, while those with bachelor's degree education have the smallest earnings of $70,263.
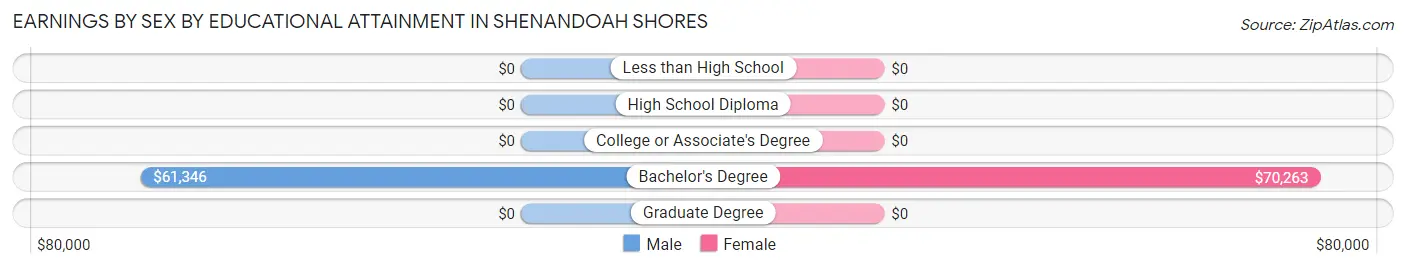
| Educational Attainment | Male Income | Female Income |
| Less than High School | - | - |
| High School Diploma | - | - |
| College or Associate's Degree | - | - |
| Bachelor's Degree | $61,346 | $70,263 |
| Graduate Degree | - | - |
| Total | $39,519 | $50,956 |
Family Income in Shenandoah Shores
Family Income Brackets in Shenandoah Shores
According to the Shenandoah Shores family income data, there are 76 families falling into the $100,000 to $149,999 income range, which is the most common income bracket and makes up 39.8% of all families.
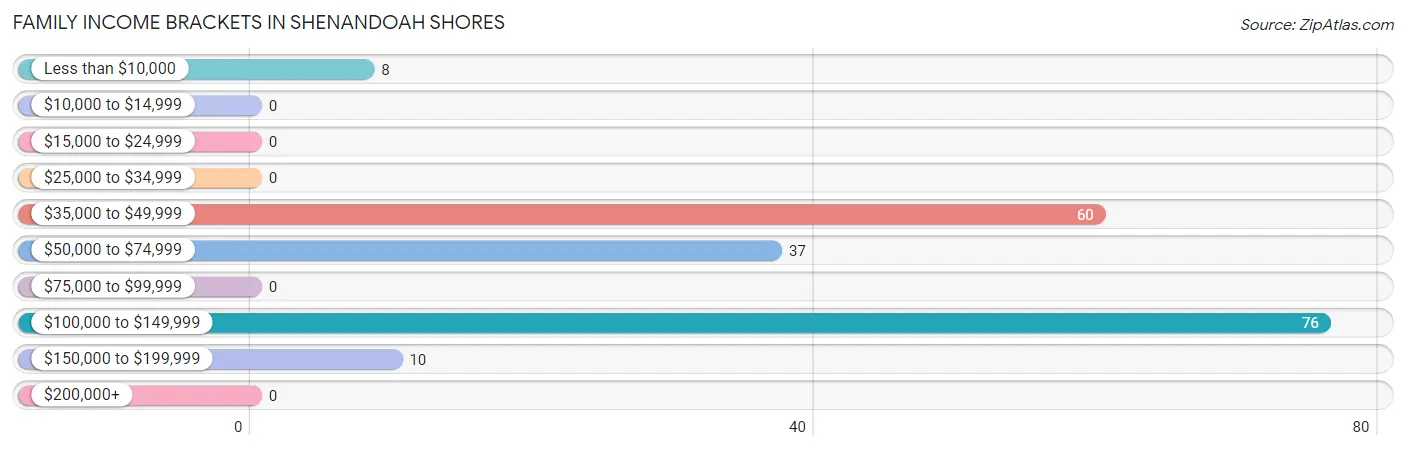
| Income Bracket | # Families | % Families |
| Less than $10,000 | 8 | 4.2% |
| $10,000 to $14,999 | 0 | 0.0% |
| $15,000 to $24,999 | 0 | 0.0% |
| $25,000 to $34,999 | 0 | 0.0% |
| $35,000 to $49,999 | 60 | 31.4% |
| $50,000 to $74,999 | 37 | 19.4% |
| $75,000 to $99,999 | 0 | 0.0% |
| $100,000 to $149,999 | 76 | 39.8% |
| $150,000 to $199,999 | 10 | 5.2% |
| $200,000+ | 0 | 0.0% |
Family Income by Famaliy Size in Shenandoah Shores
3-person families (30 | 15.7%) account for the highest median family income in Shenandoah Shores with $140,227 per family, while 3-person families (30 | 15.7%) have the highest median income of $46,742 per family member.
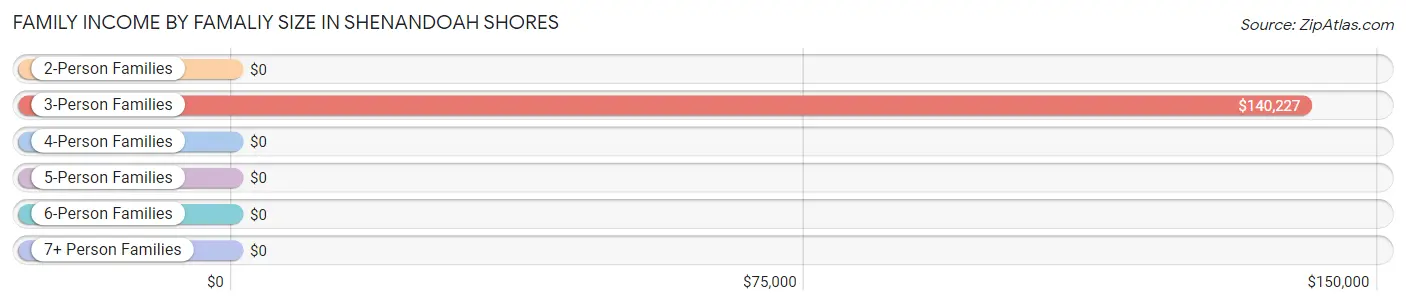
| Income Bracket | # Families | Median Income |
| 2-Person Families | 94 (49.2%) | $0 |
| 3-Person Families | 30 (15.7%) | $140,227 |
| 4-Person Families | 12 (6.3%) | $0 |
| 5-Person Families | 38 (19.9%) | $0 |
| 6-Person Families | 13 (6.8%) | $0 |
| 7+ Person Families | 4 (2.1%) | $0 |
| Total | 191 (100.0%) | $0 |
Family Income by Number of Earners in Shenandoah Shores
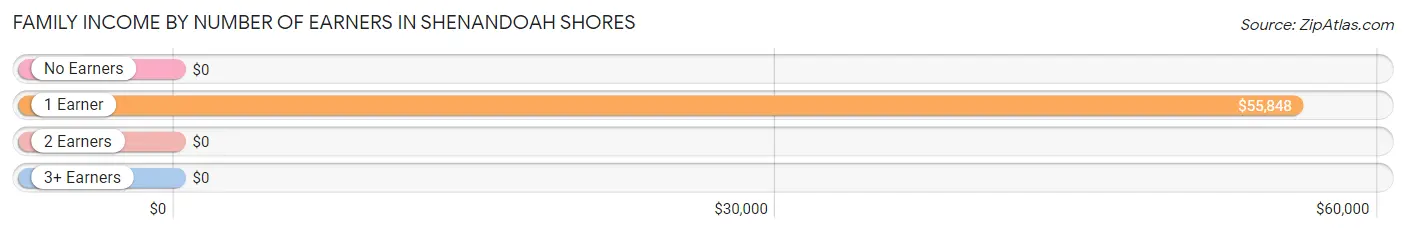
| Number of Earners | # Families | Median Income |
| No Earners | 0 (0.0%) | $0 |
| 1 Earner | 61 (31.9%) | $55,848 |
| 2 Earners | 120 (62.8%) | $0 |
| 3+ Earners | 10 (5.2%) | $0 |
| Total | 191 (100.0%) | $0 |
Household Income in Shenandoah Shores
Household Income Brackets in Shenandoah Shores
With 83 households falling in the category, the $50,000 to $74,999 income range is the most frequent in Shenandoah Shores, accounting for 29.6% of all households.
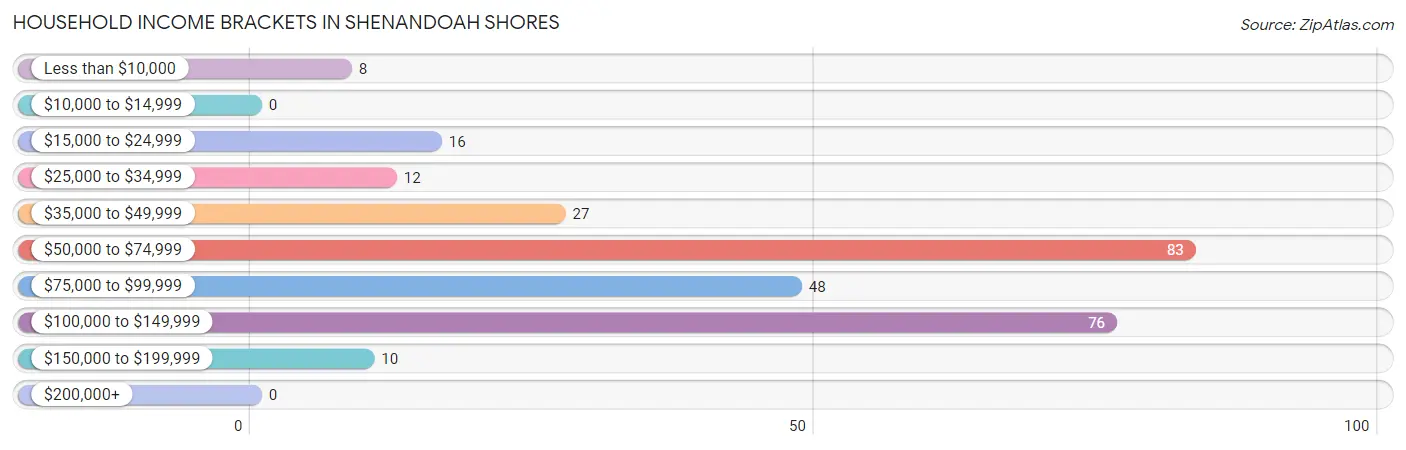
| Income Bracket | # Households | % Households |
| Less than $10,000 | 8 | 2.9% |
| $10,000 to $14,999 | 0 | 0.0% |
| $15,000 to $24,999 | 16 | 5.7% |
| $25,000 to $34,999 | 12 | 4.3% |
| $35,000 to $49,999 | 27 | 9.6% |
| $50,000 to $74,999 | 83 | 29.6% |
| $75,000 to $99,999 | 48 | 17.1% |
| $100,000 to $149,999 | 76 | 27.1% |
| $150,000 to $199,999 | 10 | 3.6% |
| $200,000+ | 0 | 0.0% |
Household Income by Householder Age in Shenandoah Shores
The median household income in Shenandoah Shores is $70,833, with the highest median household income of $87,500 found in the 25 to 44 years age bracket for the primary householder. A total of 190 households (67.9%) fall into this category. Meanwhile, the 15 to 24 years age bracket for the primary householder has the lowest median household income of $0, with 9 households (3.2%) in this group.
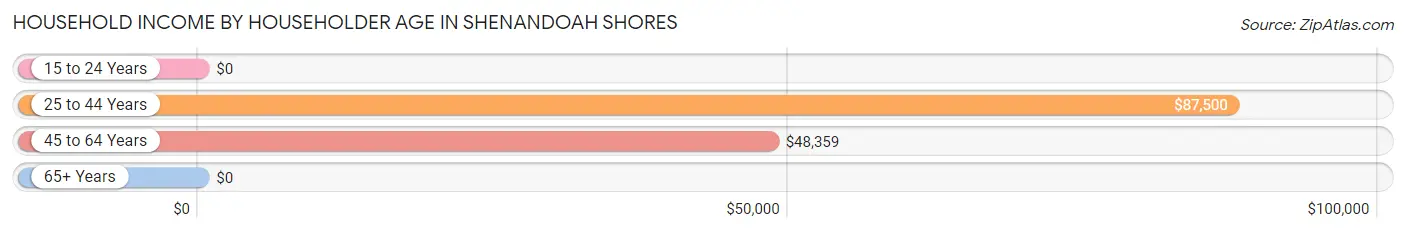
| Income Bracket | # Households | Median Income |
| 15 to 24 Years | 9 (3.2%) | $0 |
| 25 to 44 Years | 190 (67.9%) | $87,500 |
| 45 to 64 Years | 65 (23.2%) | $48,359 |
| 65+ Years | 16 (5.7%) | $0 |
| Total | 280 (100.0%) | $70,833 |
Poverty in Shenandoah Shores
Income Below Poverty by Sex and Age in Shenandoah Shores
With 16.5% poverty level for males and 11.5% for females among the residents of Shenandoah Shores, under 5 year old males and under 5 year old females are the most vulnerable to poverty, with 24 males (70.6%) and 19 females (40.4%) in their respective age groups living below the poverty level.
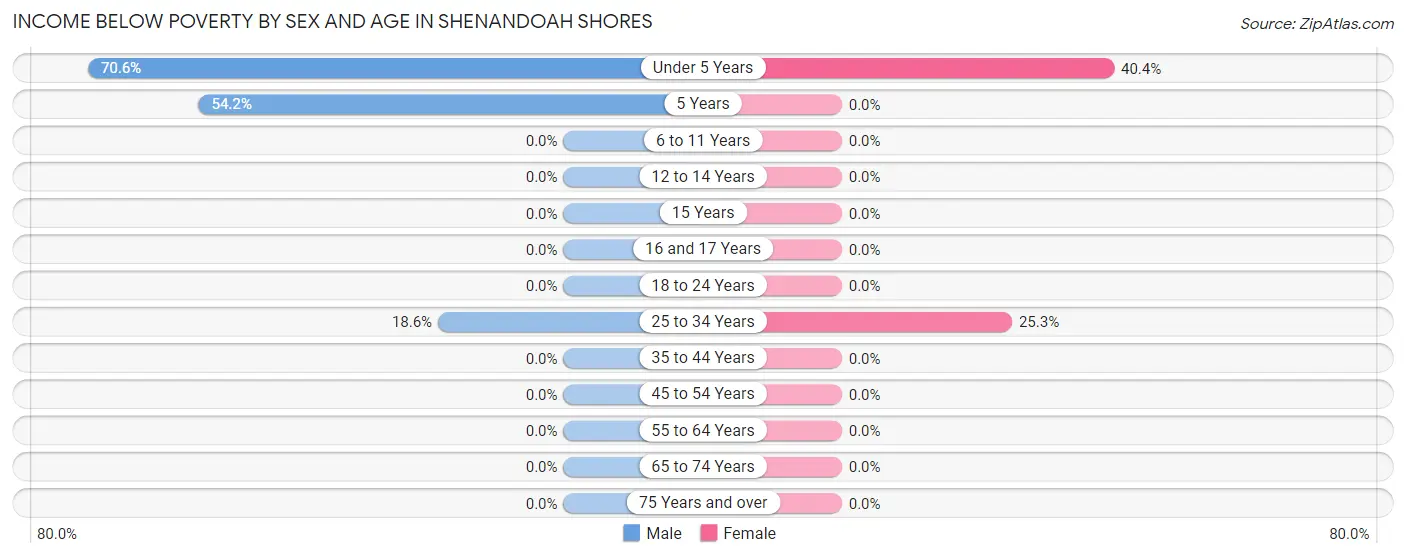
| Age Bracket | Male | Female |
| Under 5 Years | 24 (70.6%) | 19 (40.4%) |
| 5 Years | 13 (54.2%) | 0 (0.0%) |
| 6 to 11 Years | 0 (0.0%) | 0 (0.0%) |
| 12 to 14 Years | 0 (0.0%) | 0 (0.0%) |
| 15 Years | 0 (0.0%) | 0 (0.0%) |
| 16 and 17 Years | 0 (0.0%) | 0 (0.0%) |
| 18 to 24 Years | 0 (0.0%) | 0 (0.0%) |
| 25 to 34 Years | 27 (18.6%) | 23 (25.3%) |
| 35 to 44 Years | 0 (0.0%) | 0 (0.0%) |
| 45 to 54 Years | 0 (0.0%) | 0 (0.0%) |
| 55 to 64 Years | 0 (0.0%) | 0 (0.0%) |
| 65 to 74 Years | 0 (0.0%) | 0 (0.0%) |
| 75 Years and over | 0 (0.0%) | 0 (0.0%) |
| Total | 64 (16.5%) | 42 (11.5%) |
Income Above Poverty by Sex and Age in Shenandoah Shores
According to the poverty statistics in Shenandoah Shores, males aged 6 to 11 years and females aged 5 years are the age groups that are most secure financially, with 100.0% of males and 100.0% of females in these age groups living above the poverty line.
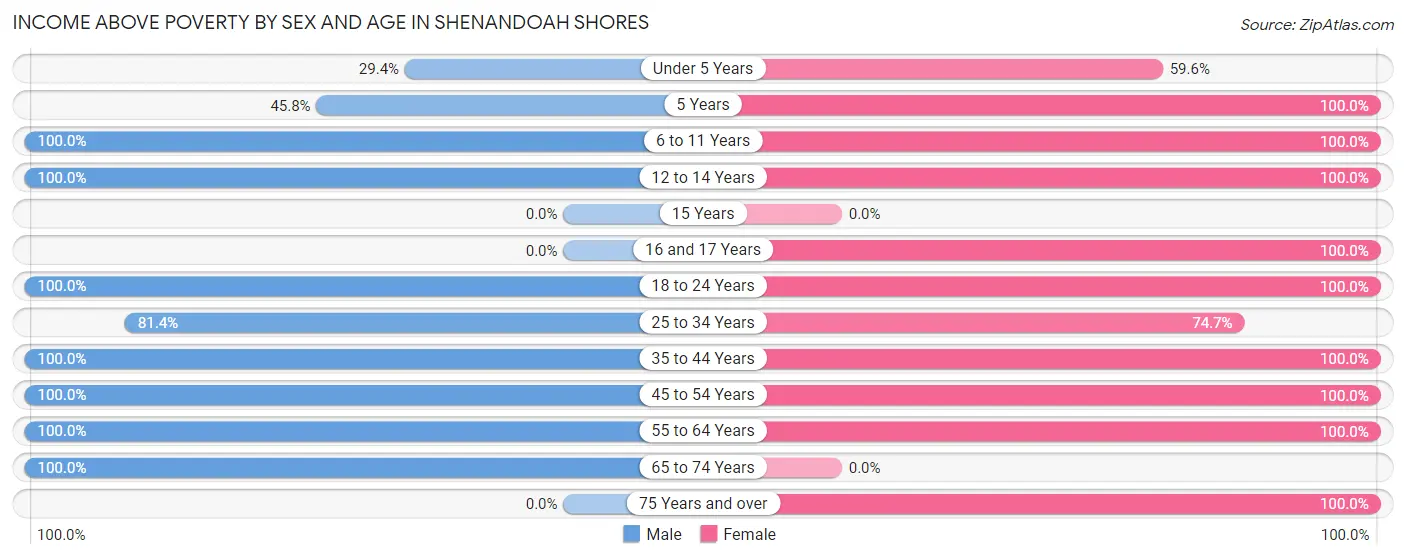
| Age Bracket | Male | Female |
| Under 5 Years | 10 (29.4%) | 28 (59.6%) |
| 5 Years | 11 (45.8%) | 8 (100.0%) |
| 6 to 11 Years | 29 (100.0%) | 29 (100.0%) |
| 12 to 14 Years | 10 (100.0%) | 51 (100.0%) |
| 15 Years | 0 (0.0%) | 0 (0.0%) |
| 16 and 17 Years | 0 (0.0%) | 9 (100.0%) |
| 18 to 24 Years | 25 (100.0%) | 33 (100.0%) |
| 25 to 34 Years | 118 (81.4%) | 68 (74.7%) |
| 35 to 44 Years | 40 (100.0%) | 40 (100.0%) |
| 45 to 54 Years | 12 (100.0%) | 20 (100.0%) |
| 55 to 64 Years | 54 (100.0%) | 25 (100.0%) |
| 65 to 74 Years | 16 (100.0%) | 0 (0.0%) |
| 75 Years and over | 0 (0.0%) | 11 (100.0%) |
| Total | 325 (83.6%) | 322 (88.5%) |
Income Below Poverty Among Married-Couple Families in Shenandoah Shores
The poverty statistics for married-couple families in Shenandoah Shores show that 14.2% or 21 of the total 148 families live below the poverty line. Families with 3 or 4 children have the highest poverty rate of 31.7%, comprising of 13 families. On the other hand, families with no children have the lowest poverty rate of 0.0%, which includes 0 families.
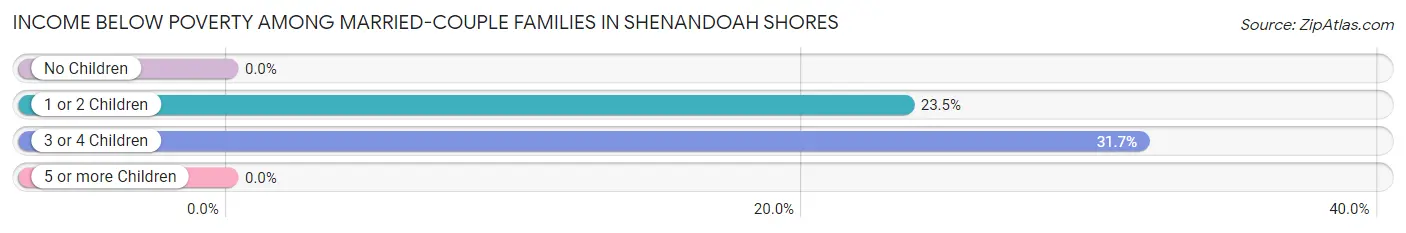
| Children | Above Poverty | Below Poverty |
| No Children | 69 (100.0%) | 0 (0.0%) |
| 1 or 2 Children | 26 (76.5%) | 8 (23.5%) |
| 3 or 4 Children | 28 (68.3%) | 13 (31.7%) |
| 5 or more Children | 4 (100.0%) | 0 (0.0%) |
| Total | 127 (85.8%) | 21 (14.2%) |
Income Below Poverty Among Single-Parent Households in Shenandoah Shores
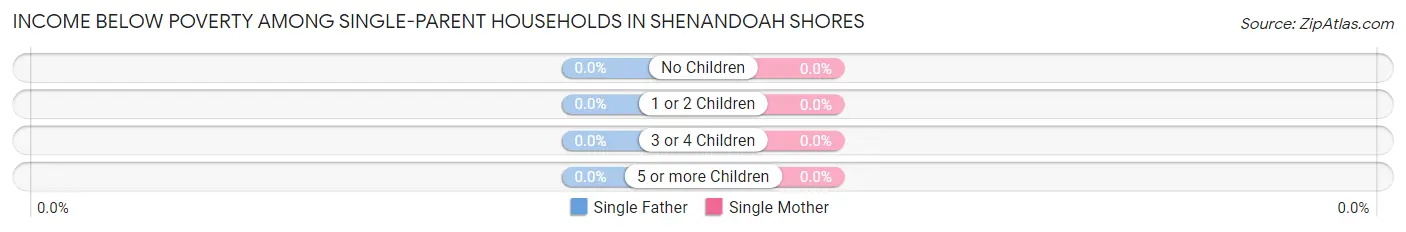
| Children | Single Father | Single Mother |
| No Children | 0 (0.0%) | 0 (0.0%) |
| 1 or 2 Children | 0 (0.0%) | 0 (0.0%) |
| 3 or 4 Children | 0 (0.0%) | 0 (0.0%) |
| 5 or more Children | 0 (0.0%) | 0 (0.0%) |
| Total | 0 (0.0%) | 0 (0.0%) |
Income Below Poverty Among Married-Couple vs Single-Parent Households in Shenandoah Shores
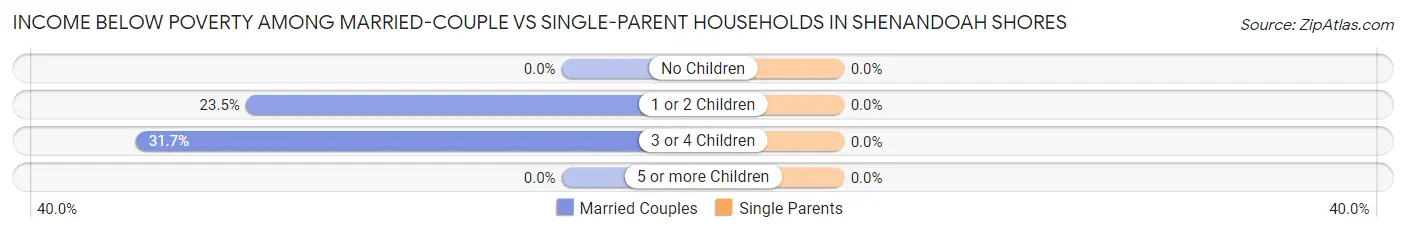
| Children | Married-Couple Families | Single-Parent Households |
| No Children | 0 (0.0%) | 0 (0.0%) |
| 1 or 2 Children | 8 (23.5%) | 0 (0.0%) |
| 3 or 4 Children | 13 (31.7%) | 0 (0.0%) |
| 5 or more Children | 0 (0.0%) | 0 (0.0%) |
| Total | 21 (14.2%) | 0 (0.0%) |
Race in Shenandoah Shores
The most populous races in Shenandoah Shores are White / Caucasian (658 | 87.4%), Hispanic or Latino (43 | 5.7%), and Some other Race (43 | 5.7%).
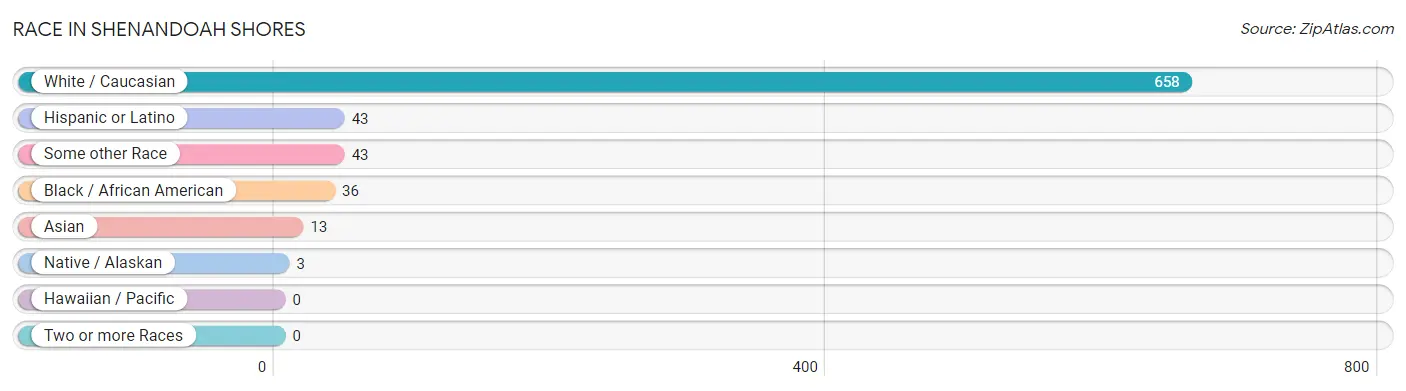
| Race | # Population | % Population |
| Asian | 13 | 1.7% |
| Black / African American | 36 | 4.8% |
| Hawaiian / Pacific | 0 | 0.0% |
| Hispanic or Latino | 43 | 5.7% |
| Native / Alaskan | 3 | 0.4% |
| White / Caucasian | 658 | 87.4% |
| Two or more Races | 0 | 0.0% |
| Some other Race | 43 | 5.7% |
| Total | 753 | 100.0% |
Ancestry in Shenandoah Shores
The most populous ancestries reported in Shenandoah Shores are German (114 | 15.1%), Irish (81 | 10.8%), Polish (80 | 10.6%), English (63 | 8.4%), and Portuguese (61 | 8.1%), together accounting for 53.0% of all Shenandoah Shores residents.
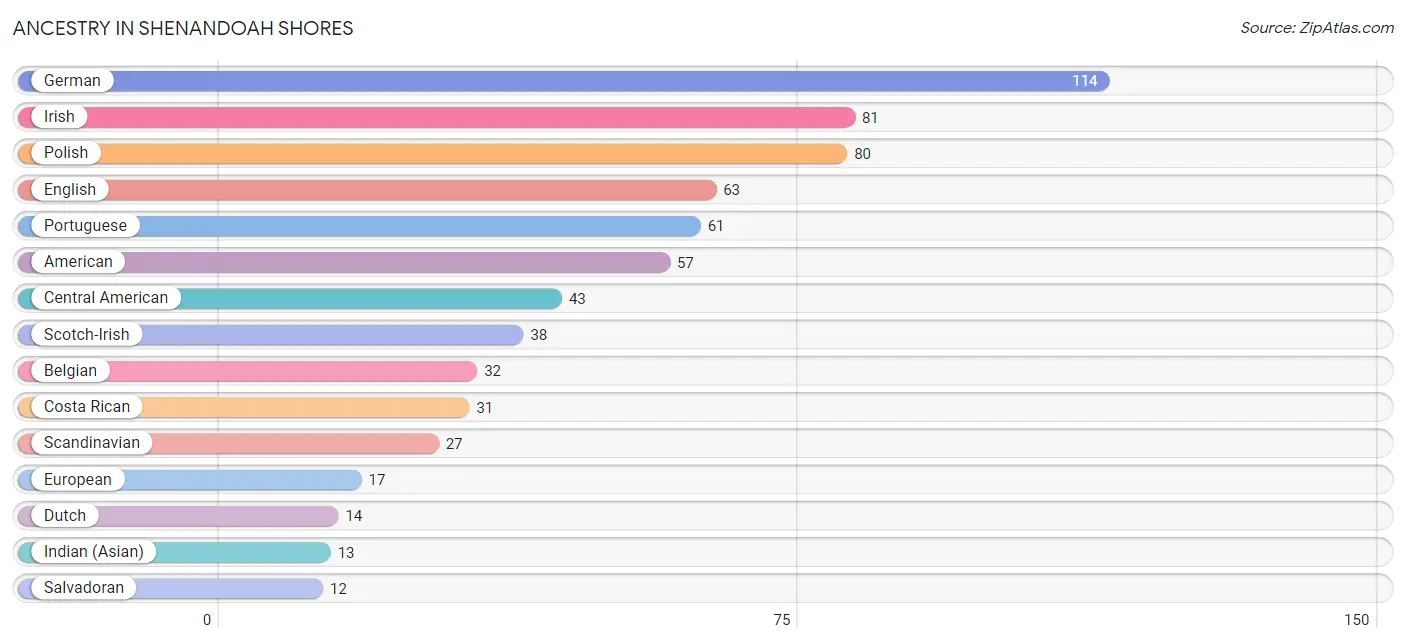
| Ancestry | # Population | % Population |
| American | 57 | 7.6% |
| Belgian | 32 | 4.3% |
| Canadian | 5 | 0.7% |
| Central American | 43 | 5.7% |
| Costa Rican | 31 | 4.1% |
| Dutch | 14 | 1.9% |
| English | 63 | 8.4% |
| European | 17 | 2.3% |
| German | 114 | 15.1% |
| Indian (Asian) | 13 | 1.7% |
| Irish | 81 | 10.8% |
| Maltese | 5 | 0.7% |
| Polish | 80 | 10.6% |
| Portuguese | 61 | 8.1% |
| Salvadoran | 12 | 1.6% |
| Scandinavian | 27 | 3.6% |
| Scotch-Irish | 38 | 5.1% | View All 17 Rows |
Immigrants in Shenandoah Shores
The most numerous immigrant groups reported in Shenandoah Shores came from Central America (43 | 5.7%), Latin America (43 | 5.7%), Costa Rica (31 | 4.1%), Canada (22 | 2.9%), and Denmark (12 | 1.6%), together accounting for 20.0% of all Shenandoah Shores residents.
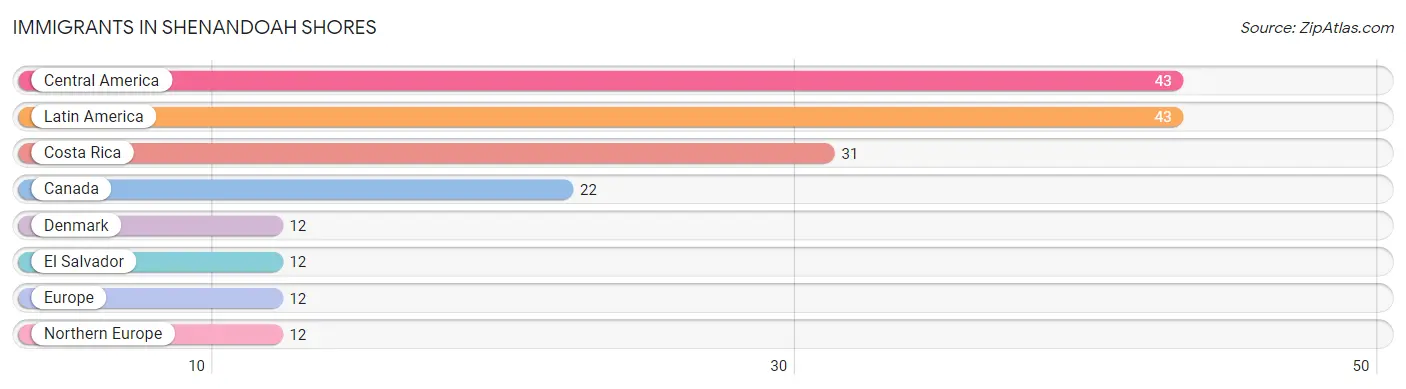
| Immigration Origin | # Population | % Population |
| Canada | 22 | 2.9% |
| Central America | 43 | 5.7% |
| Costa Rica | 31 | 4.1% |
| Denmark | 12 | 1.6% |
| El Salvador | 12 | 1.6% |
| Europe | 12 | 1.6% |
| Latin America | 43 | 5.7% |
| Northern Europe | 12 | 1.6% | View All 8 Rows |
Sex and Age in Shenandoah Shores
Sex and Age in Shenandoah Shores
The most populous age groups in Shenandoah Shores are 30 to 34 Years (115 | 29.6%) for men and 25 to 29 Years (70 | 19.2%) for women.
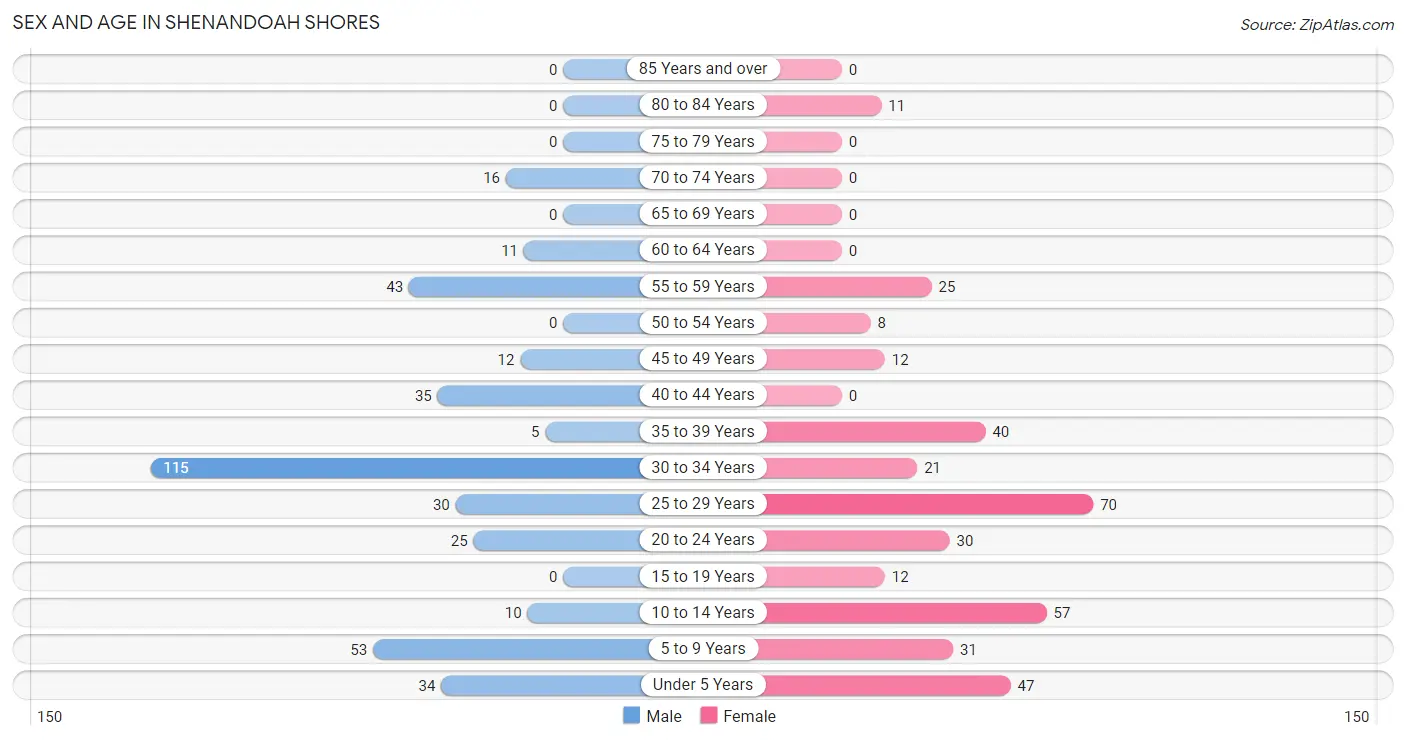
| Age Bracket | Male | Female |
| Under 5 Years | 34 (8.7%) | 47 (12.9%) |
| 5 to 9 Years | 53 (13.6%) | 31 (8.5%) |
| 10 to 14 Years | 10 (2.6%) | 57 (15.7%) |
| 15 to 19 Years | 0 (0.0%) | 12 (3.3%) |
| 20 to 24 Years | 25 (6.4%) | 30 (8.2%) |
| 25 to 29 Years | 30 (7.7%) | 70 (19.2%) |
| 30 to 34 Years | 115 (29.6%) | 21 (5.8%) |
| 35 to 39 Years | 5 (1.3%) | 40 (11.0%) |
| 40 to 44 Years | 35 (9.0%) | 0 (0.0%) |
| 45 to 49 Years | 12 (3.1%) | 12 (3.3%) |
| 50 to 54 Years | 0 (0.0%) | 8 (2.2%) |
| 55 to 59 Years | 43 (11.1%) | 25 (6.9%) |
| 60 to 64 Years | 11 (2.8%) | 0 (0.0%) |
| 65 to 69 Years | 0 (0.0%) | 0 (0.0%) |
| 70 to 74 Years | 16 (4.1%) | 0 (0.0%) |
| 75 to 79 Years | 0 (0.0%) | 0 (0.0%) |
| 80 to 84 Years | 0 (0.0%) | 11 (3.0%) |
| 85 Years and over | 0 (0.0%) | 0 (0.0%) |
| Total | 389 (100.0%) | 364 (100.0%) |
Families and Households in Shenandoah Shores
Median Family Size in Shenandoah Shores
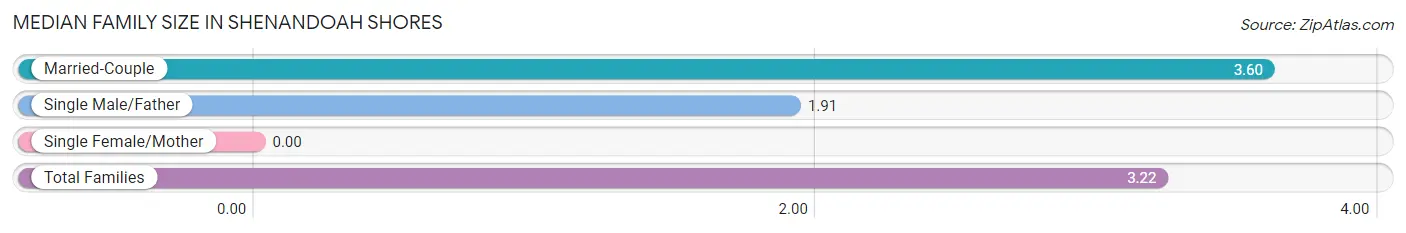
| Family Type | # Families | Family Size |
| Married-Couple | 148 (77.5%) | 3.60 |
| Single Male/Father | 43 (22.5%) | 1.91 |
| Single Female/Mother | 0 (0.0%) | - |
| Total Families | 191 (100.0%) | 3.22 |
Median Household Size in Shenandoah Shores
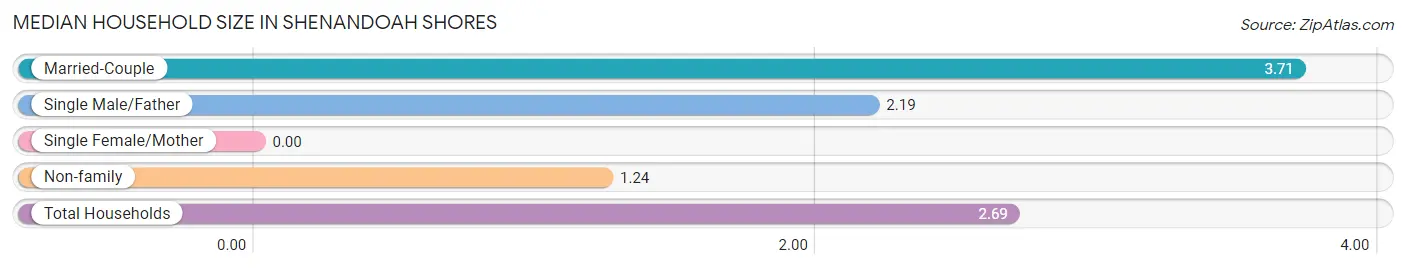
| Household Type | # Households | Household Size |
| Married-Couple | 148 (52.9%) | 3.71 |
| Single Male/Father | 43 (15.4%) | 2.19 |
| Single Female/Mother | 0 (0.0%) | - |
| Non-family | 89 (31.8%) | 1.24 |
| Total Households | 280 (100.0%) | 2.69 |
Household Size by Marriage Status in Shenandoah Shores
Out of a total of 280 households in Shenandoah Shores, 191 (68.2%) are family households, while 89 (31.8%) are nonfamily households. The most numerous type of family households are 2-person households, comprising 63, and the most common type of nonfamily households are 1-person households, comprising 71.
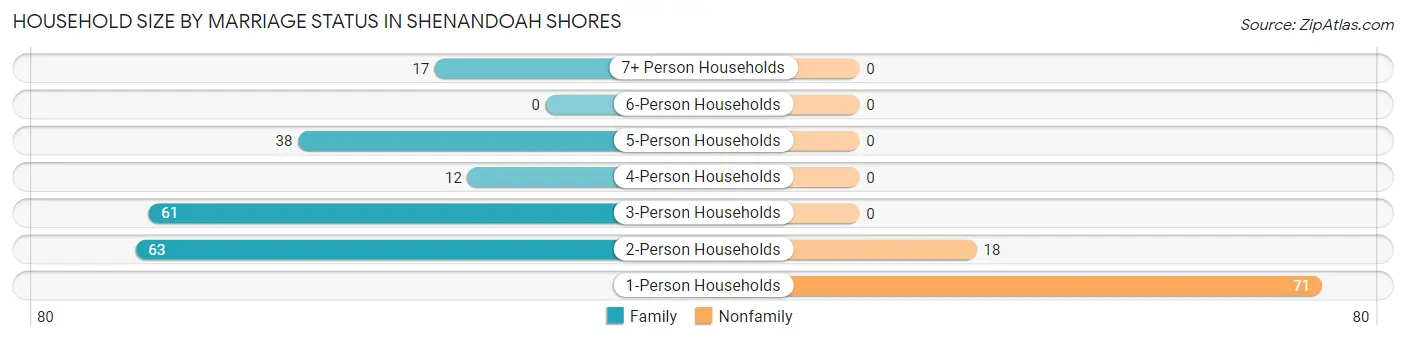
| Household Size | Family Households | Nonfamily Households |
| 1-Person Households | - | 71 (25.4%) |
| 2-Person Households | 63 (22.5%) | 18 (6.4%) |
| 3-Person Households | 61 (21.8%) | 0 (0.0%) |
| 4-Person Households | 12 (4.3%) | 0 (0.0%) |
| 5-Person Households | 38 (13.6%) | 0 (0.0%) |
| 6-Person Households | 0 (0.0%) | 0 (0.0%) |
| 7+ Person Households | 17 (6.1%) | 0 (0.0%) |
| Total | 191 (68.2%) | 89 (31.8%) |
Female Fertility in Shenandoah Shores
Fertility by Age in Shenandoah Shores
Average fertility rate in Shenandoah Shores is 124.0 births per 1,000 women. Women in the age bracket of 20 to 34 years have the highest fertility rate with 190.0 births per 1,000 women. Women in the age bracket of 20 to 34 years acount for 100.0% of all women with births.
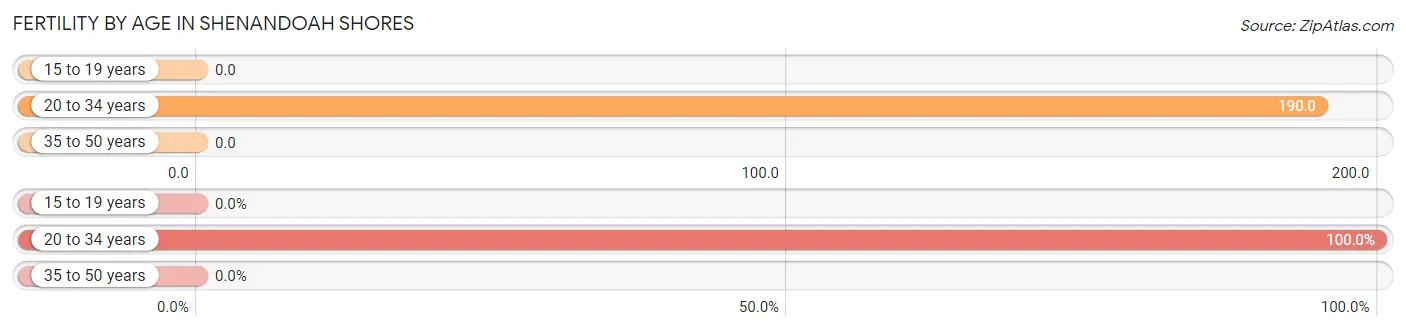
| Age Bracket | Women with Births | Births / 1,000 Women |
| 15 to 19 years | 0 (0.0%) | 0.0 |
| 20 to 34 years | 23 (100.0%) | 190.0 |
| 35 to 50 years | 0 (0.0%) | 0.0 |
| Total | 23 (100.0%) | 124.0 |
Fertility by Age by Marriage Status in Shenandoah Shores
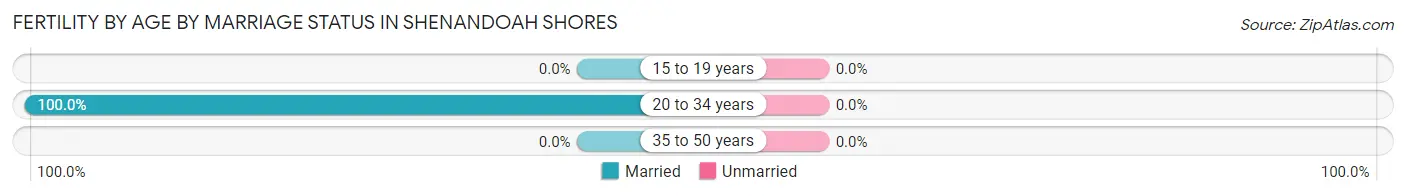
| Age Bracket | Married | Unmarried |
| 15 to 19 years | 0 (0.0%) | 0 (0.0%) |
| 20 to 34 years | 23 (100.0%) | 0 (0.0%) |
| 35 to 50 years | 0 (0.0%) | 0 (0.0%) |
| Total | 23 (100.0%) | 0 (0.0%) |
Fertility by Education in Shenandoah Shores
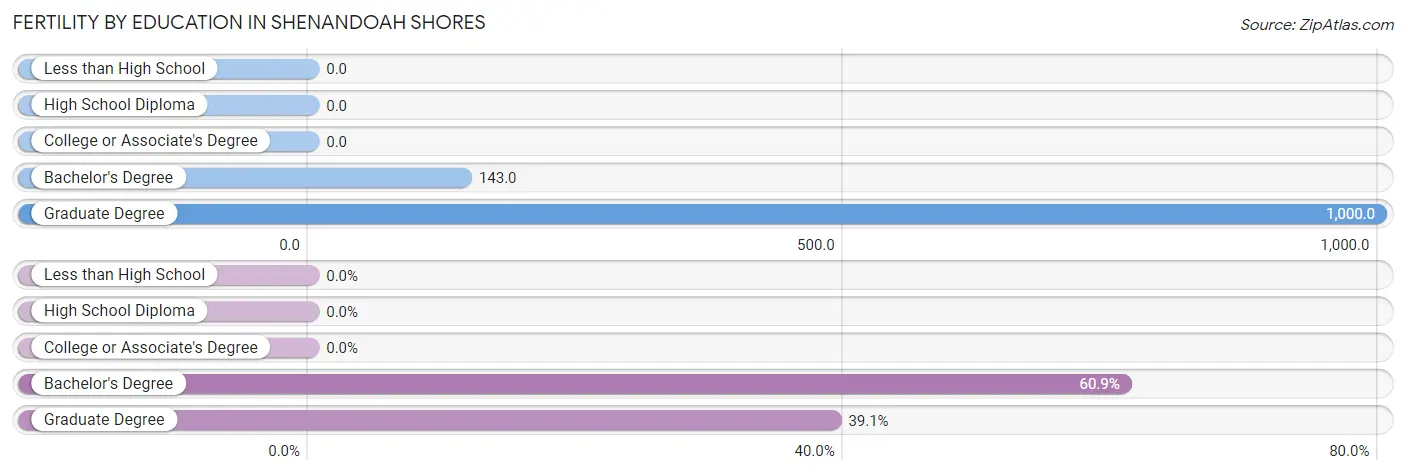
| Educational Attainment | Women with Births | Births / 1,000 Women |
| Less than High School | 0 (0.0%) | 0.0 |
| High School Diploma | 0 (0.0%) | 0.0 |
| College or Associate's Degree | 0 (0.0%) | 0.0 |
| Bachelor's Degree | 14 (60.9%) | 143.0 |
| Graduate Degree | 9 (39.1%) | 1,000.0 |
| Total | 23 (100.0%) | 124.0 |
Fertility by Education by Marriage Status in Shenandoah Shores
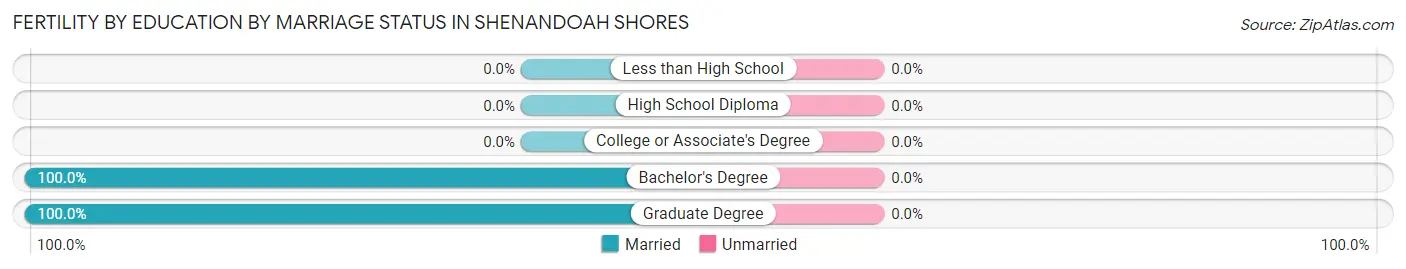
| Educational Attainment | Married | Unmarried |
| Less than High School | 0 (0.0%) | 0 (0.0%) |
| High School Diploma | 0 (0.0%) | 0 (0.0%) |
| College or Associate's Degree | 0 (0.0%) | 0 (0.0%) |
| Bachelor's Degree | 14 (100.0%) | 0 (0.0%) |
| Graduate Degree | 9 (100.0%) | 0 (0.0%) |
| Total | 23 (100.0%) | 0 (0.0%) |
Employment Characteristics in Shenandoah Shores
Employment by Class of Employer in Shenandoah Shores
Among the 334 employed individuals in Shenandoah Shores, private company employees (225 | 67.4%), local government employees (37 | 11.1%), and not-for-profit organizations (34 | 10.2%) make up the most common classes of employment.
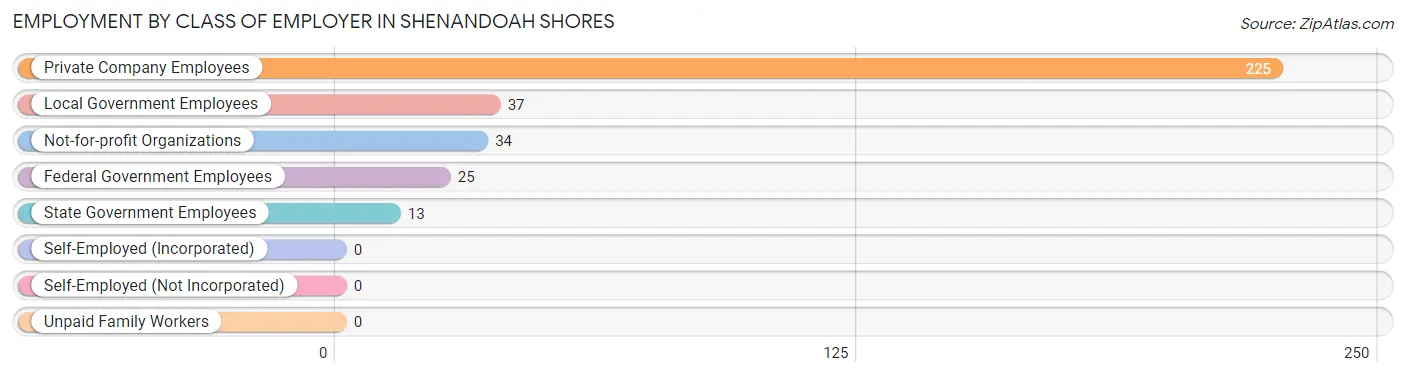
| Employer Class | # Employees | % Employees |
| Private Company Employees | 225 | 67.4% |
| Self-Employed (Incorporated) | 0 | 0.0% |
| Self-Employed (Not Incorporated) | 0 | 0.0% |
| Not-for-profit Organizations | 34 | 10.2% |
| Local Government Employees | 37 | 11.1% |
| State Government Employees | 13 | 3.9% |
| Federal Government Employees | 25 | 7.5% |
| Unpaid Family Workers | 0 | 0.0% |
| Total | 334 | 100.0% |
Employment Status by Age in Shenandoah Shores
According to the labor force statistics for Shenandoah Shores, out of the total population over 16 years of age (521), 75.2% or 392 individuals are in the labor force, with 10.7% or 42 of them unemployed. The age group with the highest labor force participation rate is 20 to 24 years, with 100.0% or 55 individuals in the labor force. Within the labor force, the 35 to 44 years age range has the highest percentage of unemployed individuals, with 60.8% or 31 of them being unemployed.
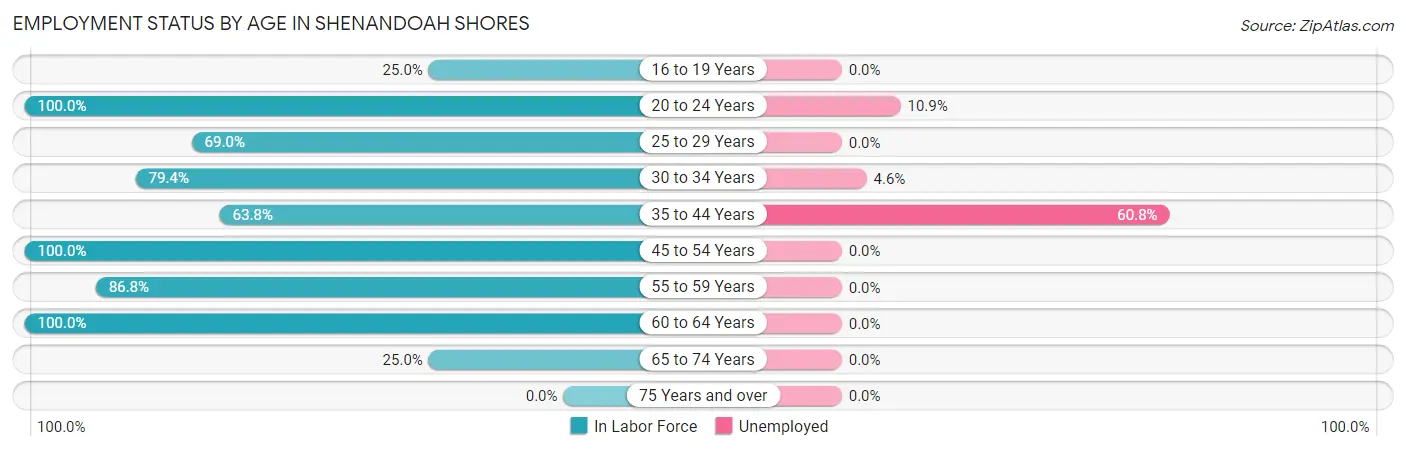
| Age Bracket | In Labor Force | Unemployed |
| 16 to 19 Years | 3 (25.0%) | 0 (0.0%) |
| 20 to 24 Years | 55 (100.0%) | 6 (10.9%) |
| 25 to 29 Years | 69 (69.0%) | 0 (0.0%) |
| 30 to 34 Years | 108 (79.4%) | 5 (4.6%) |
| 35 to 44 Years | 51 (63.8%) | 31 (60.8%) |
| 45 to 54 Years | 32 (100.0%) | 0 (0.0%) |
| 55 to 59 Years | 59 (86.8%) | 0 (0.0%) |
| 60 to 64 Years | 11 (100.0%) | 0 (0.0%) |
| 65 to 74 Years | 4 (25.0%) | 0 (0.0%) |
| 75 Years and over | 0 (0.0%) | 0 (0.0%) |
| Total | 392 (75.2%) | 42 (10.7%) |
Employment Status by Educational Attainment in Shenandoah Shores
According to labor force statistics for Shenandoah Shores, 77.3% of individuals (330) out of the total population between 25 and 64 years of age (427) are in the labor force, with 10.9% or 36 of them being unemployed. The group with the highest labor force participation rate are those with the educational attainment of less than high school, with 100.0% or 51 individuals in the labor force. Within the labor force, individuals with less than high school education have the highest percentage of unemployment, with 60.8% or 31 of them being unemployed.
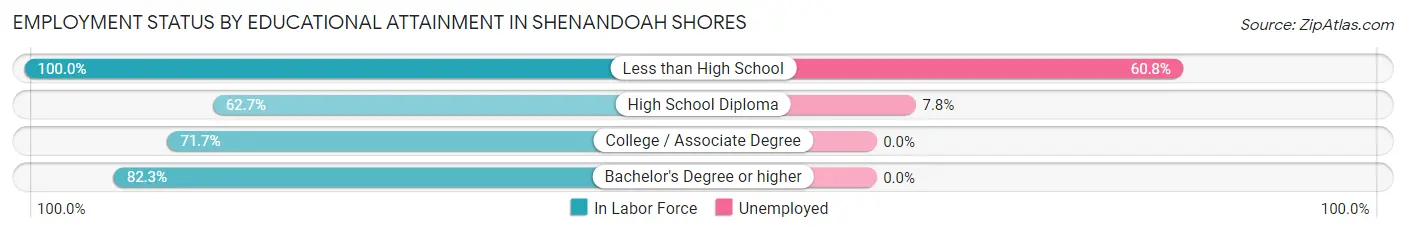
| Educational Attainment | In Labor Force | Unemployed |
| Less than High School | 51 (100.0%) | 31 (60.8%) |
| High School Diploma | 64 (62.7%) | 8 (7.8%) |
| College / Associate Degree | 71 (71.7%) | 0 (0.0%) |
| Bachelor's Degree or higher | 144 (82.3%) | 0 (0.0%) |
| Total | 330 (77.3%) | 47 (10.9%) |
Employment Occupations by Sex in Shenandoah Shores
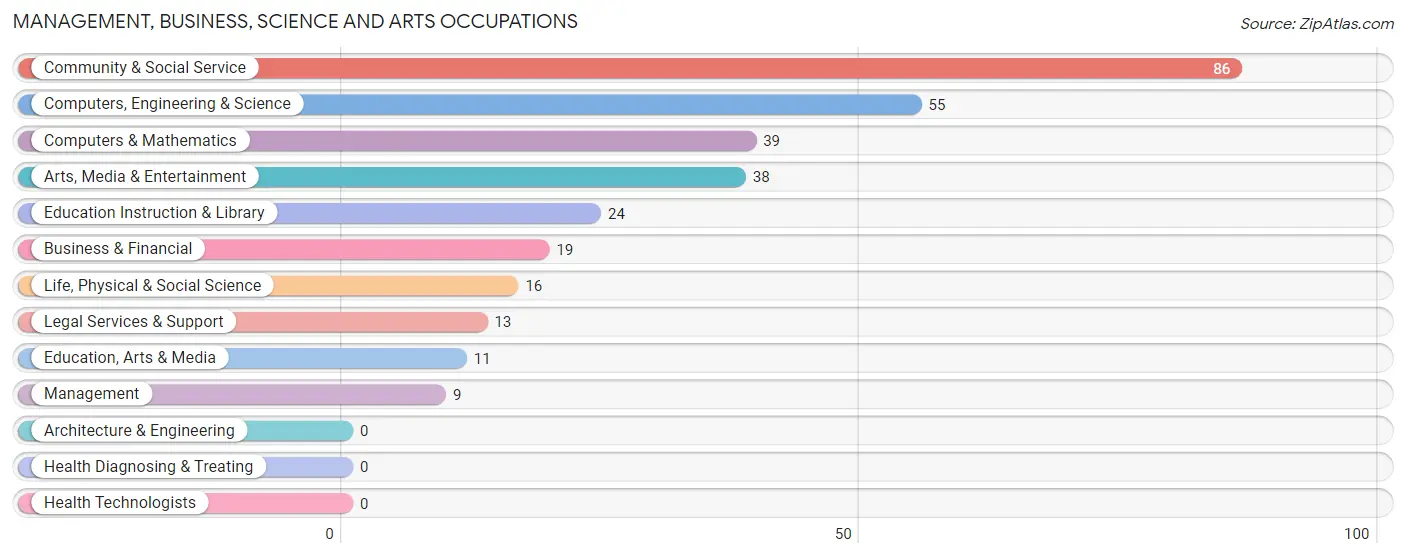
Management, Business, Science and Arts Occupations
The most common Management, Business, Science and Arts occupations in Shenandoah Shores are Community & Social Service (86 | 24.6%), Computers, Engineering & Science (55 | 15.7%), Computers & Mathematics (39 | 11.1%), Arts, Media & Entertainment (38 | 10.9%), and Education Instruction & Library (24 | 6.9%).
Management, Business, Science and Arts Occupations by Sex
Within the Management, Business, Science and Arts occupations in Shenandoah Shores, the most male-oriented occupations are Education, Arts & Media (100.0%), Legal Services & Support (100.0%), and Education Instruction & Library (79.2%), while the most female-oriented occupations are Management (100.0%), Life, Physical & Social Science (100.0%), and Arts, Media & Entertainment (100.0%).
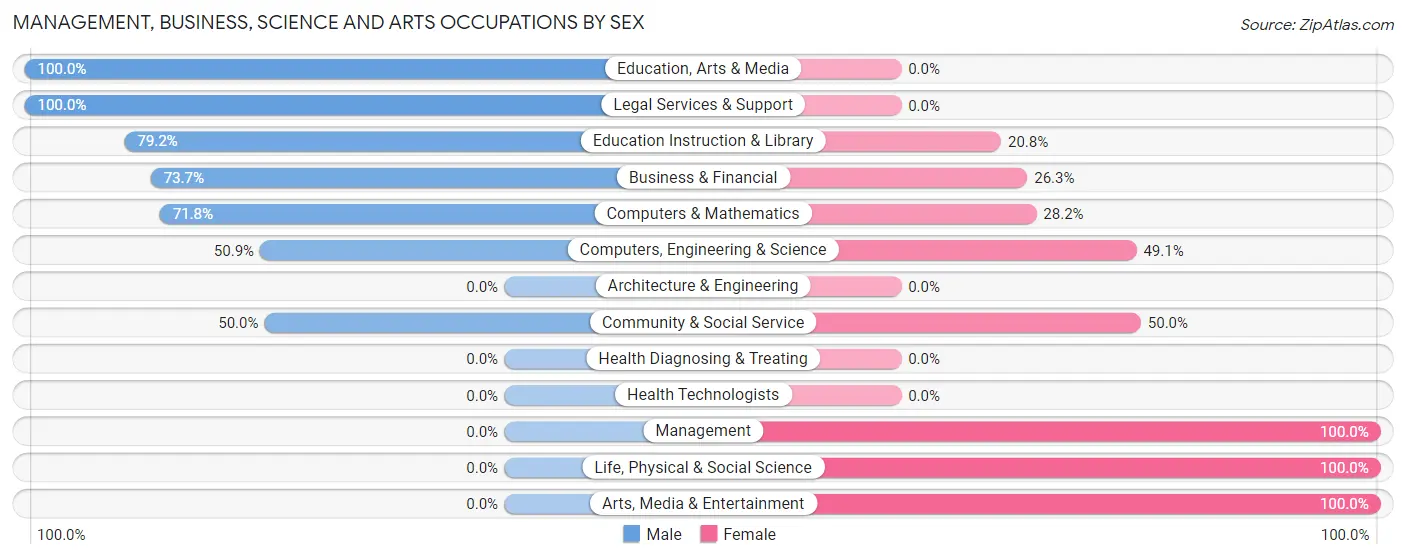
| Occupation | Male | Female |
| Management | 0 (0.0%) | 9 (100.0%) |
| Business & Financial | 14 (73.7%) | 5 (26.3%) |
| Computers, Engineering & Science | 28 (50.9%) | 27 (49.1%) |
| Computers & Mathematics | 28 (71.8%) | 11 (28.2%) |
| Architecture & Engineering | 0 (0.0%) | 0 (0.0%) |
| Life, Physical & Social Science | 0 (0.0%) | 16 (100.0%) |
| Community & Social Service | 43 (50.0%) | 43 (50.0%) |
| Education, Arts & Media | 11 (100.0%) | 0 (0.0%) |
| Legal Services & Support | 13 (100.0%) | 0 (0.0%) |
| Education Instruction & Library | 19 (79.2%) | 5 (20.8%) |
| Arts, Media & Entertainment | 0 (0.0%) | 38 (100.0%) |
| Health Diagnosing & Treating | 0 (0.0%) | 0 (0.0%) |
| Health Technologists | 0 (0.0%) | 0 (0.0%) |
| Total (Category) | 85 (50.3%) | 84 (49.7%) |
| Total (Overall) | 207 (59.1%) | 143 (40.9%) |
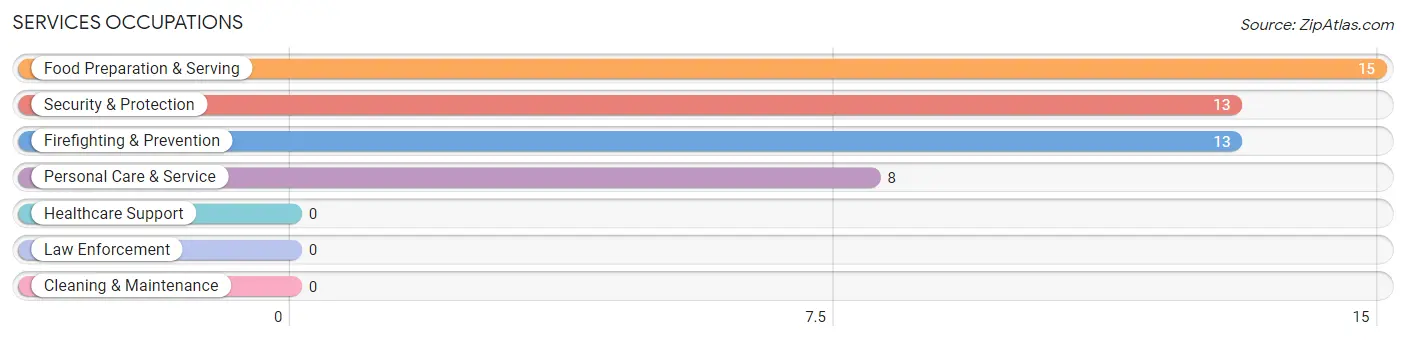
Services Occupations
The most common Services occupations in Shenandoah Shores are Food Preparation & Serving (15 | 4.3%), Security & Protection (13 | 3.7%), Firefighting & Prevention (13 | 3.7%), and Personal Care & Service (8 | 2.3%).
Services Occupations by Sex
Within the Services occupations in Shenandoah Shores, the most male-oriented occupations are Security & Protection (100.0%), and Firefighting & Prevention (100.0%), while the most female-oriented occupations are Food Preparation & Serving (100.0%), and Personal Care & Service (100.0%).
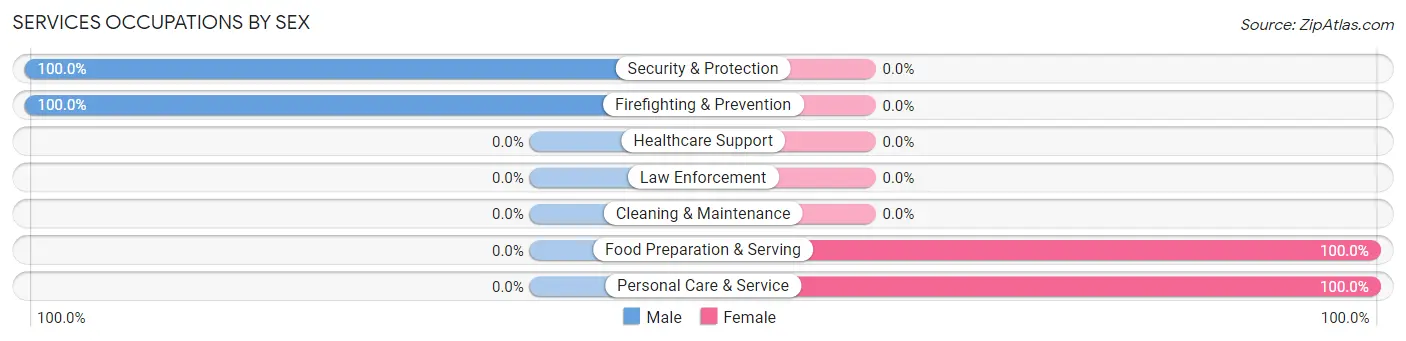
| Occupation | Male | Female |
| Healthcare Support | 0 (0.0%) | 0 (0.0%) |
| Security & Protection | 13 (100.0%) | 0 (0.0%) |
| Firefighting & Prevention | 13 (100.0%) | 0 (0.0%) |
| Law Enforcement | 0 (0.0%) | 0 (0.0%) |
| Food Preparation & Serving | 0 (0.0%) | 15 (100.0%) |
| Cleaning & Maintenance | 0 (0.0%) | 0 (0.0%) |
| Personal Care & Service | 0 (0.0%) | 8 (100.0%) |
| Total (Category) | 13 (36.1%) | 23 (63.9%) |
| Total (Overall) | 207 (59.1%) | 143 (40.9%) |
Sales and Office Occupations
The most common Sales and Office occupations in Shenandoah Shores are Sales & Related (26 | 7.4%), and Office & Administration (26 | 7.4%).
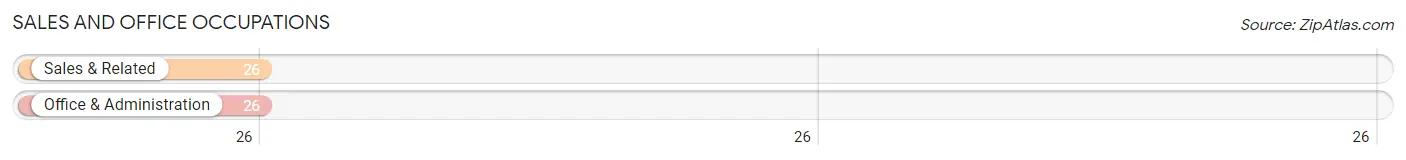
Sales and Office Occupations by Sex

| Occupation | Male | Female |
| Sales & Related | 26 (100.0%) | 0 (0.0%) |
| Office & Administration | 4 (15.4%) | 22 (84.6%) |
| Total (Category) | 30 (57.7%) | 22 (42.3%) |
| Total (Overall) | 207 (59.1%) | 143 (40.9%) |
Natural Resources, Construction and Maintenance Occupations
The most common Natural Resources, Construction and Maintenance occupations in Shenandoah Shores are Installation, Maintenance & Repair (38 | 10.9%), and Construction & Extraction (25 | 7.1%).
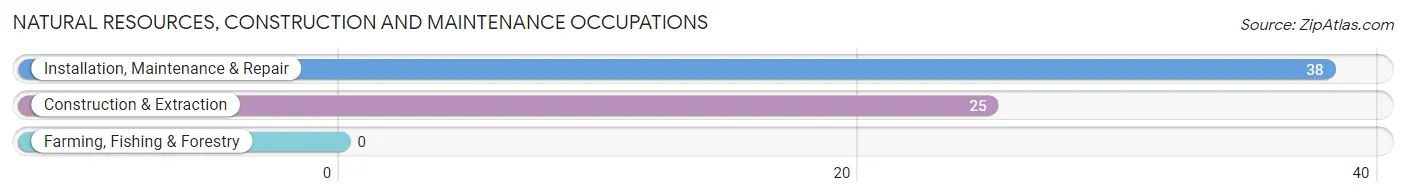
Natural Resources, Construction and Maintenance Occupations by Sex

| Occupation | Male | Female |
| Farming, Fishing & Forestry | 0 (0.0%) | 0 (0.0%) |
| Construction & Extraction | 25 (100.0%) | 0 (0.0%) |
| Installation, Maintenance & Repair | 38 (100.0%) | 0 (0.0%) |
| Total (Category) | 63 (100.0%) | 0 (0.0%) |
| Total (Overall) | 207 (59.1%) | 143 (40.9%) |
Production, Transportation and Moving Occupations
The most common Production, Transportation and Moving occupations in Shenandoah Shores are Production (14 | 4.0%), Transportation (10 | 2.9%), and Material Moving (6 | 1.7%).
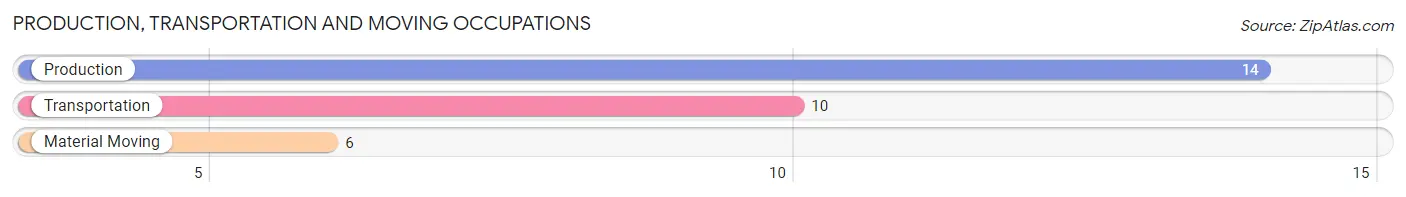
Production, Transportation and Moving Occupations by Sex
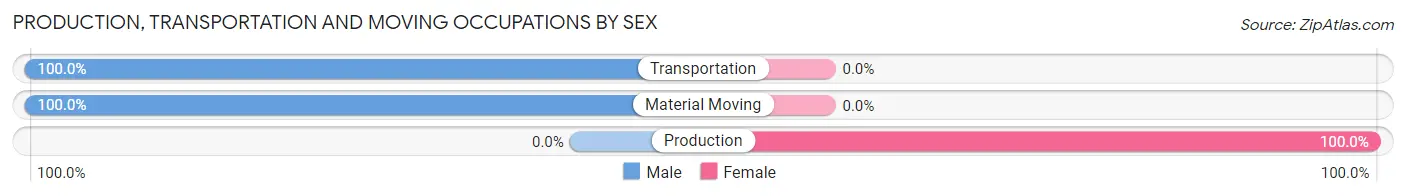
| Occupation | Male | Female |
| Production | 0 (0.0%) | 14 (100.0%) |
| Transportation | 10 (100.0%) | 0 (0.0%) |
| Material Moving | 6 (100.0%) | 0 (0.0%) |
| Total (Category) | 16 (53.3%) | 14 (46.7%) |
| Total (Overall) | 207 (59.1%) | 143 (40.9%) |
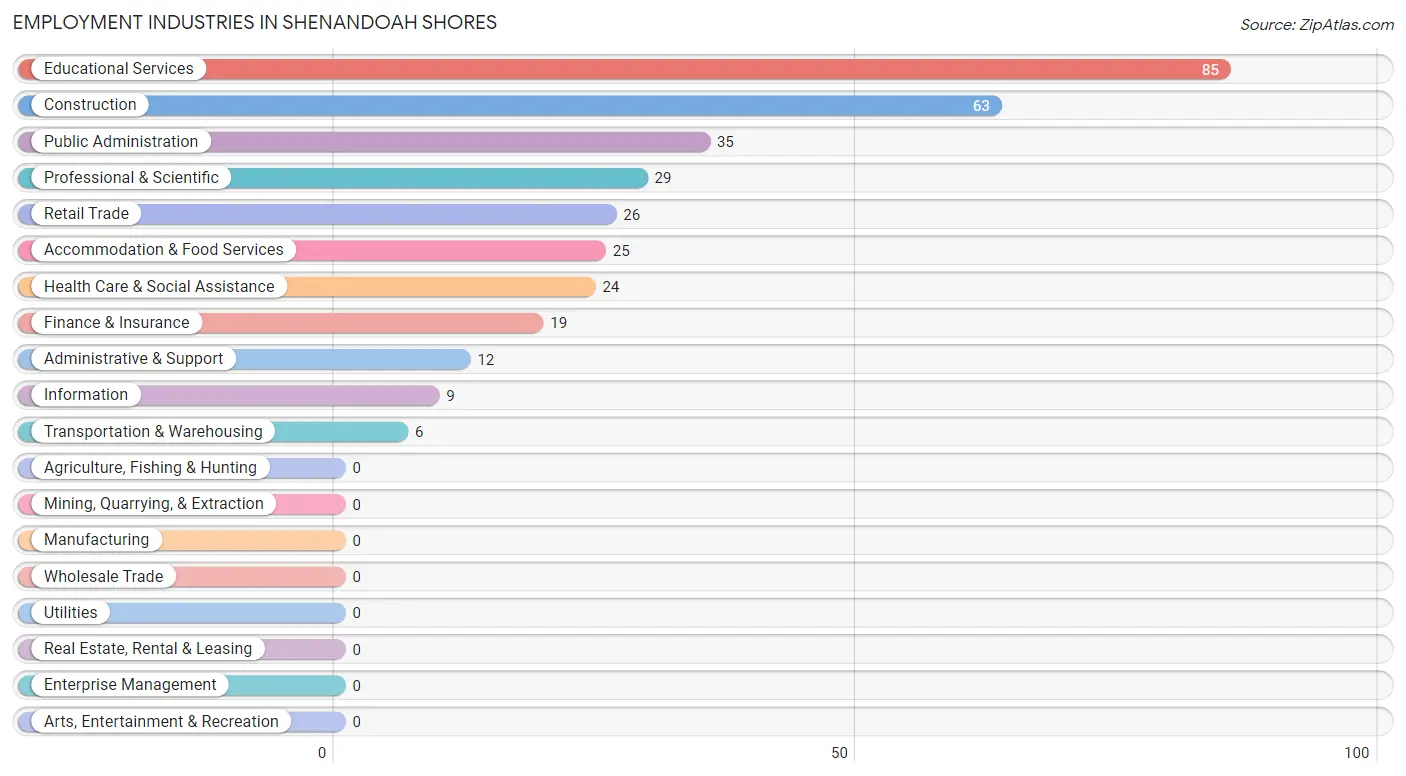
Employment Industries by Sex in Shenandoah Shores
Employment Industries in Shenandoah Shores
The major employment industries in Shenandoah Shores include Educational Services (85 | 24.3%), Construction (63 | 18.0%), Public Administration (35 | 10.0%), Professional & Scientific (29 | 8.3%), and Retail Trade (26 | 7.4%).
Employment Industries by Sex in Shenandoah Shores
The Shenandoah Shores industries that see more men than women are Retail Trade (100.0%), Transportation & Warehousing (100.0%), and Finance & Insurance (100.0%), whereas the industries that tend to have a higher number of women are Information (100.0%), Health Care & Social Assistance (100.0%), and Educational Services (72.9%).
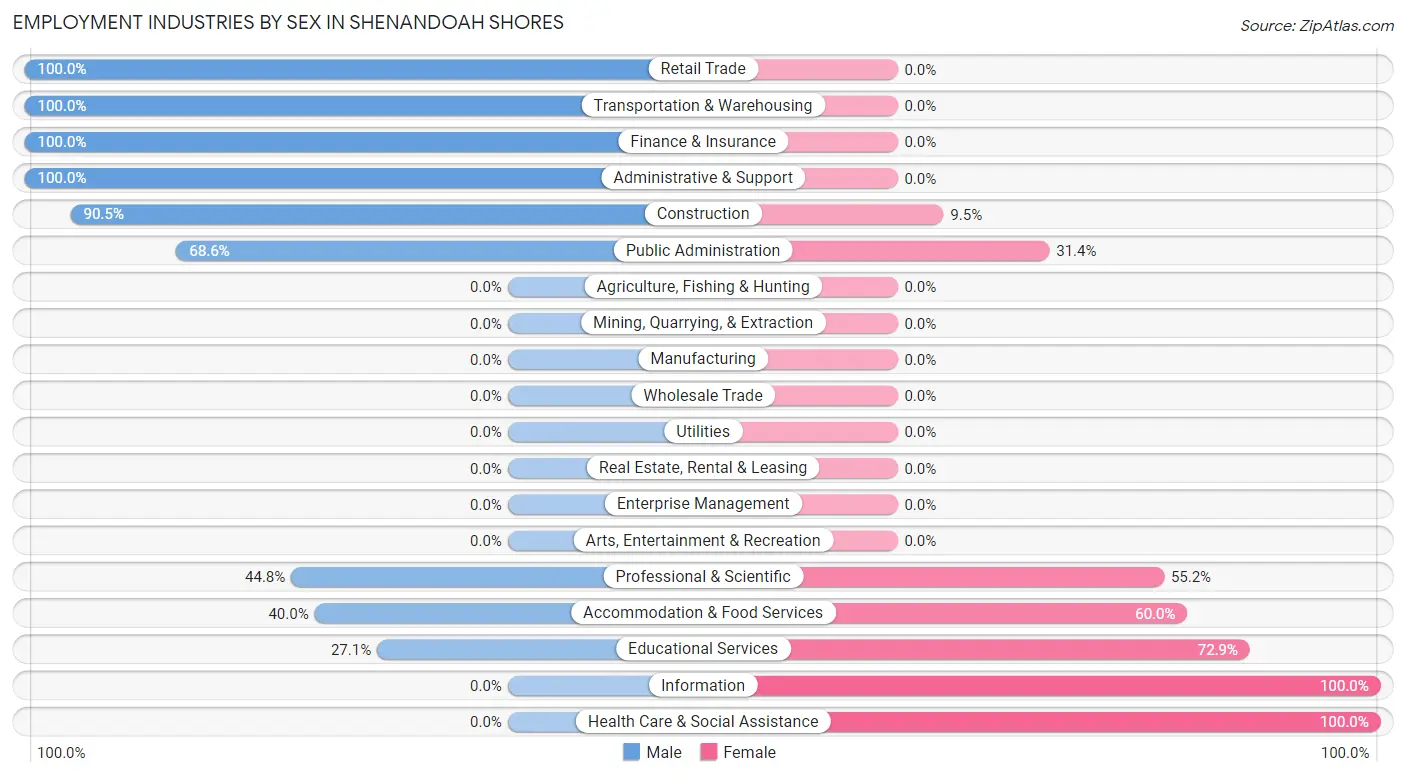
| Industry | Male | Female |
| Agriculture, Fishing & Hunting | 0 (0.0%) | 0 (0.0%) |
| Mining, Quarrying, & Extraction | 0 (0.0%) | 0 (0.0%) |
| Construction | 57 (90.5%) | 6 (9.5%) |
| Manufacturing | 0 (0.0%) | 0 (0.0%) |
| Wholesale Trade | 0 (0.0%) | 0 (0.0%) |
| Retail Trade | 26 (100.0%) | 0 (0.0%) |
| Transportation & Warehousing | 6 (100.0%) | 0 (0.0%) |
| Utilities | 0 (0.0%) | 0 (0.0%) |
| Information | 0 (0.0%) | 9 (100.0%) |
| Finance & Insurance | 19 (100.0%) | 0 (0.0%) |
| Real Estate, Rental & Leasing | 0 (0.0%) | 0 (0.0%) |
| Professional & Scientific | 13 (44.8%) | 16 (55.2%) |
| Enterprise Management | 0 (0.0%) | 0 (0.0%) |
| Administrative & Support | 12 (100.0%) | 0 (0.0%) |
| Educational Services | 23 (27.1%) | 62 (72.9%) |
| Health Care & Social Assistance | 0 (0.0%) | 24 (100.0%) |
| Arts, Entertainment & Recreation | 0 (0.0%) | 0 (0.0%) |
| Accommodation & Food Services | 10 (40.0%) | 15 (60.0%) |
| Public Administration | 24 (68.6%) | 11 (31.4%) |
| Total | 207 (59.1%) | 143 (40.9%) |
Education in Shenandoah Shores
School Enrollment in Shenandoah Shores
The most common levels of schooling among the 141 students in Shenandoah Shores are high school (50 | 35.5%), kindergarten (40 | 28.4%), and middle school (26 | 18.4%).
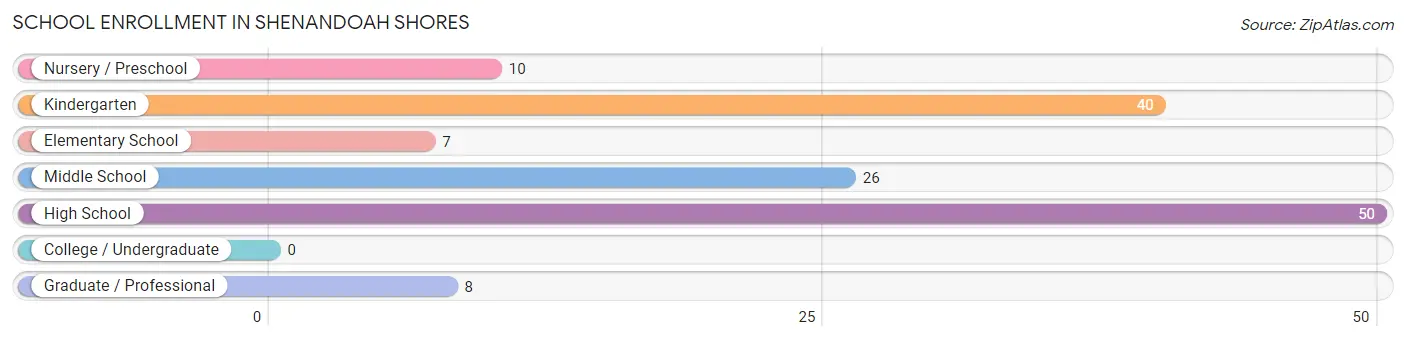
| School Level | # Students | % Students |
| Nursery / Preschool | 10 | 7.1% |
| Kindergarten | 40 | 28.4% |
| Elementary School | 7 | 5.0% |
| Middle School | 26 | 18.4% |
| High School | 50 | 35.5% |
| College / Undergraduate | 0 | 0.0% |
| Graduate / Professional | 8 | 5.7% |
| Total | 141 | 100.0% |
School Enrollment by Age by Funding Source in Shenandoah Shores
Out of a total of 141 students who are enrolled in schools in Shenandoah Shores, 44 (31.2%) attend a private institution, while the remaining 97 (68.8%) are enrolled in public schools. The age group of 25 to 34 year olds has the highest likelihood of being enrolled in private schools, with 8 (100.0% in the age bracket) enrolled. Conversely, the age group of 3 to 4 year olds has the lowest likelihood of being enrolled in a private school, with 10 (100.0% in the age bracket) attending a public institution.
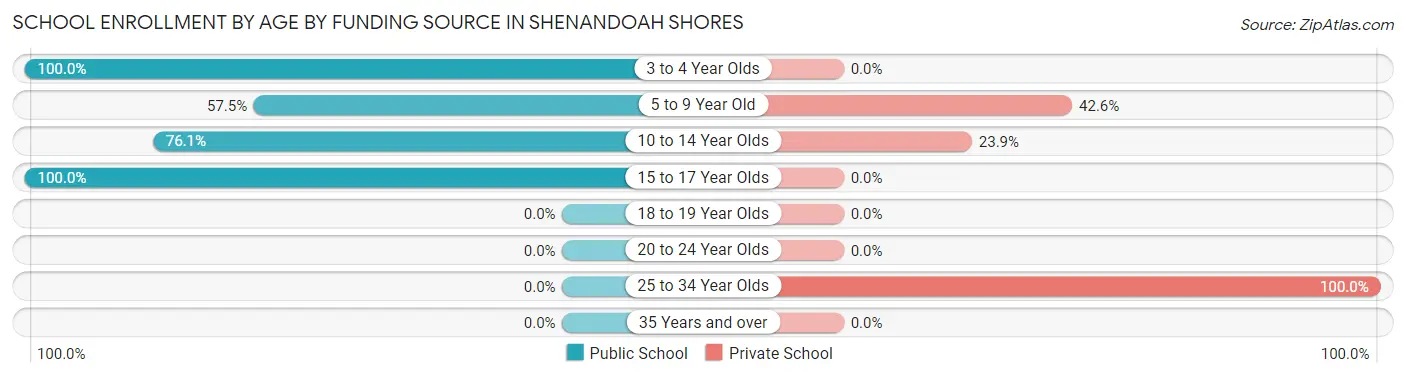
| Age Bracket | Public School | Private School |
| 3 to 4 Year Olds | 10 (100.0%) | 0 (0.0%) |
| 5 to 9 Year Old | 27 (57.5%) | 20 (42.5%) |
| 10 to 14 Year Olds | 51 (76.1%) | 16 (23.9%) |
| 15 to 17 Year Olds | 9 (100.0%) | 0 (0.0%) |
| 18 to 19 Year Olds | 0 (0.0%) | 0 (0.0%) |
| 20 to 24 Year Olds | 0 (0.0%) | 0 (0.0%) |
| 25 to 34 Year Olds | 0 (0.0%) | 8 (100.0%) |
| 35 Years and over | 0 (0.0%) | 0 (0.0%) |
| Total | 97 (68.8%) | 44 (31.2%) |
Educational Attainment by Field of Study in Shenandoah Shores
Liberal arts & history (44 | 23.7%), social sciences (42 | 22.6%), business (29 | 15.6%), literature & languages (25 | 13.4%), and computers & mathematics (19 | 10.2%) are the most common fields of study among 186 individuals in Shenandoah Shores who have obtained a bachelor's degree or higher.
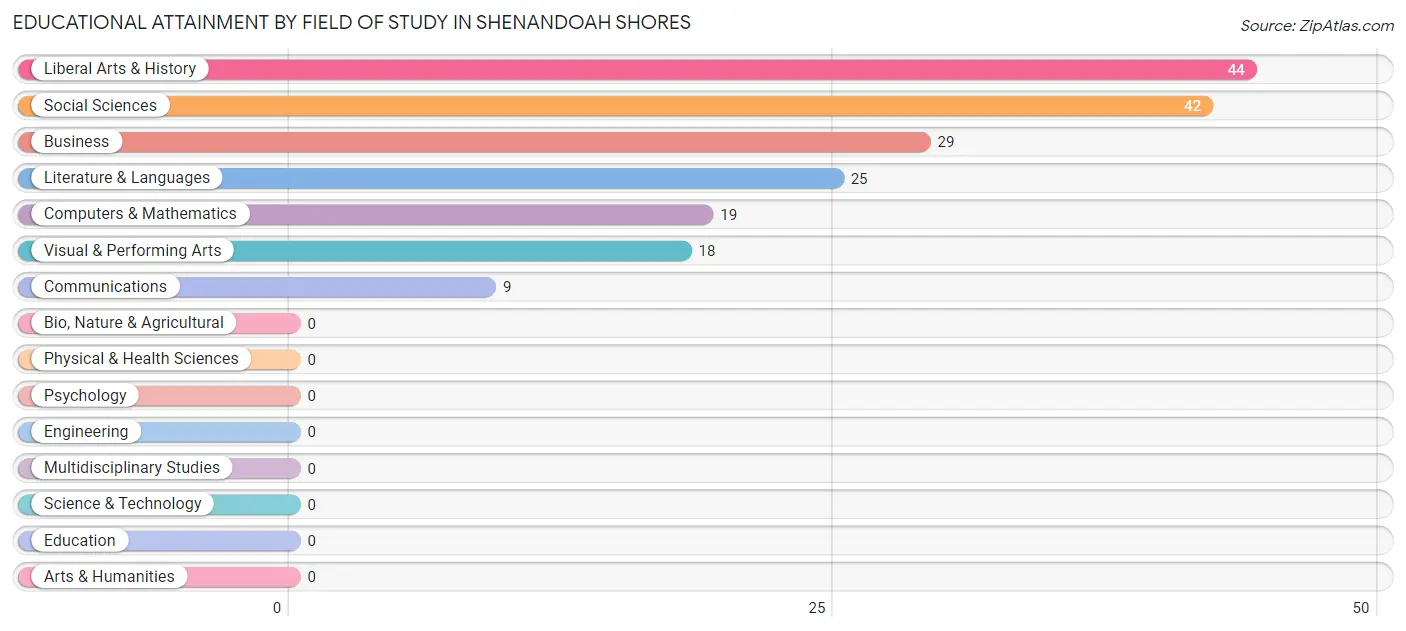
| Field of Study | # Graduates | % Graduates |
| Computers & Mathematics | 19 | 10.2% |
| Bio, Nature & Agricultural | 0 | 0.0% |
| Physical & Health Sciences | 0 | 0.0% |
| Psychology | 0 | 0.0% |
| Social Sciences | 42 | 22.6% |
| Engineering | 0 | 0.0% |
| Multidisciplinary Studies | 0 | 0.0% |
| Science & Technology | 0 | 0.0% |
| Business | 29 | 15.6% |
| Education | 0 | 0.0% |
| Literature & Languages | 25 | 13.4% |
| Liberal Arts & History | 44 | 23.7% |
| Visual & Performing Arts | 18 | 9.7% |
| Communications | 9 | 4.8% |
| Arts & Humanities | 0 | 0.0% |
| Total | 186 | 100.0% |
Transportation & Commute in Shenandoah Shores
Vehicle Availability by Sex in Shenandoah Shores
The most prevalent vehicle ownership categories in Shenandoah Shores are males with 2 vehicles (71, accounting for 37.2%) and females with 2 vehicles (82, making up 49.6%).
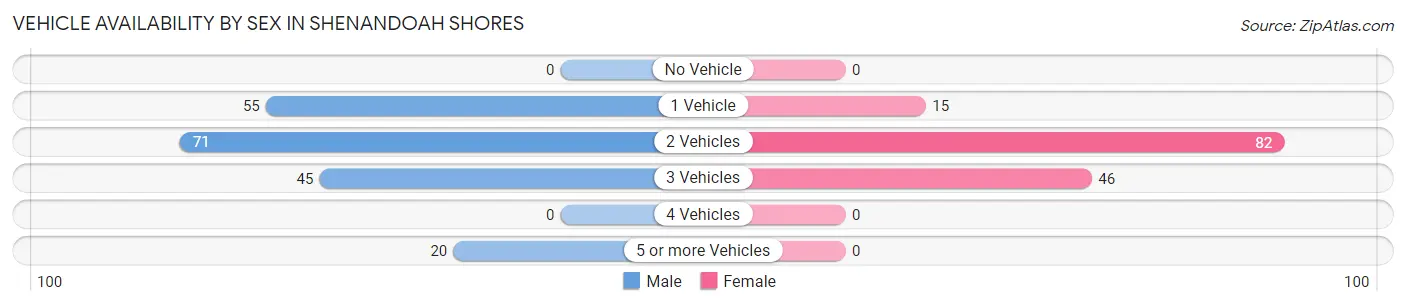
| Vehicles Available | Male | Female |
| No Vehicle | 0 (0.0%) | 0 (0.0%) |
| 1 Vehicle | 55 (28.8%) | 15 (10.5%) |
| 2 Vehicles | 71 (37.2%) | 82 (57.3%) |
| 3 Vehicles | 45 (23.6%) | 46 (32.2%) |
| 4 Vehicles | 0 (0.0%) | 0 (0.0%) |
| 5 or more Vehicles | 20 (10.5%) | 0 (0.0%) |
| Total | 191 (100.0%) | 143 (100.0%) |
Commute Time in Shenandoah Shores
The most frequently occuring commute durations in Shenandoah Shores are 60 to 89 minutes (105 commuters, 38.3%), less than 5 minutes (28 commuters, 10.2%), and 15 to 19 minutes (27 commuters, 9.9%).
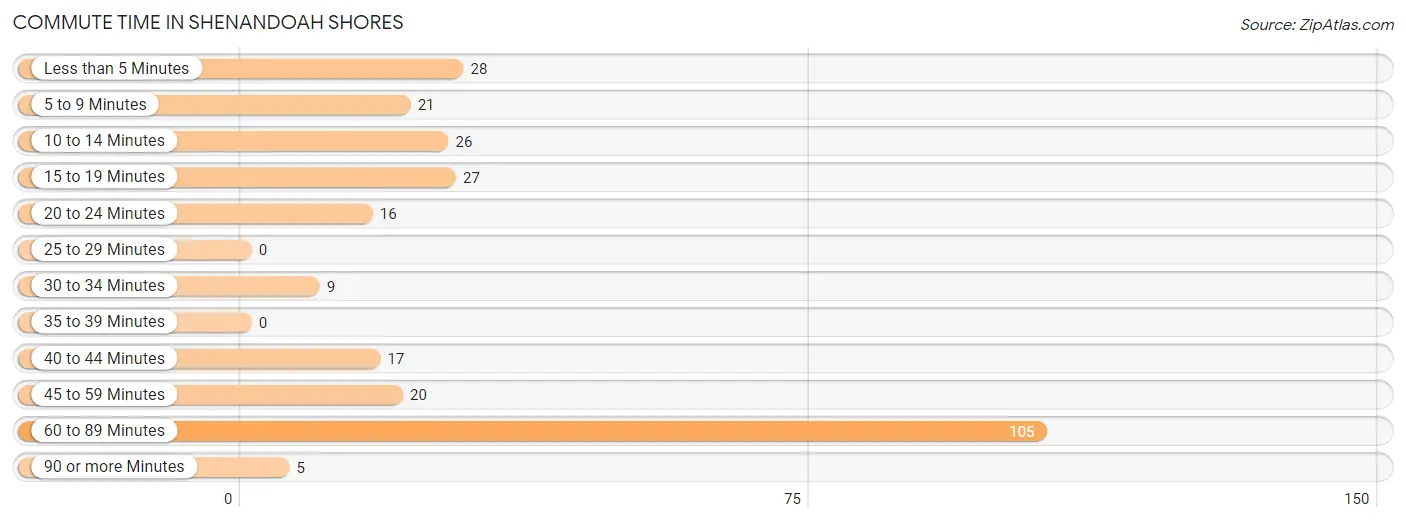
| Commute Time | # Commuters | % Commuters |
| Less than 5 Minutes | 28 | 10.2% |
| 5 to 9 Minutes | 21 | 7.7% |
| 10 to 14 Minutes | 26 | 9.5% |
| 15 to 19 Minutes | 27 | 9.9% |
| 20 to 24 Minutes | 16 | 5.8% |
| 25 to 29 Minutes | 0 | 0.0% |
| 30 to 34 Minutes | 9 | 3.3% |
| 35 to 39 Minutes | 0 | 0.0% |
| 40 to 44 Minutes | 17 | 6.2% |
| 45 to 59 Minutes | 20 | 7.3% |
| 60 to 89 Minutes | 105 | 38.3% |
| 90 or more Minutes | 5 | 1.8% |
Commute Time by Sex in Shenandoah Shores
The most common commute times in Shenandoah Shores are 60 to 89 minutes (82 commuters, 48.5%) for males and 60 to 89 minutes (23 commuters, 21.9%) for females.
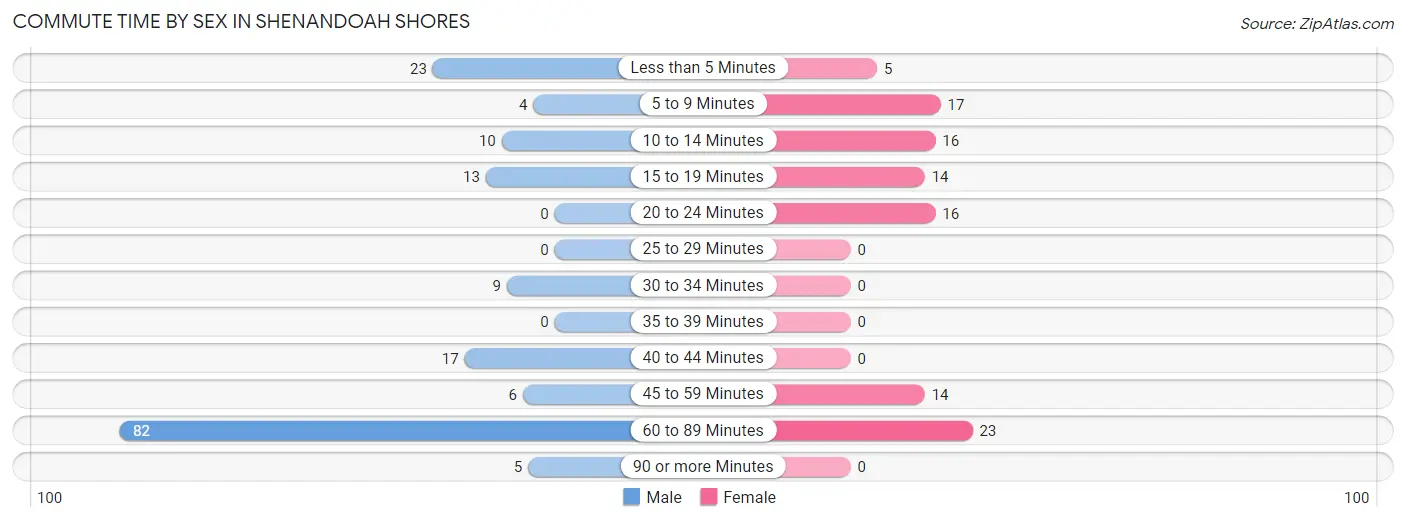
| Commute Time | Male | Female |
| Less than 5 Minutes | 23 (13.6%) | 5 (4.8%) |
| 5 to 9 Minutes | 4 (2.4%) | 17 (16.2%) |
| 10 to 14 Minutes | 10 (5.9%) | 16 (15.2%) |
| 15 to 19 Minutes | 13 (7.7%) | 14 (13.3%) |
| 20 to 24 Minutes | 0 (0.0%) | 16 (15.2%) |
| 25 to 29 Minutes | 0 (0.0%) | 0 (0.0%) |
| 30 to 34 Minutes | 9 (5.3%) | 0 (0.0%) |
| 35 to 39 Minutes | 0 (0.0%) | 0 (0.0%) |
| 40 to 44 Minutes | 17 (10.1%) | 0 (0.0%) |
| 45 to 59 Minutes | 6 (3.5%) | 14 (13.3%) |
| 60 to 89 Minutes | 82 (48.5%) | 23 (21.9%) |
| 90 or more Minutes | 5 (3.0%) | 0 (0.0%) |
Time of Departure to Work by Sex in Shenandoah Shores
The most frequent times of departure to work in Shenandoah Shores are 12:00 AM to 4:59 AM (62, 36.7%) for males and 7:00 AM to 7:29 AM (47, 44.8%) for females.
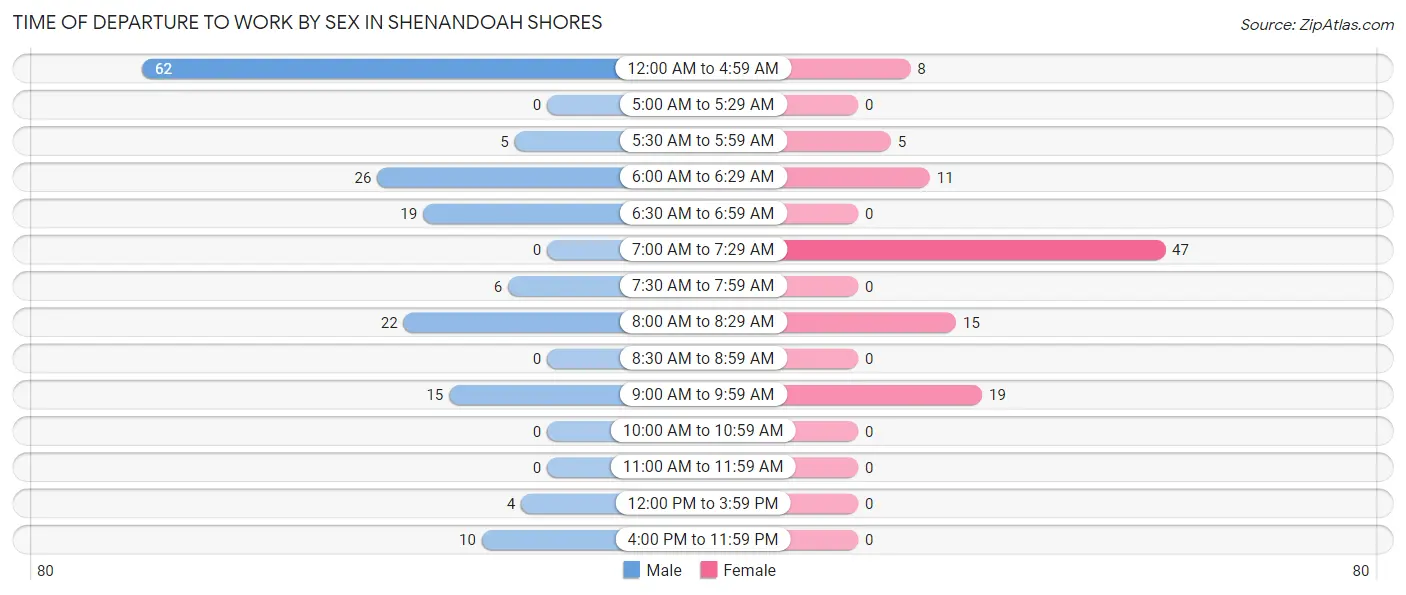
| Time of Departure | Male | Female |
| 12:00 AM to 4:59 AM | 62 (36.7%) | 8 (7.6%) |
| 5:00 AM to 5:29 AM | 0 (0.0%) | 0 (0.0%) |
| 5:30 AM to 5:59 AM | 5 (3.0%) | 5 (4.8%) |
| 6:00 AM to 6:29 AM | 26 (15.4%) | 11 (10.5%) |
| 6:30 AM to 6:59 AM | 19 (11.2%) | 0 (0.0%) |
| 7:00 AM to 7:29 AM | 0 (0.0%) | 47 (44.8%) |
| 7:30 AM to 7:59 AM | 6 (3.5%) | 0 (0.0%) |
| 8:00 AM to 8:29 AM | 22 (13.0%) | 15 (14.3%) |
| 8:30 AM to 8:59 AM | 0 (0.0%) | 0 (0.0%) |
| 9:00 AM to 9:59 AM | 15 (8.9%) | 19 (18.1%) |
| 10:00 AM to 10:59 AM | 0 (0.0%) | 0 (0.0%) |
| 11:00 AM to 11:59 AM | 0 (0.0%) | 0 (0.0%) |
| 12:00 PM to 3:59 PM | 4 (2.4%) | 0 (0.0%) |
| 4:00 PM to 11:59 PM | 10 (5.9%) | 0 (0.0%) |
| Total | 169 (100.0%) | 105 (100.0%) |
Housing Occupancy in Shenandoah Shores
Occupancy by Ownership in Shenandoah Shores
Of the total 280 dwellings in Shenandoah Shores, owner-occupied units account for 212 (75.7%), while renter-occupied units make up 68 (24.3%).
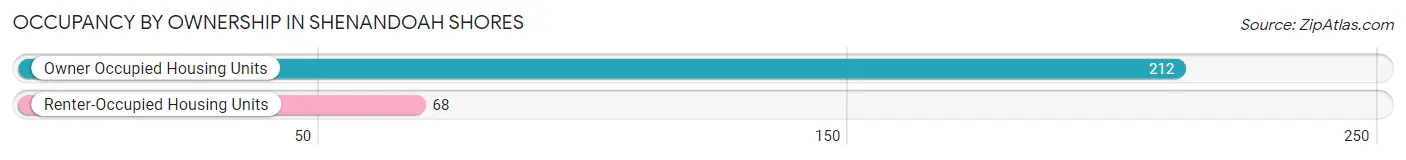
| Occupancy | # Housing Units | % Housing Units |
| Owner Occupied Housing Units | 212 | 75.7% |
| Renter-Occupied Housing Units | 68 | 24.3% |
| Total Occupied Housing Units | 280 | 100.0% |
Occupancy by Household Size in Shenandoah Shores
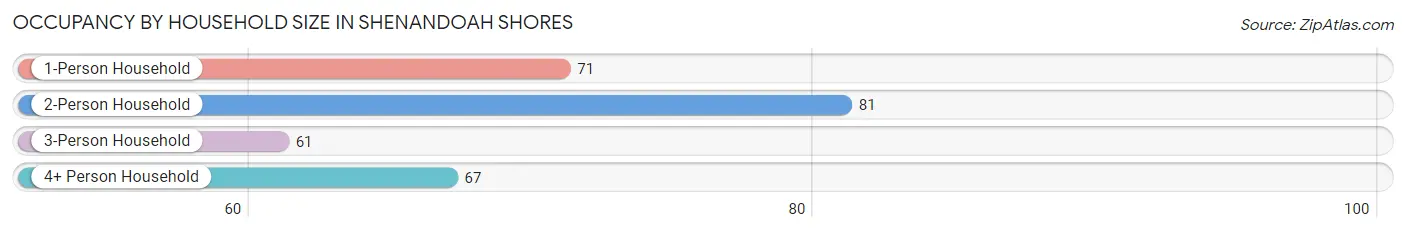
| Household Size | # Housing Units | % Housing Units |
| 1-Person Household | 71 | 25.4% |
| 2-Person Household | 81 | 28.9% |
| 3-Person Household | 61 | 21.8% |
| 4+ Person Household | 67 | 23.9% |
| Total Housing Units | 280 | 100.0% |
Occupancy by Ownership by Household Size in Shenandoah Shores
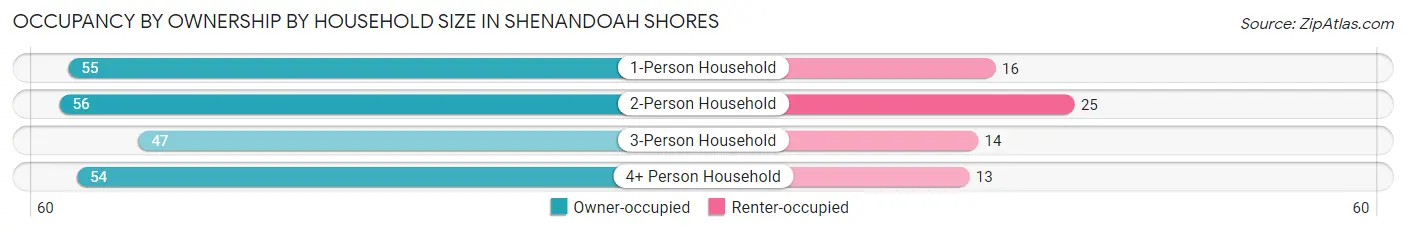
| Household Size | Owner-occupied | Renter-occupied |
| 1-Person Household | 55 (77.5%) | 16 (22.5%) |
| 2-Person Household | 56 (69.1%) | 25 (30.9%) |
| 3-Person Household | 47 (77.0%) | 14 (23.0%) |
| 4+ Person Household | 54 (80.6%) | 13 (19.4%) |
| Total Housing Units | 212 (75.7%) | 68 (24.3%) |
Occupancy by Educational Attainment in Shenandoah Shores
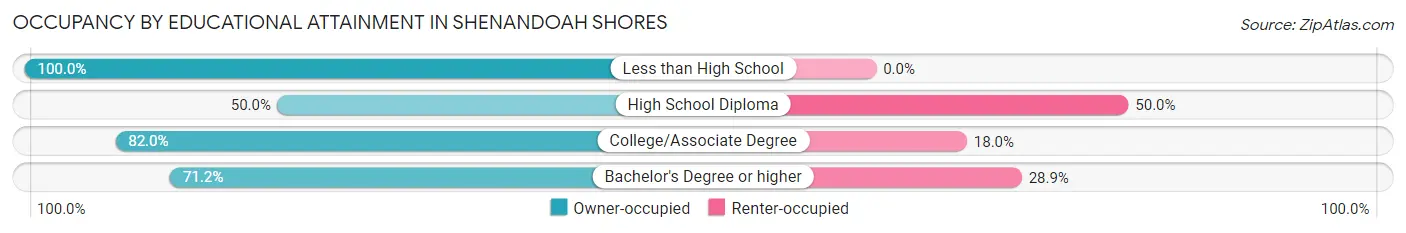
| Household Size | Owner-occupied | Renter-occupied |
| Less than High School | 43 (100.0%) | 0 (0.0%) |
| High School Diploma | 22 (50.0%) | 22 (50.0%) |
| College/Associate Degree | 73 (82.0%) | 16 (18.0%) |
| Bachelor's Degree or higher | 74 (71.2%) | 30 (28.8%) |
Occupancy by Age of Householder in Shenandoah Shores
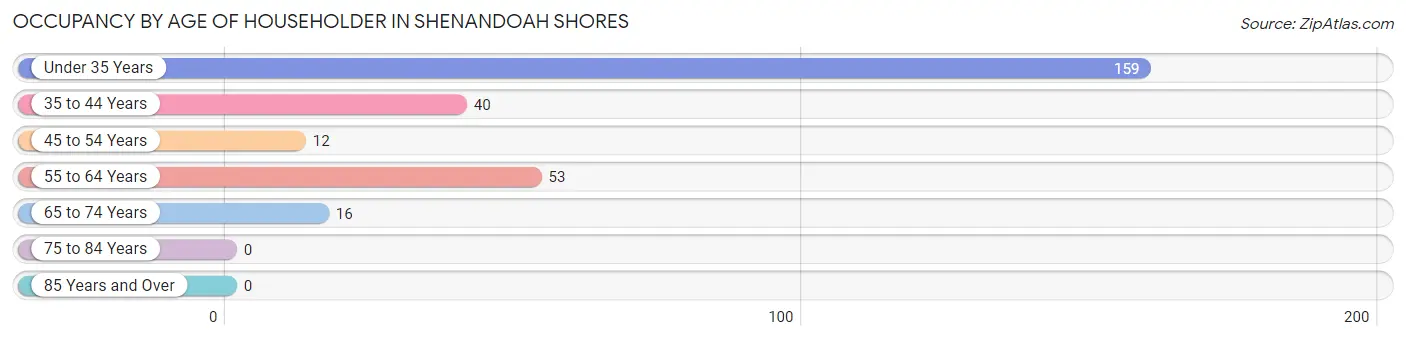
| Age Bracket | # Households | % Households |
| Under 35 Years | 159 | 56.8% |
| 35 to 44 Years | 40 | 14.3% |
| 45 to 54 Years | 12 | 4.3% |
| 55 to 64 Years | 53 | 18.9% |
| 65 to 74 Years | 16 | 5.7% |
| 75 to 84 Years | 0 | 0.0% |
| 85 Years and Over | 0 | 0.0% |
| Total | 280 | 100.0% |
Housing Finances in Shenandoah Shores
Median Income by Occupancy in Shenandoah Shores
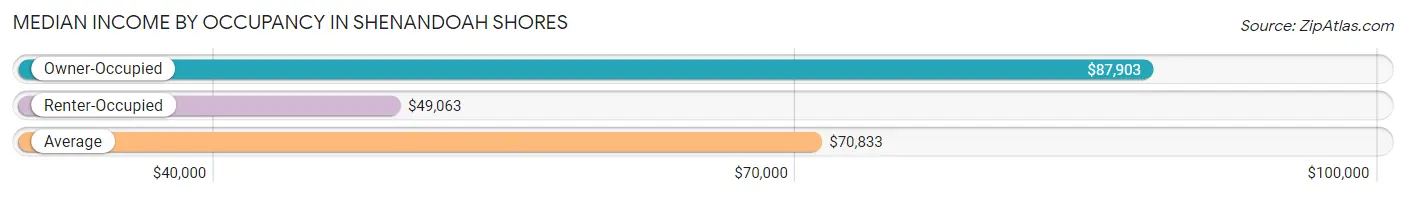
| Occupancy Type | # Households | Median Income |
| Owner-Occupied | 212 (75.7%) | $87,903 |
| Renter-Occupied | 68 (24.3%) | $49,063 |
| Average | 280 (100.0%) | $70,833 |
Occupancy by Householder Income Bracket in Shenandoah Shores
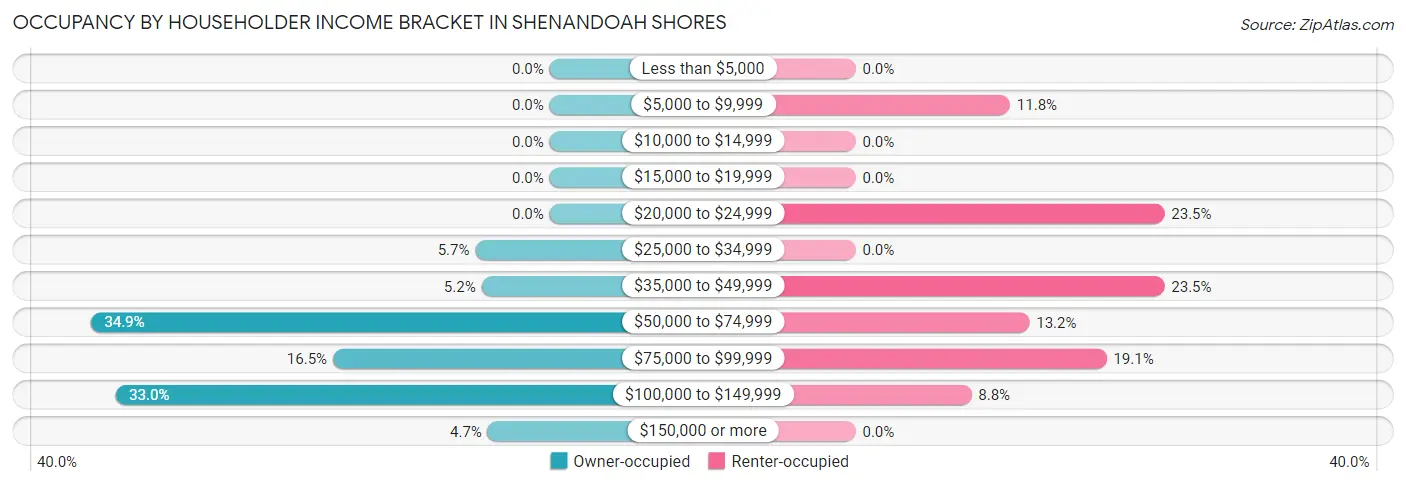
| Income Bracket | Owner-occupied | Renter-occupied |
| Less than $5,000 | 0 (0.0%) | 0 (0.0%) |
| $5,000 to $9,999 | 0 (0.0%) | 8 (11.8%) |
| $10,000 to $14,999 | 0 (0.0%) | 0 (0.0%) |
| $15,000 to $19,999 | 0 (0.0%) | 0 (0.0%) |
| $20,000 to $24,999 | 0 (0.0%) | 16 (23.5%) |
| $25,000 to $34,999 | 12 (5.7%) | 0 (0.0%) |
| $35,000 to $49,999 | 11 (5.2%) | 16 (23.5%) |
| $50,000 to $74,999 | 74 (34.9%) | 9 (13.2%) |
| $75,000 to $99,999 | 35 (16.5%) | 13 (19.1%) |
| $100,000 to $149,999 | 70 (33.0%) | 6 (8.8%) |
| $150,000 or more | 10 (4.7%) | 0 (0.0%) |
| Total | 212 (100.0%) | 68 (100.0%) |
Monthly Housing Cost Tiers in Shenandoah Shores
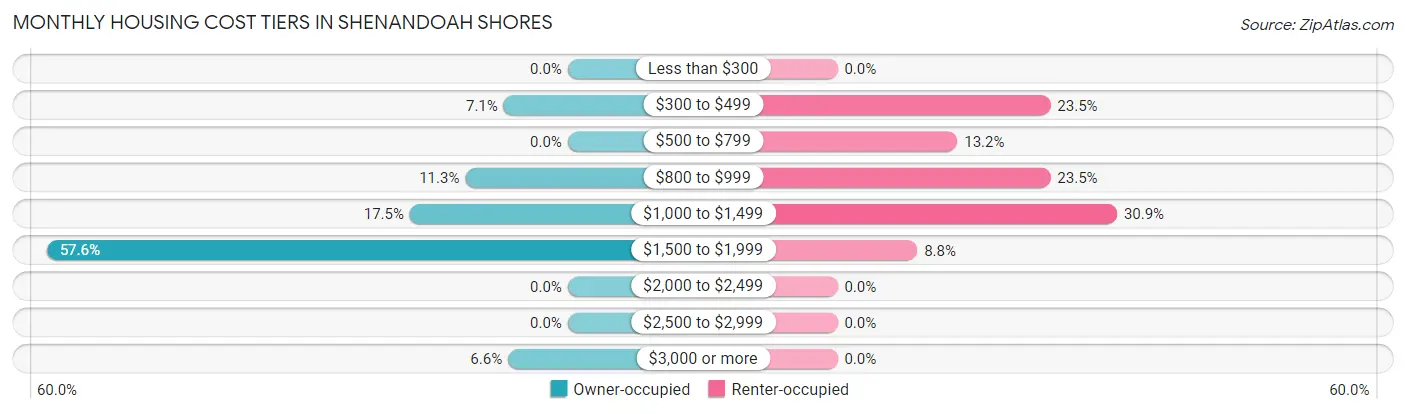
| Monthly Cost | Owner-occupied | Renter-occupied |
| Less than $300 | 0 (0.0%) | 0 (0.0%) |
| $300 to $499 | 15 (7.1%) | 16 (23.5%) |
| $500 to $799 | 0 (0.0%) | 9 (13.2%) |
| $800 to $999 | 24 (11.3%) | 16 (23.5%) |
| $1,000 to $1,499 | 37 (17.4%) | 21 (30.9%) |
| $1,500 to $1,999 | 122 (57.6%) | 6 (8.8%) |
| $2,000 to $2,499 | 0 (0.0%) | 0 (0.0%) |
| $2,500 to $2,999 | 0 (0.0%) | 0 (0.0%) |
| $3,000 or more | 14 (6.6%) | 0 (0.0%) |
| Total | 212 (100.0%) | 68 (100.0%) |
Physical Housing Characteristics in Shenandoah Shores
Housing Structures in Shenandoah Shores
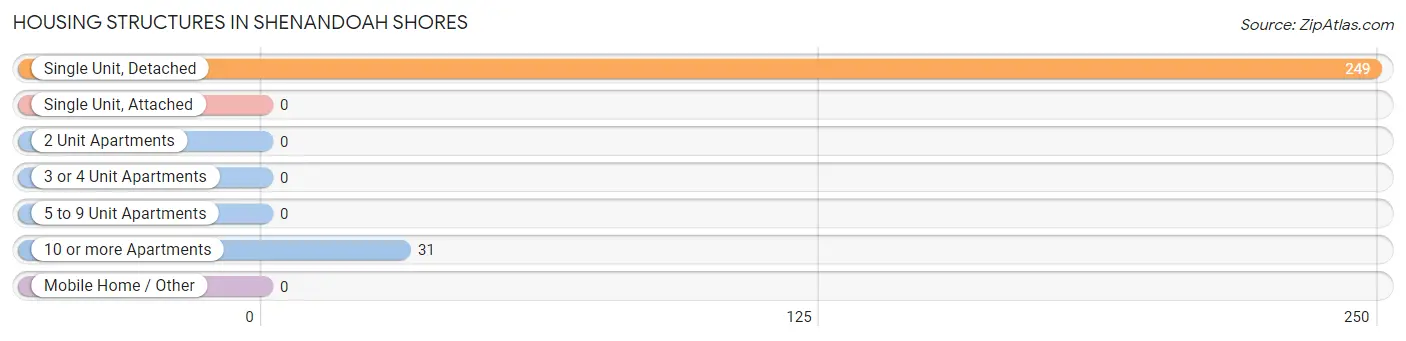
| Structure Type | # Housing Units | % Housing Units |
| Single Unit, Detached | 249 | 88.9% |
| Single Unit, Attached | 0 | 0.0% |
| 2 Unit Apartments | 0 | 0.0% |
| 3 or 4 Unit Apartments | 0 | 0.0% |
| 5 to 9 Unit Apartments | 0 | 0.0% |
| 10 or more Apartments | 31 | 11.1% |
| Mobile Home / Other | 0 | 0.0% |
| Total | 280 | 100.0% |
Housing Structures by Occupancy in Shenandoah Shores
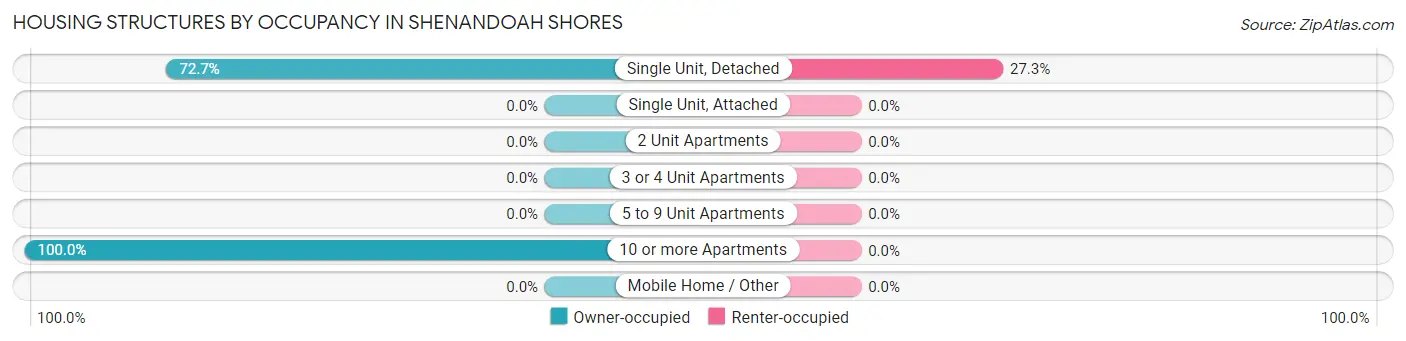
| Structure Type | Owner-occupied | Renter-occupied |
| Single Unit, Detached | 181 (72.7%) | 68 (27.3%) |
| Single Unit, Attached | 0 (0.0%) | 0 (0.0%) |
| 2 Unit Apartments | 0 (0.0%) | 0 (0.0%) |
| 3 or 4 Unit Apartments | 0 (0.0%) | 0 (0.0%) |
| 5 to 9 Unit Apartments | 0 (0.0%) | 0 (0.0%) |
| 10 or more Apartments | 31 (100.0%) | 0 (0.0%) |
| Mobile Home / Other | 0 (0.0%) | 0 (0.0%) |
| Total | 212 (75.7%) | 68 (24.3%) |
Housing Structures by Number of Rooms in Shenandoah Shores
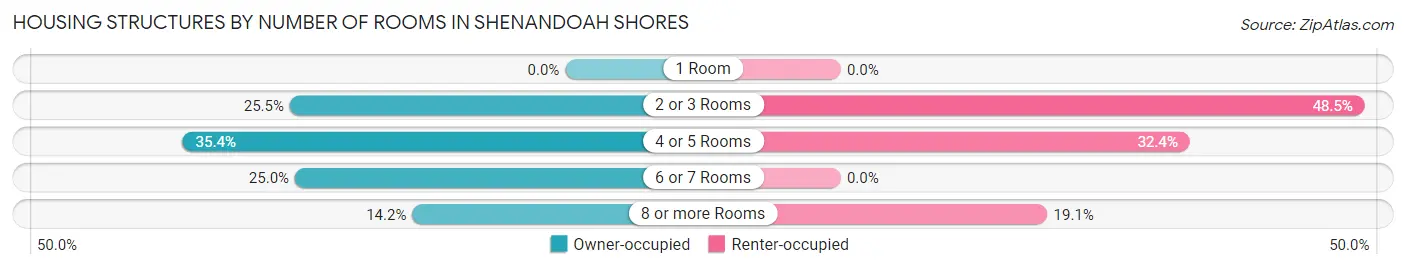
| Number of Rooms | Owner-occupied | Renter-occupied |
| 1 Room | 0 (0.0%) | 0 (0.0%) |
| 2 or 3 Rooms | 54 (25.5%) | 33 (48.5%) |
| 4 or 5 Rooms | 75 (35.4%) | 22 (32.4%) |
| 6 or 7 Rooms | 53 (25.0%) | 0 (0.0%) |
| 8 or more Rooms | 30 (14.1%) | 13 (19.1%) |
| Total | 212 (100.0%) | 68 (100.0%) |
Housing Structure by Heating Type in Shenandoah Shores
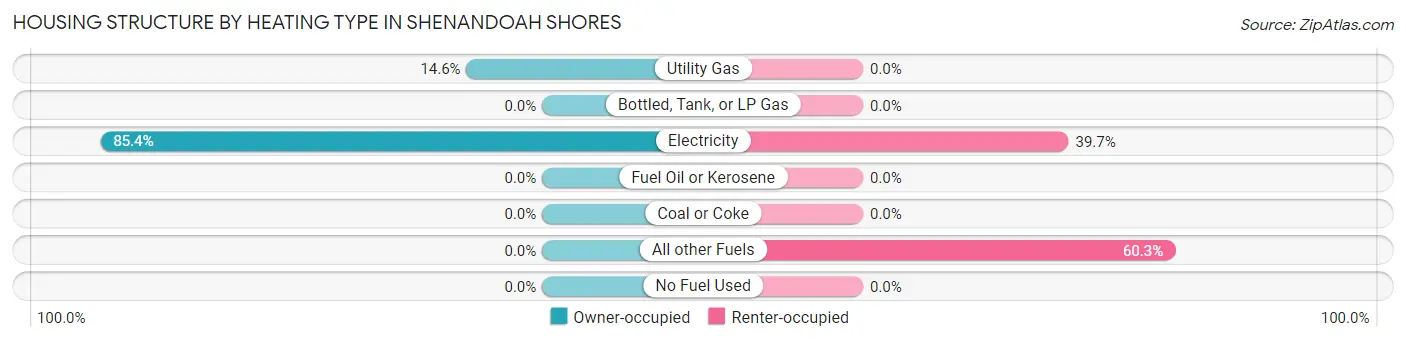
| Heating Type | Owner-occupied | Renter-occupied |
| Utility Gas | 31 (14.6%) | 0 (0.0%) |
| Bottled, Tank, or LP Gas | 0 (0.0%) | 0 (0.0%) |
| Electricity | 181 (85.4%) | 27 (39.7%) |
| Fuel Oil or Kerosene | 0 (0.0%) | 0 (0.0%) |
| Coal or Coke | 0 (0.0%) | 0 (0.0%) |
| All other Fuels | 0 (0.0%) | 41 (60.3%) |
| No Fuel Used | 0 (0.0%) | 0 (0.0%) |
| Total | 212 (100.0%) | 68 (100.0%) |
Household Vehicle Usage in Shenandoah Shores
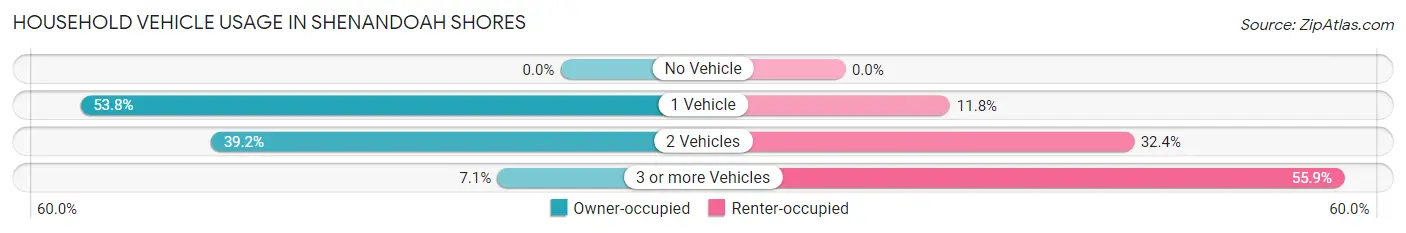
| Vehicles per Household | Owner-occupied | Renter-occupied |
| No Vehicle | 0 (0.0%) | 0 (0.0%) |
| 1 Vehicle | 114 (53.8%) | 8 (11.8%) |
| 2 Vehicles | 83 (39.2%) | 22 (32.4%) |
| 3 or more Vehicles | 15 (7.1%) | 38 (55.9%) |
| Total | 212 (100.0%) | 68 (100.0%) |
Real Estate & Mortgages in Shenandoah Shores
Real Estate and Mortgage Overview in Shenandoah Shores
| Characteristic | Without Mortgage | With Mortgage |
| Housing Units | 15 | 197 |
| Median Property Value | - | - |
| Median Household Income | - | - |
| Monthly Housing Costs | - | - |
| Real Estate Taxes | - | - |
Property Value by Mortgage Status in Shenandoah Shores
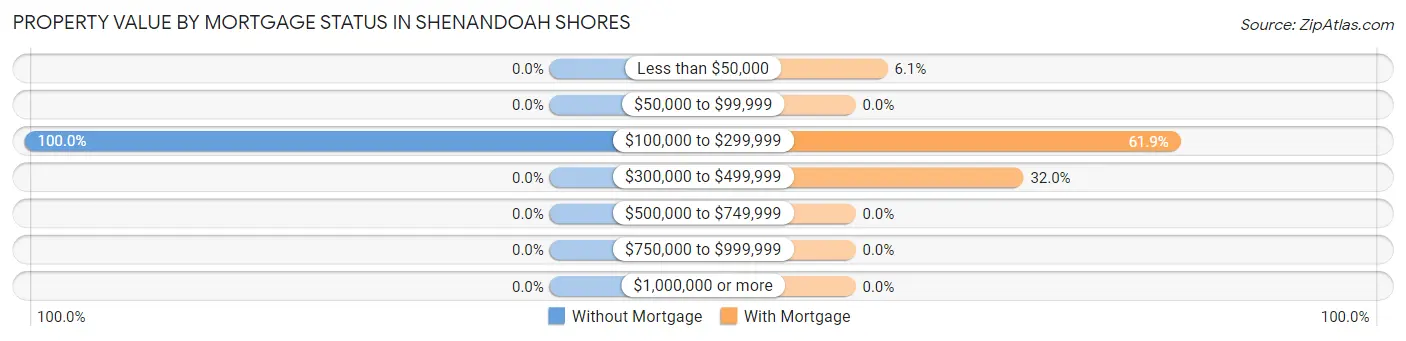
| Property Value | Without Mortgage | With Mortgage |
| Less than $50,000 | 0 (0.0%) | 12 (6.1%) |
| $50,000 to $99,999 | 0 (0.0%) | 0 (0.0%) |
| $100,000 to $299,999 | 15 (100.0%) | 122 (61.9%) |
| $300,000 to $499,999 | 0 (0.0%) | 63 (32.0%) |
| $500,000 to $749,999 | 0 (0.0%) | 0 (0.0%) |
| $750,000 to $999,999 | 0 (0.0%) | 0 (0.0%) |
| $1,000,000 or more | 0 (0.0%) | 0 (0.0%) |
| Total | 15 (100.0%) | 197 (100.0%) |
Household Income by Mortgage Status in Shenandoah Shores
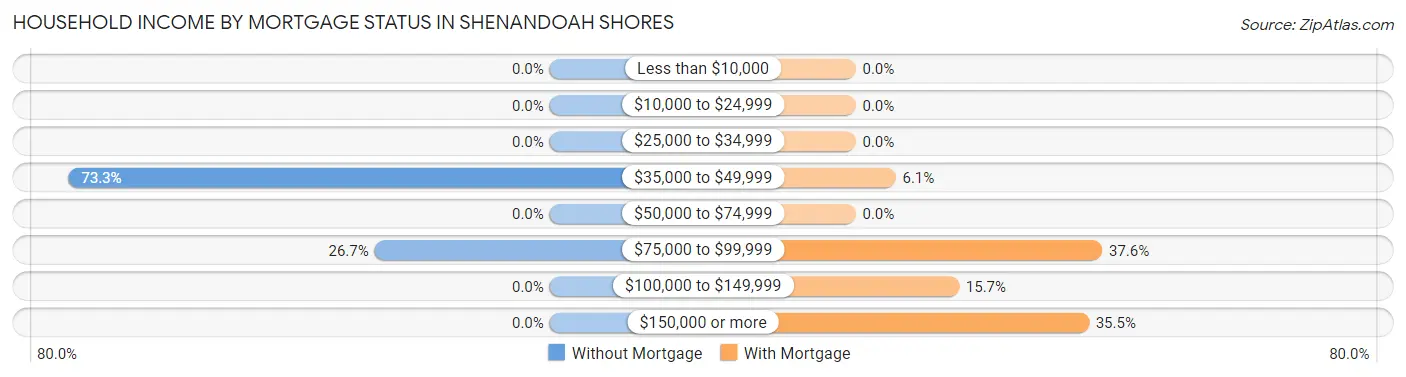
| Household Income | Without Mortgage | With Mortgage |
| Less than $10,000 | 0 (0.0%) | 0 (0.0%) |
| $10,000 to $24,999 | 0 (0.0%) | 0 (0.0%) |
| $25,000 to $34,999 | 0 (0.0%) | 0 (0.0%) |
| $35,000 to $49,999 | 11 (73.3%) | 12 (6.1%) |
| $50,000 to $74,999 | 0 (0.0%) | 0 (0.0%) |
| $75,000 to $99,999 | 4 (26.7%) | 74 (37.6%) |
| $100,000 to $149,999 | 0 (0.0%) | 31 (15.7%) |
| $150,000 or more | 0 (0.0%) | 70 (35.5%) |
| Total | 15 (100.0%) | 197 (100.0%) |
Property Value to Household Income Ratio in Shenandoah Shores
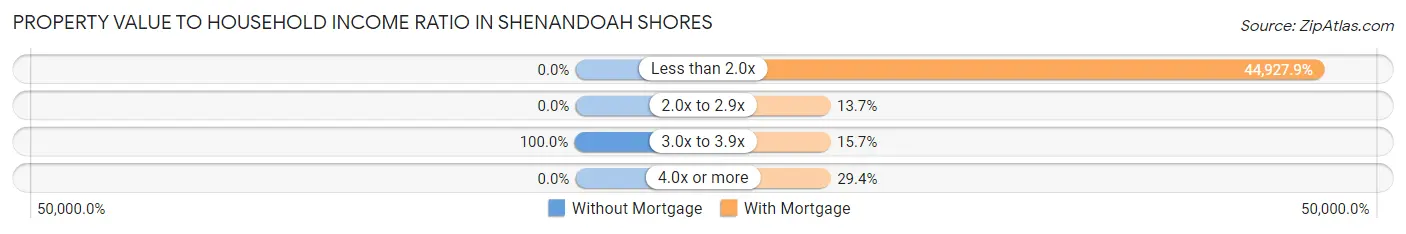
| Value-to-Income Ratio | Without Mortgage | With Mortgage |
| Less than 2.0x | 0 (0.0%) | 88,508 (44,927.9%) |
| 2.0x to 2.9x | 0 (0.0%) | 27 (13.7%) |
| 3.0x to 3.9x | 15 (100.0%) | 31 (15.7%) |
| 4.0x or more | 0 (0.0%) | 58 (29.4%) |
| Total | 15 (100.0%) | 197 (100.0%) |
Real Estate Taxes by Mortgage Status in Shenandoah Shores
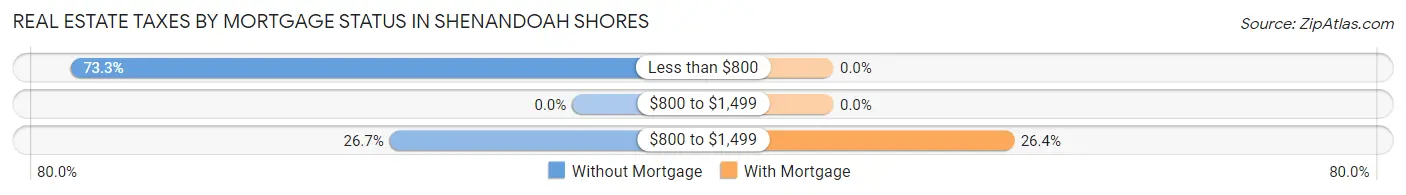
| Property Taxes | Without Mortgage | With Mortgage |
| Less than $800 | 11 (73.3%) | 0 (0.0%) |
| $800 to $1,499 | 0 (0.0%) | 0 (0.0%) |
| $800 to $1,499 | 4 (26.7%) | 52 (26.4%) |
| Total | 15 (100.0%) | 197 (100.0%) |
Health & Disability in Shenandoah Shores
Health Insurance Coverage by Age in Shenandoah Shores
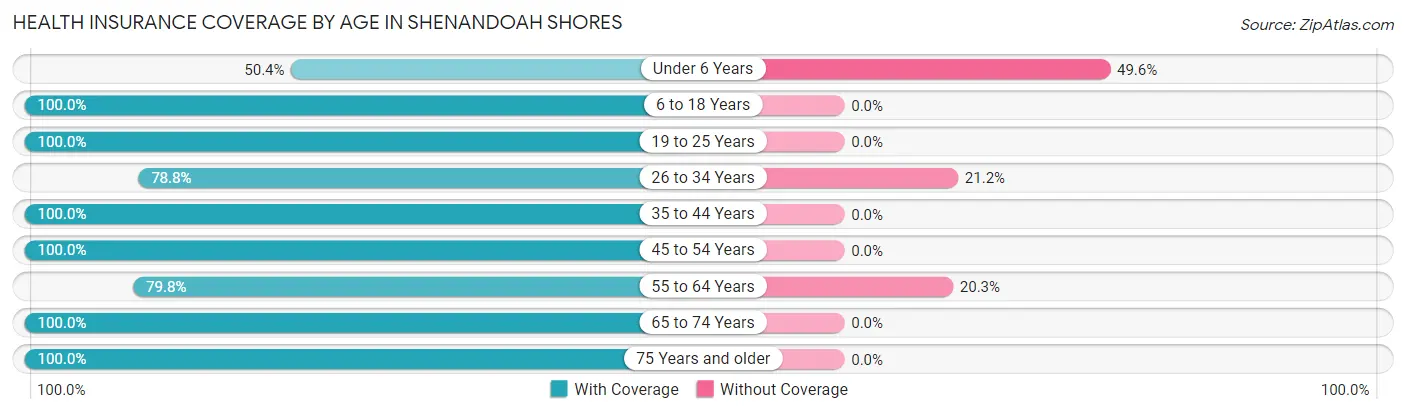
| Age Bracket | With Coverage | Without Coverage |
| Under 6 Years | 57 (50.4%) | 56 (49.6%) |
| 6 to 18 Years | 128 (100.0%) | 0 (0.0%) |
| 19 to 25 Years | 58 (100.0%) | 0 (0.0%) |
| 26 to 34 Years | 186 (78.8%) | 50 (21.2%) |
| 35 to 44 Years | 80 (100.0%) | 0 (0.0%) |
| 45 to 54 Years | 32 (100.0%) | 0 (0.0%) |
| 55 to 64 Years | 63 (79.7%) | 16 (20.3%) |
| 65 to 74 Years | 16 (100.0%) | 0 (0.0%) |
| 75 Years and older | 11 (100.0%) | 0 (0.0%) |
| Total | 631 (83.8%) | 122 (16.2%) |
Health Insurance Coverage by Citizenship Status in Shenandoah Shores
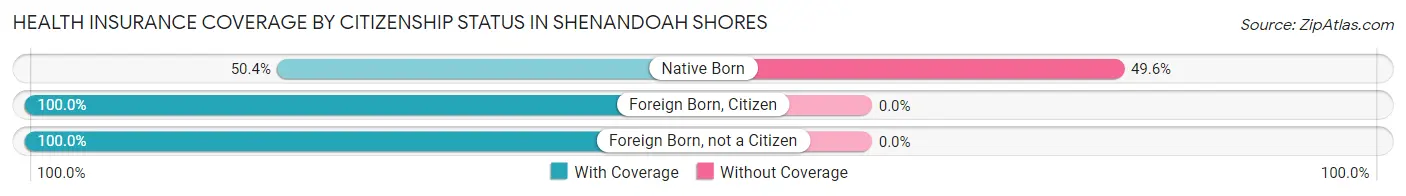
| Citizenship Status | With Coverage | Without Coverage |
| Native Born | 57 (50.4%) | 56 (49.6%) |
| Foreign Born, Citizen | 128 (100.0%) | 0 (0.0%) |
| Foreign Born, not a Citizen | 58 (100.0%) | 0 (0.0%) |
Health Insurance Coverage by Household Income in Shenandoah Shores
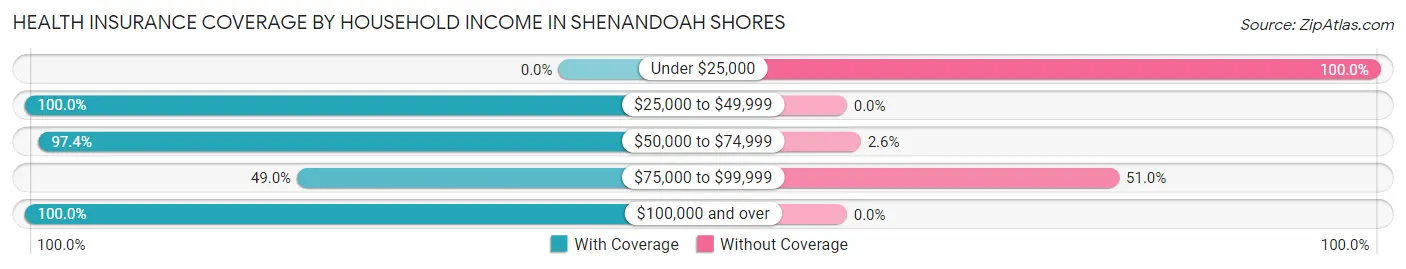
| Household Income | With Coverage | Without Coverage |
| Under $25,000 | 0 (0.0%) | 41 (100.0%) |
| $25,000 to $49,999 | 56 (100.0%) | 0 (0.0%) |
| $50,000 to $74,999 | 224 (97.4%) | 6 (2.6%) |
| $75,000 to $99,999 | 72 (49.0%) | 75 (51.0%) |
| $100,000 and over | 279 (100.0%) | 0 (0.0%) |
Public vs Private Health Insurance Coverage by Age in Shenandoah Shores
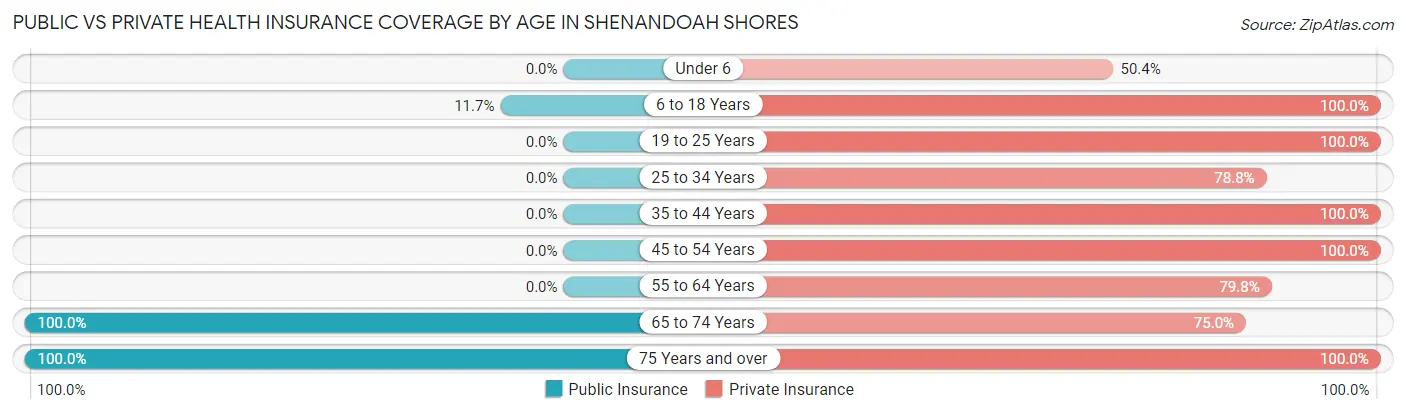
| Age Bracket | Public Insurance | Private Insurance |
| Under 6 | 0 (0.0%) | 57 (50.4%) |
| 6 to 18 Years | 15 (11.7%) | 128 (100.0%) |
| 19 to 25 Years | 0 (0.0%) | 58 (100.0%) |
| 25 to 34 Years | 0 (0.0%) | 186 (78.8%) |
| 35 to 44 Years | 0 (0.0%) | 80 (100.0%) |
| 45 to 54 Years | 0 (0.0%) | 32 (100.0%) |
| 55 to 64 Years | 0 (0.0%) | 63 (79.7%) |
| 65 to 74 Years | 16 (100.0%) | 12 (75.0%) |
| 75 Years and over | 11 (100.0%) | 11 (100.0%) |
| Total | 42 (5.6%) | 627 (83.3%) |
Disability Status by Sex by Age in Shenandoah Shores
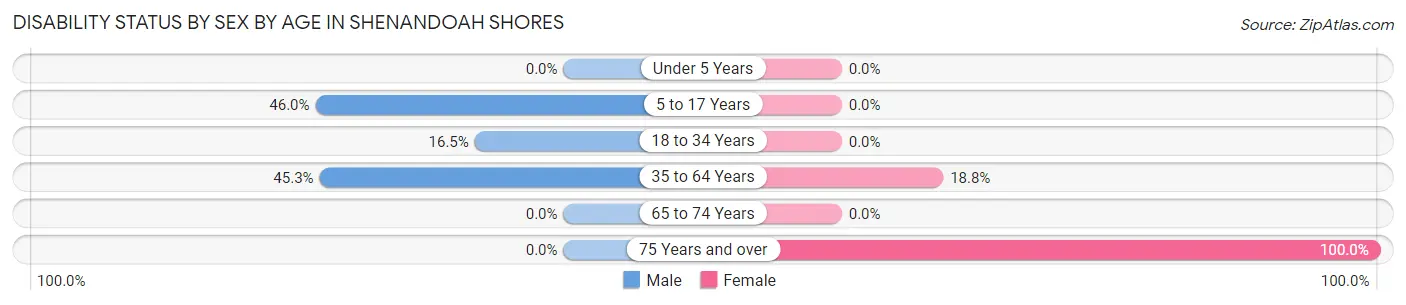
| Age Bracket | Male | Female |
| Under 5 Years | 0 (0.0%) | 0 (0.0%) |
| 5 to 17 Years | 29 (46.0%) | 0 (0.0%) |
| 18 to 34 Years | 28 (16.5%) | 0 (0.0%) |
| 35 to 64 Years | 48 (45.3%) | 16 (18.8%) |
| 65 to 74 Years | 0 (0.0%) | 0 (0.0%) |
| 75 Years and over | 0 (0.0%) | 11 (100.0%) |
Disability Class by Sex by Age in Shenandoah Shores
Disability Class: Hearing Difficulty
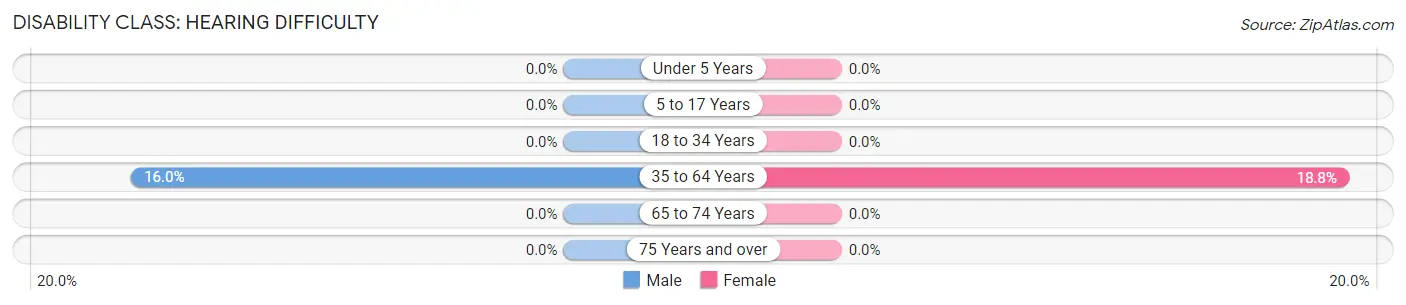
| Age Bracket | Male | Female |
| Under 5 Years | 0 (0.0%) | 0 (0.0%) |
| 5 to 17 Years | 0 (0.0%) | 0 (0.0%) |
| 18 to 34 Years | 0 (0.0%) | 0 (0.0%) |
| 35 to 64 Years | 17 (16.0%) | 16 (18.8%) |
| 65 to 74 Years | 0 (0.0%) | 0 (0.0%) |
| 75 Years and over | 0 (0.0%) | 0 (0.0%) |
Disability Class: Vision Difficulty
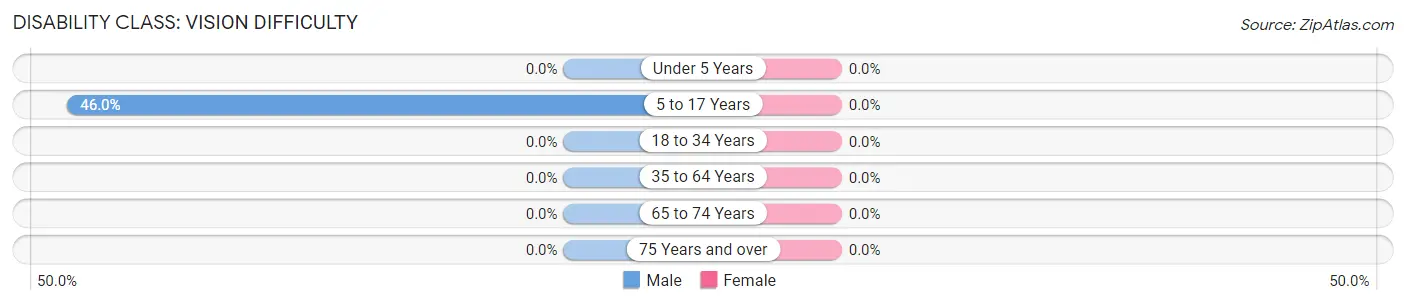
| Age Bracket | Male | Female |
| Under 5 Years | 0 (0.0%) | 0 (0.0%) |
| 5 to 17 Years | 29 (46.0%) | 0 (0.0%) |
| 18 to 34 Years | 0 (0.0%) | 0 (0.0%) |
| 35 to 64 Years | 0 (0.0%) | 0 (0.0%) |
| 65 to 74 Years | 0 (0.0%) | 0 (0.0%) |
| 75 Years and over | 0 (0.0%) | 0 (0.0%) |
Disability Class: Cognitive Difficulty
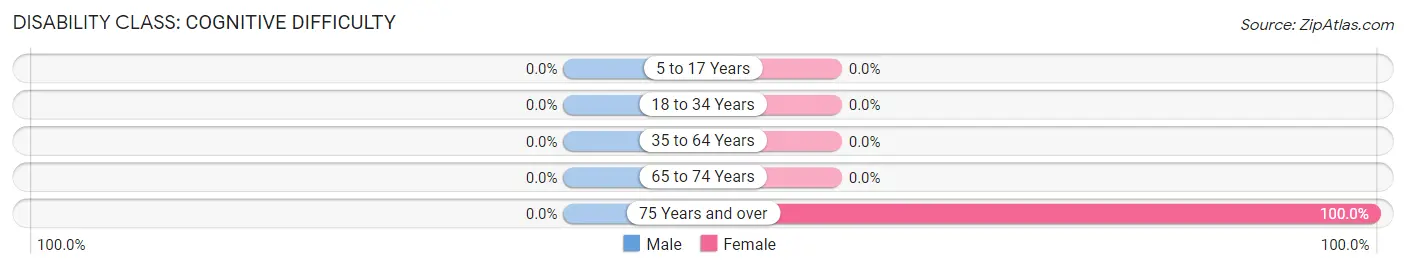
| Age Bracket | Male | Female |
| 5 to 17 Years | 0 (0.0%) | 0 (0.0%) |
| 18 to 34 Years | 0 (0.0%) | 0 (0.0%) |
| 35 to 64 Years | 0 (0.0%) | 0 (0.0%) |
| 65 to 74 Years | 0 (0.0%) | 0 (0.0%) |
| 75 Years and over | 0 (0.0%) | 11 (100.0%) |
Disability Class: Ambulatory Difficulty
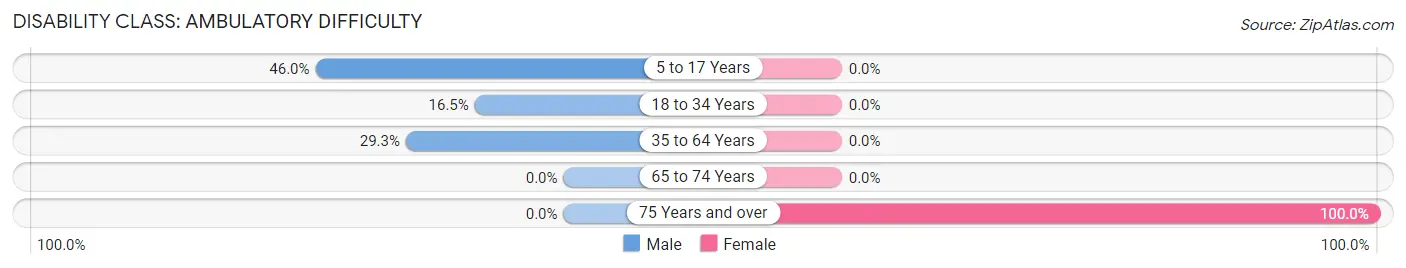
| Age Bracket | Male | Female |
| 5 to 17 Years | 29 (46.0%) | 0 (0.0%) |
| 18 to 34 Years | 28 (16.5%) | 0 (0.0%) |
| 35 to 64 Years | 31 (29.2%) | 0 (0.0%) |
| 65 to 74 Years | 0 (0.0%) | 0 (0.0%) |
| 75 Years and over | 0 (0.0%) | 11 (100.0%) |
Disability Class: Self-Care Difficulty
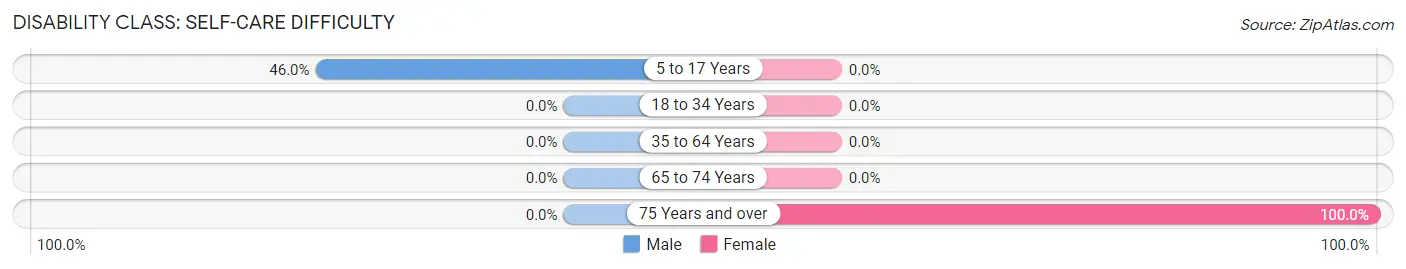
| Age Bracket | Male | Female |
| 5 to 17 Years | 29 (46.0%) | 0 (0.0%) |
| 18 to 34 Years | 0 (0.0%) | 0 (0.0%) |
| 35 to 64 Years | 0 (0.0%) | 0 (0.0%) |
| 65 to 74 Years | 0 (0.0%) | 0 (0.0%) |
| 75 Years and over | 0 (0.0%) | 11 (100.0%) |
Technology Access in Shenandoah Shores
Computing Device Access in Shenandoah Shores
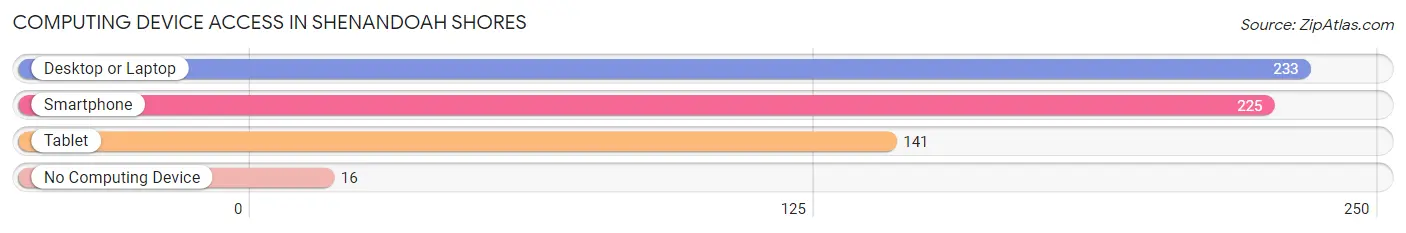
| Device Type | # Households | % Households |
| Desktop or Laptop | 233 | 83.2% |
| Smartphone | 225 | 80.4% |
| Tablet | 141 | 50.4% |
| No Computing Device | 16 | 5.7% |
| Total | 280 | 100.0% |
Internet Access in Shenandoah Shores
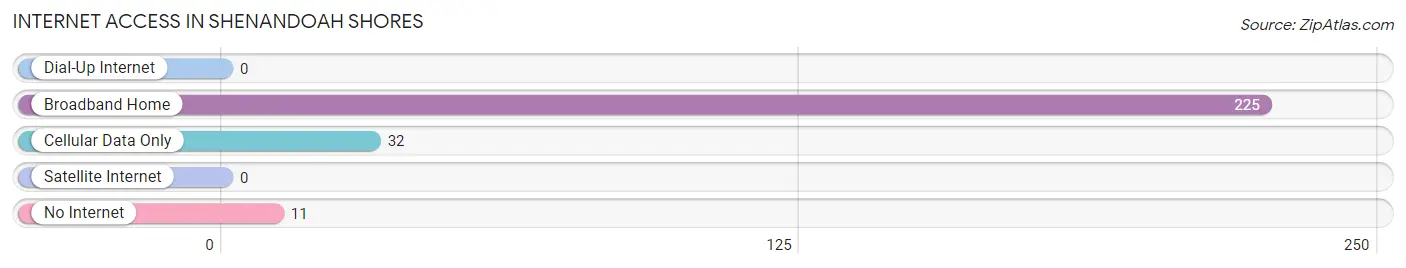
| Internet Type | # Households | % Households |
| Dial-Up Internet | 0 | 0.0% |
| Broadband Home | 225 | 80.4% |
| Cellular Data Only | 32 | 11.4% |
| Satellite Internet | 0 | 0.0% |
| No Internet | 11 | 3.9% |
| Total | 280 | 100.0% |
Shenandoah Shores Summary
Shenandoah Shores is a small town located in the Shenandoah Valley of Virginia. It is situated in the northern part of the state, near the border of West Virginia. The town is home to a population of just over 1,000 people, and is known for its rural charm and scenic beauty.
History
Shenandoah Shores was first settled in the late 1700s by German immigrants. The town was originally known as “New Market”, and was a small farming community. In the early 1800s, the town was renamed “Shenandoah Shores”, and it quickly became a popular destination for travelers and tourists. The town was known for its scenic beauty, and was a popular spot for fishing and hunting.
In the late 1800s, the town began to grow and develop. The railroad was extended to the town, and a number of businesses opened up. The town also became a popular destination for vacationers, and a number of resorts and hotels were built.
In the early 1900s, the town began to decline. The railroad was abandoned, and the resorts and hotels closed. The town was largely forgotten until the late 1970s, when it was rediscovered by a group of local residents. The town was revitalized, and it has since become a popular destination for tourists and outdoor enthusiasts.
Geography
Shenandoah Shores is located in the northern part of Virginia, near the border of West Virginia. The town is situated in the Shenandoah Valley, and is surrounded by the Blue Ridge Mountains. The town is located on the banks of the Shenandoah River, and is known for its scenic beauty.
The town is located in a rural area, and is surrounded by farmland and forests. The town is located near a number of state parks, including Shenandoah National Park and George Washington National Forest. The town is also located near a number of popular tourist attractions, including Luray Caverns and Skyline Drive.
Economy
Shenandoah Shores is a small, rural town, and the economy is largely based on tourism and agriculture. The town is home to a number of small businesses, including restaurants, shops, and lodging. The town is also home to a number of farms, and the surrounding area is known for its production of apples, peaches, and other fruits and vegetables.
The town is also home to a number of outdoor recreation businesses, including fishing and hunting guides, and canoe and kayak rentals. The town is also home to a number of wineries, and is a popular destination for wine tours.
Demographics
As of the 2010 census, the population of Shenandoah Shores was 1,072. The town is largely white, with a small African American population. The median household income is $45,000, and the median home value is $150,000. The town is home to a number of churches, and is served by a number of public schools.
Common Questions
What is Per Capita Income in Shenandoah Shores?
Per Capita income in Shenandoah Shores is $28,673.
What is the Median Household income in Shenandoah Shores?
Median Household Income in Shenandoah Shores is $70,833.
What is Income or Wage Gap in Shenandoah Shores?
Income or Wage Gap in Shenandoah Shores is 19.7%.
Women in Shenandoah Shores earn 80.3 cents for every dollar earned by a man.
What is Inequality or Gini Index in Shenandoah Shores?
Inequality or Gini Index in Shenandoah Shores is 0.29.
What is the Total Population of Shenandoah Shores?
Total Population of Shenandoah Shores is 753.
What is the Total Male Population of Shenandoah Shores?
Total Male Population of Shenandoah Shores is 389.
What is the Total Female Population of Shenandoah Shores?
Total Female Population of Shenandoah Shores is 364.
What is the Ratio of Males per 100 Females in Shenandoah Shores?
There are 106.87 Males per 100 Females in Shenandoah Shores.
What is the Ratio of Females per 100 Males in Shenandoah Shores?
There are 93.57 Females per 100 Males in Shenandoah Shores.
What is the Median Population Age in Shenandoah Shores?
Median Population Age in Shenandoah Shores is 29.2 Years.
What is the Average Family Size in Shenandoah Shores
Average Family Size in Shenandoah Shores is 3.2 People.
What is the Average Household Size in Shenandoah Shores
Average Household Size in Shenandoah Shores is 2.7 People.
How Large is the Labor Force in Shenandoah Shores?
There are 392 People in the Labor Forcein in Shenandoah Shores.
What is the Percentage of People in the Labor Force in Shenandoah Shores?
75.2% of People are in the Labor Force in Shenandoah Shores.
What is the Unemployment Rate in Shenandoah Shores?
Unemployment Rate in Shenandoah Shores is 10.7%.