Virgilina, VA Map & Demographics
Virgilina Map
Virgilina Overview
$23,987
PER CAPITA INCOME
$46,719
AVG FAMILY INCOME
$58,750
AVG HOUSEHOLD INCOME
0.35
INEQUALITY / GINI INDEX
157
TOTAL POPULATION
78
MALE POPULATION
79
FEMALE POPULATION
98.73
MALES / 100 FEMALES
101.28
FEMALES / 100 MALES
47.7
MEDIAN AGE
3.2
AVG FAMILY SIZE
2.7
AVG HOUSEHOLD SIZE
69
LABOR FORCE [ PEOPLE ]
53.1%
PERCENT IN LABOR FORCE
Virgilina Zip Codes
Virgilina Area Codes
Income in Virgilina
Income Overview in Virgilina
Per Capita Income in Virgilina is $23,987, while median incomes of families and households are $46,719 and $58,750 respectively.
| Characteristic | Number | Measure |
| Per Capita Income | 157 | $23,987 |
| Median Family Income | 29 | $46,719 |
| Mean Family Income | 29 | $51,210 |
| Median Household Income | 58 | $58,750 |
| Mean Household Income | 58 | $54,441 |
| Income Deficit | 29 | $0 |
| Wage / Income Gap (%) | 157 | 0.00% |
| Wage / Income Gap ($) | 157 | 100.00¢ per $1 |
| Gini / Inequality Index | 157 | 0.35 |
Earnings by Sex in Virgilina
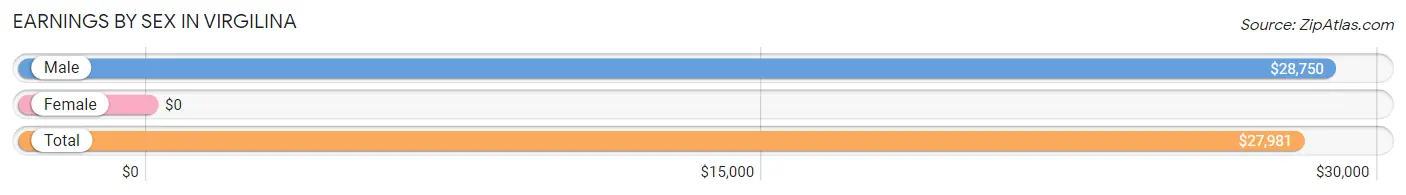
| Sex | Number | Average Earnings |
| Male | 43 (62.3%) | $28,750 |
| Female | 26 (37.7%) | $0 |
| Total | 69 (100.0%) | $27,981 |
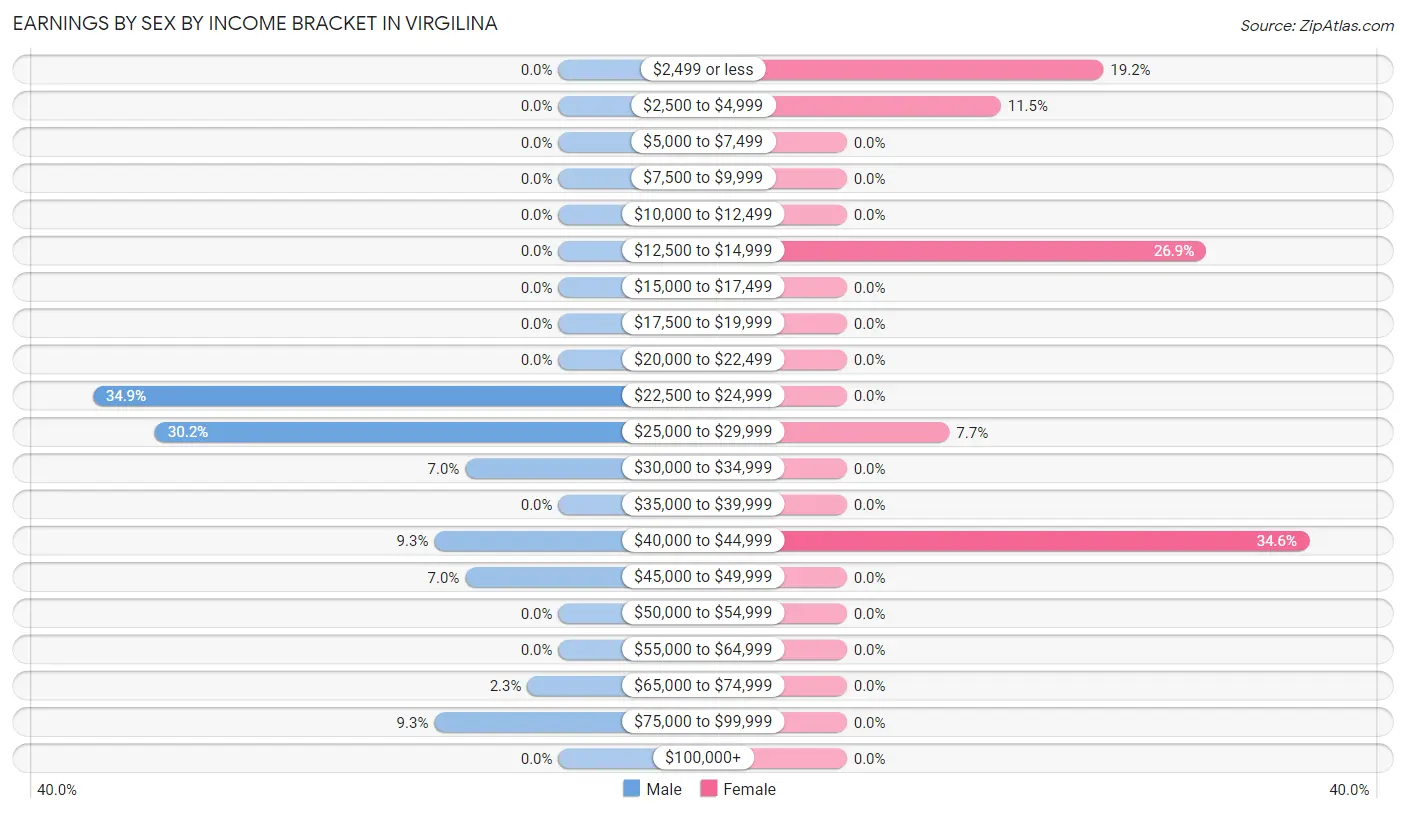
Earnings by Sex by Income Bracket in Virgilina
The most common earnings brackets in Virgilina are $22,500 to $24,999 for men (15 | 34.9%) and $40,000 to $44,999 for women (9 | 34.6%).
| Income | Male | Female |
| $2,499 or less | 0 (0.0%) | 5 (19.2%) |
| $2,500 to $4,999 | 0 (0.0%) | 3 (11.5%) |
| $5,000 to $7,499 | 0 (0.0%) | 0 (0.0%) |
| $7,500 to $9,999 | 0 (0.0%) | 0 (0.0%) |
| $10,000 to $12,499 | 0 (0.0%) | 0 (0.0%) |
| $12,500 to $14,999 | 0 (0.0%) | 7 (26.9%) |
| $15,000 to $17,499 | 0 (0.0%) | 0 (0.0%) |
| $17,500 to $19,999 | 0 (0.0%) | 0 (0.0%) |
| $20,000 to $22,499 | 0 (0.0%) | 0 (0.0%) |
| $22,500 to $24,999 | 15 (34.9%) | 0 (0.0%) |
| $25,000 to $29,999 | 13 (30.2%) | 2 (7.7%) |
| $30,000 to $34,999 | 3 (7.0%) | 0 (0.0%) |
| $35,000 to $39,999 | 0 (0.0%) | 0 (0.0%) |
| $40,000 to $44,999 | 4 (9.3%) | 9 (34.6%) |
| $45,000 to $49,999 | 3 (7.0%) | 0 (0.0%) |
| $50,000 to $54,999 | 0 (0.0%) | 0 (0.0%) |
| $55,000 to $64,999 | 0 (0.0%) | 0 (0.0%) |
| $65,000 to $74,999 | 1 (2.3%) | 0 (0.0%) |
| $75,000 to $99,999 | 4 (9.3%) | 0 (0.0%) |
| $100,000+ | 0 (0.0%) | 0 (0.0%) |
| Total | 43 (100.0%) | 26 (100.0%) |
Earnings by Sex by Educational Attainment in Virgilina
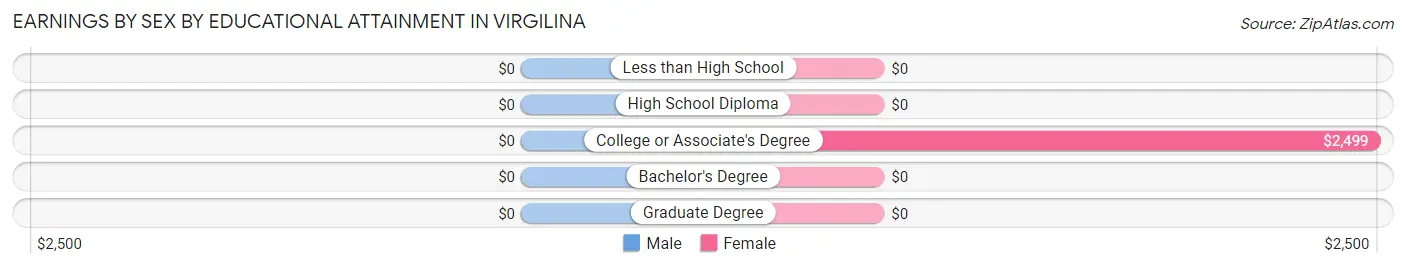
| Educational Attainment | Male Income | Female Income |
| Less than High School | - | - |
| High School Diploma | - | - |
| College or Associate's Degree | - | - |
| Bachelor's Degree | - | - |
| Graduate Degree | - | - |
| Total | $28,654 | $0 |
Family Income in Virgilina
Family Income Brackets in Virgilina
According to the Virgilina family income data, there are 8 families falling into the $35,000 to $49,999 income range, which is the most common income bracket and makes up 27.6% of all families.
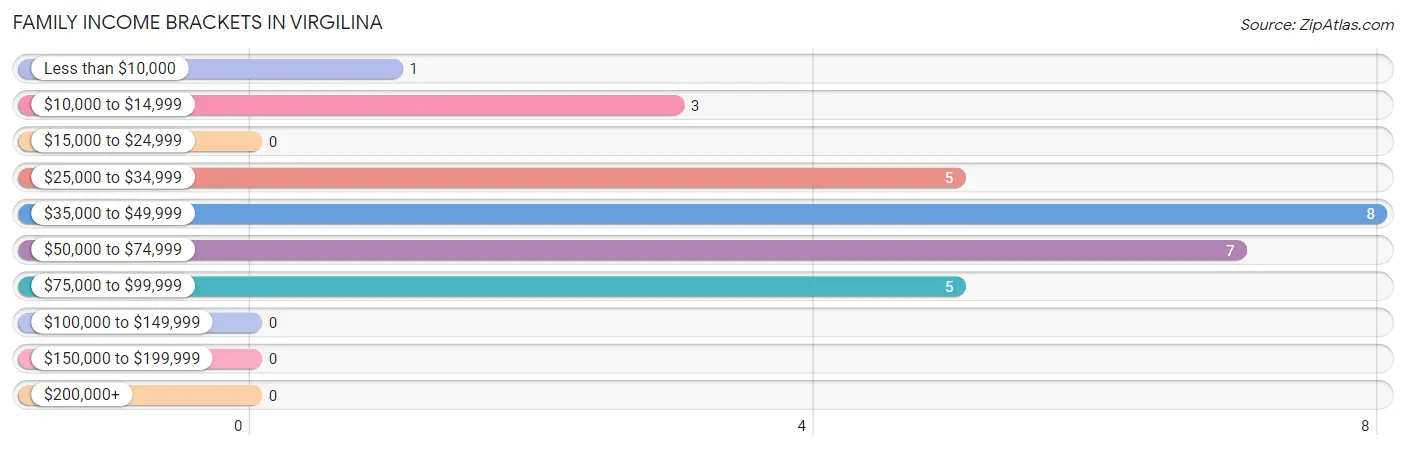
| Income Bracket | # Families | % Families |
| Less than $10,000 | 1 | 3.4% |
| $10,000 to $14,999 | 3 | 10.3% |
| $15,000 to $24,999 | 0 | 0.0% |
| $25,000 to $34,999 | 5 | 17.2% |
| $35,000 to $49,999 | 8 | 27.6% |
| $50,000 to $74,999 | 7 | 24.1% |
| $75,000 to $99,999 | 5 | 17.2% |
| $100,000 to $149,999 | 0 | 0.0% |
| $150,000 to $199,999 | 0 | 0.0% |
| $200,000+ | 0 | 0.0% |
Family Income by Famaliy Size in Virgilina
2-person families (18 | 62.1%) account for the highest median family income in Virgilina with $53,750 per family, while 2-person families (18 | 62.1%) have the highest median income of $26,875 per family member.
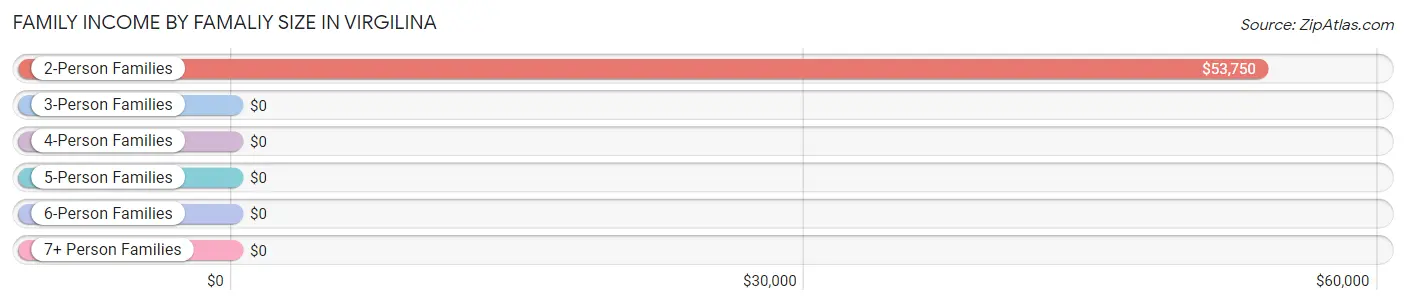
| Income Bracket | # Families | Median Income |
| 2-Person Families | 18 (62.1%) | $53,750 |
| 3-Person Families | 0 (0.0%) | $0 |
| 4-Person Families | 8 (27.6%) | $0 |
| 5-Person Families | 3 (10.3%) | $0 |
| 6-Person Families | 0 (0.0%) | $0 |
| 7+ Person Families | 0 (0.0%) | $0 |
| Total | 29 (100.0%) | $46,719 |
Family Income by Number of Earners in Virgilina
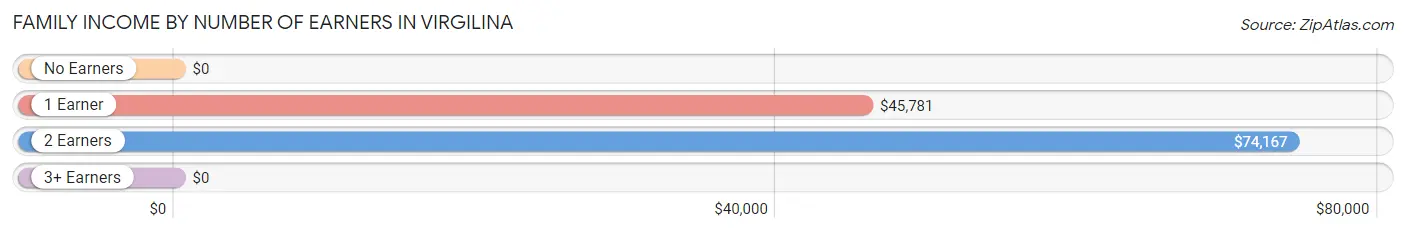
| Number of Earners | # Families | Median Income |
| No Earners | 6 (20.7%) | $0 |
| 1 Earner | 11 (37.9%) | $45,781 |
| 2 Earners | 12 (41.4%) | $74,167 |
| 3+ Earners | 0 (0.0%) | $0 |
| Total | 29 (100.0%) | $46,719 |
Household Income in Virgilina
Household Income Brackets in Virgilina
With 16 households falling in the category, the $50,000 to $74,999 income range is the most frequent in Virgilina, accounting for 27.6% of all households.
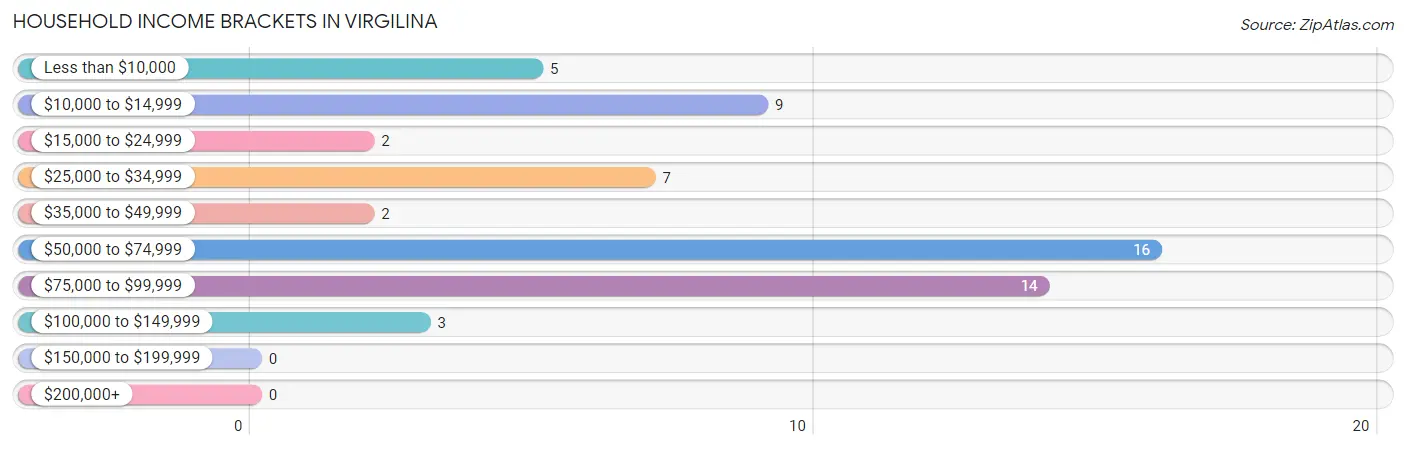
| Income Bracket | # Households | % Households |
| Less than $10,000 | 5 | 8.6% |
| $10,000 to $14,999 | 9 | 15.5% |
| $15,000 to $24,999 | 2 | 3.4% |
| $25,000 to $34,999 | 7 | 12.1% |
| $35,000 to $49,999 | 2 | 3.4% |
| $50,000 to $74,999 | 16 | 27.6% |
| $75,000 to $99,999 | 14 | 24.1% |
| $100,000 to $149,999 | 3 | 5.2% |
| $150,000 to $199,999 | 0 | 0.0% |
| $200,000+ | 0 | 0.0% |
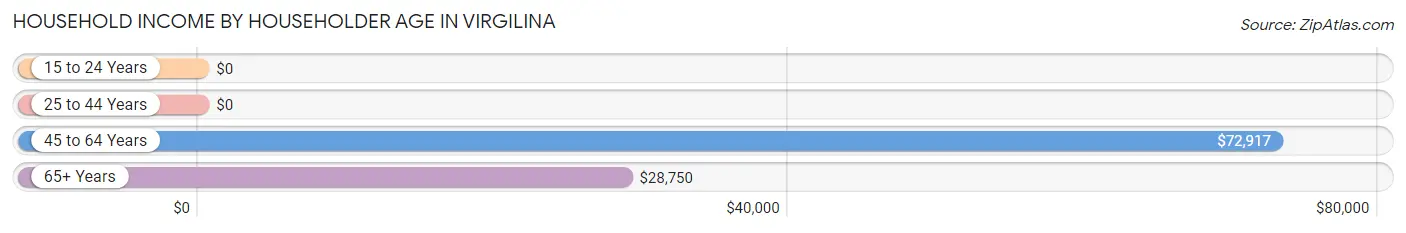
Household Income by Householder Age in Virgilina
The median household income in Virgilina is $58,750, with the highest median household income of $72,917 found in the 45 to 64 years age bracket for the primary householder. A total of 31 households (53.4%) fall into this category. Meanwhile, the 15 to 24 years age bracket for the primary householder has the lowest median household income of $0, with 1 households (1.7%) in this group.
| Income Bracket | # Households | Median Income |
| 15 to 24 Years | 1 (1.7%) | $0 |
| 25 to 44 Years | 6 (10.3%) | $0 |
| 45 to 64 Years | 31 (53.4%) | $72,917 |
| 65+ Years | 20 (34.5%) | $28,750 |
| Total | 58 (100.0%) | $58,750 |
Poverty in Virgilina
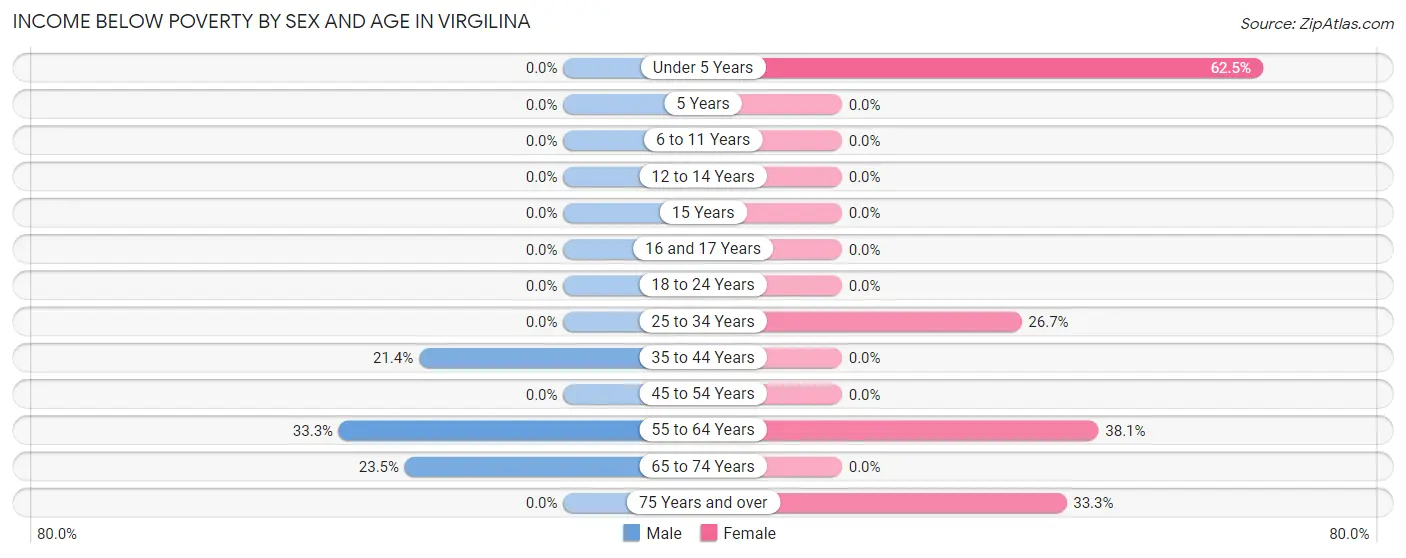
Income Below Poverty by Sex and Age in Virgilina
With 14.1% poverty level for males and 30.4% for females among the residents of Virgilina, 55 to 64 year old males and under 5 year old females are the most vulnerable to poverty, with 4 males (33.3%) and 10 females (62.5%) in their respective age groups living below the poverty level.
| Age Bracket | Male | Female |
| Under 5 Years | 0 (0.0%) | 10 (62.5%) |
| 5 Years | 0 (0.0%) | 0 (0.0%) |
| 6 to 11 Years | 0 (0.0%) | 0 (0.0%) |
| 12 to 14 Years | 0 (0.0%) | 0 (0.0%) |
| 15 Years | 0 (0.0%) | 0 (0.0%) |
| 16 and 17 Years | 0 (0.0%) | 0 (0.0%) |
| 18 to 24 Years | 0 (0.0%) | 0 (0.0%) |
| 25 to 34 Years | 0 (0.0%) | 4 (26.7%) |
| 35 to 44 Years | 3 (21.4%) | 0 (0.0%) |
| 45 to 54 Years | 0 (0.0%) | 0 (0.0%) |
| 55 to 64 Years | 4 (33.3%) | 8 (38.1%) |
| 65 to 74 Years | 4 (23.5%) | 0 (0.0%) |
| 75 Years and over | 0 (0.0%) | 2 (33.3%) |
| Total | 11 (14.1%) | 24 (30.4%) |
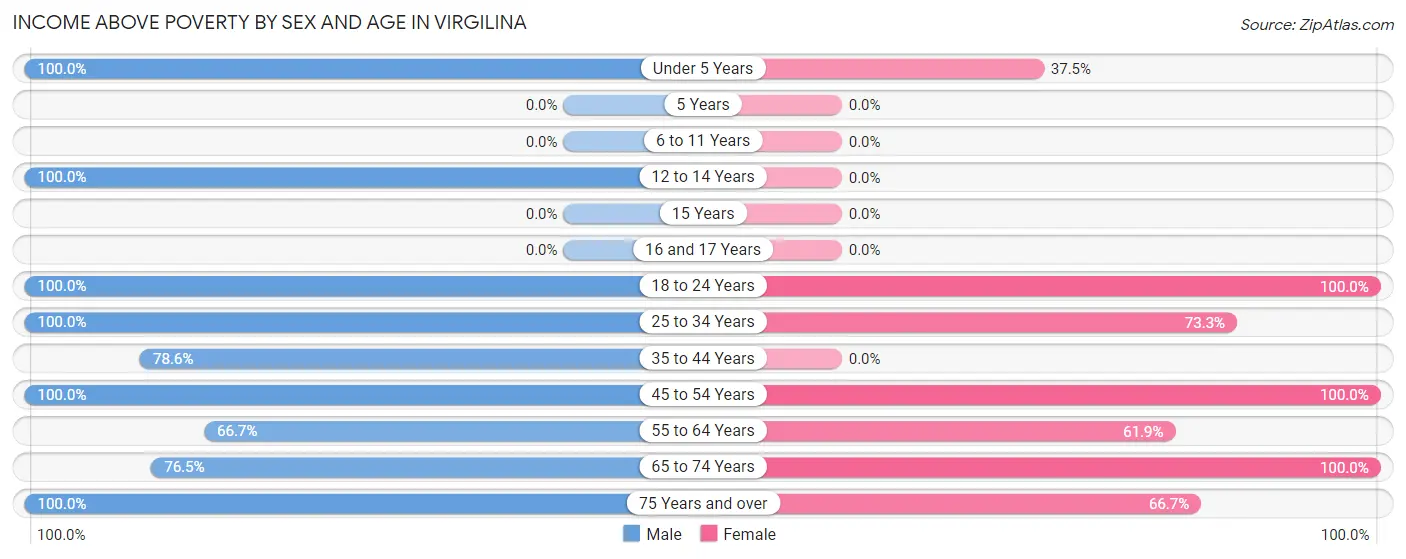
Income Above Poverty by Sex and Age in Virgilina
According to the poverty statistics in Virgilina, males aged under 5 years and females aged 18 to 24 years are the age groups that are most secure financially, with 100.0% of males and 100.0% of females in these age groups living above the poverty line.
| Age Bracket | Male | Female |
| Under 5 Years | 1 (100.0%) | 6 (37.5%) |
| 5 Years | 0 (0.0%) | 0 (0.0%) |
| 6 to 11 Years | 0 (0.0%) | 0 (0.0%) |
| 12 to 14 Years | 10 (100.0%) | 0 (0.0%) |
| 15 Years | 0 (0.0%) | 0 (0.0%) |
| 16 and 17 Years | 0 (0.0%) | 0 (0.0%) |
| 18 to 24 Years | 1 (100.0%) | 8 (100.0%) |
| 25 to 34 Years | 5 (100.0%) | 11 (73.3%) |
| 35 to 44 Years | 11 (78.6%) | 0 (0.0%) |
| 45 to 54 Years | 13 (100.0%) | 8 (100.0%) |
| 55 to 64 Years | 8 (66.7%) | 13 (61.9%) |
| 65 to 74 Years | 13 (76.5%) | 5 (100.0%) |
| 75 Years and over | 5 (100.0%) | 4 (66.7%) |
| Total | 67 (85.9%) | 55 (69.6%) |
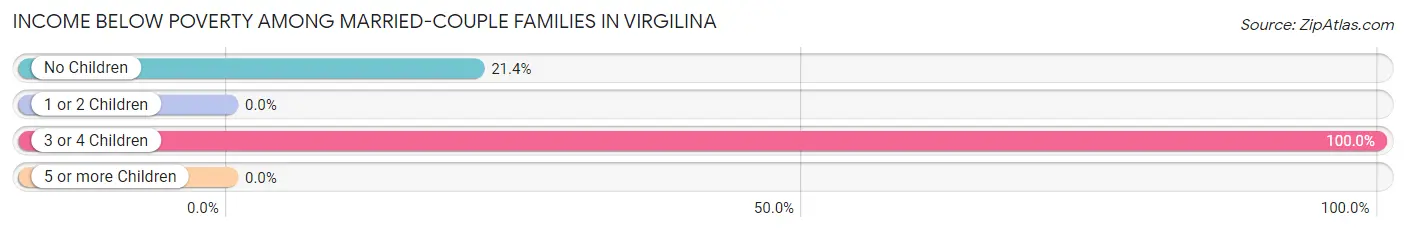
Income Below Poverty Among Married-Couple Families in Virgilina
The poverty statistics for married-couple families in Virgilina show that 35.3% or 6 of the total 17 families live below the poverty line. Families with 3 or 4 children have the highest poverty rate of 100.0%, comprising of 3 families. On the other hand, families with no children have the lowest poverty rate of 21.4%, which includes 3 families.
| Children | Above Poverty | Below Poverty |
| No Children | 11 (78.6%) | 3 (21.4%) |
| 1 or 2 Children | 0 (0.0%) | 0 (0.0%) |
| 3 or 4 Children | 0 (0.0%) | 3 (100.0%) |
| 5 or more Children | 0 (0.0%) | 0 (0.0%) |
| Total | 11 (64.7%) | 6 (35.3%) |
Income Below Poverty Among Single-Parent Households in Virgilina
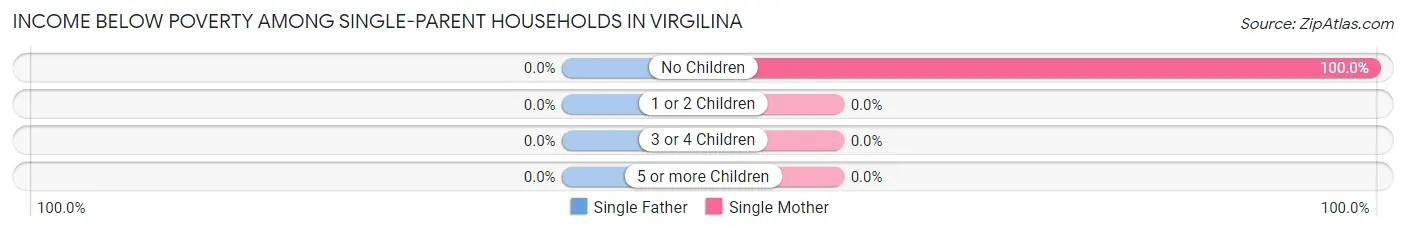
| Children | Single Father | Single Mother |
| No Children | 0 (0.0%) | 1 (100.0%) |
| 1 or 2 Children | 0 (0.0%) | 0 (0.0%) |
| 3 or 4 Children | 0 (0.0%) | 0 (0.0%) |
| 5 or more Children | 0 (0.0%) | 0 (0.0%) |
| Total | 0 (0.0%) | 1 (11.1%) |
Income Below Poverty Among Married-Couple vs Single-Parent Households in Virgilina
The poverty data for Virgilina shows that 6 of the married-couple family households (35.3%) and 1 of the single-parent households (8.3%) are living below the poverty level. Within the married-couple family households, those with 3 or 4 children have the highest poverty rate, with 3 households (100.0%) falling below the poverty line. Among the single-parent households, those with no children have the highest poverty rate, with 1 household (100.0%) living below poverty.
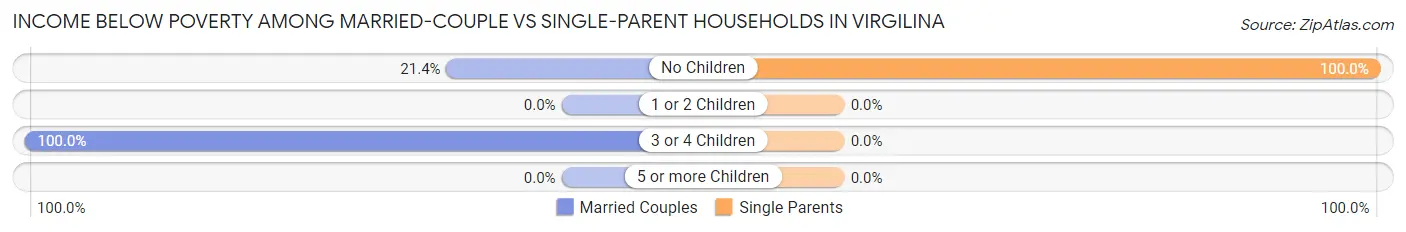
| Children | Married-Couple Families | Single-Parent Households |
| No Children | 3 (21.4%) | 1 (100.0%) |
| 1 or 2 Children | 0 (0.0%) | 0 (0.0%) |
| 3 or 4 Children | 3 (100.0%) | 0 (0.0%) |
| 5 or more Children | 0 (0.0%) | 0 (0.0%) |
| Total | 6 (35.3%) | 1 (8.3%) |
Race in Virgilina
The most populous races in Virgilina are White / Caucasian (127 | 80.9%), Black / African American (17 | 10.8%), and Native / Alaskan (8 | 5.1%).
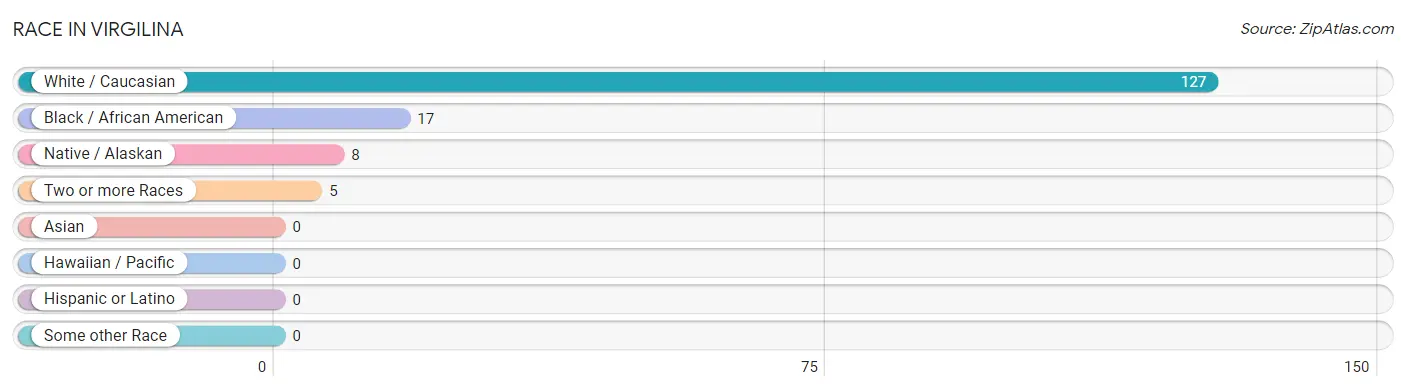
| Race | # Population | % Population |
| Asian | 0 | 0.0% |
| Black / African American | 17 | 10.8% |
| Hawaiian / Pacific | 0 | 0.0% |
| Hispanic or Latino | 0 | 0.0% |
| Native / Alaskan | 8 | 5.1% |
| White / Caucasian | 127 | 80.9% |
| Two or more Races | 5 | 3.2% |
| Some other Race | 0 | 0.0% |
| Total | 157 | 100.0% |
Ancestry in Virgilina
The most populous ancestries reported in Virgilina are American (54 | 34.4%), English (18 | 11.5%), Cherokee (13 | 8.3%), Irish (11 | 7.0%), and German (8 | 5.1%), together accounting for 66.2% of all Virgilina residents.
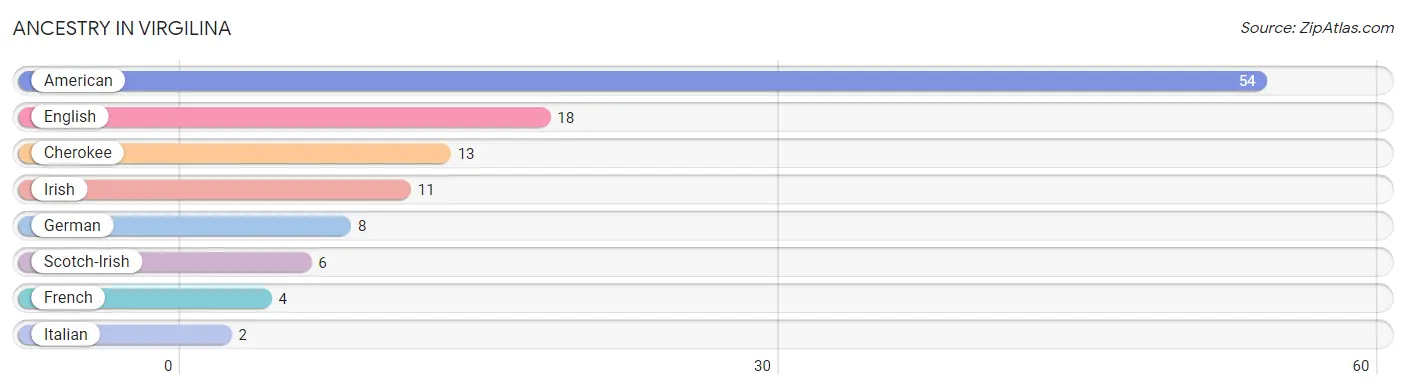
| Ancestry | # Population | % Population |
| American | 54 | 34.4% |
| Cherokee | 13 | 8.3% |
| English | 18 | 11.5% |
| French | 4 | 2.5% |
| German | 8 | 5.1% |
| Irish | 11 | 7.0% |
| Italian | 2 | 1.3% |
| Scotch-Irish | 6 | 3.8% | View All 8 Rows |
Immigrants in Virgilina
The most numerous immigrant groups reported in Virgilina came from Eastern Europe (1 | 0.6%), and Europe (1 | 0.6%), together accounting for 1.3% of all Virgilina residents.
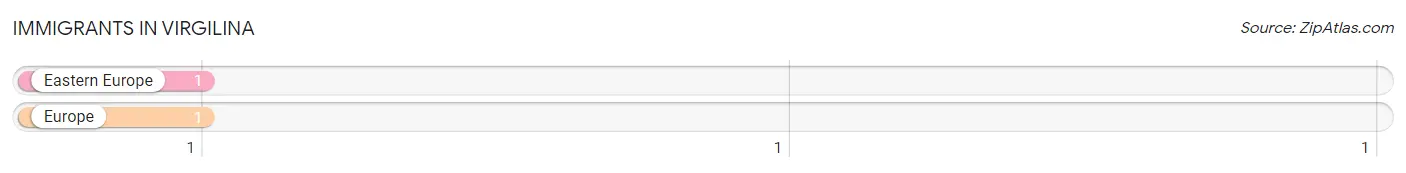
| Immigration Origin | # Population | % Population |
| Eastern Europe | 1 | 0.6% |
| Europe | 1 | 0.6% | View All 2 Rows |
Sex and Age in Virgilina
Sex and Age in Virgilina
The most populous age groups in Virgilina are 40 to 44 Years (14 | 17.9%) for men and Under 5 Years (16 | 20.3%) for women.
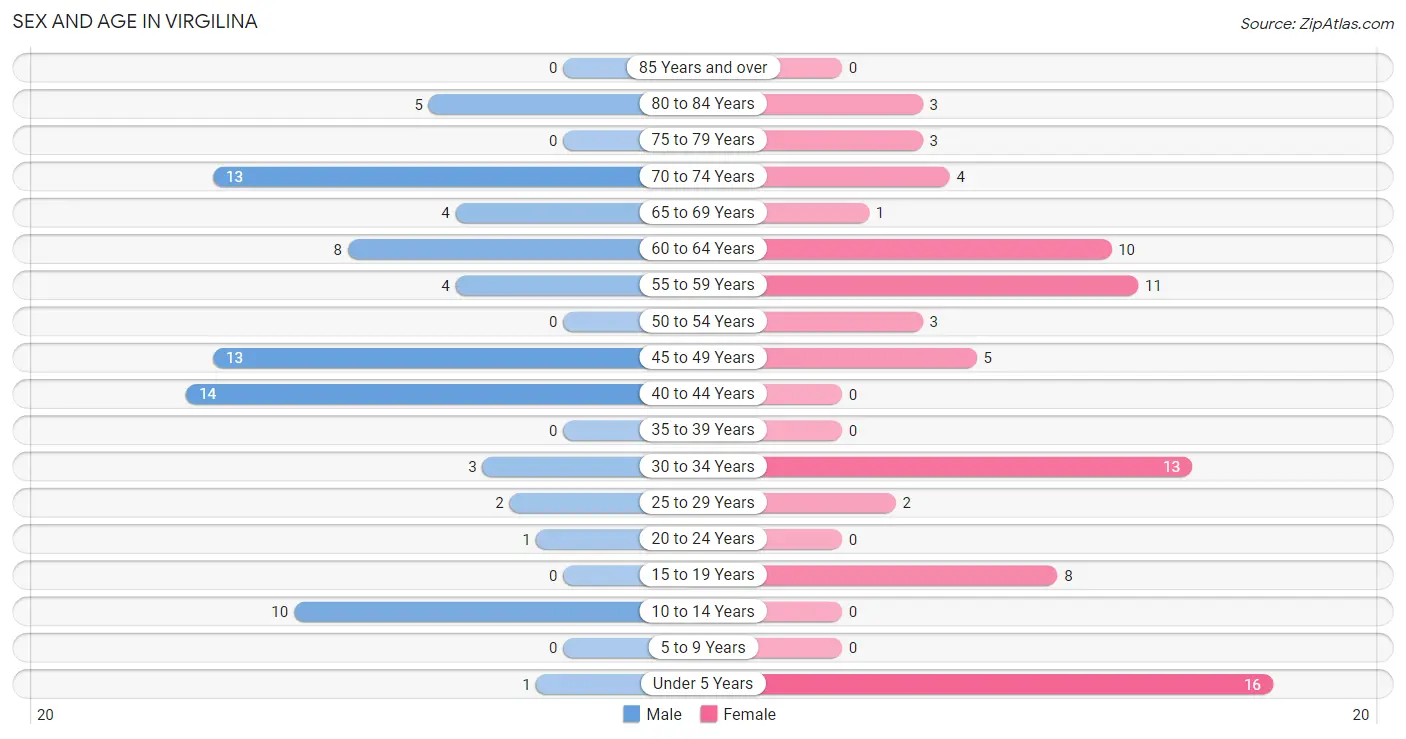
| Age Bracket | Male | Female |
| Under 5 Years | 1 (1.3%) | 16 (20.3%) |
| 5 to 9 Years | 0 (0.0%) | 0 (0.0%) |
| 10 to 14 Years | 10 (12.8%) | 0 (0.0%) |
| 15 to 19 Years | 0 (0.0%) | 8 (10.1%) |
| 20 to 24 Years | 1 (1.3%) | 0 (0.0%) |
| 25 to 29 Years | 2 (2.6%) | 2 (2.5%) |
| 30 to 34 Years | 3 (3.8%) | 13 (16.5%) |
| 35 to 39 Years | 0 (0.0%) | 0 (0.0%) |
| 40 to 44 Years | 14 (17.9%) | 0 (0.0%) |
| 45 to 49 Years | 13 (16.7%) | 5 (6.3%) |
| 50 to 54 Years | 0 (0.0%) | 3 (3.8%) |
| 55 to 59 Years | 4 (5.1%) | 11 (13.9%) |
| 60 to 64 Years | 8 (10.3%) | 10 (12.7%) |
| 65 to 69 Years | 4 (5.1%) | 1 (1.3%) |
| 70 to 74 Years | 13 (16.7%) | 4 (5.1%) |
| 75 to 79 Years | 0 (0.0%) | 3 (3.8%) |
| 80 to 84 Years | 5 (6.4%) | 3 (3.8%) |
| 85 Years and over | 0 (0.0%) | 0 (0.0%) |
| Total | 78 (100.0%) | 79 (100.0%) |
Families and Households in Virgilina
Median Family Size in Virgilina
The median family size in Virgilina is 3.21 persons per family, with single female/mother families (9 | 31.0%) accounting for the largest median family size of 5.11 persons per family. On the other hand, single male/father families (3 | 10.3%) represent the smallest median family size with 1.33 persons per family.
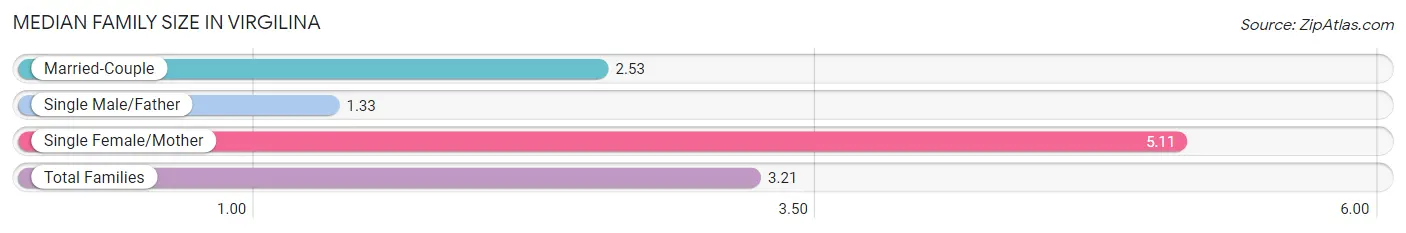
| Family Type | # Families | Family Size |
| Married-Couple | 17 (58.6%) | 2.53 |
| Single Male/Father | 3 (10.3%) | 1.33 |
| Single Female/Mother | 9 (31.0%) | 5.11 |
| Total Families | 29 (100.0%) | 3.21 |
Median Household Size in Virgilina
The median household size in Virgilina is 2.71 persons per household, with single female/mother households (9 | 15.5%) accounting for the largest median household size of 6.33 persons per household. non-family households (29 | 50.0%) represent the smallest median household size with 1.07 persons per household.
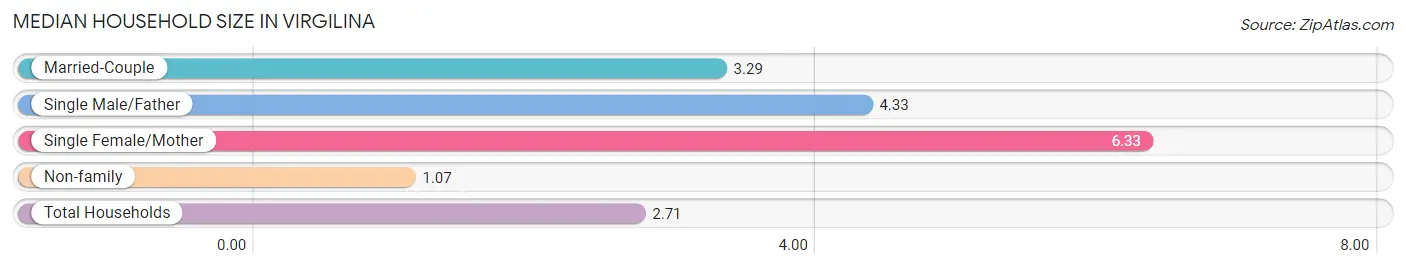
| Household Type | # Households | Household Size |
| Married-Couple | 17 (29.3%) | 3.29 |
| Single Male/Father | 3 (5.2%) | 4.33 |
| Single Female/Mother | 9 (15.5%) | 6.33 |
| Non-family | 29 (50.0%) | 1.07 |
| Total Households | 58 (100.0%) | 2.71 |
Household Size by Marriage Status in Virgilina
Out of a total of 58 households in Virgilina, 29 (50.0%) are family households, while 29 (50.0%) are nonfamily households. The most numerous type of family households are 2-person households, comprising 11, and the most common type of nonfamily households are 1-person households, comprising 28.
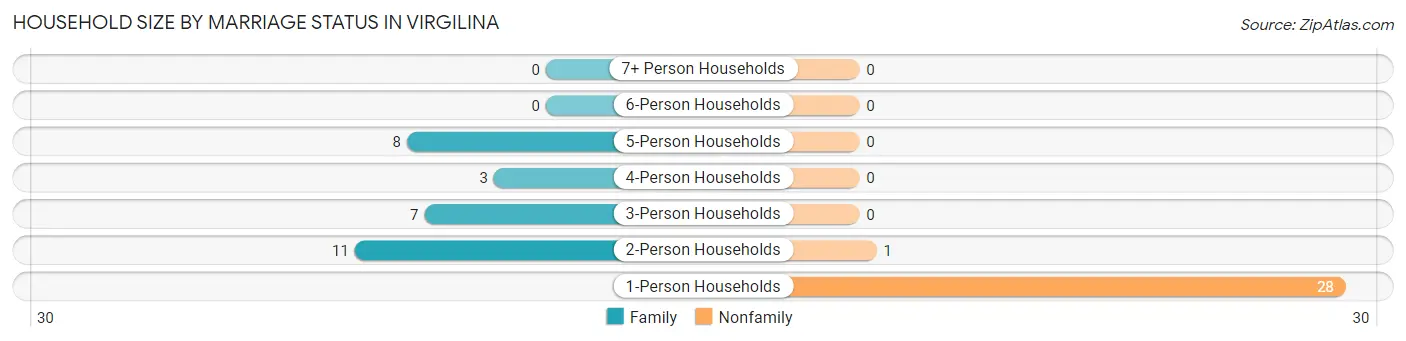
| Household Size | Family Households | Nonfamily Households |
| 1-Person Households | - | 28 (48.3%) |
| 2-Person Households | 11 (19.0%) | 1 (1.7%) |
| 3-Person Households | 7 (12.1%) | 0 (0.0%) |
| 4-Person Households | 3 (5.2%) | 0 (0.0%) |
| 5-Person Households | 8 (13.8%) | 0 (0.0%) |
| 6-Person Households | 0 (0.0%) | 0 (0.0%) |
| 7+ Person Households | 0 (0.0%) | 0 (0.0%) |
| Total | 29 (50.0%) | 29 (50.0%) |
Female Fertility in Virgilina
Fertility by Age in Virgilina
| Age Bracket | Women with Births | Births / 1,000 Women |
| 15 to 19 years | 0 (0.0%) | 0.0 |
| 20 to 34 years | 0 (0.0%) | 0.0 |
| 35 to 50 years | 0 (0.0%) | 0.0 |
| Total | 0 (0.0%) | 0.0 |
Fertility by Age by Marriage Status in Virgilina
| Age Bracket | Married | Unmarried |
| 15 to 19 years | 0 (0.0%) | 0 (0.0%) |
| 20 to 34 years | 0 (0.0%) | 0 (0.0%) |
| 35 to 50 years | 0 (0.0%) | 0 (0.0%) |
| Total | 0 (0.0%) | 0 (0.0%) |
Fertility by Education in Virgilina
| Educational Attainment | Women with Births | Births / 1,000 Women |
| Less than High School | 0 (0.0%) | 0.0 |
| High School Diploma | 0 (0.0%) | 0.0 |
| College or Associate's Degree | 0 (0.0%) | 0.0 |
| Bachelor's Degree | 0 (0.0%) | 0.0 |
| Graduate Degree | 0 (0.0%) | 0.0 |
| Total | 0 (0.0%) | 0.0 |
Fertility by Education by Marriage Status in Virgilina
| Educational Attainment | Married | Unmarried |
| Less than High School | 0 (0.0%) | 0 (0.0%) |
| High School Diploma | 0 (0.0%) | 0 (0.0%) |
| College or Associate's Degree | 0 (0.0%) | 0 (0.0%) |
| Bachelor's Degree | 0 (0.0%) | 0 (0.0%) |
| Graduate Degree | 0 (0.0%) | 0 (0.0%) |
| Total | 0 (0.0%) | 0 (0.0%) |
Employment Characteristics in Virgilina
Employment by Class of Employer in Virgilina
Among the 66 employed individuals in Virgilina, private company employees (40 | 60.6%), local government employees (11 | 16.7%), and self-employed (incorporated) (5 | 7.6%) make up the most common classes of employment.
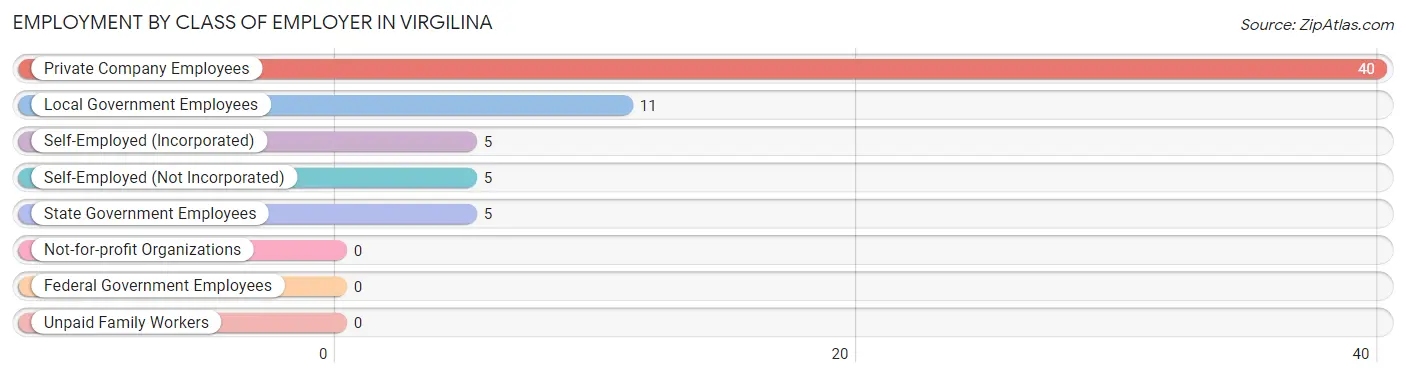
| Employer Class | # Employees | % Employees |
| Private Company Employees | 40 | 60.6% |
| Self-Employed (Incorporated) | 5 | 7.6% |
| Self-Employed (Not Incorporated) | 5 | 7.6% |
| Not-for-profit Organizations | 0 | 0.0% |
| Local Government Employees | 11 | 16.7% |
| State Government Employees | 5 | 7.6% |
| Federal Government Employees | 0 | 0.0% |
| Unpaid Family Workers | 0 | 0.0% |
| Total | 66 | 100.0% |
Employment Status by Age in Virgilina
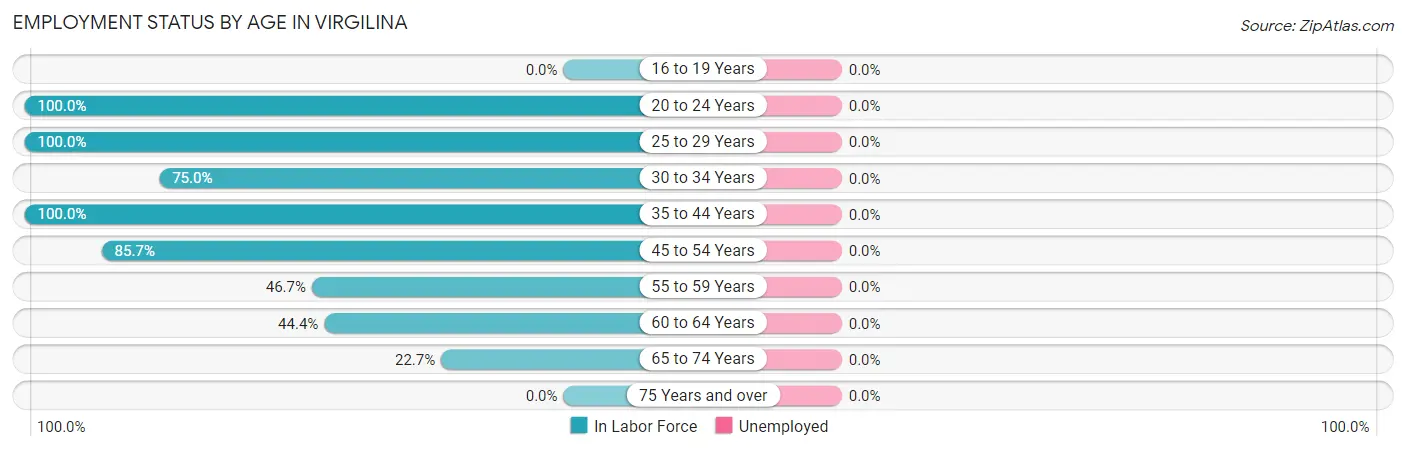
| Age Bracket | In Labor Force | Unemployed |
| 16 to 19 Years | 0 (0.0%) | 0 (0.0%) |
| 20 to 24 Years | 1 (100.0%) | 0 (0.0%) |
| 25 to 29 Years | 4 (100.0%) | 0 (0.0%) |
| 30 to 34 Years | 12 (75.0%) | 0 (0.0%) |
| 35 to 44 Years | 14 (100.0%) | 0 (0.0%) |
| 45 to 54 Years | 18 (85.7%) | 0 (0.0%) |
| 55 to 59 Years | 7 (46.7%) | 0 (0.0%) |
| 60 to 64 Years | 8 (44.4%) | 0 (0.0%) |
| 65 to 74 Years | 5 (22.7%) | 0 (0.0%) |
| 75 Years and over | 0 (0.0%) | 0 (0.0%) |
| Total | 69 (53.1%) | 0 (0.0%) |
Employment Status by Educational Attainment in Virgilina
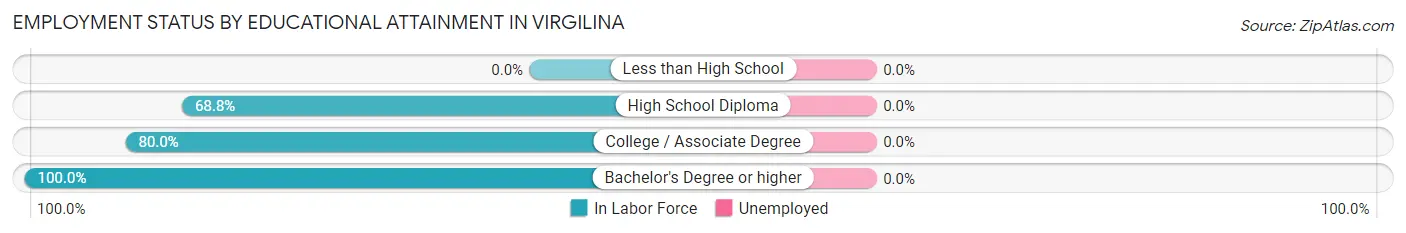
| Educational Attainment | In Labor Force | Unemployed |
| Less than High School | 0 (0.0%) | 0 (0.0%) |
| High School Diploma | 22 (68.8%) | 0 (0.0%) |
| College / Associate Degree | 28 (80.0%) | 0 (0.0%) |
| Bachelor's Degree or higher | 13 (100.0%) | 0 (0.0%) |
| Total | 63 (71.6%) | 0 (0.0%) |
Employment Occupations by Sex in Virgilina
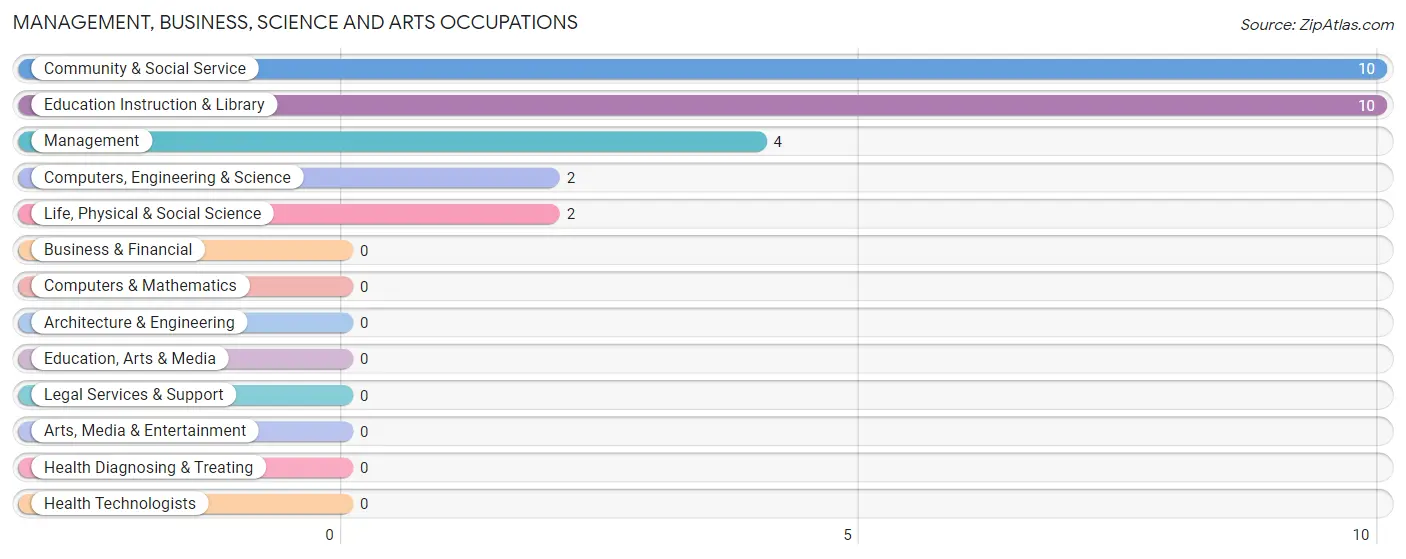
Management, Business, Science and Arts Occupations
The most common Management, Business, Science and Arts occupations in Virgilina are Community & Social Service (10 | 14.5%), Education Instruction & Library (10 | 14.5%), Management (4 | 5.8%), Computers, Engineering & Science (2 | 2.9%), and Life, Physical & Social Science (2 | 2.9%).
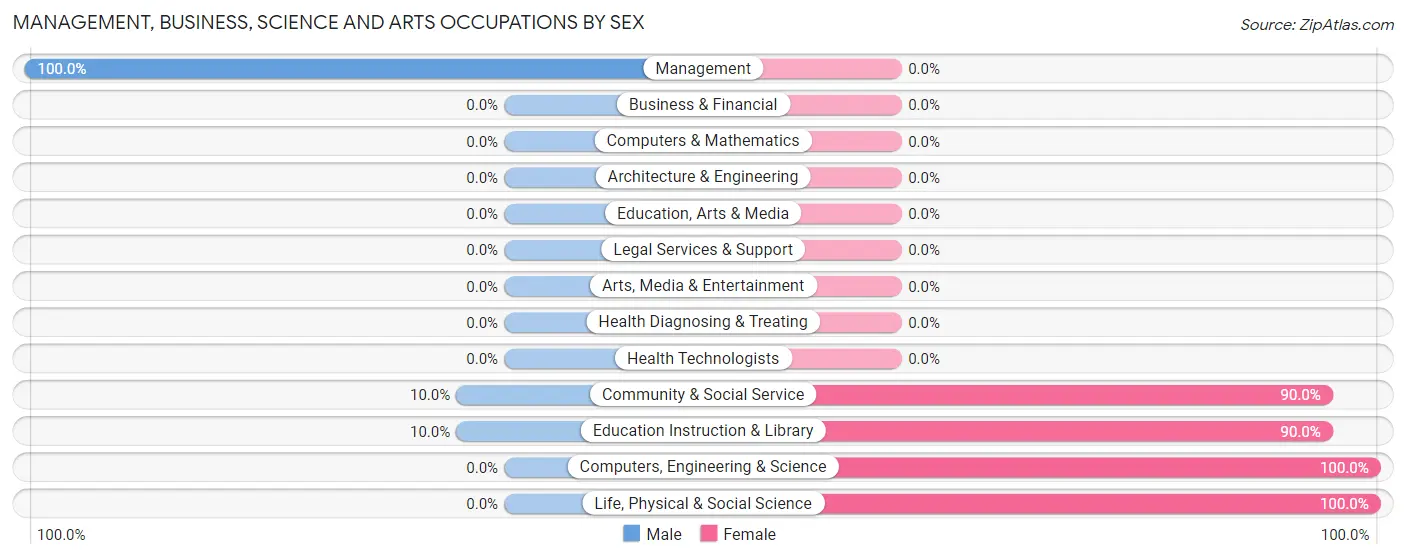
Management, Business, Science and Arts Occupations by Sex
Within the Management, Business, Science and Arts occupations in Virgilina, the most male-oriented occupations are Management (100.0%), Community & Social Service (10.0%), and Education Instruction & Library (10.0%), while the most female-oriented occupations are Computers, Engineering & Science (100.0%), Life, Physical & Social Science (100.0%), and Community & Social Service (90.0%).
| Occupation | Male | Female |
| Management | 4 (100.0%) | 0 (0.0%) |
| Business & Financial | 0 (0.0%) | 0 (0.0%) |
| Computers, Engineering & Science | 0 (0.0%) | 2 (100.0%) |
| Computers & Mathematics | 0 (0.0%) | 0 (0.0%) |
| Architecture & Engineering | 0 (0.0%) | 0 (0.0%) |
| Life, Physical & Social Science | 0 (0.0%) | 2 (100.0%) |
| Community & Social Service | 1 (10.0%) | 9 (90.0%) |
| Education, Arts & Media | 0 (0.0%) | 0 (0.0%) |
| Legal Services & Support | 0 (0.0%) | 0 (0.0%) |
| Education Instruction & Library | 1 (10.0%) | 9 (90.0%) |
| Arts, Media & Entertainment | 0 (0.0%) | 0 (0.0%) |
| Health Diagnosing & Treating | 0 (0.0%) | 0 (0.0%) |
| Health Technologists | 0 (0.0%) | 0 (0.0%) |
| Total (Category) | 5 (31.2%) | 11 (68.8%) |
| Total (Overall) | 43 (62.3%) | 26 (37.7%) |
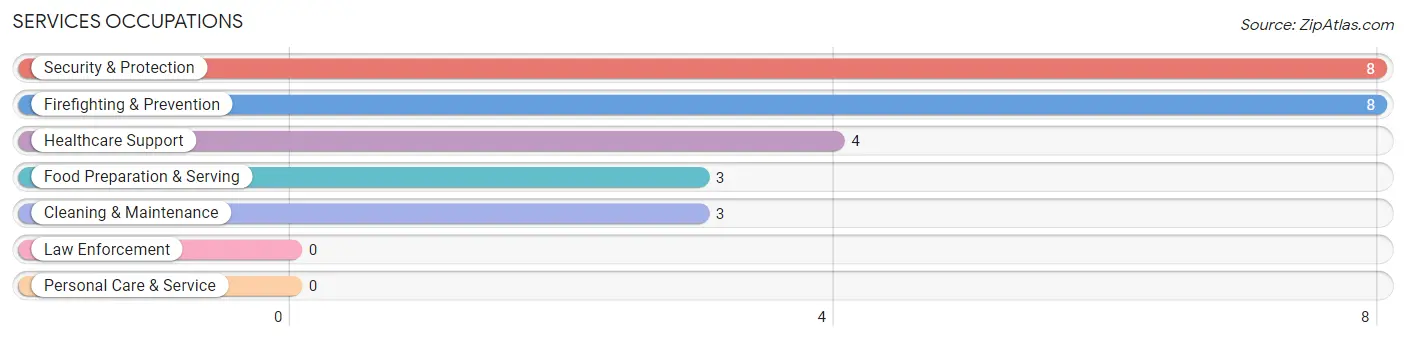
Services Occupations
The most common Services occupations in Virgilina are Security & Protection (8 | 11.6%), Firefighting & Prevention (8 | 11.6%), Healthcare Support (4 | 5.8%), Food Preparation & Serving (3 | 4.3%), and Cleaning & Maintenance (3 | 4.3%).
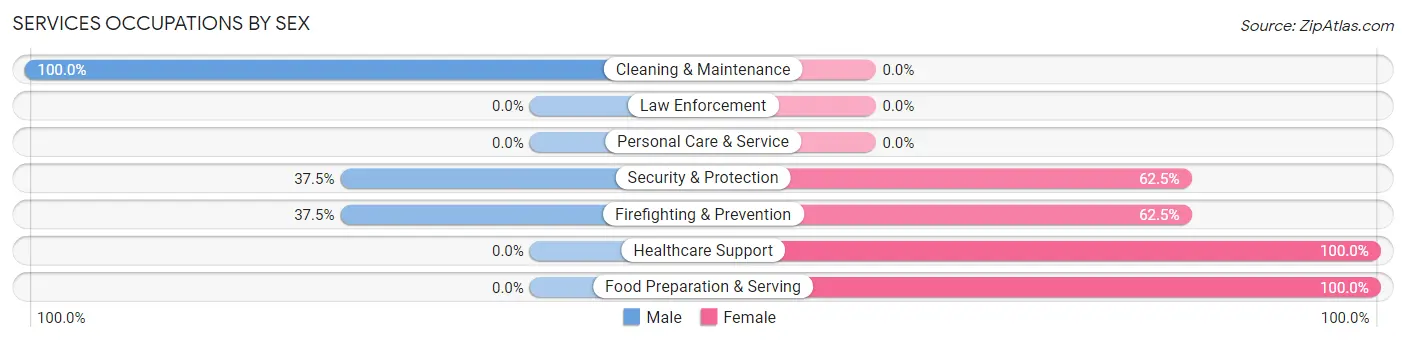
Services Occupations by Sex
Within the Services occupations in Virgilina, the most male-oriented occupations are Cleaning & Maintenance (100.0%), Security & Protection (37.5%), and Firefighting & Prevention (37.5%), while the most female-oriented occupations are Healthcare Support (100.0%), Food Preparation & Serving (100.0%), and Security & Protection (62.5%).
| Occupation | Male | Female |
| Healthcare Support | 0 (0.0%) | 4 (100.0%) |
| Security & Protection | 3 (37.5%) | 5 (62.5%) |
| Firefighting & Prevention | 3 (37.5%) | 5 (62.5%) |
| Law Enforcement | 0 (0.0%) | 0 (0.0%) |
| Food Preparation & Serving | 0 (0.0%) | 3 (100.0%) |
| Cleaning & Maintenance | 3 (100.0%) | 0 (0.0%) |
| Personal Care & Service | 0 (0.0%) | 0 (0.0%) |
| Total (Category) | 6 (33.3%) | 12 (66.7%) |
| Total (Overall) | 43 (62.3%) | 26 (37.7%) |
Sales and Office Occupations
The most common Sales and Office occupations in Virgilina are Office & Administration (13 | 18.8%), and Sales & Related (3 | 4.3%).
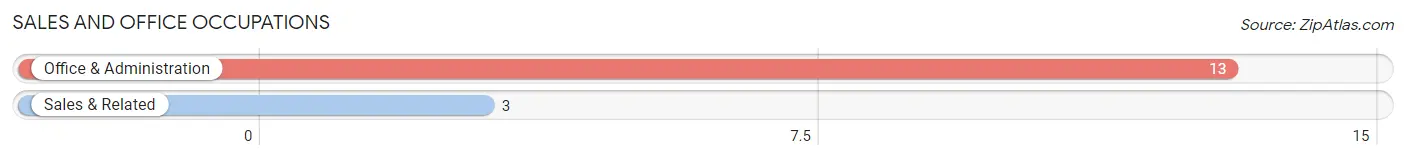
Sales and Office Occupations by Sex
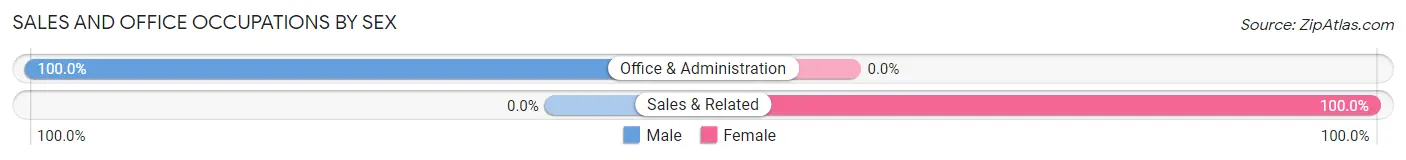
| Occupation | Male | Female |
| Sales & Related | 0 (0.0%) | 3 (100.0%) |
| Office & Administration | 13 (100.0%) | 0 (0.0%) |
| Total (Category) | 13 (81.2%) | 3 (18.8%) |
| Total (Overall) | 43 (62.3%) | 26 (37.7%) |
Natural Resources, Construction and Maintenance Occupations
The most common Natural Resources, Construction and Maintenance occupations in Virgilina are Installation, Maintenance & Repair (13 | 18.8%), and Construction & Extraction (2 | 2.9%).
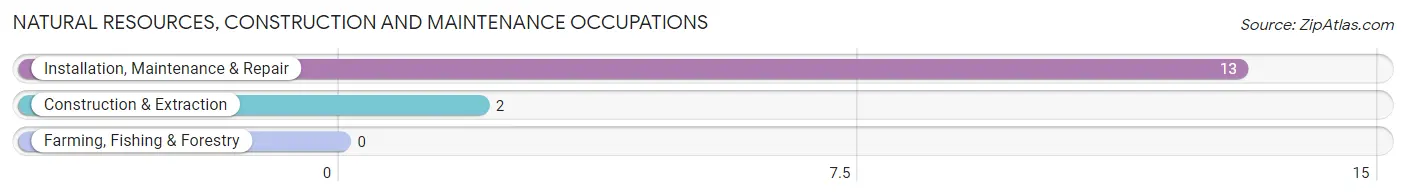
Natural Resources, Construction and Maintenance Occupations by Sex
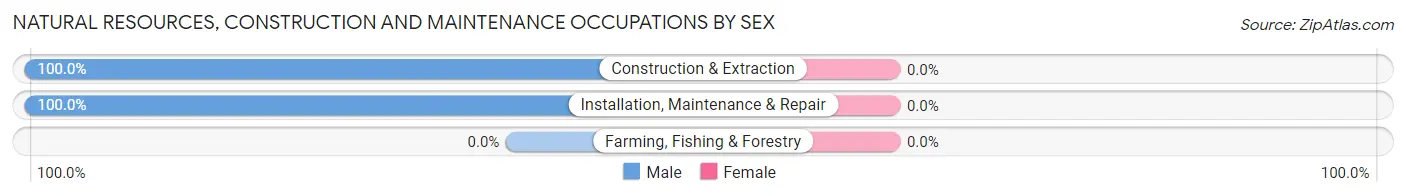
| Occupation | Male | Female |
| Farming, Fishing & Forestry | 0 (0.0%) | 0 (0.0%) |
| Construction & Extraction | 2 (100.0%) | 0 (0.0%) |
| Installation, Maintenance & Repair | 13 (100.0%) | 0 (0.0%) |
| Total (Category) | 15 (100.0%) | 0 (0.0%) |
| Total (Overall) | 43 (62.3%) | 26 (37.7%) |
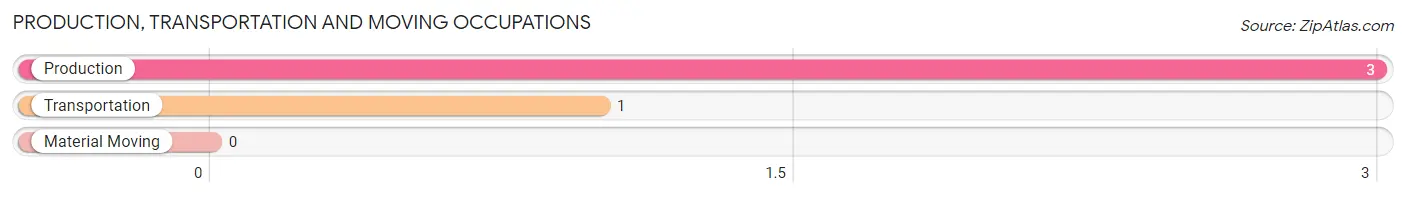
Production, Transportation and Moving Occupations
The most common Production, Transportation and Moving occupations in Virgilina are Production (3 | 4.3%), and Transportation (1 | 1.5%).
Production, Transportation and Moving Occupations by Sex
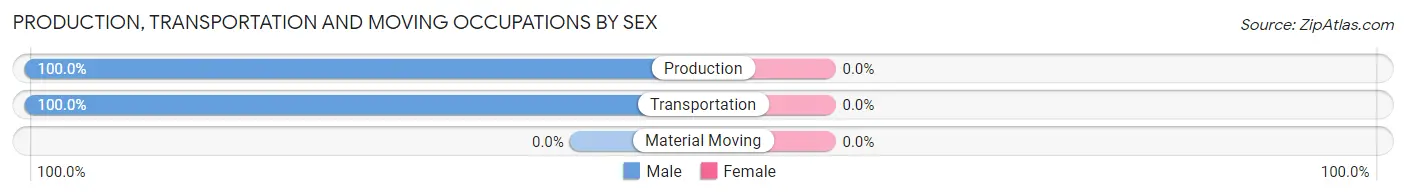
| Occupation | Male | Female |
| Production | 3 (100.0%) | 0 (0.0%) |
| Transportation | 1 (100.0%) | 0 (0.0%) |
| Material Moving | 0 (0.0%) | 0 (0.0%) |
| Total (Category) | 4 (100.0%) | 0 (0.0%) |
| Total (Overall) | 43 (62.3%) | 26 (37.7%) |
Employment Industries by Sex in Virgilina
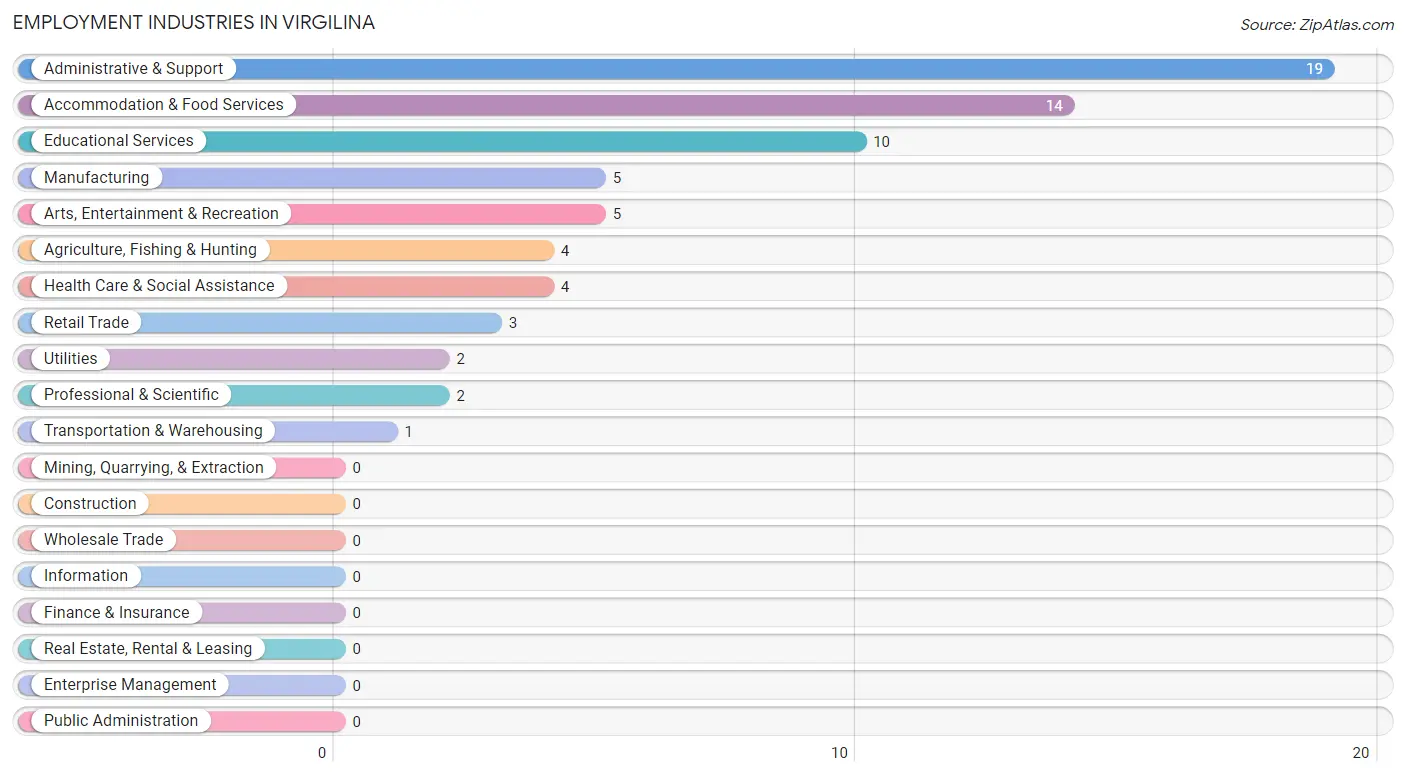
Employment Industries in Virgilina
The major employment industries in Virgilina include Administrative & Support (19 | 27.5%), Accommodation & Food Services (14 | 20.3%), Educational Services (10 | 14.5%), Manufacturing (5 | 7.2%), and Arts, Entertainment & Recreation (5 | 7.2%).
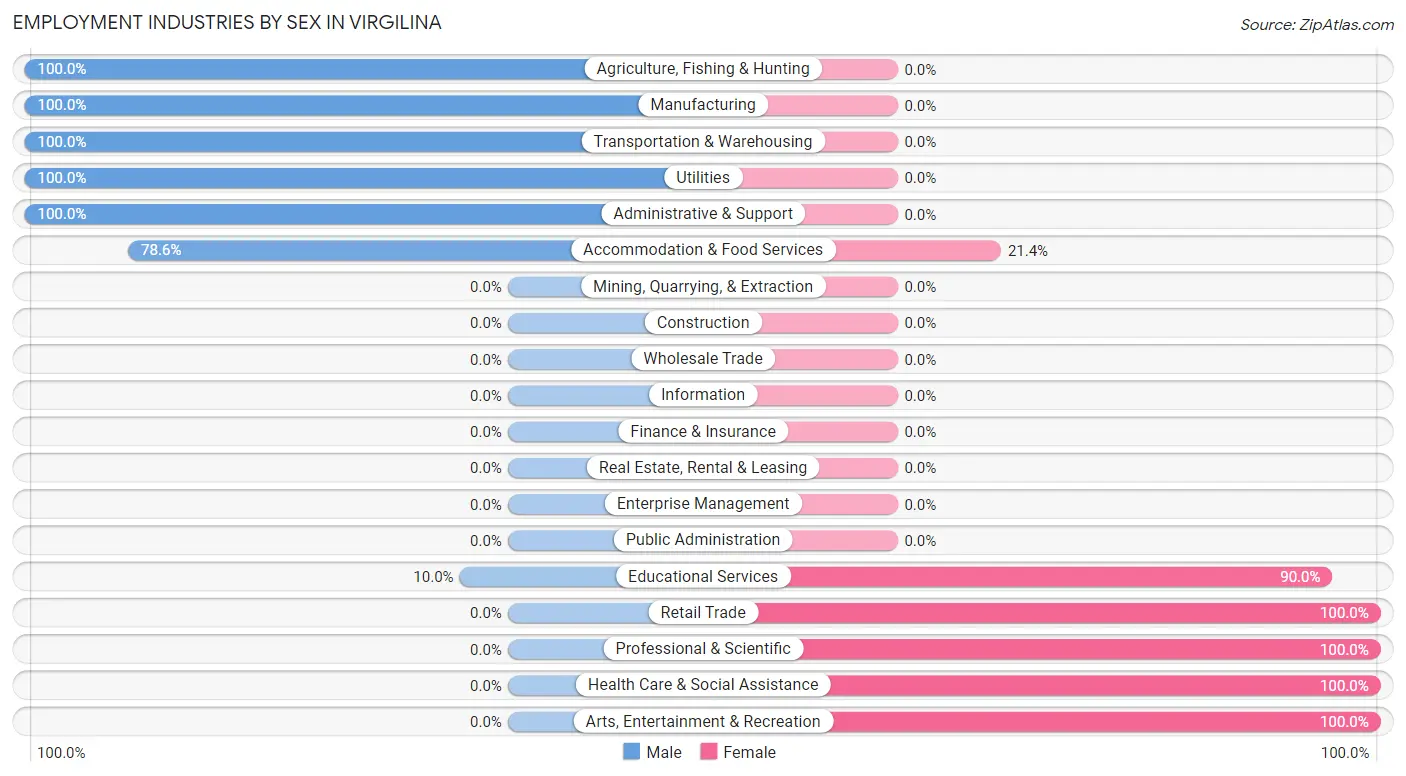
Employment Industries by Sex in Virgilina
The Virgilina industries that see more men than women are Agriculture, Fishing & Hunting (100.0%), Manufacturing (100.0%), and Transportation & Warehousing (100.0%), whereas the industries that tend to have a higher number of women are Retail Trade (100.0%), Professional & Scientific (100.0%), and Health Care & Social Assistance (100.0%).
| Industry | Male | Female |
| Agriculture, Fishing & Hunting | 4 (100.0%) | 0 (0.0%) |
| Mining, Quarrying, & Extraction | 0 (0.0%) | 0 (0.0%) |
| Construction | 0 (0.0%) | 0 (0.0%) |
| Manufacturing | 5 (100.0%) | 0 (0.0%) |
| Wholesale Trade | 0 (0.0%) | 0 (0.0%) |
| Retail Trade | 0 (0.0%) | 3 (100.0%) |
| Transportation & Warehousing | 1 (100.0%) | 0 (0.0%) |
| Utilities | 2 (100.0%) | 0 (0.0%) |
| Information | 0 (0.0%) | 0 (0.0%) |
| Finance & Insurance | 0 (0.0%) | 0 (0.0%) |
| Real Estate, Rental & Leasing | 0 (0.0%) | 0 (0.0%) |
| Professional & Scientific | 0 (0.0%) | 2 (100.0%) |
| Enterprise Management | 0 (0.0%) | 0 (0.0%) |
| Administrative & Support | 19 (100.0%) | 0 (0.0%) |
| Educational Services | 1 (10.0%) | 9 (90.0%) |
| Health Care & Social Assistance | 0 (0.0%) | 4 (100.0%) |
| Arts, Entertainment & Recreation | 0 (0.0%) | 5 (100.0%) |
| Accommodation & Food Services | 11 (78.6%) | 3 (21.4%) |
| Public Administration | 0 (0.0%) | 0 (0.0%) |
| Total | 43 (62.3%) | 26 (37.7%) |
Education in Virgilina
School Enrollment in Virgilina
The most common levels of schooling among the 14 students in Virgilina are middle school (10 | 71.4%), kindergarten (3 | 21.4%), and nursery / preschool (1 | 7.1%).
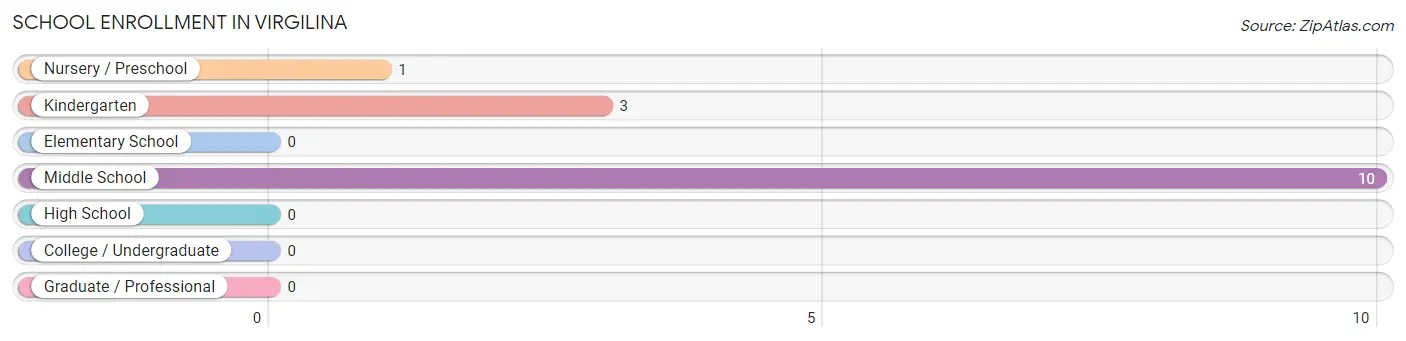
| School Level | # Students | % Students |
| Nursery / Preschool | 1 | 7.1% |
| Kindergarten | 3 | 21.4% |
| Elementary School | 0 | 0.0% |
| Middle School | 10 | 71.4% |
| High School | 0 | 0.0% |
| College / Undergraduate | 0 | 0.0% |
| Graduate / Professional | 0 | 0.0% |
| Total | 14 | 100.0% |
School Enrollment by Age by Funding Source in Virgilina
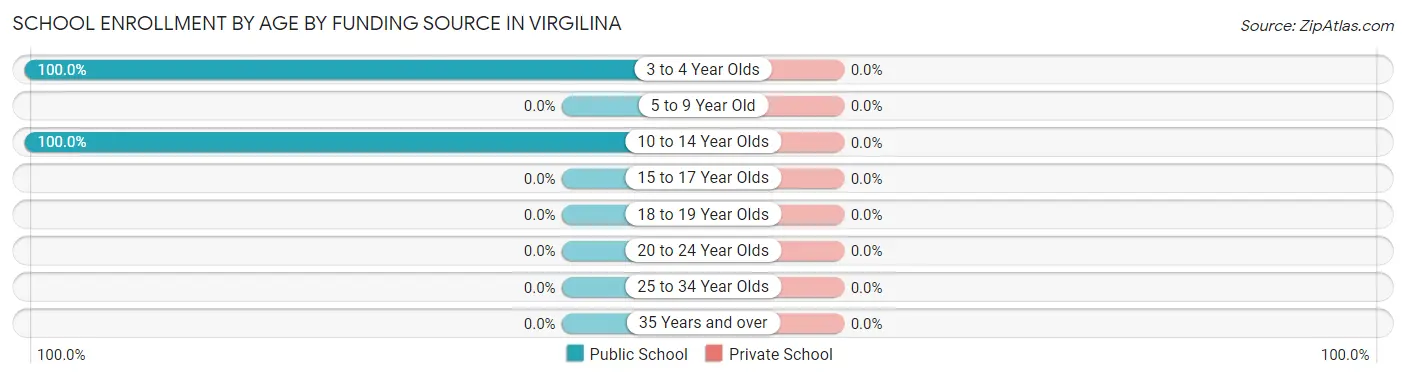
| Age Bracket | Public School | Private School |
| 3 to 4 Year Olds | 4 (100.0%) | 0 (0.0%) |
| 5 to 9 Year Old | 0 (0.0%) | 0 (0.0%) |
| 10 to 14 Year Olds | 10 (100.0%) | 0 (0.0%) |
| 15 to 17 Year Olds | 0 (0.0%) | 0 (0.0%) |
| 18 to 19 Year Olds | 0 (0.0%) | 0 (0.0%) |
| 20 to 24 Year Olds | 0 (0.0%) | 0 (0.0%) |
| 25 to 34 Year Olds | 0 (0.0%) | 0 (0.0%) |
| 35 Years and over | 0 (0.0%) | 0 (0.0%) |
| Total | 14 (100.0%) | 0 (0.0%) |
Educational Attainment by Field of Study in Virgilina
Education (15 | 65.2%), computers & mathematics (3 | 13.0%), social sciences (2 | 8.7%), science & technology (2 | 8.7%), and physical & health sciences (1 | 4.3%) are the most common fields of study among 23 individuals in Virgilina who have obtained a bachelor's degree or higher.
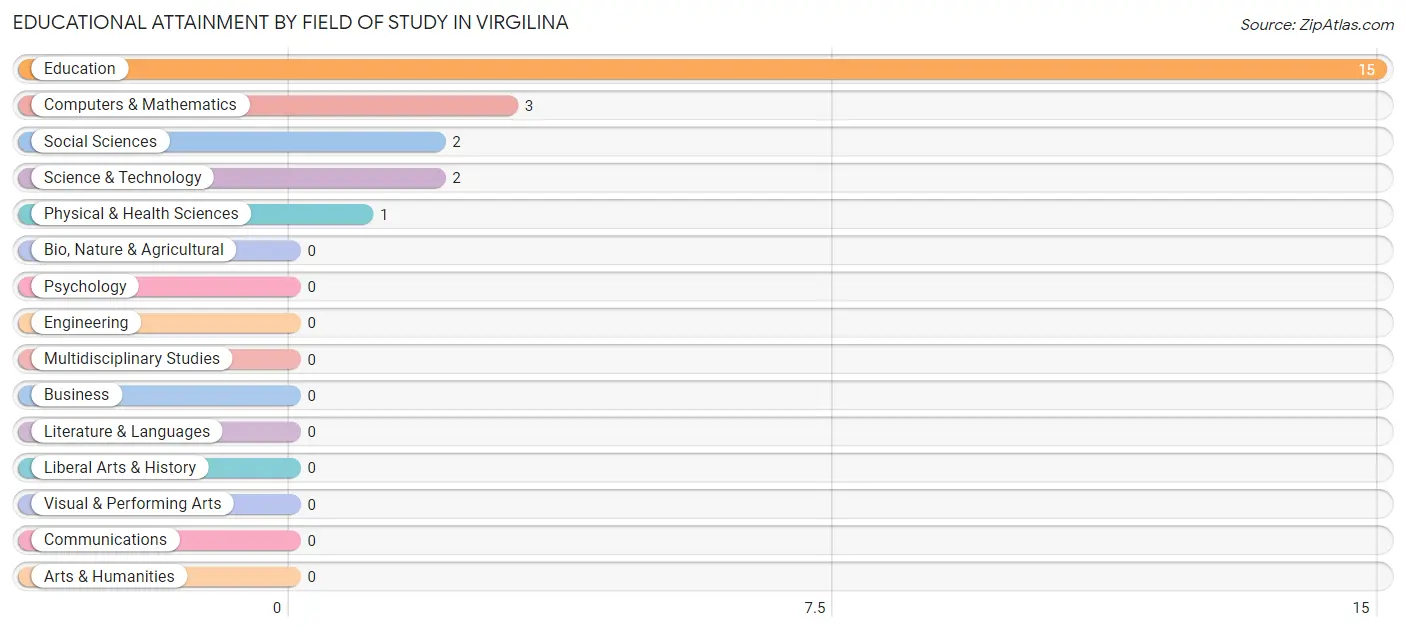
| Field of Study | # Graduates | % Graduates |
| Computers & Mathematics | 3 | 13.0% |
| Bio, Nature & Agricultural | 0 | 0.0% |
| Physical & Health Sciences | 1 | 4.3% |
| Psychology | 0 | 0.0% |
| Social Sciences | 2 | 8.7% |
| Engineering | 0 | 0.0% |
| Multidisciplinary Studies | 0 | 0.0% |
| Science & Technology | 2 | 8.7% |
| Business | 0 | 0.0% |
| Education | 15 | 65.2% |
| Literature & Languages | 0 | 0.0% |
| Liberal Arts & History | 0 | 0.0% |
| Visual & Performing Arts | 0 | 0.0% |
| Communications | 0 | 0.0% |
| Arts & Humanities | 0 | 0.0% |
| Total | 23 | 100.0% |
Transportation & Commute in Virgilina
Vehicle Availability by Sex in Virgilina
The most prevalent vehicle ownership categories in Virgilina are males with 3 vehicles (35, accounting for 81.4%) and females with 3 vehicles (21, making up 152.2%).
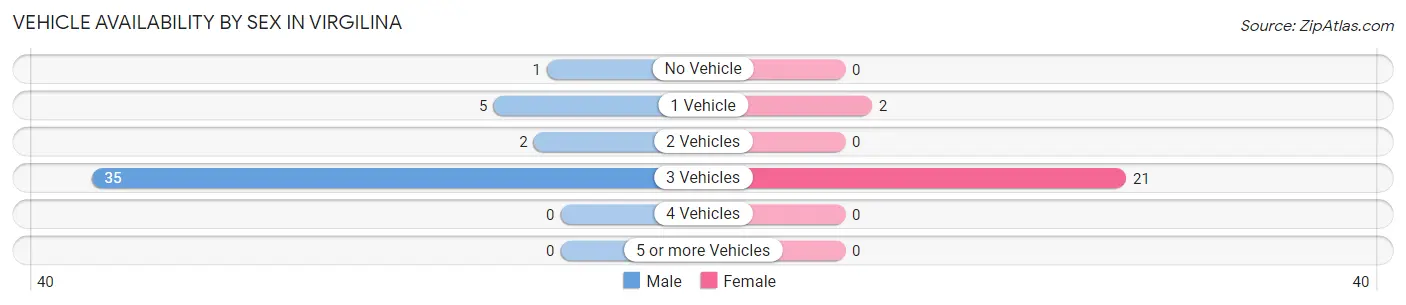
| Vehicles Available | Male | Female |
| No Vehicle | 1 (2.3%) | 0 (0.0%) |
| 1 Vehicle | 5 (11.6%) | 2 (8.7%) |
| 2 Vehicles | 2 (4.6%) | 0 (0.0%) |
| 3 Vehicles | 35 (81.4%) | 21 (91.3%) |
| 4 Vehicles | 0 (0.0%) | 0 (0.0%) |
| 5 or more Vehicles | 0 (0.0%) | 0 (0.0%) |
| Total | 43 (100.0%) | 23 (100.0%) |
Commute Time in Virgilina
The most frequently occuring commute durations in Virgilina are 25 to 29 minutes (20 commuters, 32.8%), 15 to 19 minutes (13 commuters, 21.3%), and 20 to 24 minutes (9 commuters, 14.7%).
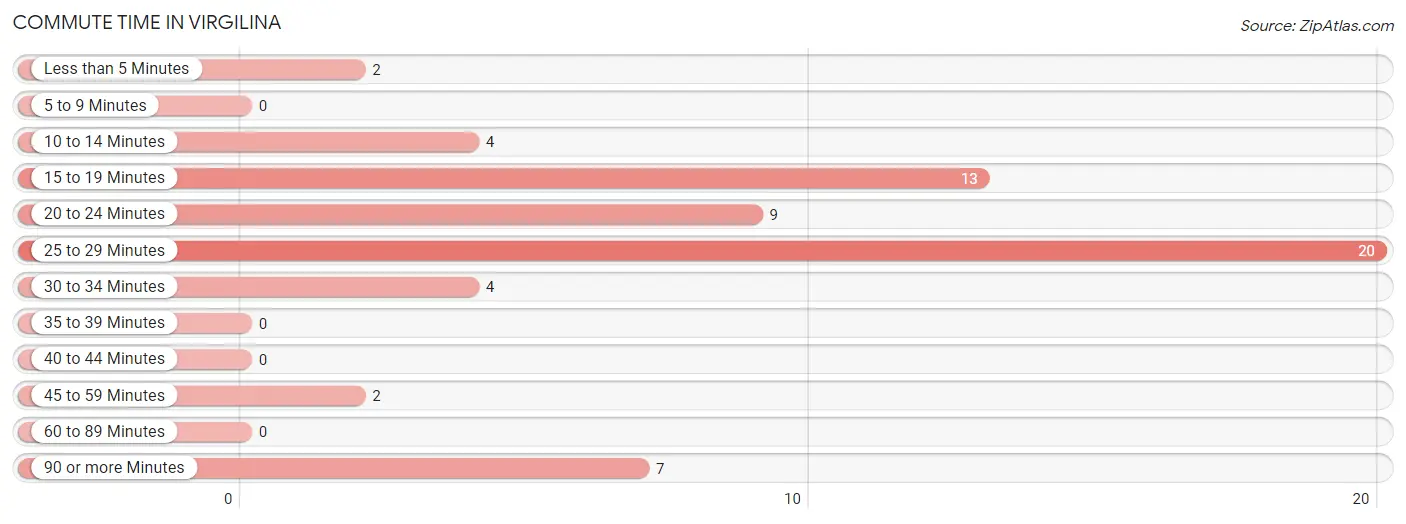
| Commute Time | # Commuters | % Commuters |
| Less than 5 Minutes | 2 | 3.3% |
| 5 to 9 Minutes | 0 | 0.0% |
| 10 to 14 Minutes | 4 | 6.6% |
| 15 to 19 Minutes | 13 | 21.3% |
| 20 to 24 Minutes | 9 | 14.7% |
| 25 to 29 Minutes | 20 | 32.8% |
| 30 to 34 Minutes | 4 | 6.6% |
| 35 to 39 Minutes | 0 | 0.0% |
| 40 to 44 Minutes | 0 | 0.0% |
| 45 to 59 Minutes | 2 | 3.3% |
| 60 to 89 Minutes | 0 | 0.0% |
| 90 or more Minutes | 7 | 11.5% |
Commute Time by Sex in Virgilina
The most common commute times in Virgilina are 15 to 19 minutes (13 commuters, 32.5%) for males and 25 to 29 minutes (9 commuters, 42.9%) for females.
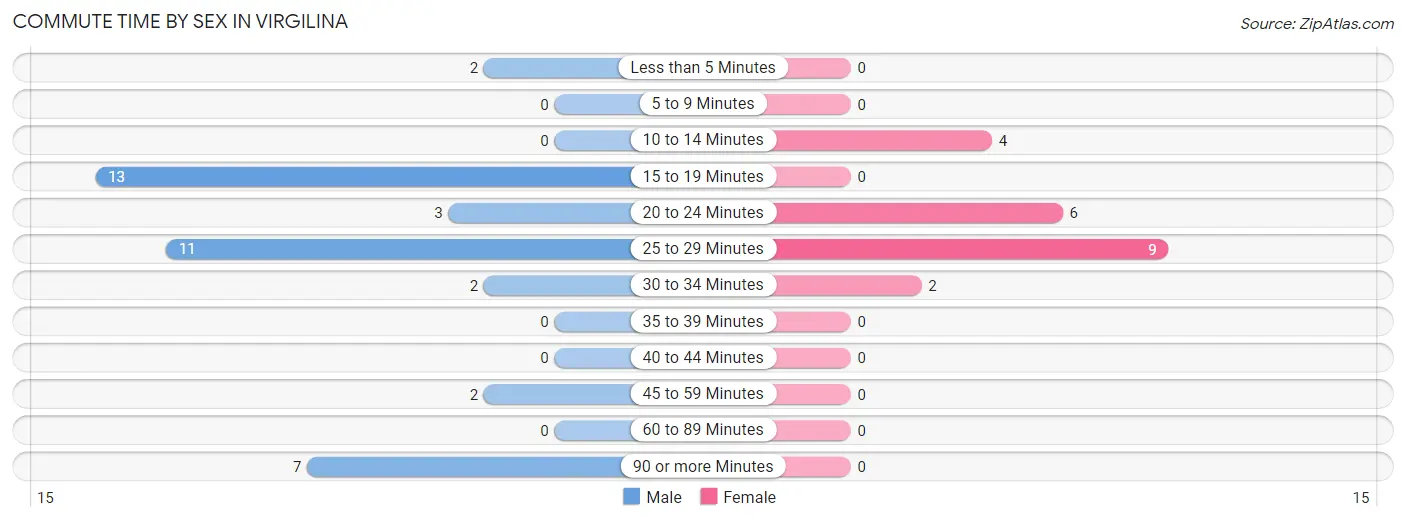
| Commute Time | Male | Female |
| Less than 5 Minutes | 2 (5.0%) | 0 (0.0%) |
| 5 to 9 Minutes | 0 (0.0%) | 0 (0.0%) |
| 10 to 14 Minutes | 0 (0.0%) | 4 (19.1%) |
| 15 to 19 Minutes | 13 (32.5%) | 0 (0.0%) |
| 20 to 24 Minutes | 3 (7.5%) | 6 (28.6%) |
| 25 to 29 Minutes | 11 (27.5%) | 9 (42.9%) |
| 30 to 34 Minutes | 2 (5.0%) | 2 (9.5%) |
| 35 to 39 Minutes | 0 (0.0%) | 0 (0.0%) |
| 40 to 44 Minutes | 0 (0.0%) | 0 (0.0%) |
| 45 to 59 Minutes | 2 (5.0%) | 0 (0.0%) |
| 60 to 89 Minutes | 0 (0.0%) | 0 (0.0%) |
| 90 or more Minutes | 7 (17.5%) | 0 (0.0%) |
Time of Departure to Work by Sex in Virgilina
The most frequent times of departure to work in Virgilina are 7:00 AM to 7:29 AM (14, 35.0%) for males and 7:00 AM to 7:29 AM (9, 42.9%) for females.
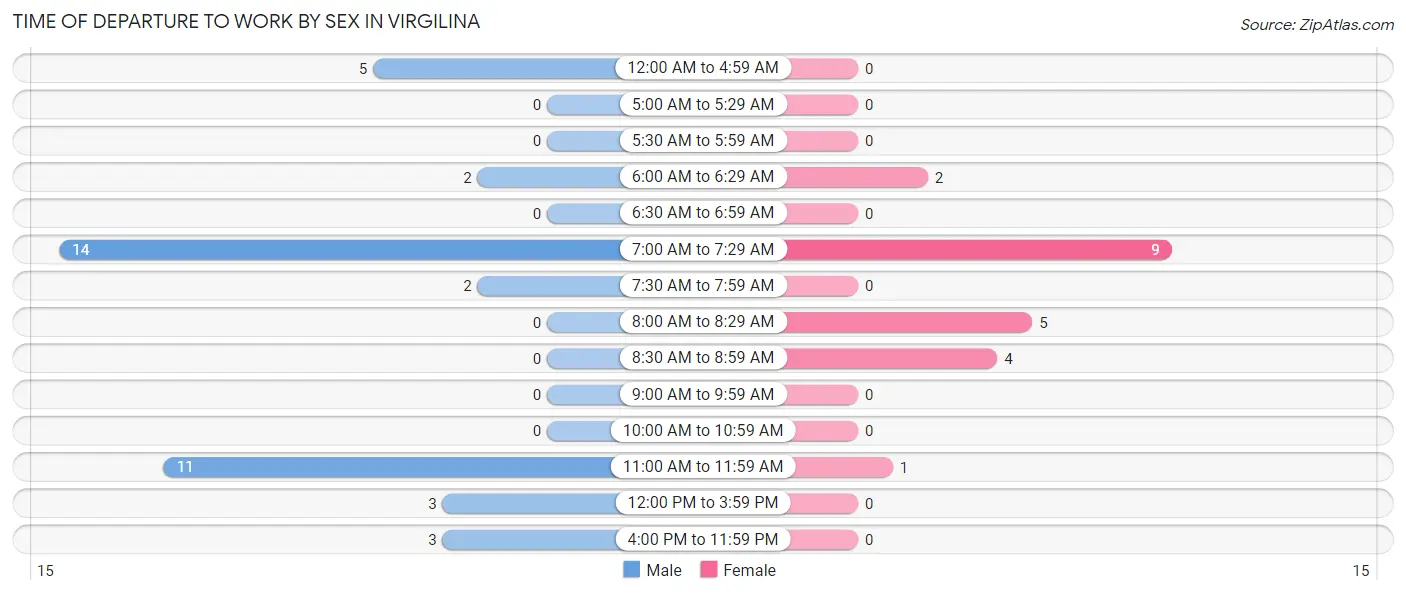
| Time of Departure | Male | Female |
| 12:00 AM to 4:59 AM | 5 (12.5%) | 0 (0.0%) |
| 5:00 AM to 5:29 AM | 0 (0.0%) | 0 (0.0%) |
| 5:30 AM to 5:59 AM | 0 (0.0%) | 0 (0.0%) |
| 6:00 AM to 6:29 AM | 2 (5.0%) | 2 (9.5%) |
| 6:30 AM to 6:59 AM | 0 (0.0%) | 0 (0.0%) |
| 7:00 AM to 7:29 AM | 14 (35.0%) | 9 (42.9%) |
| 7:30 AM to 7:59 AM | 2 (5.0%) | 0 (0.0%) |
| 8:00 AM to 8:29 AM | 0 (0.0%) | 5 (23.8%) |
| 8:30 AM to 8:59 AM | 0 (0.0%) | 4 (19.1%) |
| 9:00 AM to 9:59 AM | 0 (0.0%) | 0 (0.0%) |
| 10:00 AM to 10:59 AM | 0 (0.0%) | 0 (0.0%) |
| 11:00 AM to 11:59 AM | 11 (27.5%) | 1 (4.8%) |
| 12:00 PM to 3:59 PM | 3 (7.5%) | 0 (0.0%) |
| 4:00 PM to 11:59 PM | 3 (7.5%) | 0 (0.0%) |
| Total | 40 (100.0%) | 21 (100.0%) |
Housing Occupancy in Virgilina
Occupancy by Ownership in Virgilina
Of the total 58 dwellings in Virgilina, owner-occupied units account for 40 (69.0%), while renter-occupied units make up 18 (31.0%).
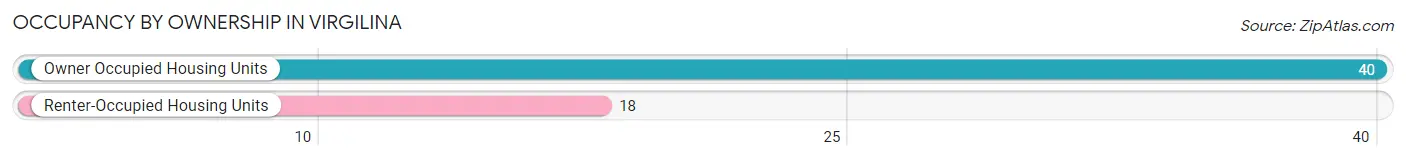
| Occupancy | # Housing Units | % Housing Units |
| Owner Occupied Housing Units | 40 | 69.0% |
| Renter-Occupied Housing Units | 18 | 31.0% |
| Total Occupied Housing Units | 58 | 100.0% |
Occupancy by Household Size in Virgilina
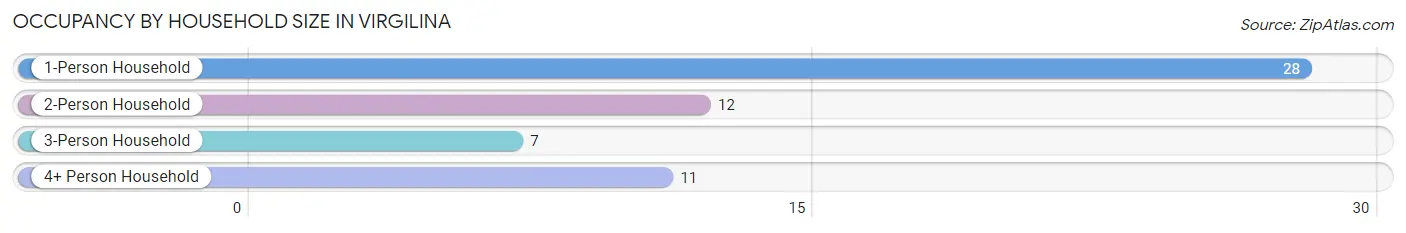
| Household Size | # Housing Units | % Housing Units |
| 1-Person Household | 28 | 48.3% |
| 2-Person Household | 12 | 20.7% |
| 3-Person Household | 7 | 12.1% |
| 4+ Person Household | 11 | 19.0% |
| Total Housing Units | 58 | 100.0% |
Occupancy by Ownership by Household Size in Virgilina
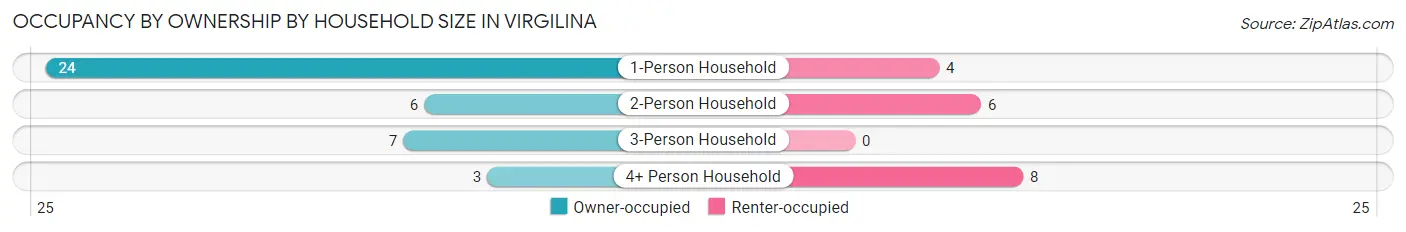
| Household Size | Owner-occupied | Renter-occupied |
| 1-Person Household | 24 (85.7%) | 4 (14.3%) |
| 2-Person Household | 6 (50.0%) | 6 (50.0%) |
| 3-Person Household | 7 (100.0%) | 0 (0.0%) |
| 4+ Person Household | 3 (27.3%) | 8 (72.7%) |
| Total Housing Units | 40 (69.0%) | 18 (31.0%) |
Occupancy by Educational Attainment in Virgilina
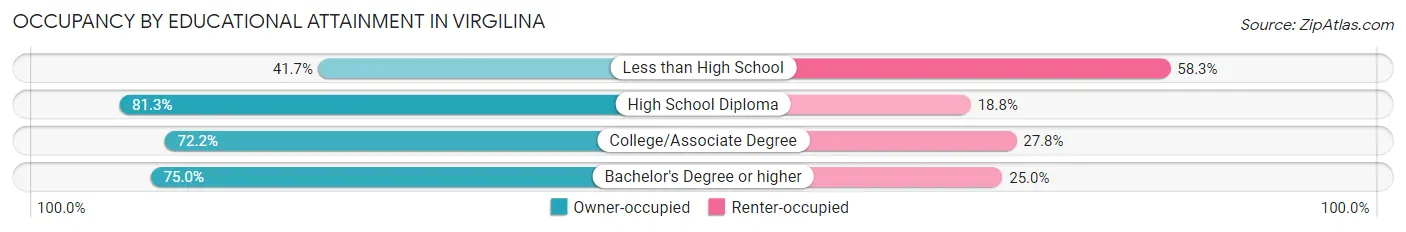
| Household Size | Owner-occupied | Renter-occupied |
| Less than High School | 5 (41.7%) | 7 (58.3%) |
| High School Diploma | 13 (81.2%) | 3 (18.8%) |
| College/Associate Degree | 13 (72.2%) | 5 (27.8%) |
| Bachelor's Degree or higher | 9 (75.0%) | 3 (25.0%) |
Occupancy by Age of Householder in Virgilina
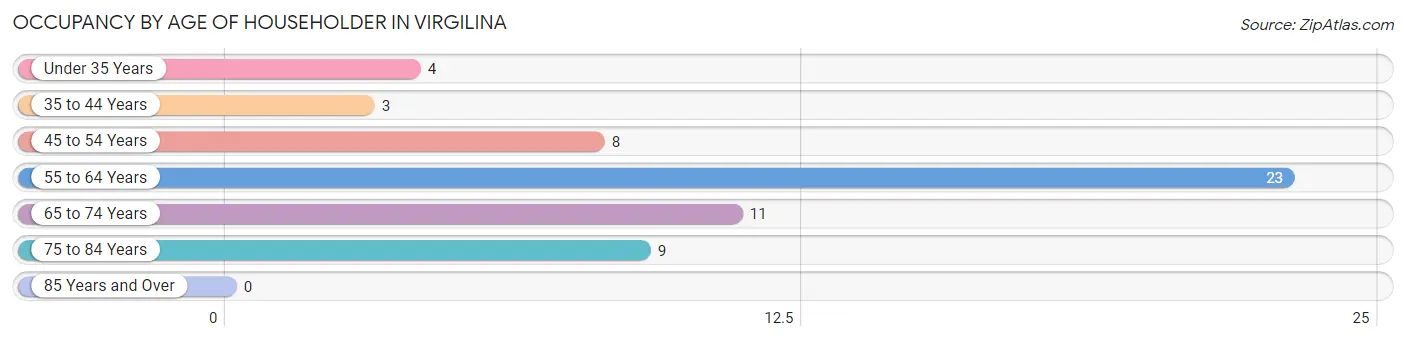
| Age Bracket | # Households | % Households |
| Under 35 Years | 4 | 6.9% |
| 35 to 44 Years | 3 | 5.2% |
| 45 to 54 Years | 8 | 13.8% |
| 55 to 64 Years | 23 | 39.7% |
| 65 to 74 Years | 11 | 19.0% |
| 75 to 84 Years | 9 | 15.5% |
| 85 Years and Over | 0 | 0.0% |
| Total | 58 | 100.0% |
Housing Finances in Virgilina
Median Income by Occupancy in Virgilina
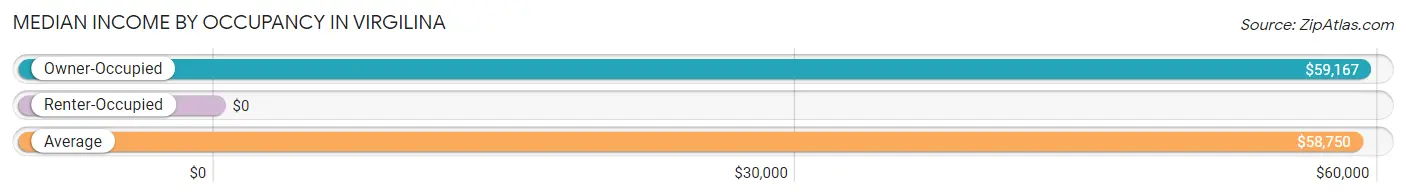
| Occupancy Type | # Households | Median Income |
| Owner-Occupied | 40 (69.0%) | $59,167 |
| Renter-Occupied | 18 (31.0%) | $0 |
| Average | 58 (100.0%) | $58,750 |
Occupancy by Householder Income Bracket in Virgilina
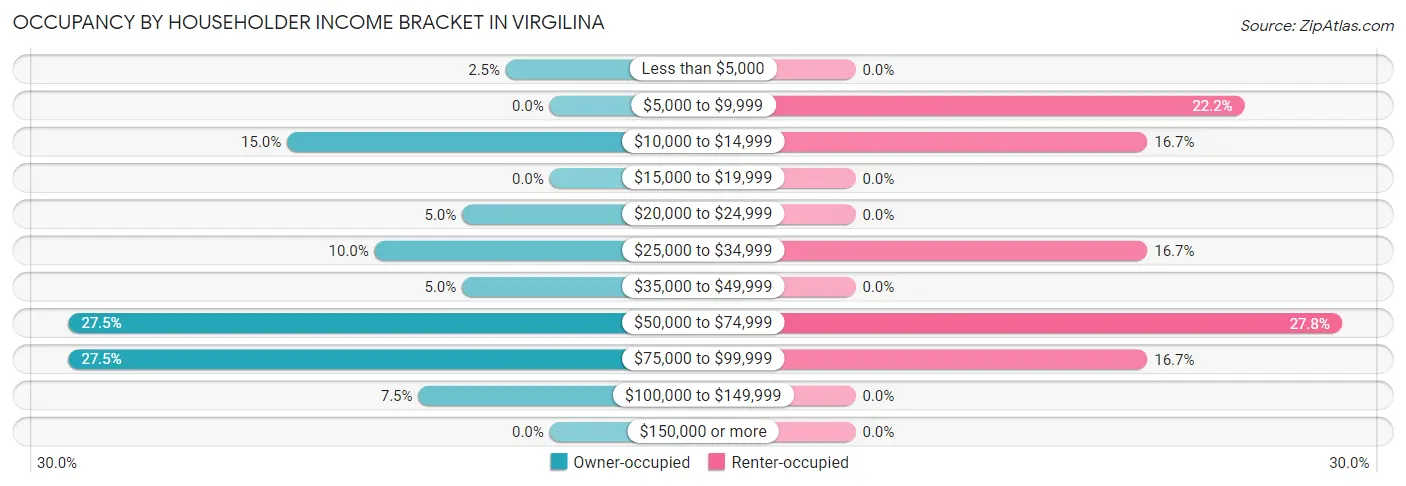
| Income Bracket | Owner-occupied | Renter-occupied |
| Less than $5,000 | 1 (2.5%) | 0 (0.0%) |
| $5,000 to $9,999 | 0 (0.0%) | 4 (22.2%) |
| $10,000 to $14,999 | 6 (15.0%) | 3 (16.7%) |
| $15,000 to $19,999 | 0 (0.0%) | 0 (0.0%) |
| $20,000 to $24,999 | 2 (5.0%) | 0 (0.0%) |
| $25,000 to $34,999 | 4 (10.0%) | 3 (16.7%) |
| $35,000 to $49,999 | 2 (5.0%) | 0 (0.0%) |
| $50,000 to $74,999 | 11 (27.5%) | 5 (27.8%) |
| $75,000 to $99,999 | 11 (27.5%) | 3 (16.7%) |
| $100,000 to $149,999 | 3 (7.5%) | 0 (0.0%) |
| $150,000 or more | 0 (0.0%) | 0 (0.0%) |
| Total | 40 (100.0%) | 18 (100.0%) |
Monthly Housing Cost Tiers in Virgilina
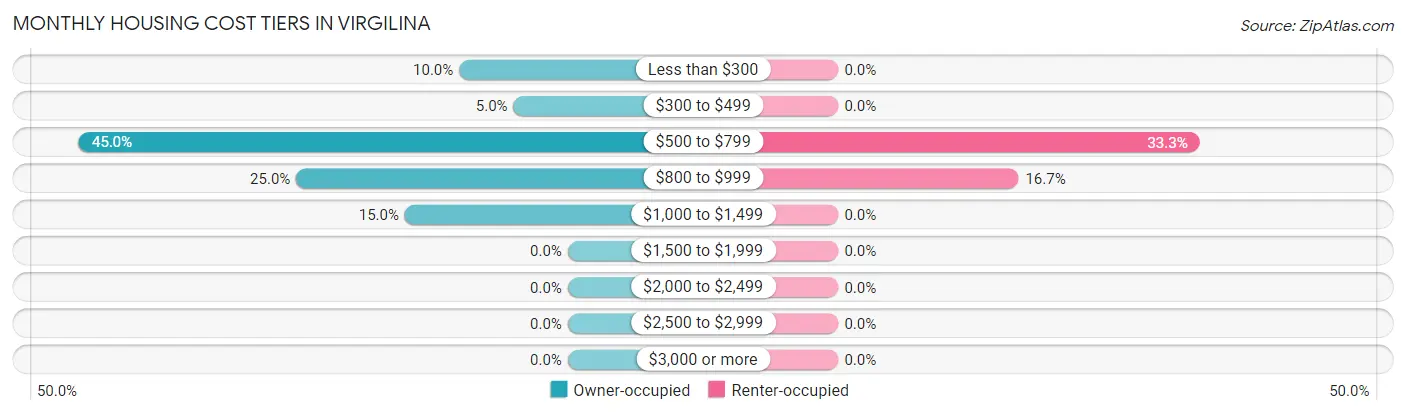
| Monthly Cost | Owner-occupied | Renter-occupied |
| Less than $300 | 4 (10.0%) | 0 (0.0%) |
| $300 to $499 | 2 (5.0%) | 0 (0.0%) |
| $500 to $799 | 18 (45.0%) | 6 (33.3%) |
| $800 to $999 | 10 (25.0%) | 3 (16.7%) |
| $1,000 to $1,499 | 6 (15.0%) | 0 (0.0%) |
| $1,500 to $1,999 | 0 (0.0%) | 0 (0.0%) |
| $2,000 to $2,499 | 0 (0.0%) | 0 (0.0%) |
| $2,500 to $2,999 | 0 (0.0%) | 0 (0.0%) |
| $3,000 or more | 0 (0.0%) | 0 (0.0%) |
| Total | 40 (100.0%) | 18 (100.0%) |
Physical Housing Characteristics in Virgilina
Housing Structures in Virgilina
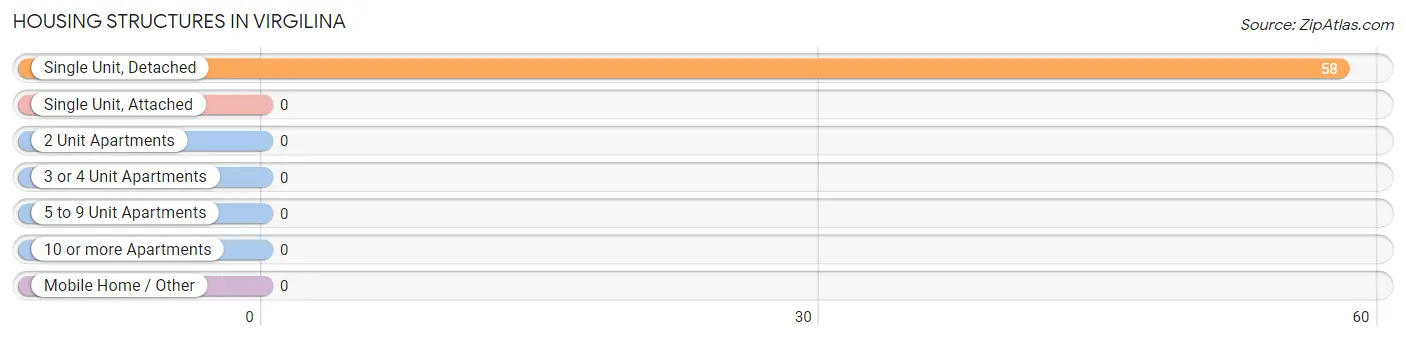
| Structure Type | # Housing Units | % Housing Units |
| Single Unit, Detached | 58 | 100.0% |
| Single Unit, Attached | 0 | 0.0% |
| 2 Unit Apartments | 0 | 0.0% |
| 3 or 4 Unit Apartments | 0 | 0.0% |
| 5 to 9 Unit Apartments | 0 | 0.0% |
| 10 or more Apartments | 0 | 0.0% |
| Mobile Home / Other | 0 | 0.0% |
| Total | 58 | 100.0% |
Housing Structures by Occupancy in Virgilina
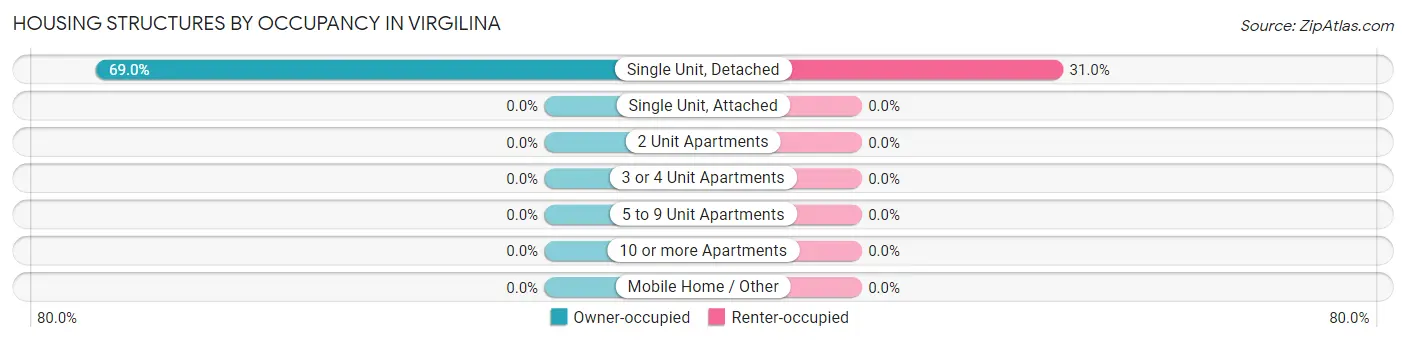
| Structure Type | Owner-occupied | Renter-occupied |
| Single Unit, Detached | 40 (69.0%) | 18 (31.0%) |
| Single Unit, Attached | 0 (0.0%) | 0 (0.0%) |
| 2 Unit Apartments | 0 (0.0%) | 0 (0.0%) |
| 3 or 4 Unit Apartments | 0 (0.0%) | 0 (0.0%) |
| 5 to 9 Unit Apartments | 0 (0.0%) | 0 (0.0%) |
| 10 or more Apartments | 0 (0.0%) | 0 (0.0%) |
| Mobile Home / Other | 0 (0.0%) | 0 (0.0%) |
| Total | 40 (69.0%) | 18 (31.0%) |
Housing Structures by Number of Rooms in Virgilina
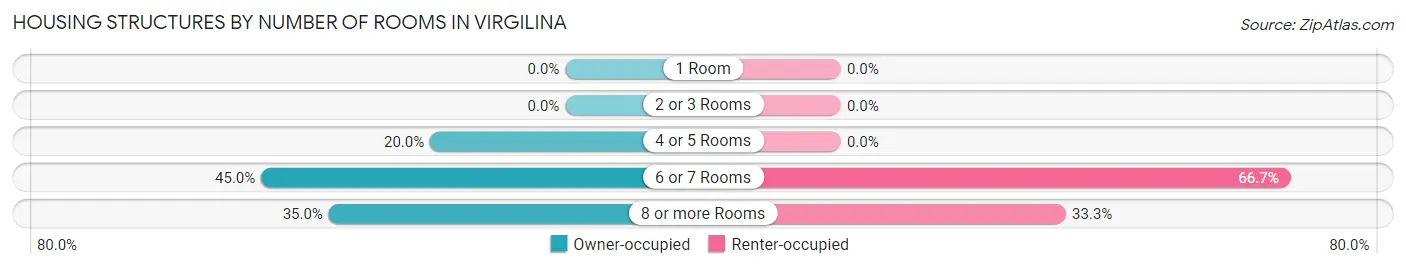
| Number of Rooms | Owner-occupied | Renter-occupied |
| 1 Room | 0 (0.0%) | 0 (0.0%) |
| 2 or 3 Rooms | 0 (0.0%) | 0 (0.0%) |
| 4 or 5 Rooms | 8 (20.0%) | 0 (0.0%) |
| 6 or 7 Rooms | 18 (45.0%) | 12 (66.7%) |
| 8 or more Rooms | 14 (35.0%) | 6 (33.3%) |
| Total | 40 (100.0%) | 18 (100.0%) |
Housing Structure by Heating Type in Virgilina
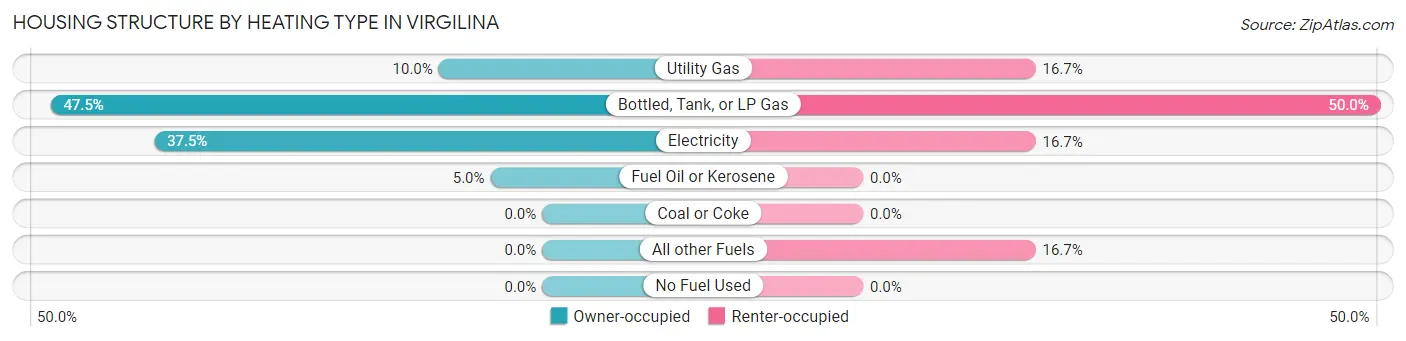
| Heating Type | Owner-occupied | Renter-occupied |
| Utility Gas | 4 (10.0%) | 3 (16.7%) |
| Bottled, Tank, or LP Gas | 19 (47.5%) | 9 (50.0%) |
| Electricity | 15 (37.5%) | 3 (16.7%) |
| Fuel Oil or Kerosene | 2 (5.0%) | 0 (0.0%) |
| Coal or Coke | 0 (0.0%) | 0 (0.0%) |
| All other Fuels | 0 (0.0%) | 3 (16.7%) |
| No Fuel Used | 0 (0.0%) | 0 (0.0%) |
| Total | 40 (100.0%) | 18 (100.0%) |
Household Vehicle Usage in Virgilina
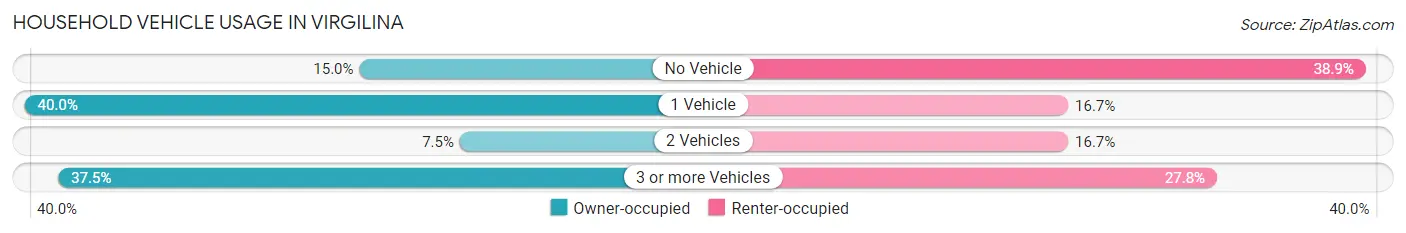
| Vehicles per Household | Owner-occupied | Renter-occupied |
| No Vehicle | 6 (15.0%) | 7 (38.9%) |
| 1 Vehicle | 16 (40.0%) | 3 (16.7%) |
| 2 Vehicles | 3 (7.5%) | 3 (16.7%) |
| 3 or more Vehicles | 15 (37.5%) | 5 (27.8%) |
| Total | 40 (100.0%) | 18 (100.0%) |
Real Estate & Mortgages in Virgilina
Real Estate and Mortgage Overview in Virgilina
| Characteristic | Without Mortgage | With Mortgage |
| Housing Units | 23 | 17 |
| Median Property Value | - | - |
| Median Household Income | $58,542 | $0 |
| Monthly Housing Costs | $605 | $0 |
| Real Estate Taxes | $491 | $0 |
Property Value by Mortgage Status in Virgilina
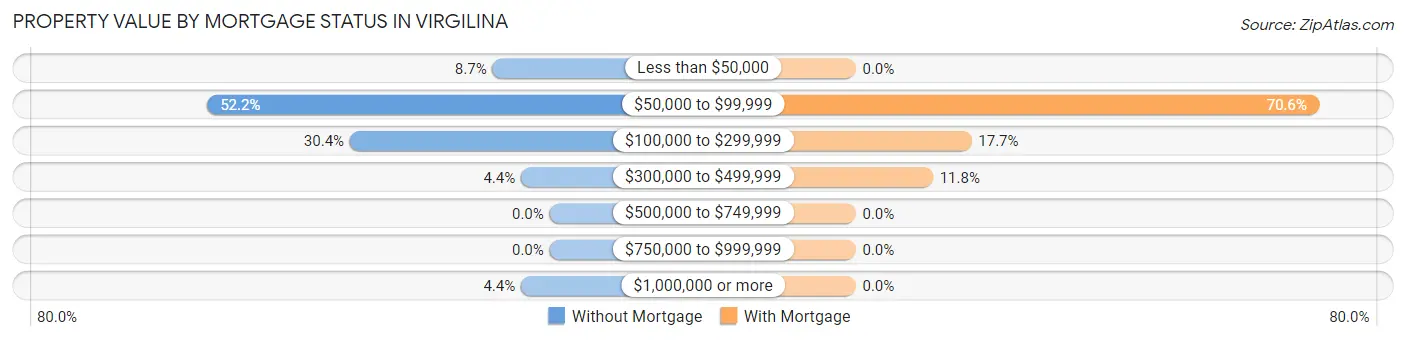
| Property Value | Without Mortgage | With Mortgage |
| Less than $50,000 | 2 (8.7%) | 0 (0.0%) |
| $50,000 to $99,999 | 12 (52.2%) | 12 (70.6%) |
| $100,000 to $299,999 | 7 (30.4%) | 3 (17.6%) |
| $300,000 to $499,999 | 1 (4.3%) | 2 (11.8%) |
| $500,000 to $749,999 | 0 (0.0%) | 0 (0.0%) |
| $750,000 to $999,999 | 0 (0.0%) | 0 (0.0%) |
| $1,000,000 or more | 1 (4.3%) | 0 (0.0%) |
| Total | 23 (100.0%) | 17 (100.0%) |
Household Income by Mortgage Status in Virgilina
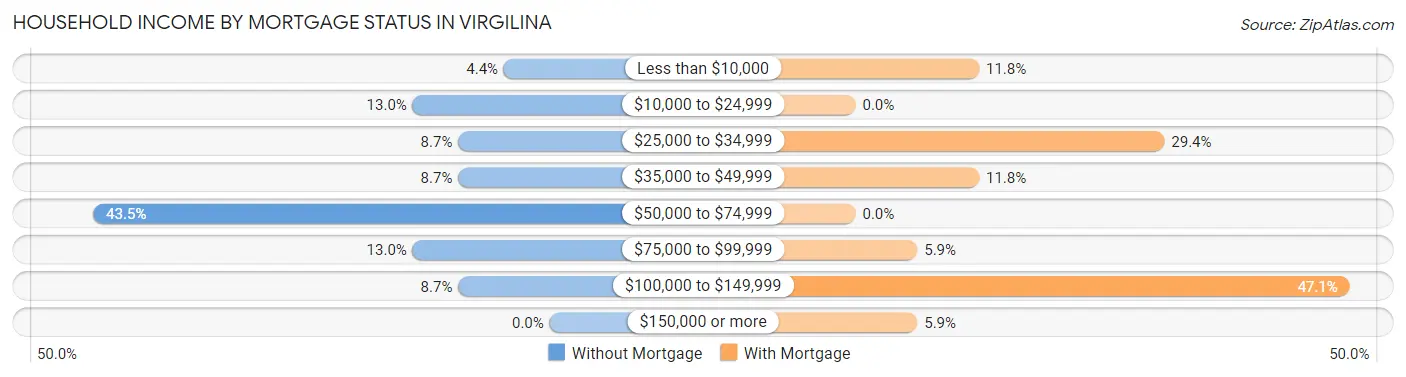
| Household Income | Without Mortgage | With Mortgage |
| Less than $10,000 | 1 (4.3%) | 2 (11.8%) |
| $10,000 to $24,999 | 3 (13.0%) | 0 (0.0%) |
| $25,000 to $34,999 | 2 (8.7%) | 5 (29.4%) |
| $35,000 to $49,999 | 2 (8.7%) | 2 (11.8%) |
| $50,000 to $74,999 | 10 (43.5%) | 0 (0.0%) |
| $75,000 to $99,999 | 3 (13.0%) | 1 (5.9%) |
| $100,000 to $149,999 | 2 (8.7%) | 8 (47.1%) |
| $150,000 or more | 0 (0.0%) | 1 (5.9%) |
| Total | 23 (100.0%) | 17 (100.0%) |
Property Value to Household Income Ratio in Virgilina
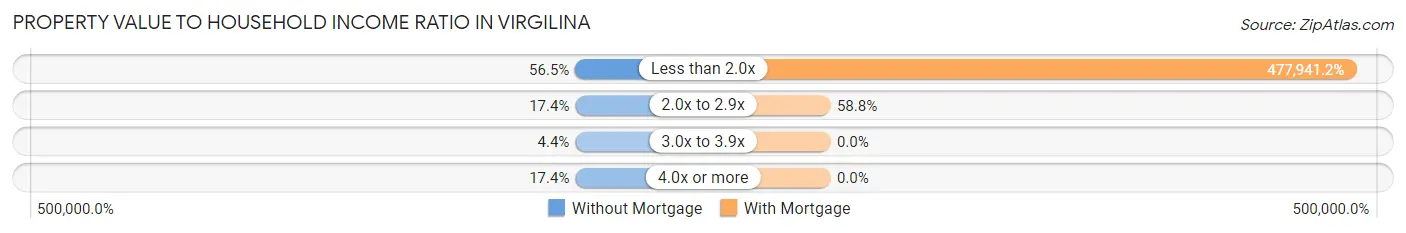
| Value-to-Income Ratio | Without Mortgage | With Mortgage |
| Less than 2.0x | 13 (56.5%) | 81,250 (477,941.2%) |
| 2.0x to 2.9x | 4 (17.4%) | 10 (58.8%) |
| 3.0x to 3.9x | 1 (4.3%) | 0 (0.0%) |
| 4.0x or more | 4 (17.4%) | 0 (0.0%) |
| Total | 23 (100.0%) | 17 (100.0%) |
Real Estate Taxes by Mortgage Status in Virgilina
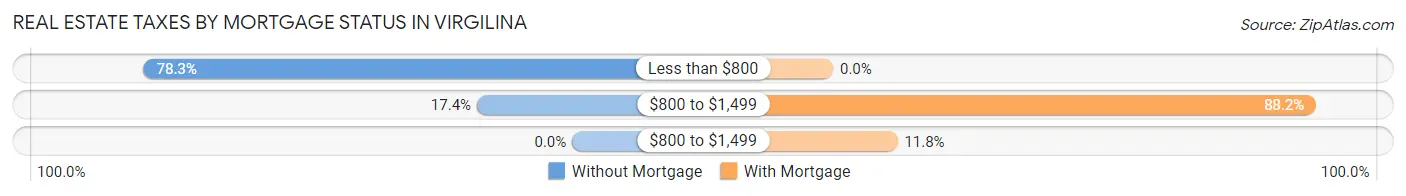
| Property Taxes | Without Mortgage | With Mortgage |
| Less than $800 | 18 (78.3%) | 0 (0.0%) |
| $800 to $1,499 | 4 (17.4%) | 15 (88.2%) |
| $800 to $1,499 | 0 (0.0%) | 2 (11.8%) |
| Total | 23 (100.0%) | 17 (100.0%) |
Health & Disability in Virgilina
Health Insurance Coverage by Age in Virgilina
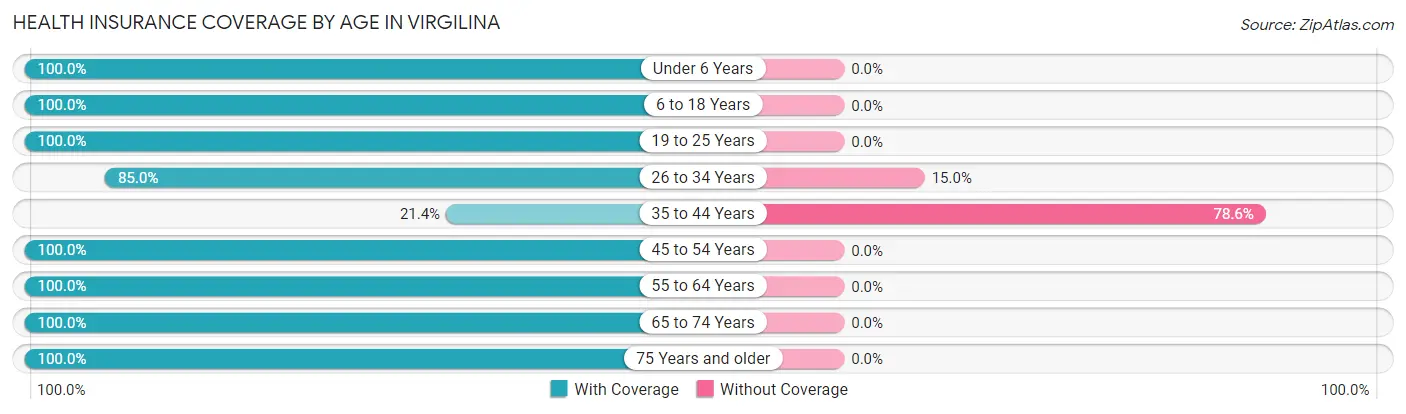
| Age Bracket | With Coverage | Without Coverage |
| Under 6 Years | 17 (100.0%) | 0 (0.0%) |
| 6 to 18 Years | 10 (100.0%) | 0 (0.0%) |
| 19 to 25 Years | 9 (100.0%) | 0 (0.0%) |
| 26 to 34 Years | 17 (85.0%) | 3 (15.0%) |
| 35 to 44 Years | 3 (21.4%) | 11 (78.6%) |
| 45 to 54 Years | 21 (100.0%) | 0 (0.0%) |
| 55 to 64 Years | 33 (100.0%) | 0 (0.0%) |
| 65 to 74 Years | 22 (100.0%) | 0 (0.0%) |
| 75 Years and older | 11 (100.0%) | 0 (0.0%) |
| Total | 143 (91.1%) | 14 (8.9%) |
Health Insurance Coverage by Citizenship Status in Virgilina
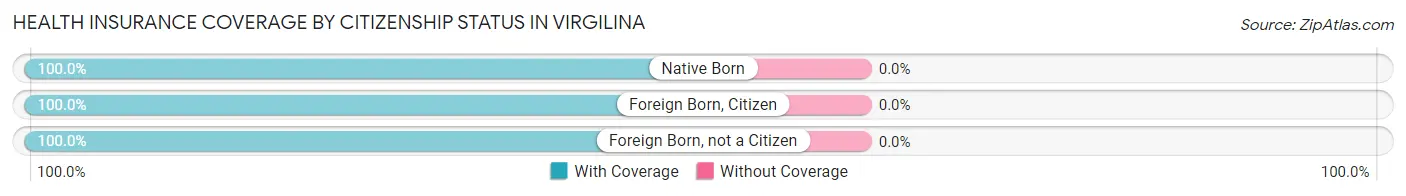
| Citizenship Status | With Coverage | Without Coverage |
| Native Born | 17 (100.0%) | 0 (0.0%) |
| Foreign Born, Citizen | 10 (100.0%) | 0 (0.0%) |
| Foreign Born, not a Citizen | 9 (100.0%) | 0 (0.0%) |
Health Insurance Coverage by Household Income in Virgilina
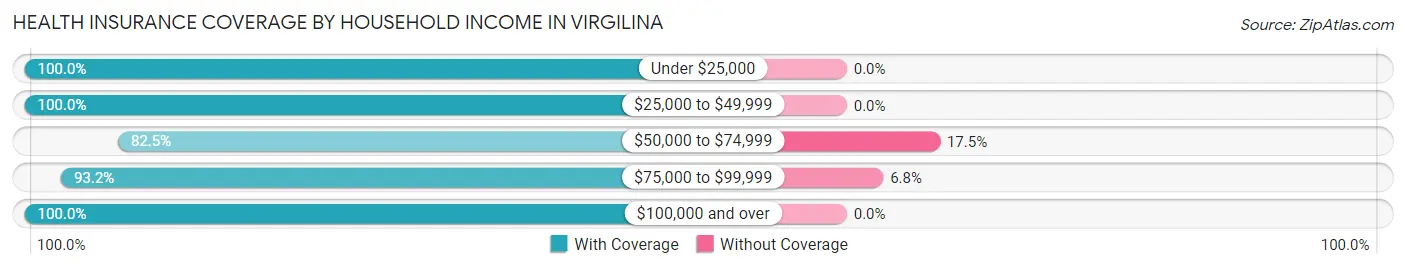
| Household Income | With Coverage | Without Coverage |
| Under $25,000 | 20 (100.0%) | 0 (0.0%) |
| $25,000 to $49,999 | 25 (100.0%) | 0 (0.0%) |
| $50,000 to $74,999 | 52 (82.5%) | 11 (17.5%) |
| $75,000 to $99,999 | 41 (93.2%) | 3 (6.8%) |
| $100,000 and over | 5 (100.0%) | 0 (0.0%) |
Public vs Private Health Insurance Coverage by Age in Virgilina
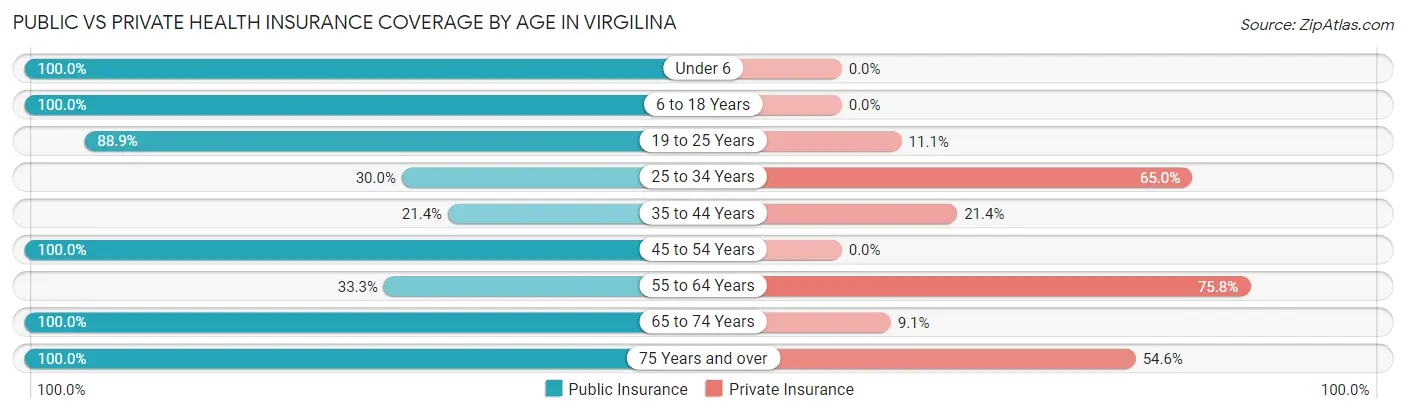
| Age Bracket | Public Insurance | Private Insurance |
| Under 6 | 17 (100.0%) | 0 (0.0%) |
| 6 to 18 Years | 10 (100.0%) | 0 (0.0%) |
| 19 to 25 Years | 8 (88.9%) | 1 (11.1%) |
| 25 to 34 Years | 6 (30.0%) | 13 (65.0%) |
| 35 to 44 Years | 3 (21.4%) | 3 (21.4%) |
| 45 to 54 Years | 21 (100.0%) | 0 (0.0%) |
| 55 to 64 Years | 11 (33.3%) | 25 (75.8%) |
| 65 to 74 Years | 22 (100.0%) | 2 (9.1%) |
| 75 Years and over | 11 (100.0%) | 6 (54.5%) |
| Total | 109 (69.4%) | 50 (31.9%) |
Disability Status by Sex by Age in Virgilina
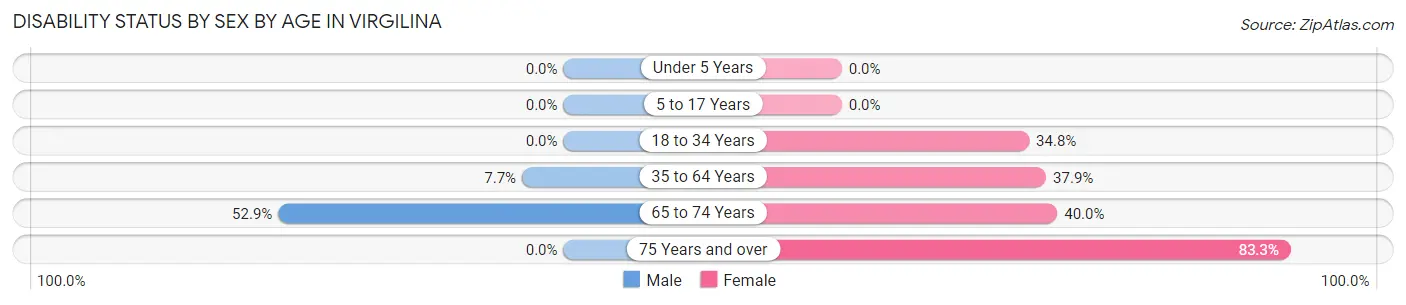
| Age Bracket | Male | Female |
| Under 5 Years | 0 (0.0%) | 0 (0.0%) |
| 5 to 17 Years | 0 (0.0%) | 0 (0.0%) |
| 18 to 34 Years | 0 (0.0%) | 8 (34.8%) |
| 35 to 64 Years | 3 (7.7%) | 11 (37.9%) |
| 65 to 74 Years | 9 (52.9%) | 2 (40.0%) |
| 75 Years and over | 0 (0.0%) | 5 (83.3%) |
Disability Class by Sex by Age in Virgilina
Disability Class: Hearing Difficulty
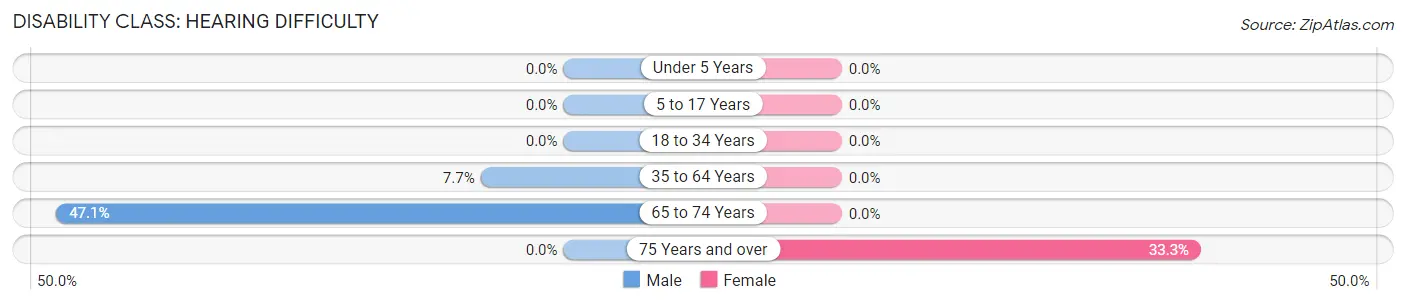
| Age Bracket | Male | Female |
| Under 5 Years | 0 (0.0%) | 0 (0.0%) |
| 5 to 17 Years | 0 (0.0%) | 0 (0.0%) |
| 18 to 34 Years | 0 (0.0%) | 0 (0.0%) |
| 35 to 64 Years | 3 (7.7%) | 0 (0.0%) |
| 65 to 74 Years | 8 (47.1%) | 0 (0.0%) |
| 75 Years and over | 0 (0.0%) | 2 (33.3%) |
Disability Class: Vision Difficulty
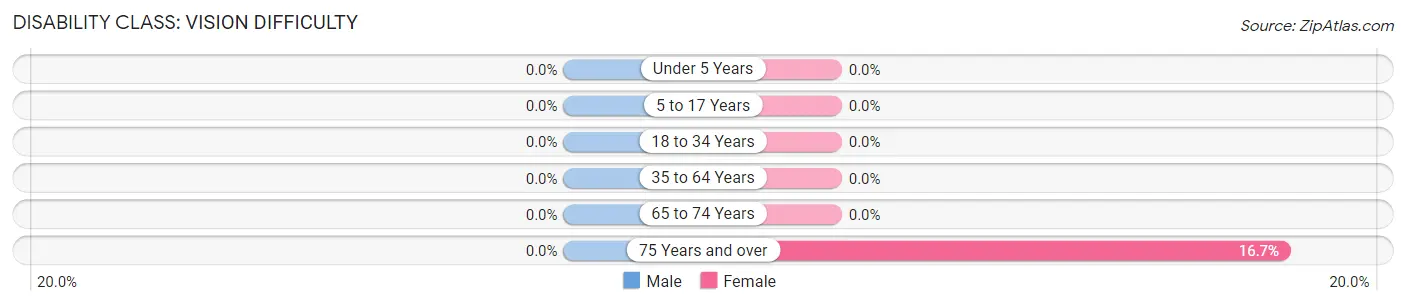
| Age Bracket | Male | Female |
| Under 5 Years | 0 (0.0%) | 0 (0.0%) |
| 5 to 17 Years | 0 (0.0%) | 0 (0.0%) |
| 18 to 34 Years | 0 (0.0%) | 0 (0.0%) |
| 35 to 64 Years | 0 (0.0%) | 0 (0.0%) |
| 65 to 74 Years | 0 (0.0%) | 0 (0.0%) |
| 75 Years and over | 0 (0.0%) | 1 (16.7%) |
Disability Class: Cognitive Difficulty
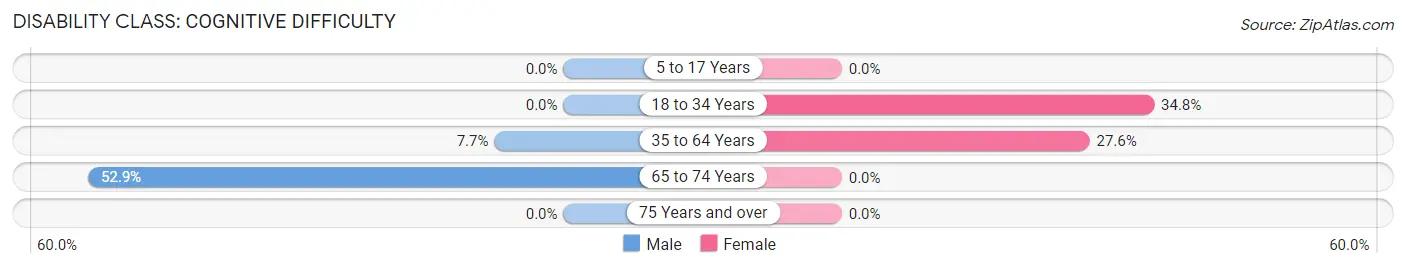
| Age Bracket | Male | Female |
| 5 to 17 Years | 0 (0.0%) | 0 (0.0%) |
| 18 to 34 Years | 0 (0.0%) | 8 (34.8%) |
| 35 to 64 Years | 3 (7.7%) | 8 (27.6%) |
| 65 to 74 Years | 9 (52.9%) | 0 (0.0%) |
| 75 Years and over | 0 (0.0%) | 0 (0.0%) |
Disability Class: Ambulatory Difficulty
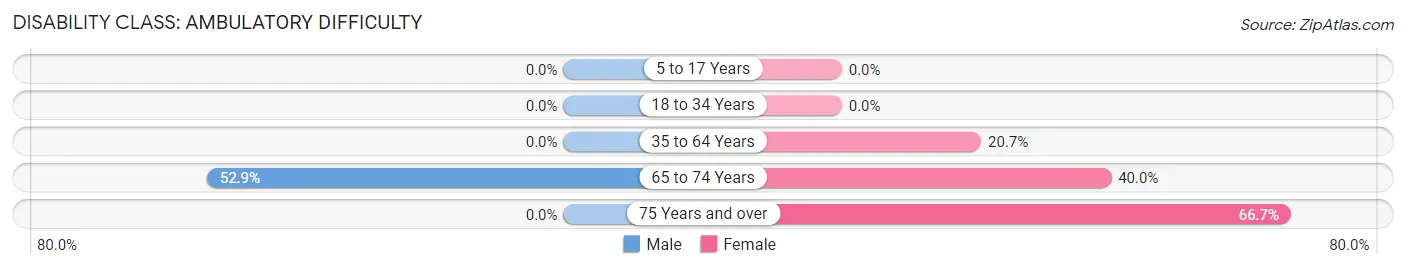
| Age Bracket | Male | Female |
| 5 to 17 Years | 0 (0.0%) | 0 (0.0%) |
| 18 to 34 Years | 0 (0.0%) | 0 (0.0%) |
| 35 to 64 Years | 0 (0.0%) | 6 (20.7%) |
| 65 to 74 Years | 9 (52.9%) | 2 (40.0%) |
| 75 Years and over | 0 (0.0%) | 4 (66.7%) |
Disability Class: Self-Care Difficulty
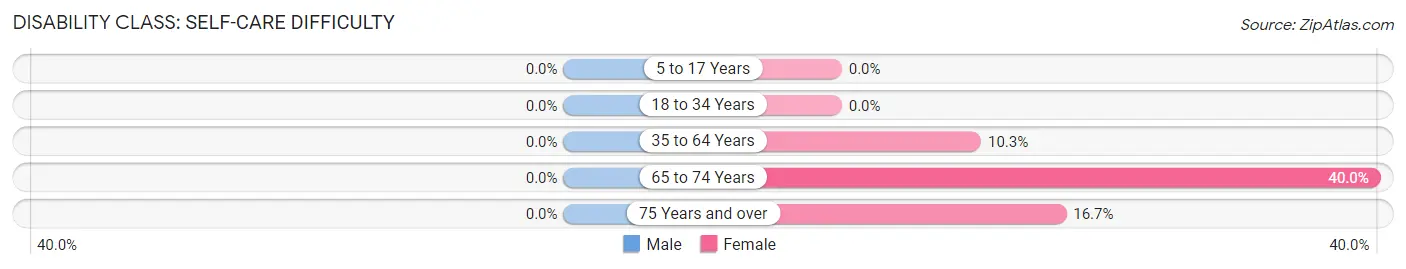
| Age Bracket | Male | Female |
| 5 to 17 Years | 0 (0.0%) | 0 (0.0%) |
| 18 to 34 Years | 0 (0.0%) | 0 (0.0%) |
| 35 to 64 Years | 0 (0.0%) | 3 (10.3%) |
| 65 to 74 Years | 0 (0.0%) | 2 (40.0%) |
| 75 Years and over | 0 (0.0%) | 1 (16.7%) |
Technology Access in Virgilina
Computing Device Access in Virgilina
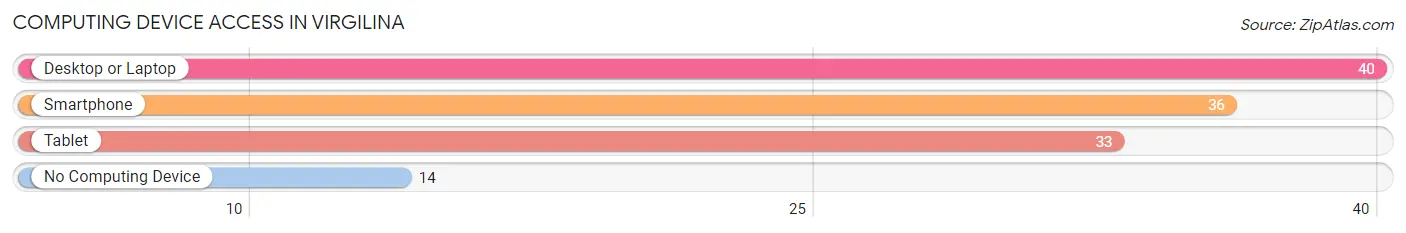
| Device Type | # Households | % Households |
| Desktop or Laptop | 40 | 69.0% |
| Smartphone | 36 | 62.1% |
| Tablet | 33 | 56.9% |
| No Computing Device | 14 | 24.1% |
| Total | 58 | 100.0% |
Internet Access in Virgilina
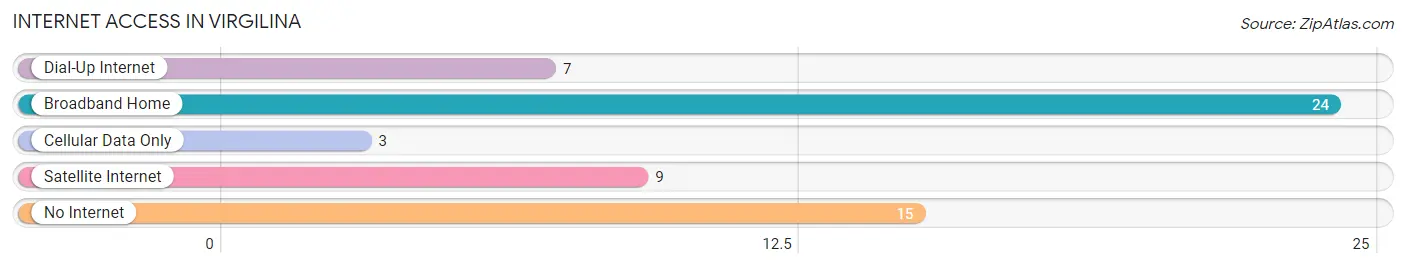
| Internet Type | # Households | % Households |
| Dial-Up Internet | 7 | 12.1% |
| Broadband Home | 24 | 41.4% |
| Cellular Data Only | 3 | 5.2% |
| Satellite Internet | 9 | 15.5% |
| No Internet | 15 | 25.9% |
| Total | 58 | 100.0% |
Virgilina Summary
Virgilina is a small town located in Halifax County, Virginia. It is situated in the southern part of the state, about halfway between Richmond and the North Carolina border. The town was founded in 1820 and has a population of approximately 500 people.
Geography
Virgilina is located in the Piedmont region of Virginia, which is characterized by rolling hills and valleys. The town is situated on the banks of the Dan River, which is a tributary of the Roanoke River. The town is surrounded by farmland and forests, and is located near the Blue Ridge Mountains. The climate in Virgilina is mild, with temperatures ranging from the mid-30s in the winter to the mid-80s in the summer.
Economy
The economy of Virgilina is largely based on agriculture. The town is home to several farms, which produce a variety of crops, including corn, soybeans, wheat, and hay. The town also has a few small businesses, including a grocery store, a hardware store, and a few restaurants.
Demographics
As of the 2010 census, the population of Virgilina was 498 people. The racial makeup of the town was 95.2% White, 2.2% African American, 0.2% Native American, 0.4% Asian, and 1.8% from other races. The median household income was $30,938, and the median age was 41.7 years.
History
Virgilina was founded in 1820 by a group of settlers from North Carolina. The town was named after Virgilina, the daughter of one of the settlers. The town grew slowly over the years, and by the late 19th century, it had become a thriving agricultural community. In the early 20th century, the town was home to several mills, which produced lumber and other goods.
In the mid-20th century, Virgilina experienced a period of decline. The mills closed, and many of the town’s residents moved away in search of better economic opportunities. However, in recent years, the town has seen a resurgence in population and economic activity. The town is now home to several small businesses, and is a popular destination for outdoor recreation.
Conclusion
Virgilina is a small town located in Halifax County, Virginia. It is situated in the southern part of the state, about halfway between Richmond and the North Carolina border. The town was founded in 1820 and has a population of approximately 500 people. The economy of Virgilina is largely based on agriculture, and the town is home to several small businesses. The racial makeup of the town is 95.2% White, 2.2% African American, 0.2% Native American, 0.4% Asian, and 1.8% from other races. The median household income was $30,938, and the median age was 41.7 years. Virgilina has experienced a period of decline in the mid-20th century, but in recent years, the town has seen a resurgence in population and economic activity.
Common Questions
What is Per Capita Income in Virgilina?
Per Capita income in Virgilina is $23,987.
What is the Median Family Income in Virgilina?
Median Family Income in Virgilina is $46,719.
What is the Median Household income in Virgilina?
Median Household Income in Virgilina is $58,750.
What is Inequality or Gini Index in Virgilina?
Inequality or Gini Index in Virgilina is 0.35.
What is the Total Population of Virgilina?
Total Population of Virgilina is 157.
What is the Total Male Population of Virgilina?
Total Male Population of Virgilina is 78.
What is the Total Female Population of Virgilina?
Total Female Population of Virgilina is 79.
What is the Ratio of Males per 100 Females in Virgilina?
There are 98.73 Males per 100 Females in Virgilina.
What is the Ratio of Females per 100 Males in Virgilina?
There are 101.28 Females per 100 Males in Virgilina.
What is the Median Population Age in Virgilina?
Median Population Age in Virgilina is 47.7 Years.
What is the Average Family Size in Virgilina
Average Family Size in Virgilina is 3.2 People.
What is the Average Household Size in Virgilina
Average Household Size in Virgilina is 2.7 People.
How Large is the Labor Force in Virgilina?
There are 69 People in the Labor Forcein in Virgilina.
What is the Percentage of People in the Labor Force in Virgilina?
53.1% of People are in the Labor Force in Virgilina.