Fort Hunt, VA Map & Demographics
Fort Hunt Map
Fort Hunt Overview
$93,485
PER CAPITA INCOME
$234,343
AVG FAMILY INCOME
$209,135
AVG HOUSEHOLD INCOME
37.4%
WAGE / INCOME GAP [ % ]
62.6¢/ $1
WAGE / INCOME GAP [ $ ]
0.38
INEQUALITY / GINI INDEX
16,009
TOTAL POPULATION
7,906
MALE POPULATION
8,103
FEMALE POPULATION
97.57
MALES / 100 FEMALES
102.49
FEMALES / 100 MALES
46.2
MEDIAN AGE
3.1
AVG FAMILY SIZE
2.7
AVG HOUSEHOLD SIZE
7,956
LABOR FORCE [ PEOPLE ]
64.1%
PERCENT IN LABOR FORCE
1.7%
UNEMPLOYMENT RATE
Income in Fort Hunt
Income Overview in Fort Hunt
Per Capita Income in Fort Hunt is $93,485, while median incomes of families and households are $234,343 and $209,135 respectively.
| Characteristic | Number | Measure |
| Per Capita Income | 16,009 | $93,485 |
| Median Family Income | 4,621 | $234,343 |
| Mean Family Income | 4,621 | $277,784 |
| Median Household Income | 5,874 | $209,135 |
| Mean Household Income | 5,874 | $251,737 |
| Income Deficit | 4,621 | $0 |
| Wage / Income Gap (%) | 16,009 | 37.39% |
| Wage / Income Gap ($) | 16,009 | 62.61¢ per $1 |
| Gini / Inequality Index | 16,009 | 0.38 |
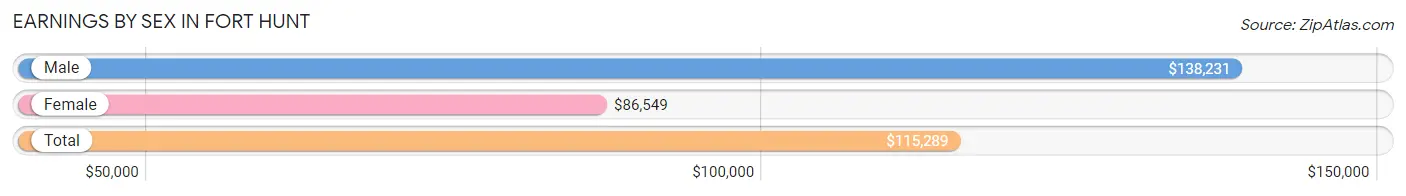
Earnings by Sex in Fort Hunt
Average Earnings in Fort Hunt are $115,289, $138,231 for men and $86,549 for women, a difference of 37.4%.
| Sex | Number | Average Earnings |
| Male | 4,554 (54.0%) | $138,231 |
| Female | 3,885 (46.0%) | $86,549 |
| Total | 8,439 (100.0%) | $115,289 |
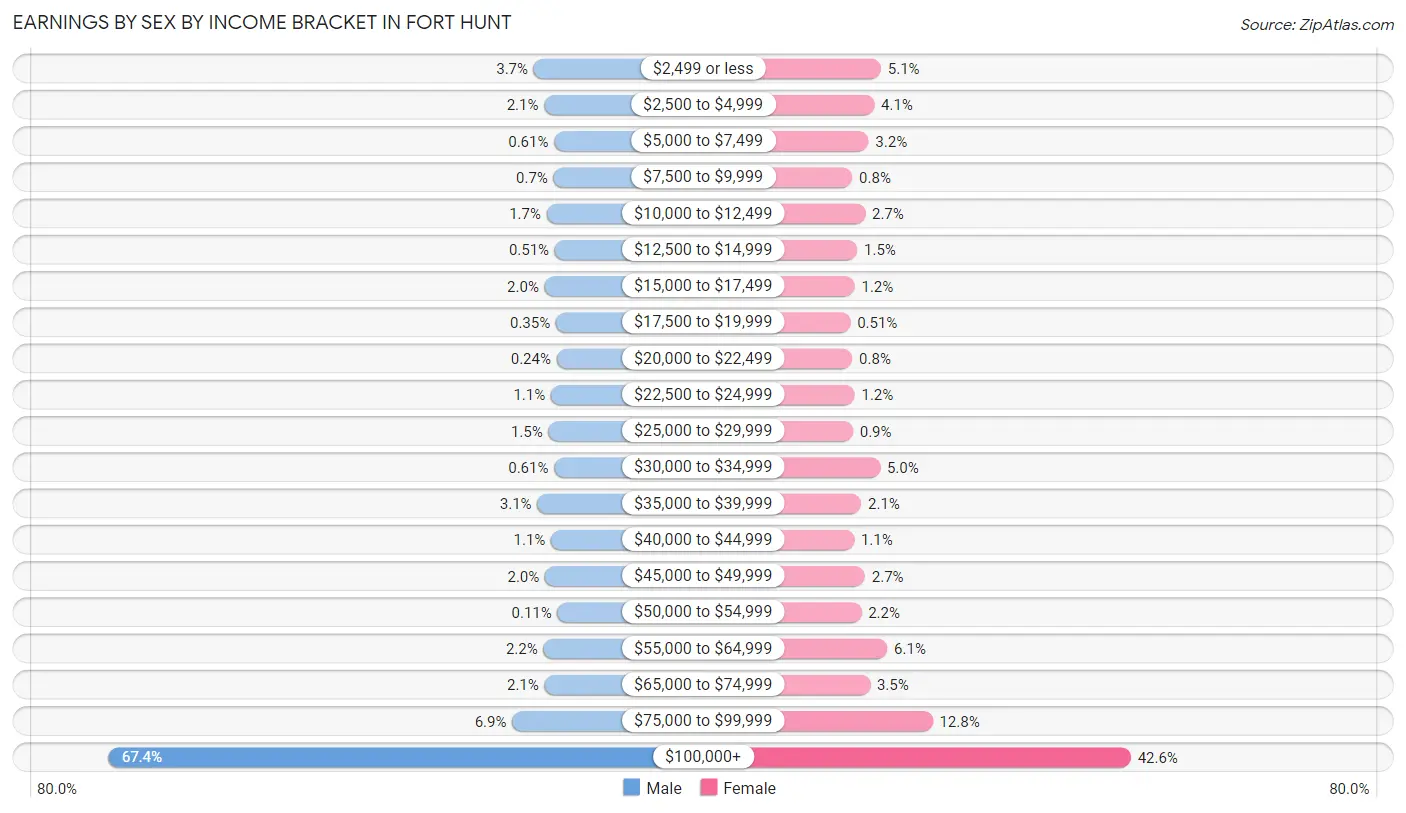
Earnings by Sex by Income Bracket in Fort Hunt
The most common earnings brackets in Fort Hunt are $100,000+ for men (3,068 | 67.4%) and $100,000+ for women (1,653 | 42.5%).
| Income | Male | Female |
| $2,499 or less | 167 (3.7%) | 198 (5.1%) |
| $2,500 to $4,999 | 96 (2.1%) | 159 (4.1%) |
| $5,000 to $7,499 | 28 (0.6%) | 126 (3.2%) |
| $7,500 to $9,999 | 32 (0.7%) | 31 (0.8%) |
| $10,000 to $12,499 | 79 (1.7%) | 106 (2.7%) |
| $12,500 to $14,999 | 23 (0.5%) | 60 (1.5%) |
| $15,000 to $17,499 | 93 (2.0%) | 45 (1.2%) |
| $17,500 to $19,999 | 16 (0.4%) | 20 (0.5%) |
| $20,000 to $22,499 | 11 (0.2%) | 31 (0.8%) |
| $22,500 to $24,999 | 50 (1.1%) | 45 (1.2%) |
| $25,000 to $29,999 | 67 (1.5%) | 35 (0.9%) |
| $30,000 to $34,999 | 28 (0.6%) | 193 (5.0%) |
| $35,000 to $39,999 | 143 (3.1%) | 83 (2.1%) |
| $40,000 to $44,999 | 49 (1.1%) | 42 (1.1%) |
| $45,000 to $49,999 | 90 (2.0%) | 105 (2.7%) |
| $50,000 to $54,999 | 5 (0.1%) | 84 (2.2%) |
| $55,000 to $64,999 | 101 (2.2%) | 235 (6.0%) |
| $65,000 to $74,999 | 94 (2.1%) | 135 (3.5%) |
| $75,000 to $99,999 | 314 (6.9%) | 499 (12.8%) |
| $100,000+ | 3,068 (67.4%) | 1,653 (42.5%) |
| Total | 4,554 (100.0%) | 3,885 (100.0%) |
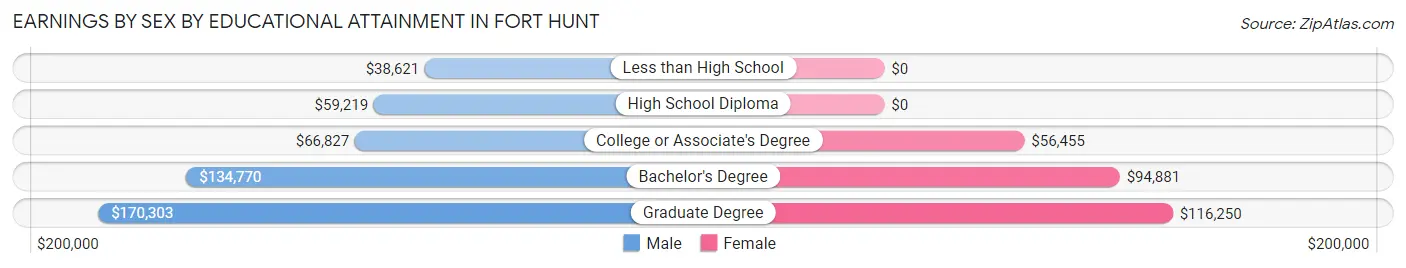
Earnings by Sex by Educational Attainment in Fort Hunt
Average earnings in Fort Hunt are $143,671 for men and $97,003 for women, a difference of 32.5%. Men with an educational attainment of graduate degree enjoy the highest average annual earnings of $170,303, while those with less than high school education earn the least with $38,621. Women with an educational attainment of graduate degree earn the most with the average annual earnings of $116,250, while those with college or associate's degree education have the smallest earnings of $56,455.
| Educational Attainment | Male Income | Female Income |
| Less than High School | $38,621 | $0 |
| High School Diploma | $59,219 | $0 |
| College or Associate's Degree | $66,827 | $56,455 |
| Bachelor's Degree | $134,770 | $94,881 |
| Graduate Degree | $170,303 | $116,250 |
| Total | $143,671 | $97,003 |
Family Income in Fort Hunt
Family Income Brackets in Fort Hunt
According to the Fort Hunt family income data, there are 2,847 families falling into the $200,000+ income range, which is the most common income bracket and makes up 61.6% of all families. Conversely, the less than $10,000 income bracket is the least frequent group with only 14 families (0.3%) belonging to this category.
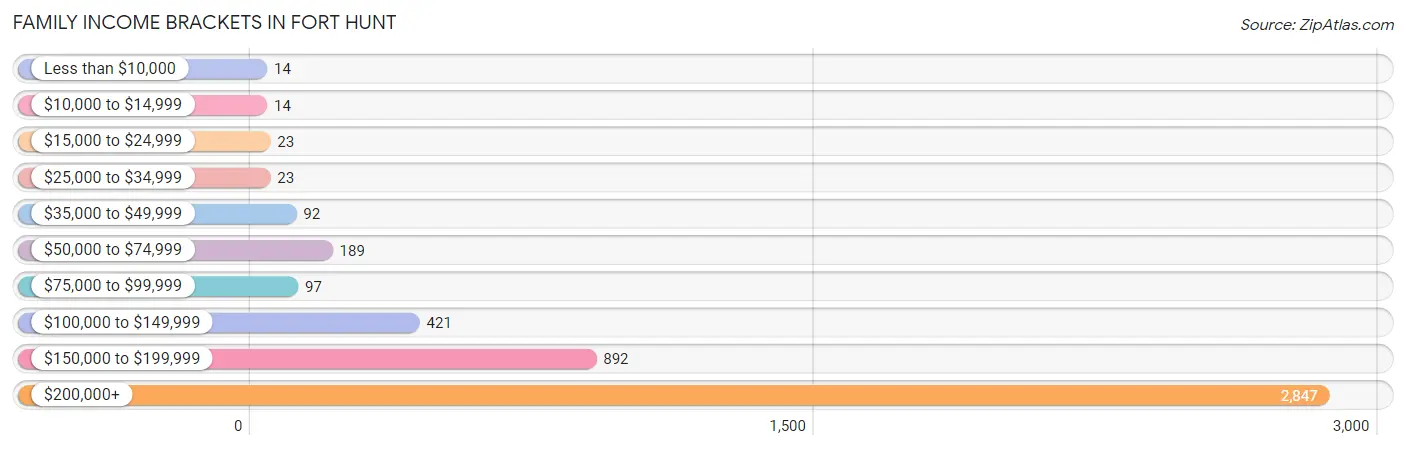
| Income Bracket | # Families | % Families |
| Less than $10,000 | 14 | 0.3% |
| $10,000 to $14,999 | 14 | 0.3% |
| $15,000 to $24,999 | 23 | 0.5% |
| $25,000 to $34,999 | 23 | 0.5% |
| $35,000 to $49,999 | 92 | 2.0% |
| $50,000 to $74,999 | 189 | 4.1% |
| $75,000 to $99,999 | 97 | 2.1% |
| $100,000 to $149,999 | 421 | 9.1% |
| $150,000 to $199,999 | 892 | 19.3% |
| $200,000+ | 2,847 | 61.6% |
Family Income by Famaliy Size in Fort Hunt
4-person families (1,147 | 24.8%) account for the highest median family income in Fort Hunt with $250,001 per family, while 2-person families (2,039 | 44.1%) have the highest median income of $108,238 per family member.
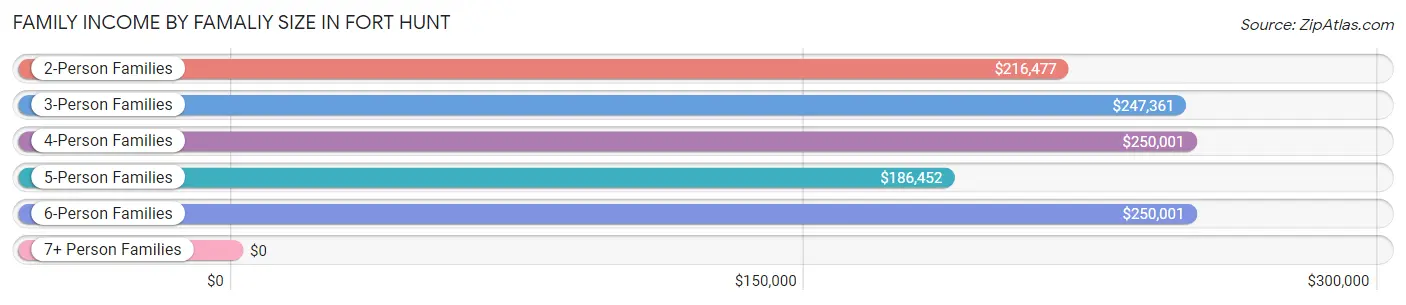
| Income Bracket | # Families | Median Income |
| 2-Person Families | 2,039 (44.1%) | $216,477 |
| 3-Person Families | 1,015 (22.0%) | $247,361 |
| 4-Person Families | 1,147 (24.8%) | $250,001 |
| 5-Person Families | 384 (8.3%) | $186,452 |
| 6-Person Families | 22 (0.5%) | $250,001 |
| 7+ Person Families | 14 (0.3%) | $0 |
| Total | 4,621 (100.0%) | $234,343 |
Family Income by Number of Earners in Fort Hunt
The median family income in Fort Hunt is $234,343, with families comprising 2 earners (2,450) having the highest median family income of $250,001, while families with no earners (608) have the lowest median family income of $164,500, accounting for 53.0% and 13.2% of families, respectively.
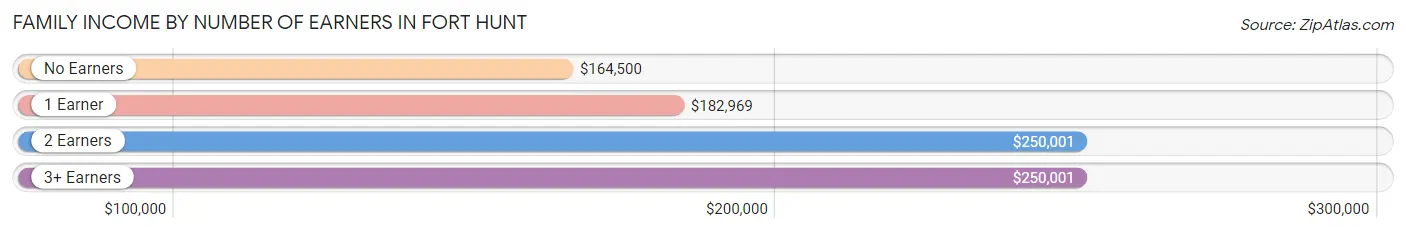
| Number of Earners | # Families | Median Income |
| No Earners | 608 (13.2%) | $164,500 |
| 1 Earner | 1,177 (25.5%) | $182,969 |
| 2 Earners | 2,450 (53.0%) | $250,001 |
| 3+ Earners | 386 (8.4%) | $250,001 |
| Total | 4,621 (100.0%) | $234,343 |
Household Income in Fort Hunt
Household Income Brackets in Fort Hunt
With 3,125 households falling in the category, the $200,000+ income range is the most frequent in Fort Hunt, accounting for 53.2% of all households. In contrast, only 41 households (0.7%) fall into the $10,000 to $14,999 income bracket, making it the least populous group.
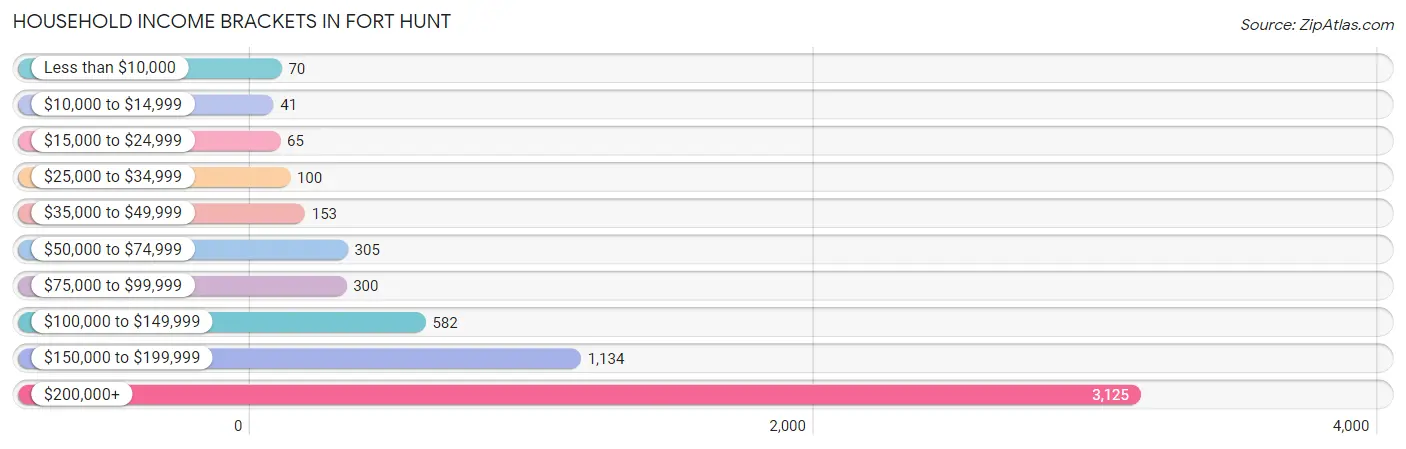
| Income Bracket | # Households | % Households |
| Less than $10,000 | 70 | 1.2% |
| $10,000 to $14,999 | 41 | 0.7% |
| $15,000 to $24,999 | 65 | 1.1% |
| $25,000 to $34,999 | 100 | 1.7% |
| $35,000 to $49,999 | 153 | 2.6% |
| $50,000 to $74,999 | 305 | 5.2% |
| $75,000 to $99,999 | 300 | 5.1% |
| $100,000 to $149,999 | 582 | 9.9% |
| $150,000 to $199,999 | 1,134 | 19.3% |
| $200,000+ | 3,125 | 53.2% |
Household Income by Householder Age in Fort Hunt
The median household income in Fort Hunt is $209,135, with the highest median household income of $250,001 found in the 45 to 64 years age bracket for the primary householder. A total of 2,545 households (43.3%) fall into this category.
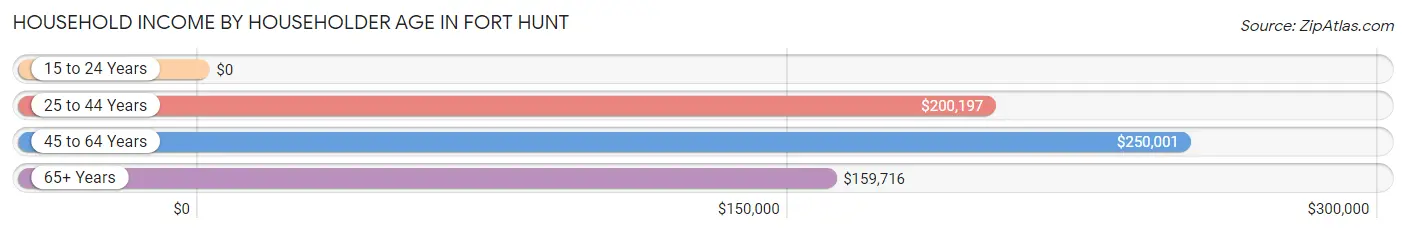
| Income Bracket | # Households | Median Income |
| 15 to 24 Years | 0 (0.0%) | $0 |
| 25 to 44 Years | 1,311 (22.3%) | $200,197 |
| 45 to 64 Years | 2,545 (43.3%) | $250,001 |
| 65+ Years | 2,018 (34.4%) | $159,716 |
| Total | 5,874 (100.0%) | $209,135 |
Poverty in Fort Hunt
Income Below Poverty by Sex and Age in Fort Hunt
With 1.8% poverty level for males and 1.7% for females among the residents of Fort Hunt, 75 year old and over males and 18 to 24 year old females are the most vulnerable to poverty, with 45 males (6.8%) and 24 females (6.9%) in their respective age groups living below the poverty level.
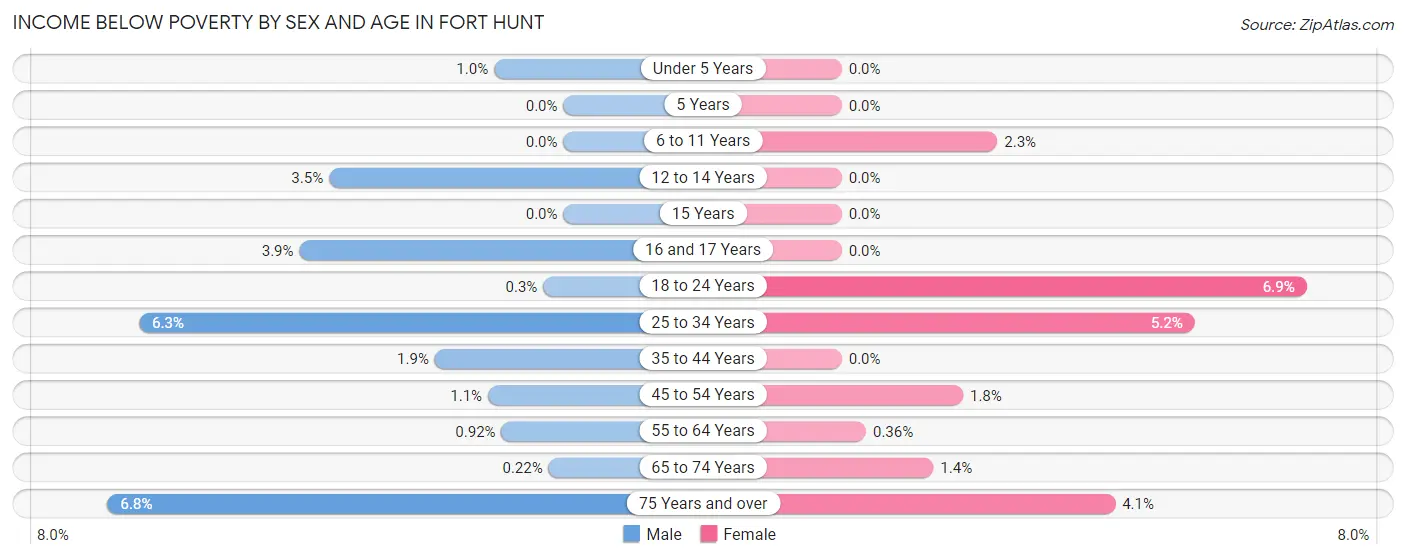
| Age Bracket | Male | Female |
| Under 5 Years | 5 (1.0%) | 0 (0.0%) |
| 5 Years | 0 (0.0%) | 0 (0.0%) |
| 6 to 11 Years | 0 (0.0%) | 17 (2.3%) |
| 12 to 14 Years | 13 (3.5%) | 0 (0.0%) |
| 15 Years | 0 (0.0%) | 0 (0.0%) |
| 16 and 17 Years | 10 (3.9%) | 0 (0.0%) |
| 18 to 24 Years | 1 (0.3%) | 24 (6.9%) |
| 25 to 34 Years | 25 (6.3%) | 27 (5.2%) |
| 35 to 44 Years | 18 (1.9%) | 0 (0.0%) |
| 45 to 54 Years | 16 (1.1%) | 23 (1.8%) |
| 55 to 64 Years | 10 (0.9%) | 4 (0.4%) |
| 65 to 74 Years | 2 (0.2%) | 13 (1.4%) |
| 75 Years and over | 45 (6.8%) | 29 (4.1%) |
| Total | 145 (1.8%) | 137 (1.7%) |
Income Above Poverty by Sex and Age in Fort Hunt
According to the poverty statistics in Fort Hunt, males aged 5 years and females aged under 5 years are the age groups that are most secure financially, with 100.0% of males and 100.0% of females in these age groups living above the poverty line.
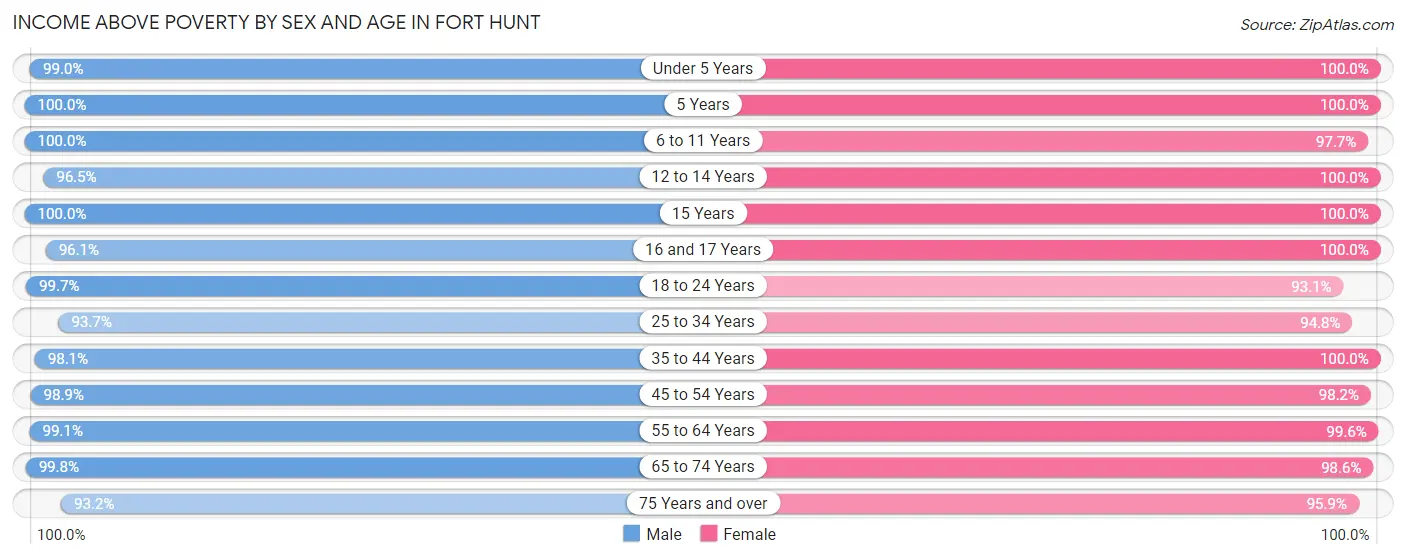
| Age Bracket | Male | Female |
| Under 5 Years | 482 (99.0%) | 508 (100.0%) |
| 5 Years | 92 (100.0%) | 86 (100.0%) |
| 6 to 11 Years | 795 (100.0%) | 719 (97.7%) |
| 12 to 14 Years | 361 (96.5%) | 312 (100.0%) |
| 15 Years | 94 (100.0%) | 93 (100.0%) |
| 16 and 17 Years | 245 (96.1%) | 244 (100.0%) |
| 18 to 24 Years | 328 (99.7%) | 324 (93.1%) |
| 25 to 34 Years | 372 (93.7%) | 488 (94.8%) |
| 35 to 44 Years | 923 (98.1%) | 1,136 (100.0%) |
| 45 to 54 Years | 1,416 (98.9%) | 1,255 (98.2%) |
| 55 to 64 Years | 1,072 (99.1%) | 1,104 (99.6%) |
| 65 to 74 Years | 916 (99.8%) | 940 (98.6%) |
| 75 Years and over | 620 (93.2%) | 686 (95.9%) |
| Total | 7,716 (98.2%) | 7,895 (98.3%) |
Income Below Poverty Among Married-Couple Families in Fort Hunt
The poverty statistics for married-couple families in Fort Hunt show that 1.0% or 41 of the total 4,266 families live below the poverty line. Families with 1 or 2 children have the highest poverty rate of 1.5%, comprising of 25 families. On the other hand, families with 3 or 4 children have the lowest poverty rate of 0.0%, which includes 0 families.
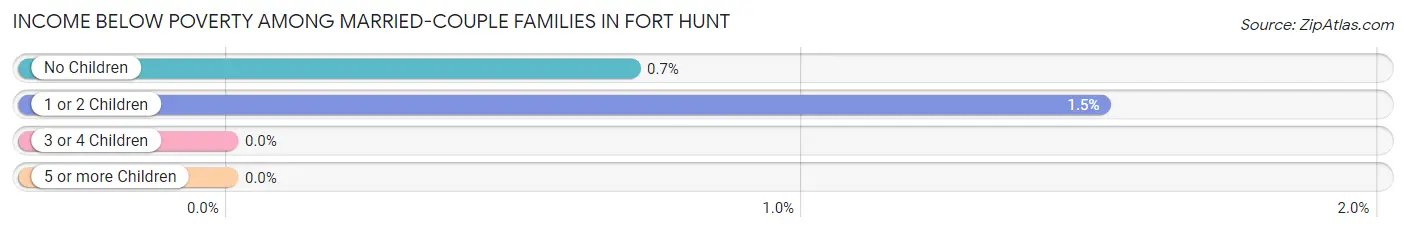
| Children | Above Poverty | Below Poverty |
| No Children | 2,255 (99.3%) | 16 (0.7%) |
| 1 or 2 Children | 1,625 (98.5%) | 25 (1.5%) |
| 3 or 4 Children | 331 (100.0%) | 0 (0.0%) |
| 5 or more Children | 14 (100.0%) | 0 (0.0%) |
| Total | 4,225 (99.0%) | 41 (1.0%) |
Income Below Poverty Among Single-Parent Households in Fort Hunt
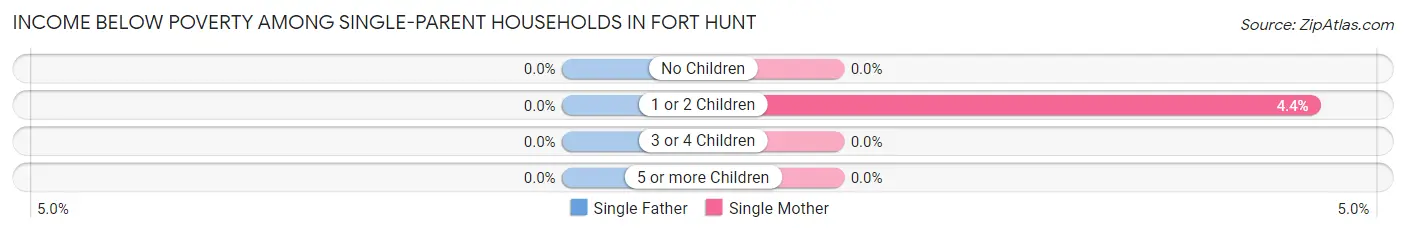
| Children | Single Father | Single Mother |
| No Children | 0 (0.0%) | 0 (0.0%) |
| 1 or 2 Children | 0 (0.0%) | 6 (4.4%) |
| 3 or 4 Children | 0 (0.0%) | 0 (0.0%) |
| 5 or more Children | 0 (0.0%) | 0 (0.0%) |
| Total | 0 (0.0%) | 6 (2.0%) |
Income Below Poverty Among Married-Couple vs Single-Parent Households in Fort Hunt
The poverty data for Fort Hunt shows that 41 of the married-couple family households (1.0%) and 6 of the single-parent households (1.7%) are living below the poverty level. Within the married-couple family households, those with 1 or 2 children have the highest poverty rate, with 25 households (1.5%) falling below the poverty line. Among the single-parent households, those with 1 or 2 children have the highest poverty rate, with 6 household (4.2%) living below poverty.
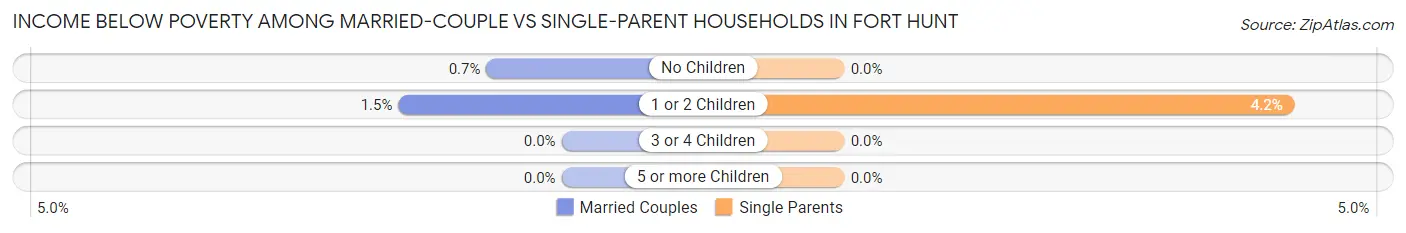
| Children | Married-Couple Families | Single-Parent Households |
| No Children | 16 (0.7%) | 0 (0.0%) |
| 1 or 2 Children | 25 (1.5%) | 6 (4.2%) |
| 3 or 4 Children | 0 (0.0%) | 0 (0.0%) |
| 5 or more Children | 0 (0.0%) | 0 (0.0%) |
| Total | 41 (1.0%) | 6 (1.7%) |
Race in Fort Hunt
The most populous races in Fort Hunt are White / Caucasian (14,095 | 88.0%), Hispanic or Latino (851 | 5.3%), and Two or more Races (817 | 5.1%).
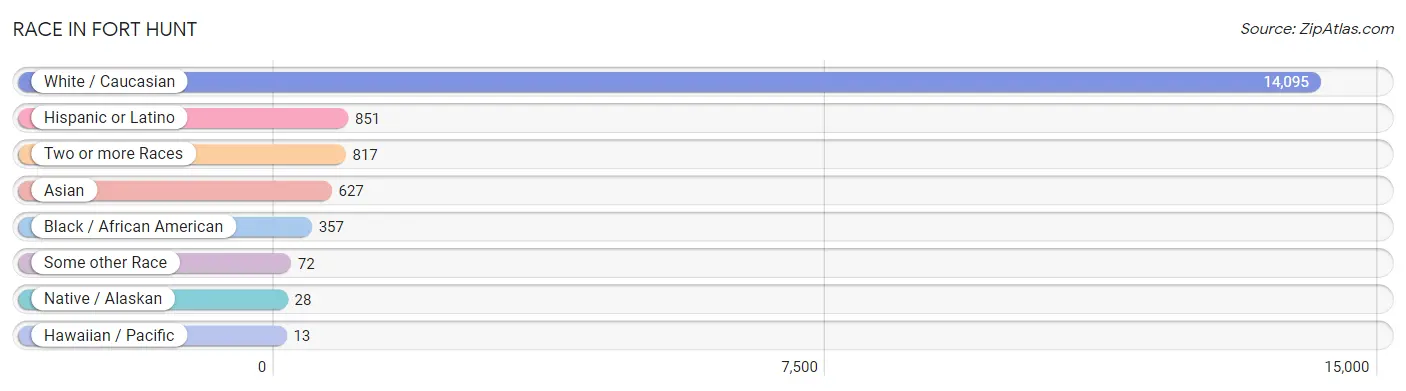
| Race | # Population | % Population |
| Asian | 627 | 3.9% |
| Black / African American | 357 | 2.2% |
| Hawaiian / Pacific | 13 | 0.1% |
| Hispanic or Latino | 851 | 5.3% |
| Native / Alaskan | 28 | 0.2% |
| White / Caucasian | 14,095 | 88.0% |
| Two or more Races | 817 | 5.1% |
| Some other Race | 72 | 0.4% |
| Total | 16,009 | 100.0% |
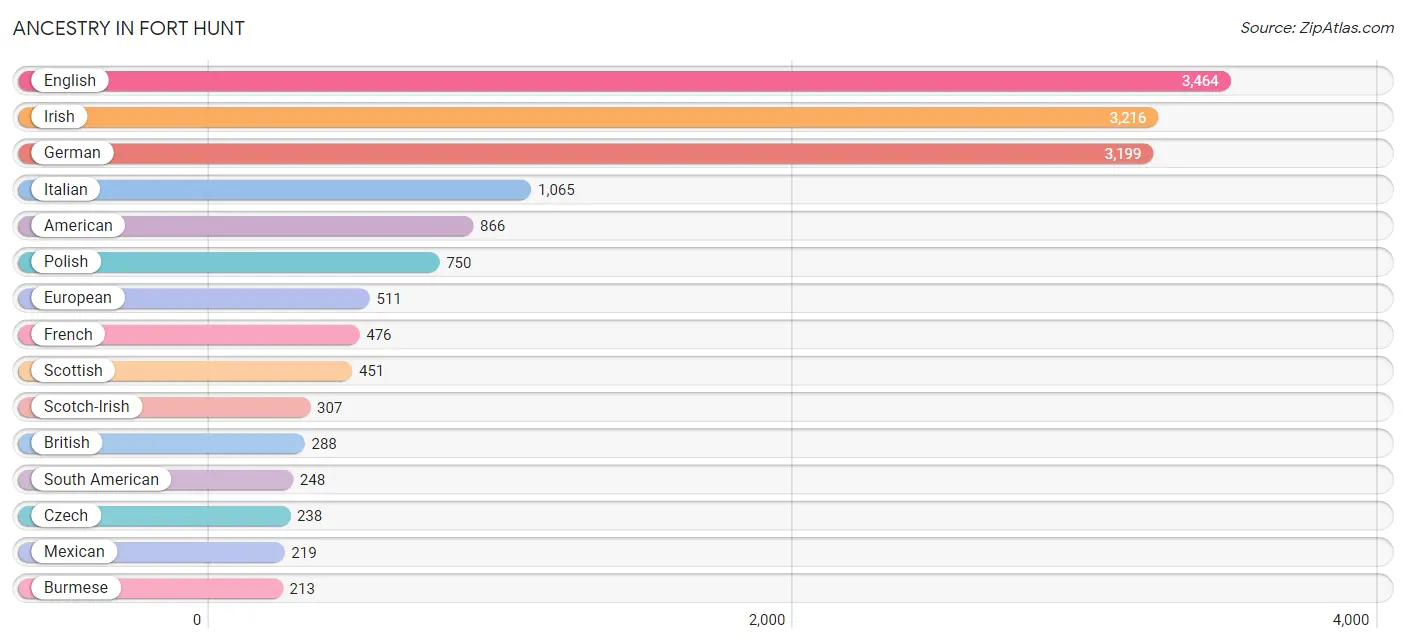
Ancestry in Fort Hunt
The most populous ancestries reported in Fort Hunt are English (3,464 | 21.6%), Irish (3,216 | 20.1%), German (3,199 | 20.0%), Italian (1,065 | 6.7%), and American (866 | 5.4%), together accounting for 73.8% of all Fort Hunt residents.
| Ancestry | # Population | % Population |
| African | 11 | 0.1% |
| Albanian | 123 | 0.8% |
| American | 866 | 5.4% |
| Arab | 145 | 0.9% |
| Armenian | 20 | 0.1% |
| Austrian | 39 | 0.2% |
| Basque | 24 | 0.2% |
| Belgian | 27 | 0.2% |
| Bhutanese | 96 | 0.6% |
| Bolivian | 36 | 0.2% |
| Brazilian | 28 | 0.2% |
| British | 288 | 1.8% |
| Burmese | 213 | 1.3% |
| Cajun | 39 | 0.2% |
| Canadian | 84 | 0.5% |
| Central American | 29 | 0.2% |
| Central American Indian | 31 | 0.2% |
| Cherokee | 38 | 0.2% |
| Chilean | 43 | 0.3% |
| Choctaw | 22 | 0.1% |
| Colombian | 42 | 0.3% |
| Croatian | 19 | 0.1% |
| Cuban | 47 | 0.3% |
| Cypriot | 8 | 0.1% |
| Czech | 238 | 1.5% |
| Czechoslovakian | 55 | 0.3% |
| Danish | 124 | 0.8% |
| Dutch | 133 | 0.8% |
| Eastern European | 53 | 0.3% |
| Ecuadorian | 40 | 0.3% |
| Egyptian | 9 | 0.1% |
| English | 3,464 | 21.6% |
| European | 511 | 3.2% |
| Filipino | 16 | 0.1% |
| Finnish | 66 | 0.4% |
| French | 476 | 3.0% |
| French American Indian | 9 | 0.1% |
| French Canadian | 50 | 0.3% |
| German | 3,199 | 20.0% |
| Greek | 64 | 0.4% |
| Honduran | 1 | 0.0% |
| Hungarian | 183 | 1.1% |
| Indian (Asian) | 147 | 0.9% |
| Iranian | 101 | 0.6% |
| Irish | 3,216 | 20.1% |
| Italian | 1,065 | 6.7% |
| Korean | 144 | 0.9% |
| Lebanese | 84 | 0.5% |
| Lithuanian | 13 | 0.1% |
| Mexican | 219 | 1.4% |
| Native Hawaiian | 25 | 0.2% |
| Northern European | 154 | 1.0% |
| Norwegian | 179 | 1.1% |
| Pakistani | 60 | 0.4% |
| Peruvian | 78 | 0.5% |
| Polish | 750 | 4.7% |
| Portuguese | 53 | 0.3% |
| Puerto Rican | 105 | 0.7% |
| Romanian | 35 | 0.2% |
| Russian | 157 | 1.0% |
| Salvadoran | 28 | 0.2% |
| Scandinavian | 44 | 0.3% |
| Scotch-Irish | 307 | 1.9% |
| Scottish | 451 | 2.8% |
| Serbian | 9 | 0.1% |
| Slavic | 54 | 0.3% |
| Slovak | 64 | 0.4% |
| Slovene | 10 | 0.1% |
| South American | 248 | 1.5% |
| Spaniard | 138 | 0.9% |
| Spanish | 38 | 0.2% |
| Sri Lankan | 56 | 0.4% |
| Subsaharan African | 11 | 0.1% |
| Swedish | 178 | 1.1% |
| Swiss | 63 | 0.4% |
| Thai | 129 | 0.8% |
| Turkish | 9 | 0.1% |
| Ukrainian | 76 | 0.5% |
| Venezuelan | 9 | 0.1% |
| Welsh | 188 | 1.2% | View All 80 Rows |
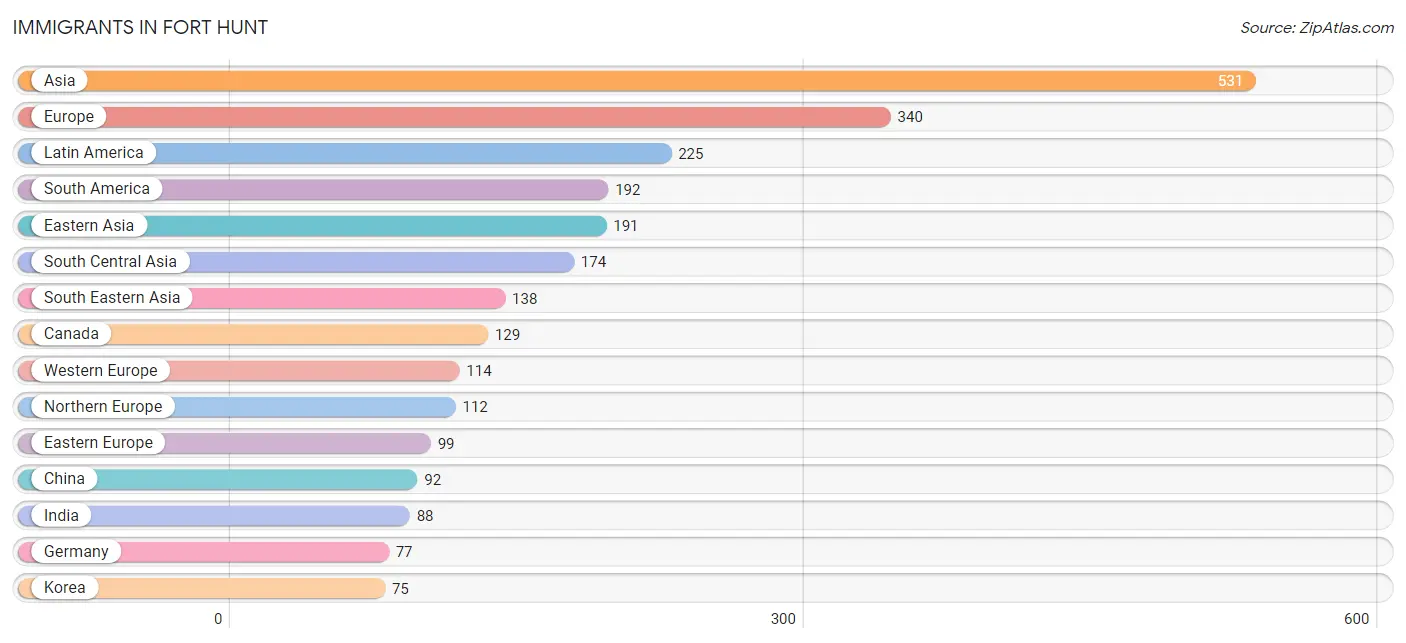
Immigrants in Fort Hunt
The most numerous immigrant groups reported in Fort Hunt came from Asia (531 | 3.3%), Europe (340 | 2.1%), Latin America (225 | 1.4%), South America (192 | 1.2%), and Eastern Asia (191 | 1.2%), together accounting for 9.2% of all Fort Hunt residents.
| Immigration Origin | # Population | % Population |
| Africa | 53 | 0.3% |
| Albania | 61 | 0.4% |
| Asia | 531 | 3.3% |
| Belgium | 11 | 0.1% |
| Bolivia | 8 | 0.1% |
| Brazil | 11 | 0.1% |
| Bulgaria | 10 | 0.1% |
| Canada | 129 | 0.8% |
| Caribbean | 12 | 0.1% |
| Central America | 21 | 0.1% |
| Chile | 43 | 0.3% |
| China | 92 | 0.6% |
| Colombia | 35 | 0.2% |
| Cuba | 10 | 0.1% |
| Czechoslovakia | 8 | 0.1% |
| Denmark | 24 | 0.2% |
| Eastern Africa | 6 | 0.0% |
| Eastern Asia | 191 | 1.2% |
| Eastern Europe | 99 | 0.6% |
| Ecuador | 30 | 0.2% |
| England | 17 | 0.1% |
| Ethiopia | 6 | 0.0% |
| Europe | 340 | 2.1% |
| France | 18 | 0.1% |
| Germany | 77 | 0.5% |
| Ghana | 36 | 0.2% |
| Honduras | 1 | 0.0% |
| Hungary | 12 | 0.1% |
| India | 88 | 0.5% |
| Iran | 65 | 0.4% |
| Jamaica | 2 | 0.0% |
| Japan | 24 | 0.2% |
| Korea | 75 | 0.5% |
| Latin America | 225 | 1.4% |
| Mexico | 20 | 0.1% |
| Nepal | 4 | 0.0% |
| Netherlands | 8 | 0.1% |
| Northern Africa | 11 | 0.1% |
| Northern Europe | 112 | 0.7% |
| Pakistan | 17 | 0.1% |
| Peru | 56 | 0.4% |
| Philippines | 71 | 0.4% |
| Scotland | 12 | 0.1% |
| Singapore | 4 | 0.0% |
| South America | 192 | 1.2% |
| South Central Asia | 174 | 1.1% |
| South Eastern Asia | 138 | 0.9% |
| Southern Europe | 15 | 0.1% |
| Spain | 15 | 0.1% |
| Thailand | 41 | 0.3% |
| Turkey | 28 | 0.2% |
| Venezuela | 9 | 0.1% |
| Vietnam | 22 | 0.1% |
| Western Africa | 36 | 0.2% |
| Western Asia | 28 | 0.2% |
| Western Europe | 114 | 0.7% | View All 56 Rows |
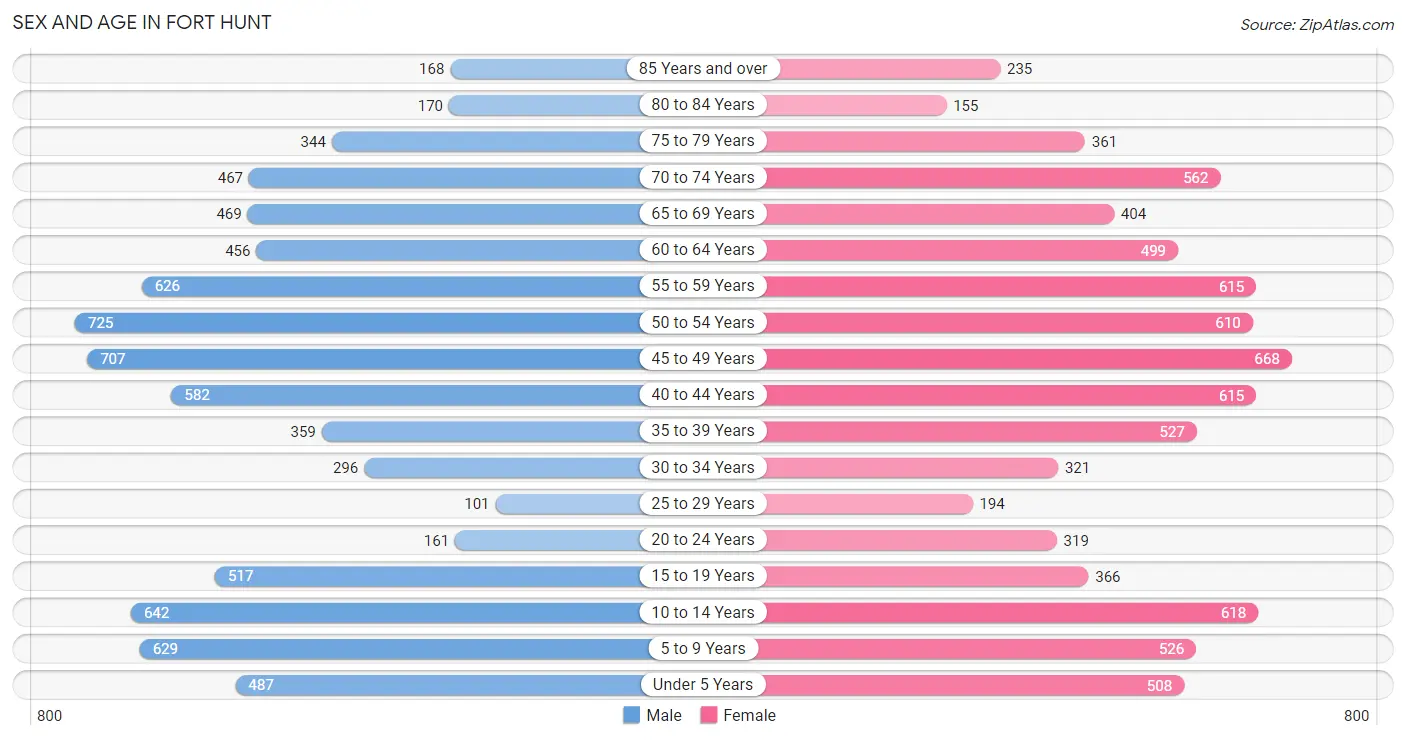
Sex and Age in Fort Hunt
Sex and Age in Fort Hunt
The most populous age groups in Fort Hunt are 50 to 54 Years (725 | 9.2%) for men and 45 to 49 Years (668 | 8.2%) for women.
| Age Bracket | Male | Female |
| Under 5 Years | 487 (6.2%) | 508 (6.3%) |
| 5 to 9 Years | 629 (8.0%) | 526 (6.5%) |
| 10 to 14 Years | 642 (8.1%) | 618 (7.6%) |
| 15 to 19 Years | 517 (6.5%) | 366 (4.5%) |
| 20 to 24 Years | 161 (2.0%) | 319 (3.9%) |
| 25 to 29 Years | 101 (1.3%) | 194 (2.4%) |
| 30 to 34 Years | 296 (3.7%) | 321 (4.0%) |
| 35 to 39 Years | 359 (4.5%) | 527 (6.5%) |
| 40 to 44 Years | 582 (7.4%) | 615 (7.6%) |
| 45 to 49 Years | 707 (8.9%) | 668 (8.2%) |
| 50 to 54 Years | 725 (9.2%) | 610 (7.5%) |
| 55 to 59 Years | 626 (7.9%) | 615 (7.6%) |
| 60 to 64 Years | 456 (5.8%) | 499 (6.2%) |
| 65 to 69 Years | 469 (5.9%) | 404 (5.0%) |
| 70 to 74 Years | 467 (5.9%) | 562 (6.9%) |
| 75 to 79 Years | 344 (4.3%) | 361 (4.5%) |
| 80 to 84 Years | 170 (2.1%) | 155 (1.9%) |
| 85 Years and over | 168 (2.1%) | 235 (2.9%) |
| Total | 7,906 (100.0%) | 8,103 (100.0%) |
Families and Households in Fort Hunt
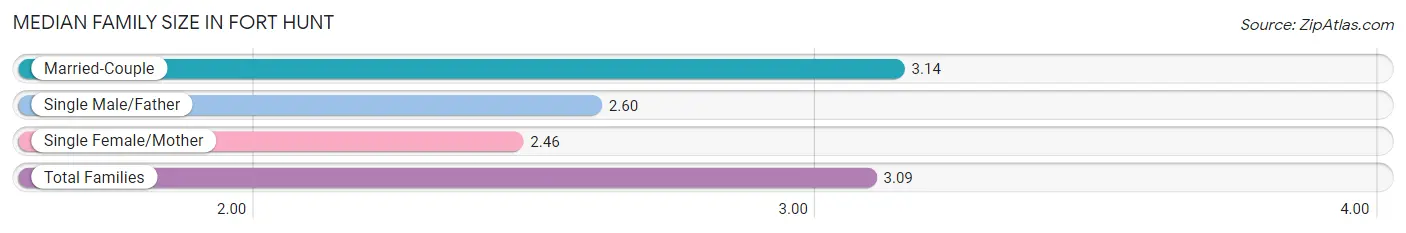
Median Family Size in Fort Hunt
The median family size in Fort Hunt is 3.09 persons per family, with married-couple families (4,266 | 92.3%) accounting for the largest median family size of 3.14 persons per family. On the other hand, single female/mother families (295 | 6.4%) represent the smallest median family size with 2.46 persons per family.
| Family Type | # Families | Family Size |
| Married-Couple | 4,266 (92.3%) | 3.14 |
| Single Male/Father | 60 (1.3%) | 2.60 |
| Single Female/Mother | 295 (6.4%) | 2.46 |
| Total Families | 4,621 (100.0%) | 3.09 |
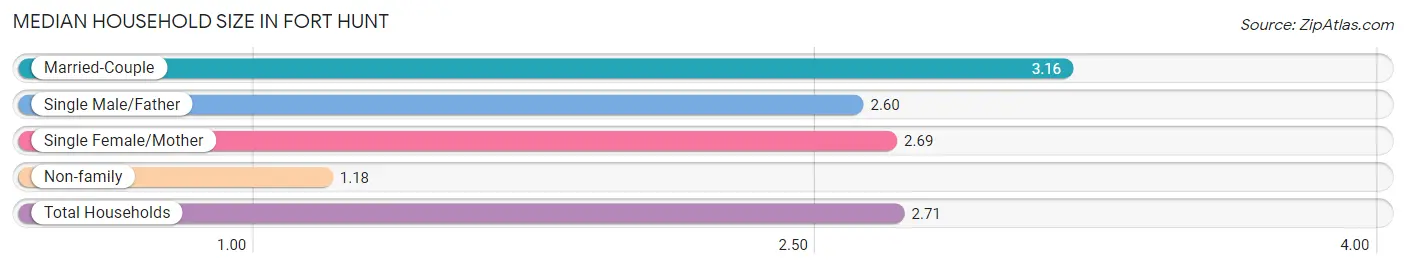
Median Household Size in Fort Hunt
The median household size in Fort Hunt is 2.71 persons per household, with married-couple households (4,266 | 72.6%) accounting for the largest median household size of 3.16 persons per household. non-family households (1,253 | 21.3%) represent the smallest median household size with 1.18 persons per household.
| Household Type | # Households | Household Size |
| Married-Couple | 4,266 (72.6%) | 3.16 |
| Single Male/Father | 60 (1.0%) | 2.60 |
| Single Female/Mother | 295 (5.0%) | 2.69 |
| Non-family | 1,253 (21.3%) | 1.18 |
| Total Households | 5,874 (100.0%) | 2.71 |
Household Size by Marriage Status in Fort Hunt
Out of a total of 5,874 households in Fort Hunt, 4,621 (78.7%) are family households, while 1,253 (21.3%) are nonfamily households. The most numerous type of family households are 2-person households, comprising 2,013, and the most common type of nonfamily households are 1-person households, comprising 1,074.
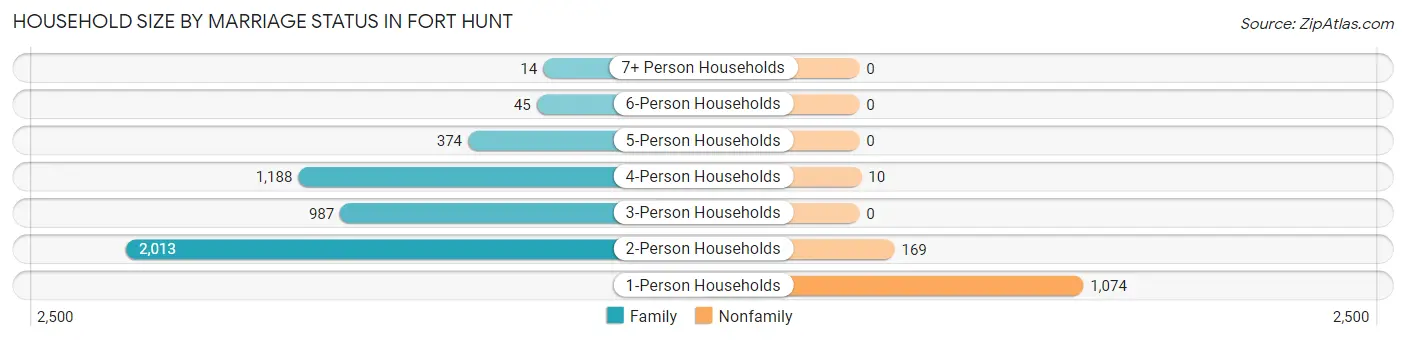
| Household Size | Family Households | Nonfamily Households |
| 1-Person Households | - | 1,074 (18.3%) |
| 2-Person Households | 2,013 (34.3%) | 169 (2.9%) |
| 3-Person Households | 987 (16.8%) | 0 (0.0%) |
| 4-Person Households | 1,188 (20.2%) | 10 (0.2%) |
| 5-Person Households | 374 (6.4%) | 0 (0.0%) |
| 6-Person Households | 45 (0.8%) | 0 (0.0%) |
| 7+ Person Households | 14 (0.2%) | 0 (0.0%) |
| Total | 4,621 (78.7%) | 1,253 (21.3%) |
Female Fertility in Fort Hunt
Fertility by Age in Fort Hunt
Average fertility rate in Fort Hunt is 45.0 births per 1,000 women. Women in the age bracket of 20 to 34 years have the highest fertility rate with 65.0 births per 1,000 women. Women in the age bracket of 35 to 50 years acount for 61.4% of all women with births.
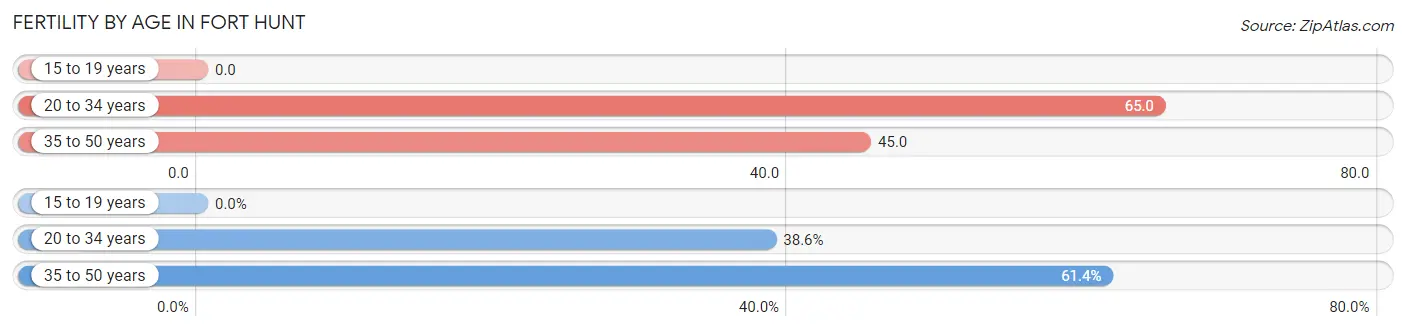
| Age Bracket | Women with Births | Births / 1,000 Women |
| 15 to 19 years | 0 (0.0%) | 0.0 |
| 20 to 34 years | 54 (38.6%) | 65.0 |
| 35 to 50 years | 86 (61.4%) | 45.0 |
| Total | 140 (100.0%) | 45.0 |
Fertility by Age by Marriage Status in Fort Hunt
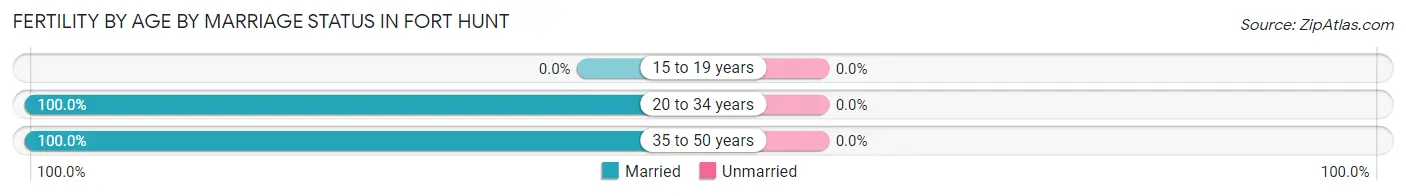
| Age Bracket | Married | Unmarried |
| 15 to 19 years | 0 (0.0%) | 0 (0.0%) |
| 20 to 34 years | 54 (100.0%) | 0 (0.0%) |
| 35 to 50 years | 86 (100.0%) | 0 (0.0%) |
| Total | 140 (100.0%) | 0 (0.0%) |
Fertility by Education in Fort Hunt
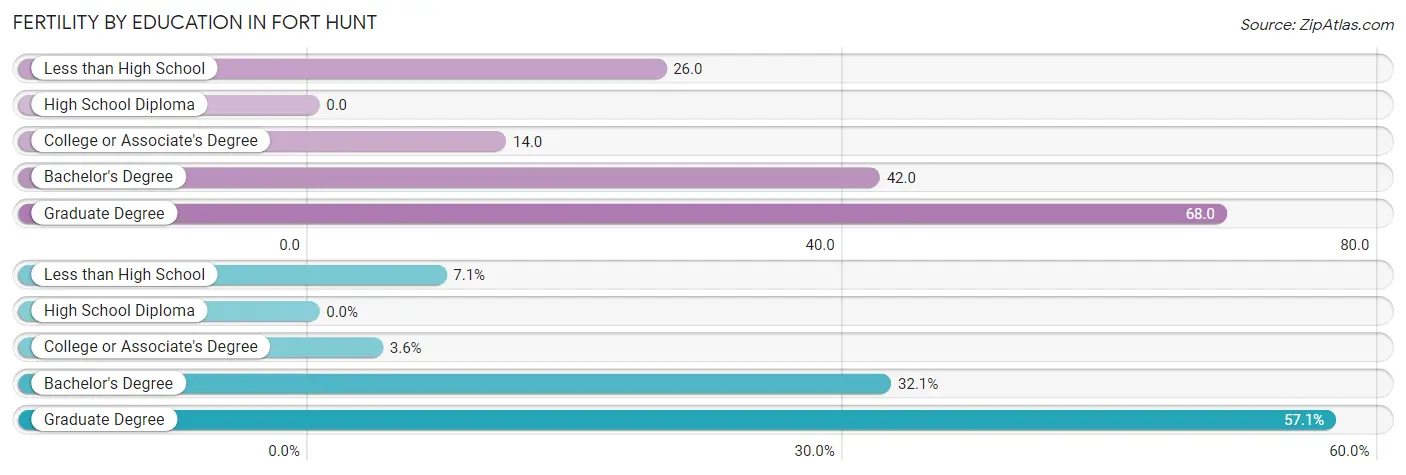
| Educational Attainment | Women with Births | Births / 1,000 Women |
| Less than High School | 10 (7.1%) | 26.0 |
| High School Diploma | 0 (0.0%) | 0.0 |
| College or Associate's Degree | 5 (3.6%) | 14.0 |
| Bachelor's Degree | 45 (32.1%) | 42.0 |
| Graduate Degree | 80 (57.1%) | 68.0 |
| Total | 140 (100.0%) | 45.0 |
Fertility by Education by Marriage Status in Fort Hunt
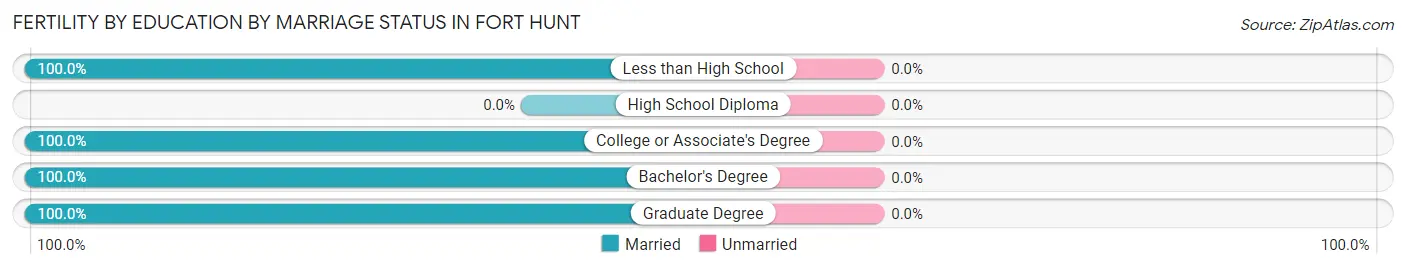
| Educational Attainment | Married | Unmarried |
| Less than High School | 10 (100.0%) | 0 (0.0%) |
| High School Diploma | 0 (0.0%) | 0 (0.0%) |
| College or Associate's Degree | 5 (100.0%) | 0 (0.0%) |
| Bachelor's Degree | 45 (100.0%) | 0 (0.0%) |
| Graduate Degree | 80 (100.0%) | 0 (0.0%) |
| Total | 140 (100.0%) | 0 (0.0%) |
Employment Characteristics in Fort Hunt
Employment by Class of Employer in Fort Hunt
Among the 7,730 employed individuals in Fort Hunt, private company employees (3,597 | 46.5%), federal government employees (2,017 | 26.1%), and not-for-profit organizations (741 | 9.6%) make up the most common classes of employment.
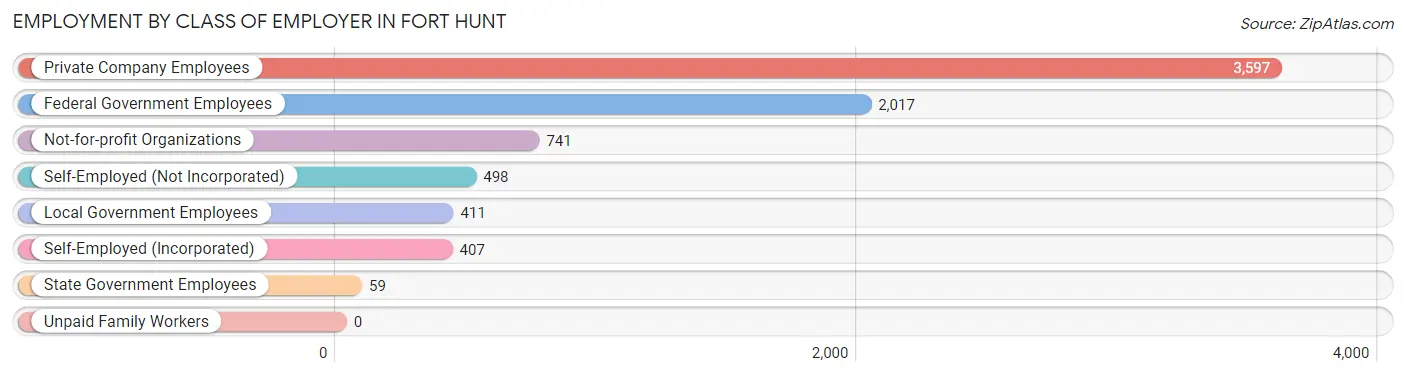
| Employer Class | # Employees | % Employees |
| Private Company Employees | 3,597 | 46.5% |
| Self-Employed (Incorporated) | 407 | 5.3% |
| Self-Employed (Not Incorporated) | 498 | 6.4% |
| Not-for-profit Organizations | 741 | 9.6% |
| Local Government Employees | 411 | 5.3% |
| State Government Employees | 59 | 0.8% |
| Federal Government Employees | 2,017 | 26.1% |
| Unpaid Family Workers | 0 | 0.0% |
| Total | 7,730 | 100.0% |
Employment Status by Age in Fort Hunt
According to the labor force statistics for Fort Hunt, out of the total population over 16 years of age (12,412), 64.1% or 7,956 individuals are in the labor force, with 1.7% or 135 of them unemployed. The age group with the highest labor force participation rate is 45 to 54 years, with 90.4% or 2,450 individuals in the labor force. Within the labor force, the 16 to 19 years age range has the highest percentage of unemployed individuals, with 12.2% or 19 of them being unemployed.
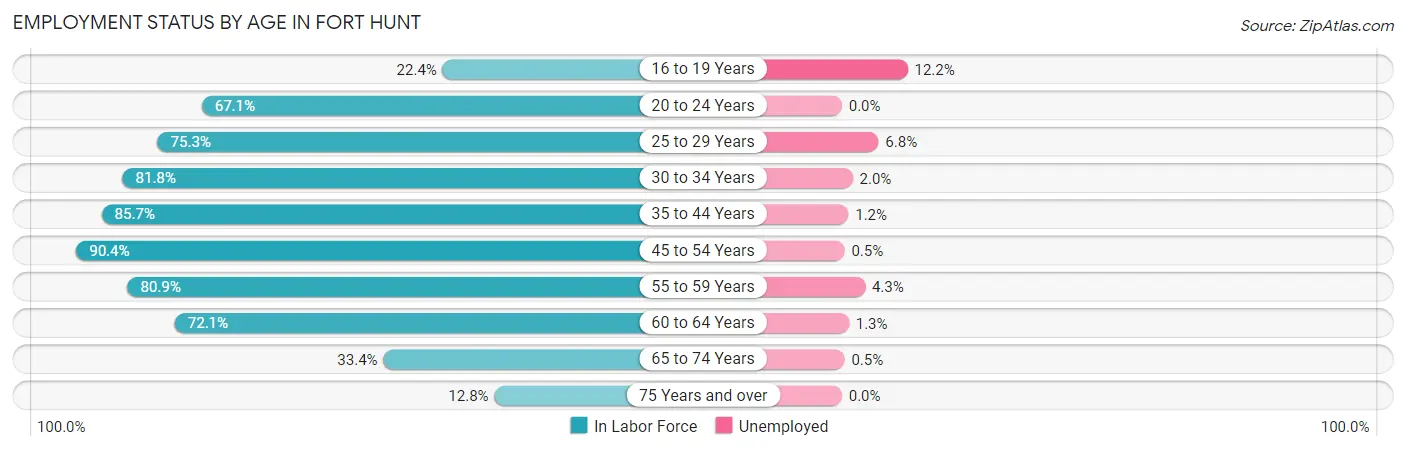
| Age Bracket | In Labor Force | Unemployed |
| 16 to 19 Years | 156 (22.4%) | 19 (12.2%) |
| 20 to 24 Years | 322 (67.1%) | 0 (0.0%) |
| 25 to 29 Years | 222 (75.3%) | 15 (6.8%) |
| 30 to 34 Years | 505 (81.8%) | 10 (2.0%) |
| 35 to 44 Years | 1,785 (85.7%) | 21 (1.2%) |
| 45 to 54 Years | 2,450 (90.4%) | 12 (0.5%) |
| 55 to 59 Years | 1,004 (80.9%) | 43 (4.3%) |
| 60 to 64 Years | 689 (72.1%) | 9 (1.3%) |
| 65 to 74 Years | 635 (33.4%) | 3 (0.5%) |
| 75 Years and over | 183 (12.8%) | 0 (0.0%) |
| Total | 7,956 (64.1%) | 135 (1.7%) |
Employment Status by Educational Attainment in Fort Hunt
According to labor force statistics for Fort Hunt, 84.2% of individuals (6,653) out of the total population between 25 and 64 years of age (7,901) are in the labor force, with 1.7% or 113 of them being unemployed. The group with the highest labor force participation rate are those with the educational attainment of bachelor's degree or higher, with 86.2% or 5,637 individuals in the labor force. Within the labor force, individuals with bachelor's degree or higher education have the highest percentage of unemployment, with 2.0% or 113 of them being unemployed.
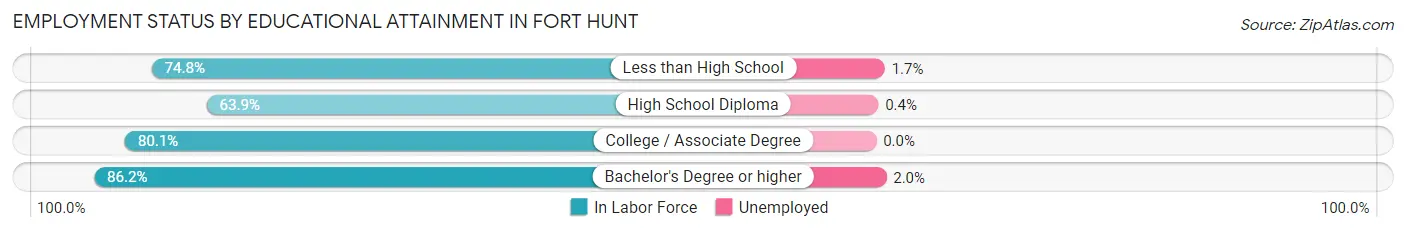
| Educational Attainment | In Labor Force | Unemployed |
| Less than High School | 116 (74.8%) | 3 (1.7%) |
| High School Diploma | 253 (63.9%) | 2 (0.4%) |
| College / Associate Degree | 649 (80.1%) | 0 (0.0%) |
| Bachelor's Degree or higher | 5,637 (86.2%) | 131 (2.0%) |
| Total | 6,653 (84.2%) | 134 (1.7%) |
Employment Occupations by Sex in Fort Hunt
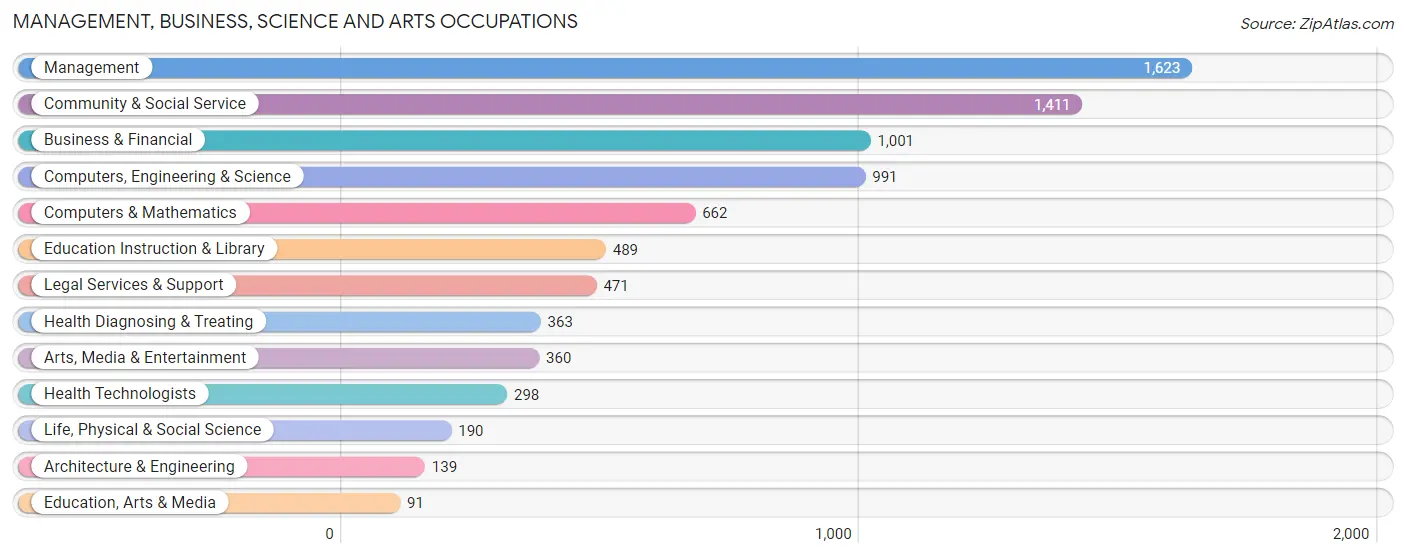
Management, Business, Science and Arts Occupations
The most common Management, Business, Science and Arts occupations in Fort Hunt are Management (1,623 | 21.7%), Community & Social Service (1,411 | 18.9%), Business & Financial (1,001 | 13.4%), Computers, Engineering & Science (991 | 13.3%), and Computers & Mathematics (662 | 8.9%).
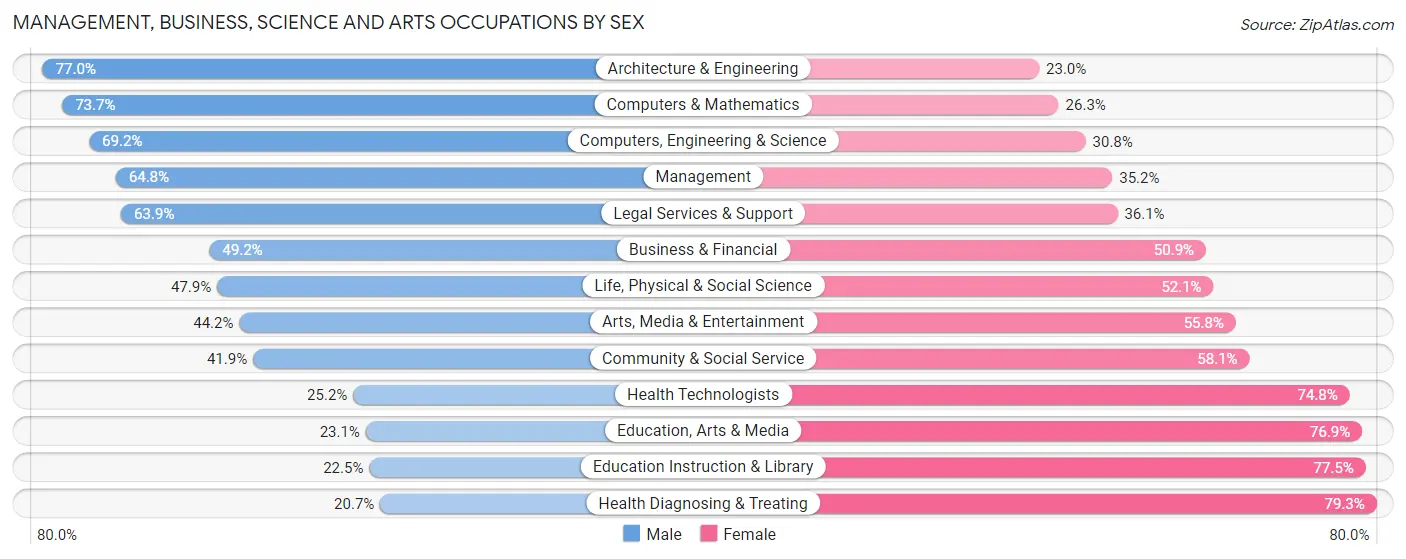
Management, Business, Science and Arts Occupations by Sex
Within the Management, Business, Science and Arts occupations in Fort Hunt, the most male-oriented occupations are Architecture & Engineering (77.0%), Computers & Mathematics (73.7%), and Computers, Engineering & Science (69.2%), while the most female-oriented occupations are Health Diagnosing & Treating (79.3%), Education Instruction & Library (77.5%), and Education, Arts & Media (76.9%).
| Occupation | Male | Female |
| Management | 1,051 (64.8%) | 572 (35.2%) |
| Business & Financial | 492 (49.1%) | 509 (50.8%) |
| Computers, Engineering & Science | 686 (69.2%) | 305 (30.8%) |
| Computers & Mathematics | 488 (73.7%) | 174 (26.3%) |
| Architecture & Engineering | 107 (77.0%) | 32 (23.0%) |
| Life, Physical & Social Science | 91 (47.9%) | 99 (52.1%) |
| Community & Social Service | 591 (41.9%) | 820 (58.1%) |
| Education, Arts & Media | 21 (23.1%) | 70 (76.9%) |
| Legal Services & Support | 301 (63.9%) | 170 (36.1%) |
| Education Instruction & Library | 110 (22.5%) | 379 (77.5%) |
| Arts, Media & Entertainment | 159 (44.2%) | 201 (55.8%) |
| Health Diagnosing & Treating | 75 (20.7%) | 288 (79.3%) |
| Health Technologists | 75 (25.2%) | 223 (74.8%) |
| Total (Category) | 2,895 (53.7%) | 2,494 (46.3%) |
| Total (Overall) | 3,946 (52.8%) | 3,520 (47.1%) |
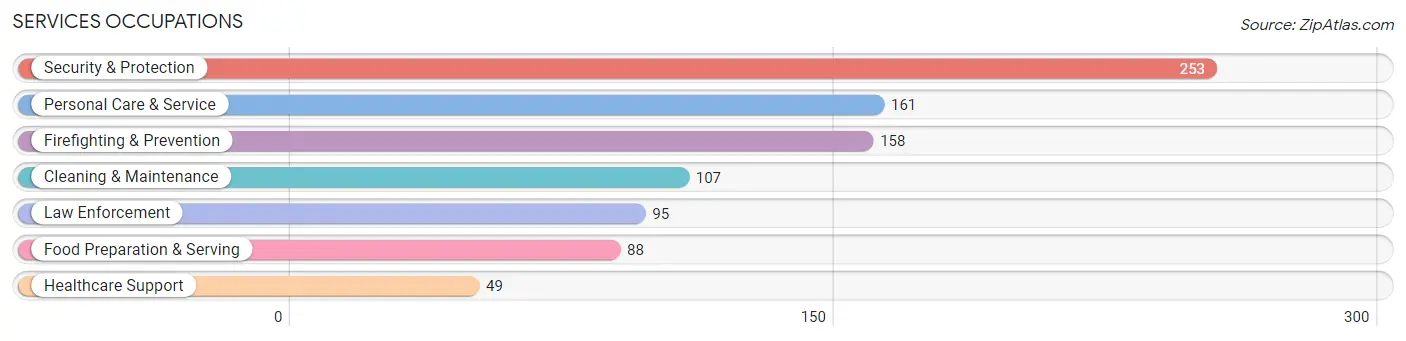
Services Occupations
The most common Services occupations in Fort Hunt are Security & Protection (253 | 3.4%), Personal Care & Service (161 | 2.2%), Firefighting & Prevention (158 | 2.1%), Cleaning & Maintenance (107 | 1.4%), and Law Enforcement (95 | 1.3%).
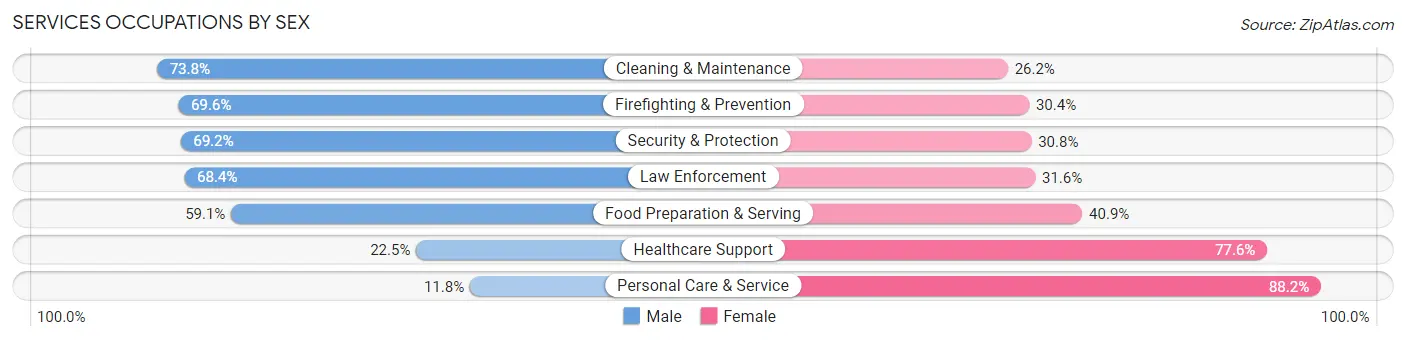
Services Occupations by Sex
Within the Services occupations in Fort Hunt, the most male-oriented occupations are Cleaning & Maintenance (73.8%), Firefighting & Prevention (69.6%), and Security & Protection (69.2%), while the most female-oriented occupations are Personal Care & Service (88.2%), Healthcare Support (77.5%), and Food Preparation & Serving (40.9%).
| Occupation | Male | Female |
| Healthcare Support | 11 (22.5%) | 38 (77.5%) |
| Security & Protection | 175 (69.2%) | 78 (30.8%) |
| Firefighting & Prevention | 110 (69.6%) | 48 (30.4%) |
| Law Enforcement | 65 (68.4%) | 30 (31.6%) |
| Food Preparation & Serving | 52 (59.1%) | 36 (40.9%) |
| Cleaning & Maintenance | 79 (73.8%) | 28 (26.2%) |
| Personal Care & Service | 19 (11.8%) | 142 (88.2%) |
| Total (Category) | 336 (51.1%) | 322 (48.9%) |
| Total (Overall) | 3,946 (52.8%) | 3,520 (47.1%) |
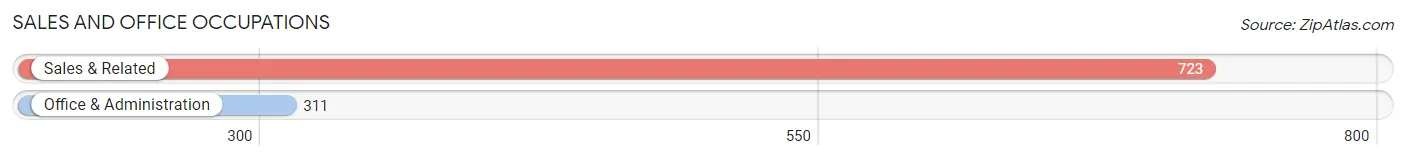
Sales and Office Occupations
The most common Sales and Office occupations in Fort Hunt are Sales & Related (723 | 9.7%), and Office & Administration (311 | 4.2%).
Sales and Office Occupations by Sex
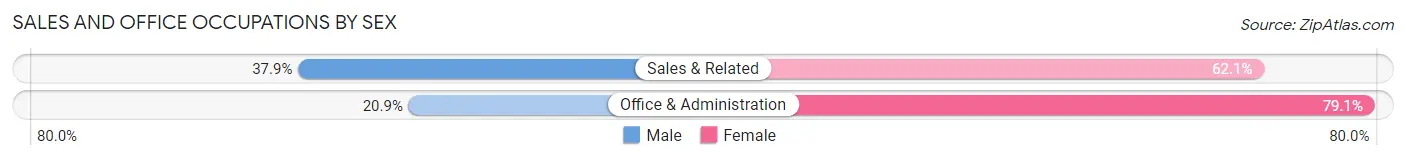
| Occupation | Male | Female |
| Sales & Related | 274 (37.9%) | 449 (62.1%) |
| Office & Administration | 65 (20.9%) | 246 (79.1%) |
| Total (Category) | 339 (32.8%) | 695 (67.2%) |
| Total (Overall) | 3,946 (52.8%) | 3,520 (47.1%) |
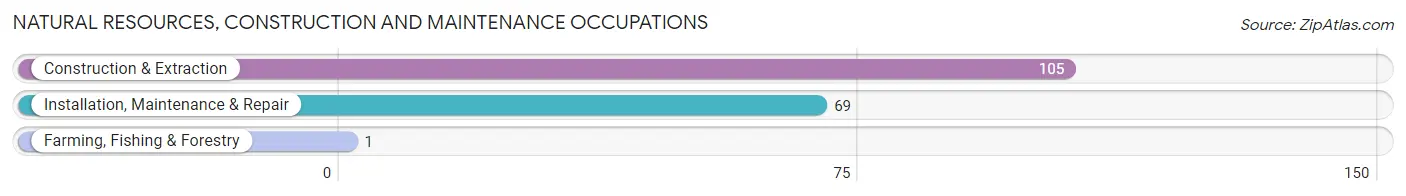
Natural Resources, Construction and Maintenance Occupations
The most common Natural Resources, Construction and Maintenance occupations in Fort Hunt are Construction & Extraction (105 | 1.4%), Installation, Maintenance & Repair (69 | 0.9%), and Farming, Fishing & Forestry (1 | 0.0%).
Natural Resources, Construction and Maintenance Occupations by Sex
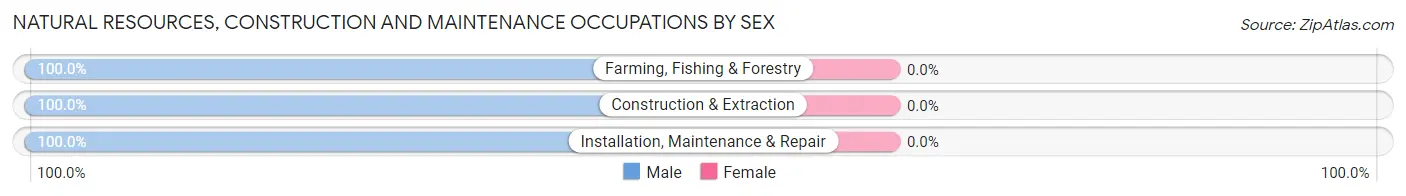
| Occupation | Male | Female |
| Farming, Fishing & Forestry | 1 (100.0%) | 0 (0.0%) |
| Construction & Extraction | 105 (100.0%) | 0 (0.0%) |
| Installation, Maintenance & Repair | 69 (100.0%) | 0 (0.0%) |
| Total (Category) | 175 (100.0%) | 0 (0.0%) |
| Total (Overall) | 3,946 (52.8%) | 3,520 (47.1%) |
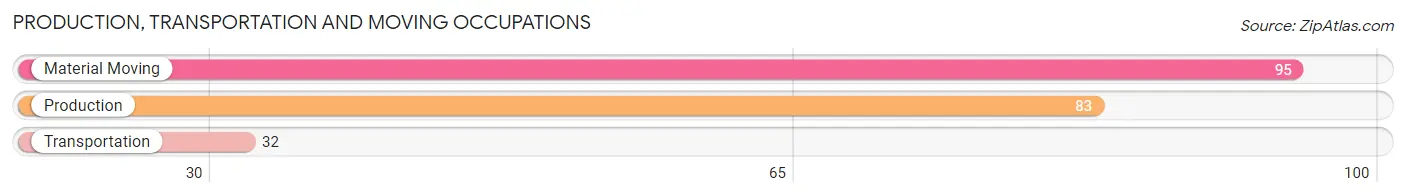
Production, Transportation and Moving Occupations
The most common Production, Transportation and Moving occupations in Fort Hunt are Material Moving (95 | 1.3%), Production (83 | 1.1%), and Transportation (32 | 0.4%).
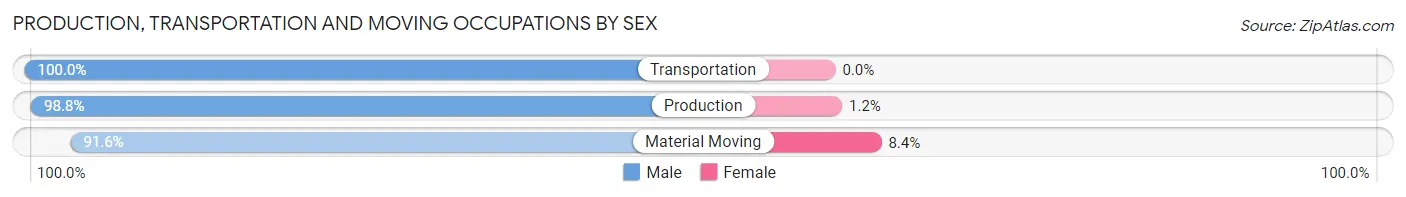
Production, Transportation and Moving Occupations by Sex
| Occupation | Male | Female |
| Production | 82 (98.8%) | 1 (1.2%) |
| Transportation | 32 (100.0%) | 0 (0.0%) |
| Material Moving | 87 (91.6%) | 8 (8.4%) |
| Total (Category) | 201 (95.7%) | 9 (4.3%) |
| Total (Overall) | 3,946 (52.8%) | 3,520 (47.1%) |
Employment Industries by Sex in Fort Hunt
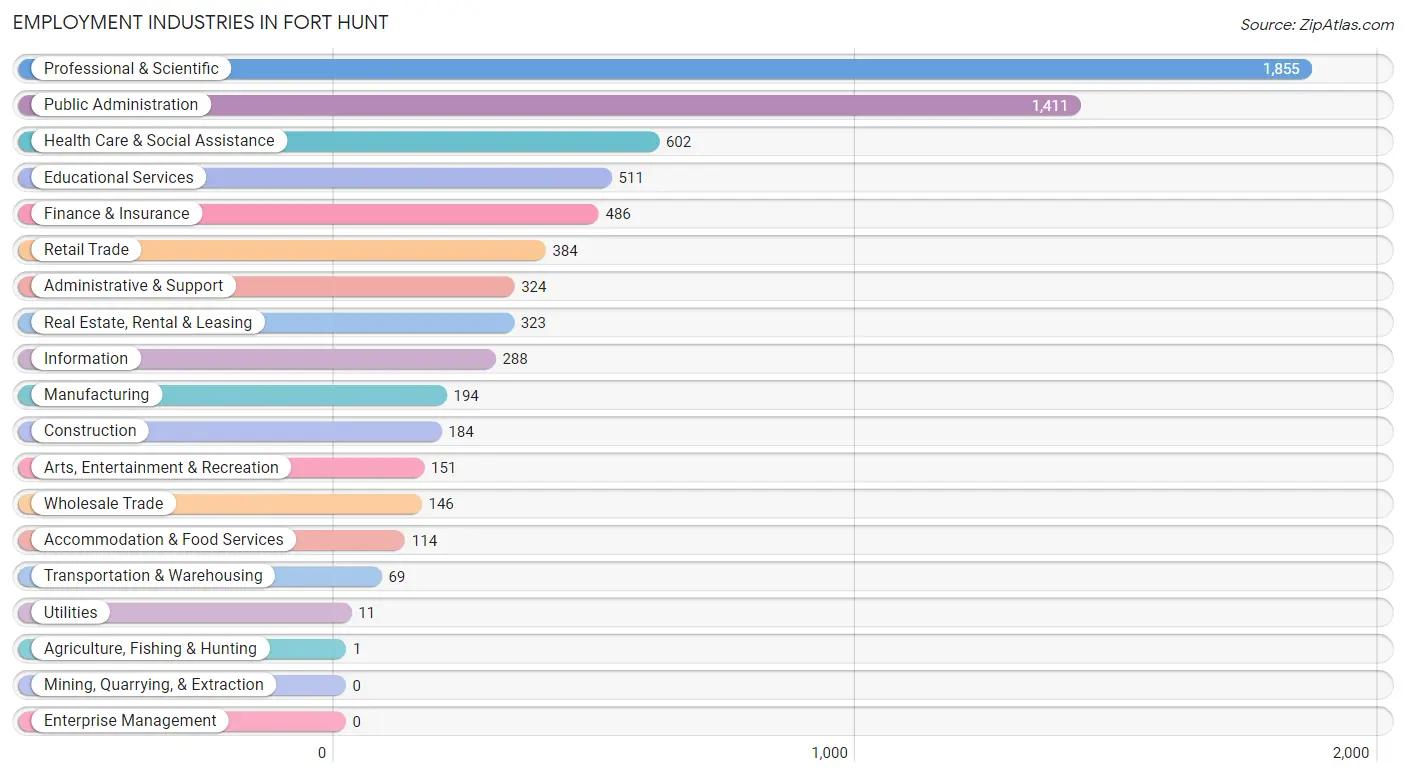
Employment Industries in Fort Hunt
The major employment industries in Fort Hunt include Professional & Scientific (1,855 | 24.8%), Public Administration (1,411 | 18.9%), Health Care & Social Assistance (602 | 8.1%), Educational Services (511 | 6.8%), and Finance & Insurance (486 | 6.5%).
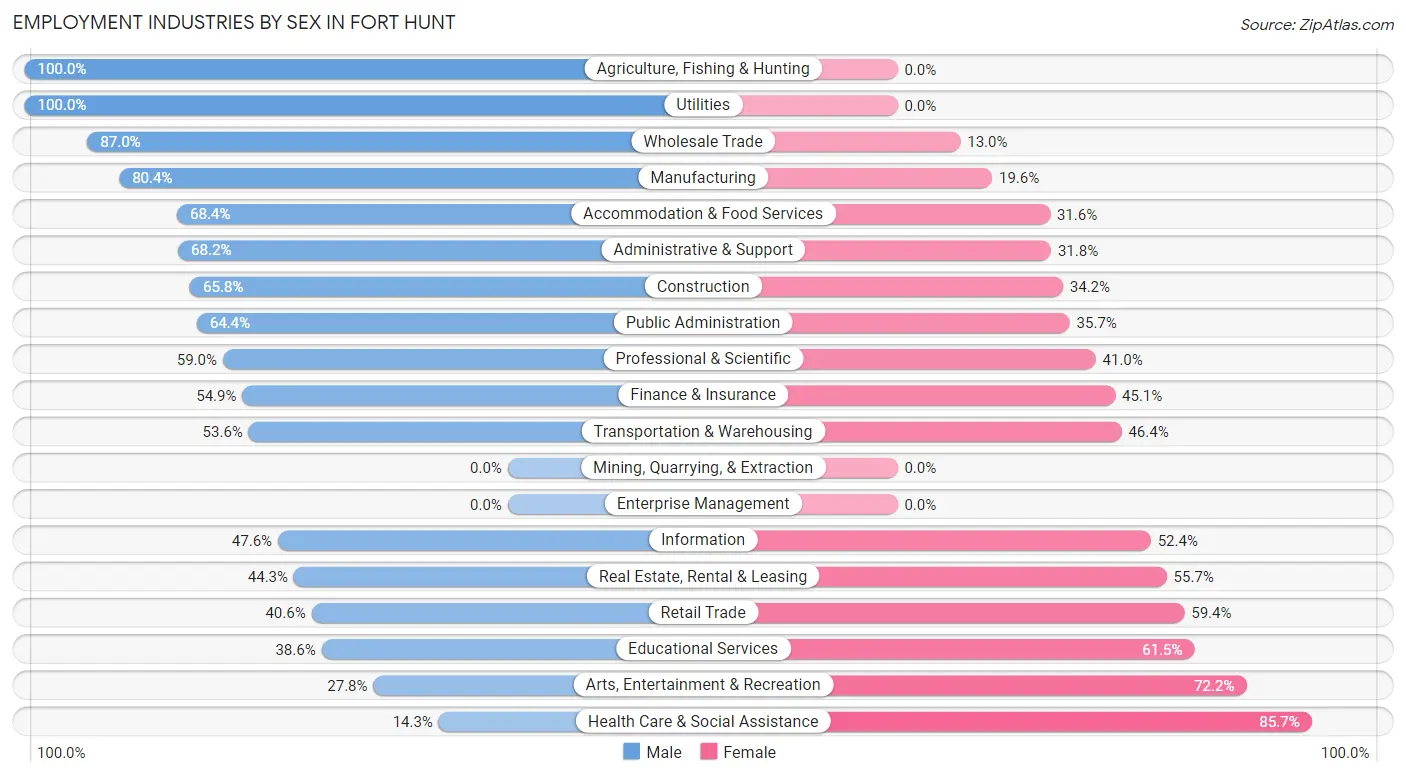
Employment Industries by Sex in Fort Hunt
The Fort Hunt industries that see more men than women are Agriculture, Fishing & Hunting (100.0%), Utilities (100.0%), and Wholesale Trade (87.0%), whereas the industries that tend to have a higher number of women are Health Care & Social Assistance (85.7%), Arts, Entertainment & Recreation (72.2%), and Educational Services (61.5%).
| Industry | Male | Female |
| Agriculture, Fishing & Hunting | 1 (100.0%) | 0 (0.0%) |
| Mining, Quarrying, & Extraction | 0 (0.0%) | 0 (0.0%) |
| Construction | 121 (65.8%) | 63 (34.2%) |
| Manufacturing | 156 (80.4%) | 38 (19.6%) |
| Wholesale Trade | 127 (87.0%) | 19 (13.0%) |
| Retail Trade | 156 (40.6%) | 228 (59.4%) |
| Transportation & Warehousing | 37 (53.6%) | 32 (46.4%) |
| Utilities | 11 (100.0%) | 0 (0.0%) |
| Information | 137 (47.6%) | 151 (52.4%) |
| Finance & Insurance | 267 (54.9%) | 219 (45.1%) |
| Real Estate, Rental & Leasing | 143 (44.3%) | 180 (55.7%) |
| Professional & Scientific | 1,094 (59.0%) | 761 (41.0%) |
| Enterprise Management | 0 (0.0%) | 0 (0.0%) |
| Administrative & Support | 221 (68.2%) | 103 (31.8%) |
| Educational Services | 197 (38.6%) | 314 (61.5%) |
| Health Care & Social Assistance | 86 (14.3%) | 516 (85.7%) |
| Arts, Entertainment & Recreation | 42 (27.8%) | 109 (72.2%) |
| Accommodation & Food Services | 78 (68.4%) | 36 (31.6%) |
| Public Administration | 908 (64.3%) | 503 (35.6%) |
| Total | 3,946 (52.8%) | 3,520 (47.1%) |
Education in Fort Hunt
School Enrollment in Fort Hunt
The most common levels of schooling among the 4,110 students in Fort Hunt are middle school (1,011 | 24.6%), elementary school (981 | 23.9%), and high school (853 | 20.7%).
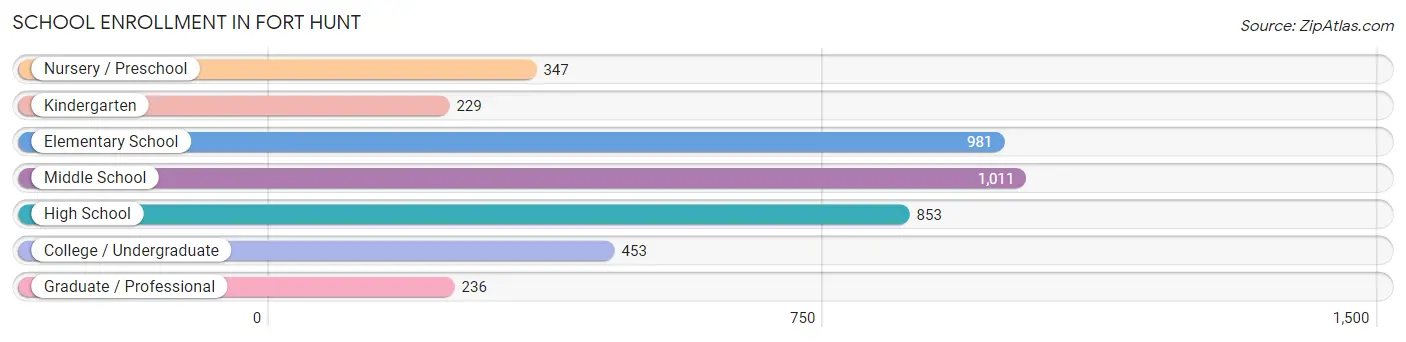
| School Level | # Students | % Students |
| Nursery / Preschool | 347 | 8.4% |
| Kindergarten | 229 | 5.6% |
| Elementary School | 981 | 23.9% |
| Middle School | 1,011 | 24.6% |
| High School | 853 | 20.7% |
| College / Undergraduate | 453 | 11.0% |
| Graduate / Professional | 236 | 5.7% |
| Total | 4,110 | 100.0% |
School Enrollment by Age by Funding Source in Fort Hunt
Out of a total of 4,110 students who are enrolled in schools in Fort Hunt, 1,048 (25.5%) attend a private institution, while the remaining 3,062 (74.5%) are enrolled in public schools. The age group of 3 to 4 year olds has the highest likelihood of being enrolled in private schools, with 230 (84.3% in the age bracket) enrolled. Conversely, the age group of 25 to 34 year olds has the lowest likelihood of being enrolled in a private school, with 60 (100.0% in the age bracket) attending a public institution.
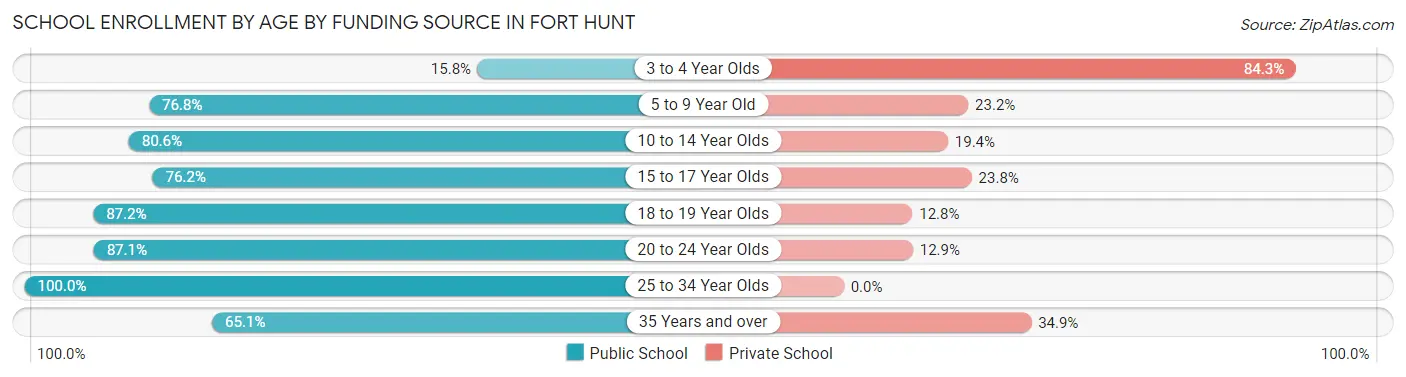
| Age Bracket | Public School | Private School |
| 3 to 4 Year Olds | 43 (15.8%) | 230 (84.3%) |
| 5 to 9 Year Old | 848 (76.8%) | 256 (23.2%) |
| 10 to 14 Year Olds | 1,005 (80.6%) | 242 (19.4%) |
| 15 to 17 Year Olds | 508 (76.2%) | 159 (23.8%) |
| 18 to 19 Year Olds | 150 (87.2%) | 22 (12.8%) |
| 20 to 24 Year Olds | 257 (87.1%) | 38 (12.9%) |
| 25 to 34 Year Olds | 60 (100.0%) | 0 (0.0%) |
| 35 Years and over | 190 (65.1%) | 102 (34.9%) |
| Total | 3,062 (74.5%) | 1,048 (25.5%) |
Educational Attainment by Field of Study in Fort Hunt
Social sciences (1,574 | 16.2%), business (1,564 | 16.1%), liberal arts & history (854 | 8.8%), literature & languages (821 | 8.4%), and engineering (754 | 7.7%) are the most common fields of study among 9,742 individuals in Fort Hunt who have obtained a bachelor's degree or higher.
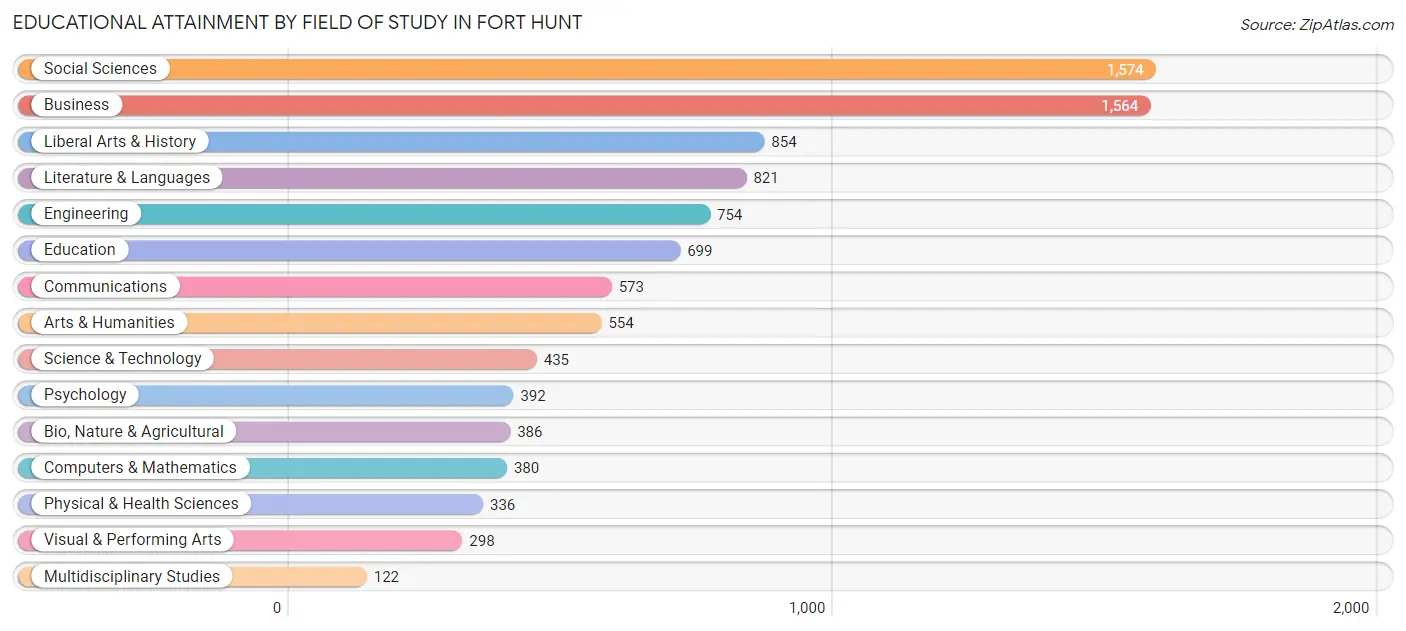
| Field of Study | # Graduates | % Graduates |
| Computers & Mathematics | 380 | 3.9% |
| Bio, Nature & Agricultural | 386 | 4.0% |
| Physical & Health Sciences | 336 | 3.5% |
| Psychology | 392 | 4.0% |
| Social Sciences | 1,574 | 16.2% |
| Engineering | 754 | 7.7% |
| Multidisciplinary Studies | 122 | 1.3% |
| Science & Technology | 435 | 4.5% |
| Business | 1,564 | 16.1% |
| Education | 699 | 7.2% |
| Literature & Languages | 821 | 8.4% |
| Liberal Arts & History | 854 | 8.8% |
| Visual & Performing Arts | 298 | 3.1% |
| Communications | 573 | 5.9% |
| Arts & Humanities | 554 | 5.7% |
| Total | 9,742 | 100.0% |
Transportation & Commute in Fort Hunt
Vehicle Availability by Sex in Fort Hunt
The most prevalent vehicle ownership categories in Fort Hunt are males with 2 vehicles (2,474, accounting for 59.0%) and females with 2 vehicles (1,804, making up 70.0%).
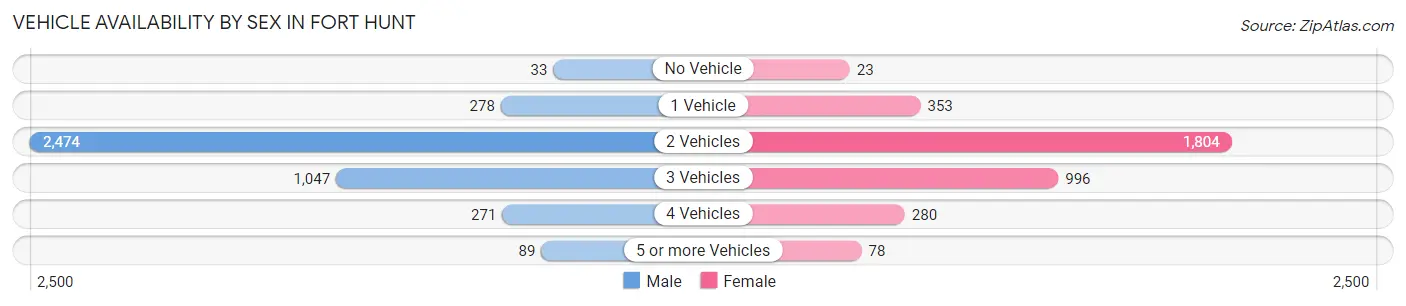
| Vehicles Available | Male | Female |
| No Vehicle | 33 (0.8%) | 23 (0.6%) |
| 1 Vehicle | 278 (6.6%) | 353 (10.0%) |
| 2 Vehicles | 2,474 (59.0%) | 1,804 (51.0%) |
| 3 Vehicles | 1,047 (25.0%) | 996 (28.2%) |
| 4 Vehicles | 271 (6.5%) | 280 (7.9%) |
| 5 or more Vehicles | 89 (2.1%) | 78 (2.2%) |
| Total | 4,192 (100.0%) | 3,534 (100.0%) |
Commute Time in Fort Hunt
The most frequently occuring commute durations in Fort Hunt are 30 to 34 minutes (1,235 commuters, 20.8%), 45 to 59 minutes (889 commuters, 14.9%), and 60 to 89 minutes (754 commuters, 12.7%).
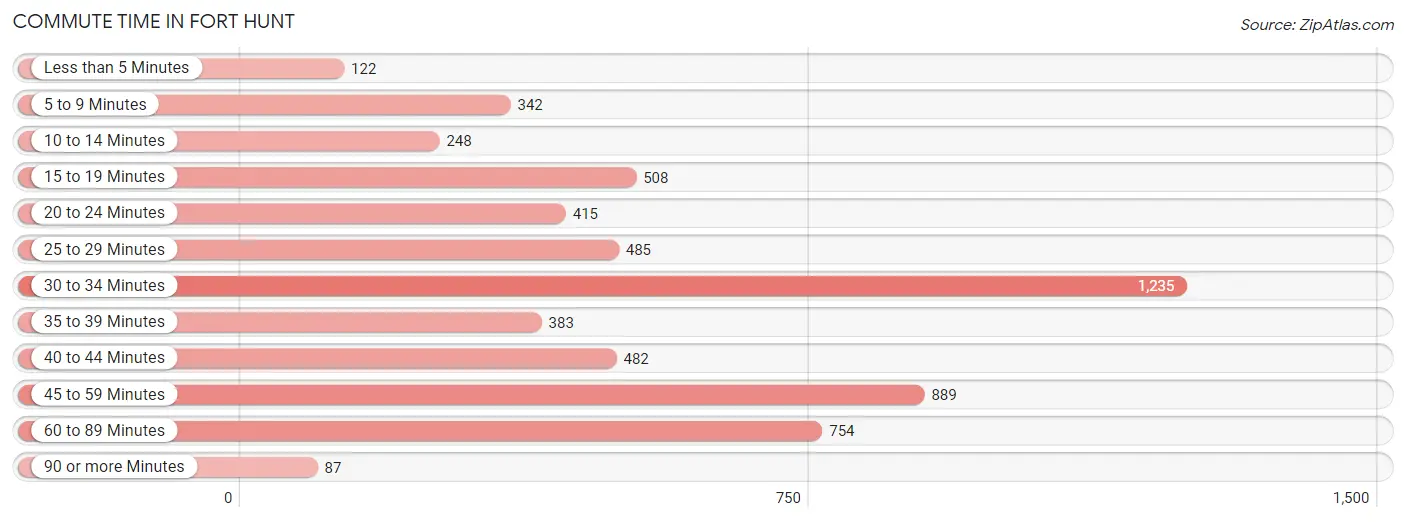
| Commute Time | # Commuters | % Commuters |
| Less than 5 Minutes | 122 | 2.1% |
| 5 to 9 Minutes | 342 | 5.8% |
| 10 to 14 Minutes | 248 | 4.2% |
| 15 to 19 Minutes | 508 | 8.5% |
| 20 to 24 Minutes | 415 | 7.0% |
| 25 to 29 Minutes | 485 | 8.2% |
| 30 to 34 Minutes | 1,235 | 20.8% |
| 35 to 39 Minutes | 383 | 6.4% |
| 40 to 44 Minutes | 482 | 8.1% |
| 45 to 59 Minutes | 889 | 14.9% |
| 60 to 89 Minutes | 754 | 12.7% |
| 90 or more Minutes | 87 | 1.5% |
Commute Time by Sex in Fort Hunt
The most common commute times in Fort Hunt are 30 to 34 minutes (737 commuters, 22.7%) for males and 30 to 34 minutes (498 commuters, 18.4%) for females.
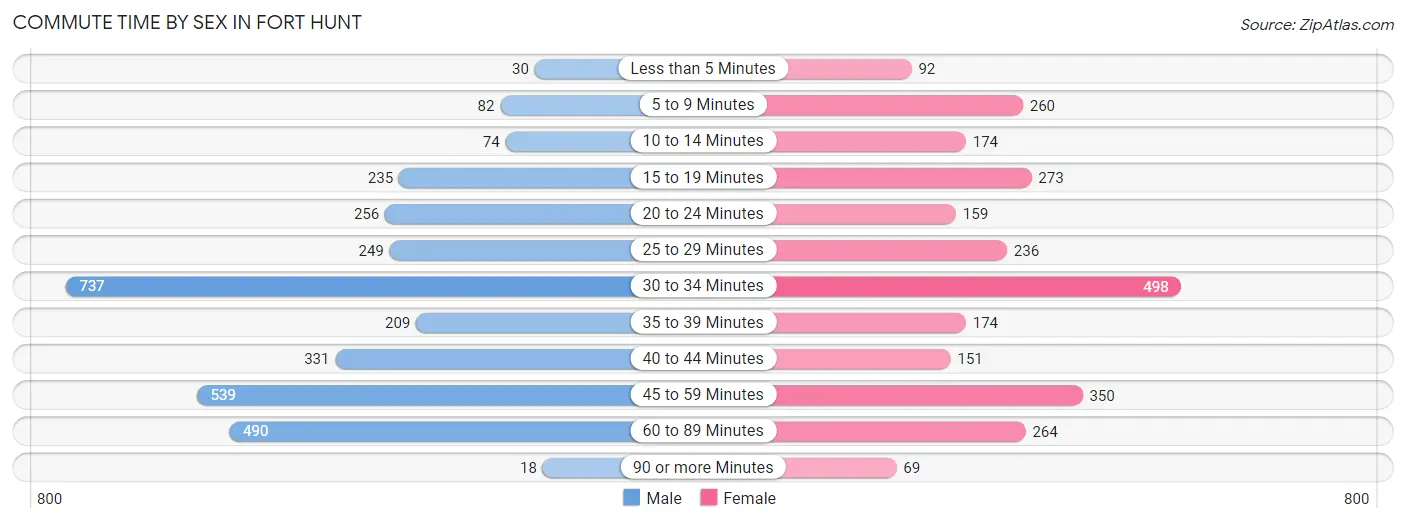
| Commute Time | Male | Female |
| Less than 5 Minutes | 30 (0.9%) | 92 (3.4%) |
| 5 to 9 Minutes | 82 (2.5%) | 260 (9.6%) |
| 10 to 14 Minutes | 74 (2.3%) | 174 (6.4%) |
| 15 to 19 Minutes | 235 (7.2%) | 273 (10.1%) |
| 20 to 24 Minutes | 256 (7.9%) | 159 (5.9%) |
| 25 to 29 Minutes | 249 (7.7%) | 236 (8.7%) |
| 30 to 34 Minutes | 737 (22.7%) | 498 (18.4%) |
| 35 to 39 Minutes | 209 (6.4%) | 174 (6.4%) |
| 40 to 44 Minutes | 331 (10.2%) | 151 (5.6%) |
| 45 to 59 Minutes | 539 (16.6%) | 350 (13.0%) |
| 60 to 89 Minutes | 490 (15.1%) | 264 (9.8%) |
| 90 or more Minutes | 18 (0.5%) | 69 (2.6%) |
Time of Departure to Work by Sex in Fort Hunt
The most frequent times of departure to work in Fort Hunt are 7:00 AM to 7:29 AM (538, 16.6%) for males and 7:30 AM to 7:59 AM (505, 18.7%) for females.
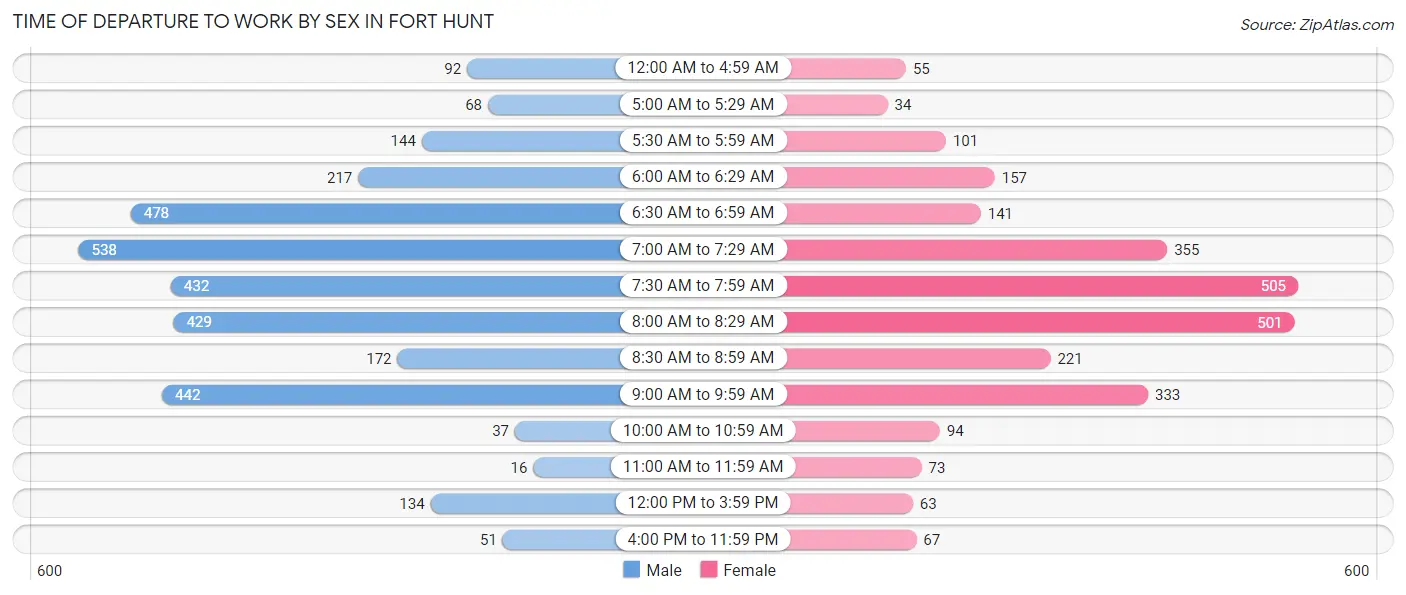
| Time of Departure | Male | Female |
| 12:00 AM to 4:59 AM | 92 (2.8%) | 55 (2.0%) |
| 5:00 AM to 5:29 AM | 68 (2.1%) | 34 (1.3%) |
| 5:30 AM to 5:59 AM | 144 (4.4%) | 101 (3.7%) |
| 6:00 AM to 6:29 AM | 217 (6.7%) | 157 (5.8%) |
| 6:30 AM to 6:59 AM | 478 (14.7%) | 141 (5.2%) |
| 7:00 AM to 7:29 AM | 538 (16.6%) | 355 (13.2%) |
| 7:30 AM to 7:59 AM | 432 (13.3%) | 505 (18.7%) |
| 8:00 AM to 8:29 AM | 429 (13.2%) | 501 (18.6%) |
| 8:30 AM to 8:59 AM | 172 (5.3%) | 221 (8.2%) |
| 9:00 AM to 9:59 AM | 442 (13.6%) | 333 (12.3%) |
| 10:00 AM to 10:59 AM | 37 (1.1%) | 94 (3.5%) |
| 11:00 AM to 11:59 AM | 16 (0.5%) | 73 (2.7%) |
| 12:00 PM to 3:59 PM | 134 (4.1%) | 63 (2.3%) |
| 4:00 PM to 11:59 PM | 51 (1.6%) | 67 (2.5%) |
| Total | 3,250 (100.0%) | 2,700 (100.0%) |
Housing Occupancy in Fort Hunt
Occupancy by Ownership in Fort Hunt
Of the total 5,874 dwellings in Fort Hunt, owner-occupied units account for 5,559 (94.6%), while renter-occupied units make up 315 (5.4%).
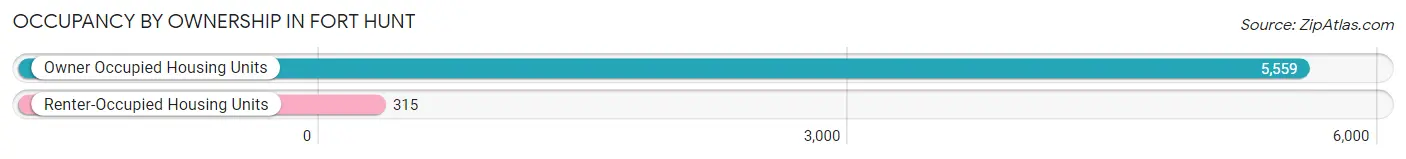
| Occupancy | # Housing Units | % Housing Units |
| Owner Occupied Housing Units | 5,559 | 94.6% |
| Renter-Occupied Housing Units | 315 | 5.4% |
| Total Occupied Housing Units | 5,874 | 100.0% |
Occupancy by Household Size in Fort Hunt
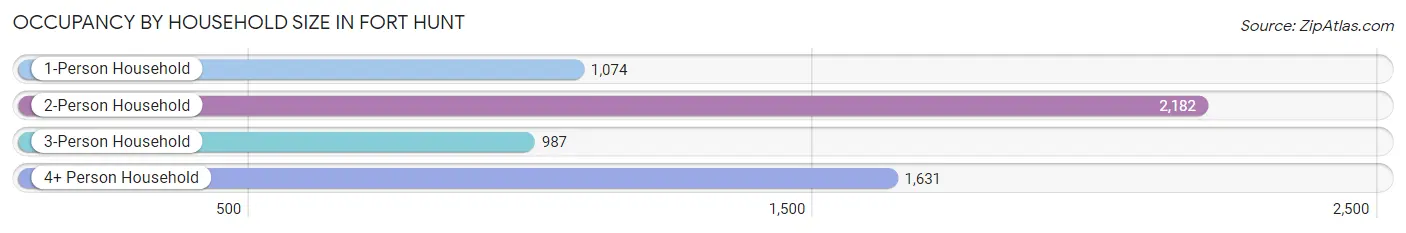
| Household Size | # Housing Units | % Housing Units |
| 1-Person Household | 1,074 | 18.3% |
| 2-Person Household | 2,182 | 37.1% |
| 3-Person Household | 987 | 16.8% |
| 4+ Person Household | 1,631 | 27.8% |
| Total Housing Units | 5,874 | 100.0% |
Occupancy by Ownership by Household Size in Fort Hunt
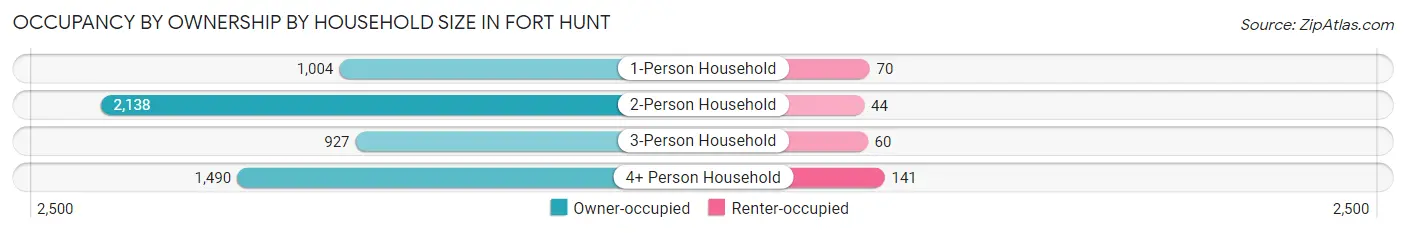
| Household Size | Owner-occupied | Renter-occupied |
| 1-Person Household | 1,004 (93.5%) | 70 (6.5%) |
| 2-Person Household | 2,138 (98.0%) | 44 (2.0%) |
| 3-Person Household | 927 (93.9%) | 60 (6.1%) |
| 4+ Person Household | 1,490 (91.3%) | 141 (8.6%) |
| Total Housing Units | 5,559 (94.6%) | 315 (5.4%) |
Occupancy by Educational Attainment in Fort Hunt
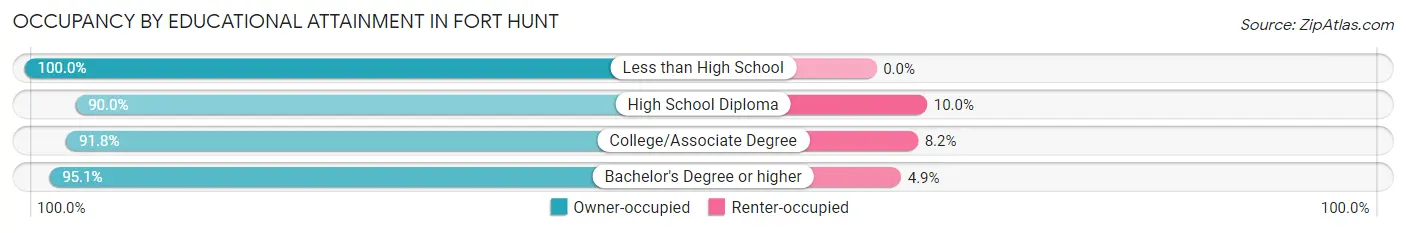
| Household Size | Owner-occupied | Renter-occupied |
| Less than High School | 123 (100.0%) | 0 (0.0%) |
| High School Diploma | 242 (90.0%) | 27 (10.0%) |
| College/Associate Degree | 557 (91.8%) | 50 (8.2%) |
| Bachelor's Degree or higher | 4,637 (95.1%) | 238 (4.9%) |
Occupancy by Age of Householder in Fort Hunt
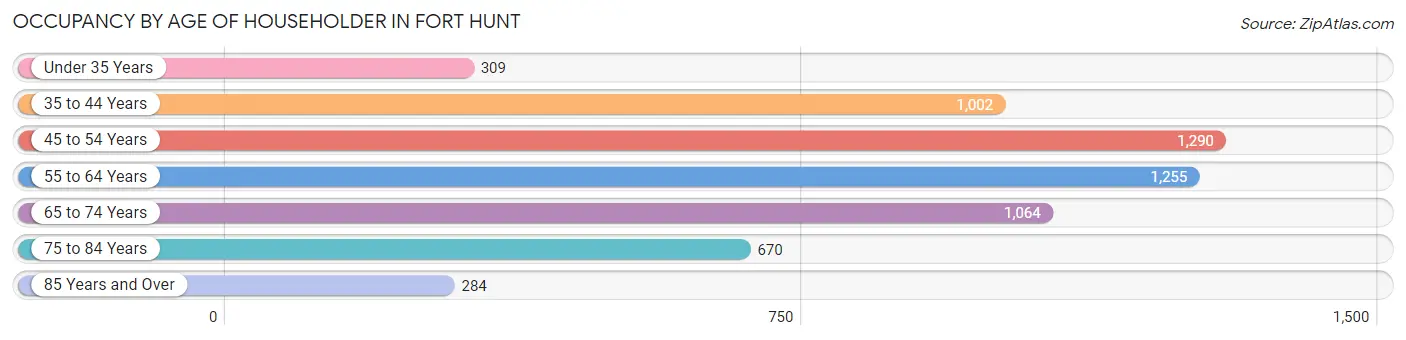
| Age Bracket | # Households | % Households |
| Under 35 Years | 309 | 5.3% |
| 35 to 44 Years | 1,002 | 17.1% |
| 45 to 54 Years | 1,290 | 22.0% |
| 55 to 64 Years | 1,255 | 21.4% |
| 65 to 74 Years | 1,064 | 18.1% |
| 75 to 84 Years | 670 | 11.4% |
| 85 Years and Over | 284 | 4.8% |
| Total | 5,874 | 100.0% |
Housing Finances in Fort Hunt
Median Income by Occupancy in Fort Hunt
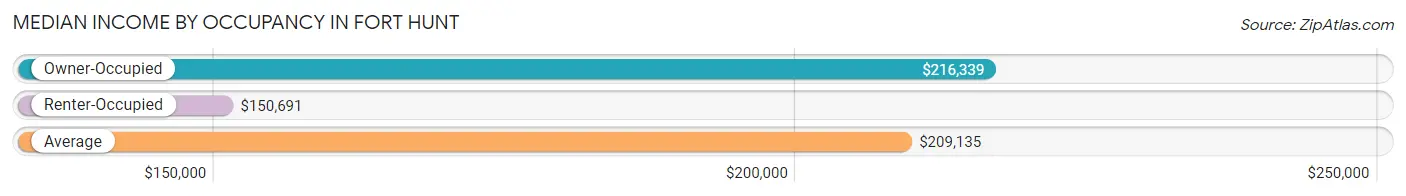
| Occupancy Type | # Households | Median Income |
| Owner-Occupied | 5,559 (94.6%) | $216,339 |
| Renter-Occupied | 315 (5.4%) | $150,691 |
| Average | 5,874 (100.0%) | $209,135 |
Occupancy by Householder Income Bracket in Fort Hunt
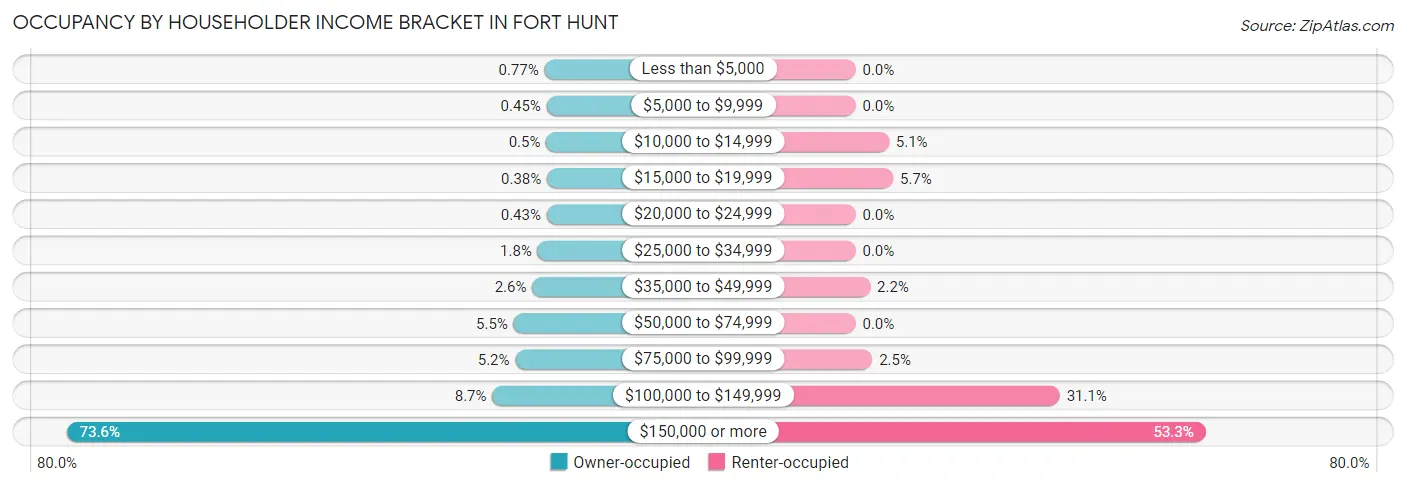
| Income Bracket | Owner-occupied | Renter-occupied |
| Less than $5,000 | 43 (0.8%) | 0 (0.0%) |
| $5,000 to $9,999 | 25 (0.4%) | 0 (0.0%) |
| $10,000 to $14,999 | 28 (0.5%) | 16 (5.1%) |
| $15,000 to $19,999 | 21 (0.4%) | 18 (5.7%) |
| $20,000 to $24,999 | 24 (0.4%) | 0 (0.0%) |
| $25,000 to $34,999 | 101 (1.8%) | 0 (0.0%) |
| $35,000 to $49,999 | 147 (2.6%) | 7 (2.2%) |
| $50,000 to $74,999 | 304 (5.5%) | 0 (0.0%) |
| $75,000 to $99,999 | 290 (5.2%) | 8 (2.5%) |
| $100,000 to $149,999 | 485 (8.7%) | 98 (31.1%) |
| $150,000 or more | 4,091 (73.6%) | 168 (53.3%) |
| Total | 5,559 (100.0%) | 315 (100.0%) |
Monthly Housing Cost Tiers in Fort Hunt
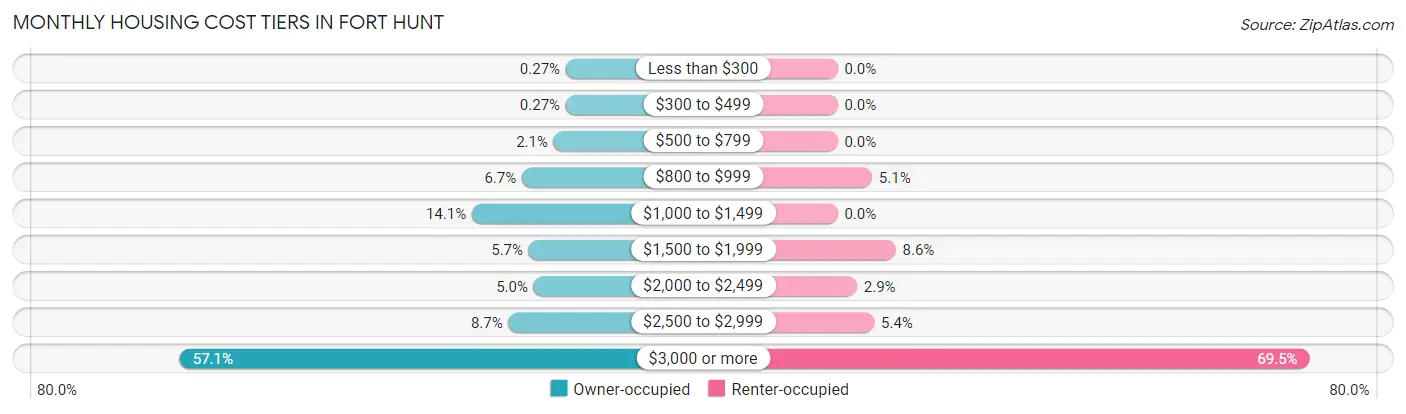
| Monthly Cost | Owner-occupied | Renter-occupied |
| Less than $300 | 15 (0.3%) | 0 (0.0%) |
| $300 to $499 | 15 (0.3%) | 0 (0.0%) |
| $500 to $799 | 114 (2.1%) | 0 (0.0%) |
| $800 to $999 | 374 (6.7%) | 16 (5.1%) |
| $1,000 to $1,499 | 784 (14.1%) | 0 (0.0%) |
| $1,500 to $1,999 | 318 (5.7%) | 27 (8.6%) |
| $2,000 to $2,499 | 278 (5.0%) | 9 (2.9%) |
| $2,500 to $2,999 | 485 (8.7%) | 17 (5.4%) |
| $3,000 or more | 3,176 (57.1%) | 219 (69.5%) |
| Total | 5,559 (100.0%) | 315 (100.0%) |
Physical Housing Characteristics in Fort Hunt
Housing Structures in Fort Hunt
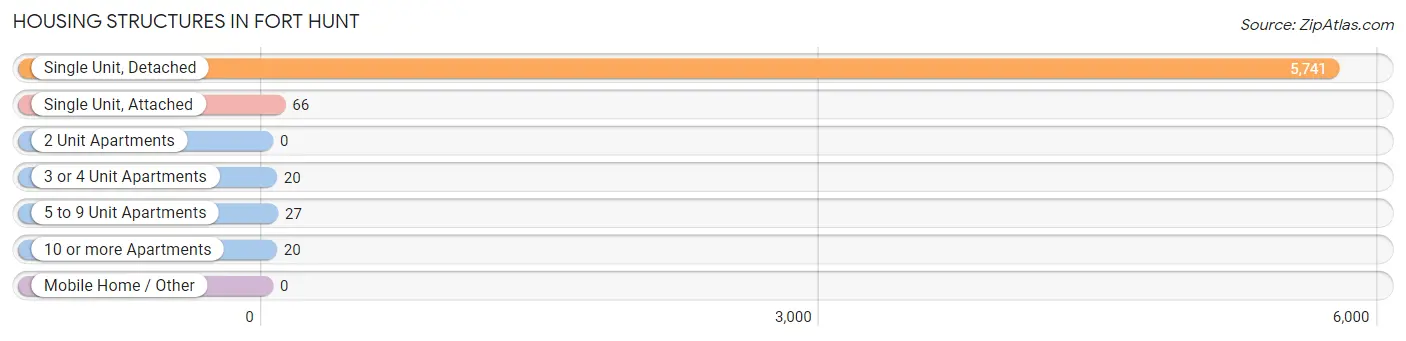
| Structure Type | # Housing Units | % Housing Units |
| Single Unit, Detached | 5,741 | 97.7% |
| Single Unit, Attached | 66 | 1.1% |
| 2 Unit Apartments | 0 | 0.0% |
| 3 or 4 Unit Apartments | 20 | 0.3% |
| 5 to 9 Unit Apartments | 27 | 0.5% |
| 10 or more Apartments | 20 | 0.3% |
| Mobile Home / Other | 0 | 0.0% |
| Total | 5,874 | 100.0% |
Housing Structures by Occupancy in Fort Hunt
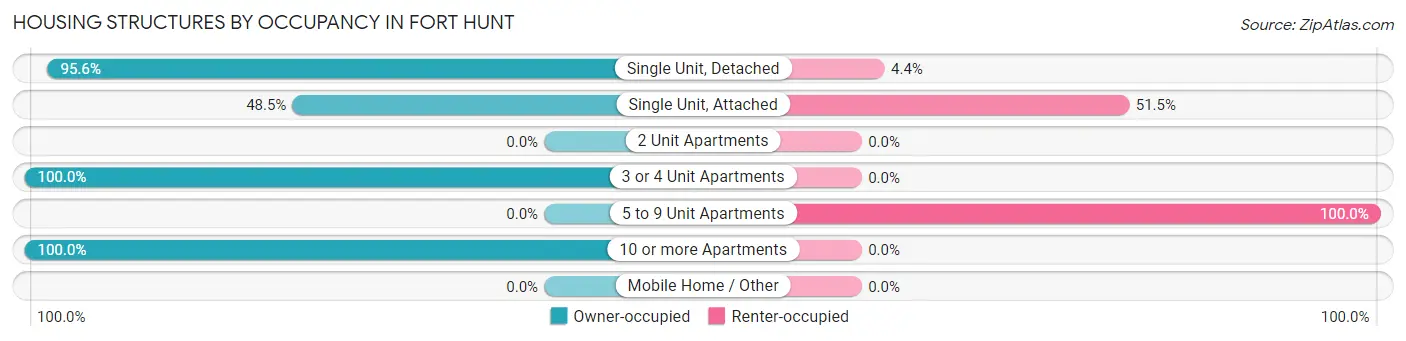
| Structure Type | Owner-occupied | Renter-occupied |
| Single Unit, Detached | 5,487 (95.6%) | 254 (4.4%) |
| Single Unit, Attached | 32 (48.5%) | 34 (51.5%) |
| 2 Unit Apartments | 0 (0.0%) | 0 (0.0%) |
| 3 or 4 Unit Apartments | 20 (100.0%) | 0 (0.0%) |
| 5 to 9 Unit Apartments | 0 (0.0%) | 27 (100.0%) |
| 10 or more Apartments | 20 (100.0%) | 0 (0.0%) |
| Mobile Home / Other | 0 (0.0%) | 0 (0.0%) |
| Total | 5,559 (94.6%) | 315 (5.4%) |
Housing Structures by Number of Rooms in Fort Hunt
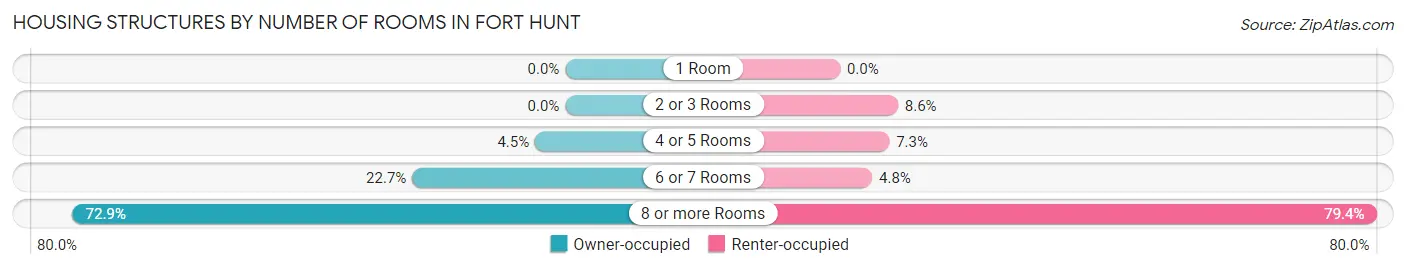
| Number of Rooms | Owner-occupied | Renter-occupied |
| 1 Room | 0 (0.0%) | 0 (0.0%) |
| 2 or 3 Rooms | 0 (0.0%) | 27 (8.6%) |
| 4 or 5 Rooms | 248 (4.5%) | 23 (7.3%) |
| 6 or 7 Rooms | 1,259 (22.7%) | 15 (4.8%) |
| 8 or more Rooms | 4,052 (72.9%) | 250 (79.4%) |
| Total | 5,559 (100.0%) | 315 (100.0%) |
Housing Structure by Heating Type in Fort Hunt
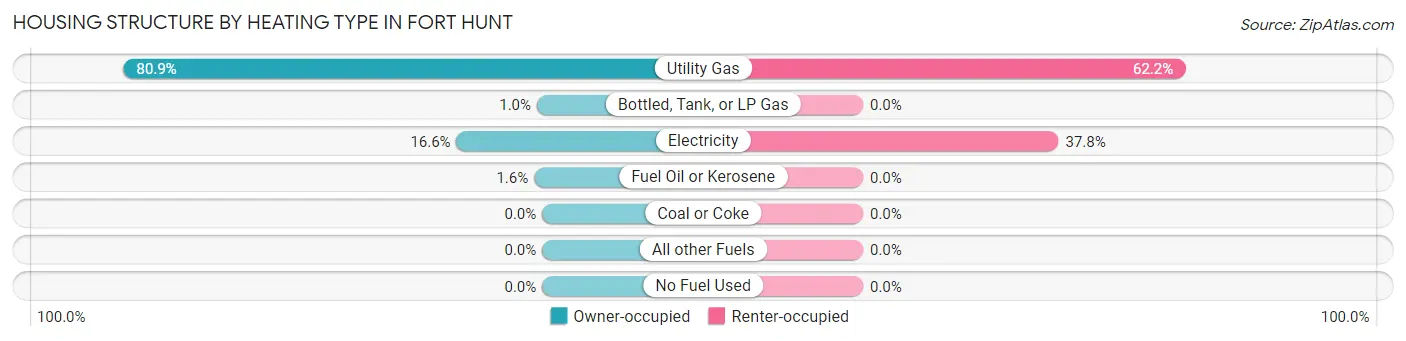
| Heating Type | Owner-occupied | Renter-occupied |
| Utility Gas | 4,497 (80.9%) | 196 (62.2%) |
| Bottled, Tank, or LP Gas | 56 (1.0%) | 0 (0.0%) |
| Electricity | 920 (16.6%) | 119 (37.8%) |
| Fuel Oil or Kerosene | 86 (1.5%) | 0 (0.0%) |
| Coal or Coke | 0 (0.0%) | 0 (0.0%) |
| All other Fuels | 0 (0.0%) | 0 (0.0%) |
| No Fuel Used | 0 (0.0%) | 0 (0.0%) |
| Total | 5,559 (100.0%) | 315 (100.0%) |
Household Vehicle Usage in Fort Hunt
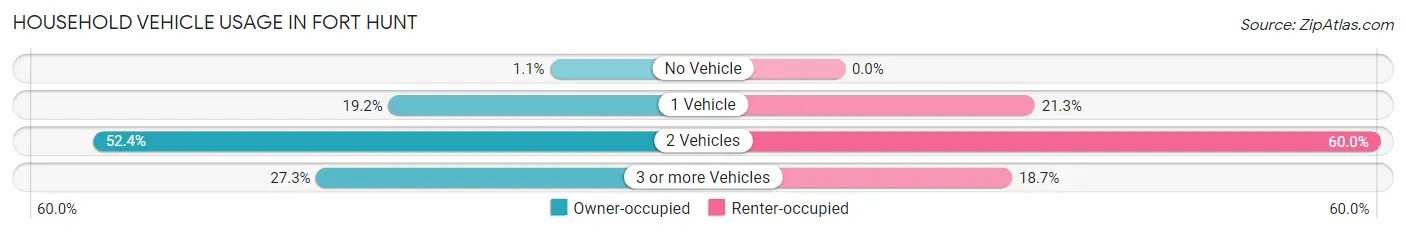
| Vehicles per Household | Owner-occupied | Renter-occupied |
| No Vehicle | 61 (1.1%) | 0 (0.0%) |
| 1 Vehicle | 1,069 (19.2%) | 67 (21.3%) |
| 2 Vehicles | 2,911 (52.4%) | 189 (60.0%) |
| 3 or more Vehicles | 1,518 (27.3%) | 59 (18.7%) |
| Total | 5,559 (100.0%) | 315 (100.0%) |
Real Estate & Mortgages in Fort Hunt
Real Estate and Mortgage Overview in Fort Hunt
| Characteristic | Without Mortgage | With Mortgage |
| Housing Units | 1,464 | 4,095 |
| Median Property Value | $803,500 | $852,300 |
| Median Household Income | $173,462 | $3,230 |
| Monthly Housing Costs | $1,134 | $3,145 |
| Real Estate Taxes | $9,179 | $27 |
Property Value by Mortgage Status in Fort Hunt
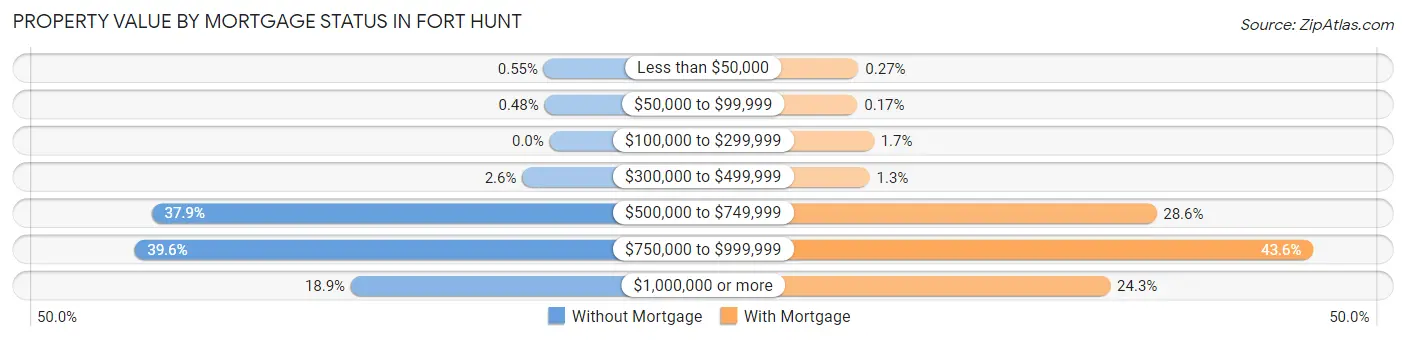
| Property Value | Without Mortgage | With Mortgage |
| Less than $50,000 | 8 (0.5%) | 11 (0.3%) |
| $50,000 to $99,999 | 7 (0.5%) | 7 (0.2%) |
| $100,000 to $299,999 | 0 (0.0%) | 71 (1.7%) |
| $300,000 to $499,999 | 38 (2.6%) | 55 (1.3%) |
| $500,000 to $749,999 | 555 (37.9%) | 1,173 (28.6%) |
| $750,000 to $999,999 | 579 (39.6%) | 1,785 (43.6%) |
| $1,000,000 or more | 277 (18.9%) | 993 (24.2%) |
| Total | 1,464 (100.0%) | 4,095 (100.0%) |
Household Income by Mortgage Status in Fort Hunt
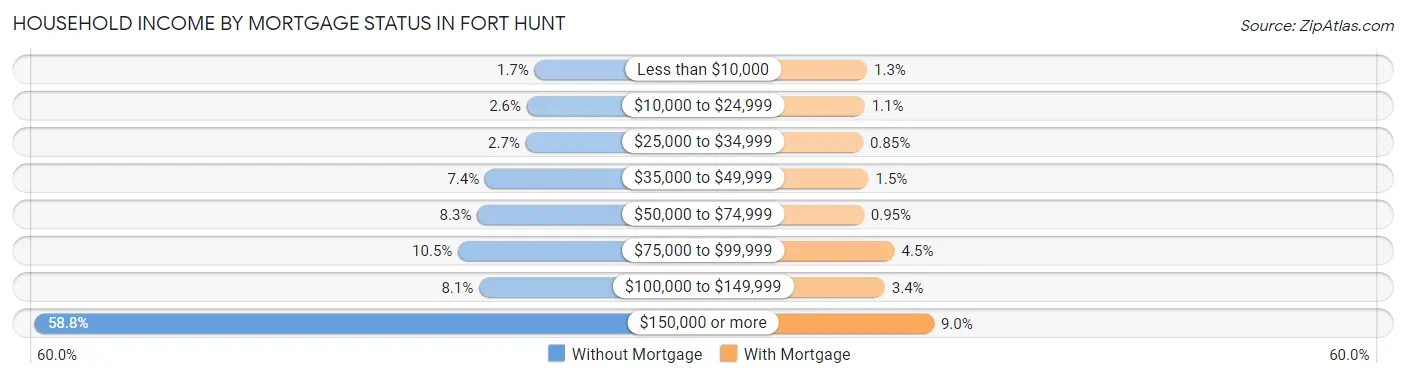
| Household Income | Without Mortgage | With Mortgage |
| Less than $10,000 | 25 (1.7%) | 54 (1.3%) |
| $10,000 to $24,999 | 38 (2.6%) | 43 (1.1%) |
| $25,000 to $34,999 | 40 (2.7%) | 35 (0.9%) |
| $35,000 to $49,999 | 108 (7.4%) | 61 (1.5%) |
| $50,000 to $74,999 | 121 (8.3%) | 39 (0.9%) |
| $75,000 to $99,999 | 153 (10.4%) | 183 (4.5%) |
| $100,000 to $149,999 | 118 (8.1%) | 137 (3.4%) |
| $150,000 or more | 861 (58.8%) | 367 (9.0%) |
| Total | 1,464 (100.0%) | 4,095 (100.0%) |
Property Value to Household Income Ratio in Fort Hunt
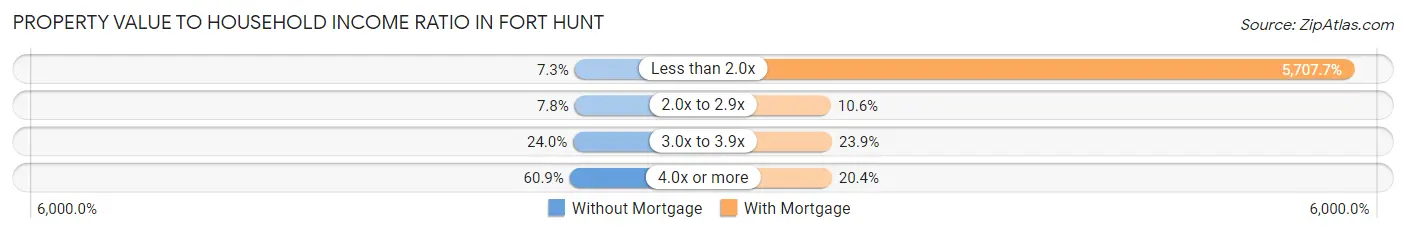
| Value-to-Income Ratio | Without Mortgage | With Mortgage |
| Less than 2.0x | 107 (7.3%) | 233,730 (5,707.7%) |
| 2.0x to 2.9x | 114 (7.8%) | 433 (10.6%) |
| 3.0x to 3.9x | 351 (24.0%) | 979 (23.9%) |
| 4.0x or more | 892 (60.9%) | 837 (20.4%) |
| Total | 1,464 (100.0%) | 4,095 (100.0%) |
Real Estate Taxes by Mortgage Status in Fort Hunt
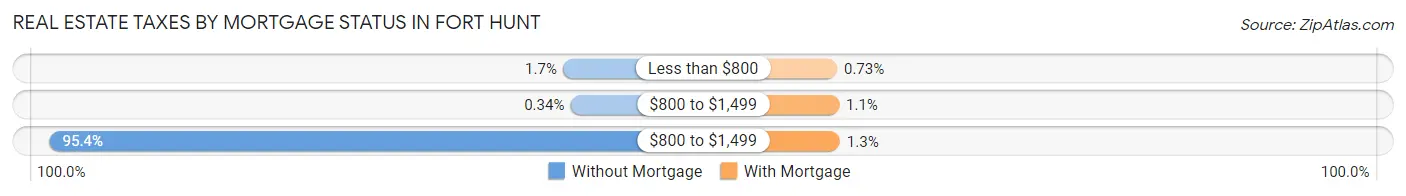
| Property Taxes | Without Mortgage | With Mortgage |
| Less than $800 | 25 (1.7%) | 30 (0.7%) |
| $800 to $1,499 | 5 (0.3%) | 45 (1.1%) |
| $800 to $1,499 | 1,397 (95.4%) | 51 (1.3%) |
| Total | 1,464 (100.0%) | 4,095 (100.0%) |
Health & Disability in Fort Hunt
Health Insurance Coverage by Age in Fort Hunt
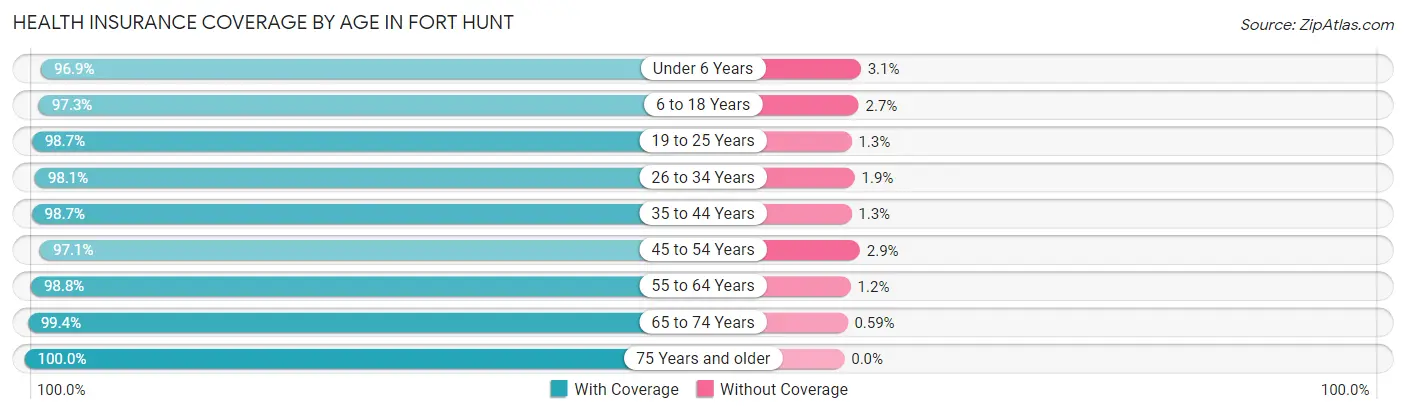
| Age Bracket | With Coverage | Without Coverage |
| Under 6 Years | 1,137 (96.9%) | 36 (3.1%) |
| 6 to 18 Years | 2,984 (97.3%) | 82 (2.7%) |
| 19 to 25 Years | 588 (98.7%) | 8 (1.3%) |
| 26 to 34 Years | 817 (98.1%) | 16 (1.9%) |
| 35 to 44 Years | 1,799 (98.7%) | 24 (1.3%) |
| 45 to 54 Years | 2,549 (97.1%) | 76 (2.9%) |
| 55 to 64 Years | 2,164 (98.8%) | 26 (1.2%) |
| 65 to 74 Years | 1,860 (99.4%) | 11 (0.6%) |
| 75 Years and older | 1,380 (100.0%) | 0 (0.0%) |
| Total | 15,278 (98.2%) | 279 (1.8%) |
Health Insurance Coverage by Citizenship Status in Fort Hunt
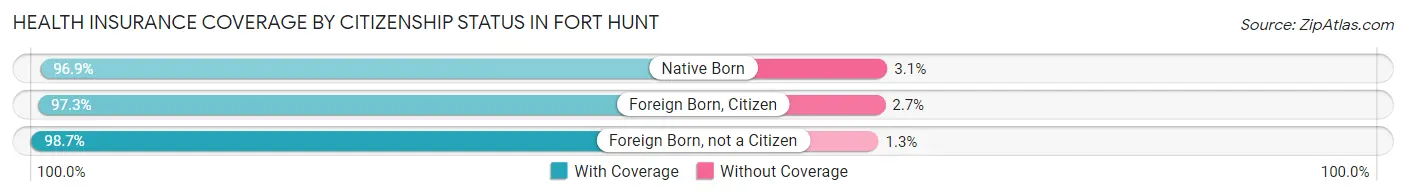
| Citizenship Status | With Coverage | Without Coverage |
| Native Born | 1,137 (96.9%) | 36 (3.1%) |
| Foreign Born, Citizen | 2,984 (97.3%) | 82 (2.7%) |
| Foreign Born, not a Citizen | 588 (98.7%) | 8 (1.3%) |
Health Insurance Coverage by Household Income in Fort Hunt
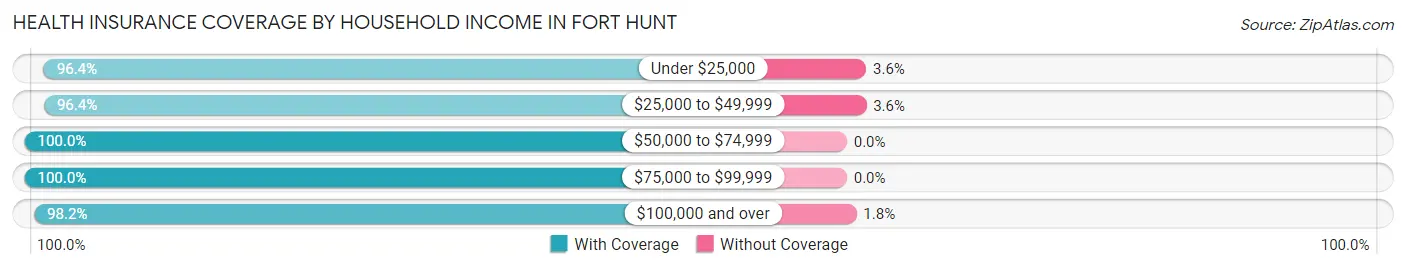
| Household Income | With Coverage | Without Coverage |
| Under $25,000 | 267 (96.4%) | 10 (3.6%) |
| $25,000 to $49,999 | 424 (96.4%) | 16 (3.6%) |
| $50,000 to $74,999 | 504 (100.0%) | 0 (0.0%) |
| $75,000 to $99,999 | 504 (100.0%) | 0 (0.0%) |
| $100,000 and over | 13,567 (98.2%) | 249 (1.8%) |
Public vs Private Health Insurance Coverage by Age in Fort Hunt
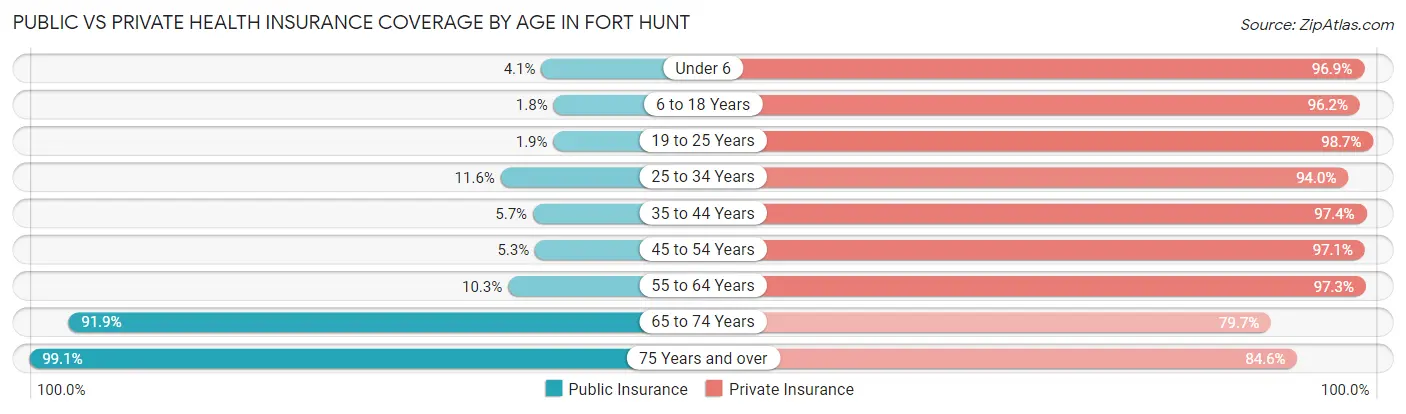
| Age Bracket | Public Insurance | Private Insurance |
| Under 6 | 48 (4.1%) | 1,137 (96.9%) |
| 6 to 18 Years | 56 (1.8%) | 2,948 (96.2%) |
| 19 to 25 Years | 11 (1.8%) | 588 (98.7%) |
| 25 to 34 Years | 97 (11.6%) | 783 (94.0%) |
| 35 to 44 Years | 103 (5.7%) | 1,775 (97.4%) |
| 45 to 54 Years | 138 (5.3%) | 2,548 (97.1%) |
| 55 to 64 Years | 225 (10.3%) | 2,130 (97.3%) |
| 65 to 74 Years | 1,719 (91.9%) | 1,491 (79.7%) |
| 75 Years and over | 1,368 (99.1%) | 1,167 (84.6%) |
| Total | 3,765 (24.2%) | 14,567 (93.6%) |
Disability Status by Sex by Age in Fort Hunt
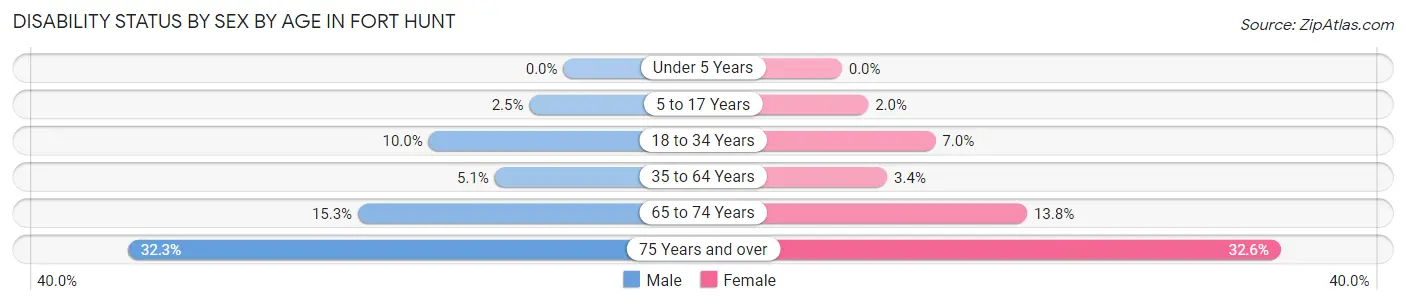
| Age Bracket | Male | Female |
| Under 5 Years | 0 (0.0%) | 0 (0.0%) |
| 5 to 17 Years | 41 (2.5%) | 29 (2.0%) |
| 18 to 34 Years | 71 (10.0%) | 60 (7.0%) |
| 35 to 64 Years | 163 (5.1%) | 116 (3.4%) |
| 65 to 74 Years | 140 (15.2%) | 131 (13.8%) |
| 75 Years and over | 215 (32.3%) | 233 (32.6%) |
Disability Class by Sex by Age in Fort Hunt
Disability Class: Hearing Difficulty
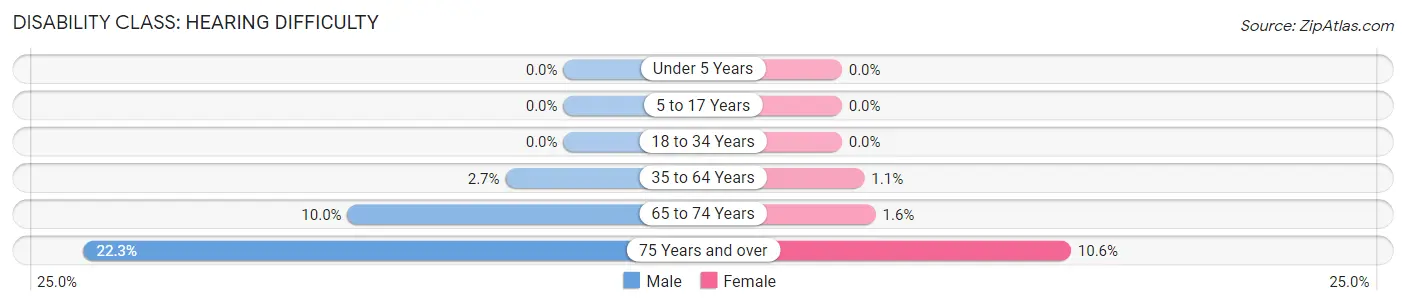
| Age Bracket | Male | Female |
| Under 5 Years | 0 (0.0%) | 0 (0.0%) |
| 5 to 17 Years | 0 (0.0%) | 0 (0.0%) |
| 18 to 34 Years | 0 (0.0%) | 0 (0.0%) |
| 35 to 64 Years | 86 (2.7%) | 36 (1.1%) |
| 65 to 74 Years | 92 (10.0%) | 15 (1.6%) |
| 75 Years and over | 148 (22.3%) | 76 (10.6%) |
Disability Class: Vision Difficulty
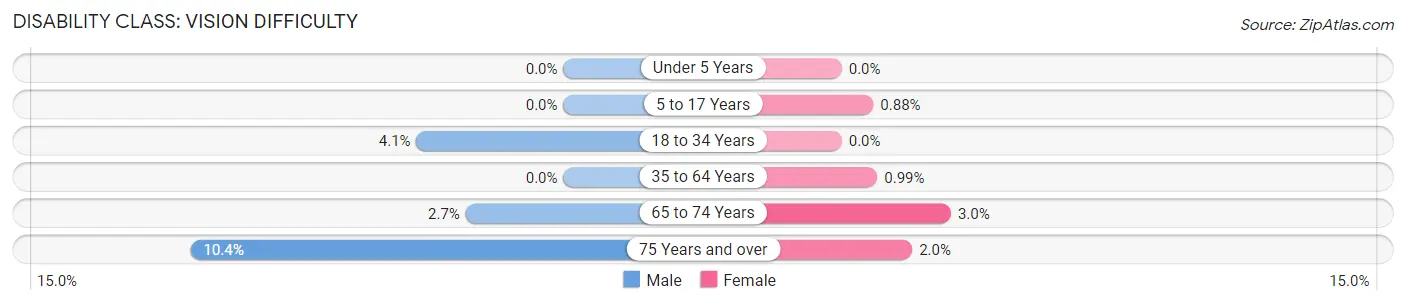
| Age Bracket | Male | Female |
| Under 5 Years | 0 (0.0%) | 0 (0.0%) |
| 5 to 17 Years | 0 (0.0%) | 13 (0.9%) |
| 18 to 34 Years | 29 (4.1%) | 0 (0.0%) |
| 35 to 64 Years | 0 (0.0%) | 34 (1.0%) |
| 65 to 74 Years | 25 (2.7%) | 29 (3.0%) |
| 75 Years and over | 69 (10.4%) | 14 (2.0%) |
Disability Class: Cognitive Difficulty
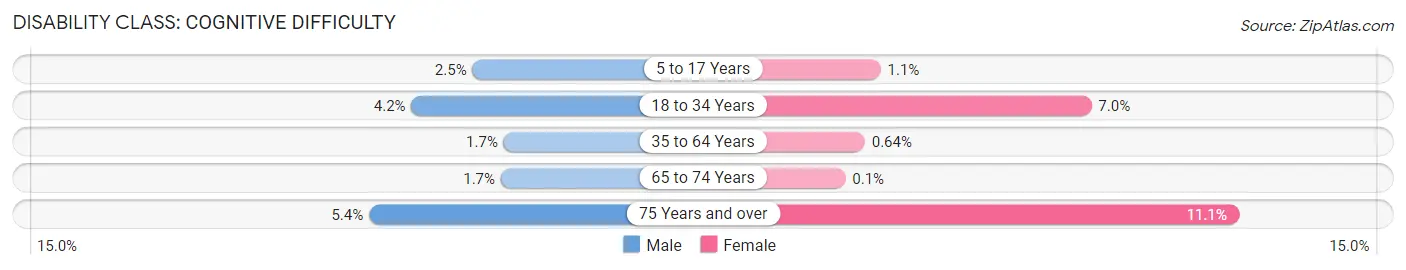
| Age Bracket | Male | Female |
| 5 to 17 Years | 41 (2.5%) | 16 (1.1%) |
| 18 to 34 Years | 30 (4.2%) | 60 (7.0%) |
| 35 to 64 Years | 53 (1.7%) | 22 (0.6%) |
| 65 to 74 Years | 16 (1.7%) | 1 (0.1%) |
| 75 Years and over | 36 (5.4%) | 79 (11.1%) |
Disability Class: Ambulatory Difficulty
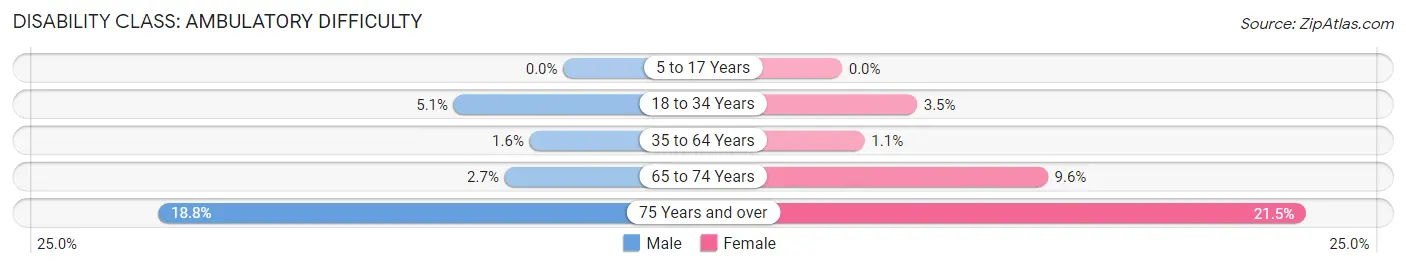
| Age Bracket | Male | Female |
| 5 to 17 Years | 0 (0.0%) | 0 (0.0%) |
| 18 to 34 Years | 36 (5.1%) | 30 (3.5%) |
| 35 to 64 Years | 50 (1.6%) | 36 (1.1%) |
| 65 to 74 Years | 25 (2.7%) | 91 (9.6%) |
| 75 Years and over | 125 (18.8%) | 154 (21.5%) |
Disability Class: Self-Care Difficulty
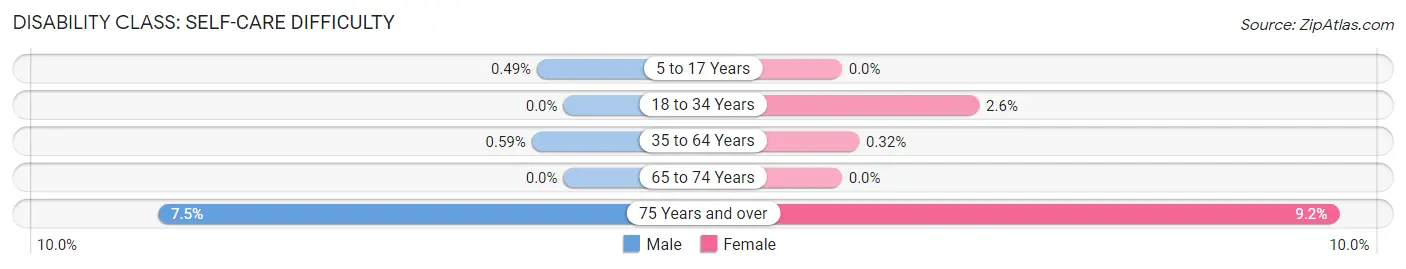
| Age Bracket | Male | Female |
| 5 to 17 Years | 8 (0.5%) | 0 (0.0%) |
| 18 to 34 Years | 0 (0.0%) | 22 (2.5%) |
| 35 to 64 Years | 19 (0.6%) | 11 (0.3%) |
| 65 to 74 Years | 0 (0.0%) | 0 (0.0%) |
| 75 Years and over | 50 (7.5%) | 66 (9.2%) |
Technology Access in Fort Hunt
Computing Device Access in Fort Hunt
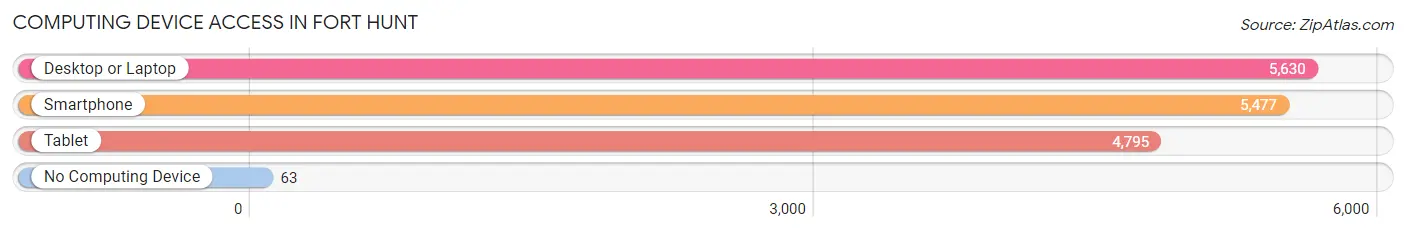
| Device Type | # Households | % Households |
| Desktop or Laptop | 5,630 | 95.9% |
| Smartphone | 5,477 | 93.2% |
| Tablet | 4,795 | 81.6% |
| No Computing Device | 63 | 1.1% |
| Total | 5,874 | 100.0% |
Internet Access in Fort Hunt
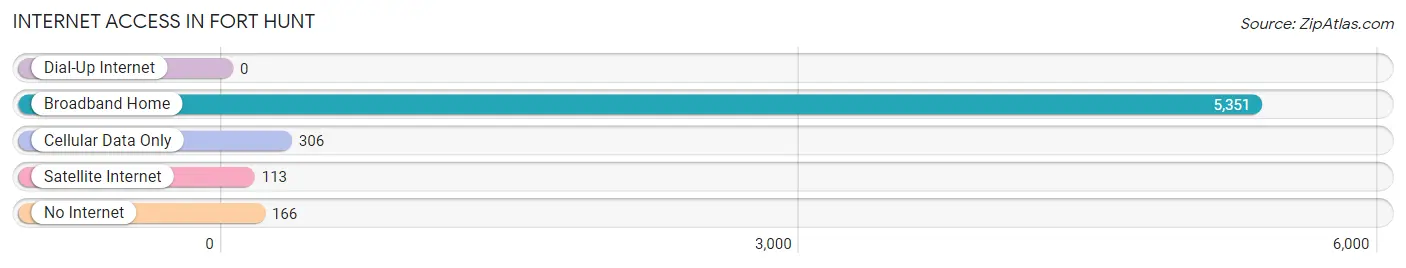
| Internet Type | # Households | % Households |
| Dial-Up Internet | 0 | 0.0% |
| Broadband Home | 5,351 | 91.1% |
| Cellular Data Only | 306 | 5.2% |
| Satellite Internet | 113 | 1.9% |
| No Internet | 166 | 2.8% |
| Total | 5,874 | 100.0% |
Fort Hunt Summary
History
Fort Hunt is a small community located in Fairfax County, Virginia, just south of Alexandria. It is situated on the Potomac River, and is part of the Washington, D.C. metropolitan area. The area was first settled in the early 1700s, and was known as Hunting Creek Plantation. The plantation was owned by the Fairfax family, and was used for farming and hunting.
In the early 1800s, the area was used as a military base by the United States Army. The base was known as Fort Washington, and was used to protect the nation’s capital from potential attack. During the Civil War, the fort was used by the Union Army to guard the Potomac River.
In the late 1800s, the area was developed as a residential community. The area was known as Fort Hunt, and was home to many prominent families. The area was also home to a number of military installations, including Fort Hunt Park, which was used as a training ground for the U.S. Army during World War I.
In the early 1900s, the area was annexed by the City of Alexandria. The area was home to a number of military installations, including Fort Hunt Park, which was used as a training ground for the U.S. Army during World War I.
In the late 1900s, the area was developed as a residential community. The area was home to a number of military installations, including Fort Hunt Park, which was used as a training ground for the U.S. Army during World War I.
Geography
Fort Hunt is located in Fairfax County, Virginia, just south of Alexandria. It is situated on the Potomac River, and is part of the Washington, D.C. metropolitan area. The area is mostly flat, with some rolling hills. The area is home to a number of parks, including Fort Hunt Park, which is a popular destination for outdoor activities.
Economy
Fort Hunt is a primarily residential community, and the local economy is largely based on the service industry. The area is home to a number of restaurants, retail stores, and other businesses. The area is also home to a number of government offices, including the Department of Defense and the Department of Homeland Security.
Demographics
As of the 2010 census, the population of Fort Hunt was 8,209. The racial makeup of the area was 79.3% White, 11.2% African American, 0.3% Native American, 4.2% Asian, 0.1% Pacific Islander, and 4.9% from other races. The median household income was $107,945, and the median family income was $118,945. The area is home to a number of military installations, including Fort Hunt Park, which is a popular destination for outdoor activities.
Common Questions
What is Per Capita Income in Fort Hunt?
Per Capita income in Fort Hunt is $93,485.
What is the Median Family Income in Fort Hunt?
Median Family Income in Fort Hunt is $234,343.
What is the Median Household income in Fort Hunt?
Median Household Income in Fort Hunt is $209,135.
What is Income or Wage Gap in Fort Hunt?
Income or Wage Gap in Fort Hunt is 37.4%.
Women in Fort Hunt earn 62.6 cents for every dollar earned by a man.
What is Inequality or Gini Index in Fort Hunt?
Inequality or Gini Index in Fort Hunt is 0.38.
What is the Total Population of Fort Hunt?
Total Population of Fort Hunt is 16,009.
What is the Total Male Population of Fort Hunt?
Total Male Population of Fort Hunt is 7,906.
What is the Total Female Population of Fort Hunt?
Total Female Population of Fort Hunt is 8,103.
What is the Ratio of Males per 100 Females in Fort Hunt?
There are 97.57 Males per 100 Females in Fort Hunt.
What is the Ratio of Females per 100 Males in Fort Hunt?
There are 102.49 Females per 100 Males in Fort Hunt.
What is the Median Population Age in Fort Hunt?
Median Population Age in Fort Hunt is 46.2 Years.
What is the Average Family Size in Fort Hunt
Average Family Size in Fort Hunt is 3.1 People.
What is the Average Household Size in Fort Hunt
Average Household Size in Fort Hunt is 2.7 People.
How Large is the Labor Force in Fort Hunt?
There are 7,956 People in the Labor Forcein in Fort Hunt.
What is the Percentage of People in the Labor Force in Fort Hunt?
64.1% of People are in the Labor Force in Fort Hunt.
What is the Unemployment Rate in Fort Hunt?
Unemployment Rate in Fort Hunt is 1.7%.