Idylwood, VA Map & Demographics
Idylwood Map
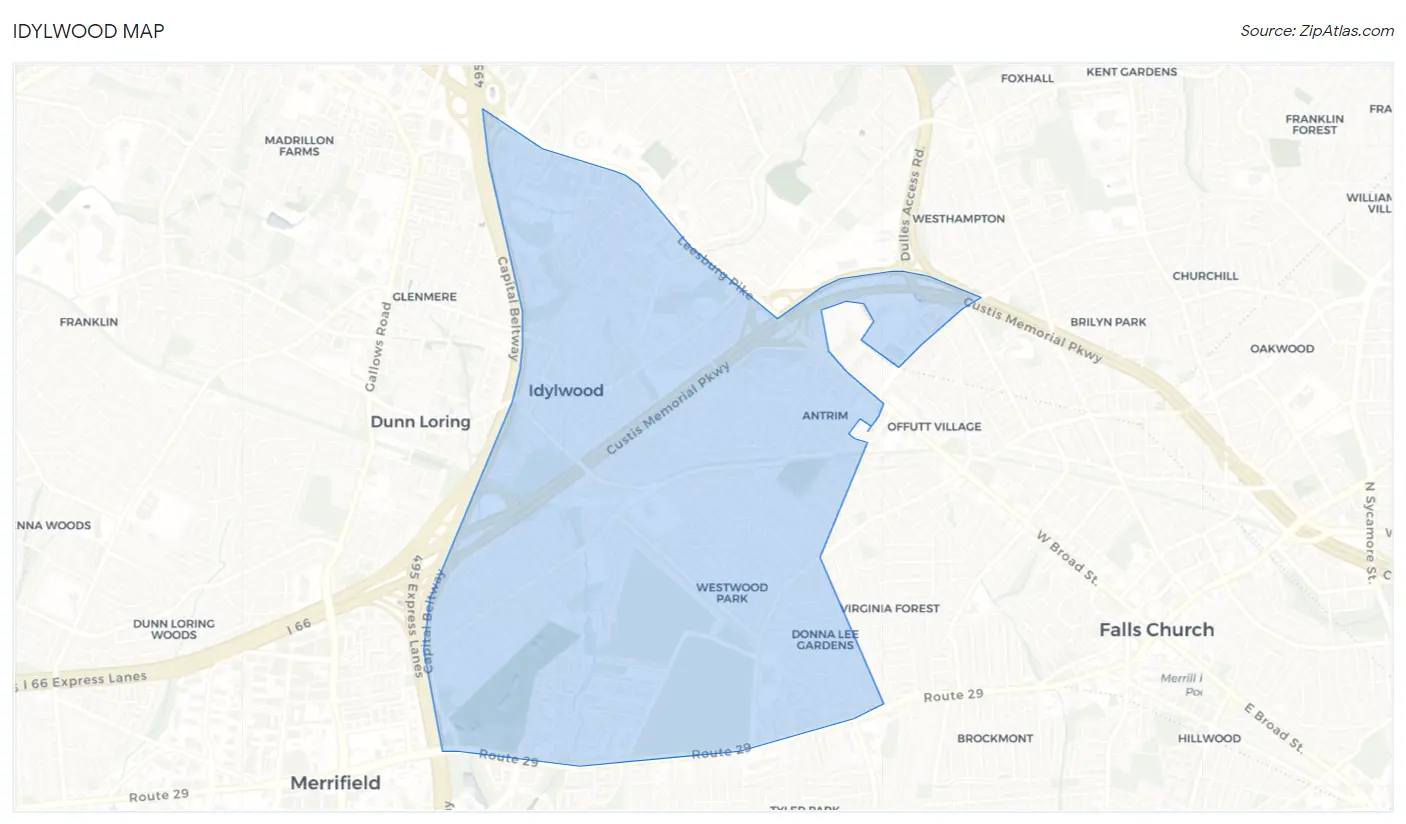
Idylwood Overview
$62,369
PER CAPITA INCOME
$151,467
AVG FAMILY INCOME
$112,677
AVG HOUSEHOLD INCOME
34.3%
WAGE / INCOME GAP [ % ]
65.7¢/ $1
WAGE / INCOME GAP [ $ ]
0.44
INEQUALITY / GINI INDEX
17,788
TOTAL POPULATION
8,875
MALE POPULATION
8,913
FEMALE POPULATION
99.57
MALES / 100 FEMALES
100.43
FEMALES / 100 MALES
36.5
MEDIAN AGE
3.2
AVG FAMILY SIZE
2.5
AVG HOUSEHOLD SIZE
10,230
LABOR FORCE [ PEOPLE ]
72.7%
PERCENT IN LABOR FORCE
2.4%
UNEMPLOYMENT RATE
Income in Idylwood
Income Overview in Idylwood
Per Capita Income in Idylwood is $62,369, while median incomes of families and households are $151,467 and $112,677 respectively.
| Characteristic | Number | Measure |
| Per Capita Income | 17,788 | $62,369 |
| Median Family Income | 4,389 | $151,467 |
| Mean Family Income | 4,389 | $184,705 |
| Median Household Income | 7,071 | $112,677 |
| Mean Household Income | 7,071 | $155,255 |
| Income Deficit | 4,389 | $0 |
| Wage / Income Gap (%) | 17,788 | 34.31% |
| Wage / Income Gap ($) | 17,788 | 65.69¢ per $1 |
| Gini / Inequality Index | 17,788 | 0.44 |
Earnings by Sex in Idylwood
Average Earnings in Idylwood are $67,662, $85,979 for men and $56,481 for women, a difference of 34.3%.
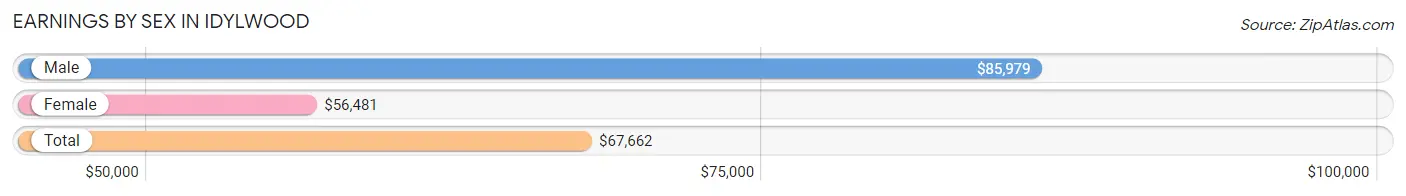
| Sex | Number | Average Earnings |
| Male | 5,702 (53.2%) | $85,979 |
| Female | 5,021 (46.8%) | $56,481 |
| Total | 10,723 (100.0%) | $67,662 |
Earnings by Sex by Income Bracket in Idylwood
The most common earnings brackets in Idylwood are $100,000+ for men (2,247 | 39.4%) and $100,000+ for women (1,467 | 29.2%).
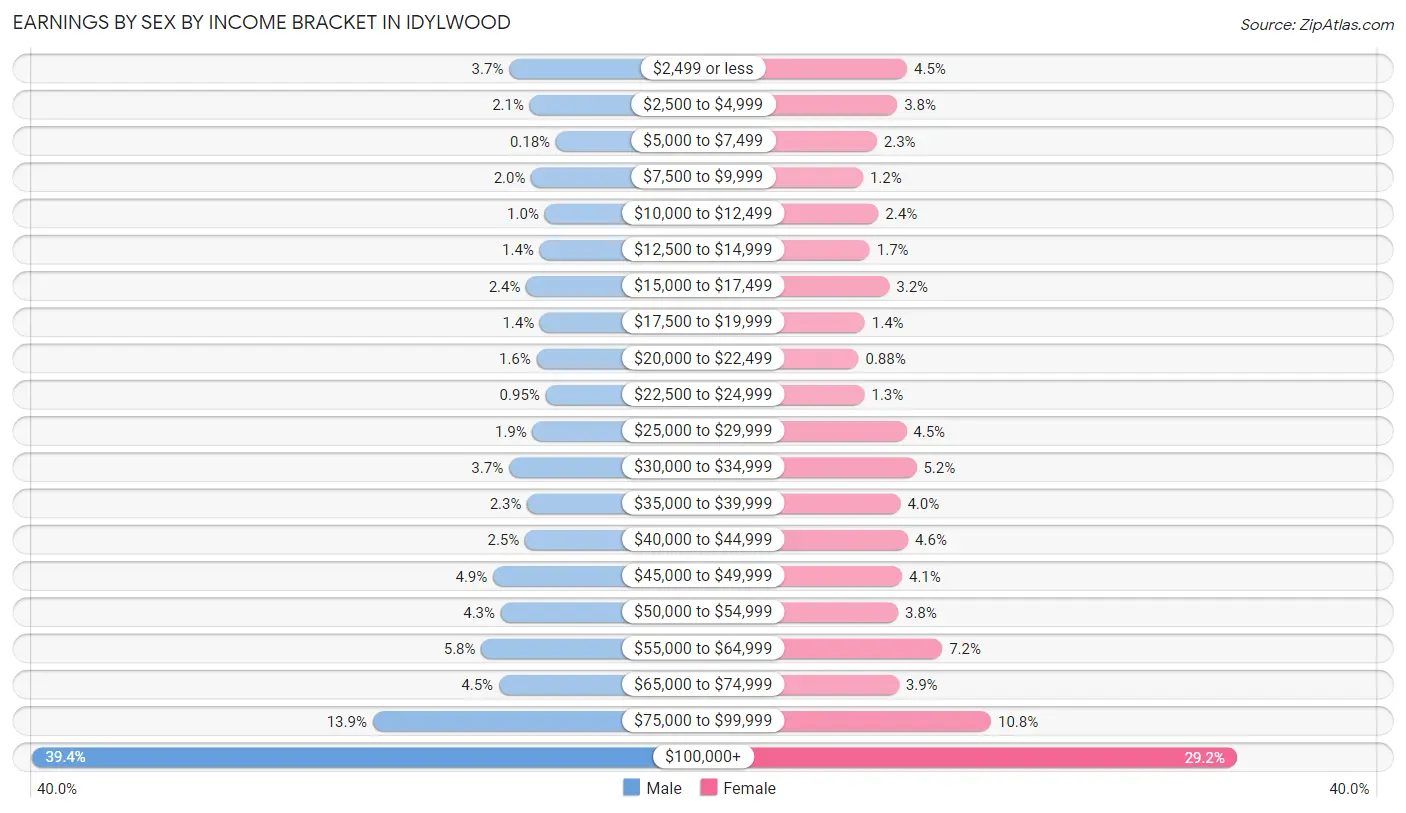
| Income | Male | Female |
| $2,499 or less | 210 (3.7%) | 227 (4.5%) |
| $2,500 to $4,999 | 122 (2.1%) | 190 (3.8%) |
| $5,000 to $7,499 | 10 (0.2%) | 113 (2.2%) |
| $7,500 to $9,999 | 116 (2.0%) | 61 (1.2%) |
| $10,000 to $12,499 | 58 (1.0%) | 119 (2.4%) |
| $12,500 to $14,999 | 80 (1.4%) | 87 (1.7%) |
| $15,000 to $17,499 | 137 (2.4%) | 160 (3.2%) |
| $17,500 to $19,999 | 78 (1.4%) | 68 (1.3%) |
| $20,000 to $22,499 | 93 (1.6%) | 44 (0.9%) |
| $22,500 to $24,999 | 54 (0.9%) | 67 (1.3%) |
| $25,000 to $29,999 | 110 (1.9%) | 224 (4.5%) |
| $30,000 to $34,999 | 211 (3.7%) | 262 (5.2%) |
| $35,000 to $39,999 | 133 (2.3%) | 202 (4.0%) |
| $40,000 to $44,999 | 142 (2.5%) | 231 (4.6%) |
| $45,000 to $49,999 | 279 (4.9%) | 208 (4.1%) |
| $50,000 to $54,999 | 246 (4.3%) | 193 (3.8%) |
| $55,000 to $64,999 | 329 (5.8%) | 359 (7.1%) |
| $65,000 to $74,999 | 254 (4.4%) | 196 (3.9%) |
| $75,000 to $99,999 | 793 (13.9%) | 543 (10.8%) |
| $100,000+ | 2,247 (39.4%) | 1,467 (29.2%) |
| Total | 5,702 (100.0%) | 5,021 (100.0%) |
Earnings by Sex by Educational Attainment in Idylwood
Average earnings in Idylwood are $90,698 for men and $63,246 for women, a difference of 30.3%. Men with an educational attainment of graduate degree enjoy the highest average annual earnings of $126,038, while those with less than high school education earn the least with $51,442. Women with an educational attainment of graduate degree earn the most with the average annual earnings of $97,121, while those with less than high school education have the smallest earnings of $30,083.
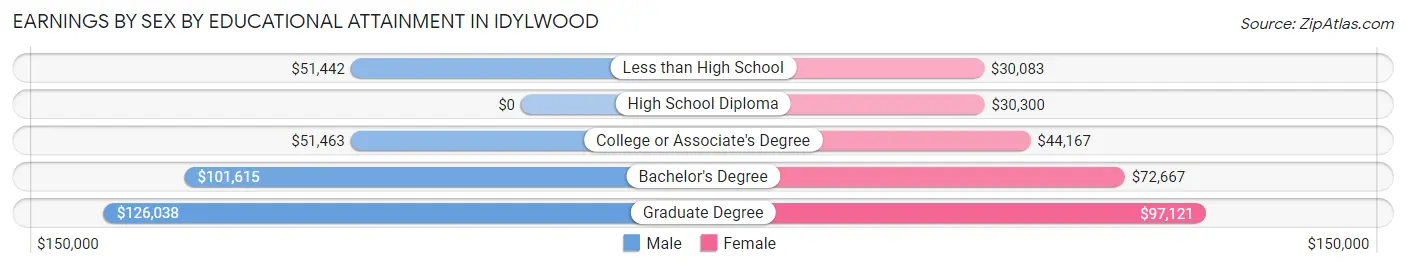
| Educational Attainment | Male Income | Female Income |
| Less than High School | $51,442 | $30,083 |
| High School Diploma | - | - |
| College or Associate's Degree | $51,463 | $44,167 |
| Bachelor's Degree | $101,615 | $72,667 |
| Graduate Degree | $126,038 | $97,121 |
| Total | $90,698 | $63,246 |
Family Income in Idylwood
Family Income Brackets in Idylwood
According to the Idylwood family income data, there are 1,650 families falling into the $200,000+ income range, which is the most common income bracket and makes up 37.6% of all families. Conversely, the $10,000 to $14,999 income bracket is the least frequent group with only 13 families (0.3%) belonging to this category.
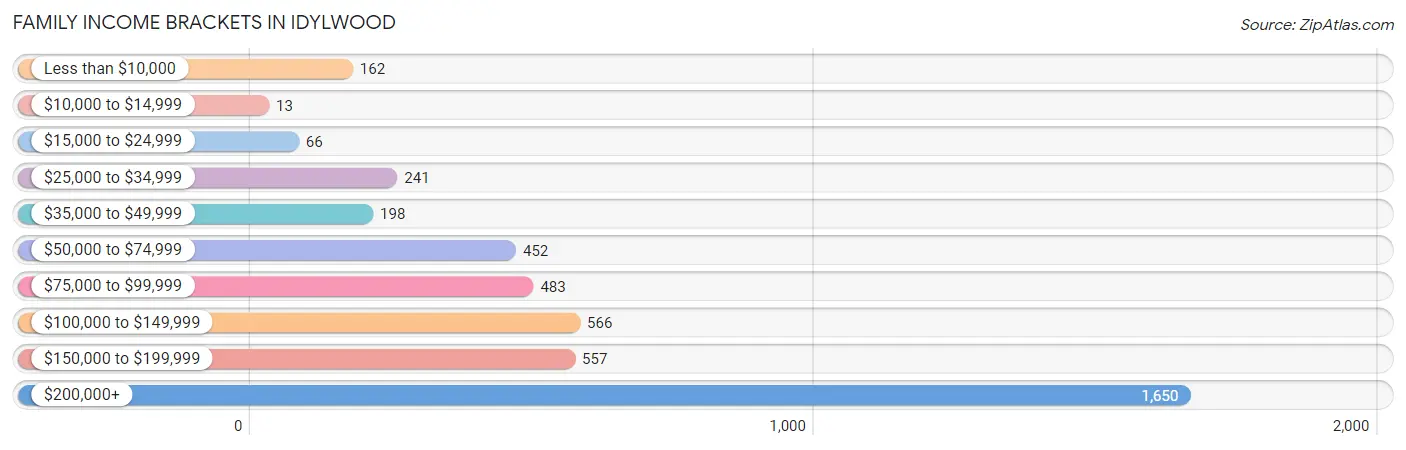
| Income Bracket | # Families | % Families |
| Less than $10,000 | 162 | 3.7% |
| $10,000 to $14,999 | 13 | 0.3% |
| $15,000 to $24,999 | 66 | 1.5% |
| $25,000 to $34,999 | 241 | 5.5% |
| $35,000 to $49,999 | 198 | 4.5% |
| $50,000 to $74,999 | 452 | 10.3% |
| $75,000 to $99,999 | 483 | 11.0% |
| $100,000 to $149,999 | 566 | 12.9% |
| $150,000 to $199,999 | 557 | 12.7% |
| $200,000+ | 1,650 | 37.6% |
Family Income by Famaliy Size in Idylwood
6-person families (59 | 1.3%) account for the highest median family income in Idylwood with $230,750 per family, while 2-person families (1,647 | 37.5%) have the highest median income of $59,532 per family member.
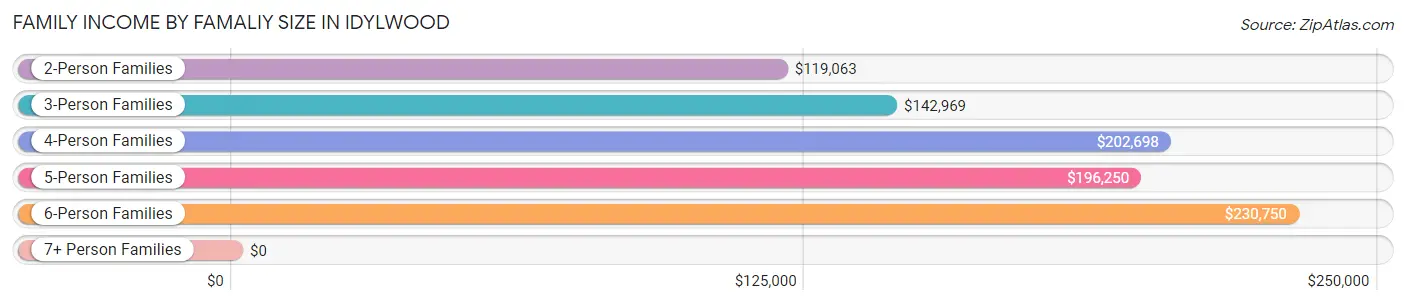
| Income Bracket | # Families | Median Income |
| 2-Person Families | 1,647 (37.5%) | $119,063 |
| 3-Person Families | 1,134 (25.8%) | $142,969 |
| 4-Person Families | 1,244 (28.3%) | $202,698 |
| 5-Person Families | 304 (6.9%) | $196,250 |
| 6-Person Families | 59 (1.3%) | $230,750 |
| 7+ Person Families | 1 (0.0%) | $0 |
| Total | 4,389 (100.0%) | $151,467 |
Family Income by Number of Earners in Idylwood
The median family income in Idylwood is $151,467, with families comprising 2 earners (2,165) having the highest median family income of $207,831, while families with no earners (394) have the lowest median family income of $60,000, accounting for 49.3% and 9.0% of families, respectively.
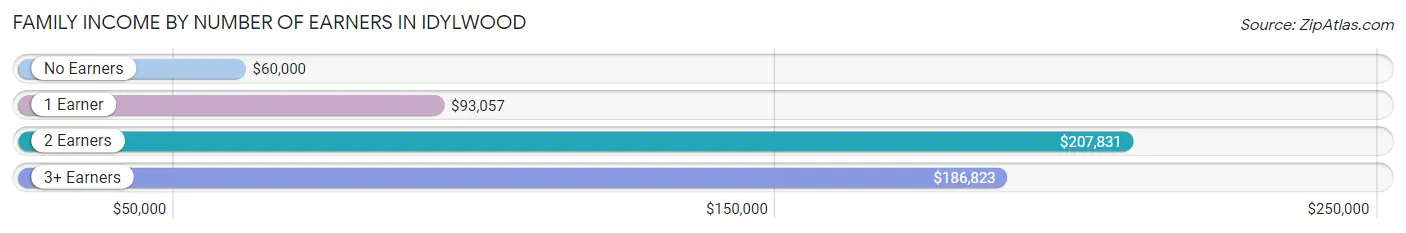
| Number of Earners | # Families | Median Income |
| No Earners | 394 (9.0%) | $60,000 |
| 1 Earner | 1,331 (30.3%) | $93,057 |
| 2 Earners | 2,165 (49.3%) | $207,831 |
| 3+ Earners | 499 (11.4%) | $186,823 |
| Total | 4,389 (100.0%) | $151,467 |
Household Income in Idylwood
Household Income Brackets in Idylwood
With 1,853 households falling in the category, the $200,000+ income range is the most frequent in Idylwood, accounting for 26.2% of all households. In contrast, only 57 households (0.8%) fall into the $10,000 to $14,999 income bracket, making it the least populous group.
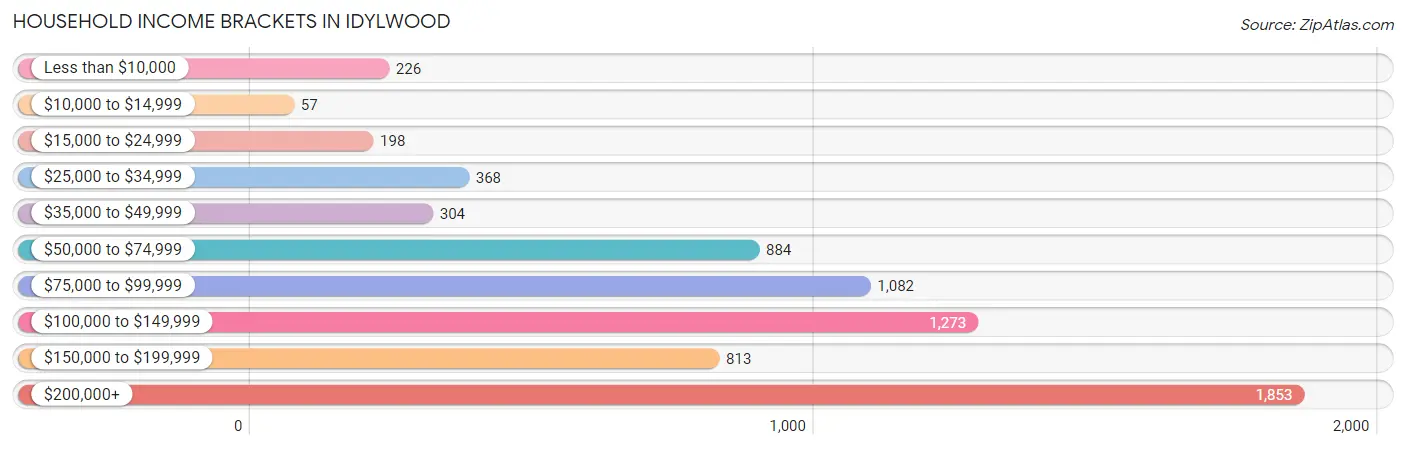
| Income Bracket | # Households | % Households |
| Less than $10,000 | 226 | 3.2% |
| $10,000 to $14,999 | 57 | 0.8% |
| $15,000 to $24,999 | 198 | 2.8% |
| $25,000 to $34,999 | 368 | 5.2% |
| $35,000 to $49,999 | 304 | 4.3% |
| $50,000 to $74,999 | 884 | 12.5% |
| $75,000 to $99,999 | 1,082 | 15.3% |
| $100,000 to $149,999 | 1,273 | 18.0% |
| $150,000 to $199,999 | 813 | 11.5% |
| $200,000+ | 1,853 | 26.2% |
Household Income by Householder Age in Idylwood
The median household income in Idylwood is $112,677, with the highest median household income of $141,824 found in the 45 to 64 years age bracket for the primary householder. A total of 2,414 households (34.1%) fall into this category. Meanwhile, the 15 to 24 years age bracket for the primary householder has the lowest median household income of $57,273, with 258 households (3.6%) in this group.
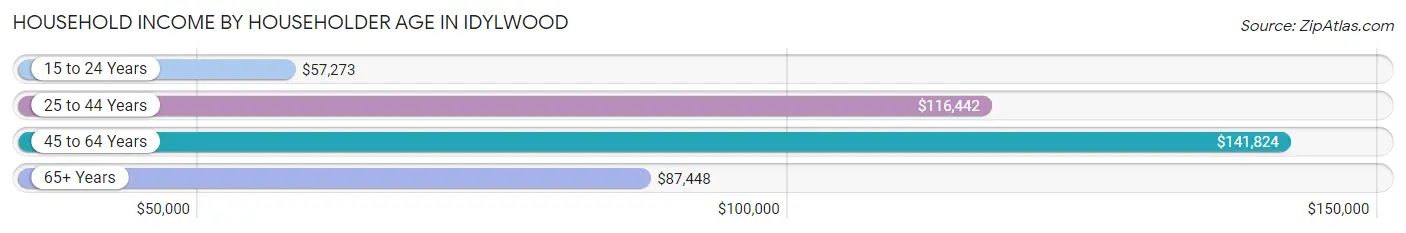
| Income Bracket | # Households | Median Income |
| 15 to 24 Years | 258 (3.6%) | $57,273 |
| 25 to 44 Years | 3,100 (43.8%) | $116,442 |
| 45 to 64 Years | 2,414 (34.1%) | $141,824 |
| 65+ Years | 1,299 (18.4%) | $87,448 |
| Total | 7,071 (100.0%) | $112,677 |
Poverty in Idylwood
Income Below Poverty by Sex and Age in Idylwood
With 6.2% poverty level for males and 6.8% for females among the residents of Idylwood, 15 year old males and 18 to 24 year old females are the most vulnerable to poverty, with 37 males (25.2%) and 117 females (21.7%) in their respective age groups living below the poverty level.
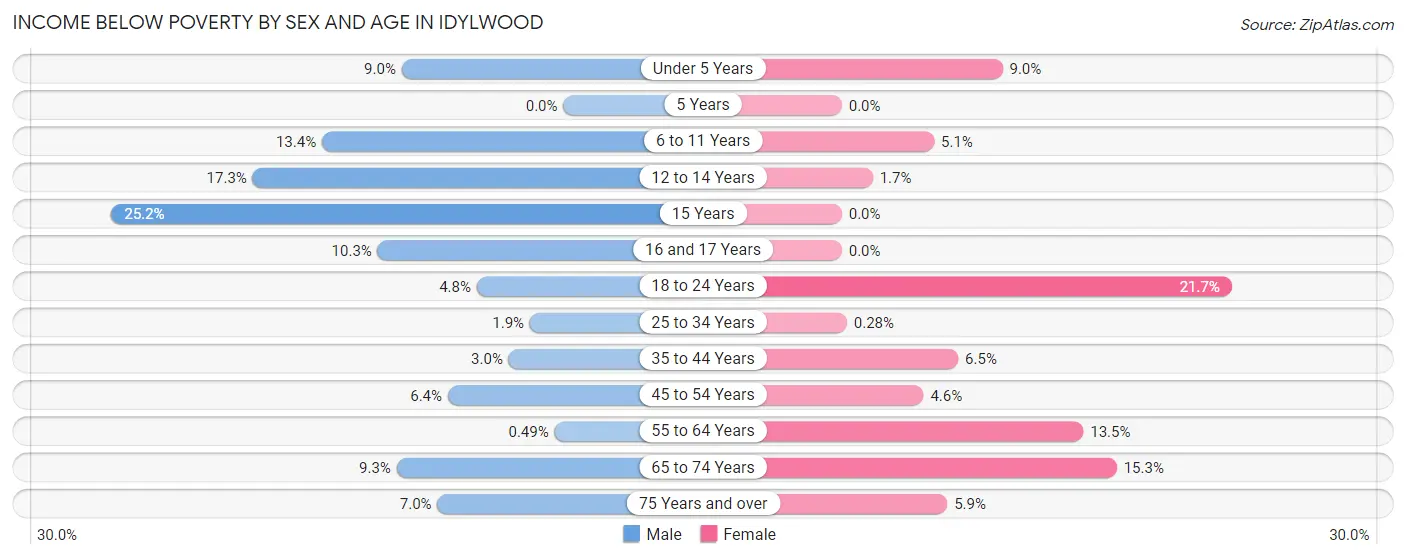
| Age Bracket | Male | Female |
| Under 5 Years | 57 (9.0%) | 40 (8.9%) |
| 5 Years | 0 (0.0%) | 0 (0.0%) |
| 6 to 11 Years | 88 (13.4%) | 33 (5.1%) |
| 12 to 14 Years | 82 (17.3%) | 4 (1.7%) |
| 15 Years | 37 (25.2%) | 0 (0.0%) |
| 16 and 17 Years | 18 (10.3%) | 0 (0.0%) |
| 18 to 24 Years | 38 (4.8%) | 117 (21.7%) |
| 25 to 34 Years | 22 (1.9%) | 4 (0.3%) |
| 35 to 44 Years | 55 (3.0%) | 102 (6.5%) |
| 45 to 54 Years | 72 (6.4%) | 55 (4.5%) |
| 55 to 64 Years | 4 (0.5%) | 111 (13.5%) |
| 65 to 74 Years | 49 (9.3%) | 111 (15.3%) |
| 75 Years and over | 26 (7.0%) | 30 (5.9%) |
| Total | 548 (6.2%) | 607 (6.8%) |
Income Above Poverty by Sex and Age in Idylwood
According to the poverty statistics in Idylwood, males aged 5 years and females aged 5 years are the age groups that are most secure financially, with 100.0% of males and 100.0% of females in these age groups living above the poverty line.
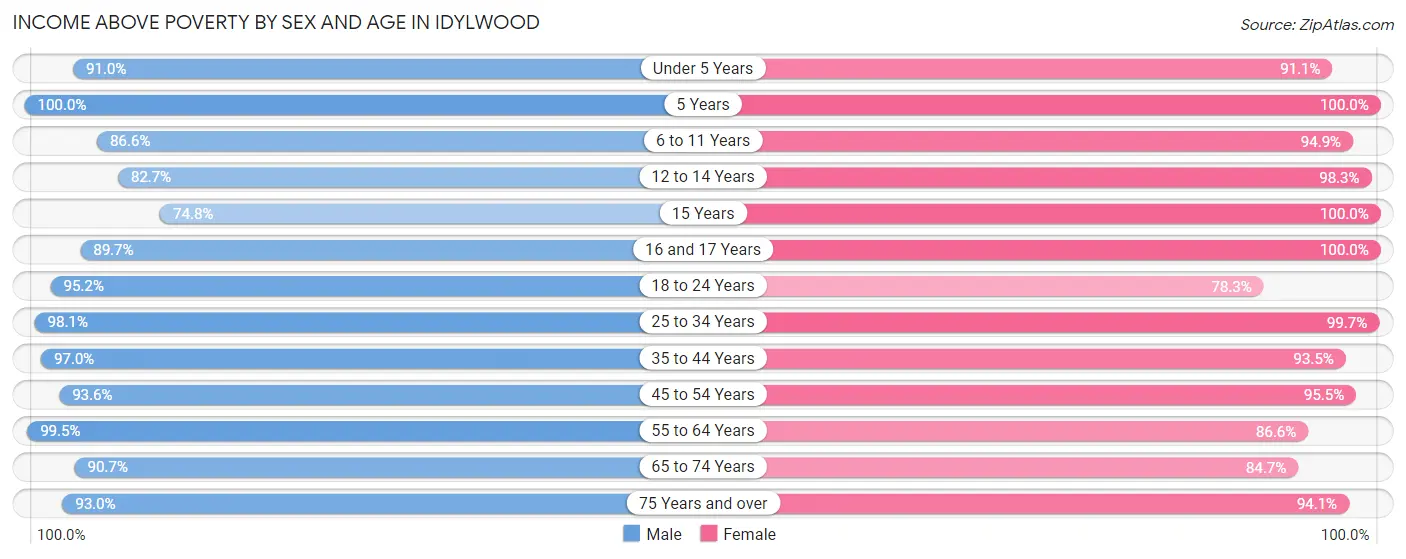
| Age Bracket | Male | Female |
| Under 5 Years | 576 (91.0%) | 407 (91.0%) |
| 5 Years | 76 (100.0%) | 47 (100.0%) |
| 6 to 11 Years | 567 (86.6%) | 609 (94.9%) |
| 12 to 14 Years | 392 (82.7%) | 228 (98.3%) |
| 15 Years | 110 (74.8%) | 260 (100.0%) |
| 16 and 17 Years | 156 (89.7%) | 465 (100.0%) |
| 18 to 24 Years | 751 (95.2%) | 422 (78.3%) |
| 25 to 34 Years | 1,159 (98.1%) | 1,433 (99.7%) |
| 35 to 44 Years | 1,757 (97.0%) | 1,473 (93.5%) |
| 45 to 54 Years | 1,047 (93.6%) | 1,153 (95.5%) |
| 55 to 64 Years | 809 (99.5%) | 714 (86.6%) |
| 65 to 74 Years | 479 (90.7%) | 614 (84.7%) |
| 75 Years and over | 345 (93.0%) | 481 (94.1%) |
| Total | 8,224 (93.8%) | 8,306 (93.2%) |
Income Below Poverty Among Married-Couple Families in Idylwood
The poverty statistics for married-couple families in Idylwood show that 4.1% or 142 of the total 3,447 families live below the poverty line. Families with 3 or 4 children have the highest poverty rate of 8.3%, comprising of 13 families. On the other hand, families with no children have the lowest poverty rate of 3.7%, which includes 52 families.
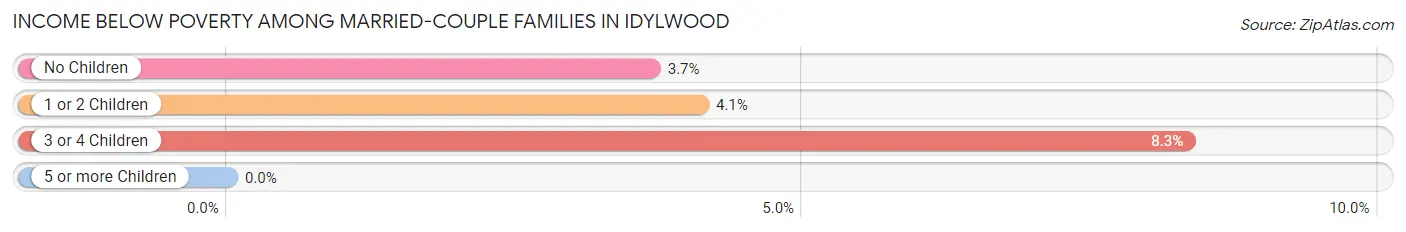
| Children | Above Poverty | Below Poverty |
| No Children | 1,361 (96.3%) | 52 (3.7%) |
| 1 or 2 Children | 1,801 (95.9%) | 77 (4.1%) |
| 3 or 4 Children | 143 (91.7%) | 13 (8.3%) |
| 5 or more Children | 0 (0.0%) | 0 (0.0%) |
| Total | 3,305 (95.9%) | 142 (4.1%) |
Income Below Poverty Among Single-Parent Households in Idylwood
According to the poverty data in Idylwood, 5.4% or 8 single-father households and 10.7% or 85 single-mother households are living below the poverty line. Among single-father households, those with 1 or 2 children have the highest poverty rate, with 8 households (8.5%) experiencing poverty. Likewise, among single-mother households, those with 3 or 4 children have the highest poverty rate, with 37 households (100.0%) falling below the poverty line.
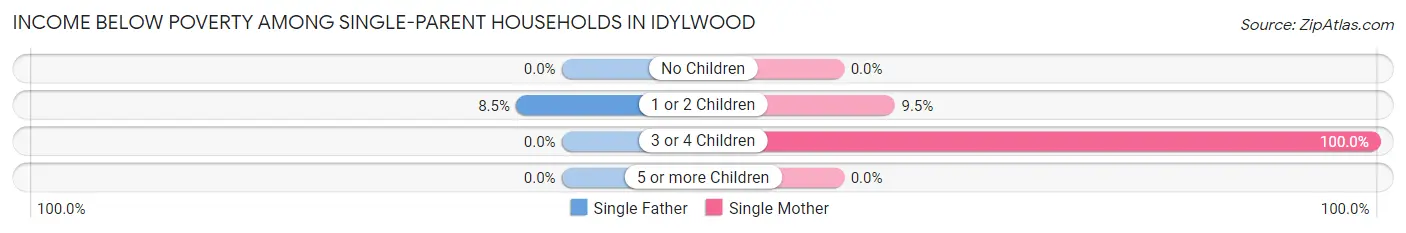
| Children | Single Father | Single Mother |
| No Children | 0 (0.0%) | 0 (0.0%) |
| 1 or 2 Children | 8 (8.5%) | 48 (9.5%) |
| 3 or 4 Children | 0 (0.0%) | 37 (100.0%) |
| 5 or more Children | 0 (0.0%) | 0 (0.0%) |
| Total | 8 (5.4%) | 85 (10.7%) |
Income Below Poverty Among Married-Couple vs Single-Parent Households in Idylwood
The poverty data for Idylwood shows that 142 of the married-couple family households (4.1%) and 93 of the single-parent households (9.9%) are living below the poverty level. Within the married-couple family households, those with 3 or 4 children have the highest poverty rate, with 13 households (8.3%) falling below the poverty line. Among the single-parent households, those with 3 or 4 children have the highest poverty rate, with 37 household (100.0%) living below poverty.
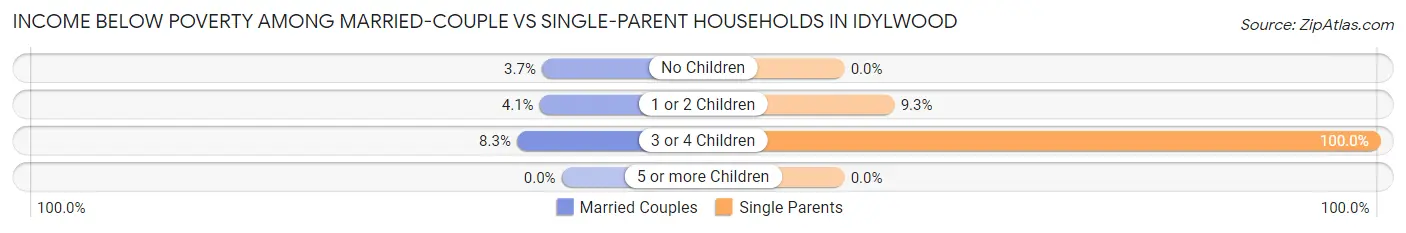
| Children | Married-Couple Families | Single-Parent Households |
| No Children | 52 (3.7%) | 0 (0.0%) |
| 1 or 2 Children | 77 (4.1%) | 56 (9.3%) |
| 3 or 4 Children | 13 (8.3%) | 37 (100.0%) |
| 5 or more Children | 0 (0.0%) | 0 (0.0%) |
| Total | 142 (4.1%) | 93 (9.9%) |
Race in Idylwood
The most populous races in Idylwood are White / Caucasian (9,663 | 54.3%), Asian (3,972 | 22.3%), and Hispanic or Latino (3,121 | 17.5%).
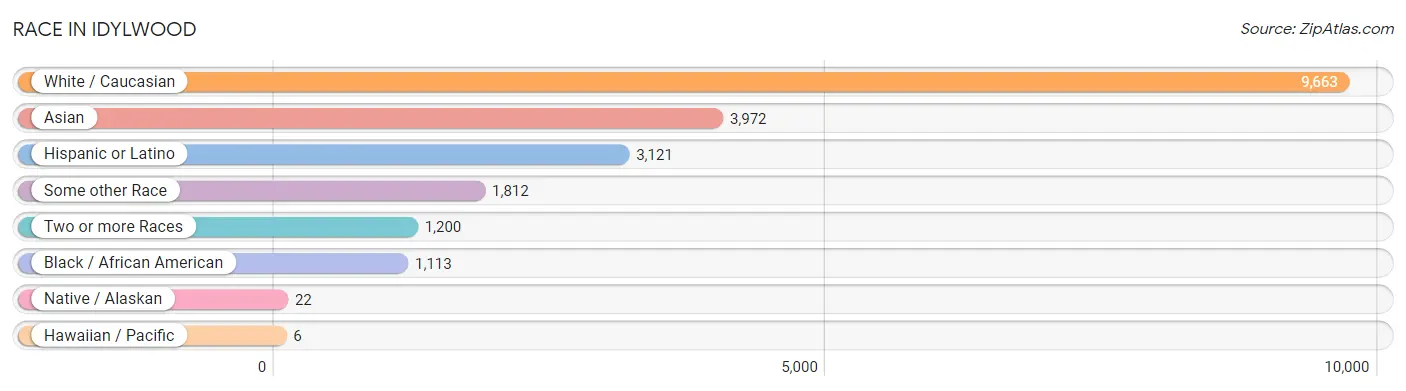
| Race | # Population | % Population |
| Asian | 3,972 | 22.3% |
| Black / African American | 1,113 | 6.3% |
| Hawaiian / Pacific | 6 | 0.0% |
| Hispanic or Latino | 3,121 | 17.5% |
| Native / Alaskan | 22 | 0.1% |
| White / Caucasian | 9,663 | 54.3% |
| Two or more Races | 1,200 | 6.8% |
| Some other Race | 1,812 | 10.2% |
| Total | 17,788 | 100.0% |
Ancestry in Idylwood
The most populous ancestries reported in Idylwood are English (1,720 | 9.7%), Irish (1,686 | 9.5%), German (1,614 | 9.1%), Thai (1,508 | 8.5%), and Central American (1,410 | 7.9%), together accounting for 44.6% of all Idylwood residents.
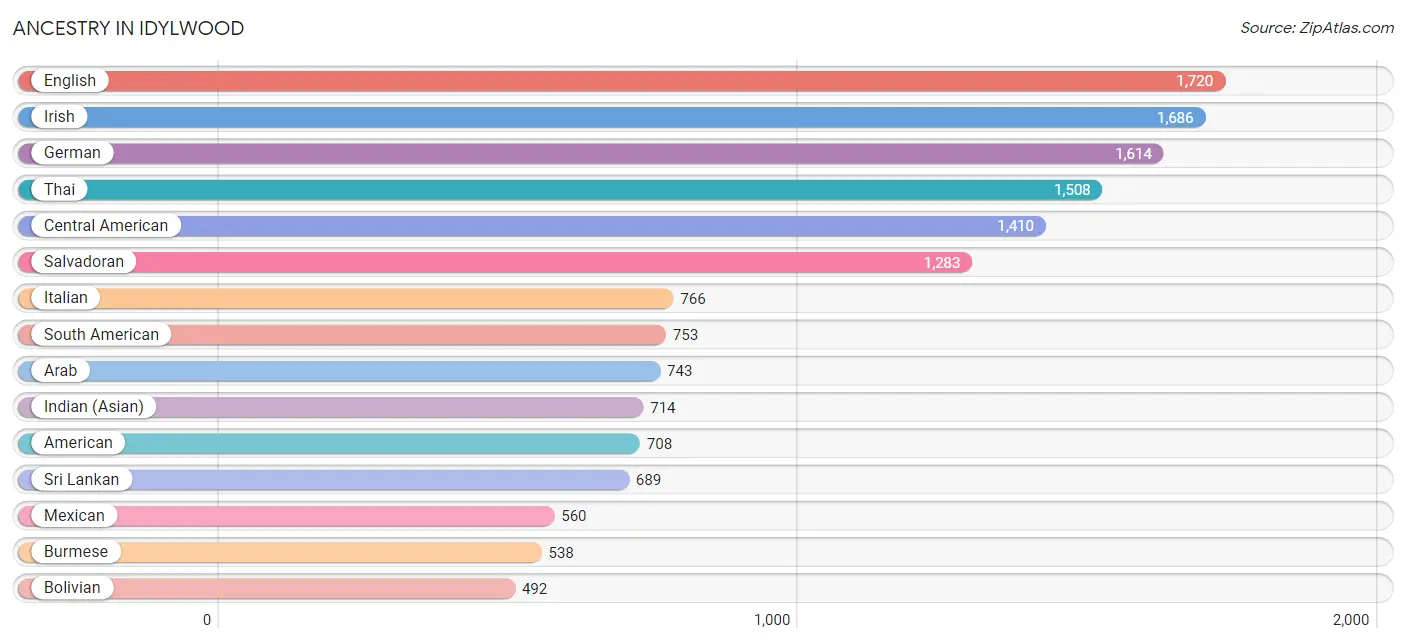
| Ancestry | # Population | % Population |
| Afghan | 56 | 0.3% |
| African | 52 | 0.3% |
| Albanian | 40 | 0.2% |
| American | 708 | 4.0% |
| Arab | 743 | 4.2% |
| Argentinean | 18 | 0.1% |
| Armenian | 22 | 0.1% |
| Australian | 28 | 0.2% |
| Austrian | 30 | 0.2% |
| Belgian | 38 | 0.2% |
| Bhutanese | 115 | 0.6% |
| Bolivian | 492 | 2.8% |
| Brazilian | 29 | 0.2% |
| British | 143 | 0.8% |
| Bulgarian | 205 | 1.1% |
| Burmese | 538 | 3.0% |
| Central American | 1,410 | 7.9% |
| Chilean | 15 | 0.1% |
| Colombian | 5 | 0.0% |
| Costa Rican | 27 | 0.2% |
| Croatian | 25 | 0.1% |
| Cuban | 91 | 0.5% |
| Czech | 15 | 0.1% |
| Danish | 43 | 0.2% |
| Dominican | 17 | 0.1% |
| Dutch | 74 | 0.4% |
| Eastern European | 37 | 0.2% |
| Ecuadorian | 67 | 0.4% |
| Egyptian | 170 | 1.0% |
| English | 1,720 | 9.7% |
| Estonian | 4 | 0.0% |
| Ethiopian | 73 | 0.4% |
| European | 295 | 1.7% |
| Filipino | 7 | 0.0% |
| Finnish | 19 | 0.1% |
| French | 223 | 1.3% |
| French Canadian | 10 | 0.1% |
| German | 1,614 | 9.1% |
| Greek | 143 | 0.8% |
| Guamanian / Chamorro | 40 | 0.2% |
| Guatemalan | 32 | 0.2% |
| Haitian | 10 | 0.1% |
| Honduran | 6 | 0.0% |
| Hungarian | 102 | 0.6% |
| Indian (Asian) | 714 | 4.0% |
| Iranian | 429 | 2.4% |
| Iraqi | 9 | 0.1% |
| Irish | 1,686 | 9.5% |
| Italian | 766 | 4.3% |
| Jamaican | 96 | 0.5% |
| Japanese | 51 | 0.3% |
| Jordanian | 55 | 0.3% |
| Korean | 160 | 0.9% |
| Laotian | 181 | 1.0% |
| Lebanese | 49 | 0.3% |
| Lithuanian | 57 | 0.3% |
| Malaysian | 14 | 0.1% |
| Mexican | 560 | 3.2% |
| Moroccan | 283 | 1.6% |
| Nicaraguan | 62 | 0.4% |
| Northern European | 11 | 0.1% |
| Norwegian | 148 | 0.8% |
| Pakistani | 40 | 0.2% |
| Palestinian | 44 | 0.3% |
| Paraguayan | 30 | 0.2% |
| Pennsylvania German | 28 | 0.2% |
| Peruvian | 116 | 0.6% |
| Polish | 415 | 2.3% |
| Portuguese | 56 | 0.3% |
| Puerto Rican | 81 | 0.5% |
| Romanian | 15 | 0.1% |
| Russian | 396 | 2.2% |
| Salvadoran | 1,283 | 7.2% |
| Scandinavian | 26 | 0.2% |
| Scotch-Irish | 130 | 0.7% |
| Scottish | 168 | 0.9% |
| Slavic | 12 | 0.1% |
| Slovak | 53 | 0.3% |
| Slovene | 31 | 0.2% |
| Somali | 283 | 1.6% |
| South African | 20 | 0.1% |
| South American | 753 | 4.2% |
| South American Indian | 8 | 0.0% |
| Spaniard | 124 | 0.7% |
| Spanish | 30 | 0.2% |
| Sri Lankan | 689 | 3.9% |
| Subsaharan African | 487 | 2.7% |
| Swedish | 170 | 1.0% |
| Swiss | 24 | 0.1% |
| Syrian | 21 | 0.1% |
| Thai | 1,508 | 8.5% |
| Trinidadian and Tobagonian | 33 | 0.2% |
| Turkish | 63 | 0.4% |
| Ukrainian | 93 | 0.5% |
| Venezuelan | 10 | 0.1% |
| Welsh | 222 | 1.3% |
| Zimbabwean | 85 | 0.5% | View All 97 Rows |
Immigrants in Idylwood
The most numerous immigrant groups reported in Idylwood came from Asia (3,785 | 21.3%), South Central Asia (2,088 | 11.7%), Latin America (1,916 | 10.8%), India (1,190 | 6.7%), and Central America (1,187 | 6.7%), together accounting for 57.2% of all Idylwood residents.
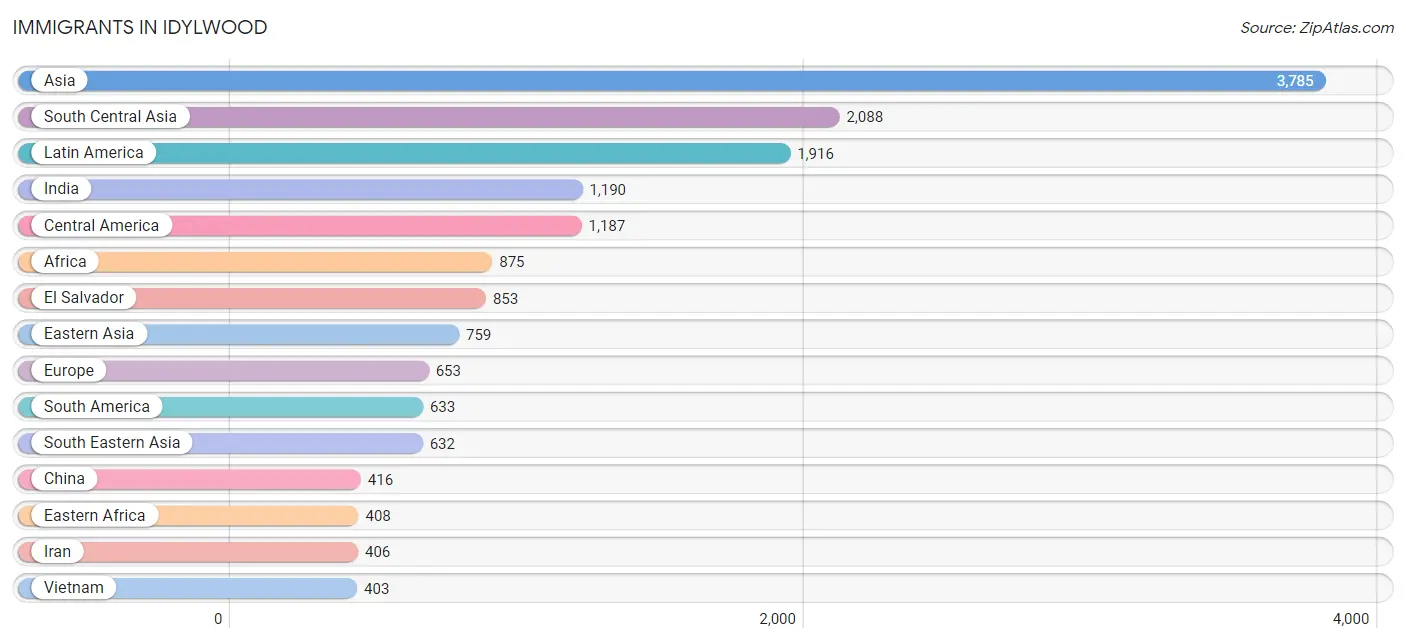
| Immigration Origin | # Population | % Population |
| Afghanistan | 56 | 0.3% |
| Africa | 875 | 4.9% |
| Albania | 16 | 0.1% |
| Argentina | 39 | 0.2% |
| Armenia | 22 | 0.1% |
| Asia | 3,785 | 21.3% |
| Australia | 36 | 0.2% |
| Belarus | 6 | 0.0% |
| Bolivia | 379 | 2.1% |
| Brazil | 19 | 0.1% |
| Bulgaria | 176 | 1.0% |
| Cambodia | 28 | 0.2% |
| Canada | 37 | 0.2% |
| Caribbean | 96 | 0.5% |
| Central America | 1,187 | 6.7% |
| Chile | 15 | 0.1% |
| China | 416 | 2.3% |
| Colombia | 31 | 0.2% |
| Costa Rica | 20 | 0.1% |
| Croatia | 14 | 0.1% |
| Cuba | 6 | 0.0% |
| Czechoslovakia | 12 | 0.1% |
| Eastern Africa | 408 | 2.3% |
| Eastern Asia | 759 | 4.3% |
| Eastern Europe | 368 | 2.1% |
| Ecuador | 9 | 0.1% |
| Egypt | 74 | 0.4% |
| El Salvador | 853 | 4.8% |
| England | 9 | 0.1% |
| Ethiopia | 54 | 0.3% |
| Europe | 653 | 3.7% |
| Germany | 153 | 0.9% |
| Ghana | 24 | 0.1% |
| Guatemala | 13 | 0.1% |
| Guyana | 13 | 0.1% |
| Haiti | 9 | 0.1% |
| Honduras | 93 | 0.5% |
| Hong Kong | 70 | 0.4% |
| Hungary | 13 | 0.1% |
| India | 1,190 | 6.7% |
| Indonesia | 36 | 0.2% |
| Iran | 406 | 2.3% |
| Iraq | 9 | 0.1% |
| Ireland | 7 | 0.0% |
| Israel | 55 | 0.3% |
| Jamaica | 81 | 0.5% |
| Japan | 52 | 0.3% |
| Jordan | 9 | 0.1% |
| Kazakhstan | 16 | 0.1% |
| Kenya | 212 | 1.2% |
| Korea | 291 | 1.6% |
| Kuwait | 29 | 0.2% |
| Latin America | 1,916 | 10.8% |
| Lebanon | 32 | 0.2% |
| Lithuania | 9 | 0.1% |
| Mexico | 186 | 1.1% |
| Moldova | 8 | 0.0% |
| Morocco | 283 | 1.6% |
| Nepal | 272 | 1.5% |
| Nicaragua | 22 | 0.1% |
| Northern Africa | 357 | 2.0% |
| Northern Europe | 50 | 0.3% |
| Oceania | 36 | 0.2% |
| Pakistan | 74 | 0.4% |
| Peru | 88 | 0.5% |
| Philippines | 120 | 0.7% |
| Poland | 7 | 0.0% |
| Portugal | 31 | 0.2% |
| Russia | 88 | 0.5% |
| Somalia | 111 | 0.6% |
| South Africa | 10 | 0.1% |
| South America | 633 | 3.6% |
| South Central Asia | 2,088 | 11.7% |
| South Eastern Asia | 632 | 3.5% |
| Southern Europe | 82 | 0.5% |
| Spain | 51 | 0.3% |
| Sri Lanka | 62 | 0.4% |
| Syria | 9 | 0.1% |
| Taiwan | 8 | 0.0% |
| Thailand | 45 | 0.3% |
| Turkey | 83 | 0.5% |
| Ukraine | 19 | 0.1% |
| Uzbekistan | 12 | 0.1% |
| Venezuela | 10 | 0.1% |
| Vietnam | 403 | 2.3% |
| Western Africa | 24 | 0.1% |
| Western Asia | 290 | 1.6% |
| Western Europe | 153 | 0.9% |
| Yemen | 19 | 0.1% |
| Zimbabwe | 31 | 0.2% | View All 90 Rows |
Sex and Age in Idylwood
Sex and Age in Idylwood
The most populous age groups in Idylwood are 35 to 39 Years (957 | 10.8%) for men and 30 to 34 Years (926 | 10.4%) for women.
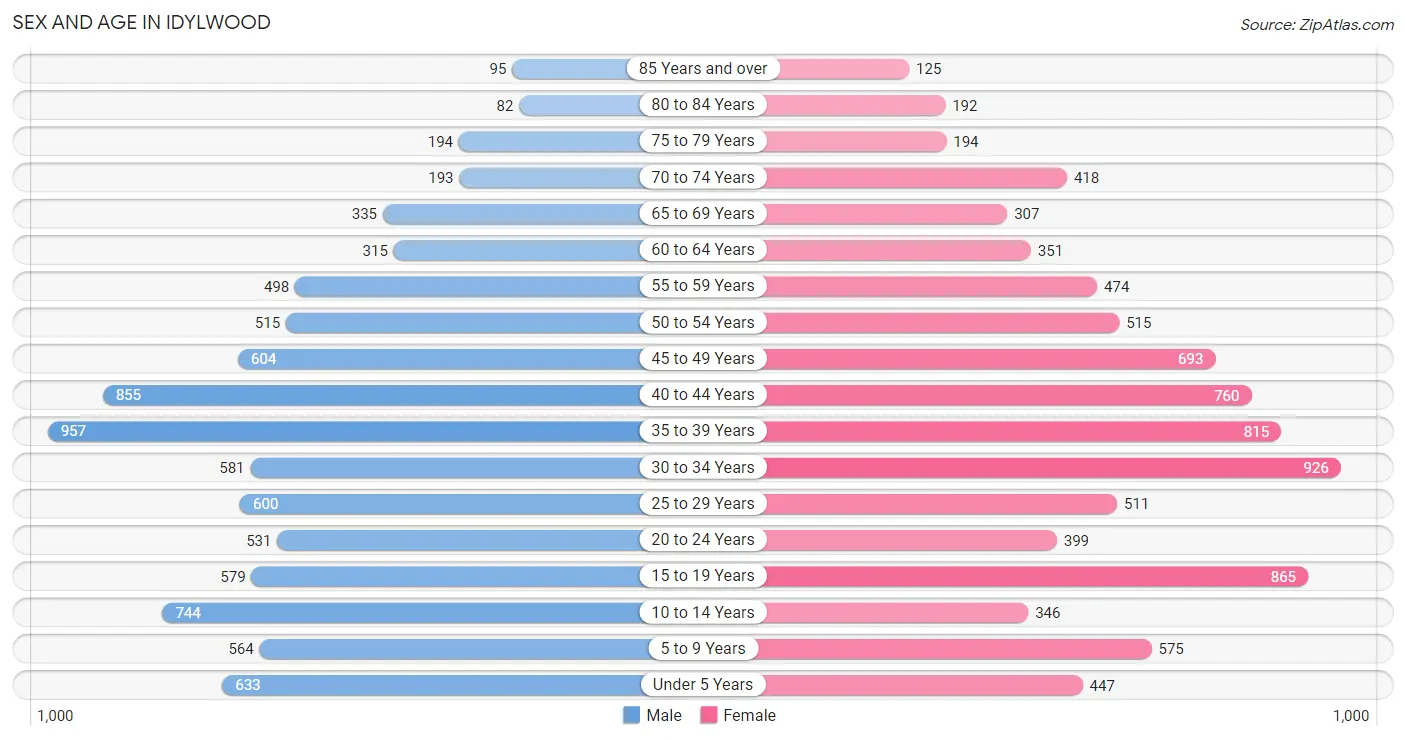
| Age Bracket | Male | Female |
| Under 5 Years | 633 (7.1%) | 447 (5.0%) |
| 5 to 9 Years | 564 (6.4%) | 575 (6.5%) |
| 10 to 14 Years | 744 (8.4%) | 346 (3.9%) |
| 15 to 19 Years | 579 (6.5%) | 865 (9.7%) |
| 20 to 24 Years | 531 (6.0%) | 399 (4.5%) |
| 25 to 29 Years | 600 (6.8%) | 511 (5.7%) |
| 30 to 34 Years | 581 (6.6%) | 926 (10.4%) |
| 35 to 39 Years | 957 (10.8%) | 815 (9.1%) |
| 40 to 44 Years | 855 (9.6%) | 760 (8.5%) |
| 45 to 49 Years | 604 (6.8%) | 693 (7.8%) |
| 50 to 54 Years | 515 (5.8%) | 515 (5.8%) |
| 55 to 59 Years | 498 (5.6%) | 474 (5.3%) |
| 60 to 64 Years | 315 (3.5%) | 351 (3.9%) |
| 65 to 69 Years | 335 (3.8%) | 307 (3.4%) |
| 70 to 74 Years | 193 (2.2%) | 418 (4.7%) |
| 75 to 79 Years | 194 (2.2%) | 194 (2.2%) |
| 80 to 84 Years | 82 (0.9%) | 192 (2.1%) |
| 85 Years and over | 95 (1.1%) | 125 (1.4%) |
| Total | 8,875 (100.0%) | 8,913 (100.0%) |
Families and Households in Idylwood
Median Family Size in Idylwood
The median family size in Idylwood is 3.20 persons per family, with married-couple families (3,447 | 78.5%) accounting for the largest median family size of 3.3 persons per family. On the other hand, single female/mother families (794 | 18.1%) represent the smallest median family size with 2.80 persons per family.
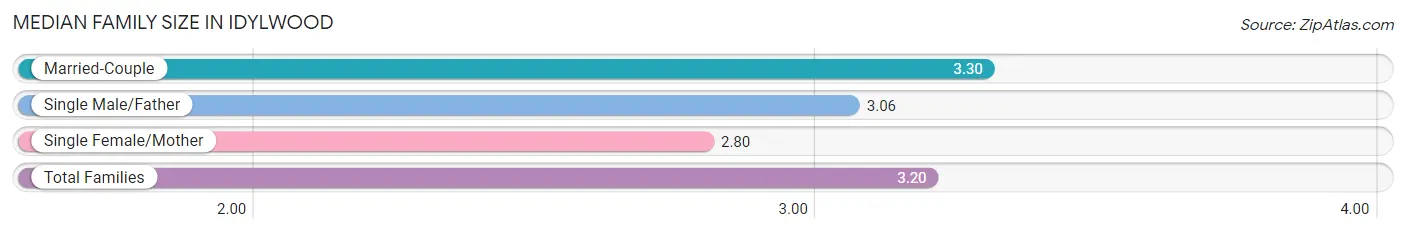
| Family Type | # Families | Family Size |
| Married-Couple | 3,447 (78.5%) | 3.30 |
| Single Male/Father | 148 (3.4%) | 3.06 |
| Single Female/Mother | 794 (18.1%) | 2.80 |
| Total Families | 4,389 (100.0%) | 3.20 |
Median Household Size in Idylwood
The median household size in Idylwood is 2.51 persons per household, with married-couple households (3,447 | 48.7%) accounting for the largest median household size of 3.33 persons per household. non-family households (2,682 | 37.9%) represent the smallest median household size with 1.28 persons per household.
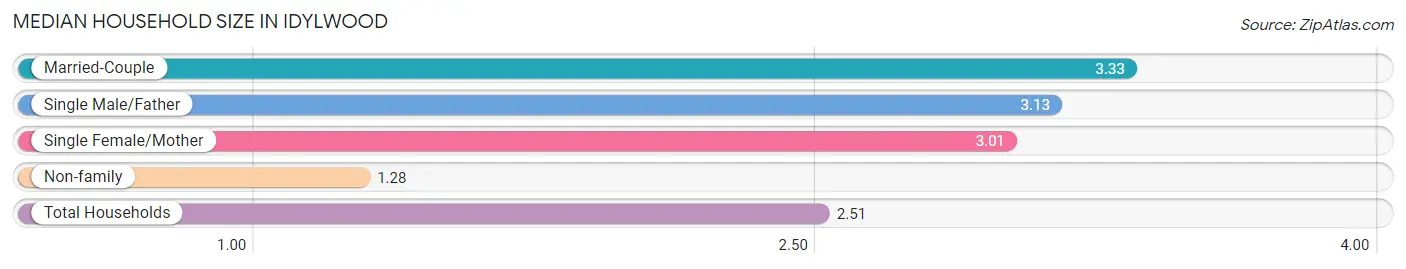
| Household Type | # Households | Household Size |
| Married-Couple | 3,447 (48.7%) | 3.33 |
| Single Male/Father | 148 (2.1%) | 3.13 |
| Single Female/Mother | 794 (11.2%) | 3.01 |
| Non-family | 2,682 (37.9%) | 1.28 |
| Total Households | 7,071 (100.0%) | 2.51 |
Household Size by Marriage Status in Idylwood
Out of a total of 7,071 households in Idylwood, 4,389 (62.1%) are family households, while 2,682 (37.9%) are nonfamily households. The most numerous type of family households are 2-person households, comprising 1,535, and the most common type of nonfamily households are 1-person households, comprising 2,097.
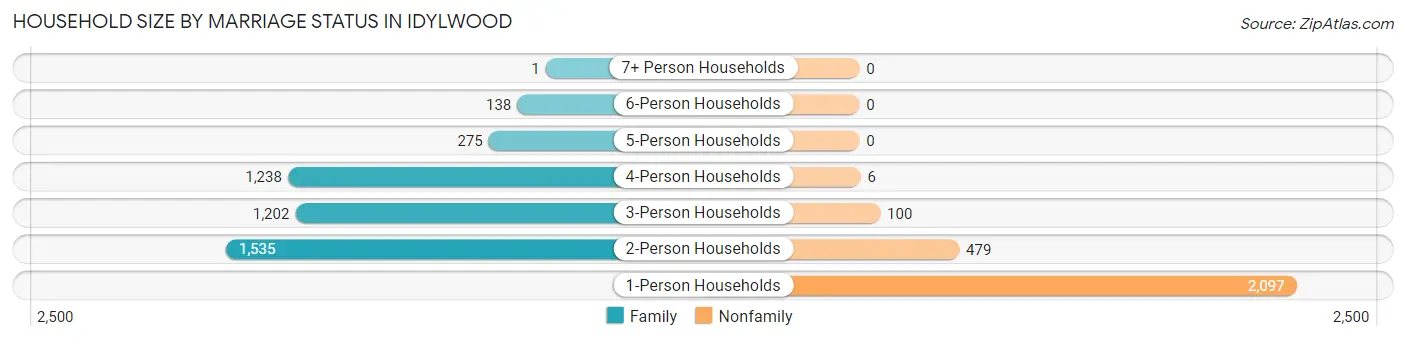
| Household Size | Family Households | Nonfamily Households |
| 1-Person Households | - | 2,097 (29.7%) |
| 2-Person Households | 1,535 (21.7%) | 479 (6.8%) |
| 3-Person Households | 1,202 (17.0%) | 100 (1.4%) |
| 4-Person Households | 1,238 (17.5%) | 6 (0.1%) |
| 5-Person Households | 275 (3.9%) | 0 (0.0%) |
| 6-Person Households | 138 (1.9%) | 0 (0.0%) |
| 7+ Person Households | 1 (0.0%) | 0 (0.0%) |
| Total | 4,389 (62.1%) | 2,682 (37.9%) |
Female Fertility in Idylwood
Fertility by Age in Idylwood
Average fertility rate in Idylwood is 45.0 births per 1,000 women. Women in the age bracket of 20 to 34 years have the highest fertility rate with 69.0 births per 1,000 women. Women in the age bracket of 20 to 34 years acount for 56.0% of all women with births.
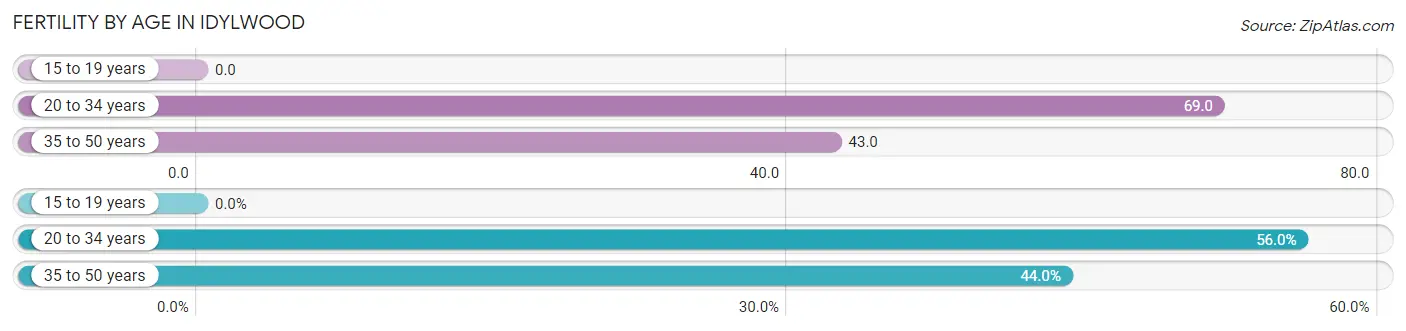
| Age Bracket | Women with Births | Births / 1,000 Women |
| 15 to 19 years | 0 (0.0%) | 0.0 |
| 20 to 34 years | 126 (56.0%) | 69.0 |
| 35 to 50 years | 99 (44.0%) | 43.0 |
| Total | 225 (100.0%) | 45.0 |
Fertility by Age by Marriage Status in Idylwood
91.1% of women with births (225) in Idylwood are married. The highest percentage of unmarried women with births falls into 35 to 50 years age bracket with 20.2% of them unmarried at the time of birth, while the lowest percentage of unmarried women with births belong to 20 to 34 years age bracket with 0.0% of them unmarried.
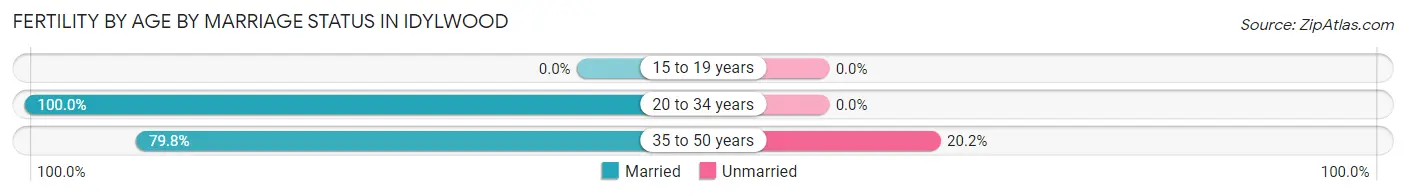
| Age Bracket | Married | Unmarried |
| 15 to 19 years | 0 (0.0%) | 0 (0.0%) |
| 20 to 34 years | 126 (100.0%) | 0 (0.0%) |
| 35 to 50 years | 79 (79.8%) | 20 (20.2%) |
| Total | 205 (91.1%) | 20 (8.9%) |
Fertility by Education in Idylwood
Average fertility rate in Idylwood is 45.0 births per 1,000 women. Women with the education attainment of high school diploma have the highest fertility rate of 102.0 births per 1,000 women, while women with the education attainment of college or associate's degree have the lowest fertility at 16.0 births per 1,000 women. Women with the education attainment of graduate degree represent 48.4% of all women with births.
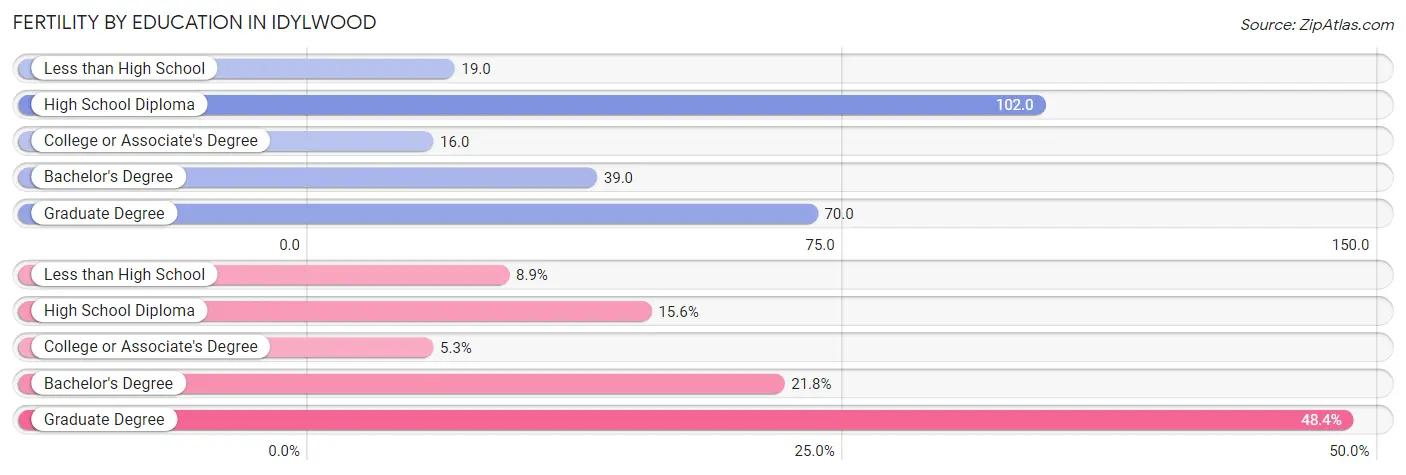
| Educational Attainment | Women with Births | Births / 1,000 Women |
| Less than High School | 20 (8.9%) | 19.0 |
| High School Diploma | 35 (15.6%) | 102.0 |
| College or Associate's Degree | 12 (5.3%) | 16.0 |
| Bachelor's Degree | 49 (21.8%) | 39.0 |
| Graduate Degree | 109 (48.4%) | 70.0 |
| Total | 225 (100.0%) | 45.0 |
Fertility by Education by Marriage Status in Idylwood
8.9% of women with births in Idylwood are unmarried. Women with the educational attainment of high school diploma are most likely to be married with 100.0% of them married at childbirth, while women with the educational attainment of less than high school are least likely to be married with 100.0% of them unmarried at childbirth.
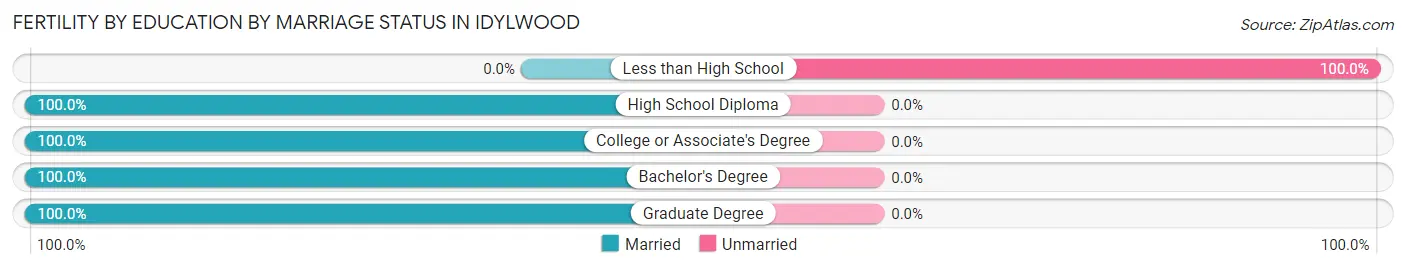
| Educational Attainment | Married | Unmarried |
| Less than High School | 0 (0.0%) | 20 (100.0%) |
| High School Diploma | 35 (100.0%) | 0 (0.0%) |
| College or Associate's Degree | 12 (100.0%) | 0 (0.0%) |
| Bachelor's Degree | 49 (100.0%) | 0 (0.0%) |
| Graduate Degree | 109 (100.0%) | 0 (0.0%) |
| Total | 205 (91.1%) | 20 (8.9%) |
Employment Characteristics in Idylwood
Employment by Class of Employer in Idylwood
Among the 9,803 employed individuals in Idylwood, private company employees (6,133 | 62.6%), federal government employees (1,513 | 15.4%), and not-for-profit organizations (948 | 9.7%) make up the most common classes of employment.
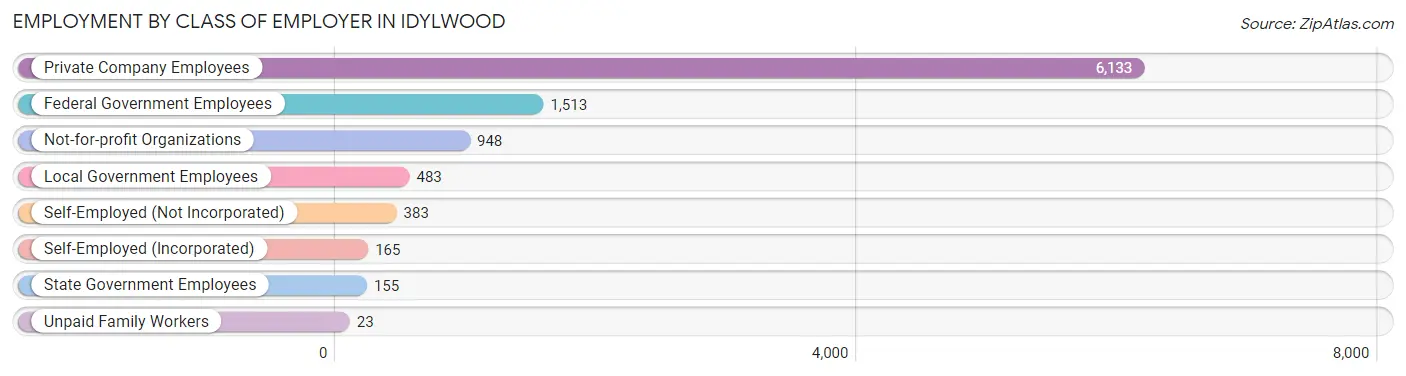
| Employer Class | # Employees | % Employees |
| Private Company Employees | 6,133 | 62.6% |
| Self-Employed (Incorporated) | 165 | 1.7% |
| Self-Employed (Not Incorporated) | 383 | 3.9% |
| Not-for-profit Organizations | 948 | 9.7% |
| Local Government Employees | 483 | 4.9% |
| State Government Employees | 155 | 1.6% |
| Federal Government Employees | 1,513 | 15.4% |
| Unpaid Family Workers | 23 | 0.2% |
| Total | 9,803 | 100.0% |
Employment Status by Age in Idylwood
According to the labor force statistics for Idylwood, out of the total population over 16 years of age (14,072), 72.7% or 10,230 individuals are in the labor force, with 2.4% or 246 of them unemployed. The age group with the highest labor force participation rate is 35 to 44 years, with 88.8% or 3,008 individuals in the labor force. Within the labor force, the 55 to 59 years age range has the highest percentage of unemployed individuals, with 11.1% or 90 of them being unemployed.
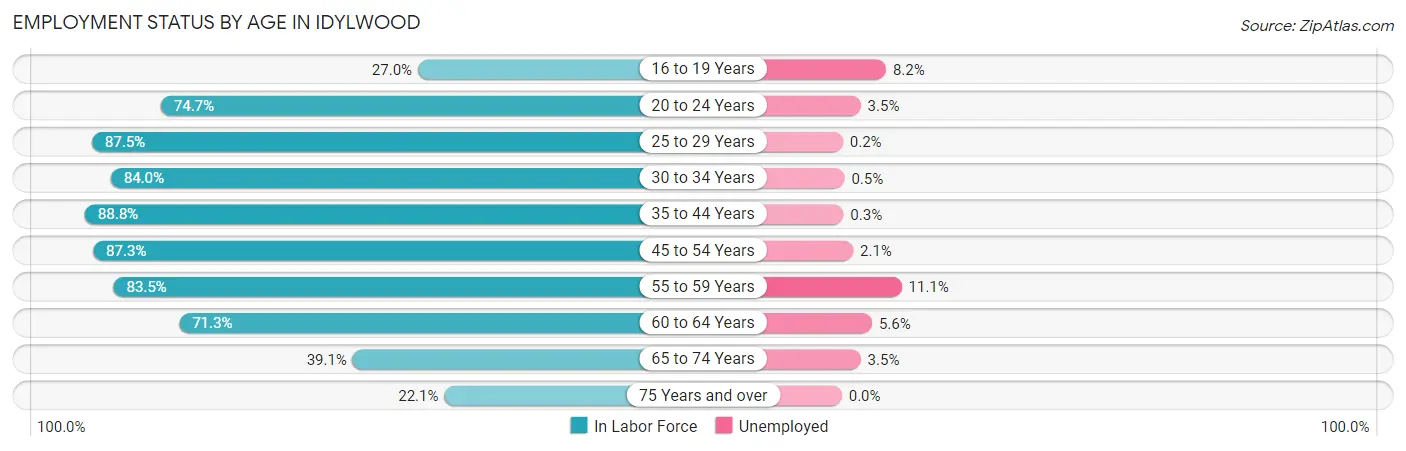
| Age Bracket | In Labor Force | Unemployed |
| 16 to 19 Years | 280 (27.0%) | 23 (8.2%) |
| 20 to 24 Years | 695 (74.7%) | 24 (3.5%) |
| 25 to 29 Years | 972 (87.5%) | 2 (0.2%) |
| 30 to 34 Years | 1,266 (84.0%) | 6 (0.5%) |
| 35 to 44 Years | 3,008 (88.8%) | 9 (0.3%) |
| 45 to 54 Years | 2,031 (87.3%) | 43 (2.1%) |
| 55 to 59 Years | 812 (83.5%) | 90 (11.1%) |
| 60 to 64 Years | 475 (71.3%) | 27 (5.6%) |
| 65 to 74 Years | 490 (39.1%) | 17 (3.5%) |
| 75 Years and over | 195 (22.1%) | 0 (0.0%) |
| Total | 10,230 (72.7%) | 246 (2.4%) |
Employment Status by Educational Attainment in Idylwood
According to labor force statistics for Idylwood, 85.9% of individuals (8,564) out of the total population between 25 and 64 years of age (9,970) are in the labor force, with 2.1% or 180 of them being unemployed. The group with the highest labor force participation rate are those with the educational attainment of bachelor's degree or higher, with 89.5% or 5,943 individuals in the labor force. Within the labor force, individuals with college / associate degree education have the highest percentage of unemployment, with 7.1% or 90 of them being unemployed.
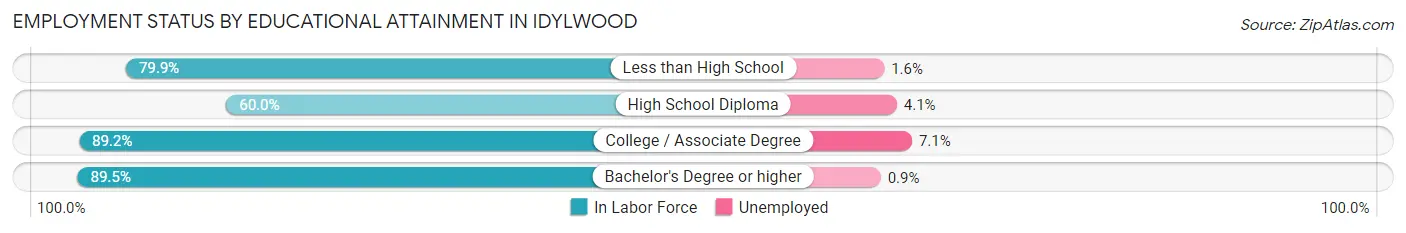
| Educational Attainment | In Labor Force | Unemployed |
| Less than High School | 838 (79.9%) | 17 (1.6%) |
| High School Diploma | 512 (60.0%) | 35 (4.1%) |
| College / Associate Degree | 1,274 (89.2%) | 101 (7.1%) |
| Bachelor's Degree or higher | 5,943 (89.5%) | 60 (0.9%) |
| Total | 8,564 (85.9%) | 209 (2.1%) |
Employment Occupations by Sex in Idylwood
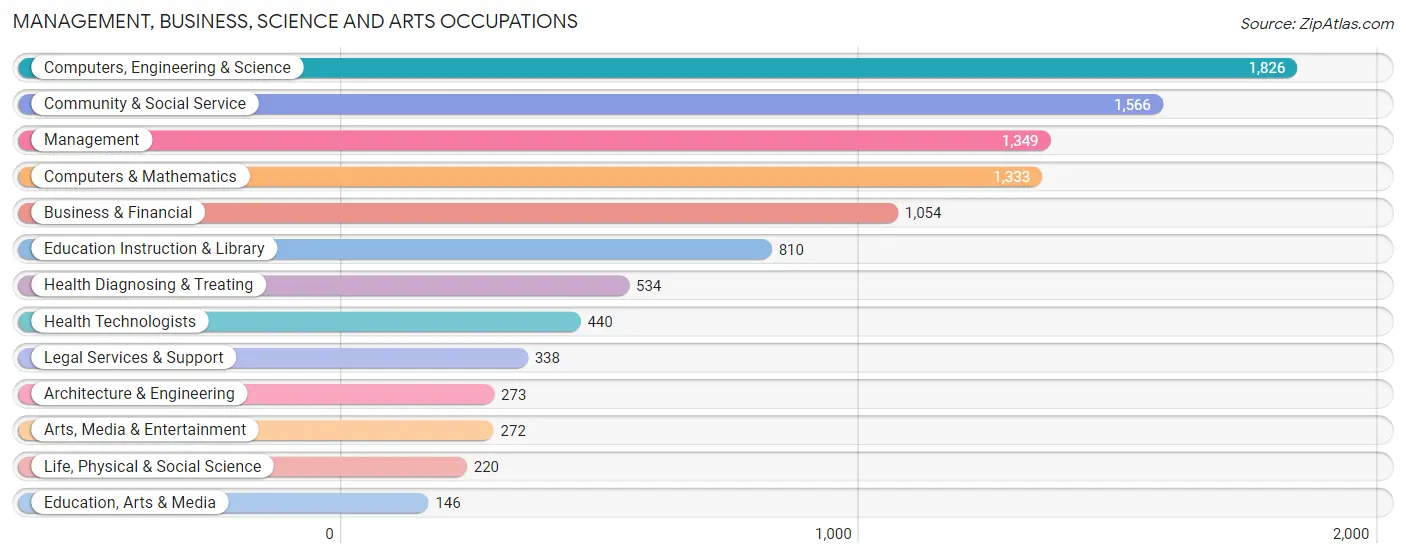
Management, Business, Science and Arts Occupations
The most common Management, Business, Science and Arts occupations in Idylwood are Computers, Engineering & Science (1,826 | 18.4%), Community & Social Service (1,566 | 15.8%), Management (1,349 | 13.6%), Computers & Mathematics (1,333 | 13.5%), and Business & Financial (1,054 | 10.6%).
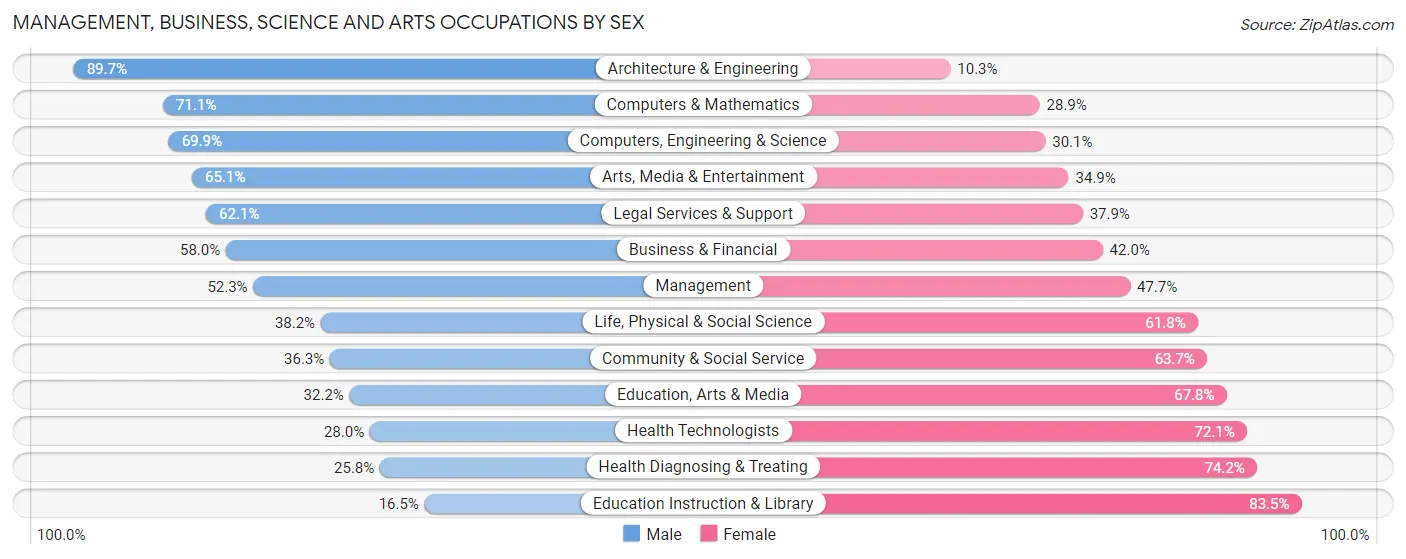
Management, Business, Science and Arts Occupations by Sex
Within the Management, Business, Science and Arts occupations in Idylwood, the most male-oriented occupations are Architecture & Engineering (89.7%), Computers & Mathematics (71.1%), and Computers, Engineering & Science (69.9%), while the most female-oriented occupations are Education Instruction & Library (83.5%), Health Diagnosing & Treating (74.2%), and Health Technologists (72.1%).
| Occupation | Male | Female |
| Management | 705 (52.3%) | 644 (47.7%) |
| Business & Financial | 611 (58.0%) | 443 (42.0%) |
| Computers, Engineering & Science | 1,277 (69.9%) | 549 (30.1%) |
| Computers & Mathematics | 948 (71.1%) | 385 (28.9%) |
| Architecture & Engineering | 245 (89.7%) | 28 (10.3%) |
| Life, Physical & Social Science | 84 (38.2%) | 136 (61.8%) |
| Community & Social Service | 568 (36.3%) | 998 (63.7%) |
| Education, Arts & Media | 47 (32.2%) | 99 (67.8%) |
| Legal Services & Support | 210 (62.1%) | 128 (37.9%) |
| Education Instruction & Library | 134 (16.5%) | 676 (83.5%) |
| Arts, Media & Entertainment | 177 (65.1%) | 95 (34.9%) |
| Health Diagnosing & Treating | 138 (25.8%) | 396 (74.2%) |
| Health Technologists | 123 (28.0%) | 317 (72.1%) |
| Total (Category) | 3,299 (52.1%) | 3,030 (47.9%) |
| Total (Overall) | 5,252 (53.0%) | 4,655 (47.0%) |
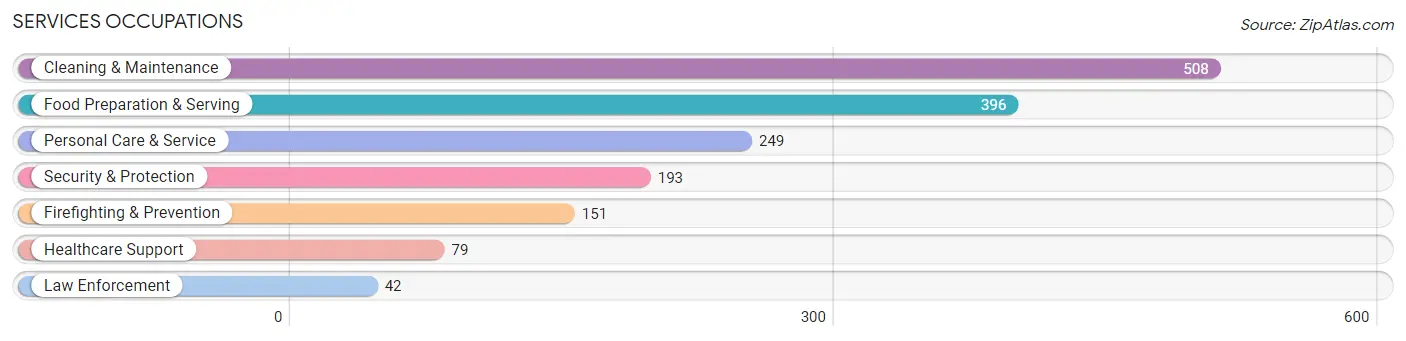
Services Occupations
The most common Services occupations in Idylwood are Cleaning & Maintenance (508 | 5.1%), Food Preparation & Serving (396 | 4.0%), Personal Care & Service (249 | 2.5%), Security & Protection (193 | 1.9%), and Firefighting & Prevention (151 | 1.5%).
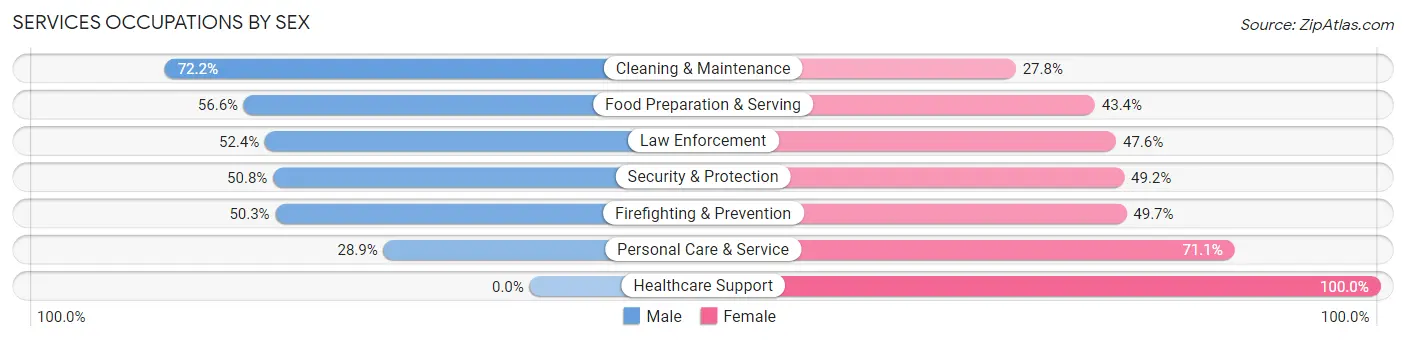
Services Occupations by Sex
Within the Services occupations in Idylwood, the most male-oriented occupations are Cleaning & Maintenance (72.2%), Food Preparation & Serving (56.6%), and Law Enforcement (52.4%), while the most female-oriented occupations are Healthcare Support (100.0%), Personal Care & Service (71.1%), and Firefighting & Prevention (49.7%).
| Occupation | Male | Female |
| Healthcare Support | 0 (0.0%) | 79 (100.0%) |
| Security & Protection | 98 (50.8%) | 95 (49.2%) |
| Firefighting & Prevention | 76 (50.3%) | 75 (49.7%) |
| Law Enforcement | 22 (52.4%) | 20 (47.6%) |
| Food Preparation & Serving | 224 (56.6%) | 172 (43.4%) |
| Cleaning & Maintenance | 367 (72.2%) | 141 (27.8%) |
| Personal Care & Service | 72 (28.9%) | 177 (71.1%) |
| Total (Category) | 761 (53.4%) | 664 (46.6%) |
| Total (Overall) | 5,252 (53.0%) | 4,655 (47.0%) |
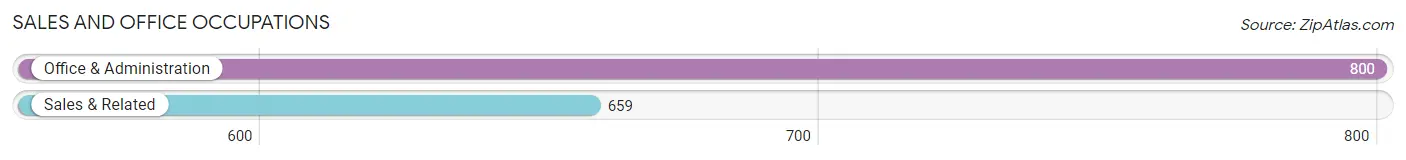
Sales and Office Occupations
The most common Sales and Office occupations in Idylwood are Office & Administration (800 | 8.1%), and Sales & Related (659 | 6.7%).
Sales and Office Occupations by Sex
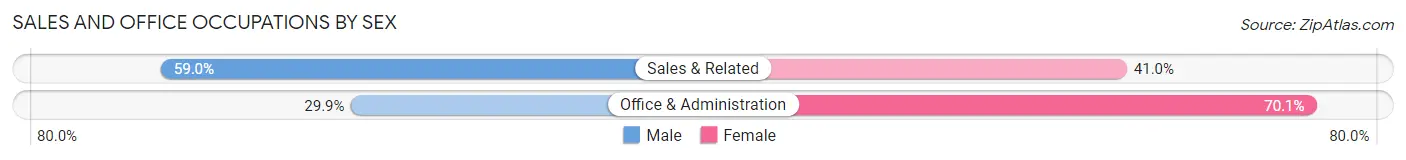
| Occupation | Male | Female |
| Sales & Related | 389 (59.0%) | 270 (41.0%) |
| Office & Administration | 239 (29.9%) | 561 (70.1%) |
| Total (Category) | 628 (43.0%) | 831 (57.0%) |
| Total (Overall) | 5,252 (53.0%) | 4,655 (47.0%) |
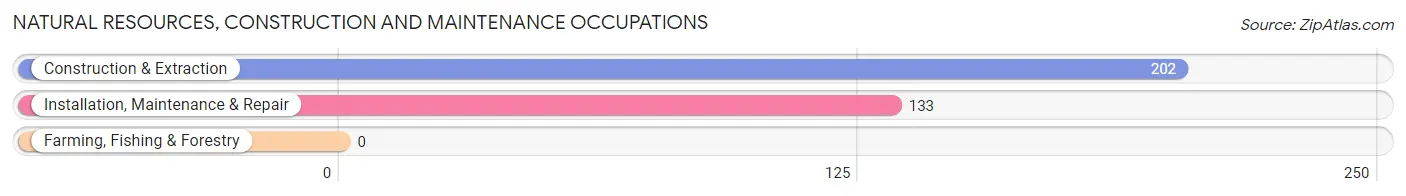
Natural Resources, Construction and Maintenance Occupations
The most common Natural Resources, Construction and Maintenance occupations in Idylwood are Construction & Extraction (202 | 2.0%), and Installation, Maintenance & Repair (133 | 1.3%).
Natural Resources, Construction and Maintenance Occupations by Sex
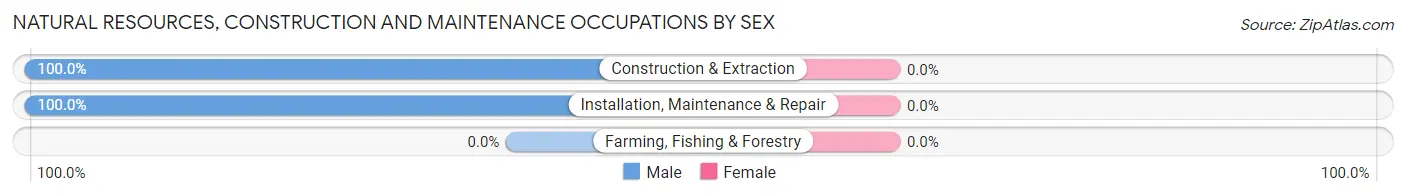
| Occupation | Male | Female |
| Farming, Fishing & Forestry | 0 (0.0%) | 0 (0.0%) |
| Construction & Extraction | 202 (100.0%) | 0 (0.0%) |
| Installation, Maintenance & Repair | 133 (100.0%) | 0 (0.0%) |
| Total (Category) | 335 (100.0%) | 0 (0.0%) |
| Total (Overall) | 5,252 (53.0%) | 4,655 (47.0%) |
Production, Transportation and Moving Occupations
The most common Production, Transportation and Moving occupations in Idylwood are Transportation (137 | 1.4%), Material Moving (120 | 1.2%), and Production (102 | 1.0%).
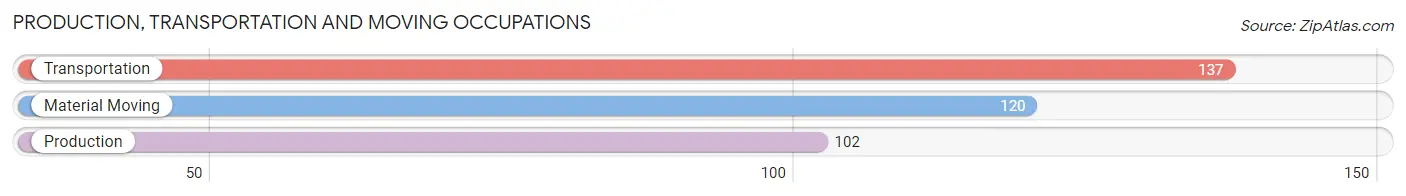
Production, Transportation and Moving Occupations by Sex
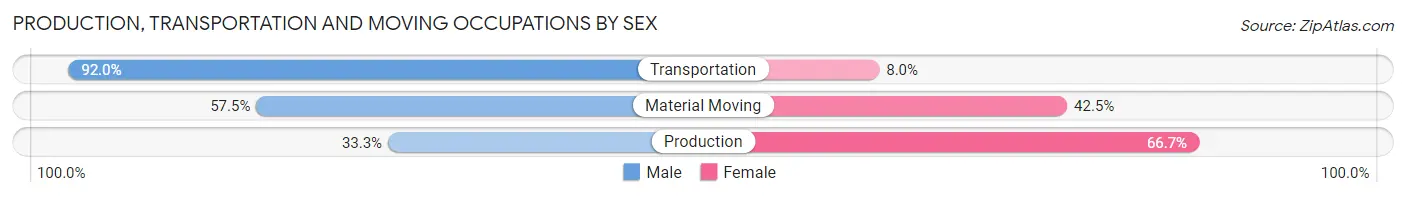
| Occupation | Male | Female |
| Production | 34 (33.3%) | 68 (66.7%) |
| Transportation | 126 (92.0%) | 11 (8.0%) |
| Material Moving | 69 (57.5%) | 51 (42.5%) |
| Total (Category) | 229 (63.8%) | 130 (36.2%) |
| Total (Overall) | 5,252 (53.0%) | 4,655 (47.0%) |
Employment Industries by Sex in Idylwood
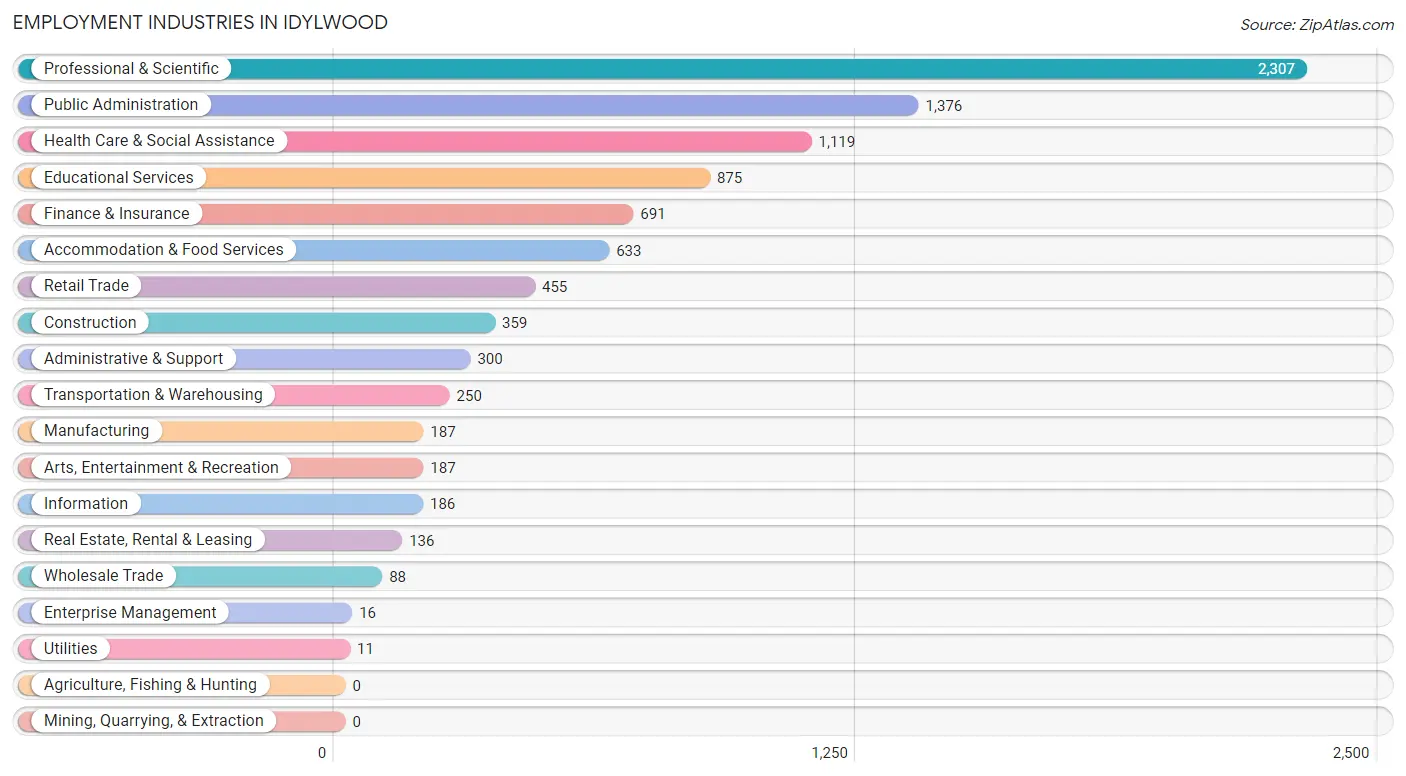
Employment Industries in Idylwood
The major employment industries in Idylwood include Professional & Scientific (2,307 | 23.3%), Public Administration (1,376 | 13.9%), Health Care & Social Assistance (1,119 | 11.3%), Educational Services (875 | 8.8%), and Finance & Insurance (691 | 7.0%).
Employment Industries by Sex in Idylwood
The Idylwood industries that see more men than women are Utilities (100.0%), Transportation & Warehousing (88.4%), and Construction (84.7%), whereas the industries that tend to have a higher number of women are Enterprise Management (100.0%), Health Care & Social Assistance (80.7%), and Educational Services (73.5%).
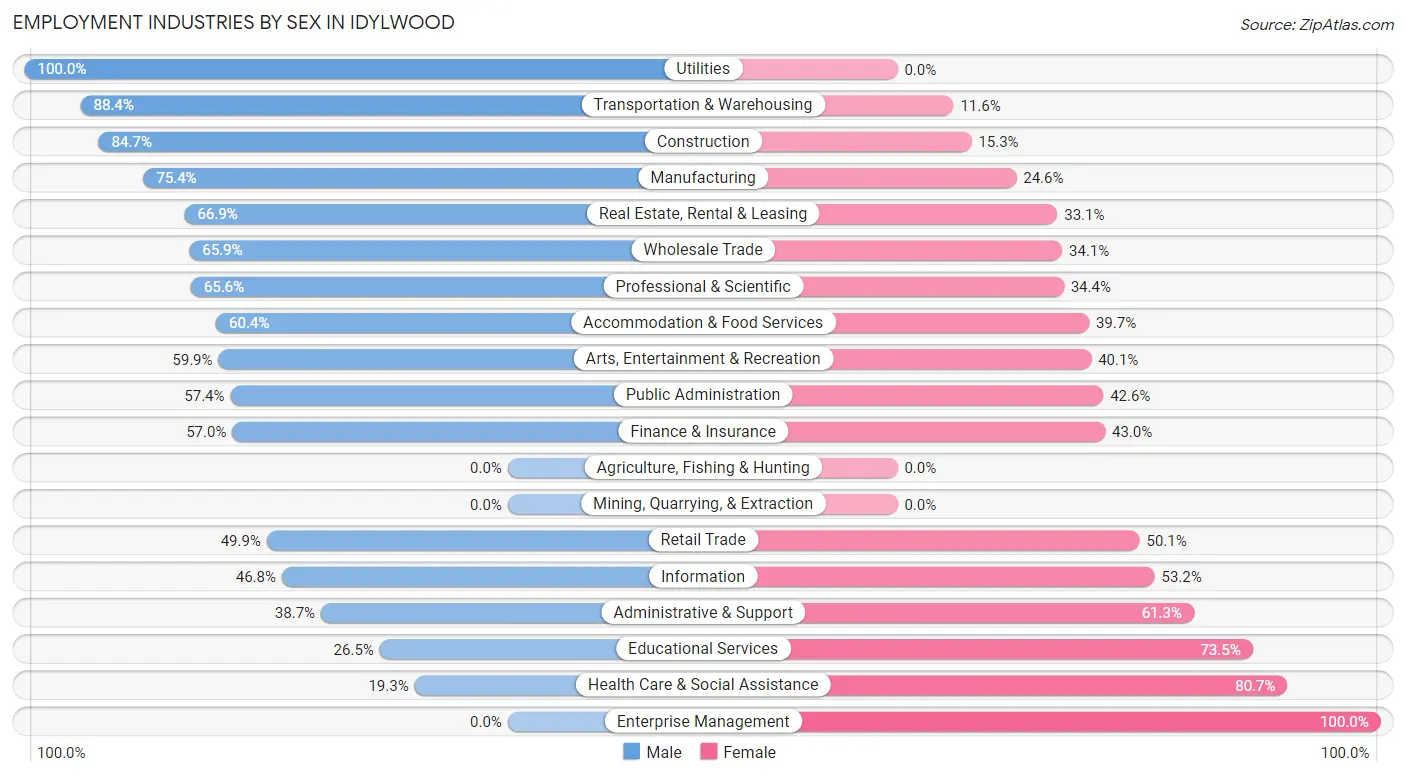
| Industry | Male | Female |
| Agriculture, Fishing & Hunting | 0 (0.0%) | 0 (0.0%) |
| Mining, Quarrying, & Extraction | 0 (0.0%) | 0 (0.0%) |
| Construction | 304 (84.7%) | 55 (15.3%) |
| Manufacturing | 141 (75.4%) | 46 (24.6%) |
| Wholesale Trade | 58 (65.9%) | 30 (34.1%) |
| Retail Trade | 227 (49.9%) | 228 (50.1%) |
| Transportation & Warehousing | 221 (88.4%) | 29 (11.6%) |
| Utilities | 11 (100.0%) | 0 (0.0%) |
| Information | 87 (46.8%) | 99 (53.2%) |
| Finance & Insurance | 394 (57.0%) | 297 (43.0%) |
| Real Estate, Rental & Leasing | 91 (66.9%) | 45 (33.1%) |
| Professional & Scientific | 1,513 (65.6%) | 794 (34.4%) |
| Enterprise Management | 0 (0.0%) | 16 (100.0%) |
| Administrative & Support | 116 (38.7%) | 184 (61.3%) |
| Educational Services | 232 (26.5%) | 643 (73.5%) |
| Health Care & Social Assistance | 216 (19.3%) | 903 (80.7%) |
| Arts, Entertainment & Recreation | 112 (59.9%) | 75 (40.1%) |
| Accommodation & Food Services | 382 (60.4%) | 251 (39.7%) |
| Public Administration | 790 (57.4%) | 586 (42.6%) |
| Total | 5,252 (53.0%) | 4,655 (47.0%) |
Education in Idylwood
School Enrollment in Idylwood
The most common levels of schooling among the 4,959 students in Idylwood are high school (1,407 | 28.4%), elementary school (983 | 19.8%), and college / undergraduate (927 | 18.7%).
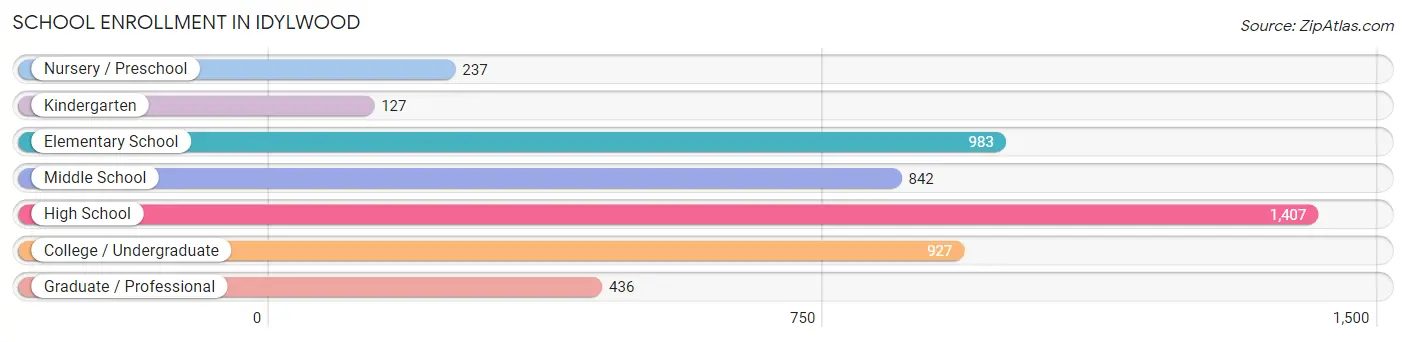
| School Level | # Students | % Students |
| Nursery / Preschool | 237 | 4.8% |
| Kindergarten | 127 | 2.6% |
| Elementary School | 983 | 19.8% |
| Middle School | 842 | 17.0% |
| High School | 1,407 | 28.4% |
| College / Undergraduate | 927 | 18.7% |
| Graduate / Professional | 436 | 8.8% |
| Total | 4,959 | 100.0% |
School Enrollment by Age by Funding Source in Idylwood
Out of a total of 4,959 students who are enrolled in schools in Idylwood, 1,220 (24.6%) attend a private institution, while the remaining 3,739 (75.4%) are enrolled in public schools. The age group of 3 to 4 year olds has the highest likelihood of being enrolled in private schools, with 152 (100.0% in the age bracket) enrolled. Conversely, the age group of 18 to 19 year olds has the lowest likelihood of being enrolled in a private school, with 376 (96.9% in the age bracket) attending a public institution.
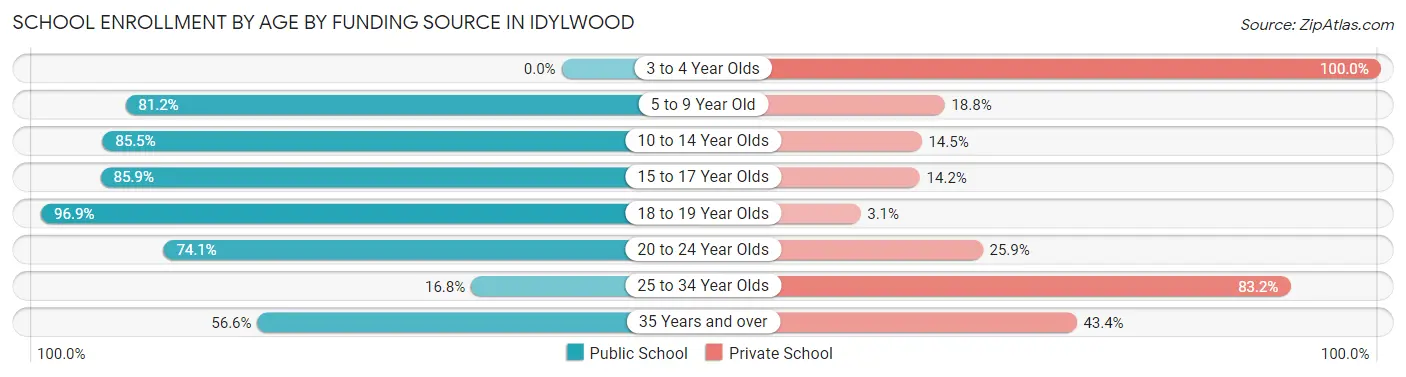
| Age Bracket | Public School | Private School |
| 3 to 4 Year Olds | 0 (0.0%) | 152 (100.0%) |
| 5 to 9 Year Old | 895 (81.2%) | 207 (18.8%) |
| 10 to 14 Year Olds | 909 (85.5%) | 154 (14.5%) |
| 15 to 17 Year Olds | 898 (85.9%) | 148 (14.1%) |
| 18 to 19 Year Olds | 376 (96.9%) | 12 (3.1%) |
| 20 to 24 Year Olds | 384 (74.1%) | 134 (25.9%) |
| 25 to 34 Year Olds | 49 (16.8%) | 242 (83.2%) |
| 35 Years and over | 226 (56.6%) | 173 (43.4%) |
| Total | 3,739 (75.4%) | 1,220 (24.6%) |
Educational Attainment by Field of Study in Idylwood
Business (1,307 | 15.7%), computers & mathematics (1,193 | 14.3%), social sciences (1,142 | 13.7%), engineering (992 | 11.9%), and literature & languages (528 | 6.3%) are the most common fields of study among 8,342 individuals in Idylwood who have obtained a bachelor's degree or higher.
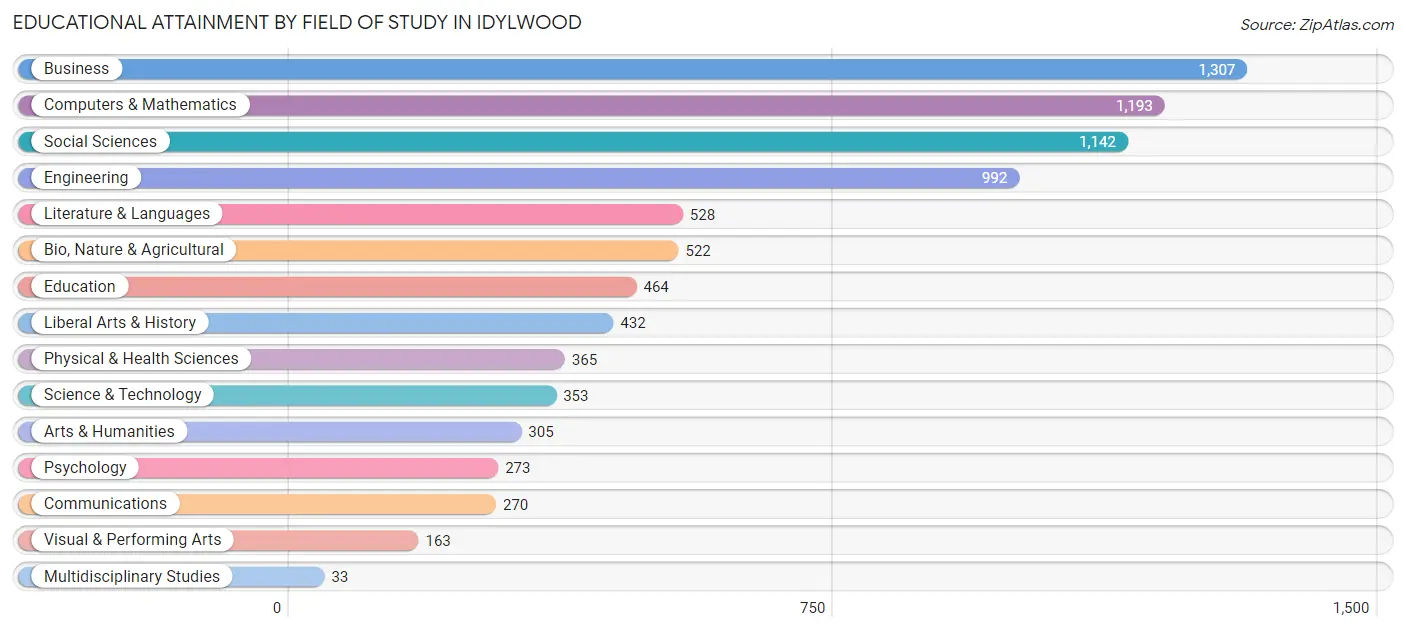
| Field of Study | # Graduates | % Graduates |
| Computers & Mathematics | 1,193 | 14.3% |
| Bio, Nature & Agricultural | 522 | 6.3% |
| Physical & Health Sciences | 365 | 4.4% |
| Psychology | 273 | 3.3% |
| Social Sciences | 1,142 | 13.7% |
| Engineering | 992 | 11.9% |
| Multidisciplinary Studies | 33 | 0.4% |
| Science & Technology | 353 | 4.2% |
| Business | 1,307 | 15.7% |
| Education | 464 | 5.6% |
| Literature & Languages | 528 | 6.3% |
| Liberal Arts & History | 432 | 5.2% |
| Visual & Performing Arts | 163 | 1.9% |
| Communications | 270 | 3.2% |
| Arts & Humanities | 305 | 3.7% |
| Total | 8,342 | 100.0% |
Transportation & Commute in Idylwood
Vehicle Availability by Sex in Idylwood
The most prevalent vehicle ownership categories in Idylwood are males with 2 vehicles (2,149, accounting for 40.9%) and females with 2 vehicles (1,948, making up 47.3%).
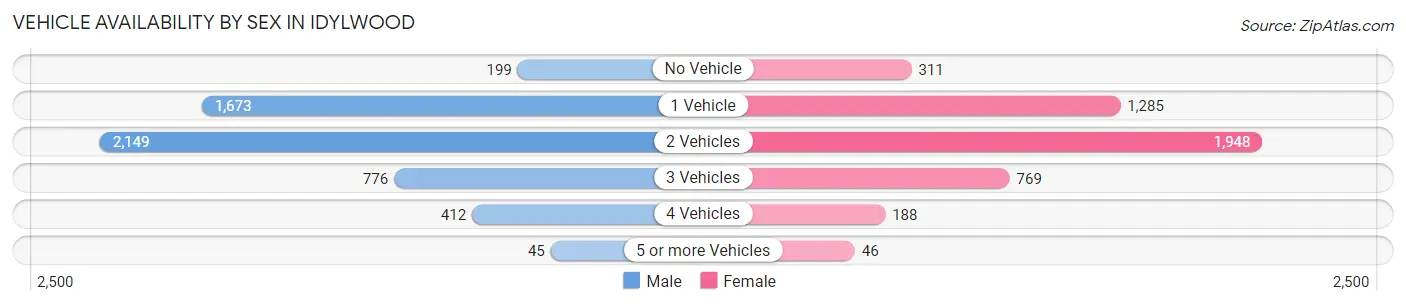
| Vehicles Available | Male | Female |
| No Vehicle | 199 (3.8%) | 311 (6.8%) |
| 1 Vehicle | 1,673 (31.8%) | 1,285 (28.3%) |
| 2 Vehicles | 2,149 (40.9%) | 1,948 (42.8%) |
| 3 Vehicles | 776 (14.8%) | 769 (16.9%) |
| 4 Vehicles | 412 (7.8%) | 188 (4.1%) |
| 5 or more Vehicles | 45 (0.9%) | 46 (1.0%) |
| Total | 5,254 (100.0%) | 4,547 (100.0%) |
Commute Time in Idylwood
The most frequently occuring commute durations in Idylwood are 30 to 34 minutes (1,482 commuters, 18.6%), 20 to 24 minutes (1,224 commuters, 15.4%), and 15 to 19 minutes (1,198 commuters, 15.0%).
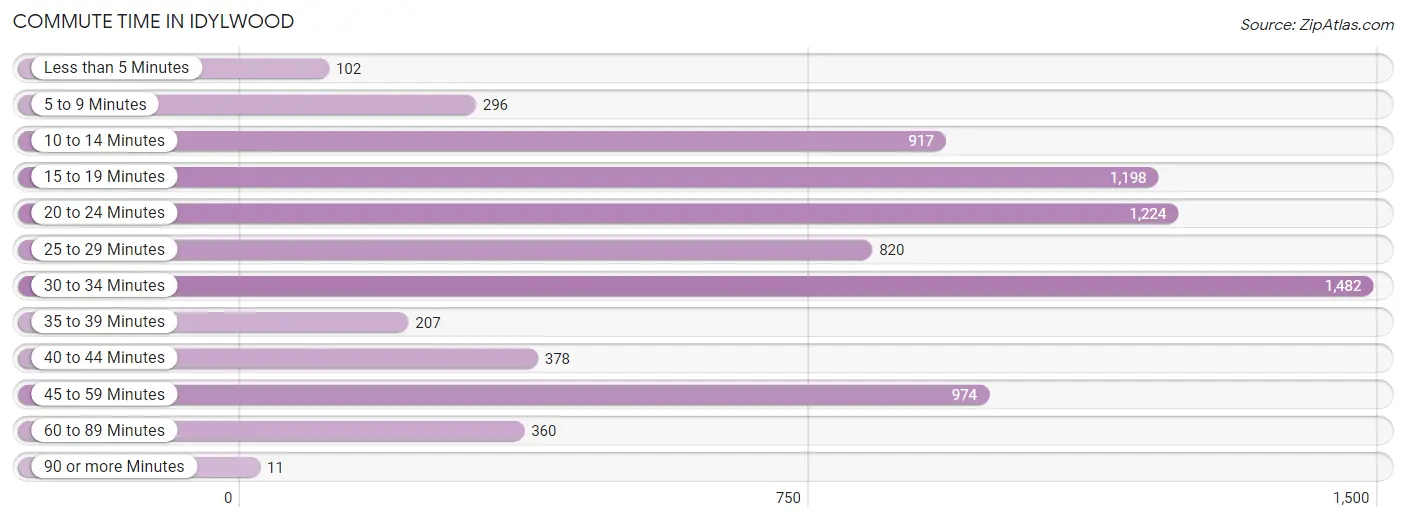
| Commute Time | # Commuters | % Commuters |
| Less than 5 Minutes | 102 | 1.3% |
| 5 to 9 Minutes | 296 | 3.7% |
| 10 to 14 Minutes | 917 | 11.5% |
| 15 to 19 Minutes | 1,198 | 15.0% |
| 20 to 24 Minutes | 1,224 | 15.4% |
| 25 to 29 Minutes | 820 | 10.3% |
| 30 to 34 Minutes | 1,482 | 18.6% |
| 35 to 39 Minutes | 207 | 2.6% |
| 40 to 44 Minutes | 378 | 4.7% |
| 45 to 59 Minutes | 974 | 12.2% |
| 60 to 89 Minutes | 360 | 4.5% |
| 90 or more Minutes | 11 | 0.1% |
Commute Time by Sex in Idylwood
The most common commute times in Idylwood are 30 to 34 minutes (890 commuters, 20.2%) for males and 20 to 24 minutes (609 commuters, 17.1%) for females.
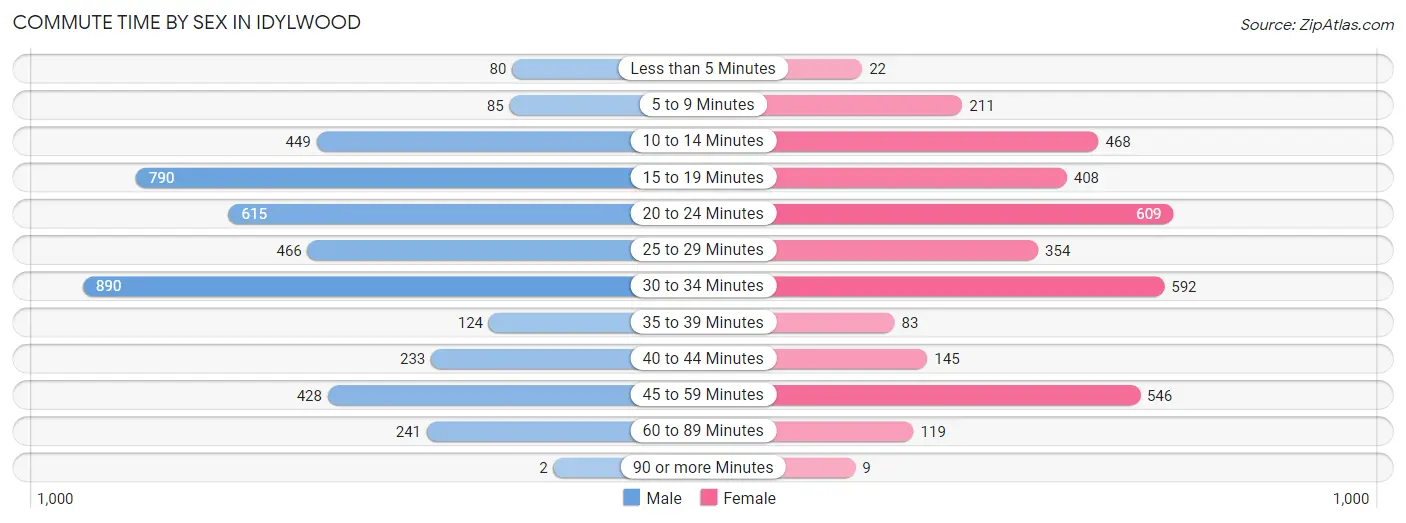
| Commute Time | Male | Female |
| Less than 5 Minutes | 80 (1.8%) | 22 (0.6%) |
| 5 to 9 Minutes | 85 (1.9%) | 211 (5.9%) |
| 10 to 14 Minutes | 449 (10.2%) | 468 (13.1%) |
| 15 to 19 Minutes | 790 (17.9%) | 408 (11.4%) |
| 20 to 24 Minutes | 615 (14.0%) | 609 (17.1%) |
| 25 to 29 Minutes | 466 (10.6%) | 354 (9.9%) |
| 30 to 34 Minutes | 890 (20.2%) | 592 (16.6%) |
| 35 to 39 Minutes | 124 (2.8%) | 83 (2.3%) |
| 40 to 44 Minutes | 233 (5.3%) | 145 (4.1%) |
| 45 to 59 Minutes | 428 (9.7%) | 546 (15.3%) |
| 60 to 89 Minutes | 241 (5.5%) | 119 (3.3%) |
| 90 or more Minutes | 2 (0.1%) | 9 (0.3%) |
Time of Departure to Work by Sex in Idylwood
The most frequent times of departure to work in Idylwood are 8:00 AM to 8:29 AM (624, 14.2%) for males and 8:00 AM to 8:29 AM (726, 20.4%) for females.
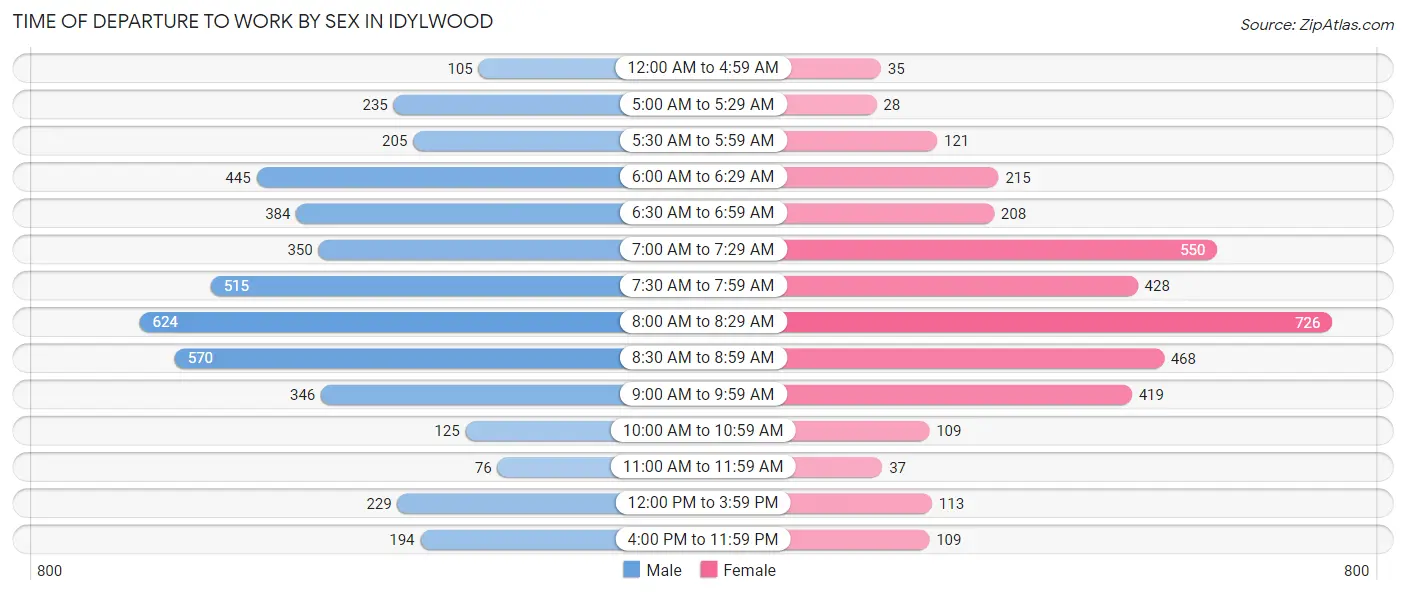
| Time of Departure | Male | Female |
| 12:00 AM to 4:59 AM | 105 (2.4%) | 35 (1.0%) |
| 5:00 AM to 5:29 AM | 235 (5.3%) | 28 (0.8%) |
| 5:30 AM to 5:59 AM | 205 (4.7%) | 121 (3.4%) |
| 6:00 AM to 6:29 AM | 445 (10.1%) | 215 (6.0%) |
| 6:30 AM to 6:59 AM | 384 (8.7%) | 208 (5.8%) |
| 7:00 AM to 7:29 AM | 350 (8.0%) | 550 (15.4%) |
| 7:30 AM to 7:59 AM | 515 (11.7%) | 428 (12.0%) |
| 8:00 AM to 8:29 AM | 624 (14.2%) | 726 (20.4%) |
| 8:30 AM to 8:59 AM | 570 (13.0%) | 468 (13.1%) |
| 9:00 AM to 9:59 AM | 346 (7.9%) | 419 (11.7%) |
| 10:00 AM to 10:59 AM | 125 (2.8%) | 109 (3.1%) |
| 11:00 AM to 11:59 AM | 76 (1.7%) | 37 (1.0%) |
| 12:00 PM to 3:59 PM | 229 (5.2%) | 113 (3.2%) |
| 4:00 PM to 11:59 PM | 194 (4.4%) | 109 (3.1%) |
| Total | 4,403 (100.0%) | 3,566 (100.0%) |
Housing Occupancy in Idylwood
Occupancy by Ownership in Idylwood
Of the total 7,071 dwellings in Idylwood, owner-occupied units account for 3,880 (54.9%), while renter-occupied units make up 3,191 (45.1%).
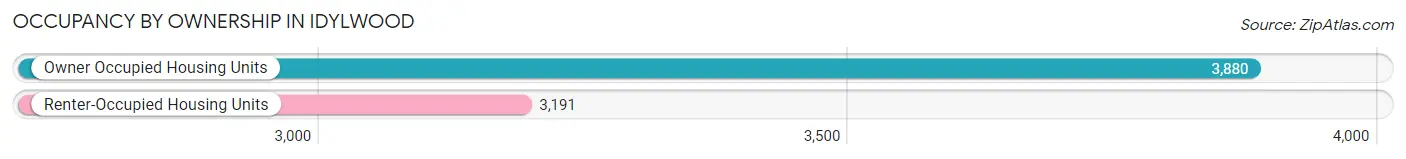
| Occupancy | # Housing Units | % Housing Units |
| Owner Occupied Housing Units | 3,880 | 54.9% |
| Renter-Occupied Housing Units | 3,191 | 45.1% |
| Total Occupied Housing Units | 7,071 | 100.0% |
Occupancy by Household Size in Idylwood
| Household Size | # Housing Units | % Housing Units |
| 1-Person Household | 2,097 | 29.7% |
| 2-Person Household | 2,014 | 28.5% |
| 3-Person Household | 1,302 | 18.4% |
| 4+ Person Household | 1,658 | 23.4% |
| Total Housing Units | 7,071 | 100.0% |
Occupancy by Ownership by Household Size in Idylwood
| Household Size | Owner-occupied | Renter-occupied |
| 1-Person Household | 1,195 (57.0%) | 902 (43.0%) |
| 2-Person Household | 1,203 (59.7%) | 811 (40.3%) |
| 3-Person Household | 582 (44.7%) | 720 (55.3%) |
| 4+ Person Household | 900 (54.3%) | 758 (45.7%) |
| Total Housing Units | 3,880 (54.9%) | 3,191 (45.1%) |
Occupancy by Educational Attainment in Idylwood
| Household Size | Owner-occupied | Renter-occupied |
| Less than High School | 407 (53.4%) | 355 (46.6%) |
| High School Diploma | 382 (48.0%) | 414 (52.0%) |
| College/Associate Degree | 456 (45.3%) | 550 (54.7%) |
| Bachelor's Degree or higher | 2,635 (58.5%) | 1,872 (41.5%) |
Occupancy by Age of Householder in Idylwood
| Age Bracket | # Households | % Households |
| Under 35 Years | 1,414 | 20.0% |
| 35 to 44 Years | 1,944 | 27.5% |
| 45 to 54 Years | 1,320 | 18.7% |
| 55 to 64 Years | 1,094 | 15.5% |
| 65 to 74 Years | 712 | 10.1% |
| 75 to 84 Years | 456 | 6.5% |
| 85 Years and Over | 131 | 1.8% |
| Total | 7,071 | 100.0% |
Housing Finances in Idylwood
Median Income by Occupancy in Idylwood
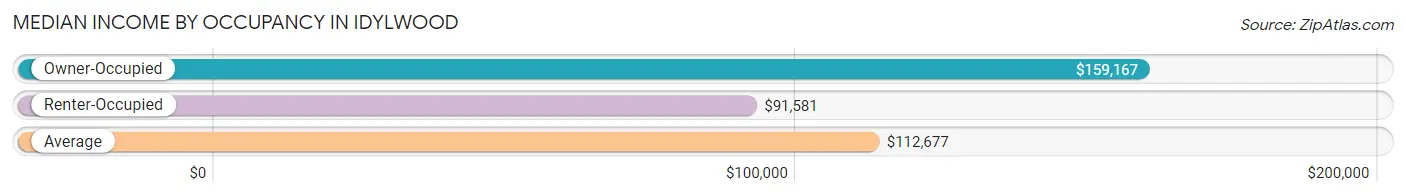
| Occupancy Type | # Households | Median Income |
| Owner-Occupied | 3,880 (54.9%) | $159,167 |
| Renter-Occupied | 3,191 (45.1%) | $91,581 |
| Average | 7,071 (100.0%) | $112,677 |
Occupancy by Householder Income Bracket in Idylwood
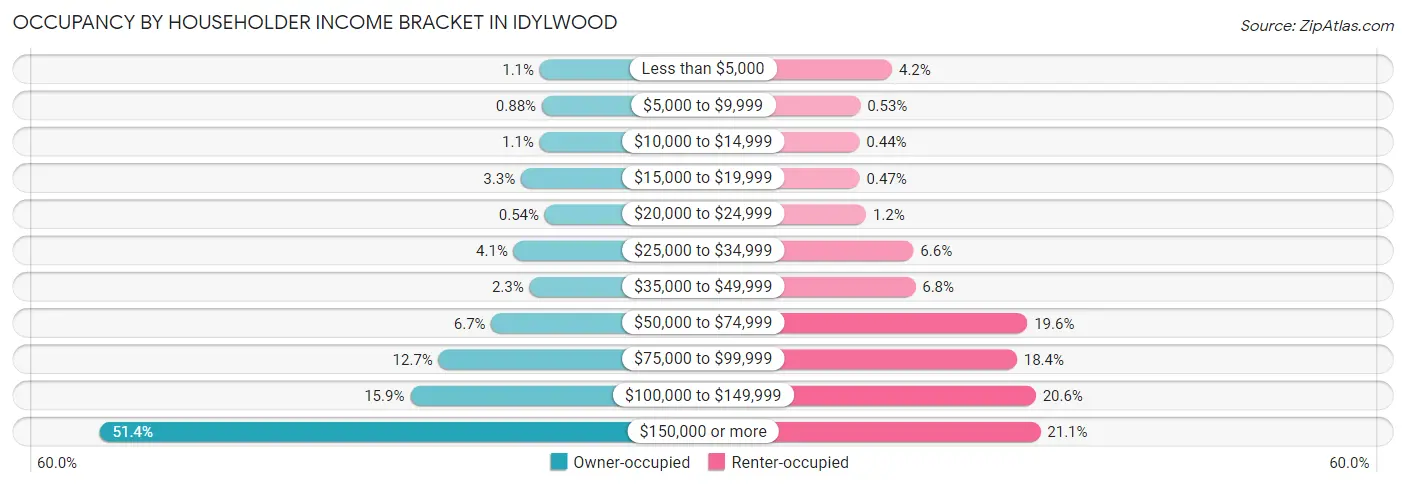
| Income Bracket | Owner-occupied | Renter-occupied |
| Less than $5,000 | 43 (1.1%) | 133 (4.2%) |
| $5,000 to $9,999 | 34 (0.9%) | 17 (0.5%) |
| $10,000 to $14,999 | 44 (1.1%) | 14 (0.4%) |
| $15,000 to $19,999 | 127 (3.3%) | 15 (0.5%) |
| $20,000 to $24,999 | 21 (0.5%) | 38 (1.2%) |
| $25,000 to $34,999 | 159 (4.1%) | 211 (6.6%) |
| $35,000 to $49,999 | 89 (2.3%) | 218 (6.8%) |
| $50,000 to $74,999 | 258 (6.7%) | 626 (19.6%) |
| $75,000 to $99,999 | 492 (12.7%) | 588 (18.4%) |
| $100,000 to $149,999 | 618 (15.9%) | 657 (20.6%) |
| $150,000 or more | 1,995 (51.4%) | 674 (21.1%) |
| Total | 3,880 (100.0%) | 3,191 (100.0%) |
Monthly Housing Cost Tiers in Idylwood
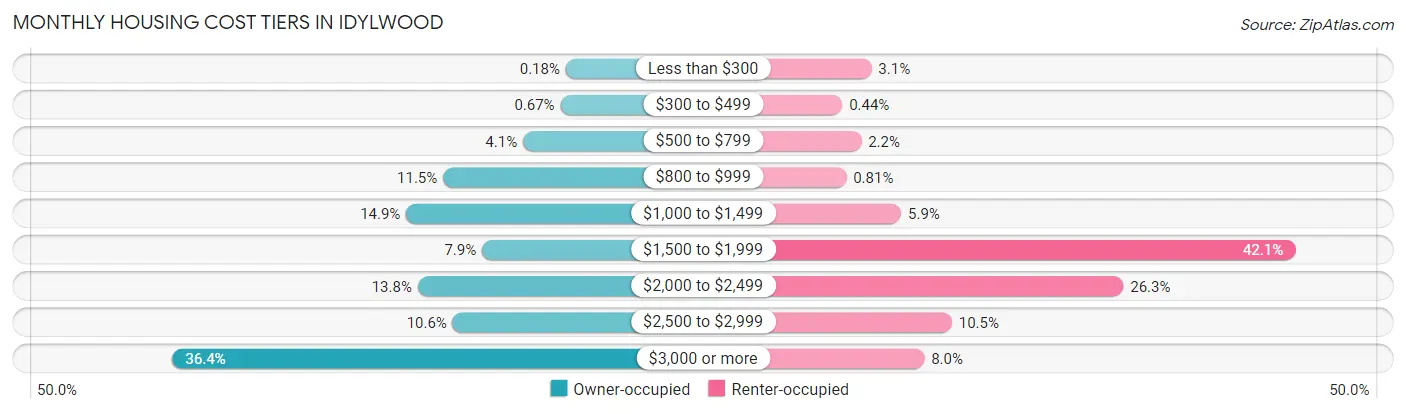
| Monthly Cost | Owner-occupied | Renter-occupied |
| Less than $300 | 7 (0.2%) | 100 (3.1%) |
| $300 to $499 | 26 (0.7%) | 14 (0.4%) |
| $500 to $799 | 160 (4.1%) | 70 (2.2%) |
| $800 to $999 | 445 (11.5%) | 26 (0.8%) |
| $1,000 to $1,499 | 577 (14.9%) | 187 (5.9%) |
| $1,500 to $1,999 | 306 (7.9%) | 1,344 (42.1%) |
| $2,000 to $2,499 | 536 (13.8%) | 840 (26.3%) |
| $2,500 to $2,999 | 411 (10.6%) | 336 (10.5%) |
| $3,000 or more | 1,412 (36.4%) | 255 (8.0%) |
| Total | 3,880 (100.0%) | 3,191 (100.0%) |
Physical Housing Characteristics in Idylwood
Housing Structures in Idylwood
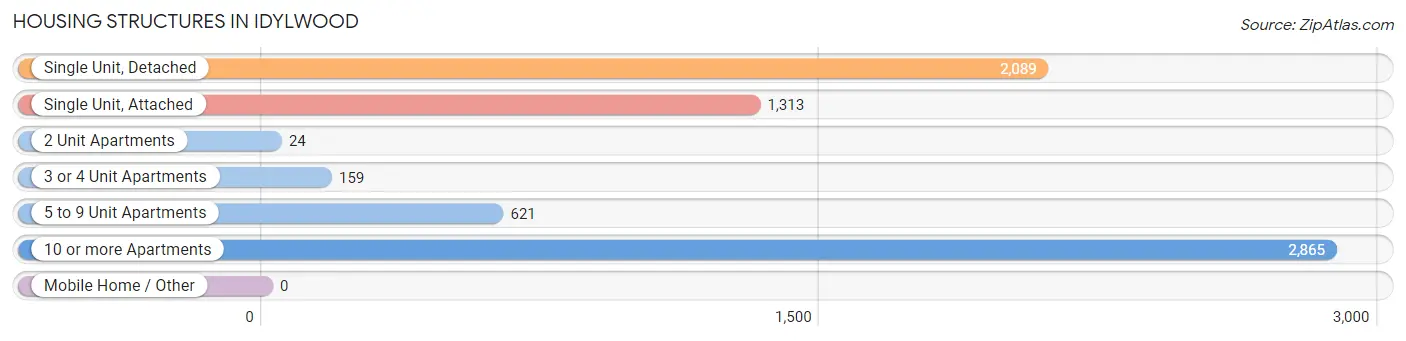
| Structure Type | # Housing Units | % Housing Units |
| Single Unit, Detached | 2,089 | 29.5% |
| Single Unit, Attached | 1,313 | 18.6% |
| 2 Unit Apartments | 24 | 0.3% |
| 3 or 4 Unit Apartments | 159 | 2.2% |
| 5 to 9 Unit Apartments | 621 | 8.8% |
| 10 or more Apartments | 2,865 | 40.5% |
| Mobile Home / Other | 0 | 0.0% |
| Total | 7,071 | 100.0% |
Housing Structures by Occupancy in Idylwood
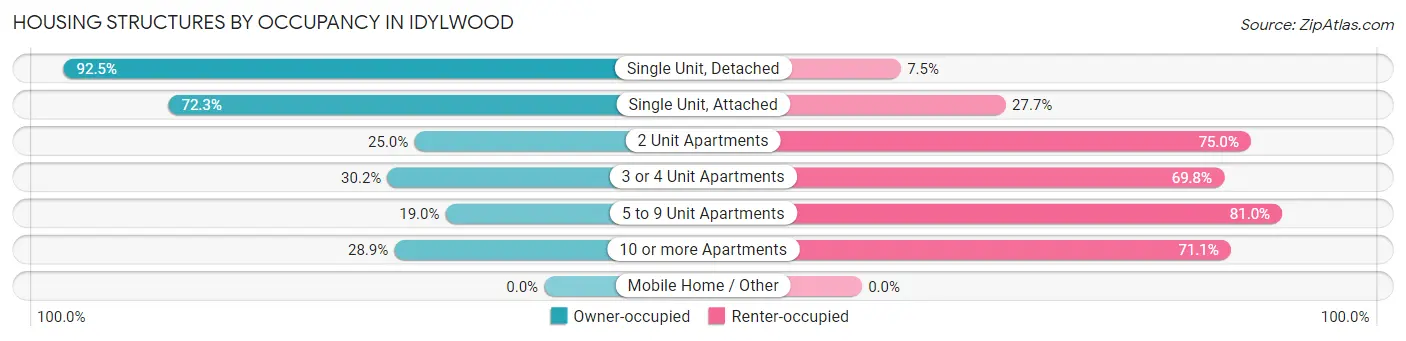
| Structure Type | Owner-occupied | Renter-occupied |
| Single Unit, Detached | 1,932 (92.5%) | 157 (7.5%) |
| Single Unit, Attached | 949 (72.3%) | 364 (27.7%) |
| 2 Unit Apartments | 6 (25.0%) | 18 (75.0%) |
| 3 or 4 Unit Apartments | 48 (30.2%) | 111 (69.8%) |
| 5 to 9 Unit Apartments | 118 (19.0%) | 503 (81.0%) |
| 10 or more Apartments | 827 (28.9%) | 2,038 (71.1%) |
| Mobile Home / Other | 0 (0.0%) | 0 (0.0%) |
| Total | 3,880 (54.9%) | 3,191 (45.1%) |
Housing Structures by Number of Rooms in Idylwood
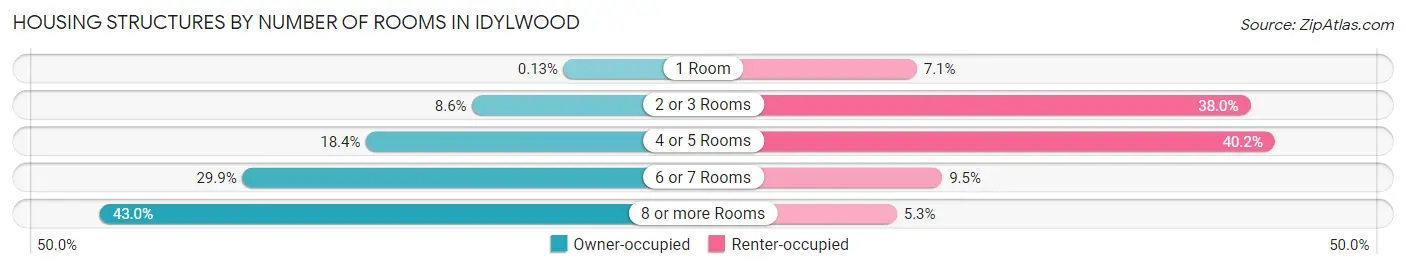
| Number of Rooms | Owner-occupied | Renter-occupied |
| 1 Room | 5 (0.1%) | 227 (7.1%) |
| 2 or 3 Rooms | 333 (8.6%) | 1,211 (38.0%) |
| 4 or 5 Rooms | 714 (18.4%) | 1,283 (40.2%) |
| 6 or 7 Rooms | 1,158 (29.8%) | 302 (9.5%) |
| 8 or more Rooms | 1,670 (43.0%) | 168 (5.3%) |
| Total | 3,880 (100.0%) | 3,191 (100.0%) |
Housing Structure by Heating Type in Idylwood
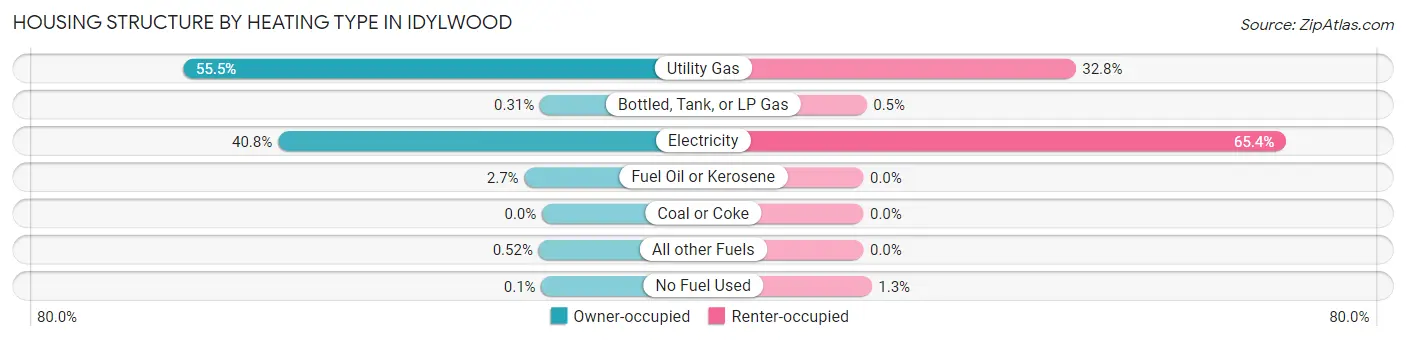
| Heating Type | Owner-occupied | Renter-occupied |
| Utility Gas | 2,154 (55.5%) | 1,047 (32.8%) |
| Bottled, Tank, or LP Gas | 12 (0.3%) | 16 (0.5%) |
| Electricity | 1,584 (40.8%) | 2,087 (65.4%) |
| Fuel Oil or Kerosene | 106 (2.7%) | 0 (0.0%) |
| Coal or Coke | 0 (0.0%) | 0 (0.0%) |
| All other Fuels | 20 (0.5%) | 0 (0.0%) |
| No Fuel Used | 4 (0.1%) | 41 (1.3%) |
| Total | 3,880 (100.0%) | 3,191 (100.0%) |
Household Vehicle Usage in Idylwood
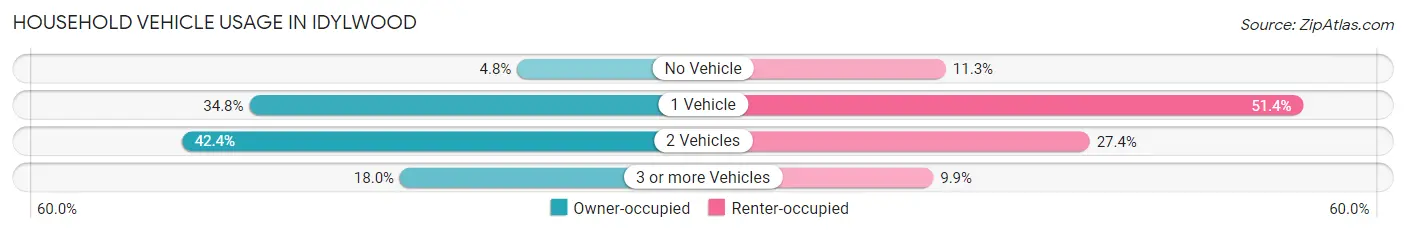
| Vehicles per Household | Owner-occupied | Renter-occupied |
| No Vehicle | 187 (4.8%) | 361 (11.3%) |
| 1 Vehicle | 1,351 (34.8%) | 1,639 (51.4%) |
| 2 Vehicles | 1,645 (42.4%) | 875 (27.4%) |
| 3 or more Vehicles | 697 (18.0%) | 316 (9.9%) |
| Total | 3,880 (100.0%) | 3,191 (100.0%) |
Real Estate & Mortgages in Idylwood
Real Estate and Mortgage Overview in Idylwood
| Characteristic | Without Mortgage | With Mortgage |
| Housing Units | 1,197 | 2,683 |
| Median Property Value | $672,700 | $712,200 |
| Median Household Income | $84,410 | $1,641 |
| Monthly Housing Costs | $989 | $1,412 |
| Real Estate Taxes | $7,771 | $24 |
Property Value by Mortgage Status in Idylwood
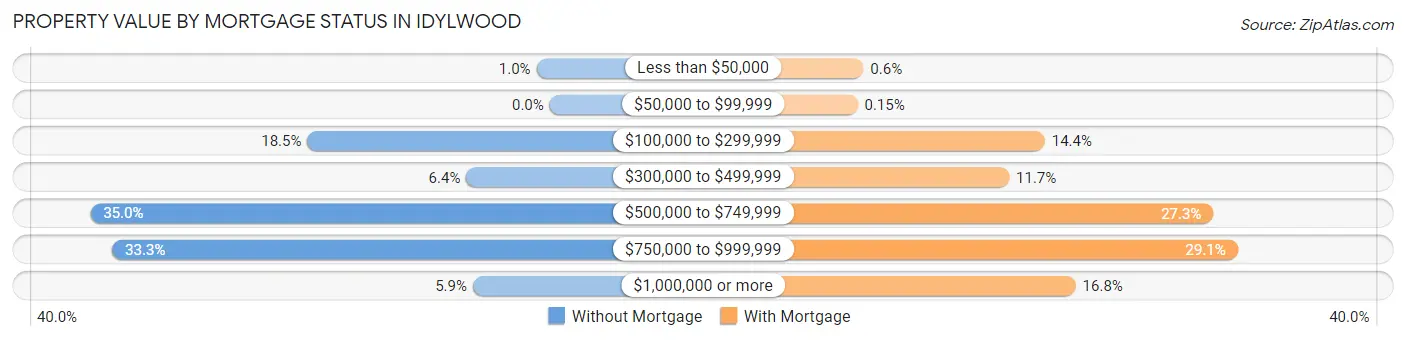
| Property Value | Without Mortgage | With Mortgage |
| Less than $50,000 | 12 (1.0%) | 16 (0.6%) |
| $50,000 to $99,999 | 0 (0.0%) | 4 (0.2%) |
| $100,000 to $299,999 | 221 (18.5%) | 387 (14.4%) |
| $300,000 to $499,999 | 76 (6.4%) | 314 (11.7%) |
| $500,000 to $749,999 | 419 (35.0%) | 731 (27.3%) |
| $750,000 to $999,999 | 399 (33.3%) | 781 (29.1%) |
| $1,000,000 or more | 70 (5.9%) | 450 (16.8%) |
| Total | 1,197 (100.0%) | 2,683 (100.0%) |
Household Income by Mortgage Status in Idylwood
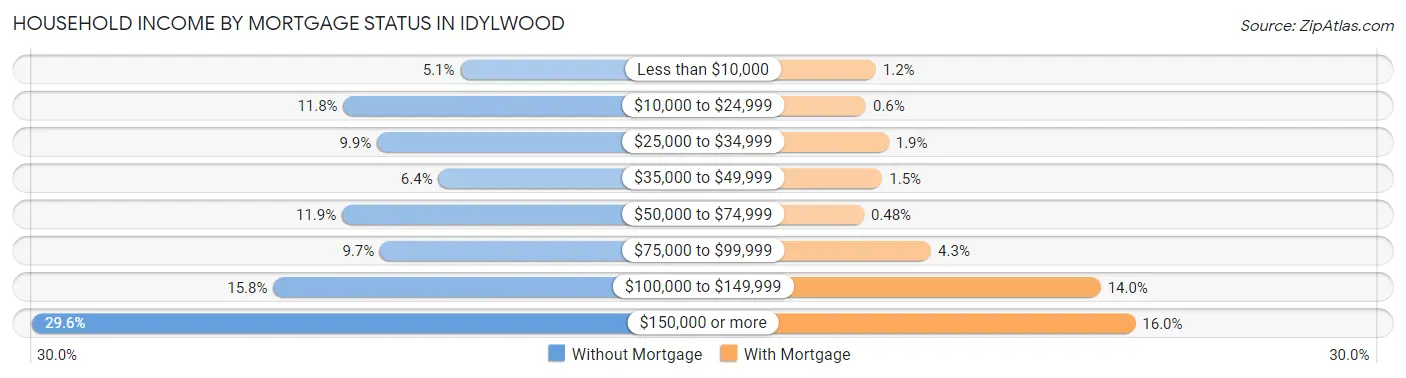
| Household Income | Without Mortgage | With Mortgage |
| Less than $10,000 | 61 (5.1%) | 31 (1.2%) |
| $10,000 to $24,999 | 141 (11.8%) | 16 (0.6%) |
| $25,000 to $34,999 | 118 (9.9%) | 51 (1.9%) |
| $35,000 to $49,999 | 76 (6.4%) | 41 (1.5%) |
| $50,000 to $74,999 | 142 (11.9%) | 13 (0.5%) |
| $75,000 to $99,999 | 116 (9.7%) | 116 (4.3%) |
| $100,000 to $149,999 | 189 (15.8%) | 376 (14.0%) |
| $150,000 or more | 354 (29.6%) | 429 (16.0%) |
| Total | 1,197 (100.0%) | 2,683 (100.0%) |
Property Value to Household Income Ratio in Idylwood
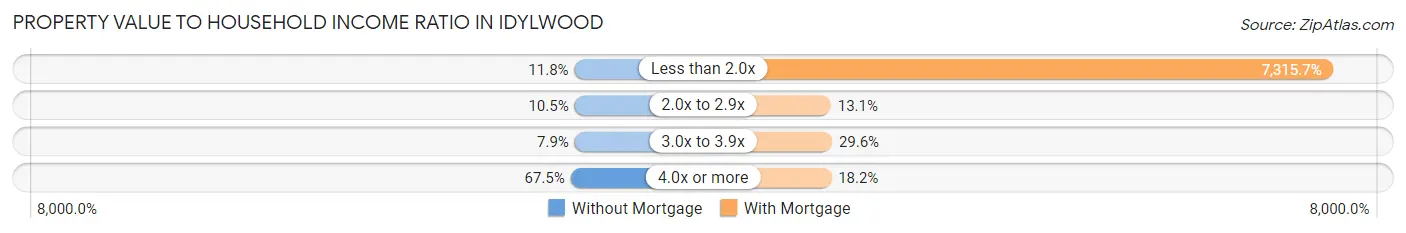
| Value-to-Income Ratio | Without Mortgage | With Mortgage |
| Less than 2.0x | 141 (11.8%) | 196,280 (7,315.7%) |
| 2.0x to 2.9x | 126 (10.5%) | 350 (13.1%) |
| 3.0x to 3.9x | 95 (7.9%) | 793 (29.6%) |
| 4.0x or more | 808 (67.5%) | 489 (18.2%) |
| Total | 1,197 (100.0%) | 2,683 (100.0%) |
Real Estate Taxes by Mortgage Status in Idylwood
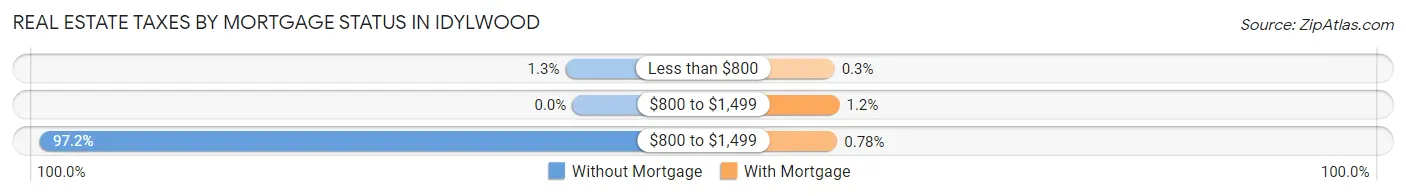
| Property Taxes | Without Mortgage | With Mortgage |
| Less than $800 | 15 (1.3%) | 8 (0.3%) |
| $800 to $1,499 | 0 (0.0%) | 32 (1.2%) |
| $800 to $1,499 | 1,163 (97.2%) | 21 (0.8%) |
| Total | 1,197 (100.0%) | 2,683 (100.0%) |
Health & Disability in Idylwood
Health Insurance Coverage by Age in Idylwood
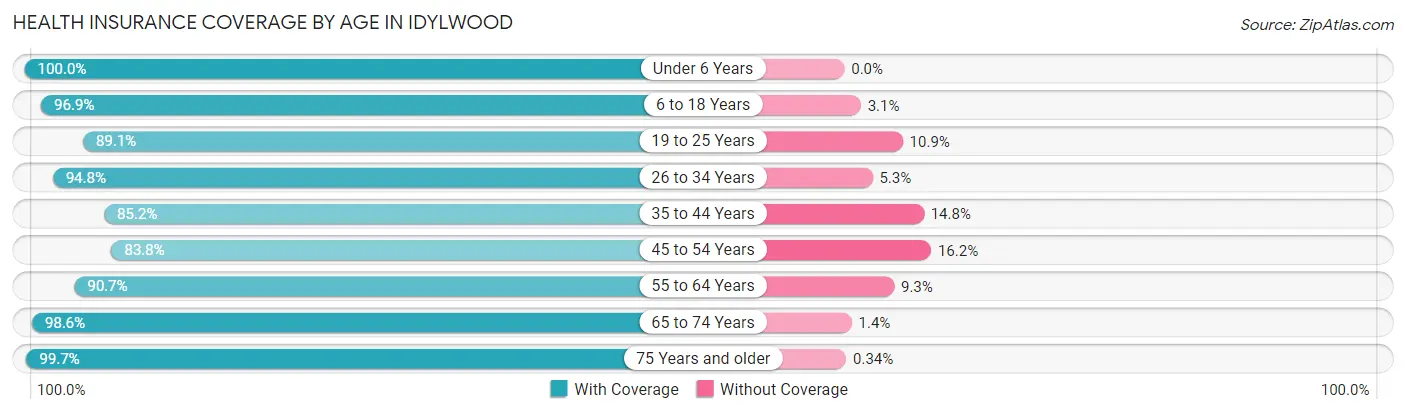
| Age Bracket | With Coverage | Without Coverage |
| Under 6 Years | 1,203 (100.0%) | 0 (0.0%) |
| 6 to 18 Years | 3,319 (96.9%) | 105 (3.1%) |
| 19 to 25 Years | 1,081 (89.1%) | 132 (10.9%) |
| 26 to 34 Years | 2,311 (94.8%) | 128 (5.2%) |
| 35 to 44 Years | 2,852 (85.2%) | 496 (14.8%) |
| 45 to 54 Years | 1,944 (83.8%) | 375 (16.2%) |
| 55 to 64 Years | 1,477 (90.7%) | 151 (9.3%) |
| 65 to 74 Years | 1,236 (98.6%) | 17 (1.4%) |
| 75 Years and older | 879 (99.7%) | 3 (0.3%) |
| Total | 16,302 (92.0%) | 1,407 (8.0%) |
Health Insurance Coverage by Citizenship Status in Idylwood
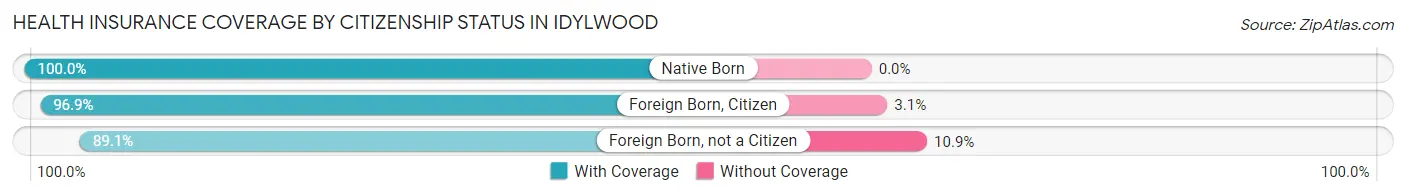
| Citizenship Status | With Coverage | Without Coverage |
| Native Born | 1,203 (100.0%) | 0 (0.0%) |
| Foreign Born, Citizen | 3,319 (96.9%) | 105 (3.1%) |
| Foreign Born, not a Citizen | 1,081 (89.1%) | 132 (10.9%) |
Health Insurance Coverage by Household Income in Idylwood
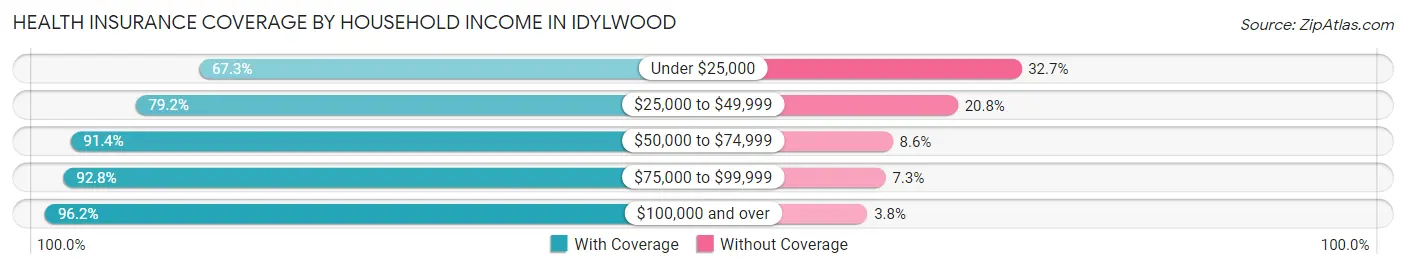
| Household Income | With Coverage | Without Coverage |
| Under $25,000 | 620 (67.3%) | 301 (32.7%) |
| $25,000 to $49,999 | 1,414 (79.2%) | 371 (20.8%) |
| $50,000 to $74,999 | 1,727 (91.4%) | 162 (8.6%) |
| $75,000 to $99,999 | 1,932 (92.7%) | 151 (7.2%) |
| $100,000 and over | 10,590 (96.2%) | 422 (3.8%) |
Public vs Private Health Insurance Coverage by Age in Idylwood
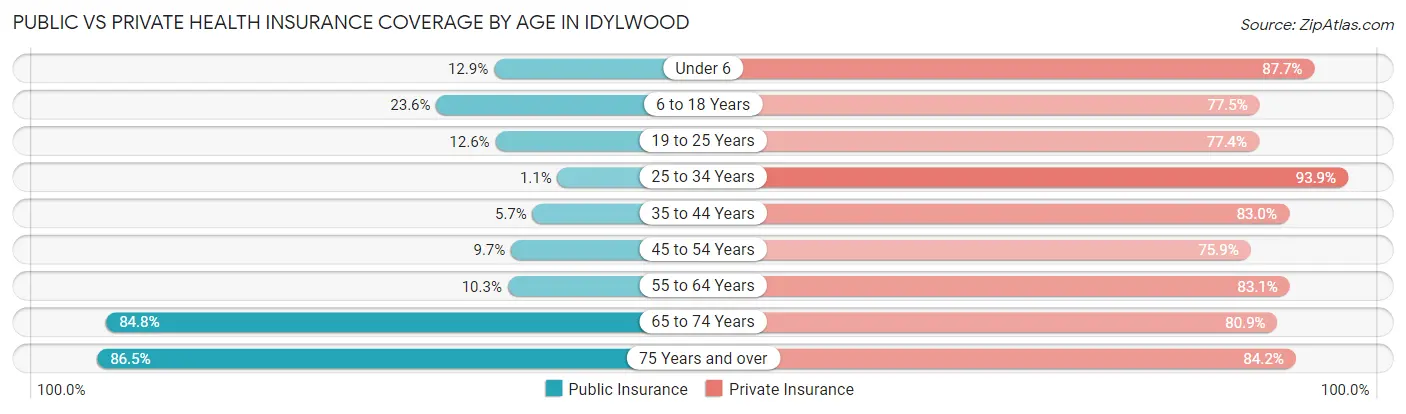
| Age Bracket | Public Insurance | Private Insurance |
| Under 6 | 155 (12.9%) | 1,055 (87.7%) |
| 6 to 18 Years | 807 (23.6%) | 2,655 (77.5%) |
| 19 to 25 Years | 153 (12.6%) | 939 (77.4%) |
| 25 to 34 Years | 26 (1.1%) | 2,291 (93.9%) |
| 35 to 44 Years | 191 (5.7%) | 2,777 (83.0%) |
| 45 to 54 Years | 225 (9.7%) | 1,759 (75.8%) |
| 55 to 64 Years | 168 (10.3%) | 1,353 (83.1%) |
| 65 to 74 Years | 1,063 (84.8%) | 1,013 (80.8%) |
| 75 Years and over | 763 (86.5%) | 743 (84.2%) |
| Total | 3,551 (20.1%) | 14,585 (82.4%) |
Disability Status by Sex by Age in Idylwood
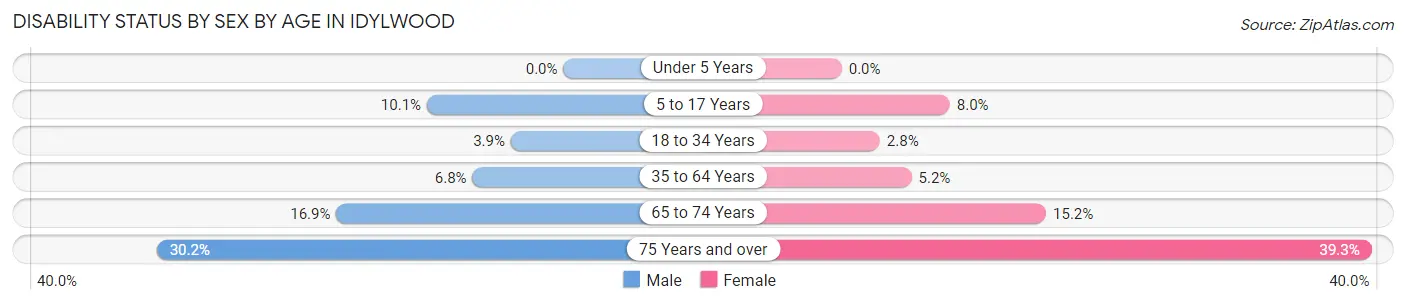
| Age Bracket | Male | Female |
| Under 5 Years | 0 (0.0%) | 0 (0.0%) |
| 5 to 17 Years | 165 (10.1%) | 132 (8.0%) |
| 18 to 34 Years | 76 (3.9%) | 56 (2.8%) |
| 35 to 64 Years | 250 (6.8%) | 186 (5.2%) |
| 65 to 74 Years | 89 (16.9%) | 110 (15.2%) |
| 75 Years and over | 112 (30.2%) | 201 (39.3%) |
Disability Class by Sex by Age in Idylwood
Disability Class: Hearing Difficulty
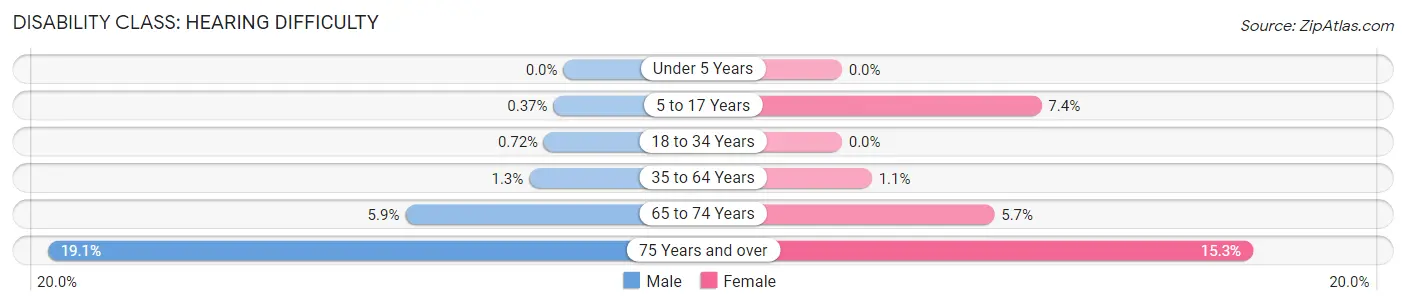
| Age Bracket | Male | Female |
| Under 5 Years | 0 (0.0%) | 0 (0.0%) |
| 5 to 17 Years | 6 (0.4%) | 122 (7.4%) |
| 18 to 34 Years | 14 (0.7%) | 0 (0.0%) |
| 35 to 64 Years | 47 (1.3%) | 40 (1.1%) |
| 65 to 74 Years | 31 (5.9%) | 41 (5.7%) |
| 75 Years and over | 71 (19.1%) | 78 (15.3%) |
Disability Class: Vision Difficulty
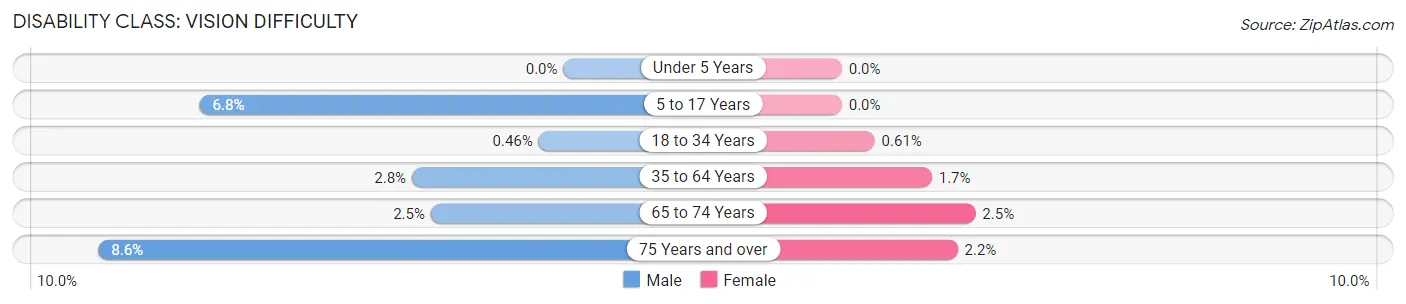
| Age Bracket | Male | Female |
| Under 5 Years | 0 (0.0%) | 0 (0.0%) |
| 5 to 17 Years | 110 (6.8%) | 0 (0.0%) |
| 18 to 34 Years | 9 (0.5%) | 12 (0.6%) |
| 35 to 64 Years | 104 (2.8%) | 60 (1.7%) |
| 65 to 74 Years | 13 (2.5%) | 18 (2.5%) |
| 75 Years and over | 32 (8.6%) | 11 (2.1%) |
Disability Class: Cognitive Difficulty
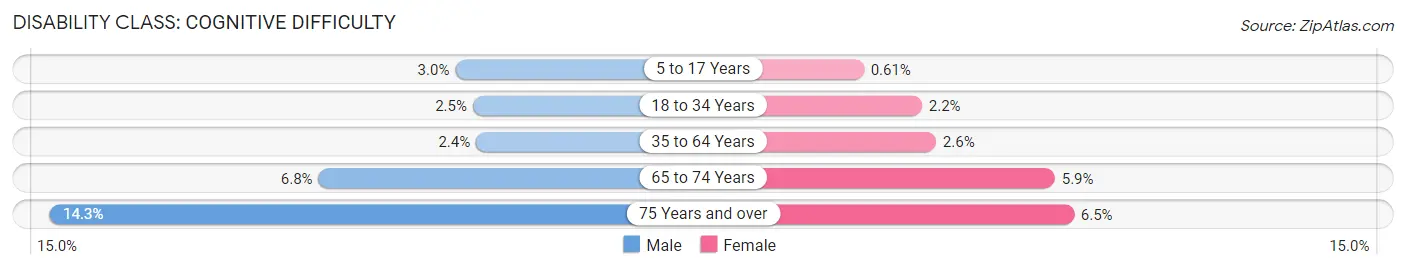
| Age Bracket | Male | Female |
| 5 to 17 Years | 49 (3.0%) | 10 (0.6%) |
| 18 to 34 Years | 49 (2.5%) | 44 (2.2%) |
| 35 to 64 Years | 90 (2.4%) | 94 (2.6%) |
| 65 to 74 Years | 36 (6.8%) | 43 (5.9%) |
| 75 Years and over | 53 (14.3%) | 33 (6.5%) |
Disability Class: Ambulatory Difficulty
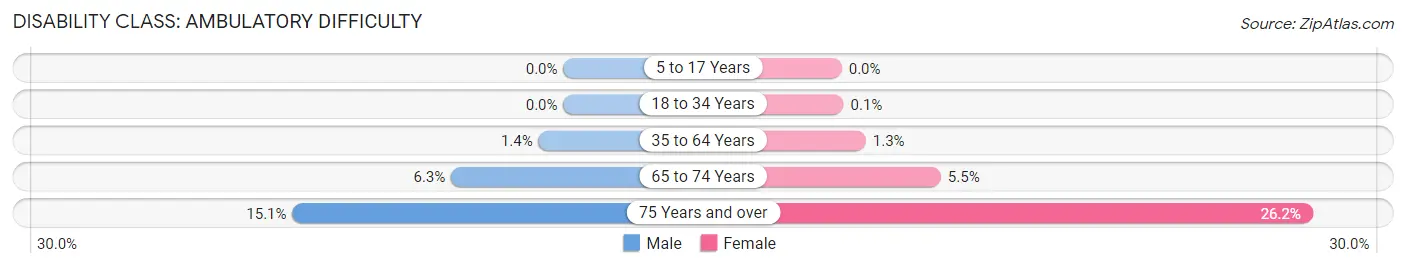
| Age Bracket | Male | Female |
| 5 to 17 Years | 0 (0.0%) | 0 (0.0%) |
| 18 to 34 Years | 0 (0.0%) | 2 (0.1%) |
| 35 to 64 Years | 51 (1.4%) | 48 (1.3%) |
| 65 to 74 Years | 33 (6.2%) | 40 (5.5%) |
| 75 Years and over | 56 (15.1%) | 134 (26.2%) |
Disability Class: Self-Care Difficulty
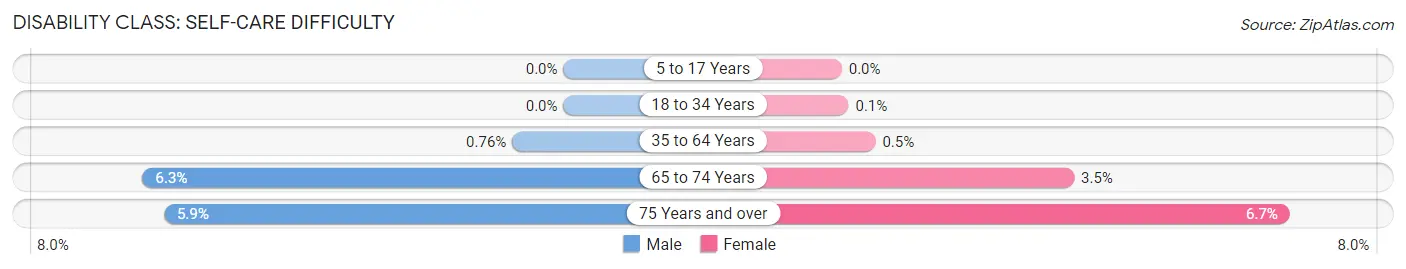
| Age Bracket | Male | Female |
| 5 to 17 Years | 0 (0.0%) | 0 (0.0%) |
| 18 to 34 Years | 0 (0.0%) | 2 (0.1%) |
| 35 to 64 Years | 28 (0.8%) | 18 (0.5%) |
| 65 to 74 Years | 33 (6.2%) | 25 (3.5%) |
| 75 Years and over | 22 (5.9%) | 34 (6.7%) |
Technology Access in Idylwood
Computing Device Access in Idylwood
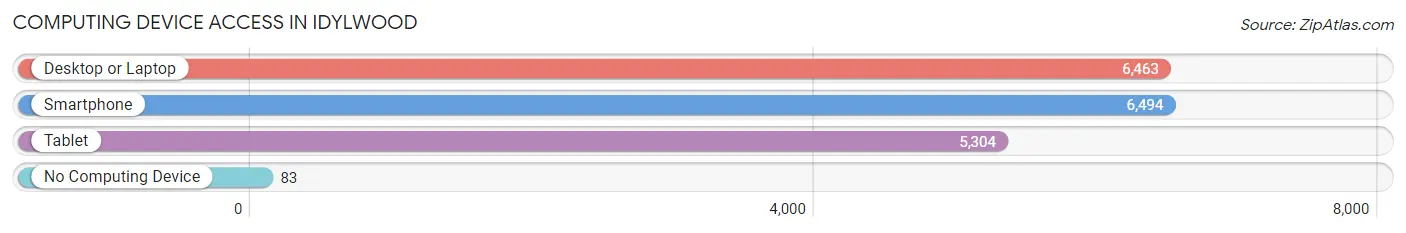
| Device Type | # Households | % Households |
| Desktop or Laptop | 6,463 | 91.4% |
| Smartphone | 6,494 | 91.8% |
| Tablet | 5,304 | 75.0% |
| No Computing Device | 83 | 1.2% |
| Total | 7,071 | 100.0% |
Internet Access in Idylwood
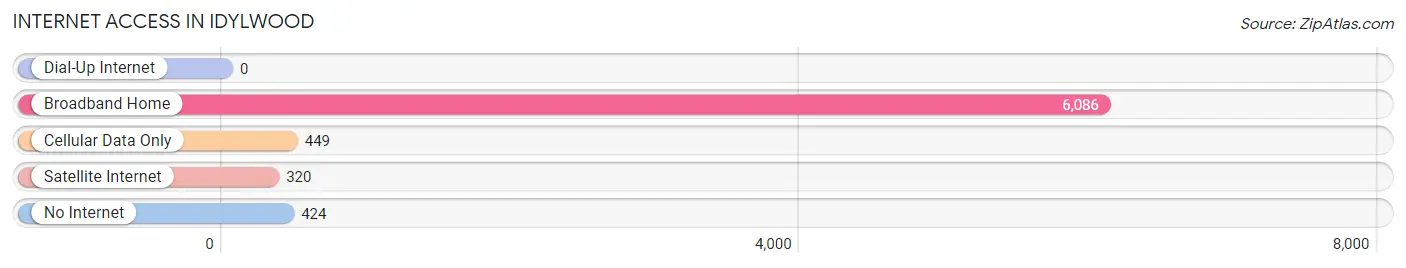
| Internet Type | # Households | % Households |
| Dial-Up Internet | 0 | 0.0% |
| Broadband Home | 6,086 | 86.1% |
| Cellular Data Only | 449 | 6.4% |
| Satellite Internet | 320 | 4.5% |
| No Internet | 424 | 6.0% |
| Total | 7,071 | 100.0% |
Idylwood Summary
Idylwood is a census-designated place (CDP) located in Fairfax County, Virginia. It is situated in the northern part of the county, just south of the City of Falls Church. The population of Idylwood was 8,845 at the 2010 census.
Geography
Idylwood is located at 38°51'17" North, 77°10'45" West (38.854722, -77.179167). It is bordered by the City of Falls Church to the north, the City of Fairfax to the east, the City of Vienna to the south, and the City of Tysons Corner to the west.
Idylwood is situated in the Piedmont region of Virginia, and is characterized by rolling hills and wooded areas. The terrain is generally flat, with some areas of steep slopes. The area is drained by the Potomac River and its tributaries.
The climate in Idylwood is temperate, with hot, humid summers and cold, wet winters. The average annual temperature is around 55°F (13°C).
Demographics
As of the 2010 census, Idylwood had a population of 8,845. The racial makeup of the CDP was 79.2% White, 8.2% African American, 0.3% Native American, 8.2% Asian, 0.1% Pacific Islander, 1.2% from other races, and 2.9% from two or more races. Hispanic or Latino of any race were 4.3% of the population.
The median household income in Idylwood was $90,945 in 2010, compared to the median income of $102,482 for Fairfax County as a whole. The median age of Idylwood residents was 37.7 years, compared to the median age of 37.2 years for Fairfax County.
Economy
Idylwood is home to a variety of businesses, including retail stores, restaurants, and professional services. The largest employers in the area are the federal government, the Fairfax County Public Schools system, and the City of Falls Church.
The area is also home to several technology companies, including the software development firm, Appian Corporation, and the IT consulting firm, CSC.
Education
Idylwood is served by the Fairfax County Public Schools system. The area is home to several elementary schools, including Idylwood Elementary School, Oak View Elementary School, and Vienna Elementary School. The area is also served by the Thomas Jefferson High School for Science and Technology, a magnet school for students in grades 9-12.
Conclusion
Idylwood is a census-designated place located in Fairfax County, Virginia. It is situated in the northern part of the county, just south of the City of Falls Church. The population of Idylwood was 8,845 at the 2010 census. The area is characterized by rolling hills and wooded areas, and is home to a variety of businesses, including retail stores, restaurants, and professional services. Idylwood is served by the Fairfax County Public Schools system, and is home to several elementary schools and the Thomas Jefferson High School for Science and Technology. The median household income in Idylwood was $90,945 in 2010, compared to the median income of $102,482 for Fairfax County as a whole.
Common Questions
What is Per Capita Income in Idylwood?
Per Capita income in Idylwood is $62,369.
What is the Median Family Income in Idylwood?
Median Family Income in Idylwood is $151,467.
What is the Median Household income in Idylwood?
Median Household Income in Idylwood is $112,677.
What is Income or Wage Gap in Idylwood?
Income or Wage Gap in Idylwood is 34.3%.
Women in Idylwood earn 65.7 cents for every dollar earned by a man.
What is Inequality or Gini Index in Idylwood?
Inequality or Gini Index in Idylwood is 0.44.
What is the Total Population of Idylwood?
Total Population of Idylwood is 17,788.
What is the Total Male Population of Idylwood?
Total Male Population of Idylwood is 8,875.
What is the Total Female Population of Idylwood?
Total Female Population of Idylwood is 8,913.
What is the Ratio of Males per 100 Females in Idylwood?
There are 99.57 Males per 100 Females in Idylwood.
What is the Ratio of Females per 100 Males in Idylwood?
There are 100.43 Females per 100 Males in Idylwood.
What is the Median Population Age in Idylwood?
Median Population Age in Idylwood is 36.5 Years.
What is the Average Family Size in Idylwood
Average Family Size in Idylwood is 3.2 People.
What is the Average Household Size in Idylwood
Average Household Size in Idylwood is 2.5 People.
How Large is the Labor Force in Idylwood?
There are 10,230 People in the Labor Forcein in Idylwood.
What is the Percentage of People in the Labor Force in Idylwood?
72.7% of People are in the Labor Force in Idylwood.
What is the Unemployment Rate in Idylwood?
Unemployment Rate in Idylwood is 2.4%.