Hayfield, VA Map & Demographics
Hayfield Map
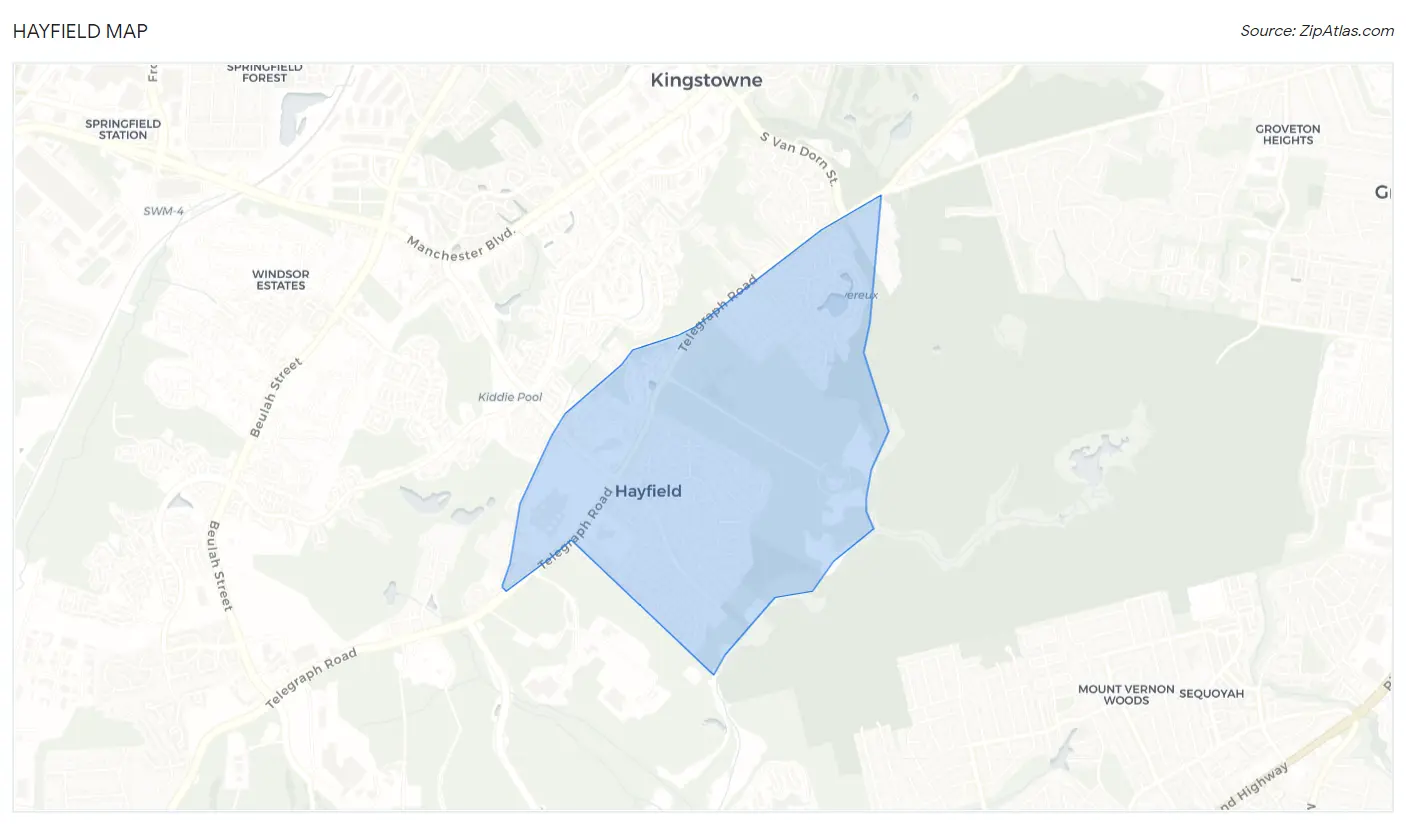
Hayfield Overview
$80,393
PER CAPITA INCOME
$192,826
AVG FAMILY INCOME
$176,125
AVG HOUSEHOLD INCOME
47.1%
WAGE / INCOME GAP [ % ]
52.9¢/ $1
WAGE / INCOME GAP [ $ ]
0.41
INEQUALITY / GINI INDEX
4,390
TOTAL POPULATION
2,302
MALE POPULATION
2,088
FEMALE POPULATION
110.25
MALES / 100 FEMALES
90.70
FEMALES / 100 MALES
40.6
MEDIAN AGE
3.3
AVG FAMILY SIZE
3.0
AVG HOUSEHOLD SIZE
2,141
LABOR FORCE [ PEOPLE ]
63.4%
PERCENT IN LABOR FORCE
3.6%
UNEMPLOYMENT RATE
Hayfield Area Codes
Income in Hayfield
Income Overview in Hayfield
Per Capita Income in Hayfield is $80,393, while median incomes of families and households are $192,826 and $176,125 respectively.
| Characteristic | Number | Measure |
| Per Capita Income | 4,390 | $80,393 |
| Median Family Income | 1,200 | $192,826 |
| Mean Family Income | 1,200 | $260,518 |
| Median Household Income | 1,466 | $176,125 |
| Mean Household Income | 1,466 | $235,135 |
| Income Deficit | 1,200 | $0 |
| Wage / Income Gap (%) | 4,390 | 47.12% |
| Wage / Income Gap ($) | 4,390 | 52.88¢ per $1 |
| Gini / Inequality Index | 4,390 | 0.41 |
Earnings by Sex in Hayfield
Average Earnings in Hayfield are $78,988, $96,214 for men and $50,878 for women, a difference of 47.1%.
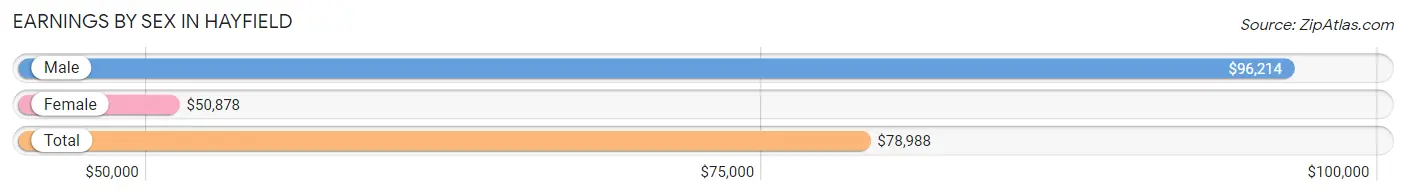
| Sex | Number | Average Earnings |
| Male | 1,358 (55.7%) | $96,214 |
| Female | 1,081 (44.3%) | $50,878 |
| Total | 2,439 (100.0%) | $78,988 |
Earnings by Sex by Income Bracket in Hayfield
The most common earnings brackets in Hayfield are $100,000+ for men (643 | 47.3%) and $100,000+ for women (309 | 28.6%).
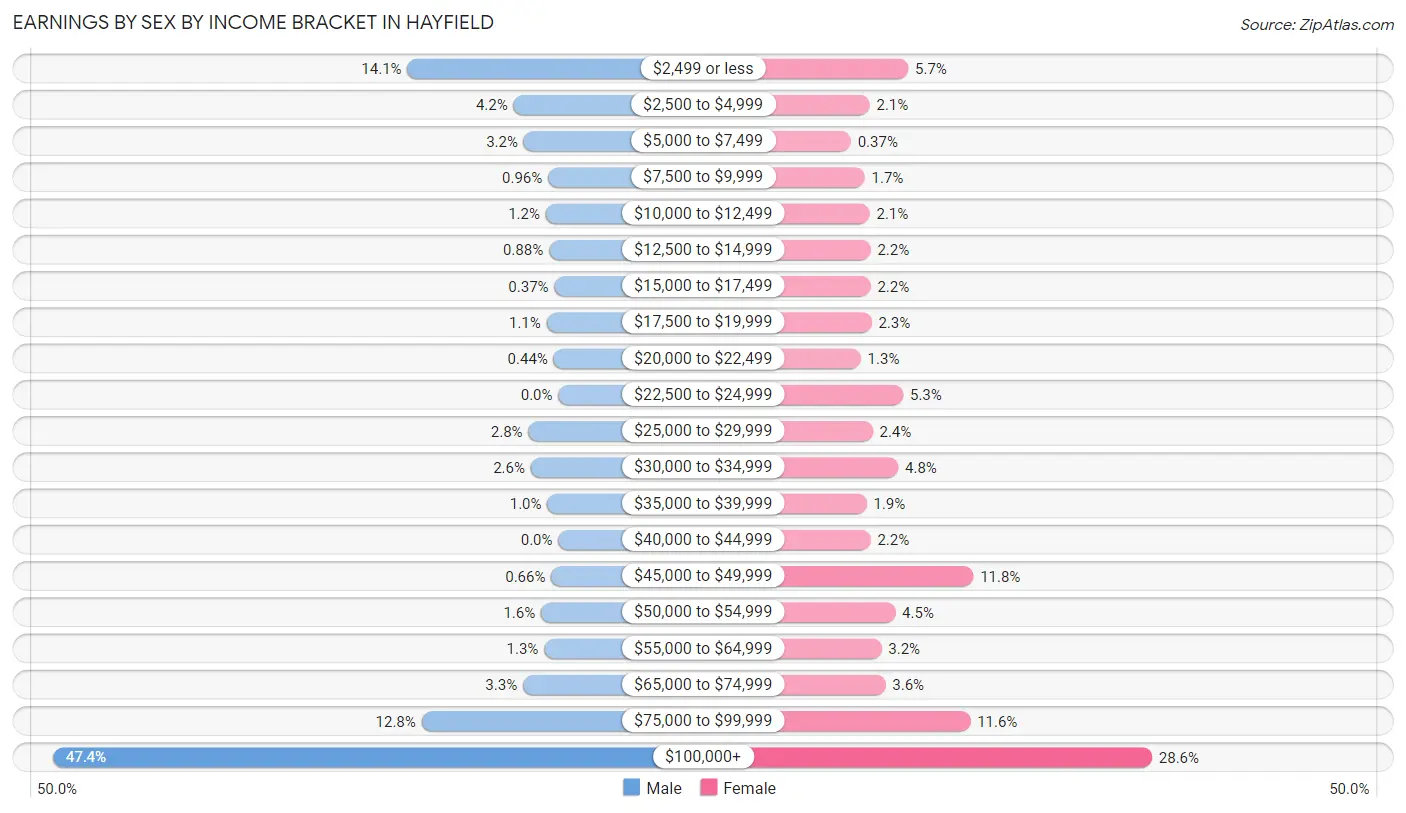
| Income | Male | Female |
| $2,499 or less | 192 (14.1%) | 62 (5.7%) |
| $2,500 to $4,999 | 57 (4.2%) | 23 (2.1%) |
| $5,000 to $7,499 | 44 (3.2%) | 4 (0.4%) |
| $7,500 to $9,999 | 13 (1.0%) | 18 (1.7%) |
| $10,000 to $12,499 | 16 (1.2%) | 23 (2.1%) |
| $12,500 to $14,999 | 12 (0.9%) | 24 (2.2%) |
| $15,000 to $17,499 | 5 (0.4%) | 24 (2.2%) |
| $17,500 to $19,999 | 15 (1.1%) | 25 (2.3%) |
| $20,000 to $22,499 | 6 (0.4%) | 14 (1.3%) |
| $22,500 to $24,999 | 0 (0.0%) | 57 (5.3%) |
| $25,000 to $29,999 | 38 (2.8%) | 26 (2.4%) |
| $30,000 to $34,999 | 35 (2.6%) | 52 (4.8%) |
| $35,000 to $39,999 | 14 (1.0%) | 20 (1.8%) |
| $40,000 to $44,999 | 0 (0.0%) | 24 (2.2%) |
| $45,000 to $49,999 | 9 (0.7%) | 128 (11.8%) |
| $50,000 to $54,999 | 22 (1.6%) | 49 (4.5%) |
| $55,000 to $64,999 | 18 (1.3%) | 35 (3.2%) |
| $65,000 to $74,999 | 45 (3.3%) | 39 (3.6%) |
| $75,000 to $99,999 | 174 (12.8%) | 125 (11.6%) |
| $100,000+ | 643 (47.3%) | 309 (28.6%) |
| Total | 1,358 (100.0%) | 1,081 (100.0%) |
Earnings by Sex by Educational Attainment in Hayfield
Average earnings in Hayfield are $120,200 for men and $61,563 for women, a difference of 48.8%. Men with an educational attainment of graduate degree enjoy the highest average annual earnings of $161,250, while those with college or associate's degree education earn the least with $95,859. Women with an educational attainment of graduate degree earn the most with the average annual earnings of $102,250, while those with college or associate's degree education have the smallest earnings of $45,543.
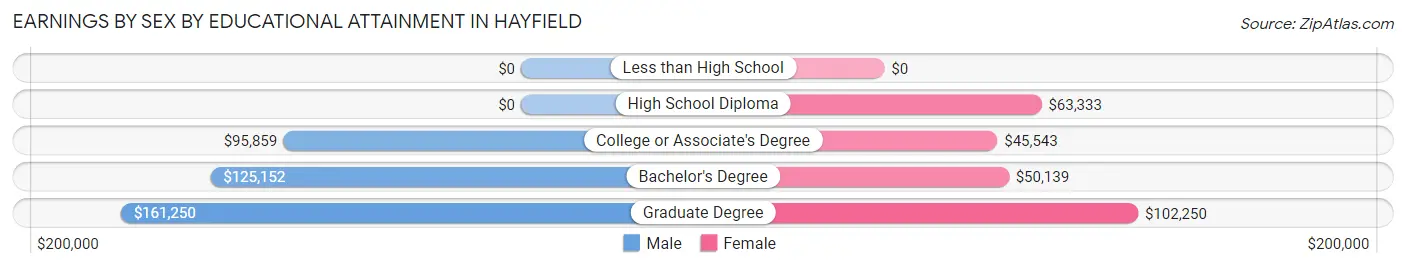
| Educational Attainment | Male Income | Female Income |
| Less than High School | - | - |
| High School Diploma | - | - |
| College or Associate's Degree | $95,859 | $45,543 |
| Bachelor's Degree | $125,152 | $50,139 |
| Graduate Degree | $161,250 | $102,250 |
| Total | $120,200 | $61,563 |
Family Income in Hayfield
Family Income Brackets in Hayfield
According to the Hayfield family income data, there are 575 families falling into the $200,000+ income range, which is the most common income bracket and makes up 47.9% of all families.
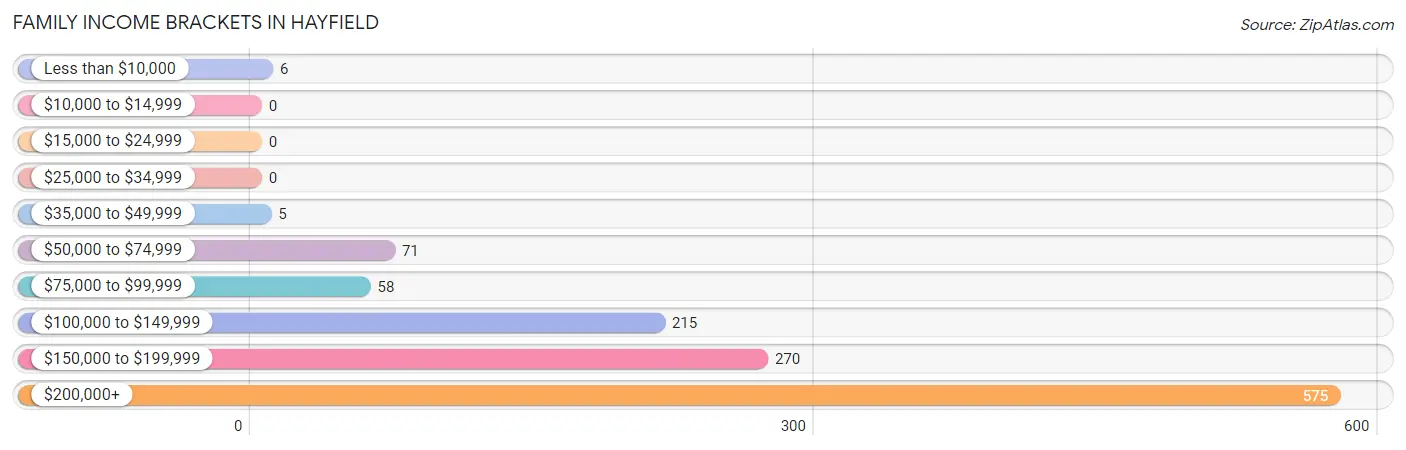
| Income Bracket | # Families | % Families |
| Less than $10,000 | 6 | 0.5% |
| $10,000 to $14,999 | 0 | 0.0% |
| $15,000 to $24,999 | 0 | 0.0% |
| $25,000 to $34,999 | 0 | 0.0% |
| $35,000 to $49,999 | 5 | 0.4% |
| $50,000 to $74,999 | 71 | 5.9% |
| $75,000 to $99,999 | 58 | 4.8% |
| $100,000 to $149,999 | 215 | 17.9% |
| $150,000 to $199,999 | 270 | 22.5% |
| $200,000+ | 575 | 47.9% |
Family Income by Famaliy Size in Hayfield
6-person families (43 | 3.6%) account for the highest median family income in Hayfield with $250,001 per family, while 2-person families (454 | 37.8%) have the highest median income of $85,000 per family member.
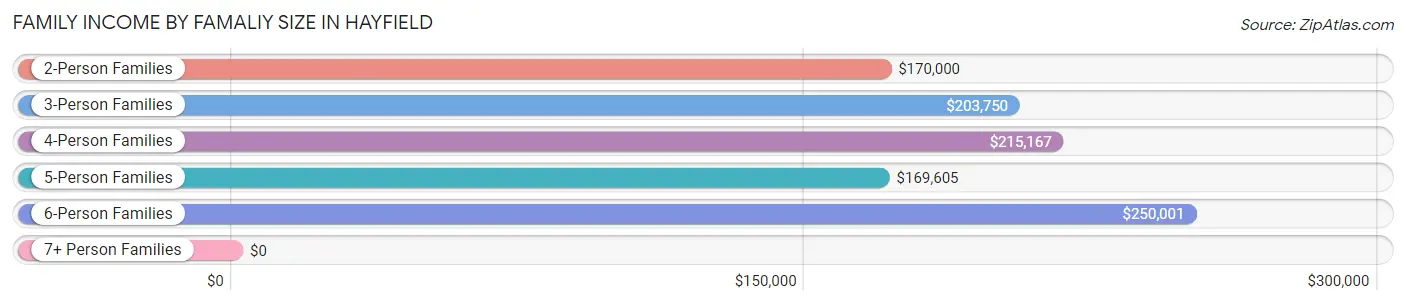
| Income Bracket | # Families | Median Income |
| 2-Person Families | 454 (37.8%) | $170,000 |
| 3-Person Families | 443 (36.9%) | $203,750 |
| 4-Person Families | 164 (13.7%) | $215,167 |
| 5-Person Families | 90 (7.5%) | $169,605 |
| 6-Person Families | 43 (3.6%) | $250,001 |
| 7+ Person Families | 6 (0.5%) | $0 |
| Total | 1,200 (100.0%) | $192,826 |
Family Income by Number of Earners in Hayfield
The median family income in Hayfield is $192,826, with families comprising 3+ earners (170) having the highest median family income of $250,001, while families with no earners (142) have the lowest median family income of $132,750, accounting for 14.2% and 11.8% of families, respectively.
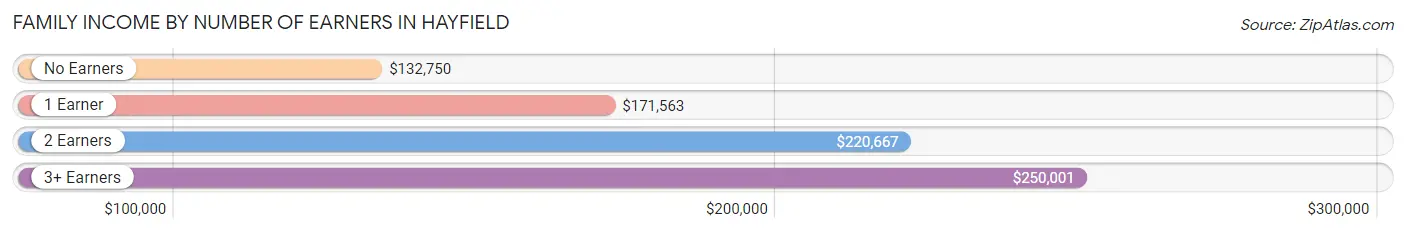
| Number of Earners | # Families | Median Income |
| No Earners | 142 (11.8%) | $132,750 |
| 1 Earner | 344 (28.7%) | $171,563 |
| 2 Earners | 544 (45.3%) | $220,667 |
| 3+ Earners | 170 (14.2%) | $250,001 |
| Total | 1,200 (100.0%) | $192,826 |
Household Income in Hayfield
Household Income Brackets in Hayfield
With 617 households falling in the category, the $200,000+ income range is the most frequent in Hayfield, accounting for 42.1% of all households.
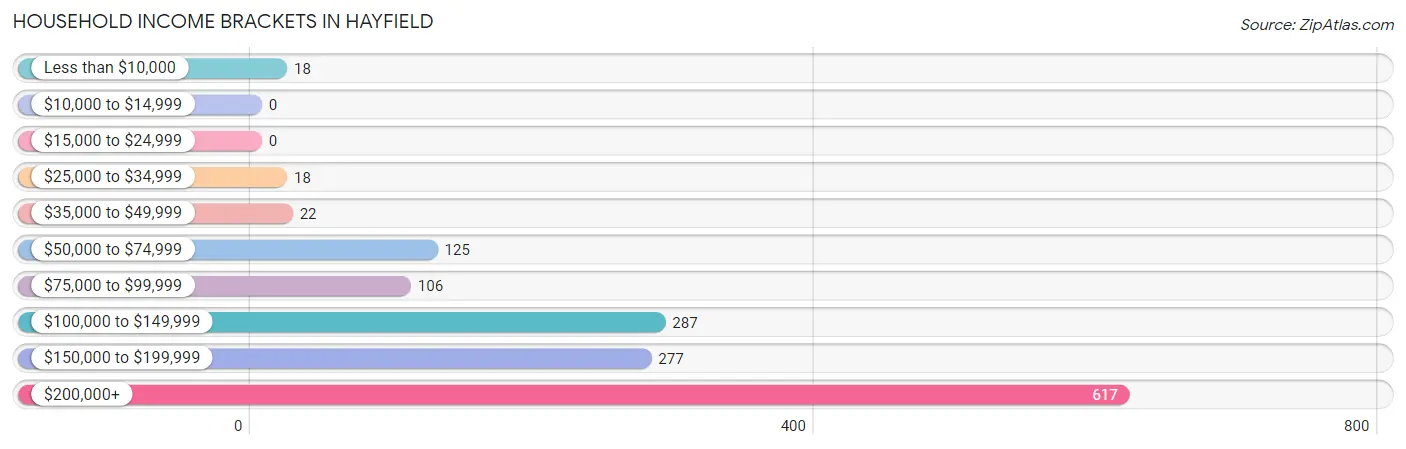
| Income Bracket | # Households | % Households |
| Less than $10,000 | 18 | 1.2% |
| $10,000 to $14,999 | 0 | 0.0% |
| $15,000 to $24,999 | 0 | 0.0% |
| $25,000 to $34,999 | 18 | 1.2% |
| $35,000 to $49,999 | 22 | 1.5% |
| $50,000 to $74,999 | 125 | 8.5% |
| $75,000 to $99,999 | 106 | 7.2% |
| $100,000 to $149,999 | 287 | 19.6% |
| $150,000 to $199,999 | 277 | 18.9% |
| $200,000+ | 617 | 42.1% |
Household Income by Householder Age in Hayfield
The median household income in Hayfield is $176,125, with the highest median household income of $204,545 found in the 25 to 44 years age bracket for the primary householder. A total of 414 households (28.2%) fall into this category.
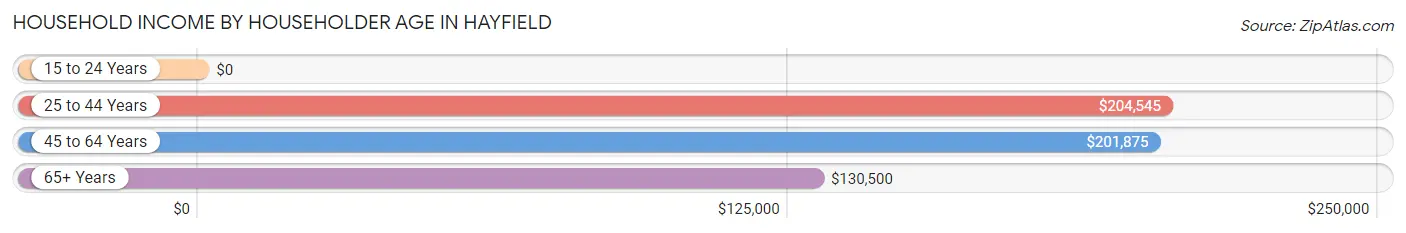
| Income Bracket | # Households | Median Income |
| 15 to 24 Years | 0 (0.0%) | $0 |
| 25 to 44 Years | 414 (28.2%) | $204,545 |
| 45 to 64 Years | 570 (38.9%) | $201,875 |
| 65+ Years | 482 (32.9%) | $130,500 |
| Total | 1,466 (100.0%) | $176,125 |
Poverty in Hayfield
Income Below Poverty by Sex and Age in Hayfield
With 0.3% poverty level for males and 1.9% for females among the residents of Hayfield, 12 to 14 year old males and 18 to 24 year old females are the most vulnerable to poverty, with 7 males (14.0%) and 13 females (13.3%) in their respective age groups living below the poverty level.
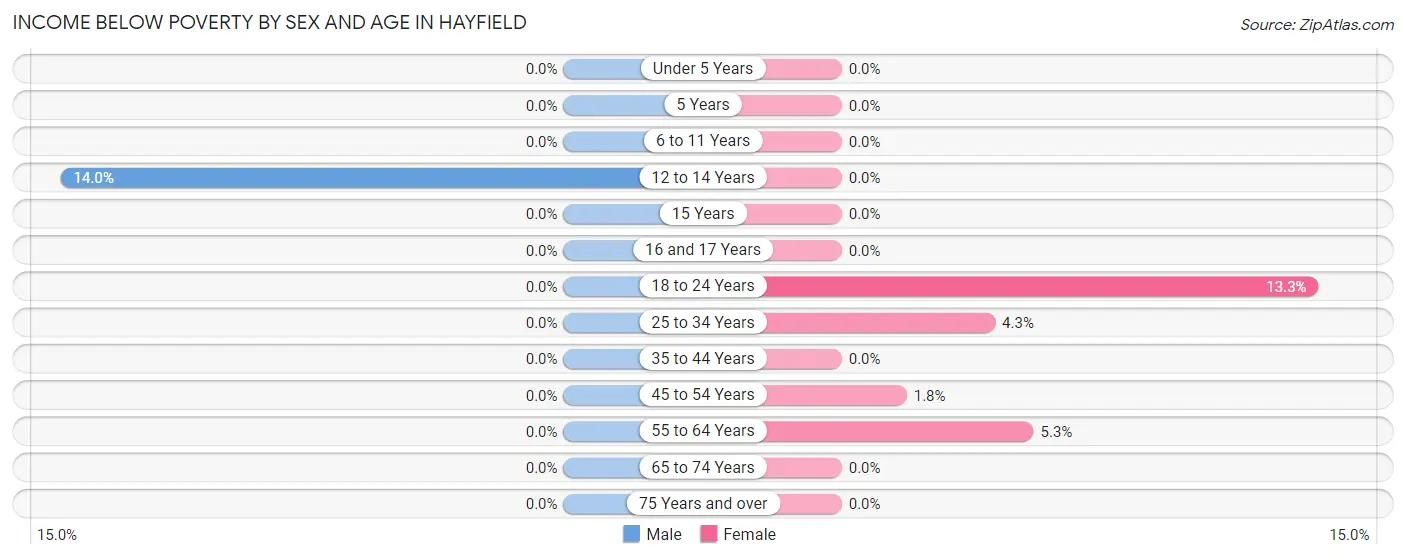
| Age Bracket | Male | Female |
| Under 5 Years | 0 (0.0%) | 0 (0.0%) |
| 5 Years | 0 (0.0%) | 0 (0.0%) |
| 6 to 11 Years | 0 (0.0%) | 0 (0.0%) |
| 12 to 14 Years | 7 (14.0%) | 0 (0.0%) |
| 15 Years | 0 (0.0%) | 0 (0.0%) |
| 16 and 17 Years | 0 (0.0%) | 0 (0.0%) |
| 18 to 24 Years | 0 (0.0%) | 13 (13.3%) |
| 25 to 34 Years | 0 (0.0%) | 9 (4.3%) |
| 35 to 44 Years | 0 (0.0%) | 0 (0.0%) |
| 45 to 54 Years | 0 (0.0%) | 6 (1.8%) |
| 55 to 64 Years | 0 (0.0%) | 11 (5.3%) |
| 65 to 74 Years | 0 (0.0%) | 0 (0.0%) |
| 75 Years and over | 0 (0.0%) | 0 (0.0%) |
| Total | 7 (0.3%) | 39 (1.9%) |
Income Above Poverty by Sex and Age in Hayfield
According to the poverty statistics in Hayfield, males aged under 5 years and females aged under 5 years are the age groups that are most secure financially, with 100.0% of males and 100.0% of females in these age groups living above the poverty line.
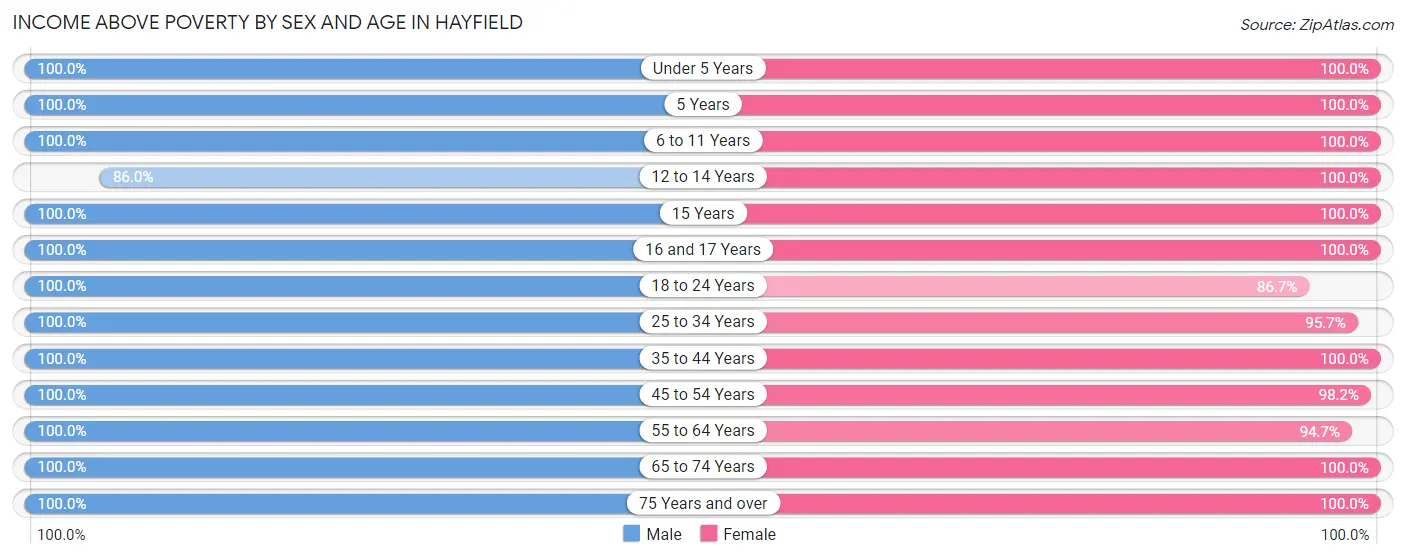
| Age Bracket | Male | Female |
| Under 5 Years | 241 (100.0%) | 106 (100.0%) |
| 5 Years | 10 (100.0%) | 62 (100.0%) |
| 6 to 11 Years | 264 (100.0%) | 199 (100.0%) |
| 12 to 14 Years | 43 (86.0%) | 34 (100.0%) |
| 15 Years | 32 (100.0%) | 15 (100.0%) |
| 16 and 17 Years | 41 (100.0%) | 58 (100.0%) |
| 18 to 24 Years | 258 (100.0%) | 85 (86.7%) |
| 25 to 34 Years | 196 (100.0%) | 202 (95.7%) |
| 35 to 44 Years | 286 (100.0%) | 233 (100.0%) |
| 45 to 54 Years | 315 (100.0%) | 325 (98.2%) |
| 55 to 64 Years | 233 (100.0%) | 195 (94.7%) |
| 65 to 74 Years | 224 (100.0%) | 333 (100.0%) |
| 75 Years and over | 118 (100.0%) | 202 (100.0%) |
| Total | 2,261 (99.7%) | 2,049 (98.1%) |
Income Below Poverty Among Married-Couple Families in Hayfield
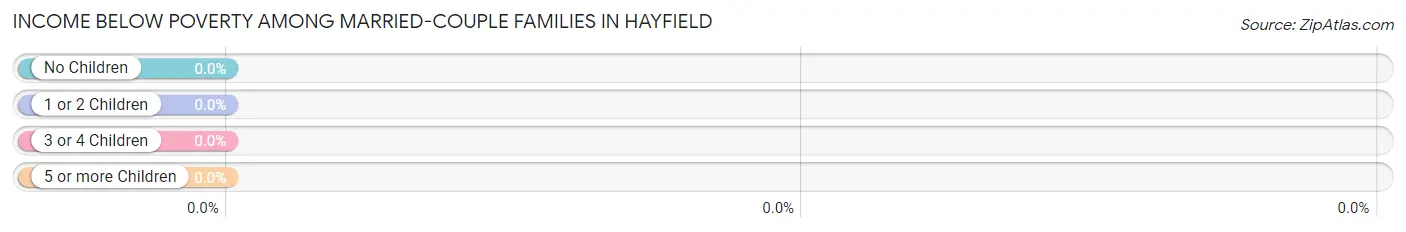
| Children | Above Poverty | Below Poverty |
| No Children | 532 (100.0%) | 0 (0.0%) |
| 1 or 2 Children | 333 (100.0%) | 0 (0.0%) |
| 3 or 4 Children | 108 (100.0%) | 0 (0.0%) |
| 5 or more Children | 6 (100.0%) | 0 (0.0%) |
| Total | 979 (100.0%) | 0 (0.0%) |
Income Below Poverty Among Single-Parent Households in Hayfield
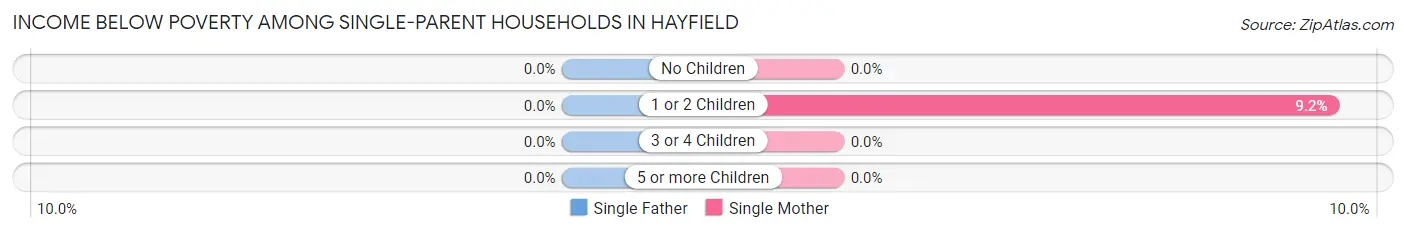
| Children | Single Father | Single Mother |
| No Children | 0 (0.0%) | 0 (0.0%) |
| 1 or 2 Children | 0 (0.0%) | 6 (9.2%) |
| 3 or 4 Children | 0 (0.0%) | 0 (0.0%) |
| 5 or more Children | 0 (0.0%) | 0 (0.0%) |
| Total | 0 (0.0%) | 6 (5.2%) |
Income Below Poverty Among Married-Couple vs Single-Parent Households in Hayfield
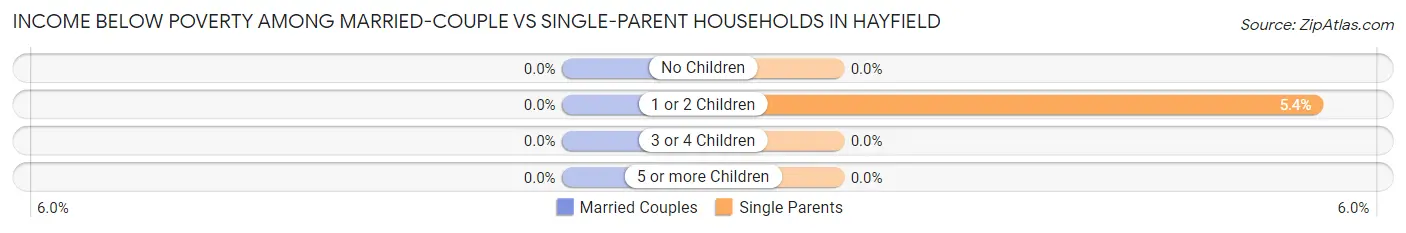
| Children | Married-Couple Families | Single-Parent Households |
| No Children | 0 (0.0%) | 0 (0.0%) |
| 1 or 2 Children | 0 (0.0%) | 6 (5.4%) |
| 3 or 4 Children | 0 (0.0%) | 0 (0.0%) |
| 5 or more Children | 0 (0.0%) | 0 (0.0%) |
| Total | 0 (0.0%) | 6 (2.7%) |
Race in Hayfield
The most populous races in Hayfield are White / Caucasian (3,451 | 78.6%), Two or more Races (417 | 9.5%), and Hispanic or Latino (268 | 6.1%).
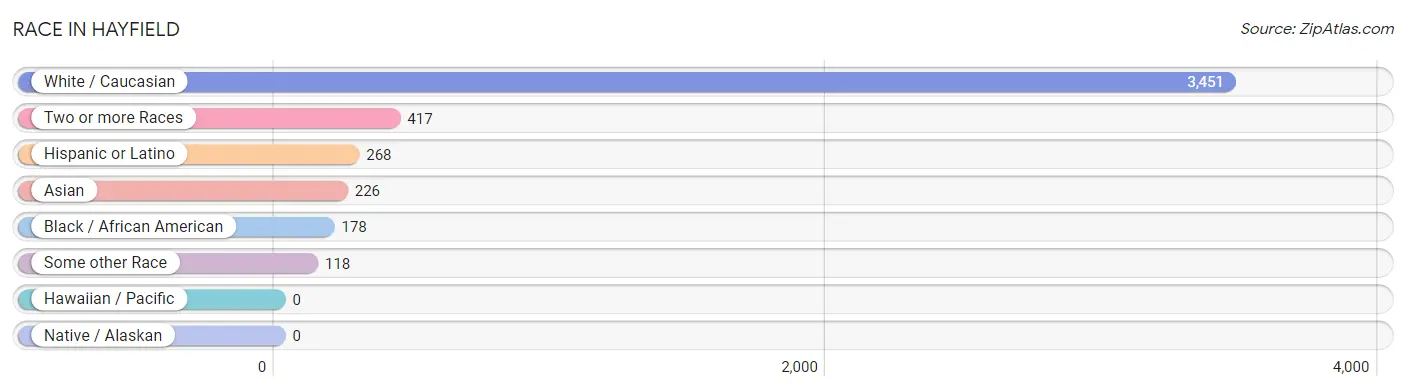
| Race | # Population | % Population |
| Asian | 226 | 5.1% |
| Black / African American | 178 | 4.1% |
| Hawaiian / Pacific | 0 | 0.0% |
| Hispanic or Latino | 268 | 6.1% |
| Native / Alaskan | 0 | 0.0% |
| White / Caucasian | 3,451 | 78.6% |
| Two or more Races | 417 | 9.5% |
| Some other Race | 118 | 2.7% |
| Total | 4,390 | 100.0% |
Ancestry in Hayfield
The most populous ancestries reported in Hayfield are Irish (890 | 20.3%), German (880 | 20.1%), English (694 | 15.8%), American (557 | 12.7%), and Italian (461 | 10.5%), together accounting for 79.3% of all Hayfield residents.
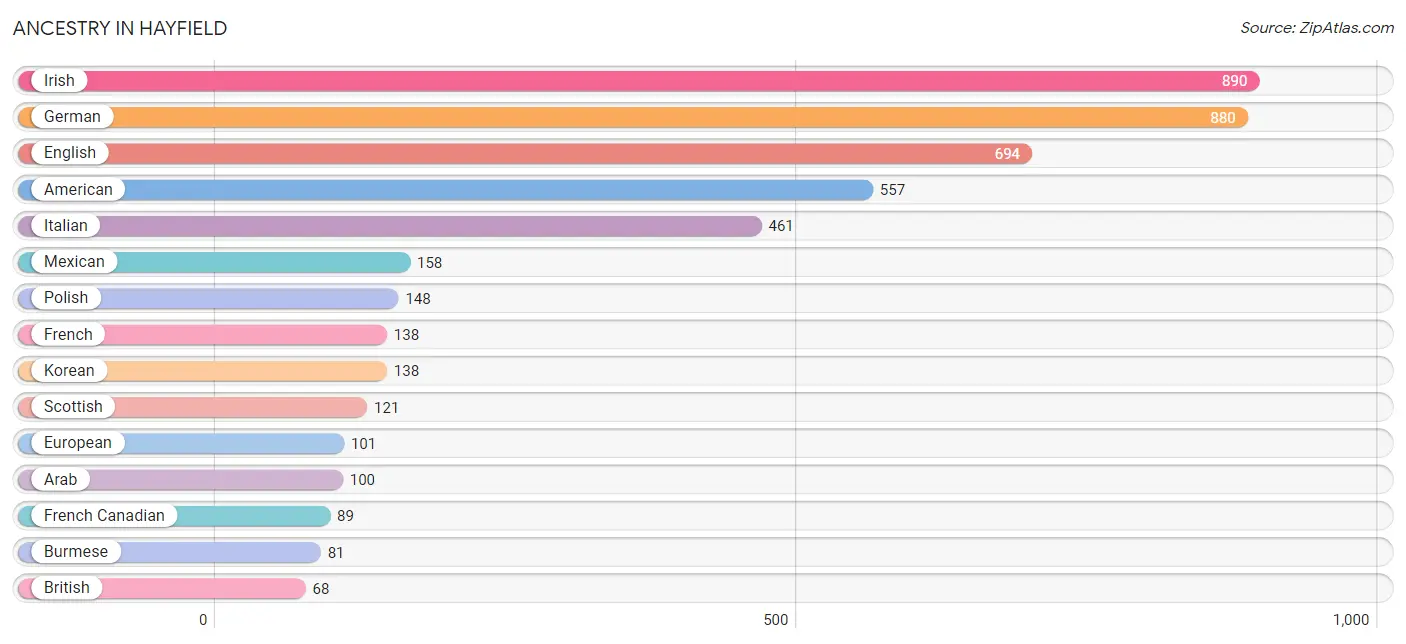
| Ancestry | # Population | % Population |
| American | 557 | 12.7% |
| Arab | 100 | 2.3% |
| Armenian | 29 | 0.7% |
| Austrian | 8 | 0.2% |
| Bhutanese | 24 | 0.5% |
| Blackfeet | 6 | 0.1% |
| Bolivian | 25 | 0.6% |
| British | 68 | 1.5% |
| Burmese | 81 | 1.8% |
| Celtic | 15 | 0.3% |
| Chinese | 15 | 0.3% |
| Chippewa | 7 | 0.2% |
| Colombian | 4 | 0.1% |
| Czech | 21 | 0.5% |
| Dutch | 17 | 0.4% |
| Eastern European | 43 | 1.0% |
| Ecuadorian | 9 | 0.2% |
| English | 694 | 15.8% |
| Ethiopian | 59 | 1.3% |
| European | 101 | 2.3% |
| Finnish | 10 | 0.2% |
| French | 138 | 3.1% |
| French Canadian | 89 | 2.0% |
| German | 880 | 20.1% |
| Ghanaian | 4 | 0.1% |
| Greek | 8 | 0.2% |
| Hungarian | 5 | 0.1% |
| Indian (Asian) | 57 | 1.3% |
| Irish | 890 | 20.3% |
| Israeli | 5 | 0.1% |
| Italian | 461 | 10.5% |
| Korean | 138 | 3.1% |
| Lebanese | 44 | 1.0% |
| Lithuanian | 7 | 0.2% |
| Mexican | 158 | 3.6% |
| Mexican American Indian | 20 | 0.5% |
| Moroccan | 14 | 0.3% |
| Native Hawaiian | 13 | 0.3% |
| Navajo | 6 | 0.1% |
| Northern European | 26 | 0.6% |
| Norwegian | 11 | 0.3% |
| Polish | 148 | 3.4% |
| Portuguese | 24 | 0.5% |
| Puerto Rican | 20 | 0.5% |
| Russian | 47 | 1.1% |
| Scandinavian | 6 | 0.1% |
| Scotch-Irish | 67 | 1.5% |
| Scottish | 121 | 2.8% |
| Serbian | 24 | 0.5% |
| Slovak | 30 | 0.7% |
| South American | 38 | 0.9% |
| Spaniard | 35 | 0.8% |
| Spanish | 7 | 0.2% |
| Sri Lankan | 41 | 0.9% |
| Subsaharan African | 63 | 1.4% |
| Swedish | 11 | 0.3% |
| Swiss | 23 | 0.5% |
| Thai | 45 | 1.0% |
| Ukrainian | 29 | 0.7% |
| Welsh | 33 | 0.7% | View All 60 Rows |
Immigrants in Hayfield
The most numerous immigrant groups reported in Hayfield came from Asia (180 | 4.1%), Europe (132 | 3.0%), South Eastern Asia (108 | 2.5%), Latin America (91 | 2.1%), and Germany (72 | 1.6%), together accounting for 13.3% of all Hayfield residents.
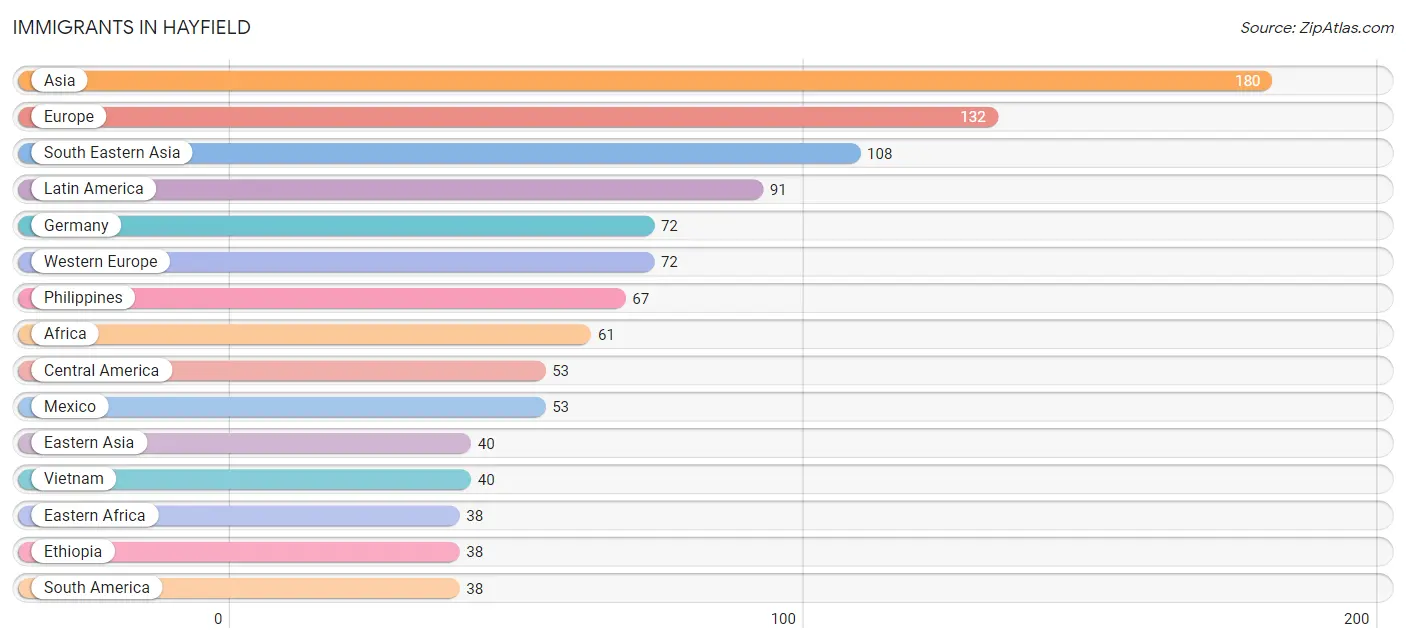
| Immigration Origin | # Population | % Population |
| Africa | 61 | 1.4% |
| Asia | 180 | 4.1% |
| Bolivia | 20 | 0.5% |
| Brazil | 5 | 0.1% |
| Canada | 5 | 0.1% |
| Central America | 53 | 1.2% |
| China | 14 | 0.3% |
| Colombia | 4 | 0.1% |
| Czechoslovakia | 6 | 0.1% |
| Eastern Africa | 38 | 0.9% |
| Eastern Asia | 40 | 0.9% |
| Eastern Europe | 22 | 0.5% |
| Ecuador | 9 | 0.2% |
| Ethiopia | 38 | 0.9% |
| Europe | 132 | 3.0% |
| Germany | 72 | 1.6% |
| Ghana | 4 | 0.1% |
| India | 22 | 0.5% |
| Ireland | 5 | 0.1% |
| Japan | 6 | 0.1% |
| Korea | 20 | 0.5% |
| Latin America | 91 | 2.1% |
| Lebanon | 10 | 0.2% |
| Mexico | 53 | 1.2% |
| Northern Europe | 5 | 0.1% |
| Philippines | 67 | 1.5% |
| Portugal | 20 | 0.5% |
| Russia | 8 | 0.2% |
| Serbia | 8 | 0.2% |
| Sierra Leone | 19 | 0.4% |
| South America | 38 | 0.9% |
| South Central Asia | 22 | 0.5% |
| South Eastern Asia | 108 | 2.5% |
| Southern Europe | 33 | 0.7% |
| Spain | 13 | 0.3% |
| Taiwan | 14 | 0.3% |
| Thailand | 1 | 0.0% |
| Vietnam | 40 | 0.9% |
| Western Africa | 23 | 0.5% |
| Western Asia | 10 | 0.2% |
| Western Europe | 72 | 1.6% | View All 41 Rows |
Sex and Age in Hayfield
Sex and Age in Hayfield
The most populous age groups in Hayfield are 15 to 19 Years (301 | 13.1%) for men and 45 to 49 Years (222 | 10.6%) for women.
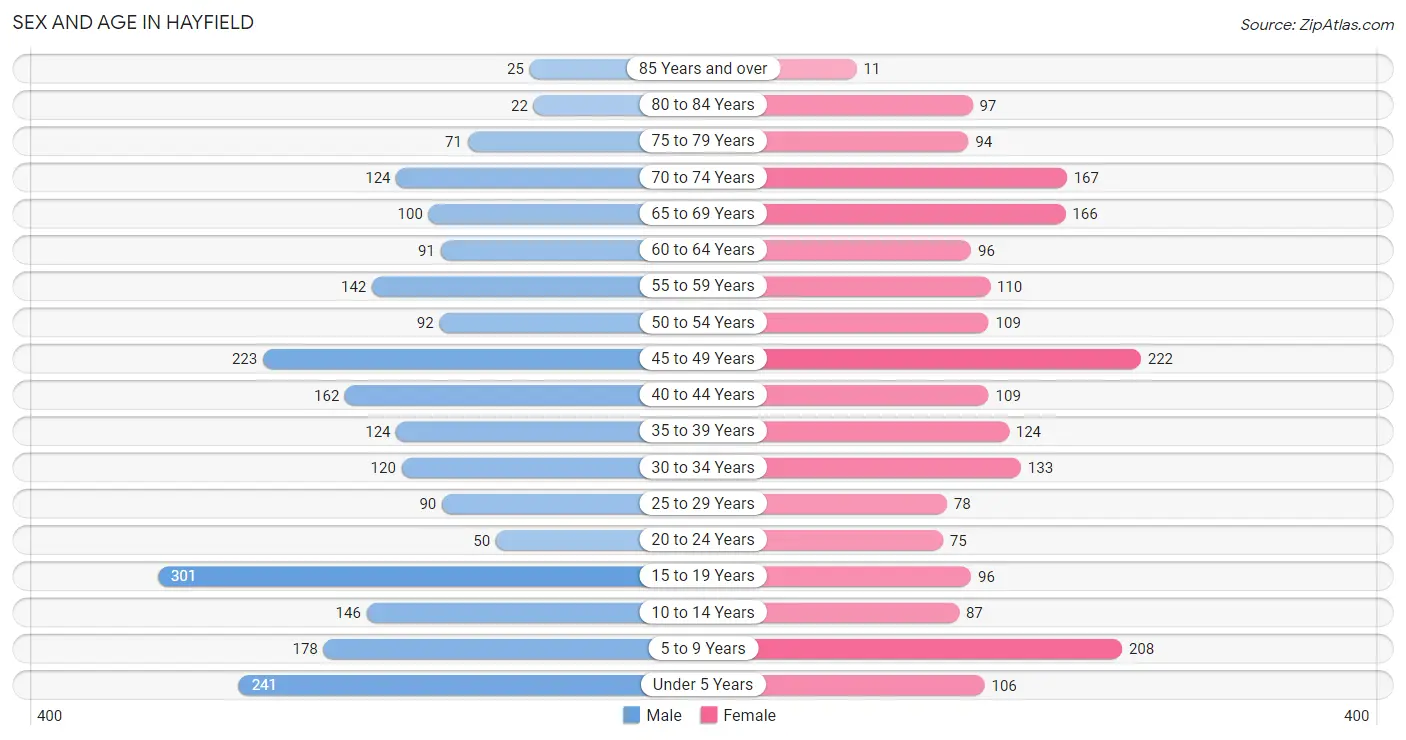
| Age Bracket | Male | Female |
| Under 5 Years | 241 (10.5%) | 106 (5.1%) |
| 5 to 9 Years | 178 (7.7%) | 208 (10.0%) |
| 10 to 14 Years | 146 (6.3%) | 87 (4.2%) |
| 15 to 19 Years | 301 (13.1%) | 96 (4.6%) |
| 20 to 24 Years | 50 (2.2%) | 75 (3.6%) |
| 25 to 29 Years | 90 (3.9%) | 78 (3.7%) |
| 30 to 34 Years | 120 (5.2%) | 133 (6.4%) |
| 35 to 39 Years | 124 (5.4%) | 124 (5.9%) |
| 40 to 44 Years | 162 (7.0%) | 109 (5.2%) |
| 45 to 49 Years | 223 (9.7%) | 222 (10.6%) |
| 50 to 54 Years | 92 (4.0%) | 109 (5.2%) |
| 55 to 59 Years | 142 (6.2%) | 110 (5.3%) |
| 60 to 64 Years | 91 (4.0%) | 96 (4.6%) |
| 65 to 69 Years | 100 (4.3%) | 166 (8.0%) |
| 70 to 74 Years | 124 (5.4%) | 167 (8.0%) |
| 75 to 79 Years | 71 (3.1%) | 94 (4.5%) |
| 80 to 84 Years | 22 (1.0%) | 97 (4.6%) |
| 85 Years and over | 25 (1.1%) | 11 (0.5%) |
| Total | 2,302 (100.0%) | 2,088 (100.0%) |
Families and Households in Hayfield
Median Family Size in Hayfield
The median family size in Hayfield is 3.31 persons per family, with married-couple families (979 | 81.6%) accounting for the largest median family size of 3.41 persons per family. On the other hand, single female/mother families (116 | 9.7%) represent the smallest median family size with 2.75 persons per family.
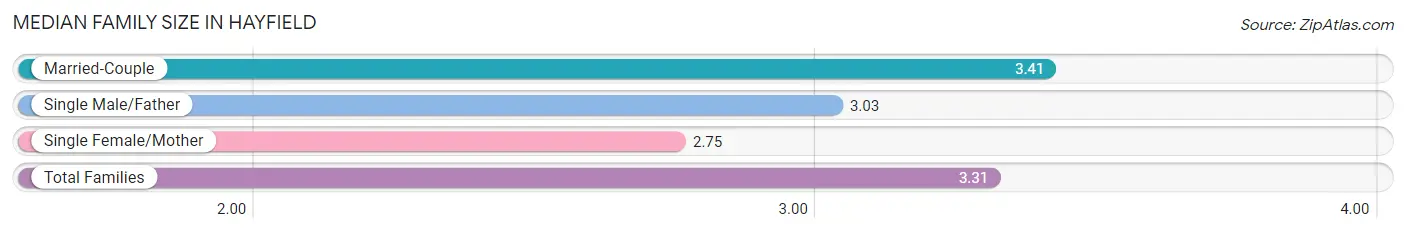
| Family Type | # Families | Family Size |
| Married-Couple | 979 (81.6%) | 3.41 |
| Single Male/Father | 105 (8.7%) | 3.03 |
| Single Female/Mother | 116 (9.7%) | 2.75 |
| Total Families | 1,200 (100.0%) | 3.31 |
Median Household Size in Hayfield
The median household size in Hayfield is 2.97 persons per household, with married-couple households (979 | 66.8%) accounting for the largest median household size of 3.43 persons per household. non-family households (266 | 18.1%) represent the smallest median household size with 1.30 persons per household.
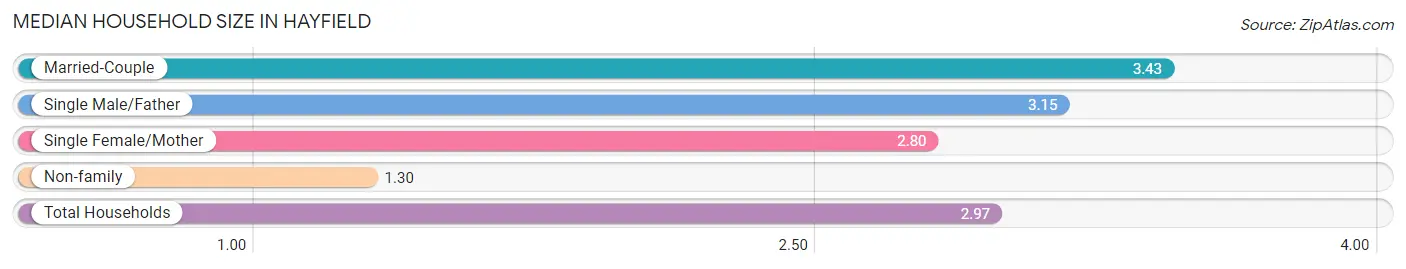
| Household Type | # Households | Household Size |
| Married-Couple | 979 (66.8%) | 3.43 |
| Single Male/Father | 105 (7.2%) | 3.15 |
| Single Female/Mother | 116 (7.9%) | 2.80 |
| Non-family | 266 (18.1%) | 1.30 |
| Total Households | 1,466 (100.0%) | 2.97 |
Household Size by Marriage Status in Hayfield
Out of a total of 1,466 households in Hayfield, 1,200 (81.9%) are family households, while 266 (18.1%) are nonfamily households. The most numerous type of family households are 2-person households, comprising 450, and the most common type of nonfamily households are 1-person households, comprising 207.
| Household Size | Family Households | Nonfamily Households |
| 1-Person Households | - | 207 (14.1%) |
| 2-Person Households | 450 (30.7%) | 52 (3.5%) |
| 3-Person Households | 437 (29.8%) | 7 (0.5%) |
| 4-Person Households | 171 (11.7%) | 0 (0.0%) |
| 5-Person Households | 81 (5.5%) | 0 (0.0%) |
| 6-Person Households | 49 (3.3%) | 0 (0.0%) |
| 7+ Person Households | 12 (0.8%) | 0 (0.0%) |
| Total | 1,200 (81.9%) | 266 (18.1%) |
Female Fertility in Hayfield
Fertility by Age in Hayfield
Average fertility rate in Hayfield is 81.0 births per 1,000 women. Women in the age bracket of 20 to 34 years have the highest fertility rate with 143.0 births per 1,000 women. Women in the age bracket of 20 to 34 years acount for 59.4% of all women with births.
| Age Bracket | Women with Births | Births / 1,000 Women |
| 15 to 19 years | 0 (0.0%) | 0.0 |
| 20 to 34 years | 41 (59.4%) | 143.0 |
| 35 to 50 years | 28 (40.6%) | 59.0 |
| Total | 69 (100.0%) | 81.0 |
Fertility by Age by Marriage Status in Hayfield
| Age Bracket | Married | Unmarried |
| 15 to 19 years | 0 (0.0%) | 0 (0.0%) |
| 20 to 34 years | 41 (100.0%) | 0 (0.0%) |
| 35 to 50 years | 28 (100.0%) | 0 (0.0%) |
| Total | 69 (100.0%) | 0 (0.0%) |
Fertility by Education in Hayfield
| Educational Attainment | Women with Births | Births / 1,000 Women |
| Less than High School | 0 (0.0%) | 0.0 |
| High School Diploma | 0 (0.0%) | 0.0 |
| College or Associate's Degree | 15 (21.7%) | 109.0 |
| Bachelor's Degree | 32 (46.4%) | 93.0 |
| Graduate Degree | 22 (31.9%) | 107.0 |
| Total | 69 (100.0%) | 81.0 |
Fertility by Education by Marriage Status in Hayfield
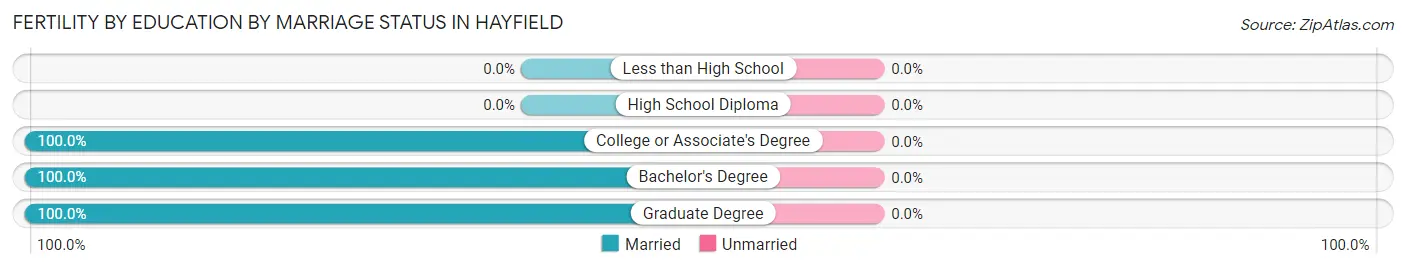
| Educational Attainment | Married | Unmarried |
| Less than High School | 0 (0.0%) | 0 (0.0%) |
| High School Diploma | 0 (0.0%) | 0 (0.0%) |
| College or Associate's Degree | 15 (100.0%) | 0 (0.0%) |
| Bachelor's Degree | 32 (100.0%) | 0 (0.0%) |
| Graduate Degree | 22 (100.0%) | 0 (0.0%) |
| Total | 69 (100.0%) | 0 (0.0%) |
Employment Characteristics in Hayfield
Employment by Class of Employer in Hayfield
Among the 2,051 employed individuals in Hayfield, private company employees (1,016 | 49.5%), federal government employees (353 | 17.2%), and self-employed (not incorporated) (248 | 12.1%) make up the most common classes of employment.
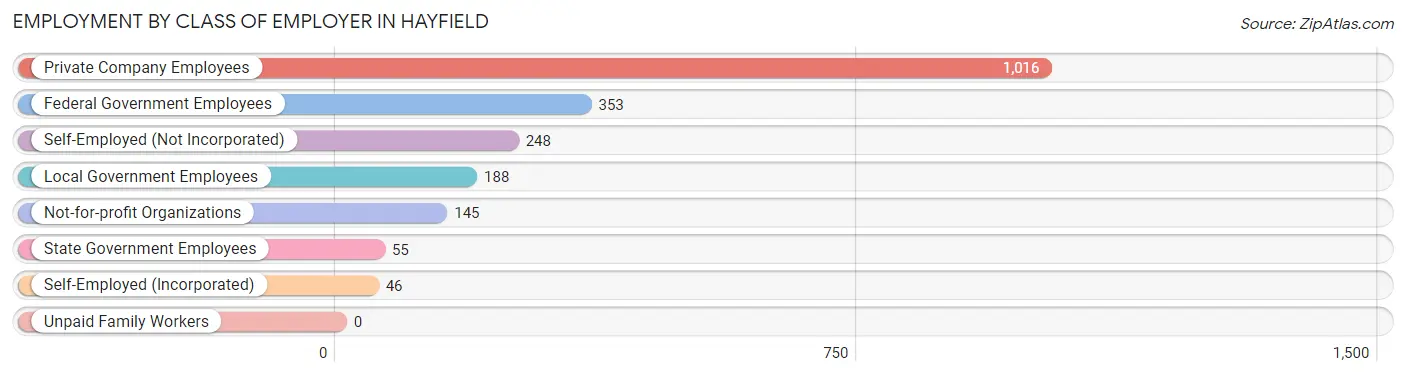
| Employer Class | # Employees | % Employees |
| Private Company Employees | 1,016 | 49.5% |
| Self-Employed (Incorporated) | 46 | 2.2% |
| Self-Employed (Not Incorporated) | 248 | 12.1% |
| Not-for-profit Organizations | 145 | 7.1% |
| Local Government Employees | 188 | 9.2% |
| State Government Employees | 55 | 2.7% |
| Federal Government Employees | 353 | 17.2% |
| Unpaid Family Workers | 0 | 0.0% |
| Total | 2,051 | 100.0% |
Employment Status by Age in Hayfield
According to the labor force statistics for Hayfield, out of the total population over 16 years of age (3,377), 63.4% or 2,141 individuals are in the labor force, with 3.6% or 77 of them unemployed. The age group with the highest labor force participation rate is 25 to 29 years, with 100.0% or 168 individuals in the labor force. Within the labor force, the 20 to 24 years age range has the highest percentage of unemployed individuals, with 51.7% or 55 of them being unemployed.
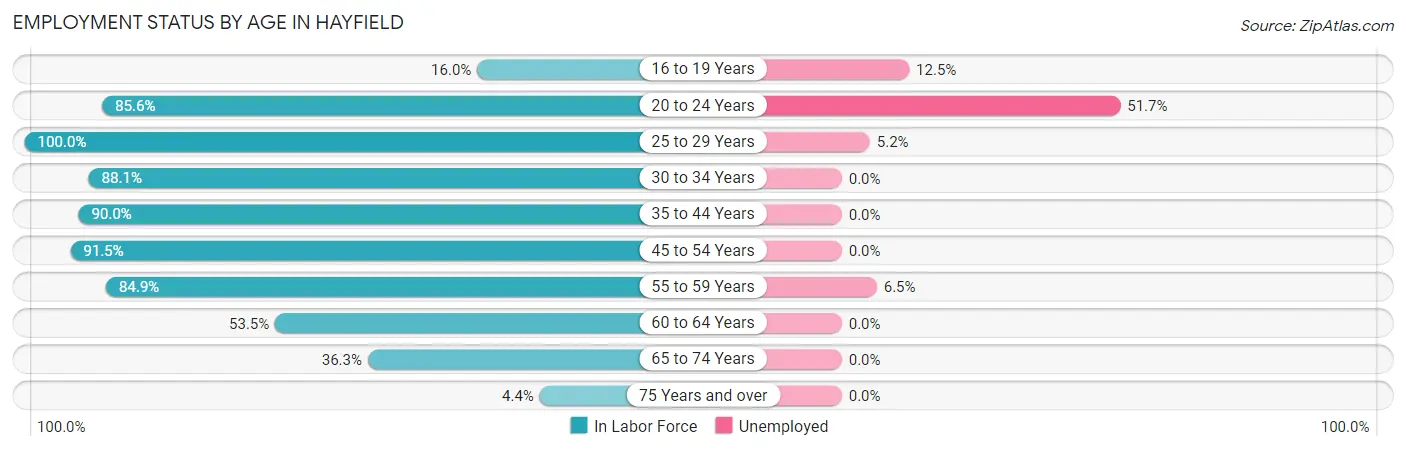
| Age Bracket | In Labor Force | Unemployed |
| 16 to 19 Years | 56 (16.0%) | 7 (12.5%) |
| 20 to 24 Years | 107 (85.6%) | 55 (51.7%) |
| 25 to 29 Years | 168 (100.0%) | 9 (5.2%) |
| 30 to 34 Years | 223 (88.1%) | 0 (0.0%) |
| 35 to 44 Years | 467 (90.0%) | 0 (0.0%) |
| 45 to 54 Years | 591 (91.5%) | 0 (0.0%) |
| 55 to 59 Years | 214 (84.9%) | 14 (6.5%) |
| 60 to 64 Years | 100 (53.5%) | 0 (0.0%) |
| 65 to 74 Years | 202 (36.3%) | 0 (0.0%) |
| 75 Years and over | 14 (4.4%) | 0 (0.0%) |
| Total | 2,141 (63.4%) | 77 (3.6%) |
Employment Status by Educational Attainment in Hayfield
According to labor force statistics for Hayfield, 87.1% of individuals (1,764) out of the total population between 25 and 64 years of age (2,025) are in the labor force, with 1.3% or 23 of them being unemployed. The group with the highest labor force participation rate are those with the educational attainment of college / associate degree, with 92.0% or 277 individuals in the labor force. Within the labor force, individuals with high school diploma education have the highest percentage of unemployment, with 7.1% or 13 of them being unemployed.
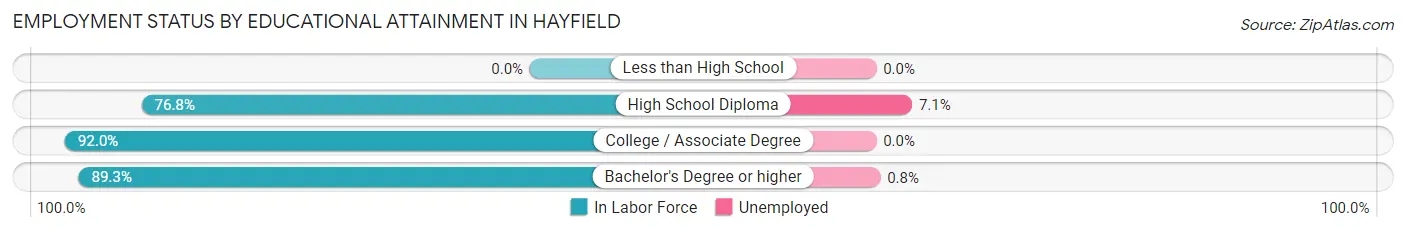
| Educational Attainment | In Labor Force | Unemployed |
| Less than High School | 0 (0.0%) | 0 (0.0%) |
| High School Diploma | 179 (76.8%) | 17 (7.1%) |
| College / Associate Degree | 277 (92.0%) | 0 (0.0%) |
| Bachelor's Degree or higher | 1,306 (89.3%) | 12 (0.8%) |
| Total | 1,764 (87.1%) | 26 (1.3%) |
Employment Occupations by Sex in Hayfield
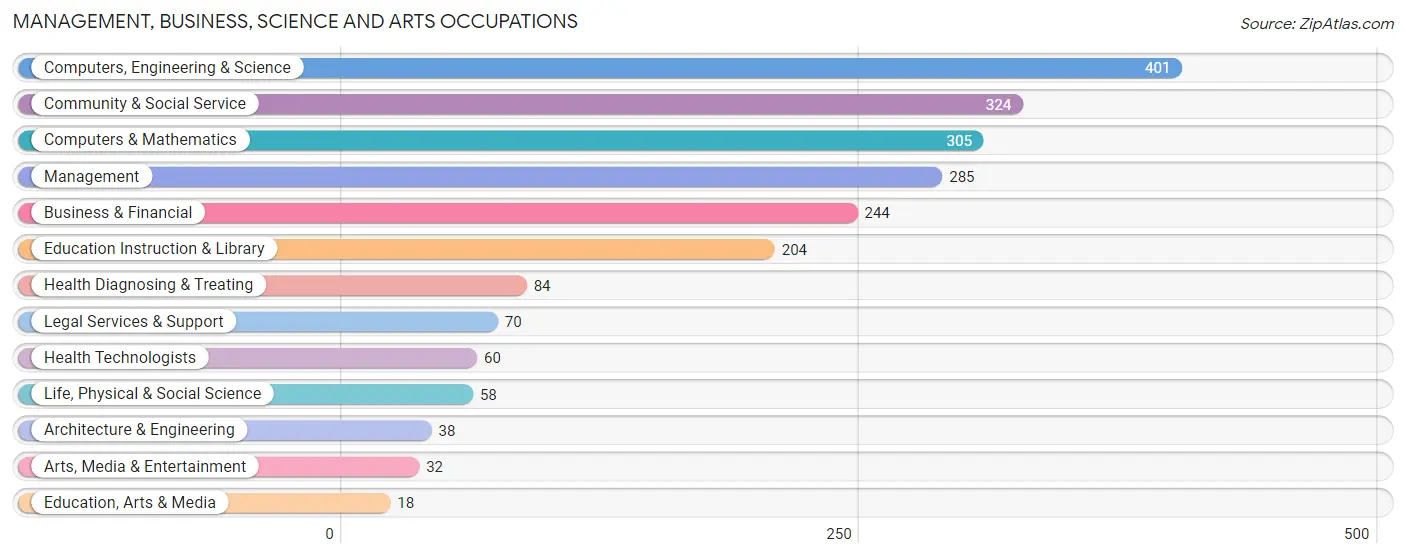
Management, Business, Science and Arts Occupations
The most common Management, Business, Science and Arts occupations in Hayfield are Computers, Engineering & Science (401 | 20.3%), Community & Social Service (324 | 16.4%), Computers & Mathematics (305 | 15.4%), Management (285 | 14.4%), and Business & Financial (244 | 12.3%).
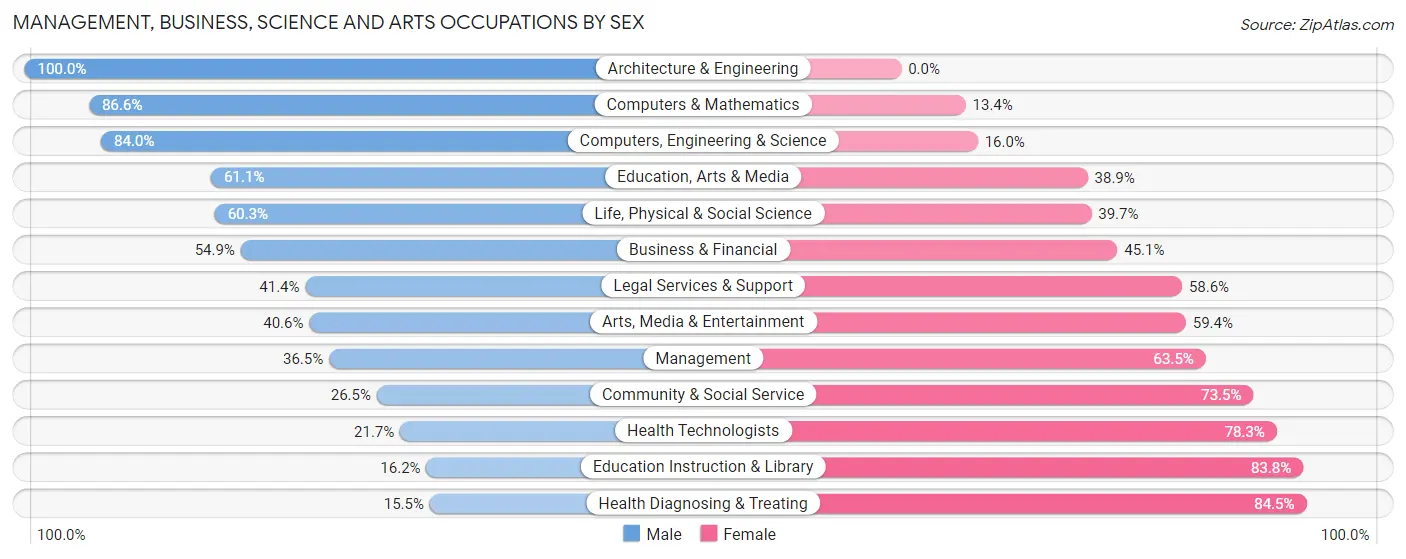
Management, Business, Science and Arts Occupations by Sex
Within the Management, Business, Science and Arts occupations in Hayfield, the most male-oriented occupations are Architecture & Engineering (100.0%), Computers & Mathematics (86.6%), and Computers, Engineering & Science (84.0%), while the most female-oriented occupations are Health Diagnosing & Treating (84.5%), Education Instruction & Library (83.8%), and Health Technologists (78.3%).
| Occupation | Male | Female |
| Management | 104 (36.5%) | 181 (63.5%) |
| Business & Financial | 134 (54.9%) | 110 (45.1%) |
| Computers, Engineering & Science | 337 (84.0%) | 64 (16.0%) |
| Computers & Mathematics | 264 (86.6%) | 41 (13.4%) |
| Architecture & Engineering | 38 (100.0%) | 0 (0.0%) |
| Life, Physical & Social Science | 35 (60.3%) | 23 (39.7%) |
| Community & Social Service | 86 (26.5%) | 238 (73.5%) |
| Education, Arts & Media | 11 (61.1%) | 7 (38.9%) |
| Legal Services & Support | 29 (41.4%) | 41 (58.6%) |
| Education Instruction & Library | 33 (16.2%) | 171 (83.8%) |
| Arts, Media & Entertainment | 13 (40.6%) | 19 (59.4%) |
| Health Diagnosing & Treating | 13 (15.5%) | 71 (84.5%) |
| Health Technologists | 13 (21.7%) | 47 (78.3%) |
| Total (Category) | 674 (50.4%) | 664 (49.6%) |
| Total (Overall) | 1,024 (51.7%) | 955 (48.3%) |
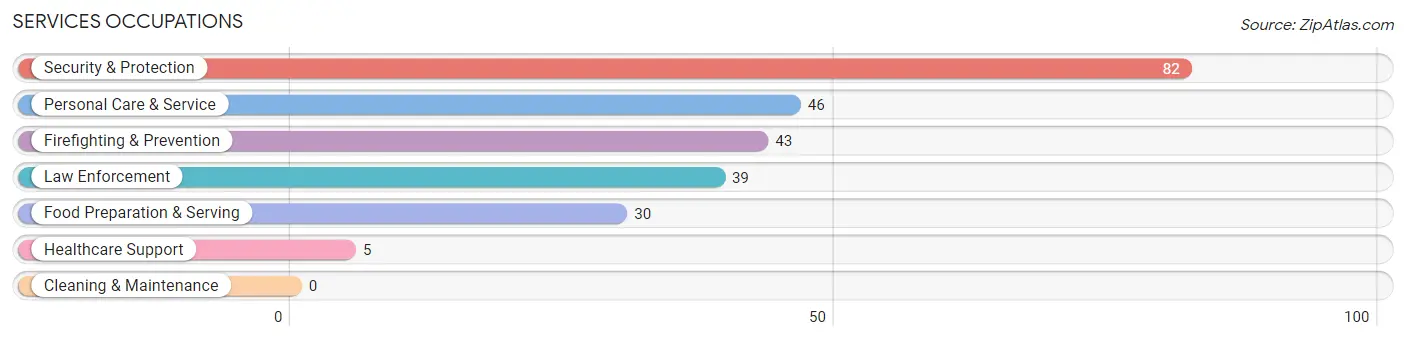
Services Occupations
The most common Services occupations in Hayfield are Security & Protection (82 | 4.1%), Personal Care & Service (46 | 2.3%), Firefighting & Prevention (43 | 2.2%), Law Enforcement (39 | 2.0%), and Food Preparation & Serving (30 | 1.5%).
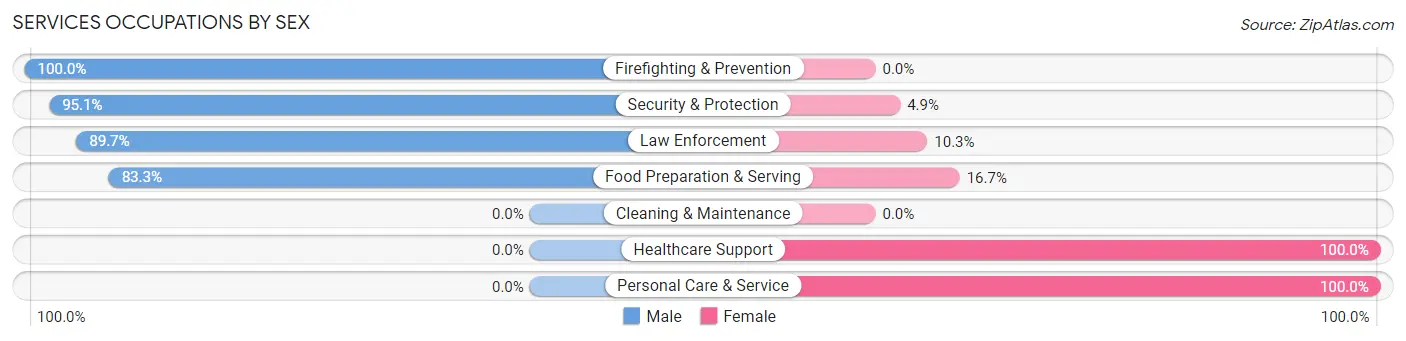
Services Occupations by Sex
Within the Services occupations in Hayfield, the most male-oriented occupations are Firefighting & Prevention (100.0%), Security & Protection (95.1%), and Law Enforcement (89.7%), while the most female-oriented occupations are Healthcare Support (100.0%), Personal Care & Service (100.0%), and Food Preparation & Serving (16.7%).
| Occupation | Male | Female |
| Healthcare Support | 0 (0.0%) | 5 (100.0%) |
| Security & Protection | 78 (95.1%) | 4 (4.9%) |
| Firefighting & Prevention | 43 (100.0%) | 0 (0.0%) |
| Law Enforcement | 35 (89.7%) | 4 (10.3%) |
| Food Preparation & Serving | 25 (83.3%) | 5 (16.7%) |
| Cleaning & Maintenance | 0 (0.0%) | 0 (0.0%) |
| Personal Care & Service | 0 (0.0%) | 46 (100.0%) |
| Total (Category) | 103 (63.2%) | 60 (36.8%) |
| Total (Overall) | 1,024 (51.7%) | 955 (48.3%) |
Sales and Office Occupations
The most common Sales and Office occupations in Hayfield are Office & Administration (190 | 9.6%), and Sales & Related (156 | 7.9%).
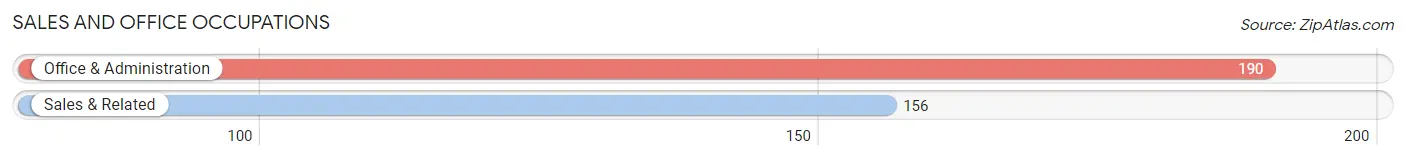
Sales and Office Occupations by Sex
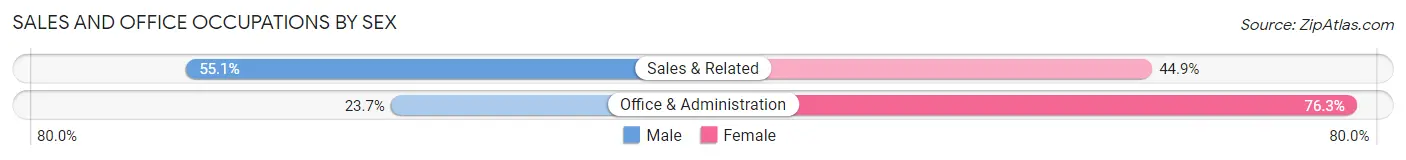
| Occupation | Male | Female |
| Sales & Related | 86 (55.1%) | 70 (44.9%) |
| Office & Administration | 45 (23.7%) | 145 (76.3%) |
| Total (Category) | 131 (37.9%) | 215 (62.1%) |
| Total (Overall) | 1,024 (51.7%) | 955 (48.3%) |
Natural Resources, Construction and Maintenance Occupations
The most common Natural Resources, Construction and Maintenance occupations in Hayfield are Construction & Extraction (31 | 1.6%), and Installation, Maintenance & Repair (5 | 0.3%).
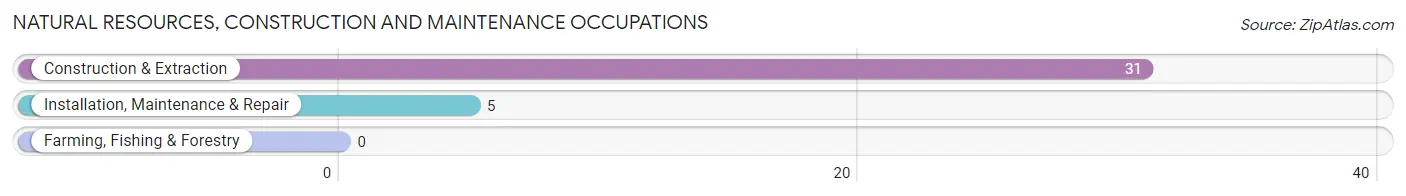
Natural Resources, Construction and Maintenance Occupations by Sex
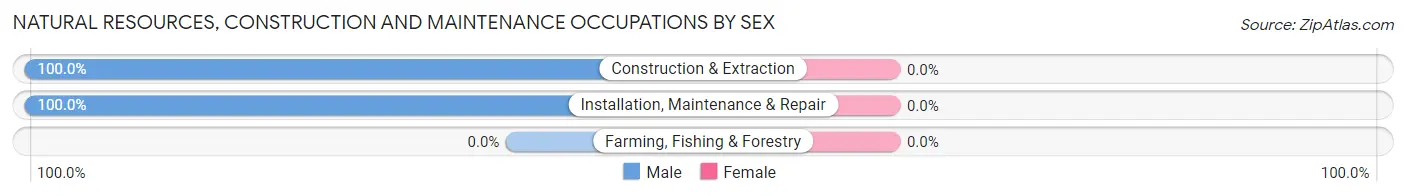
| Occupation | Male | Female |
| Farming, Fishing & Forestry | 0 (0.0%) | 0 (0.0%) |
| Construction & Extraction | 31 (100.0%) | 0 (0.0%) |
| Installation, Maintenance & Repair | 5 (100.0%) | 0 (0.0%) |
| Total (Category) | 36 (100.0%) | 0 (0.0%) |
| Total (Overall) | 1,024 (51.7%) | 955 (48.3%) |
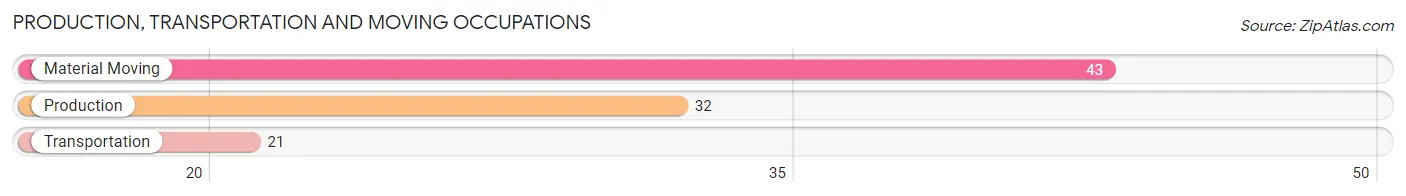
Production, Transportation and Moving Occupations
The most common Production, Transportation and Moving occupations in Hayfield are Material Moving (43 | 2.2%), Production (32 | 1.6%), and Transportation (21 | 1.1%).
Production, Transportation and Moving Occupations by Sex
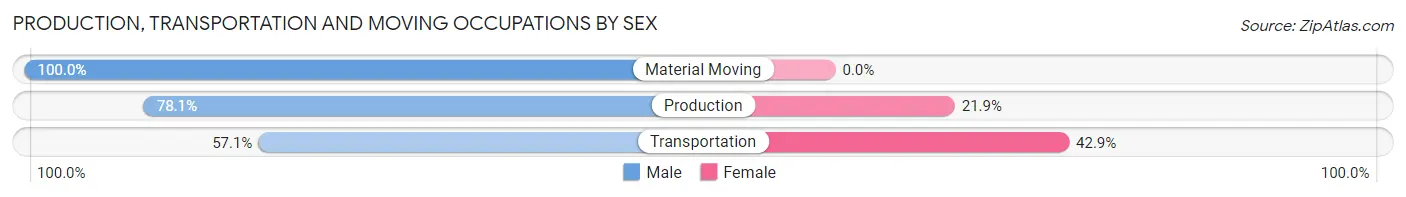
| Occupation | Male | Female |
| Production | 25 (78.1%) | 7 (21.9%) |
| Transportation | 12 (57.1%) | 9 (42.9%) |
| Material Moving | 43 (100.0%) | 0 (0.0%) |
| Total (Category) | 80 (83.3%) | 16 (16.7%) |
| Total (Overall) | 1,024 (51.7%) | 955 (48.3%) |
Employment Industries by Sex in Hayfield
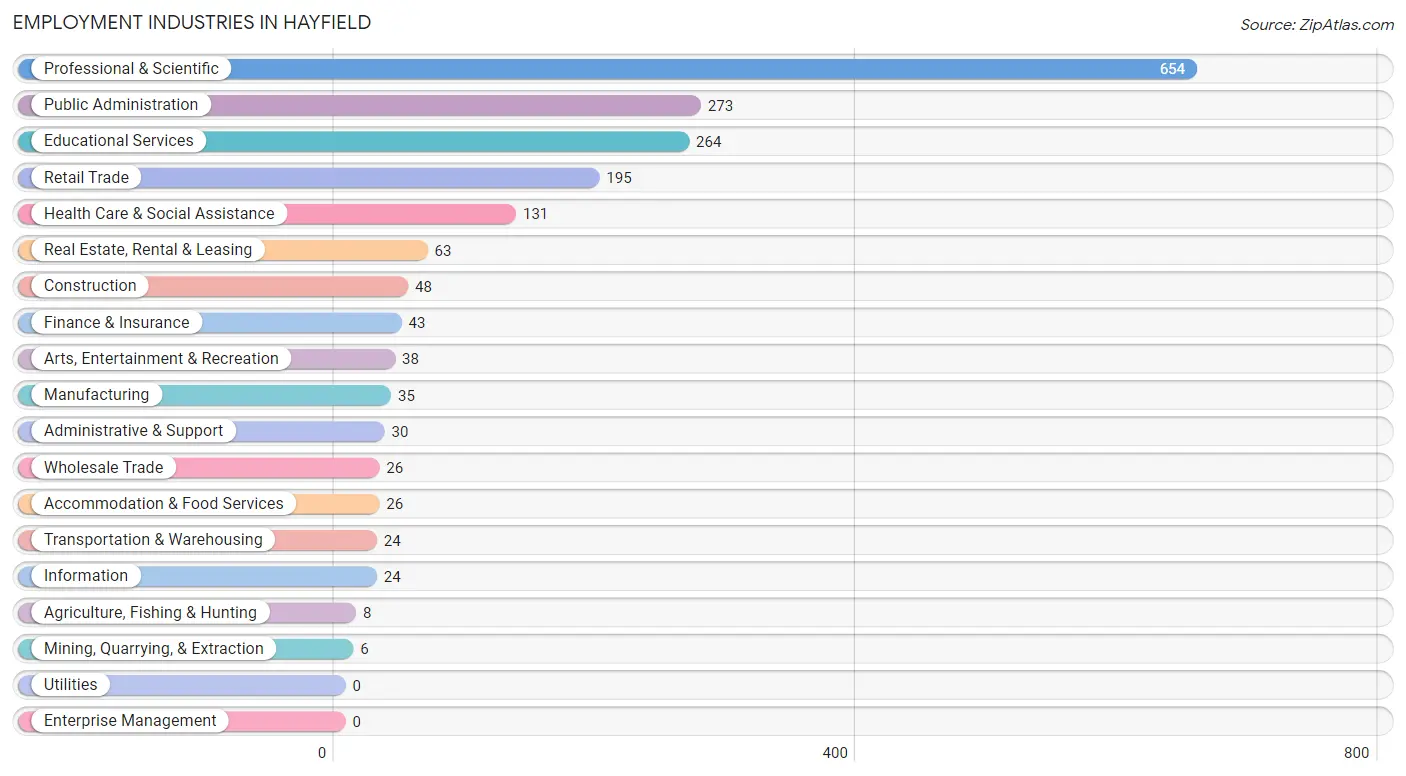
Employment Industries in Hayfield
The major employment industries in Hayfield include Professional & Scientific (654 | 33.1%), Public Administration (273 | 13.8%), Educational Services (264 | 13.3%), Retail Trade (195 | 9.9%), and Health Care & Social Assistance (131 | 6.6%).
Employment Industries by Sex in Hayfield
The Hayfield industries that see more men than women are Administrative & Support (86.7%), Construction (83.3%), and Accommodation & Food Services (80.8%), whereas the industries that tend to have a higher number of women are Agriculture, Fishing & Hunting (100.0%), Mining, Quarrying, & Extraction (100.0%), and Transportation & Warehousing (100.0%).
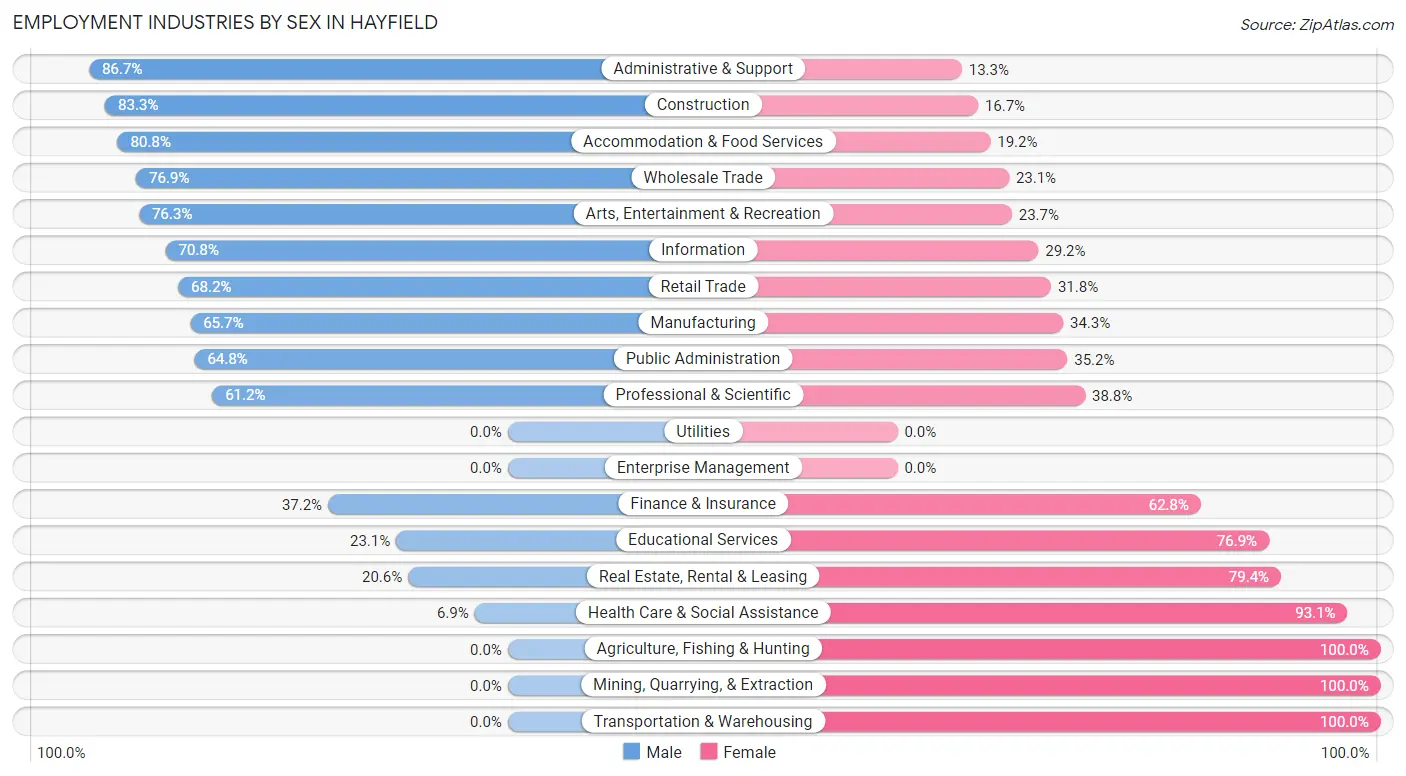
| Industry | Male | Female |
| Agriculture, Fishing & Hunting | 0 (0.0%) | 8 (100.0%) |
| Mining, Quarrying, & Extraction | 0 (0.0%) | 6 (100.0%) |
| Construction | 40 (83.3%) | 8 (16.7%) |
| Manufacturing | 23 (65.7%) | 12 (34.3%) |
| Wholesale Trade | 20 (76.9%) | 6 (23.1%) |
| Retail Trade | 133 (68.2%) | 62 (31.8%) |
| Transportation & Warehousing | 0 (0.0%) | 24 (100.0%) |
| Utilities | 0 (0.0%) | 0 (0.0%) |
| Information | 17 (70.8%) | 7 (29.2%) |
| Finance & Insurance | 16 (37.2%) | 27 (62.8%) |
| Real Estate, Rental & Leasing | 13 (20.6%) | 50 (79.4%) |
| Professional & Scientific | 400 (61.2%) | 254 (38.8%) |
| Enterprise Management | 0 (0.0%) | 0 (0.0%) |
| Administrative & Support | 26 (86.7%) | 4 (13.3%) |
| Educational Services | 61 (23.1%) | 203 (76.9%) |
| Health Care & Social Assistance | 9 (6.9%) | 122 (93.1%) |
| Arts, Entertainment & Recreation | 29 (76.3%) | 9 (23.7%) |
| Accommodation & Food Services | 21 (80.8%) | 5 (19.2%) |
| Public Administration | 177 (64.8%) | 96 (35.2%) |
| Total | 1,024 (51.7%) | 955 (48.3%) |
Education in Hayfield
School Enrollment in Hayfield
The most common levels of schooling among the 1,165 students in Hayfield are high school (353 | 30.3%), elementary school (286 | 24.5%), and middle school (244 | 20.9%).
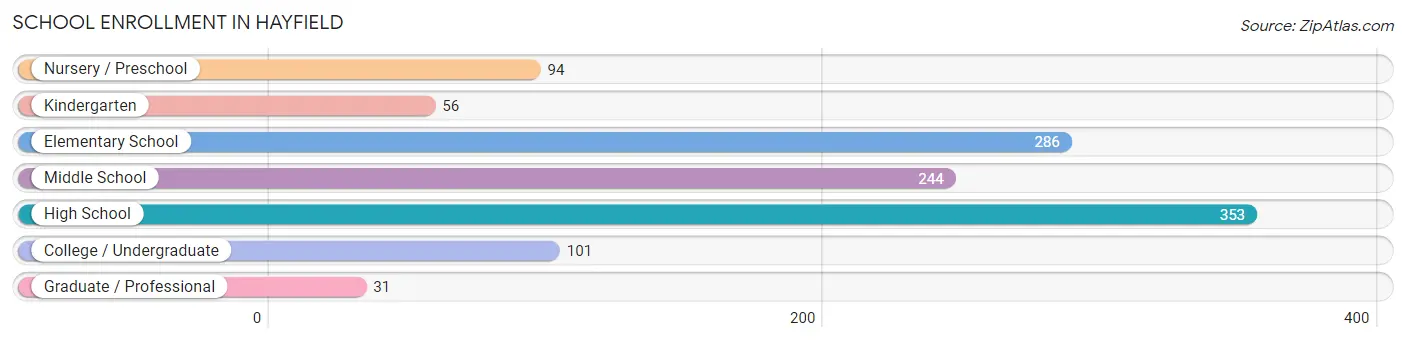
| School Level | # Students | % Students |
| Nursery / Preschool | 94 | 8.1% |
| Kindergarten | 56 | 4.8% |
| Elementary School | 286 | 24.5% |
| Middle School | 244 | 20.9% |
| High School | 353 | 30.3% |
| College / Undergraduate | 101 | 8.7% |
| Graduate / Professional | 31 | 2.7% |
| Total | 1,165 | 100.0% |
School Enrollment by Age by Funding Source in Hayfield
Out of a total of 1,165 students who are enrolled in schools in Hayfield, 203 (17.4%) attend a private institution, while the remaining 962 (82.6%) are enrolled in public schools. The age group of 3 to 4 year olds has the highest likelihood of being enrolled in private schools, with 54 (76.1% in the age bracket) enrolled. Conversely, the age group of 20 to 24 year olds has the lowest likelihood of being enrolled in a private school, with 15 (100.0% in the age bracket) attending a public institution.
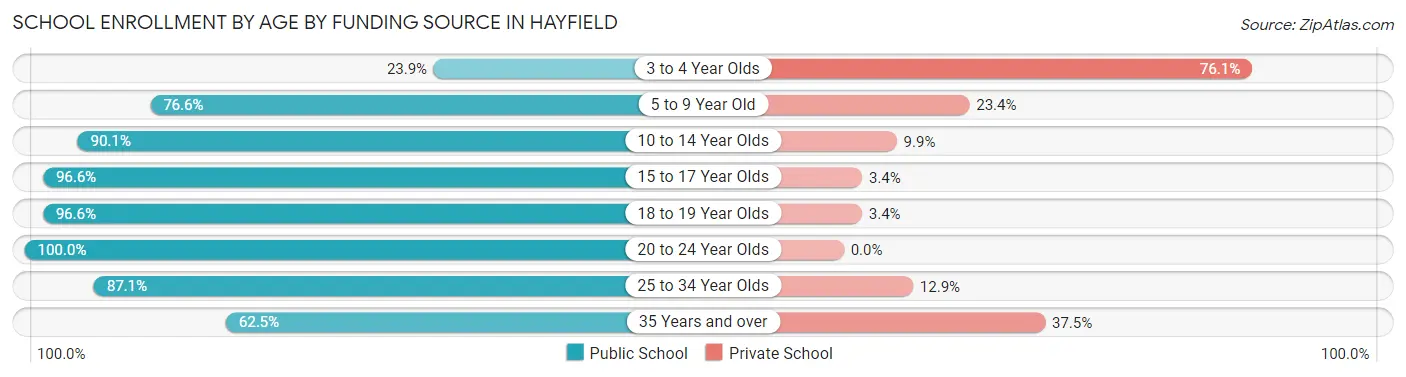
| Age Bracket | Public School | Private School |
| 3 to 4 Year Olds | 17 (23.9%) | 54 (76.1%) |
| 5 to 9 Year Old | 288 (76.6%) | 88 (23.4%) |
| 10 to 14 Year Olds | 210 (90.1%) | 23 (9.9%) |
| 15 to 17 Year Olds | 141 (96.6%) | 5 (3.4%) |
| 18 to 19 Year Olds | 229 (96.6%) | 8 (3.4%) |
| 20 to 24 Year Olds | 15 (100.0%) | 0 (0.0%) |
| 25 to 34 Year Olds | 27 (87.1%) | 4 (12.9%) |
| 35 Years and over | 35 (62.5%) | 21 (37.5%) |
| Total | 962 (82.6%) | 203 (17.4%) |
Educational Attainment by Field of Study in Hayfield
Business (438 | 19.9%), social sciences (265 | 12.1%), engineering (223 | 10.2%), computers & mathematics (207 | 9.4%), and literature & languages (146 | 6.6%) are the most common fields of study among 2,198 individuals in Hayfield who have obtained a bachelor's degree or higher.
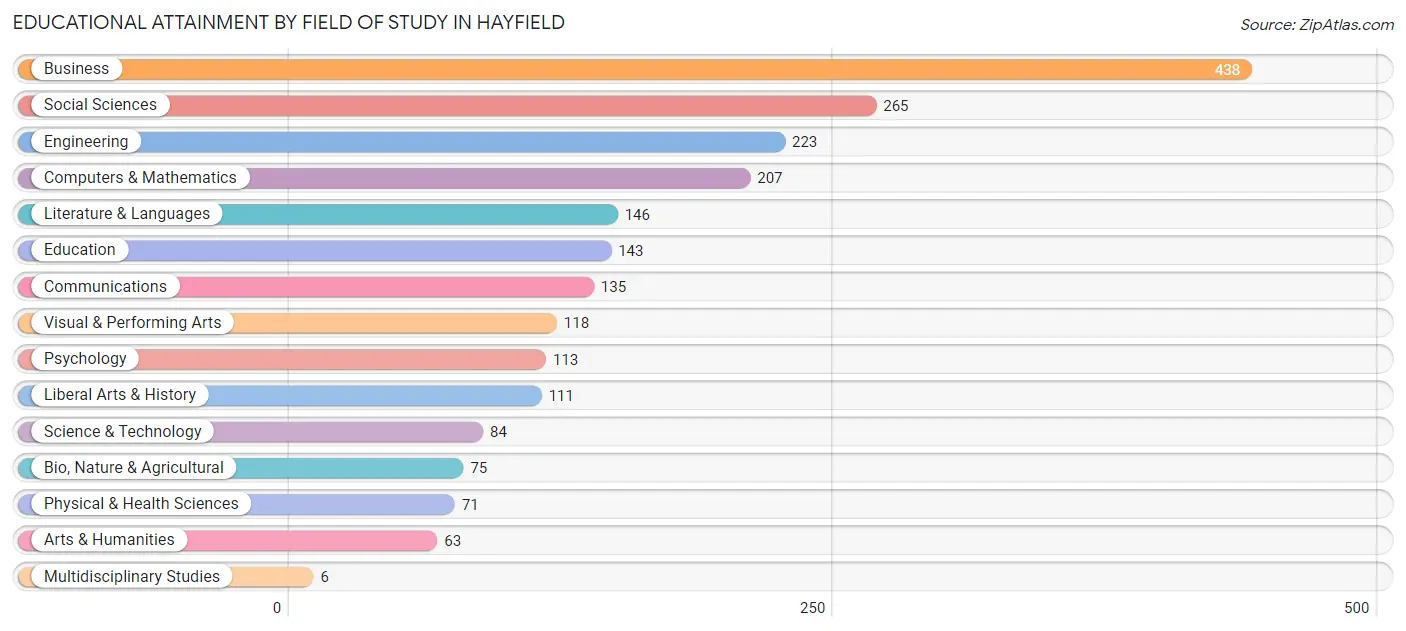
| Field of Study | # Graduates | % Graduates |
| Computers & Mathematics | 207 | 9.4% |
| Bio, Nature & Agricultural | 75 | 3.4% |
| Physical & Health Sciences | 71 | 3.2% |
| Psychology | 113 | 5.1% |
| Social Sciences | 265 | 12.1% |
| Engineering | 223 | 10.2% |
| Multidisciplinary Studies | 6 | 0.3% |
| Science & Technology | 84 | 3.8% |
| Business | 438 | 19.9% |
| Education | 143 | 6.5% |
| Literature & Languages | 146 | 6.6% |
| Liberal Arts & History | 111 | 5.1% |
| Visual & Performing Arts | 118 | 5.4% |
| Communications | 135 | 6.1% |
| Arts & Humanities | 63 | 2.9% |
| Total | 2,198 | 100.0% |
Transportation & Commute in Hayfield
Vehicle Availability by Sex in Hayfield
The most prevalent vehicle ownership categories in Hayfield are males with 2 vehicles (510, accounting for 48.3%) and females with 2 vehicles (450, making up 53.1%).
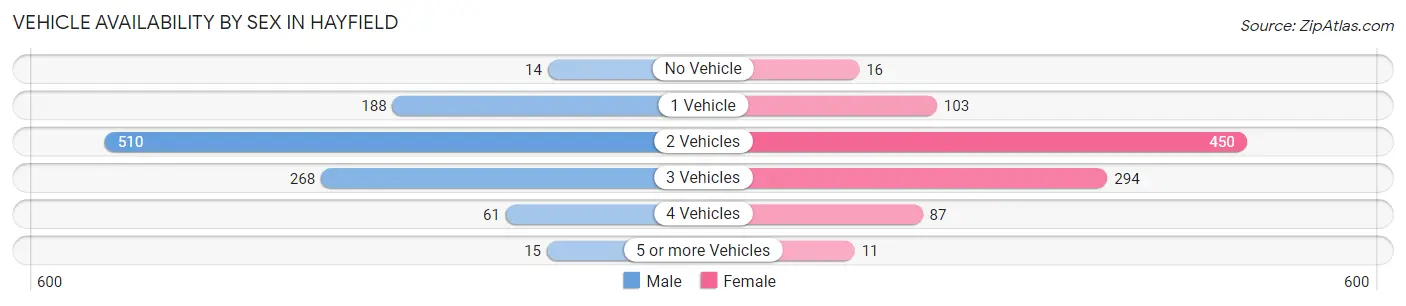
| Vehicles Available | Male | Female |
| No Vehicle | 14 (1.3%) | 16 (1.7%) |
| 1 Vehicle | 188 (17.8%) | 103 (10.7%) |
| 2 Vehicles | 510 (48.3%) | 450 (46.8%) |
| 3 Vehicles | 268 (25.4%) | 294 (30.6%) |
| 4 Vehicles | 61 (5.8%) | 87 (9.0%) |
| 5 or more Vehicles | 15 (1.4%) | 11 (1.1%) |
| Total | 1,056 (100.0%) | 961 (100.0%) |
Commute Time in Hayfield
The most frequently occuring commute durations in Hayfield are 30 to 34 minutes (215 commuters, 14.9%), 25 to 29 minutes (209 commuters, 14.5%), and 20 to 24 minutes (203 commuters, 14.1%).
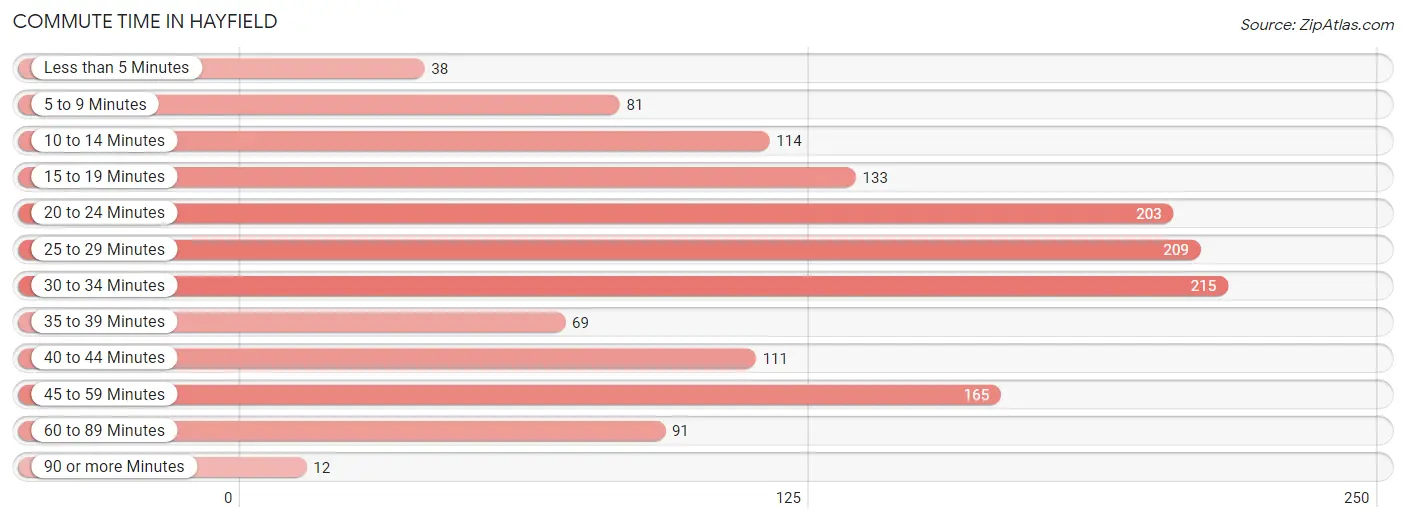
| Commute Time | # Commuters | % Commuters |
| Less than 5 Minutes | 38 | 2.6% |
| 5 to 9 Minutes | 81 | 5.6% |
| 10 to 14 Minutes | 114 | 7.9% |
| 15 to 19 Minutes | 133 | 9.2% |
| 20 to 24 Minutes | 203 | 14.1% |
| 25 to 29 Minutes | 209 | 14.5% |
| 30 to 34 Minutes | 215 | 14.9% |
| 35 to 39 Minutes | 69 | 4.8% |
| 40 to 44 Minutes | 111 | 7.7% |
| 45 to 59 Minutes | 165 | 11.5% |
| 60 to 89 Minutes | 91 | 6.3% |
| 90 or more Minutes | 12 | 0.8% |
Commute Time by Sex in Hayfield
The most common commute times in Hayfield are 25 to 29 minutes (145 commuters, 18.5%) for males and 20 to 24 minutes (110 commuters, 16.7%) for females.
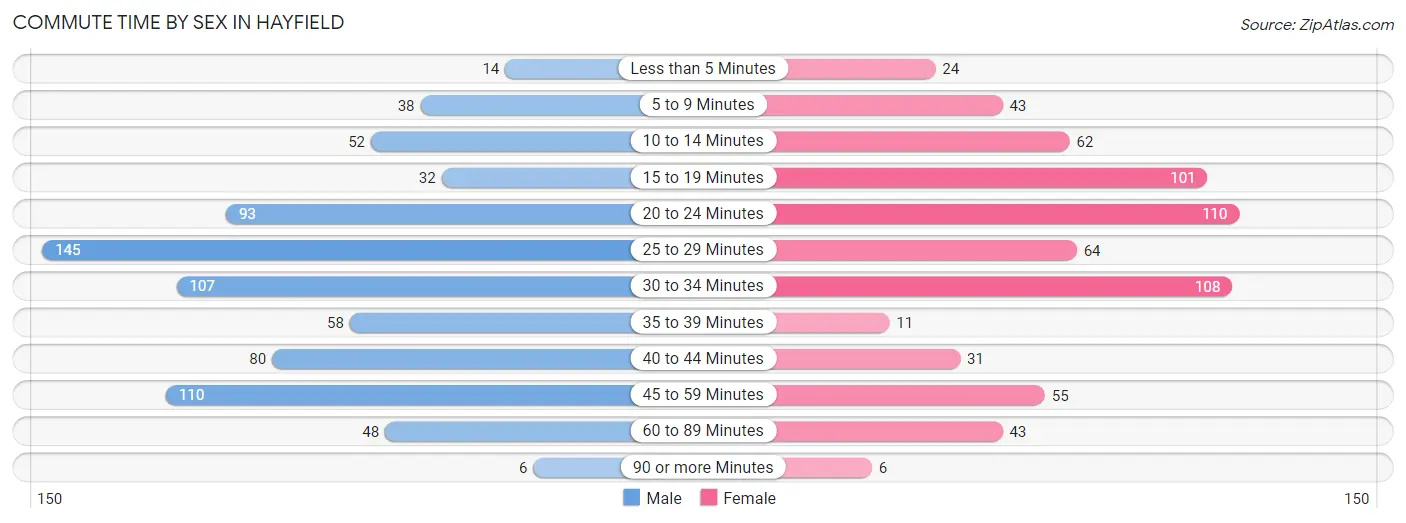
| Commute Time | Male | Female |
| Less than 5 Minutes | 14 (1.8%) | 24 (3.6%) |
| 5 to 9 Minutes | 38 (4.9%) | 43 (6.5%) |
| 10 to 14 Minutes | 52 (6.6%) | 62 (9.4%) |
| 15 to 19 Minutes | 32 (4.1%) | 101 (15.3%) |
| 20 to 24 Minutes | 93 (11.9%) | 110 (16.7%) |
| 25 to 29 Minutes | 145 (18.5%) | 64 (9.7%) |
| 30 to 34 Minutes | 107 (13.7%) | 108 (16.4%) |
| 35 to 39 Minutes | 58 (7.4%) | 11 (1.7%) |
| 40 to 44 Minutes | 80 (10.2%) | 31 (4.7%) |
| 45 to 59 Minutes | 110 (14.1%) | 55 (8.4%) |
| 60 to 89 Minutes | 48 (6.1%) | 43 (6.5%) |
| 90 or more Minutes | 6 (0.8%) | 6 (0.9%) |
Time of Departure to Work by Sex in Hayfield
The most frequent times of departure to work in Hayfield are 6:30 AM to 6:59 AM (136, 17.4%) for males and 8:00 AM to 8:29 AM (128, 19.5%) for females.
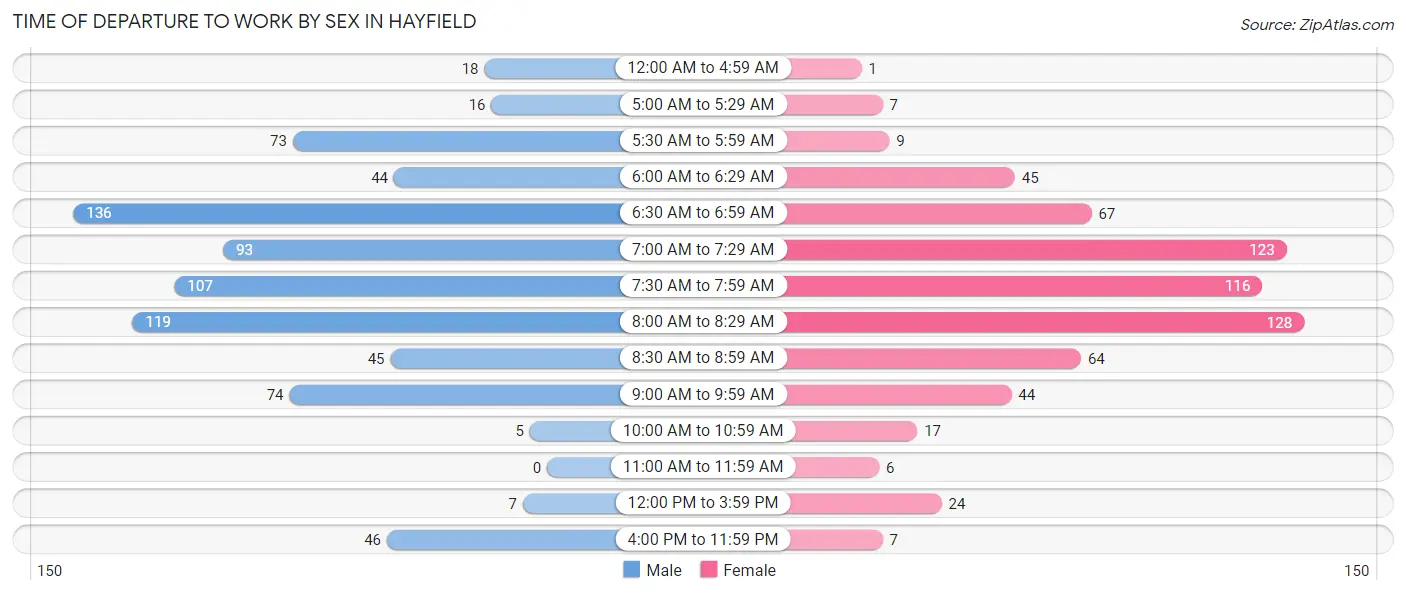
| Time of Departure | Male | Female |
| 12:00 AM to 4:59 AM | 18 (2.3%) | 1 (0.2%) |
| 5:00 AM to 5:29 AM | 16 (2.0%) | 7 (1.1%) |
| 5:30 AM to 5:59 AM | 73 (9.3%) | 9 (1.4%) |
| 6:00 AM to 6:29 AM | 44 (5.6%) | 45 (6.8%) |
| 6:30 AM to 6:59 AM | 136 (17.4%) | 67 (10.2%) |
| 7:00 AM to 7:29 AM | 93 (11.9%) | 123 (18.7%) |
| 7:30 AM to 7:59 AM | 107 (13.7%) | 116 (17.6%) |
| 8:00 AM to 8:29 AM | 119 (15.2%) | 128 (19.5%) |
| 8:30 AM to 8:59 AM | 45 (5.8%) | 64 (9.7%) |
| 9:00 AM to 9:59 AM | 74 (9.5%) | 44 (6.7%) |
| 10:00 AM to 10:59 AM | 5 (0.6%) | 17 (2.6%) |
| 11:00 AM to 11:59 AM | 0 (0.0%) | 6 (0.9%) |
| 12:00 PM to 3:59 PM | 7 (0.9%) | 24 (3.6%) |
| 4:00 PM to 11:59 PM | 46 (5.9%) | 7 (1.1%) |
| Total | 783 (100.0%) | 658 (100.0%) |
Housing Occupancy in Hayfield
Occupancy by Ownership in Hayfield
Of the total 1,466 dwellings in Hayfield, owner-occupied units account for 1,385 (94.5%), while renter-occupied units make up 81 (5.5%).
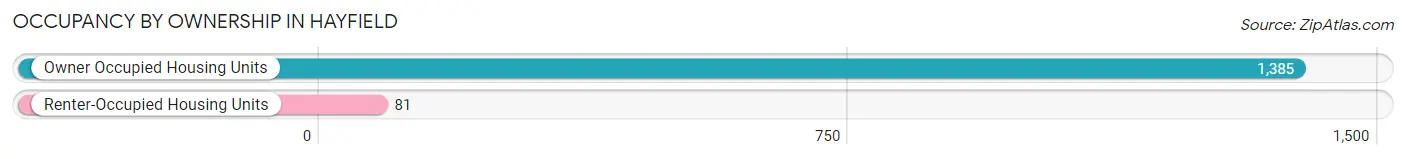
| Occupancy | # Housing Units | % Housing Units |
| Owner Occupied Housing Units | 1,385 | 94.5% |
| Renter-Occupied Housing Units | 81 | 5.5% |
| Total Occupied Housing Units | 1,466 | 100.0% |
Occupancy by Household Size in Hayfield
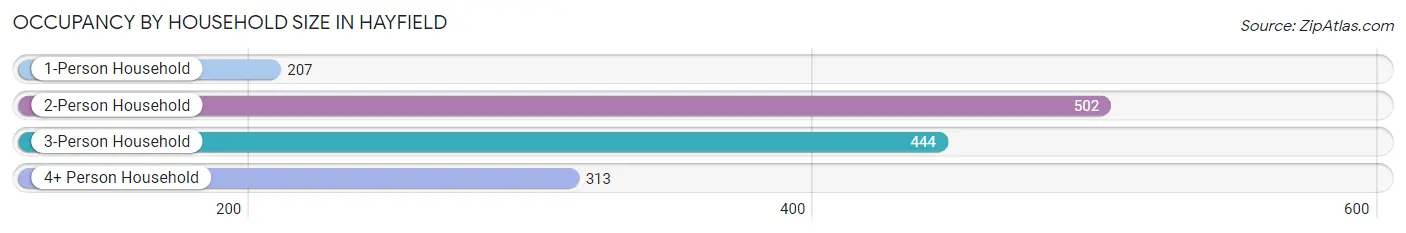
| Household Size | # Housing Units | % Housing Units |
| 1-Person Household | 207 | 14.1% |
| 2-Person Household | 502 | 34.2% |
| 3-Person Household | 444 | 30.3% |
| 4+ Person Household | 313 | 21.3% |
| Total Housing Units | 1,466 | 100.0% |
Occupancy by Ownership by Household Size in Hayfield
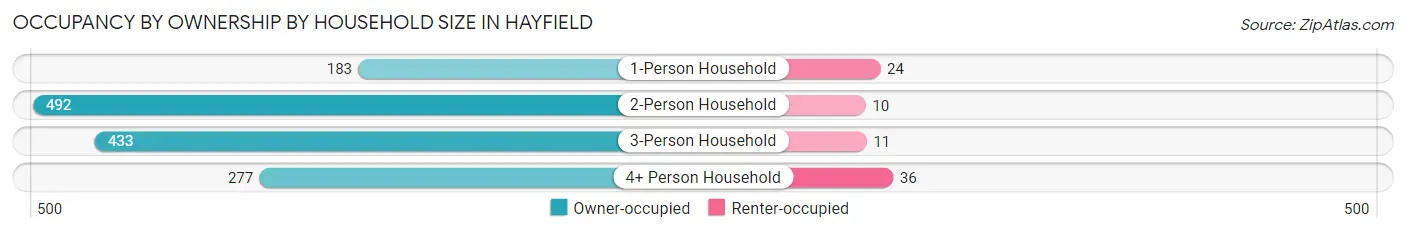
| Household Size | Owner-occupied | Renter-occupied |
| 1-Person Household | 183 (88.4%) | 24 (11.6%) |
| 2-Person Household | 492 (98.0%) | 10 (2.0%) |
| 3-Person Household | 433 (97.5%) | 11 (2.5%) |
| 4+ Person Household | 277 (88.5%) | 36 (11.5%) |
| Total Housing Units | 1,385 (94.5%) | 81 (5.5%) |
Occupancy by Educational Attainment in Hayfield
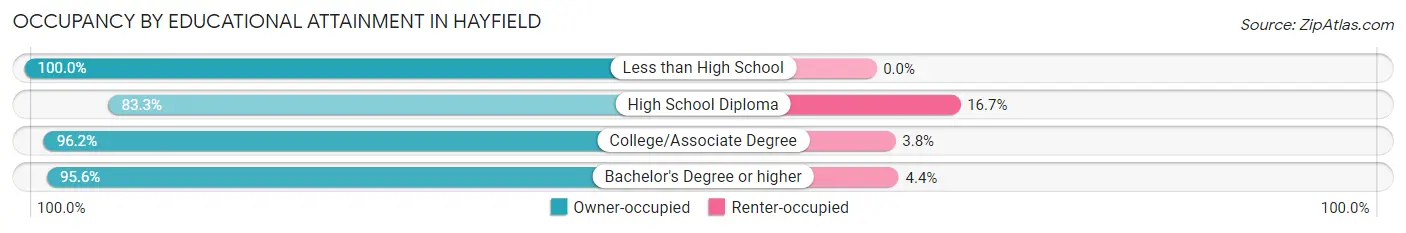
| Household Size | Owner-occupied | Renter-occupied |
| Less than High School | 4 (100.0%) | 0 (0.0%) |
| High School Diploma | 120 (83.3%) | 24 (16.7%) |
| College/Associate Degree | 227 (96.2%) | 9 (3.8%) |
| Bachelor's Degree or higher | 1,034 (95.6%) | 48 (4.4%) |
Occupancy by Age of Householder in Hayfield
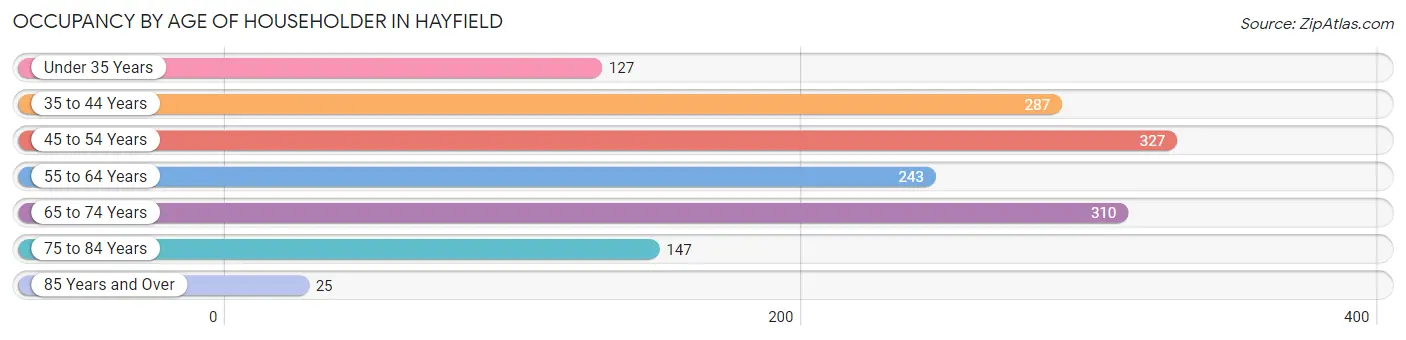
| Age Bracket | # Households | % Households |
| Under 35 Years | 127 | 8.7% |
| 35 to 44 Years | 287 | 19.6% |
| 45 to 54 Years | 327 | 22.3% |
| 55 to 64 Years | 243 | 16.6% |
| 65 to 74 Years | 310 | 21.1% |
| 75 to 84 Years | 147 | 10.0% |
| 85 Years and Over | 25 | 1.7% |
| Total | 1,466 | 100.0% |
Housing Finances in Hayfield
Median Income by Occupancy in Hayfield
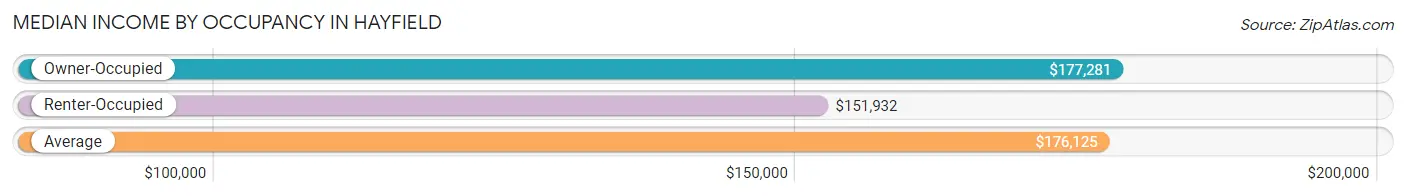
| Occupancy Type | # Households | Median Income |
| Owner-Occupied | 1,385 (94.5%) | $177,281 |
| Renter-Occupied | 81 (5.5%) | $151,932 |
| Average | 1,466 (100.0%) | $176,125 |
Occupancy by Householder Income Bracket in Hayfield
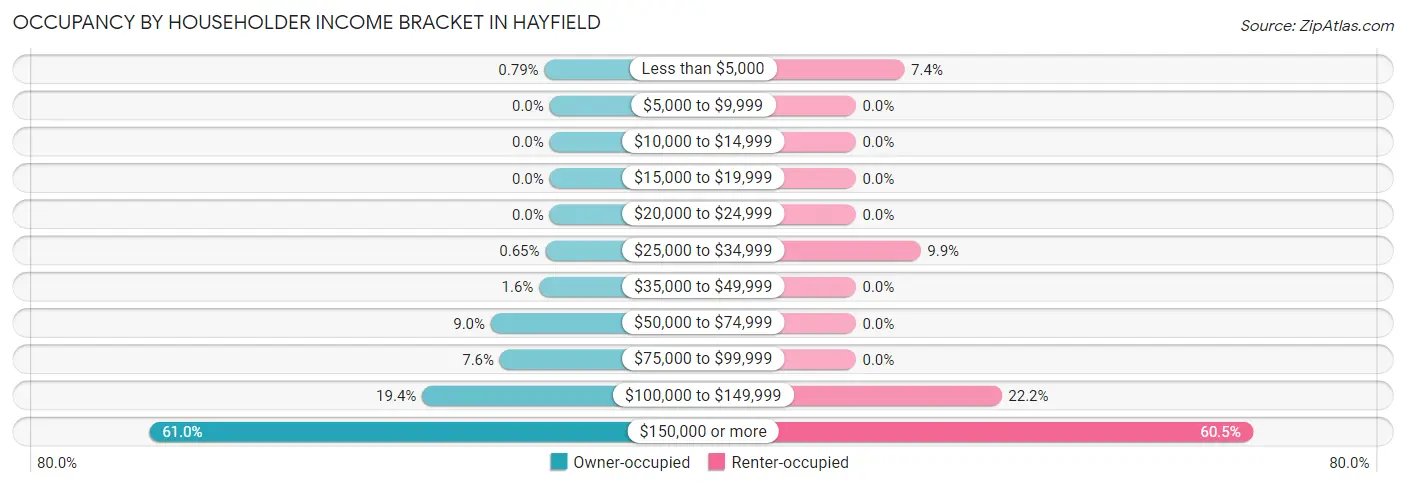
| Income Bracket | Owner-occupied | Renter-occupied |
| Less than $5,000 | 11 (0.8%) | 6 (7.4%) |
| $5,000 to $9,999 | 0 (0.0%) | 0 (0.0%) |
| $10,000 to $14,999 | 0 (0.0%) | 0 (0.0%) |
| $15,000 to $19,999 | 0 (0.0%) | 0 (0.0%) |
| $20,000 to $24,999 | 0 (0.0%) | 0 (0.0%) |
| $25,000 to $34,999 | 9 (0.6%) | 8 (9.9%) |
| $35,000 to $49,999 | 22 (1.6%) | 0 (0.0%) |
| $50,000 to $74,999 | 124 (8.9%) | 0 (0.0%) |
| $75,000 to $99,999 | 105 (7.6%) | 0 (0.0%) |
| $100,000 to $149,999 | 269 (19.4%) | 18 (22.2%) |
| $150,000 or more | 845 (61.0%) | 49 (60.5%) |
| Total | 1,385 (100.0%) | 81 (100.0%) |
Monthly Housing Cost Tiers in Hayfield
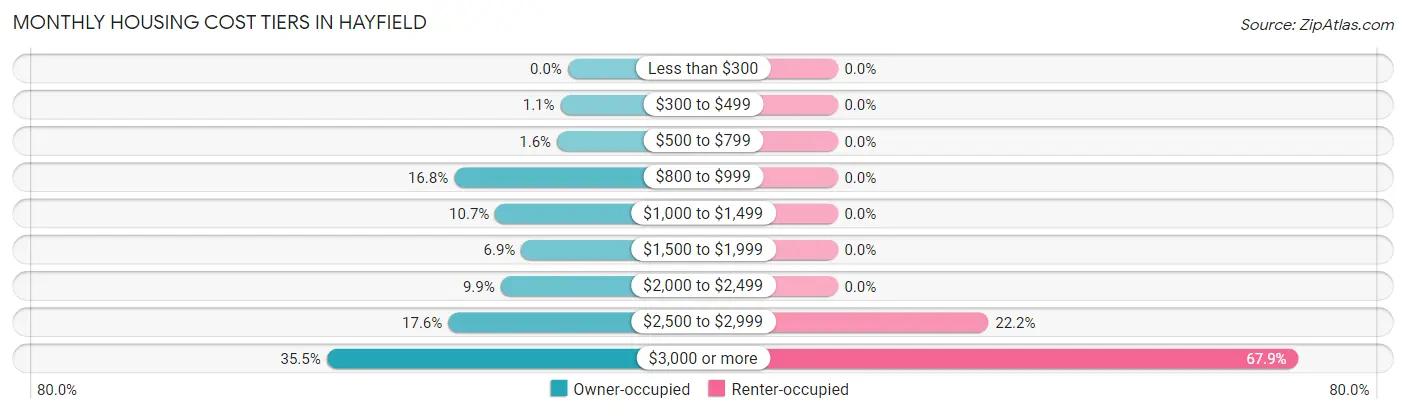
| Monthly Cost | Owner-occupied | Renter-occupied |
| Less than $300 | 0 (0.0%) | 0 (0.0%) |
| $300 to $499 | 15 (1.1%) | 0 (0.0%) |
| $500 to $799 | 22 (1.6%) | 0 (0.0%) |
| $800 to $999 | 232 (16.8%) | 0 (0.0%) |
| $1,000 to $1,499 | 148 (10.7%) | 0 (0.0%) |
| $1,500 to $1,999 | 95 (6.9%) | 0 (0.0%) |
| $2,000 to $2,499 | 137 (9.9%) | 0 (0.0%) |
| $2,500 to $2,999 | 244 (17.6%) | 18 (22.2%) |
| $3,000 or more | 492 (35.5%) | 55 (67.9%) |
| Total | 1,385 (100.0%) | 81 (100.0%) |
Physical Housing Characteristics in Hayfield
Housing Structures in Hayfield
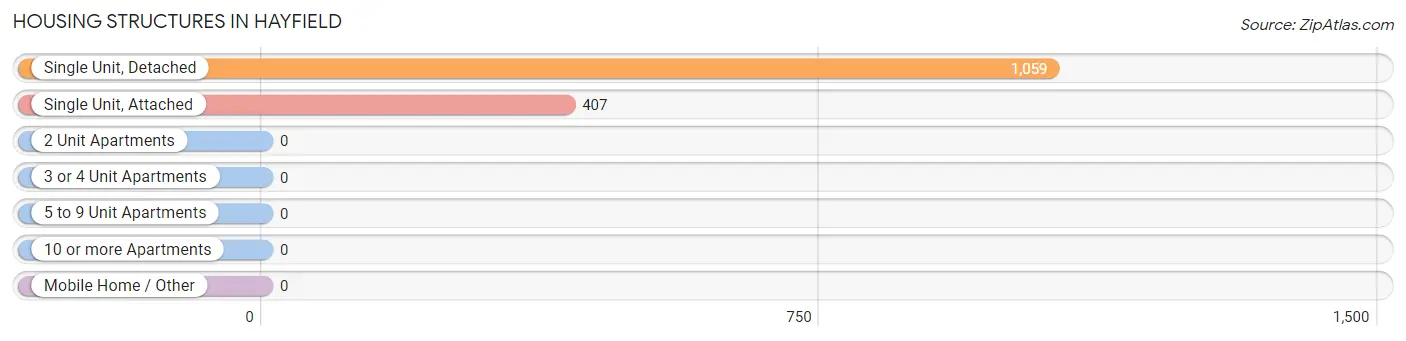
| Structure Type | # Housing Units | % Housing Units |
| Single Unit, Detached | 1,059 | 72.2% |
| Single Unit, Attached | 407 | 27.8% |
| 2 Unit Apartments | 0 | 0.0% |
| 3 or 4 Unit Apartments | 0 | 0.0% |
| 5 to 9 Unit Apartments | 0 | 0.0% |
| 10 or more Apartments | 0 | 0.0% |
| Mobile Home / Other | 0 | 0.0% |
| Total | 1,466 | 100.0% |
Housing Structures by Occupancy in Hayfield
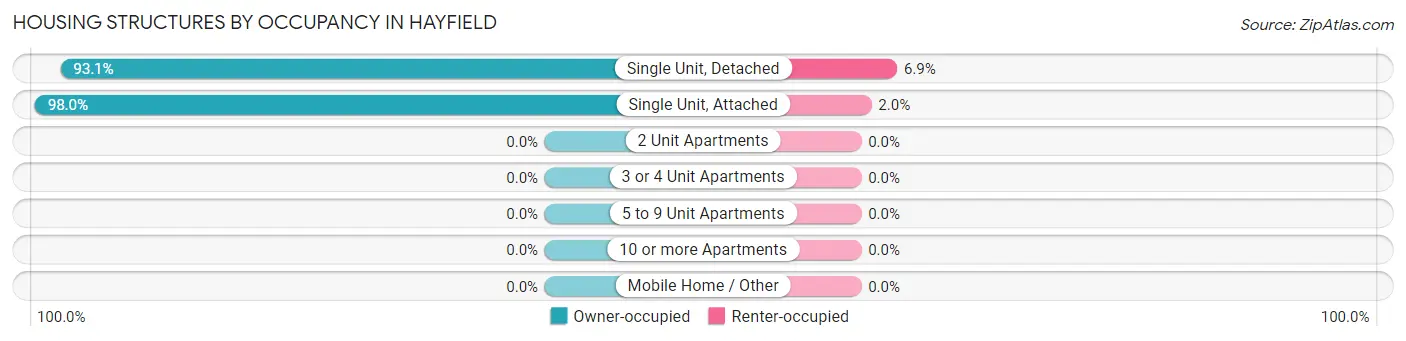
| Structure Type | Owner-occupied | Renter-occupied |
| Single Unit, Detached | 986 (93.1%) | 73 (6.9%) |
| Single Unit, Attached | 399 (98.0%) | 8 (2.0%) |
| 2 Unit Apartments | 0 (0.0%) | 0 (0.0%) |
| 3 or 4 Unit Apartments | 0 (0.0%) | 0 (0.0%) |
| 5 to 9 Unit Apartments | 0 (0.0%) | 0 (0.0%) |
| 10 or more Apartments | 0 (0.0%) | 0 (0.0%) |
| Mobile Home / Other | 0 (0.0%) | 0 (0.0%) |
| Total | 1,385 (94.5%) | 81 (5.5%) |
Housing Structures by Number of Rooms in Hayfield
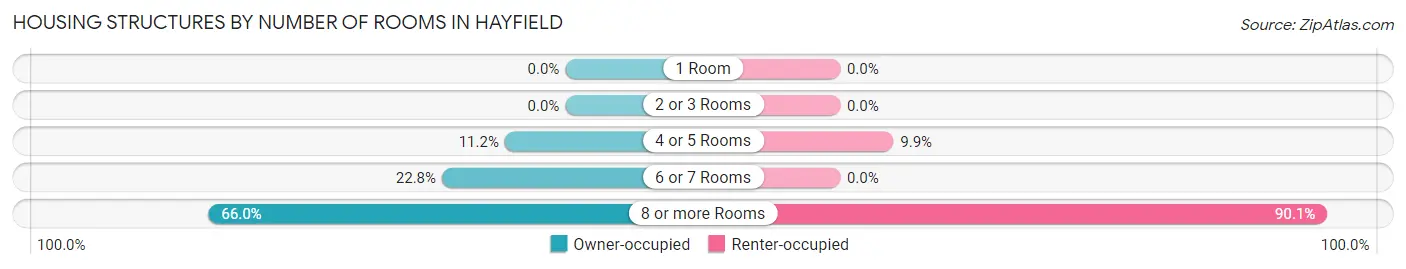
| Number of Rooms | Owner-occupied | Renter-occupied |
| 1 Room | 0 (0.0%) | 0 (0.0%) |
| 2 or 3 Rooms | 0 (0.0%) | 0 (0.0%) |
| 4 or 5 Rooms | 155 (11.2%) | 8 (9.9%) |
| 6 or 7 Rooms | 316 (22.8%) | 0 (0.0%) |
| 8 or more Rooms | 914 (66.0%) | 73 (90.1%) |
| Total | 1,385 (100.0%) | 81 (100.0%) |
Housing Structure by Heating Type in Hayfield
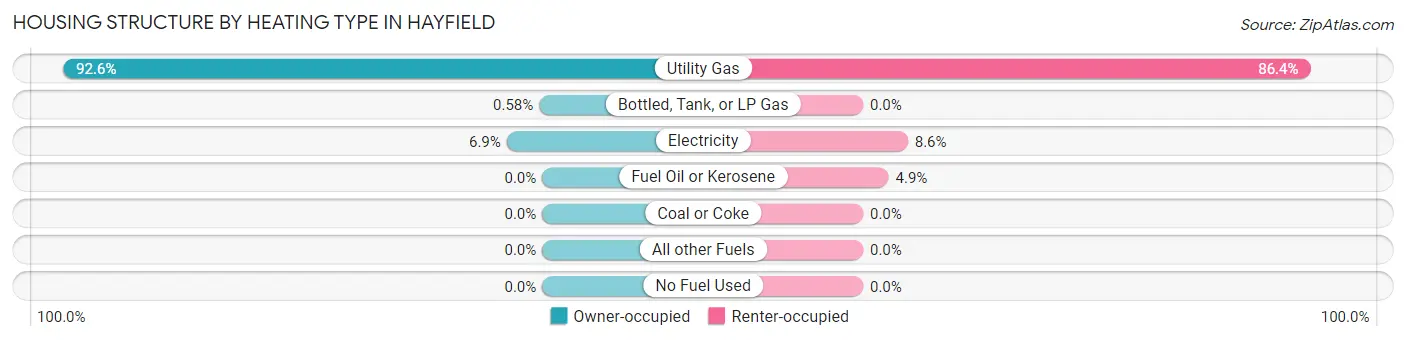
| Heating Type | Owner-occupied | Renter-occupied |
| Utility Gas | 1,282 (92.6%) | 70 (86.4%) |
| Bottled, Tank, or LP Gas | 8 (0.6%) | 0 (0.0%) |
| Electricity | 95 (6.9%) | 7 (8.6%) |
| Fuel Oil or Kerosene | 0 (0.0%) | 4 (4.9%) |
| Coal or Coke | 0 (0.0%) | 0 (0.0%) |
| All other Fuels | 0 (0.0%) | 0 (0.0%) |
| No Fuel Used | 0 (0.0%) | 0 (0.0%) |
| Total | 1,385 (100.0%) | 81 (100.0%) |
Household Vehicle Usage in Hayfield
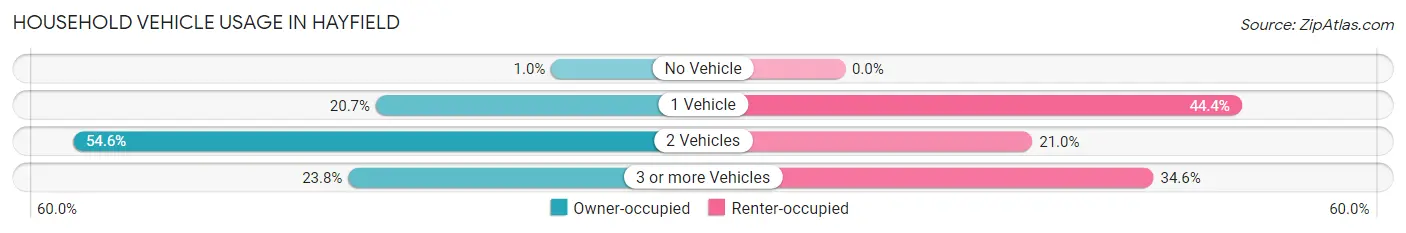
| Vehicles per Household | Owner-occupied | Renter-occupied |
| No Vehicle | 14 (1.0%) | 0 (0.0%) |
| 1 Vehicle | 286 (20.6%) | 36 (44.4%) |
| 2 Vehicles | 756 (54.6%) | 17 (21.0%) |
| 3 or more Vehicles | 329 (23.7%) | 28 (34.6%) |
| Total | 1,385 (100.0%) | 81 (100.0%) |
Real Estate & Mortgages in Hayfield
Real Estate and Mortgage Overview in Hayfield
| Characteristic | Without Mortgage | With Mortgage |
| Housing Units | 371 | 1,014 |
| Median Property Value | $620,000 | $643,000 |
| Median Household Income | $133,125 | $670 |
| Monthly Housing Costs | $927 | $492 |
| Real Estate Taxes | $6,457 | $33 |
Property Value by Mortgage Status in Hayfield
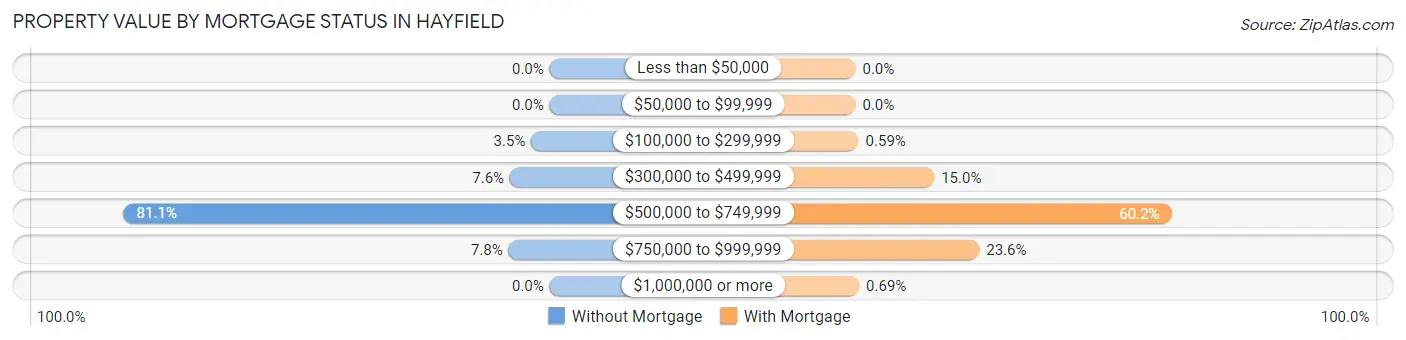
| Property Value | Without Mortgage | With Mortgage |
| Less than $50,000 | 0 (0.0%) | 0 (0.0%) |
| $50,000 to $99,999 | 0 (0.0%) | 0 (0.0%) |
| $100,000 to $299,999 | 13 (3.5%) | 6 (0.6%) |
| $300,000 to $499,999 | 28 (7.5%) | 152 (15.0%) |
| $500,000 to $749,999 | 301 (81.1%) | 610 (60.2%) |
| $750,000 to $999,999 | 29 (7.8%) | 239 (23.6%) |
| $1,000,000 or more | 0 (0.0%) | 7 (0.7%) |
| Total | 371 (100.0%) | 1,014 (100.0%) |
Household Income by Mortgage Status in Hayfield
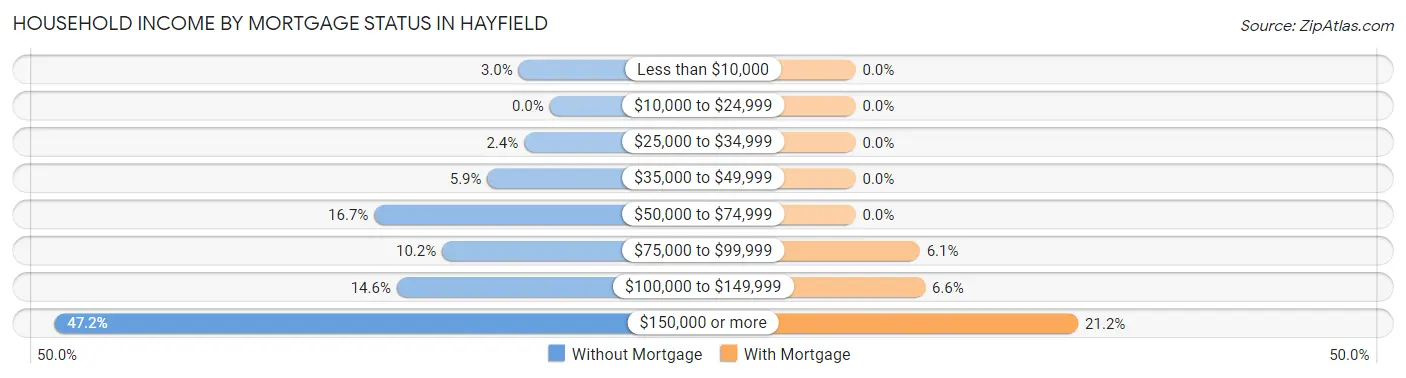
| Household Income | Without Mortgage | With Mortgage |
| Less than $10,000 | 11 (3.0%) | 0 (0.0%) |
| $10,000 to $24,999 | 0 (0.0%) | 0 (0.0%) |
| $25,000 to $34,999 | 9 (2.4%) | 0 (0.0%) |
| $35,000 to $49,999 | 22 (5.9%) | 0 (0.0%) |
| $50,000 to $74,999 | 62 (16.7%) | 0 (0.0%) |
| $75,000 to $99,999 | 38 (10.2%) | 62 (6.1%) |
| $100,000 to $149,999 | 54 (14.6%) | 67 (6.6%) |
| $150,000 or more | 175 (47.2%) | 215 (21.2%) |
| Total | 371 (100.0%) | 1,014 (100.0%) |
Property Value to Household Income Ratio in Hayfield
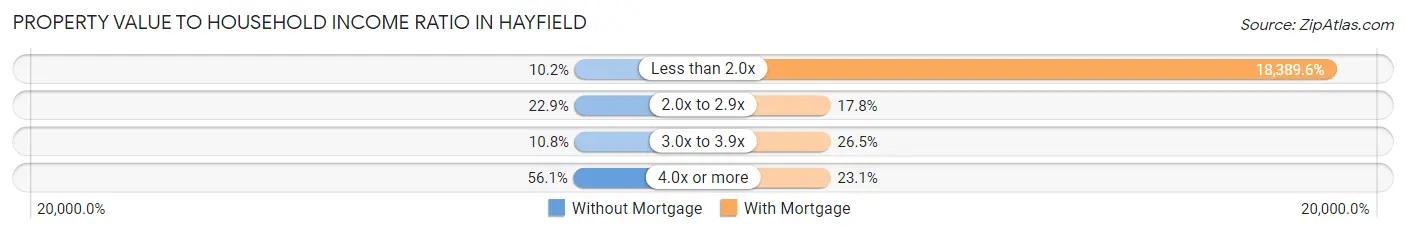
| Value-to-Income Ratio | Without Mortgage | With Mortgage |
| Less than 2.0x | 38 (10.2%) | 186,471 (18,389.6%) |
| 2.0x to 2.9x | 85 (22.9%) | 180 (17.7%) |
| 3.0x to 3.9x | 40 (10.8%) | 269 (26.5%) |
| 4.0x or more | 208 (56.1%) | 234 (23.1%) |
| Total | 371 (100.0%) | 1,014 (100.0%) |
Real Estate Taxes by Mortgage Status in Hayfield
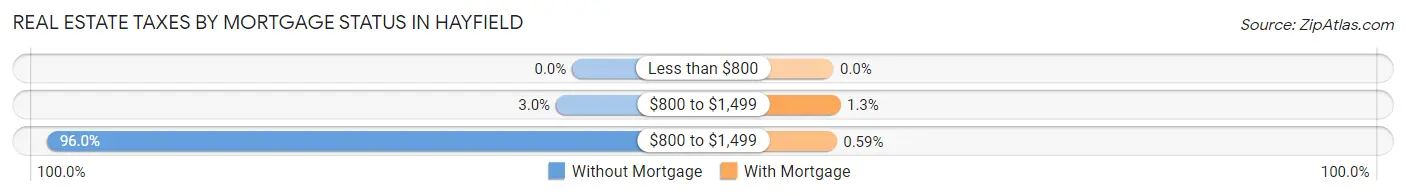
| Property Taxes | Without Mortgage | With Mortgage |
| Less than $800 | 0 (0.0%) | 0 (0.0%) |
| $800 to $1,499 | 11 (3.0%) | 13 (1.3%) |
| $800 to $1,499 | 356 (96.0%) | 6 (0.6%) |
| Total | 371 (100.0%) | 1,014 (100.0%) |
Health & Disability in Hayfield
Health Insurance Coverage by Age in Hayfield
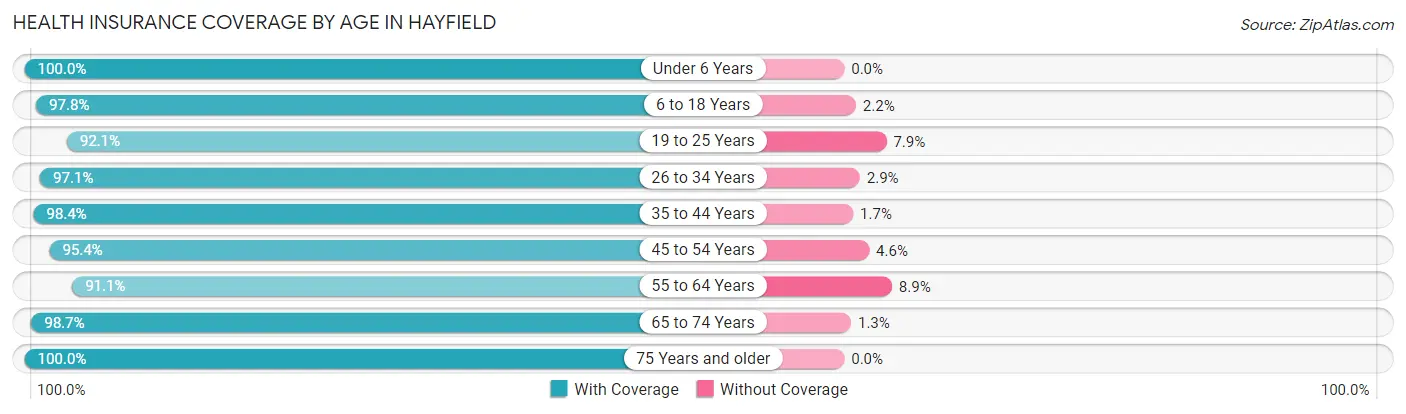
| Age Bracket | With Coverage | Without Coverage |
| Under 6 Years | 419 (100.0%) | 0 (0.0%) |
| 6 to 18 Years | 859 (97.8%) | 19 (2.2%) |
| 19 to 25 Years | 164 (92.1%) | 14 (7.9%) |
| 26 to 34 Years | 368 (97.1%) | 11 (2.9%) |
| 35 to 44 Years | 477 (98.4%) | 8 (1.7%) |
| 45 to 54 Years | 616 (95.4%) | 30 (4.6%) |
| 55 to 64 Years | 400 (91.1%) | 39 (8.9%) |
| 65 to 74 Years | 550 (98.7%) | 7 (1.3%) |
| 75 Years and older | 320 (100.0%) | 0 (0.0%) |
| Total | 4,173 (97.0%) | 128 (3.0%) |
Health Insurance Coverage by Citizenship Status in Hayfield
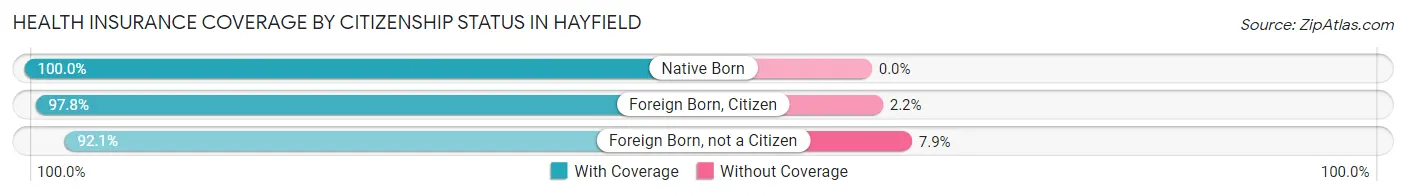
| Citizenship Status | With Coverage | Without Coverage |
| Native Born | 419 (100.0%) | 0 (0.0%) |
| Foreign Born, Citizen | 859 (97.8%) | 19 (2.2%) |
| Foreign Born, not a Citizen | 164 (92.1%) | 14 (7.9%) |
Health Insurance Coverage by Household Income in Hayfield
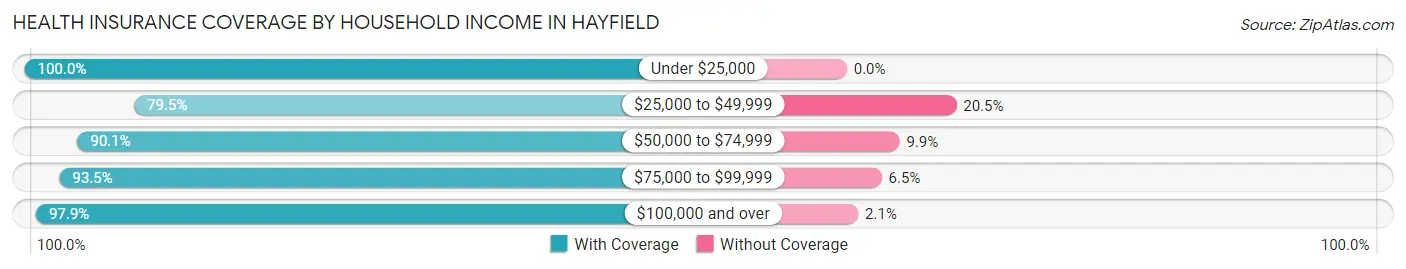
| Household Income | With Coverage | Without Coverage |
| Under $25,000 | 24 (100.0%) | 0 (0.0%) |
| $25,000 to $49,999 | 31 (79.5%) | 8 (20.5%) |
| $50,000 to $74,999 | 228 (90.1%) | 25 (9.9%) |
| $75,000 to $99,999 | 215 (93.5%) | 15 (6.5%) |
| $100,000 and over | 3,675 (97.9%) | 80 (2.1%) |
Public vs Private Health Insurance Coverage by Age in Hayfield
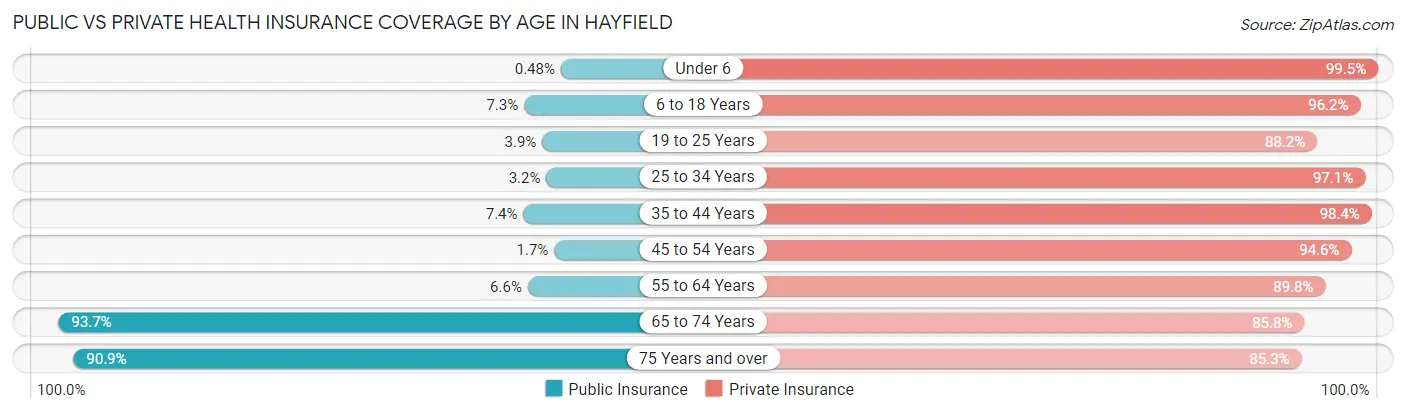
| Age Bracket | Public Insurance | Private Insurance |
| Under 6 | 2 (0.5%) | 417 (99.5%) |
| 6 to 18 Years | 64 (7.3%) | 845 (96.2%) |
| 19 to 25 Years | 7 (3.9%) | 157 (88.2%) |
| 25 to 34 Years | 12 (3.2%) | 368 (97.1%) |
| 35 to 44 Years | 36 (7.4%) | 477 (98.4%) |
| 45 to 54 Years | 11 (1.7%) | 611 (94.6%) |
| 55 to 64 Years | 29 (6.6%) | 394 (89.7%) |
| 65 to 74 Years | 522 (93.7%) | 478 (85.8%) |
| 75 Years and over | 291 (90.9%) | 273 (85.3%) |
| Total | 974 (22.7%) | 4,020 (93.5%) |
Disability Status by Sex by Age in Hayfield
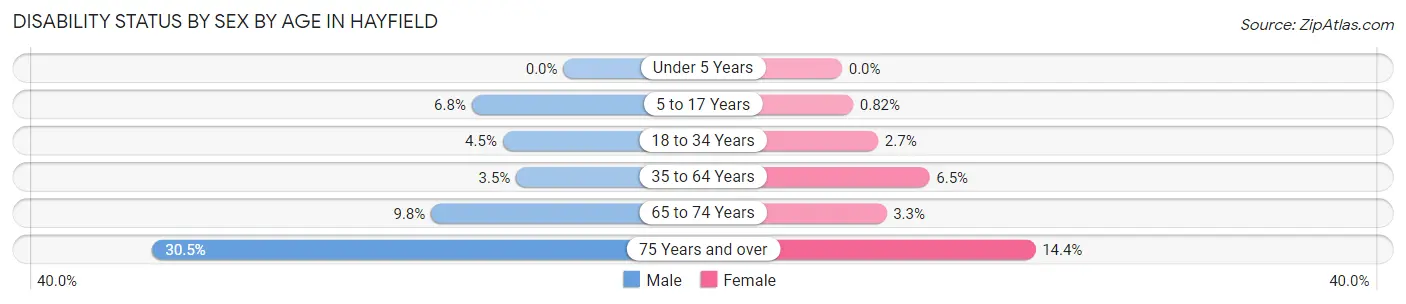
| Age Bracket | Male | Female |
| Under 5 Years | 0 (0.0%) | 0 (0.0%) |
| 5 to 17 Years | 27 (6.8%) | 3 (0.8%) |
| 18 to 34 Years | 20 (4.5%) | 8 (2.7%) |
| 35 to 64 Years | 28 (3.5%) | 50 (6.5%) |
| 65 to 74 Years | 22 (9.8%) | 11 (3.3%) |
| 75 Years and over | 36 (30.5%) | 29 (14.4%) |
Disability Class by Sex by Age in Hayfield
Disability Class: Hearing Difficulty
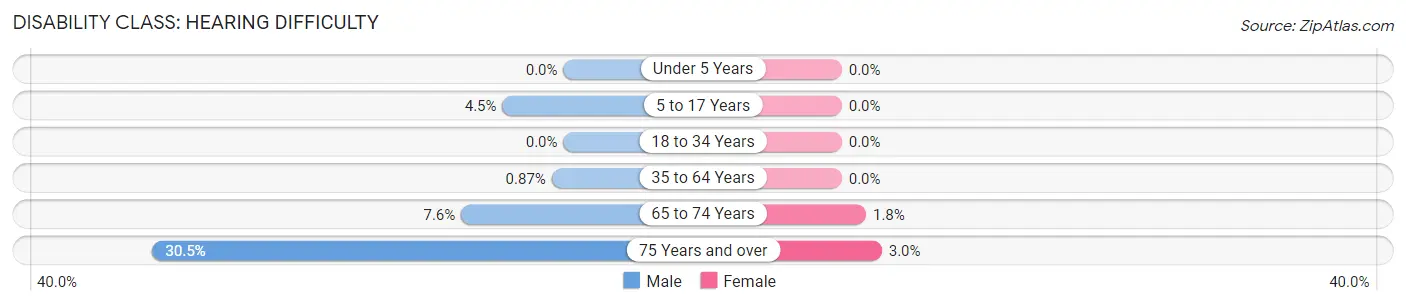
| Age Bracket | Male | Female |
| Under 5 Years | 0 (0.0%) | 0 (0.0%) |
| 5 to 17 Years | 18 (4.5%) | 0 (0.0%) |
| 18 to 34 Years | 0 (0.0%) | 0 (0.0%) |
| 35 to 64 Years | 7 (0.9%) | 0 (0.0%) |
| 65 to 74 Years | 17 (7.6%) | 6 (1.8%) |
| 75 Years and over | 36 (30.5%) | 6 (3.0%) |
Disability Class: Vision Difficulty
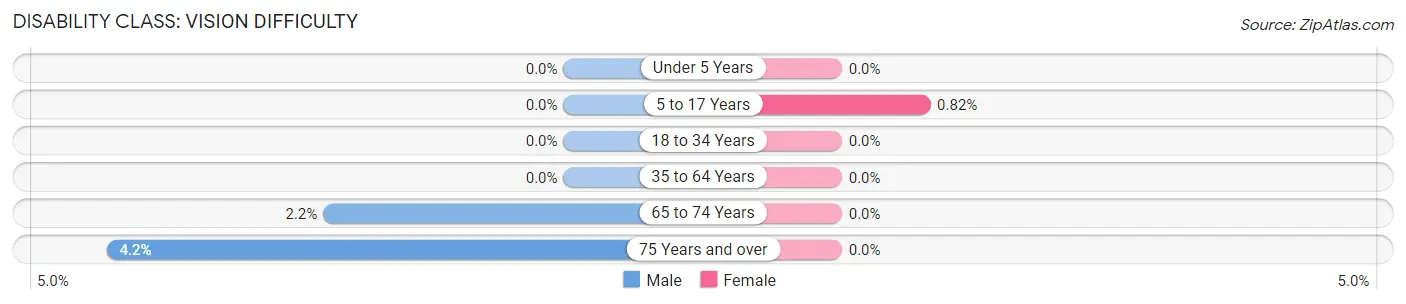
| Age Bracket | Male | Female |
| Under 5 Years | 0 (0.0%) | 0 (0.0%) |
| 5 to 17 Years | 0 (0.0%) | 3 (0.8%) |
| 18 to 34 Years | 0 (0.0%) | 0 (0.0%) |
| 35 to 64 Years | 0 (0.0%) | 0 (0.0%) |
| 65 to 74 Years | 5 (2.2%) | 0 (0.0%) |
| 75 Years and over | 5 (4.2%) | 0 (0.0%) |
Disability Class: Cognitive Difficulty
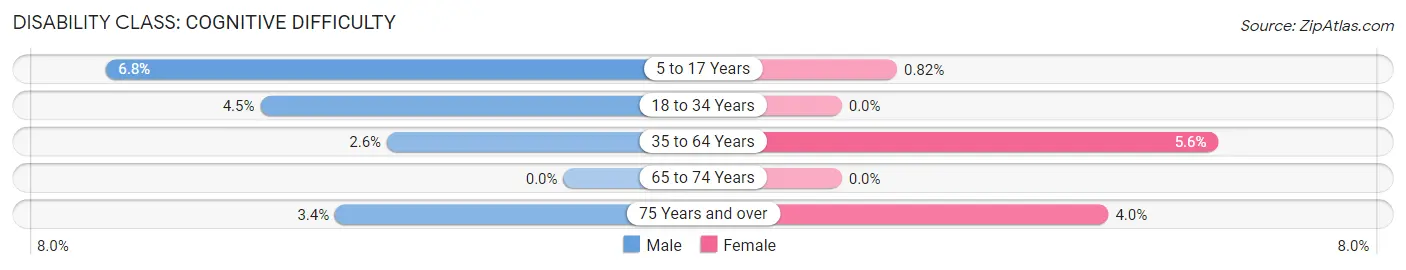
| Age Bracket | Male | Female |
| 5 to 17 Years | 27 (6.8%) | 3 (0.8%) |
| 18 to 34 Years | 20 (4.5%) | 0 (0.0%) |
| 35 to 64 Years | 21 (2.6%) | 43 (5.6%) |
| 65 to 74 Years | 0 (0.0%) | 0 (0.0%) |
| 75 Years and over | 4 (3.4%) | 8 (4.0%) |
Disability Class: Ambulatory Difficulty
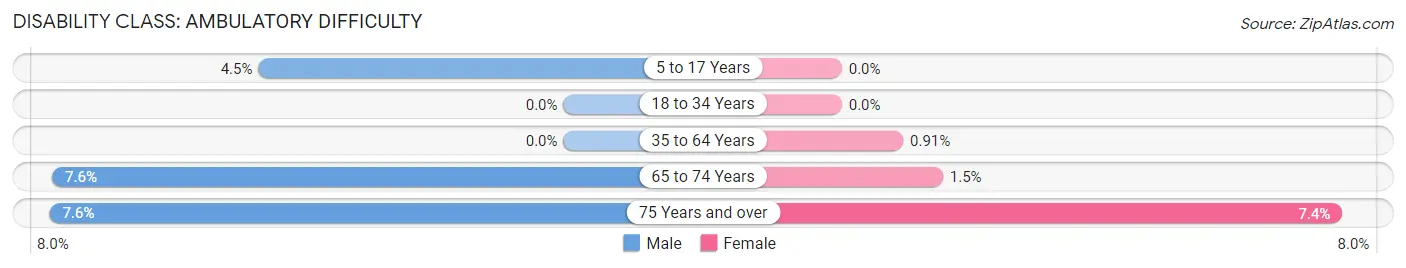
| Age Bracket | Male | Female |
| 5 to 17 Years | 18 (4.5%) | 0 (0.0%) |
| 18 to 34 Years | 0 (0.0%) | 0 (0.0%) |
| 35 to 64 Years | 0 (0.0%) | 7 (0.9%) |
| 65 to 74 Years | 17 (7.6%) | 5 (1.5%) |
| 75 Years and over | 9 (7.6%) | 15 (7.4%) |
Disability Class: Self-Care Difficulty
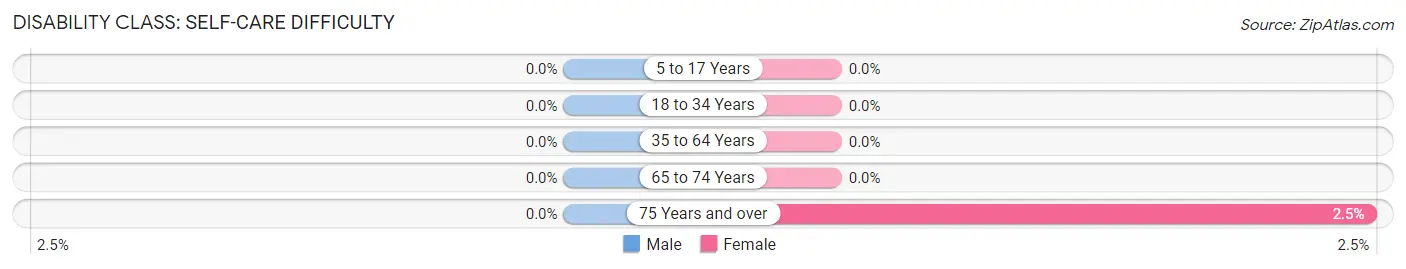
| Age Bracket | Male | Female |
| 5 to 17 Years | 0 (0.0%) | 0 (0.0%) |
| 18 to 34 Years | 0 (0.0%) | 0 (0.0%) |
| 35 to 64 Years | 0 (0.0%) | 0 (0.0%) |
| 65 to 74 Years | 0 (0.0%) | 0 (0.0%) |
| 75 Years and over | 0 (0.0%) | 5 (2.5%) |
Technology Access in Hayfield
Computing Device Access in Hayfield
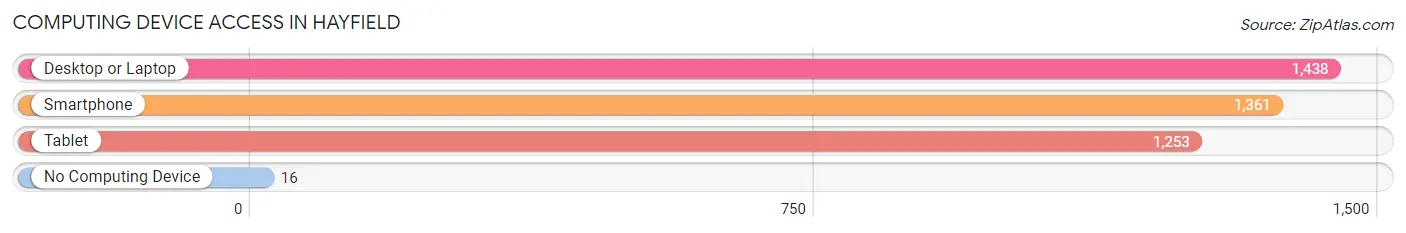
| Device Type | # Households | % Households |
| Desktop or Laptop | 1,438 | 98.1% |
| Smartphone | 1,361 | 92.8% |
| Tablet | 1,253 | 85.5% |
| No Computing Device | 16 | 1.1% |
| Total | 1,466 | 100.0% |
Internet Access in Hayfield
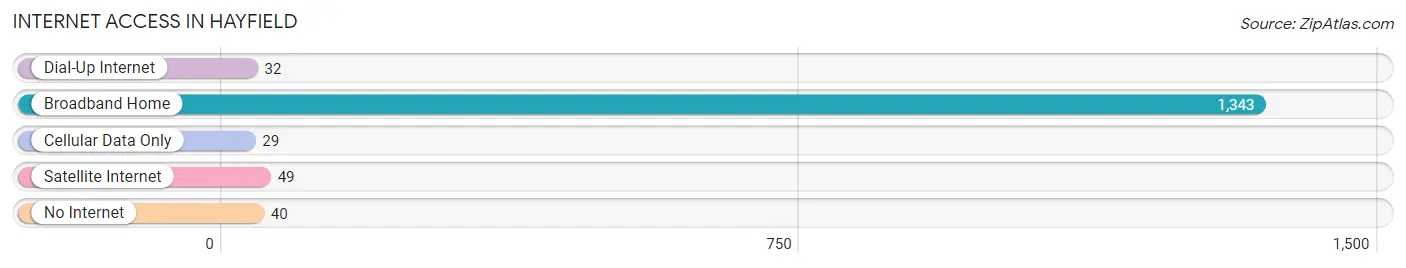
| Internet Type | # Households | % Households |
| Dial-Up Internet | 32 | 2.2% |
| Broadband Home | 1,343 | 91.6% |
| Cellular Data Only | 29 | 2.0% |
| Satellite Internet | 49 | 3.3% |
| No Internet | 40 | 2.7% |
| Total | 1,466 | 100.0% |
Hayfield Summary
Hayfield, Virginia is a small town located in Fairfax County, Virginia. It is situated on the banks of the Potomac River, just south of Washington, D.C. The town is home to a population of approximately 1,500 people, and is part of the Washington Metropolitan Area.
History
The area that is now Hayfield was first settled in the late 1700s by a group of German immigrants. The town was originally known as “Hoffman’s Crossroads”, named after the family that owned the land. In 1820, the town was renamed “Hayfield”, after the hay fields that surrounded the area.
In the late 1800s, Hayfield began to grow and develop. The town was home to a number of businesses, including a general store, a blacksmith shop, and a post office. The town also had a school, a church, and a number of other small businesses.
In the early 1900s, Hayfield began to experience a period of growth and prosperity. The town was home to a number of large farms, and the population began to increase. In the 1950s, the town was incorporated as a town, and the population continued to grow.
Geography
Hayfield is located in Fairfax County, Virginia. The town is situated on the banks of the Potomac River, just south of Washington, D.C. The town is bordered by the towns of Clifton, Fairfax Station, and Lorton. The town is located in a rural area, and is surrounded by farmland and wooded areas.
The climate in Hayfield is typical of the mid-Atlantic region. Summers are hot and humid, with temperatures reaching into the 90s. Winters are cold and wet, with temperatures dropping into the 20s.
Economy
The economy of Hayfield is largely based on agriculture. The town is home to a number of large farms, and the surrounding area is home to many smaller farms. The town is also home to a number of small businesses, including restaurants, retail stores, and professional services.
Demographics
As of the 2010 census, the population of Hayfield was 1,500. The town is predominantly white, with a small African American population. The median household income is $75,000, and the median home value is $400,000. The town is home to a number of families, and the average family size is 3.5 people.
Conclusion
Hayfield, Virginia is a small town located in Fairfax County, Virginia. It is situated on the banks of the Potomac River, just south of Washington, D.C. The town is home to a population of approximately 1,500 people, and is part of the Washington Metropolitan Area. The town has a long history, and the economy is largely based on agriculture. The town is predominantly white, with a small African American population. The median household income is $75,000, and the median home value is $400,000. Hayfield is a small town with a rich history and a bright future.
Common Questions
What is Per Capita Income in Hayfield?
Per Capita income in Hayfield is $80,393.
What is the Median Family Income in Hayfield?
Median Family Income in Hayfield is $192,826.
What is the Median Household income in Hayfield?
Median Household Income in Hayfield is $176,125.
What is Income or Wage Gap in Hayfield?
Income or Wage Gap in Hayfield is 47.1%.
Women in Hayfield earn 52.9 cents for every dollar earned by a man.
What is Inequality or Gini Index in Hayfield?
Inequality or Gini Index in Hayfield is 0.41.
What is the Total Population of Hayfield?
Total Population of Hayfield is 4,390.
What is the Total Male Population of Hayfield?
Total Male Population of Hayfield is 2,302.
What is the Total Female Population of Hayfield?
Total Female Population of Hayfield is 2,088.
What is the Ratio of Males per 100 Females in Hayfield?
There are 110.25 Males per 100 Females in Hayfield.
What is the Ratio of Females per 100 Males in Hayfield?
There are 90.70 Females per 100 Males in Hayfield.
What is the Median Population Age in Hayfield?
Median Population Age in Hayfield is 40.6 Years.
What is the Average Family Size in Hayfield
Average Family Size in Hayfield is 3.3 People.
What is the Average Household Size in Hayfield
Average Household Size in Hayfield is 3.0 People.
How Large is the Labor Force in Hayfield?
There are 2,141 People in the Labor Forcein in Hayfield.
What is the Percentage of People in the Labor Force in Hayfield?
63.4% of People are in the Labor Force in Hayfield.
What is the Unemployment Rate in Hayfield?
Unemployment Rate in Hayfield is 3.6%.