Dunn Loring, VA Map & Demographics
Dunn Loring Map
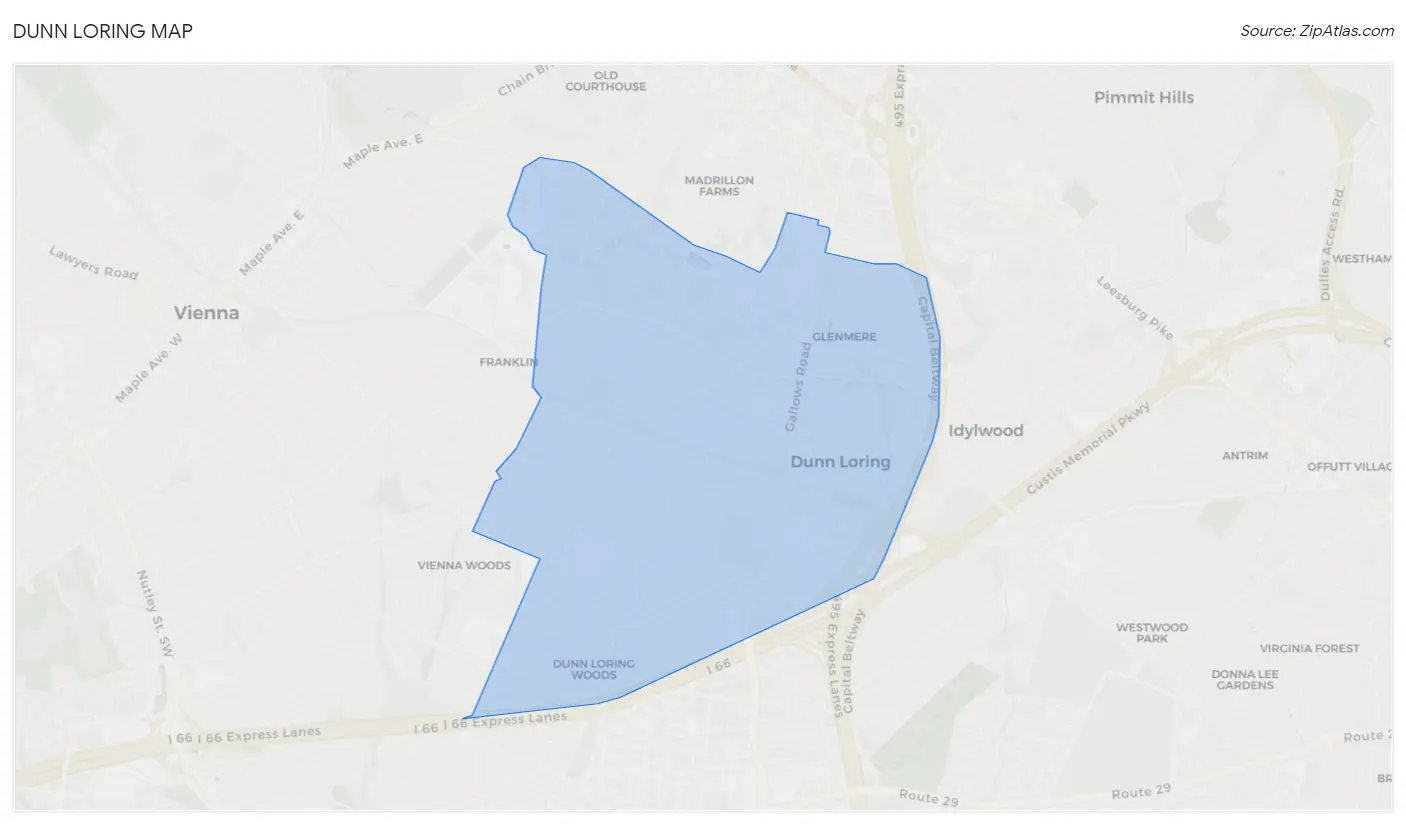
Dunn Loring Overview
$89,174
PER CAPITA INCOME
$246,716
AVG FAMILY INCOME
$238,734
AVG HOUSEHOLD INCOME
56.5%
WAGE / INCOME GAP [ % ]
43.5¢/ $1
WAGE / INCOME GAP [ $ ]
0.35
INEQUALITY / GINI INDEX
8,707
TOTAL POPULATION
4,325
MALE POPULATION
4,382
FEMALE POPULATION
98.70
MALES / 100 FEMALES
101.32
FEMALES / 100 MALES
42.0
MEDIAN AGE
3.3
AVG FAMILY SIZE
3.0
AVG HOUSEHOLD SIZE
4,690
LABOR FORCE [ PEOPLE ]
67.8%
PERCENT IN LABOR FORCE
3.8%
UNEMPLOYMENT RATE
Dunn Loring Zip Codes
Income in Dunn Loring
Income Overview in Dunn Loring
Per Capita Income in Dunn Loring is $89,174, while median incomes of families and households are $246,716 and $238,734 respectively.
| Characteristic | Number | Measure |
| Per Capita Income | 8,707 | $89,174 |
| Median Family Income | 2,378 | $246,716 |
| Mean Family Income | 2,378 | $281,110 |
| Median Household Income | 2,806 | $238,734 |
| Mean Household Income | 2,806 | $272,715 |
| Income Deficit | 2,378 | $0 |
| Wage / Income Gap (%) | 8,707 | 56.46% |
| Wage / Income Gap ($) | 8,707 | 43.54¢ per $1 |
| Gini / Inequality Index | 8,707 | 0.35 |
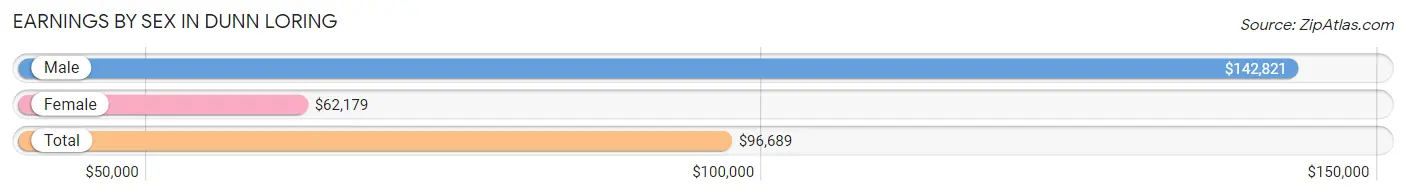
Earnings by Sex in Dunn Loring
Average Earnings in Dunn Loring are $96,689, $142,821 for men and $62,179 for women, a difference of 56.5%.
| Sex | Number | Average Earnings |
| Male | 2,721 (54.5%) | $142,821 |
| Female | 2,273 (45.5%) | $62,179 |
| Total | 4,994 (100.0%) | $96,689 |
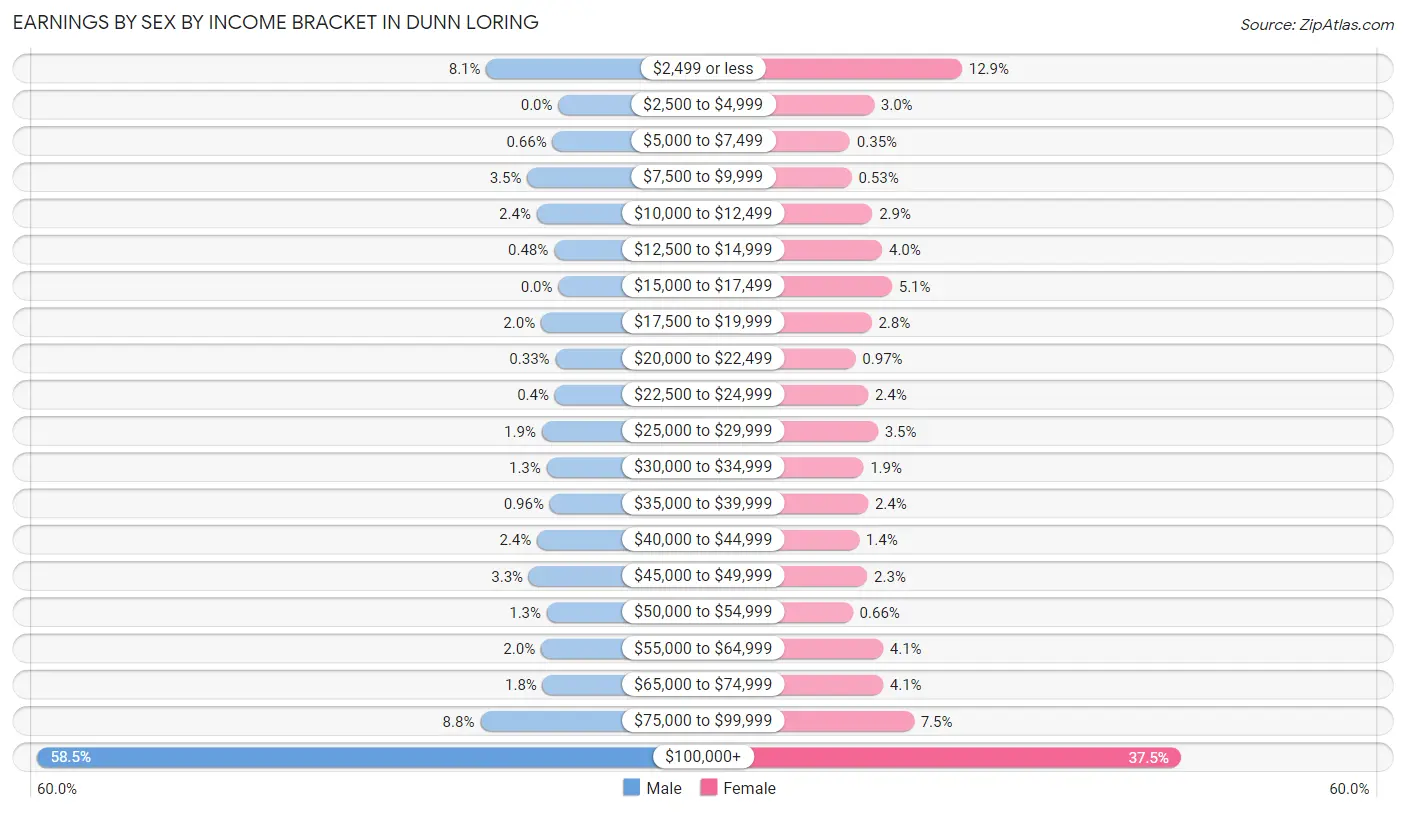
Earnings by Sex by Income Bracket in Dunn Loring
The most common earnings brackets in Dunn Loring are $100,000+ for men (1,593 | 58.5%) and $100,000+ for women (853 | 37.5%).
| Income | Male | Female |
| $2,499 or less | 220 (8.1%) | 294 (12.9%) |
| $2,500 to $4,999 | 0 (0.0%) | 69 (3.0%) |
| $5,000 to $7,499 | 18 (0.7%) | 8 (0.4%) |
| $7,500 to $9,999 | 95 (3.5%) | 12 (0.5%) |
| $10,000 to $12,499 | 66 (2.4%) | 65 (2.9%) |
| $12,500 to $14,999 | 13 (0.5%) | 90 (4.0%) |
| $15,000 to $17,499 | 0 (0.0%) | 115 (5.1%) |
| $17,500 to $19,999 | 53 (1.9%) | 63 (2.8%) |
| $20,000 to $22,499 | 9 (0.3%) | 22 (1.0%) |
| $22,500 to $24,999 | 11 (0.4%) | 54 (2.4%) |
| $25,000 to $29,999 | 51 (1.9%) | 79 (3.5%) |
| $30,000 to $34,999 | 36 (1.3%) | 42 (1.8%) |
| $35,000 to $39,999 | 26 (1.0%) | 54 (2.4%) |
| $40,000 to $44,999 | 65 (2.4%) | 31 (1.4%) |
| $45,000 to $49,999 | 90 (3.3%) | 52 (2.3%) |
| $50,000 to $54,999 | 35 (1.3%) | 15 (0.7%) |
| $55,000 to $64,999 | 53 (1.9%) | 92 (4.1%) |
| $65,000 to $74,999 | 48 (1.8%) | 92 (4.1%) |
| $75,000 to $99,999 | 239 (8.8%) | 171 (7.5%) |
| $100,000+ | 1,593 (58.5%) | 853 (37.5%) |
| Total | 2,721 (100.0%) | 2,273 (100.0%) |
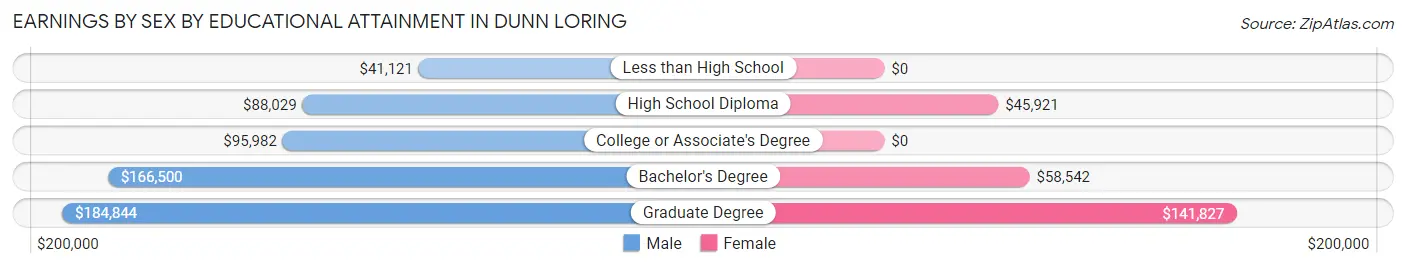
Earnings by Sex by Educational Attainment in Dunn Loring
Average earnings in Dunn Loring are $162,583 for men and $85,547 for women, a difference of 47.4%. Men with an educational attainment of graduate degree enjoy the highest average annual earnings of $184,844, while those with less than high school education earn the least with $41,121. Women with an educational attainment of graduate degree earn the most with the average annual earnings of $141,827, while those with high school diploma education have the smallest earnings of $45,921.
| Educational Attainment | Male Income | Female Income |
| Less than High School | $41,121 | $0 |
| High School Diploma | $88,029 | $45,921 |
| College or Associate's Degree | $95,982 | $0 |
| Bachelor's Degree | $166,500 | $58,542 |
| Graduate Degree | $184,844 | $141,827 |
| Total | $162,583 | $85,547 |
Family Income in Dunn Loring
Family Income Brackets in Dunn Loring
According to the Dunn Loring family income data, there are 1,517 families falling into the $200,000+ income range, which is the most common income bracket and makes up 63.8% of all families.
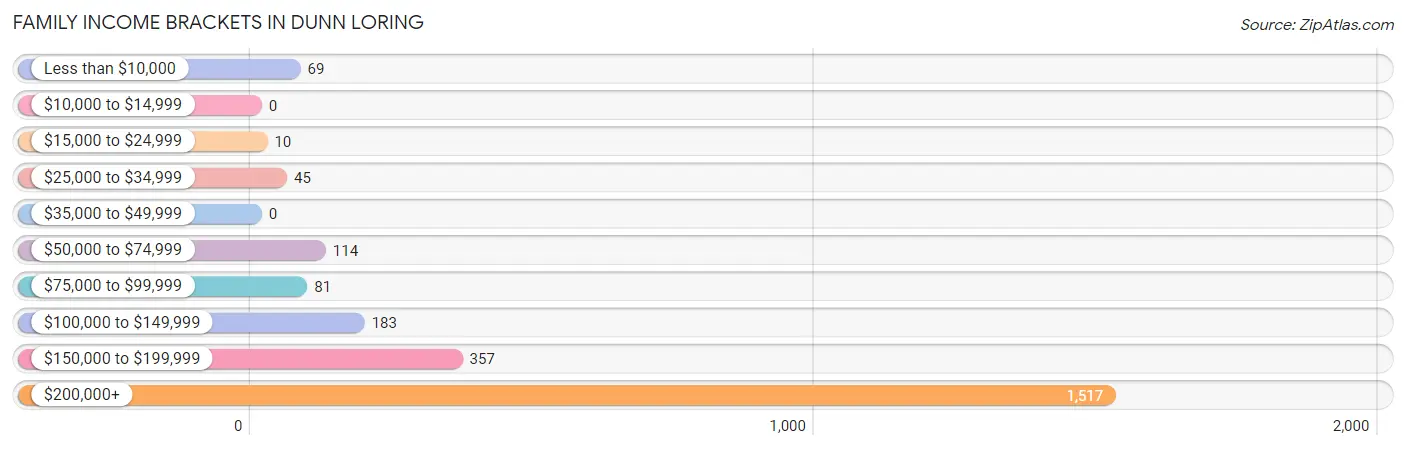
| Income Bracket | # Families | % Families |
| Less than $10,000 | 69 | 2.9% |
| $10,000 to $14,999 | 0 | 0.0% |
| $15,000 to $24,999 | 10 | 0.4% |
| $25,000 to $34,999 | 45 | 1.9% |
| $35,000 to $49,999 | 0 | 0.0% |
| $50,000 to $74,999 | 114 | 4.8% |
| $75,000 to $99,999 | 81 | 3.4% |
| $100,000 to $149,999 | 183 | 7.7% |
| $150,000 to $199,999 | 357 | 15.0% |
| $200,000+ | 1,517 | 63.8% |
Family Income by Famaliy Size in Dunn Loring
4-person families (709 | 29.8%) account for the highest median family income in Dunn Loring with $250,001 per family, while 2-person families (886 | 37.3%) have the highest median income of $96,066 per family member.
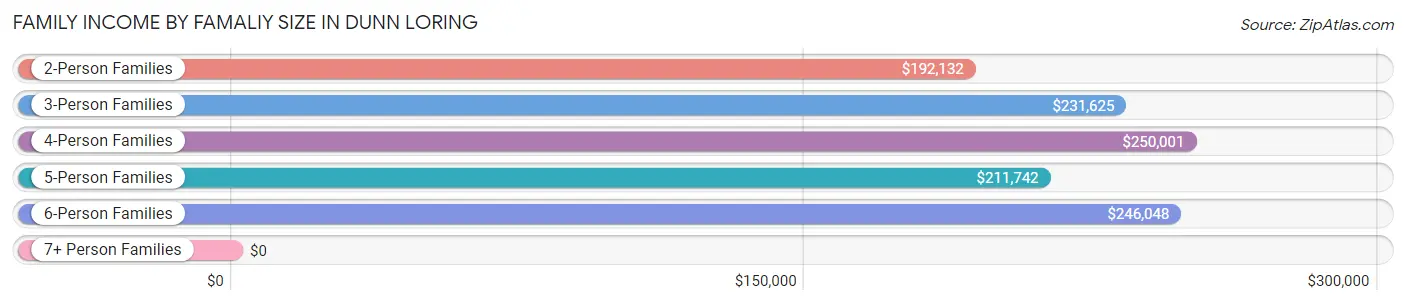
| Income Bracket | # Families | Median Income |
| 2-Person Families | 886 (37.3%) | $192,132 |
| 3-Person Families | 501 (21.1%) | $231,625 |
| 4-Person Families | 709 (29.8%) | $250,001 |
| 5-Person Families | 174 (7.3%) | $211,742 |
| 6-Person Families | 108 (4.5%) | $246,048 |
| 7+ Person Families | 0 (0.0%) | $0 |
| Total | 2,378 (100.0%) | $246,716 |
Family Income by Number of Earners in Dunn Loring
The median family income in Dunn Loring is $246,716, with families comprising 2 earners (1,237) having the highest median family income of $250,001, while families with 1 earner (526) have the lowest median family income of $181,667, accounting for 52.0% and 22.1% of families, respectively.
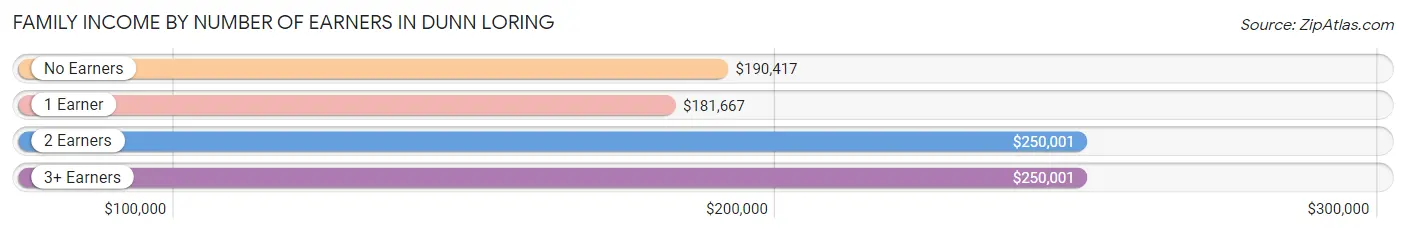
| Number of Earners | # Families | Median Income |
| No Earners | 228 (9.6%) | $190,417 |
| 1 Earner | 526 (22.1%) | $181,667 |
| 2 Earners | 1,237 (52.0%) | $250,001 |
| 3+ Earners | 387 (16.3%) | $250,001 |
| Total | 2,378 (100.0%) | $246,716 |
Household Income in Dunn Loring
Household Income Brackets in Dunn Loring
With 1,700 households falling in the category, the $200,000+ income range is the most frequent in Dunn Loring, accounting for 60.6% of all households. In contrast, only 8 households (0.3%) fall into the $35,000 to $49,999 income bracket, making it the least populous group.
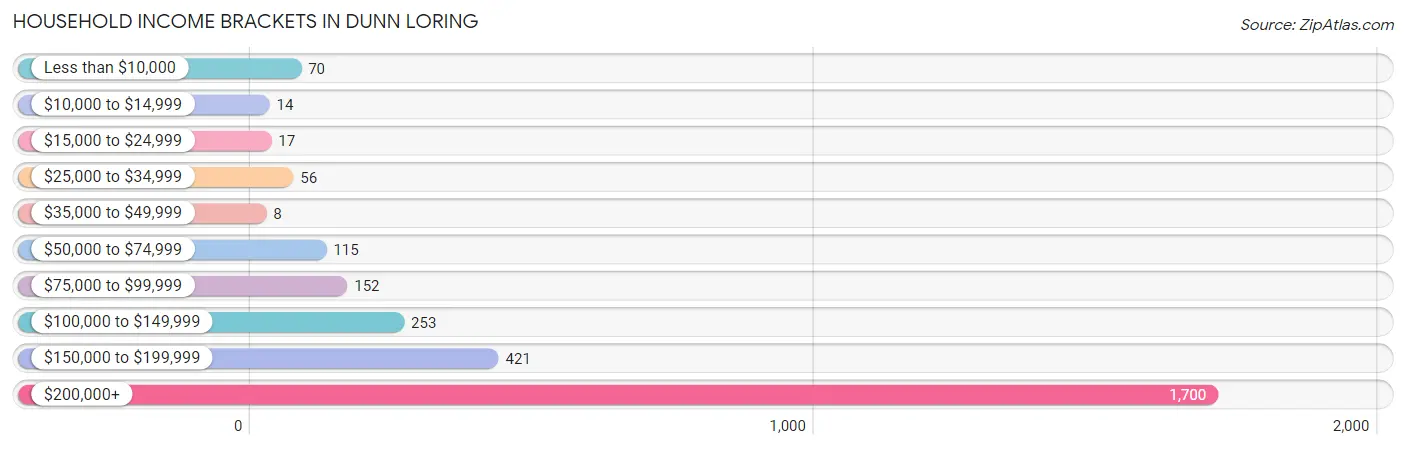
| Income Bracket | # Households | % Households |
| Less than $10,000 | 70 | 2.5% |
| $10,000 to $14,999 | 14 | 0.5% |
| $15,000 to $24,999 | 17 | 0.6% |
| $25,000 to $34,999 | 56 | 2.0% |
| $35,000 to $49,999 | 8 | 0.3% |
| $50,000 to $74,999 | 115 | 4.1% |
| $75,000 to $99,999 | 152 | 5.4% |
| $100,000 to $149,999 | 253 | 9.0% |
| $150,000 to $199,999 | 421 | 15.0% |
| $200,000+ | 1,700 | 60.6% |
Household Income by Householder Age in Dunn Loring
The median household income in Dunn Loring is $238,734, with the highest median household income of $250,001 found in the 25 to 44 years age bracket for the primary householder. A total of 702 households (25.0%) fall into this category.
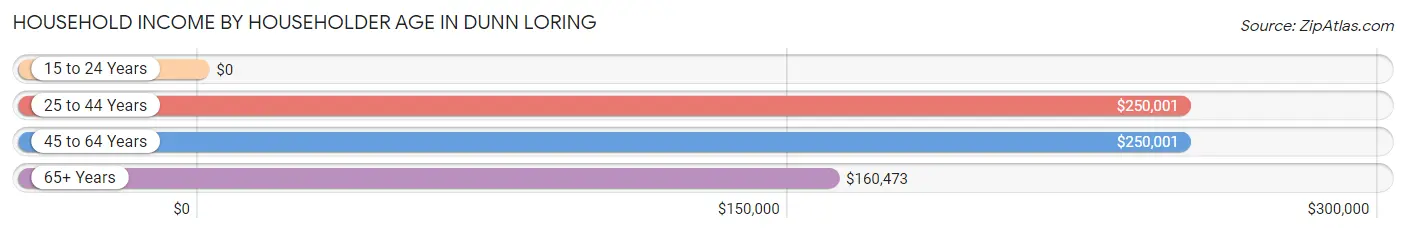
| Income Bracket | # Households | Median Income |
| 15 to 24 Years | 0 (0.0%) | $0 |
| 25 to 44 Years | 702 (25.0%) | $250,001 |
| 45 to 64 Years | 1,269 (45.2%) | $250,001 |
| 65+ Years | 835 (29.8%) | $160,473 |
| Total | 2,806 (100.0%) | $238,734 |
Poverty in Dunn Loring
Income Below Poverty by Sex and Age in Dunn Loring
With 3.6% poverty level for males and 5.6% for females among the residents of Dunn Loring, 18 to 24 year old males and 18 to 24 year old females are the most vulnerable to poverty, with 63 males (16.0%) and 89 females (27.6%) in their respective age groups living below the poverty level.
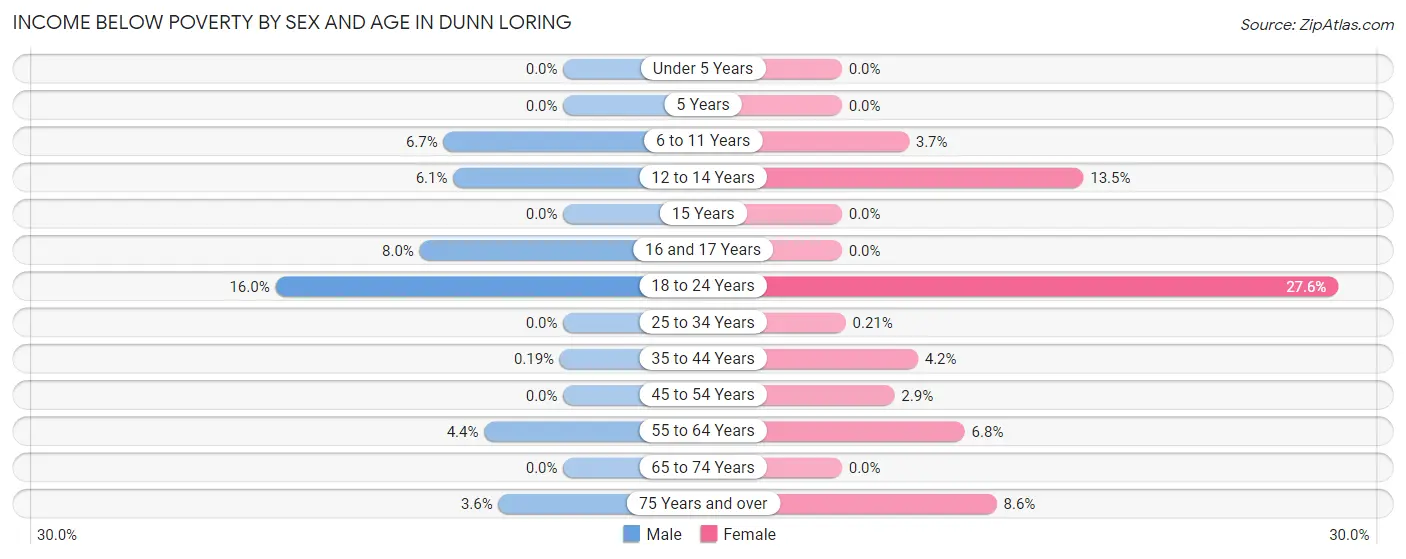
| Age Bracket | Male | Female |
| Under 5 Years | 0 (0.0%) | 0 (0.0%) |
| 5 Years | 0 (0.0%) | 0 (0.0%) |
| 6 to 11 Years | 22 (6.7%) | 16 (3.7%) |
| 12 to 14 Years | 10 (6.1%) | 16 (13.5%) |
| 15 Years | 0 (0.0%) | 0 (0.0%) |
| 16 and 17 Years | 16 (8.0%) | 0 (0.0%) |
| 18 to 24 Years | 63 (16.0%) | 89 (27.6%) |
| 25 to 34 Years | 0 (0.0%) | 1 (0.2%) |
| 35 to 44 Years | 1 (0.2%) | 26 (4.2%) |
| 45 to 54 Years | 0 (0.0%) | 16 (2.9%) |
| 55 to 64 Years | 33 (4.4%) | 50 (6.8%) |
| 65 to 74 Years | 0 (0.0%) | 0 (0.0%) |
| 75 Years and over | 10 (3.6%) | 25 (8.6%) |
| Total | 155 (3.6%) | 239 (5.6%) |
Income Above Poverty by Sex and Age in Dunn Loring
According to the poverty statistics in Dunn Loring, males aged under 5 years and females aged under 5 years are the age groups that are most secure financially, with 100.0% of males and 100.0% of females in these age groups living above the poverty line.
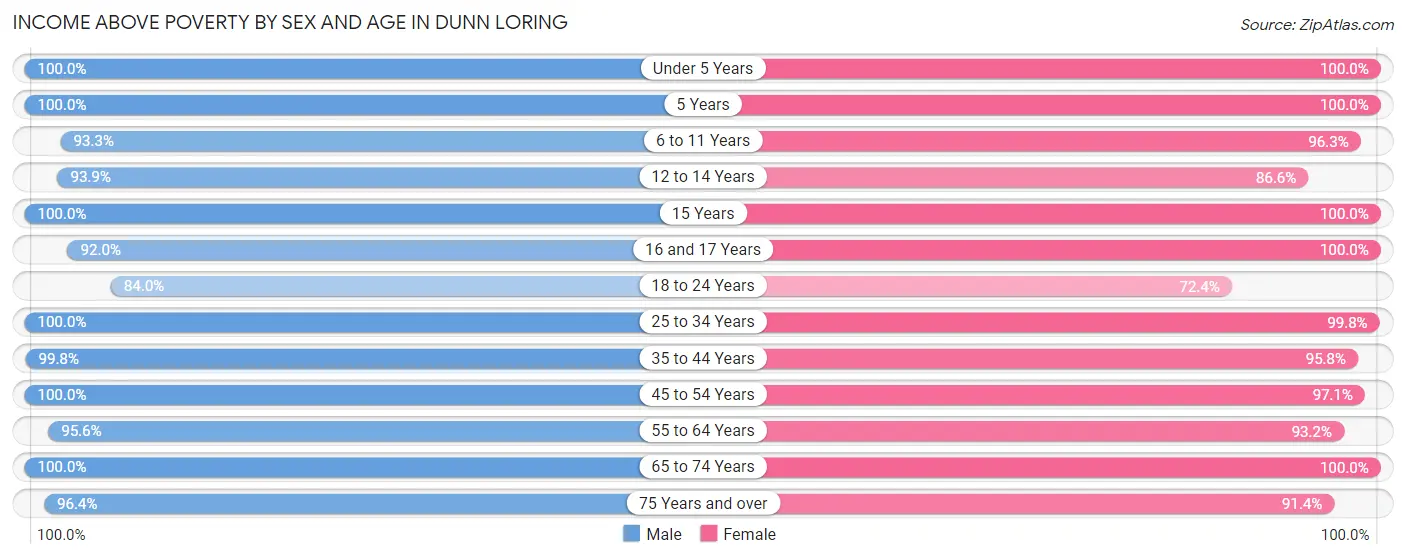
| Age Bracket | Male | Female |
| Under 5 Years | 238 (100.0%) | 271 (100.0%) |
| 5 Years | 41 (100.0%) | 12 (100.0%) |
| 6 to 11 Years | 308 (93.3%) | 413 (96.3%) |
| 12 to 14 Years | 153 (93.9%) | 103 (86.6%) |
| 15 Years | 92 (100.0%) | 78 (100.0%) |
| 16 and 17 Years | 184 (92.0%) | 79 (100.0%) |
| 18 to 24 Years | 330 (84.0%) | 233 (72.4%) |
| 25 to 34 Years | 292 (100.0%) | 468 (99.8%) |
| 35 to 44 Years | 537 (99.8%) | 589 (95.8%) |
| 45 to 54 Years | 532 (100.0%) | 530 (97.1%) |
| 55 to 64 Years | 717 (95.6%) | 681 (93.2%) |
| 65 to 74 Years | 448 (100.0%) | 337 (100.0%) |
| 75 Years and over | 267 (96.4%) | 265 (91.4%) |
| Total | 4,139 (96.4%) | 4,059 (94.4%) |
Income Below Poverty Among Married-Couple Families in Dunn Loring
The poverty statistics for married-couple families in Dunn Loring show that 0.2% or 5 of the total 2,128 families live below the poverty line. Families with 1 or 2 children have the highest poverty rate of 0.5%, comprising of 5 families. On the other hand, families with no children have the lowest poverty rate of 0.0%, which includes 0 families.
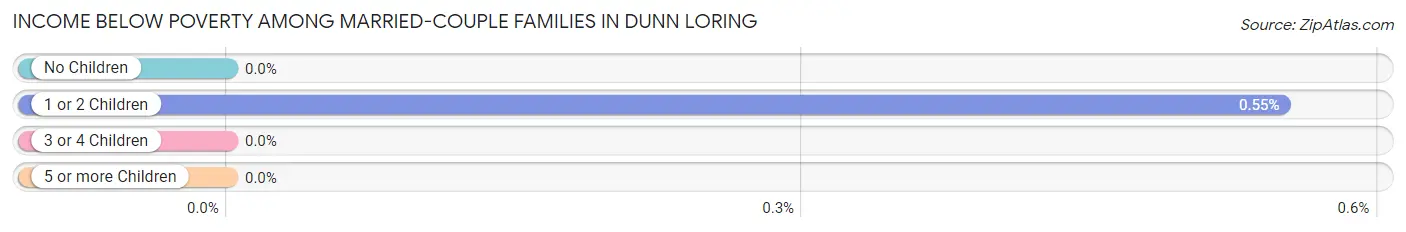
| Children | Above Poverty | Below Poverty |
| No Children | 1,041 (100.0%) | 0 (0.0%) |
| 1 or 2 Children | 907 (99.5%) | 5 (0.5%) |
| 3 or 4 Children | 175 (100.0%) | 0 (0.0%) |
| 5 or more Children | 0 (0.0%) | 0 (0.0%) |
| Total | 2,123 (99.8%) | 5 (0.2%) |
Income Below Poverty Among Single-Parent Households in Dunn Loring
According to the poverty data in Dunn Loring, 30.8% or 24 single-father households and 38.4% or 66 single-mother households are living below the poverty line. Among single-father households, those with no children have the highest poverty rate, with 14 households (46.7%) experiencing poverty. Likewise, among single-mother households, those with 3 or 4 children have the highest poverty rate, with 16 households (100.0%) falling below the poverty line.
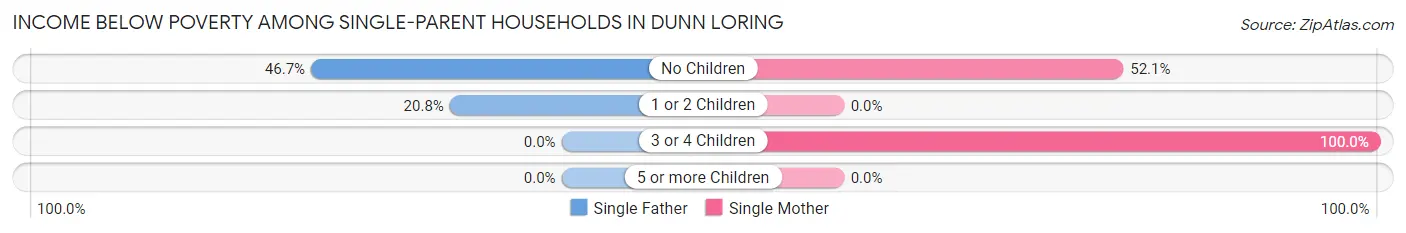
| Children | Single Father | Single Mother |
| No Children | 14 (46.7%) | 50 (52.1%) |
| 1 or 2 Children | 10 (20.8%) | 0 (0.0%) |
| 3 or 4 Children | 0 (0.0%) | 16 (100.0%) |
| 5 or more Children | 0 (0.0%) | 0 (0.0%) |
| Total | 24 (30.8%) | 66 (38.4%) |
Income Below Poverty Among Married-Couple vs Single-Parent Households in Dunn Loring
The poverty data for Dunn Loring shows that 5 of the married-couple family households (0.2%) and 90 of the single-parent households (36.0%) are living below the poverty level. Within the married-couple family households, those with 1 or 2 children have the highest poverty rate, with 5 households (0.5%) falling below the poverty line. Among the single-parent households, those with 3 or 4 children have the highest poverty rate, with 16 household (100.0%) living below poverty.
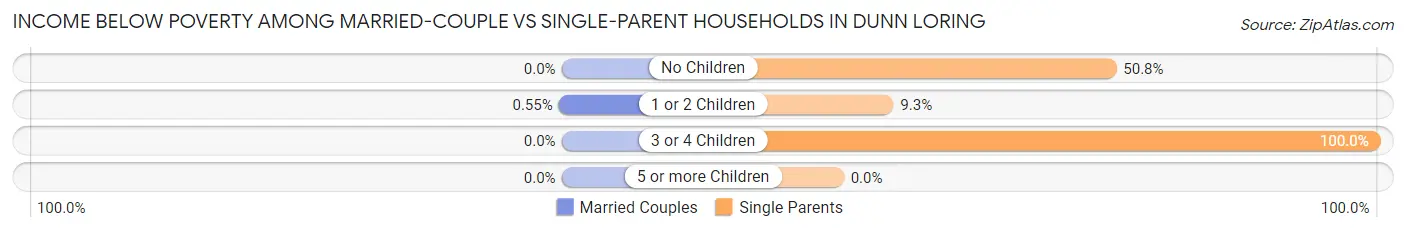
| Children | Married-Couple Families | Single-Parent Households |
| No Children | 0 (0.0%) | 64 (50.8%) |
| 1 or 2 Children | 5 (0.5%) | 10 (9.3%) |
| 3 or 4 Children | 0 (0.0%) | 16 (100.0%) |
| 5 or more Children | 0 (0.0%) | 0 (0.0%) |
| Total | 5 (0.2%) | 90 (36.0%) |
Race in Dunn Loring
The most populous races in Dunn Loring are White / Caucasian (5,840 | 67.1%), Asian (2,082 | 23.9%), and Hispanic or Latino (876 | 10.1%).
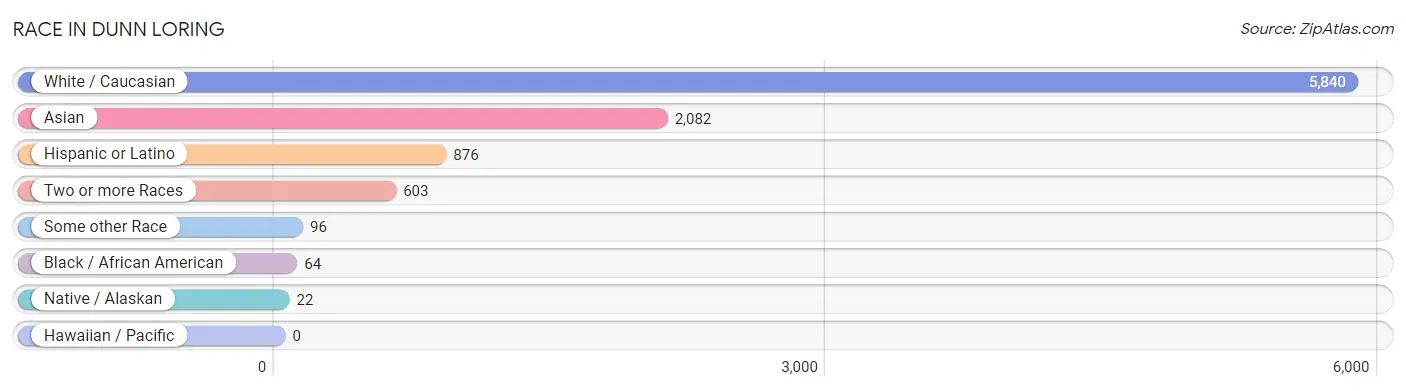
| Race | # Population | % Population |
| Asian | 2,082 | 23.9% |
| Black / African American | 64 | 0.7% |
| Hawaiian / Pacific | 0 | 0.0% |
| Hispanic or Latino | 876 | 10.1% |
| Native / Alaskan | 22 | 0.3% |
| White / Caucasian | 5,840 | 67.1% |
| Two or more Races | 603 | 6.9% |
| Some other Race | 96 | 1.1% |
| Total | 8,707 | 100.0% |
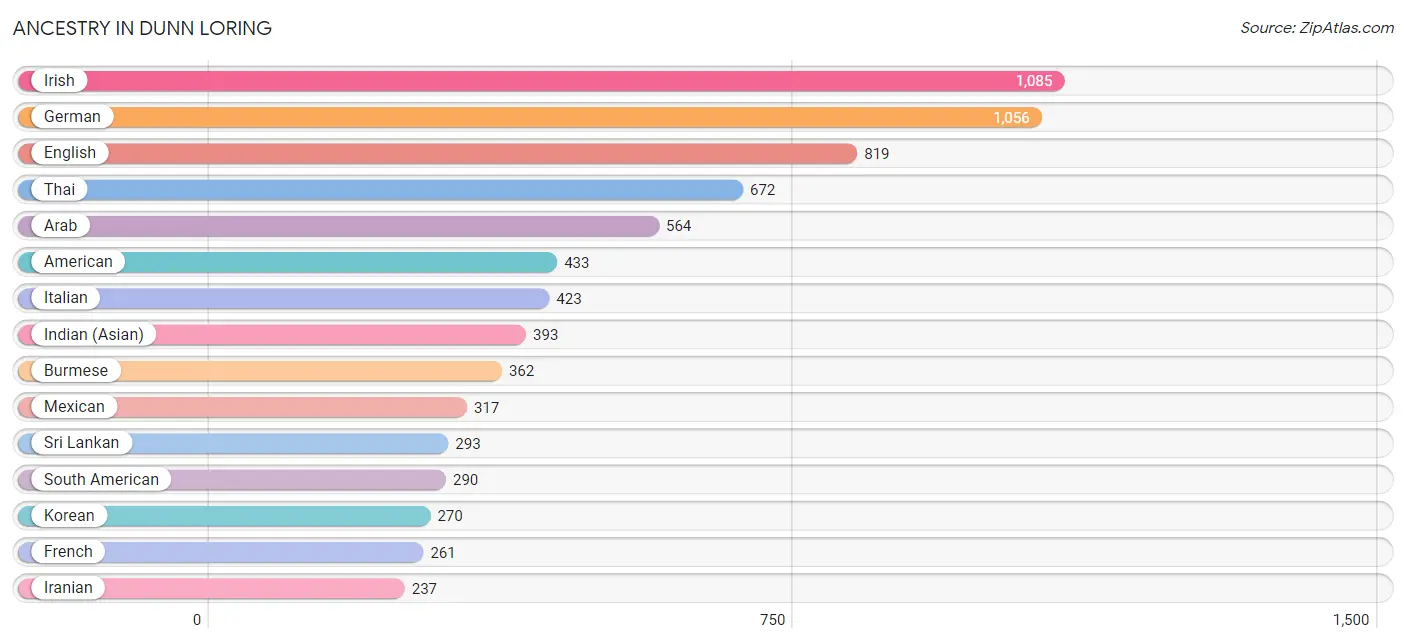
Ancestry in Dunn Loring
The most populous ancestries reported in Dunn Loring are Irish (1,085 | 12.5%), German (1,056 | 12.1%), English (819 | 9.4%), Thai (672 | 7.7%), and Arab (564 | 6.5%), together accounting for 48.2% of all Dunn Loring residents.
| Ancestry | # Population | % Population |
| Afghan | 22 | 0.3% |
| American | 433 | 5.0% |
| Arab | 564 | 6.5% |
| Armenian | 6 | 0.1% |
| Austrian | 75 | 0.9% |
| Bhutanese | 150 | 1.7% |
| Bolivian | 56 | 0.6% |
| British | 66 | 0.8% |
| Burmese | 362 | 4.2% |
| Cape Verdean | 18 | 0.2% |
| Celtic | 46 | 0.5% |
| Central American | 112 | 1.3% |
| Central American Indian | 9 | 0.1% |
| Cherokee | 24 | 0.3% |
| Chilean | 5 | 0.1% |
| Colombian | 131 | 1.5% |
| Croatian | 15 | 0.2% |
| Cuban | 15 | 0.2% |
| Czech | 20 | 0.2% |
| Danish | 7 | 0.1% |
| Dutch | 74 | 0.9% |
| Eastern European | 133 | 1.5% |
| Ecuadorian | 66 | 0.8% |
| Egyptian | 77 | 0.9% |
| English | 819 | 9.4% |
| European | 111 | 1.3% |
| Finnish | 41 | 0.5% |
| French | 261 | 3.0% |
| French Canadian | 55 | 0.6% |
| German | 1,056 | 12.1% |
| Greek | 11 | 0.1% |
| Honduran | 1 | 0.0% |
| Hungarian | 9 | 0.1% |
| Indian (Asian) | 393 | 4.5% |
| Iranian | 237 | 2.7% |
| Irish | 1,085 | 12.5% |
| Italian | 423 | 4.9% |
| Japanese | 34 | 0.4% |
| Korean | 270 | 3.1% |
| Latvian | 24 | 0.3% |
| Lebanese | 45 | 0.5% |
| Lithuanian | 53 | 0.6% |
| Mexican | 317 | 3.6% |
| Mongolian | 5 | 0.1% |
| Moroccan | 45 | 0.5% |
| Norwegian | 101 | 1.2% |
| Pakistani | 18 | 0.2% |
| Palestinian | 141 | 1.6% |
| Peruvian | 32 | 0.4% |
| Polish | 140 | 1.6% |
| Portuguese | 134 | 1.5% |
| Puerto Rican | 57 | 0.6% |
| Romanian | 11 | 0.1% |
| Russian | 67 | 0.8% |
| Salvadoran | 111 | 1.3% |
| Scandinavian | 34 | 0.4% |
| Scotch-Irish | 129 | 1.5% |
| Scottish | 149 | 1.7% |
| Slavic | 39 | 0.4% |
| Slovak | 8 | 0.1% |
| Slovene | 5 | 0.1% |
| South American | 290 | 3.3% |
| Sri Lankan | 293 | 3.4% |
| Subsaharan African | 18 | 0.2% |
| Swedish | 56 | 0.6% |
| Swiss | 110 | 1.3% |
| Syrian | 23 | 0.3% |
| Thai | 672 | 7.7% |
| Turkish | 105 | 1.2% |
| Ukrainian | 8 | 0.1% |
| Welsh | 41 | 0.5% | View All 71 Rows |
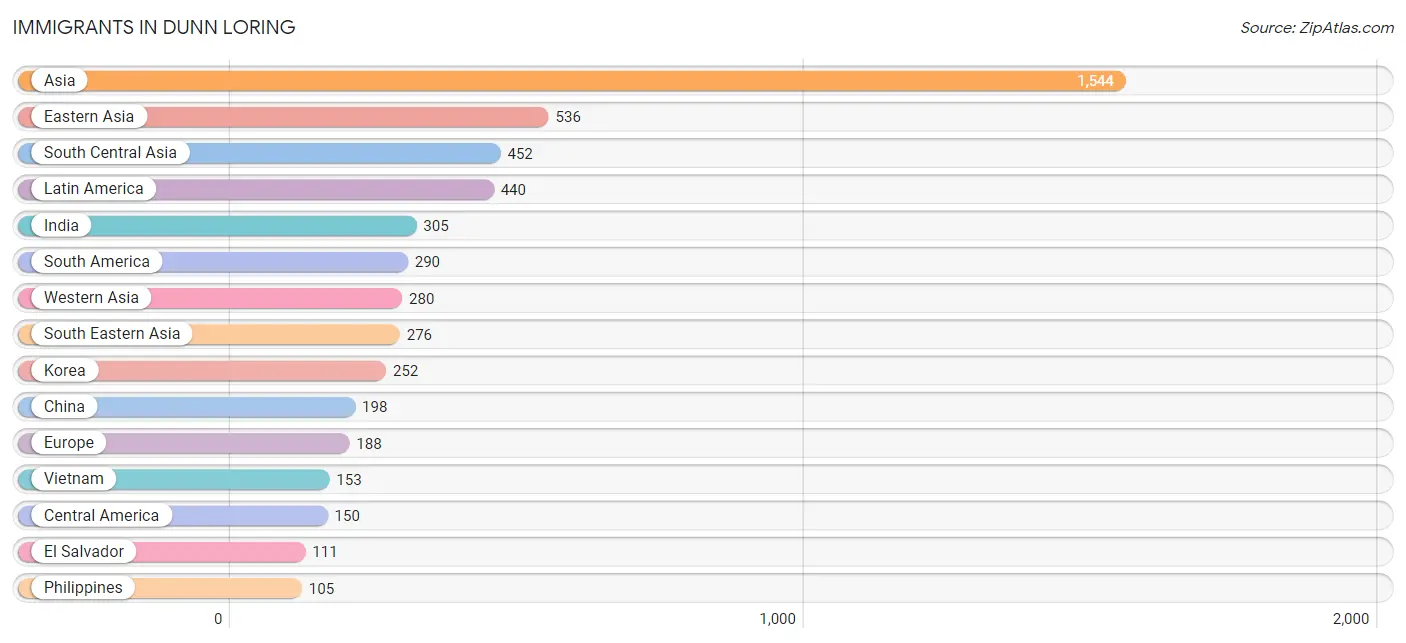
Immigrants in Dunn Loring
The most numerous immigrant groups reported in Dunn Loring came from Asia (1,544 | 17.7%), Eastern Asia (536 | 6.2%), South Central Asia (452 | 5.2%), Latin America (440 | 5.1%), and India (305 | 3.5%), together accounting for 37.6% of all Dunn Loring residents.
| Immigration Origin | # Population | % Population |
| Afghanistan | 38 | 0.4% |
| Africa | 58 | 0.7% |
| Argentina | 16 | 0.2% |
| Asia | 1,544 | 17.7% |
| Australia | 7 | 0.1% |
| Belarus | 19 | 0.2% |
| Bolivia | 67 | 0.8% |
| Brazil | 34 | 0.4% |
| Canada | 31 | 0.4% |
| Central America | 150 | 1.7% |
| China | 198 | 2.3% |
| Colombia | 41 | 0.5% |
| Eastern Asia | 536 | 6.2% |
| Eastern Europe | 59 | 0.7% |
| Ecuador | 60 | 0.7% |
| Egypt | 35 | 0.4% |
| El Salvador | 111 | 1.3% |
| England | 12 | 0.1% |
| Europe | 188 | 2.2% |
| Germany | 46 | 0.5% |
| India | 305 | 3.5% |
| Iran | 63 | 0.7% |
| Ireland | 6 | 0.1% |
| Japan | 86 | 1.0% |
| Jordan | 39 | 0.4% |
| Korea | 252 | 2.9% |
| Latin America | 440 | 5.1% |
| Latvia | 6 | 0.1% |
| Lebanon | 34 | 0.4% |
| Mexico | 39 | 0.4% |
| Morocco | 17 | 0.2% |
| Netherlands | 7 | 0.1% |
| Northern Africa | 52 | 0.6% |
| Northern Europe | 26 | 0.3% |
| Oceania | 7 | 0.1% |
| Pakistan | 20 | 0.2% |
| Peru | 36 | 0.4% |
| Philippines | 105 | 1.2% |
| Poland | 4 | 0.1% |
| Portugal | 50 | 0.6% |
| Russia | 22 | 0.3% |
| Saudi Arabia | 69 | 0.8% |
| South Africa | 6 | 0.1% |
| South America | 290 | 3.3% |
| South Central Asia | 452 | 5.2% |
| South Eastern Asia | 276 | 3.2% |
| Southern Europe | 50 | 0.6% |
| Sri Lanka | 9 | 0.1% |
| Syria | 68 | 0.8% |
| Taiwan | 51 | 0.6% |
| Thailand | 18 | 0.2% |
| Turkey | 70 | 0.8% |
| Ukraine | 8 | 0.1% |
| Venezuela | 5 | 0.1% |
| Vietnam | 153 | 1.8% |
| Western Asia | 280 | 3.2% |
| Western Europe | 53 | 0.6% | View All 57 Rows |
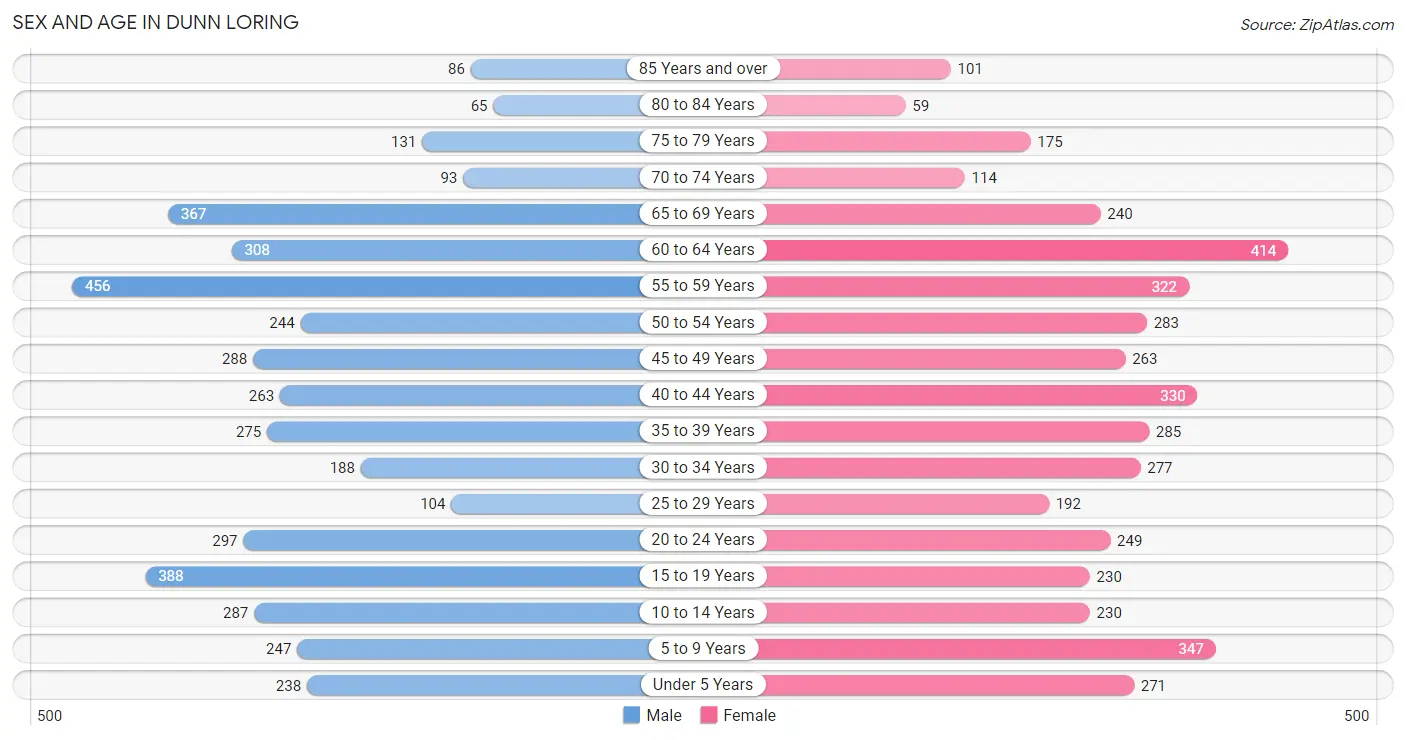
Sex and Age in Dunn Loring
Sex and Age in Dunn Loring
The most populous age groups in Dunn Loring are 55 to 59 Years (456 | 10.5%) for men and 60 to 64 Years (414 | 9.5%) for women.
| Age Bracket | Male | Female |
| Under 5 Years | 238 (5.5%) | 271 (6.2%) |
| 5 to 9 Years | 247 (5.7%) | 347 (7.9%) |
| 10 to 14 Years | 287 (6.6%) | 230 (5.2%) |
| 15 to 19 Years | 388 (9.0%) | 230 (5.2%) |
| 20 to 24 Years | 297 (6.9%) | 249 (5.7%) |
| 25 to 29 Years | 104 (2.4%) | 192 (4.4%) |
| 30 to 34 Years | 188 (4.3%) | 277 (6.3%) |
| 35 to 39 Years | 275 (6.4%) | 285 (6.5%) |
| 40 to 44 Years | 263 (6.1%) | 330 (7.5%) |
| 45 to 49 Years | 288 (6.7%) | 263 (6.0%) |
| 50 to 54 Years | 244 (5.6%) | 283 (6.5%) |
| 55 to 59 Years | 456 (10.5%) | 322 (7.3%) |
| 60 to 64 Years | 308 (7.1%) | 414 (9.5%) |
| 65 to 69 Years | 367 (8.5%) | 240 (5.5%) |
| 70 to 74 Years | 93 (2.1%) | 114 (2.6%) |
| 75 to 79 Years | 131 (3.0%) | 175 (4.0%) |
| 80 to 84 Years | 65 (1.5%) | 59 (1.3%) |
| 85 Years and over | 86 (2.0%) | 101 (2.3%) |
| Total | 4,325 (100.0%) | 4,382 (100.0%) |
Families and Households in Dunn Loring
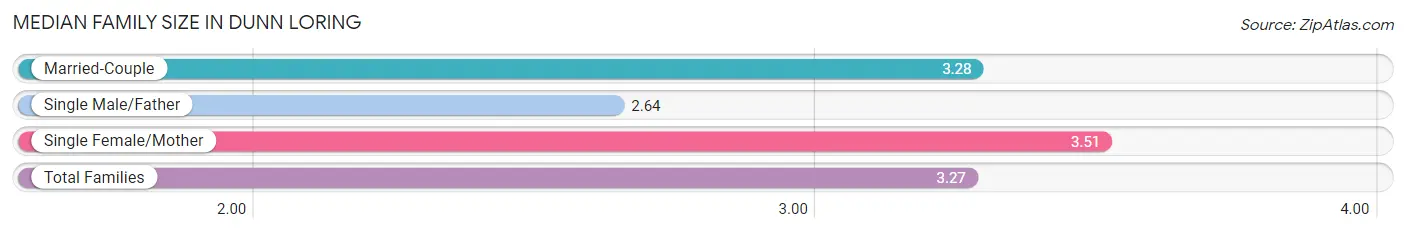
Median Family Size in Dunn Loring
The median family size in Dunn Loring is 3.27 persons per family, with single female/mother families (172 | 7.2%) accounting for the largest median family size of 3.51 persons per family. On the other hand, single male/father families (78 | 3.3%) represent the smallest median family size with 2.64 persons per family.
| Family Type | # Families | Family Size |
| Married-Couple | 2,128 (89.5%) | 3.28 |
| Single Male/Father | 78 (3.3%) | 2.64 |
| Single Female/Mother | 172 (7.2%) | 3.51 |
| Total Families | 2,378 (100.0%) | 3.27 |
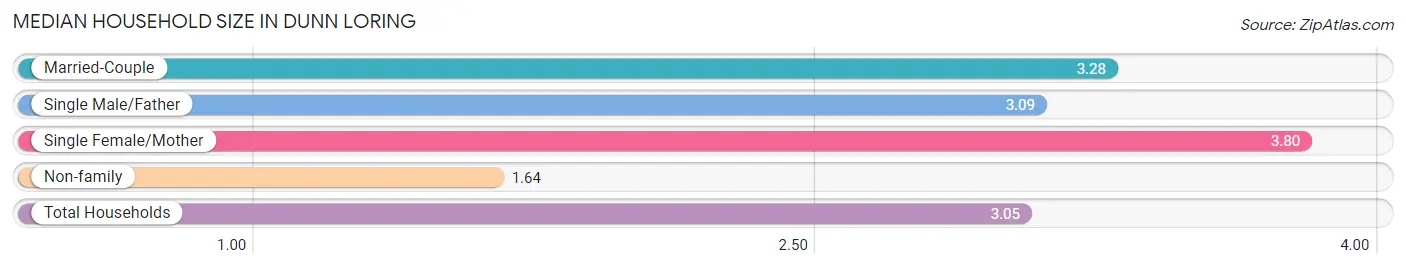
Median Household Size in Dunn Loring
The median household size in Dunn Loring is 3.05 persons per household, with single female/mother households (172 | 6.1%) accounting for the largest median household size of 3.8 persons per household. non-family households (428 | 15.2%) represent the smallest median household size with 1.64 persons per household.
| Household Type | # Households | Household Size |
| Married-Couple | 2,128 (75.8%) | 3.28 |
| Single Male/Father | 78 (2.8%) | 3.09 |
| Single Female/Mother | 172 (6.1%) | 3.80 |
| Non-family | 428 (15.2%) | 1.64 |
| Total Households | 2,806 (100.0%) | 3.05 |
Household Size by Marriage Status in Dunn Loring
Out of a total of 2,806 households in Dunn Loring, 2,378 (84.8%) are family households, while 428 (15.2%) are nonfamily households. The most numerous type of family households are 2-person households, comprising 864, and the most common type of nonfamily households are 1-person households, comprising 308.
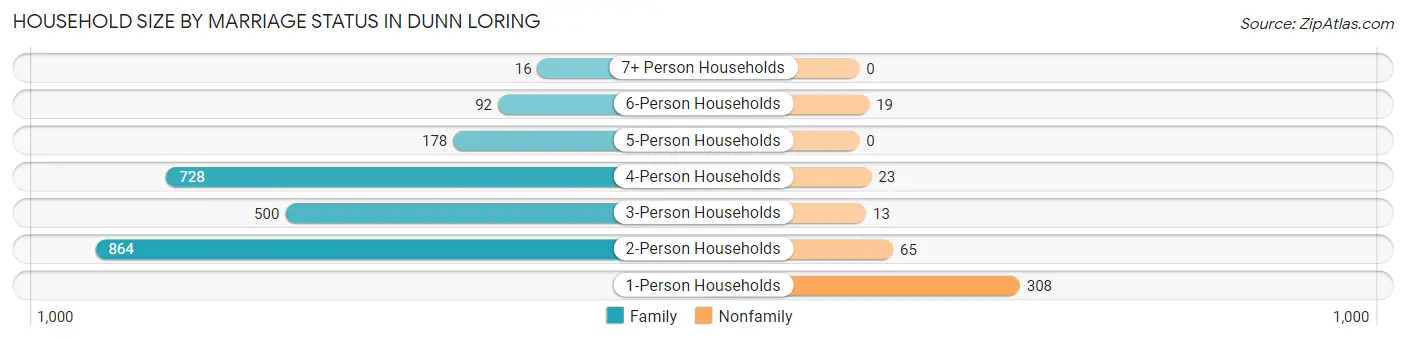
| Household Size | Family Households | Nonfamily Households |
| 1-Person Households | - | 308 (11.0%) |
| 2-Person Households | 864 (30.8%) | 65 (2.3%) |
| 3-Person Households | 500 (17.8%) | 13 (0.5%) |
| 4-Person Households | 728 (25.9%) | 23 (0.8%) |
| 5-Person Households | 178 (6.3%) | 0 (0.0%) |
| 6-Person Households | 92 (3.3%) | 19 (0.7%) |
| 7+ Person Households | 16 (0.6%) | 0 (0.0%) |
| Total | 2,378 (84.8%) | 428 (15.2%) |
Female Fertility in Dunn Loring
Fertility by Age in Dunn Loring
Average fertility rate in Dunn Loring is 72.0 births per 1,000 women. Women in the age bracket of 20 to 34 years have the highest fertility rate with 130.0 births per 1,000 women. Women in the age bracket of 20 to 34 years acount for 69.4% of all women with births.
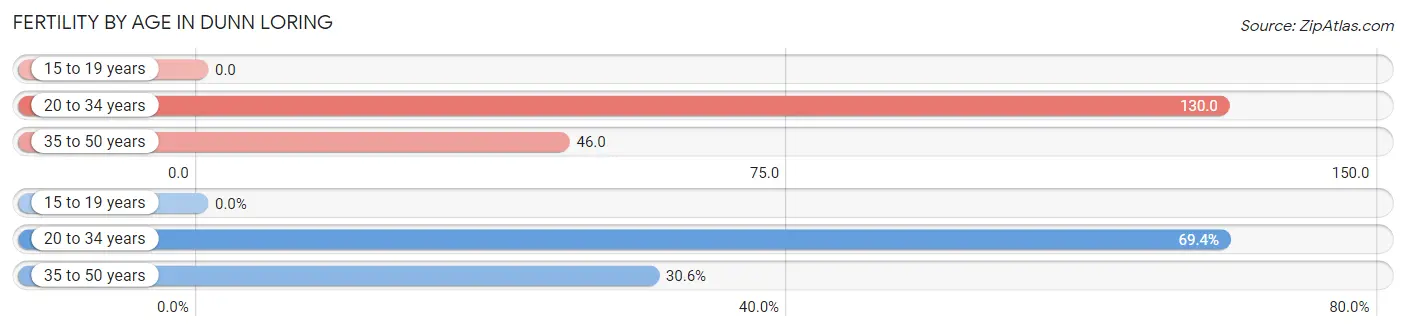
| Age Bracket | Women with Births | Births / 1,000 Women |
| 15 to 19 years | 0 (0.0%) | 0.0 |
| 20 to 34 years | 93 (69.4%) | 130.0 |
| 35 to 50 years | 41 (30.6%) | 46.0 |
| Total | 134 (100.0%) | 72.0 |
Fertility by Age by Marriage Status in Dunn Loring
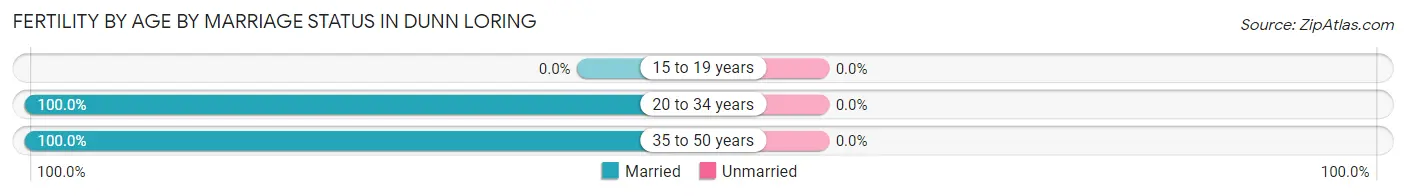
| Age Bracket | Married | Unmarried |
| 15 to 19 years | 0 (0.0%) | 0 (0.0%) |
| 20 to 34 years | 93 (100.0%) | 0 (0.0%) |
| 35 to 50 years | 41 (100.0%) | 0 (0.0%) |
| Total | 134 (100.0%) | 0 (0.0%) |
Fertility by Education in Dunn Loring
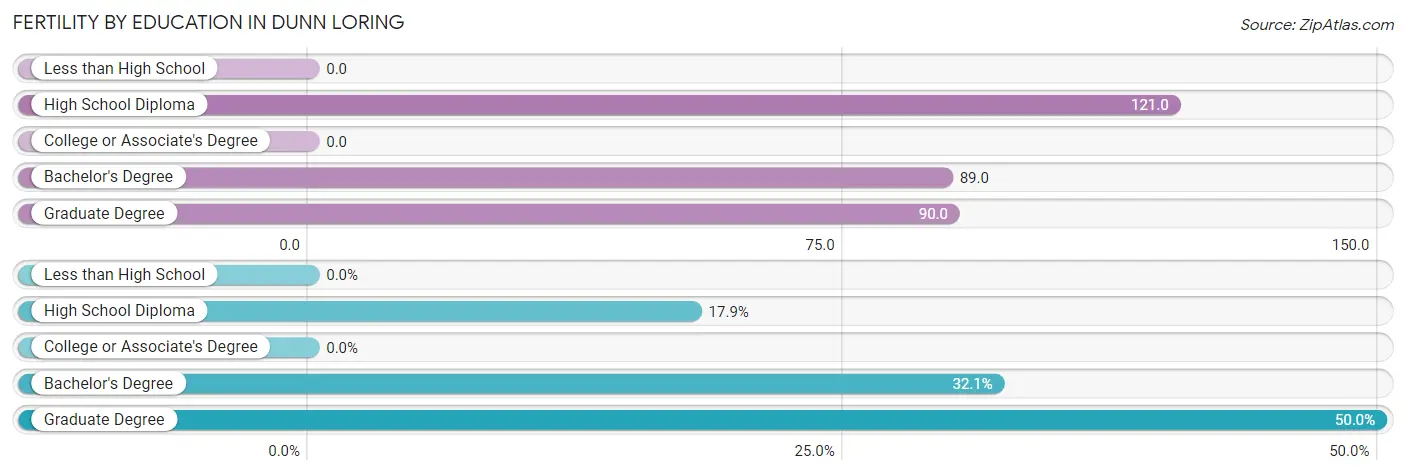
| Educational Attainment | Women with Births | Births / 1,000 Women |
| Less than High School | 0 (0.0%) | 0.0 |
| High School Diploma | 24 (17.9%) | 121.0 |
| College or Associate's Degree | 0 (0.0%) | 0.0 |
| Bachelor's Degree | 43 (32.1%) | 89.0 |
| Graduate Degree | 67 (50.0%) | 90.0 |
| Total | 134 (100.0%) | 72.0 |
Fertility by Education by Marriage Status in Dunn Loring
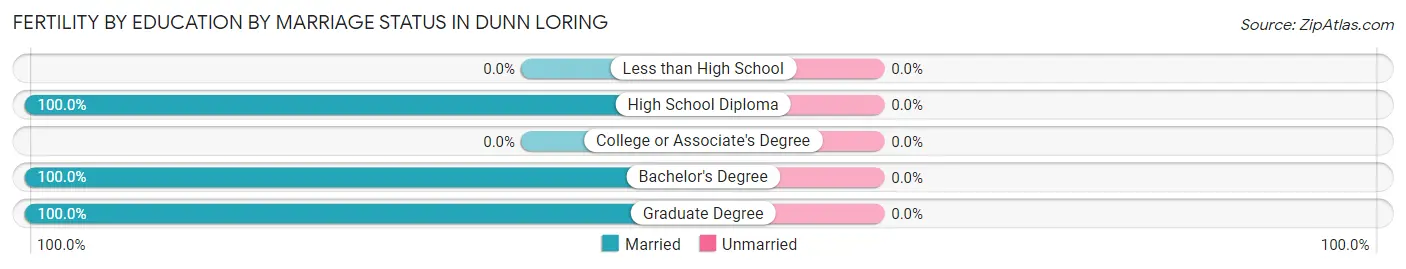
| Educational Attainment | Married | Unmarried |
| Less than High School | 0 (0.0%) | 0 (0.0%) |
| High School Diploma | 24 (100.0%) | 0 (0.0%) |
| College or Associate's Degree | 0 (0.0%) | 0 (0.0%) |
| Bachelor's Degree | 43 (100.0%) | 0 (0.0%) |
| Graduate Degree | 67 (100.0%) | 0 (0.0%) |
| Total | 134 (100.0%) | 0 (0.0%) |
Employment Characteristics in Dunn Loring
Employment by Class of Employer in Dunn Loring
Among the 4,456 employed individuals in Dunn Loring, private company employees (2,885 | 64.7%), federal government employees (541 | 12.1%), and not-for-profit organizations (485 | 10.9%) make up the most common classes of employment.
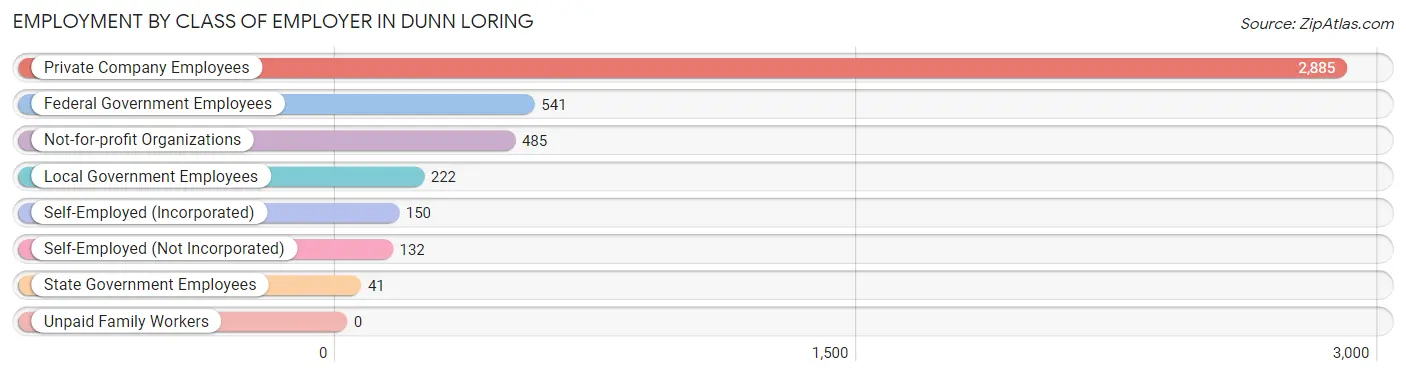
| Employer Class | # Employees | % Employees |
| Private Company Employees | 2,885 | 64.7% |
| Self-Employed (Incorporated) | 150 | 3.4% |
| Self-Employed (Not Incorporated) | 132 | 3.0% |
| Not-for-profit Organizations | 485 | 10.9% |
| Local Government Employees | 222 | 5.0% |
| State Government Employees | 41 | 0.9% |
| Federal Government Employees | 541 | 12.1% |
| Unpaid Family Workers | 0 | 0.0% |
| Total | 4,456 | 100.0% |
Employment Status by Age in Dunn Loring
According to the labor force statistics for Dunn Loring, out of the total population over 16 years of age (6,917), 67.8% or 4,690 individuals are in the labor force, with 3.8% or 178 of them unemployed. The age group with the highest labor force participation rate is 45 to 54 years, with 91.7% or 989 individuals in the labor force. Within the labor force, the 20 to 24 years age range has the highest percentage of unemployed individuals, with 13.5% or 60 of them being unemployed.
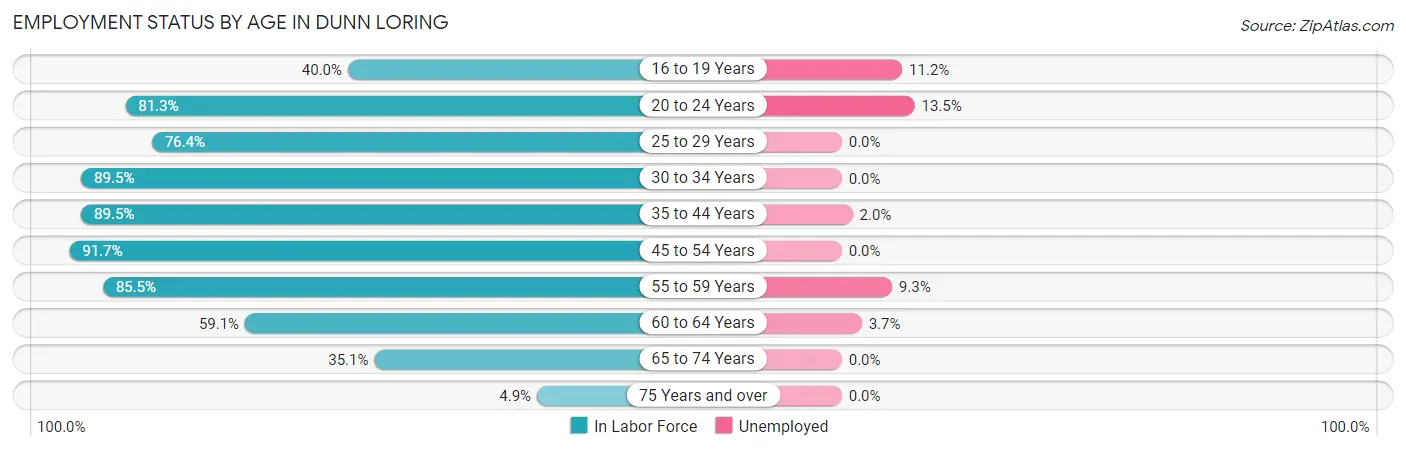
| Age Bracket | In Labor Force | Unemployed |
| 16 to 19 Years | 179 (40.0%) | 20 (11.2%) |
| 20 to 24 Years | 444 (81.3%) | 60 (13.5%) |
| 25 to 29 Years | 226 (76.4%) | 0 (0.0%) |
| 30 to 34 Years | 416 (89.5%) | 0 (0.0%) |
| 35 to 44 Years | 1,032 (89.5%) | 21 (2.0%) |
| 45 to 54 Years | 989 (91.7%) | 0 (0.0%) |
| 55 to 59 Years | 665 (85.5%) | 62 (9.3%) |
| 60 to 64 Years | 427 (59.1%) | 16 (3.7%) |
| 65 to 74 Years | 286 (35.1%) | 0 (0.0%) |
| 75 Years and over | 30 (4.9%) | 0 (0.0%) |
| Total | 4,690 (67.8%) | 178 (3.8%) |
Employment Status by Educational Attainment in Dunn Loring
According to labor force statistics for Dunn Loring, 83.6% of individuals (3,755) out of the total population between 25 and 64 years of age (4,492) are in the labor force, with 2.6% or 98 of them being unemployed. The group with the highest labor force participation rate are those with the educational attainment of high school diploma, with 86.9% or 173 individuals in the labor force. Within the labor force, individuals with less than high school education have the highest percentage of unemployment, with 81.0% or 68 of them being unemployed.
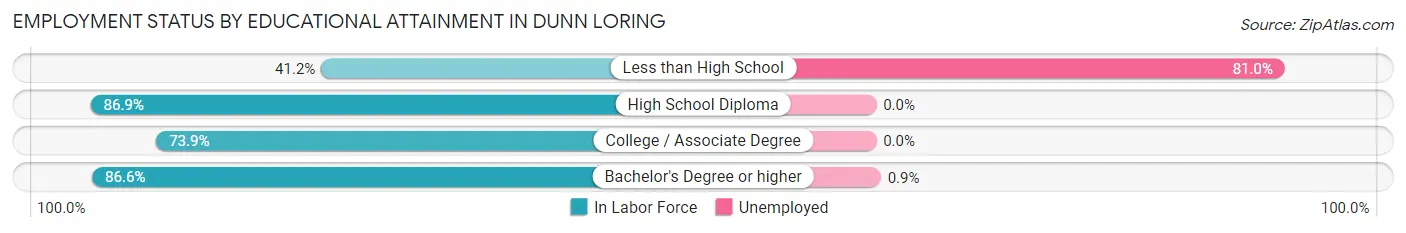
| Educational Attainment | In Labor Force | Unemployed |
| Less than High School | 84 (41.2%) | 165 (81.0%) |
| High School Diploma | 173 (86.9%) | 0 (0.0%) |
| College / Associate Degree | 252 (73.9%) | 0 (0.0%) |
| Bachelor's Degree or higher | 3,246 (86.6%) | 34 (0.9%) |
| Total | 3,755 (83.6%) | 117 (2.6%) |
Employment Occupations by Sex in Dunn Loring
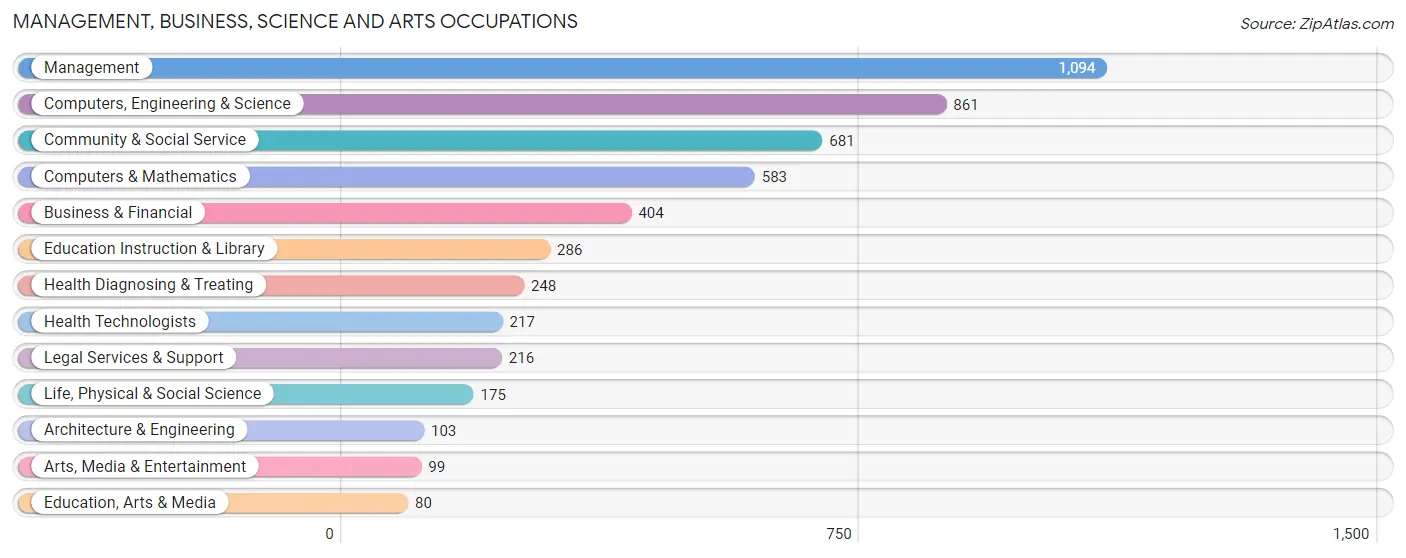
Management, Business, Science and Arts Occupations
The most common Management, Business, Science and Arts occupations in Dunn Loring are Management (1,094 | 24.3%), Computers, Engineering & Science (861 | 19.1%), Community & Social Service (681 | 15.1%), Computers & Mathematics (583 | 12.9%), and Business & Financial (404 | 9.0%).
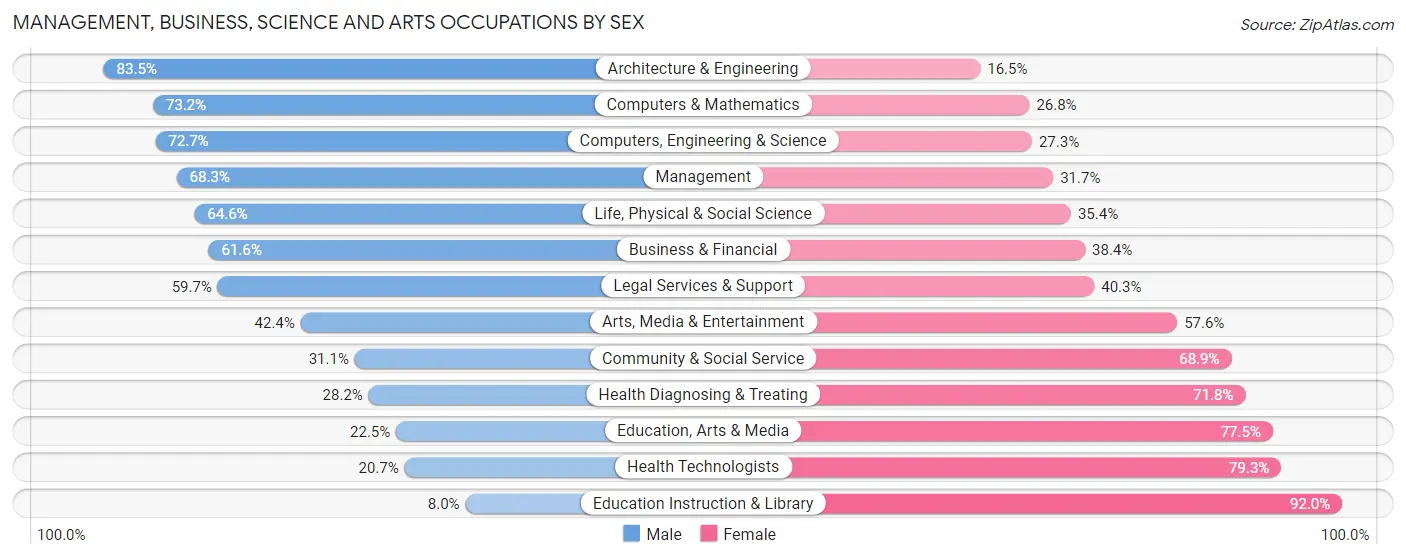
Management, Business, Science and Arts Occupations by Sex
Within the Management, Business, Science and Arts occupations in Dunn Loring, the most male-oriented occupations are Architecture & Engineering (83.5%), Computers & Mathematics (73.2%), and Computers, Engineering & Science (72.7%), while the most female-oriented occupations are Education Instruction & Library (92.0%), Health Technologists (79.3%), and Education, Arts & Media (77.5%).
| Occupation | Male | Female |
| Management | 747 (68.3%) | 347 (31.7%) |
| Business & Financial | 249 (61.6%) | 155 (38.4%) |
| Computers, Engineering & Science | 626 (72.7%) | 235 (27.3%) |
| Computers & Mathematics | 427 (73.2%) | 156 (26.8%) |
| Architecture & Engineering | 86 (83.5%) | 17 (16.5%) |
| Life, Physical & Social Science | 113 (64.6%) | 62 (35.4%) |
| Community & Social Service | 212 (31.1%) | 469 (68.9%) |
| Education, Arts & Media | 18 (22.5%) | 62 (77.5%) |
| Legal Services & Support | 129 (59.7%) | 87 (40.3%) |
| Education Instruction & Library | 23 (8.0%) | 263 (92.0%) |
| Arts, Media & Entertainment | 42 (42.4%) | 57 (57.6%) |
| Health Diagnosing & Treating | 70 (28.2%) | 178 (71.8%) |
| Health Technologists | 45 (20.7%) | 172 (79.3%) |
| Total (Category) | 1,904 (57.9%) | 1,384 (42.1%) |
| Total (Overall) | 2,494 (55.3%) | 2,012 (44.7%) |
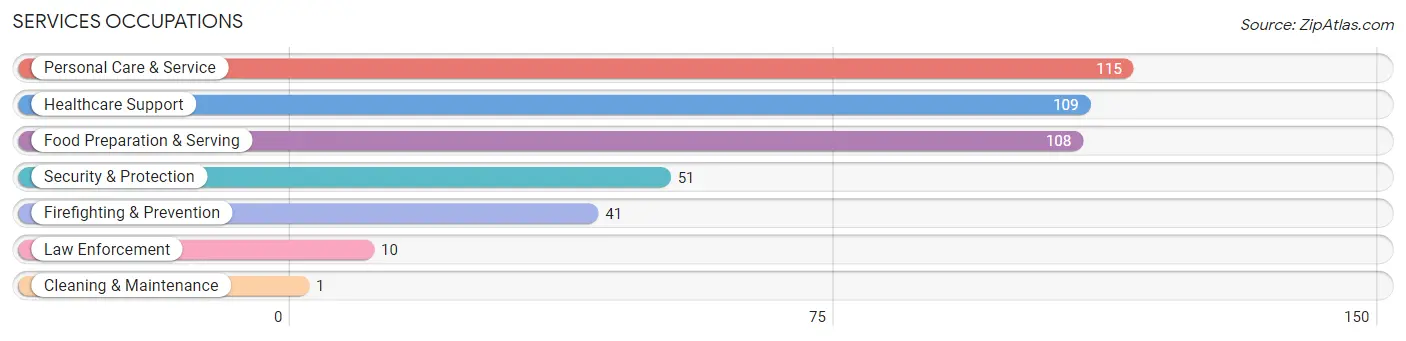
Services Occupations
The most common Services occupations in Dunn Loring are Personal Care & Service (115 | 2.5%), Healthcare Support (109 | 2.4%), Food Preparation & Serving (108 | 2.4%), Security & Protection (51 | 1.1%), and Firefighting & Prevention (41 | 0.9%).
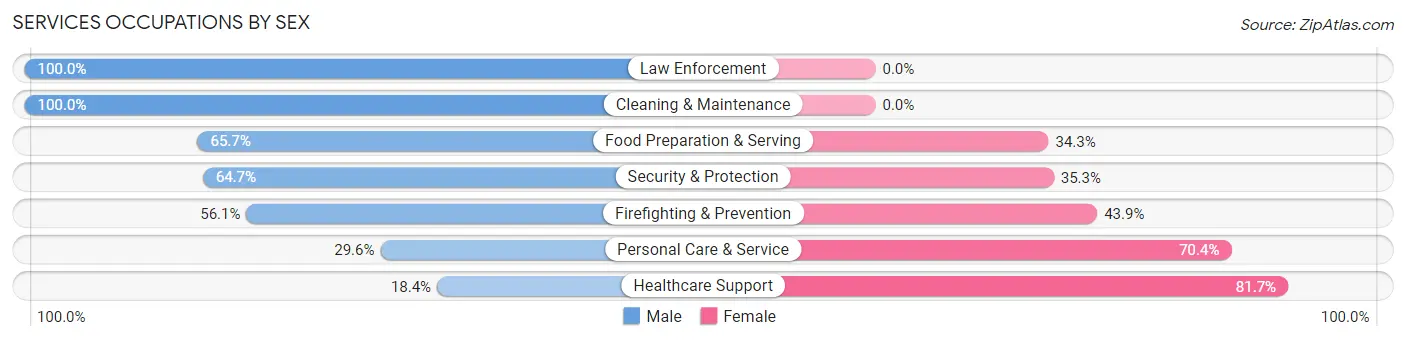
Services Occupations by Sex
Within the Services occupations in Dunn Loring, the most male-oriented occupations are Law Enforcement (100.0%), Cleaning & Maintenance (100.0%), and Food Preparation & Serving (65.7%), while the most female-oriented occupations are Healthcare Support (81.7%), Personal Care & Service (70.4%), and Firefighting & Prevention (43.9%).
| Occupation | Male | Female |
| Healthcare Support | 20 (18.3%) | 89 (81.7%) |
| Security & Protection | 33 (64.7%) | 18 (35.3%) |
| Firefighting & Prevention | 23 (56.1%) | 18 (43.9%) |
| Law Enforcement | 10 (100.0%) | 0 (0.0%) |
| Food Preparation & Serving | 71 (65.7%) | 37 (34.3%) |
| Cleaning & Maintenance | 1 (100.0%) | 0 (0.0%) |
| Personal Care & Service | 34 (29.6%) | 81 (70.4%) |
| Total (Category) | 159 (41.4%) | 225 (58.6%) |
| Total (Overall) | 2,494 (55.3%) | 2,012 (44.7%) |
Sales and Office Occupations
The most common Sales and Office occupations in Dunn Loring are Sales & Related (388 | 8.6%), and Office & Administration (238 | 5.3%).
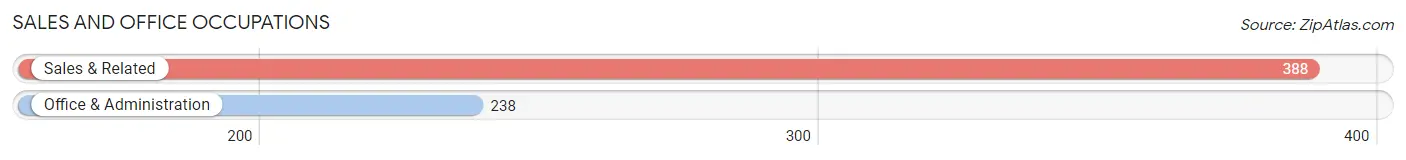
Sales and Office Occupations by Sex
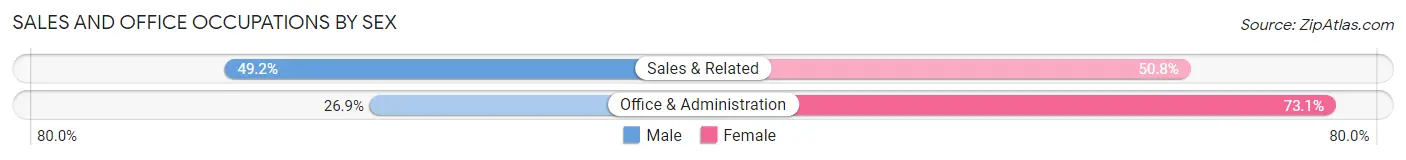
| Occupation | Male | Female |
| Sales & Related | 191 (49.2%) | 197 (50.8%) |
| Office & Administration | 64 (26.9%) | 174 (73.1%) |
| Total (Category) | 255 (40.7%) | 371 (59.3%) |
| Total (Overall) | 2,494 (55.3%) | 2,012 (44.7%) |
Natural Resources, Construction and Maintenance Occupations
The most common Natural Resources, Construction and Maintenance occupations in Dunn Loring are Installation, Maintenance & Repair (44 | 1.0%), and Construction & Extraction (35 | 0.8%).
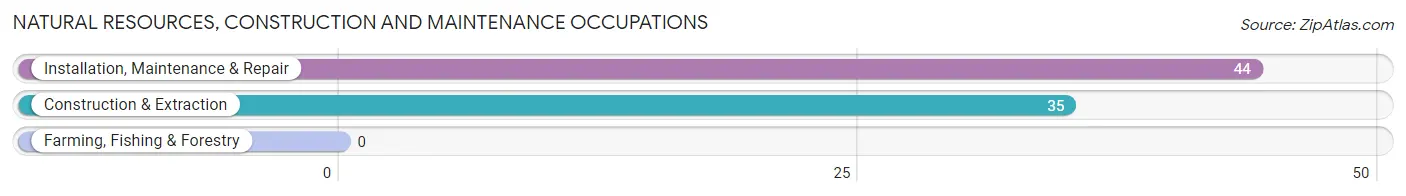
Natural Resources, Construction and Maintenance Occupations by Sex
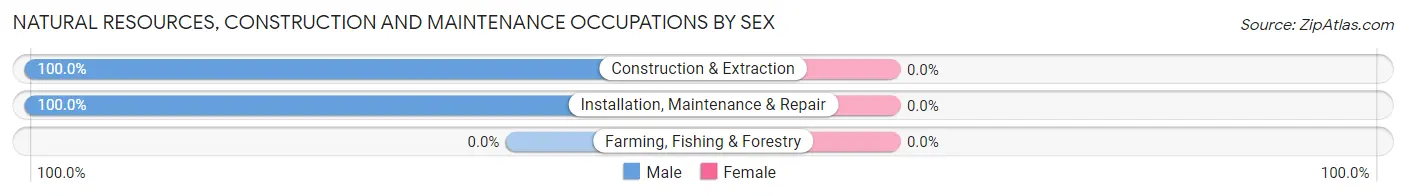
| Occupation | Male | Female |
| Farming, Fishing & Forestry | 0 (0.0%) | 0 (0.0%) |
| Construction & Extraction | 35 (100.0%) | 0 (0.0%) |
| Installation, Maintenance & Repair | 44 (100.0%) | 0 (0.0%) |
| Total (Category) | 79 (100.0%) | 0 (0.0%) |
| Total (Overall) | 2,494 (55.3%) | 2,012 (44.7%) |
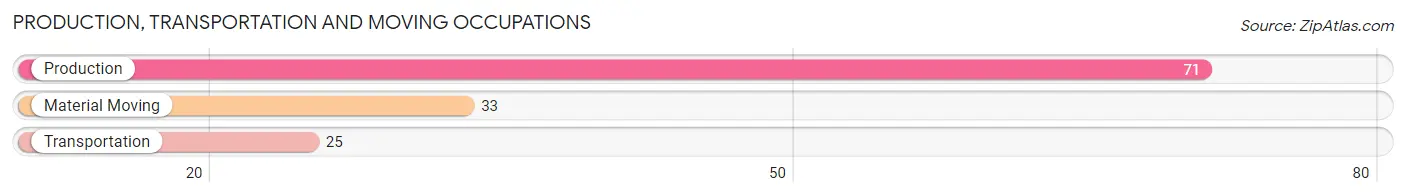
Production, Transportation and Moving Occupations
The most common Production, Transportation and Moving occupations in Dunn Loring are Production (71 | 1.6%), Material Moving (33 | 0.7%), and Transportation (25 | 0.5%).
Production, Transportation and Moving Occupations by Sex
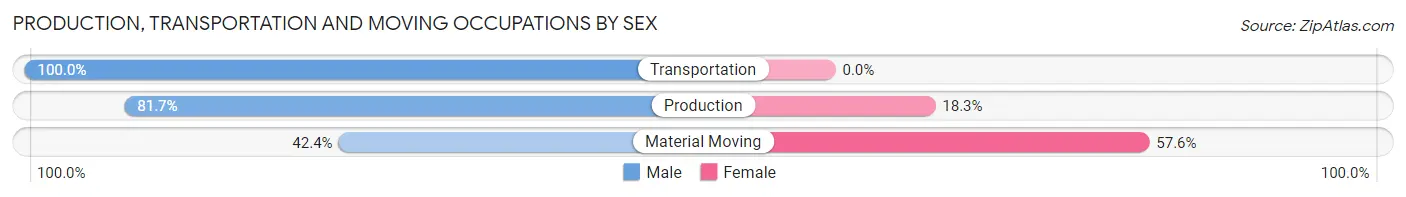
| Occupation | Male | Female |
| Production | 58 (81.7%) | 13 (18.3%) |
| Transportation | 25 (100.0%) | 0 (0.0%) |
| Material Moving | 14 (42.4%) | 19 (57.6%) |
| Total (Category) | 97 (75.2%) | 32 (24.8%) |
| Total (Overall) | 2,494 (55.3%) | 2,012 (44.7%) |
Employment Industries by Sex in Dunn Loring
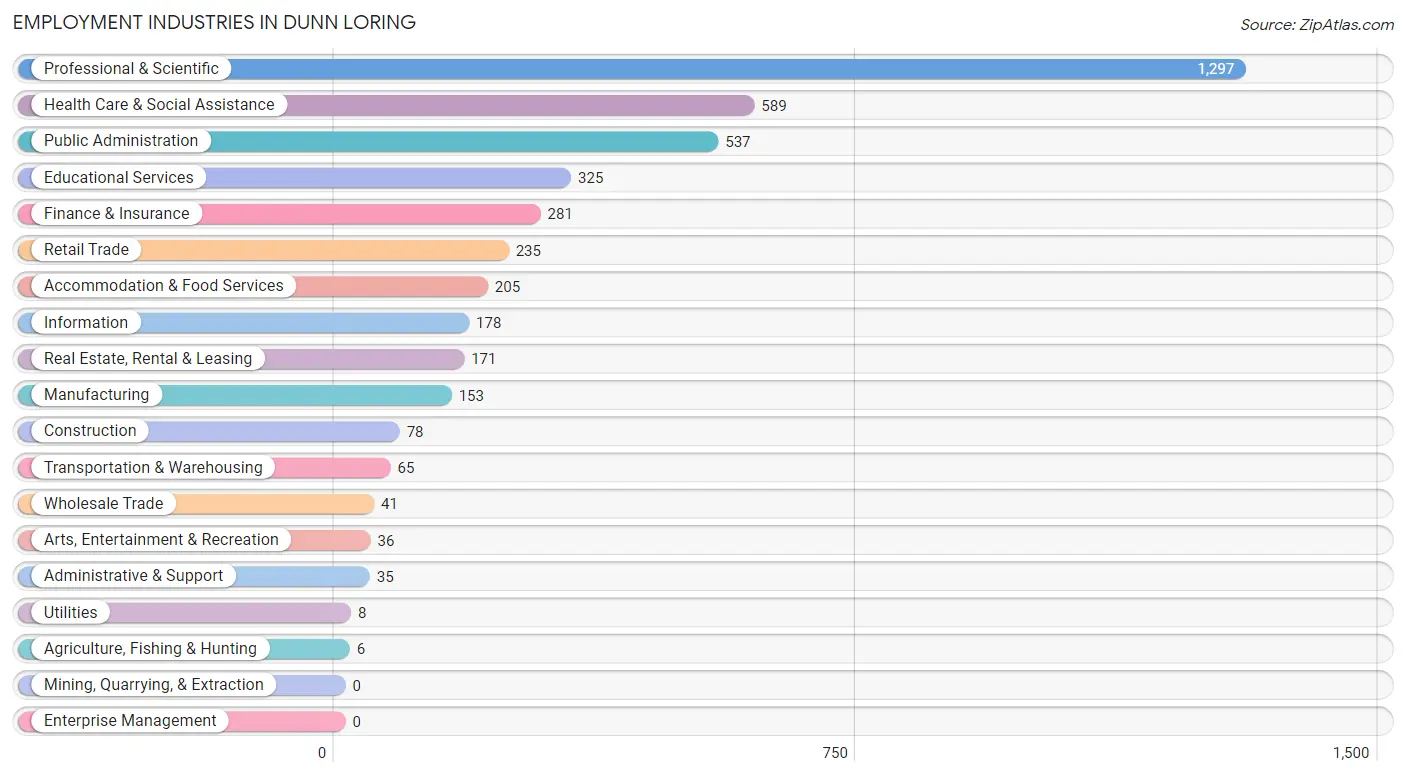
Employment Industries in Dunn Loring
The major employment industries in Dunn Loring include Professional & Scientific (1,297 | 28.8%), Health Care & Social Assistance (589 | 13.1%), Public Administration (537 | 11.9%), Educational Services (325 | 7.2%), and Finance & Insurance (281 | 6.2%).
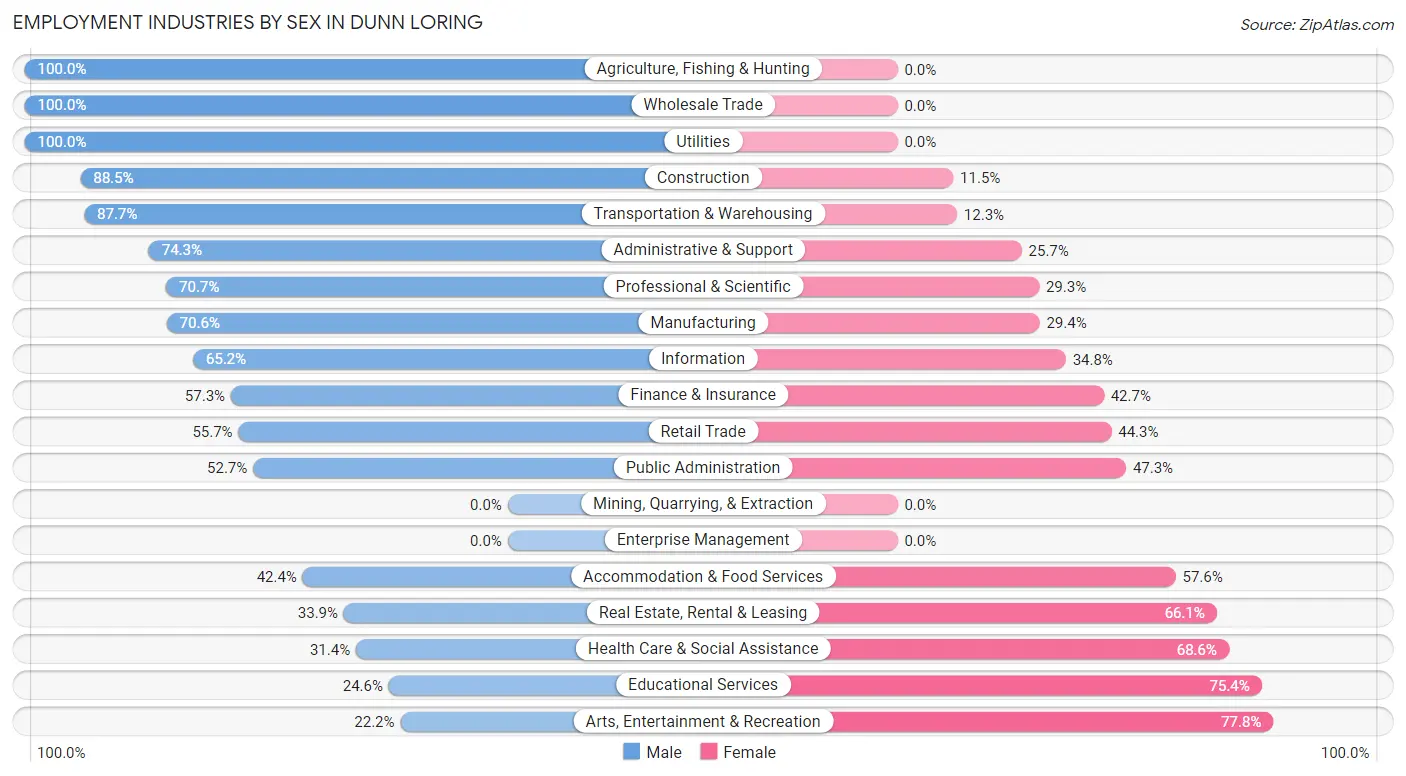
Employment Industries by Sex in Dunn Loring
The Dunn Loring industries that see more men than women are Agriculture, Fishing & Hunting (100.0%), Wholesale Trade (100.0%), and Utilities (100.0%), whereas the industries that tend to have a higher number of women are Arts, Entertainment & Recreation (77.8%), Educational Services (75.4%), and Health Care & Social Assistance (68.6%).
| Industry | Male | Female |
| Agriculture, Fishing & Hunting | 6 (100.0%) | 0 (0.0%) |
| Mining, Quarrying, & Extraction | 0 (0.0%) | 0 (0.0%) |
| Construction | 69 (88.5%) | 9 (11.5%) |
| Manufacturing | 108 (70.6%) | 45 (29.4%) |
| Wholesale Trade | 41 (100.0%) | 0 (0.0%) |
| Retail Trade | 131 (55.7%) | 104 (44.3%) |
| Transportation & Warehousing | 57 (87.7%) | 8 (12.3%) |
| Utilities | 8 (100.0%) | 0 (0.0%) |
| Information | 116 (65.2%) | 62 (34.8%) |
| Finance & Insurance | 161 (57.3%) | 120 (42.7%) |
| Real Estate, Rental & Leasing | 58 (33.9%) | 113 (66.1%) |
| Professional & Scientific | 917 (70.7%) | 380 (29.3%) |
| Enterprise Management | 0 (0.0%) | 0 (0.0%) |
| Administrative & Support | 26 (74.3%) | 9 (25.7%) |
| Educational Services | 80 (24.6%) | 245 (75.4%) |
| Health Care & Social Assistance | 185 (31.4%) | 404 (68.6%) |
| Arts, Entertainment & Recreation | 8 (22.2%) | 28 (77.8%) |
| Accommodation & Food Services | 87 (42.4%) | 118 (57.6%) |
| Public Administration | 283 (52.7%) | 254 (47.3%) |
| Total | 2,494 (55.3%) | 2,012 (44.7%) |
Education in Dunn Loring
School Enrollment in Dunn Loring
The most common levels of schooling among the 2,355 students in Dunn Loring are high school (684 | 29.0%), elementary school (580 | 24.6%), and middle school (446 | 18.9%).
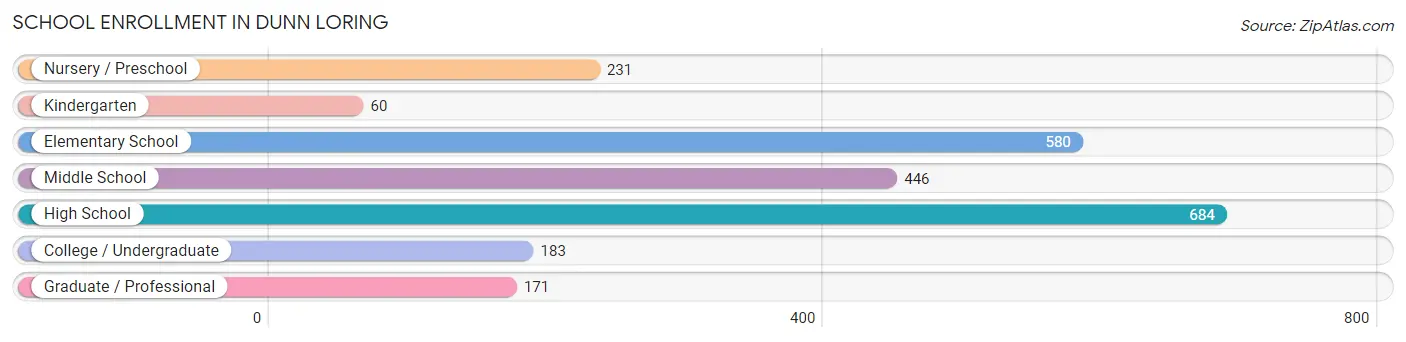
| School Level | # Students | % Students |
| Nursery / Preschool | 231 | 9.8% |
| Kindergarten | 60 | 2.5% |
| Elementary School | 580 | 24.6% |
| Middle School | 446 | 18.9% |
| High School | 684 | 29.0% |
| College / Undergraduate | 183 | 7.8% |
| Graduate / Professional | 171 | 7.3% |
| Total | 2,355 | 100.0% |
School Enrollment by Age by Funding Source in Dunn Loring
Out of a total of 2,355 students who are enrolled in schools in Dunn Loring, 459 (19.5%) attend a private institution, while the remaining 1,896 (80.5%) are enrolled in public schools. The age group of 3 to 4 year olds has the highest likelihood of being enrolled in private schools, with 127 (64.5% in the age bracket) enrolled. Conversely, the age group of 10 to 14 year olds has the lowest likelihood of being enrolled in a private school, with 501 (96.9% in the age bracket) attending a public institution.
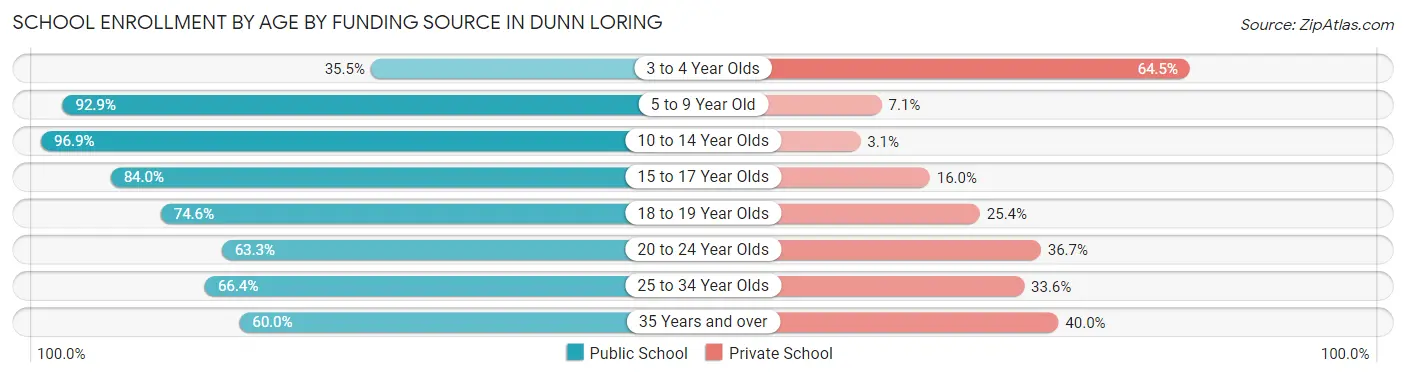
| Age Bracket | Public School | Private School |
| 3 to 4 Year Olds | 70 (35.5%) | 127 (64.5%) |
| 5 to 9 Year Old | 552 (92.9%) | 42 (7.1%) |
| 10 to 14 Year Olds | 501 (96.9%) | 16 (3.1%) |
| 15 to 17 Year Olds | 377 (84.0%) | 72 (16.0%) |
| 18 to 19 Year Olds | 100 (74.6%) | 34 (25.4%) |
| 20 to 24 Year Olds | 193 (63.3%) | 112 (36.7%) |
| 25 to 34 Year Olds | 79 (66.4%) | 40 (33.6%) |
| 35 Years and over | 24 (60.0%) | 16 (40.0%) |
| Total | 1,896 (80.5%) | 459 (19.5%) |
Educational Attainment by Field of Study in Dunn Loring
Business (800 | 16.0%), engineering (694 | 13.9%), social sciences (654 | 13.1%), computers & mathematics (553 | 11.0%), and liberal arts & history (393 | 7.8%) are the most common fields of study among 5,011 individuals in Dunn Loring who have obtained a bachelor's degree or higher.
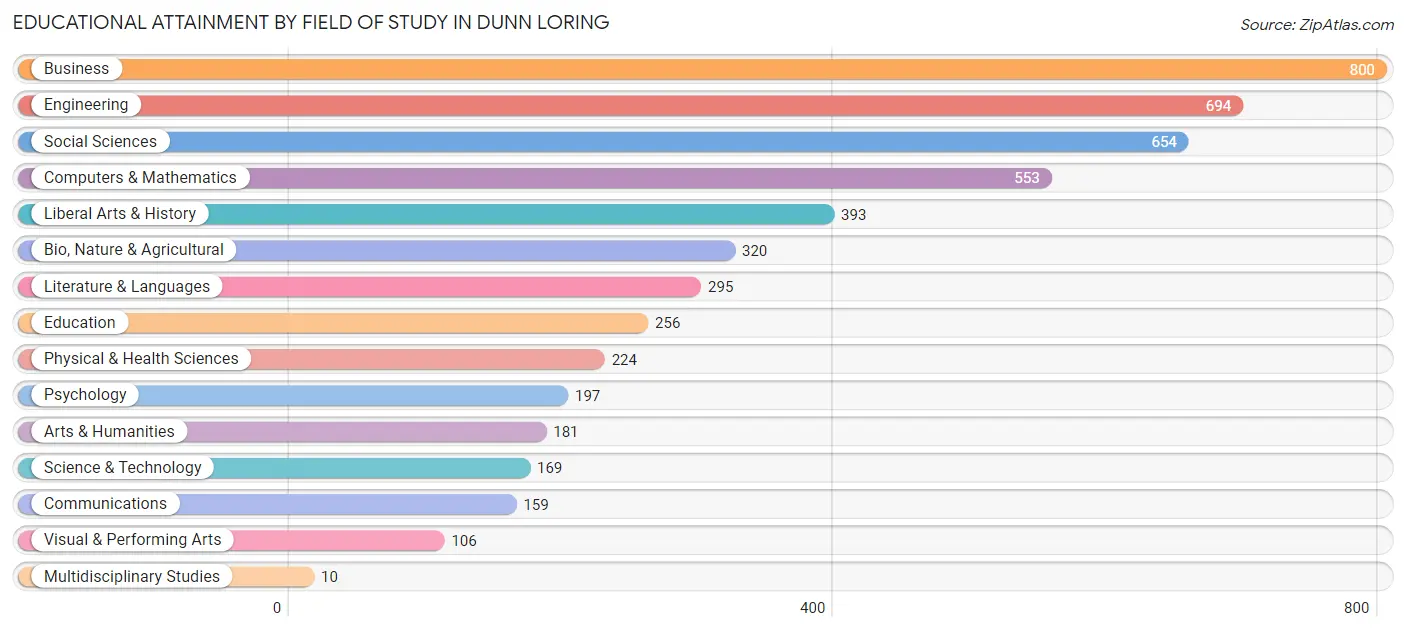
| Field of Study | # Graduates | % Graduates |
| Computers & Mathematics | 553 | 11.0% |
| Bio, Nature & Agricultural | 320 | 6.4% |
| Physical & Health Sciences | 224 | 4.5% |
| Psychology | 197 | 3.9% |
| Social Sciences | 654 | 13.1% |
| Engineering | 694 | 13.9% |
| Multidisciplinary Studies | 10 | 0.2% |
| Science & Technology | 169 | 3.4% |
| Business | 800 | 16.0% |
| Education | 256 | 5.1% |
| Literature & Languages | 295 | 5.9% |
| Liberal Arts & History | 393 | 7.8% |
| Visual & Performing Arts | 106 | 2.1% |
| Communications | 159 | 3.2% |
| Arts & Humanities | 181 | 3.6% |
| Total | 5,011 | 100.0% |
Transportation & Commute in Dunn Loring
Vehicle Availability by Sex in Dunn Loring
The most prevalent vehicle ownership categories in Dunn Loring are males with 2 vehicles (1,365, accounting for 55.2%) and females with 2 vehicles (1,036, making up 69.4%).
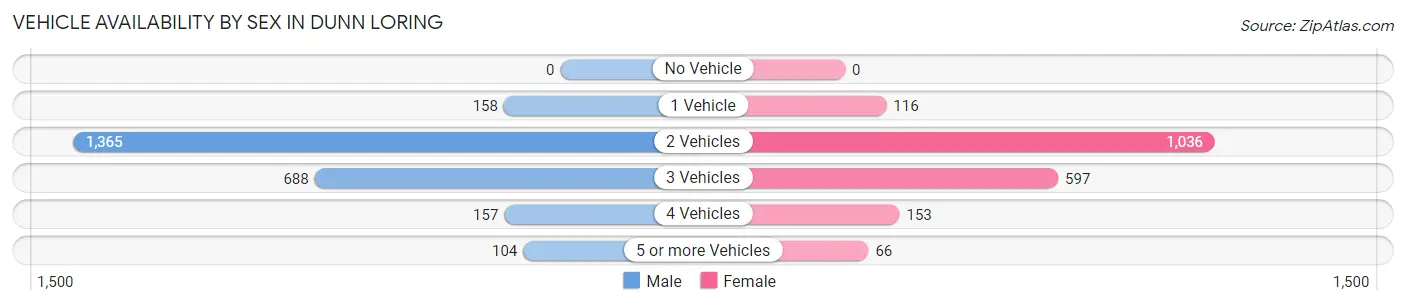
| Vehicles Available | Male | Female |
| No Vehicle | 0 (0.0%) | 0 (0.0%) |
| 1 Vehicle | 158 (6.4%) | 116 (5.9%) |
| 2 Vehicles | 1,365 (55.2%) | 1,036 (52.6%) |
| 3 Vehicles | 688 (27.8%) | 597 (30.3%) |
| 4 Vehicles | 157 (6.4%) | 153 (7.8%) |
| 5 or more Vehicles | 104 (4.2%) | 66 (3.4%) |
| Total | 2,472 (100.0%) | 1,968 (100.0%) |
Commute Time in Dunn Loring
The most frequently occuring commute durations in Dunn Loring are 15 to 19 minutes (528 commuters, 15.6%), 30 to 34 minutes (502 commuters, 14.8%), and 10 to 14 minutes (421 commuters, 12.4%).
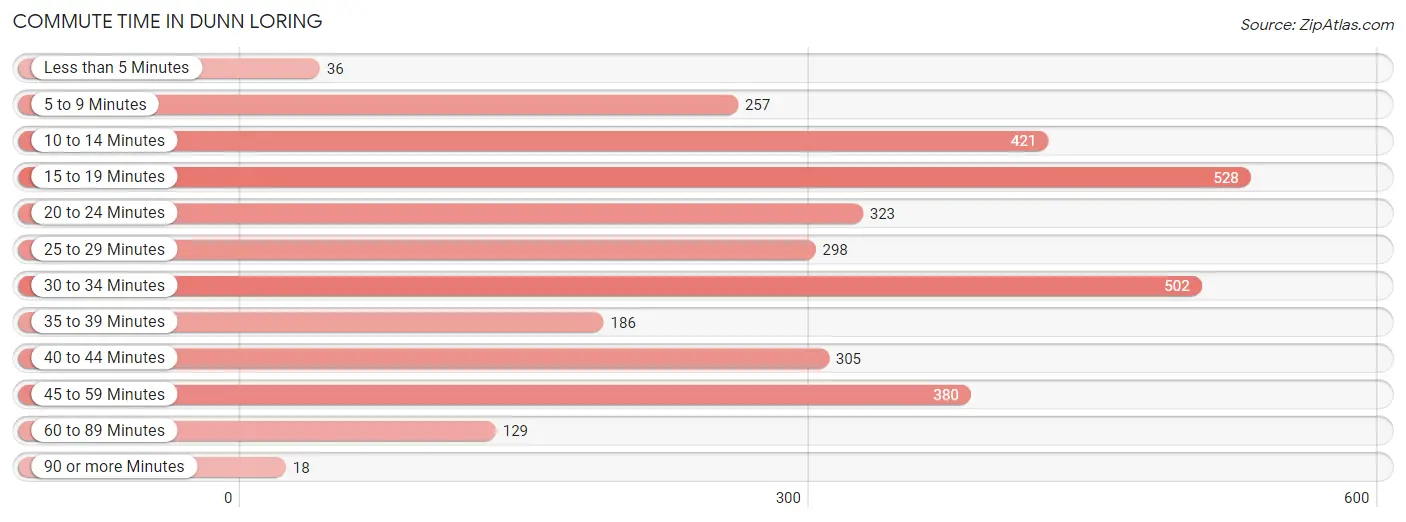
| Commute Time | # Commuters | % Commuters |
| Less than 5 Minutes | 36 | 1.1% |
| 5 to 9 Minutes | 257 | 7.6% |
| 10 to 14 Minutes | 421 | 12.4% |
| 15 to 19 Minutes | 528 | 15.6% |
| 20 to 24 Minutes | 323 | 9.6% |
| 25 to 29 Minutes | 298 | 8.8% |
| 30 to 34 Minutes | 502 | 14.8% |
| 35 to 39 Minutes | 186 | 5.5% |
| 40 to 44 Minutes | 305 | 9.0% |
| 45 to 59 Minutes | 380 | 11.2% |
| 60 to 89 Minutes | 129 | 3.8% |
| 90 or more Minutes | 18 | 0.5% |
Commute Time by Sex in Dunn Loring
The most common commute times in Dunn Loring are 45 to 59 minutes (315 commuters, 16.8%) for males and 15 to 19 minutes (349 commuters, 23.1%) for females.
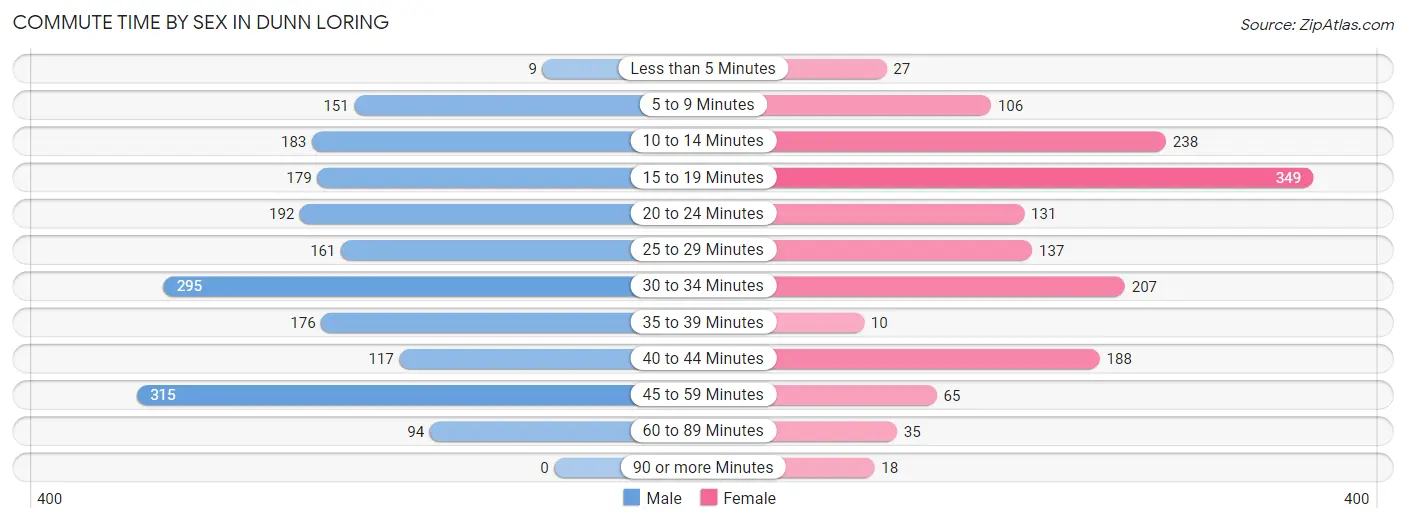
| Commute Time | Male | Female |
| Less than 5 Minutes | 9 (0.5%) | 27 (1.8%) |
| 5 to 9 Minutes | 151 (8.1%) | 106 (7.0%) |
| 10 to 14 Minutes | 183 (9.8%) | 238 (15.8%) |
| 15 to 19 Minutes | 179 (9.6%) | 349 (23.1%) |
| 20 to 24 Minutes | 192 (10.3%) | 131 (8.7%) |
| 25 to 29 Minutes | 161 (8.6%) | 137 (9.1%) |
| 30 to 34 Minutes | 295 (15.8%) | 207 (13.7%) |
| 35 to 39 Minutes | 176 (9.4%) | 10 (0.7%) |
| 40 to 44 Minutes | 117 (6.2%) | 188 (12.4%) |
| 45 to 59 Minutes | 315 (16.8%) | 65 (4.3%) |
| 60 to 89 Minutes | 94 (5.0%) | 35 (2.3%) |
| 90 or more Minutes | 0 (0.0%) | 18 (1.2%) |
Time of Departure to Work by Sex in Dunn Loring
The most frequent times of departure to work in Dunn Loring are 8:00 AM to 8:29 AM (446, 23.8%) for males and 8:00 AM to 8:29 AM (238, 15.8%) for females.
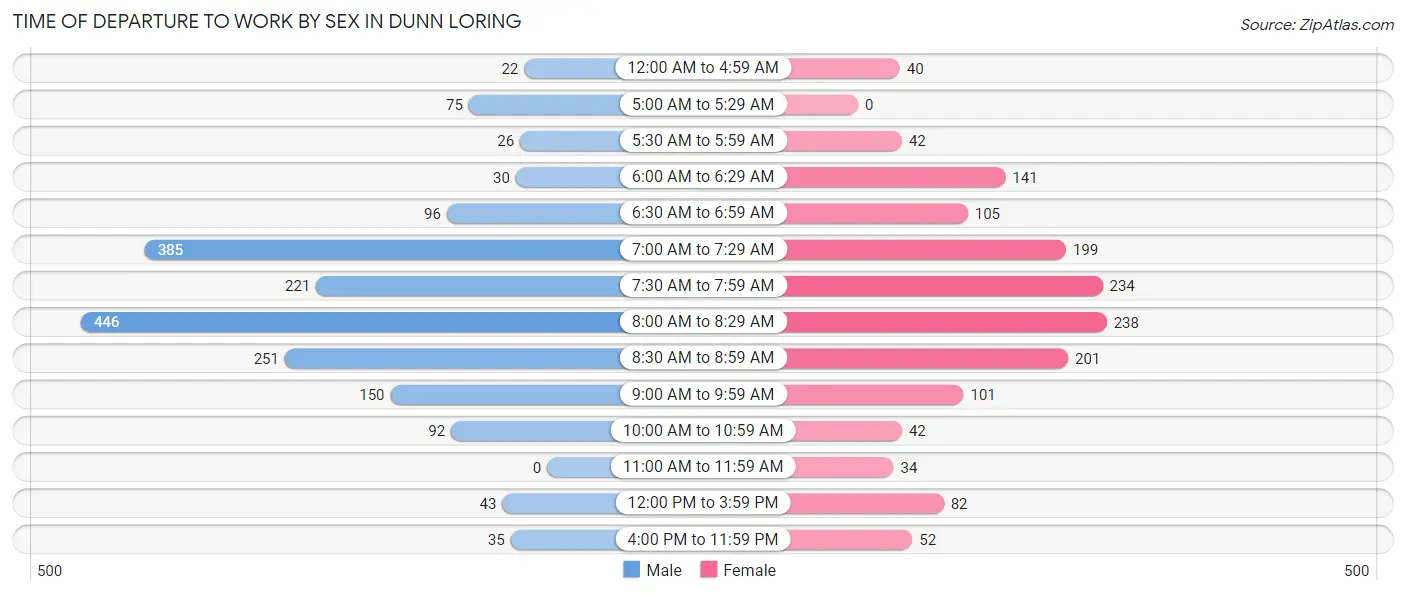
| Time of Departure | Male | Female |
| 12:00 AM to 4:59 AM | 22 (1.2%) | 40 (2.6%) |
| 5:00 AM to 5:29 AM | 75 (4.0%) | 0 (0.0%) |
| 5:30 AM to 5:59 AM | 26 (1.4%) | 42 (2.8%) |
| 6:00 AM to 6:29 AM | 30 (1.6%) | 141 (9.3%) |
| 6:30 AM to 6:59 AM | 96 (5.1%) | 105 (7.0%) |
| 7:00 AM to 7:29 AM | 385 (20.6%) | 199 (13.2%) |
| 7:30 AM to 7:59 AM | 221 (11.8%) | 234 (15.5%) |
| 8:00 AM to 8:29 AM | 446 (23.8%) | 238 (15.8%) |
| 8:30 AM to 8:59 AM | 251 (13.4%) | 201 (13.3%) |
| 9:00 AM to 9:59 AM | 150 (8.0%) | 101 (6.7%) |
| 10:00 AM to 10:59 AM | 92 (4.9%) | 42 (2.8%) |
| 11:00 AM to 11:59 AM | 0 (0.0%) | 34 (2.2%) |
| 12:00 PM to 3:59 PM | 43 (2.3%) | 82 (5.4%) |
| 4:00 PM to 11:59 PM | 35 (1.9%) | 52 (3.4%) |
| Total | 1,872 (100.0%) | 1,511 (100.0%) |
Housing Occupancy in Dunn Loring
Occupancy by Ownership in Dunn Loring
Of the total 2,806 dwellings in Dunn Loring, owner-occupied units account for 2,470 (88.0%), while renter-occupied units make up 336 (12.0%).
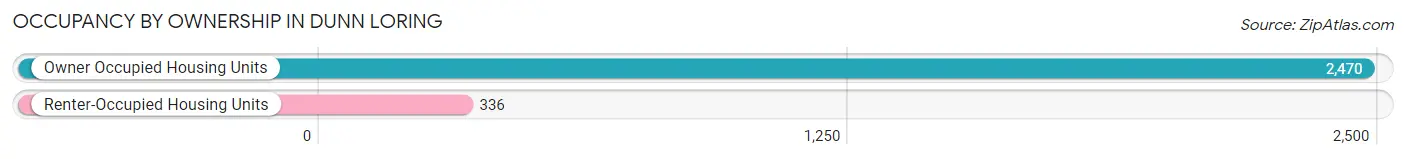
| Occupancy | # Housing Units | % Housing Units |
| Owner Occupied Housing Units | 2,470 | 88.0% |
| Renter-Occupied Housing Units | 336 | 12.0% |
| Total Occupied Housing Units | 2,806 | 100.0% |
Occupancy by Household Size in Dunn Loring
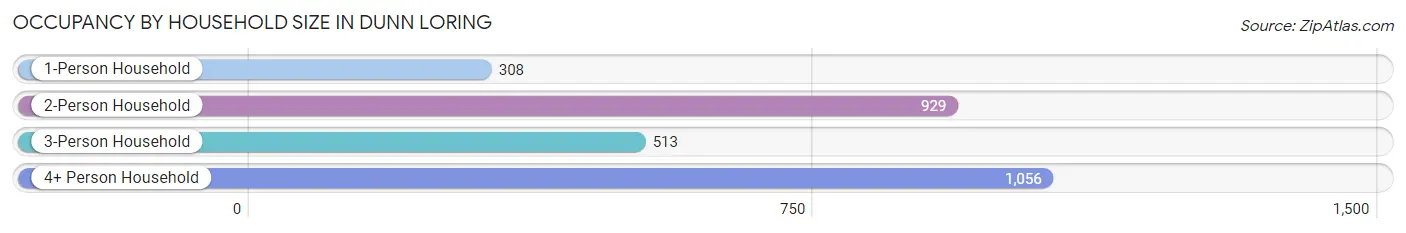
| Household Size | # Housing Units | % Housing Units |
| 1-Person Household | 308 | 11.0% |
| 2-Person Household | 929 | 33.1% |
| 3-Person Household | 513 | 18.3% |
| 4+ Person Household | 1,056 | 37.6% |
| Total Housing Units | 2,806 | 100.0% |
Occupancy by Ownership by Household Size in Dunn Loring
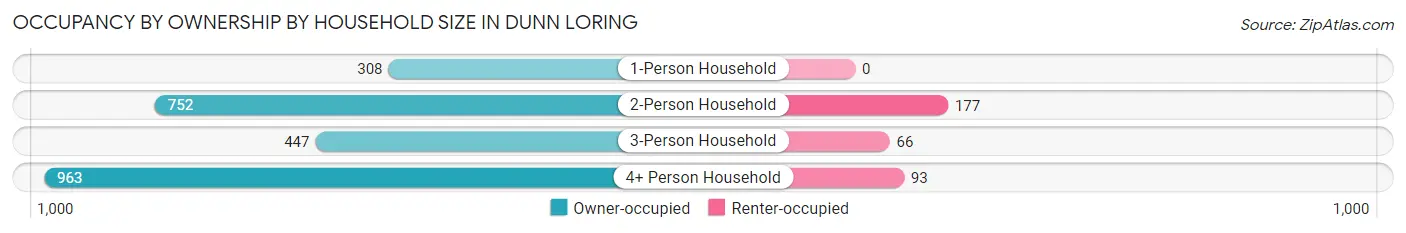
| Household Size | Owner-occupied | Renter-occupied |
| 1-Person Household | 308 (100.0%) | 0 (0.0%) |
| 2-Person Household | 752 (80.9%) | 177 (19.1%) |
| 3-Person Household | 447 (87.1%) | 66 (12.9%) |
| 4+ Person Household | 963 (91.2%) | 93 (8.8%) |
| Total Housing Units | 2,470 (88.0%) | 336 (12.0%) |
Occupancy by Educational Attainment in Dunn Loring
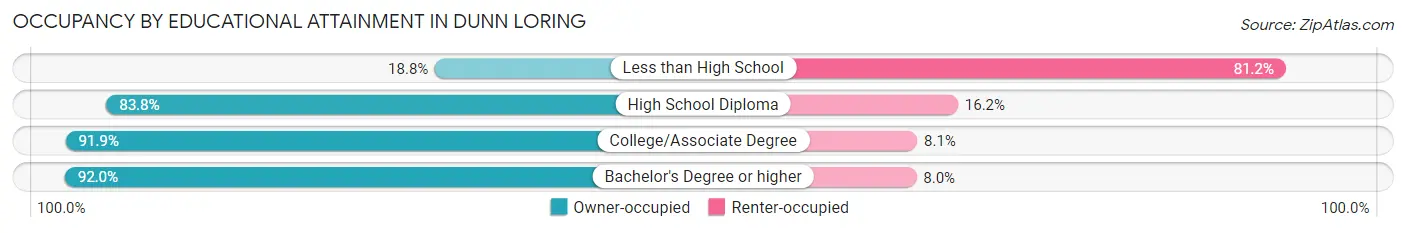
| Household Size | Owner-occupied | Renter-occupied |
| Less than High School | 25 (18.8%) | 108 (81.2%) |
| High School Diploma | 150 (83.8%) | 29 (16.2%) |
| College/Associate Degree | 136 (91.9%) | 12 (8.1%) |
| Bachelor's Degree or higher | 2,159 (92.0%) | 187 (8.0%) |
Occupancy by Age of Householder in Dunn Loring
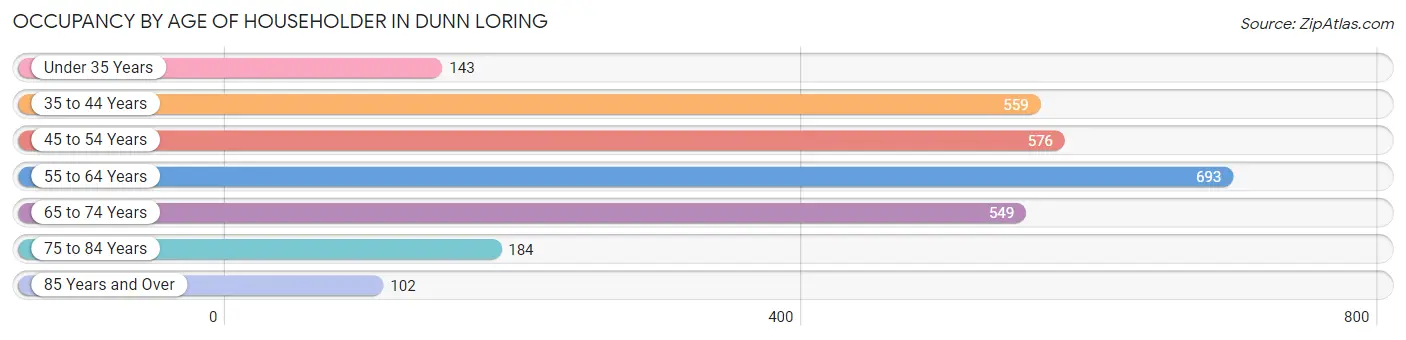
| Age Bracket | # Households | % Households |
| Under 35 Years | 143 | 5.1% |
| 35 to 44 Years | 559 | 19.9% |
| 45 to 54 Years | 576 | 20.5% |
| 55 to 64 Years | 693 | 24.7% |
| 65 to 74 Years | 549 | 19.6% |
| 75 to 84 Years | 184 | 6.6% |
| 85 Years and Over | 102 | 3.6% |
| Total | 2,806 | 100.0% |
Housing Finances in Dunn Loring
Median Income by Occupancy in Dunn Loring
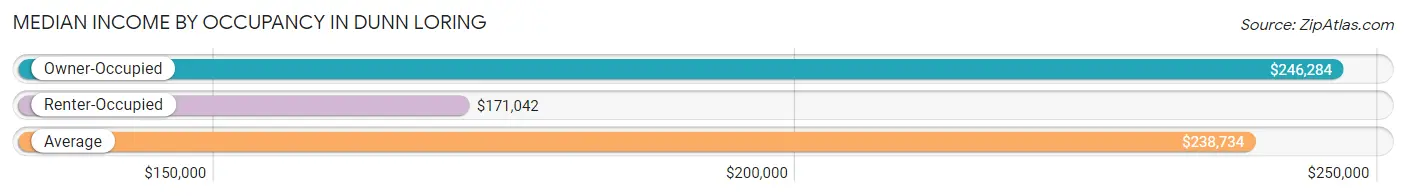
| Occupancy Type | # Households | Median Income |
| Owner-Occupied | 2,470 (88.0%) | $246,284 |
| Renter-Occupied | 336 (12.0%) | $171,042 |
| Average | 2,806 (100.0%) | $238,734 |
Occupancy by Householder Income Bracket in Dunn Loring
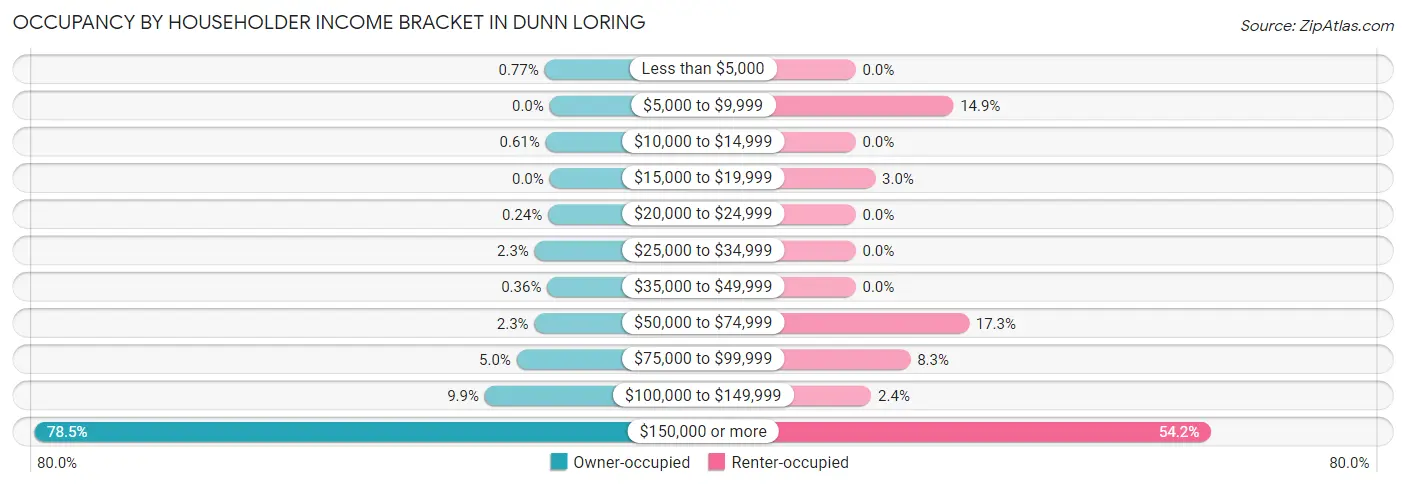
| Income Bracket | Owner-occupied | Renter-occupied |
| Less than $5,000 | 19 (0.8%) | 0 (0.0%) |
| $5,000 to $9,999 | 0 (0.0%) | 50 (14.9%) |
| $10,000 to $14,999 | 15 (0.6%) | 0 (0.0%) |
| $15,000 to $19,999 | 0 (0.0%) | 10 (3.0%) |
| $20,000 to $24,999 | 6 (0.2%) | 0 (0.0%) |
| $25,000 to $34,999 | 56 (2.3%) | 0 (0.0%) |
| $35,000 to $49,999 | 9 (0.4%) | 0 (0.0%) |
| $50,000 to $74,999 | 57 (2.3%) | 58 (17.3%) |
| $75,000 to $99,999 | 124 (5.0%) | 28 (8.3%) |
| $100,000 to $149,999 | 244 (9.9%) | 8 (2.4%) |
| $150,000 or more | 1,940 (78.5%) | 182 (54.2%) |
| Total | 2,470 (100.0%) | 336 (100.0%) |
Monthly Housing Cost Tiers in Dunn Loring
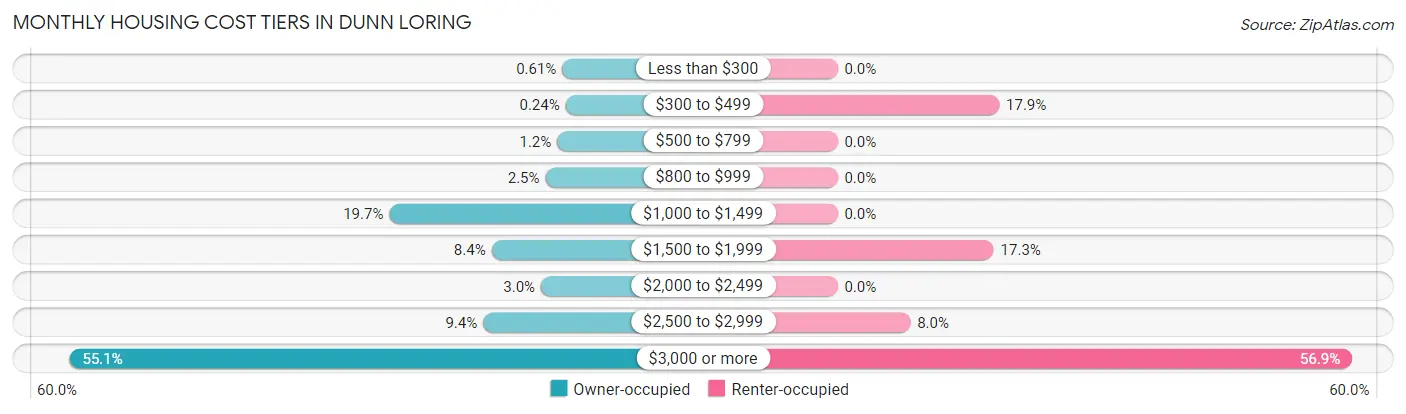
| Monthly Cost | Owner-occupied | Renter-occupied |
| Less than $300 | 15 (0.6%) | 0 (0.0%) |
| $300 to $499 | 6 (0.2%) | 60 (17.9%) |
| $500 to $799 | 29 (1.2%) | 0 (0.0%) |
| $800 to $999 | 61 (2.5%) | 0 (0.0%) |
| $1,000 to $1,499 | 487 (19.7%) | 0 (0.0%) |
| $1,500 to $1,999 | 208 (8.4%) | 58 (17.3%) |
| $2,000 to $2,499 | 73 (3.0%) | 0 (0.0%) |
| $2,500 to $2,999 | 231 (9.3%) | 27 (8.0%) |
| $3,000 or more | 1,360 (55.1%) | 191 (56.9%) |
| Total | 2,470 (100.0%) | 336 (100.0%) |
Physical Housing Characteristics in Dunn Loring
Housing Structures in Dunn Loring
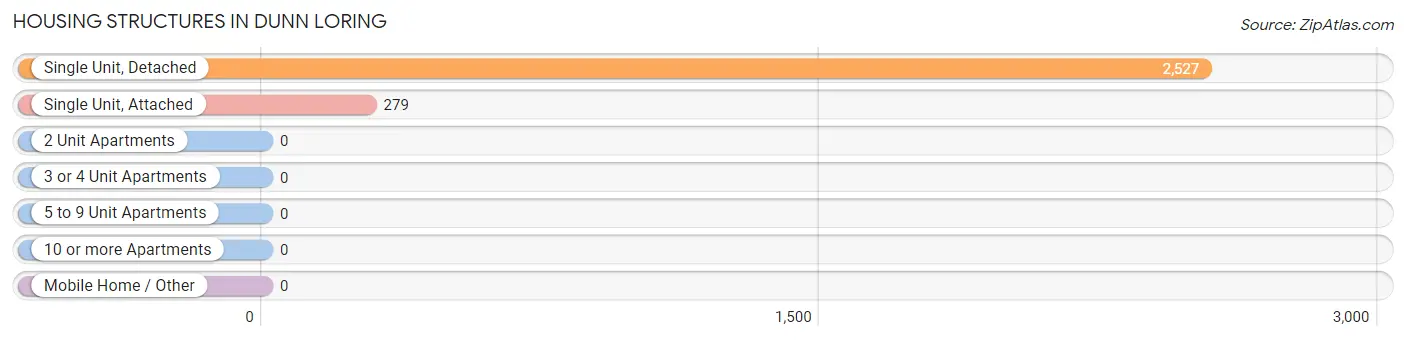
| Structure Type | # Housing Units | % Housing Units |
| Single Unit, Detached | 2,527 | 90.1% |
| Single Unit, Attached | 279 | 9.9% |
| 2 Unit Apartments | 0 | 0.0% |
| 3 or 4 Unit Apartments | 0 | 0.0% |
| 5 to 9 Unit Apartments | 0 | 0.0% |
| 10 or more Apartments | 0 | 0.0% |
| Mobile Home / Other | 0 | 0.0% |
| Total | 2,806 | 100.0% |
Housing Structures by Occupancy in Dunn Loring
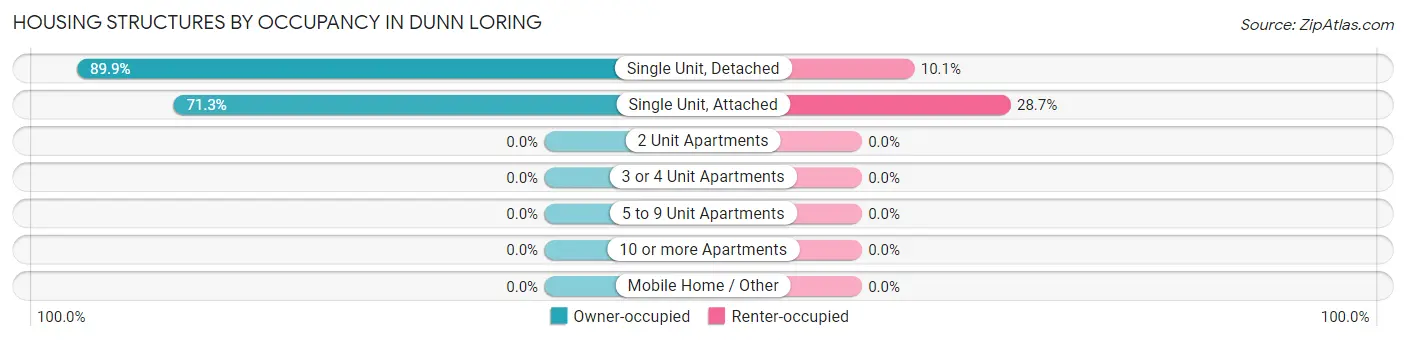
| Structure Type | Owner-occupied | Renter-occupied |
| Single Unit, Detached | 2,271 (89.9%) | 256 (10.1%) |
| Single Unit, Attached | 199 (71.3%) | 80 (28.7%) |
| 2 Unit Apartments | 0 (0.0%) | 0 (0.0%) |
| 3 or 4 Unit Apartments | 0 (0.0%) | 0 (0.0%) |
| 5 to 9 Unit Apartments | 0 (0.0%) | 0 (0.0%) |
| 10 or more Apartments | 0 (0.0%) | 0 (0.0%) |
| Mobile Home / Other | 0 (0.0%) | 0 (0.0%) |
| Total | 2,470 (88.0%) | 336 (12.0%) |
Housing Structures by Number of Rooms in Dunn Loring
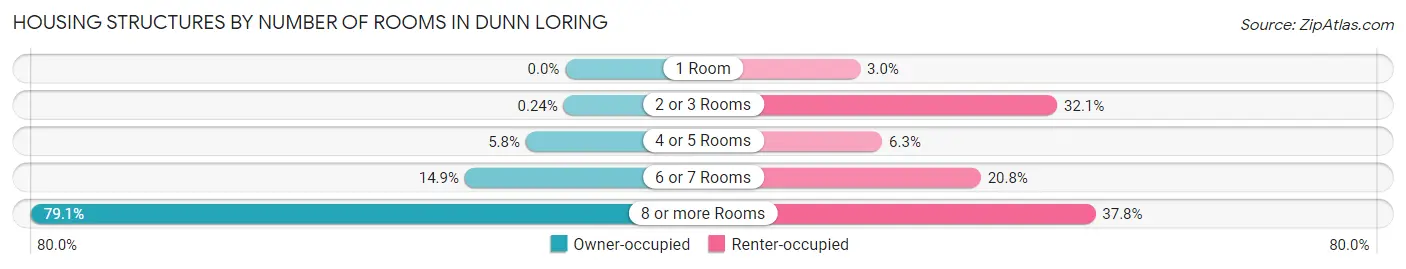
| Number of Rooms | Owner-occupied | Renter-occupied |
| 1 Room | 0 (0.0%) | 10 (3.0%) |
| 2 or 3 Rooms | 6 (0.2%) | 108 (32.1%) |
| 4 or 5 Rooms | 144 (5.8%) | 21 (6.2%) |
| 6 or 7 Rooms | 367 (14.9%) | 70 (20.8%) |
| 8 or more Rooms | 1,953 (79.1%) | 127 (37.8%) |
| Total | 2,470 (100.0%) | 336 (100.0%) |
Housing Structure by Heating Type in Dunn Loring
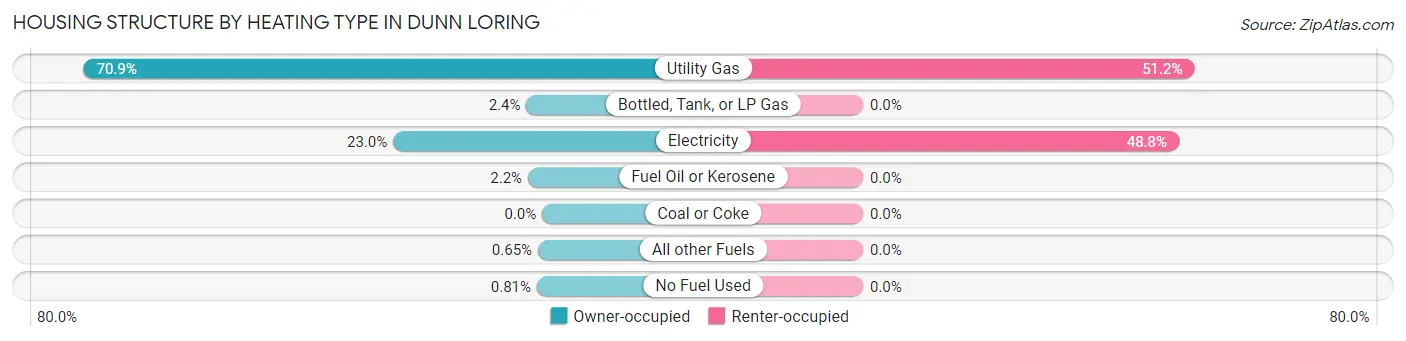
| Heating Type | Owner-occupied | Renter-occupied |
| Utility Gas | 1,751 (70.9%) | 172 (51.2%) |
| Bottled, Tank, or LP Gas | 60 (2.4%) | 0 (0.0%) |
| Electricity | 569 (23.0%) | 164 (48.8%) |
| Fuel Oil or Kerosene | 54 (2.2%) | 0 (0.0%) |
| Coal or Coke | 0 (0.0%) | 0 (0.0%) |
| All other Fuels | 16 (0.6%) | 0 (0.0%) |
| No Fuel Used | 20 (0.8%) | 0 (0.0%) |
| Total | 2,470 (100.0%) | 336 (100.0%) |
Household Vehicle Usage in Dunn Loring
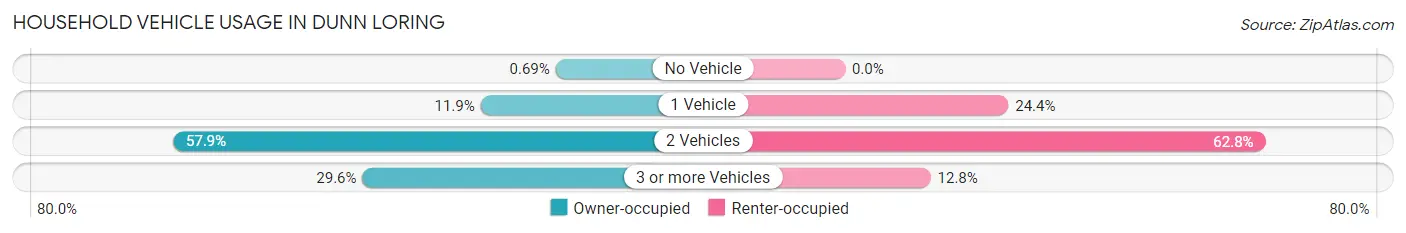
| Vehicles per Household | Owner-occupied | Renter-occupied |
| No Vehicle | 17 (0.7%) | 0 (0.0%) |
| 1 Vehicle | 294 (11.9%) | 82 (24.4%) |
| 2 Vehicles | 1,429 (57.9%) | 211 (62.8%) |
| 3 or more Vehicles | 730 (29.5%) | 43 (12.8%) |
| Total | 2,470 (100.0%) | 336 (100.0%) |
Real Estate & Mortgages in Dunn Loring
Real Estate and Mortgage Overview in Dunn Loring
| Characteristic | Without Mortgage | With Mortgage |
| Housing Units | 775 | 1,695 |
| Median Property Value | $860,800 | $937,900 |
| Median Household Income | $192,188 | $1,456 |
| Monthly Housing Costs | $1,178 | $1,352 |
| Real Estate Taxes | $9,230 | $0 |
Property Value by Mortgage Status in Dunn Loring
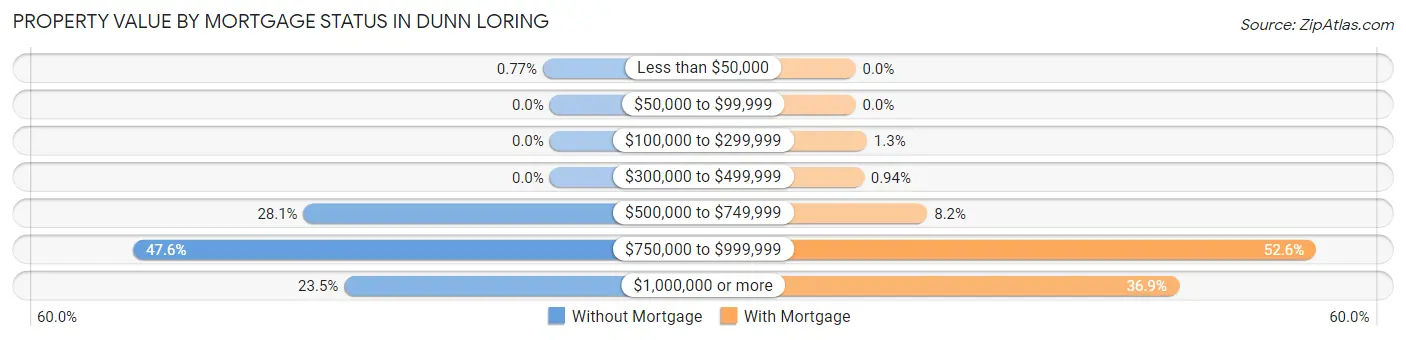
| Property Value | Without Mortgage | With Mortgage |
| Less than $50,000 | 6 (0.8%) | 0 (0.0%) |
| $50,000 to $99,999 | 0 (0.0%) | 0 (0.0%) |
| $100,000 to $299,999 | 0 (0.0%) | 22 (1.3%) |
| $300,000 to $499,999 | 0 (0.0%) | 16 (0.9%) |
| $500,000 to $749,999 | 218 (28.1%) | 139 (8.2%) |
| $750,000 to $999,999 | 369 (47.6%) | 892 (52.6%) |
| $1,000,000 or more | 182 (23.5%) | 626 (36.9%) |
| Total | 775 (100.0%) | 1,695 (100.0%) |
Household Income by Mortgage Status in Dunn Loring
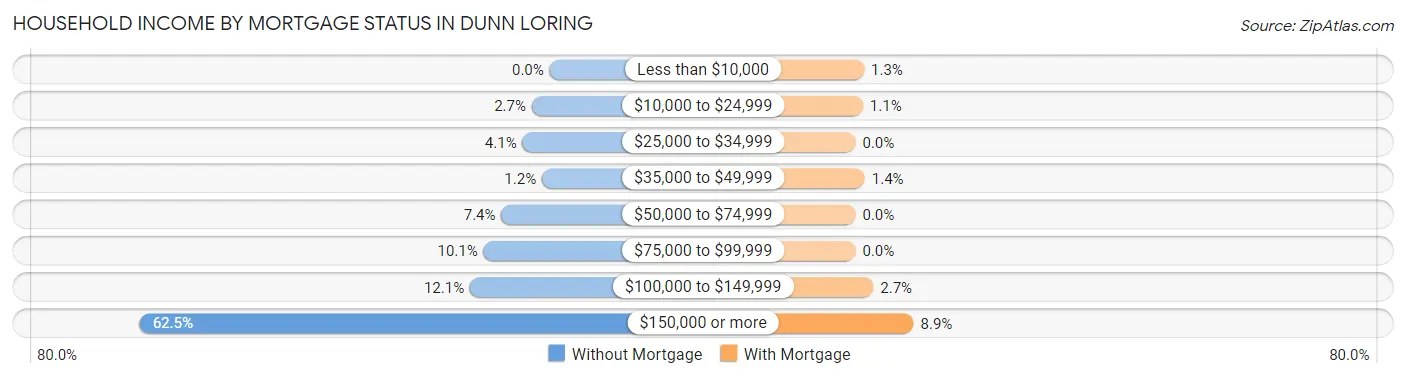
| Household Income | Without Mortgage | With Mortgage |
| Less than $10,000 | 0 (0.0%) | 22 (1.3%) |
| $10,000 to $24,999 | 21 (2.7%) | 19 (1.1%) |
| $25,000 to $34,999 | 32 (4.1%) | 0 (0.0%) |
| $35,000 to $49,999 | 9 (1.2%) | 24 (1.4%) |
| $50,000 to $74,999 | 57 (7.3%) | 0 (0.0%) |
| $75,000 to $99,999 | 78 (10.1%) | 0 (0.0%) |
| $100,000 to $149,999 | 94 (12.1%) | 46 (2.7%) |
| $150,000 or more | 484 (62.5%) | 150 (8.8%) |
| Total | 775 (100.0%) | 1,695 (100.0%) |
Property Value to Household Income Ratio in Dunn Loring
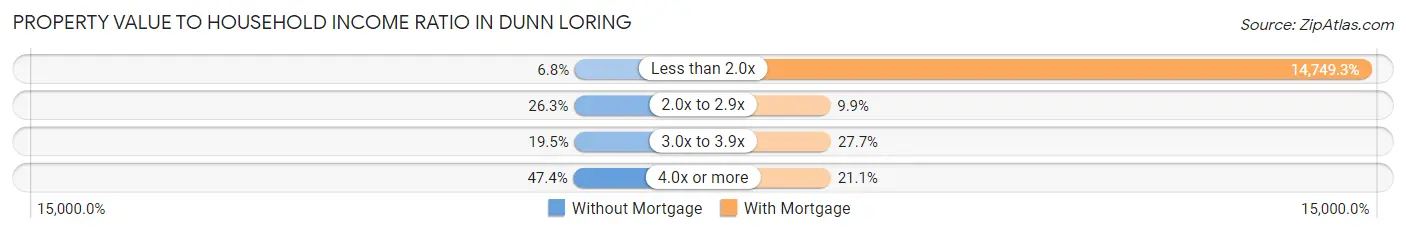
| Value-to-Income Ratio | Without Mortgage | With Mortgage |
| Less than 2.0x | 53 (6.8%) | 250,001 (14,749.3%) |
| 2.0x to 2.9x | 204 (26.3%) | 167 (9.9%) |
| 3.0x to 3.9x | 151 (19.5%) | 469 (27.7%) |
| 4.0x or more | 367 (47.3%) | 358 (21.1%) |
| Total | 775 (100.0%) | 1,695 (100.0%) |
Real Estate Taxes by Mortgage Status in Dunn Loring
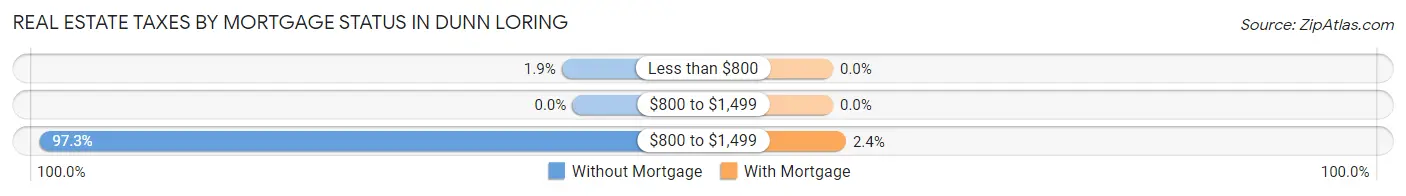
| Property Taxes | Without Mortgage | With Mortgage |
| Less than $800 | 15 (1.9%) | 0 (0.0%) |
| $800 to $1,499 | 0 (0.0%) | 0 (0.0%) |
| $800 to $1,499 | 754 (97.3%) | 40 (2.4%) |
| Total | 775 (100.0%) | 1,695 (100.0%) |
Health & Disability in Dunn Loring
Health Insurance Coverage by Age in Dunn Loring
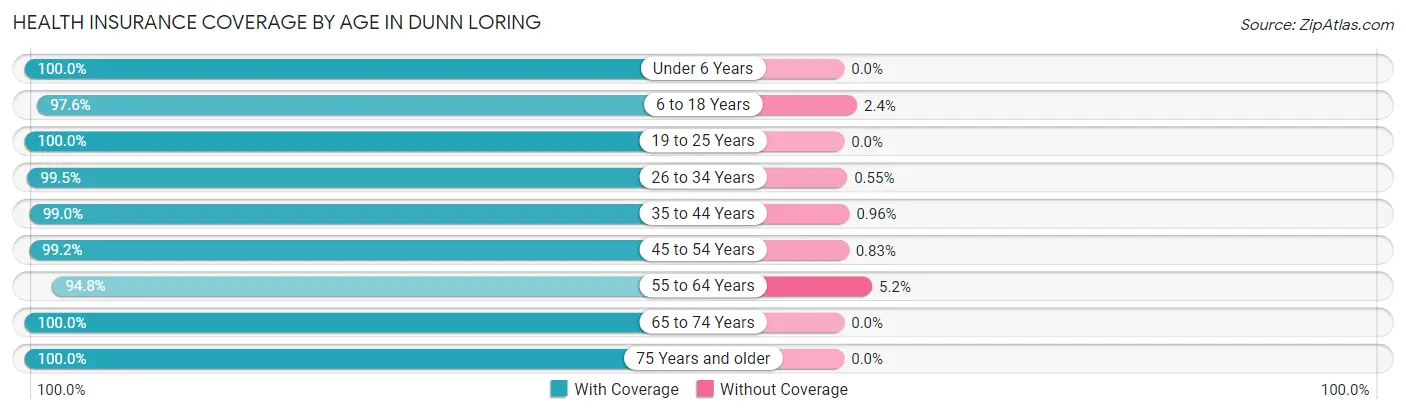
| Age Bracket | With Coverage | Without Coverage |
| Under 6 Years | 562 (100.0%) | 0 (0.0%) |
| 6 to 18 Years | 1,553 (97.6%) | 38 (2.4%) |
| 19 to 25 Years | 660 (100.0%) | 0 (0.0%) |
| 26 to 34 Years | 728 (99.5%) | 4 (0.5%) |
| 35 to 44 Years | 1,133 (99.0%) | 11 (1.0%) |
| 45 to 54 Years | 1,069 (99.2%) | 9 (0.8%) |
| 55 to 64 Years | 1,404 (94.8%) | 77 (5.2%) |
| 65 to 74 Years | 785 (100.0%) | 0 (0.0%) |
| 75 Years and older | 567 (100.0%) | 0 (0.0%) |
| Total | 8,461 (98.4%) | 139 (1.6%) |
Health Insurance Coverage by Citizenship Status in Dunn Loring
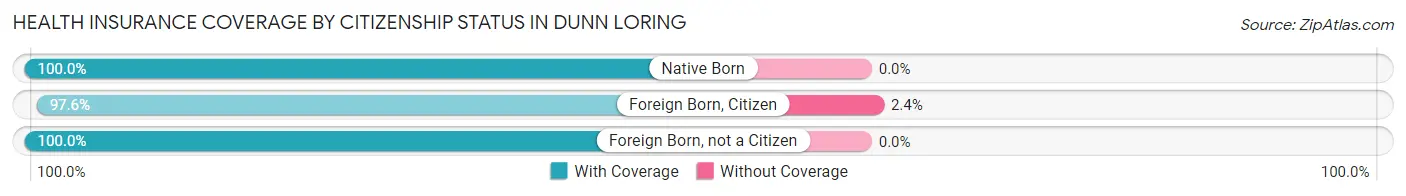
| Citizenship Status | With Coverage | Without Coverage |
| Native Born | 562 (100.0%) | 0 (0.0%) |
| Foreign Born, Citizen | 1,553 (97.6%) | 38 (2.4%) |
| Foreign Born, not a Citizen | 660 (100.0%) | 0 (0.0%) |
Health Insurance Coverage by Household Income in Dunn Loring
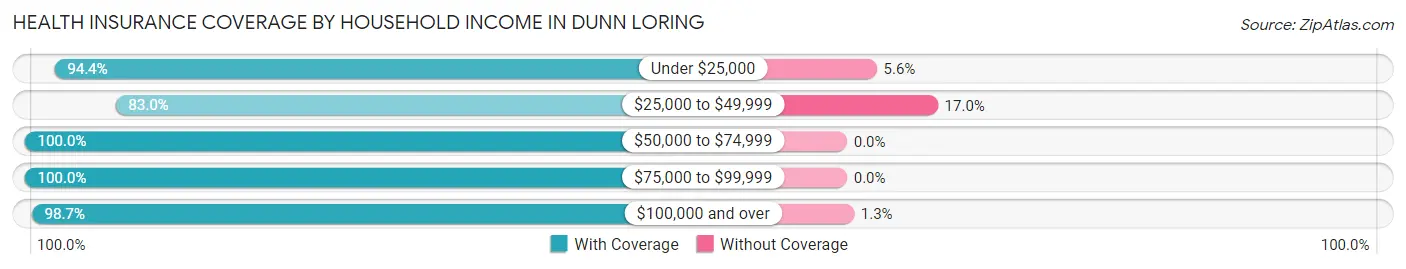
| Household Income | With Coverage | Without Coverage |
| Under $25,000 | 237 (94.4%) | 14 (5.6%) |
| $25,000 to $49,999 | 78 (83.0%) | 16 (17.0%) |
| $50,000 to $74,999 | 267 (100.0%) | 0 (0.0%) |
| $75,000 to $99,999 | 310 (100.0%) | 0 (0.0%) |
| $100,000 and over | 7,539 (98.7%) | 101 (1.3%) |
Public vs Private Health Insurance Coverage by Age in Dunn Loring
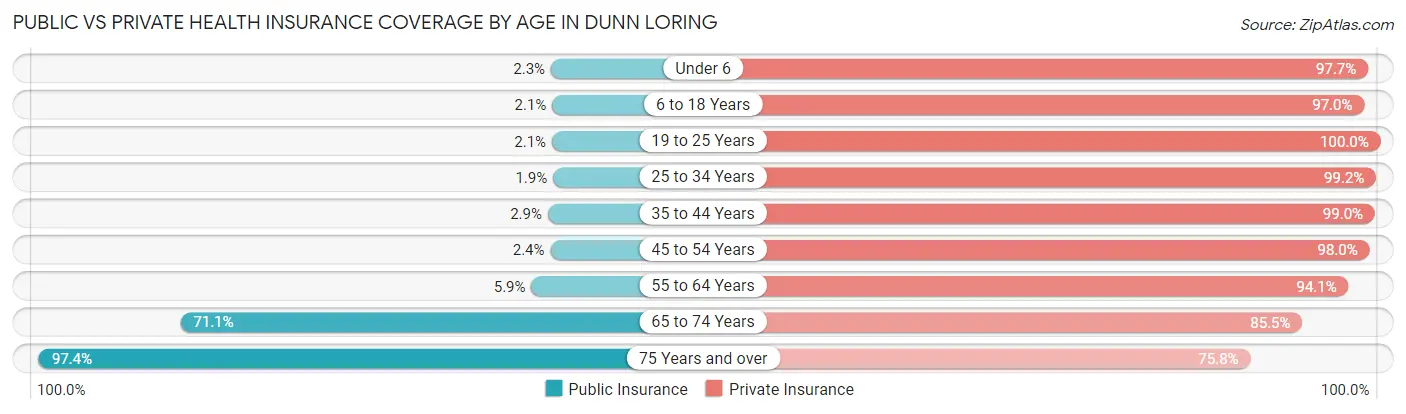
| Age Bracket | Public Insurance | Private Insurance |
| Under 6 | 13 (2.3%) | 549 (97.7%) |
| 6 to 18 Years | 33 (2.1%) | 1,543 (97.0%) |
| 19 to 25 Years | 14 (2.1%) | 660 (100.0%) |
| 25 to 34 Years | 14 (1.9%) | 726 (99.2%) |
| 35 to 44 Years | 33 (2.9%) | 1,132 (99.0%) |
| 45 to 54 Years | 26 (2.4%) | 1,056 (98.0%) |
| 55 to 64 Years | 88 (5.9%) | 1,393 (94.1%) |
| 65 to 74 Years | 558 (71.1%) | 671 (85.5%) |
| 75 Years and over | 552 (97.4%) | 430 (75.8%) |
| Total | 1,331 (15.5%) | 8,160 (94.9%) |
Disability Status by Sex by Age in Dunn Loring
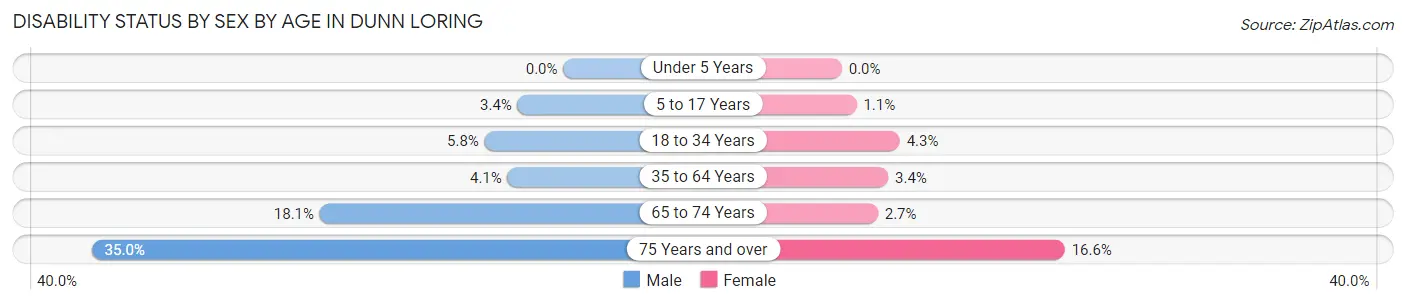
| Age Bracket | Male | Female |
| Under 5 Years | 0 (0.0%) | 0 (0.0%) |
| 5 to 17 Years | 28 (3.4%) | 8 (1.1%) |
| 18 to 34 Years | 40 (5.8%) | 34 (4.3%) |
| 35 to 64 Years | 75 (4.1%) | 65 (3.4%) |
| 65 to 74 Years | 81 (18.1%) | 9 (2.7%) |
| 75 Years and over | 97 (35.0%) | 48 (16.6%) |
Disability Class by Sex by Age in Dunn Loring
Disability Class: Hearing Difficulty
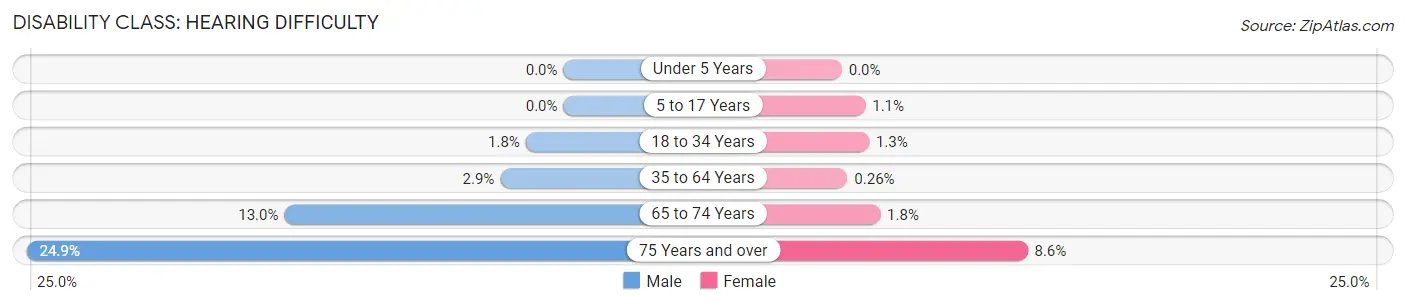
| Age Bracket | Male | Female |
| Under 5 Years | 0 (0.0%) | 0 (0.0%) |
| 5 to 17 Years | 0 (0.0%) | 8 (1.1%) |
| 18 to 34 Years | 12 (1.8%) | 10 (1.3%) |
| 35 to 64 Years | 53 (2.9%) | 5 (0.3%) |
| 65 to 74 Years | 58 (13.0%) | 6 (1.8%) |
| 75 Years and over | 69 (24.9%) | 25 (8.6%) |
Disability Class: Vision Difficulty
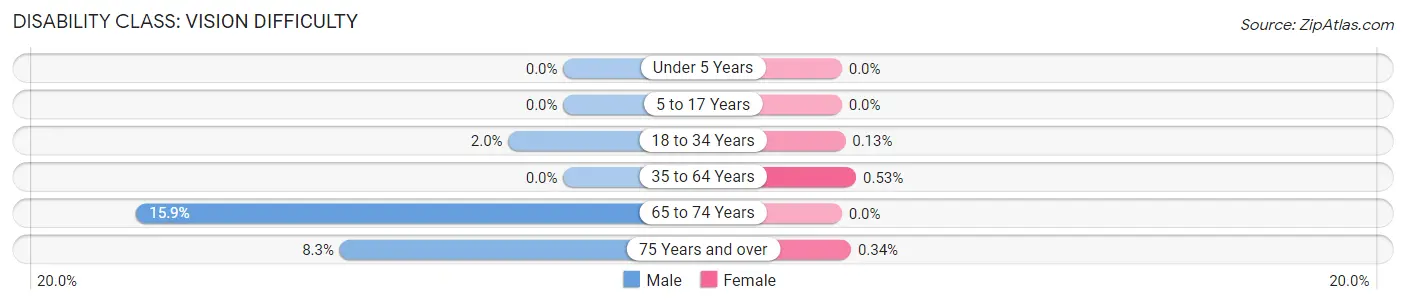
| Age Bracket | Male | Female |
| Under 5 Years | 0 (0.0%) | 0 (0.0%) |
| 5 to 17 Years | 0 (0.0%) | 0 (0.0%) |
| 18 to 34 Years | 14 (2.0%) | 1 (0.1%) |
| 35 to 64 Years | 0 (0.0%) | 10 (0.5%) |
| 65 to 74 Years | 71 (15.9%) | 0 (0.0%) |
| 75 Years and over | 23 (8.3%) | 1 (0.3%) |
Disability Class: Cognitive Difficulty
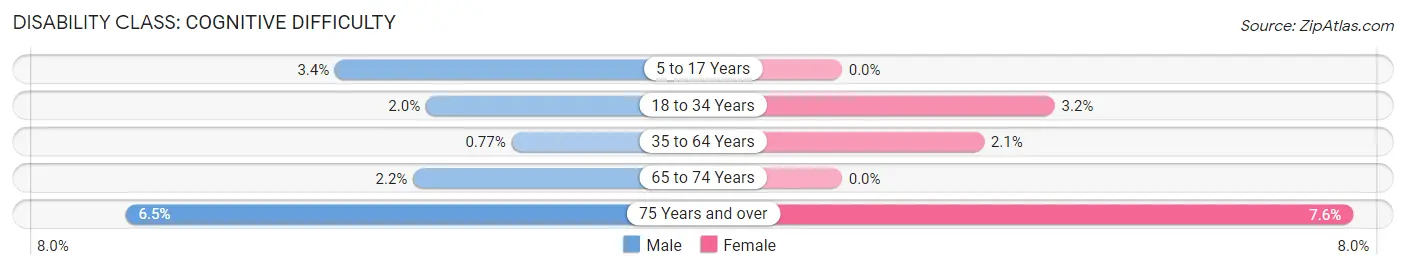
| Age Bracket | Male | Female |
| 5 to 17 Years | 28 (3.4%) | 0 (0.0%) |
| 18 to 34 Years | 14 (2.0%) | 25 (3.2%) |
| 35 to 64 Years | 14 (0.8%) | 40 (2.1%) |
| 65 to 74 Years | 10 (2.2%) | 0 (0.0%) |
| 75 Years and over | 18 (6.5%) | 22 (7.6%) |
Disability Class: Ambulatory Difficulty
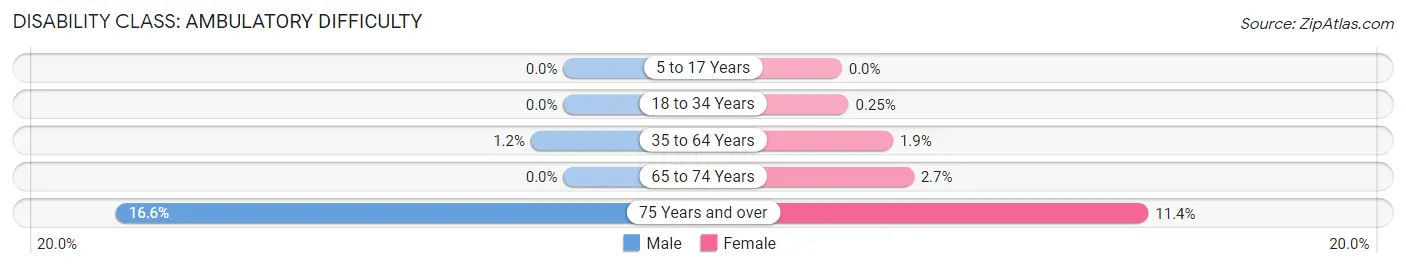
| Age Bracket | Male | Female |
| 5 to 17 Years | 0 (0.0%) | 0 (0.0%) |
| 18 to 34 Years | 0 (0.0%) | 2 (0.3%) |
| 35 to 64 Years | 22 (1.2%) | 36 (1.9%) |
| 65 to 74 Years | 0 (0.0%) | 9 (2.7%) |
| 75 Years and over | 46 (16.6%) | 33 (11.4%) |
Disability Class: Self-Care Difficulty
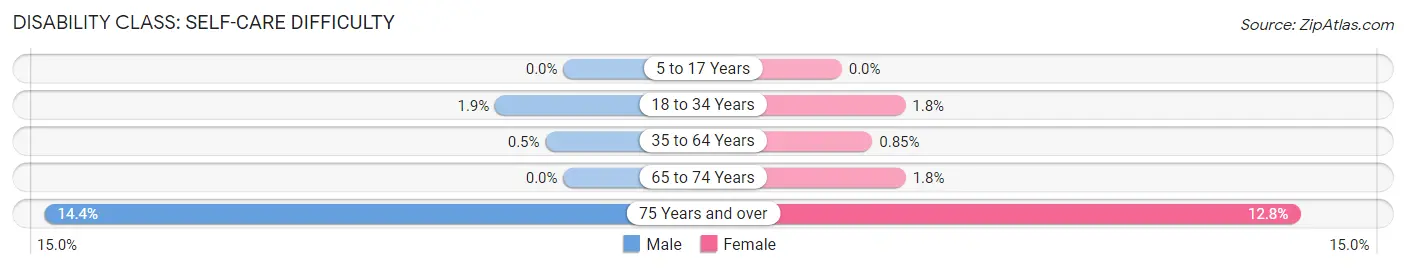
| Age Bracket | Male | Female |
| 5 to 17 Years | 0 (0.0%) | 0 (0.0%) |
| 18 to 34 Years | 13 (1.9%) | 14 (1.8%) |
| 35 to 64 Years | 9 (0.5%) | 16 (0.9%) |
| 65 to 74 Years | 0 (0.0%) | 6 (1.8%) |
| 75 Years and over | 40 (14.4%) | 37 (12.8%) |
Technology Access in Dunn Loring
Computing Device Access in Dunn Loring
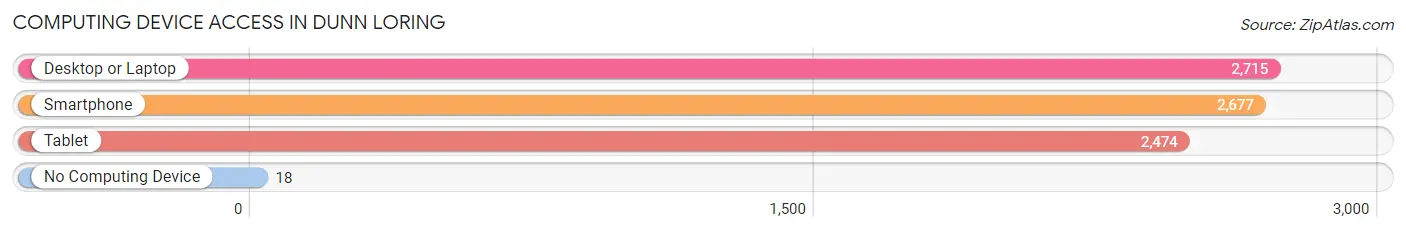
| Device Type | # Households | % Households |
| Desktop or Laptop | 2,715 | 96.8% |
| Smartphone | 2,677 | 95.4% |
| Tablet | 2,474 | 88.2% |
| No Computing Device | 18 | 0.6% |
| Total | 2,806 | 100.0% |
Internet Access in Dunn Loring
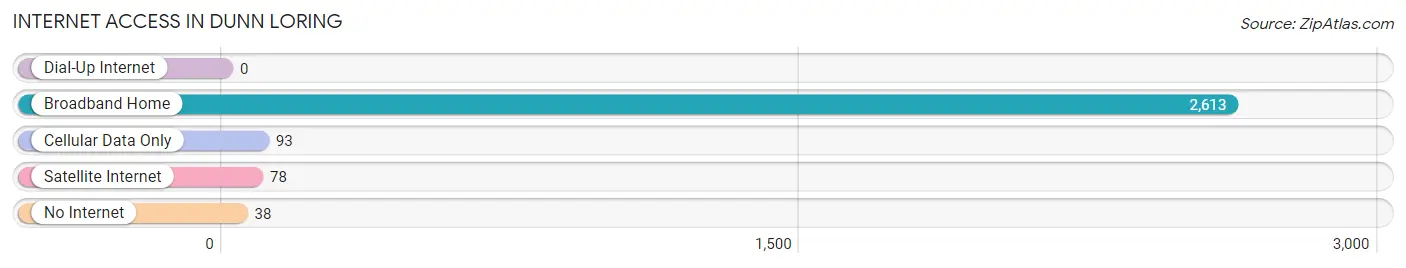
| Internet Type | # Households | % Households |
| Dial-Up Internet | 0 | 0.0% |
| Broadband Home | 2,613 | 93.1% |
| Cellular Data Only | 93 | 3.3% |
| Satellite Internet | 78 | 2.8% |
| No Internet | 38 | 1.3% |
| Total | 2,806 | 100.0% |
Dunn Loring Summary
Dunn Loring is a small unincorporated community located in Fairfax County, Virginia. It is situated in the Washington, D.C. metropolitan area, approximately 13 miles west of the city. The community is named after two brothers, William and Thomas Dunn, who owned a large tract of land in the area in the late 19th century.
History
The area that is now Dunn Loring was originally inhabited by Native American tribes, including the Powhatan, Iroquois, and Susquehannock. The first European settlers arrived in the area in the late 17th century, and the area was officially established as a town in 1873. The town was named after two brothers, William and Thomas Dunn, who owned a large tract of land in the area.
In the early 20th century, Dunn Loring was a rural farming community. The town was home to several small businesses, including a general store, a blacksmith shop, and a post office. In the 1950s, the area began to experience rapid growth as the Washington, D.C. metropolitan area expanded. The town was eventually annexed by Fairfax County in 1961.
Geography
Dunn Loring is located in Fairfax County, Virginia, approximately 13 miles west of Washington, D.C. The community is situated in the Piedmont region of Virginia, and is bordered by the cities of Vienna and Falls Church to the east, and the towns of Merrifield and Oakton to the west. The area is characterized by rolling hills and wooded areas, and is home to several parks and recreational areas, including the Dunn Loring Park and the Dunn Loring Nature Center.
Economy
Dunn Loring is primarily a residential community, and is home to a variety of businesses and services. The area is home to several large employers, including the Department of Defense, the National Institutes of Health, and the Federal Aviation Administration. The community is also home to several retail stores, restaurants, and other businesses.
Demographics
As of the 2010 census, the population of Dunn Loring was 8,845. The racial makeup of the community was 79.3% White, 8.2% African American, 5.2% Asian, and 4.3% Hispanic or Latino. The median household income was $112,917, and the median home value was $541,917.
Dunn Loring is a diverse community, and is home to a variety of religious and cultural organizations. The community is served by the Fairfax County Public Schools system, and is home to several private schools, including the Dunn Loring Montessori School and the Dunn Loring Christian Academy.
Common Questions
What is Per Capita Income in Dunn Loring?
Per Capita income in Dunn Loring is $89,174.
What is the Median Family Income in Dunn Loring?
Median Family Income in Dunn Loring is $246,716.
What is the Median Household income in Dunn Loring?
Median Household Income in Dunn Loring is $238,734.
What is Income or Wage Gap in Dunn Loring?
Income or Wage Gap in Dunn Loring is 56.5%.
Women in Dunn Loring earn 43.5 cents for every dollar earned by a man.
What is Inequality or Gini Index in Dunn Loring?
Inequality or Gini Index in Dunn Loring is 0.35.
What is the Total Population of Dunn Loring?
Total Population of Dunn Loring is 8,707.
What is the Total Male Population of Dunn Loring?
Total Male Population of Dunn Loring is 4,325.
What is the Total Female Population of Dunn Loring?
Total Female Population of Dunn Loring is 4,382.
What is the Ratio of Males per 100 Females in Dunn Loring?
There are 98.70 Males per 100 Females in Dunn Loring.
What is the Ratio of Females per 100 Males in Dunn Loring?
There are 101.32 Females per 100 Males in Dunn Loring.
What is the Median Population Age in Dunn Loring?
Median Population Age in Dunn Loring is 42.0 Years.
What is the Average Family Size in Dunn Loring
Average Family Size in Dunn Loring is 3.3 People.
What is the Average Household Size in Dunn Loring
Average Household Size in Dunn Loring is 3.0 People.
How Large is the Labor Force in Dunn Loring?
There are 4,690 People in the Labor Forcein in Dunn Loring.
What is the Percentage of People in the Labor Force in Dunn Loring?
67.8% of People are in the Labor Force in Dunn Loring.
What is the Unemployment Rate in Dunn Loring?
Unemployment Rate in Dunn Loring is 3.8%.