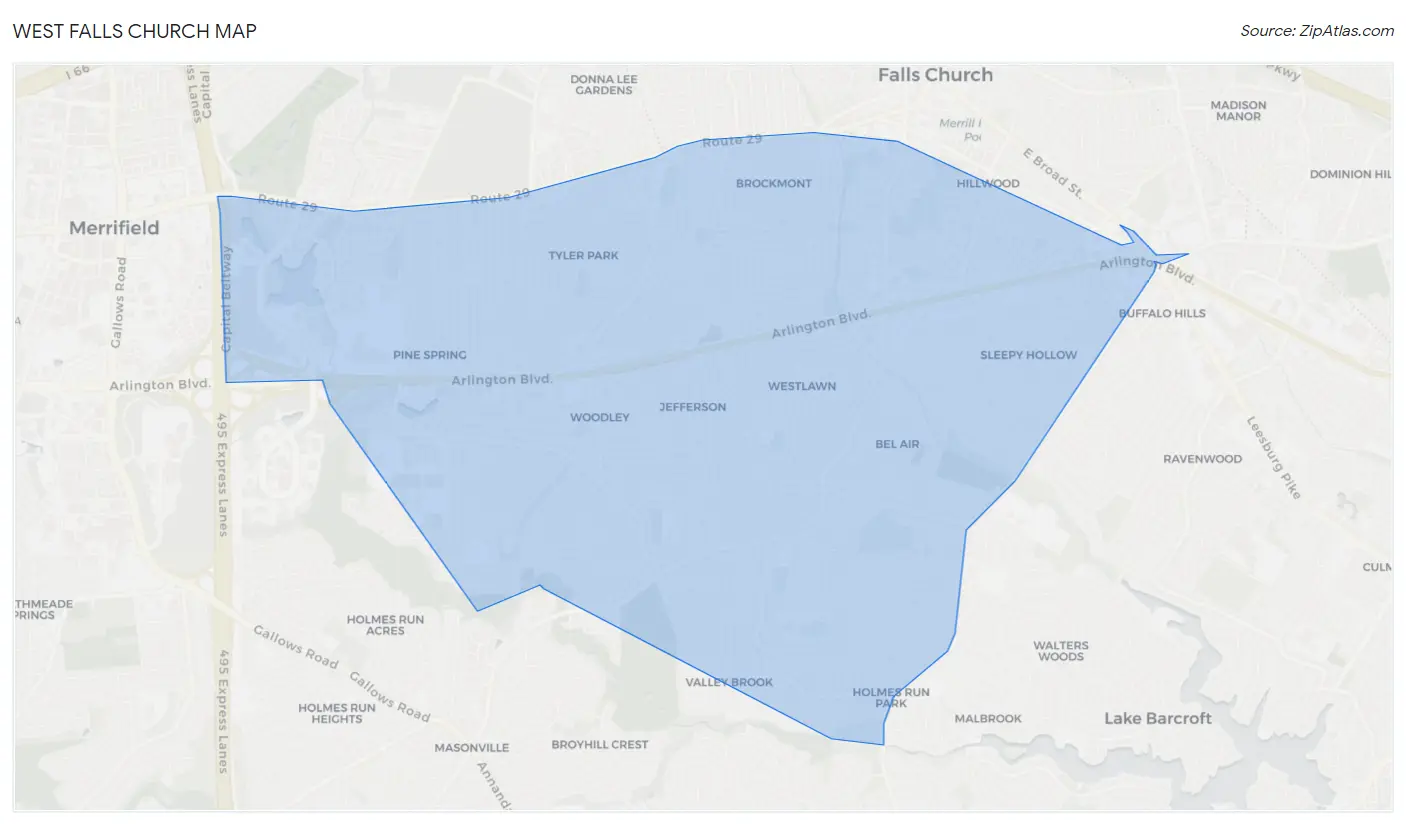
West Falls Church, VA Map & Demographics
West Falls Church Map
West Falls Church Overview
$53,513
PER CAPITA INCOME
$134,411
AVG FAMILY INCOME
$126,737
AVG HOUSEHOLD INCOME
21.5%
WAGE / INCOME GAP [ % ]
78.5¢/ $1
WAGE / INCOME GAP [ $ ]
0.40
INEQUALITY / GINI INDEX
31,121
TOTAL POPULATION
15,379
MALE POPULATION
15,742
FEMALE POPULATION
97.69
MALES / 100 FEMALES
102.36
FEMALES / 100 MALES
37.6
MEDIAN AGE
3.4
AVG FAMILY SIZE
3.0
AVG HOUSEHOLD SIZE
18,410
LABOR FORCE [ PEOPLE ]
73.6%
PERCENT IN LABOR FORCE
5.7%
UNEMPLOYMENT RATE
Income in West Falls Church
Income Overview in West Falls Church
Per Capita Income in West Falls Church is $53,513, while median incomes of families and households are $134,411 and $126,737 respectively.
| Characteristic | Number | Measure |
| Per Capita Income | 31,121 | $53,513 |
| Median Family Income | 7,229 | $134,411 |
| Mean Family Income | 7,229 | $167,332 |
| Median Household Income | 10,540 | $126,737 |
| Mean Household Income | 10,540 | $155,176 |
| Income Deficit | 7,229 | $0 |
| Wage / Income Gap (%) | 31,121 | 21.54% |
| Wage / Income Gap ($) | 31,121 | 78.46¢ per $1 |
| Gini / Inequality Index | 31,121 | 0.40 |
Earnings by Sex in West Falls Church
Average Earnings in West Falls Church are $52,582, $56,974 for men and $44,702 for women, a difference of 21.5%.
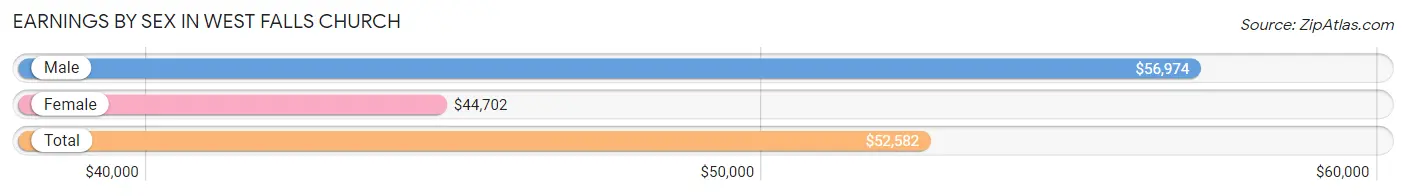
| Sex | Number | Average Earnings |
| Male | 9,965 (52.4%) | $56,974 |
| Female | 9,054 (47.6%) | $44,702 |
| Total | 19,019 (100.0%) | $52,582 |
Earnings by Sex by Income Bracket in West Falls Church
The most common earnings brackets in West Falls Church are $100,000+ for men (3,199 | 32.1%) and $100,000+ for women (2,096 | 23.2%).
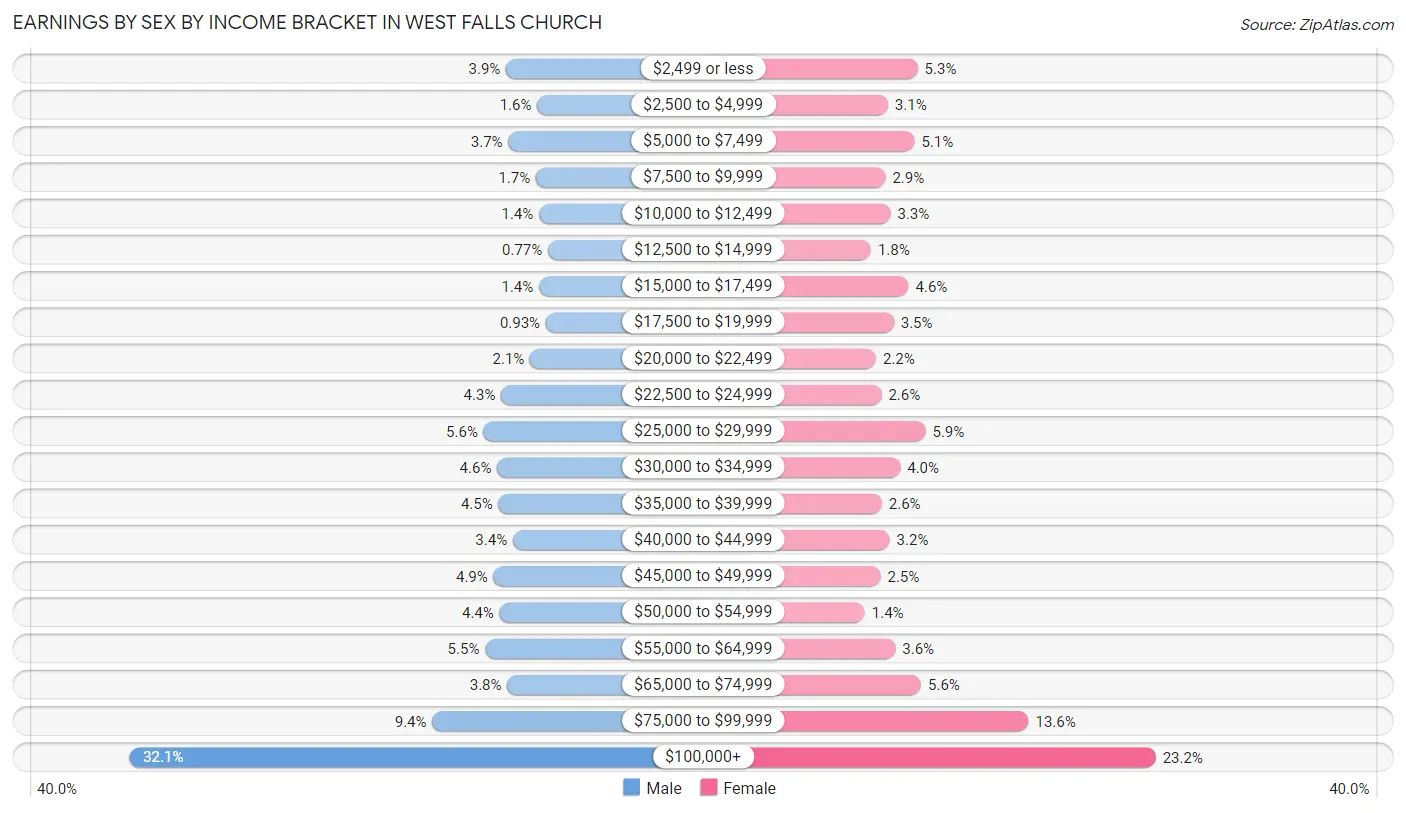
| Income | Male | Female |
| $2,499 or less | 390 (3.9%) | 481 (5.3%) |
| $2,500 to $4,999 | 157 (1.6%) | 279 (3.1%) |
| $5,000 to $7,499 | 373 (3.7%) | 459 (5.1%) |
| $7,500 to $9,999 | 166 (1.7%) | 263 (2.9%) |
| $10,000 to $12,499 | 143 (1.4%) | 297 (3.3%) |
| $12,500 to $14,999 | 77 (0.8%) | 164 (1.8%) |
| $15,000 to $17,499 | 143 (1.4%) | 419 (4.6%) |
| $17,500 to $19,999 | 93 (0.9%) | 319 (3.5%) |
| $20,000 to $22,499 | 210 (2.1%) | 198 (2.2%) |
| $22,500 to $24,999 | 427 (4.3%) | 235 (2.6%) |
| $25,000 to $29,999 | 557 (5.6%) | 534 (5.9%) |
| $30,000 to $34,999 | 456 (4.6%) | 363 (4.0%) |
| $35,000 to $39,999 | 446 (4.5%) | 238 (2.6%) |
| $40,000 to $44,999 | 339 (3.4%) | 291 (3.2%) |
| $45,000 to $49,999 | 483 (4.9%) | 229 (2.5%) |
| $50,000 to $54,999 | 438 (4.4%) | 122 (1.3%) |
| $55,000 to $64,999 | 546 (5.5%) | 330 (3.6%) |
| $65,000 to $74,999 | 381 (3.8%) | 504 (5.6%) |
| $75,000 to $99,999 | 941 (9.4%) | 1,233 (13.6%) |
| $100,000+ | 3,199 (32.1%) | 2,096 (23.2%) |
| Total | 9,965 (100.0%) | 9,054 (100.0%) |
Earnings by Sex by Educational Attainment in West Falls Church
Average earnings in West Falls Church are $67,518 for men and $63,292 for women, a difference of 6.3%. Men with an educational attainment of graduate degree enjoy the highest average annual earnings of $133,735, while those with high school diploma education earn the least with $36,354. Women with an educational attainment of graduate degree earn the most with the average annual earnings of $94,961, while those with less than high school education have the smallest earnings of $17,127.
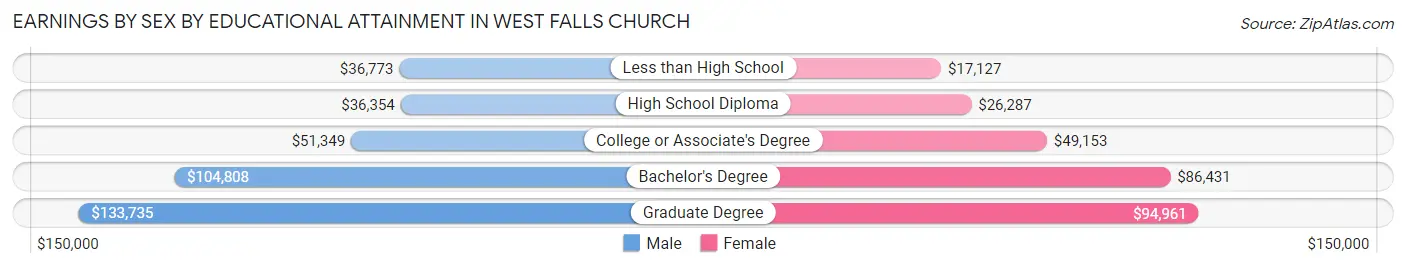
| Educational Attainment | Male Income | Female Income |
| Less than High School | $36,773 | $17,127 |
| High School Diploma | $36,354 | $26,287 |
| College or Associate's Degree | $51,349 | $49,153 |
| Bachelor's Degree | $104,808 | $86,431 |
| Graduate Degree | $133,735 | $94,961 |
| Total | $67,518 | $63,292 |
Family Income in West Falls Church
Family Income Brackets in West Falls Church
According to the West Falls Church family income data, there are 2,147 families falling into the $200,000+ income range, which is the most common income bracket and makes up 29.7% of all families. Conversely, the $10,000 to $14,999 income bracket is the least frequent group with only 7 families (0.1%) belonging to this category.
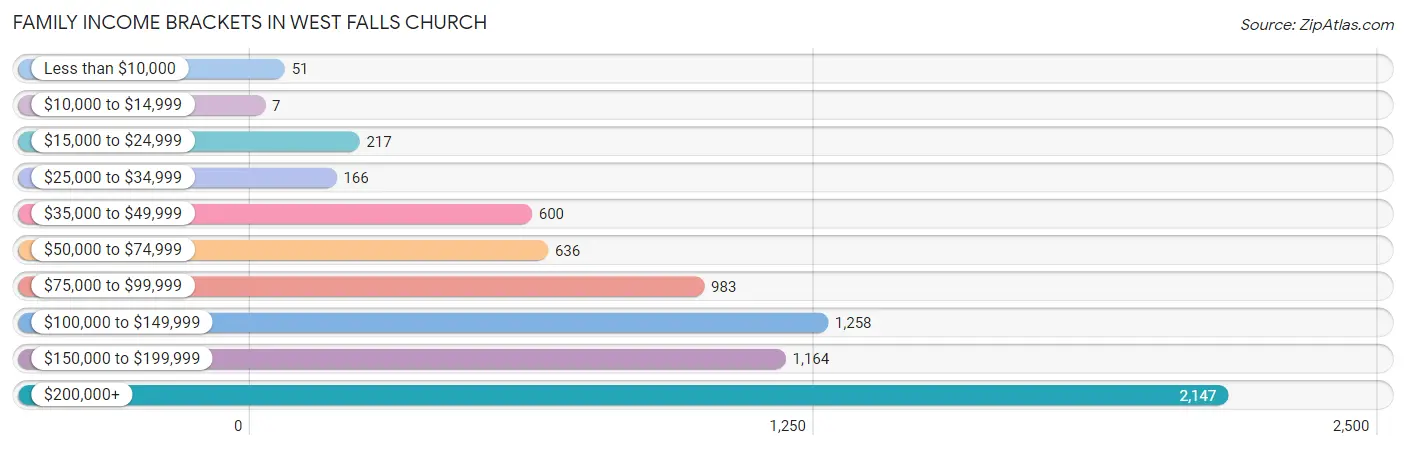
| Income Bracket | # Families | % Families |
| Less than $10,000 | 51 | 0.7% |
| $10,000 to $14,999 | 7 | 0.1% |
| $15,000 to $24,999 | 217 | 3.0% |
| $25,000 to $34,999 | 166 | 2.3% |
| $35,000 to $49,999 | 600 | 8.3% |
| $50,000 to $74,999 | 636 | 8.8% |
| $75,000 to $99,999 | 983 | 13.6% |
| $100,000 to $149,999 | 1,258 | 17.4% |
| $150,000 to $199,999 | 1,164 | 16.1% |
| $200,000+ | 2,147 | 29.7% |
Family Income by Famaliy Size in West Falls Church
4-person families (1,590 | 22.0%) account for the highest median family income in West Falls Church with $164,111 per family, while 2-person families (2,776 | 38.4%) have the highest median income of $66,250 per family member.
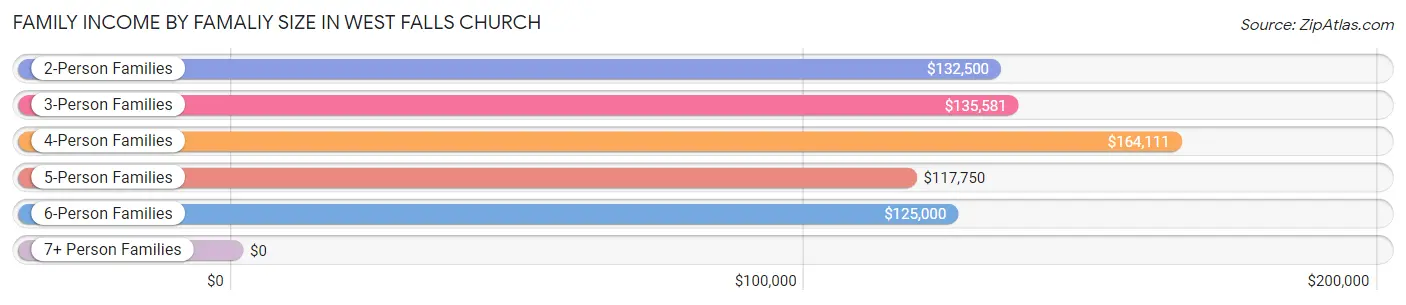
| Income Bracket | # Families | Median Income |
| 2-Person Families | 2,776 (38.4%) | $132,500 |
| 3-Person Families | 1,967 (27.2%) | $135,581 |
| 4-Person Families | 1,590 (22.0%) | $164,111 |
| 5-Person Families | 596 (8.2%) | $117,750 |
| 6-Person Families | 110 (1.5%) | $125,000 |
| 7+ Person Families | 190 (2.6%) | $0 |
| Total | 7,229 (100.0%) | $134,411 |
Family Income by Number of Earners in West Falls Church
The median family income in West Falls Church is $134,411, with families comprising 2 earners (3,498) having the highest median family income of $179,500, while families with no earners (523) have the lowest median family income of $99,154, accounting for 48.4% and 7.2% of families, respectively.
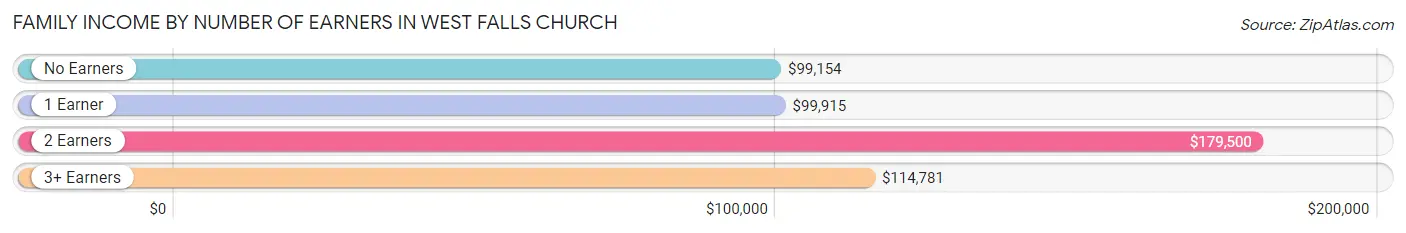
| Number of Earners | # Families | Median Income |
| No Earners | 523 (7.2%) | $99,154 |
| 1 Earner | 1,943 (26.9%) | $99,915 |
| 2 Earners | 3,498 (48.4%) | $179,500 |
| 3+ Earners | 1,265 (17.5%) | $114,781 |
| Total | 7,229 (100.0%) | $134,411 |
Household Income in West Falls Church
Household Income Brackets in West Falls Church
With 2,624 households falling in the category, the $200,000+ income range is the most frequent in West Falls Church, accounting for 24.9% of all households. In contrast, only 116 households (1.1%) fall into the $10,000 to $14,999 income bracket, making it the least populous group.
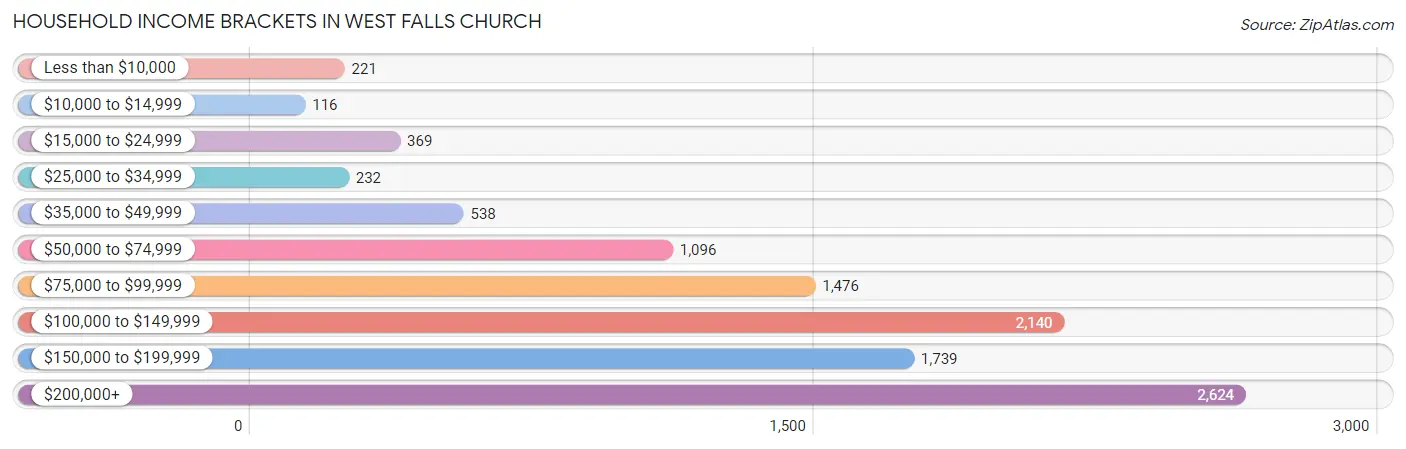
| Income Bracket | # Households | % Households |
| Less than $10,000 | 221 | 2.1% |
| $10,000 to $14,999 | 116 | 1.1% |
| $15,000 to $24,999 | 369 | 3.5% |
| $25,000 to $34,999 | 232 | 2.2% |
| $35,000 to $49,999 | 538 | 5.1% |
| $50,000 to $74,999 | 1,096 | 10.4% |
| $75,000 to $99,999 | 1,476 | 14.0% |
| $100,000 to $149,999 | 2,140 | 20.3% |
| $150,000 to $199,999 | 1,739 | 16.5% |
| $200,000+ | 2,624 | 24.9% |
Household Income by Householder Age in West Falls Church
The median household income in West Falls Church is $126,737, with the highest median household income of $145,660 found in the 25 to 44 years age bracket for the primary householder. A total of 4,034 households (38.3%) fall into this category. Meanwhile, the 15 to 24 years age bracket for the primary householder has the lowest median household income of $56,479, with 246 households (2.3%) in this group.
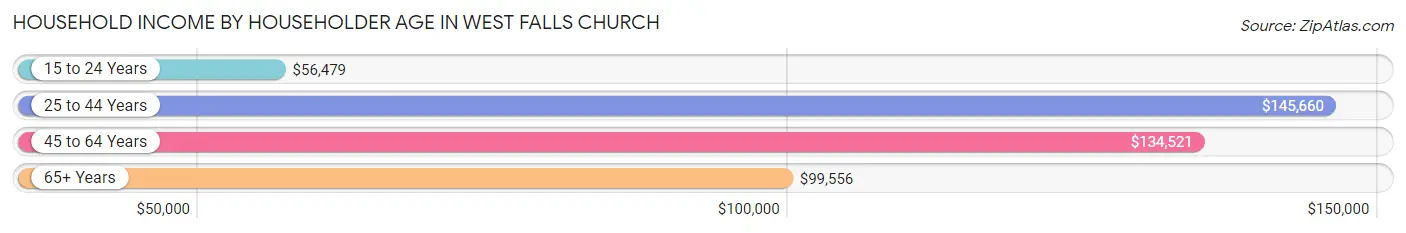
| Income Bracket | # Households | Median Income |
| 15 to 24 Years | 246 (2.3%) | $56,479 |
| 25 to 44 Years | 4,034 (38.3%) | $145,660 |
| 45 to 64 Years | 4,280 (40.6%) | $134,521 |
| 65+ Years | 1,980 (18.8%) | $99,556 |
| Total | 10,540 (100.0%) | $126,737 |
Poverty in West Falls Church
Income Below Poverty by Sex and Age in West Falls Church
With 5.9% poverty level for males and 7.5% for females among the residents of West Falls Church, 12 to 14 year old males and 15 year old females are the most vulnerable to poverty, with 62 males (13.8%) and 78 females (56.5%) in their respective age groups living below the poverty level.
| Age Bracket | Male | Female |
| Under 5 Years | 47 (5.9%) | 34 (2.1%) |
| 5 Years | 0 (0.0%) | 0 (0.0%) |
| 6 to 11 Years | 58 (5.9%) | 0 (0.0%) |
| 12 to 14 Years | 62 (13.8%) | 14 (4.3%) |
| 15 Years | 0 (0.0%) | 78 (56.5%) |
| 16 and 17 Years | 36 (11.4%) | 0 (0.0%) |
| 18 to 24 Years | 137 (8.8%) | 161 (11.1%) |
| 25 to 34 Years | 104 (4.5%) | 251 (11.9%) |
| 35 to 44 Years | 0 (0.0%) | 203 (8.0%) |
| 45 to 54 Years | 265 (10.5%) | 170 (8.1%) |
| 55 to 64 Years | 77 (4.9%) | 194 (11.2%) |
| 65 to 74 Years | 71 (5.2%) | 49 (4.3%) |
| 75 Years and over | 44 (6.1%) | 15 (1.9%) |
| Total | 901 (5.9%) | 1,169 (7.5%) |
Income Above Poverty by Sex and Age in West Falls Church
According to the poverty statistics in West Falls Church, males aged 5 years and females aged 5 years are the age groups that are most secure financially, with 100.0% of males and 100.0% of females in these age groups living above the poverty line.
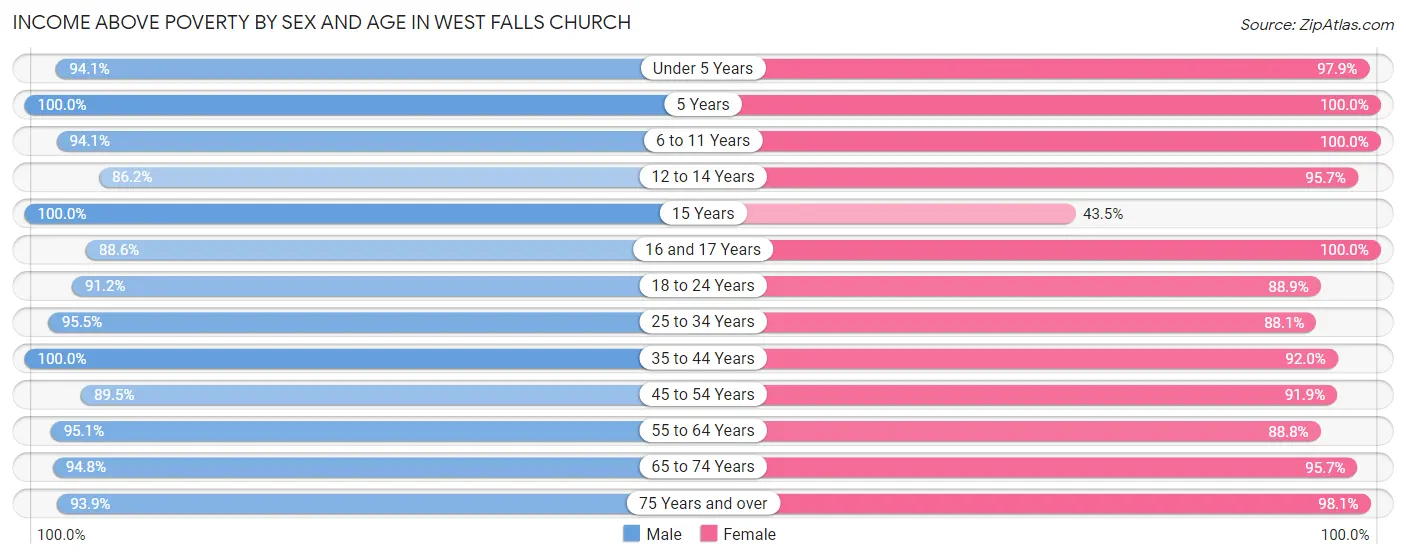
| Age Bracket | Male | Female |
| Under 5 Years | 749 (94.1%) | 1,574 (97.9%) |
| 5 Years | 150 (100.0%) | 309 (100.0%) |
| 6 to 11 Years | 916 (94.1%) | 945 (100.0%) |
| 12 to 14 Years | 386 (86.2%) | 315 (95.7%) |
| 15 Years | 84 (100.0%) | 60 (43.5%) |
| 16 and 17 Years | 280 (88.6%) | 364 (100.0%) |
| 18 to 24 Years | 1,416 (91.2%) | 1,284 (88.9%) |
| 25 to 34 Years | 2,204 (95.5%) | 1,850 (88.0%) |
| 35 to 44 Years | 2,420 (100.0%) | 2,345 (92.0%) |
| 45 to 54 Years | 2,262 (89.5%) | 1,931 (91.9%) |
| 55 to 64 Years | 1,507 (95.1%) | 1,544 (88.8%) |
| 65 to 74 Years | 1,284 (94.8%) | 1,091 (95.7%) |
| 75 Years and over | 682 (93.9%) | 773 (98.1%) |
| Total | 14,340 (94.1%) | 14,385 (92.5%) |
Income Below Poverty Among Married-Couple Families in West Falls Church
The poverty statistics for married-couple families in West Falls Church show that 3.3% or 181 of the total 5,446 families live below the poverty line. Families with no children have the highest poverty rate of 4.5%, comprising of 134 families. On the other hand, families with 1 or 2 children have the lowest poverty rate of 1.6%, which includes 35 families.
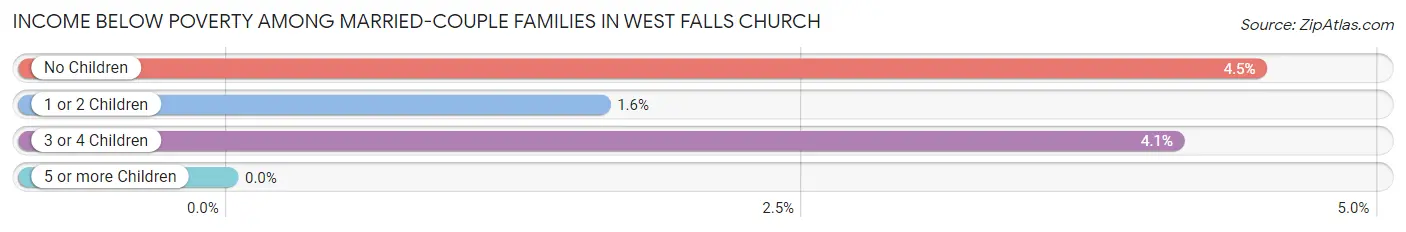
| Children | Above Poverty | Below Poverty |
| No Children | 2,854 (95.5%) | 134 (4.5%) |
| 1 or 2 Children | 2,132 (98.4%) | 35 (1.6%) |
| 3 or 4 Children | 279 (95.9%) | 12 (4.1%) |
| 5 or more Children | 0 (0.0%) | 0 (0.0%) |
| Total | 5,265 (96.7%) | 181 (3.3%) |
Income Below Poverty Among Single-Parent Households in West Falls Church
According to the poverty data in West Falls Church, 5.9% or 51 single-father households and 7.1% or 66 single-mother households are living below the poverty line. Among single-father households, those with 1 or 2 children have the highest poverty rate, with 51 households (12.3%) experiencing poverty. Likewise, among single-mother households, those with no children have the highest poverty rate, with 66 households (11.6%) falling below the poverty line.
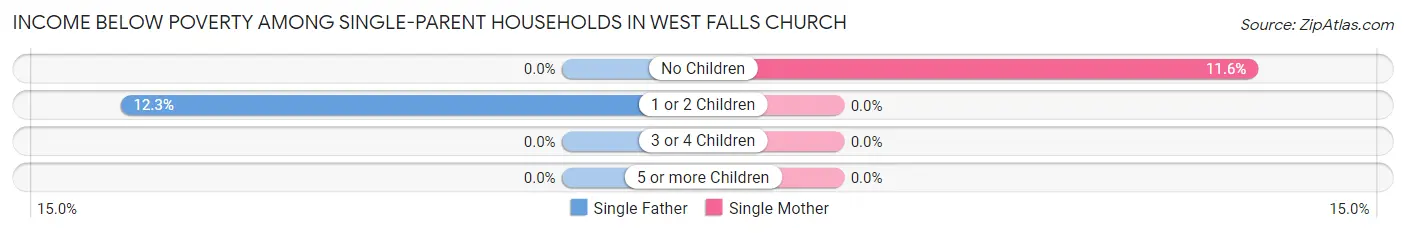
| Children | Single Father | Single Mother |
| No Children | 0 (0.0%) | 66 (11.6%) |
| 1 or 2 Children | 51 (12.3%) | 0 (0.0%) |
| 3 or 4 Children | 0 (0.0%) | 0 (0.0%) |
| 5 or more Children | 0 (0.0%) | 0 (0.0%) |
| Total | 51 (5.9%) | 66 (7.1%) |
Income Below Poverty Among Married-Couple vs Single-Parent Households in West Falls Church
The poverty data for West Falls Church shows that 181 of the married-couple family households (3.3%) and 117 of the single-parent households (6.6%) are living below the poverty level. Within the married-couple family households, those with no children have the highest poverty rate, with 134 households (4.5%) falling below the poverty line. Among the single-parent households, those with no children have the highest poverty rate, with 66 household (7.0%) living below poverty.
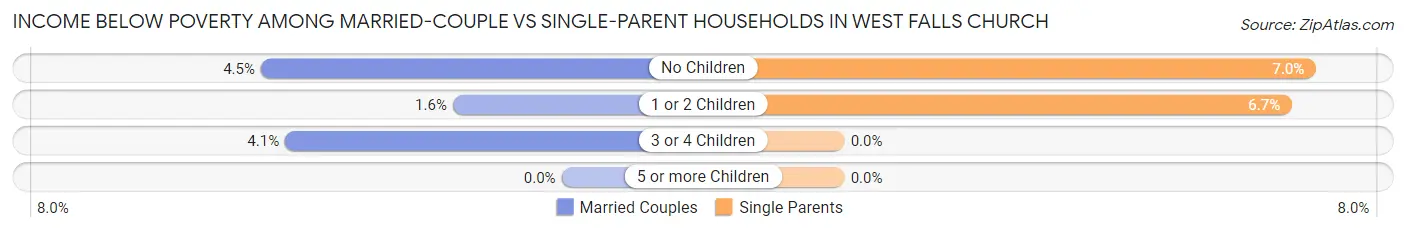
| Children | Married-Couple Families | Single-Parent Households |
| No Children | 134 (4.5%) | 66 (7.0%) |
| 1 or 2 Children | 35 (1.6%) | 51 (6.7%) |
| 3 or 4 Children | 12 (4.1%) | 0 (0.0%) |
| 5 or more Children | 0 (0.0%) | 0 (0.0%) |
| Total | 181 (3.3%) | 117 (6.6%) |
Race in West Falls Church
The most populous races in West Falls Church are White / Caucasian (14,446 | 46.4%), Hispanic or Latino (11,861 | 38.1%), and Some other Race (7,668 | 24.6%).
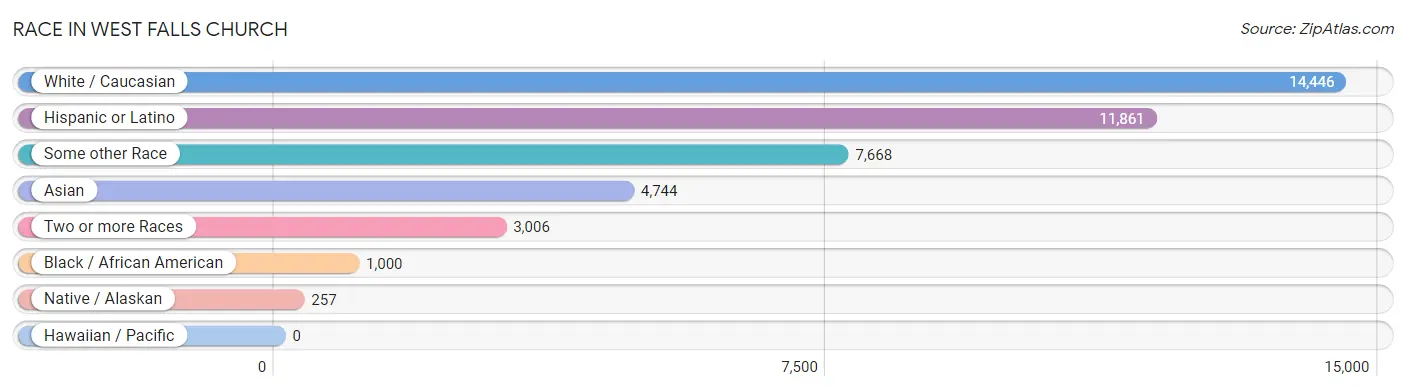
| Race | # Population | % Population |
| Asian | 4,744 | 15.2% |
| Black / African American | 1,000 | 3.2% |
| Hawaiian / Pacific | 0 | 0.0% |
| Hispanic or Latino | 11,861 | 38.1% |
| Native / Alaskan | 257 | 0.8% |
| White / Caucasian | 14,446 | 46.4% |
| Two or more Races | 3,006 | 9.7% |
| Some other Race | 7,668 | 24.6% |
| Total | 31,121 | 100.0% |
Ancestry in West Falls Church
The most populous ancestries reported in West Falls Church are Central American (5,587 | 17.9%), South American (4,326 | 13.9%), German (3,002 | 9.7%), Bolivian (2,968 | 9.5%), and Sri Lankan (2,675 | 8.6%), together accounting for 59.6% of all West Falls Church residents.
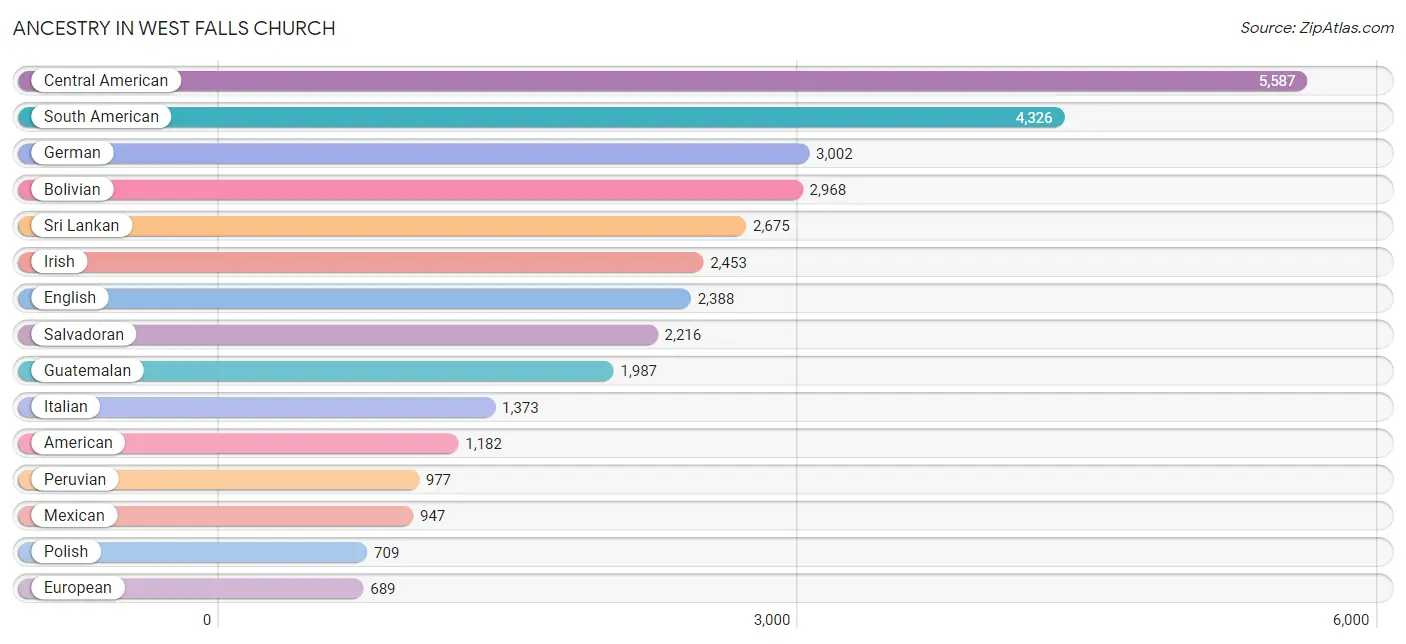
| Ancestry | # Population | % Population |
| Afghan | 42 | 0.1% |
| African | 59 | 0.2% |
| Albanian | 13 | 0.0% |
| American | 1,182 | 3.8% |
| Arab | 357 | 1.1% |
| Argentinean | 75 | 0.2% |
| Armenian | 12 | 0.0% |
| Austrian | 102 | 0.3% |
| Basque | 29 | 0.1% |
| Belgian | 8 | 0.0% |
| Bhutanese | 116 | 0.4% |
| Bolivian | 2,968 | 9.5% |
| Brazilian | 62 | 0.2% |
| British | 161 | 0.5% |
| Bulgarian | 53 | 0.2% |
| Burmese | 144 | 0.5% |
| Cambodian | 14 | 0.0% |
| Canadian | 64 | 0.2% |
| Central American | 5,587 | 17.9% |
| Central American Indian | 194 | 0.6% |
| Cherokee | 23 | 0.1% |
| Chickasaw | 8 | 0.0% |
| Chilean | 4 | 0.0% |
| Choctaw | 20 | 0.1% |
| Colombian | 50 | 0.2% |
| Costa Rican | 136 | 0.4% |
| Croatian | 77 | 0.3% |
| Cuban | 26 | 0.1% |
| Cypriot | 7 | 0.0% |
| Czech | 126 | 0.4% |
| Danish | 178 | 0.6% |
| Dominican | 20 | 0.1% |
| Dutch | 358 | 1.1% |
| Eastern European | 100 | 0.3% |
| Ecuadorian | 177 | 0.6% |
| Egyptian | 8 | 0.0% |
| English | 2,388 | 7.7% |
| Ethiopian | 219 | 0.7% |
| European | 689 | 2.2% |
| Finnish | 82 | 0.3% |
| French | 397 | 1.3% |
| French Canadian | 133 | 0.4% |
| German | 3,002 | 9.7% |
| Greek | 73 | 0.2% |
| Guatemalan | 1,987 | 6.4% |
| Honduran | 549 | 1.8% |
| Hungarian | 55 | 0.2% |
| Indian (Asian) | 499 | 1.6% |
| Iranian | 150 | 0.5% |
| Iraqi | 4 | 0.0% |
| Irish | 2,453 | 7.9% |
| Israeli | 5 | 0.0% |
| Italian | 1,373 | 4.4% |
| Japanese | 110 | 0.4% |
| Jordanian | 21 | 0.1% |
| Korean | 333 | 1.1% |
| Laotian | 29 | 0.1% |
| Lebanese | 188 | 0.6% |
| Lithuanian | 67 | 0.2% |
| Macedonian | 29 | 0.1% |
| Malaysian | 145 | 0.5% |
| Mexican | 947 | 3.0% |
| Mexican American Indian | 8 | 0.0% |
| Mongolian | 15 | 0.1% |
| Moroccan | 61 | 0.2% |
| Native Hawaiian | 16 | 0.1% |
| Nicaraguan | 491 | 1.6% |
| Northern European | 64 | 0.2% |
| Norwegian | 205 | 0.7% |
| Ottawa | 3 | 0.0% |
| Pakistani | 174 | 0.6% |
| Panamanian | 208 | 0.7% |
| Paraguayan | 57 | 0.2% |
| Peruvian | 977 | 3.1% |
| Polish | 709 | 2.3% |
| Portuguese | 46 | 0.2% |
| Puerto Rican | 295 | 0.9% |
| Romanian | 50 | 0.2% |
| Russian | 260 | 0.8% |
| Salvadoran | 2,216 | 7.1% |
| Scandinavian | 57 | 0.2% |
| Scotch-Irish | 295 | 0.9% |
| Scottish | 578 | 1.9% |
| Serbian | 3 | 0.0% |
| Sioux | 7 | 0.0% |
| Slavic | 8 | 0.0% |
| Slovak | 75 | 0.2% |
| Slovene | 9 | 0.0% |
| South American | 4,326 | 13.9% |
| South American Indian | 340 | 1.1% |
| Spaniard | 22 | 0.1% |
| Spanish | 86 | 0.3% |
| Sri Lankan | 2,675 | 8.6% |
| Subsaharan African | 292 | 0.9% |
| Sudanese | 5 | 0.0% |
| Swedish | 356 | 1.1% |
| Swiss | 74 | 0.2% |
| Syrian | 33 | 0.1% |
| Thai | 571 | 1.8% |
| Turkish | 125 | 0.4% |
| Ukrainian | 49 | 0.2% |
| Venezuelan | 18 | 0.1% |
| Vietnamese | 78 | 0.3% |
| Welsh | 199 | 0.6% |
| West Indian | 61 | 0.2% | View All 105 Rows |
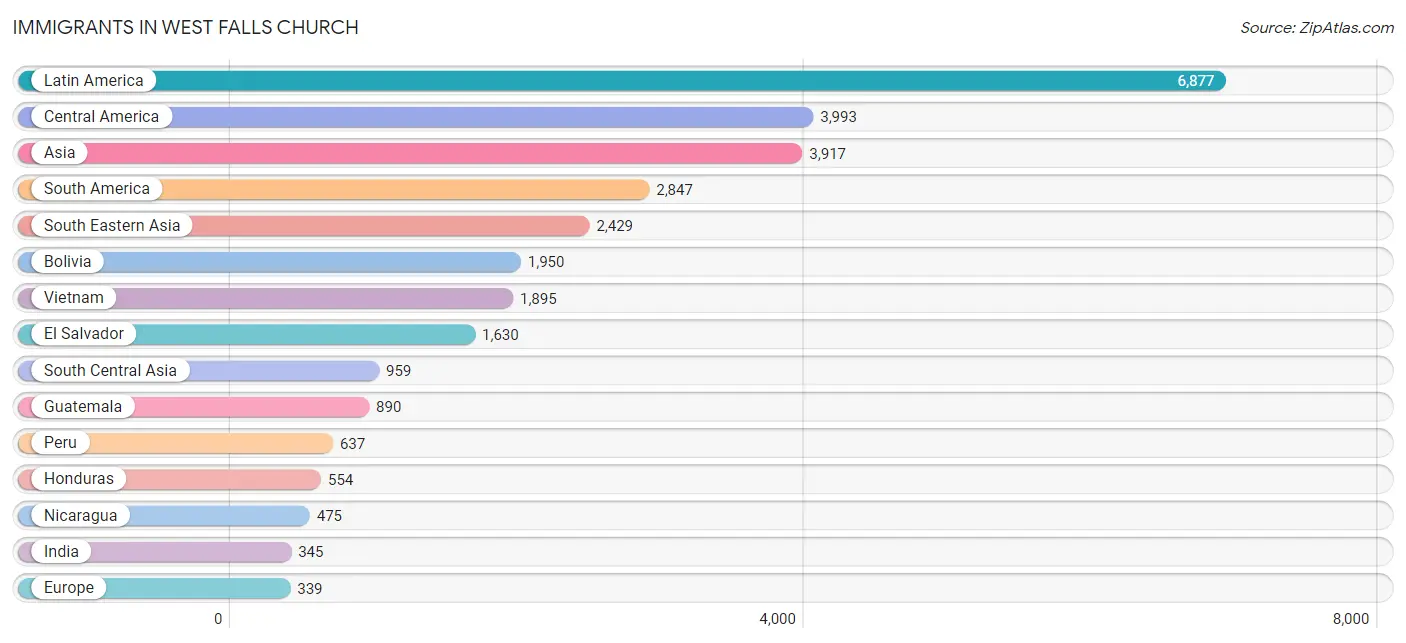
Immigrants in West Falls Church
The most numerous immigrant groups reported in West Falls Church came from Latin America (6,877 | 22.1%), Central America (3,993 | 12.8%), Asia (3,917 | 12.6%), South America (2,847 | 9.1%), and South Eastern Asia (2,429 | 7.8%), together accounting for 64.5% of all West Falls Church residents.
| Immigration Origin | # Population | % Population |
| Afghanistan | 42 | 0.1% |
| Africa | 260 | 0.8% |
| Albania | 13 | 0.0% |
| Argentina | 57 | 0.2% |
| Asia | 3,917 | 12.6% |
| Austria | 11 | 0.0% |
| Bangladesh | 86 | 0.3% |
| Bolivia | 1,950 | 6.3% |
| Bosnia and Herzegovina | 3 | 0.0% |
| Brazil | 19 | 0.1% |
| Bulgaria | 43 | 0.1% |
| Cambodia | 19 | 0.1% |
| Canada | 33 | 0.1% |
| Caribbean | 37 | 0.1% |
| Central America | 3,993 | 12.8% |
| Chile | 4 | 0.0% |
| China | 193 | 0.6% |
| Colombia | 19 | 0.1% |
| Costa Rica | 125 | 0.4% |
| Cuba | 19 | 0.1% |
| Czechoslovakia | 8 | 0.0% |
| Dominican Republic | 14 | 0.0% |
| Eastern Africa | 196 | 0.6% |
| Eastern Asia | 332 | 1.1% |
| Eastern Europe | 193 | 0.6% |
| Ecuador | 135 | 0.4% |
| El Salvador | 1,630 | 5.2% |
| England | 25 | 0.1% |
| Ethiopia | 189 | 0.6% |
| Europe | 339 | 1.1% |
| France | 12 | 0.0% |
| Germany | 32 | 0.1% |
| Greece | 4 | 0.0% |
| Guatemala | 890 | 2.9% |
| Honduras | 554 | 1.8% |
| Hong Kong | 55 | 0.2% |
| India | 345 | 1.1% |
| Iran | 151 | 0.5% |
| Iraq | 4 | 0.0% |
| Ireland | 14 | 0.0% |
| Japan | 40 | 0.1% |
| Jordan | 42 | 0.1% |
| Kazakhstan | 13 | 0.0% |
| Kenya | 7 | 0.0% |
| Korea | 93 | 0.3% |
| Kuwait | 13 | 0.0% |
| Laos | 95 | 0.3% |
| Latin America | 6,877 | 22.1% |
| Lebanon | 16 | 0.1% |
| Malaysia | 24 | 0.1% |
| Mexico | 319 | 1.0% |
| Morocco | 54 | 0.2% |
| Nepal | 163 | 0.5% |
| Nicaragua | 475 | 1.5% |
| Northern Africa | 64 | 0.2% |
| Northern Europe | 71 | 0.2% |
| Pakistan | 6 | 0.0% |
| Peru | 637 | 2.1% |
| Philippines | 261 | 0.8% |
| Poland | 4 | 0.0% |
| Portugal | 7 | 0.0% |
| Romania | 6 | 0.0% |
| Russia | 86 | 0.3% |
| Scotland | 4 | 0.0% |
| Singapore | 35 | 0.1% |
| South America | 2,847 | 9.1% |
| South Central Asia | 959 | 3.1% |
| South Eastern Asia | 2,429 | 7.8% |
| Southern Europe | 20 | 0.1% |
| Spain | 9 | 0.0% |
| Sri Lanka | 153 | 0.5% |
| Sudan | 5 | 0.0% |
| Syria | 27 | 0.1% |
| Taiwan | 44 | 0.1% |
| Thailand | 97 | 0.3% |
| Trinidad and Tobago | 4 | 0.0% |
| Turkey | 70 | 0.2% |
| Venezuela | 9 | 0.0% |
| Vietnam | 1,895 | 6.1% |
| Western Asia | 197 | 0.6% |
| Western Europe | 55 | 0.2% | View All 81 Rows |
Sex and Age in West Falls Church
Sex and Age in West Falls Church
The most populous age groups in West Falls Church are 35 to 39 Years (1,476 | 9.6%) for men and Under 5 Years (1,608 | 10.2%) for women.
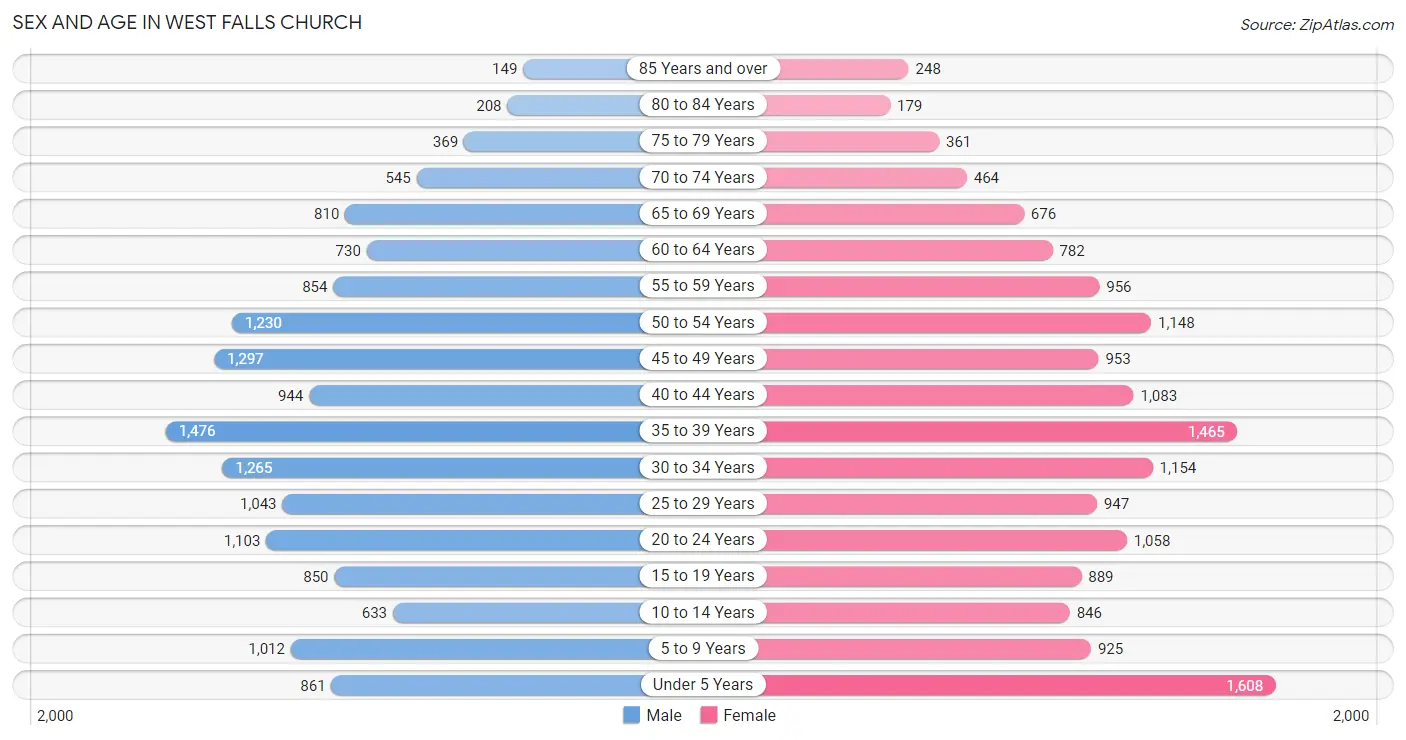
| Age Bracket | Male | Female |
| Under 5 Years | 861 (5.6%) | 1,608 (10.2%) |
| 5 to 9 Years | 1,012 (6.6%) | 925 (5.9%) |
| 10 to 14 Years | 633 (4.1%) | 846 (5.4%) |
| 15 to 19 Years | 850 (5.5%) | 889 (5.7%) |
| 20 to 24 Years | 1,103 (7.2%) | 1,058 (6.7%) |
| 25 to 29 Years | 1,043 (6.8%) | 947 (6.0%) |
| 30 to 34 Years | 1,265 (8.2%) | 1,154 (7.3%) |
| 35 to 39 Years | 1,476 (9.6%) | 1,465 (9.3%) |
| 40 to 44 Years | 944 (6.1%) | 1,083 (6.9%) |
| 45 to 49 Years | 1,297 (8.4%) | 953 (6.0%) |
| 50 to 54 Years | 1,230 (8.0%) | 1,148 (7.3%) |
| 55 to 59 Years | 854 (5.6%) | 956 (6.1%) |
| 60 to 64 Years | 730 (4.8%) | 782 (5.0%) |
| 65 to 69 Years | 810 (5.3%) | 676 (4.3%) |
| 70 to 74 Years | 545 (3.5%) | 464 (2.9%) |
| 75 to 79 Years | 369 (2.4%) | 361 (2.3%) |
| 80 to 84 Years | 208 (1.3%) | 179 (1.1%) |
| 85 Years and over | 149 (1.0%) | 248 (1.6%) |
| Total | 15,379 (100.0%) | 15,742 (100.0%) |
Families and Households in West Falls Church
Median Family Size in West Falls Church
The median family size in West Falls Church is 3.40 persons per family, with single male/father families (857 | 11.9%) accounting for the largest median family size of 4.21 persons per family. On the other hand, married-couple families (5,446 | 75.3%) represent the smallest median family size with 3.29 persons per family.
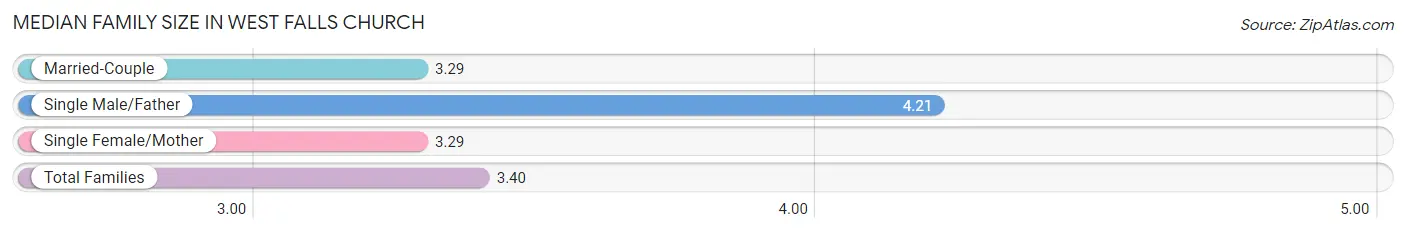
| Family Type | # Families | Family Size |
| Married-Couple | 5,446 (75.3%) | 3.29 |
| Single Male/Father | 857 (11.9%) | 4.21 |
| Single Female/Mother | 926 (12.8%) | 3.29 |
| Total Families | 7,229 (100.0%) | 3.40 |
Median Household Size in West Falls Church
The median household size in West Falls Church is 2.95 persons per household, with single male/father households (857 | 8.1%) accounting for the largest median household size of 4.93 persons per household. non-family households (3,311 | 31.4%) represent the smallest median household size with 1.48 persons per household.
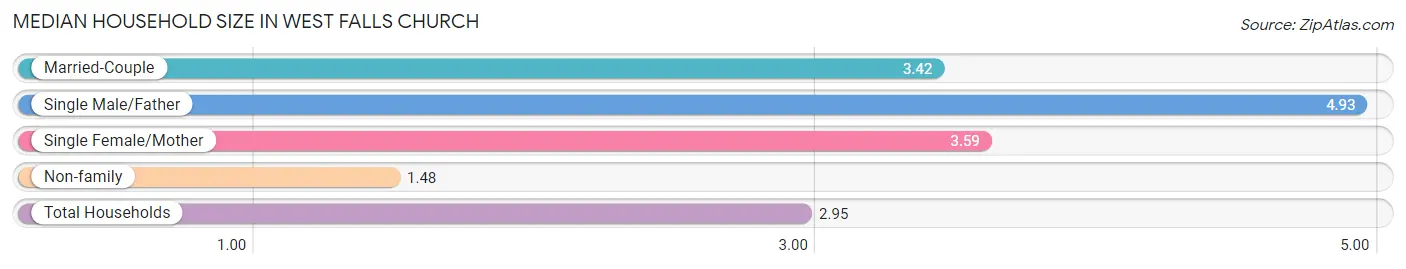
| Household Type | # Households | Household Size |
| Married-Couple | 5,446 (51.7%) | 3.42 |
| Single Male/Father | 857 (8.1%) | 4.93 |
| Single Female/Mother | 926 (8.8%) | 3.59 |
| Non-family | 3,311 (31.4%) | 1.48 |
| Total Households | 10,540 (100.0%) | 2.95 |
Household Size by Marriage Status in West Falls Church
Out of a total of 10,540 households in West Falls Church, 7,229 (68.6%) are family households, while 3,311 (31.4%) are nonfamily households. The most numerous type of family households are 2-person households, comprising 2,482, and the most common type of nonfamily households are 1-person households, comprising 2,280.
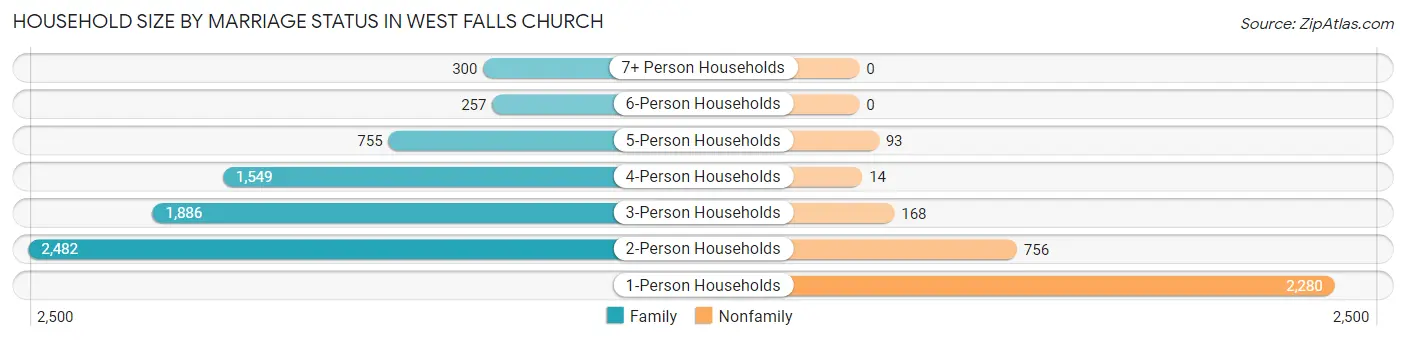
| Household Size | Family Households | Nonfamily Households |
| 1-Person Households | - | 2,280 (21.6%) |
| 2-Person Households | 2,482 (23.5%) | 756 (7.2%) |
| 3-Person Households | 1,886 (17.9%) | 168 (1.6%) |
| 4-Person Households | 1,549 (14.7%) | 14 (0.1%) |
| 5-Person Households | 755 (7.2%) | 93 (0.9%) |
| 6-Person Households | 257 (2.4%) | 0 (0.0%) |
| 7+ Person Households | 300 (2.9%) | 0 (0.0%) |
| Total | 7,229 (68.6%) | 3,311 (31.4%) |
Female Fertility in West Falls Church
Fertility by Age in West Falls Church
Average fertility rate in West Falls Church is 55.0 births per 1,000 women. Women in the age bracket of 35 to 50 years have the highest fertility rate with 73.0 births per 1,000 women. Women in the age bracket of 35 to 50 years acount for 63.8% of all women with births.
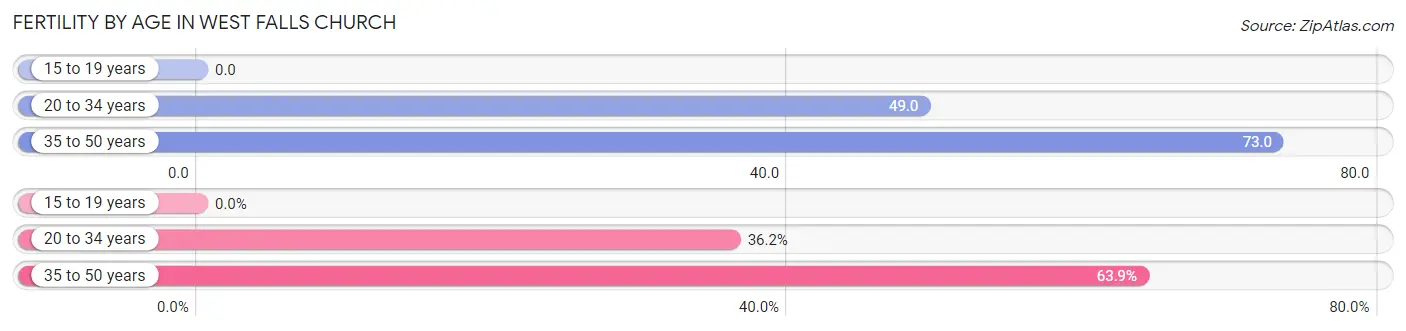
| Age Bracket | Women with Births | Births / 1,000 Women |
| 15 to 19 years | 0 (0.0%) | 0.0 |
| 20 to 34 years | 154 (36.1%) | 49.0 |
| 35 to 50 years | 272 (63.8%) | 73.0 |
| Total | 426 (100.0%) | 55.0 |
Fertility by Age by Marriage Status in West Falls Church
87.3% of women with births (426) in West Falls Church are married. The highest percentage of unmarried women with births falls into 35 to 50 years age bracket with 17.3% of them unmarried at the time of birth, while the lowest percentage of unmarried women with births belong to 20 to 34 years age bracket with 4.5% of them unmarried.
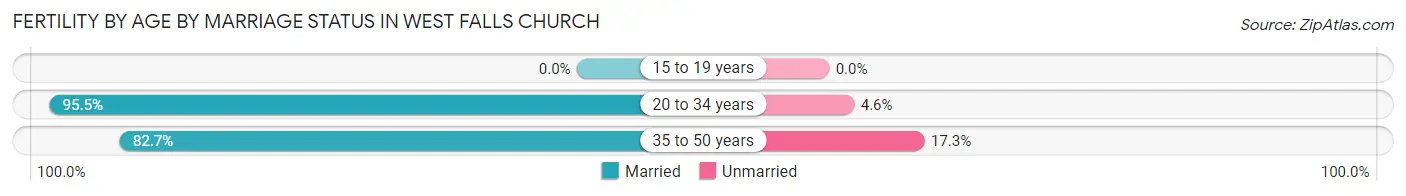
| Age Bracket | Married | Unmarried |
| 15 to 19 years | 0 (0.0%) | 0 (0.0%) |
| 20 to 34 years | 147 (95.5%) | 7 (4.5%) |
| 35 to 50 years | 225 (82.7%) | 47 (17.3%) |
| Total | 372 (87.3%) | 54 (12.7%) |
Fertility by Education in West Falls Church
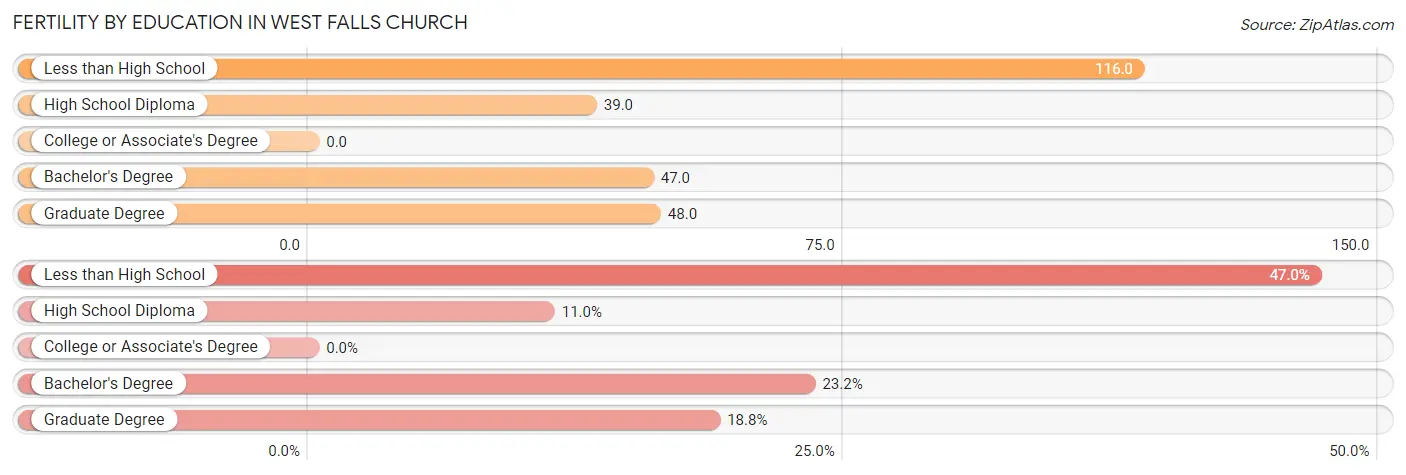
| Educational Attainment | Women with Births | Births / 1,000 Women |
| Less than High School | 200 (46.9%) | 116.0 |
| High School Diploma | 47 (11.0%) | 39.0 |
| College or Associate's Degree | 0 (0.0%) | 0.0 |
| Bachelor's Degree | 99 (23.2%) | 47.0 |
| Graduate Degree | 80 (18.8%) | 48.0 |
| Total | 426 (100.0%) | 55.0 |
Fertility by Education by Marriage Status in West Falls Church
12.7% of women with births in West Falls Church are unmarried. Women with the educational attainment of less than high school are most likely to be married with 100.0% of them married at childbirth, while women with the educational attainment of high school diploma are least likely to be married with 100.0% of them unmarried at childbirth.
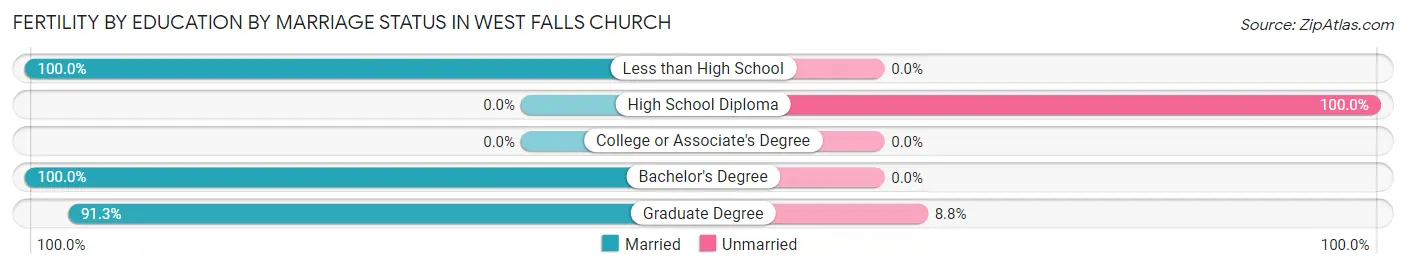
| Educational Attainment | Married | Unmarried |
| Less than High School | 200 (100.0%) | 0 (0.0%) |
| High School Diploma | 0 (0.0%) | 47 (100.0%) |
| College or Associate's Degree | 0 (0.0%) | 0 (0.0%) |
| Bachelor's Degree | 99 (100.0%) | 0 (0.0%) |
| Graduate Degree | 73 (91.2%) | 7 (8.7%) |
| Total | 372 (87.3%) | 54 (12.7%) |
Employment Characteristics in West Falls Church
Employment by Class of Employer in West Falls Church
Among the 16,942 employed individuals in West Falls Church, private company employees (10,270 | 60.6%), federal government employees (2,157 | 12.7%), and not-for-profit organizations (1,417 | 8.4%) make up the most common classes of employment.
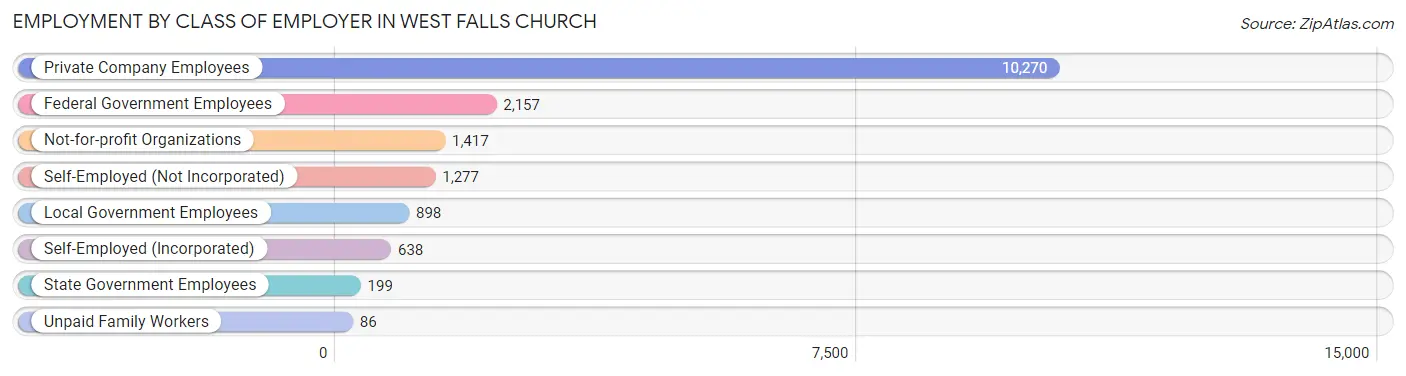
| Employer Class | # Employees | % Employees |
| Private Company Employees | 10,270 | 60.6% |
| Self-Employed (Incorporated) | 638 | 3.8% |
| Self-Employed (Not Incorporated) | 1,277 | 7.5% |
| Not-for-profit Organizations | 1,417 | 8.4% |
| Local Government Employees | 898 | 5.3% |
| State Government Employees | 199 | 1.2% |
| Federal Government Employees | 2,157 | 12.7% |
| Unpaid Family Workers | 86 | 0.5% |
| Total | 16,942 | 100.0% |
Employment Status by Age in West Falls Church
According to the labor force statistics for West Falls Church, out of the total population over 16 years of age (25,014), 73.6% or 18,410 individuals are in the labor force, with 5.7% or 1,049 of them unemployed. The age group with the highest labor force participation rate is 25 to 29 years, with 93.9% or 1,869 individuals in the labor force. Within the labor force, the 16 to 19 years age range has the highest percentage of unemployed individuals, with 17.7% or 131 of them being unemployed.
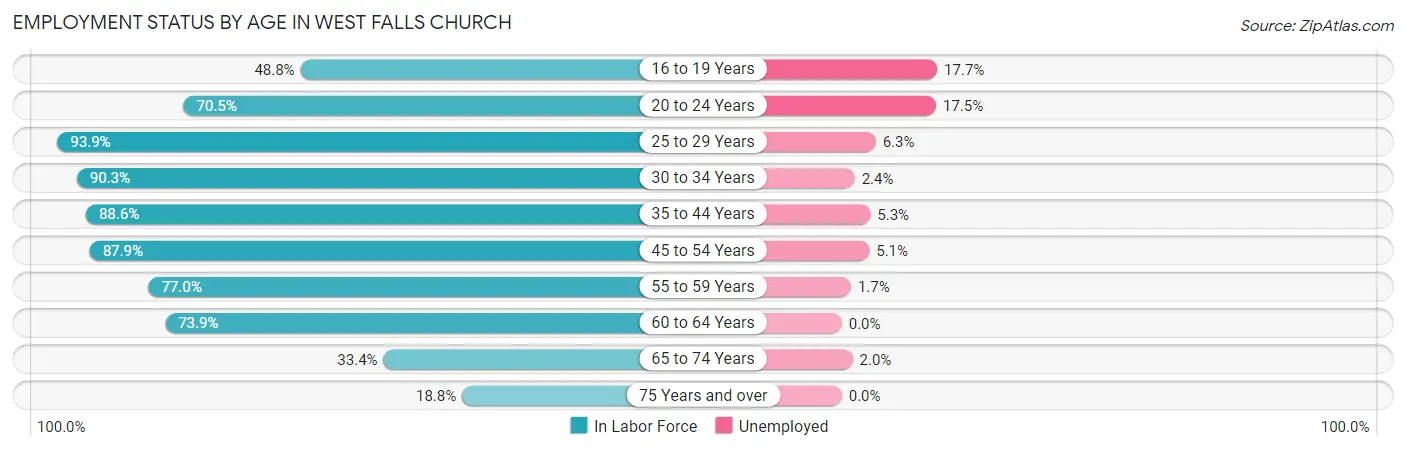
| Age Bracket | In Labor Force | Unemployed |
| 16 to 19 Years | 740 (48.8%) | 131 (17.7%) |
| 20 to 24 Years | 1,524 (70.5%) | 267 (17.5%) |
| 25 to 29 Years | 1,869 (93.9%) | 118 (6.3%) |
| 30 to 34 Years | 2,184 (90.3%) | 52 (2.4%) |
| 35 to 44 Years | 4,402 (88.6%) | 233 (5.3%) |
| 45 to 54 Years | 4,068 (87.9%) | 207 (5.1%) |
| 55 to 59 Years | 1,394 (77.0%) | 24 (1.7%) |
| 60 to 64 Years | 1,117 (73.9%) | 0 (0.0%) |
| 65 to 74 Years | 833 (33.4%) | 17 (2.0%) |
| 75 Years and over | 285 (18.8%) | 0 (0.0%) |
| Total | 18,410 (73.6%) | 1,049 (5.7%) |
Employment Status by Educational Attainment in West Falls Church
According to labor force statistics for West Falls Church, 86.8% of individuals (15,040) out of the total population between 25 and 64 years of age (17,327) are in the labor force, with 4.2% or 632 of them being unemployed. The group with the highest labor force participation rate are those with the educational attainment of bachelor's degree or higher, with 90.7% or 8,392 individuals in the labor force. Within the labor force, individuals with less than high school education have the highest percentage of unemployment, with 10.0% or 240 of them being unemployed.
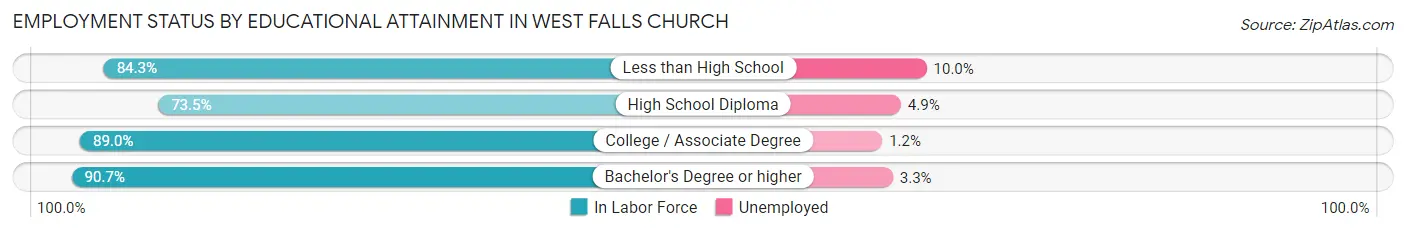
| Educational Attainment | In Labor Force | Unemployed |
| Less than High School | 2,401 (84.3%) | 285 (10.0%) |
| High School Diploma | 1,931 (73.5%) | 129 (4.9%) |
| College / Associate Degree | 2,313 (89.0%) | 31 (1.2%) |
| Bachelor's Degree or higher | 8,392 (90.7%) | 305 (3.3%) |
| Total | 15,040 (86.8%) | 728 (4.2%) |
Employment Occupations by Sex in West Falls Church
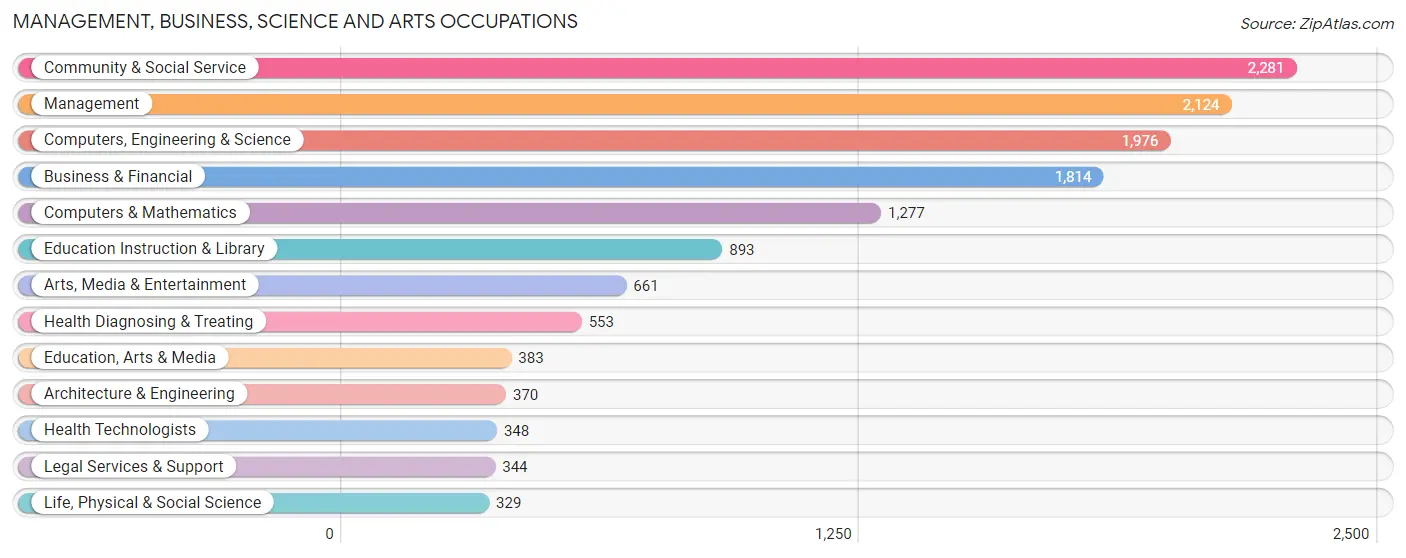
Management, Business, Science and Arts Occupations
The most common Management, Business, Science and Arts occupations in West Falls Church are Community & Social Service (2,281 | 13.2%), Management (2,124 | 12.3%), Computers, Engineering & Science (1,976 | 11.4%), Business & Financial (1,814 | 10.5%), and Computers & Mathematics (1,277 | 7.4%).
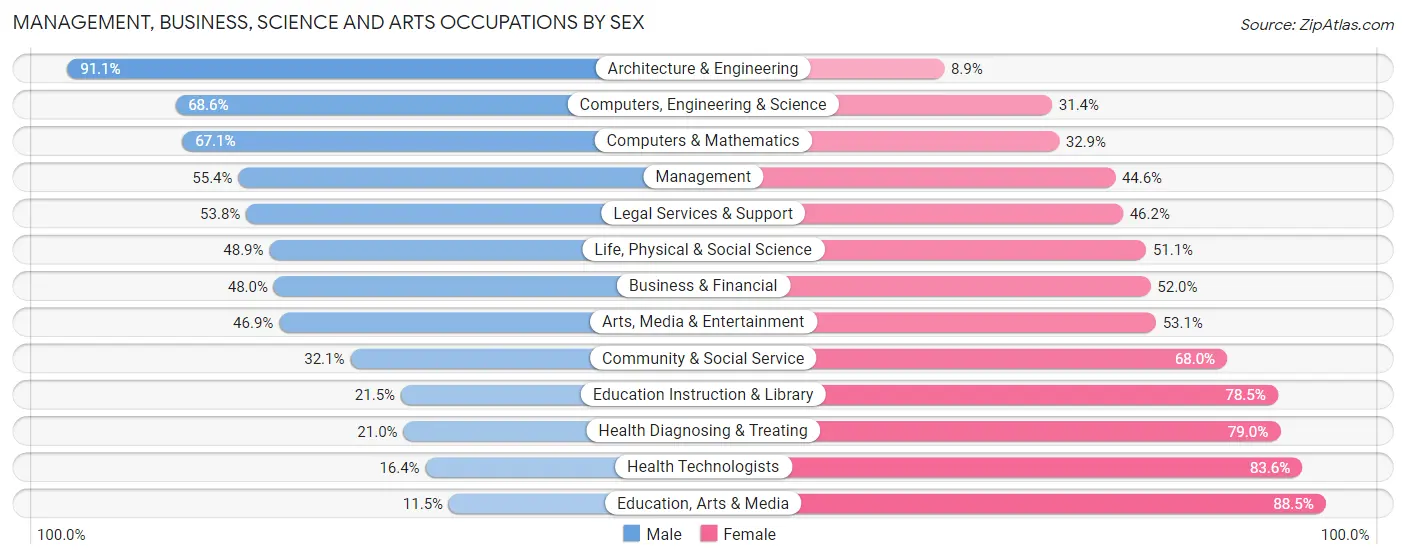
Management, Business, Science and Arts Occupations by Sex
Within the Management, Business, Science and Arts occupations in West Falls Church, the most male-oriented occupations are Architecture & Engineering (91.1%), Computers, Engineering & Science (68.6%), and Computers & Mathematics (67.1%), while the most female-oriented occupations are Education, Arts & Media (88.5%), Health Technologists (83.6%), and Health Diagnosing & Treating (79.0%).
| Occupation | Male | Female |
| Management | 1,177 (55.4%) | 947 (44.6%) |
| Business & Financial | 871 (48.0%) | 943 (52.0%) |
| Computers, Engineering & Science | 1,355 (68.6%) | 621 (31.4%) |
| Computers & Mathematics | 857 (67.1%) | 420 (32.9%) |
| Architecture & Engineering | 337 (91.1%) | 33 (8.9%) |
| Life, Physical & Social Science | 161 (48.9%) | 168 (51.1%) |
| Community & Social Service | 731 (32.1%) | 1,550 (67.9%) |
| Education, Arts & Media | 44 (11.5%) | 339 (88.5%) |
| Legal Services & Support | 185 (53.8%) | 159 (46.2%) |
| Education Instruction & Library | 192 (21.5%) | 701 (78.5%) |
| Arts, Media & Entertainment | 310 (46.9%) | 351 (53.1%) |
| Health Diagnosing & Treating | 116 (21.0%) | 437 (79.0%) |
| Health Technologists | 57 (16.4%) | 291 (83.6%) |
| Total (Category) | 4,250 (48.6%) | 4,498 (51.4%) |
| Total (Overall) | 9,261 (53.5%) | 8,043 (46.5%) |
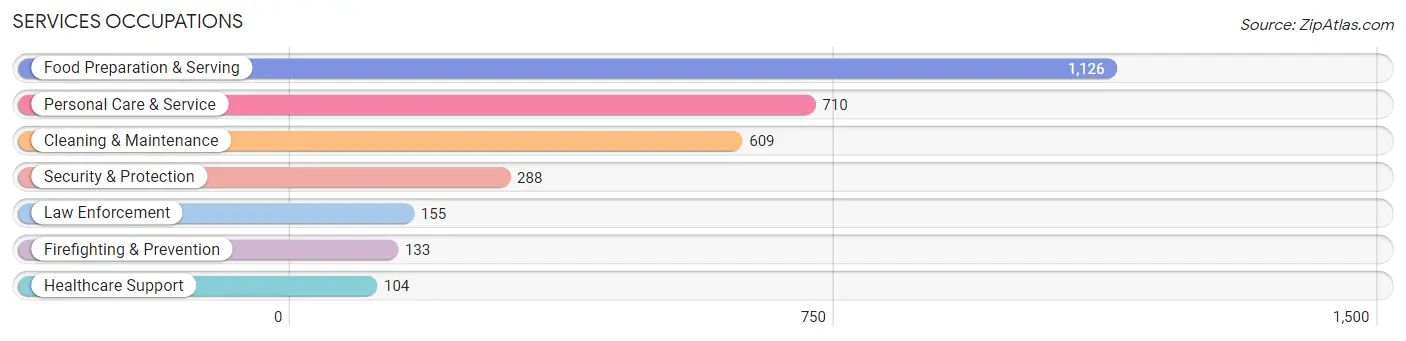
Services Occupations
The most common Services occupations in West Falls Church are Food Preparation & Serving (1,126 | 6.5%), Personal Care & Service (710 | 4.1%), Cleaning & Maintenance (609 | 3.5%), Security & Protection (288 | 1.7%), and Law Enforcement (155 | 0.9%).
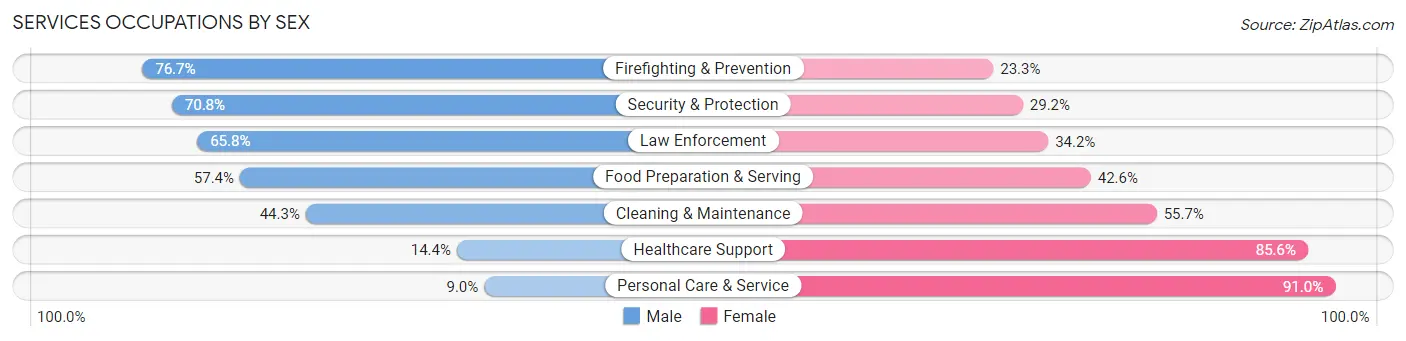
Services Occupations by Sex
Within the Services occupations in West Falls Church, the most male-oriented occupations are Firefighting & Prevention (76.7%), Security & Protection (70.8%), and Law Enforcement (65.8%), while the most female-oriented occupations are Personal Care & Service (91.0%), Healthcare Support (85.6%), and Cleaning & Maintenance (55.7%).
| Occupation | Male | Female |
| Healthcare Support | 15 (14.4%) | 89 (85.6%) |
| Security & Protection | 204 (70.8%) | 84 (29.2%) |
| Firefighting & Prevention | 102 (76.7%) | 31 (23.3%) |
| Law Enforcement | 102 (65.8%) | 53 (34.2%) |
| Food Preparation & Serving | 646 (57.4%) | 480 (42.6%) |
| Cleaning & Maintenance | 270 (44.3%) | 339 (55.7%) |
| Personal Care & Service | 64 (9.0%) | 646 (91.0%) |
| Total (Category) | 1,199 (42.3%) | 1,638 (57.7%) |
| Total (Overall) | 9,261 (53.5%) | 8,043 (46.5%) |
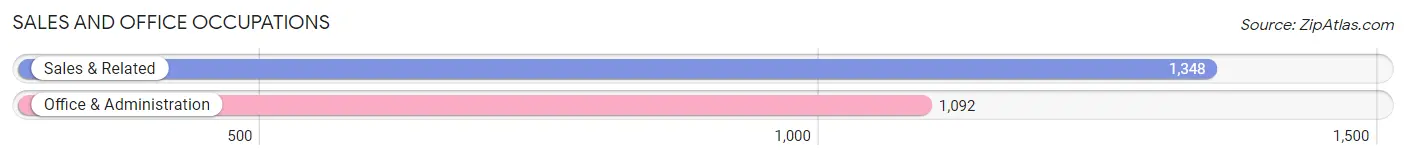
Sales and Office Occupations
The most common Sales and Office occupations in West Falls Church are Sales & Related (1,348 | 7.8%), and Office & Administration (1,092 | 6.3%).
Sales and Office Occupations by Sex
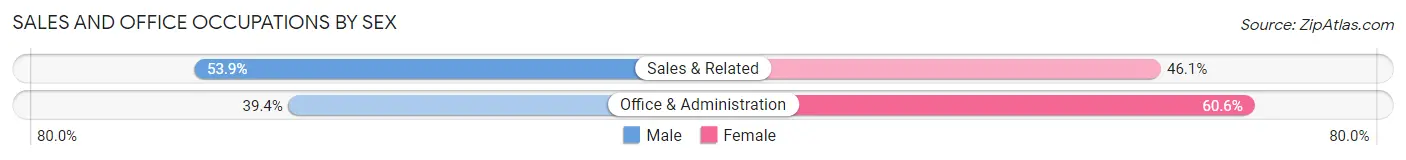
| Occupation | Male | Female |
| Sales & Related | 727 (53.9%) | 621 (46.1%) |
| Office & Administration | 430 (39.4%) | 662 (60.6%) |
| Total (Category) | 1,157 (47.4%) | 1,283 (52.6%) |
| Total (Overall) | 9,261 (53.5%) | 8,043 (46.5%) |
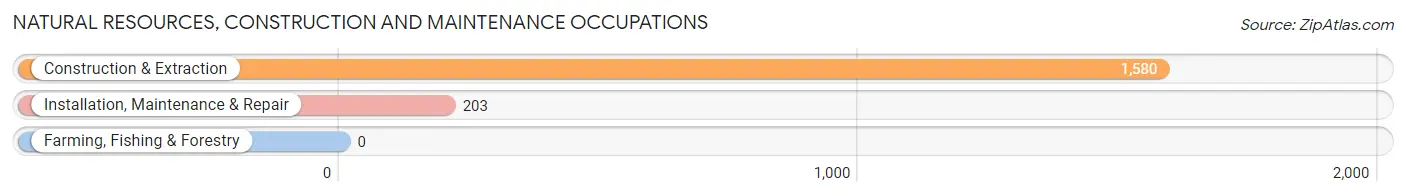
Natural Resources, Construction and Maintenance Occupations
The most common Natural Resources, Construction and Maintenance occupations in West Falls Church are Construction & Extraction (1,580 | 9.1%), and Installation, Maintenance & Repair (203 | 1.2%).
Natural Resources, Construction and Maintenance Occupations by Sex
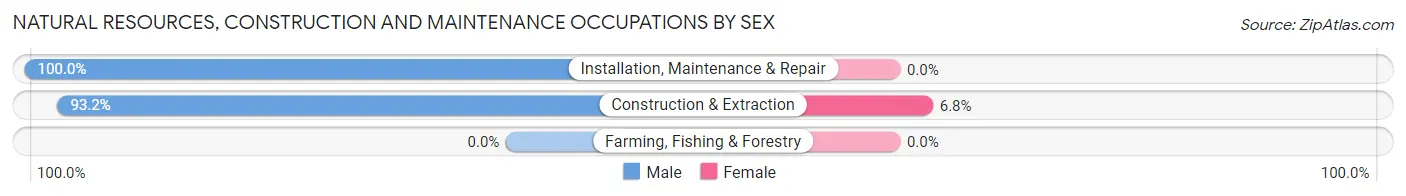
| Occupation | Male | Female |
| Farming, Fishing & Forestry | 0 (0.0%) | 0 (0.0%) |
| Construction & Extraction | 1,472 (93.2%) | 108 (6.8%) |
| Installation, Maintenance & Repair | 203 (100.0%) | 0 (0.0%) |
| Total (Category) | 1,675 (93.9%) | 108 (6.1%) |
| Total (Overall) | 9,261 (53.5%) | 8,043 (46.5%) |
Production, Transportation and Moving Occupations
The most common Production, Transportation and Moving occupations in West Falls Church are Transportation (601 | 3.5%), Production (598 | 3.5%), and Material Moving (297 | 1.7%).
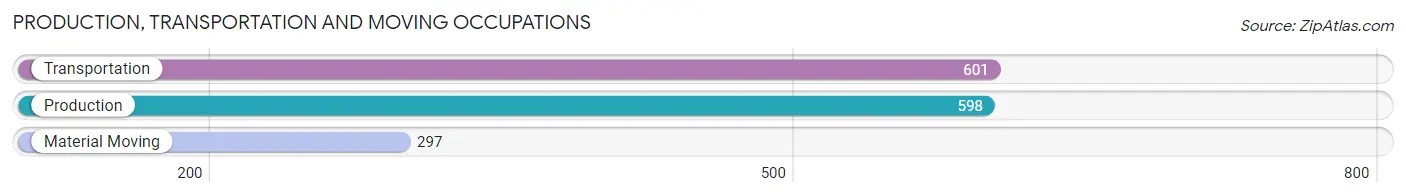
Production, Transportation and Moving Occupations by Sex
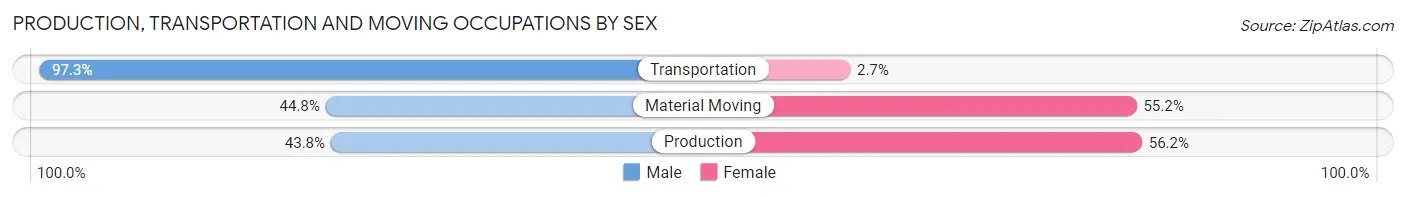
| Occupation | Male | Female |
| Production | 262 (43.8%) | 336 (56.2%) |
| Transportation | 585 (97.3%) | 16 (2.7%) |
| Material Moving | 133 (44.8%) | 164 (55.2%) |
| Total (Category) | 980 (65.5%) | 516 (34.5%) |
| Total (Overall) | 9,261 (53.5%) | 8,043 (46.5%) |
Employment Industries by Sex in West Falls Church
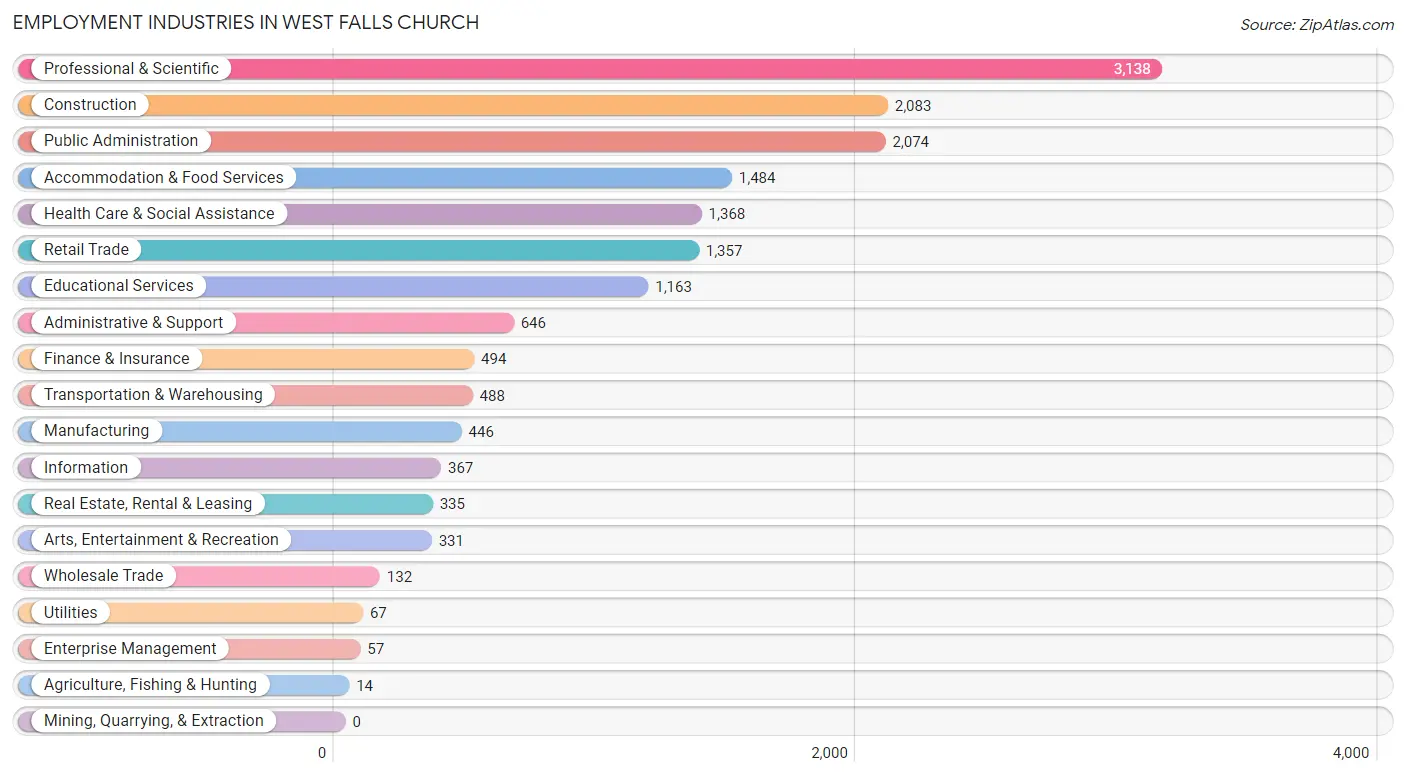
Employment Industries in West Falls Church
The major employment industries in West Falls Church include Professional & Scientific (3,138 | 18.1%), Construction (2,083 | 12.0%), Public Administration (2,074 | 12.0%), Accommodation & Food Services (1,484 | 8.6%), and Health Care & Social Assistance (1,368 | 7.9%).
Employment Industries by Sex in West Falls Church
The West Falls Church industries that see more men than women are Agriculture, Fishing & Hunting (100.0%), Transportation & Warehousing (92.2%), and Utilities (91.0%), whereas the industries that tend to have a higher number of women are Enterprise Management (100.0%), Health Care & Social Assistance (77.1%), and Educational Services (71.2%).
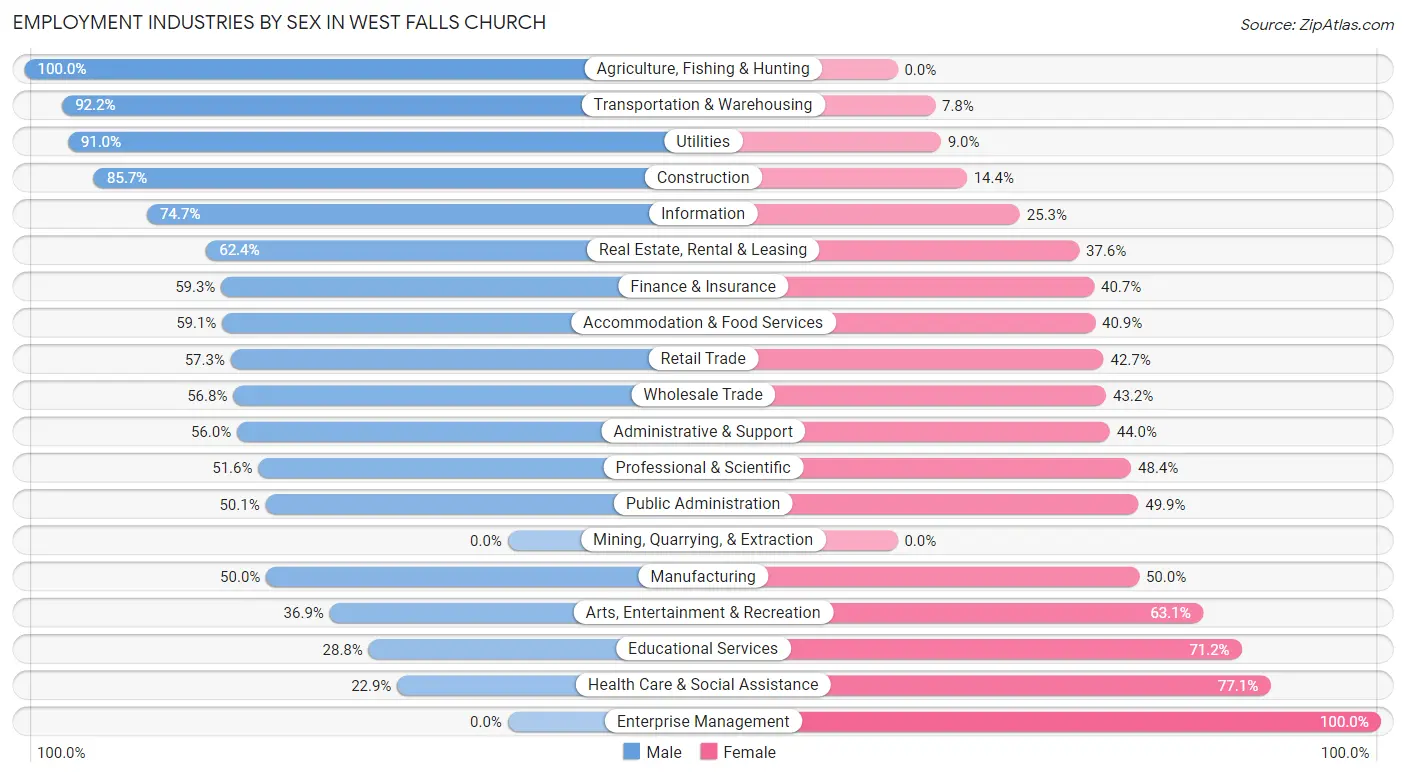
| Industry | Male | Female |
| Agriculture, Fishing & Hunting | 14 (100.0%) | 0 (0.0%) |
| Mining, Quarrying, & Extraction | 0 (0.0%) | 0 (0.0%) |
| Construction | 1,784 (85.7%) | 299 (14.3%) |
| Manufacturing | 223 (50.0%) | 223 (50.0%) |
| Wholesale Trade | 75 (56.8%) | 57 (43.2%) |
| Retail Trade | 778 (57.3%) | 579 (42.7%) |
| Transportation & Warehousing | 450 (92.2%) | 38 (7.8%) |
| Utilities | 61 (91.0%) | 6 (9.0%) |
| Information | 274 (74.7%) | 93 (25.3%) |
| Finance & Insurance | 293 (59.3%) | 201 (40.7%) |
| Real Estate, Rental & Leasing | 209 (62.4%) | 126 (37.6%) |
| Professional & Scientific | 1,620 (51.6%) | 1,518 (48.4%) |
| Enterprise Management | 0 (0.0%) | 57 (100.0%) |
| Administrative & Support | 362 (56.0%) | 284 (44.0%) |
| Educational Services | 335 (28.8%) | 828 (71.2%) |
| Health Care & Social Assistance | 313 (22.9%) | 1,055 (77.1%) |
| Arts, Entertainment & Recreation | 122 (36.9%) | 209 (63.1%) |
| Accommodation & Food Services | 877 (59.1%) | 607 (40.9%) |
| Public Administration | 1,040 (50.1%) | 1,034 (49.9%) |
| Total | 9,261 (53.5%) | 8,043 (46.5%) |
Education in West Falls Church
School Enrollment in West Falls Church
The most common levels of schooling among the 6,871 students in West Falls Church are high school (1,503 | 21.9%), elementary school (1,480 | 21.5%), and college / undergraduate (1,412 | 20.5%).
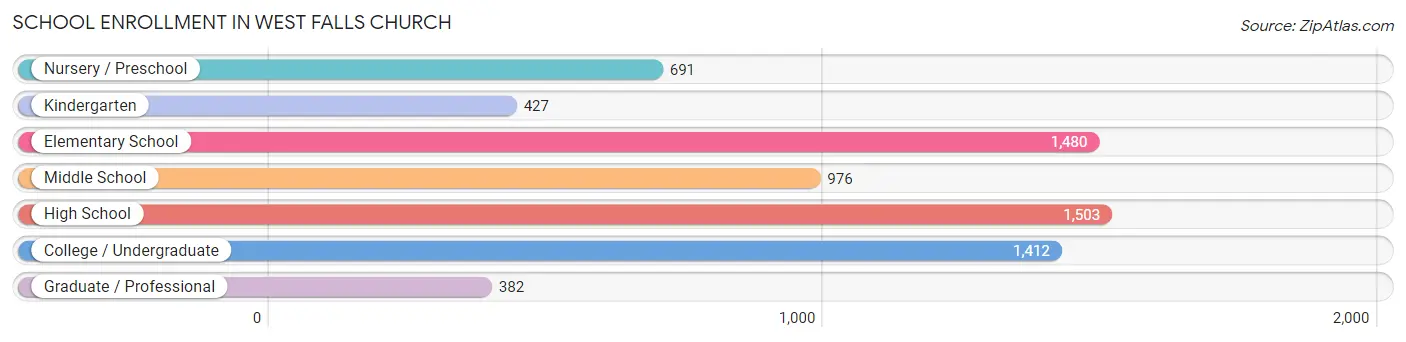
| School Level | # Students | % Students |
| Nursery / Preschool | 691 | 10.1% |
| Kindergarten | 427 | 6.2% |
| Elementary School | 1,480 | 21.5% |
| Middle School | 976 | 14.2% |
| High School | 1,503 | 21.9% |
| College / Undergraduate | 1,412 | 20.5% |
| Graduate / Professional | 382 | 5.6% |
| Total | 6,871 | 100.0% |
School Enrollment by Age by Funding Source in West Falls Church
Out of a total of 6,871 students who are enrolled in schools in West Falls Church, 1,244 (18.1%) attend a private institution, while the remaining 5,627 (81.9%) are enrolled in public schools. The age group of 3 to 4 year olds has the highest likelihood of being enrolled in private schools, with 395 (66.2% in the age bracket) enrolled. Conversely, the age group of 15 to 17 year olds has the lowest likelihood of being enrolled in a private school, with 843 (95.3% in the age bracket) attending a public institution.
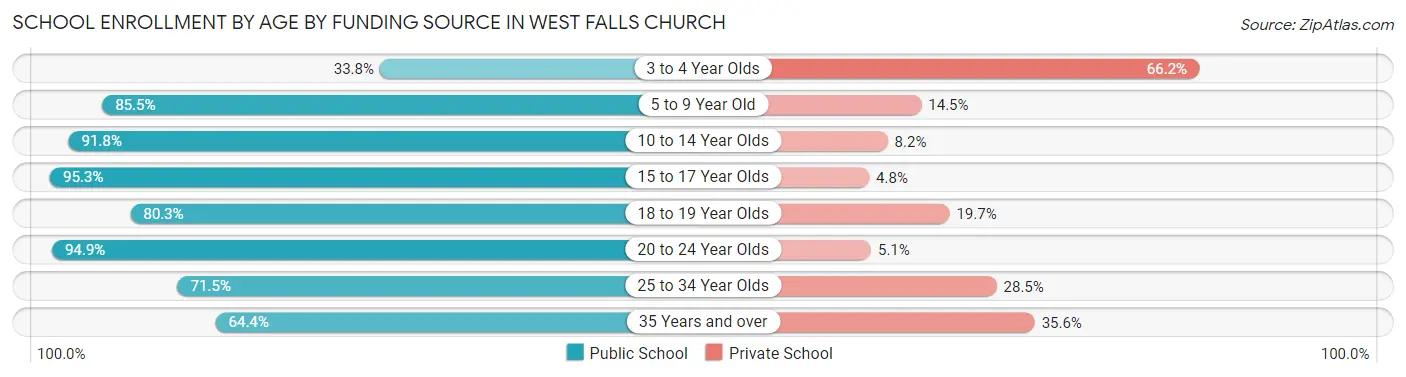
| Age Bracket | Public School | Private School |
| 3 to 4 Year Olds | 202 (33.8%) | 395 (66.2%) |
| 5 to 9 Year Old | 1,561 (85.5%) | 264 (14.5%) |
| 10 to 14 Year Olds | 1,301 (91.8%) | 116 (8.2%) |
| 15 to 17 Year Olds | 843 (95.3%) | 42 (4.8%) |
| 18 to 19 Year Olds | 501 (80.3%) | 123 (19.7%) |
| 20 to 24 Year Olds | 633 (94.9%) | 34 (5.1%) |
| 25 to 34 Year Olds | 379 (71.5%) | 151 (28.5%) |
| 35 Years and over | 210 (64.4%) | 116 (35.6%) |
| Total | 5,627 (81.9%) | 1,244 (18.1%) |
Educational Attainment by Field of Study in West Falls Church
Social sciences (2,019 | 16.6%), business (1,573 | 12.9%), literature & languages (1,154 | 9.5%), engineering (1,084 | 8.9%), and computers & mathematics (934 | 7.7%) are the most common fields of study among 12,170 individuals in West Falls Church who have obtained a bachelor's degree or higher.
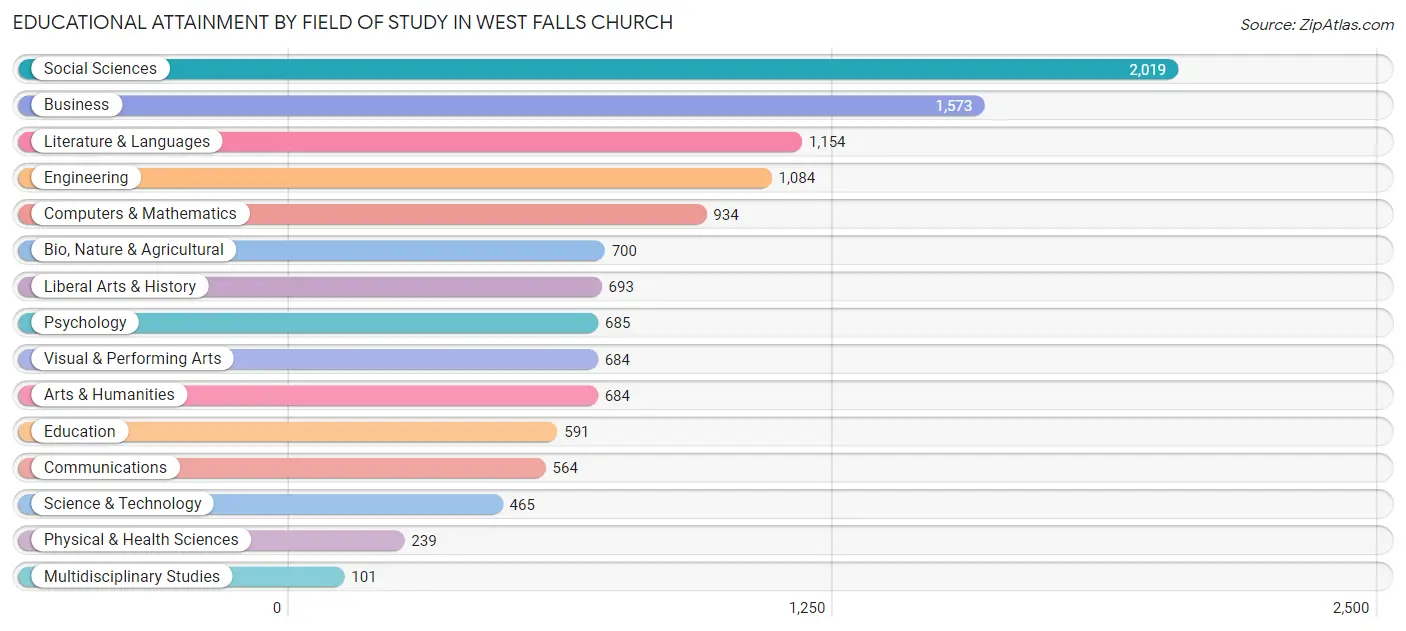
| Field of Study | # Graduates | % Graduates |
| Computers & Mathematics | 934 | 7.7% |
| Bio, Nature & Agricultural | 700 | 5.8% |
| Physical & Health Sciences | 239 | 2.0% |
| Psychology | 685 | 5.6% |
| Social Sciences | 2,019 | 16.6% |
| Engineering | 1,084 | 8.9% |
| Multidisciplinary Studies | 101 | 0.8% |
| Science & Technology | 465 | 3.8% |
| Business | 1,573 | 12.9% |
| Education | 591 | 4.9% |
| Literature & Languages | 1,154 | 9.5% |
| Liberal Arts & History | 693 | 5.7% |
| Visual & Performing Arts | 684 | 5.6% |
| Communications | 564 | 4.6% |
| Arts & Humanities | 684 | 5.6% |
| Total | 12,170 | 100.0% |
Transportation & Commute in West Falls Church
Vehicle Availability by Sex in West Falls Church
The most prevalent vehicle ownership categories in West Falls Church are males with 2 vehicles (4,072, accounting for 44.3%) and females with 2 vehicles (3,714, making up 52.6%).
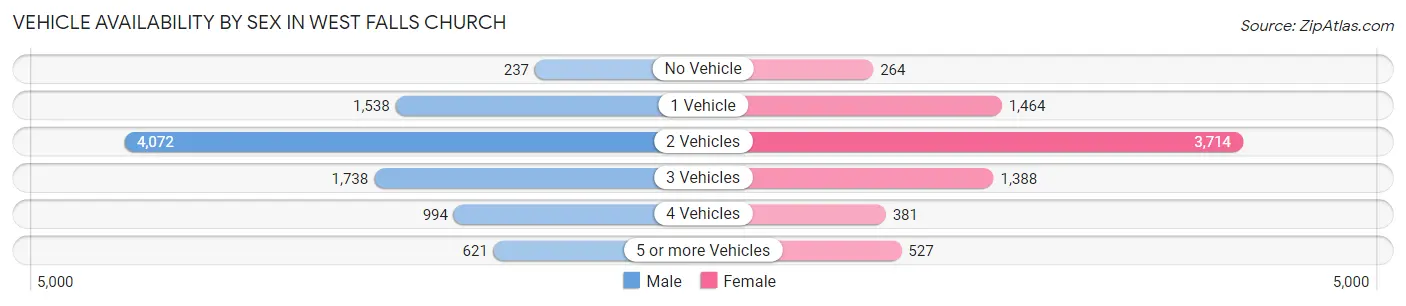
| Vehicles Available | Male | Female |
| No Vehicle | 237 (2.6%) | 264 (3.4%) |
| 1 Vehicle | 1,538 (16.7%) | 1,464 (18.9%) |
| 2 Vehicles | 4,072 (44.3%) | 3,714 (48.0%) |
| 3 Vehicles | 1,738 (18.9%) | 1,388 (17.9%) |
| 4 Vehicles | 994 (10.8%) | 381 (4.9%) |
| 5 or more Vehicles | 621 (6.8%) | 527 (6.8%) |
| Total | 9,200 (100.0%) | 7,738 (100.0%) |
Commute Time in West Falls Church
The most frequently occuring commute durations in West Falls Church are 30 to 34 minutes (2,262 commuters, 16.1%), 15 to 19 minutes (2,130 commuters, 15.2%), and 20 to 24 minutes (2,120 commuters, 15.1%).
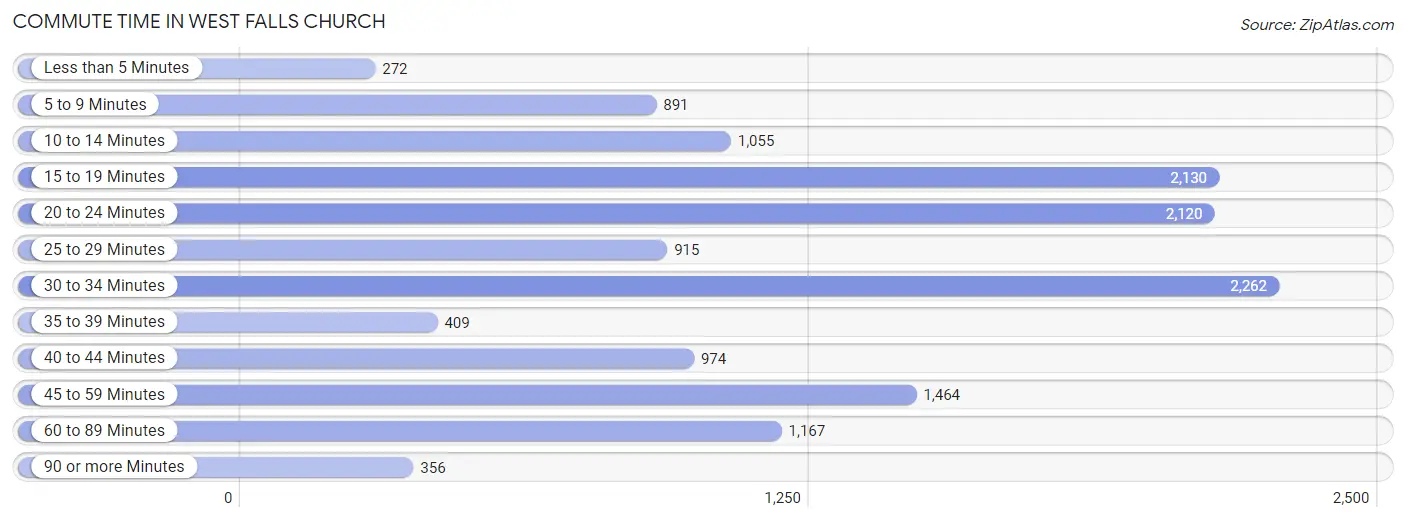
| Commute Time | # Commuters | % Commuters |
| Less than 5 Minutes | 272 | 1.9% |
| 5 to 9 Minutes | 891 | 6.4% |
| 10 to 14 Minutes | 1,055 | 7.5% |
| 15 to 19 Minutes | 2,130 | 15.2% |
| 20 to 24 Minutes | 2,120 | 15.1% |
| 25 to 29 Minutes | 915 | 6.5% |
| 30 to 34 Minutes | 2,262 | 16.1% |
| 35 to 39 Minutes | 409 | 2.9% |
| 40 to 44 Minutes | 974 | 7.0% |
| 45 to 59 Minutes | 1,464 | 10.4% |
| 60 to 89 Minutes | 1,167 | 8.3% |
| 90 or more Minutes | 356 | 2.5% |
Commute Time by Sex in West Falls Church
The most common commute times in West Falls Church are 20 to 24 minutes (1,301 commuters, 16.6%) for males and 15 to 19 minutes (1,275 commuters, 20.7%) for females.
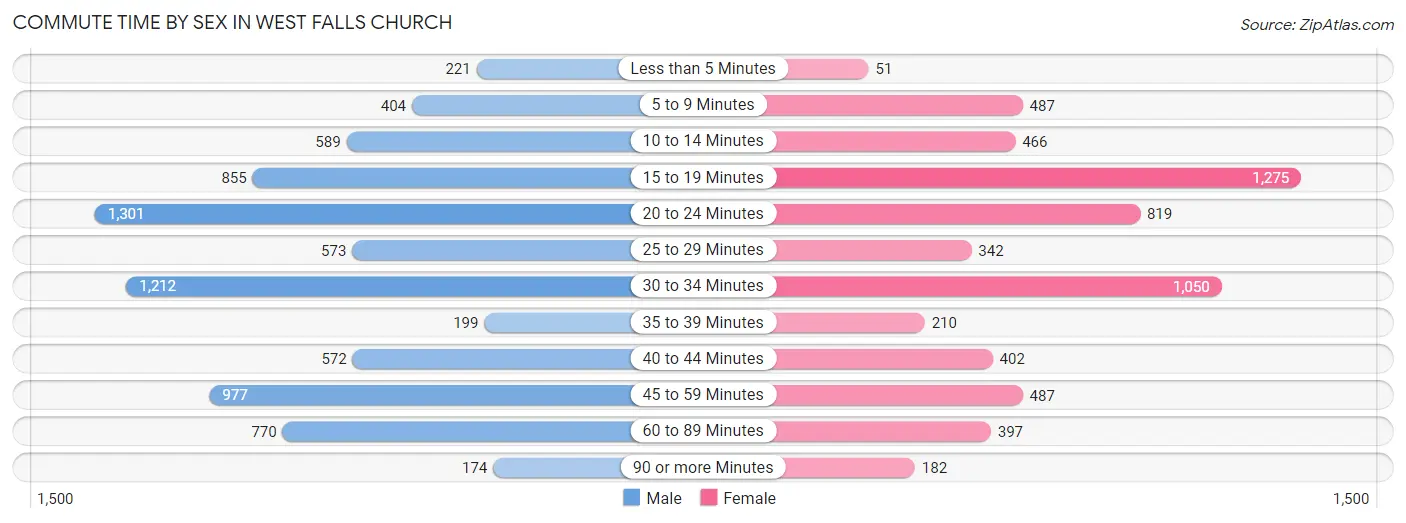
| Commute Time | Male | Female |
| Less than 5 Minutes | 221 (2.8%) | 51 (0.8%) |
| 5 to 9 Minutes | 404 (5.1%) | 487 (7.9%) |
| 10 to 14 Minutes | 589 (7.5%) | 466 (7.6%) |
| 15 to 19 Minutes | 855 (10.9%) | 1,275 (20.7%) |
| 20 to 24 Minutes | 1,301 (16.6%) | 819 (13.3%) |
| 25 to 29 Minutes | 573 (7.3%) | 342 (5.5%) |
| 30 to 34 Minutes | 1,212 (15.4%) | 1,050 (17.0%) |
| 35 to 39 Minutes | 199 (2.5%) | 210 (3.4%) |
| 40 to 44 Minutes | 572 (7.3%) | 402 (6.5%) |
| 45 to 59 Minutes | 977 (12.4%) | 487 (7.9%) |
| 60 to 89 Minutes | 770 (9.8%) | 397 (6.4%) |
| 90 or more Minutes | 174 (2.2%) | 182 (2.9%) |
Time of Departure to Work by Sex in West Falls Church
The most frequent times of departure to work in West Falls Church are 7:00 AM to 7:29 AM (1,621, 20.7%) for males and 7:30 AM to 7:59 AM (1,058, 17.2%) for females.
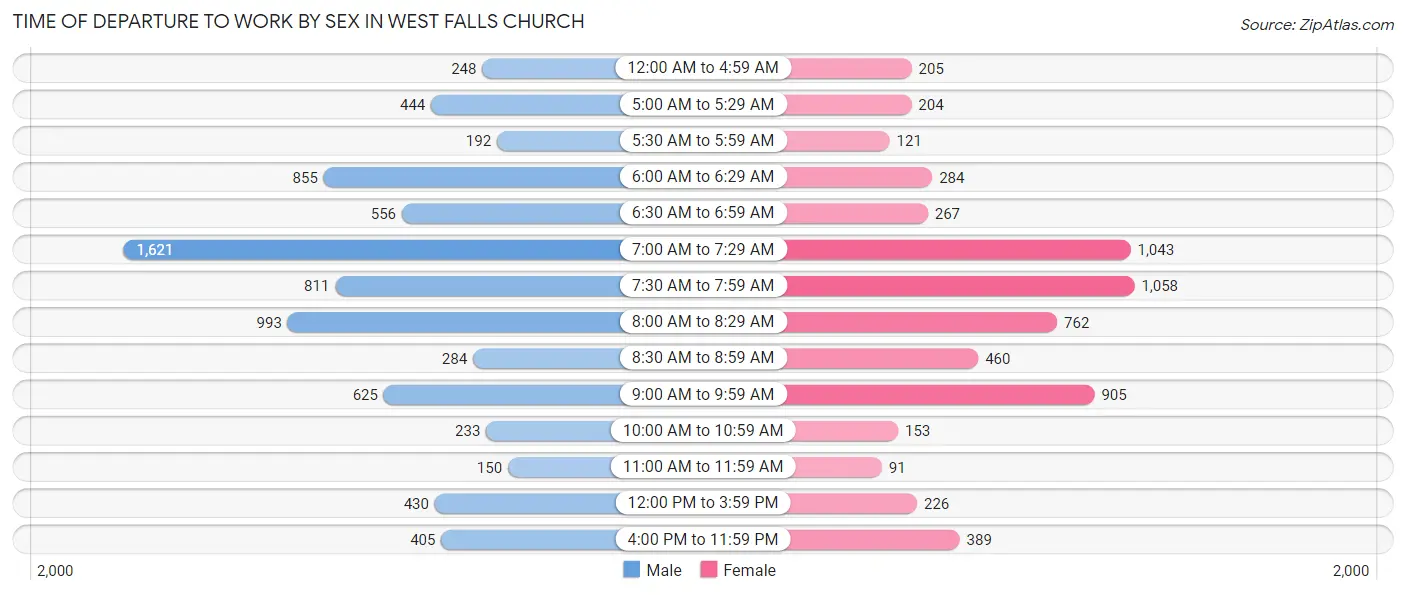
| Time of Departure | Male | Female |
| 12:00 AM to 4:59 AM | 248 (3.2%) | 205 (3.3%) |
| 5:00 AM to 5:29 AM | 444 (5.7%) | 204 (3.3%) |
| 5:30 AM to 5:59 AM | 192 (2.5%) | 121 (2.0%) |
| 6:00 AM to 6:29 AM | 855 (10.9%) | 284 (4.6%) |
| 6:30 AM to 6:59 AM | 556 (7.1%) | 267 (4.3%) |
| 7:00 AM to 7:29 AM | 1,621 (20.7%) | 1,043 (16.9%) |
| 7:30 AM to 7:59 AM | 811 (10.3%) | 1,058 (17.2%) |
| 8:00 AM to 8:29 AM | 993 (12.7%) | 762 (12.3%) |
| 8:30 AM to 8:59 AM | 284 (3.6%) | 460 (7.5%) |
| 9:00 AM to 9:59 AM | 625 (8.0%) | 905 (14.7%) |
| 10:00 AM to 10:59 AM | 233 (3.0%) | 153 (2.5%) |
| 11:00 AM to 11:59 AM | 150 (1.9%) | 91 (1.5%) |
| 12:00 PM to 3:59 PM | 430 (5.5%) | 226 (3.7%) |
| 4:00 PM to 11:59 PM | 405 (5.2%) | 389 (6.3%) |
| Total | 7,847 (100.0%) | 6,168 (100.0%) |
Housing Occupancy in West Falls Church
Occupancy by Ownership in West Falls Church
Of the total 10,540 dwellings in West Falls Church, owner-occupied units account for 6,901 (65.5%), while renter-occupied units make up 3,639 (34.5%).
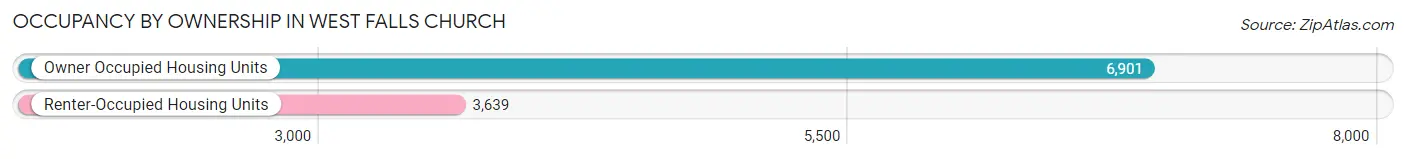
| Occupancy | # Housing Units | % Housing Units |
| Owner Occupied Housing Units | 6,901 | 65.5% |
| Renter-Occupied Housing Units | 3,639 | 34.5% |
| Total Occupied Housing Units | 10,540 | 100.0% |
Occupancy by Household Size in West Falls Church
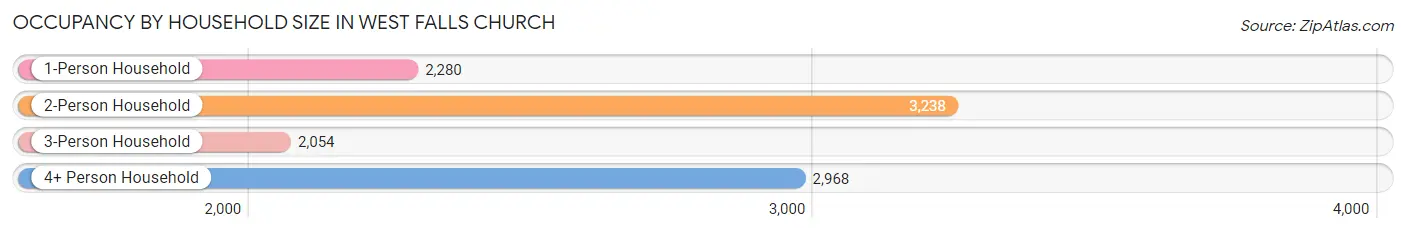
| Household Size | # Housing Units | % Housing Units |
| 1-Person Household | 2,280 | 21.6% |
| 2-Person Household | 3,238 | 30.7% |
| 3-Person Household | 2,054 | 19.5% |
| 4+ Person Household | 2,968 | 28.2% |
| Total Housing Units | 10,540 | 100.0% |
Occupancy by Ownership by Household Size in West Falls Church
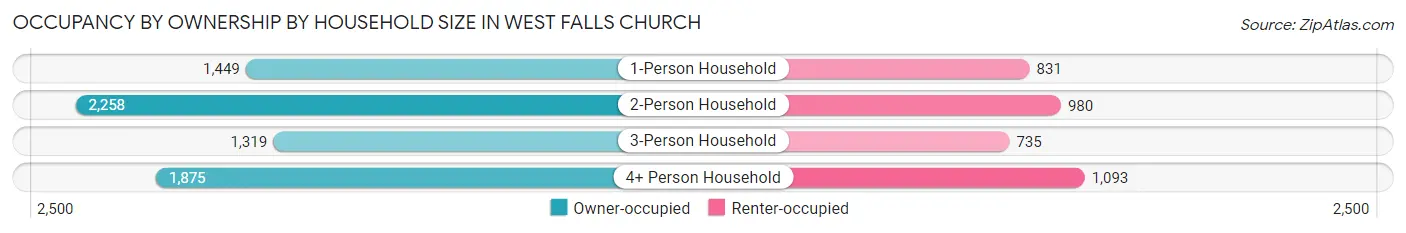
| Household Size | Owner-occupied | Renter-occupied |
| 1-Person Household | 1,449 (63.5%) | 831 (36.4%) |
| 2-Person Household | 2,258 (69.7%) | 980 (30.3%) |
| 3-Person Household | 1,319 (64.2%) | 735 (35.8%) |
| 4+ Person Household | 1,875 (63.2%) | 1,093 (36.8%) |
| Total Housing Units | 6,901 (65.5%) | 3,639 (34.5%) |
Occupancy by Educational Attainment in West Falls Church
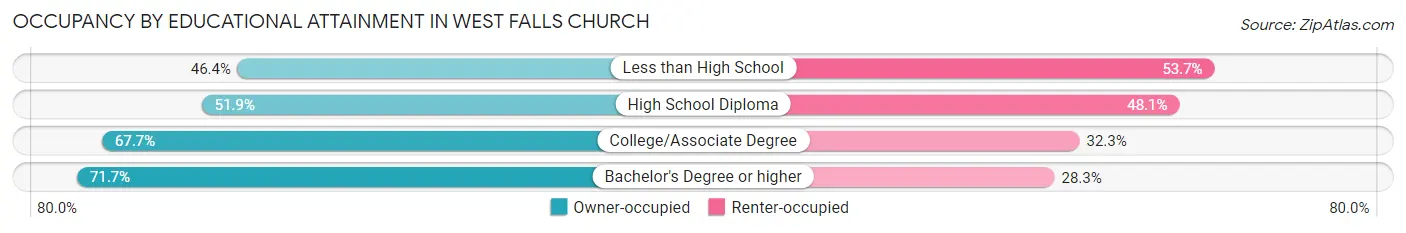
| Household Size | Owner-occupied | Renter-occupied |
| Less than High School | 635 (46.4%) | 735 (53.6%) |
| High School Diploma | 647 (51.9%) | 599 (48.1%) |
| College/Associate Degree | 1,075 (67.7%) | 512 (32.3%) |
| Bachelor's Degree or higher | 4,544 (71.7%) | 1,793 (28.3%) |
Occupancy by Age of Householder in West Falls Church
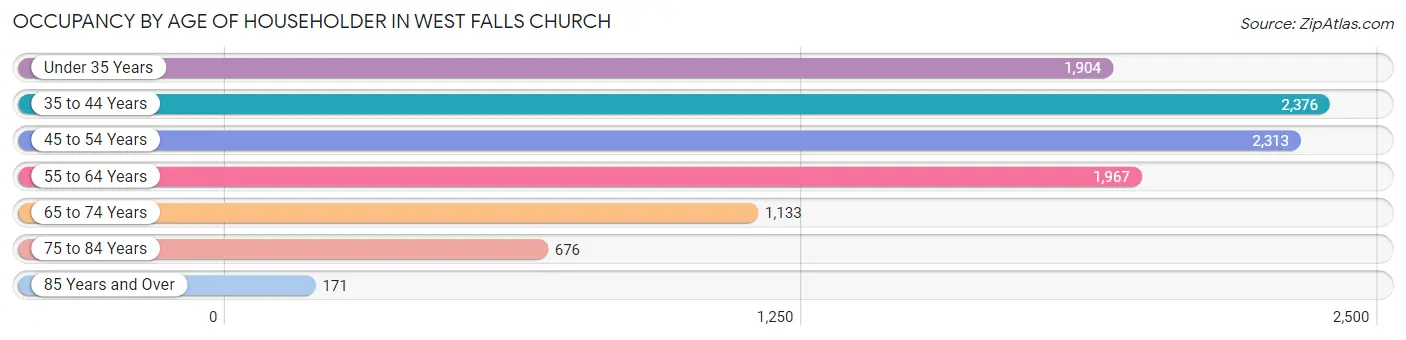
| Age Bracket | # Households | % Households |
| Under 35 Years | 1,904 | 18.1% |
| 35 to 44 Years | 2,376 | 22.5% |
| 45 to 54 Years | 2,313 | 21.9% |
| 55 to 64 Years | 1,967 | 18.7% |
| 65 to 74 Years | 1,133 | 10.7% |
| 75 to 84 Years | 676 | 6.4% |
| 85 Years and Over | 171 | 1.6% |
| Total | 10,540 | 100.0% |
Housing Finances in West Falls Church
Median Income by Occupancy in West Falls Church
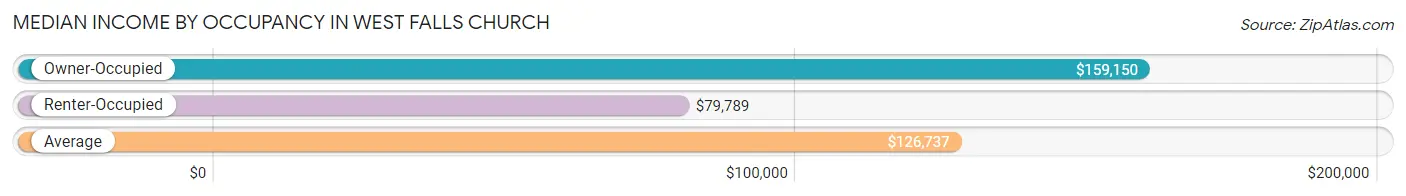
| Occupancy Type | # Households | Median Income |
| Owner-Occupied | 6,901 (65.5%) | $159,150 |
| Renter-Occupied | 3,639 (34.5%) | $79,789 |
| Average | 10,540 (100.0%) | $126,737 |
Occupancy by Householder Income Bracket in West Falls Church
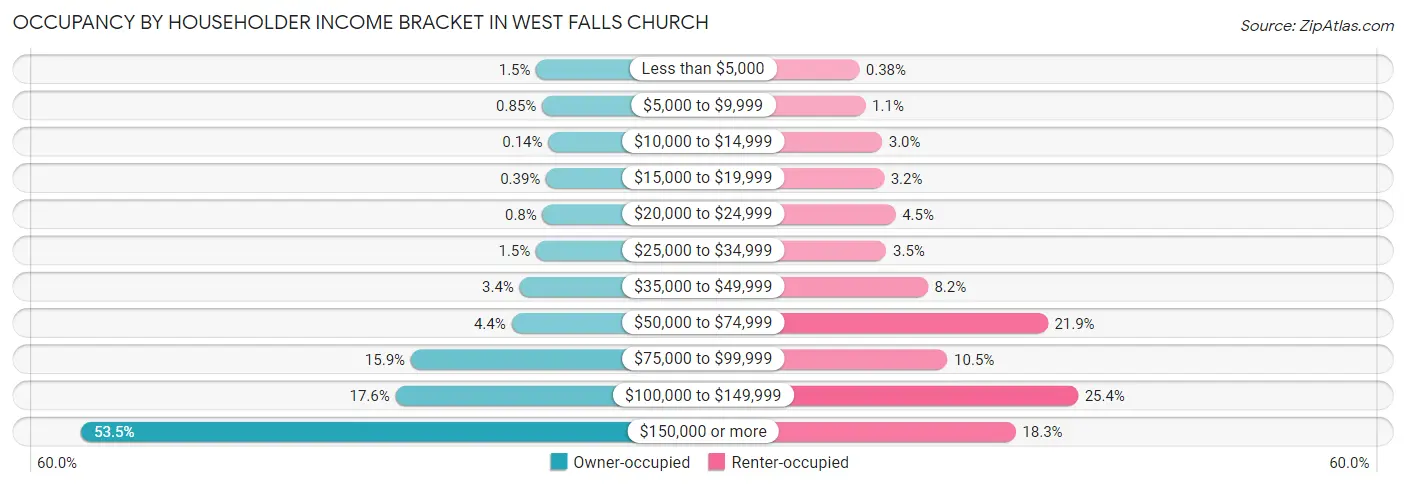
| Income Bracket | Owner-occupied | Renter-occupied |
| Less than $5,000 | 104 (1.5%) | 14 (0.4%) |
| $5,000 to $9,999 | 59 (0.9%) | 40 (1.1%) |
| $10,000 to $14,999 | 10 (0.1%) | 109 (3.0%) |
| $15,000 to $19,999 | 27 (0.4%) | 117 (3.2%) |
| $20,000 to $24,999 | 55 (0.8%) | 165 (4.5%) |
| $25,000 to $34,999 | 106 (1.5%) | 127 (3.5%) |
| $35,000 to $49,999 | 236 (3.4%) | 299 (8.2%) |
| $50,000 to $74,999 | 300 (4.3%) | 798 (21.9%) |
| $75,000 to $99,999 | 1,094 (15.9%) | 381 (10.5%) |
| $100,000 to $149,999 | 1,215 (17.6%) | 924 (25.4%) |
| $150,000 or more | 3,695 (53.5%) | 665 (18.3%) |
| Total | 6,901 (100.0%) | 3,639 (100.0%) |
Monthly Housing Cost Tiers in West Falls Church
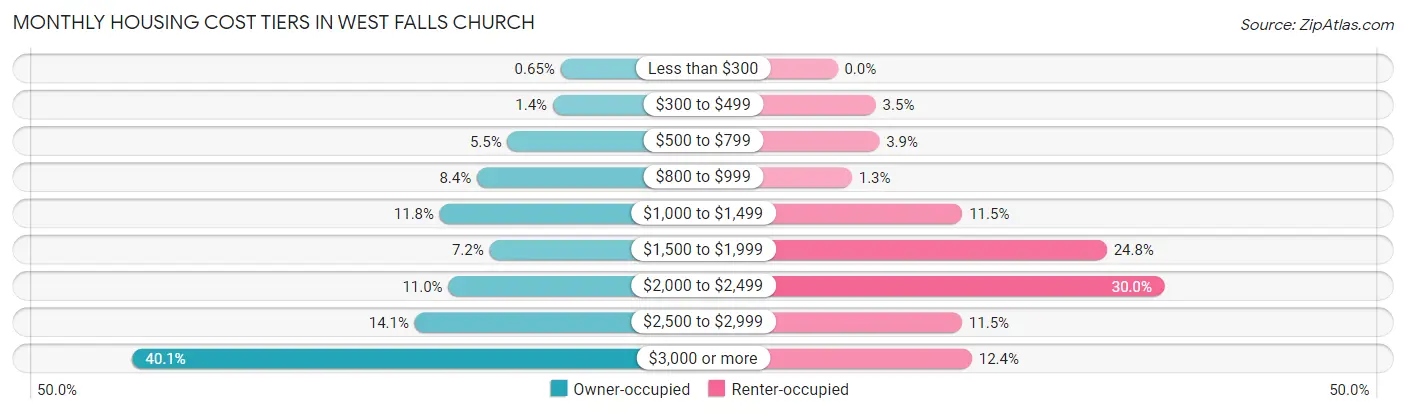
| Monthly Cost | Owner-occupied | Renter-occupied |
| Less than $300 | 45 (0.6%) | 0 (0.0%) |
| $300 to $499 | 94 (1.4%) | 128 (3.5%) |
| $500 to $799 | 382 (5.5%) | 140 (3.8%) |
| $800 to $999 | 576 (8.4%) | 48 (1.3%) |
| $1,000 to $1,499 | 812 (11.8%) | 418 (11.5%) |
| $1,500 to $1,999 | 497 (7.2%) | 902 (24.8%) |
| $2,000 to $2,499 | 758 (11.0%) | 1,093 (30.0%) |
| $2,500 to $2,999 | 972 (14.1%) | 417 (11.5%) |
| $3,000 or more | 2,765 (40.1%) | 450 (12.4%) |
| Total | 6,901 (100.0%) | 3,639 (100.0%) |
Physical Housing Characteristics in West Falls Church
Housing Structures in West Falls Church
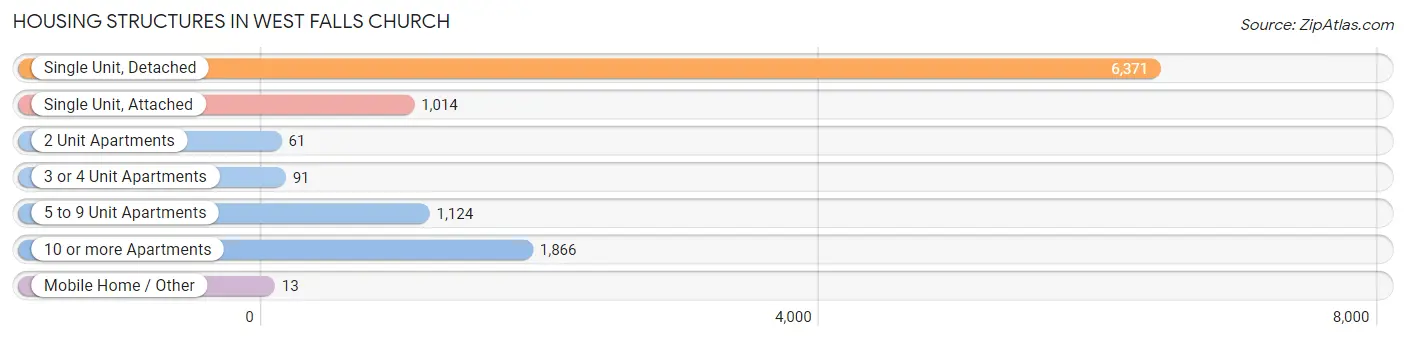
| Structure Type | # Housing Units | % Housing Units |
| Single Unit, Detached | 6,371 | 60.5% |
| Single Unit, Attached | 1,014 | 9.6% |
| 2 Unit Apartments | 61 | 0.6% |
| 3 or 4 Unit Apartments | 91 | 0.9% |
| 5 to 9 Unit Apartments | 1,124 | 10.7% |
| 10 or more Apartments | 1,866 | 17.7% |
| Mobile Home / Other | 13 | 0.1% |
| Total | 10,540 | 100.0% |
Housing Structures by Occupancy in West Falls Church
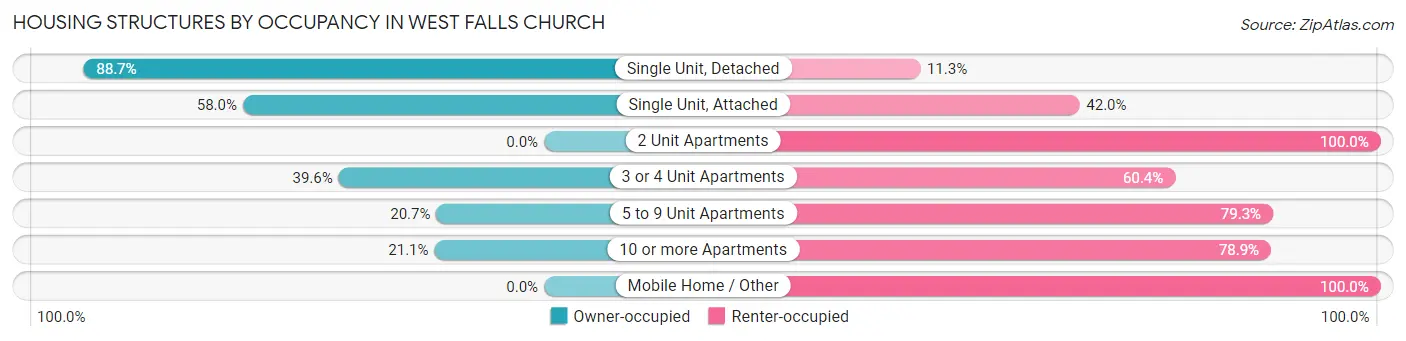
| Structure Type | Owner-occupied | Renter-occupied |
| Single Unit, Detached | 5,650 (88.7%) | 721 (11.3%) |
| Single Unit, Attached | 588 (58.0%) | 426 (42.0%) |
| 2 Unit Apartments | 0 (0.0%) | 61 (100.0%) |
| 3 or 4 Unit Apartments | 36 (39.6%) | 55 (60.4%) |
| 5 to 9 Unit Apartments | 233 (20.7%) | 891 (79.3%) |
| 10 or more Apartments | 394 (21.1%) | 1,472 (78.9%) |
| Mobile Home / Other | 0 (0.0%) | 13 (100.0%) |
| Total | 6,901 (65.5%) | 3,639 (34.5%) |
Housing Structures by Number of Rooms in West Falls Church
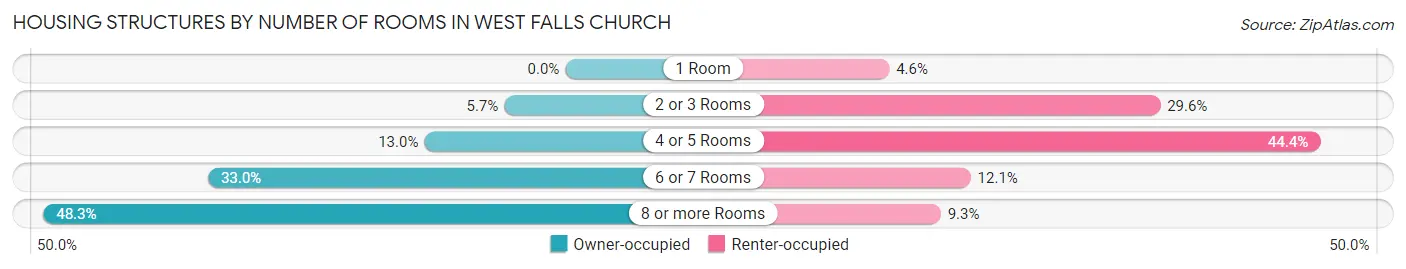
| Number of Rooms | Owner-occupied | Renter-occupied |
| 1 Room | 0 (0.0%) | 166 (4.6%) |
| 2 or 3 Rooms | 390 (5.7%) | 1,078 (29.6%) |
| 4 or 5 Rooms | 900 (13.0%) | 1,616 (44.4%) |
| 6 or 7 Rooms | 2,280 (33.0%) | 440 (12.1%) |
| 8 or more Rooms | 3,331 (48.3%) | 339 (9.3%) |
| Total | 6,901 (100.0%) | 3,639 (100.0%) |
Housing Structure by Heating Type in West Falls Church
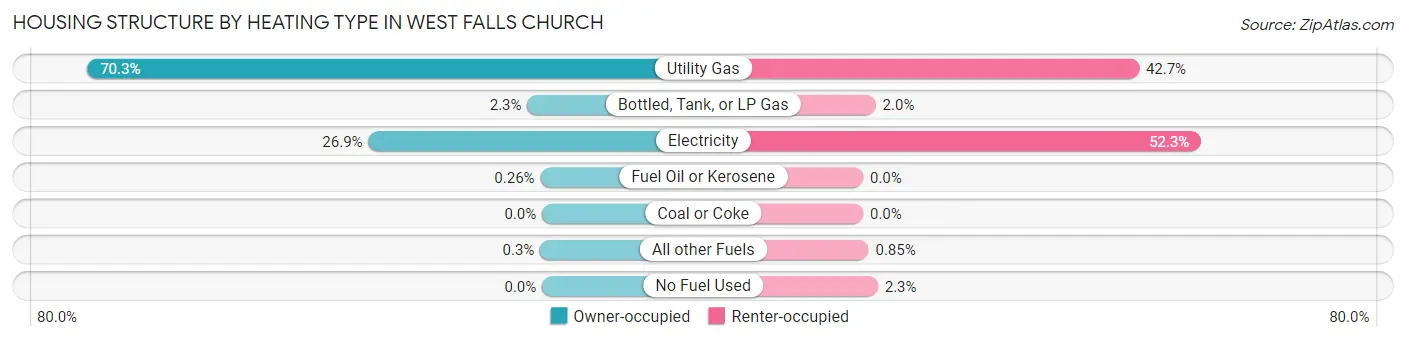
| Heating Type | Owner-occupied | Renter-occupied |
| Utility Gas | 4,852 (70.3%) | 1,552 (42.6%) |
| Bottled, Tank, or LP Gas | 157 (2.3%) | 71 (1.9%) |
| Electricity | 1,853 (26.9%) | 1,902 (52.3%) |
| Fuel Oil or Kerosene | 18 (0.3%) | 0 (0.0%) |
| Coal or Coke | 0 (0.0%) | 0 (0.0%) |
| All other Fuels | 21 (0.3%) | 31 (0.9%) |
| No Fuel Used | 0 (0.0%) | 83 (2.3%) |
| Total | 6,901 (100.0%) | 3,639 (100.0%) |
Household Vehicle Usage in West Falls Church
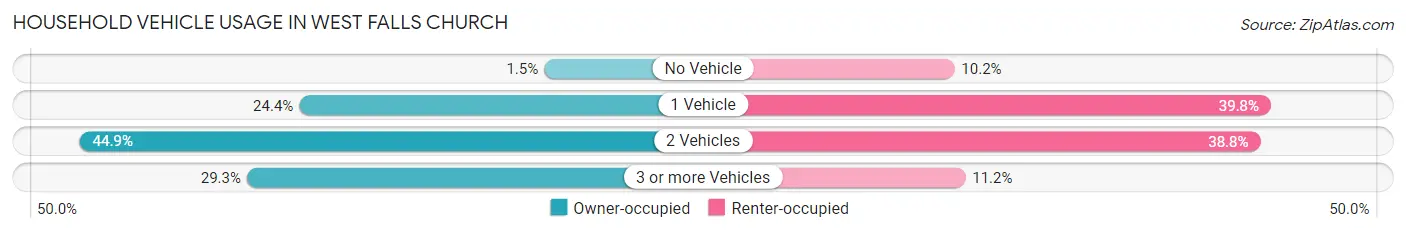
| Vehicles per Household | Owner-occupied | Renter-occupied |
| No Vehicle | 104 (1.5%) | 372 (10.2%) |
| 1 Vehicle | 1,682 (24.4%) | 1,447 (39.8%) |
| 2 Vehicles | 3,096 (44.9%) | 1,411 (38.8%) |
| 3 or more Vehicles | 2,019 (29.3%) | 409 (11.2%) |
| Total | 6,901 (100.0%) | 3,639 (100.0%) |
Real Estate & Mortgages in West Falls Church
Real Estate and Mortgage Overview in West Falls Church
| Characteristic | Without Mortgage | With Mortgage |
| Housing Units | 1,671 | 5,230 |
| Median Property Value | $604,900 | $645,800 |
| Median Household Income | $102,161 | $3,173 |
| Monthly Housing Costs | $902 | $2,765 |
| Real Estate Taxes | $6,723 | $213 |
Property Value by Mortgage Status in West Falls Church
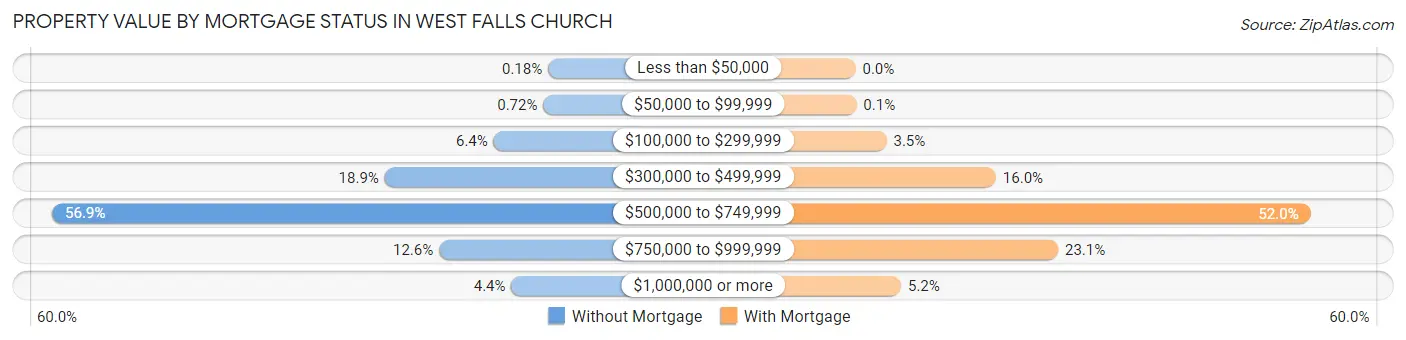
| Property Value | Without Mortgage | With Mortgage |
| Less than $50,000 | 3 (0.2%) | 0 (0.0%) |
| $50,000 to $99,999 | 12 (0.7%) | 5 (0.1%) |
| $100,000 to $299,999 | 107 (6.4%) | 185 (3.5%) |
| $300,000 to $499,999 | 315 (18.9%) | 839 (16.0%) |
| $500,000 to $749,999 | 950 (56.9%) | 2,719 (52.0%) |
| $750,000 to $999,999 | 211 (12.6%) | 1,210 (23.1%) |
| $1,000,000 or more | 73 (4.4%) | 272 (5.2%) |
| Total | 1,671 (100.0%) | 5,230 (100.0%) |
Household Income by Mortgage Status in West Falls Church
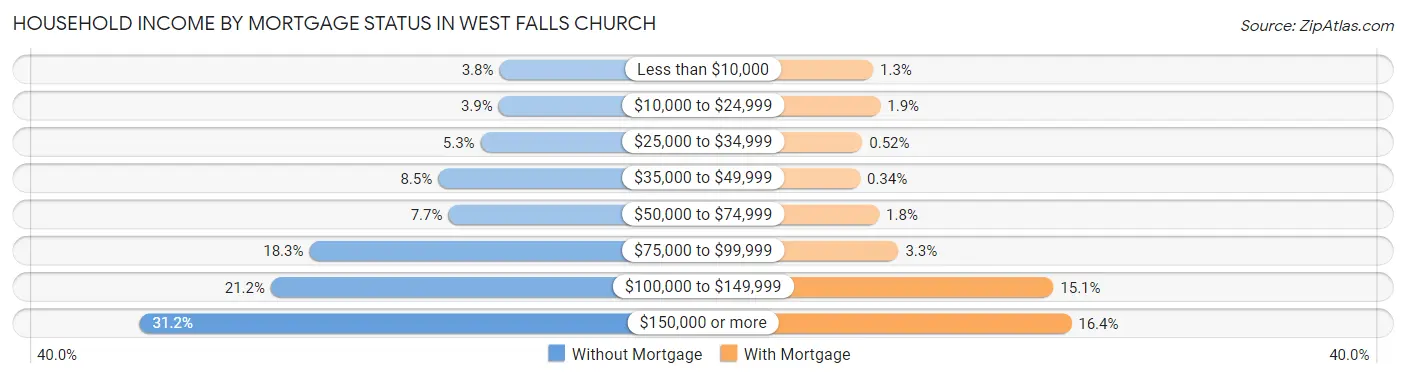
| Household Income | Without Mortgage | With Mortgage |
| Less than $10,000 | 64 (3.8%) | 70 (1.3%) |
| $10,000 to $24,999 | 65 (3.9%) | 99 (1.9%) |
| $25,000 to $34,999 | 88 (5.3%) | 27 (0.5%) |
| $35,000 to $49,999 | 142 (8.5%) | 18 (0.3%) |
| $50,000 to $74,999 | 129 (7.7%) | 94 (1.8%) |
| $75,000 to $99,999 | 306 (18.3%) | 171 (3.3%) |
| $100,000 to $149,999 | 355 (21.2%) | 788 (15.1%) |
| $150,000 or more | 522 (31.2%) | 860 (16.4%) |
| Total | 1,671 (100.0%) | 5,230 (100.0%) |
Property Value to Household Income Ratio in West Falls Church
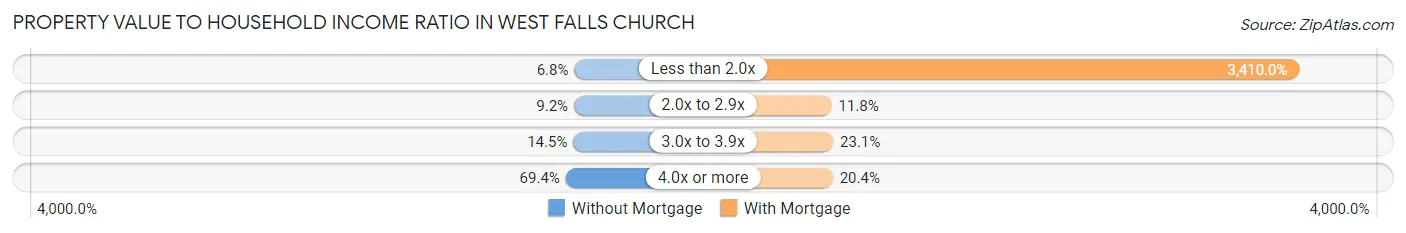
| Value-to-Income Ratio | Without Mortgage | With Mortgage |
| Less than 2.0x | 113 (6.8%) | 178,345 (3,410.0%) |
| 2.0x to 2.9x | 154 (9.2%) | 618 (11.8%) |
| 3.0x to 3.9x | 242 (14.5%) | 1,209 (23.1%) |
| 4.0x or more | 1,160 (69.4%) | 1,067 (20.4%) |
| Total | 1,671 (100.0%) | 5,230 (100.0%) |
Real Estate Taxes by Mortgage Status in West Falls Church
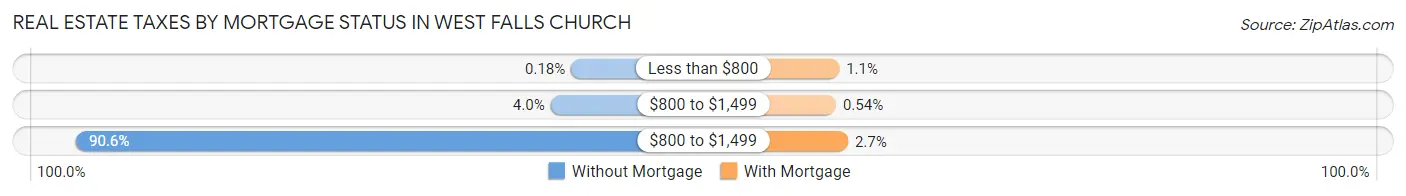
| Property Taxes | Without Mortgage | With Mortgage |
| Less than $800 | 3 (0.2%) | 59 (1.1%) |
| $800 to $1,499 | 66 (4.0%) | 28 (0.5%) |
| $800 to $1,499 | 1,514 (90.6%) | 143 (2.7%) |
| Total | 1,671 (100.0%) | 5,230 (100.0%) |
Health & Disability in West Falls Church
Health Insurance Coverage by Age in West Falls Church
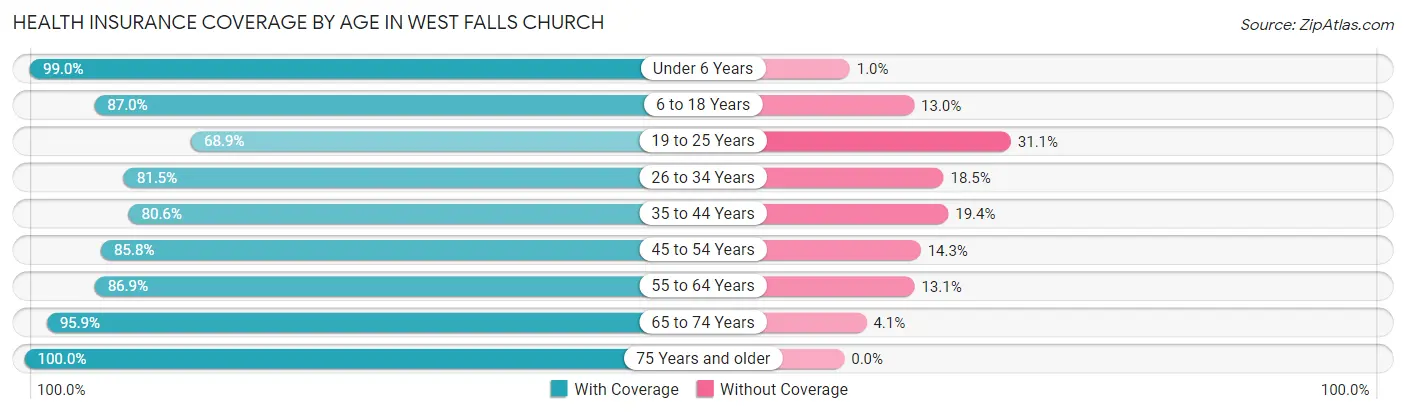
| Age Bracket | With Coverage | Without Coverage |
| Under 6 Years | 2,898 (99.0%) | 30 (1.0%) |
| 6 to 18 Years | 3,742 (87.0%) | 560 (13.0%) |
| 19 to 25 Years | 1,989 (68.9%) | 896 (31.1%) |
| 26 to 34 Years | 3,281 (81.5%) | 746 (18.5%) |
| 35 to 44 Years | 3,997 (80.6%) | 962 (19.4%) |
| 45 to 54 Years | 3,961 (85.8%) | 658 (14.2%) |
| 55 to 64 Years | 2,887 (86.9%) | 435 (13.1%) |
| 65 to 74 Years | 2,392 (95.9%) | 103 (4.1%) |
| 75 Years and older | 1,514 (100.0%) | 0 (0.0%) |
| Total | 26,661 (85.9%) | 4,390 (14.1%) |
Health Insurance Coverage by Citizenship Status in West Falls Church
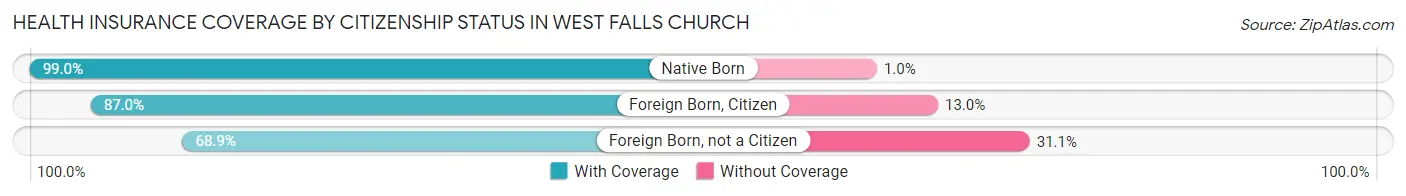
| Citizenship Status | With Coverage | Without Coverage |
| Native Born | 2,898 (99.0%) | 30 (1.0%) |
| Foreign Born, Citizen | 3,742 (87.0%) | 560 (13.0%) |
| Foreign Born, not a Citizen | 1,989 (68.9%) | 896 (31.1%) |
Health Insurance Coverage by Household Income in West Falls Church
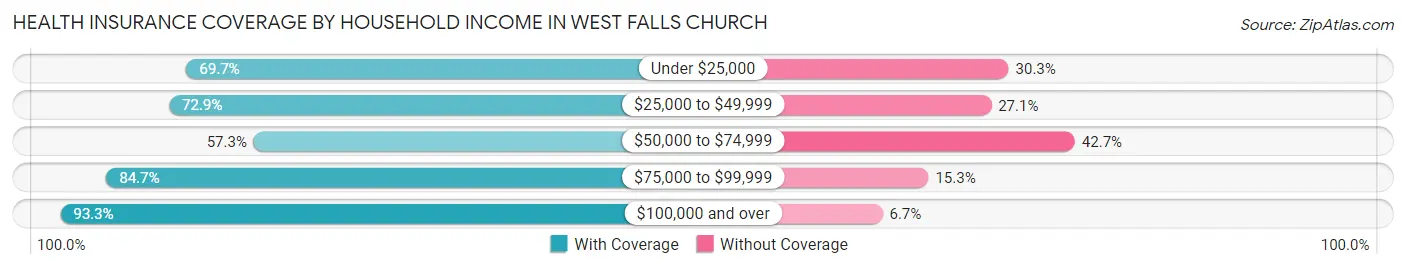
| Household Income | With Coverage | Without Coverage |
| Under $25,000 | 970 (69.7%) | 422 (30.3%) |
| $25,000 to $49,999 | 1,458 (72.9%) | 541 (27.1%) |
| $50,000 to $74,999 | 1,842 (57.3%) | 1,375 (42.7%) |
| $75,000 to $99,999 | 4,110 (84.7%) | 743 (15.3%) |
| $100,000 and over | 18,251 (93.3%) | 1,309 (6.7%) |
Public vs Private Health Insurance Coverage by Age in West Falls Church
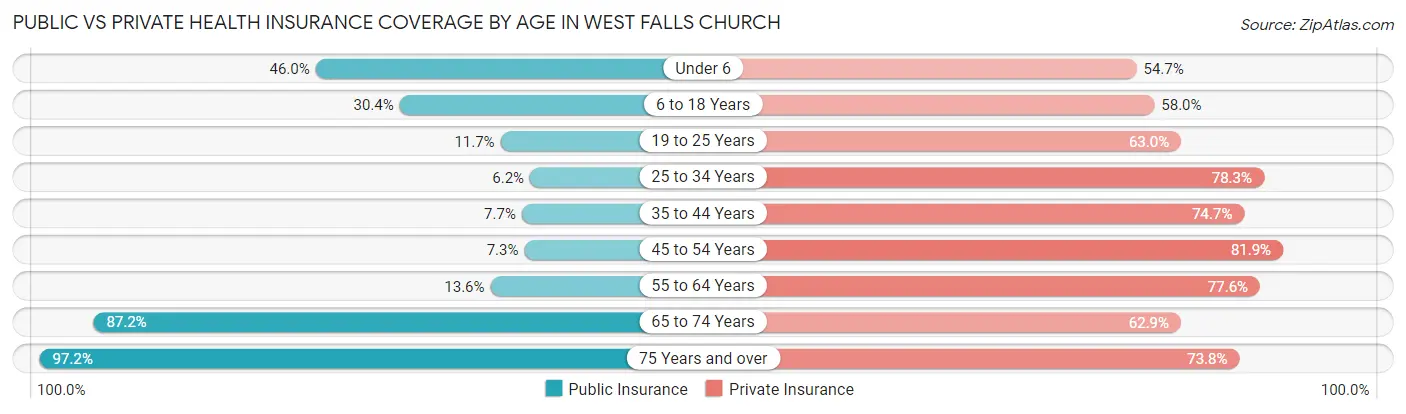
| Age Bracket | Public Insurance | Private Insurance |
| Under 6 | 1,347 (46.0%) | 1,602 (54.7%) |
| 6 to 18 Years | 1,308 (30.4%) | 2,496 (58.0%) |
| 19 to 25 Years | 337 (11.7%) | 1,816 (62.9%) |
| 25 to 34 Years | 250 (6.2%) | 3,154 (78.3%) |
| 35 to 44 Years | 383 (7.7%) | 3,704 (74.7%) |
| 45 to 54 Years | 335 (7.2%) | 3,782 (81.9%) |
| 55 to 64 Years | 450 (13.6%) | 2,578 (77.6%) |
| 65 to 74 Years | 2,176 (87.2%) | 1,570 (62.9%) |
| 75 Years and over | 1,472 (97.2%) | 1,117 (73.8%) |
| Total | 8,058 (26.0%) | 21,819 (70.3%) |
Disability Status by Sex by Age in West Falls Church
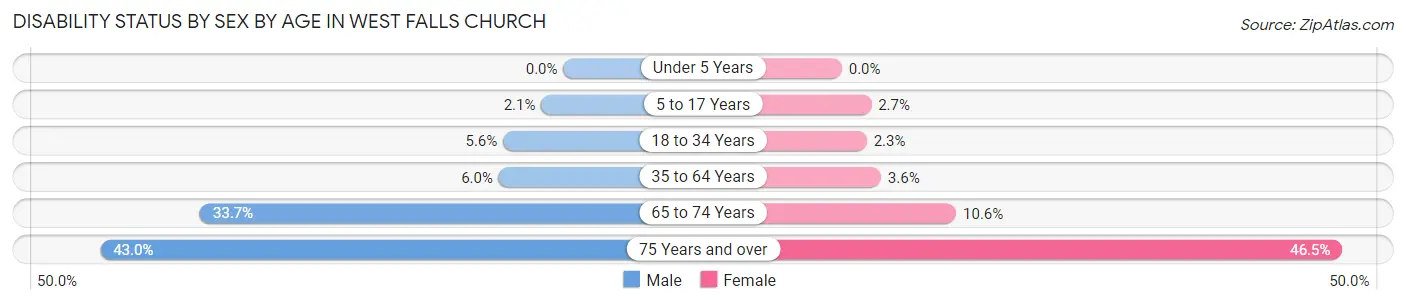
| Age Bracket | Male | Female |
| Under 5 Years | 0 (0.0%) | 0 (0.0%) |
| 5 to 17 Years | 42 (2.1%) | 62 (2.7%) |
| 18 to 34 Years | 213 (5.6%) | 82 (2.3%) |
| 35 to 64 Years | 390 (6.0%) | 232 (3.6%) |
| 65 to 74 Years | 457 (33.7%) | 121 (10.6%) |
| 75 Years and over | 312 (43.0%) | 366 (46.5%) |
Disability Class by Sex by Age in West Falls Church
Disability Class: Hearing Difficulty
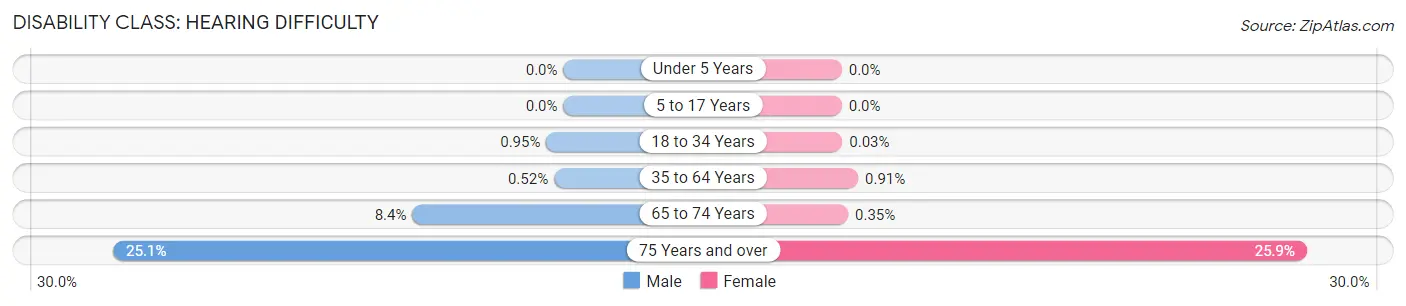
| Age Bracket | Male | Female |
| Under 5 Years | 0 (0.0%) | 0 (0.0%) |
| 5 to 17 Years | 0 (0.0%) | 0 (0.0%) |
| 18 to 34 Years | 36 (0.9%) | 1 (0.0%) |
| 35 to 64 Years | 34 (0.5%) | 58 (0.9%) |
| 65 to 74 Years | 114 (8.4%) | 4 (0.4%) |
| 75 Years and over | 182 (25.1%) | 204 (25.9%) |
Disability Class: Vision Difficulty
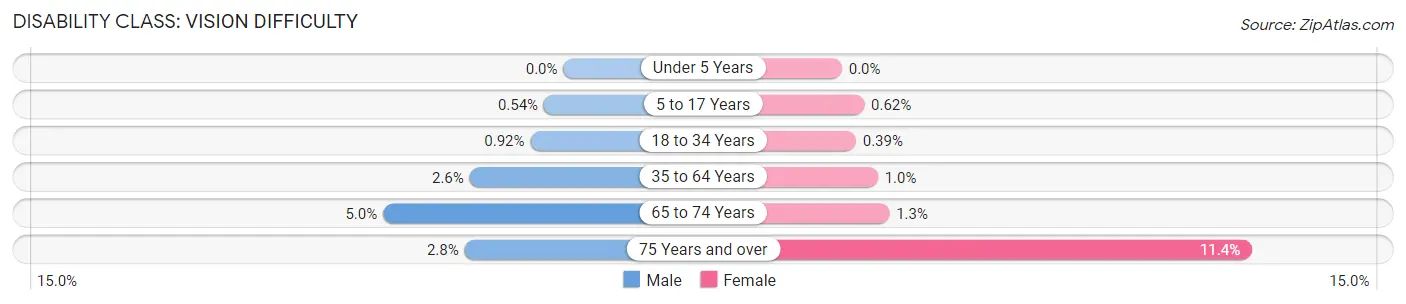
| Age Bracket | Male | Female |
| Under 5 Years | 0 (0.0%) | 0 (0.0%) |
| 5 to 17 Years | 11 (0.5%) | 14 (0.6%) |
| 18 to 34 Years | 35 (0.9%) | 14 (0.4%) |
| 35 to 64 Years | 170 (2.6%) | 64 (1.0%) |
| 65 to 74 Years | 68 (5.0%) | 15 (1.3%) |
| 75 Years and over | 20 (2.8%) | 90 (11.4%) |
Disability Class: Cognitive Difficulty
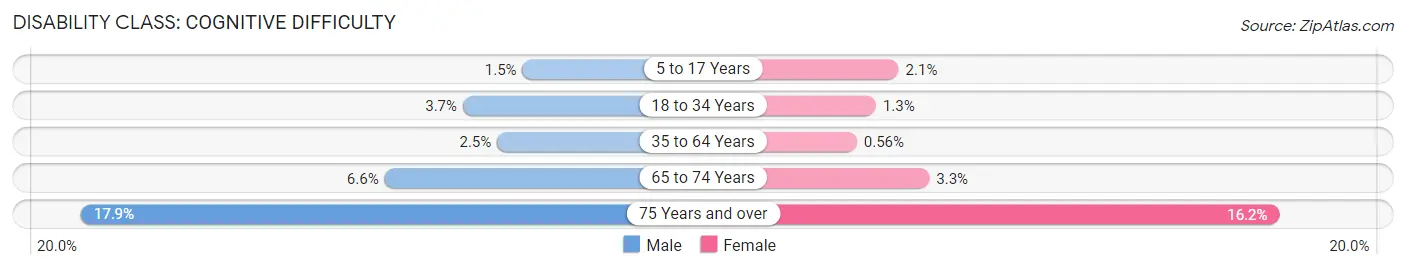
| Age Bracket | Male | Female |
| 5 to 17 Years | 31 (1.5%) | 48 (2.1%) |
| 18 to 34 Years | 142 (3.7%) | 45 (1.3%) |
| 35 to 64 Years | 160 (2.5%) | 36 (0.6%) |
| 65 to 74 Years | 90 (6.6%) | 37 (3.3%) |
| 75 Years and over | 130 (17.9%) | 128 (16.2%) |
Disability Class: Ambulatory Difficulty
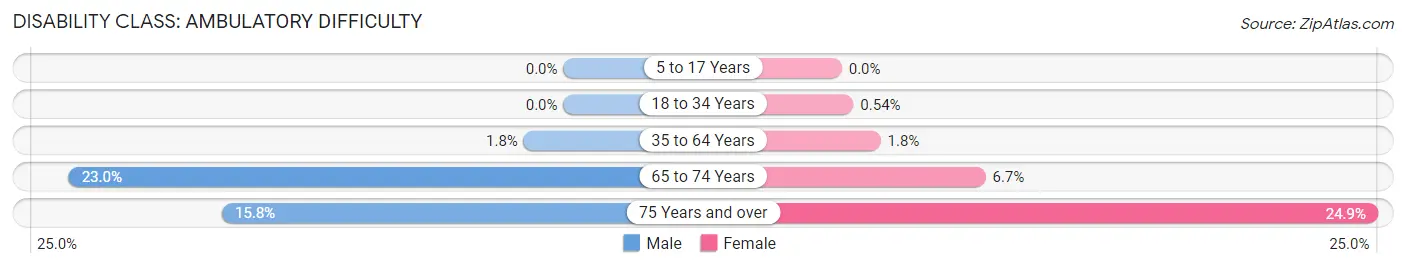
| Age Bracket | Male | Female |
| 5 to 17 Years | 0 (0.0%) | 0 (0.0%) |
| 18 to 34 Years | 0 (0.0%) | 19 (0.5%) |
| 35 to 64 Years | 120 (1.8%) | 115 (1.8%) |
| 65 to 74 Years | 311 (23.0%) | 76 (6.7%) |
| 75 Years and over | 115 (15.8%) | 196 (24.9%) |
Disability Class: Self-Care Difficulty
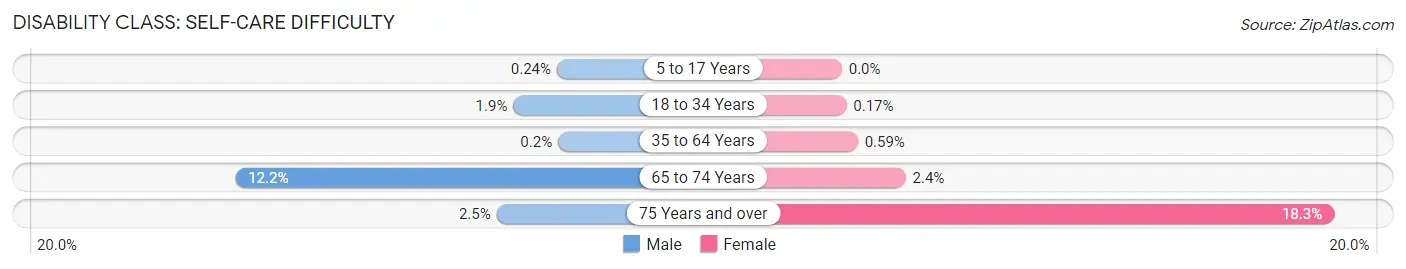
| Age Bracket | Male | Female |
| 5 to 17 Years | 5 (0.2%) | 0 (0.0%) |
| 18 to 34 Years | 71 (1.9%) | 6 (0.2%) |
| 35 to 64 Years | 13 (0.2%) | 38 (0.6%) |
| 65 to 74 Years | 165 (12.2%) | 27 (2.4%) |
| 75 Years and over | 18 (2.5%) | 144 (18.3%) |
Technology Access in West Falls Church
Computing Device Access in West Falls Church
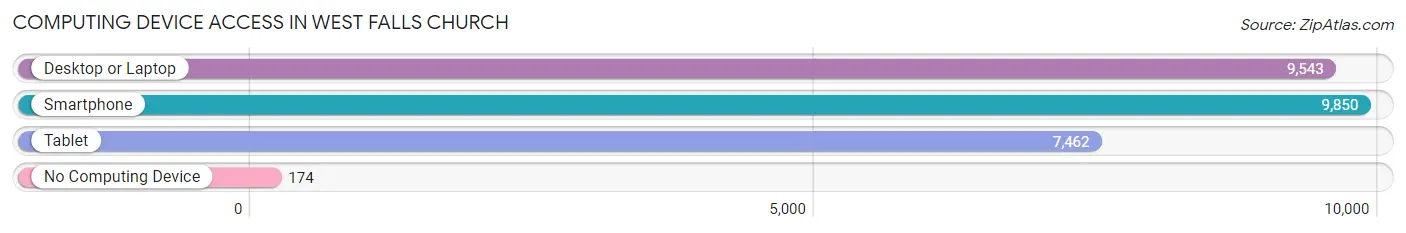
| Device Type | # Households | % Households |
| Desktop or Laptop | 9,543 | 90.5% |
| Smartphone | 9,850 | 93.4% |
| Tablet | 7,462 | 70.8% |
| No Computing Device | 174 | 1.7% |
| Total | 10,540 | 100.0% |
Internet Access in West Falls Church
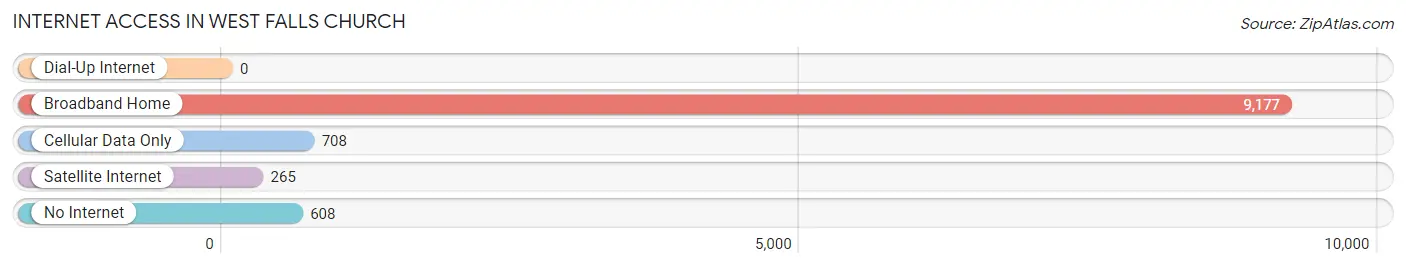
| Internet Type | # Households | % Households |
| Dial-Up Internet | 0 | 0.0% |
| Broadband Home | 9,177 | 87.1% |
| Cellular Data Only | 708 | 6.7% |
| Satellite Internet | 265 | 2.5% |
| No Internet | 608 | 5.8% |
| Total | 10,540 | 100.0% |
West Falls Church Summary
Falls Church, Virginia is a small independent city located in the northern part of the state, just outside of Washington, D.C. It is part of the Washington Metropolitan Area and is bordered by Fairfax County and Arlington County. The city is home to a population of 12,332 people, according to the 2010 census.
History
Falls Church was first settled in the late 17th century by English colonists. The area was originally known as “The Falls Church” due to its proximity to the Potomac River and the presence of a small church. The church was built in 1734 and is still standing today. The city was officially incorporated in 1875 and was named after the church.
In the late 19th century, the city began to grow rapidly due to its proximity to Washington, D.C. and the development of the Washington and Old Dominion Railroad. The railroad connected Falls Church to the rest of the region and allowed for the growth of industry and commerce.
In the early 20th century, the city experienced a period of growth and development. The population increased from 1,000 in 1900 to over 10,000 by the 1950s. During this time, the city was home to a variety of businesses, including a dairy, a cannery, a brickyard, and a lumberyard.
Geography
Falls Church is located in northern Virginia, just outside of Washington, D.C. It is part of the Washington Metropolitan Area and is bordered by Fairfax County and Arlington County. The city covers an area of 2.2 square miles and is located at an elevation of 393 feet.
The city is situated on the banks of the Potomac River and is home to a variety of parks and recreational areas. The city is also home to a variety of historic sites, including the Falls Church, which was built in 1734.
Economy
Falls Church is home to a variety of businesses and industries. The city is home to a number of government contractors, including Northrop Grumman, Booz Allen Hamilton, and Lockheed Martin. The city is also home to a number of technology companies, including Amazon Web Services, Microsoft, and Oracle.
The city is also home to a number of retail stores, restaurants, and other businesses. The city is home to a variety of shopping centers, including the West Falls Church Shopping Center and the Falls Church Shopping Center.
Demographics
According to the 2010 census, Falls Church has a population of 12,332 people. The population is made up of a variety of ethnic and racial backgrounds, including White (63.2%), Asian (20.2%), African American (9.2%), and Hispanic or Latino (7.2%).
The median household income in Falls Church is $107,817, which is significantly higher than the national average of $53,482. The median home value in the city is $541,400, which is also significantly higher than the national average of $184,700.
Conclusion
Falls Church, Virginia is a small independent city located in the northern part of the state, just outside of Washington, D.C. It is part of the Washington Metropolitan Area and is bordered by Fairfax County and Arlington County. The city is home to a population of 12,332 people, according to the 2010 census. The city is home to a variety of businesses and industries, including government contractors, technology companies, and retail stores. The median household income in Falls Church is $107,817, which is significantly higher than the national average.
Common Questions
What is Per Capita Income in West Falls Church?
Per Capita income in West Falls Church is $53,513.
What is the Median Family Income in West Falls Church?
Median Family Income in West Falls Church is $134,411.
What is the Median Household income in West Falls Church?
Median Household Income in West Falls Church is $126,737.
What is Income or Wage Gap in West Falls Church?
Income or Wage Gap in West Falls Church is 21.5%.
Women in West Falls Church earn 78.5 cents for every dollar earned by a man.
What is Inequality or Gini Index in West Falls Church?
Inequality or Gini Index in West Falls Church is 0.40.
What is the Total Population of West Falls Church?
Total Population of West Falls Church is 31,121.
What is the Total Male Population of West Falls Church?
Total Male Population of West Falls Church is 15,379.
What is the Total Female Population of West Falls Church?
Total Female Population of West Falls Church is 15,742.
What is the Ratio of Males per 100 Females in West Falls Church?
There are 97.69 Males per 100 Females in West Falls Church.
What is the Ratio of Females per 100 Males in West Falls Church?
There are 102.36 Females per 100 Males in West Falls Church.
What is the Median Population Age in West Falls Church?
Median Population Age in West Falls Church is 37.6 Years.
What is the Average Family Size in West Falls Church
Average Family Size in West Falls Church is 3.4 People.
What is the Average Household Size in West Falls Church
Average Household Size in West Falls Church is 3.0 People.
How Large is the Labor Force in West Falls Church?
There are 18,410 People in the Labor Forcein in West Falls Church.
What is the Percentage of People in the Labor Force in West Falls Church?
73.6% of People are in the Labor Force in West Falls Church.
What is the Unemployment Rate in West Falls Church?
Unemployment Rate in West Falls Church is 5.7%.