Great Falls, VA Map & Demographics
Great Falls Map
Great Falls Overview
$125,391
PER CAPITA INCOME
$250,001
AVG FAMILY INCOME
$250,001
AVG HOUSEHOLD INCOME
48.3%
WAGE / INCOME GAP [ % ]
51.7¢/ $1
WAGE / INCOME GAP [ $ ]
$7,746
FAMILY INCOME DEFICIT
0.44
INEQUALITY / GINI INDEX
14,968
TOTAL POPULATION
7,657
MALE POPULATION
7,311
FEMALE POPULATION
104.73
MALES / 100 FEMALES
95.48
FEMALES / 100 MALES
47.9
MEDIAN AGE
3.1
AVG FAMILY SIZE
3.0
AVG HOUSEHOLD SIZE
7,330
LABOR FORCE [ PEOPLE ]
61.4%
PERCENT IN LABOR FORCE
3.3%
UNEMPLOYMENT RATE
Great Falls Zip Codes
Great Falls Area Codes
Income in Great Falls
Income Overview in Great Falls
Per Capita Income in Great Falls is $125,391, while median incomes of families and households are $250,001 and $250,001 respectively.
| Characteristic | Number | Measure |
| Per Capita Income | 14,968 | $125,391 |
| Median Family Income | 4,477 | $250,001 |
| Mean Family Income | 4,477 | $386,214 |
| Median Household Income | 5,019 | $250,001 |
| Mean Household Income | 5,019 | $373,735 |
| Income Deficit | 4,477 | $7,746 |
| Wage / Income Gap (%) | 14,968 | 48.25% |
| Wage / Income Gap ($) | 14,968 | 51.75¢ per $1 |
| Gini / Inequality Index | 14,968 | 0.44 |
Earnings by Sex in Great Falls
Average Earnings in Great Falls are $115,208, $144,256 for men and $74,651 for women, a difference of 48.2%.
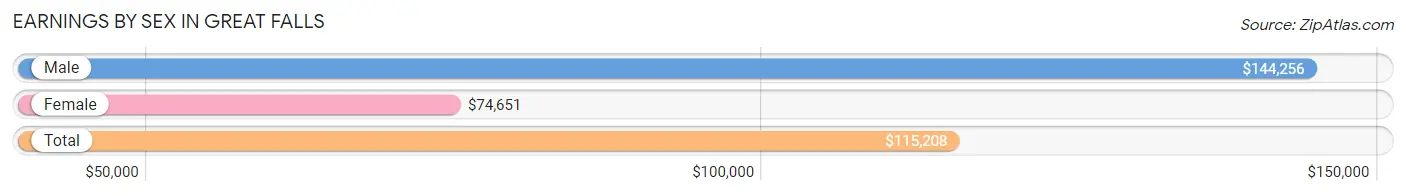
| Sex | Number | Average Earnings |
| Male | 4,397 (55.0%) | $144,256 |
| Female | 3,594 (45.0%) | $74,651 |
| Total | 7,991 (100.0%) | $115,208 |
Earnings by Sex by Income Bracket in Great Falls
The most common earnings brackets in Great Falls are $100,000+ for men (2,941 | 66.9%) and $100,000+ for women (1,446 | 40.2%).
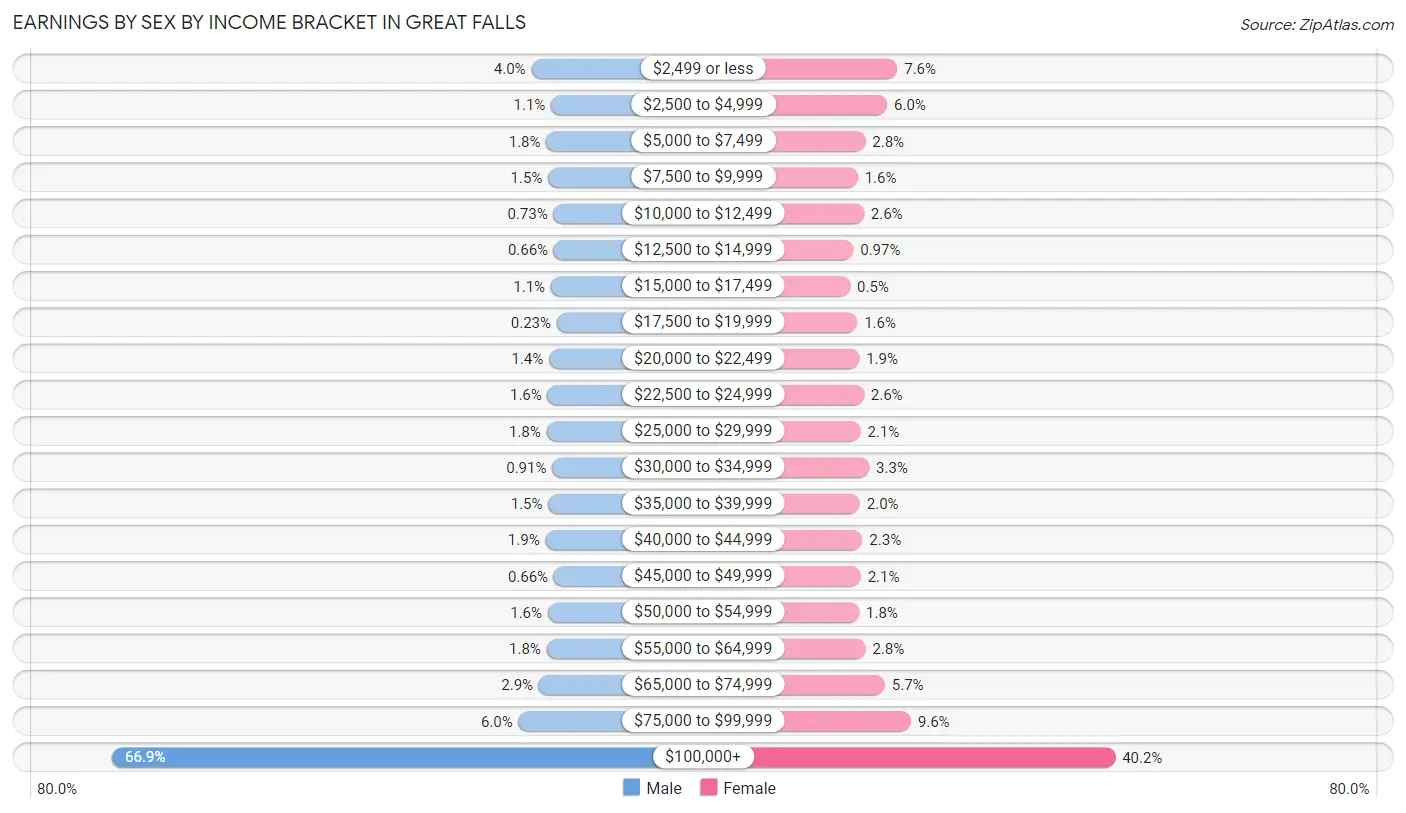
| Income | Male | Female |
| $2,499 or less | 177 (4.0%) | 272 (7.6%) |
| $2,500 to $4,999 | 47 (1.1%) | 217 (6.0%) |
| $5,000 to $7,499 | 79 (1.8%) | 100 (2.8%) |
| $7,500 to $9,999 | 67 (1.5%) | 59 (1.6%) |
| $10,000 to $12,499 | 32 (0.7%) | 92 (2.6%) |
| $12,500 to $14,999 | 29 (0.7%) | 35 (1.0%) |
| $15,000 to $17,499 | 49 (1.1%) | 18 (0.5%) |
| $17,500 to $19,999 | 10 (0.2%) | 56 (1.6%) |
| $20,000 to $22,499 | 61 (1.4%) | 67 (1.9%) |
| $22,500 to $24,999 | 71 (1.6%) | 92 (2.6%) |
| $25,000 to $29,999 | 78 (1.8%) | 74 (2.1%) |
| $30,000 to $34,999 | 40 (0.9%) | 120 (3.3%) |
| $35,000 to $39,999 | 66 (1.5%) | 70 (1.9%) |
| $40,000 to $44,999 | 85 (1.9%) | 84 (2.3%) |
| $45,000 to $49,999 | 29 (0.7%) | 75 (2.1%) |
| $50,000 to $54,999 | 69 (1.6%) | 66 (1.8%) |
| $55,000 to $64,999 | 77 (1.8%) | 101 (2.8%) |
| $65,000 to $74,999 | 128 (2.9%) | 205 (5.7%) |
| $75,000 to $99,999 | 262 (6.0%) | 345 (9.6%) |
| $100,000+ | 2,941 (66.9%) | 1,446 (40.2%) |
| Total | 4,397 (100.0%) | 3,594 (100.0%) |
Earnings by Sex by Educational Attainment in Great Falls
Average earnings in Great Falls are $154,104 for men and $87,750 for women, a difference of 43.1%. Men with an educational attainment of graduate degree enjoy the highest average annual earnings of $174,583, while those with high school diploma education earn the least with $69,286. Women with an educational attainment of graduate degree earn the most with the average annual earnings of $125,875, while those with college or associate's degree education have the smallest earnings of $50,598.
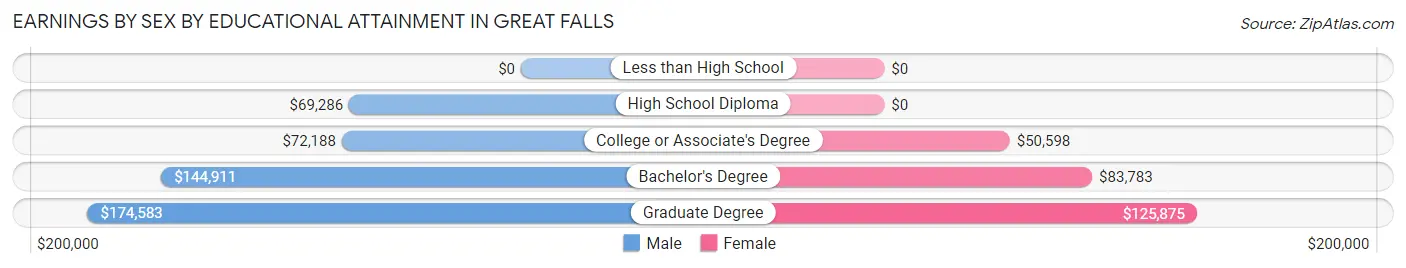
| Educational Attainment | Male Income | Female Income |
| Less than High School | - | - |
| High School Diploma | $69,286 | $0 |
| College or Associate's Degree | $72,188 | $50,598 |
| Bachelor's Degree | $144,911 | $83,783 |
| Graduate Degree | $174,583 | $125,875 |
| Total | $154,104 | $87,750 |
Family Income in Great Falls
Family Income Brackets in Great Falls
According to the Great Falls family income data, there are 3,277 families falling into the $200,000+ income range, which is the most common income bracket and makes up 73.2% of all families.
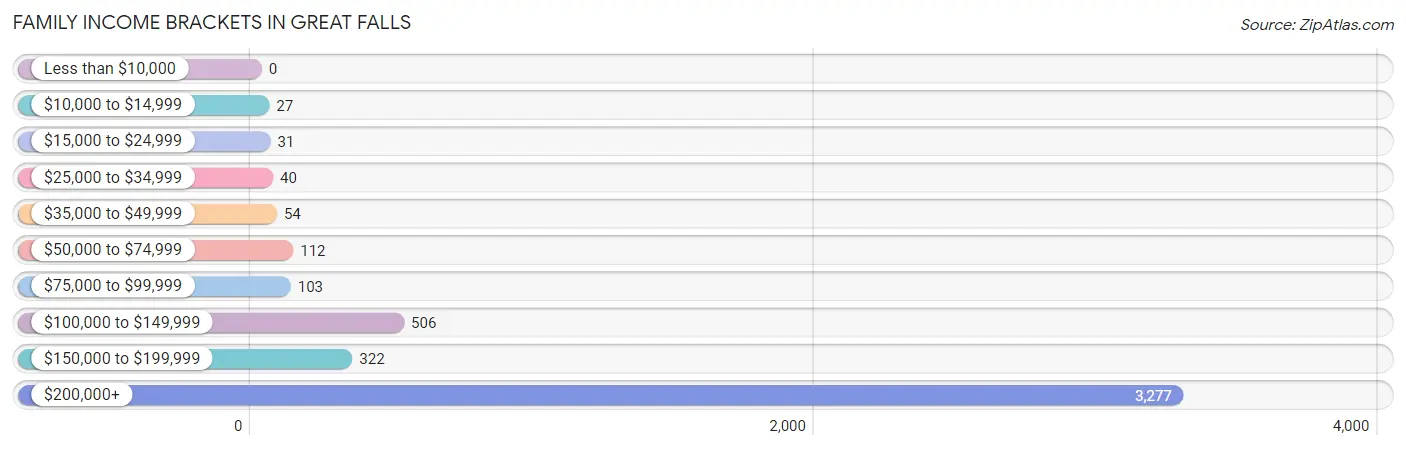
| Income Bracket | # Families | % Families |
| Less than $10,000 | 0 | 0.0% |
| $10,000 to $14,999 | 27 | 0.6% |
| $15,000 to $24,999 | 31 | 0.7% |
| $25,000 to $34,999 | 40 | 0.9% |
| $35,000 to $49,999 | 54 | 1.2% |
| $50,000 to $74,999 | 112 | 2.5% |
| $75,000 to $99,999 | 103 | 2.3% |
| $100,000 to $149,999 | 506 | 11.3% |
| $150,000 to $199,999 | 322 | 7.2% |
| $200,000+ | 3,277 | 73.2% |
Family Income by Famaliy Size in Great Falls
3-person families (980 | 21.9%) account for the highest median family income in Great Falls with $250,001 per family, while 2-person families (2,058 | 46.0%) have the highest median income of $123,728 per family member.
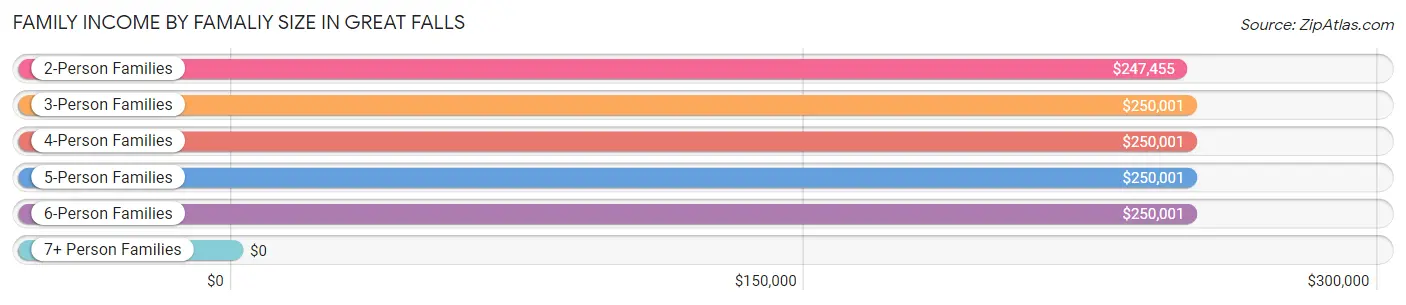
| Income Bracket | # Families | Median Income |
| 2-Person Families | 2,058 (46.0%) | $247,455 |
| 3-Person Families | 980 (21.9%) | $250,001 |
| 4-Person Families | 856 (19.1%) | $250,001 |
| 5-Person Families | 427 (9.5%) | $250,001 |
| 6-Person Families | 92 (2.1%) | $250,001 |
| 7+ Person Families | 64 (1.4%) | $0 |
| Total | 4,477 (100.0%) | $250,001 |
Family Income by Number of Earners in Great Falls
The median family income in Great Falls is $250,001, with families comprising 2 earners (2,122) having the highest median family income of $250,001, while families with no earners (508) have the lowest median family income of $177,250, accounting for 47.4% and 11.4% of families, respectively.
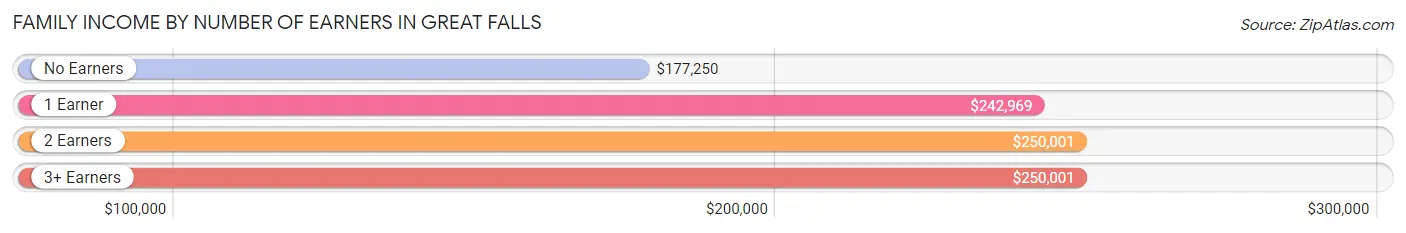
| Number of Earners | # Families | Median Income |
| No Earners | 508 (11.4%) | $177,250 |
| 1 Earner | 1,298 (29.0%) | $242,969 |
| 2 Earners | 2,122 (47.4%) | $250,001 |
| 3+ Earners | 549 (12.3%) | $250,001 |
| Total | 4,477 (100.0%) | $250,001 |
Household Income in Great Falls
Household Income Brackets in Great Falls
With 3,483 households falling in the category, the $200,000+ income range is the most frequent in Great Falls, accounting for 69.4% of all households. In contrast, only 20 households (0.4%) fall into the less than $10,000 income bracket, making it the least populous group.
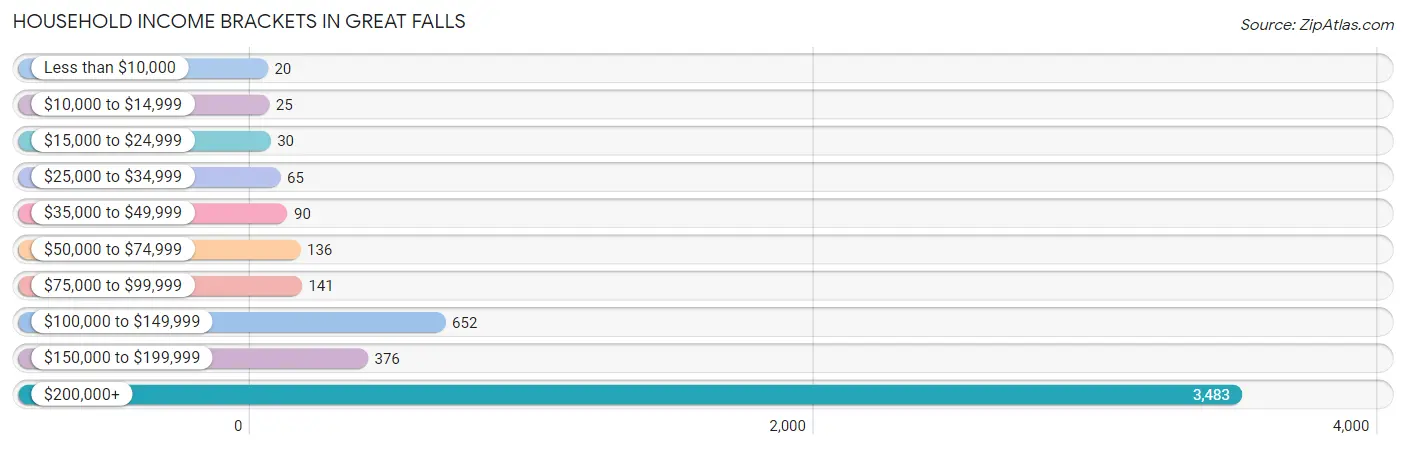
| Income Bracket | # Households | % Households |
| Less than $10,000 | 20 | 0.4% |
| $10,000 to $14,999 | 25 | 0.5% |
| $15,000 to $24,999 | 30 | 0.6% |
| $25,000 to $34,999 | 65 | 1.3% |
| $35,000 to $49,999 | 90 | 1.8% |
| $50,000 to $74,999 | 136 | 2.7% |
| $75,000 to $99,999 | 141 | 2.8% |
| $100,000 to $149,999 | 652 | 13.0% |
| $150,000 to $199,999 | 376 | 7.5% |
| $200,000+ | 3,483 | 69.4% |
Household Income by Householder Age in Great Falls
The median household income in Great Falls is $250,001, with the highest median household income of $250,001 found in the 25 to 44 years age bracket for the primary householder. A total of 813 households (16.2%) fall into this category.
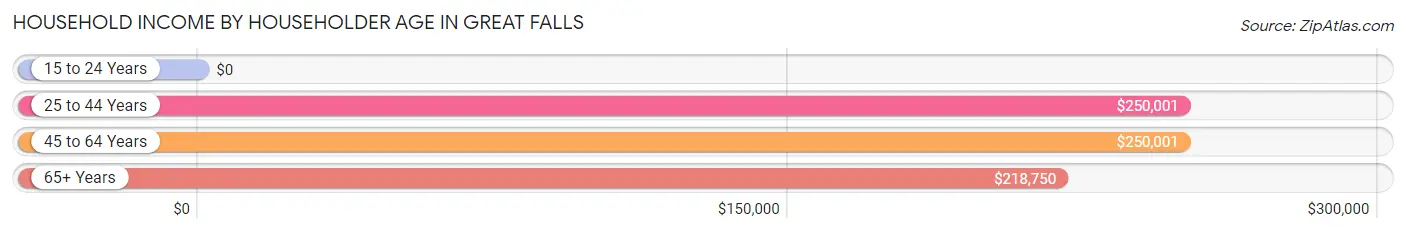
| Income Bracket | # Households | Median Income |
| 15 to 24 Years | 0 (0.0%) | $0 |
| 25 to 44 Years | 813 (16.2%) | $250,001 |
| 45 to 64 Years | 2,438 (48.6%) | $250,001 |
| 65+ Years | 1,768 (35.2%) | $218,750 |
| Total | 5,019 (100.0%) | $250,001 |
Poverty in Great Falls
Income Below Poverty by Sex and Age in Great Falls
With 2.1% poverty level for males and 2.5% for females among the residents of Great Falls, 18 to 24 year old males and 18 to 24 year old females are the most vulnerable to poverty, with 23 males (4.2%) and 21 females (6.7%) in their respective age groups living below the poverty level.
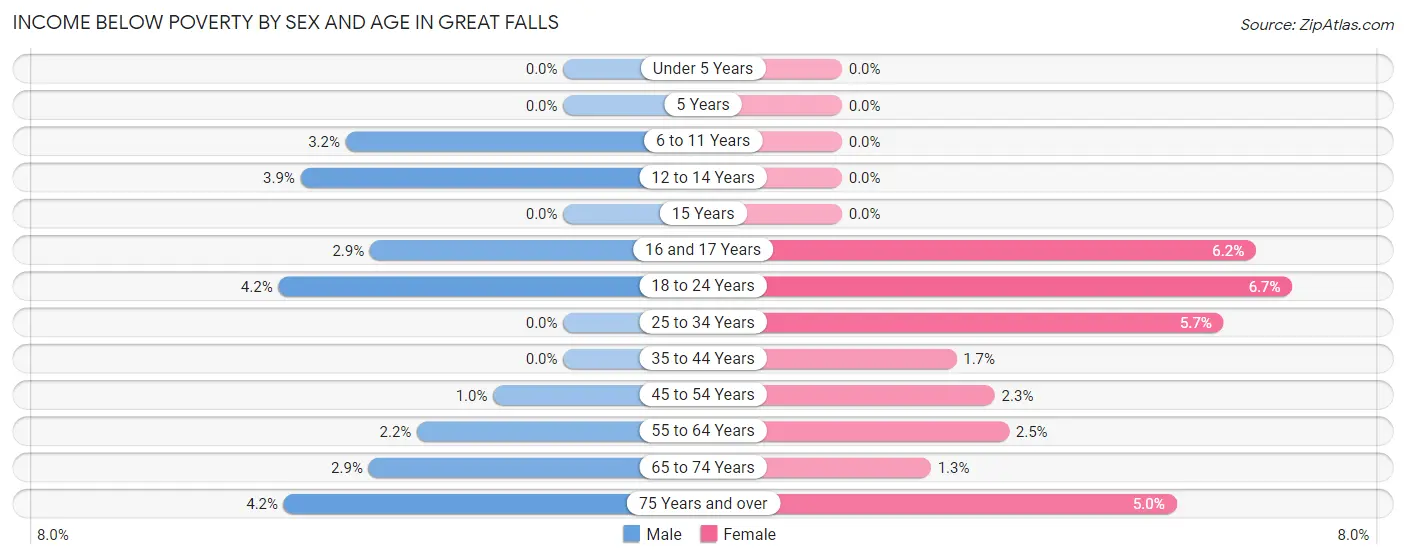
| Age Bracket | Male | Female |
| Under 5 Years | 0 (0.0%) | 0 (0.0%) |
| 5 Years | 0 (0.0%) | 0 (0.0%) |
| 6 to 11 Years | 19 (3.2%) | 0 (0.0%) |
| 12 to 14 Years | 12 (3.9%) | 0 (0.0%) |
| 15 Years | 0 (0.0%) | 0 (0.0%) |
| 16 and 17 Years | 6 (2.9%) | 16 (6.1%) |
| 18 to 24 Years | 23 (4.2%) | 21 (6.7%) |
| 25 to 34 Years | 0 (0.0%) | 23 (5.7%) |
| 35 to 44 Years | 0 (0.0%) | 14 (1.7%) |
| 45 to 54 Years | 13 (1.0%) | 29 (2.3%) |
| 55 to 64 Years | 27 (2.2%) | 30 (2.5%) |
| 65 to 74 Years | 29 (2.9%) | 11 (1.3%) |
| 75 Years and over | 29 (4.2%) | 38 (5.0%) |
| Total | 158 (2.1%) | 182 (2.5%) |
Income Above Poverty by Sex and Age in Great Falls
According to the poverty statistics in Great Falls, males aged under 5 years and females aged under 5 years are the age groups that are most secure financially, with 100.0% of males and 100.0% of females in these age groups living above the poverty line.
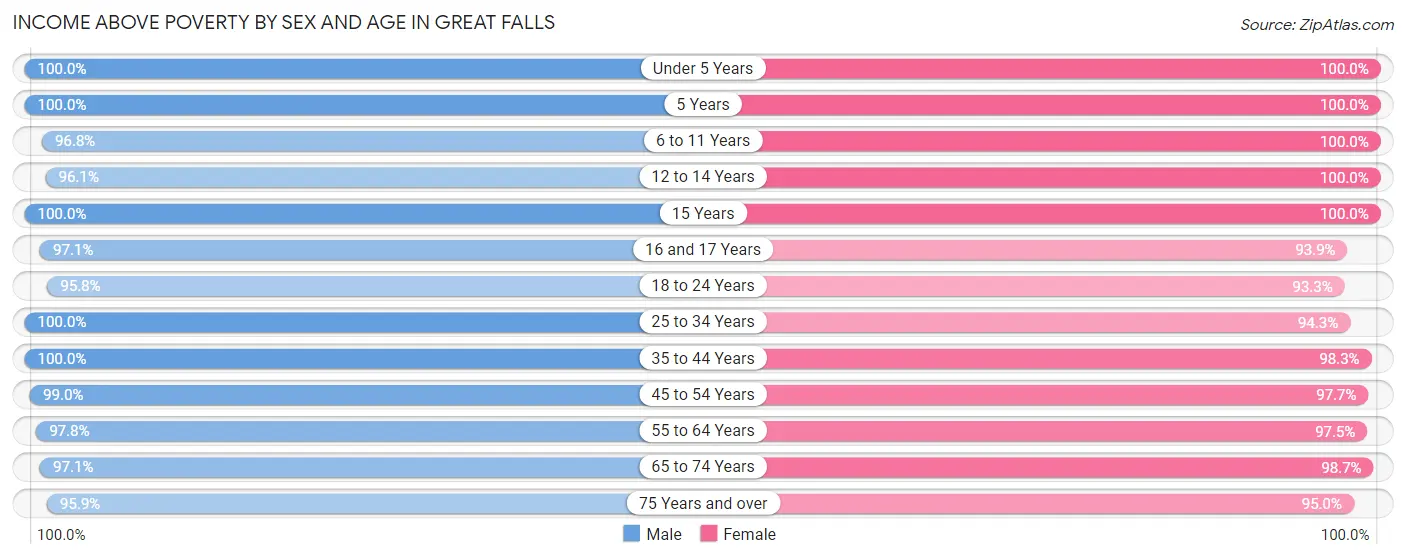
| Age Bracket | Male | Female |
| Under 5 Years | 370 (100.0%) | 248 (100.0%) |
| 5 Years | 159 (100.0%) | 50 (100.0%) |
| 6 to 11 Years | 570 (96.8%) | 672 (100.0%) |
| 12 to 14 Years | 296 (96.1%) | 305 (100.0%) |
| 15 Years | 167 (100.0%) | 133 (100.0%) |
| 16 and 17 Years | 203 (97.1%) | 244 (93.9%) |
| 18 to 24 Years | 521 (95.8%) | 293 (93.3%) |
| 25 to 34 Years | 456 (100.0%) | 383 (94.3%) |
| 35 to 44 Years | 645 (100.0%) | 809 (98.3%) |
| 45 to 54 Years | 1,235 (99.0%) | 1,249 (97.7%) |
| 55 to 64 Years | 1,219 (97.8%) | 1,179 (97.5%) |
| 65 to 74 Years | 974 (97.1%) | 823 (98.7%) |
| 75 Years and over | 669 (95.9%) | 727 (95.0%) |
| Total | 7,484 (97.9%) | 7,115 (97.5%) |
Income Below Poverty Among Married-Couple Families in Great Falls
The poverty statistics for married-couple families in Great Falls show that 1.4% or 59 of the total 4,195 families live below the poverty line. Families with 1 or 2 children have the highest poverty rate of 1.8%, comprising of 22 families. On the other hand, families with 3 or 4 children have the lowest poverty rate of 0.0%, which includes 0 families.
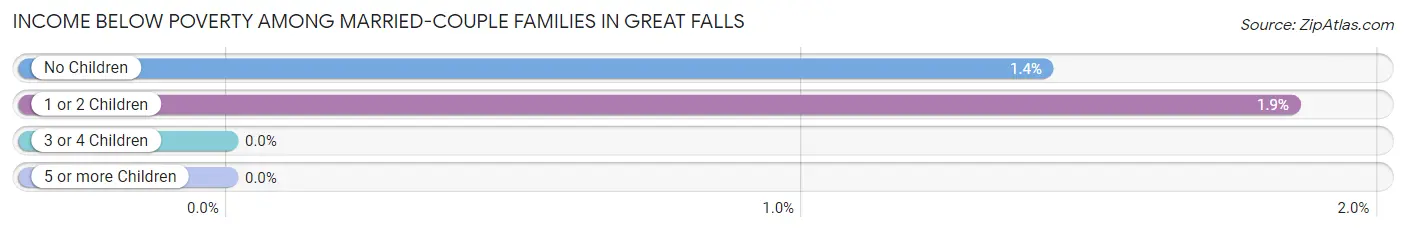
| Children | Above Poverty | Below Poverty |
| No Children | 2,576 (98.6%) | 37 (1.4%) |
| 1 or 2 Children | 1,167 (98.2%) | 22 (1.8%) |
| 3 or 4 Children | 393 (100.0%) | 0 (0.0%) |
| 5 or more Children | 0 (0.0%) | 0 (0.0%) |
| Total | 4,136 (98.6%) | 59 (1.4%) |
Income Below Poverty Among Single-Parent Households in Great Falls
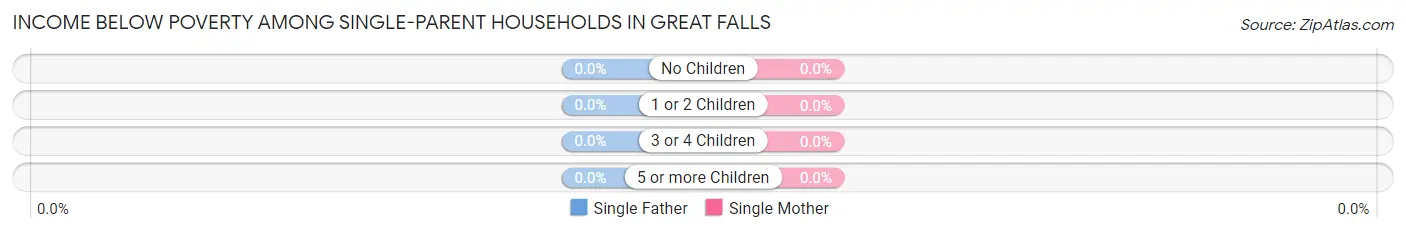
| Children | Single Father | Single Mother |
| No Children | 0 (0.0%) | 0 (0.0%) |
| 1 or 2 Children | 0 (0.0%) | 0 (0.0%) |
| 3 or 4 Children | 0 (0.0%) | 0 (0.0%) |
| 5 or more Children | 0 (0.0%) | 0 (0.0%) |
| Total | 0 (0.0%) | 0 (0.0%) |
Income Below Poverty Among Married-Couple vs Single-Parent Households in Great Falls
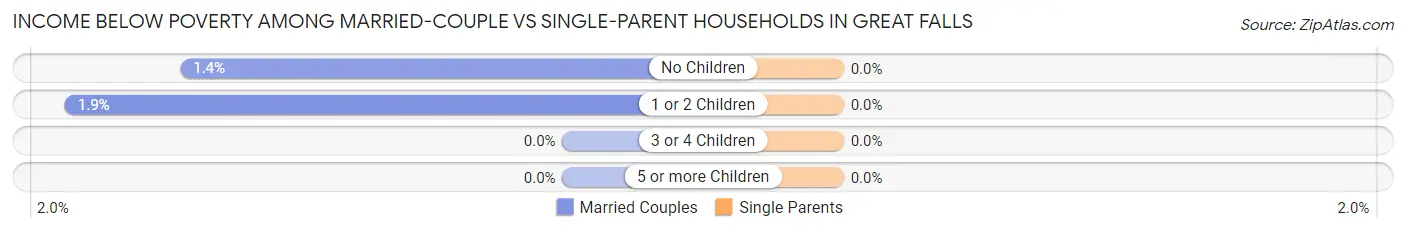
| Children | Married-Couple Families | Single-Parent Households |
| No Children | 37 (1.4%) | 0 (0.0%) |
| 1 or 2 Children | 22 (1.8%) | 0 (0.0%) |
| 3 or 4 Children | 0 (0.0%) | 0 (0.0%) |
| 5 or more Children | 0 (0.0%) | 0 (0.0%) |
| Total | 59 (1.4%) | 0 (0.0%) |
Race in Great Falls
The most populous races in Great Falls are White / Caucasian (9,944 | 66.4%), Asian (3,700 | 24.7%), and Two or more Races (779 | 5.2%).
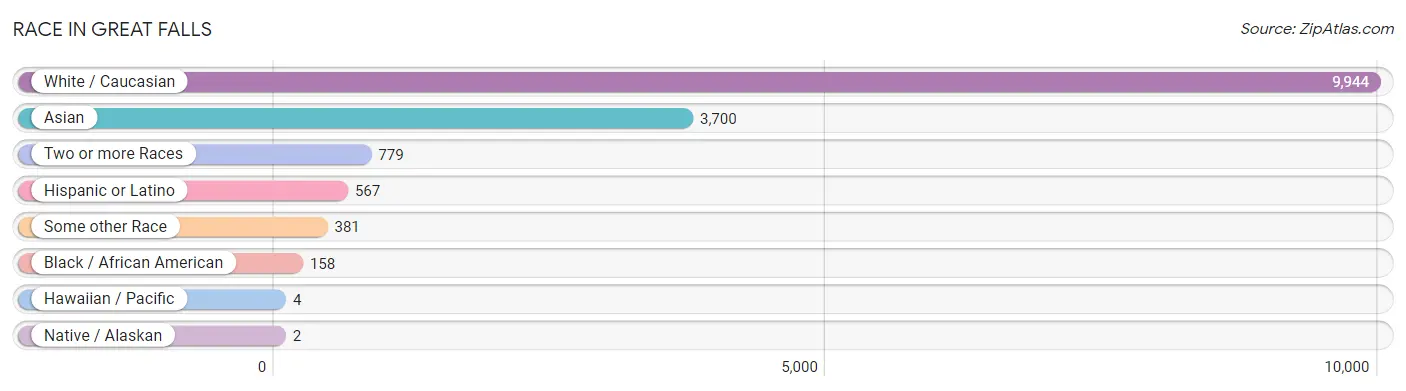
| Race | # Population | % Population |
| Asian | 3,700 | 24.7% |
| Black / African American | 158 | 1.1% |
| Hawaiian / Pacific | 4 | 0.0% |
| Hispanic or Latino | 567 | 3.8% |
| Native / Alaskan | 2 | 0.0% |
| White / Caucasian | 9,944 | 66.4% |
| Two or more Races | 779 | 5.2% |
| Some other Race | 381 | 2.5% |
| Total | 14,968 | 100.0% |
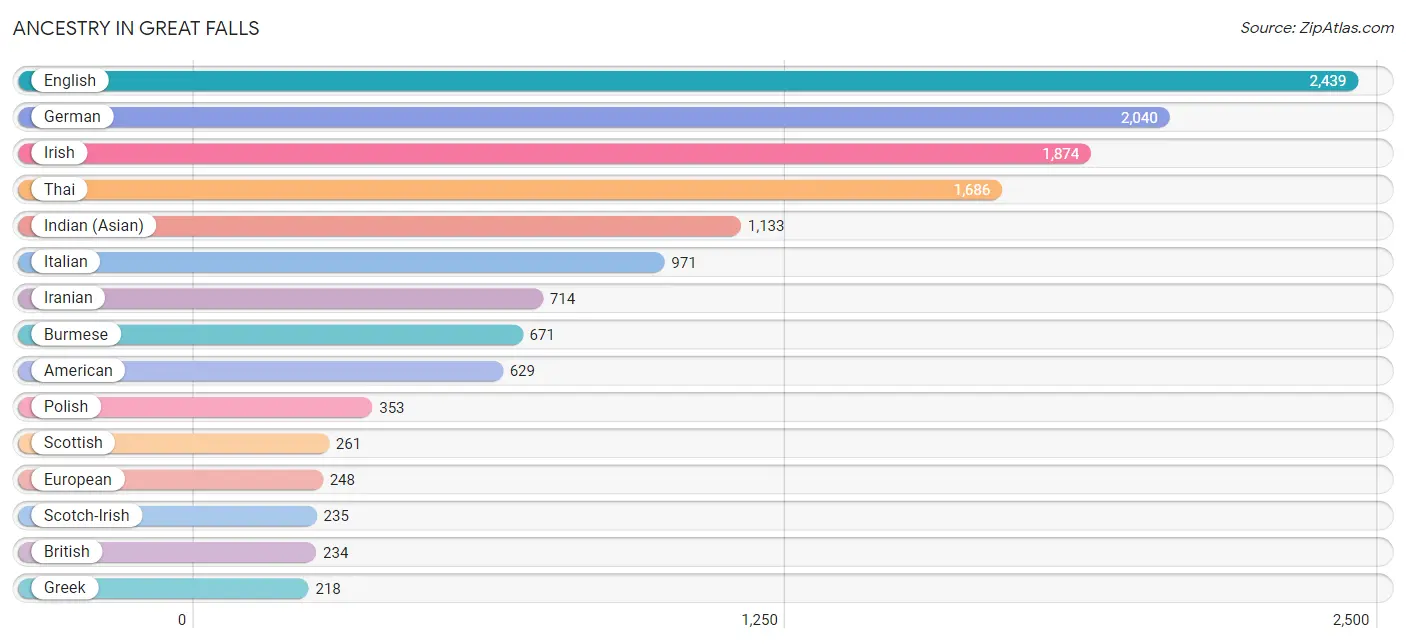
Ancestry in Great Falls
The most populous ancestries reported in Great Falls are English (2,439 | 16.3%), German (2,040 | 13.6%), Irish (1,874 | 12.5%), Thai (1,686 | 11.3%), and Indian (Asian) (1,133 | 7.6%), together accounting for 61.3% of all Great Falls residents.
| Ancestry | # Population | % Population |
| Albanian | 110 | 0.7% |
| American | 629 | 4.2% |
| Apache | 2 | 0.0% |
| Arab | 217 | 1.5% |
| Argentinean | 13 | 0.1% |
| Armenian | 99 | 0.7% |
| Austrian | 36 | 0.2% |
| Basque | 9 | 0.1% |
| Belgian | 61 | 0.4% |
| Bhutanese | 40 | 0.3% |
| Bolivian | 17 | 0.1% |
| Brazilian | 43 | 0.3% |
| British | 234 | 1.6% |
| Burmese | 671 | 4.5% |
| Canadian | 55 | 0.4% |
| Central American | 30 | 0.2% |
| Cherokee | 8 | 0.1% |
| Chilean | 32 | 0.2% |
| Colombian | 10 | 0.1% |
| Costa Rican | 21 | 0.1% |
| Croatian | 27 | 0.2% |
| Cuban | 42 | 0.3% |
| Czech | 52 | 0.4% |
| Danish | 82 | 0.5% |
| Dominican | 20 | 0.1% |
| Dutch | 100 | 0.7% |
| Eastern European | 176 | 1.2% |
| Egyptian | 16 | 0.1% |
| English | 2,439 | 16.3% |
| Ethiopian | 13 | 0.1% |
| European | 248 | 1.7% |
| Filipino | 87 | 0.6% |
| Finnish | 9 | 0.1% |
| French | 160 | 1.1% |
| French Canadian | 52 | 0.4% |
| German | 2,040 | 13.6% |
| Greek | 218 | 1.5% |
| Guamanian / Chamorro | 36 | 0.2% |
| Guyanese | 21 | 0.1% |
| Hungarian | 118 | 0.8% |
| Indian (Asian) | 1,133 | 7.6% |
| Iranian | 714 | 4.8% |
| Irish | 1,874 | 12.5% |
| Israeli | 13 | 0.1% |
| Italian | 971 | 6.5% |
| Korean | 38 | 0.3% |
| Latvian | 52 | 0.4% |
| Lebanese | 18 | 0.1% |
| Lithuanian | 18 | 0.1% |
| Maltese | 29 | 0.2% |
| Mexican | 194 | 1.3% |
| Mongolian | 10 | 0.1% |
| Northern European | 10 | 0.1% |
| Norwegian | 132 | 0.9% |
| Peruvian | 77 | 0.5% |
| Polish | 353 | 2.4% |
| Portuguese | 12 | 0.1% |
| Puerto Rican | 51 | 0.3% |
| Romanian | 82 | 0.5% |
| Russian | 83 | 0.5% |
| Salvadoran | 9 | 0.1% |
| Scandinavian | 144 | 1.0% |
| Scotch-Irish | 235 | 1.6% |
| Scottish | 261 | 1.7% |
| Serbian | 10 | 0.1% |
| Slavic | 10 | 0.1% |
| Slovak | 46 | 0.3% |
| South African | 5 | 0.0% |
| South American | 180 | 1.2% |
| South American Indian | 10 | 0.1% |
| Spaniard | 24 | 0.2% |
| Sri Lankan | 181 | 1.2% |
| Subsaharan African | 40 | 0.3% |
| Swedish | 178 | 1.2% |
| Swiss | 40 | 0.3% |
| Syrian | 50 | 0.3% |
| Thai | 1,686 | 11.3% |
| Turkish | 9 | 0.1% |
| Ukrainian | 11 | 0.1% |
| Venezuelan | 31 | 0.2% |
| Vietnamese | 21 | 0.1% |
| Welsh | 131 | 0.9% |
| West Indian | 5 | 0.0% |
| Yugoslavian | 9 | 0.1% | View All 84 Rows |
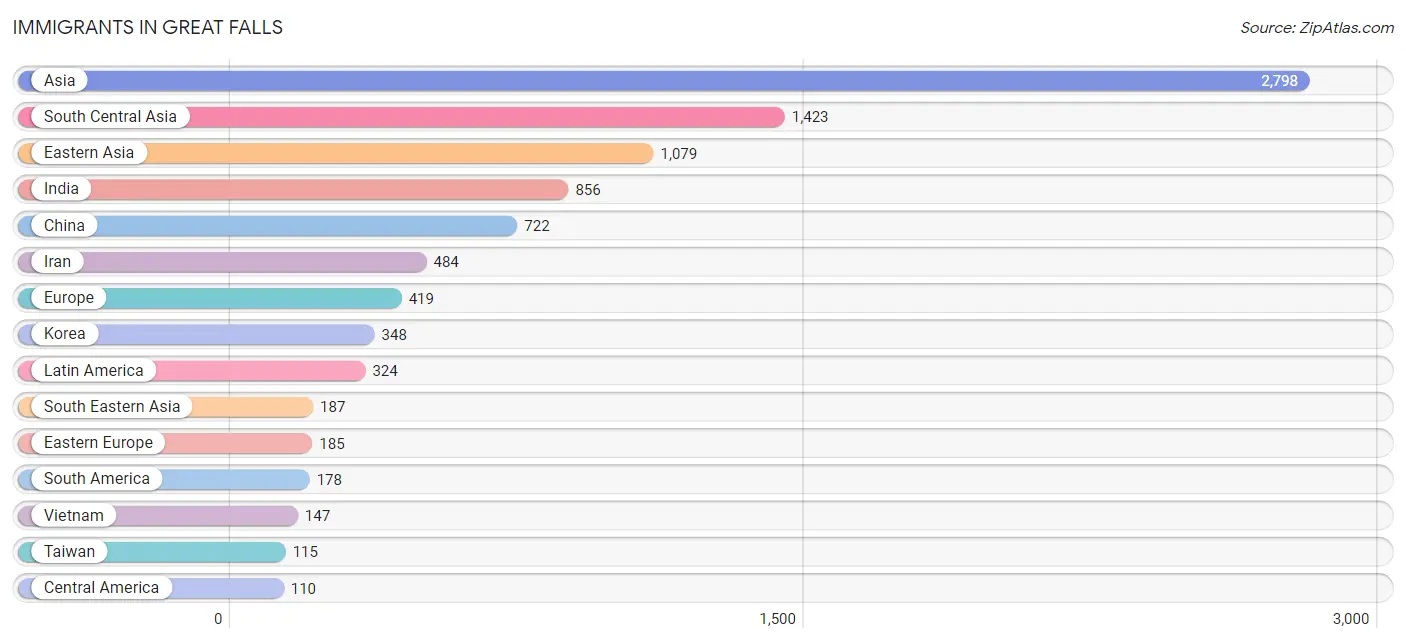
Immigrants in Great Falls
The most numerous immigrant groups reported in Great Falls came from Asia (2,798 | 18.7%), South Central Asia (1,423 | 9.5%), Eastern Asia (1,079 | 7.2%), India (856 | 5.7%), and China (722 | 4.8%), together accounting for 46.0% of all Great Falls residents.
| Immigration Origin | # Population | % Population |
| Africa | 77 | 0.5% |
| Albania | 67 | 0.4% |
| Argentina | 13 | 0.1% |
| Asia | 2,798 | 18.7% |
| Austria | 36 | 0.2% |
| Bangladesh | 5 | 0.0% |
| Bolivia | 5 | 0.0% |
| Brazil | 38 | 0.3% |
| Cameroon | 22 | 0.2% |
| Canada | 42 | 0.3% |
| Caribbean | 36 | 0.2% |
| Central America | 110 | 0.7% |
| Chile | 14 | 0.1% |
| China | 722 | 4.8% |
| Costa Rica | 21 | 0.1% |
| Croatia | 9 | 0.1% |
| Dominican Republic | 20 | 0.1% |
| Eastern Africa | 24 | 0.2% |
| Eastern Asia | 1,079 | 7.2% |
| Eastern Europe | 185 | 1.2% |
| Egypt | 16 | 0.1% |
| England | 39 | 0.3% |
| Ethiopia | 5 | 0.0% |
| Europe | 419 | 2.8% |
| Germany | 18 | 0.1% |
| Greece | 54 | 0.4% |
| Guatemala | 11 | 0.1% |
| Hong Kong | 27 | 0.2% |
| Hungary | 8 | 0.1% |
| India | 856 | 5.7% |
| Indonesia | 11 | 0.1% |
| Iran | 484 | 3.2% |
| Iraq | 44 | 0.3% |
| Italy | 10 | 0.1% |
| Japan | 9 | 0.1% |
| Korea | 348 | 2.3% |
| Latin America | 324 | 2.2% |
| Lebanon | 11 | 0.1% |
| Malaysia | 10 | 0.1% |
| Mexico | 78 | 0.5% |
| Middle Africa | 22 | 0.2% |
| Nepal | 11 | 0.1% |
| Northern Africa | 26 | 0.2% |
| Northern Europe | 108 | 0.7% |
| Pakistan | 58 | 0.4% |
| Peru | 96 | 0.6% |
| Philippines | 8 | 0.1% |
| Poland | 35 | 0.2% |
| Romania | 17 | 0.1% |
| Russia | 11 | 0.1% |
| Serbia | 10 | 0.1% |
| Singapore | 11 | 0.1% |
| South Africa | 5 | 0.0% |
| South America | 178 | 1.2% |
| South Central Asia | 1,423 | 9.5% |
| South Eastern Asia | 187 | 1.3% |
| Southern Europe | 72 | 0.5% |
| Spain | 8 | 0.1% |
| Syria | 13 | 0.1% |
| Taiwan | 115 | 0.8% |
| Trinidad and Tobago | 7 | 0.1% |
| Turkey | 11 | 0.1% |
| Uganda | 9 | 0.1% |
| Ukraine | 9 | 0.1% |
| Uzbekistan | 9 | 0.1% |
| Venezuela | 12 | 0.1% |
| Vietnam | 147 | 1.0% |
| Western Asia | 109 | 0.7% |
| Western Europe | 54 | 0.4% | View All 69 Rows |
Sex and Age in Great Falls
Sex and Age in Great Falls
The most populous age groups in Great Falls are 60 to 64 Years (660 | 8.6%) for men and 45 to 49 Years (726 | 9.9%) for women.
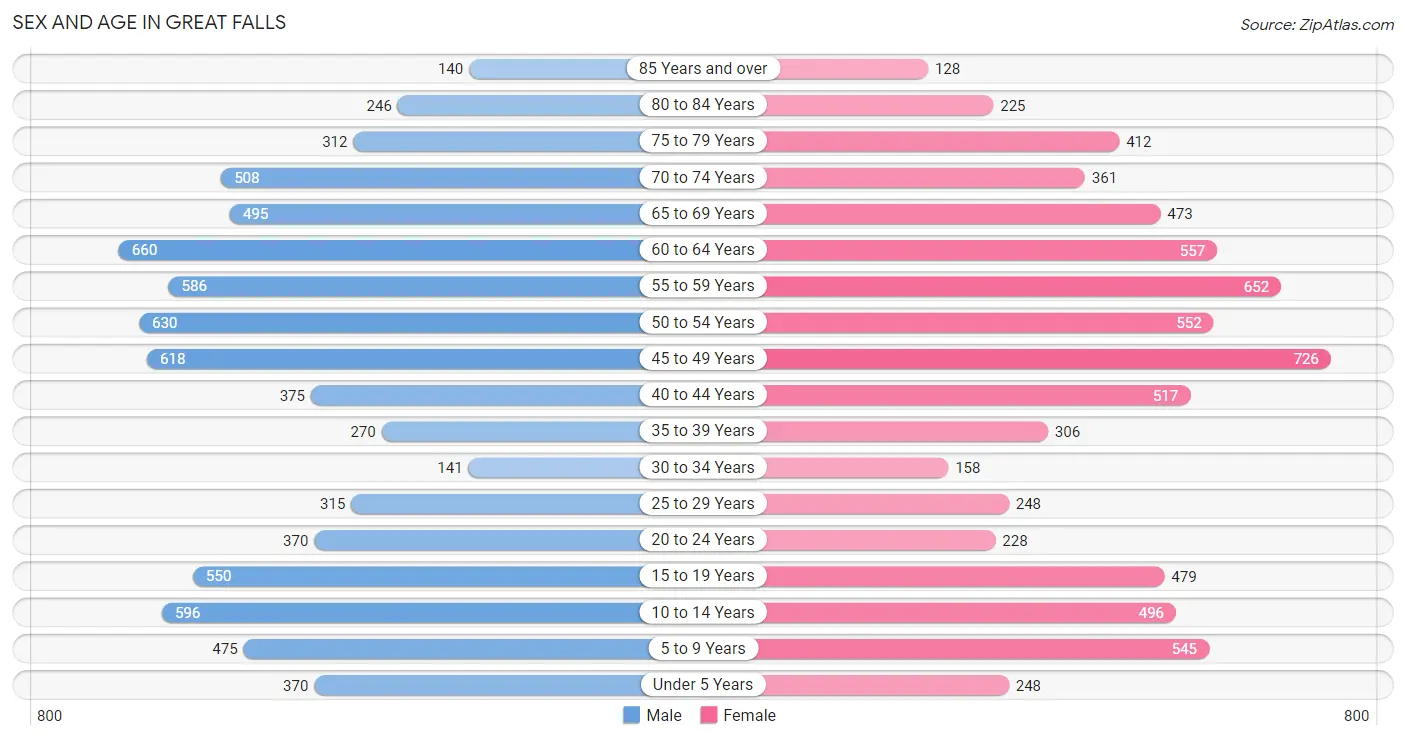
| Age Bracket | Male | Female |
| Under 5 Years | 370 (4.8%) | 248 (3.4%) |
| 5 to 9 Years | 475 (6.2%) | 545 (7.4%) |
| 10 to 14 Years | 596 (7.8%) | 496 (6.8%) |
| 15 to 19 Years | 550 (7.2%) | 479 (6.6%) |
| 20 to 24 Years | 370 (4.8%) | 228 (3.1%) |
| 25 to 29 Years | 315 (4.1%) | 248 (3.4%) |
| 30 to 34 Years | 141 (1.8%) | 158 (2.2%) |
| 35 to 39 Years | 270 (3.5%) | 306 (4.2%) |
| 40 to 44 Years | 375 (4.9%) | 517 (7.1%) |
| 45 to 49 Years | 618 (8.1%) | 726 (9.9%) |
| 50 to 54 Years | 630 (8.2%) | 552 (7.5%) |
| 55 to 59 Years | 586 (7.6%) | 652 (8.9%) |
| 60 to 64 Years | 660 (8.6%) | 557 (7.6%) |
| 65 to 69 Years | 495 (6.5%) | 473 (6.5%) |
| 70 to 74 Years | 508 (6.6%) | 361 (4.9%) |
| 75 to 79 Years | 312 (4.1%) | 412 (5.6%) |
| 80 to 84 Years | 246 (3.2%) | 225 (3.1%) |
| 85 Years and over | 140 (1.8%) | 128 (1.8%) |
| Total | 7,657 (100.0%) | 7,311 (100.0%) |
Families and Households in Great Falls
Median Family Size in Great Falls
The median family size in Great Falls is 3.13 persons per family, with married-couple families (4,195 | 93.7%) accounting for the largest median family size of 3.13 persons per family. On the other hand, single male/father families (108 | 2.4%) represent the smallest median family size with 2.97 persons per family.
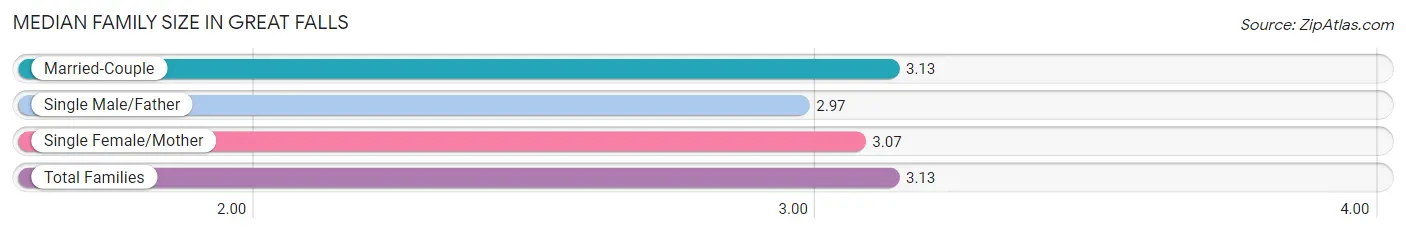
| Family Type | # Families | Family Size |
| Married-Couple | 4,195 (93.7%) | 3.13 |
| Single Male/Father | 108 (2.4%) | 2.97 |
| Single Female/Mother | 174 (3.9%) | 3.07 |
| Total Families | 4,477 (100.0%) | 3.13 |
Median Household Size in Great Falls
The median household size in Great Falls is 2.98 persons per household, with single female/mother households (174 | 3.5%) accounting for the largest median household size of 3.22 persons per household. non-family households (542 | 10.8%) represent the smallest median household size with 1.28 persons per household.
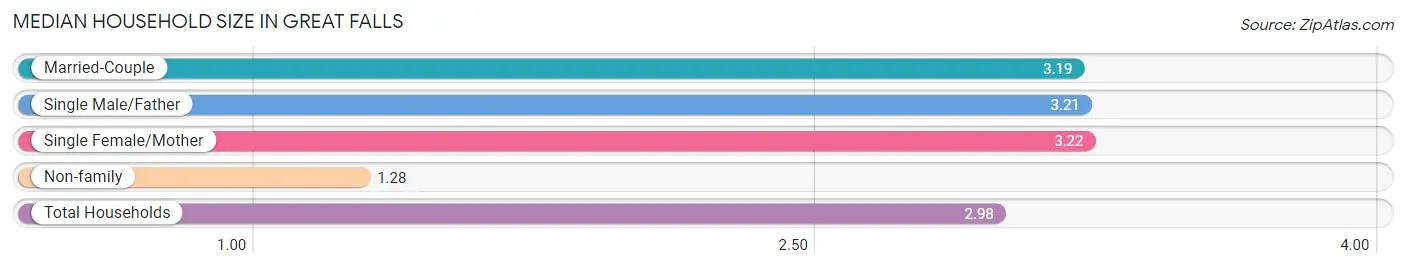
| Household Type | # Households | Household Size |
| Married-Couple | 4,195 (83.6%) | 3.19 |
| Single Male/Father | 108 (2.1%) | 3.21 |
| Single Female/Mother | 174 (3.5%) | 3.22 |
| Non-family | 542 (10.8%) | 1.28 |
| Total Households | 5,019 (100.0%) | 2.98 |
Household Size by Marriage Status in Great Falls
Out of a total of 5,019 households in Great Falls, 4,477 (89.2%) are family households, while 542 (10.8%) are nonfamily households. The most numerous type of family households are 2-person households, comprising 1,997, and the most common type of nonfamily households are 1-person households, comprising 434.
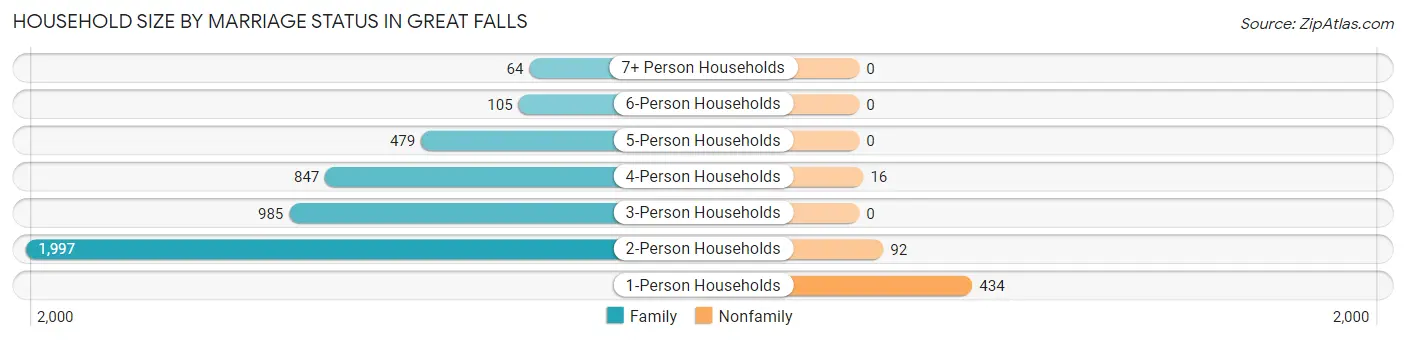
| Household Size | Family Households | Nonfamily Households |
| 1-Person Households | - | 434 (8.6%) |
| 2-Person Households | 1,997 (39.8%) | 92 (1.8%) |
| 3-Person Households | 985 (19.6%) | 0 (0.0%) |
| 4-Person Households | 847 (16.9%) | 16 (0.3%) |
| 5-Person Households | 479 (9.5%) | 0 (0.0%) |
| 6-Person Households | 105 (2.1%) | 0 (0.0%) |
| 7+ Person Households | 64 (1.3%) | 0 (0.0%) |
| Total | 4,477 (89.2%) | 542 (10.8%) |
Female Fertility in Great Falls
Fertility by Age in Great Falls
Average fertility rate in Great Falls is 21.0 births per 1,000 women. Women in the age bracket of 35 to 50 years have the highest fertility rate with 29.0 births per 1,000 women. Women in the age bracket of 35 to 50 years acount for 84.2% of all women with births.
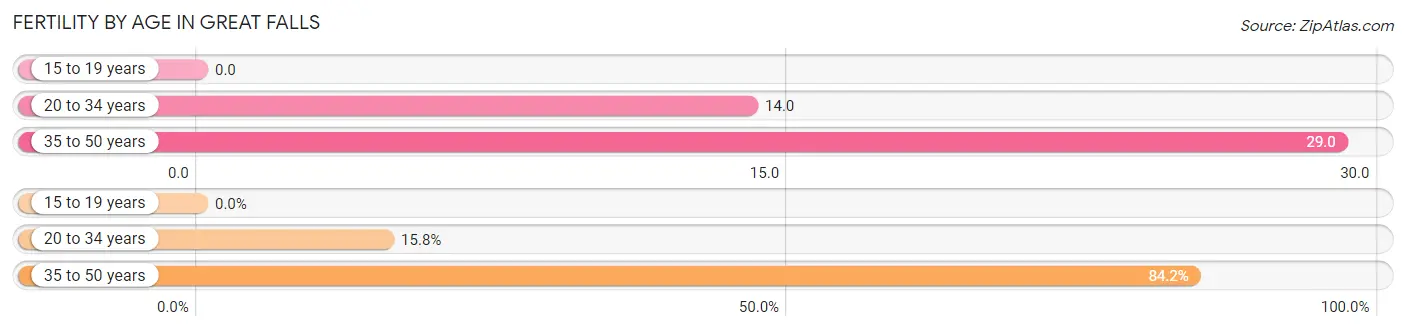
| Age Bracket | Women with Births | Births / 1,000 Women |
| 15 to 19 years | 0 (0.0%) | 0.0 |
| 20 to 34 years | 9 (15.8%) | 14.0 |
| 35 to 50 years | 48 (84.2%) | 29.0 |
| Total | 57 (100.0%) | 21.0 |
Fertility by Age by Marriage Status in Great Falls
82.5% of women with births (57) in Great Falls are married. The highest percentage of unmarried women with births falls into 35 to 50 years age bracket with 20.8% of them unmarried at the time of birth, while the lowest percentage of unmarried women with births belong to 20 to 34 years age bracket with 0.0% of them unmarried.
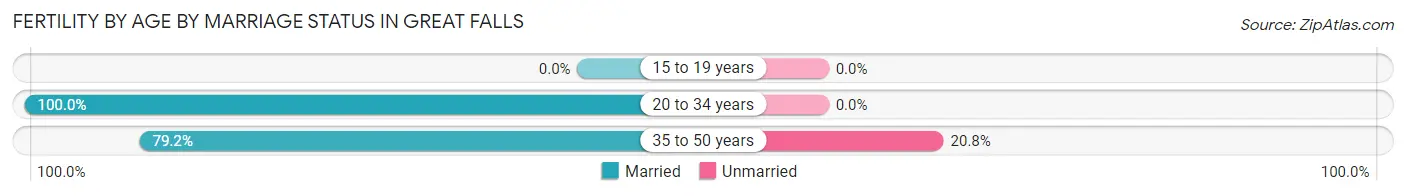
| Age Bracket | Married | Unmarried |
| 15 to 19 years | 0 (0.0%) | 0 (0.0%) |
| 20 to 34 years | 9 (100.0%) | 0 (0.0%) |
| 35 to 50 years | 38 (79.2%) | 10 (20.8%) |
| Total | 47 (82.5%) | 10 (17.5%) |
Fertility by Education in Great Falls
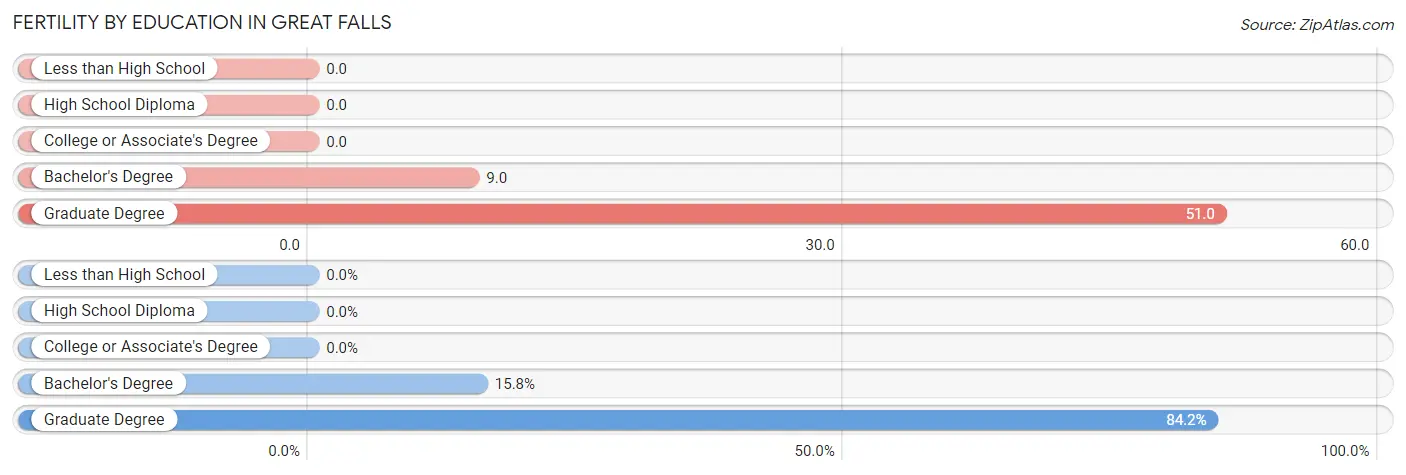
| Educational Attainment | Women with Births | Births / 1,000 Women |
| Less than High School | 0 (0.0%) | 0.0 |
| High School Diploma | 0 (0.0%) | 0.0 |
| College or Associate's Degree | 0 (0.0%) | 0.0 |
| Bachelor's Degree | 9 (15.8%) | 9.0 |
| Graduate Degree | 48 (84.2%) | 51.0 |
| Total | 57 (100.0%) | 21.0 |
Fertility by Education by Marriage Status in Great Falls
17.5% of women with births in Great Falls are unmarried. Women with the educational attainment of bachelor's degree are most likely to be married with 100.0% of them married at childbirth, while women with the educational attainment of graduate degree are least likely to be married with 20.8% of them unmarried at childbirth.
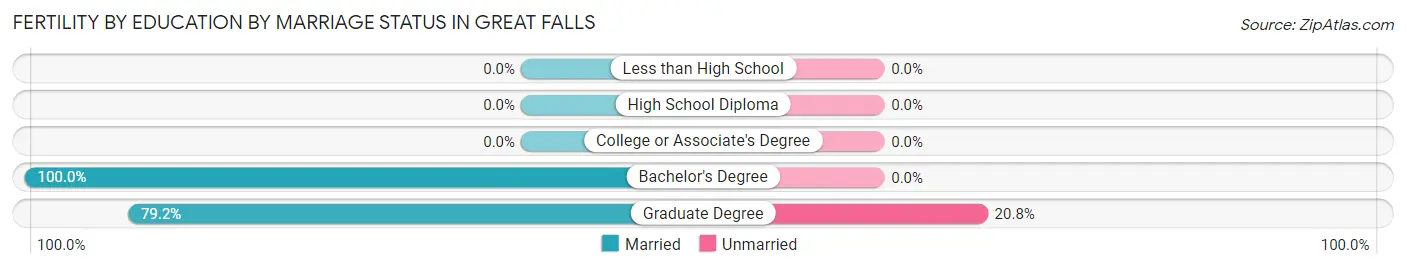
| Educational Attainment | Married | Unmarried |
| Less than High School | 0 (0.0%) | 0 (0.0%) |
| High School Diploma | 0 (0.0%) | 0 (0.0%) |
| College or Associate's Degree | 0 (0.0%) | 0 (0.0%) |
| Bachelor's Degree | 9 (100.0%) | 0 (0.0%) |
| Graduate Degree | 38 (79.2%) | 10 (20.8%) |
| Total | 47 (82.5%) | 10 (17.5%) |
Employment Characteristics in Great Falls
Employment by Class of Employer in Great Falls
Among the 6,985 employed individuals in Great Falls, private company employees (3,951 | 56.6%), self-employed (incorporated) (831 | 11.9%), and federal government employees (821 | 11.7%) make up the most common classes of employment.
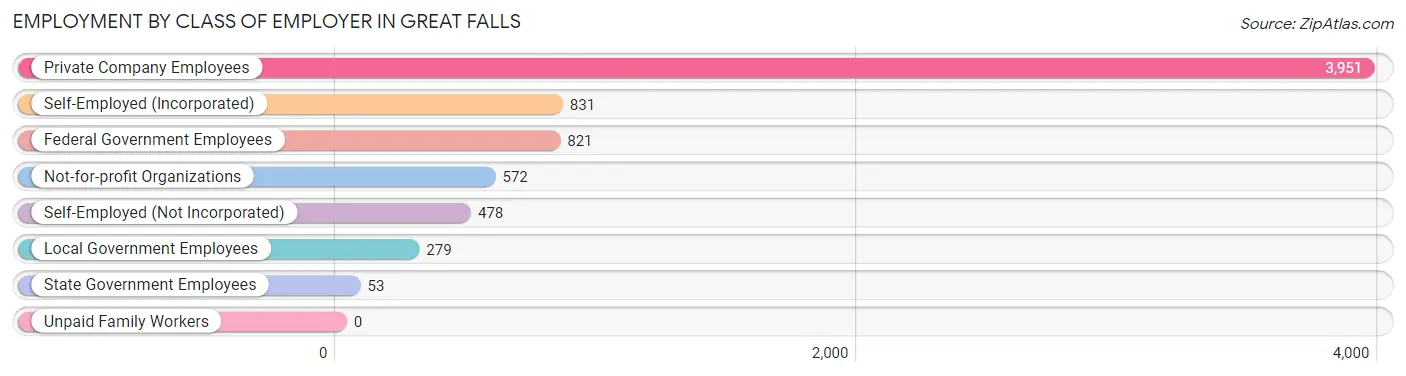
| Employer Class | # Employees | % Employees |
| Private Company Employees | 3,951 | 56.6% |
| Self-Employed (Incorporated) | 831 | 11.9% |
| Self-Employed (Not Incorporated) | 478 | 6.8% |
| Not-for-profit Organizations | 572 | 8.2% |
| Local Government Employees | 279 | 4.0% |
| State Government Employees | 53 | 0.8% |
| Federal Government Employees | 821 | 11.7% |
| Unpaid Family Workers | 0 | 0.0% |
| Total | 6,985 | 100.0% |
Employment Status by Age in Great Falls
According to the labor force statistics for Great Falls, out of the total population over 16 years of age (11,938), 61.4% or 7,330 individuals are in the labor force, with 3.3% or 242 of them unemployed. The age group with the highest labor force participation rate is 30 to 34 years, with 96.7% or 289 individuals in the labor force. Within the labor force, the 20 to 24 years age range has the highest percentage of unemployed individuals, with 12.7% or 46 of them being unemployed.
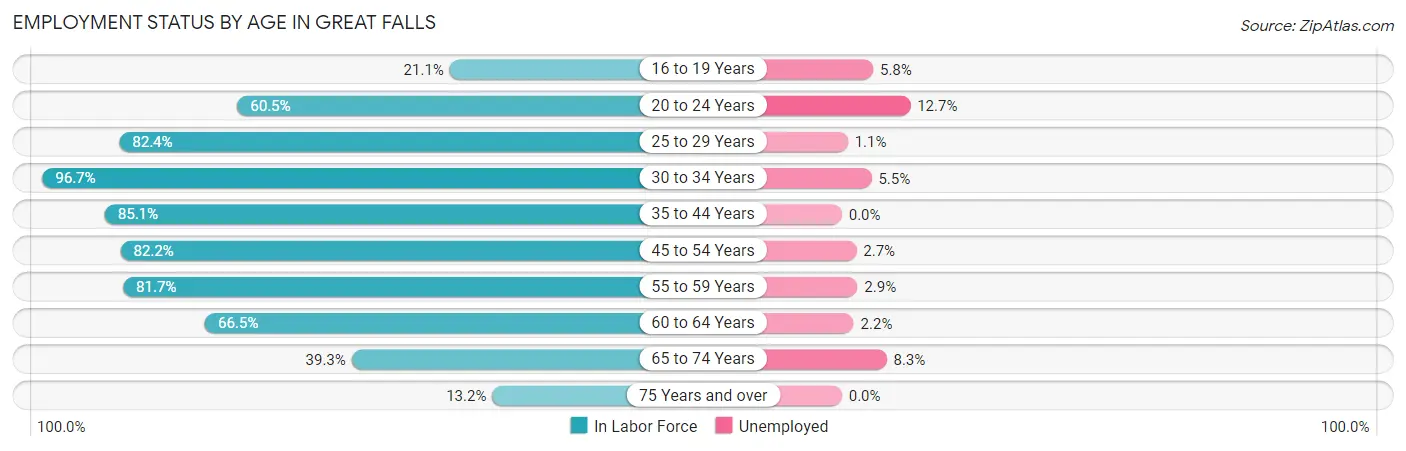
| Age Bracket | In Labor Force | Unemployed |
| 16 to 19 Years | 154 (21.1%) | 9 (5.8%) |
| 20 to 24 Years | 362 (60.5%) | 46 (12.7%) |
| 25 to 29 Years | 464 (82.4%) | 5 (1.1%) |
| 30 to 34 Years | 289 (96.7%) | 16 (5.5%) |
| 35 to 44 Years | 1,249 (85.1%) | 0 (0.0%) |
| 45 to 54 Years | 2,076 (82.2%) | 56 (2.7%) |
| 55 to 59 Years | 1,011 (81.7%) | 29 (2.9%) |
| 60 to 64 Years | 809 (66.5%) | 18 (2.2%) |
| 65 to 74 Years | 722 (39.3%) | 60 (8.3%) |
| 75 Years and over | 193 (13.2%) | 0 (0.0%) |
| Total | 7,330 (61.4%) | 242 (3.3%) |
Employment Status by Educational Attainment in Great Falls
According to labor force statistics for Great Falls, 80.7% of individuals (5,900) out of the total population between 25 and 64 years of age (7,311) are in the labor force, with 2.1% or 124 of them being unemployed. The group with the highest labor force participation rate are those with the educational attainment of college / associate degree, with 84.5% or 501 individuals in the labor force. Within the labor force, individuals with high school diploma education have the highest percentage of unemployment, with 24.3% or 45 of them being unemployed.
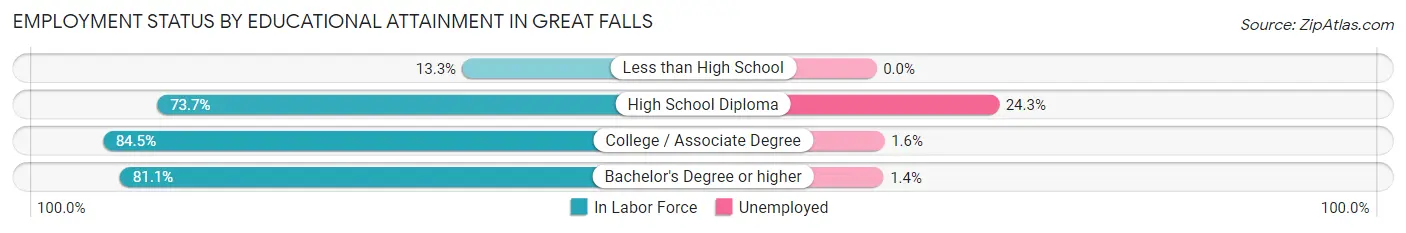
| Educational Attainment | In Labor Force | Unemployed |
| Less than High School | 6 (13.3%) | 0 (0.0%) |
| High School Diploma | 185 (73.7%) | 61 (24.3%) |
| College / Associate Degree | 501 (84.5%) | 9 (1.6%) |
| Bachelor's Degree or higher | 5,208 (81.1%) | 90 (1.4%) |
| Total | 5,900 (80.7%) | 154 (2.1%) |
Employment Occupations by Sex in Great Falls
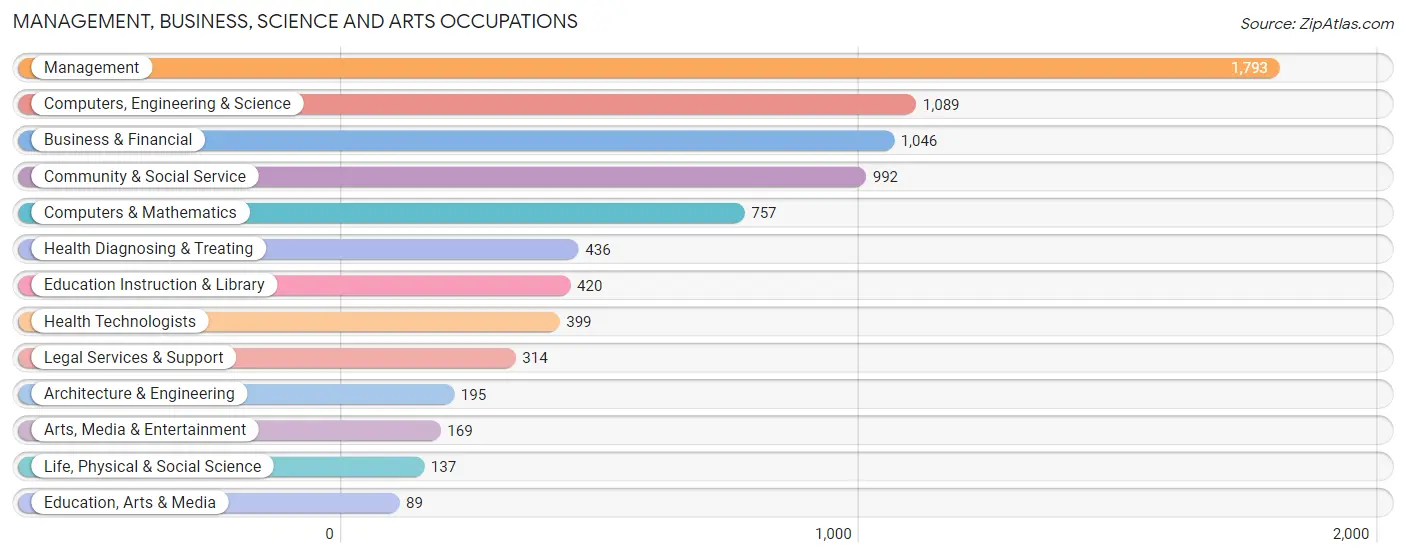
Management, Business, Science and Arts Occupations
The most common Management, Business, Science and Arts occupations in Great Falls are Management (1,793 | 25.4%), Computers, Engineering & Science (1,089 | 15.4%), Business & Financial (1,046 | 14.8%), Community & Social Service (992 | 14.1%), and Computers & Mathematics (757 | 10.7%).
Management, Business, Science and Arts Occupations by Sex
Within the Management, Business, Science and Arts occupations in Great Falls, the most male-oriented occupations are Architecture & Engineering (90.8%), Legal Services & Support (67.8%), and Computers, Engineering & Science (62.2%), while the most female-oriented occupations are Education Instruction & Library (87.1%), Education, Arts & Media (76.4%), and Community & Social Service (60.7%).
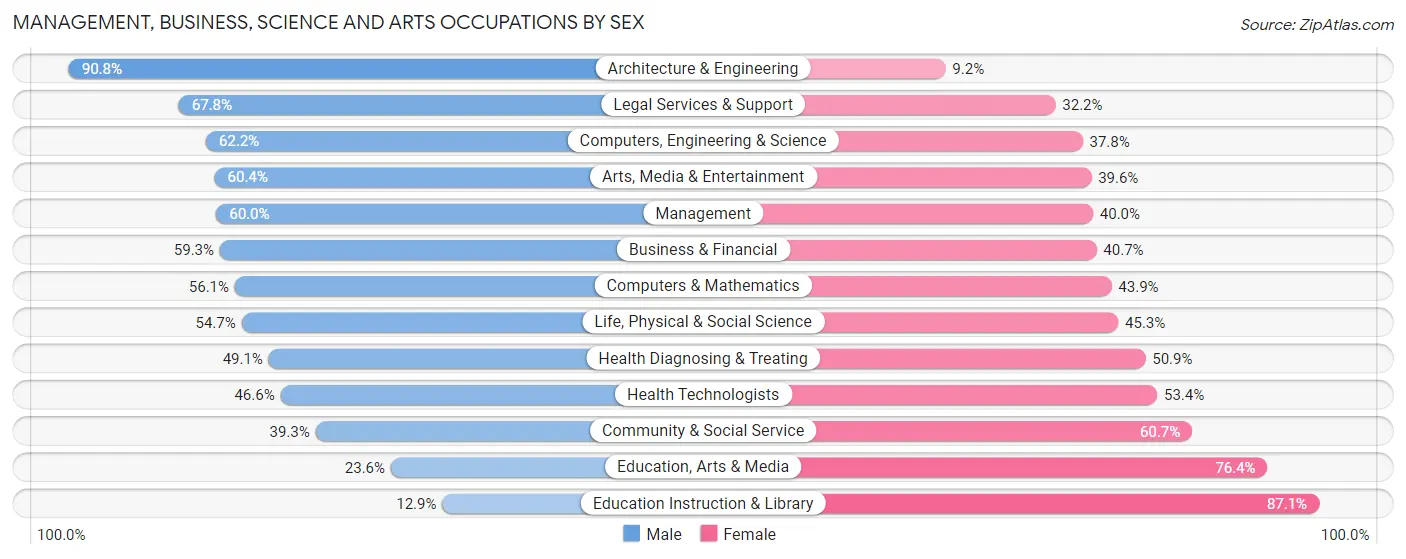
| Occupation | Male | Female |
| Management | 1,076 (60.0%) | 717 (40.0%) |
| Business & Financial | 620 (59.3%) | 426 (40.7%) |
| Computers, Engineering & Science | 677 (62.2%) | 412 (37.8%) |
| Computers & Mathematics | 425 (56.1%) | 332 (43.9%) |
| Architecture & Engineering | 177 (90.8%) | 18 (9.2%) |
| Life, Physical & Social Science | 75 (54.7%) | 62 (45.3%) |
| Community & Social Service | 390 (39.3%) | 602 (60.7%) |
| Education, Arts & Media | 21 (23.6%) | 68 (76.4%) |
| Legal Services & Support | 213 (67.8%) | 101 (32.2%) |
| Education Instruction & Library | 54 (12.9%) | 366 (87.1%) |
| Arts, Media & Entertainment | 102 (60.4%) | 67 (39.6%) |
| Health Diagnosing & Treating | 214 (49.1%) | 222 (50.9%) |
| Health Technologists | 186 (46.6%) | 213 (53.4%) |
| Total (Category) | 2,977 (55.6%) | 2,379 (44.4%) |
| Total (Overall) | 3,989 (56.5%) | 3,066 (43.5%) |
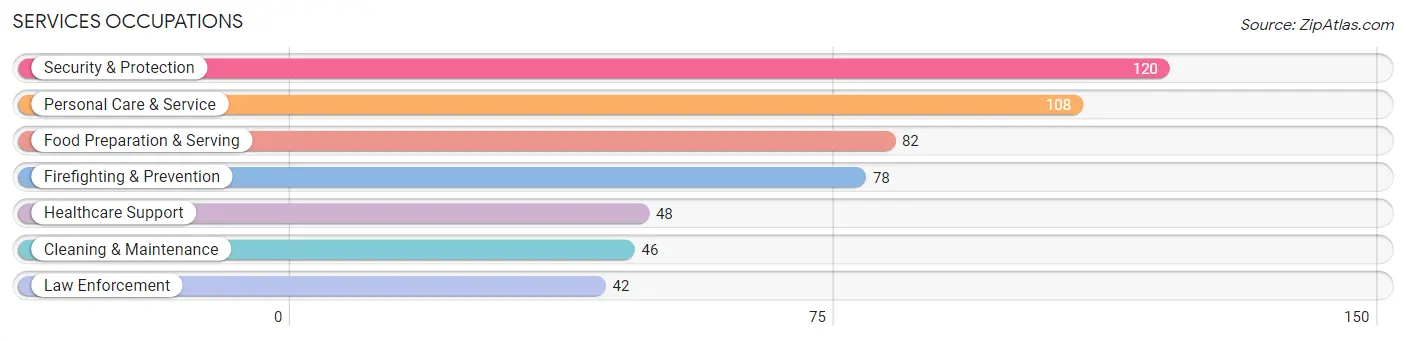
Services Occupations
The most common Services occupations in Great Falls are Security & Protection (120 | 1.7%), Personal Care & Service (108 | 1.5%), Food Preparation & Serving (82 | 1.2%), Firefighting & Prevention (78 | 1.1%), and Healthcare Support (48 | 0.7%).
Services Occupations by Sex
Within the Services occupations in Great Falls, the most male-oriented occupations are Law Enforcement (100.0%), Cleaning & Maintenance (100.0%), and Security & Protection (54.2%), while the most female-oriented occupations are Personal Care & Service (80.6%), Firefighting & Prevention (70.5%), and Healthcare Support (52.1%).
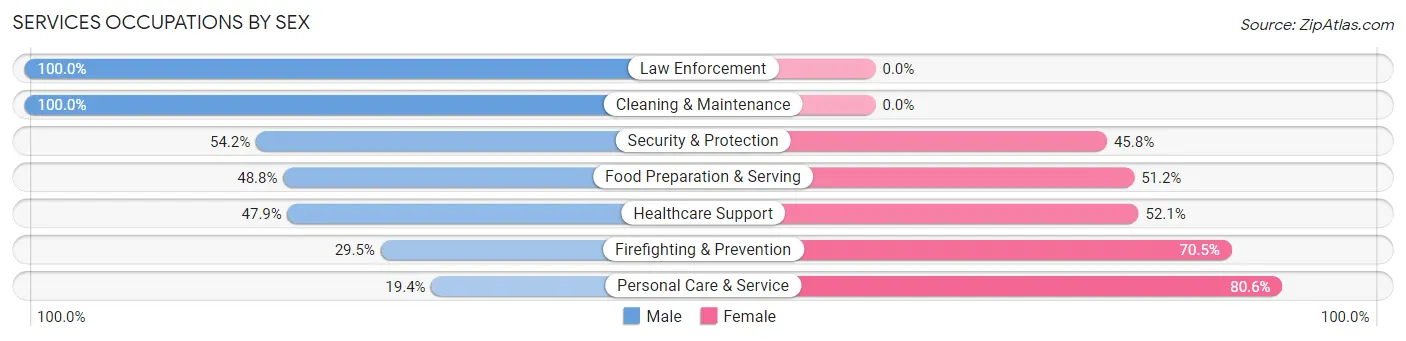
| Occupation | Male | Female |
| Healthcare Support | 23 (47.9%) | 25 (52.1%) |
| Security & Protection | 65 (54.2%) | 55 (45.8%) |
| Firefighting & Prevention | 23 (29.5%) | 55 (70.5%) |
| Law Enforcement | 42 (100.0%) | 0 (0.0%) |
| Food Preparation & Serving | 40 (48.8%) | 42 (51.2%) |
| Cleaning & Maintenance | 46 (100.0%) | 0 (0.0%) |
| Personal Care & Service | 21 (19.4%) | 87 (80.6%) |
| Total (Category) | 195 (48.3%) | 209 (51.7%) |
| Total (Overall) | 3,989 (56.5%) | 3,066 (43.5%) |
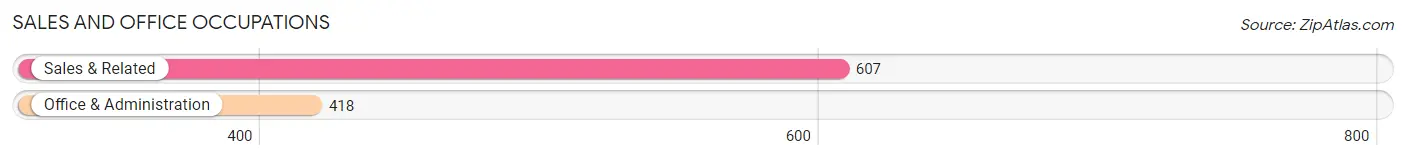
Sales and Office Occupations
The most common Sales and Office occupations in Great Falls are Sales & Related (607 | 8.6%), and Office & Administration (418 | 5.9%).
Sales and Office Occupations by Sex
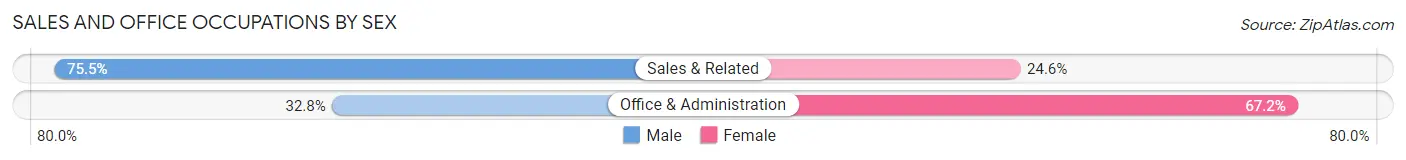
| Occupation | Male | Female |
| Sales & Related | 458 (75.4%) | 149 (24.5%) |
| Office & Administration | 137 (32.8%) | 281 (67.2%) |
| Total (Category) | 595 (58.1%) | 430 (41.9%) |
| Total (Overall) | 3,989 (56.5%) | 3,066 (43.5%) |
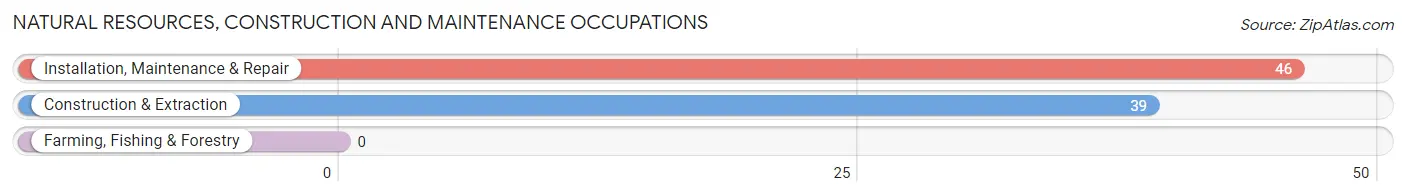
Natural Resources, Construction and Maintenance Occupations
The most common Natural Resources, Construction and Maintenance occupations in Great Falls are Installation, Maintenance & Repair (46 | 0.6%), and Construction & Extraction (39 | 0.5%).
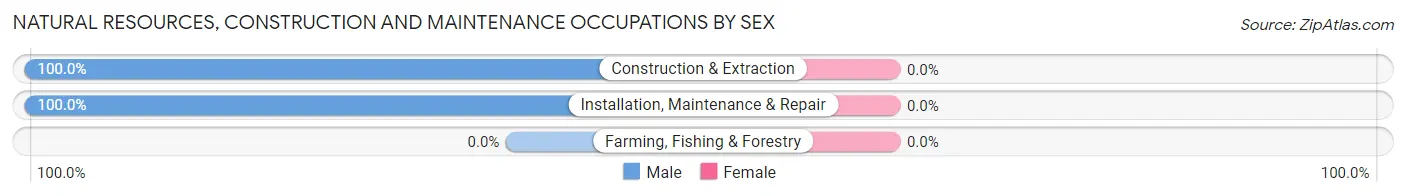
Natural Resources, Construction and Maintenance Occupations by Sex
| Occupation | Male | Female |
| Farming, Fishing & Forestry | 0 (0.0%) | 0 (0.0%) |
| Construction & Extraction | 39 (100.0%) | 0 (0.0%) |
| Installation, Maintenance & Repair | 46 (100.0%) | 0 (0.0%) |
| Total (Category) | 85 (100.0%) | 0 (0.0%) |
| Total (Overall) | 3,989 (56.5%) | 3,066 (43.5%) |
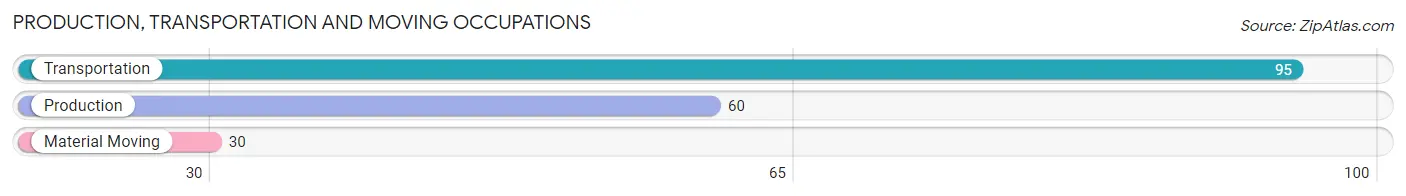
Production, Transportation and Moving Occupations
The most common Production, Transportation and Moving occupations in Great Falls are Transportation (95 | 1.3%), Production (60 | 0.9%), and Material Moving (30 | 0.4%).
Production, Transportation and Moving Occupations by Sex
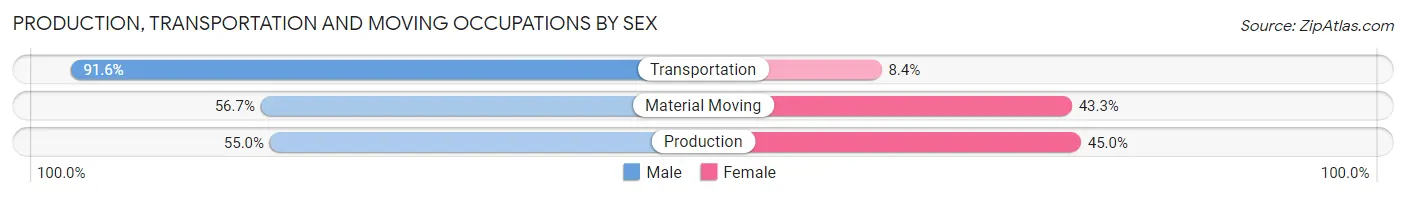
| Occupation | Male | Female |
| Production | 33 (55.0%) | 27 (45.0%) |
| Transportation | 87 (91.6%) | 8 (8.4%) |
| Material Moving | 17 (56.7%) | 13 (43.3%) |
| Total (Category) | 137 (74.1%) | 48 (26.0%) |
| Total (Overall) | 3,989 (56.5%) | 3,066 (43.5%) |
Employment Industries by Sex in Great Falls
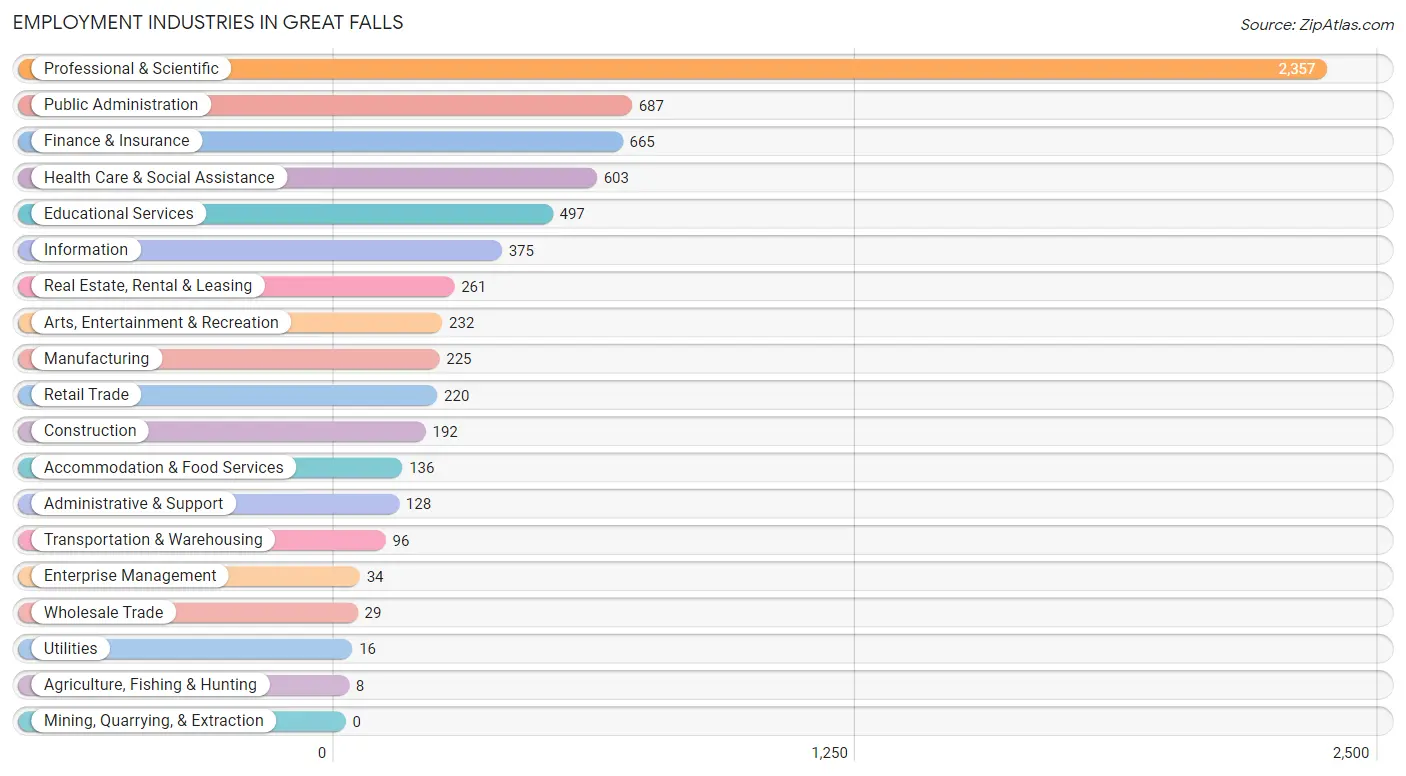
Employment Industries in Great Falls
The major employment industries in Great Falls include Professional & Scientific (2,357 | 33.4%), Public Administration (687 | 9.7%), Finance & Insurance (665 | 9.4%), Health Care & Social Assistance (603 | 8.6%), and Educational Services (497 | 7.0%).
Employment Industries by Sex in Great Falls
The Great Falls industries that see more men than women are Agriculture, Fishing & Hunting (100.0%), Utilities (100.0%), and Enterprise Management (100.0%), whereas the industries that tend to have a higher number of women are Educational Services (81.3%), Wholesale Trade (72.4%), and Health Care & Social Assistance (64.0%).
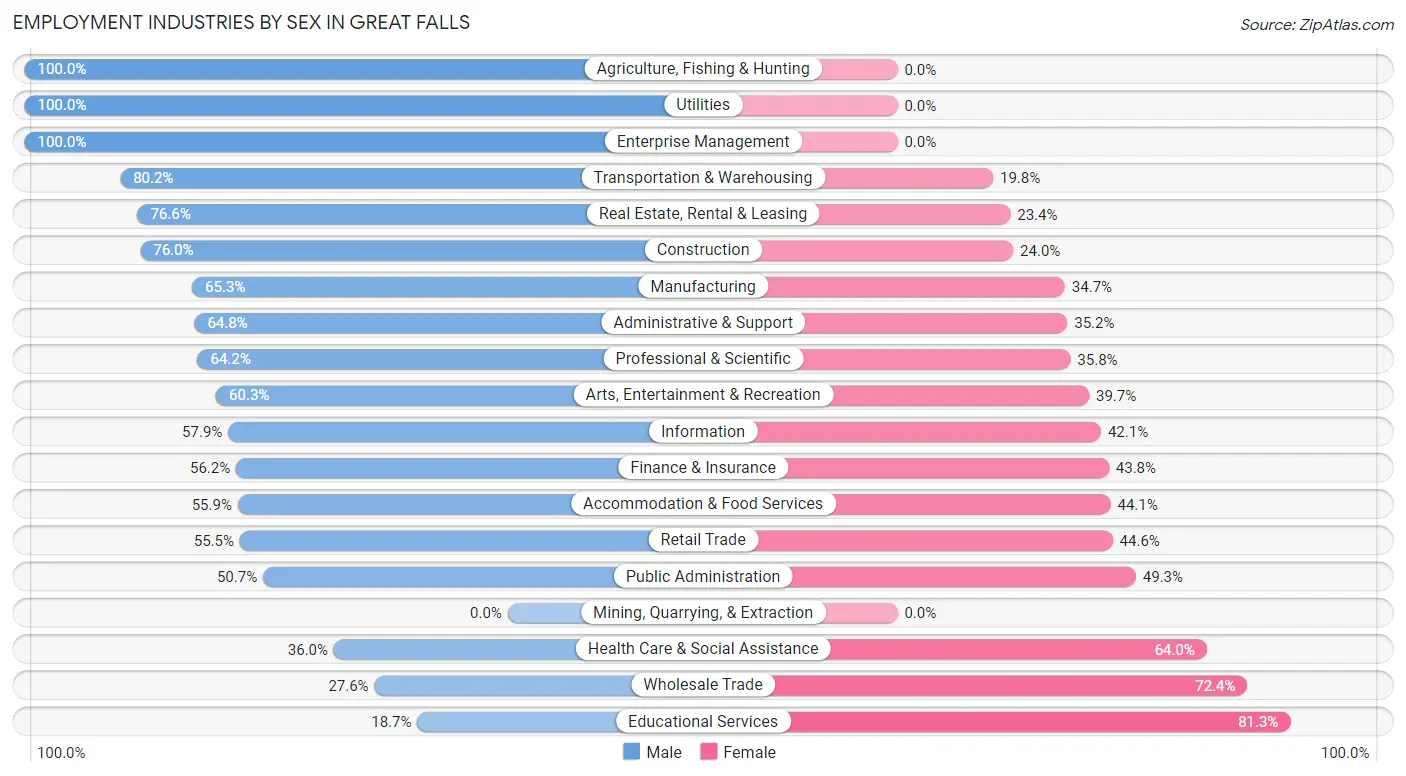
| Industry | Male | Female |
| Agriculture, Fishing & Hunting | 8 (100.0%) | 0 (0.0%) |
| Mining, Quarrying, & Extraction | 0 (0.0%) | 0 (0.0%) |
| Construction | 146 (76.0%) | 46 (24.0%) |
| Manufacturing | 147 (65.3%) | 78 (34.7%) |
| Wholesale Trade | 8 (27.6%) | 21 (72.4%) |
| Retail Trade | 122 (55.4%) | 98 (44.6%) |
| Transportation & Warehousing | 77 (80.2%) | 19 (19.8%) |
| Utilities | 16 (100.0%) | 0 (0.0%) |
| Information | 217 (57.9%) | 158 (42.1%) |
| Finance & Insurance | 374 (56.2%) | 291 (43.8%) |
| Real Estate, Rental & Leasing | 200 (76.6%) | 61 (23.4%) |
| Professional & Scientific | 1,513 (64.2%) | 844 (35.8%) |
| Enterprise Management | 34 (100.0%) | 0 (0.0%) |
| Administrative & Support | 83 (64.8%) | 45 (35.2%) |
| Educational Services | 93 (18.7%) | 404 (81.3%) |
| Health Care & Social Assistance | 217 (36.0%) | 386 (64.0%) |
| Arts, Entertainment & Recreation | 140 (60.3%) | 92 (39.7%) |
| Accommodation & Food Services | 76 (55.9%) | 60 (44.1%) |
| Public Administration | 348 (50.7%) | 339 (49.3%) |
| Total | 3,989 (56.5%) | 3,066 (43.5%) |
Education in Great Falls
School Enrollment in Great Falls
The most common levels of schooling among the 3,863 students in Great Falls are high school (968 | 25.1%), elementary school (842 | 21.8%), and middle school (795 | 20.6%).
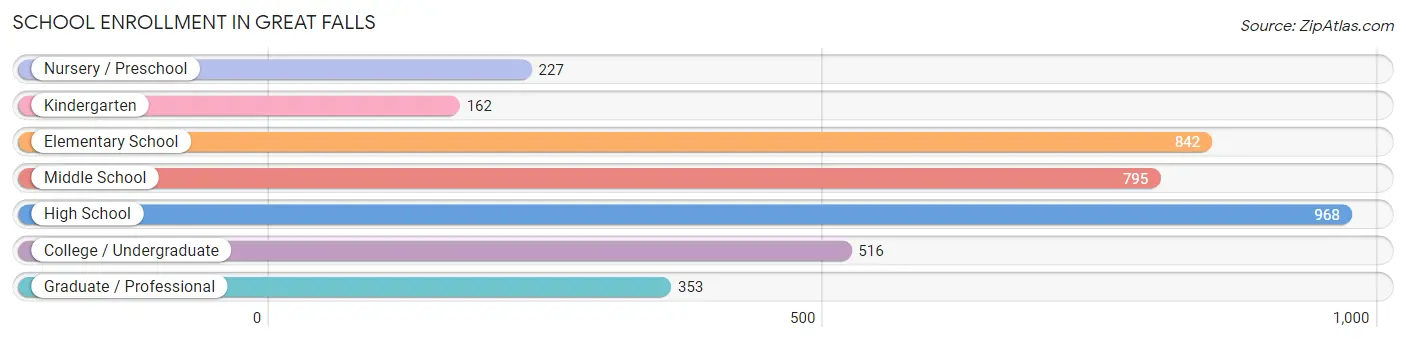
| School Level | # Students | % Students |
| Nursery / Preschool | 227 | 5.9% |
| Kindergarten | 162 | 4.2% |
| Elementary School | 842 | 21.8% |
| Middle School | 795 | 20.6% |
| High School | 968 | 25.1% |
| College / Undergraduate | 516 | 13.4% |
| Graduate / Professional | 353 | 9.1% |
| Total | 3,863 | 100.0% |
School Enrollment by Age by Funding Source in Great Falls
Out of a total of 3,863 students who are enrolled in schools in Great Falls, 900 (23.3%) attend a private institution, while the remaining 2,963 (76.7%) are enrolled in public schools. The age group of 3 to 4 year olds has the highest likelihood of being enrolled in private schools, with 111 (77.1% in the age bracket) enrolled. Conversely, the age group of 18 to 19 year olds has the lowest likelihood of being enrolled in a private school, with 209 (92.5% in the age bracket) attending a public institution.
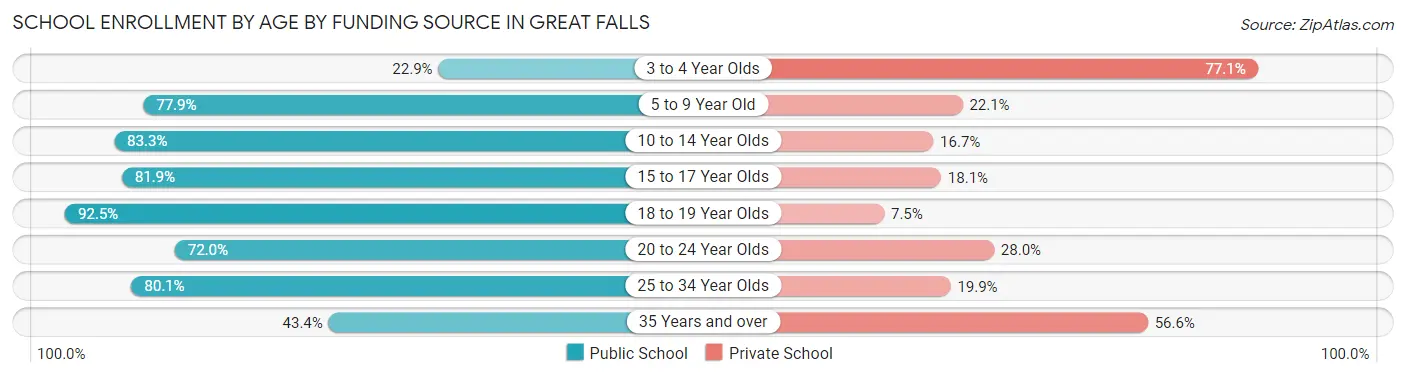
| Age Bracket | Public School | Private School |
| 3 to 4 Year Olds | 33 (22.9%) | 111 (77.1%) |
| 5 to 9 Year Old | 764 (77.9%) | 217 (22.1%) |
| 10 to 14 Year Olds | 880 (83.3%) | 176 (16.7%) |
| 15 to 17 Year Olds | 588 (81.9%) | 130 (18.1%) |
| 18 to 19 Year Olds | 209 (92.5%) | 17 (7.5%) |
| 20 to 24 Year Olds | 260 (72.0%) | 101 (28.0%) |
| 25 to 34 Year Olds | 145 (80.1%) | 36 (19.9%) |
| 35 Years and over | 85 (43.4%) | 111 (56.6%) |
| Total | 2,963 (76.7%) | 900 (23.3%) |
Educational Attainment by Field of Study in Great Falls
Business (2,069 | 21.3%), social sciences (1,631 | 16.8%), engineering (1,268 | 13.0%), computers & mathematics (855 | 8.8%), and bio, nature & agricultural (593 | 6.1%) are the most common fields of study among 9,733 individuals in Great Falls who have obtained a bachelor's degree or higher.
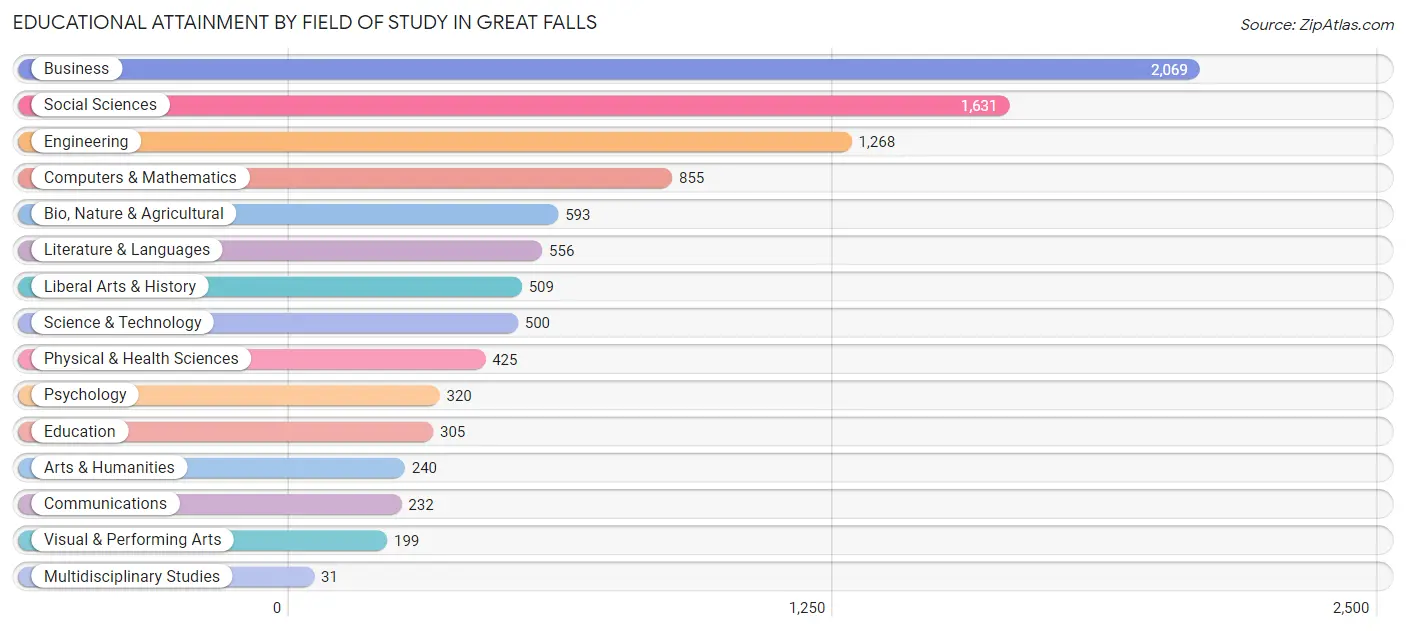
| Field of Study | # Graduates | % Graduates |
| Computers & Mathematics | 855 | 8.8% |
| Bio, Nature & Agricultural | 593 | 6.1% |
| Physical & Health Sciences | 425 | 4.4% |
| Psychology | 320 | 3.3% |
| Social Sciences | 1,631 | 16.8% |
| Engineering | 1,268 | 13.0% |
| Multidisciplinary Studies | 31 | 0.3% |
| Science & Technology | 500 | 5.1% |
| Business | 2,069 | 21.3% |
| Education | 305 | 3.1% |
| Literature & Languages | 556 | 5.7% |
| Liberal Arts & History | 509 | 5.2% |
| Visual & Performing Arts | 199 | 2.0% |
| Communications | 232 | 2.4% |
| Arts & Humanities | 240 | 2.5% |
| Total | 9,733 | 100.0% |
Transportation & Commute in Great Falls
Vehicle Availability by Sex in Great Falls
The most prevalent vehicle ownership categories in Great Falls are males with 3 vehicles (1,643, accounting for 41.4%) and females with 3 vehicles (1,074, making up 54.5%).
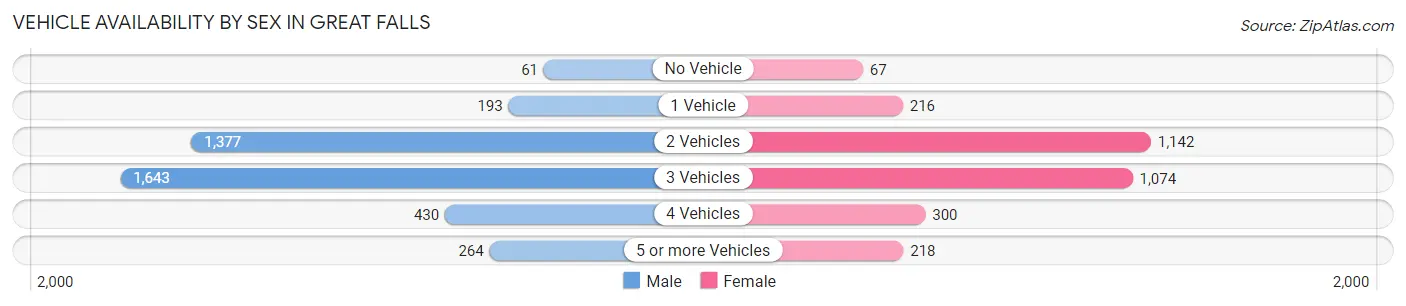
| Vehicles Available | Male | Female |
| No Vehicle | 61 (1.5%) | 67 (2.2%) |
| 1 Vehicle | 193 (4.9%) | 216 (7.2%) |
| 2 Vehicles | 1,377 (34.7%) | 1,142 (37.9%) |
| 3 Vehicles | 1,643 (41.4%) | 1,074 (35.6%) |
| 4 Vehicles | 430 (10.8%) | 300 (9.9%) |
| 5 or more Vehicles | 264 (6.7%) | 218 (7.2%) |
| Total | 3,968 (100.0%) | 3,017 (100.0%) |
Commute Time in Great Falls
The most frequently occuring commute durations in Great Falls are 45 to 59 minutes (755 commuters, 16.7%), 30 to 34 minutes (746 commuters, 16.5%), and 20 to 24 minutes (630 commuters, 14.0%).
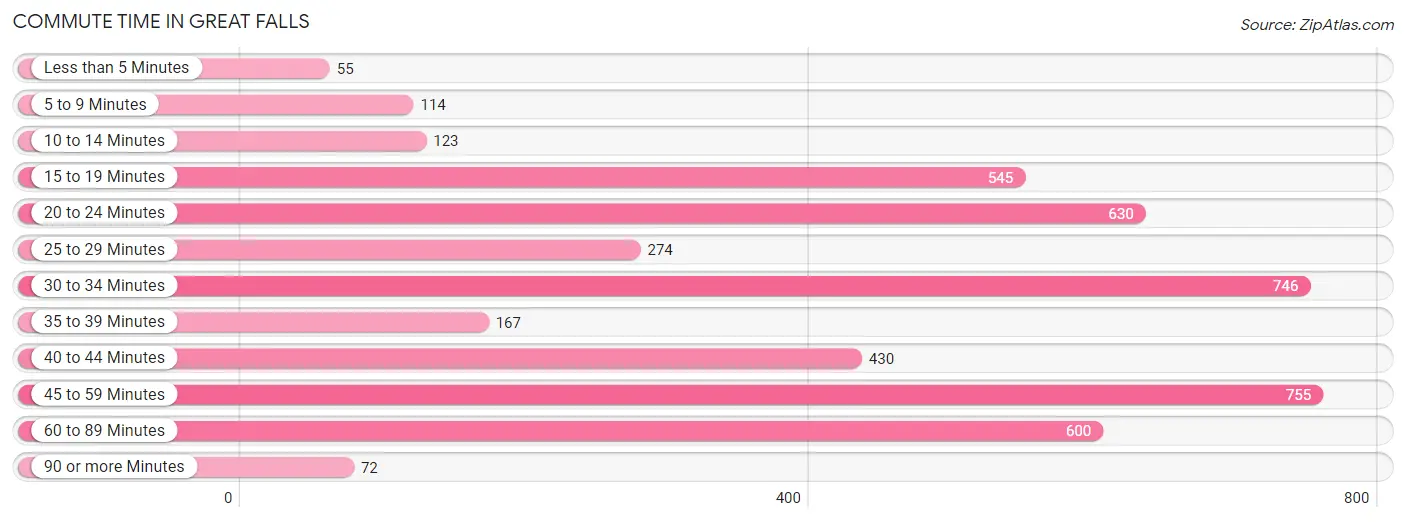
| Commute Time | # Commuters | % Commuters |
| Less than 5 Minutes | 55 | 1.2% |
| 5 to 9 Minutes | 114 | 2.5% |
| 10 to 14 Minutes | 123 | 2.7% |
| 15 to 19 Minutes | 545 | 12.1% |
| 20 to 24 Minutes | 630 | 14.0% |
| 25 to 29 Minutes | 274 | 6.1% |
| 30 to 34 Minutes | 746 | 16.5% |
| 35 to 39 Minutes | 167 | 3.7% |
| 40 to 44 Minutes | 430 | 9.5% |
| 45 to 59 Minutes | 755 | 16.7% |
| 60 to 89 Minutes | 600 | 13.3% |
| 90 or more Minutes | 72 | 1.6% |
Commute Time by Sex in Great Falls
The most common commute times in Great Falls are 30 to 34 minutes (486 commuters, 19.0%) for males and 20 to 24 minutes (342 commuters, 17.5%) for females.
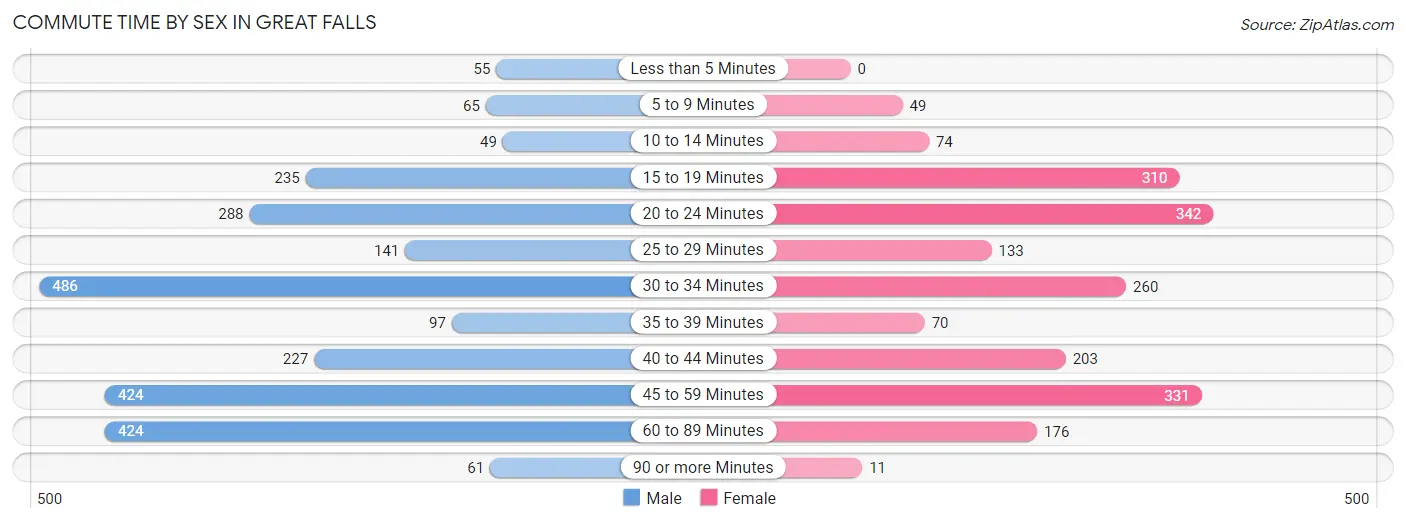
| Commute Time | Male | Female |
| Less than 5 Minutes | 55 (2.2%) | 0 (0.0%) |
| 5 to 9 Minutes | 65 (2.5%) | 49 (2.5%) |
| 10 to 14 Minutes | 49 (1.9%) | 74 (3.8%) |
| 15 to 19 Minutes | 235 (9.2%) | 310 (15.8%) |
| 20 to 24 Minutes | 288 (11.3%) | 342 (17.5%) |
| 25 to 29 Minutes | 141 (5.5%) | 133 (6.8%) |
| 30 to 34 Minutes | 486 (19.0%) | 260 (13.3%) |
| 35 to 39 Minutes | 97 (3.8%) | 70 (3.6%) |
| 40 to 44 Minutes | 227 (8.9%) | 203 (10.4%) |
| 45 to 59 Minutes | 424 (16.6%) | 331 (16.9%) |
| 60 to 89 Minutes | 424 (16.6%) | 176 (9.0%) |
| 90 or more Minutes | 61 (2.4%) | 11 (0.6%) |
Time of Departure to Work by Sex in Great Falls
The most frequent times of departure to work in Great Falls are 8:00 AM to 8:29 AM (469, 18.4%) for males and 9:00 AM to 9:59 AM (400, 20.4%) for females.
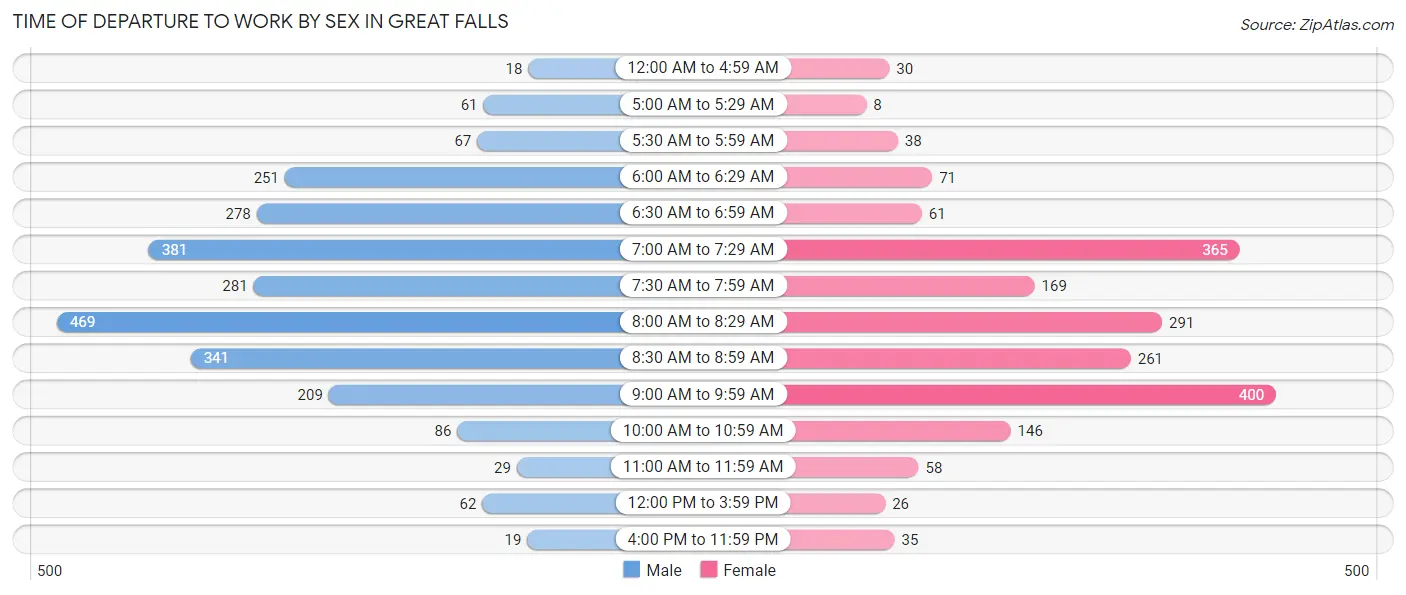
| Time of Departure | Male | Female |
| 12:00 AM to 4:59 AM | 18 (0.7%) | 30 (1.5%) |
| 5:00 AM to 5:29 AM | 61 (2.4%) | 8 (0.4%) |
| 5:30 AM to 5:59 AM | 67 (2.6%) | 38 (1.9%) |
| 6:00 AM to 6:29 AM | 251 (9.8%) | 71 (3.6%) |
| 6:30 AM to 6:59 AM | 278 (10.9%) | 61 (3.1%) |
| 7:00 AM to 7:29 AM | 381 (14.9%) | 365 (18.6%) |
| 7:30 AM to 7:59 AM | 281 (11.0%) | 169 (8.6%) |
| 8:00 AM to 8:29 AM | 469 (18.4%) | 291 (14.8%) |
| 8:30 AM to 8:59 AM | 341 (13.4%) | 261 (13.3%) |
| 9:00 AM to 9:59 AM | 209 (8.2%) | 400 (20.4%) |
| 10:00 AM to 10:59 AM | 86 (3.4%) | 146 (7.4%) |
| 11:00 AM to 11:59 AM | 29 (1.1%) | 58 (3.0%) |
| 12:00 PM to 3:59 PM | 62 (2.4%) | 26 (1.3%) |
| 4:00 PM to 11:59 PM | 19 (0.7%) | 35 (1.8%) |
| Total | 2,552 (100.0%) | 1,959 (100.0%) |
Housing Occupancy in Great Falls
Occupancy by Ownership in Great Falls
Of the total 5,019 dwellings in Great Falls, owner-occupied units account for 4,758 (94.8%), while renter-occupied units make up 261 (5.2%).
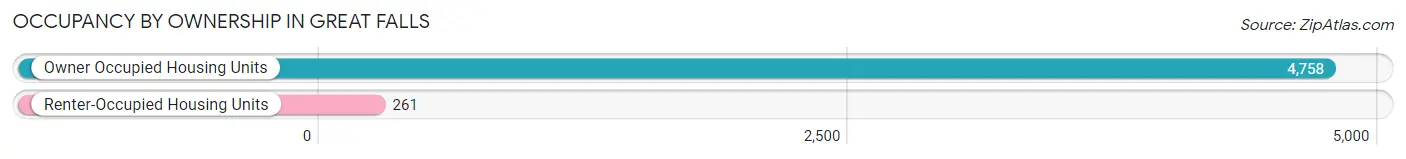
| Occupancy | # Housing Units | % Housing Units |
| Owner Occupied Housing Units | 4,758 | 94.8% |
| Renter-Occupied Housing Units | 261 | 5.2% |
| Total Occupied Housing Units | 5,019 | 100.0% |
Occupancy by Household Size in Great Falls
| Household Size | # Housing Units | % Housing Units |
| 1-Person Household | 434 | 8.6% |
| 2-Person Household | 2,089 | 41.6% |
| 3-Person Household | 985 | 19.6% |
| 4+ Person Household | 1,511 | 30.1% |
| Total Housing Units | 5,019 | 100.0% |
Occupancy by Ownership by Household Size in Great Falls
| Household Size | Owner-occupied | Renter-occupied |
| 1-Person Household | 404 (93.1%) | 30 (6.9%) |
| 2-Person Household | 1,942 (93.0%) | 147 (7.0%) |
| 3-Person Household | 962 (97.7%) | 23 (2.3%) |
| 4+ Person Household | 1,450 (96.0%) | 61 (4.0%) |
| Total Housing Units | 4,758 (94.8%) | 261 (5.2%) |
Occupancy by Educational Attainment in Great Falls
| Household Size | Owner-occupied | Renter-occupied |
| Less than High School | 48 (81.4%) | 11 (18.6%) |
| High School Diploma | 41 (82.0%) | 9 (18.0%) |
| College/Associate Degree | 287 (88.6%) | 37 (11.4%) |
| Bachelor's Degree or higher | 4,382 (95.6%) | 204 (4.4%) |
Occupancy by Age of Householder in Great Falls
| Age Bracket | # Households | % Households |
| Under 35 Years | 136 | 2.7% |
| 35 to 44 Years | 677 | 13.5% |
| 45 to 54 Years | 1,236 | 24.6% |
| 55 to 64 Years | 1,202 | 23.9% |
| 65 to 74 Years | 1,062 | 21.2% |
| 75 to 84 Years | 598 | 11.9% |
| 85 Years and Over | 108 | 2.1% |
| Total | 5,019 | 100.0% |
Housing Finances in Great Falls
Median Income by Occupancy in Great Falls
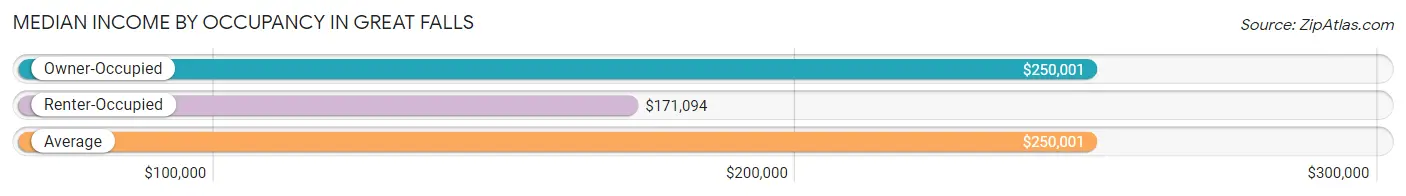
| Occupancy Type | # Households | Median Income |
| Owner-Occupied | 4,758 (94.8%) | $250,001 |
| Renter-Occupied | 261 (5.2%) | $171,094 |
| Average | 5,019 (100.0%) | $250,001 |
Occupancy by Householder Income Bracket in Great Falls
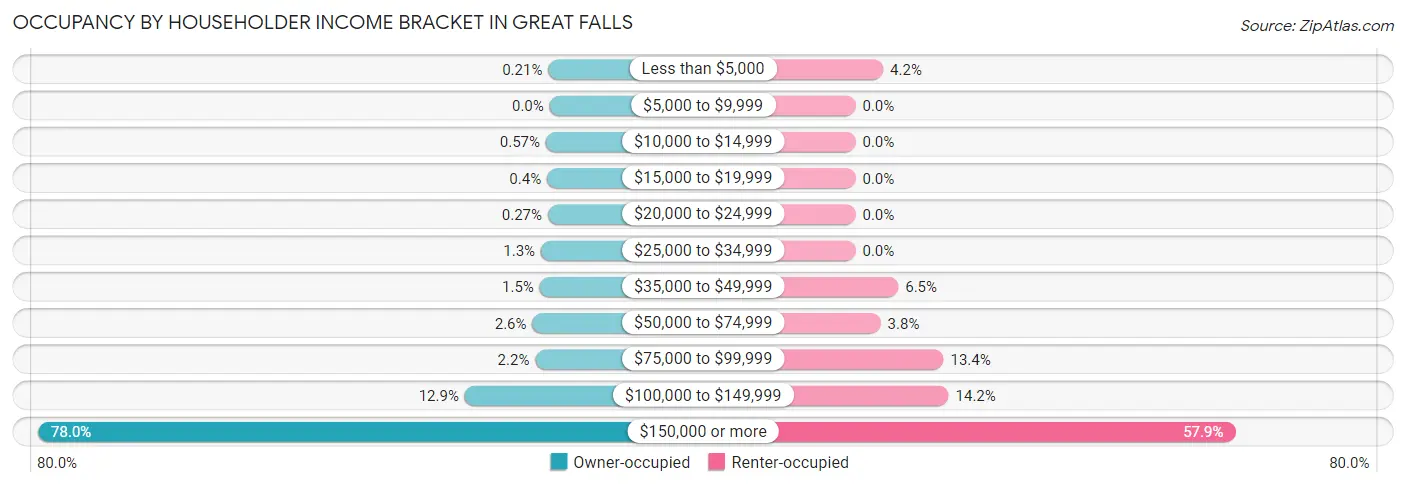
| Income Bracket | Owner-occupied | Renter-occupied |
| Less than $5,000 | 10 (0.2%) | 11 (4.2%) |
| $5,000 to $9,999 | 0 (0.0%) | 0 (0.0%) |
| $10,000 to $14,999 | 27 (0.6%) | 0 (0.0%) |
| $15,000 to $19,999 | 19 (0.4%) | 0 (0.0%) |
| $20,000 to $24,999 | 13 (0.3%) | 0 (0.0%) |
| $25,000 to $34,999 | 63 (1.3%) | 0 (0.0%) |
| $35,000 to $49,999 | 72 (1.5%) | 17 (6.5%) |
| $50,000 to $74,999 | 125 (2.6%) | 10 (3.8%) |
| $75,000 to $99,999 | 104 (2.2%) | 35 (13.4%) |
| $100,000 to $149,999 | 615 (12.9%) | 37 (14.2%) |
| $150,000 or more | 3,710 (78.0%) | 151 (57.9%) |
| Total | 4,758 (100.0%) | 261 (100.0%) |
Monthly Housing Cost Tiers in Great Falls
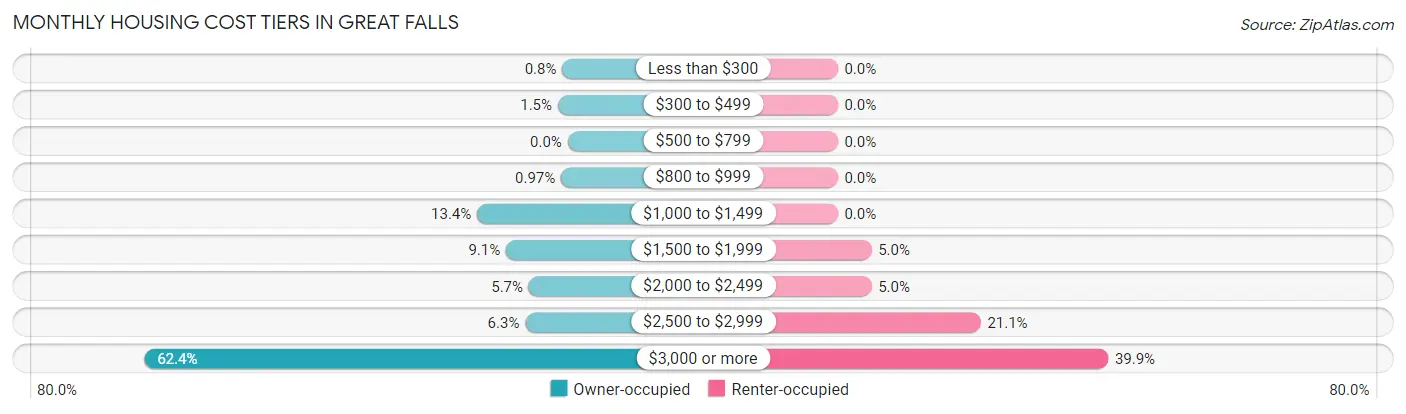
| Monthly Cost | Owner-occupied | Renter-occupied |
| Less than $300 | 38 (0.8%) | 0 (0.0%) |
| $300 to $499 | 69 (1.5%) | 0 (0.0%) |
| $500 to $799 | 0 (0.0%) | 0 (0.0%) |
| $800 to $999 | 46 (1.0%) | 0 (0.0%) |
| $1,000 to $1,499 | 635 (13.4%) | 0 (0.0%) |
| $1,500 to $1,999 | 432 (9.1%) | 13 (5.0%) |
| $2,000 to $2,499 | 272 (5.7%) | 13 (5.0%) |
| $2,500 to $2,999 | 298 (6.3%) | 55 (21.1%) |
| $3,000 or more | 2,968 (62.4%) | 104 (39.9%) |
| Total | 4,758 (100.0%) | 261 (100.0%) |
Physical Housing Characteristics in Great Falls
Housing Structures in Great Falls
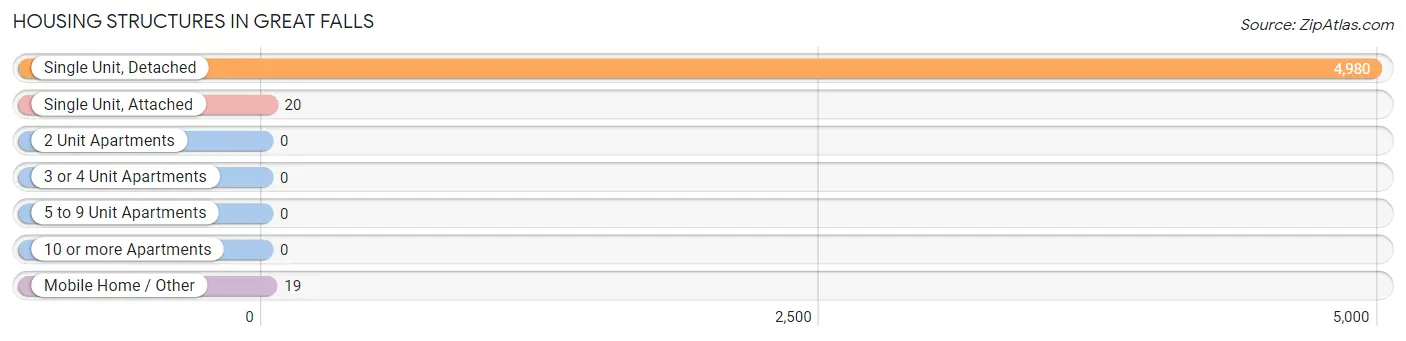
| Structure Type | # Housing Units | % Housing Units |
| Single Unit, Detached | 4,980 | 99.2% |
| Single Unit, Attached | 20 | 0.4% |
| 2 Unit Apartments | 0 | 0.0% |
| 3 or 4 Unit Apartments | 0 | 0.0% |
| 5 to 9 Unit Apartments | 0 | 0.0% |
| 10 or more Apartments | 0 | 0.0% |
| Mobile Home / Other | 19 | 0.4% |
| Total | 5,019 | 100.0% |
Housing Structures by Occupancy in Great Falls
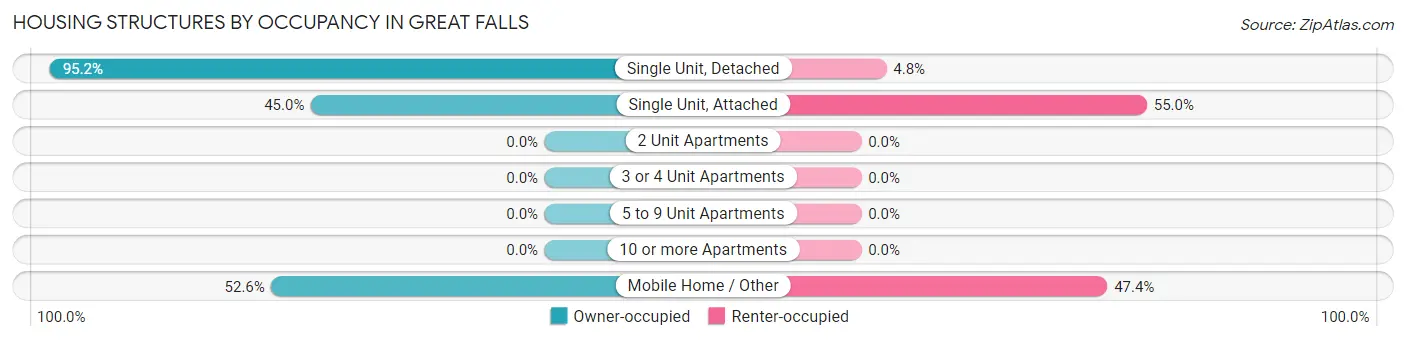
| Structure Type | Owner-occupied | Renter-occupied |
| Single Unit, Detached | 4,739 (95.2%) | 241 (4.8%) |
| Single Unit, Attached | 9 (45.0%) | 11 (55.0%) |
| 2 Unit Apartments | 0 (0.0%) | 0 (0.0%) |
| 3 or 4 Unit Apartments | 0 (0.0%) | 0 (0.0%) |
| 5 to 9 Unit Apartments | 0 (0.0%) | 0 (0.0%) |
| 10 or more Apartments | 0 (0.0%) | 0 (0.0%) |
| Mobile Home / Other | 10 (52.6%) | 9 (47.4%) |
| Total | 4,758 (94.8%) | 261 (5.2%) |
Housing Structures by Number of Rooms in Great Falls
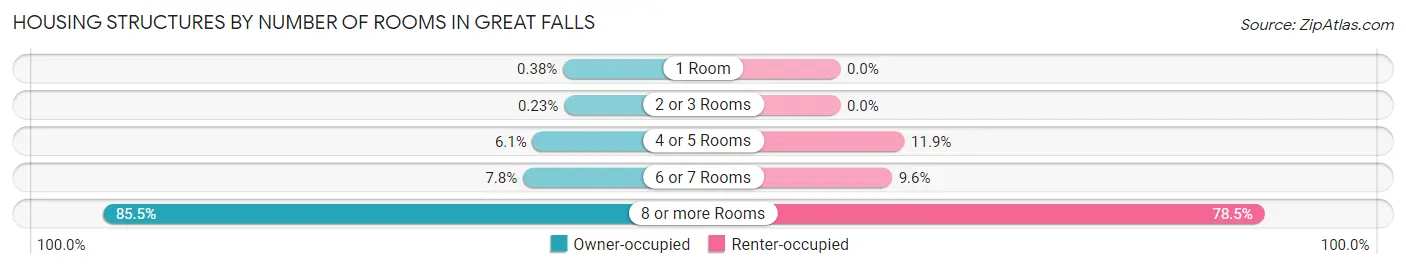
| Number of Rooms | Owner-occupied | Renter-occupied |
| 1 Room | 18 (0.4%) | 0 (0.0%) |
| 2 or 3 Rooms | 11 (0.2%) | 0 (0.0%) |
| 4 or 5 Rooms | 288 (6.0%) | 31 (11.9%) |
| 6 or 7 Rooms | 371 (7.8%) | 25 (9.6%) |
| 8 or more Rooms | 4,070 (85.5%) | 205 (78.5%) |
| Total | 4,758 (100.0%) | 261 (100.0%) |
Housing Structure by Heating Type in Great Falls
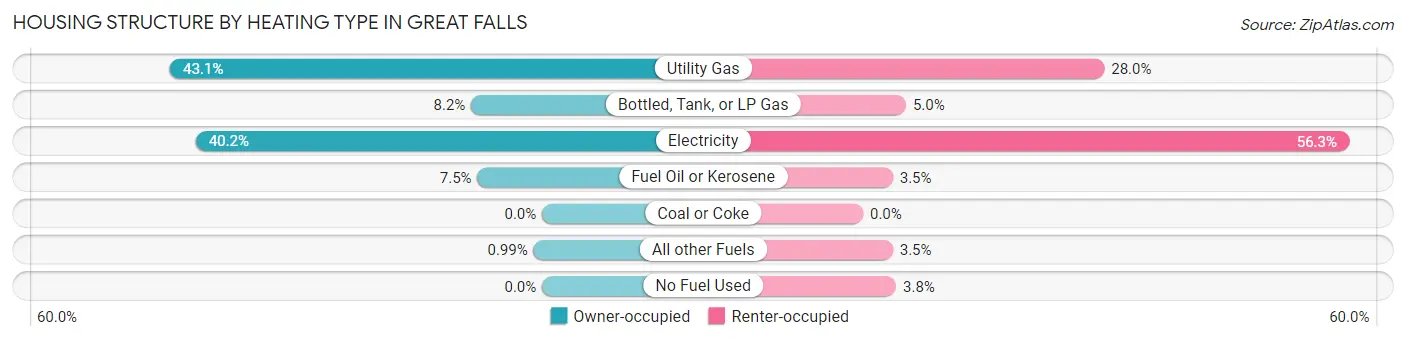
| Heating Type | Owner-occupied | Renter-occupied |
| Utility Gas | 2,052 (43.1%) | 73 (28.0%) |
| Bottled, Tank, or LP Gas | 391 (8.2%) | 13 (5.0%) |
| Electricity | 1,911 (40.2%) | 147 (56.3%) |
| Fuel Oil or Kerosene | 357 (7.5%) | 9 (3.5%) |
| Coal or Coke | 0 (0.0%) | 0 (0.0%) |
| All other Fuels | 47 (1.0%) | 9 (3.5%) |
| No Fuel Used | 0 (0.0%) | 10 (3.8%) |
| Total | 4,758 (100.0%) | 261 (100.0%) |
Household Vehicle Usage in Great Falls
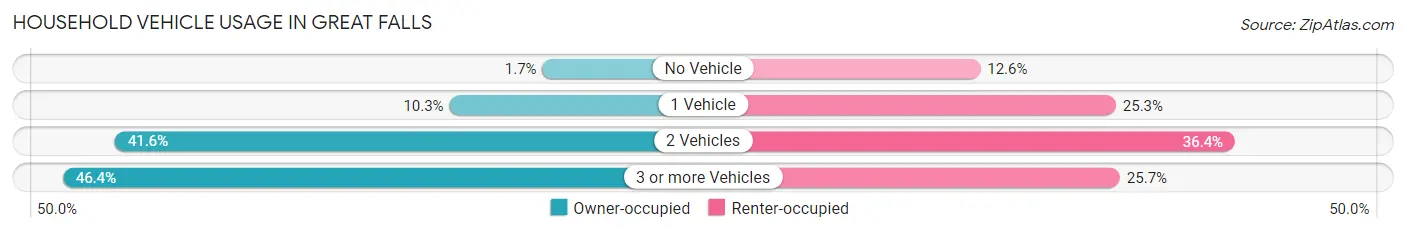
| Vehicles per Household | Owner-occupied | Renter-occupied |
| No Vehicle | 79 (1.7%) | 33 (12.6%) |
| 1 Vehicle | 492 (10.3%) | 66 (25.3%) |
| 2 Vehicles | 1,978 (41.6%) | 95 (36.4%) |
| 3 or more Vehicles | 2,209 (46.4%) | 67 (25.7%) |
| Total | 4,758 (100.0%) | 261 (100.0%) |
Real Estate & Mortgages in Great Falls
Real Estate and Mortgage Overview in Great Falls
| Characteristic | Without Mortgage | With Mortgage |
| Housing Units | 1,458 | 3,300 |
| Median Property Value | $1,213,800 | $1,264,600 |
| Median Household Income | $224,451 | $2,830 |
| Monthly Housing Costs | $1,501 | $2,896 |
| Real Estate Taxes | $10,001 | $73 |
Property Value by Mortgage Status in Great Falls
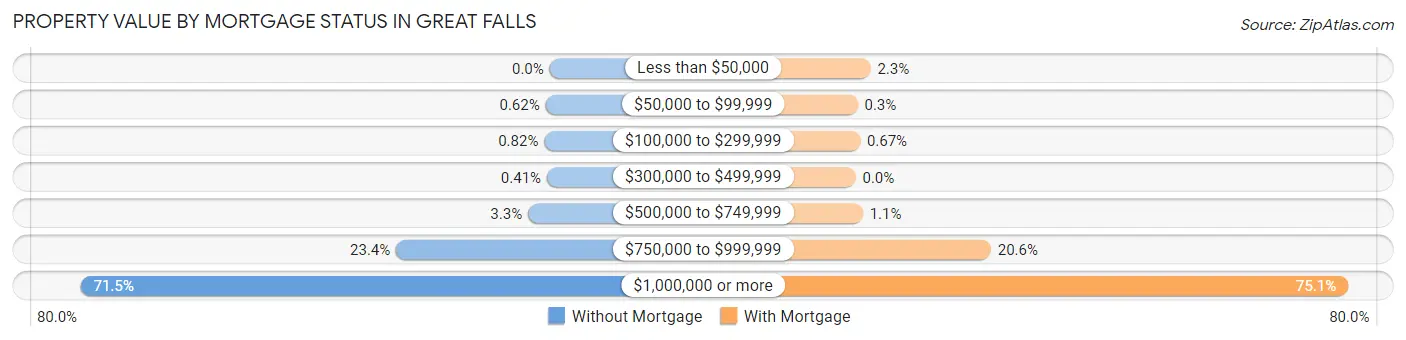
| Property Value | Without Mortgage | With Mortgage |
| Less than $50,000 | 0 (0.0%) | 75 (2.3%) |
| $50,000 to $99,999 | 9 (0.6%) | 10 (0.3%) |
| $100,000 to $299,999 | 12 (0.8%) | 22 (0.7%) |
| $300,000 to $499,999 | 6 (0.4%) | 0 (0.0%) |
| $500,000 to $749,999 | 48 (3.3%) | 36 (1.1%) |
| $750,000 to $999,999 | 341 (23.4%) | 680 (20.6%) |
| $1,000,000 or more | 1,042 (71.5%) | 2,477 (75.1%) |
| Total | 1,458 (100.0%) | 3,300 (100.0%) |
Household Income by Mortgage Status in Great Falls
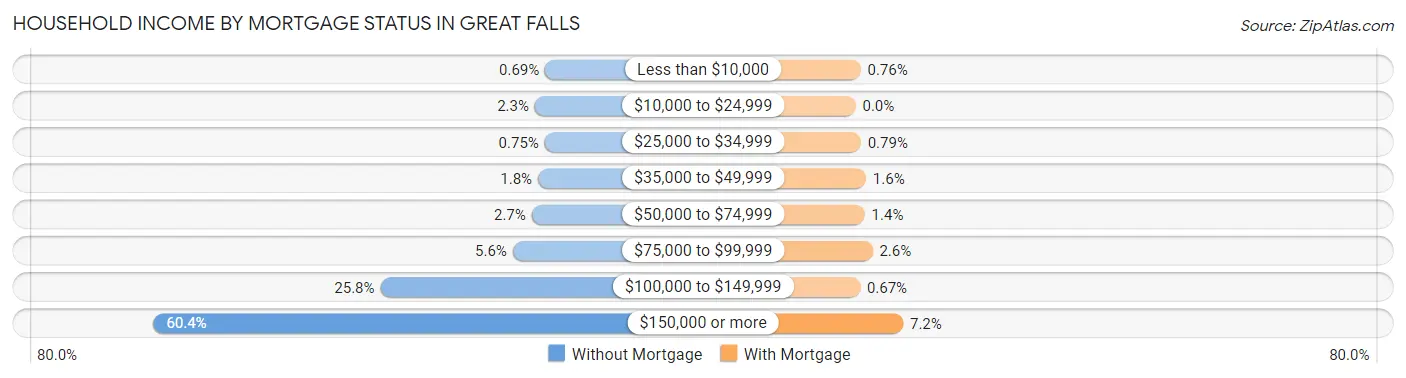
| Household Income | Without Mortgage | With Mortgage |
| Less than $10,000 | 10 (0.7%) | 25 (0.8%) |
| $10,000 to $24,999 | 33 (2.3%) | 0 (0.0%) |
| $25,000 to $34,999 | 11 (0.7%) | 26 (0.8%) |
| $35,000 to $49,999 | 26 (1.8%) | 52 (1.6%) |
| $50,000 to $74,999 | 40 (2.7%) | 46 (1.4%) |
| $75,000 to $99,999 | 82 (5.6%) | 85 (2.6%) |
| $100,000 to $149,999 | 376 (25.8%) | 22 (0.7%) |
| $150,000 or more | 880 (60.4%) | 239 (7.2%) |
| Total | 1,458 (100.0%) | 3,300 (100.0%) |
Property Value to Household Income Ratio in Great Falls
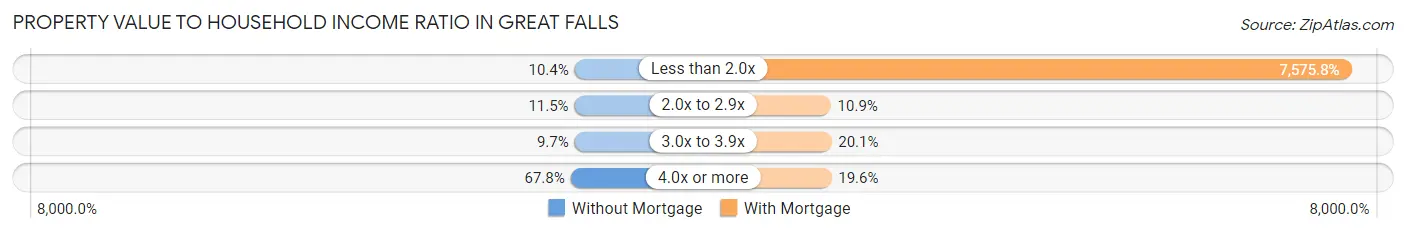
| Value-to-Income Ratio | Without Mortgage | With Mortgage |
| Less than 2.0x | 152 (10.4%) | 250,001 (7,575.8%) |
| 2.0x to 2.9x | 167 (11.5%) | 361 (10.9%) |
| 3.0x to 3.9x | 141 (9.7%) | 663 (20.1%) |
| 4.0x or more | 988 (67.8%) | 646 (19.6%) |
| Total | 1,458 (100.0%) | 3,300 (100.0%) |
Real Estate Taxes by Mortgage Status in Great Falls
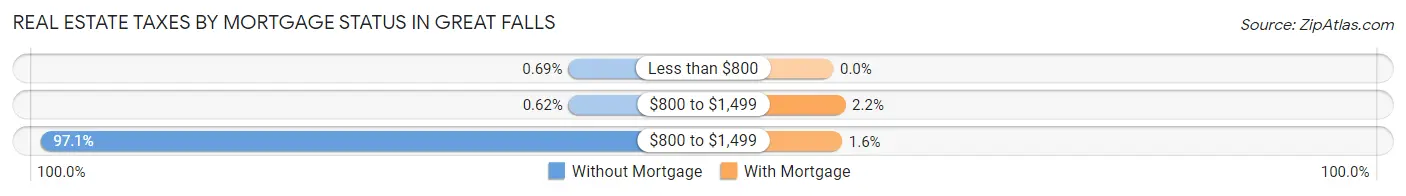
| Property Taxes | Without Mortgage | With Mortgage |
| Less than $800 | 10 (0.7%) | 0 (0.0%) |
| $800 to $1,499 | 9 (0.6%) | 73 (2.2%) |
| $800 to $1,499 | 1,416 (97.1%) | 53 (1.6%) |
| Total | 1,458 (100.0%) | 3,300 (100.0%) |
Health & Disability in Great Falls
Health Insurance Coverage by Age in Great Falls
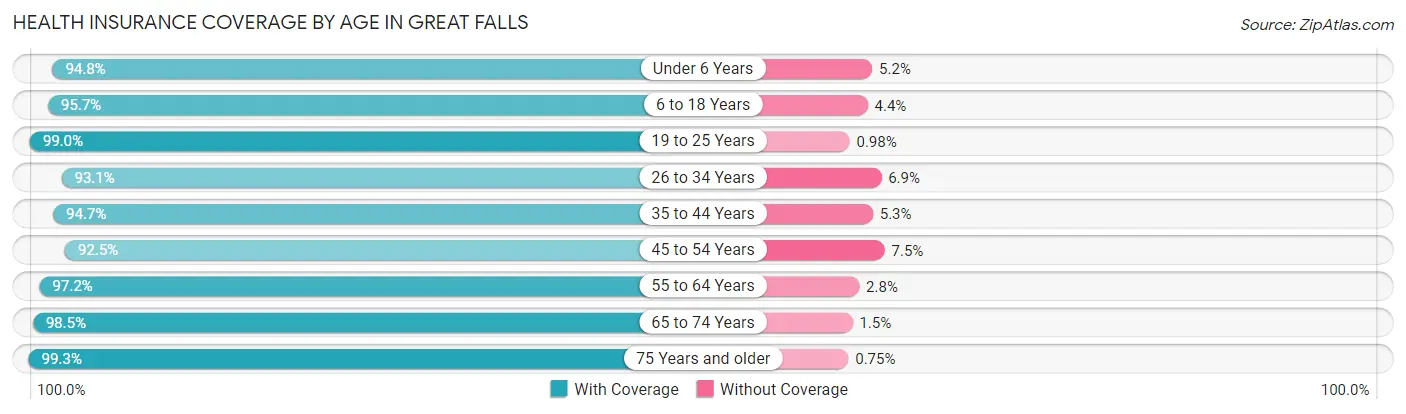
| Age Bracket | With Coverage | Without Coverage |
| Under 6 Years | 784 (94.8%) | 43 (5.2%) |
| 6 to 18 Years | 2,685 (95.7%) | 122 (4.3%) |
| 19 to 25 Years | 807 (99.0%) | 8 (1.0%) |
| 26 to 34 Years | 717 (93.1%) | 53 (6.9%) |
| 35 to 44 Years | 1,356 (94.7%) | 76 (5.3%) |
| 45 to 54 Years | 2,336 (92.5%) | 190 (7.5%) |
| 55 to 64 Years | 2,387 (97.2%) | 68 (2.8%) |
| 65 to 74 Years | 1,809 (98.5%) | 28 (1.5%) |
| 75 Years and older | 1,452 (99.3%) | 11 (0.7%) |
| Total | 14,333 (96.0%) | 599 (4.0%) |
Health Insurance Coverage by Citizenship Status in Great Falls
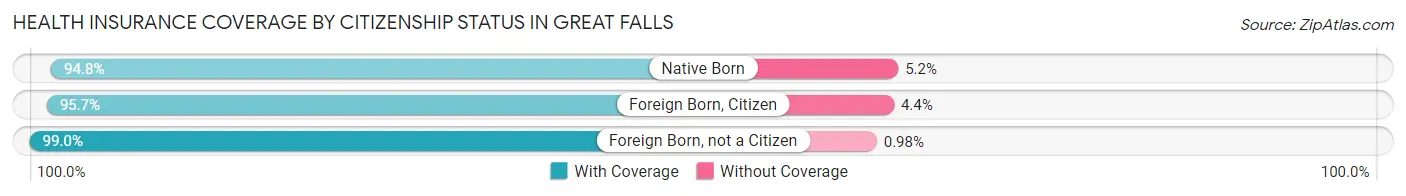
| Citizenship Status | With Coverage | Without Coverage |
| Native Born | 784 (94.8%) | 43 (5.2%) |
| Foreign Born, Citizen | 2,685 (95.7%) | 122 (4.3%) |
| Foreign Born, not a Citizen | 807 (99.0%) | 8 (1.0%) |
Health Insurance Coverage by Household Income in Great Falls
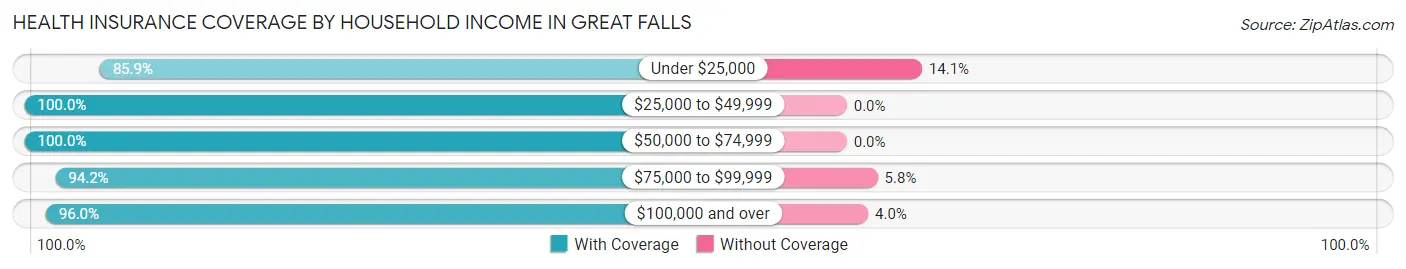
| Household Income | With Coverage | Without Coverage |
| Under $25,000 | 183 (85.9%) | 30 (14.1%) |
| $25,000 to $49,999 | 315 (100.0%) | 0 (0.0%) |
| $50,000 to $74,999 | 302 (100.0%) | 0 (0.0%) |
| $75,000 to $99,999 | 310 (94.2%) | 19 (5.8%) |
| $100,000 and over | 13,223 (96.0%) | 550 (4.0%) |
Public vs Private Health Insurance Coverage by Age in Great Falls
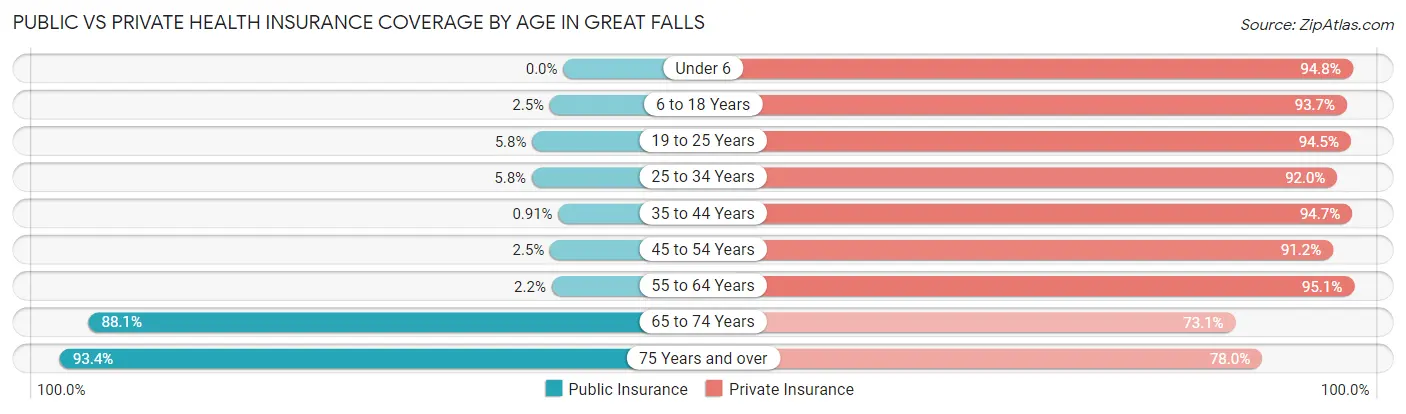
| Age Bracket | Public Insurance | Private Insurance |
| Under 6 | 0 (0.0%) | 784 (94.8%) |
| 6 to 18 Years | 70 (2.5%) | 2,631 (93.7%) |
| 19 to 25 Years | 47 (5.8%) | 770 (94.5%) |
| 25 to 34 Years | 45 (5.8%) | 708 (91.9%) |
| 35 to 44 Years | 13 (0.9%) | 1,356 (94.7%) |
| 45 to 54 Years | 62 (2.5%) | 2,303 (91.2%) |
| 55 to 64 Years | 53 (2.2%) | 2,334 (95.1%) |
| 65 to 74 Years | 1,619 (88.1%) | 1,342 (73.1%) |
| 75 Years and over | 1,367 (93.4%) | 1,141 (78.0%) |
| Total | 3,276 (21.9%) | 13,369 (89.5%) |
Disability Status by Sex by Age in Great Falls
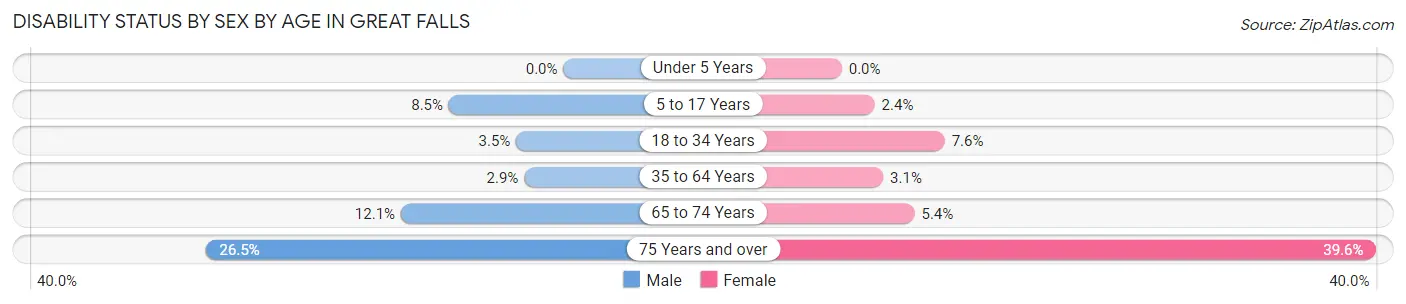
| Age Bracket | Male | Female |
| Under 5 Years | 0 (0.0%) | 0 (0.0%) |
| 5 to 17 Years | 123 (8.5%) | 35 (2.4%) |
| 18 to 34 Years | 35 (3.5%) | 55 (7.6%) |
| 35 to 64 Years | 91 (2.9%) | 101 (3.1%) |
| 65 to 74 Years | 121 (12.1%) | 45 (5.4%) |
| 75 Years and over | 185 (26.5%) | 303 (39.6%) |
Disability Class by Sex by Age in Great Falls
Disability Class: Hearing Difficulty
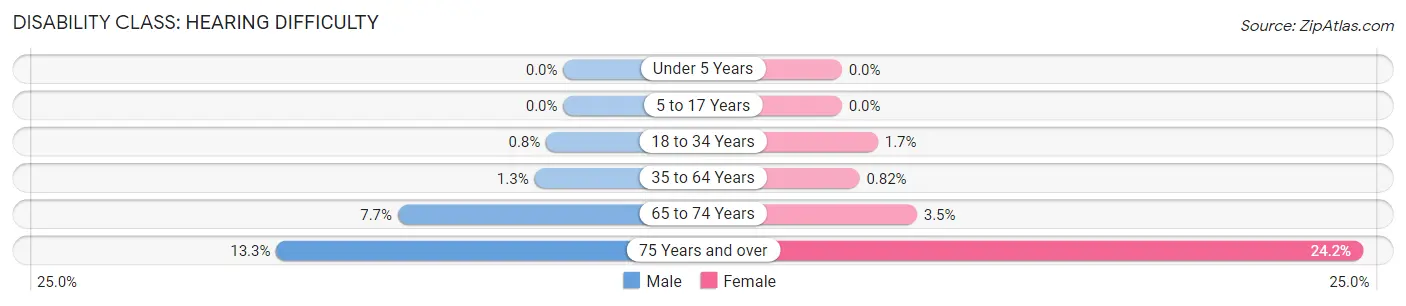
| Age Bracket | Male | Female |
| Under 5 Years | 0 (0.0%) | 0 (0.0%) |
| 5 to 17 Years | 0 (0.0%) | 0 (0.0%) |
| 18 to 34 Years | 8 (0.8%) | 12 (1.7%) |
| 35 to 64 Years | 42 (1.3%) | 27 (0.8%) |
| 65 to 74 Years | 77 (7.7%) | 29 (3.5%) |
| 75 Years and over | 93 (13.3%) | 185 (24.2%) |
Disability Class: Vision Difficulty
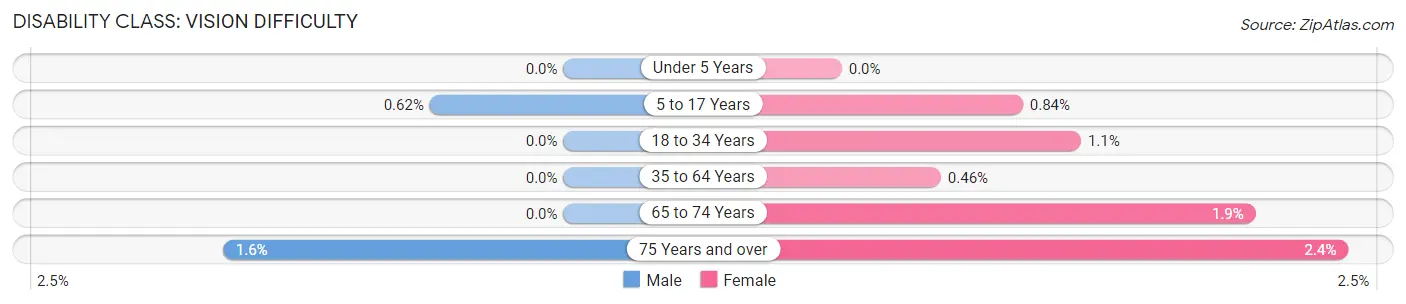
| Age Bracket | Male | Female |
| Under 5 Years | 0 (0.0%) | 0 (0.0%) |
| 5 to 17 Years | 9 (0.6%) | 12 (0.8%) |
| 18 to 34 Years | 0 (0.0%) | 8 (1.1%) |
| 35 to 64 Years | 0 (0.0%) | 15 (0.5%) |
| 65 to 74 Years | 0 (0.0%) | 16 (1.9%) |
| 75 Years and over | 11 (1.6%) | 18 (2.4%) |
Disability Class: Cognitive Difficulty
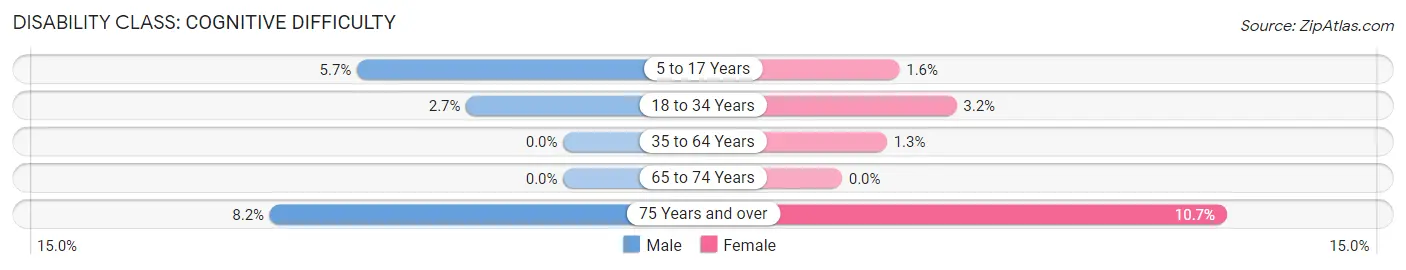
| Age Bracket | Male | Female |
| 5 to 17 Years | 83 (5.7%) | 23 (1.6%) |
| 18 to 34 Years | 27 (2.7%) | 23 (3.2%) |
| 35 to 64 Years | 0 (0.0%) | 41 (1.3%) |
| 65 to 74 Years | 0 (0.0%) | 0 (0.0%) |
| 75 Years and over | 57 (8.2%) | 82 (10.7%) |
Disability Class: Ambulatory Difficulty
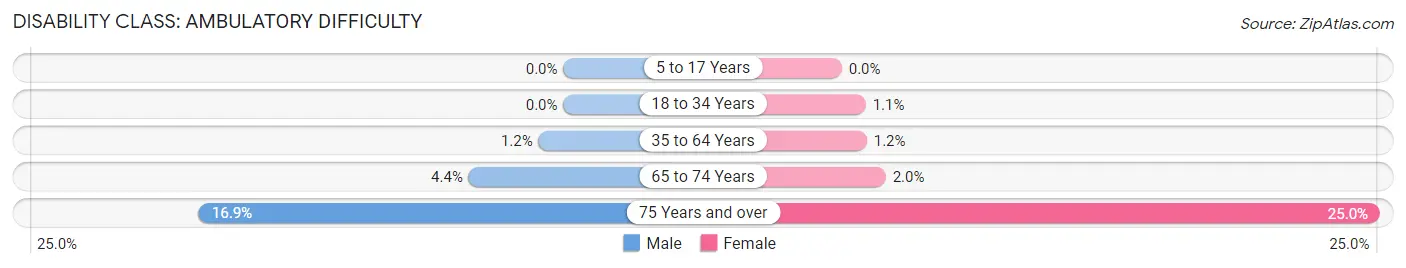
| Age Bracket | Male | Female |
| 5 to 17 Years | 0 (0.0%) | 0 (0.0%) |
| 18 to 34 Years | 0 (0.0%) | 8 (1.1%) |
| 35 to 64 Years | 36 (1.1%) | 38 (1.2%) |
| 65 to 74 Years | 44 (4.4%) | 17 (2.0%) |
| 75 Years and over | 118 (16.9%) | 191 (25.0%) |
Disability Class: Self-Care Difficulty
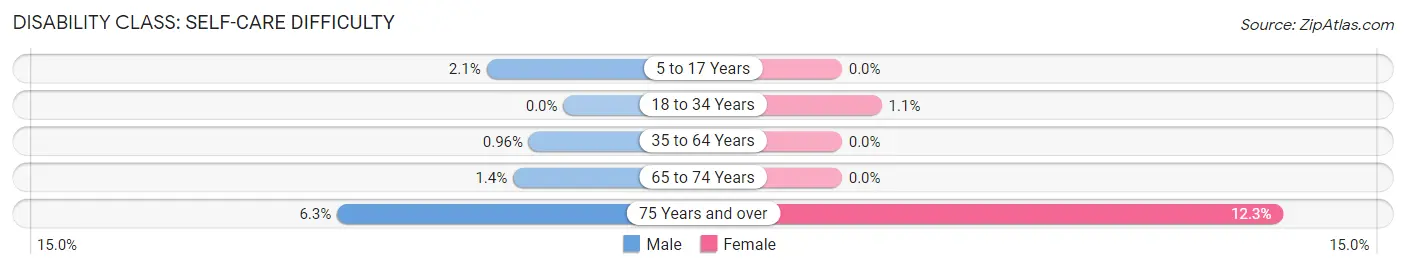
| Age Bracket | Male | Female |
| 5 to 17 Years | 31 (2.1%) | 0 (0.0%) |
| 18 to 34 Years | 0 (0.0%) | 8 (1.1%) |
| 35 to 64 Years | 30 (1.0%) | 0 (0.0%) |
| 65 to 74 Years | 14 (1.4%) | 0 (0.0%) |
| 75 Years and over | 44 (6.3%) | 94 (12.3%) |
Technology Access in Great Falls
Computing Device Access in Great Falls
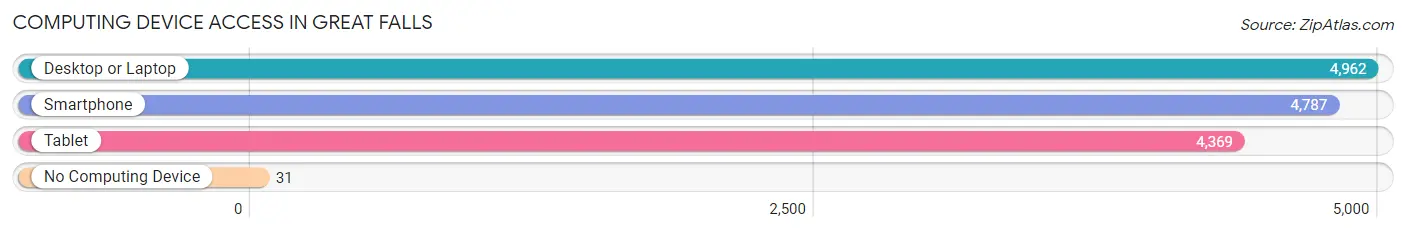
| Device Type | # Households | % Households |
| Desktop or Laptop | 4,962 | 98.9% |
| Smartphone | 4,787 | 95.4% |
| Tablet | 4,369 | 87.1% |
| No Computing Device | 31 | 0.6% |
| Total | 5,019 | 100.0% |
Internet Access in Great Falls
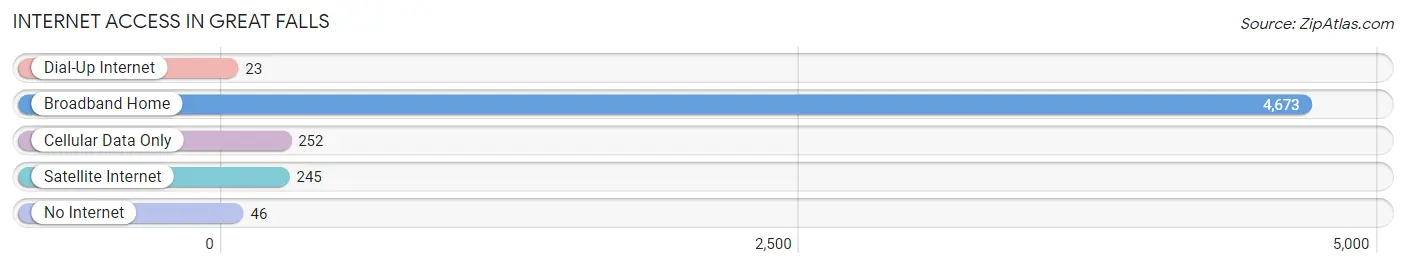
| Internet Type | # Households | % Households |
| Dial-Up Internet | 23 | 0.5% |
| Broadband Home | 4,673 | 93.1% |
| Cellular Data Only | 252 | 5.0% |
| Satellite Internet | 245 | 4.9% |
| No Internet | 46 | 0.9% |
| Total | 5,019 | 100.0% |
Great Falls Summary
Great Falls is a census-designated place (CDP) in Fairfax County, Virginia, United States. The population was 15,427 at the 2010 census, an increase of 80.5% from the 2000 census. Located in Northern Virginia on the scenic Potomac River, Great Falls is an affluent suburb of Washington, D.C.
History
The area that is now Great Falls was first settled in the late 1700s by farmers and fishermen. The area was known as Forestville until the late 1800s when it was renamed Great Falls. The name was chosen to reflect the nearby Great Falls of the Potomac River, which is one of the most spectacular waterfalls in the eastern United States.
The area was largely rural until the 1950s when it began to experience rapid growth due to its proximity to Washington, D.C. and the development of the Dulles Technology Corridor. The population of Great Falls has grown steadily since then, and the area is now one of the most affluent suburbs of Washington, D.C.
Geography
Great Falls is located in northern Fairfax County at 38°58′N 77°17′W (38.967, -77.283). It is bordered to the north by the Potomac River, to the east by the city of Fairfax, to the south by the city of Vienna, and to the west by the town of Herndon.
The CDP has a total area of 10.2 square miles (26.4 km2), of which 10.1 square miles (26.2 km2) is land and 0.1 square miles (0.2 km2) (0.78%) is water.
Economy
Great Falls is home to a variety of businesses, including technology, finance, and professional services. The area is also home to several government contractors, including Northrop Grumman, Lockheed Martin, and Booz Allen Hamilton.
The median household income in Great Falls is $179,000, making it one of the wealthiest communities in the United States. The unemployment rate is 2.7%, which is lower than the national average.
Demographics
As of the 2010 census, there were 15,427 people, 5,717 households, and 4,541 families residing in the CDP. The population density was 1,521.3 people per square mile (586.3/km2). There were 5,945 housing units at an average density of 586.3 per square mile (226.3/km2). The racial makeup of the CDP was 79.2% White, 8.2% African American, 0.2% Native American, 8.7% Asian, 0.1% Pacific Islander, 1.2% from other races, and 2.6% from two or more races. Hispanic or Latino of any race were 4.7% of the population.
There were 5,717 households, out of which 41.2% had children under the age of 18 living with them, 72.2% were married couples living together, 6.2% had a female householder with no husband present, and 19.2% were non-families. 15.2% of all households were made up of individuals, and 5.2% had someone living alone who was 65 years of age or older. The average household size was 2.68 and the average family size was 3.00.
In the CDP, the population was spread out, with 28.2% under the age of 18, 4.2% from 18 to 24, 24.2% from 25 to 44, 33.2% from 45 to 64, and 10.2% who were 65 years of age or older. The median age was 41 years. For every 100 females, there were 97.2 males. For every 100 females age 18 and over, there were 94.2 males.
The median income for a household in the CDP was $179,000, and the median income for a family was $196,000. Males had a median income of $150,000 versus $90,000 for females. The per capita income for the CDP was $90,000. About 2.2% of families and 3.2% of the population were below the poverty line, including 3.2% of those under age 18 and 2.2% of those age 65 or over.
Common Questions
What is Per Capita Income in Great Falls?
Per Capita income in Great Falls is $125,391.
What is the Median Family Income in Great Falls?
Median Family Income in Great Falls is $250,001.
What is the Median Household income in Great Falls?
Median Household Income in Great Falls is $250,001.
What is Income or Wage Gap in Great Falls?
Income or Wage Gap in Great Falls is 48.3%.
Women in Great Falls earn 51.7 cents for every dollar earned by a man.
What is Family Income Deficit in Great Falls?
Family Income Deficit in Great Falls is $7,746.
Families that are below poverty line in Great Falls earn $7,746 less on average than the poverty threshold level.
What is Inequality or Gini Index in Great Falls?
Inequality or Gini Index in Great Falls is 0.44.
What is the Total Population of Great Falls?
Total Population of Great Falls is 14,968.
What is the Total Male Population of Great Falls?
Total Male Population of Great Falls is 7,657.
What is the Total Female Population of Great Falls?
Total Female Population of Great Falls is 7,311.
What is the Ratio of Males per 100 Females in Great Falls?
There are 104.73 Males per 100 Females in Great Falls.
What is the Ratio of Females per 100 Males in Great Falls?
There are 95.48 Females per 100 Males in Great Falls.
What is the Median Population Age in Great Falls?
Median Population Age in Great Falls is 47.9 Years.
What is the Average Family Size in Great Falls
Average Family Size in Great Falls is 3.1 People.
What is the Average Household Size in Great Falls
Average Household Size in Great Falls is 3.0 People.
How Large is the Labor Force in Great Falls?
There are 7,330 People in the Labor Forcein in Great Falls.
What is the Percentage of People in the Labor Force in Great Falls?
61.4% of People are in the Labor Force in Great Falls.
What is the Unemployment Rate in Great Falls?
Unemployment Rate in Great Falls is 3.3%.