Bluefield, VA Map & Demographics
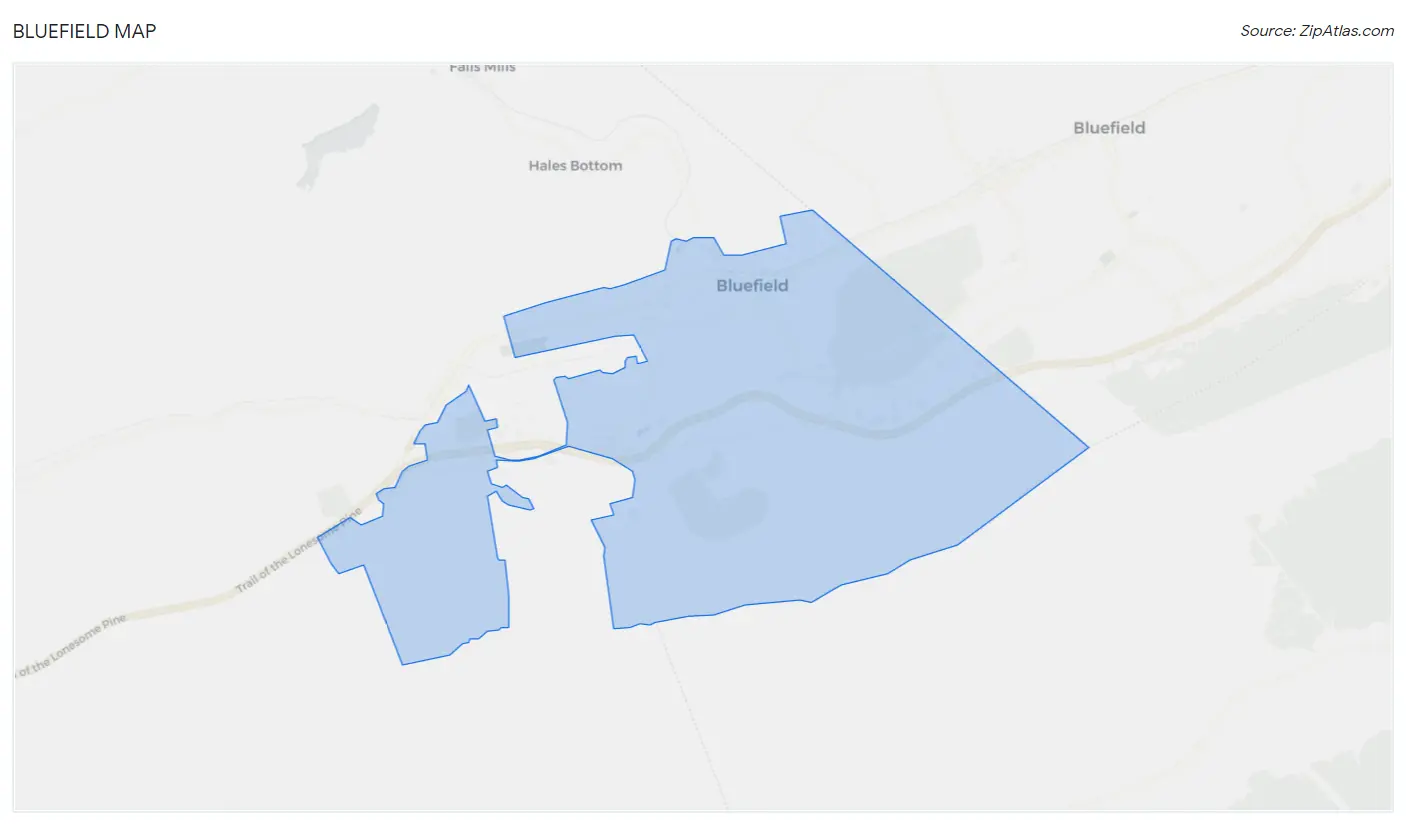
Bluefield Map
Bluefield Overview
$34,090
PER CAPITA INCOME
$52,299
AVG FAMILY INCOME
$53,162
AVG HOUSEHOLD INCOME
34.9%
WAGE / INCOME GAP [ % ]
65.1¢/ $1
WAGE / INCOME GAP [ $ ]
0.54
INEQUALITY / GINI INDEX
5,059
TOTAL POPULATION
2,337
MALE POPULATION
2,722
FEMALE POPULATION
85.86
MALES / 100 FEMALES
116.47
FEMALES / 100 MALES
38.9
MEDIAN AGE
2.7
AVG FAMILY SIZE
2.3
AVG HOUSEHOLD SIZE
2,010
LABOR FORCE [ PEOPLE ]
50.2%
PERCENT IN LABOR FORCE
2.8%
UNEMPLOYMENT RATE
Bluefield Zip Codes
Bluefield Area Codes
Income in Bluefield
Income Overview in Bluefield
Per Capita Income in Bluefield is $34,090, while median incomes of families and households are $52,299 and $53,162 respectively.
| Characteristic | Number | Measure |
| Per Capita Income | 5,059 | $34,090 |
| Median Family Income | 1,516 | $52,299 |
| Mean Family Income | 1,516 | $92,779 |
| Median Household Income | 2,059 | $53,162 |
| Mean Household Income | 2,059 | $82,919 |
| Income Deficit | 1,516 | $0 |
| Wage / Income Gap (%) | 5,059 | 34.92% |
| Wage / Income Gap ($) | 5,059 | 65.08¢ per $1 |
| Gini / Inequality Index | 5,059 | 0.54 |
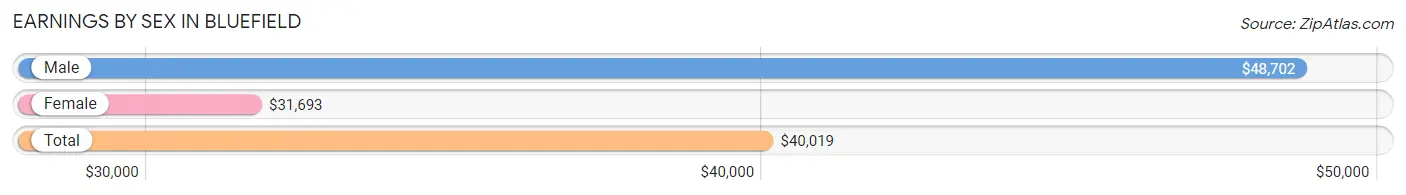
Earnings by Sex in Bluefield
Average Earnings in Bluefield are $40,019, $48,702 for men and $31,693 for women, a difference of 34.9%.
| Sex | Number | Average Earnings |
| Male | 1,061 (47.4%) | $48,702 |
| Female | 1,177 (52.6%) | $31,693 |
| Total | 2,238 (100.0%) | $40,019 |
Earnings by Sex by Income Bracket in Bluefield
The most common earnings brackets in Bluefield are $75,000 to $99,999 for men (172 | 16.2%) and $40,000 to $44,999 for women (151 | 12.8%).
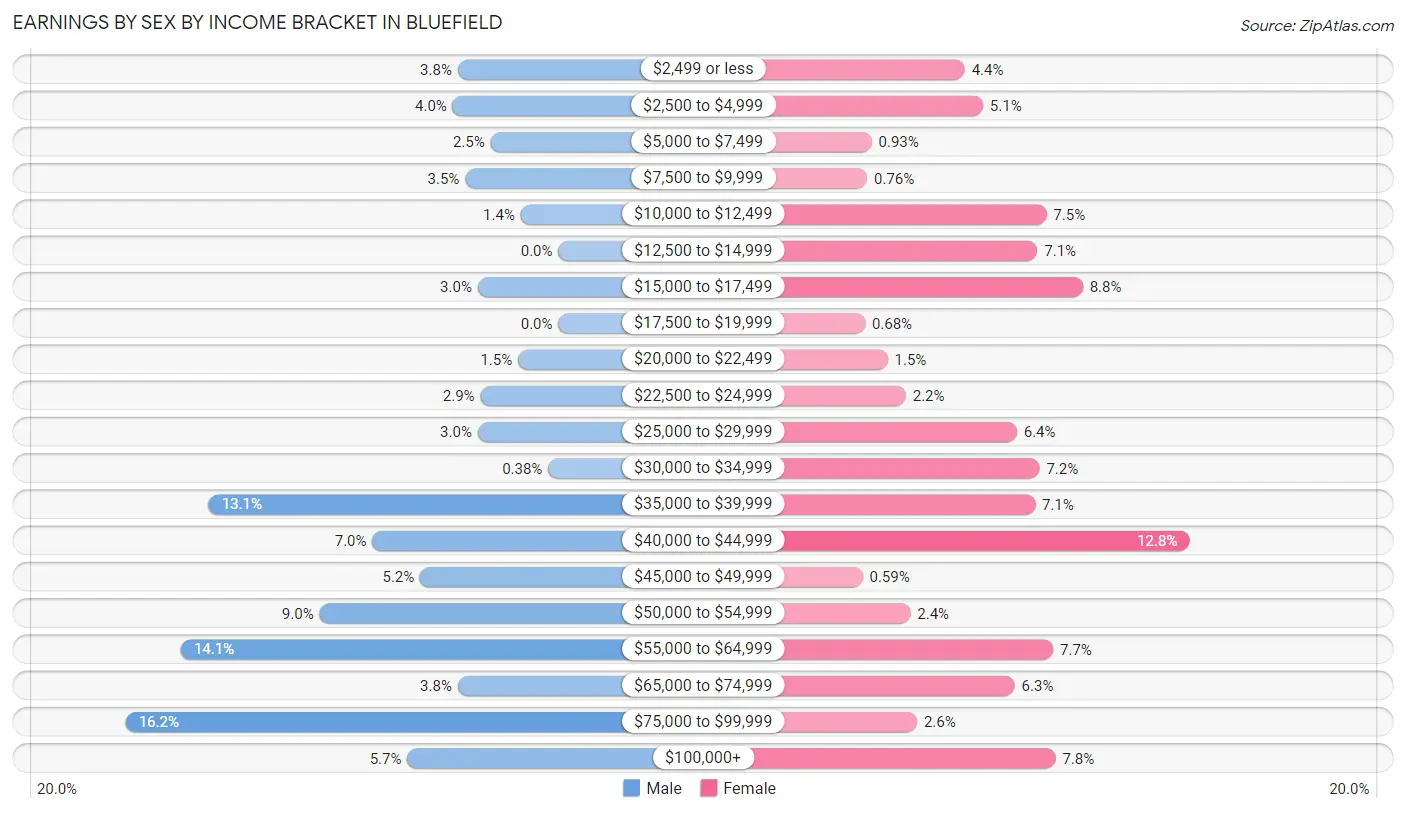
| Income | Male | Female |
| $2,499 or less | 40 (3.8%) | 52 (4.4%) |
| $2,500 to $4,999 | 42 (4.0%) | 60 (5.1%) |
| $5,000 to $7,499 | 27 (2.5%) | 11 (0.9%) |
| $7,500 to $9,999 | 37 (3.5%) | 9 (0.8%) |
| $10,000 to $12,499 | 15 (1.4%) | 88 (7.5%) |
| $12,500 to $14,999 | 0 (0.0%) | 84 (7.1%) |
| $15,000 to $17,499 | 32 (3.0%) | 104 (8.8%) |
| $17,500 to $19,999 | 0 (0.0%) | 8 (0.7%) |
| $20,000 to $22,499 | 16 (1.5%) | 18 (1.5%) |
| $22,500 to $24,999 | 31 (2.9%) | 26 (2.2%) |
| $25,000 to $29,999 | 32 (3.0%) | 75 (6.4%) |
| $30,000 to $34,999 | 4 (0.4%) | 85 (7.2%) |
| $35,000 to $39,999 | 139 (13.1%) | 83 (7.0%) |
| $40,000 to $44,999 | 74 (7.0%) | 151 (12.8%) |
| $45,000 to $49,999 | 55 (5.2%) | 7 (0.6%) |
| $50,000 to $54,999 | 95 (8.9%) | 28 (2.4%) |
| $55,000 to $64,999 | 150 (14.1%) | 91 (7.7%) |
| $65,000 to $74,999 | 40 (3.8%) | 74 (6.3%) |
| $75,000 to $99,999 | 172 (16.2%) | 31 (2.6%) |
| $100,000+ | 60 (5.7%) | 92 (7.8%) |
| Total | 1,061 (100.0%) | 1,177 (100.0%) |
Earnings by Sex by Educational Attainment in Bluefield
Average earnings in Bluefield are $50,026 for men and $35,625 for women, a difference of 28.8%. Men with an educational attainment of bachelor's degree enjoy the highest average annual earnings of $63,583, while those with college or associate's degree education earn the least with $42,583. Women with an educational attainment of bachelor's degree earn the most with the average annual earnings of $42,891, while those with college or associate's degree education have the smallest earnings of $24,688.
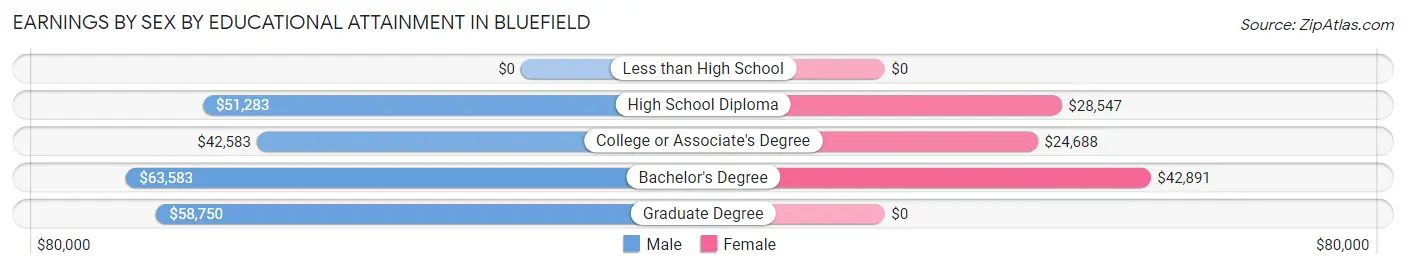
| Educational Attainment | Male Income | Female Income |
| Less than High School | - | - |
| High School Diploma | $51,283 | $28,547 |
| College or Associate's Degree | $42,583 | $24,688 |
| Bachelor's Degree | $63,583 | $42,891 |
| Graduate Degree | $58,750 | $0 |
| Total | $50,026 | $35,625 |
Family Income in Bluefield
Family Income Brackets in Bluefield
According to the Bluefield family income data, there are 337 families falling into the $100,000 to $149,999 income range, which is the most common income bracket and makes up 22.2% of all families. Conversely, the $15,000 to $24,999 income bracket is the least frequent group with only 36 families (2.4%) belonging to this category.
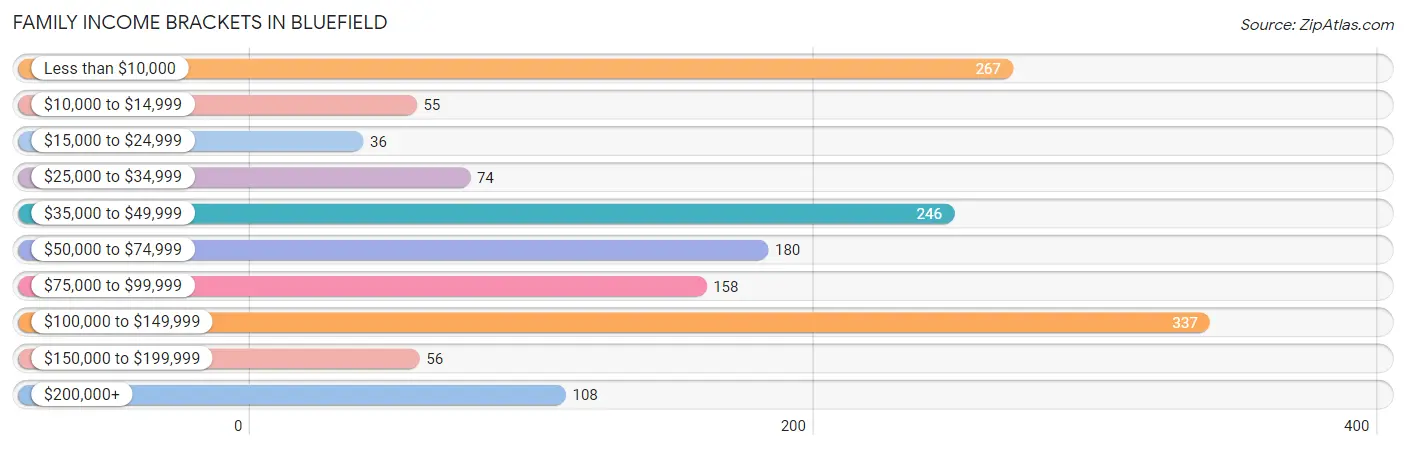
| Income Bracket | # Families | % Families |
| Less than $10,000 | 267 | 17.6% |
| $10,000 to $14,999 | 55 | 3.6% |
| $15,000 to $24,999 | 36 | 2.4% |
| $25,000 to $34,999 | 74 | 4.9% |
| $35,000 to $49,999 | 246 | 16.2% |
| $50,000 to $74,999 | 180 | 11.9% |
| $75,000 to $99,999 | 158 | 10.4% |
| $100,000 to $149,999 | 337 | 22.2% |
| $150,000 to $199,999 | 56 | 3.7% |
| $200,000+ | 108 | 7.1% |
Family Income by Famaliy Size in Bluefield
4-person families (154 | 10.2%) account for the highest median family income in Bluefield with $134,239 per family, while 2-person families (651 | 42.9%) have the highest median income of $34,602 per family member.
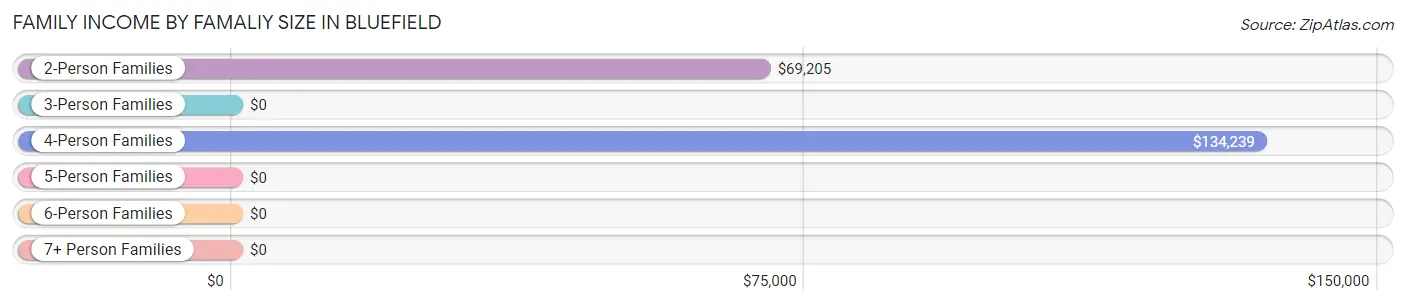
| Income Bracket | # Families | Median Income |
| 2-Person Families | 651 (42.9%) | $69,205 |
| 3-Person Families | 644 (42.5%) | $0 |
| 4-Person Families | 154 (10.2%) | $134,239 |
| 5-Person Families | 60 (4.0%) | $0 |
| 6-Person Families | 7 (0.5%) | $0 |
| 7+ Person Families | 0 (0.0%) | $0 |
| Total | 1,516 (100.0%) | $52,299 |
Family Income by Number of Earners in Bluefield
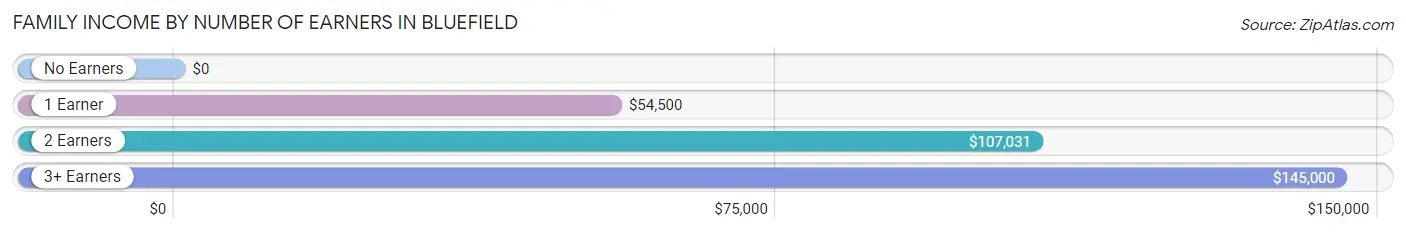
| Number of Earners | # Families | Median Income |
| No Earners | 557 (36.7%) | $0 |
| 1 Earner | 372 (24.5%) | $54,500 |
| 2 Earners | 453 (29.9%) | $107,031 |
| 3+ Earners | 134 (8.8%) | $145,000 |
| Total | 1,516 (100.0%) | $52,299 |
Household Income in Bluefield
Household Income Brackets in Bluefield
With 387 households falling in the category, the $100,000 to $149,999 income range is the most frequent in Bluefield, accounting for 18.8% of all households. In contrast, only 68 households (3.3%) fall into the $150,000 to $199,999 income bracket, making it the least populous group.
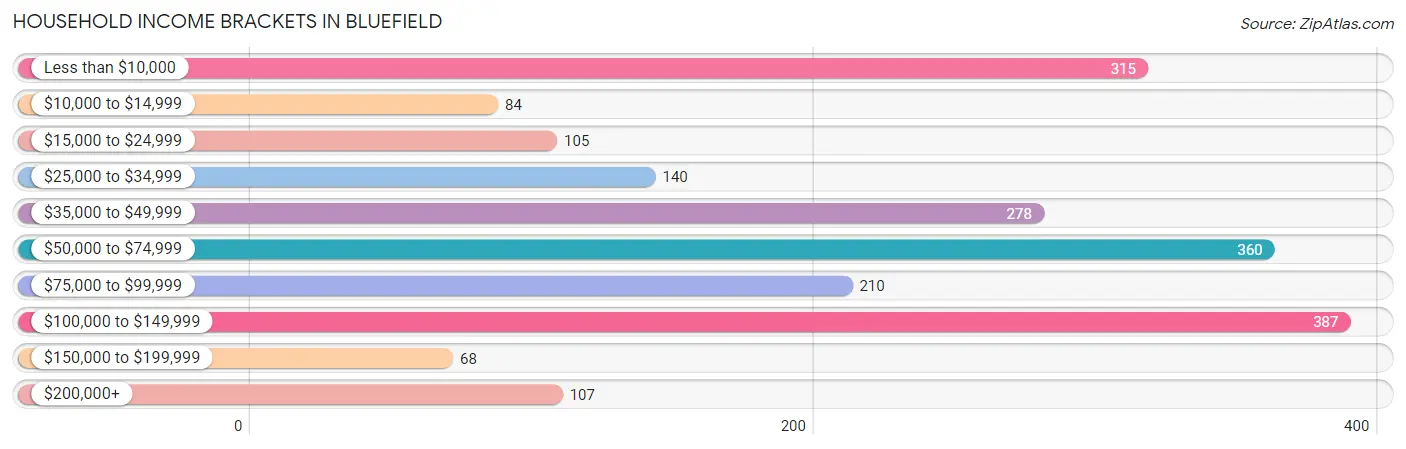
| Income Bracket | # Households | % Households |
| Less than $10,000 | 315 | 15.3% |
| $10,000 to $14,999 | 84 | 4.1% |
| $15,000 to $24,999 | 105 | 5.1% |
| $25,000 to $34,999 | 140 | 6.8% |
| $35,000 to $49,999 | 278 | 13.5% |
| $50,000 to $74,999 | 360 | 17.5% |
| $75,000 to $99,999 | 210 | 10.2% |
| $100,000 to $149,999 | 387 | 18.8% |
| $150,000 to $199,999 | 68 | 3.3% |
| $200,000+ | 107 | 5.2% |
Household Income by Householder Age in Bluefield
The median household income in Bluefield is $53,162, with the highest median household income of $100,156 found in the 25 to 44 years age bracket for the primary householder. A total of 345 households (16.8%) fall into this category. Meanwhile, the 15 to 24 years age bracket for the primary householder has the lowest median household income of $4,147, with 315 households (15.3%) in this group.
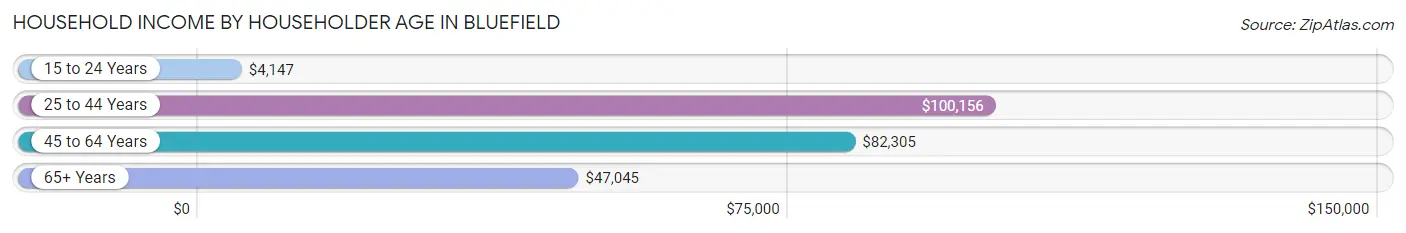
| Income Bracket | # Households | Median Income |
| 15 to 24 Years | 315 (15.3%) | $4,147 |
| 25 to 44 Years | 345 (16.8%) | $100,156 |
| 45 to 64 Years | 657 (31.9%) | $82,305 |
| 65+ Years | 742 (36.0%) | $47,045 |
| Total | 2,059 (100.0%) | $53,162 |
Poverty in Bluefield
Income Below Poverty by Sex and Age in Bluefield
With 7.2% poverty level for males and 26.9% for females among the residents of Bluefield, under 5 year old males and 18 to 24 year old females are the most vulnerable to poverty, with 51 males (34.9%) and 304 females (62.2%) in their respective age groups living below the poverty level.
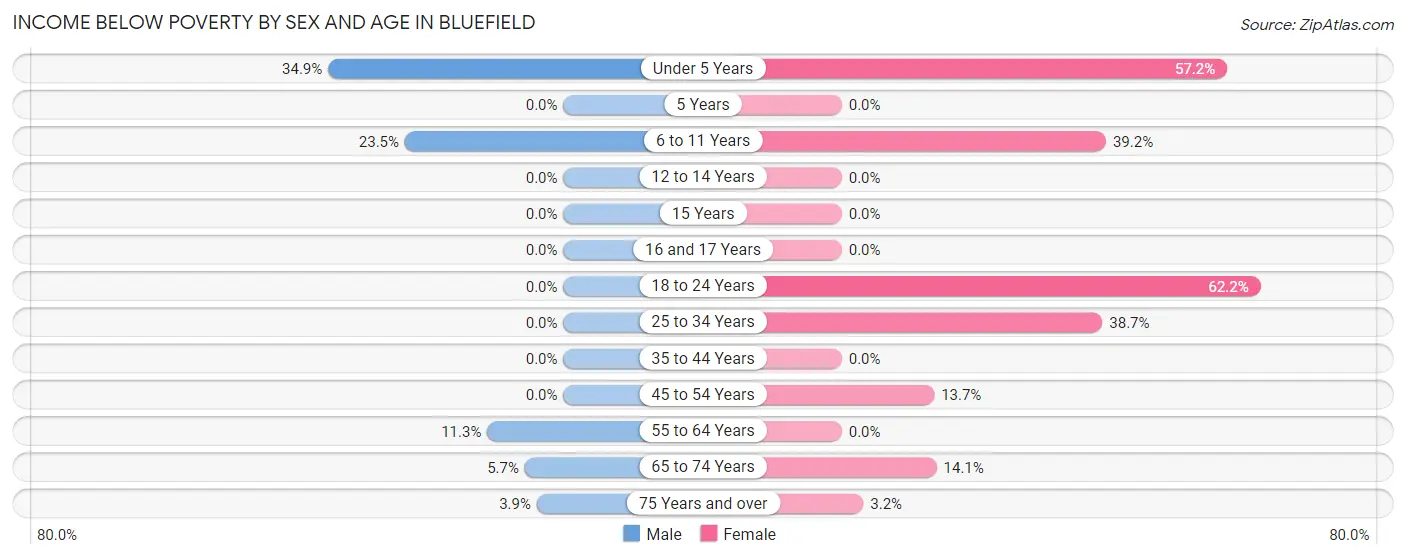
| Age Bracket | Male | Female |
| Under 5 Years | 51 (34.9%) | 147 (57.2%) |
| 5 Years | 0 (0.0%) | 0 (0.0%) |
| 6 to 11 Years | 40 (23.5%) | 82 (39.2%) |
| 12 to 14 Years | 0 (0.0%) | 0 (0.0%) |
| 15 Years | 0 (0.0%) | 0 (0.0%) |
| 16 and 17 Years | 0 (0.0%) | 0 (0.0%) |
| 18 to 24 Years | 0 (0.0%) | 304 (62.2%) |
| 25 to 34 Years | 0 (0.0%) | 65 (38.7%) |
| 35 to 44 Years | 0 (0.0%) | 0 (0.0%) |
| 45 to 54 Years | 0 (0.0%) | 55 (13.7%) |
| 55 to 64 Years | 40 (11.3%) | 0 (0.0%) |
| 65 to 74 Years | 11 (5.7%) | 29 (14.1%) |
| 75 Years and over | 13 (3.9%) | 12 (3.2%) |
| Total | 155 (7.2%) | 694 (26.9%) |
Income Above Poverty by Sex and Age in Bluefield
According to the poverty statistics in Bluefield, males aged 5 years and females aged 5 years are the age groups that are most secure financially, with 100.0% of males and 100.0% of females in these age groups living above the poverty line.
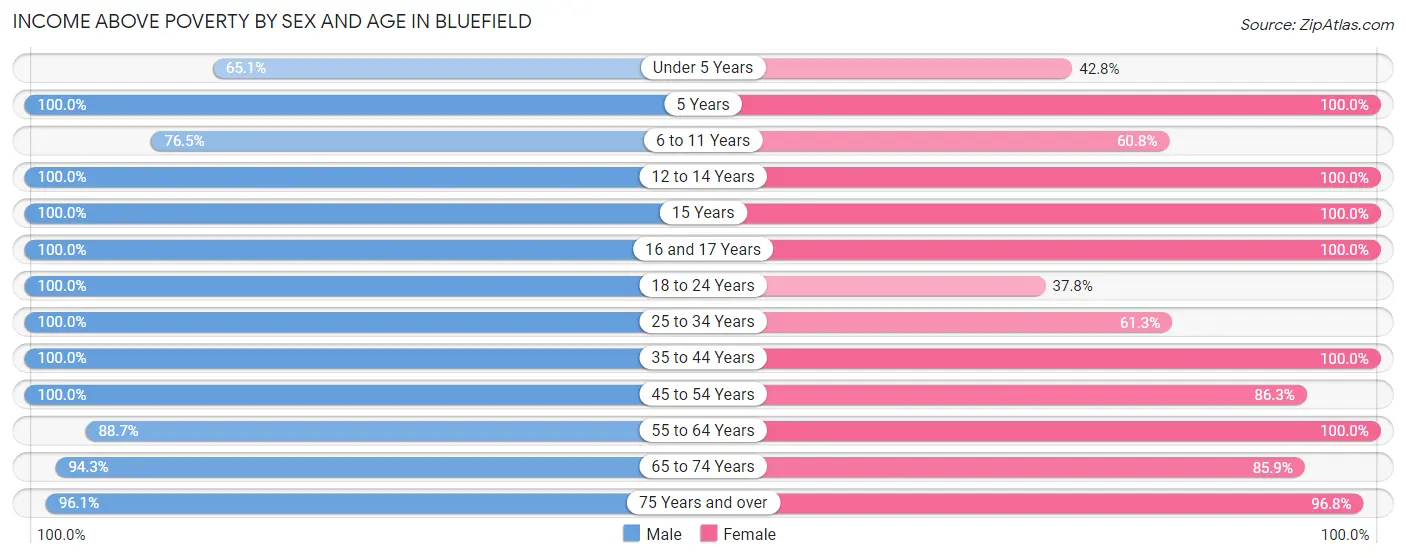
| Age Bracket | Male | Female |
| Under 5 Years | 95 (65.1%) | 110 (42.8%) |
| 5 Years | 13 (100.0%) | 22 (100.0%) |
| 6 to 11 Years | 130 (76.5%) | 127 (60.8%) |
| 12 to 14 Years | 80 (100.0%) | 76 (100.0%) |
| 15 Years | 48 (100.0%) | 14 (100.0%) |
| 16 and 17 Years | 49 (100.0%) | 18 (100.0%) |
| 18 to 24 Years | 77 (100.0%) | 185 (37.8%) |
| 25 to 34 Years | 275 (100.0%) | 103 (61.3%) |
| 35 to 44 Years | 184 (100.0%) | 166 (100.0%) |
| 45 to 54 Years | 231 (100.0%) | 346 (86.3%) |
| 55 to 64 Years | 314 (88.7%) | 175 (100.0%) |
| 65 to 74 Years | 181 (94.3%) | 177 (85.9%) |
| 75 Years and over | 317 (96.1%) | 363 (96.8%) |
| Total | 1,994 (92.8%) | 1,882 (73.1%) |
Income Below Poverty Among Married-Couple Families in Bluefield
The poverty statistics for married-couple families in Bluefield show that 1.2% or 11 of the total 937 families live below the poverty line. Families with no children have the highest poverty rate of 1.7%, comprising of 11 families. On the other hand, families with 1 or 2 children have the lowest poverty rate of 0.0%, which includes 0 families.
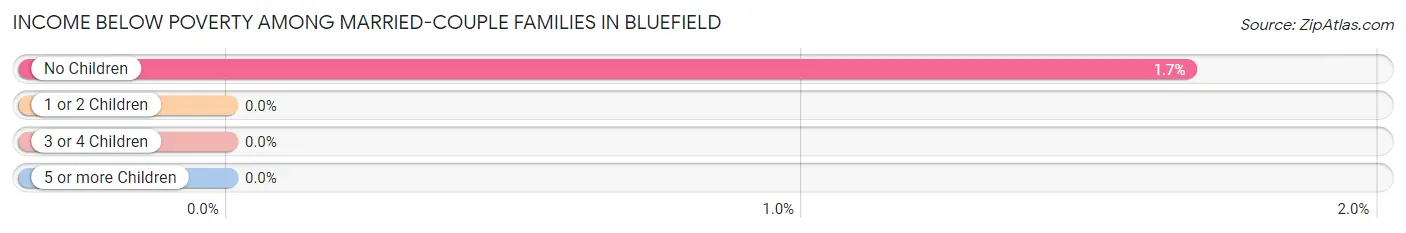
| Children | Above Poverty | Below Poverty |
| No Children | 648 (98.3%) | 11 (1.7%) |
| 1 or 2 Children | 251 (100.0%) | 0 (0.0%) |
| 3 or 4 Children | 27 (100.0%) | 0 (0.0%) |
| 5 or more Children | 0 (0.0%) | 0 (0.0%) |
| Total | 926 (98.8%) | 11 (1.2%) |
Income Below Poverty Among Single-Parent Households in Bluefield
According to the poverty data in Bluefield, 14.3% or 17 single-father households and 67.4% or 310 single-mother households are living below the poverty line. Among single-father households, those with 1 or 2 children have the highest poverty rate, with 17 households (17.9%) experiencing poverty. Likewise, among single-mother households, those with 1 or 2 children have the highest poverty rate, with 301 households (87.0%) falling below the poverty line.
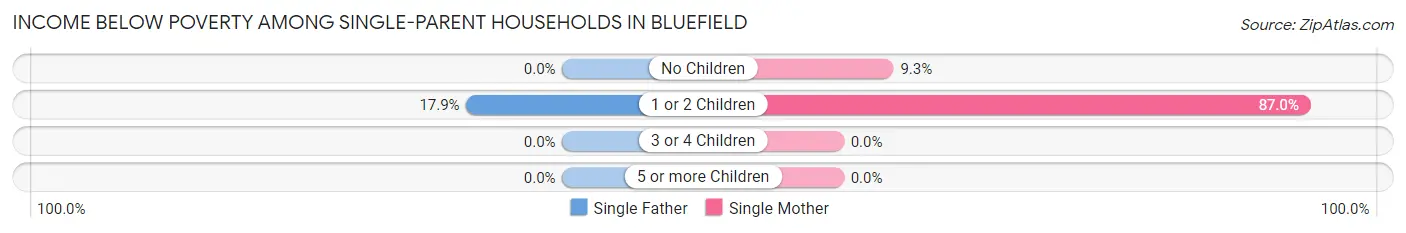
| Children | Single Father | Single Mother |
| No Children | 0 (0.0%) | 9 (9.3%) |
| 1 or 2 Children | 17 (17.9%) | 301 (87.0%) |
| 3 or 4 Children | 0 (0.0%) | 0 (0.0%) |
| 5 or more Children | 0 (0.0%) | 0 (0.0%) |
| Total | 17 (14.3%) | 310 (67.4%) |
Income Below Poverty Among Married-Couple vs Single-Parent Households in Bluefield
The poverty data for Bluefield shows that 11 of the married-couple family households (1.2%) and 327 of the single-parent households (56.5%) are living below the poverty level. Within the married-couple family households, those with no children have the highest poverty rate, with 11 households (1.7%) falling below the poverty line. Among the single-parent households, those with 1 or 2 children have the highest poverty rate, with 318 household (72.1%) living below poverty.
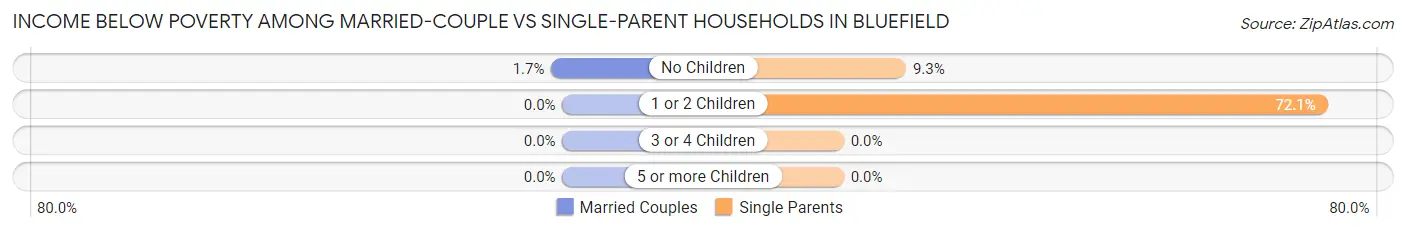
| Children | Married-Couple Families | Single-Parent Households |
| No Children | 11 (1.7%) | 9 (9.3%) |
| 1 or 2 Children | 0 (0.0%) | 318 (72.1%) |
| 3 or 4 Children | 0 (0.0%) | 0 (0.0%) |
| 5 or more Children | 0 (0.0%) | 0 (0.0%) |
| Total | 11 (1.2%) | 327 (56.5%) |
Race in Bluefield
The most populous races in Bluefield are White / Caucasian (4,375 | 86.5%), Black / African American (593 | 11.7%), and Hispanic or Latino (190 | 3.8%).
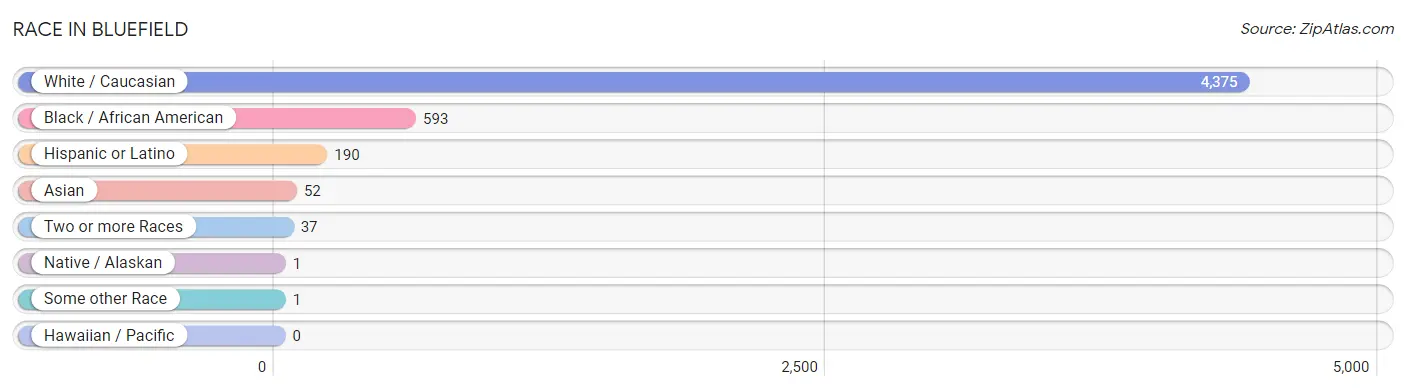
| Race | # Population | % Population |
| Asian | 52 | 1.0% |
| Black / African American | 593 | 11.7% |
| Hawaiian / Pacific | 0 | 0.0% |
| Hispanic or Latino | 190 | 3.8% |
| Native / Alaskan | 1 | 0.0% |
| White / Caucasian | 4,375 | 86.5% |
| Two or more Races | 37 | 0.7% |
| Some other Race | 1 | 0.0% |
| Total | 5,059 | 100.0% |
Ancestry in Bluefield
The most populous ancestries reported in Bluefield are American (722 | 14.3%), Irish (652 | 12.9%), English (485 | 9.6%), German (421 | 8.3%), and Haitian (398 | 7.9%), together accounting for 52.9% of all Bluefield residents.
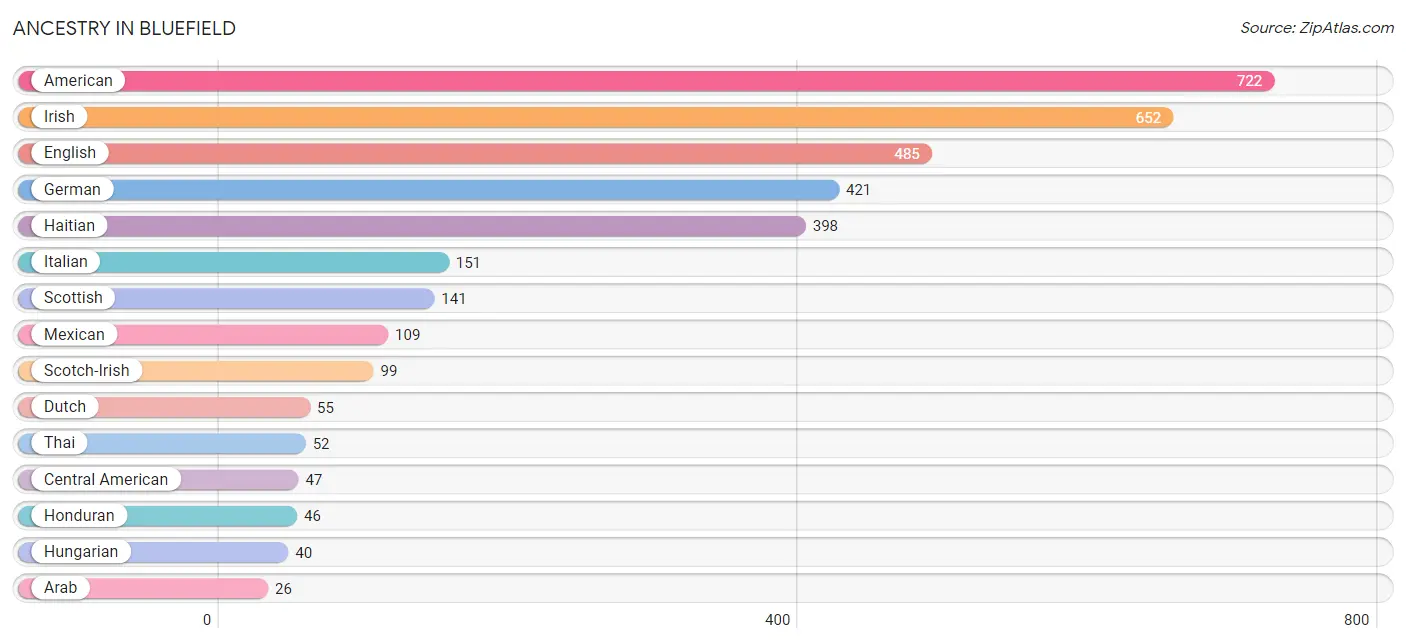
| Ancestry | # Population | % Population |
| American | 722 | 14.3% |
| Arab | 26 | 0.5% |
| Bhutanese | 1 | 0.0% |
| British | 14 | 0.3% |
| British West Indian | 4 | 0.1% |
| Canadian | 24 | 0.5% |
| Central American | 47 | 0.9% |
| Dominican | 4 | 0.1% |
| Dutch | 55 | 1.1% |
| English | 485 | 9.6% |
| European | 16 | 0.3% |
| French | 24 | 0.5% |
| French Canadian | 4 | 0.1% |
| German | 421 | 8.3% |
| Greek | 4 | 0.1% |
| Haitian | 398 | 7.9% |
| Honduran | 46 | 0.9% |
| Hungarian | 40 | 0.8% |
| Irish | 652 | 12.9% |
| Italian | 151 | 3.0% |
| Lebanese | 26 | 0.5% |
| Mexican | 109 | 2.1% |
| Norwegian | 11 | 0.2% |
| Puerto Rican | 7 | 0.1% |
| Russian | 16 | 0.3% |
| Salvadoran | 1 | 0.0% |
| Scotch-Irish | 99 | 2.0% |
| Scottish | 141 | 2.8% |
| Slovak | 8 | 0.2% |
| Spaniard | 9 | 0.2% |
| Thai | 52 | 1.0% |
| Welsh | 11 | 0.2% | View All 32 Rows |
Immigrants in Bluefield
The most numerous immigrant groups reported in Bluefield came from Asia (78 | 1.5%), India (52 | 1.0%), South Central Asia (52 | 1.0%), Europe (27 | 0.5%), and Lebanon (26 | 0.5%), together accounting for 4.6% of all Bluefield residents.
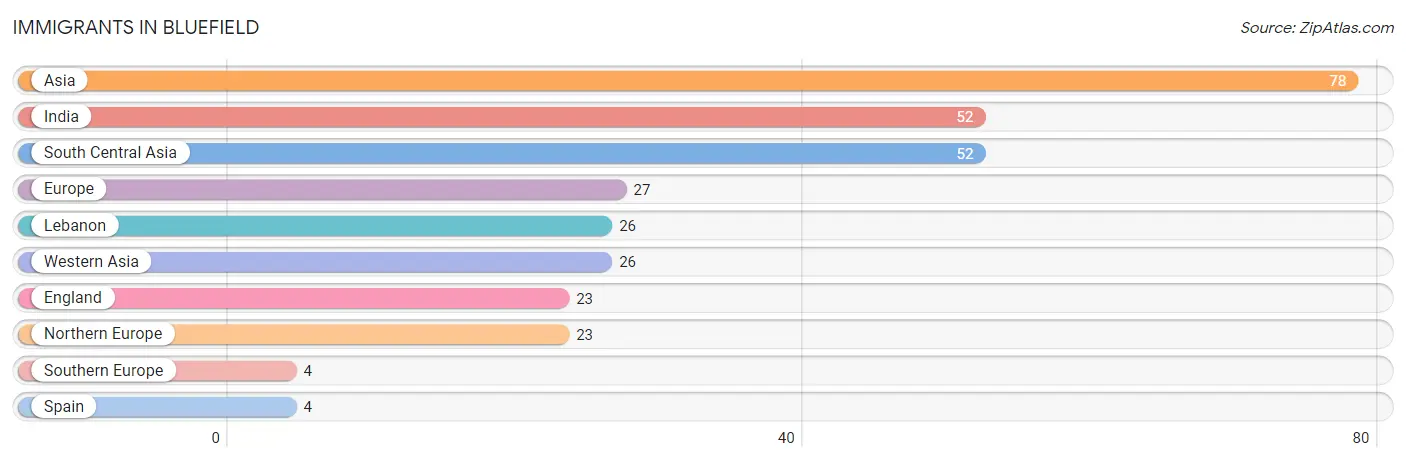
| Immigration Origin | # Population | % Population |
| Asia | 78 | 1.5% |
| England | 23 | 0.4% |
| Europe | 27 | 0.5% |
| India | 52 | 1.0% |
| Lebanon | 26 | 0.5% |
| Northern Europe | 23 | 0.4% |
| South Central Asia | 52 | 1.0% |
| Southern Europe | 4 | 0.1% |
| Spain | 4 | 0.1% |
| Western Asia | 26 | 0.5% | View All 10 Rows |
Sex and Age in Bluefield
Sex and Age in Bluefield
The most populous age groups in Bluefield are 15 to 19 Years (213 | 9.1%) for men and 20 to 24 Years (460 | 16.9%) for women.
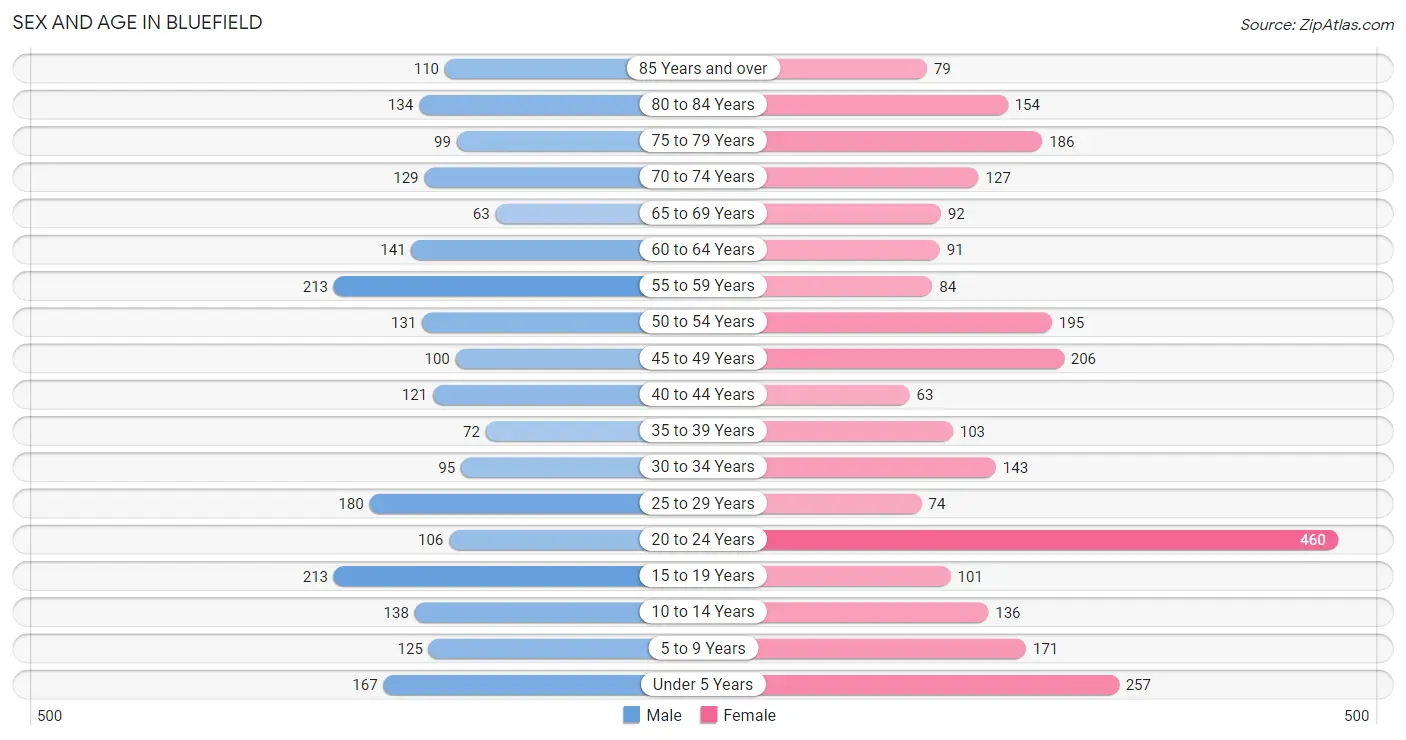
| Age Bracket | Male | Female |
| Under 5 Years | 167 (7.1%) | 257 (9.4%) |
| 5 to 9 Years | 125 (5.3%) | 171 (6.3%) |
| 10 to 14 Years | 138 (5.9%) | 136 (5.0%) |
| 15 to 19 Years | 213 (9.1%) | 101 (3.7%) |
| 20 to 24 Years | 106 (4.5%) | 460 (16.9%) |
| 25 to 29 Years | 180 (7.7%) | 74 (2.7%) |
| 30 to 34 Years | 95 (4.1%) | 143 (5.2%) |
| 35 to 39 Years | 72 (3.1%) | 103 (3.8%) |
| 40 to 44 Years | 121 (5.2%) | 63 (2.3%) |
| 45 to 49 Years | 100 (4.3%) | 206 (7.6%) |
| 50 to 54 Years | 131 (5.6%) | 195 (7.2%) |
| 55 to 59 Years | 213 (9.1%) | 84 (3.1%) |
| 60 to 64 Years | 141 (6.0%) | 91 (3.3%) |
| 65 to 69 Years | 63 (2.7%) | 92 (3.4%) |
| 70 to 74 Years | 129 (5.5%) | 127 (4.7%) |
| 75 to 79 Years | 99 (4.2%) | 186 (6.8%) |
| 80 to 84 Years | 134 (5.7%) | 154 (5.7%) |
| 85 Years and over | 110 (4.7%) | 79 (2.9%) |
| Total | 2,337 (100.0%) | 2,722 (100.0%) |
Families and Households in Bluefield
Median Family Size in Bluefield
The median family size in Bluefield is 2.67 persons per family, with single male/father families (119 | 7.9%) accounting for the largest median family size of 3.17 persons per family. On the other hand, single female/mother families (460 | 30.3%) represent the smallest median family size with 2.20 persons per family.
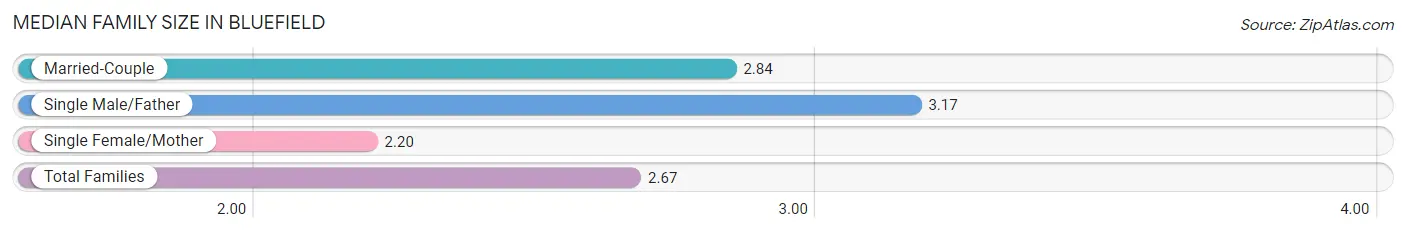
| Family Type | # Families | Family Size |
| Married-Couple | 937 (61.8%) | 2.84 |
| Single Male/Father | 119 (7.9%) | 3.17 |
| Single Female/Mother | 460 (30.3%) | 2.20 |
| Total Families | 1,516 (100.0%) | 2.67 |
Median Household Size in Bluefield
The median household size in Bluefield is 2.31 persons per household, with single male/father households (119 | 5.8%) accounting for the largest median household size of 3.92 persons per household. non-family households (543 | 26.4%) represent the smallest median household size with 1.06 persons per household.
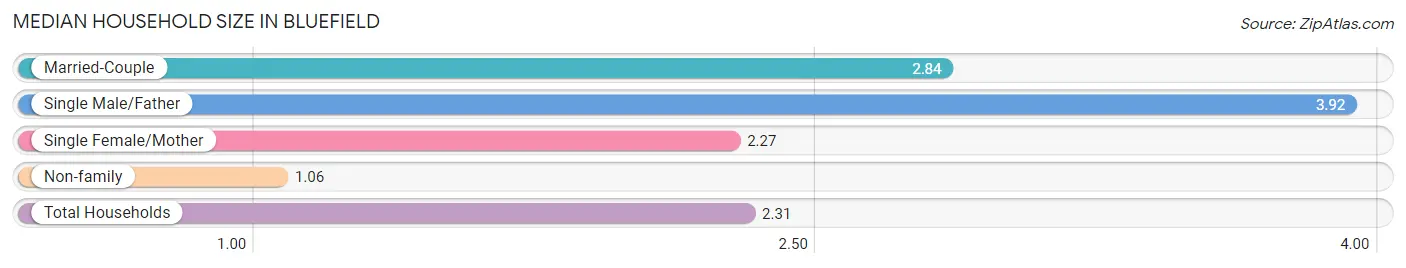
| Household Type | # Households | Household Size |
| Married-Couple | 937 (45.5%) | 2.84 |
| Single Male/Father | 119 (5.8%) | 3.92 |
| Single Female/Mother | 460 (22.3%) | 2.27 |
| Non-family | 543 (26.4%) | 1.06 |
| Total Households | 2,059 (100.0%) | 2.31 |
Household Size by Marriage Status in Bluefield
Out of a total of 2,059 households in Bluefield, 1,516 (73.6%) are family households, while 543 (26.4%) are nonfamily households. The most numerous type of family households are 3-person households, comprising 666, and the most common type of nonfamily households are 1-person households, comprising 526.
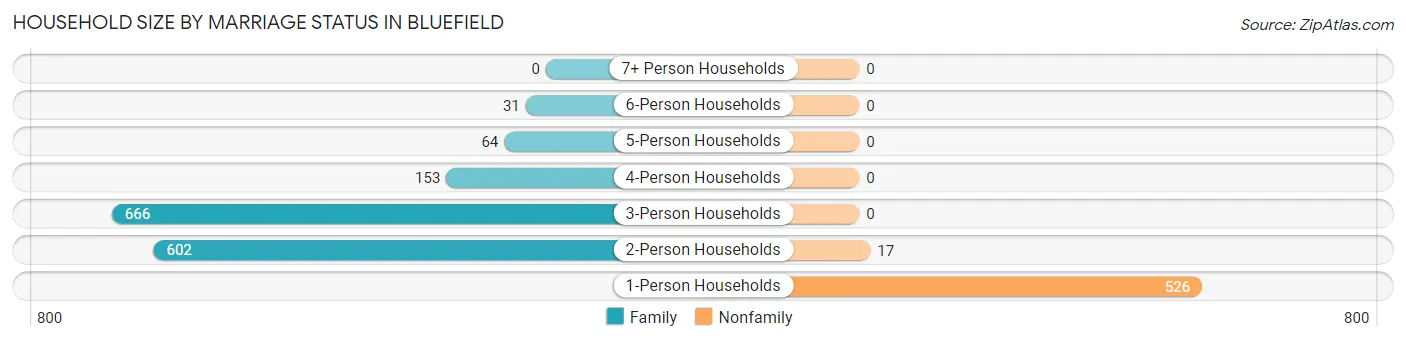
| Household Size | Family Households | Nonfamily Households |
| 1-Person Households | - | 526 (25.6%) |
| 2-Person Households | 602 (29.2%) | 17 (0.8%) |
| 3-Person Households | 666 (32.4%) | 0 (0.0%) |
| 4-Person Households | 153 (7.4%) | 0 (0.0%) |
| 5-Person Households | 64 (3.1%) | 0 (0.0%) |
| 6-Person Households | 31 (1.5%) | 0 (0.0%) |
| 7+ Person Households | 0 (0.0%) | 0 (0.0%) |
| Total | 1,516 (73.6%) | 543 (26.4%) |
Female Fertility in Bluefield
Fertility by Age in Bluefield
Average fertility rate in Bluefield is 242.0 births per 1,000 women. Women in the age bracket of 20 to 34 years have the highest fertility rate with 437.0 births per 1,000 women. Women in the age bracket of 20 to 34 years acount for 100.0% of all women with births.
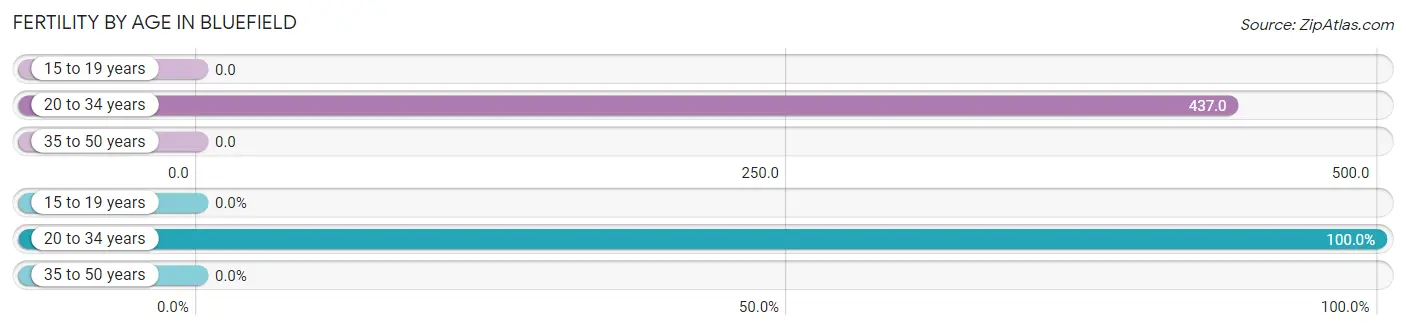
| Age Bracket | Women with Births | Births / 1,000 Women |
| 15 to 19 years | 0 (0.0%) | 0.0 |
| 20 to 34 years | 296 (100.0%) | 437.0 |
| 35 to 50 years | 0 (0.0%) | 0.0 |
| Total | 296 (100.0%) | 242.0 |
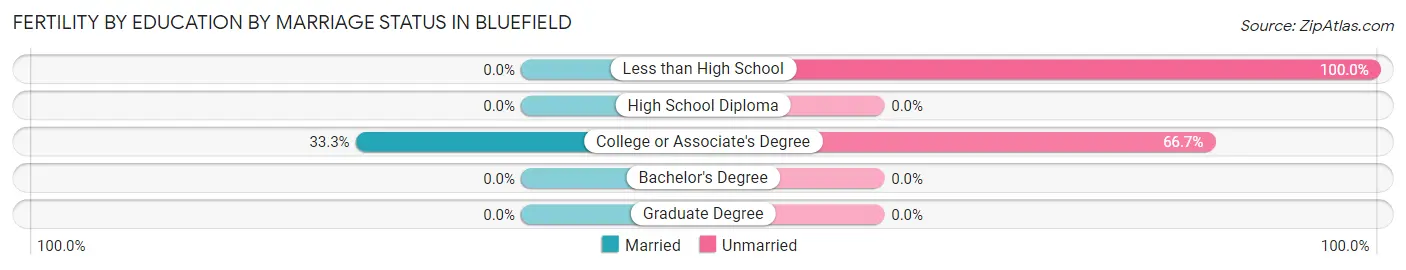
Fertility by Age by Marriage Status in Bluefield
6.4% of women with births (296) in Bluefield are married. The highest percentage of unmarried women with births falls into 20 to 34 years age bracket with 93.6% of them unmarried at the time of birth, while the lowest percentage of unmarried women with births belong to 20 to 34 years age bracket with 93.6% of them unmarried.
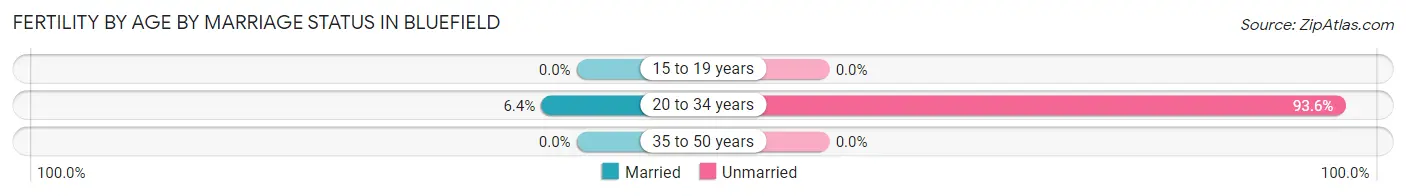
| Age Bracket | Married | Unmarried |
| 15 to 19 years | 0 (0.0%) | 0 (0.0%) |
| 20 to 34 years | 19 (6.4%) | 277 (93.6%) |
| 35 to 50 years | 0 (0.0%) | 0 (0.0%) |
| Total | 19 (6.4%) | 277 (93.6%) |
Fertility by Education in Bluefield
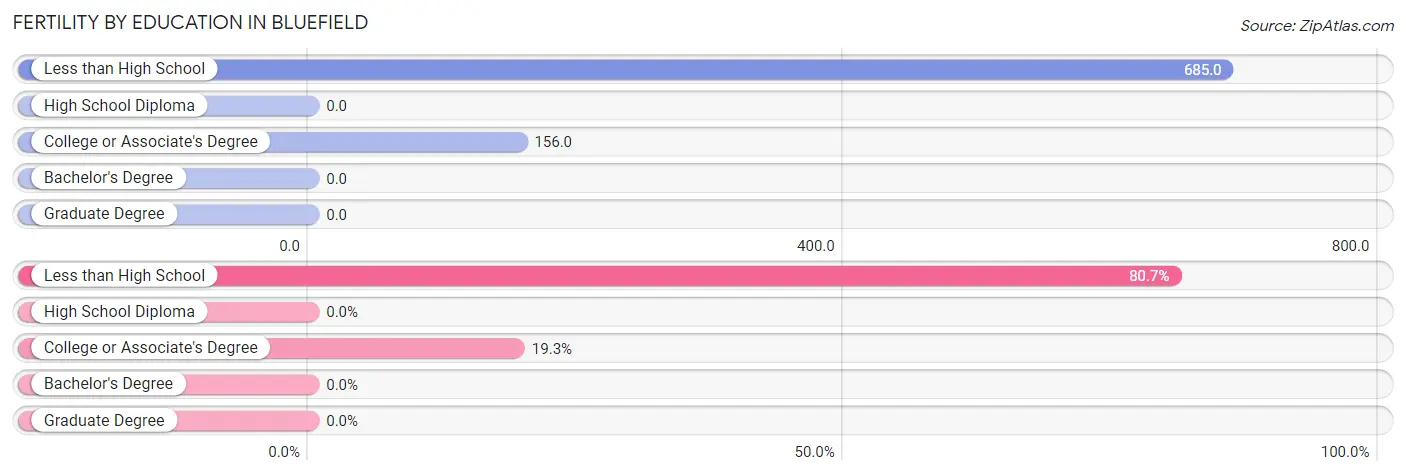
| Educational Attainment | Women with Births | Births / 1,000 Women |
| Less than High School | 239 (80.7%) | 685.0 |
| High School Diploma | 0 (0.0%) | 0.0 |
| College or Associate's Degree | 57 (19.3%) | 156.0 |
| Bachelor's Degree | 0 (0.0%) | 0.0 |
| Graduate Degree | 0 (0.0%) | 0.0 |
| Total | 296 (100.0%) | 242.0 |
Fertility by Education by Marriage Status in Bluefield
93.6% of women with births in Bluefield are unmarried. Women with the educational attainment of college or associate's degree are most likely to be married with 33.3% of them married at childbirth, while women with the educational attainment of less than high school are least likely to be married with 100.0% of them unmarried at childbirth.
| Educational Attainment | Married | Unmarried |
| Less than High School | 0 (0.0%) | 239 (100.0%) |
| High School Diploma | 0 (0.0%) | 0 (0.0%) |
| College or Associate's Degree | 19 (33.3%) | 38 (66.7%) |
| Bachelor's Degree | 0 (0.0%) | 0 (0.0%) |
| Graduate Degree | 0 (0.0%) | 0 (0.0%) |
| Total | 19 (6.4%) | 277 (93.6%) |
Employment Characteristics in Bluefield
Employment by Class of Employer in Bluefield
Among the 1,929 employed individuals in Bluefield, private company employees (1,064 | 55.2%), state government employees (317 | 16.4%), and local government employees (256 | 13.3%) make up the most common classes of employment.
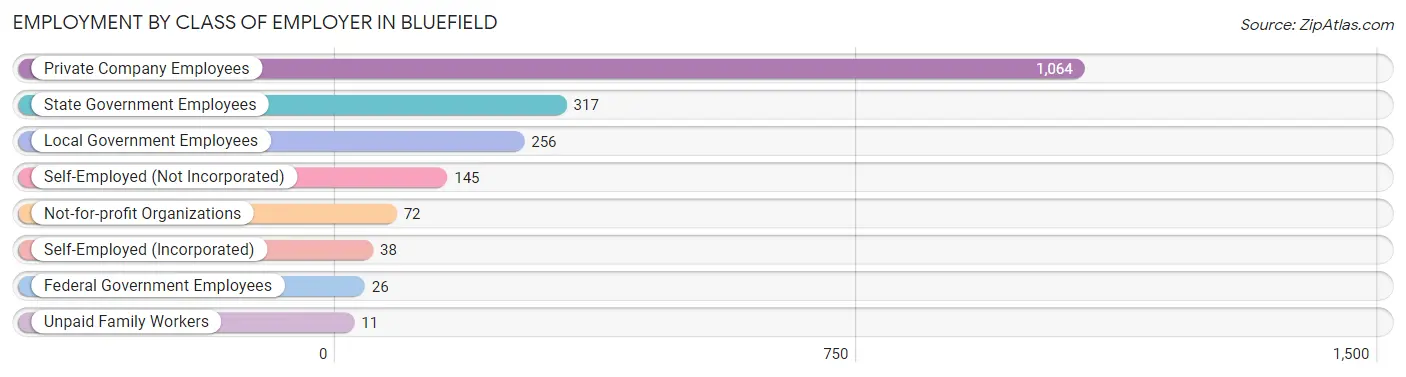
| Employer Class | # Employees | % Employees |
| Private Company Employees | 1,064 | 55.2% |
| Self-Employed (Incorporated) | 38 | 2.0% |
| Self-Employed (Not Incorporated) | 145 | 7.5% |
| Not-for-profit Organizations | 72 | 3.7% |
| Local Government Employees | 256 | 13.3% |
| State Government Employees | 317 | 16.4% |
| Federal Government Employees | 26 | 1.3% |
| Unpaid Family Workers | 11 | 0.6% |
| Total | 1,929 | 100.0% |
Employment Status by Age in Bluefield
According to the labor force statistics for Bluefield, out of the total population over 16 years of age (4,003), 50.2% or 2,010 individuals are in the labor force, with 2.8% or 56 of them unemployed. The age group with the highest labor force participation rate is 25 to 29 years, with 100.0% or 254 individuals in the labor force. Within the labor force, the 20 to 24 years age range has the highest percentage of unemployed individuals, with 17.6% or 42 of them being unemployed.
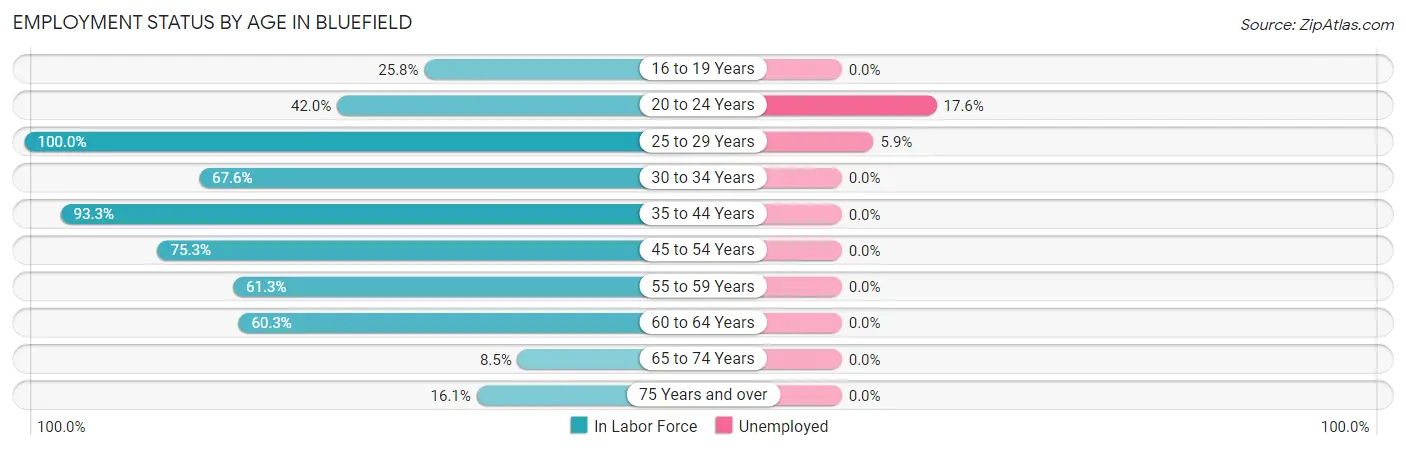
| Age Bracket | In Labor Force | Unemployed |
| 16 to 19 Years | 65 (25.8%) | 0 (0.0%) |
| 20 to 24 Years | 238 (42.0%) | 42 (17.6%) |
| 25 to 29 Years | 254 (100.0%) | 15 (5.9%) |
| 30 to 34 Years | 161 (67.6%) | 0 (0.0%) |
| 35 to 44 Years | 335 (93.3%) | 0 (0.0%) |
| 45 to 54 Years | 476 (75.3%) | 0 (0.0%) |
| 55 to 59 Years | 182 (61.3%) | 0 (0.0%) |
| 60 to 64 Years | 140 (60.3%) | 0 (0.0%) |
| 65 to 74 Years | 35 (8.5%) | 0 (0.0%) |
| 75 Years and over | 123 (16.1%) | 0 (0.0%) |
| Total | 2,010 (50.2%) | 56 (2.8%) |
Employment Status by Educational Attainment in Bluefield
According to labor force statistics for Bluefield, 76.9% of individuals (1,547) out of the total population between 25 and 64 years of age (2,012) are in the labor force, with 1.0% or 15 of them being unemployed. The group with the highest labor force participation rate are those with the educational attainment of bachelor's degree or higher, with 84.0% or 563 individuals in the labor force. Within the labor force, individuals with high school diploma education have the highest percentage of unemployment, with 3.7% or 15 of them being unemployed.
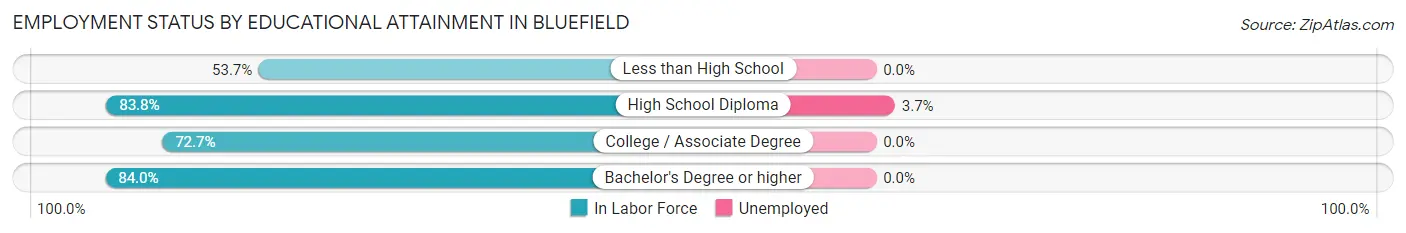
| Educational Attainment | In Labor Force | Unemployed |
| Less than High School | 124 (53.7%) | 0 (0.0%) |
| High School Diploma | 402 (83.8%) | 18 (3.7%) |
| College / Associate Degree | 459 (72.7%) | 0 (0.0%) |
| Bachelor's Degree or higher | 563 (84.0%) | 0 (0.0%) |
| Total | 1,547 (76.9%) | 20 (1.0%) |
Employment Occupations by Sex in Bluefield
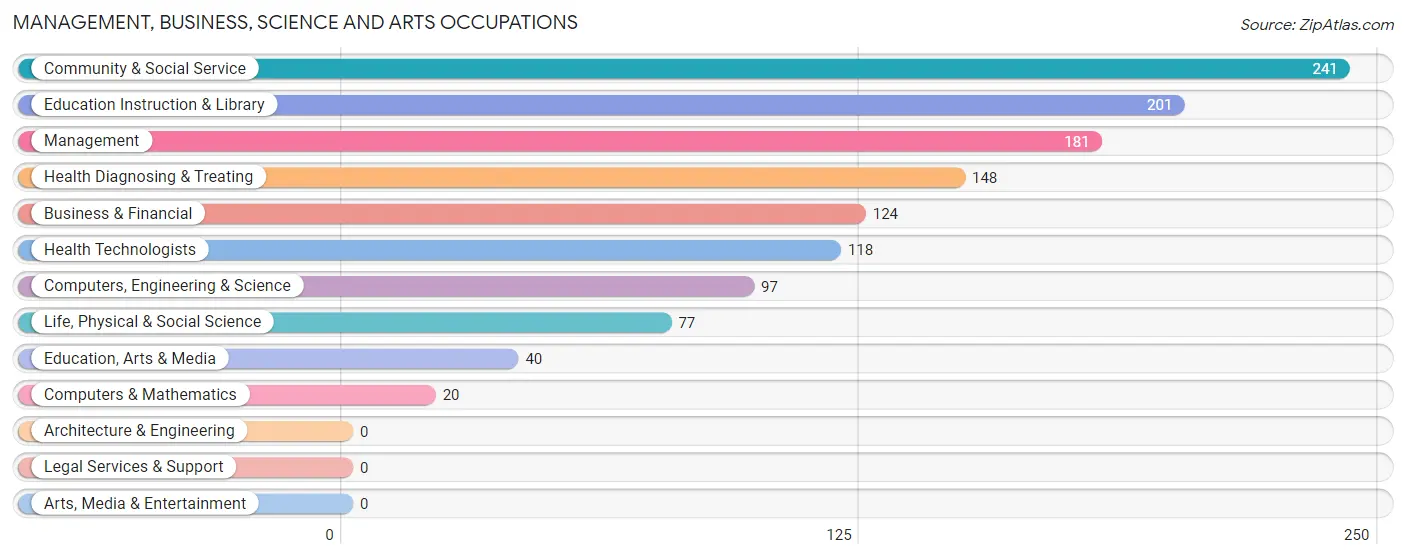
Management, Business, Science and Arts Occupations
The most common Management, Business, Science and Arts occupations in Bluefield are Community & Social Service (241 | 12.3%), Education Instruction & Library (201 | 10.3%), Management (181 | 9.3%), Health Diagnosing & Treating (148 | 7.6%), and Business & Financial (124 | 6.4%).
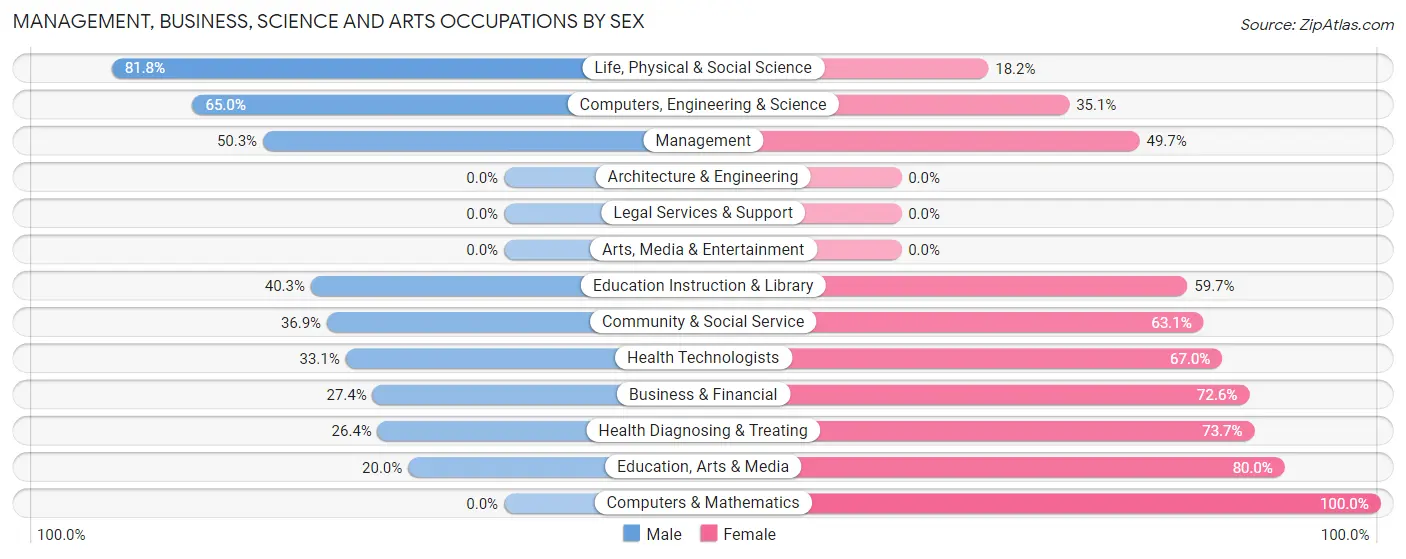
Management, Business, Science and Arts Occupations by Sex
Within the Management, Business, Science and Arts occupations in Bluefield, the most male-oriented occupations are Life, Physical & Social Science (81.8%), Computers, Engineering & Science (64.9%), and Management (50.3%), while the most female-oriented occupations are Computers & Mathematics (100.0%), Education, Arts & Media (80.0%), and Health Diagnosing & Treating (73.7%).
| Occupation | Male | Female |
| Management | 91 (50.3%) | 90 (49.7%) |
| Business & Financial | 34 (27.4%) | 90 (72.6%) |
| Computers, Engineering & Science | 63 (64.9%) | 34 (35.0%) |
| Computers & Mathematics | 0 (0.0%) | 20 (100.0%) |
| Architecture & Engineering | 0 (0.0%) | 0 (0.0%) |
| Life, Physical & Social Science | 63 (81.8%) | 14 (18.2%) |
| Community & Social Service | 89 (36.9%) | 152 (63.1%) |
| Education, Arts & Media | 8 (20.0%) | 32 (80.0%) |
| Legal Services & Support | 0 (0.0%) | 0 (0.0%) |
| Education Instruction & Library | 81 (40.3%) | 120 (59.7%) |
| Arts, Media & Entertainment | 0 (0.0%) | 0 (0.0%) |
| Health Diagnosing & Treating | 39 (26.4%) | 109 (73.7%) |
| Health Technologists | 39 (33.1%) | 79 (66.9%) |
| Total (Category) | 316 (40.0%) | 475 (60.1%) |
| Total (Overall) | 970 (49.7%) | 982 (50.3%) |
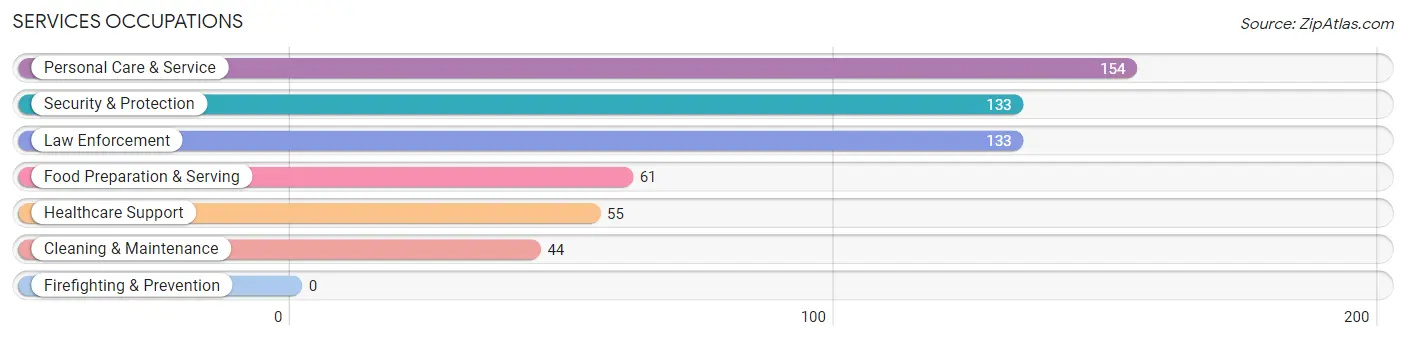
Services Occupations
The most common Services occupations in Bluefield are Personal Care & Service (154 | 7.9%), Security & Protection (133 | 6.8%), Law Enforcement (133 | 6.8%), Food Preparation & Serving (61 | 3.1%), and Healthcare Support (55 | 2.8%).
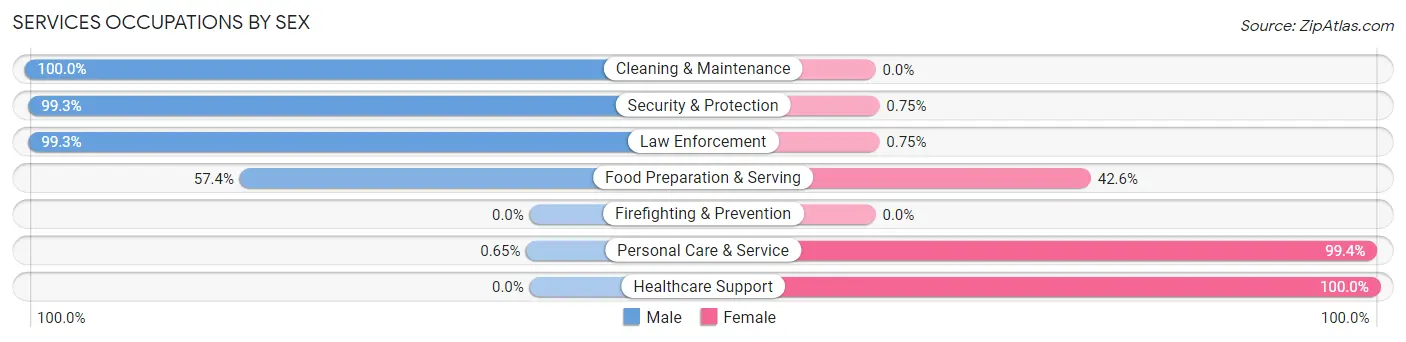
Services Occupations by Sex
Within the Services occupations in Bluefield, the most male-oriented occupations are Cleaning & Maintenance (100.0%), Security & Protection (99.3%), and Law Enforcement (99.3%), while the most female-oriented occupations are Healthcare Support (100.0%), Personal Care & Service (99.4%), and Food Preparation & Serving (42.6%).
| Occupation | Male | Female |
| Healthcare Support | 0 (0.0%) | 55 (100.0%) |
| Security & Protection | 132 (99.3%) | 1 (0.7%) |
| Firefighting & Prevention | 0 (0.0%) | 0 (0.0%) |
| Law Enforcement | 132 (99.3%) | 1 (0.7%) |
| Food Preparation & Serving | 35 (57.4%) | 26 (42.6%) |
| Cleaning & Maintenance | 44 (100.0%) | 0 (0.0%) |
| Personal Care & Service | 1 (0.6%) | 153 (99.4%) |
| Total (Category) | 212 (47.4%) | 235 (52.6%) |
| Total (Overall) | 970 (49.7%) | 982 (50.3%) |
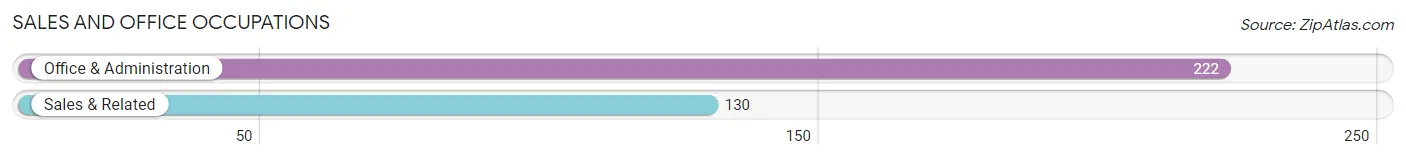
Sales and Office Occupations
The most common Sales and Office occupations in Bluefield are Office & Administration (222 | 11.4%), and Sales & Related (130 | 6.7%).
Sales and Office Occupations by Sex
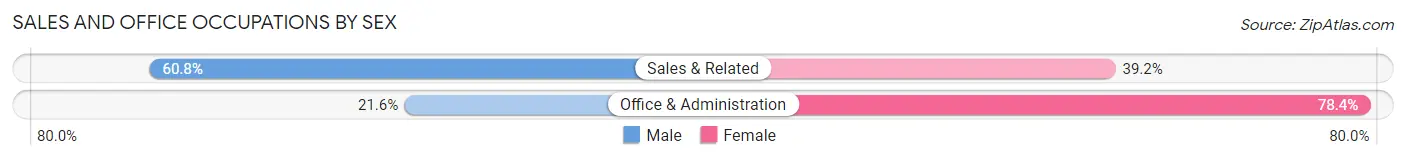
| Occupation | Male | Female |
| Sales & Related | 79 (60.8%) | 51 (39.2%) |
| Office & Administration | 48 (21.6%) | 174 (78.4%) |
| Total (Category) | 127 (36.1%) | 225 (63.9%) |
| Total (Overall) | 970 (49.7%) | 982 (50.3%) |
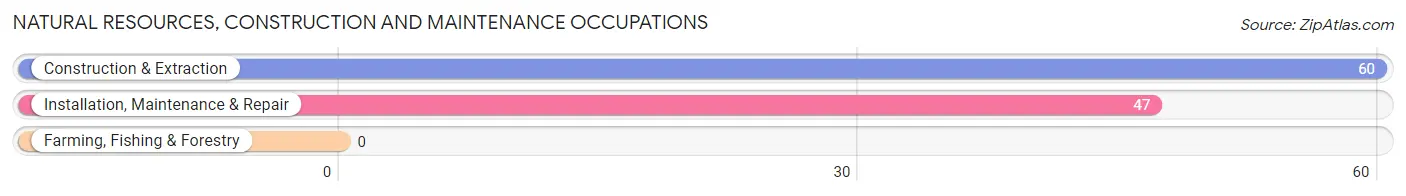
Natural Resources, Construction and Maintenance Occupations
The most common Natural Resources, Construction and Maintenance occupations in Bluefield are Construction & Extraction (60 | 3.1%), and Installation, Maintenance & Repair (47 | 2.4%).
Natural Resources, Construction and Maintenance Occupations by Sex
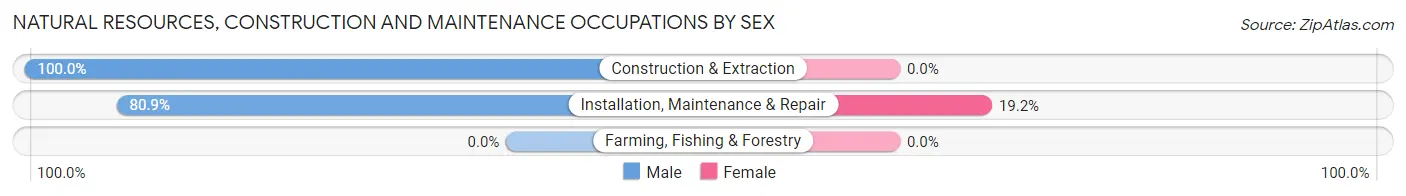
| Occupation | Male | Female |
| Farming, Fishing & Forestry | 0 (0.0%) | 0 (0.0%) |
| Construction & Extraction | 60 (100.0%) | 0 (0.0%) |
| Installation, Maintenance & Repair | 38 (80.8%) | 9 (19.2%) |
| Total (Category) | 98 (91.6%) | 9 (8.4%) |
| Total (Overall) | 970 (49.7%) | 982 (50.3%) |
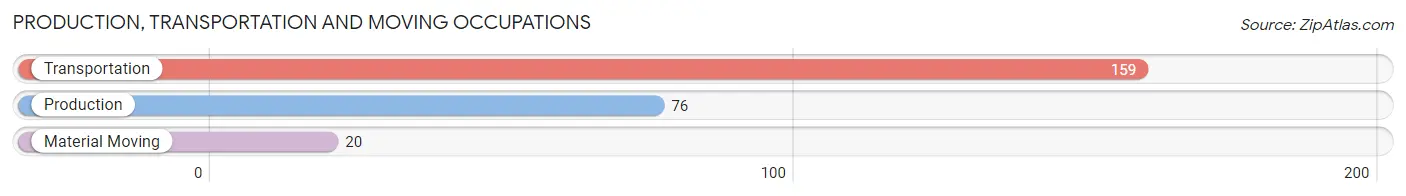
Production, Transportation and Moving Occupations
The most common Production, Transportation and Moving occupations in Bluefield are Transportation (159 | 8.2%), Production (76 | 3.9%), and Material Moving (20 | 1.0%).
Production, Transportation and Moving Occupations by Sex
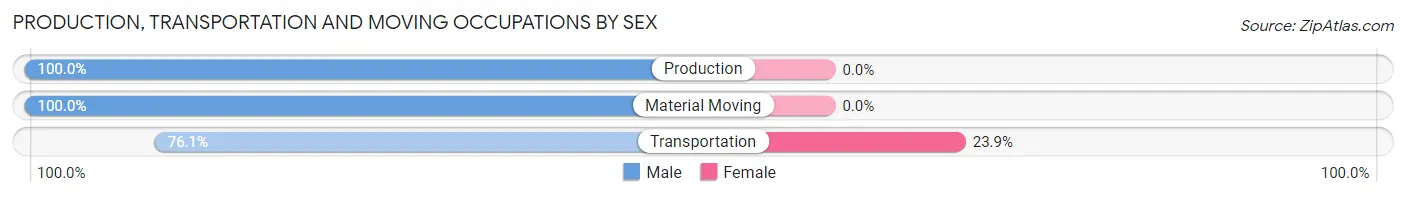
| Occupation | Male | Female |
| Production | 76 (100.0%) | 0 (0.0%) |
| Transportation | 121 (76.1%) | 38 (23.9%) |
| Material Moving | 20 (100.0%) | 0 (0.0%) |
| Total (Category) | 217 (85.1%) | 38 (14.9%) |
| Total (Overall) | 970 (49.7%) | 982 (50.3%) |
Employment Industries by Sex in Bluefield
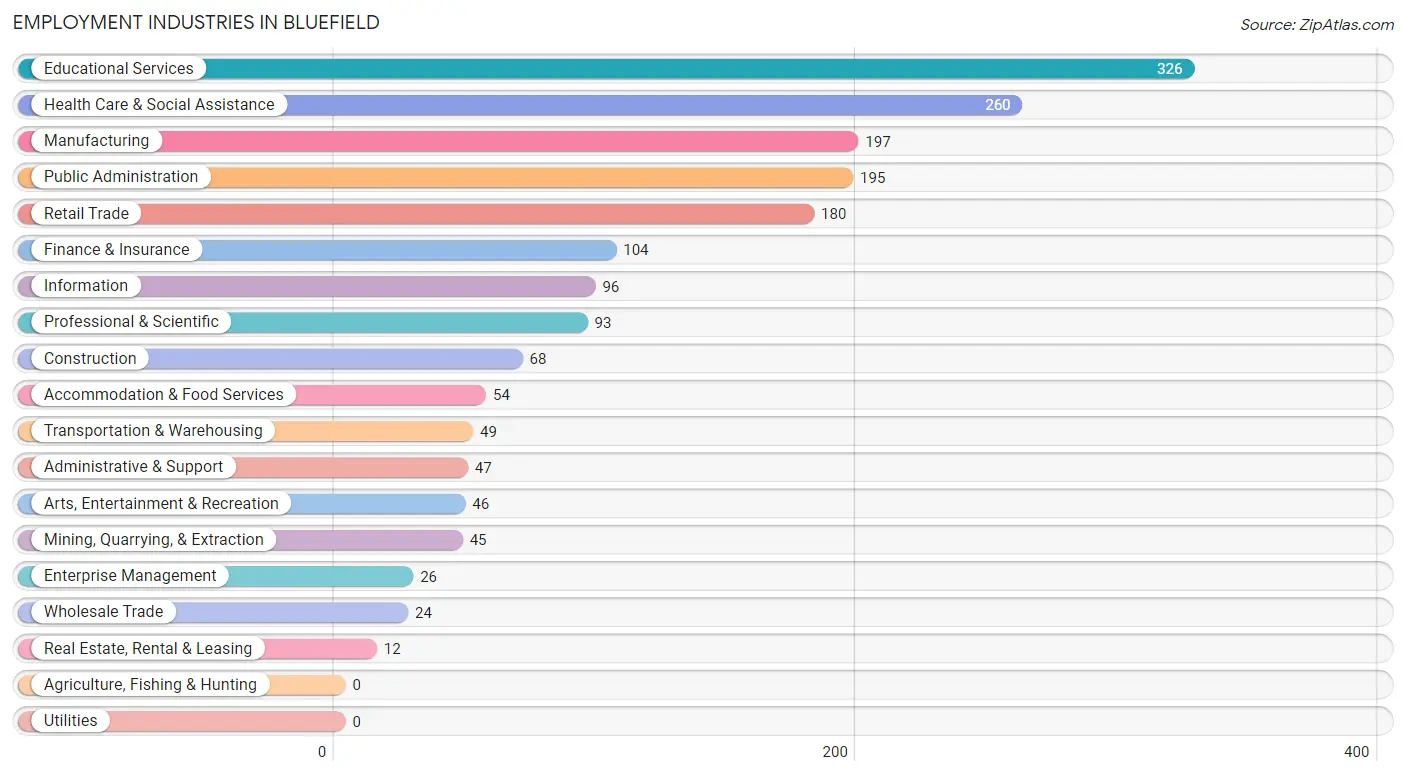
Employment Industries in Bluefield
The major employment industries in Bluefield include Educational Services (326 | 16.7%), Health Care & Social Assistance (260 | 13.3%), Manufacturing (197 | 10.1%), Public Administration (195 | 10.0%), and Retail Trade (180 | 9.2%).
Employment Industries by Sex in Bluefield
The Bluefield industries that see more men than women are Mining, Quarrying, & Extraction (100.0%), Construction (100.0%), and Transportation & Warehousing (100.0%), whereas the industries that tend to have a higher number of women are Real Estate, Rental & Leasing (100.0%), Arts, Entertainment & Recreation (97.8%), and Health Care & Social Assistance (85.0%).
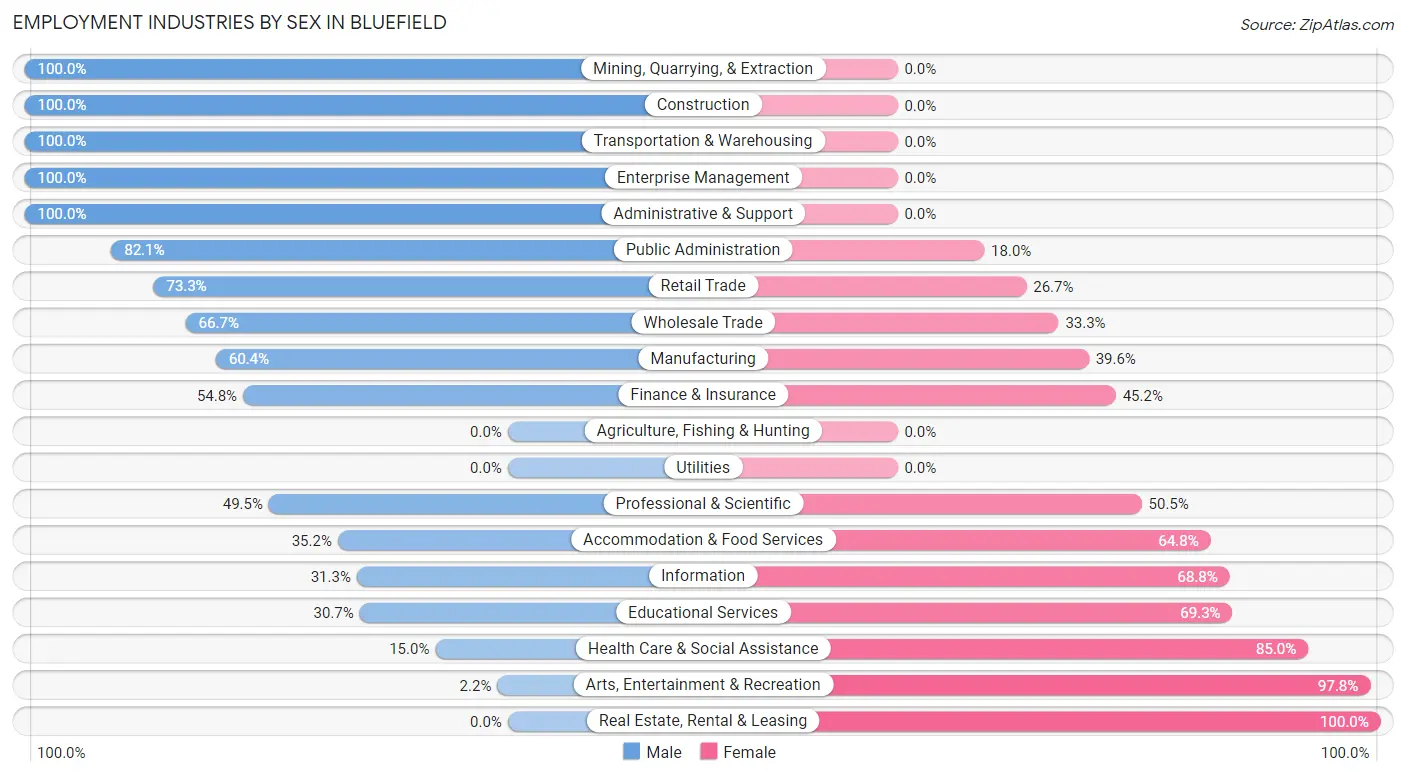
| Industry | Male | Female |
| Agriculture, Fishing & Hunting | 0 (0.0%) | 0 (0.0%) |
| Mining, Quarrying, & Extraction | 45 (100.0%) | 0 (0.0%) |
| Construction | 68 (100.0%) | 0 (0.0%) |
| Manufacturing | 119 (60.4%) | 78 (39.6%) |
| Wholesale Trade | 16 (66.7%) | 8 (33.3%) |
| Retail Trade | 132 (73.3%) | 48 (26.7%) |
| Transportation & Warehousing | 49 (100.0%) | 0 (0.0%) |
| Utilities | 0 (0.0%) | 0 (0.0%) |
| Information | 30 (31.2%) | 66 (68.8%) |
| Finance & Insurance | 57 (54.8%) | 47 (45.2%) |
| Real Estate, Rental & Leasing | 0 (0.0%) | 12 (100.0%) |
| Professional & Scientific | 46 (49.5%) | 47 (50.5%) |
| Enterprise Management | 26 (100.0%) | 0 (0.0%) |
| Administrative & Support | 47 (100.0%) | 0 (0.0%) |
| Educational Services | 100 (30.7%) | 226 (69.3%) |
| Health Care & Social Assistance | 39 (15.0%) | 221 (85.0%) |
| Arts, Entertainment & Recreation | 1 (2.2%) | 45 (97.8%) |
| Accommodation & Food Services | 19 (35.2%) | 35 (64.8%) |
| Public Administration | 160 (82.1%) | 35 (17.9%) |
| Total | 970 (49.7%) | 982 (50.3%) |
Education in Bluefield
School Enrollment in Bluefield
The most common levels of schooling among the 1,179 students in Bluefield are college / undergraduate (394 | 33.4%), elementary school (262 | 22.2%), and middle school (219 | 18.6%).
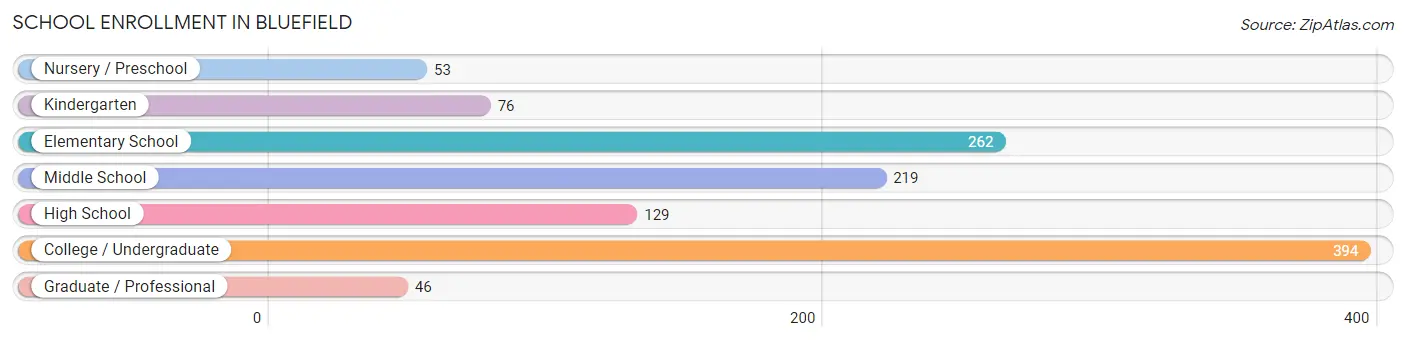
| School Level | # Students | % Students |
| Nursery / Preschool | 53 | 4.5% |
| Kindergarten | 76 | 6.5% |
| Elementary School | 262 | 22.2% |
| Middle School | 219 | 18.6% |
| High School | 129 | 10.9% |
| College / Undergraduate | 394 | 33.4% |
| Graduate / Professional | 46 | 3.9% |
| Total | 1,179 | 100.0% |
School Enrollment by Age by Funding Source in Bluefield
Out of a total of 1,179 students who are enrolled in schools in Bluefield, 380 (32.2%) attend a private institution, while the remaining 799 (67.8%) are enrolled in public schools. The age group of 35 years and over has the highest likelihood of being enrolled in private schools, with 46 (100.0% in the age bracket) enrolled. Conversely, the age group of 15 to 17 year olds has the lowest likelihood of being enrolled in a private school, with 132 (100.0% in the age bracket) attending a public institution.
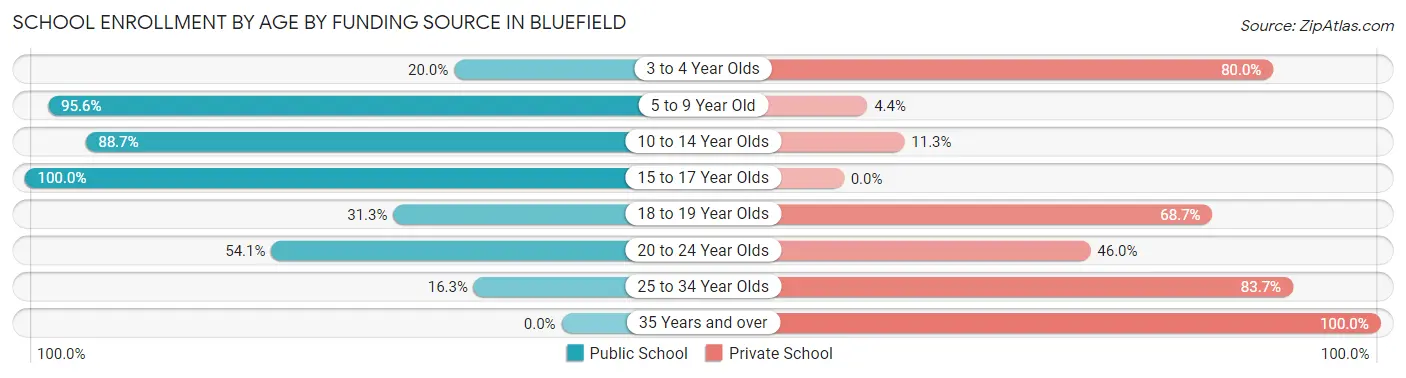
| Age Bracket | Public School | Private School |
| 3 to 4 Year Olds | 8 (20.0%) | 32 (80.0%) |
| 5 to 9 Year Old | 283 (95.6%) | 13 (4.4%) |
| 10 to 14 Year Olds | 243 (88.7%) | 31 (11.3%) |
| 15 to 17 Year Olds | 132 (100.0%) | 0 (0.0%) |
| 18 to 19 Year Olds | 57 (31.3%) | 125 (68.7%) |
| 20 to 24 Year Olds | 60 (54.0%) | 51 (46.0%) |
| 25 to 34 Year Olds | 16 (16.3%) | 82 (83.7%) |
| 35 Years and over | 0 (0.0%) | 46 (100.0%) |
| Total | 799 (67.8%) | 380 (32.2%) |
Educational Attainment by Field of Study in Bluefield
Business (187 | 17.8%), education (160 | 15.2%), computers & mathematics (108 | 10.3%), science & technology (107 | 10.2%), and visual & performing arts (71 | 6.8%) are the most common fields of study among 1,051 individuals in Bluefield who have obtained a bachelor's degree or higher.
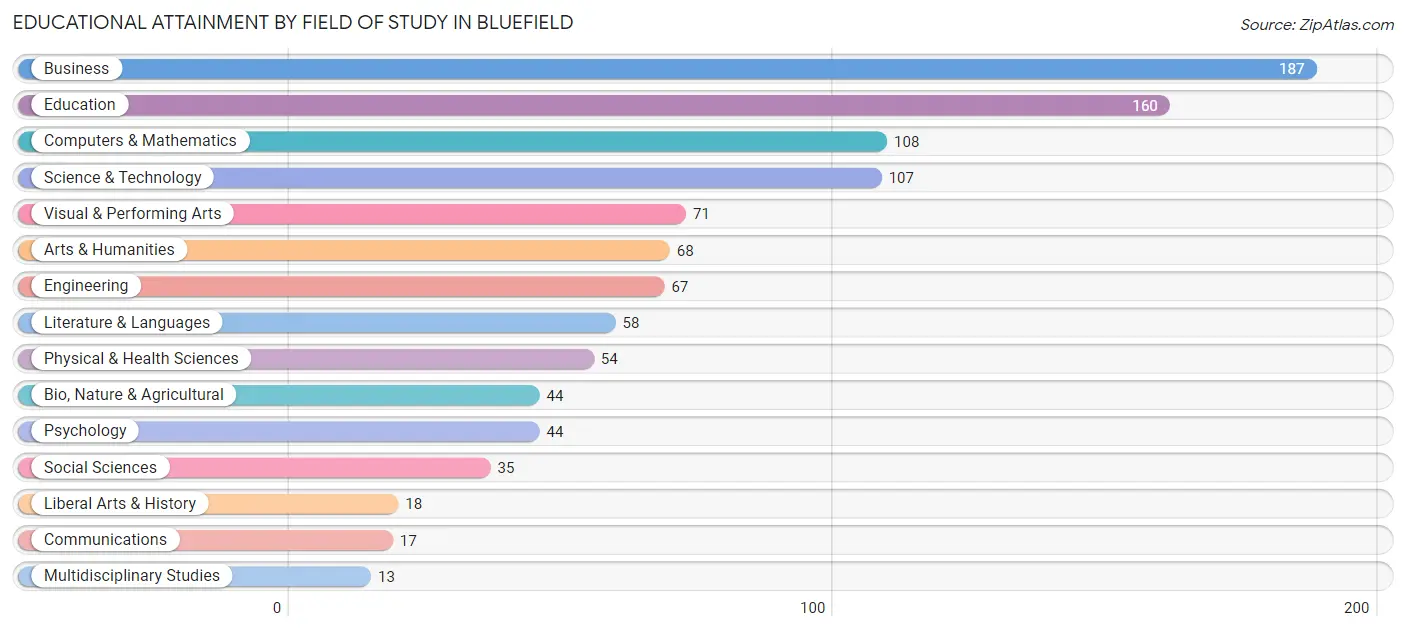
| Field of Study | # Graduates | % Graduates |
| Computers & Mathematics | 108 | 10.3% |
| Bio, Nature & Agricultural | 44 | 4.2% |
| Physical & Health Sciences | 54 | 5.1% |
| Psychology | 44 | 4.2% |
| Social Sciences | 35 | 3.3% |
| Engineering | 67 | 6.4% |
| Multidisciplinary Studies | 13 | 1.2% |
| Science & Technology | 107 | 10.2% |
| Business | 187 | 17.8% |
| Education | 160 | 15.2% |
| Literature & Languages | 58 | 5.5% |
| Liberal Arts & History | 18 | 1.7% |
| Visual & Performing Arts | 71 | 6.8% |
| Communications | 17 | 1.6% |
| Arts & Humanities | 68 | 6.5% |
| Total | 1,051 | 100.0% |
Transportation & Commute in Bluefield
Vehicle Availability by Sex in Bluefield
The most prevalent vehicle ownership categories in Bluefield are males with 2 vehicles (472, accounting for 50.4%) and females with 2 vehicles (301, making up 51.4%).
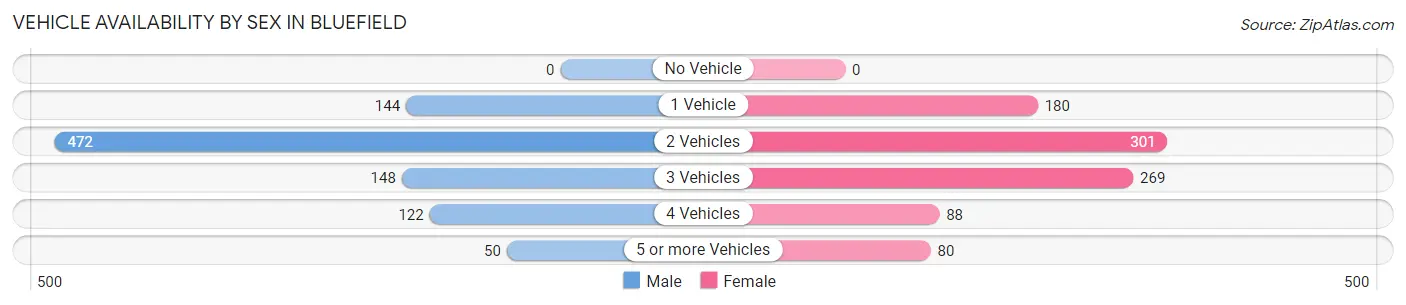
| Vehicles Available | Male | Female |
| No Vehicle | 0 (0.0%) | 0 (0.0%) |
| 1 Vehicle | 144 (15.4%) | 180 (19.6%) |
| 2 Vehicles | 472 (50.4%) | 301 (32.8%) |
| 3 Vehicles | 148 (15.8%) | 269 (29.3%) |
| 4 Vehicles | 122 (13.0%) | 88 (9.6%) |
| 5 or more Vehicles | 50 (5.3%) | 80 (8.7%) |
| Total | 936 (100.0%) | 918 (100.0%) |
Commute Time in Bluefield
The most frequently occuring commute durations in Bluefield are 10 to 14 minutes (414 commuters, 24.1%), 15 to 19 minutes (307 commuters, 17.8%), and 5 to 9 minutes (296 commuters, 17.2%).
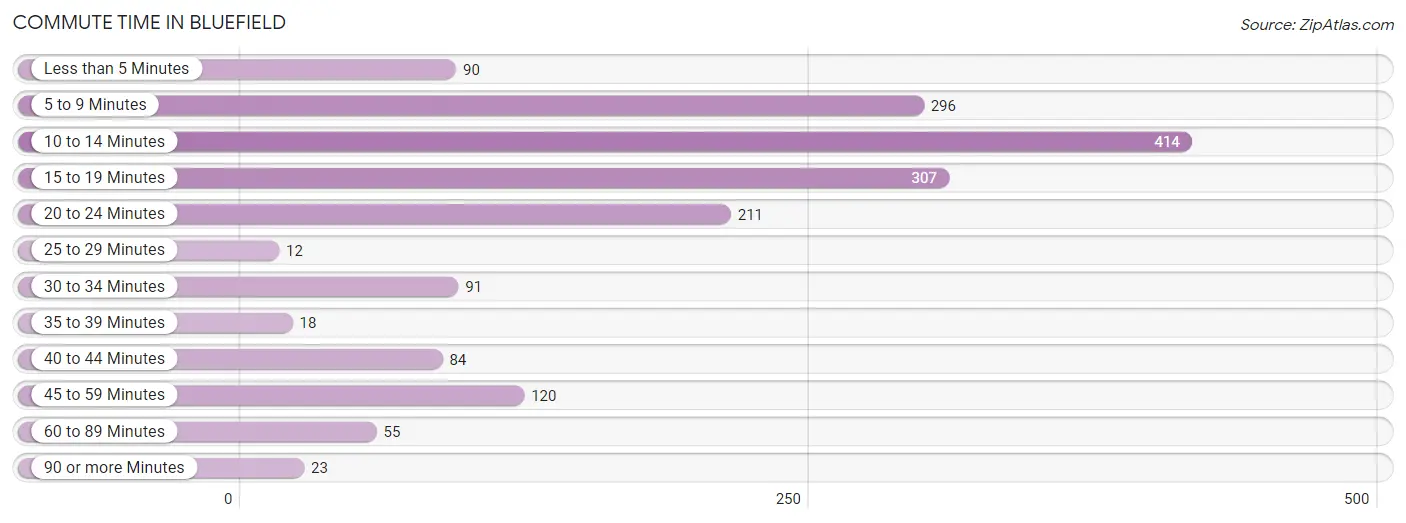
| Commute Time | # Commuters | % Commuters |
| Less than 5 Minutes | 90 | 5.2% |
| 5 to 9 Minutes | 296 | 17.2% |
| 10 to 14 Minutes | 414 | 24.1% |
| 15 to 19 Minutes | 307 | 17.8% |
| 20 to 24 Minutes | 211 | 12.3% |
| 25 to 29 Minutes | 12 | 0.7% |
| 30 to 34 Minutes | 91 | 5.3% |
| 35 to 39 Minutes | 18 | 1.1% |
| 40 to 44 Minutes | 84 | 4.9% |
| 45 to 59 Minutes | 120 | 7.0% |
| 60 to 89 Minutes | 55 | 3.2% |
| 90 or more Minutes | 23 | 1.3% |
Commute Time by Sex in Bluefield
The most common commute times in Bluefield are 15 to 19 minutes (178 commuters, 19.7%) for males and 10 to 14 minutes (275 commuters, 33.6%) for females.
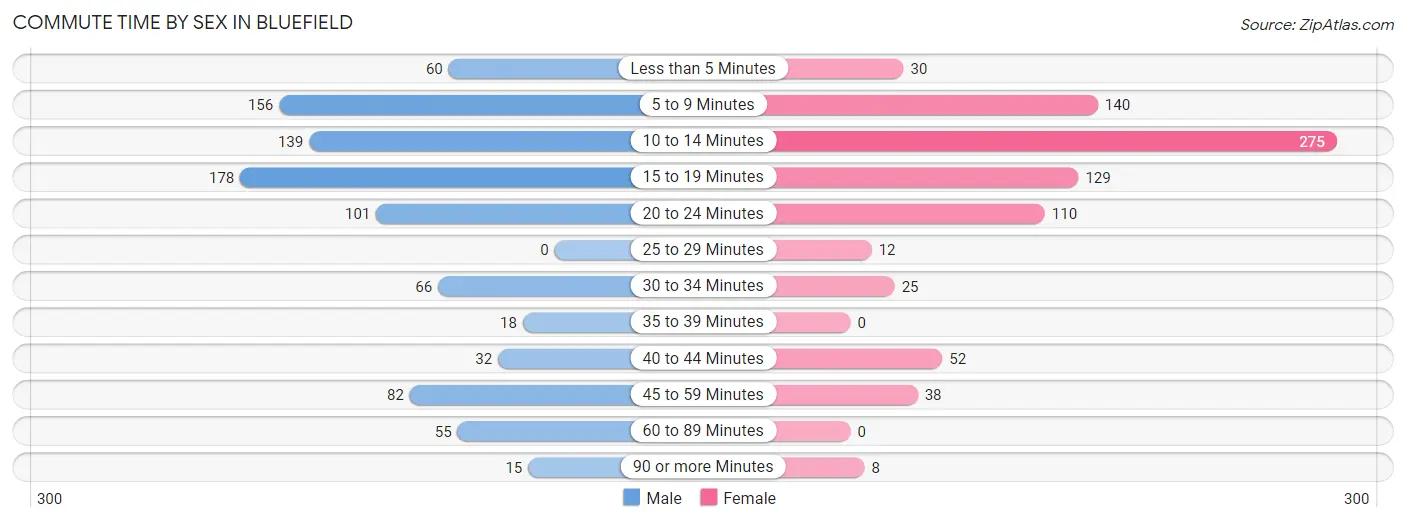
| Commute Time | Male | Female |
| Less than 5 Minutes | 60 (6.7%) | 30 (3.7%) |
| 5 to 9 Minutes | 156 (17.3%) | 140 (17.1%) |
| 10 to 14 Minutes | 139 (15.4%) | 275 (33.6%) |
| 15 to 19 Minutes | 178 (19.7%) | 129 (15.8%) |
| 20 to 24 Minutes | 101 (11.2%) | 110 (13.4%) |
| 25 to 29 Minutes | 0 (0.0%) | 12 (1.5%) |
| 30 to 34 Minutes | 66 (7.3%) | 25 (3.0%) |
| 35 to 39 Minutes | 18 (2.0%) | 0 (0.0%) |
| 40 to 44 Minutes | 32 (3.5%) | 52 (6.4%) |
| 45 to 59 Minutes | 82 (9.1%) | 38 (4.6%) |
| 60 to 89 Minutes | 55 (6.1%) | 0 (0.0%) |
| 90 or more Minutes | 15 (1.7%) | 8 (1.0%) |
Time of Departure to Work by Sex in Bluefield
The most frequent times of departure to work in Bluefield are 7:00 AM to 7:29 AM (204, 22.6%) for males and 7:30 AM to 7:59 AM (232, 28.3%) for females.
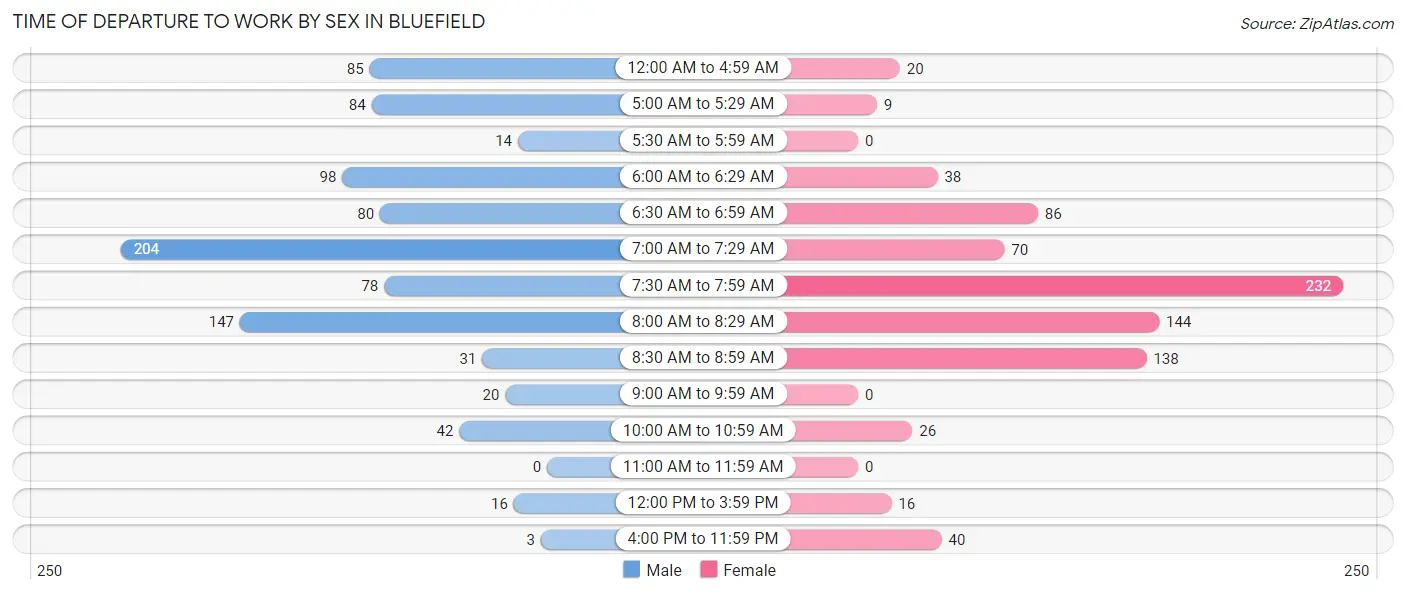
| Time of Departure | Male | Female |
| 12:00 AM to 4:59 AM | 85 (9.4%) | 20 (2.4%) |
| 5:00 AM to 5:29 AM | 84 (9.3%) | 9 (1.1%) |
| 5:30 AM to 5:59 AM | 14 (1.5%) | 0 (0.0%) |
| 6:00 AM to 6:29 AM | 98 (10.9%) | 38 (4.6%) |
| 6:30 AM to 6:59 AM | 80 (8.9%) | 86 (10.5%) |
| 7:00 AM to 7:29 AM | 204 (22.6%) | 70 (8.6%) |
| 7:30 AM to 7:59 AM | 78 (8.6%) | 232 (28.3%) |
| 8:00 AM to 8:29 AM | 147 (16.3%) | 144 (17.6%) |
| 8:30 AM to 8:59 AM | 31 (3.4%) | 138 (16.9%) |
| 9:00 AM to 9:59 AM | 20 (2.2%) | 0 (0.0%) |
| 10:00 AM to 10:59 AM | 42 (4.7%) | 26 (3.2%) |
| 11:00 AM to 11:59 AM | 0 (0.0%) | 0 (0.0%) |
| 12:00 PM to 3:59 PM | 16 (1.8%) | 16 (1.9%) |
| 4:00 PM to 11:59 PM | 3 (0.3%) | 40 (4.9%) |
| Total | 902 (100.0%) | 819 (100.0%) |
Housing Occupancy in Bluefield
Occupancy by Ownership in Bluefield
Of the total 2,059 dwellings in Bluefield, owner-occupied units account for 1,435 (69.7%), while renter-occupied units make up 624 (30.3%).
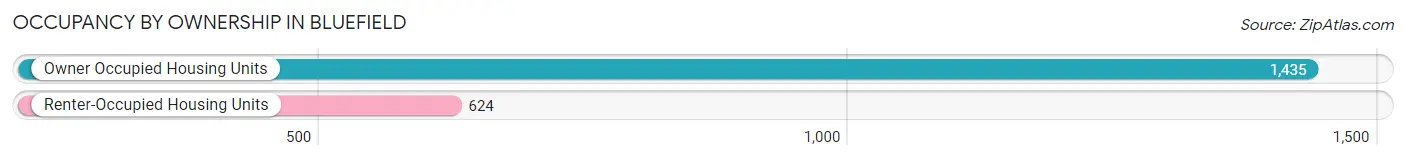
| Occupancy | # Housing Units | % Housing Units |
| Owner Occupied Housing Units | 1,435 | 69.7% |
| Renter-Occupied Housing Units | 624 | 30.3% |
| Total Occupied Housing Units | 2,059 | 100.0% |
Occupancy by Household Size in Bluefield
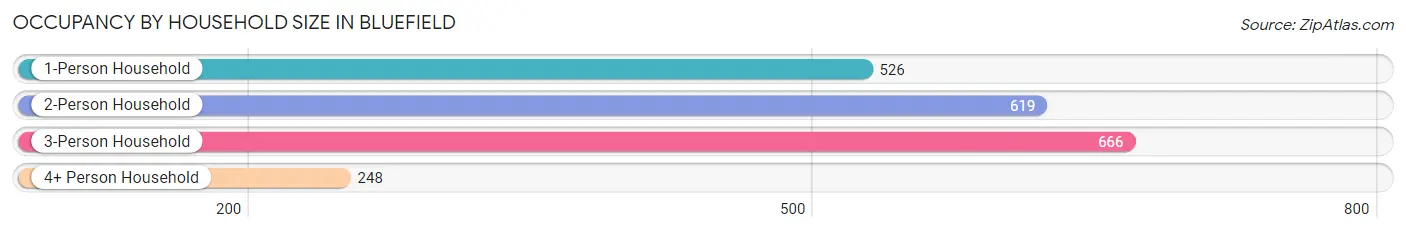
| Household Size | # Housing Units | % Housing Units |
| 1-Person Household | 526 | 25.6% |
| 2-Person Household | 619 | 30.1% |
| 3-Person Household | 666 | 32.4% |
| 4+ Person Household | 248 | 12.0% |
| Total Housing Units | 2,059 | 100.0% |
Occupancy by Ownership by Household Size in Bluefield
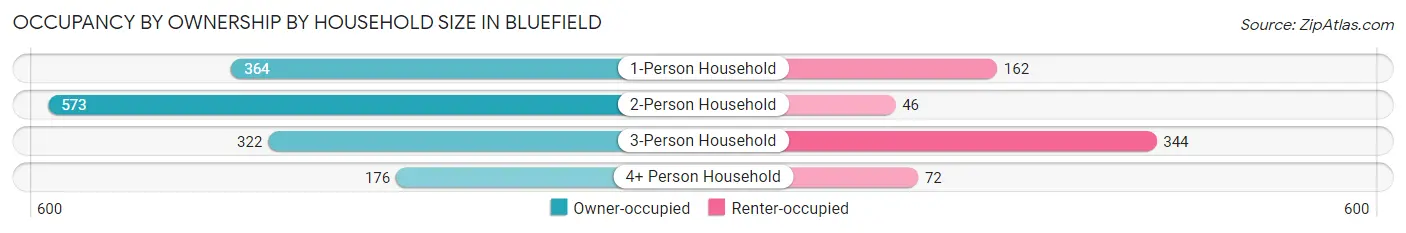
| Household Size | Owner-occupied | Renter-occupied |
| 1-Person Household | 364 (69.2%) | 162 (30.8%) |
| 2-Person Household | 573 (92.6%) | 46 (7.4%) |
| 3-Person Household | 322 (48.3%) | 344 (51.6%) |
| 4+ Person Household | 176 (71.0%) | 72 (29.0%) |
| Total Housing Units | 1,435 (69.7%) | 624 (30.3%) |
Occupancy by Educational Attainment in Bluefield
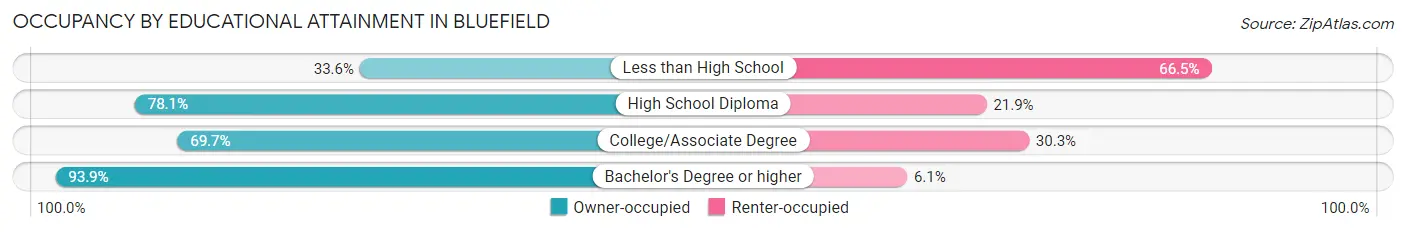
| Household Size | Owner-occupied | Renter-occupied |
| Less than High School | 153 (33.6%) | 303 (66.4%) |
| High School Diploma | 386 (78.1%) | 108 (21.9%) |
| College/Associate Degree | 419 (69.7%) | 182 (30.3%) |
| Bachelor's Degree or higher | 477 (93.9%) | 31 (6.1%) |
Occupancy by Age of Householder in Bluefield
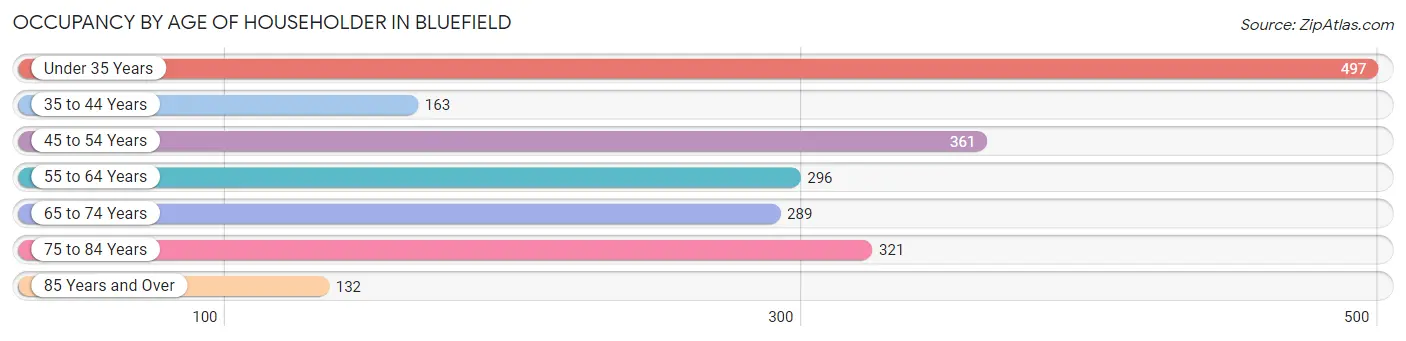
| Age Bracket | # Households | % Households |
| Under 35 Years | 497 | 24.1% |
| 35 to 44 Years | 163 | 7.9% |
| 45 to 54 Years | 361 | 17.5% |
| 55 to 64 Years | 296 | 14.4% |
| 65 to 74 Years | 289 | 14.0% |
| 75 to 84 Years | 321 | 15.6% |
| 85 Years and Over | 132 | 6.4% |
| Total | 2,059 | 100.0% |
Housing Finances in Bluefield
Median Income by Occupancy in Bluefield
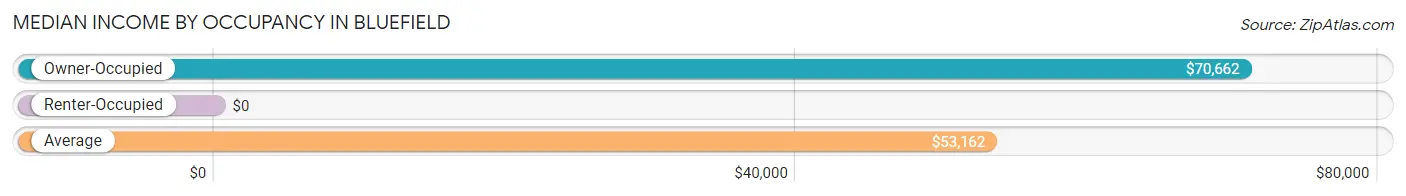
| Occupancy Type | # Households | Median Income |
| Owner-Occupied | 1,435 (69.7%) | $70,662 |
| Renter-Occupied | 624 (30.3%) | $0 |
| Average | 2,059 (100.0%) | $53,162 |
Occupancy by Householder Income Bracket in Bluefield
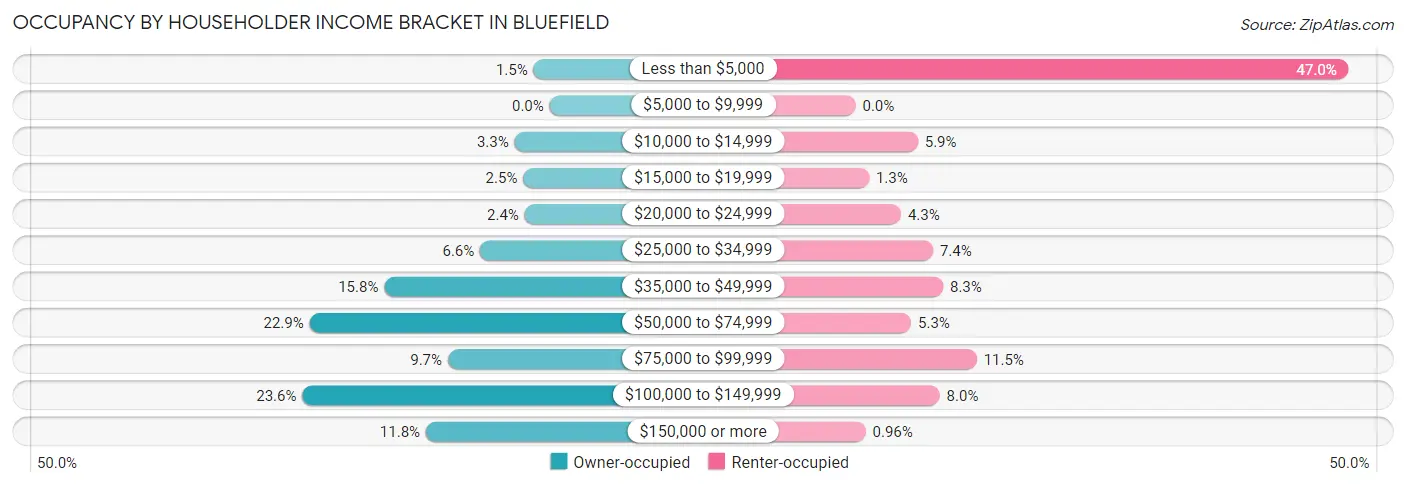
| Income Bracket | Owner-occupied | Renter-occupied |
| Less than $5,000 | 22 (1.5%) | 293 (47.0%) |
| $5,000 to $9,999 | 0 (0.0%) | 0 (0.0%) |
| $10,000 to $14,999 | 48 (3.3%) | 37 (5.9%) |
| $15,000 to $19,999 | 36 (2.5%) | 8 (1.3%) |
| $20,000 to $24,999 | 34 (2.4%) | 27 (4.3%) |
| $25,000 to $34,999 | 95 (6.6%) | 46 (7.4%) |
| $35,000 to $49,999 | 226 (15.8%) | 52 (8.3%) |
| $50,000 to $74,999 | 328 (22.9%) | 33 (5.3%) |
| $75,000 to $99,999 | 139 (9.7%) | 72 (11.5%) |
| $100,000 to $149,999 | 338 (23.5%) | 50 (8.0%) |
| $150,000 or more | 169 (11.8%) | 6 (1.0%) |
| Total | 1,435 (100.0%) | 624 (100.0%) |
Monthly Housing Cost Tiers in Bluefield
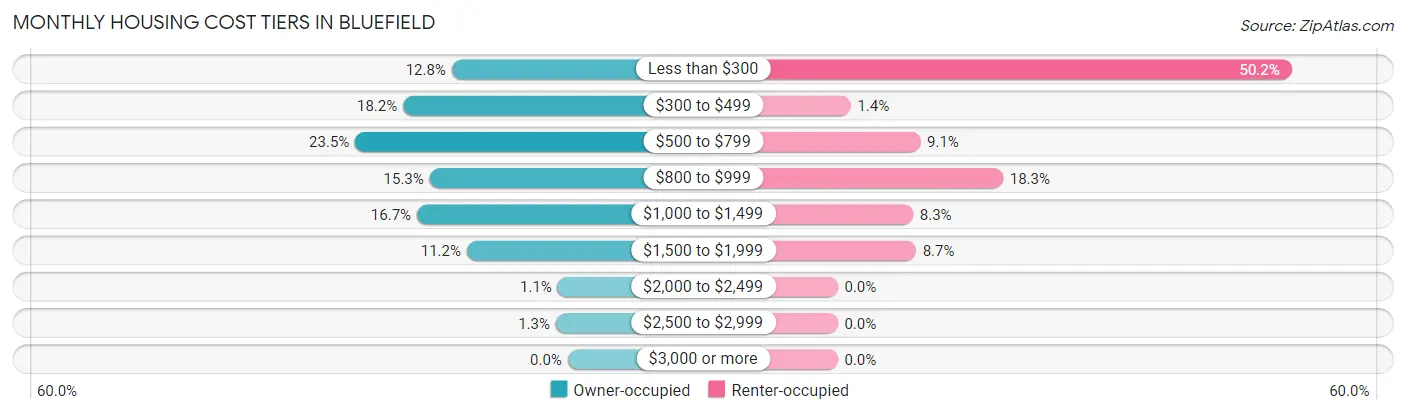
| Monthly Cost | Owner-occupied | Renter-occupied |
| Less than $300 | 184 (12.8%) | 313 (50.2%) |
| $300 to $499 | 261 (18.2%) | 9 (1.4%) |
| $500 to $799 | 337 (23.5%) | 57 (9.1%) |
| $800 to $999 | 219 (15.3%) | 114 (18.3%) |
| $1,000 to $1,499 | 239 (16.7%) | 52 (8.3%) |
| $1,500 to $1,999 | 160 (11.2%) | 54 (8.6%) |
| $2,000 to $2,499 | 16 (1.1%) | 0 (0.0%) |
| $2,500 to $2,999 | 19 (1.3%) | 0 (0.0%) |
| $3,000 or more | 0 (0.0%) | 0 (0.0%) |
| Total | 1,435 (100.0%) | 624 (100.0%) |
Physical Housing Characteristics in Bluefield
Housing Structures in Bluefield
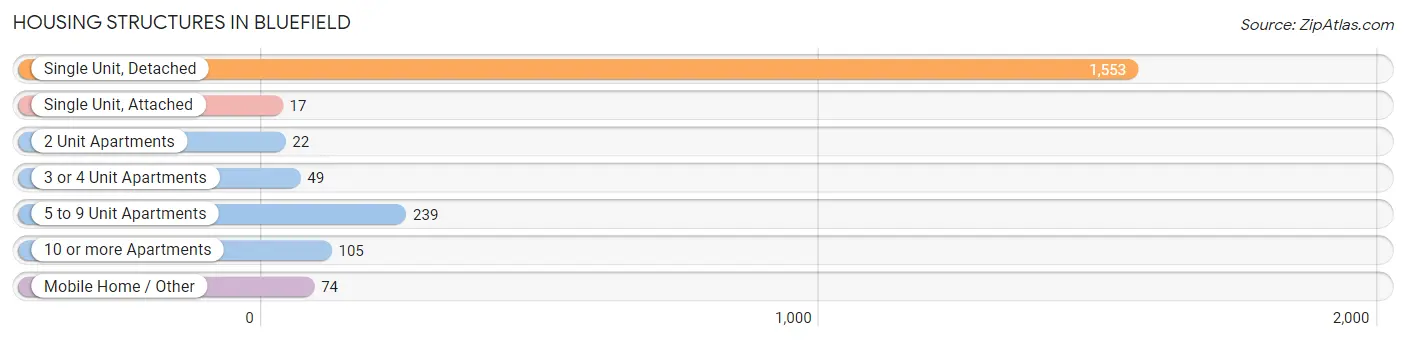
| Structure Type | # Housing Units | % Housing Units |
| Single Unit, Detached | 1,553 | 75.4% |
| Single Unit, Attached | 17 | 0.8% |
| 2 Unit Apartments | 22 | 1.1% |
| 3 or 4 Unit Apartments | 49 | 2.4% |
| 5 to 9 Unit Apartments | 239 | 11.6% |
| 10 or more Apartments | 105 | 5.1% |
| Mobile Home / Other | 74 | 3.6% |
| Total | 2,059 | 100.0% |
Housing Structures by Occupancy in Bluefield
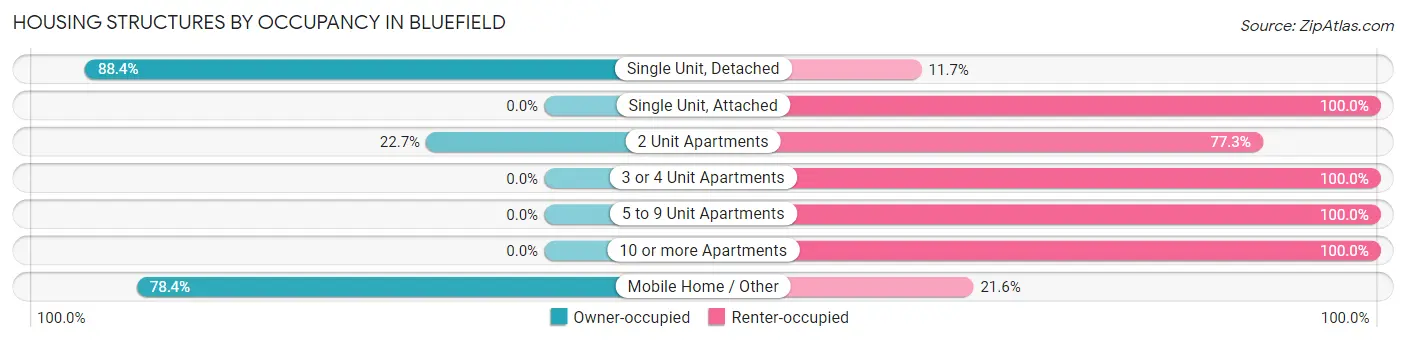
| Structure Type | Owner-occupied | Renter-occupied |
| Single Unit, Detached | 1,372 (88.3%) | 181 (11.7%) |
| Single Unit, Attached | 0 (0.0%) | 17 (100.0%) |
| 2 Unit Apartments | 5 (22.7%) | 17 (77.3%) |
| 3 or 4 Unit Apartments | 0 (0.0%) | 49 (100.0%) |
| 5 to 9 Unit Apartments | 0 (0.0%) | 239 (100.0%) |
| 10 or more Apartments | 0 (0.0%) | 105 (100.0%) |
| Mobile Home / Other | 58 (78.4%) | 16 (21.6%) |
| Total | 1,435 (69.7%) | 624 (30.3%) |
Housing Structures by Number of Rooms in Bluefield
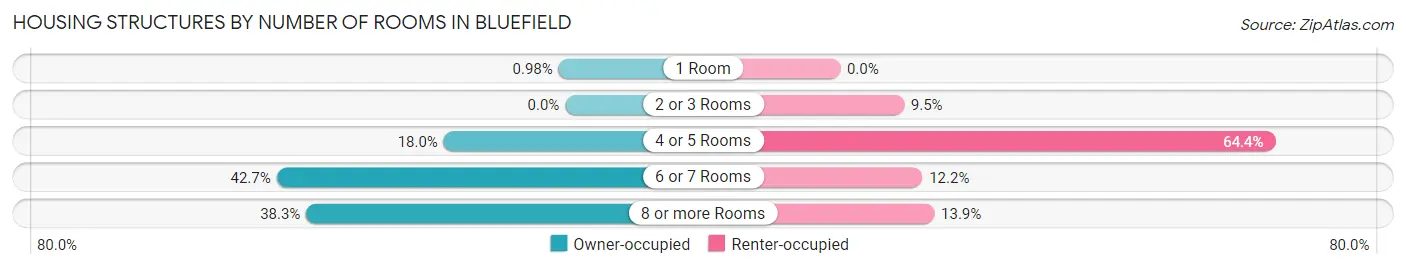
| Number of Rooms | Owner-occupied | Renter-occupied |
| 1 Room | 14 (1.0%) | 0 (0.0%) |
| 2 or 3 Rooms | 0 (0.0%) | 59 (9.5%) |
| 4 or 5 Rooms | 258 (18.0%) | 402 (64.4%) |
| 6 or 7 Rooms | 613 (42.7%) | 76 (12.2%) |
| 8 or more Rooms | 550 (38.3%) | 87 (13.9%) |
| Total | 1,435 (100.0%) | 624 (100.0%) |
Housing Structure by Heating Type in Bluefield
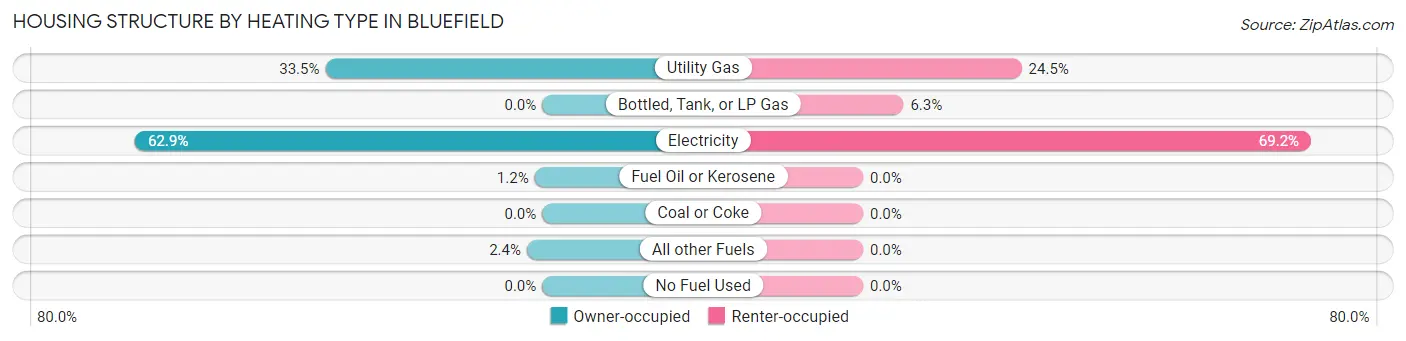
| Heating Type | Owner-occupied | Renter-occupied |
| Utility Gas | 481 (33.5%) | 153 (24.5%) |
| Bottled, Tank, or LP Gas | 0 (0.0%) | 39 (6.2%) |
| Electricity | 903 (62.9%) | 432 (69.2%) |
| Fuel Oil or Kerosene | 17 (1.2%) | 0 (0.0%) |
| Coal or Coke | 0 (0.0%) | 0 (0.0%) |
| All other Fuels | 34 (2.4%) | 0 (0.0%) |
| No Fuel Used | 0 (0.0%) | 0 (0.0%) |
| Total | 1,435 (100.0%) | 624 (100.0%) |
Household Vehicle Usage in Bluefield
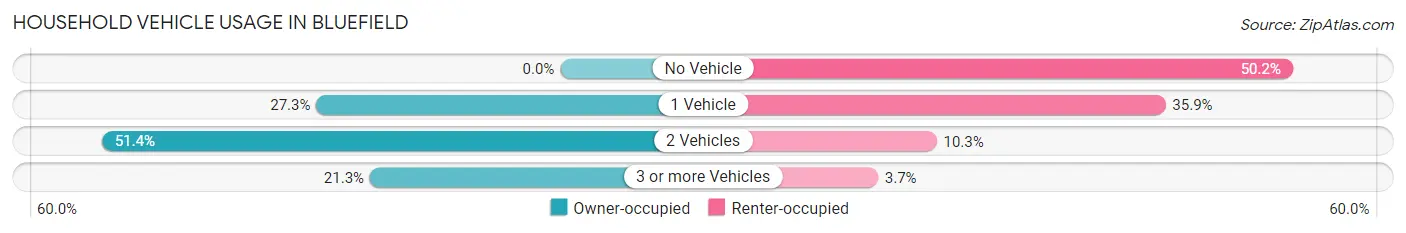
| Vehicles per Household | Owner-occupied | Renter-occupied |
| No Vehicle | 0 (0.0%) | 313 (50.2%) |
| 1 Vehicle | 392 (27.3%) | 224 (35.9%) |
| 2 Vehicles | 737 (51.4%) | 64 (10.3%) |
| 3 or more Vehicles | 306 (21.3%) | 23 (3.7%) |
| Total | 1,435 (100.0%) | 624 (100.0%) |
Real Estate & Mortgages in Bluefield
Real Estate and Mortgage Overview in Bluefield
| Characteristic | Without Mortgage | With Mortgage |
| Housing Units | 695 | 740 |
| Median Property Value | $127,400 | $139,900 |
| Median Household Income | $57,770 | $124 |
| Monthly Housing Costs | $430 | $0 |
| Real Estate Taxes | $774 | $27 |
Property Value by Mortgage Status in Bluefield
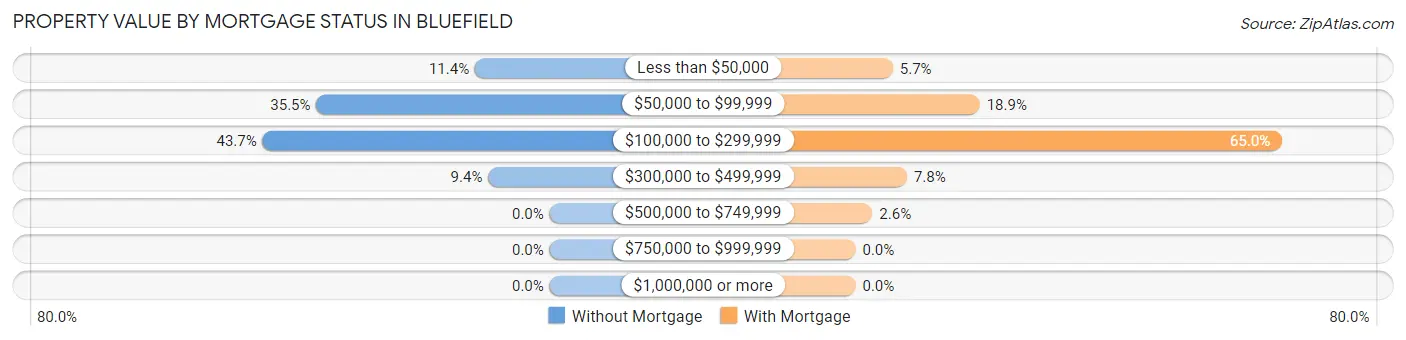
| Property Value | Without Mortgage | With Mortgage |
| Less than $50,000 | 79 (11.4%) | 42 (5.7%) |
| $50,000 to $99,999 | 247 (35.5%) | 140 (18.9%) |
| $100,000 to $299,999 | 304 (43.7%) | 481 (65.0%) |
| $300,000 to $499,999 | 65 (9.3%) | 58 (7.8%) |
| $500,000 to $749,999 | 0 (0.0%) | 19 (2.6%) |
| $750,000 to $999,999 | 0 (0.0%) | 0 (0.0%) |
| $1,000,000 or more | 0 (0.0%) | 0 (0.0%) |
| Total | 695 (100.0%) | 740 (100.0%) |
Household Income by Mortgage Status in Bluefield
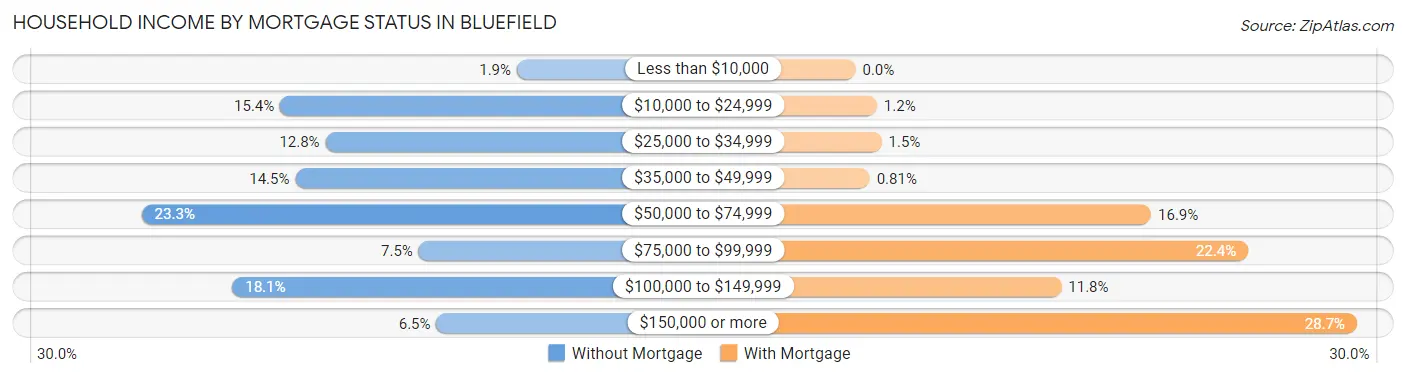
| Household Income | Without Mortgage | With Mortgage |
| Less than $10,000 | 13 (1.9%) | 0 (0.0%) |
| $10,000 to $24,999 | 107 (15.4%) | 9 (1.2%) |
| $25,000 to $34,999 | 89 (12.8%) | 11 (1.5%) |
| $35,000 to $49,999 | 101 (14.5%) | 6 (0.8%) |
| $50,000 to $74,999 | 162 (23.3%) | 125 (16.9%) |
| $75,000 to $99,999 | 52 (7.5%) | 166 (22.4%) |
| $100,000 to $149,999 | 126 (18.1%) | 87 (11.8%) |
| $150,000 or more | 45 (6.5%) | 212 (28.6%) |
| Total | 695 (100.0%) | 740 (100.0%) |
Property Value to Household Income Ratio in Bluefield
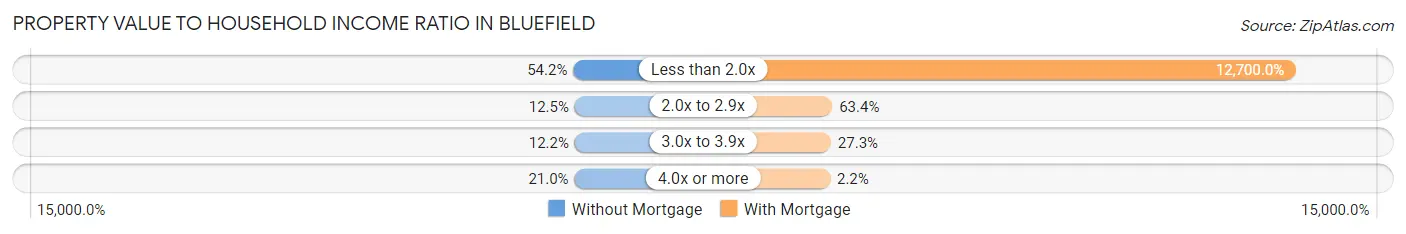
| Value-to-Income Ratio | Without Mortgage | With Mortgage |
| Less than 2.0x | 377 (54.2%) | 93,980 (12,700.0%) |
| 2.0x to 2.9x | 87 (12.5%) | 469 (63.4%) |
| 3.0x to 3.9x | 85 (12.2%) | 202 (27.3%) |
| 4.0x or more | 146 (21.0%) | 16 (2.2%) |
| Total | 695 (100.0%) | 740 (100.0%) |
Real Estate Taxes by Mortgage Status in Bluefield
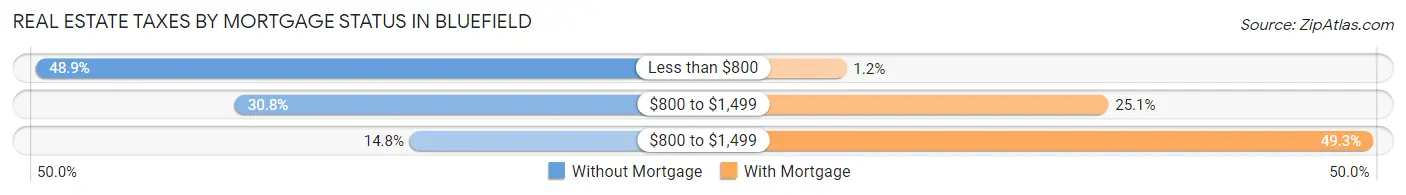
| Property Taxes | Without Mortgage | With Mortgage |
| Less than $800 | 340 (48.9%) | 9 (1.2%) |
| $800 to $1,499 | 214 (30.8%) | 186 (25.1%) |
| $800 to $1,499 | 103 (14.8%) | 365 (49.3%) |
| Total | 695 (100.0%) | 740 (100.0%) |
Health & Disability in Bluefield
Health Insurance Coverage by Age in Bluefield
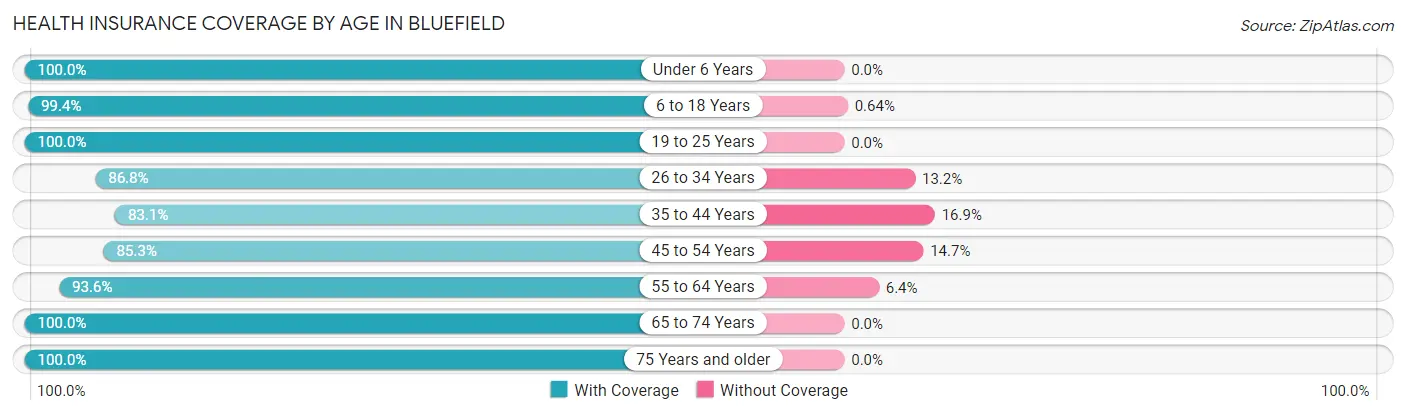
| Age Bracket | With Coverage | Without Coverage |
| Under 6 Years | 459 (100.0%) | 0 (0.0%) |
| 6 to 18 Years | 772 (99.4%) | 5 (0.6%) |
| 19 to 25 Years | 675 (100.0%) | 0 (0.0%) |
| 26 to 34 Years | 395 (86.8%) | 60 (13.2%) |
| 35 to 44 Years | 291 (83.1%) | 59 (16.9%) |
| 45 to 54 Years | 539 (85.3%) | 93 (14.7%) |
| 55 to 64 Years | 495 (93.6%) | 34 (6.4%) |
| 65 to 74 Years | 398 (100.0%) | 0 (0.0%) |
| 75 Years and older | 705 (100.0%) | 0 (0.0%) |
| Total | 4,729 (95.0%) | 251 (5.0%) |
Health Insurance Coverage by Citizenship Status in Bluefield
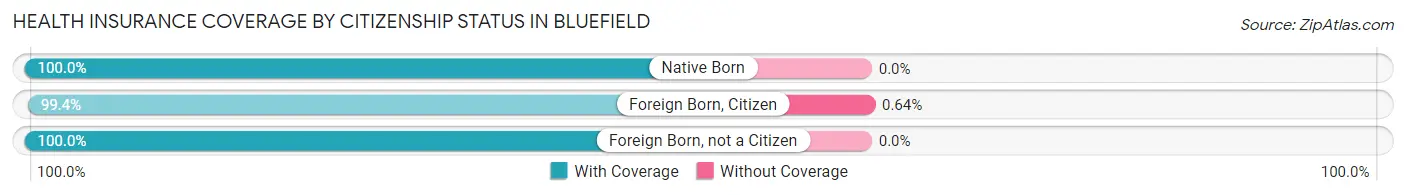
| Citizenship Status | With Coverage | Without Coverage |
| Native Born | 459 (100.0%) | 0 (0.0%) |
| Foreign Born, Citizen | 772 (99.4%) | 5 (0.6%) |
| Foreign Born, not a Citizen | 675 (100.0%) | 0 (0.0%) |
Health Insurance Coverage by Household Income in Bluefield
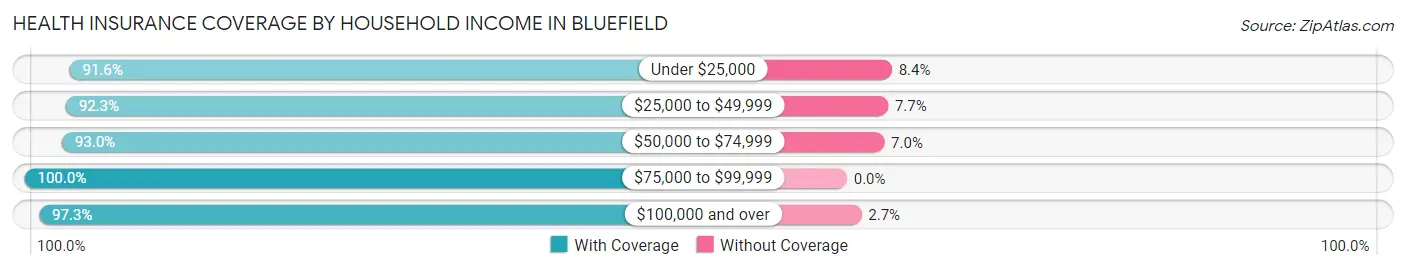
| Household Income | With Coverage | Without Coverage |
| Under $25,000 | 805 (91.6%) | 74 (8.4%) |
| $25,000 to $49,999 | 921 (92.3%) | 77 (7.7%) |
| $50,000 to $74,999 | 678 (93.0%) | 51 (7.0%) |
| $75,000 to $99,999 | 488 (100.0%) | 0 (0.0%) |
| $100,000 and over | 1,607 (97.3%) | 45 (2.7%) |
Public vs Private Health Insurance Coverage by Age in Bluefield
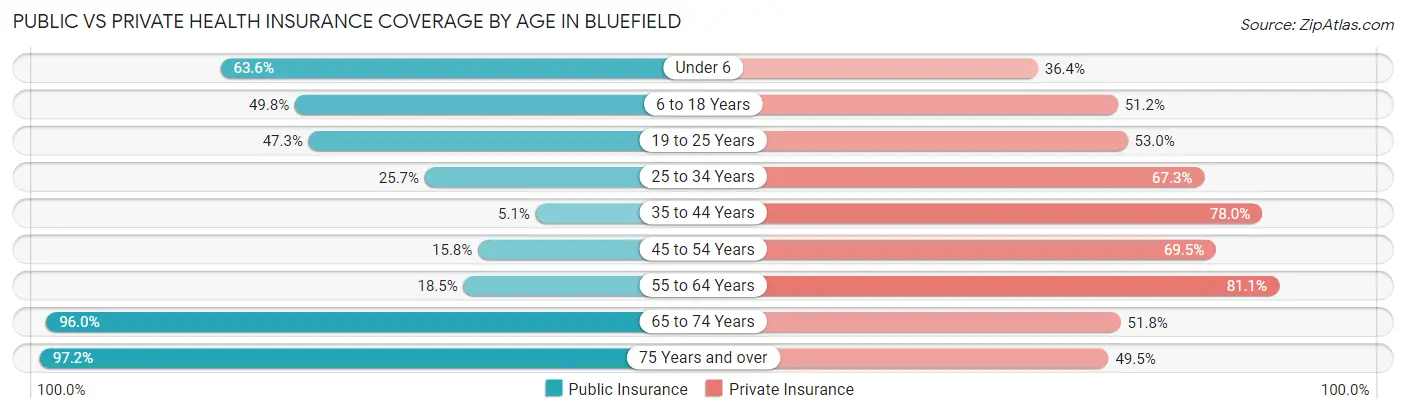
| Age Bracket | Public Insurance | Private Insurance |
| Under 6 | 292 (63.6%) | 167 (36.4%) |
| 6 to 18 Years | 387 (49.8%) | 398 (51.2%) |
| 19 to 25 Years | 319 (47.3%) | 358 (53.0%) |
| 25 to 34 Years | 117 (25.7%) | 306 (67.2%) |
| 35 to 44 Years | 18 (5.1%) | 273 (78.0%) |
| 45 to 54 Years | 100 (15.8%) | 439 (69.5%) |
| 55 to 64 Years | 98 (18.5%) | 429 (81.1%) |
| 65 to 74 Years | 382 (96.0%) | 206 (51.8%) |
| 75 Years and over | 685 (97.2%) | 349 (49.5%) |
| Total | 2,398 (48.1%) | 2,925 (58.7%) |
Disability Status by Sex by Age in Bluefield
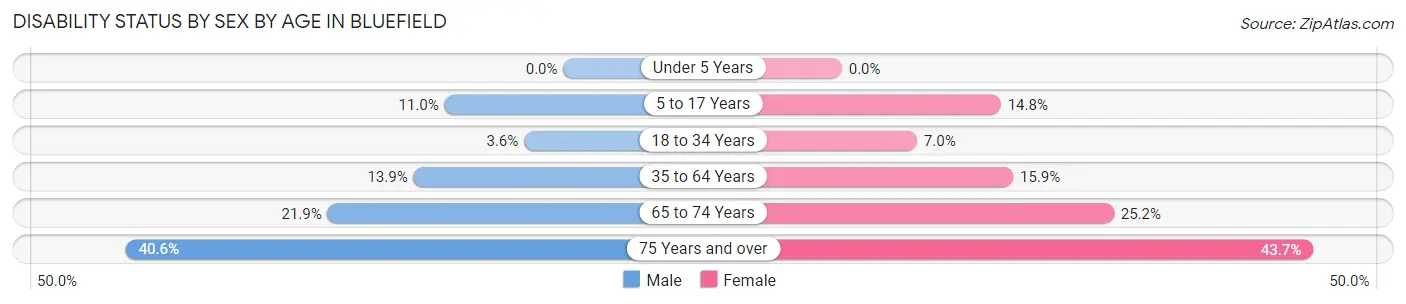
| Age Bracket | Male | Female |
| Under 5 Years | 0 (0.0%) | 0 (0.0%) |
| 5 to 17 Years | 40 (11.0%) | 50 (14.7%) |
| 18 to 34 Years | 18 (3.6%) | 52 (7.0%) |
| 35 to 64 Years | 107 (13.9%) | 118 (15.9%) |
| 65 to 74 Years | 42 (21.9%) | 52 (25.2%) |
| 75 Years and over | 134 (40.6%) | 164 (43.7%) |
Disability Class by Sex by Age in Bluefield
Disability Class: Hearing Difficulty
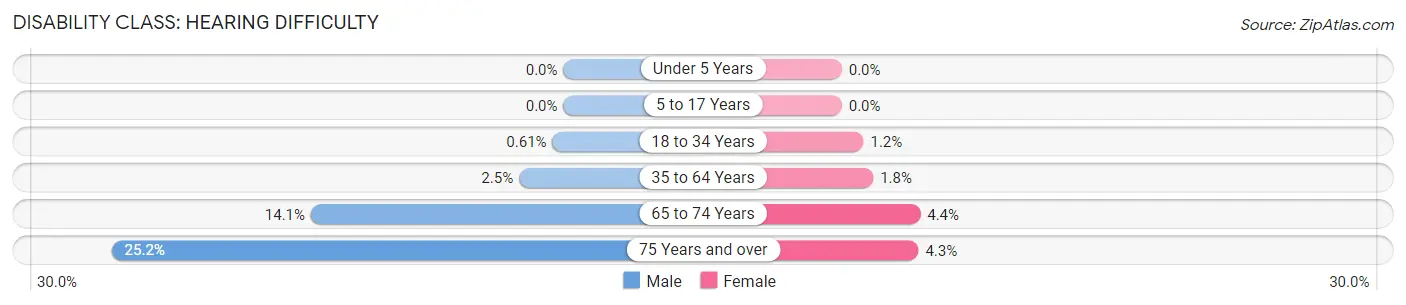
| Age Bracket | Male | Female |
| Under 5 Years | 0 (0.0%) | 0 (0.0%) |
| 5 to 17 Years | 0 (0.0%) | 0 (0.0%) |
| 18 to 34 Years | 3 (0.6%) | 9 (1.2%) |
| 35 to 64 Years | 19 (2.5%) | 13 (1.8%) |
| 65 to 74 Years | 27 (14.1%) | 9 (4.4%) |
| 75 Years and over | 83 (25.2%) | 16 (4.3%) |
Disability Class: Vision Difficulty
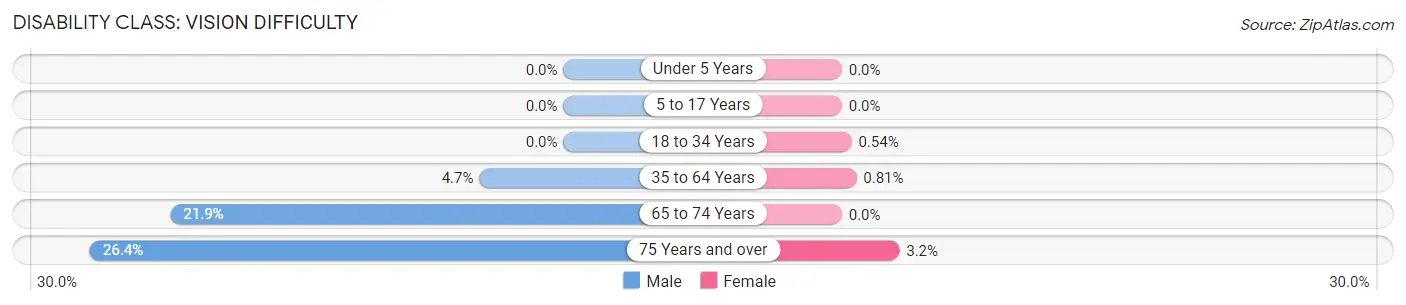
| Age Bracket | Male | Female |
| Under 5 Years | 0 (0.0%) | 0 (0.0%) |
| 5 to 17 Years | 0 (0.0%) | 0 (0.0%) |
| 18 to 34 Years | 0 (0.0%) | 4 (0.5%) |
| 35 to 64 Years | 36 (4.7%) | 6 (0.8%) |
| 65 to 74 Years | 42 (21.9%) | 0 (0.0%) |
| 75 Years and over | 87 (26.4%) | 12 (3.2%) |
Disability Class: Cognitive Difficulty
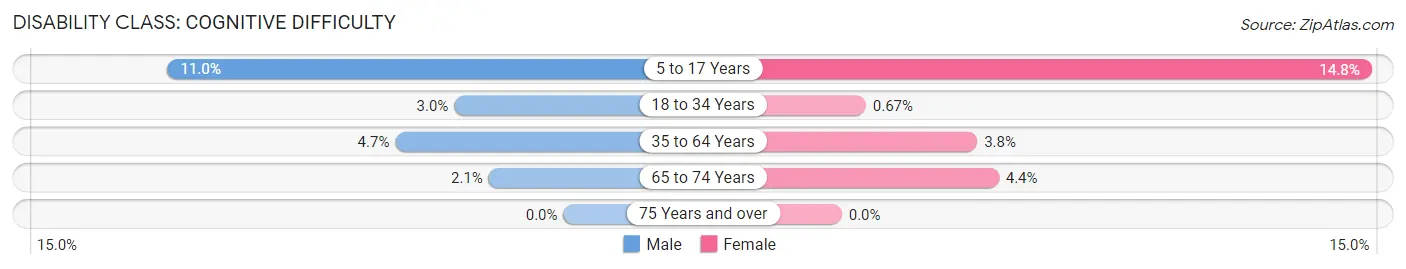
| Age Bracket | Male | Female |
| 5 to 17 Years | 40 (11.0%) | 50 (14.7%) |
| 18 to 34 Years | 15 (3.0%) | 5 (0.7%) |
| 35 to 64 Years | 36 (4.7%) | 28 (3.8%) |
| 65 to 74 Years | 4 (2.1%) | 9 (4.4%) |
| 75 Years and over | 0 (0.0%) | 0 (0.0%) |
Disability Class: Ambulatory Difficulty
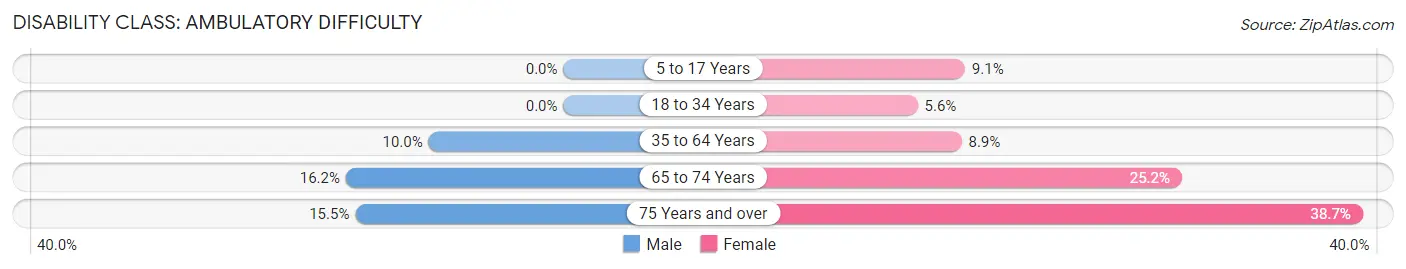
| Age Bracket | Male | Female |
| 5 to 17 Years | 0 (0.0%) | 31 (9.1%) |
| 18 to 34 Years | 0 (0.0%) | 42 (5.6%) |
| 35 to 64 Years | 77 (10.0%) | 66 (8.9%) |
| 65 to 74 Years | 31 (16.2%) | 52 (25.2%) |
| 75 Years and over | 51 (15.4%) | 145 (38.7%) |
Disability Class: Self-Care Difficulty
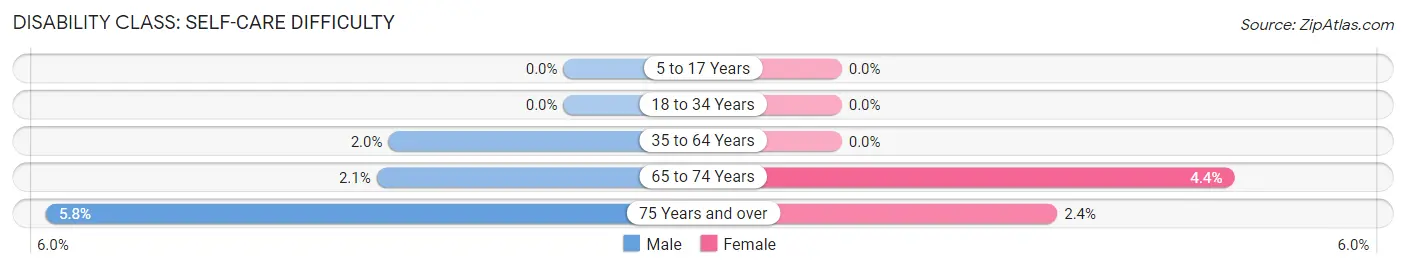
| Age Bracket | Male | Female |
| 5 to 17 Years | 0 (0.0%) | 0 (0.0%) |
| 18 to 34 Years | 0 (0.0%) | 0 (0.0%) |
| 35 to 64 Years | 15 (1.9%) | 0 (0.0%) |
| 65 to 74 Years | 4 (2.1%) | 9 (4.4%) |
| 75 Years and over | 19 (5.8%) | 9 (2.4%) |
Technology Access in Bluefield
Computing Device Access in Bluefield
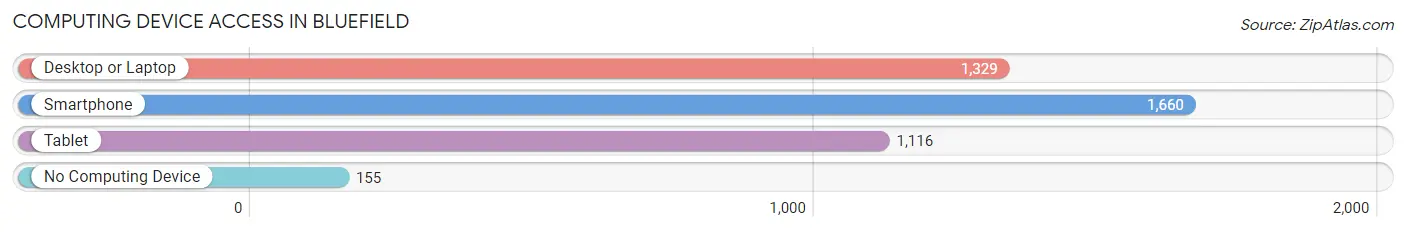
| Device Type | # Households | % Households |
| Desktop or Laptop | 1,329 | 64.5% |
| Smartphone | 1,660 | 80.6% |
| Tablet | 1,116 | 54.2% |
| No Computing Device | 155 | 7.5% |
| Total | 2,059 | 100.0% |
Internet Access in Bluefield
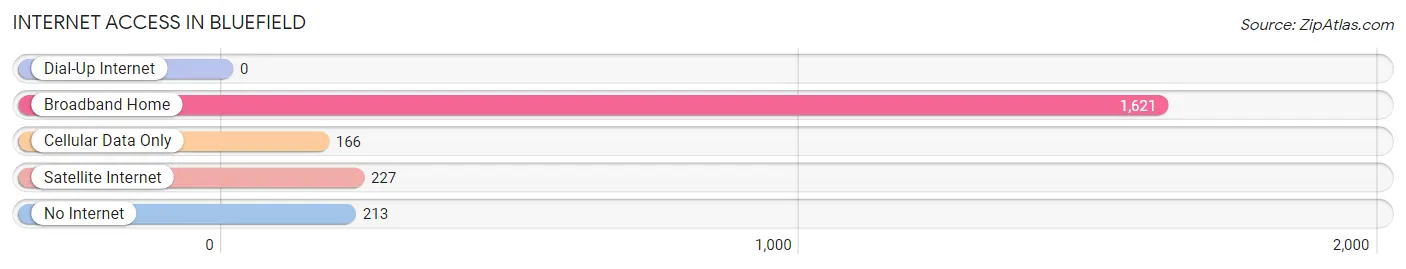
| Internet Type | # Households | % Households |
| Dial-Up Internet | 0 | 0.0% |
| Broadband Home | 1,621 | 78.7% |
| Cellular Data Only | 166 | 8.1% |
| Satellite Internet | 227 | 11.0% |
| No Internet | 213 | 10.3% |
| Total | 2,059 | 100.0% |
Bluefield Summary
Bluefield, Virginia is a small town located in the Appalachian Mountains of Tazewell County, Virginia. It is situated in the heart of the Appalachian coal fields and is the county seat of Tazewell County. The town was founded in 1883 and has a population of approximately 5,000 people.
History
Bluefield was founded in 1883 by the Norfolk and Western Railroad. The town was named after the blue-colored coal that was mined in the area. The town quickly grew and became a major hub for the coal industry. The town was also home to a number of other industries, including lumber, textiles, and furniture.
In the early 1900s, Bluefield was a major center for the coal industry. The town was home to several coal mines, including the Bluefield Coal and Coke Company, the Bluefield Coal and Iron Company, and the Bluefield Coal and Coke Company. The town was also home to several other businesses, including a hotel, a bank, a post office, and a number of stores.
In the late 1950s, the coal industry began to decline in the area and the town began to suffer economically. The town was hit hard by the Great Depression and many of the businesses in the area closed. In the 1970s, the town began to experience a resurgence as the coal industry began to rebound. The town was also home to a number of new businesses, including a shopping center, a movie theater, and a number of restaurants.
Geography
Bluefield is located in the Appalachian Mountains of Tazewell County, Virginia. The town is situated in the heart of the Appalachian coal fields and is surrounded by mountains and valleys. The town is located at an elevation of 1,400 feet and is approximately 30 miles from the nearest major city, Roanoke.
The town is located in a temperate climate and experiences four distinct seasons. The summers are hot and humid, while the winters are cold and snowy. The town receives an average of 40 inches of precipitation per year.
Economy
Bluefield’s economy is largely based on the coal industry. The town is home to several coal mines, including the Bluefield Coal and Coke Company, the Bluefield Coal and Iron Company, and the Bluefield Coal and Coke Company. The town is also home to a number of other businesses, including a shopping center, a movie theater, and a number of restaurants.
The town is also home to a number of manufacturing companies, including a furniture factory, a textile mill, and a lumber mill. The town is also home to a number of government offices, including the Tazewell County Courthouse and the Tazewell County Sheriff’s Office.
Demographics
As of the 2010 census, the population of Bluefield was 5,039. The town is predominantly white, with approximately 90% of the population being white. The town is also home to a small African American population, with approximately 5% of the population being African American. The town is also home to a small Hispanic population, with approximately 2% of the population being Hispanic.
The median household income in Bluefield is $30,938, which is lower than the national average. The town has a poverty rate of 22.3%, which is higher than the national average. The town also has a high unemployment rate, with approximately 8.5% of the population being unemployed.
Conclusion
Bluefield, Virginia is a small town located in the Appalachian Mountains of Tazewell County, Virginia. The town was founded in 1883 and has a population of approximately 5,000 people. The town’s economy is largely based on the coal industry, and the town is also home to a number of other businesses, including a shopping center, a movie theater, and a number of restaurants. The town is predominantly white, with approximately 90% of the population being white. The town has a median household income of $30,938 and a poverty rate of 22.3%. Bluefield is a small town with a rich history and a bright future.
Common Questions
What is Per Capita Income in Bluefield?
Per Capita income in Bluefield is $34,090.
What is the Median Family Income in Bluefield?
Median Family Income in Bluefield is $52,299.
What is the Median Household income in Bluefield?
Median Household Income in Bluefield is $53,162.
What is Income or Wage Gap in Bluefield?
Income or Wage Gap in Bluefield is 34.9%.
Women in Bluefield earn 65.1 cents for every dollar earned by a man.
What is Inequality or Gini Index in Bluefield?
Inequality or Gini Index in Bluefield is 0.54.
What is the Total Population of Bluefield?
Total Population of Bluefield is 5,059.
What is the Total Male Population of Bluefield?
Total Male Population of Bluefield is 2,337.
What is the Total Female Population of Bluefield?
Total Female Population of Bluefield is 2,722.
What is the Ratio of Males per 100 Females in Bluefield?
There are 85.86 Males per 100 Females in Bluefield.
What is the Ratio of Females per 100 Males in Bluefield?
There are 116.47 Females per 100 Males in Bluefield.
What is the Median Population Age in Bluefield?
Median Population Age in Bluefield is 38.9 Years.
What is the Average Family Size in Bluefield
Average Family Size in Bluefield is 2.7 People.
What is the Average Household Size in Bluefield
Average Household Size in Bluefield is 2.3 People.
How Large is the Labor Force in Bluefield?
There are 2,010 People in the Labor Forcein in Bluefield.
What is the Percentage of People in the Labor Force in Bluefield?
50.2% of People are in the Labor Force in Bluefield.
What is the Unemployment Rate in Bluefield?
Unemployment Rate in Bluefield is 2.8%.