McLean, VA Map & Demographics
McLean Map
McLean Overview
$125,373
PER CAPITA INCOME
$250,001
AVG FAMILY INCOME
$250,001
AVG HOUSEHOLD INCOME
43.5%
WAGE / INCOME GAP [ % ]
56.5¢/ $1
WAGE / INCOME GAP [ $ ]
0.47
INEQUALITY / GINI INDEX
49,587
TOTAL POPULATION
24,488
MALE POPULATION
25,099
FEMALE POPULATION
97.57
MALES / 100 FEMALES
102.50
FEMALES / 100 MALES
46.7
MEDIAN AGE
3.3
AVG FAMILY SIZE
2.9
AVG HOUSEHOLD SIZE
24,661
LABOR FORCE [ PEOPLE ]
63.2%
PERCENT IN LABOR FORCE
2.1%
UNEMPLOYMENT RATE
Income in McLean
Income Overview in McLean
Per Capita Income in McLean is $125,373, while median incomes of families and households are $250,001 and $250,001 respectively.
| Characteristic | Number | Measure |
| Per Capita Income | 49,587 | $125,373 |
| Median Family Income | 13,622 | $250,001 |
| Mean Family Income | 13,622 | $410,401 |
| Median Household Income | 17,005 | $250,001 |
| Mean Household Income | 17,005 | $364,093 |
| Income Deficit | 13,622 | $0 |
| Wage / Income Gap (%) | 49,587 | 43.46% |
| Wage / Income Gap ($) | 49,587 | 56.54¢ per $1 |
| Gini / Inequality Index | 49,587 | 0.47 |
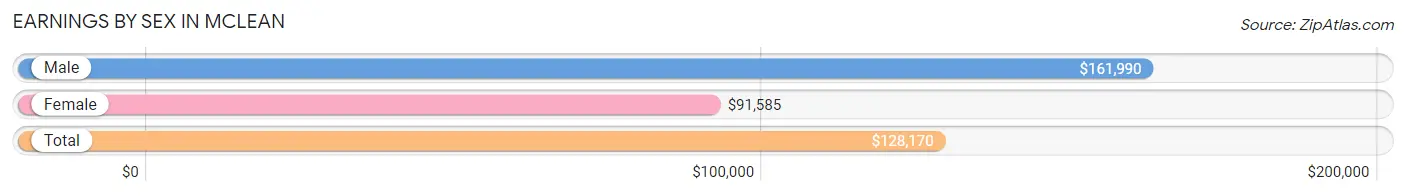
Earnings by Sex in McLean
Average Earnings in McLean are $128,170, $161,990 for men and $91,585 for women, a difference of 43.5%.
| Sex | Number | Average Earnings |
| Male | 14,439 (55.0%) | $161,990 |
| Female | 11,822 (45.0%) | $91,585 |
| Total | 26,261 (100.0%) | $128,170 |
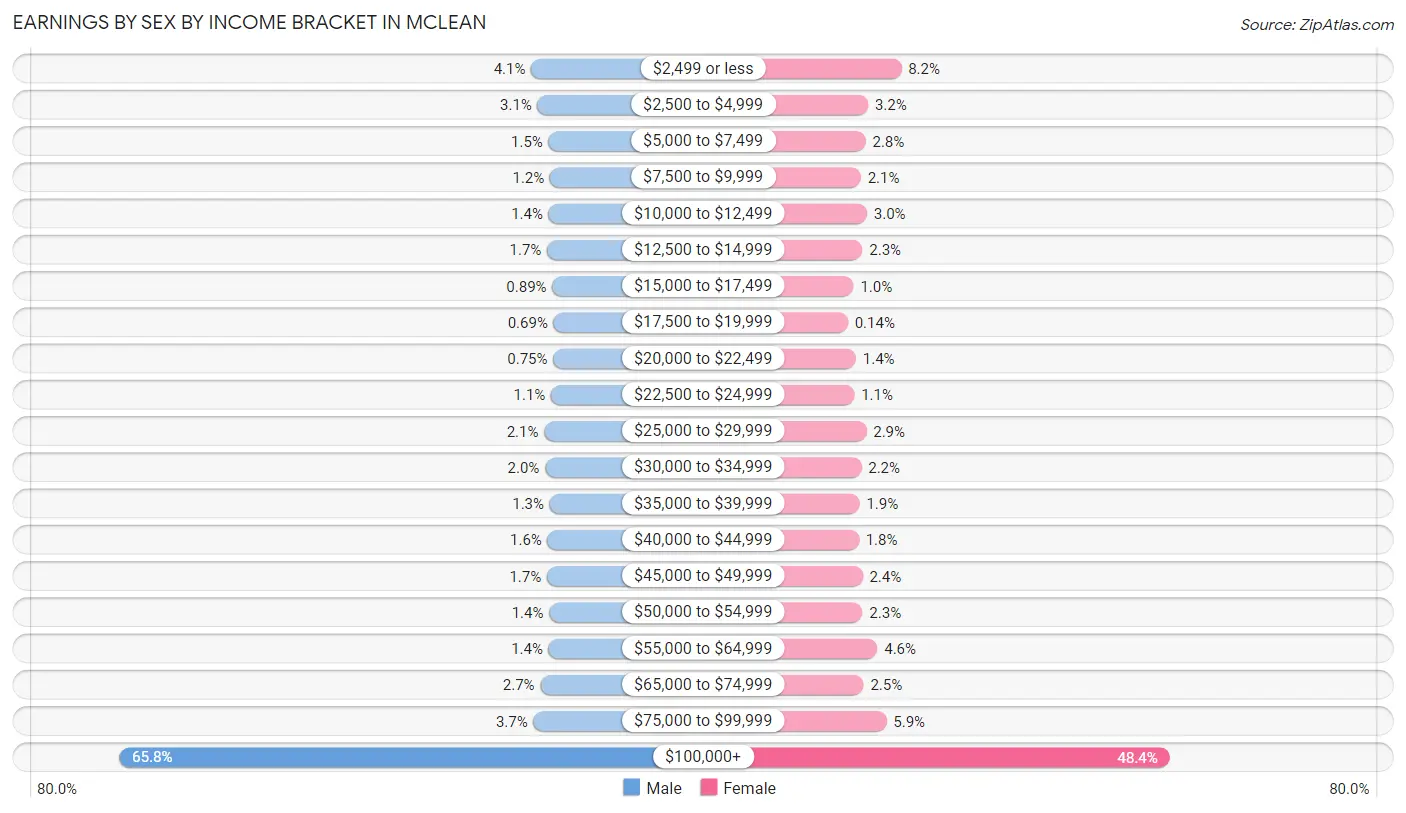
Earnings by Sex by Income Bracket in McLean
The most common earnings brackets in McLean are $100,000+ for men (9,504 | 65.8%) and $100,000+ for women (5,719 | 48.4%).
| Income | Male | Female |
| $2,499 or less | 586 (4.1%) | 963 (8.2%) |
| $2,500 to $4,999 | 447 (3.1%) | 375 (3.2%) |
| $5,000 to $7,499 | 210 (1.5%) | 332 (2.8%) |
| $7,500 to $9,999 | 177 (1.2%) | 247 (2.1%) |
| $10,000 to $12,499 | 206 (1.4%) | 356 (3.0%) |
| $12,500 to $14,999 | 241 (1.7%) | 276 (2.3%) |
| $15,000 to $17,499 | 128 (0.9%) | 118 (1.0%) |
| $17,500 to $19,999 | 99 (0.7%) | 16 (0.1%) |
| $20,000 to $22,499 | 108 (0.7%) | 161 (1.4%) |
| $22,500 to $24,999 | 156 (1.1%) | 131 (1.1%) |
| $25,000 to $29,999 | 305 (2.1%) | 345 (2.9%) |
| $30,000 to $34,999 | 284 (2.0%) | 257 (2.2%) |
| $35,000 to $39,999 | 184 (1.3%) | 225 (1.9%) |
| $40,000 to $44,999 | 231 (1.6%) | 210 (1.8%) |
| $45,000 to $49,999 | 244 (1.7%) | 278 (2.4%) |
| $50,000 to $54,999 | 197 (1.4%) | 277 (2.3%) |
| $55,000 to $64,999 | 207 (1.4%) | 540 (4.6%) |
| $65,000 to $74,999 | 388 (2.7%) | 295 (2.5%) |
| $75,000 to $99,999 | 537 (3.7%) | 701 (5.9%) |
| $100,000+ | 9,504 (65.8%) | 5,719 (48.4%) |
| Total | 14,439 (100.0%) | 11,822 (100.0%) |
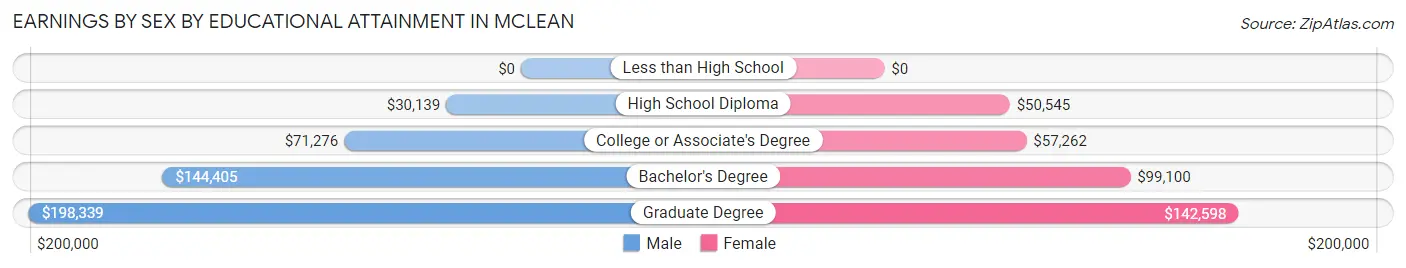
Earnings by Sex by Educational Attainment in McLean
Average earnings in McLean are $176,920 for men and $113,855 for women, a difference of 35.6%. Men with an educational attainment of graduate degree enjoy the highest average annual earnings of $198,339, while those with high school diploma education earn the least with $30,139. Women with an educational attainment of graduate degree earn the most with the average annual earnings of $142,598, while those with high school diploma education have the smallest earnings of $50,545.
| Educational Attainment | Male Income | Female Income |
| Less than High School | - | - |
| High School Diploma | $30,139 | $50,545 |
| College or Associate's Degree | $71,276 | $57,262 |
| Bachelor's Degree | $144,405 | $99,100 |
| Graduate Degree | $198,339 | $142,598 |
| Total | $176,920 | $113,855 |
Family Income in McLean
Family Income Brackets in McLean
According to the McLean family income data, there are 9,685 families falling into the $200,000+ income range, which is the most common income bracket and makes up 71.1% of all families. Conversely, the $10,000 to $14,999 income bracket is the least frequent group with only 14 families (0.1%) belonging to this category.
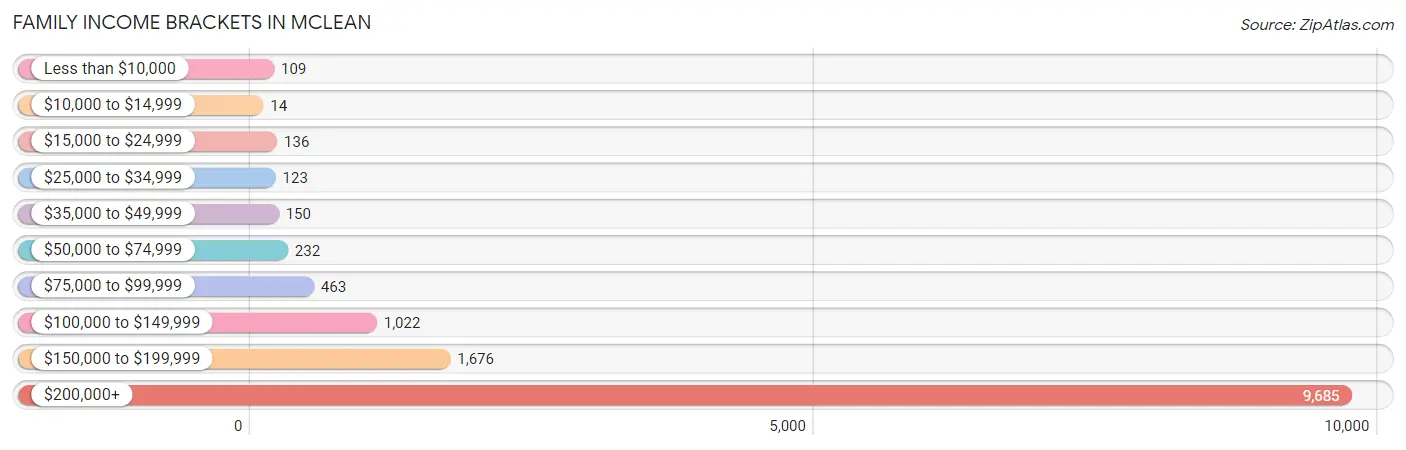
| Income Bracket | # Families | % Families |
| Less than $10,000 | 109 | 0.8% |
| $10,000 to $14,999 | 14 | 0.1% |
| $15,000 to $24,999 | 136 | 1.0% |
| $25,000 to $34,999 | 123 | 0.9% |
| $35,000 to $49,999 | 150 | 1.1% |
| $50,000 to $74,999 | 232 | 1.7% |
| $75,000 to $99,999 | 463 | 3.4% |
| $100,000 to $149,999 | 1,022 | 7.5% |
| $150,000 to $199,999 | 1,676 | 12.3% |
| $200,000+ | 9,685 | 71.1% |
Family Income by Famaliy Size in McLean
3-person families (3,288 | 24.1%) account for the highest median family income in McLean with $250,001 per family, while 2-person families (5,201 | 38.2%) have the highest median income of $117,430 per family member.
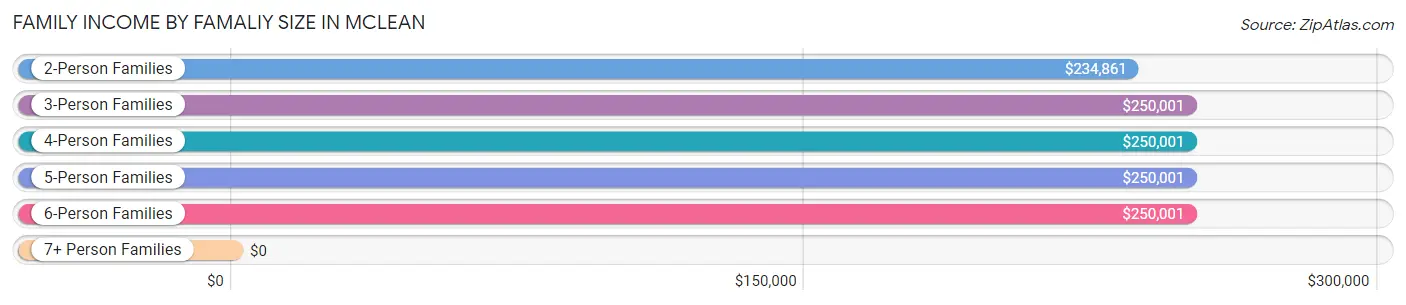
| Income Bracket | # Families | Median Income |
| 2-Person Families | 5,201 (38.2%) | $234,861 |
| 3-Person Families | 3,288 (24.1%) | $250,001 |
| 4-Person Families | 3,223 (23.7%) | $250,001 |
| 5-Person Families | 1,497 (11.0%) | $250,001 |
| 6-Person Families | 357 (2.6%) | $250,001 |
| 7+ Person Families | 56 (0.4%) | $0 |
| Total | 13,622 (100.0%) | $250,001 |
Family Income by Number of Earners in McLean
The median family income in McLean is $250,001, with families comprising 2 earners (6,668) having the highest median family income of $250,001, while families with no earners (1,517) have the lowest median family income of $151,998, accounting for 48.9% and 11.1% of families, respectively.
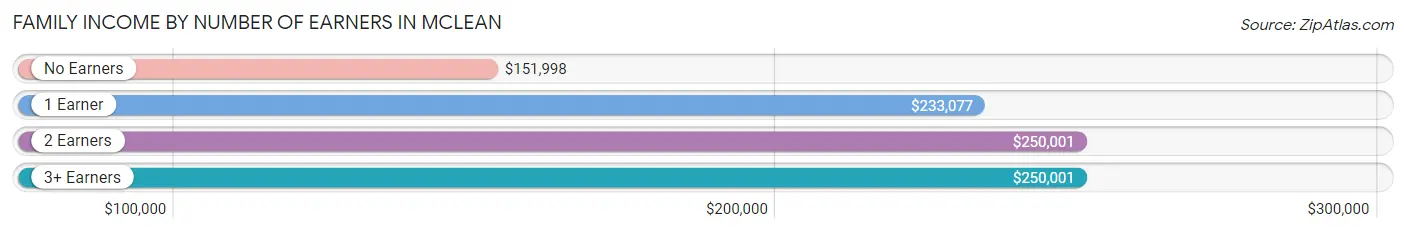
| Number of Earners | # Families | Median Income |
| No Earners | 1,517 (11.1%) | $151,998 |
| 1 Earner | 3,706 (27.2%) | $233,077 |
| 2 Earners | 6,668 (48.9%) | $250,001 |
| 3+ Earners | 1,731 (12.7%) | $250,001 |
| Total | 13,622 (100.0%) | $250,001 |
Household Income in McLean
Household Income Brackets in McLean
With 10,509 households falling in the category, the $200,000+ income range is the most frequent in McLean, accounting for 61.8% of all households. In contrast, only 170 households (1.0%) fall into the $10,000 to $14,999 income bracket, making it the least populous group.
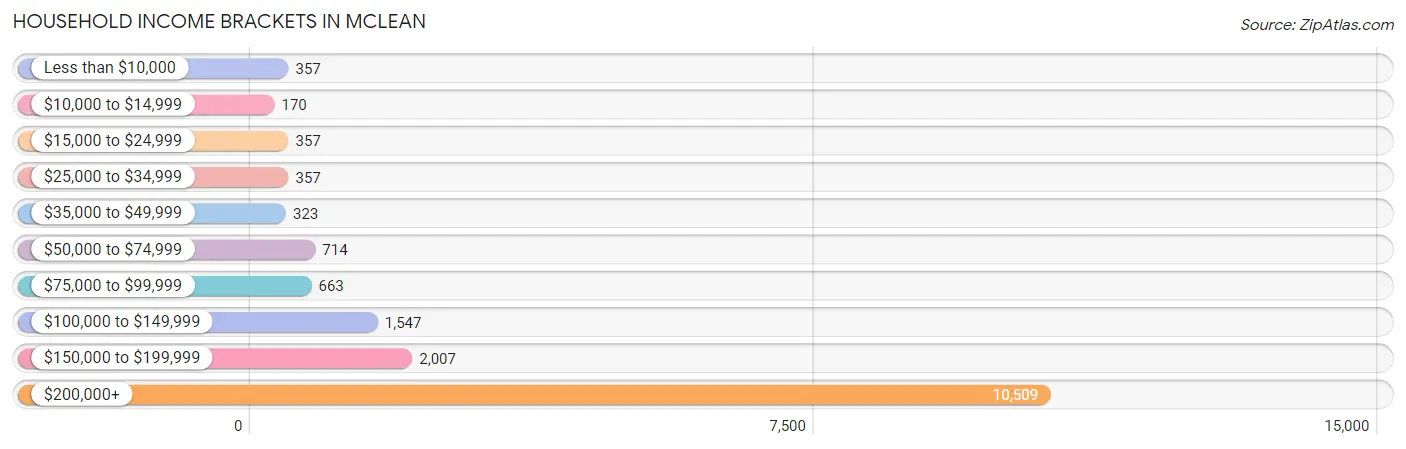
| Income Bracket | # Households | % Households |
| Less than $10,000 | 357 | 2.1% |
| $10,000 to $14,999 | 170 | 1.0% |
| $15,000 to $24,999 | 357 | 2.1% |
| $25,000 to $34,999 | 357 | 2.1% |
| $35,000 to $49,999 | 323 | 1.9% |
| $50,000 to $74,999 | 714 | 4.2% |
| $75,000 to $99,999 | 663 | 3.9% |
| $100,000 to $149,999 | 1,547 | 9.1% |
| $150,000 to $199,999 | 2,007 | 11.8% |
| $200,000+ | 10,509 | 61.8% |
Household Income by Householder Age in McLean
The median household income in McLean is $250,001, with the highest median household income of $250,001 found in the 25 to 44 years age bracket for the primary householder. A total of 2,837 households (16.7%) fall into this category. Meanwhile, the 15 to 24 years age bracket for the primary householder has the lowest median household income of $0, with 39 households (0.2%) in this group.
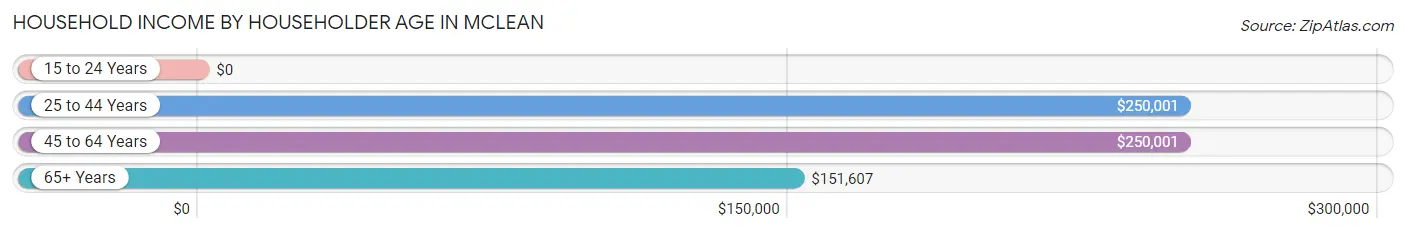
| Income Bracket | # Households | Median Income |
| 15 to 24 Years | 39 (0.2%) | $0 |
| 25 to 44 Years | 2,837 (16.7%) | $250,001 |
| 45 to 64 Years | 8,590 (50.5%) | $250,001 |
| 65+ Years | 5,539 (32.6%) | $151,607 |
| Total | 17,005 (100.0%) | $250,001 |
Poverty in McLean
Income Below Poverty by Sex and Age in McLean
With 2.0% poverty level for males and 2.9% for females among the residents of McLean, 75 year old and over males and 25 to 34 year old females are the most vulnerable to poverty, with 132 males (6.0%) and 75 females (7.5%) in their respective age groups living below the poverty level.
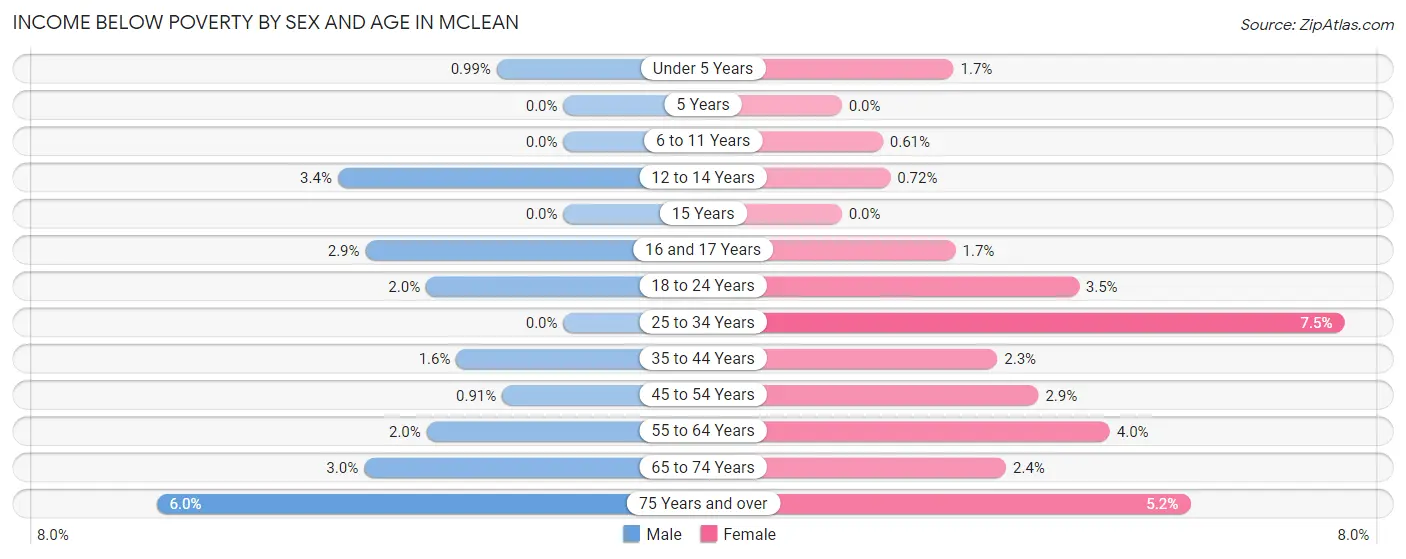
| Age Bracket | Male | Female |
| Under 5 Years | 9 (1.0%) | 18 (1.7%) |
| 5 Years | 0 (0.0%) | 0 (0.0%) |
| 6 to 11 Years | 0 (0.0%) | 13 (0.6%) |
| 12 to 14 Years | 47 (3.4%) | 10 (0.7%) |
| 15 Years | 0 (0.0%) | 0 (0.0%) |
| 16 and 17 Years | 32 (2.9%) | 17 (1.7%) |
| 18 to 24 Years | 38 (2.0%) | 56 (3.5%) |
| 25 to 34 Years | 0 (0.0%) | 75 (7.5%) |
| 35 to 44 Years | 37 (1.6%) | 61 (2.3%) |
| 45 to 54 Years | 40 (0.9%) | 134 (2.9%) |
| 55 to 64 Years | 80 (2.0%) | 149 (4.0%) |
| 65 to 74 Years | 67 (3.0%) | 55 (2.4%) |
| 75 Years and over | 132 (6.0%) | 141 (5.2%) |
| Total | 482 (2.0%) | 729 (2.9%) |
Income Above Poverty by Sex and Age in McLean
According to the poverty statistics in McLean, males aged 5 years and females aged 5 years are the age groups that are most secure financially, with 100.0% of males and 100.0% of females in these age groups living above the poverty line.
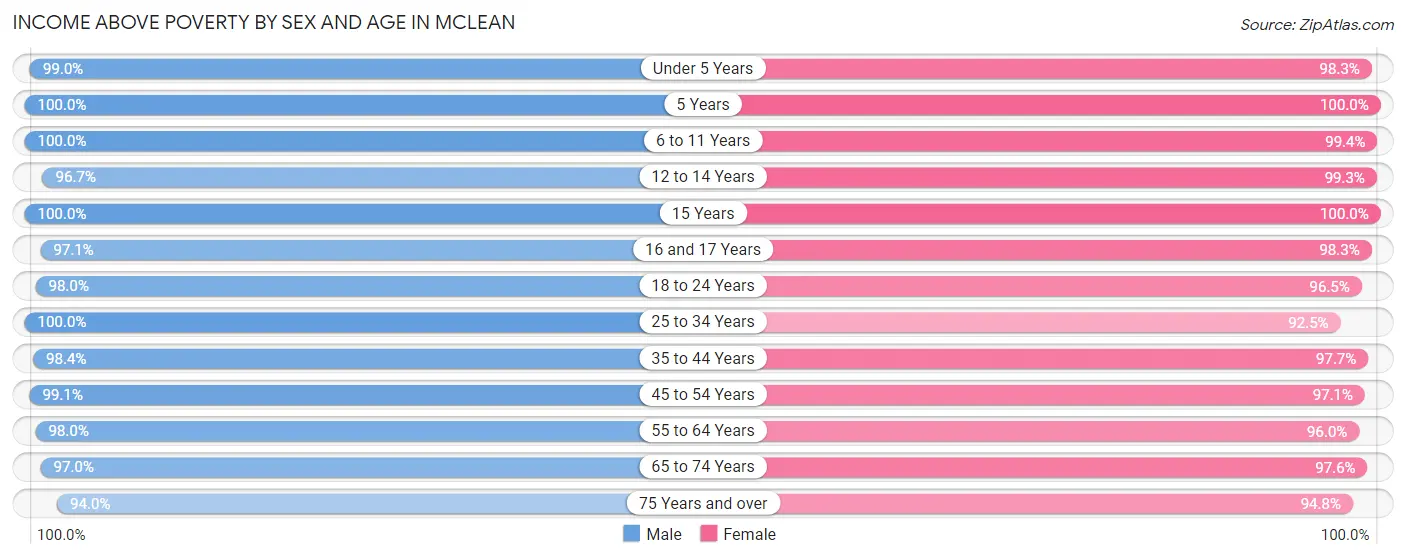
| Age Bracket | Male | Female |
| Under 5 Years | 897 (99.0%) | 1,069 (98.3%) |
| 5 Years | 215 (100.0%) | 288 (100.0%) |
| 6 to 11 Years | 2,227 (100.0%) | 2,101 (99.4%) |
| 12 to 14 Years | 1,357 (96.7%) | 1,377 (99.3%) |
| 15 Years | 357 (100.0%) | 535 (100.0%) |
| 16 and 17 Years | 1,058 (97.1%) | 987 (98.3%) |
| 18 to 24 Years | 1,828 (98.0%) | 1,537 (96.5%) |
| 25 to 34 Years | 1,242 (100.0%) | 931 (92.5%) |
| 35 to 44 Years | 2,286 (98.4%) | 2,575 (97.7%) |
| 45 to 54 Years | 4,363 (99.1%) | 4,450 (97.1%) |
| 55 to 64 Years | 3,869 (98.0%) | 3,598 (96.0%) |
| 65 to 74 Years | 2,199 (97.0%) | 2,198 (97.6%) |
| 75 Years and over | 2,052 (94.0%) | 2,585 (94.8%) |
| Total | 23,950 (98.0%) | 24,231 (97.1%) |
Income Below Poverty Among Married-Couple Families in McLean
The poverty statistics for married-couple families in McLean show that 0.5% or 58 of the total 12,076 families live below the poverty line. Families with 1 or 2 children have the highest poverty rate of 0.6%, comprising of 28 families. On the other hand, families with 3 or 4 children have the lowest poverty rate of 0.0%, which includes 0 families.
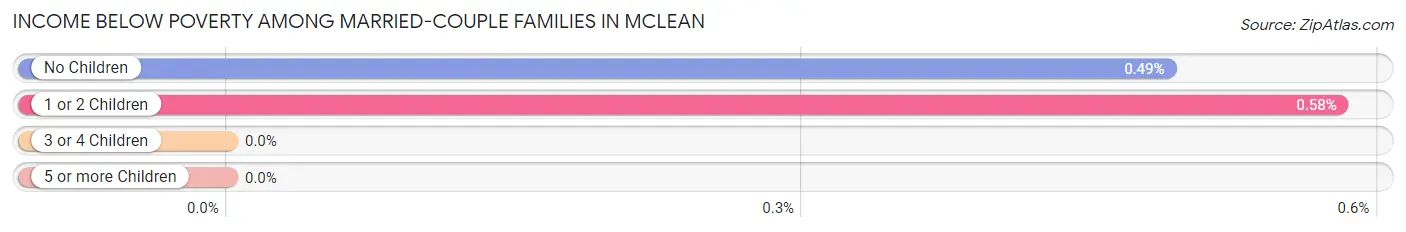
| Children | Above Poverty | Below Poverty |
| No Children | 6,035 (99.5%) | 30 (0.5%) |
| 1 or 2 Children | 4,763 (99.4%) | 28 (0.6%) |
| 3 or 4 Children | 1,199 (100.0%) | 0 (0.0%) |
| 5 or more Children | 21 (100.0%) | 0 (0.0%) |
| Total | 12,018 (99.5%) | 58 (0.5%) |
Income Below Poverty Among Single-Parent Households in McLean
According to the poverty data in McLean, 3.2% or 15 single-father households and 5.2% or 56 single-mother households are living below the poverty line. Among single-father households, those with no children have the highest poverty rate, with 8 households (4.4%) experiencing poverty. Likewise, among single-mother households, those with 1 or 2 children have the highest poverty rate, with 37 households (7.7%) falling below the poverty line.
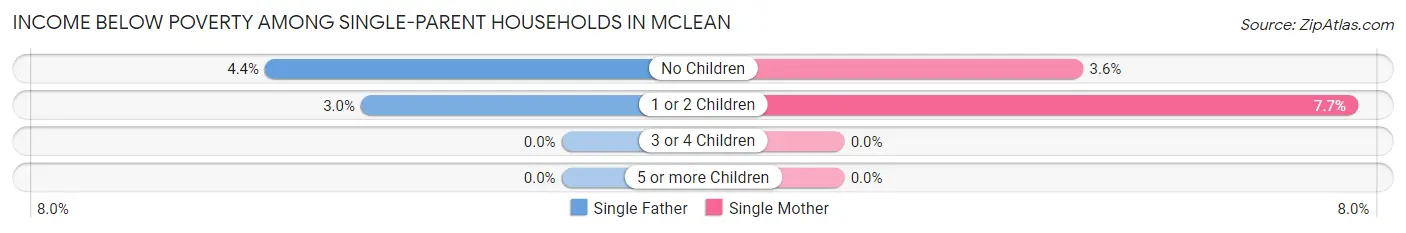
| Children | Single Father | Single Mother |
| No Children | 8 (4.4%) | 19 (3.6%) |
| 1 or 2 Children | 7 (3.0%) | 37 (7.7%) |
| 3 or 4 Children | 0 (0.0%) | 0 (0.0%) |
| 5 or more Children | 0 (0.0%) | 0 (0.0%) |
| Total | 15 (3.2%) | 56 (5.2%) |
Income Below Poverty Among Married-Couple vs Single-Parent Households in McLean
The poverty data for McLean shows that 58 of the married-couple family households (0.5%) and 71 of the single-parent households (4.6%) are living below the poverty level. Within the married-couple family households, those with 1 or 2 children have the highest poverty rate, with 28 households (0.6%) falling below the poverty line. Among the single-parent households, those with 1 or 2 children have the highest poverty rate, with 44 household (6.1%) living below poverty.
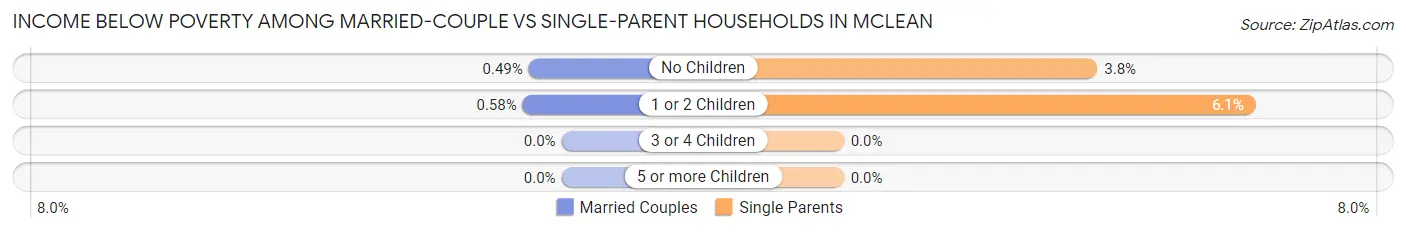
| Children | Married-Couple Families | Single-Parent Households |
| No Children | 30 (0.5%) | 27 (3.8%) |
| 1 or 2 Children | 28 (0.6%) | 44 (6.1%) |
| 3 or 4 Children | 0 (0.0%) | 0 (0.0%) |
| 5 or more Children | 0 (0.0%) | 0 (0.0%) |
| Total | 58 (0.5%) | 71 (4.6%) |
Race in McLean
The most populous races in McLean are White / Caucasian (34,269 | 69.1%), Asian (10,054 | 20.3%), and Two or more Races (3,198 | 6.5%).
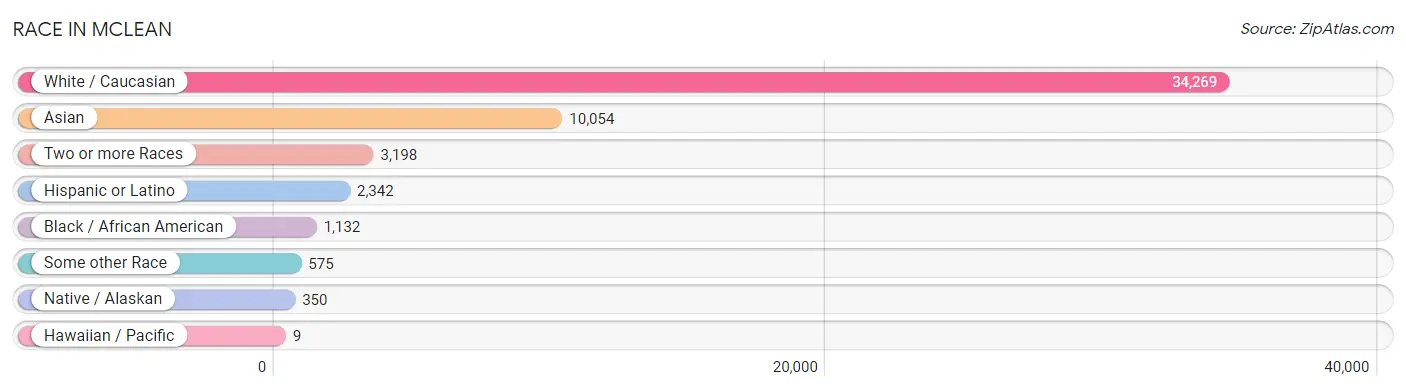
| Race | # Population | % Population |
| Asian | 10,054 | 20.3% |
| Black / African American | 1,132 | 2.3% |
| Hawaiian / Pacific | 9 | 0.0% |
| Hispanic or Latino | 2,342 | 4.7% |
| Native / Alaskan | 350 | 0.7% |
| White / Caucasian | 34,269 | 69.1% |
| Two or more Races | 3,198 | 6.5% |
| Some other Race | 575 | 1.2% |
| Total | 49,587 | 100.0% |
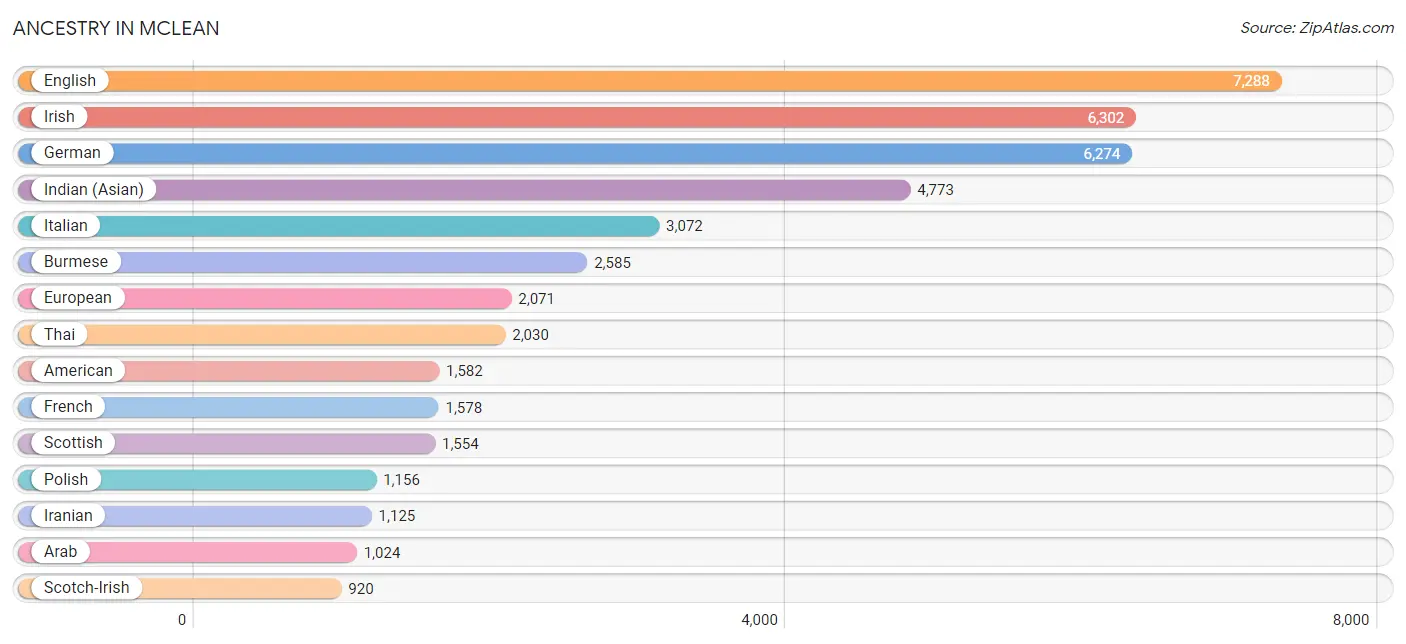
Ancestry in McLean
The most populous ancestries reported in McLean are English (7,288 | 14.7%), Irish (6,302 | 12.7%), German (6,274 | 12.7%), Indian (Asian) (4,773 | 9.6%), and Italian (3,072 | 6.2%), together accounting for 55.9% of all McLean residents.
| Ancestry | # Population | % Population |
| African | 53 | 0.1% |
| Aleut | 22 | 0.0% |
| American | 1,582 | 3.2% |
| Apache | 10 | 0.0% |
| Arab | 1,024 | 2.1% |
| Argentinean | 227 | 0.5% |
| Armenian | 477 | 1.0% |
| Australian | 70 | 0.1% |
| Austrian | 233 | 0.5% |
| Basque | 22 | 0.0% |
| Belgian | 52 | 0.1% |
| Bhutanese | 416 | 0.8% |
| Bolivian | 47 | 0.1% |
| Brazilian | 206 | 0.4% |
| British | 728 | 1.5% |
| Bulgarian | 46 | 0.1% |
| Burmese | 2,585 | 5.2% |
| Canadian | 201 | 0.4% |
| Cape Verdean | 10 | 0.0% |
| Carpatho Rusyn | 8 | 0.0% |
| Central American | 156 | 0.3% |
| Central American Indian | 284 | 0.6% |
| Cherokee | 105 | 0.2% |
| Chilean | 14 | 0.0% |
| Choctaw | 12 | 0.0% |
| Colombian | 88 | 0.2% |
| Costa Rican | 14 | 0.0% |
| Creek | 46 | 0.1% |
| Croatian | 44 | 0.1% |
| Cuban | 42 | 0.1% |
| Czech | 211 | 0.4% |
| Czechoslovakian | 35 | 0.1% |
| Danish | 184 | 0.4% |
| Dominican | 37 | 0.1% |
| Dutch | 478 | 1.0% |
| Eastern European | 496 | 1.0% |
| Ecuadorian | 24 | 0.1% |
| Egyptian | 155 | 0.3% |
| English | 7,288 | 14.7% |
| Estonian | 48 | 0.1% |
| Ethiopian | 92 | 0.2% |
| European | 2,071 | 4.2% |
| Filipino | 199 | 0.4% |
| Finnish | 52 | 0.1% |
| French | 1,578 | 3.2% |
| French American Indian | 71 | 0.1% |
| French Canadian | 562 | 1.1% |
| German | 6,274 | 12.7% |
| Greek | 310 | 0.6% |
| Guamanian / Chamorro | 9 | 0.0% |
| Guatemalan | 37 | 0.1% |
| Guyanese | 37 | 0.1% |
| Haitian | 10 | 0.0% |
| Honduran | 2 | 0.0% |
| Hungarian | 311 | 0.6% |
| Icelander | 9 | 0.0% |
| Indian (Asian) | 4,773 | 9.6% |
| Inupiat | 18 | 0.0% |
| Iranian | 1,125 | 2.3% |
| Iraqi | 76 | 0.2% |
| Irish | 6,302 | 12.7% |
| Israeli | 24 | 0.1% |
| Italian | 3,072 | 6.2% |
| Japanese | 55 | 0.1% |
| Jordanian | 29 | 0.1% |
| Kenyan | 83 | 0.2% |
| Korean | 595 | 1.2% |
| Laotian | 5 | 0.0% |
| Latvian | 17 | 0.0% |
| Lebanese | 219 | 0.4% |
| Lithuanian | 101 | 0.2% |
| Macedonian | 7 | 0.0% |
| Malaysian | 37 | 0.1% |
| Mexican | 755 | 1.5% |
| Mexican American Indian | 72 | 0.2% |
| Moroccan | 75 | 0.2% |
| Native Hawaiian | 15 | 0.0% |
| New Zealander | 10 | 0.0% |
| Nicaraguan | 29 | 0.1% |
| Northern European | 161 | 0.3% |
| Norwegian | 273 | 0.5% |
| Pakistani | 208 | 0.4% |
| Palestinian | 79 | 0.2% |
| Panamanian | 24 | 0.1% |
| Paraguayan | 11 | 0.0% |
| Pennsylvania German | 13 | 0.0% |
| Peruvian | 395 | 0.8% |
| Polish | 1,156 | 2.3% |
| Portuguese | 88 | 0.2% |
| Puerto Rican | 141 | 0.3% |
| Puget Sound Salish | 4 | 0.0% |
| Romanian | 188 | 0.4% |
| Russian | 854 | 1.7% |
| Salvadoran | 50 | 0.1% |
| Samoan | 9 | 0.0% |
| Scandinavian | 302 | 0.6% |
| Scotch-Irish | 920 | 1.9% |
| Scottish | 1,554 | 3.1% |
| Serbian | 63 | 0.1% |
| Slavic | 34 | 0.1% |
| Slovak | 151 | 0.3% |
| Slovene | 10 | 0.0% |
| South African | 77 | 0.2% |
| South American | 874 | 1.8% |
| South American Indian | 13 | 0.0% |
| Spaniard | 117 | 0.2% |
| Spanish | 77 | 0.2% |
| Sri Lankan | 482 | 1.0% |
| Subsaharan African | 331 | 0.7% |
| Swedish | 739 | 1.5% |
| Swiss | 120 | 0.2% |
| Syrian | 59 | 0.1% |
| Thai | 2,030 | 4.1% |
| Trinidadian and Tobagonian | 27 | 0.1% |
| Turkish | 214 | 0.4% |
| Ukrainian | 317 | 0.6% |
| Uruguayan | 15 | 0.0% |
| Venezuelan | 53 | 0.1% |
| Vietnamese | 12 | 0.0% |
| Welsh | 453 | 0.9% |
| Yugoslavian | 6 | 0.0% | View All 121 Rows |
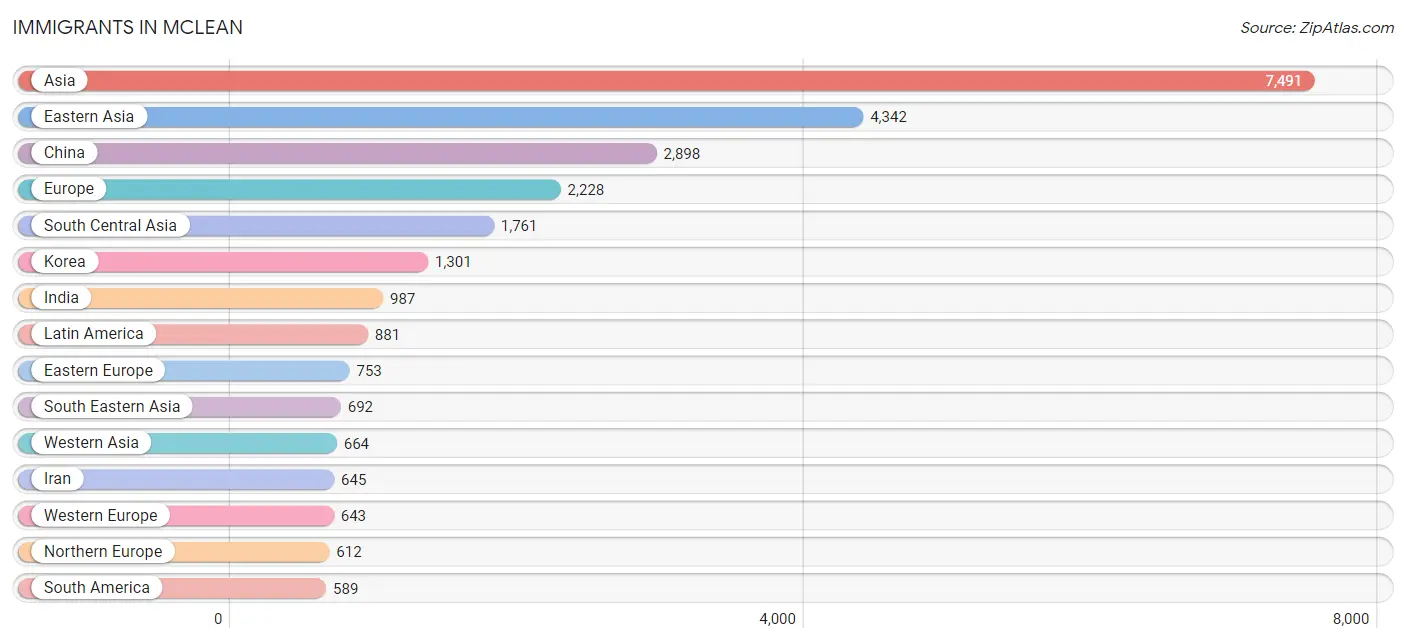
Immigrants in McLean
The most numerous immigrant groups reported in McLean came from Asia (7,491 | 15.1%), Eastern Asia (4,342 | 8.8%), China (2,898 | 5.8%), Europe (2,228 | 4.5%), and South Central Asia (1,761 | 3.5%), together accounting for 37.8% of all McLean residents.
| Immigration Origin | # Population | % Population |
| Africa | 473 | 0.9% |
| Argentina | 79 | 0.2% |
| Asia | 7,491 | 15.1% |
| Australia | 162 | 0.3% |
| Austria | 6 | 0.0% |
| Bangladesh | 5 | 0.0% |
| Belarus | 13 | 0.0% |
| Belgium | 6 | 0.0% |
| Bolivia | 17 | 0.0% |
| Brazil | 224 | 0.4% |
| Bulgaria | 8 | 0.0% |
| Cambodia | 28 | 0.1% |
| Cameroon | 16 | 0.0% |
| Canada | 439 | 0.9% |
| Caribbean | 26 | 0.1% |
| Central America | 266 | 0.5% |
| China | 2,898 | 5.8% |
| Colombia | 43 | 0.1% |
| Costa Rica | 14 | 0.0% |
| Cuba | 9 | 0.0% |
| Czechoslovakia | 43 | 0.1% |
| Denmark | 37 | 0.1% |
| Eastern Africa | 189 | 0.4% |
| Eastern Asia | 4,342 | 8.8% |
| Eastern Europe | 753 | 1.5% |
| Ecuador | 43 | 0.1% |
| Egypt | 70 | 0.1% |
| El Salvador | 46 | 0.1% |
| England | 49 | 0.1% |
| Ethiopia | 47 | 0.1% |
| Europe | 2,228 | 4.5% |
| France | 252 | 0.5% |
| Germany | 320 | 0.6% |
| Greece | 46 | 0.1% |
| Guatemala | 54 | 0.1% |
| Guyana | 7 | 0.0% |
| Haiti | 8 | 0.0% |
| Honduras | 2 | 0.0% |
| Hong Kong | 51 | 0.1% |
| Hungary | 72 | 0.2% |
| India | 987 | 2.0% |
| Indonesia | 5 | 0.0% |
| Iran | 645 | 1.3% |
| Iraq | 106 | 0.2% |
| Ireland | 76 | 0.2% |
| Israel | 24 | 0.1% |
| Italy | 18 | 0.0% |
| Jamaica | 9 | 0.0% |
| Japan | 143 | 0.3% |
| Jordan | 30 | 0.1% |
| Kazakhstan | 10 | 0.0% |
| Kenya | 70 | 0.1% |
| Korea | 1,301 | 2.6% |
| Latin America | 881 | 1.8% |
| Latvia | 7 | 0.0% |
| Lebanon | 149 | 0.3% |
| Malaysia | 11 | 0.0% |
| Mexico | 150 | 0.3% |
| Middle Africa | 40 | 0.1% |
| Morocco | 52 | 0.1% |
| Nepal | 82 | 0.2% |
| Netherlands | 59 | 0.1% |
| Northern Africa | 129 | 0.3% |
| Northern Europe | 612 | 1.2% |
| Norway | 9 | 0.0% |
| Oceania | 181 | 0.4% |
| Pakistan | 32 | 0.1% |
| Peru | 124 | 0.3% |
| Philippines | 251 | 0.5% |
| Poland | 91 | 0.2% |
| Portugal | 9 | 0.0% |
| Russia | 371 | 0.7% |
| Saudi Arabia | 21 | 0.0% |
| Scotland | 7 | 0.0% |
| Serbia | 70 | 0.1% |
| Sierra Leone | 48 | 0.1% |
| South Africa | 51 | 0.1% |
| South America | 589 | 1.2% |
| South Central Asia | 1,761 | 3.5% |
| South Eastern Asia | 692 | 1.4% |
| Southern Europe | 157 | 0.3% |
| Spain | 84 | 0.2% |
| Sweden | 124 | 0.3% |
| Syria | 82 | 0.2% |
| Taiwan | 507 | 1.0% |
| Thailand | 81 | 0.2% |
| Turkey | 199 | 0.4% |
| Uganda | 21 | 0.0% |
| Ukraine | 63 | 0.1% |
| Uruguay | 26 | 0.1% |
| Venezuela | 15 | 0.0% |
| Vietnam | 316 | 0.6% |
| Western Africa | 48 | 0.1% |
| Western Asia | 664 | 1.3% |
| Western Europe | 643 | 1.3% |
| Zaire | 24 | 0.1% |
| Zimbabwe | 16 | 0.0% | View All 97 Rows |
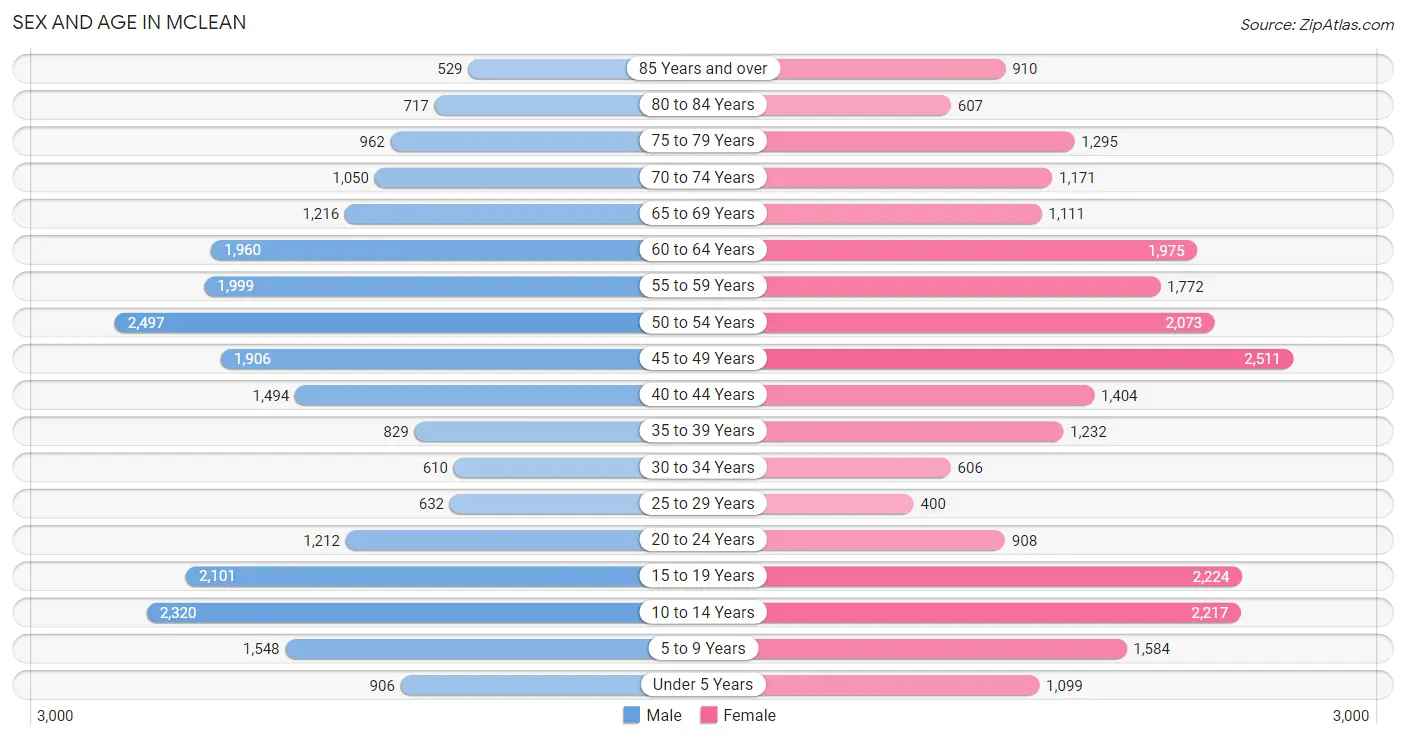
Sex and Age in McLean
Sex and Age in McLean
The most populous age groups in McLean are 50 to 54 Years (2,497 | 10.2%) for men and 45 to 49 Years (2,511 | 10.0%) for women.
| Age Bracket | Male | Female |
| Under 5 Years | 906 (3.7%) | 1,099 (4.4%) |
| 5 to 9 Years | 1,548 (6.3%) | 1,584 (6.3%) |
| 10 to 14 Years | 2,320 (9.5%) | 2,217 (8.8%) |
| 15 to 19 Years | 2,101 (8.6%) | 2,224 (8.9%) |
| 20 to 24 Years | 1,212 (5.0%) | 908 (3.6%) |
| 25 to 29 Years | 632 (2.6%) | 400 (1.6%) |
| 30 to 34 Years | 610 (2.5%) | 606 (2.4%) |
| 35 to 39 Years | 829 (3.4%) | 1,232 (4.9%) |
| 40 to 44 Years | 1,494 (6.1%) | 1,404 (5.6%) |
| 45 to 49 Years | 1,906 (7.8%) | 2,511 (10.0%) |
| 50 to 54 Years | 2,497 (10.2%) | 2,073 (8.3%) |
| 55 to 59 Years | 1,999 (8.2%) | 1,772 (7.1%) |
| 60 to 64 Years | 1,960 (8.0%) | 1,975 (7.9%) |
| 65 to 69 Years | 1,216 (5.0%) | 1,111 (4.4%) |
| 70 to 74 Years | 1,050 (4.3%) | 1,171 (4.7%) |
| 75 to 79 Years | 962 (3.9%) | 1,295 (5.2%) |
| 80 to 84 Years | 717 (2.9%) | 607 (2.4%) |
| 85 Years and over | 529 (2.2%) | 910 (3.6%) |
| Total | 24,488 (100.0%) | 25,099 (100.0%) |
Families and Households in McLean
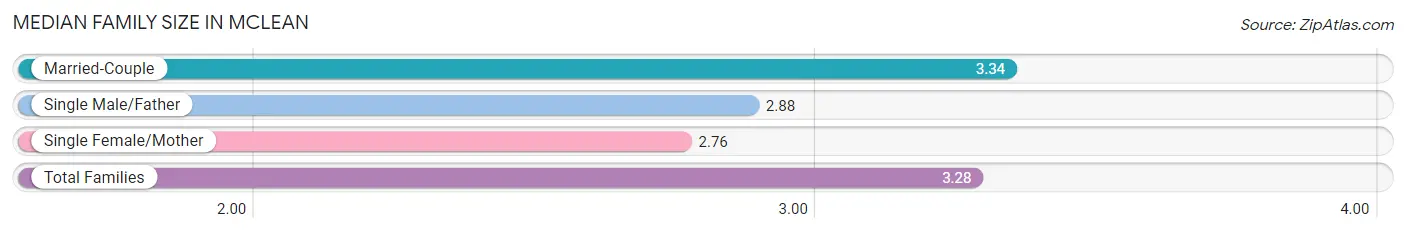
Median Family Size in McLean
The median family size in McLean is 3.28 persons per family, with married-couple families (12,076 | 88.6%) accounting for the largest median family size of 3.34 persons per family. On the other hand, single female/mother families (1,083 | 8.0%) represent the smallest median family size with 2.76 persons per family.
| Family Type | # Families | Family Size |
| Married-Couple | 12,076 (88.6%) | 3.34 |
| Single Male/Father | 463 (3.4%) | 2.88 |
| Single Female/Mother | 1,083 (8.0%) | 2.76 |
| Total Families | 13,622 (100.0%) | 3.28 |
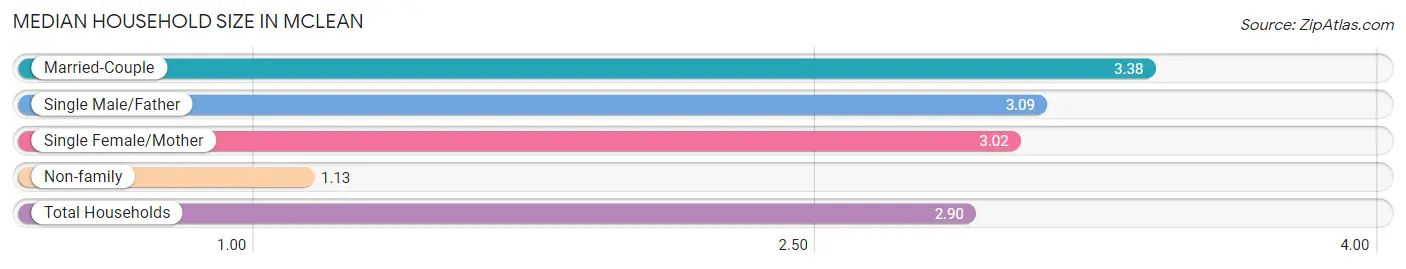
Median Household Size in McLean
The median household size in McLean is 2.90 persons per household, with married-couple households (12,076 | 71.0%) accounting for the largest median household size of 3.38 persons per household. non-family households (3,383 | 19.9%) represent the smallest median household size with 1.13 persons per household.
| Household Type | # Households | Household Size |
| Married-Couple | 12,076 (71.0%) | 3.38 |
| Single Male/Father | 463 (2.7%) | 3.09 |
| Single Female/Mother | 1,083 (6.4%) | 3.02 |
| Non-family | 3,383 (19.9%) | 1.13 |
| Total Households | 17,005 (100.0%) | 2.90 |
Household Size by Marriage Status in McLean
Out of a total of 17,005 households in McLean, 13,622 (80.1%) are family households, while 3,383 (19.9%) are nonfamily households. The most numerous type of family households are 2-person households, comprising 5,007, and the most common type of nonfamily households are 1-person households, comprising 3,026.
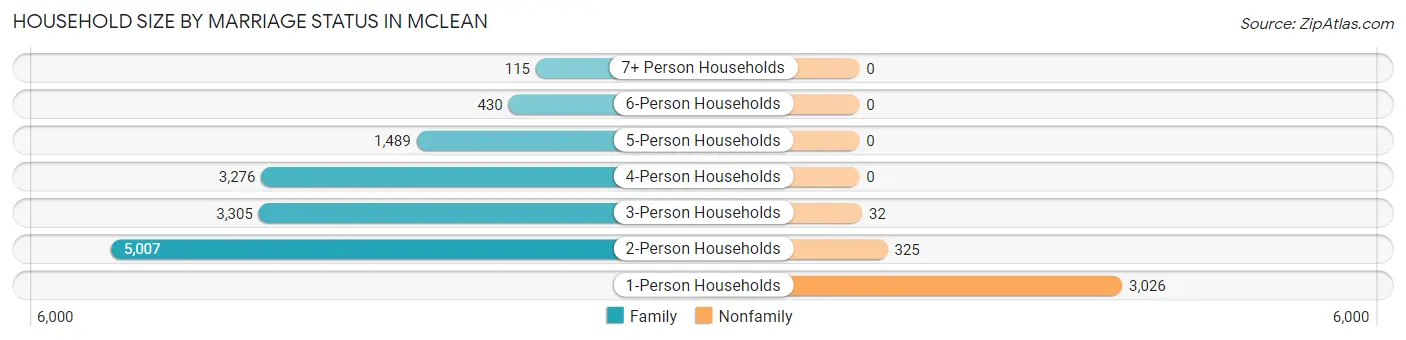
| Household Size | Family Households | Nonfamily Households |
| 1-Person Households | - | 3,026 (17.8%) |
| 2-Person Households | 5,007 (29.4%) | 325 (1.9%) |
| 3-Person Households | 3,305 (19.4%) | 32 (0.2%) |
| 4-Person Households | 3,276 (19.3%) | 0 (0.0%) |
| 5-Person Households | 1,489 (8.8%) | 0 (0.0%) |
| 6-Person Households | 430 (2.5%) | 0 (0.0%) |
| 7+ Person Households | 115 (0.7%) | 0 (0.0%) |
| Total | 13,622 (80.1%) | 3,383 (19.9%) |
Female Fertility in McLean
Fertility by Age in McLean
Average fertility rate in McLean is 22.0 births per 1,000 women. Women in the age bracket of 20 to 34 years have the highest fertility rate with 46.0 births per 1,000 women. Women in the age bracket of 35 to 50 years acount for 57.6% of all women with births.
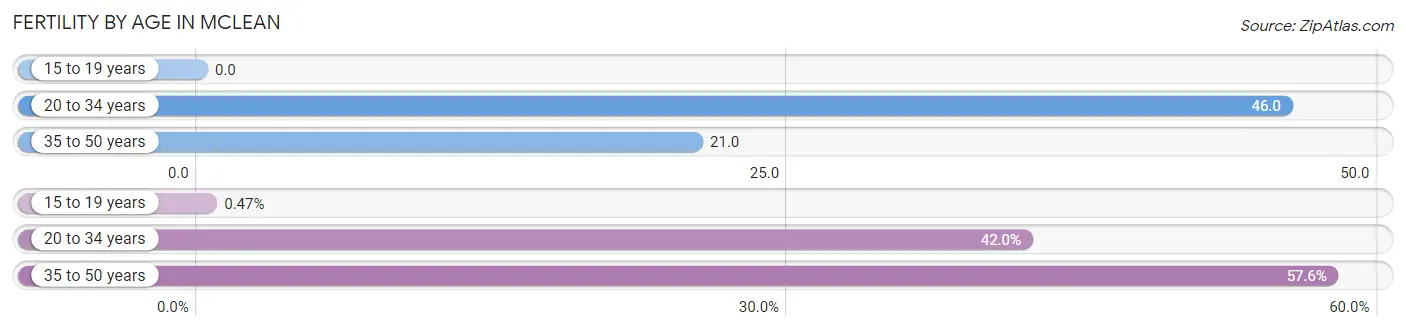
| Age Bracket | Women with Births | Births / 1,000 Women |
| 15 to 19 years | 1 (0.5%) | 0.0 |
| 20 to 34 years | 89 (42.0%) | 46.0 |
| 35 to 50 years | 122 (57.6%) | 21.0 |
| Total | 212 (100.0%) | 22.0 |
Fertility by Age by Marriage Status in McLean
79.7% of women with births (212) in McLean are married. The highest percentage of unmarried women with births falls into 15 to 19 years age bracket with 100.0% of them unmarried at the time of birth, while the lowest percentage of unmarried women with births belong to 20 to 34 years age bracket with 18.0% of them unmarried.
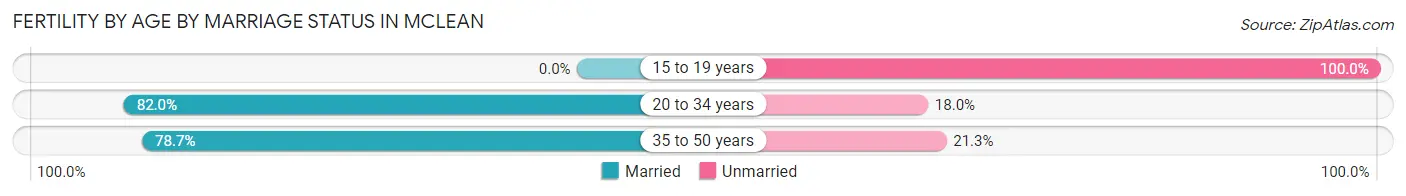
| Age Bracket | Married | Unmarried |
| 15 to 19 years | 0 (0.0%) | 1 (100.0%) |
| 20 to 34 years | 73 (82.0%) | 16 (18.0%) |
| 35 to 50 years | 96 (78.7%) | 26 (21.3%) |
| Total | 169 (79.7%) | 43 (20.3%) |
Fertility by Education in McLean
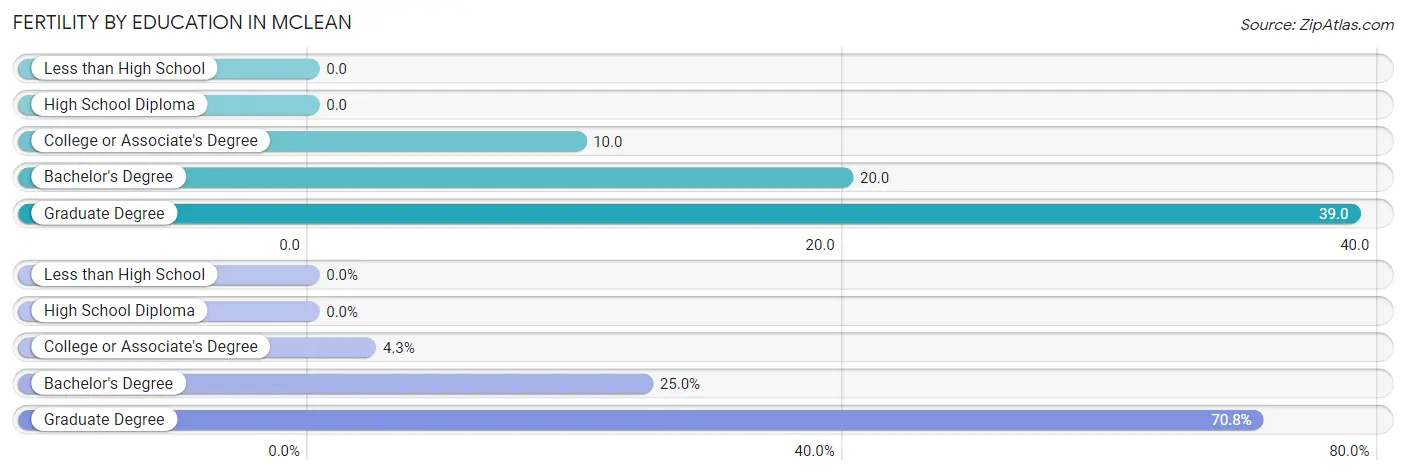
| Educational Attainment | Women with Births | Births / 1,000 Women |
| Less than High School | 0 (0.0%) | 0.0 |
| High School Diploma | 0 (0.0%) | 0.0 |
| College or Associate's Degree | 9 (4.3%) | 10.0 |
| Bachelor's Degree | 53 (25.0%) | 20.0 |
| Graduate Degree | 150 (70.8%) | 39.0 |
| Total | 212 (100.0%) | 22.0 |
Fertility by Education by Marriage Status in McLean
20.3% of women with births in McLean are unmarried. Women with the educational attainment of bachelor's degree are most likely to be married with 100.0% of them married at childbirth, while women with the educational attainment of graduate degree are least likely to be married with 28.0% of them unmarried at childbirth.
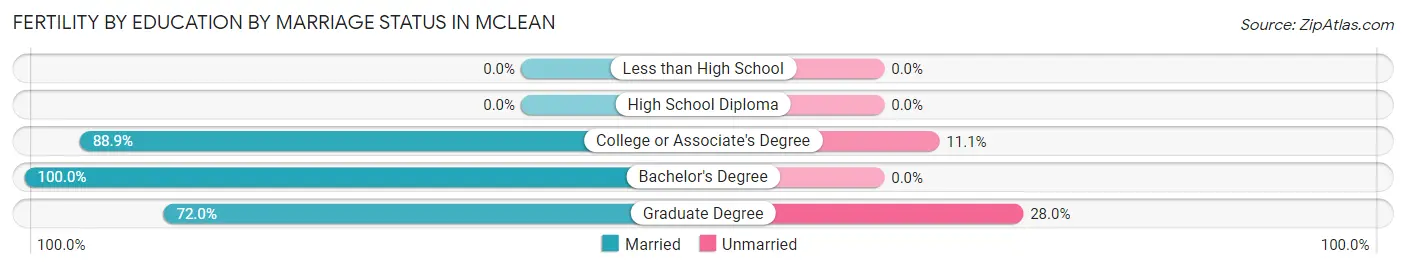
| Educational Attainment | Married | Unmarried |
| Less than High School | 0 (0.0%) | 0 (0.0%) |
| High School Diploma | 0 (0.0%) | 0 (0.0%) |
| College or Associate's Degree | 8 (88.9%) | 1 (11.1%) |
| Bachelor's Degree | 53 (100.0%) | 0 (0.0%) |
| Graduate Degree | 108 (72.0%) | 42 (28.0%) |
| Total | 169 (79.7%) | 43 (20.3%) |
Employment Characteristics in McLean
Employment by Class of Employer in McLean
Among the 23,808 employed individuals in McLean, private company employees (12,430 | 52.2%), federal government employees (3,832 | 16.1%), and not-for-profit organizations (3,030 | 12.7%) make up the most common classes of employment.
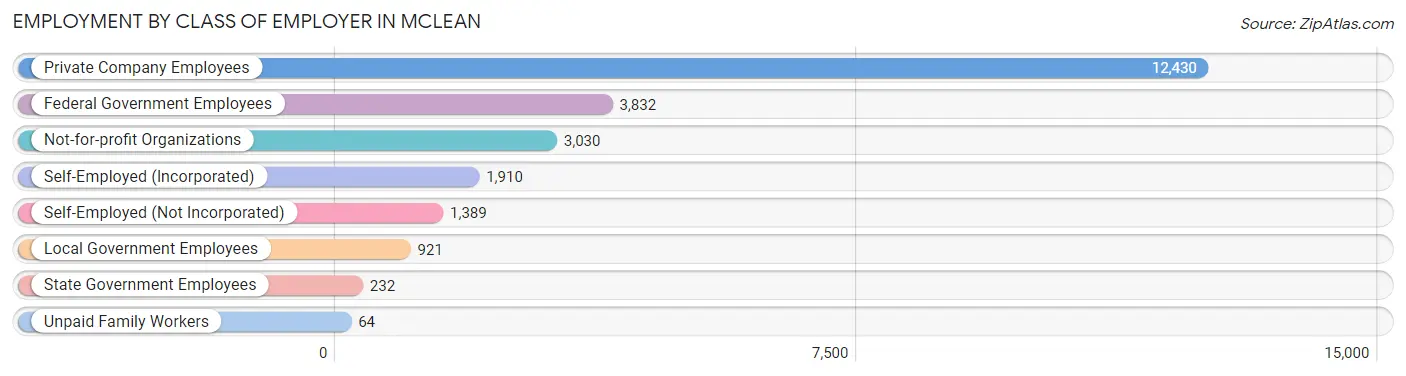
| Employer Class | # Employees | % Employees |
| Private Company Employees | 12,430 | 52.2% |
| Self-Employed (Incorporated) | 1,910 | 8.0% |
| Self-Employed (Not Incorporated) | 1,389 | 5.8% |
| Not-for-profit Organizations | 3,030 | 12.7% |
| Local Government Employees | 921 | 3.9% |
| State Government Employees | 232 | 1.0% |
| Federal Government Employees | 3,832 | 16.1% |
| Unpaid Family Workers | 64 | 0.3% |
| Total | 23,808 | 100.0% |
Employment Status by Age in McLean
According to the labor force statistics for McLean, out of the total population over 16 years of age (39,021), 63.2% or 24,661 individuals are in the labor force, with 2.1% or 518 of them unemployed. The age group with the highest labor force participation rate is 35 to 44 years, with 85.7% or 4,250 individuals in the labor force. Within the labor force, the 20 to 24 years age range has the highest percentage of unemployed individuals, with 6.0% or 95 of them being unemployed.
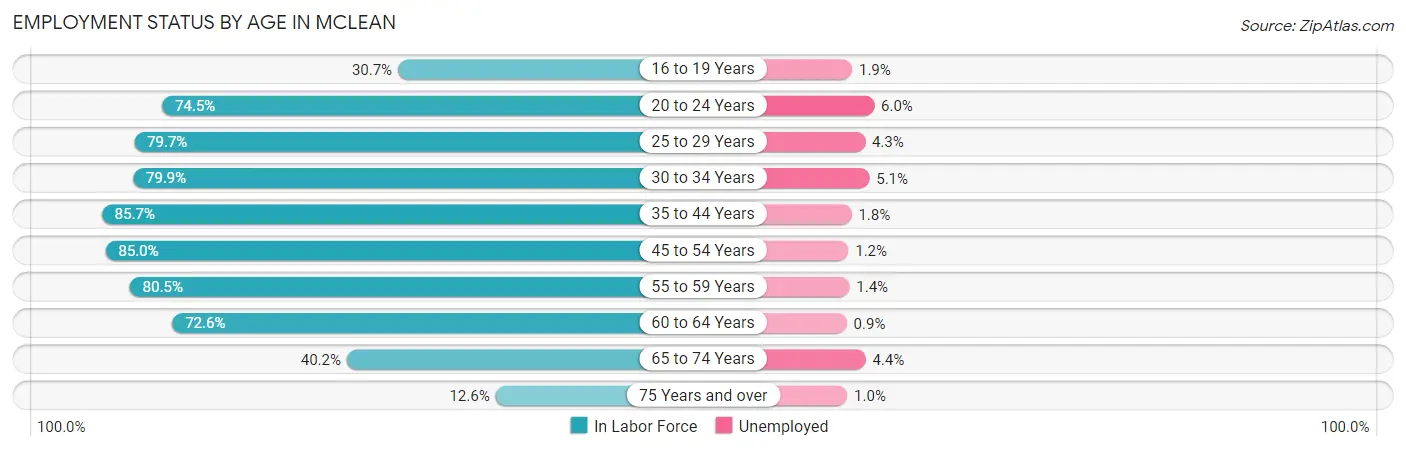
| Age Bracket | In Labor Force | Unemployed |
| 16 to 19 Years | 1,054 (30.7%) | 20 (1.9%) |
| 20 to 24 Years | 1,579 (74.5%) | 95 (6.0%) |
| 25 to 29 Years | 823 (79.7%) | 35 (4.3%) |
| 30 to 34 Years | 972 (79.9%) | 50 (5.1%) |
| 35 to 44 Years | 4,250 (85.7%) | 76 (1.8%) |
| 45 to 54 Years | 7,639 (85.0%) | 92 (1.2%) |
| 55 to 59 Years | 3,036 (80.5%) | 43 (1.4%) |
| 60 to 64 Years | 2,857 (72.6%) | 26 (0.9%) |
| 65 to 74 Years | 1,828 (40.2%) | 80 (4.4%) |
| 75 Years and over | 633 (12.6%) | 6 (1.0%) |
| Total | 24,661 (63.2%) | 518 (2.1%) |
Employment Status by Educational Attainment in McLean
According to labor force statistics for McLean, 81.9% of individuals (19,574) out of the total population between 25 and 64 years of age (23,900) are in the labor force, with 1.6% or 313 of them being unemployed. The group with the highest labor force participation rate are those with the educational attainment of bachelor's degree or higher, with 83.9% or 17,823 individuals in the labor force. Within the labor force, individuals with college / associate degree education have the highest percentage of unemployment, with 3.1% or 32 of them being unemployed.
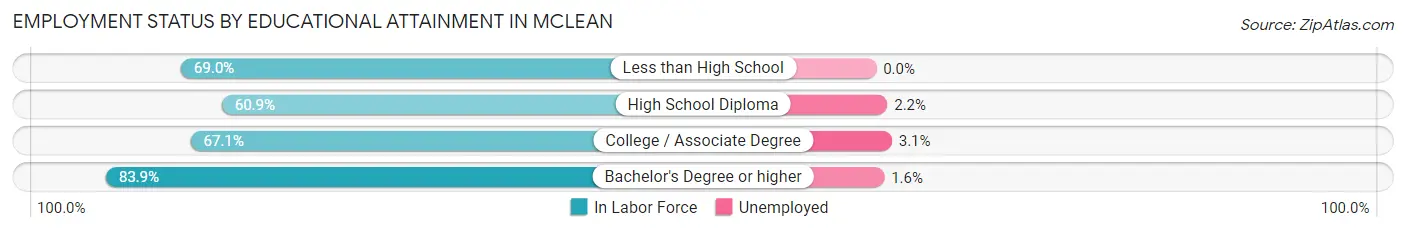
| Educational Attainment | In Labor Force | Unemployed |
| Less than High School | 298 (69.0%) | 0 (0.0%) |
| High School Diploma | 410 (60.9%) | 15 (2.2%) |
| College / Associate Degree | 1,041 (67.1%) | 48 (3.1%) |
| Bachelor's Degree or higher | 17,823 (83.9%) | 340 (1.6%) |
| Total | 19,574 (81.9%) | 382 (1.6%) |
Employment Occupations by Sex in McLean
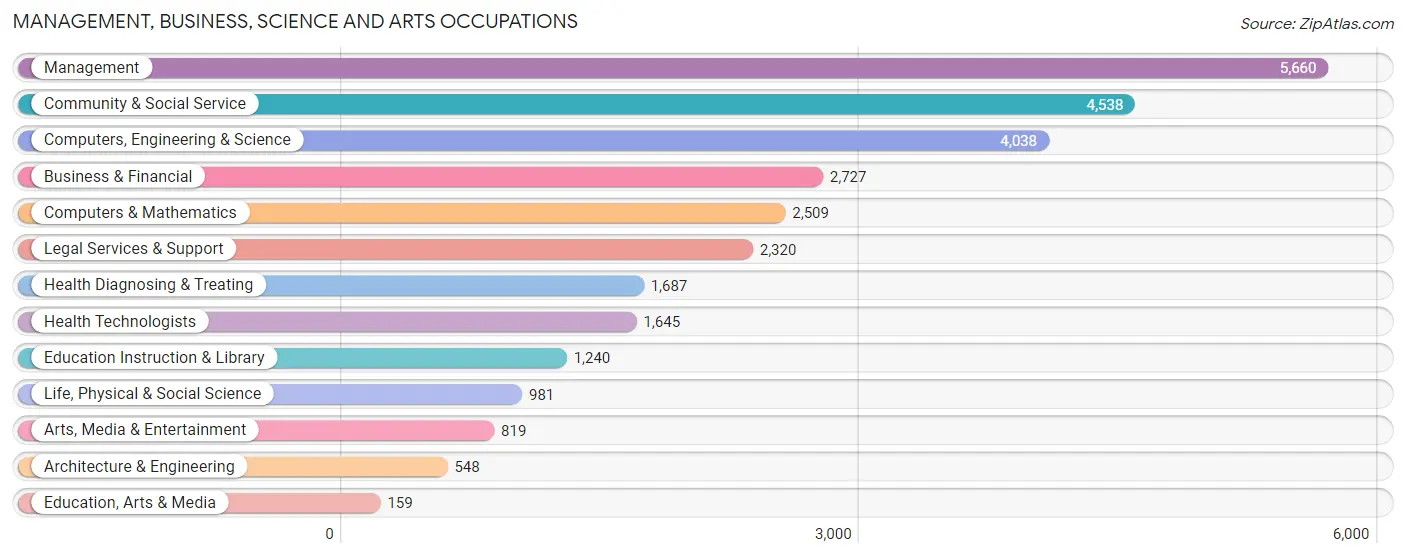
Management, Business, Science and Arts Occupations
The most common Management, Business, Science and Arts occupations in McLean are Management (5,660 | 23.5%), Community & Social Service (4,538 | 18.9%), Computers, Engineering & Science (4,038 | 16.8%), Business & Financial (2,727 | 11.3%), and Computers & Mathematics (2,509 | 10.4%).
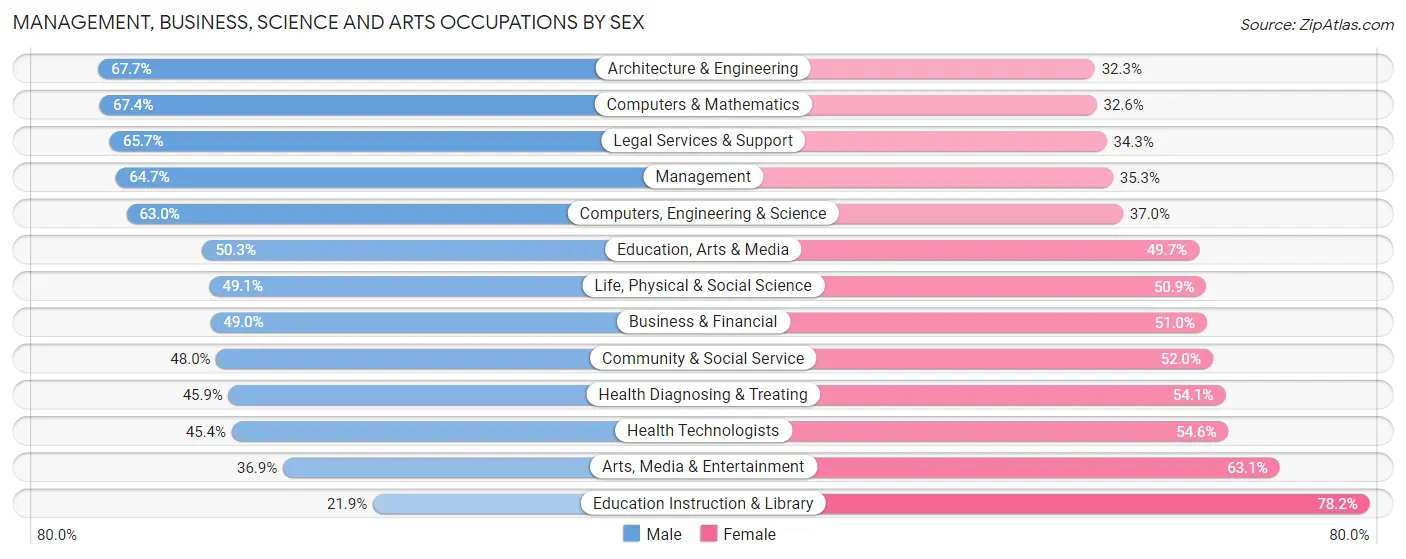
Management, Business, Science and Arts Occupations by Sex
Within the Management, Business, Science and Arts occupations in McLean, the most male-oriented occupations are Architecture & Engineering (67.7%), Computers & Mathematics (67.4%), and Legal Services & Support (65.7%), while the most female-oriented occupations are Education Instruction & Library (78.1%), Arts, Media & Entertainment (63.1%), and Health Technologists (54.6%).
| Occupation | Male | Female |
| Management | 3,661 (64.7%) | 1,999 (35.3%) |
| Business & Financial | 1,336 (49.0%) | 1,391 (51.0%) |
| Computers, Engineering & Science | 2,544 (63.0%) | 1,494 (37.0%) |
| Computers & Mathematics | 1,691 (67.4%) | 818 (32.6%) |
| Architecture & Engineering | 371 (67.7%) | 177 (32.3%) |
| Life, Physical & Social Science | 482 (49.1%) | 499 (50.9%) |
| Community & Social Service | 2,178 (48.0%) | 2,360 (52.0%) |
| Education, Arts & Media | 80 (50.3%) | 79 (49.7%) |
| Legal Services & Support | 1,525 (65.7%) | 795 (34.3%) |
| Education Instruction & Library | 271 (21.8%) | 969 (78.1%) |
| Arts, Media & Entertainment | 302 (36.9%) | 517 (63.1%) |
| Health Diagnosing & Treating | 775 (45.9%) | 912 (54.1%) |
| Health Technologists | 747 (45.4%) | 898 (54.6%) |
| Total (Category) | 10,494 (56.3%) | 8,156 (43.7%) |
| Total (Overall) | 13,180 (54.8%) | 10,873 (45.2%) |
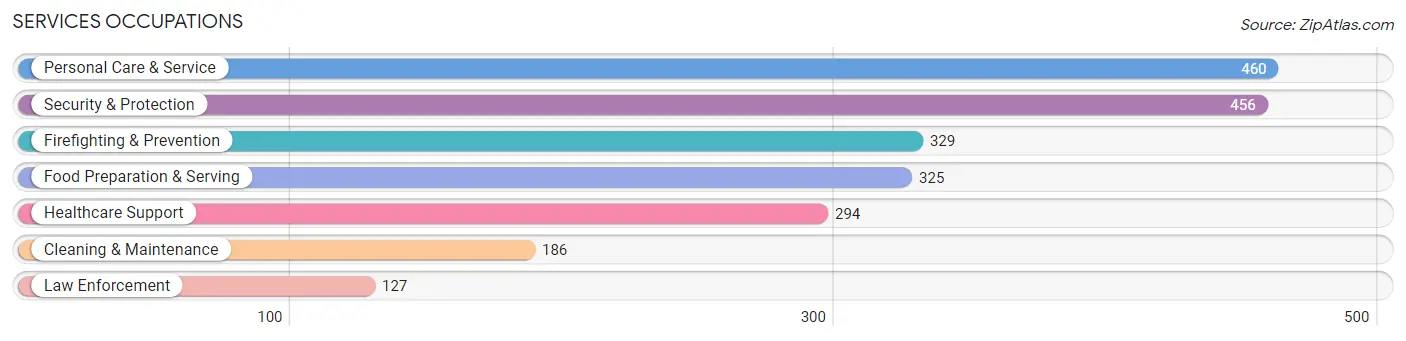
Services Occupations
The most common Services occupations in McLean are Personal Care & Service (460 | 1.9%), Security & Protection (456 | 1.9%), Firefighting & Prevention (329 | 1.4%), Food Preparation & Serving (325 | 1.3%), and Healthcare Support (294 | 1.2%).
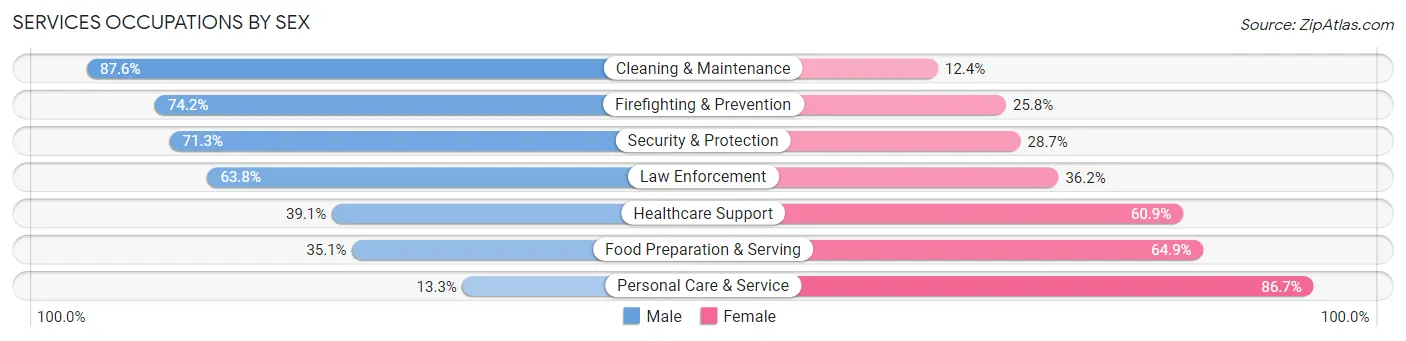
Services Occupations by Sex
Within the Services occupations in McLean, the most male-oriented occupations are Cleaning & Maintenance (87.6%), Firefighting & Prevention (74.2%), and Security & Protection (71.3%), while the most female-oriented occupations are Personal Care & Service (86.7%), Food Preparation & Serving (64.9%), and Healthcare Support (60.9%).
| Occupation | Male | Female |
| Healthcare Support | 115 (39.1%) | 179 (60.9%) |
| Security & Protection | 325 (71.3%) | 131 (28.7%) |
| Firefighting & Prevention | 244 (74.2%) | 85 (25.8%) |
| Law Enforcement | 81 (63.8%) | 46 (36.2%) |
| Food Preparation & Serving | 114 (35.1%) | 211 (64.9%) |
| Cleaning & Maintenance | 163 (87.6%) | 23 (12.4%) |
| Personal Care & Service | 61 (13.3%) | 399 (86.7%) |
| Total (Category) | 778 (45.2%) | 943 (54.8%) |
| Total (Overall) | 13,180 (54.8%) | 10,873 (45.2%) |
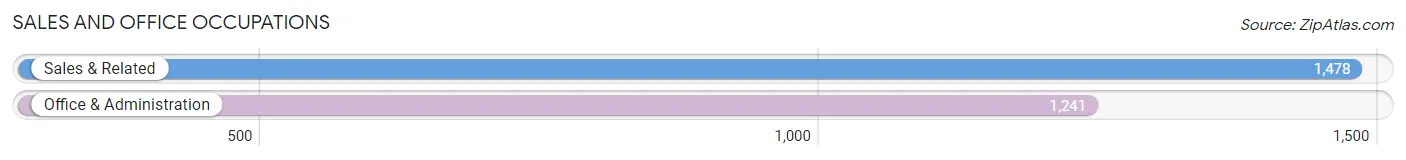
Sales and Office Occupations
The most common Sales and Office occupations in McLean are Sales & Related (1,478 | 6.1%), and Office & Administration (1,241 | 5.2%).
Sales and Office Occupations by Sex
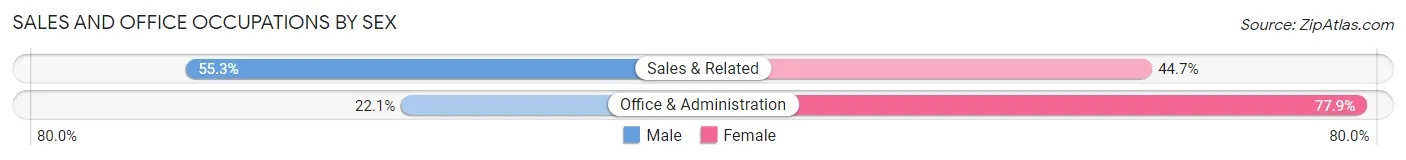
| Occupation | Male | Female |
| Sales & Related | 817 (55.3%) | 661 (44.7%) |
| Office & Administration | 274 (22.1%) | 967 (77.9%) |
| Total (Category) | 1,091 (40.1%) | 1,628 (59.9%) |
| Total (Overall) | 13,180 (54.8%) | 10,873 (45.2%) |
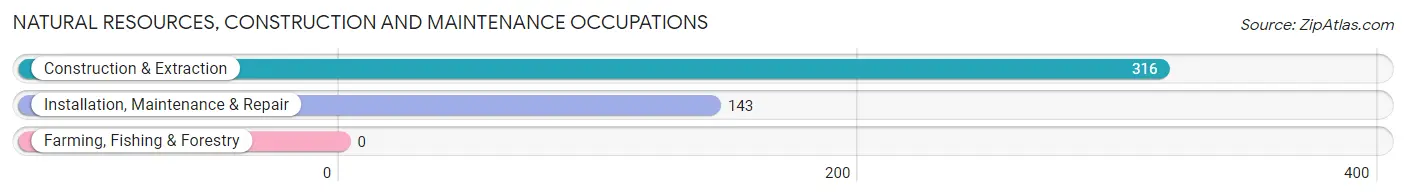
Natural Resources, Construction and Maintenance Occupations
The most common Natural Resources, Construction and Maintenance occupations in McLean are Construction & Extraction (316 | 1.3%), and Installation, Maintenance & Repair (143 | 0.6%).
Natural Resources, Construction and Maintenance Occupations by Sex
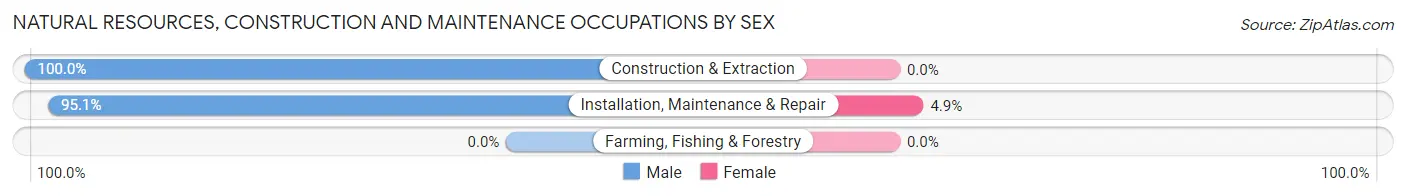
| Occupation | Male | Female |
| Farming, Fishing & Forestry | 0 (0.0%) | 0 (0.0%) |
| Construction & Extraction | 316 (100.0%) | 0 (0.0%) |
| Installation, Maintenance & Repair | 136 (95.1%) | 7 (4.9%) |
| Total (Category) | 452 (98.5%) | 7 (1.5%) |
| Total (Overall) | 13,180 (54.8%) | 10,873 (45.2%) |
Production, Transportation and Moving Occupations
The most common Production, Transportation and Moving occupations in McLean are Transportation (233 | 1.0%), Production (154 | 0.6%), and Material Moving (117 | 0.5%).
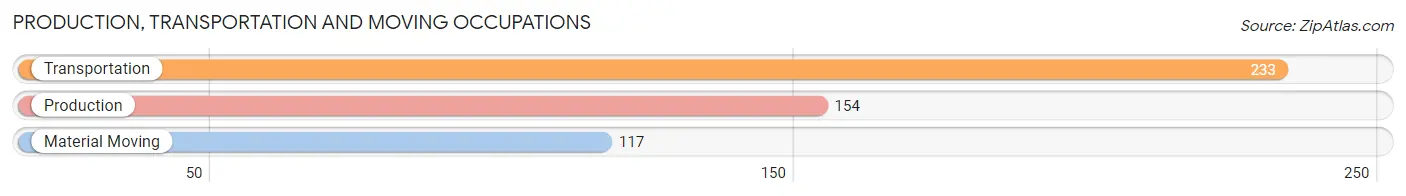
Production, Transportation and Moving Occupations by Sex
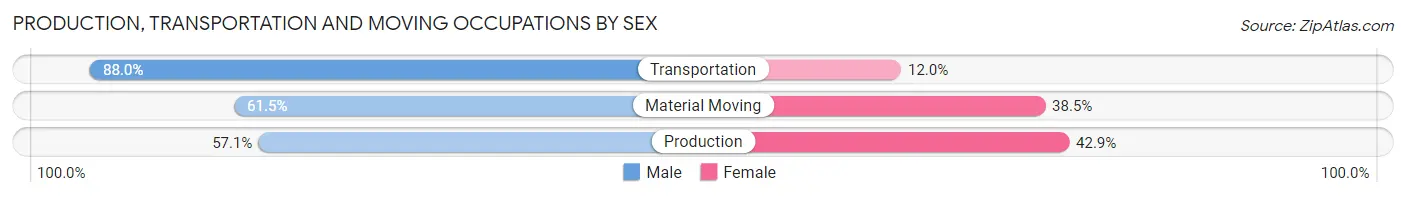
| Occupation | Male | Female |
| Production | 88 (57.1%) | 66 (42.9%) |
| Transportation | 205 (88.0%) | 28 (12.0%) |
| Material Moving | 72 (61.5%) | 45 (38.5%) |
| Total (Category) | 365 (72.4%) | 139 (27.6%) |
| Total (Overall) | 13,180 (54.8%) | 10,873 (45.2%) |
Employment Industries by Sex in McLean
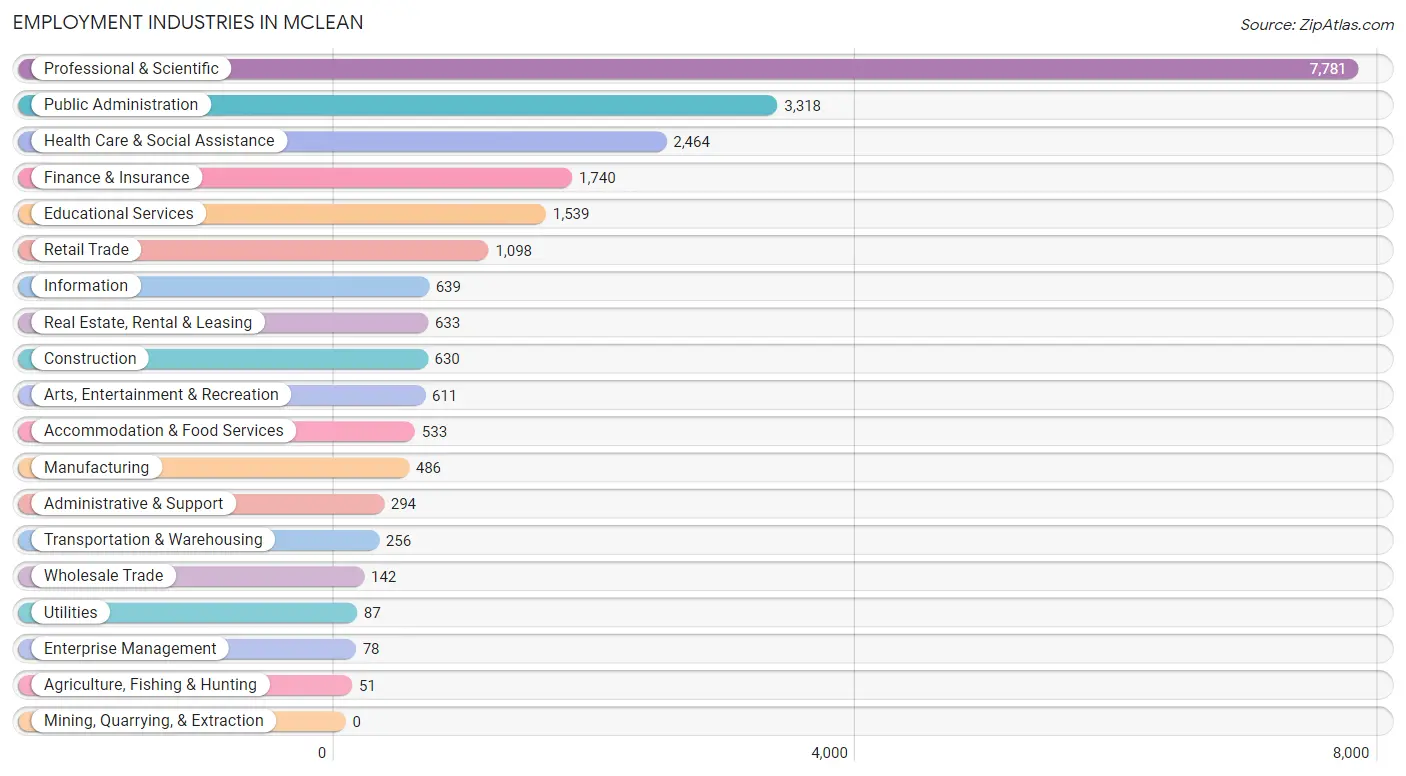
Employment Industries in McLean
The major employment industries in McLean include Professional & Scientific (7,781 | 32.4%), Public Administration (3,318 | 13.8%), Health Care & Social Assistance (2,464 | 10.2%), Finance & Insurance (1,740 | 7.2%), and Educational Services (1,539 | 6.4%).
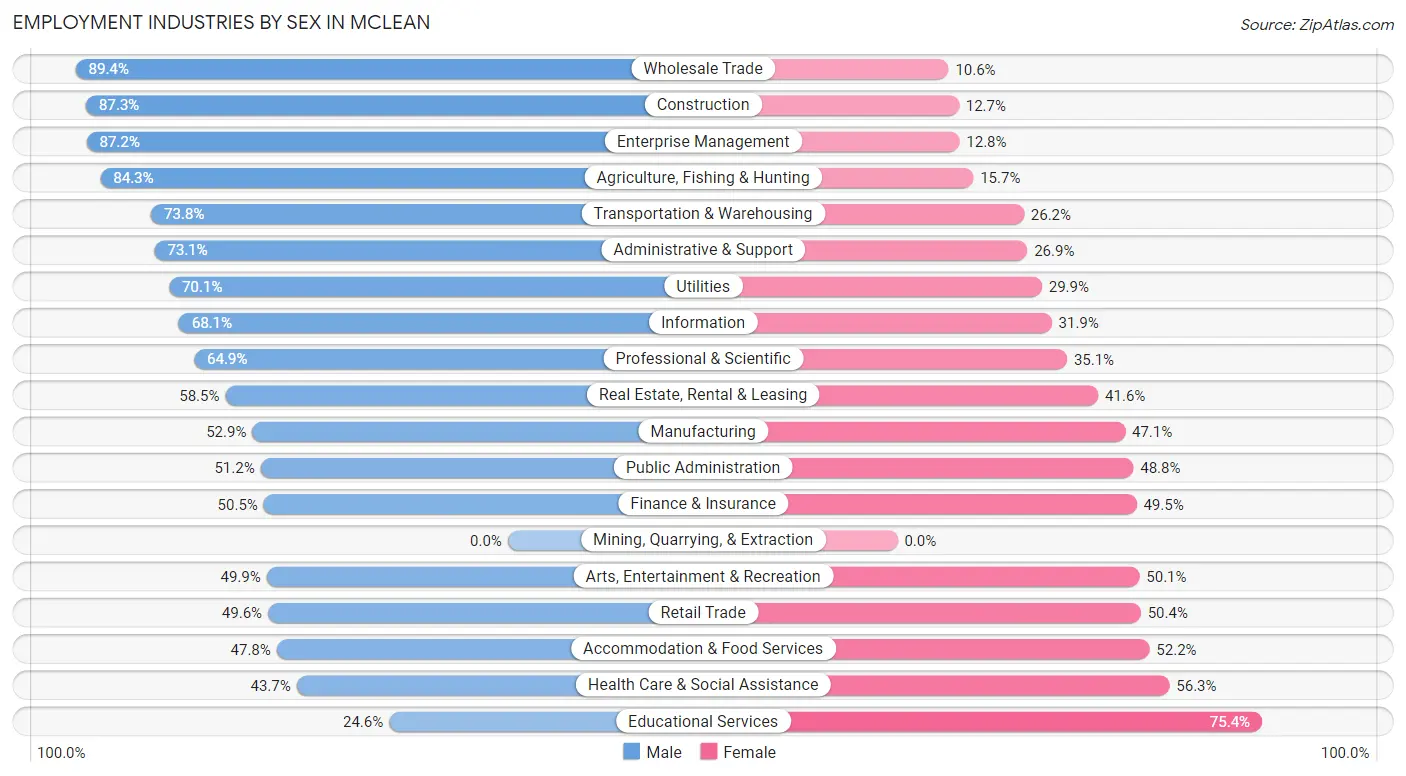
Employment Industries by Sex in McLean
The McLean industries that see more men than women are Wholesale Trade (89.4%), Construction (87.3%), and Enterprise Management (87.2%), whereas the industries that tend to have a higher number of women are Educational Services (75.4%), Health Care & Social Assistance (56.3%), and Accommodation & Food Services (52.2%).
| Industry | Male | Female |
| Agriculture, Fishing & Hunting | 43 (84.3%) | 8 (15.7%) |
| Mining, Quarrying, & Extraction | 0 (0.0%) | 0 (0.0%) |
| Construction | 550 (87.3%) | 80 (12.7%) |
| Manufacturing | 257 (52.9%) | 229 (47.1%) |
| Wholesale Trade | 127 (89.4%) | 15 (10.6%) |
| Retail Trade | 545 (49.6%) | 553 (50.4%) |
| Transportation & Warehousing | 189 (73.8%) | 67 (26.2%) |
| Utilities | 61 (70.1%) | 26 (29.9%) |
| Information | 435 (68.1%) | 204 (31.9%) |
| Finance & Insurance | 879 (50.5%) | 861 (49.5%) |
| Real Estate, Rental & Leasing | 370 (58.5%) | 263 (41.5%) |
| Professional & Scientific | 5,051 (64.9%) | 2,730 (35.1%) |
| Enterprise Management | 68 (87.2%) | 10 (12.8%) |
| Administrative & Support | 215 (73.1%) | 79 (26.9%) |
| Educational Services | 378 (24.6%) | 1,161 (75.4%) |
| Health Care & Social Assistance | 1,077 (43.7%) | 1,387 (56.3%) |
| Arts, Entertainment & Recreation | 305 (49.9%) | 306 (50.1%) |
| Accommodation & Food Services | 255 (47.8%) | 278 (52.2%) |
| Public Administration | 1,698 (51.2%) | 1,620 (48.8%) |
| Total | 13,180 (54.8%) | 10,873 (45.2%) |
Education in McLean
School Enrollment in McLean
The most common levels of schooling among the 14,491 students in McLean are high school (4,073 | 28.1%), middle school (3,501 | 24.2%), and elementary school (2,705 | 18.7%).
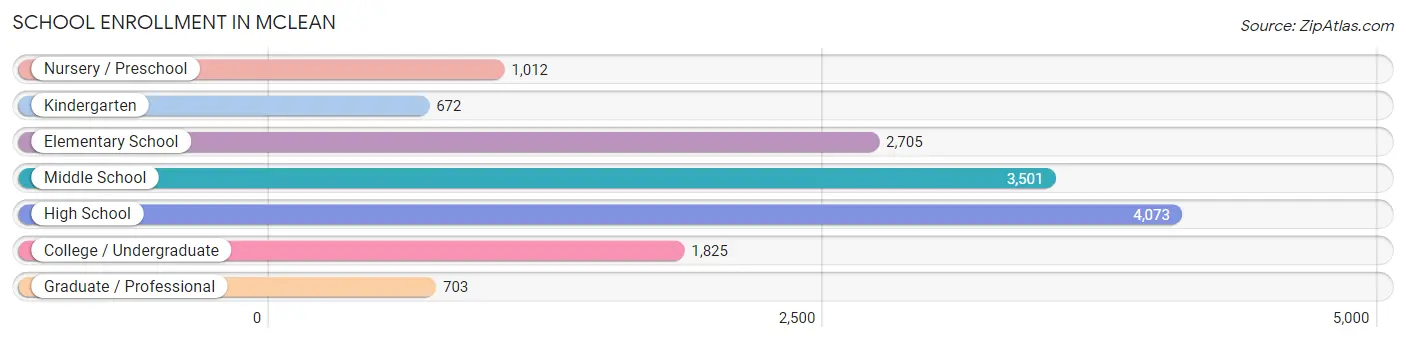
| School Level | # Students | % Students |
| Nursery / Preschool | 1,012 | 7.0% |
| Kindergarten | 672 | 4.6% |
| Elementary School | 2,705 | 18.7% |
| Middle School | 3,501 | 24.2% |
| High School | 4,073 | 28.1% |
| College / Undergraduate | 1,825 | 12.6% |
| Graduate / Professional | 703 | 4.9% |
| Total | 14,491 | 100.0% |
School Enrollment by Age by Funding Source in McLean
Out of a total of 14,491 students who are enrolled in schools in McLean, 4,144 (28.6%) attend a private institution, while the remaining 10,347 (71.4%) are enrolled in public schools. The age group of 3 to 4 year olds has the highest likelihood of being enrolled in private schools, with 773 (91.9% in the age bracket) enrolled. Conversely, the age group of 10 to 14 year olds has the lowest likelihood of being enrolled in a private school, with 3,743 (83.5% in the age bracket) attending a public institution.
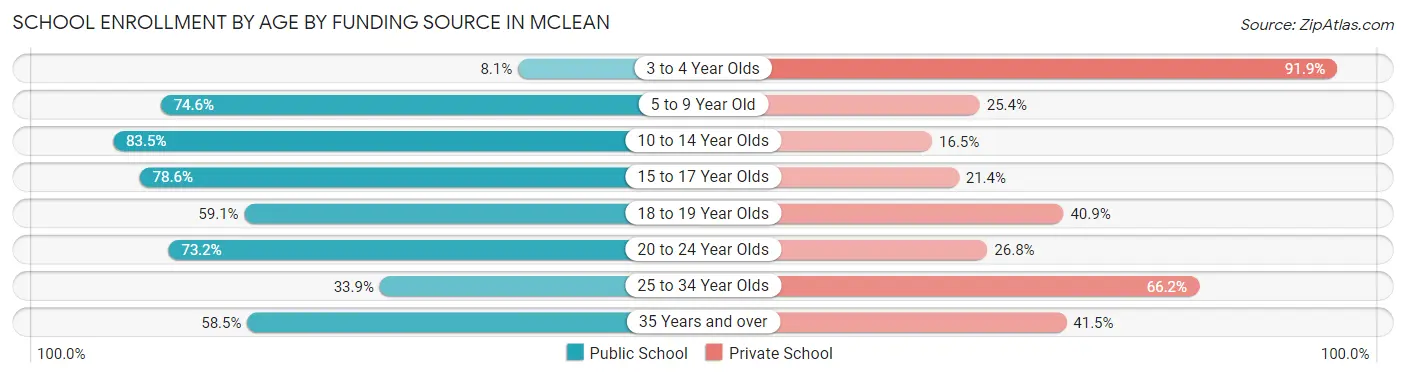
| Age Bracket | Public School | Private School |
| 3 to 4 Year Olds | 68 (8.1%) | 773 (91.9%) |
| 5 to 9 Year Old | 2,296 (74.6%) | 780 (25.4%) |
| 10 to 14 Year Olds | 3,743 (83.5%) | 738 (16.5%) |
| 15 to 17 Year Olds | 2,320 (78.6%) | 633 (21.4%) |
| 18 to 19 Year Olds | 743 (59.1%) | 515 (40.9%) |
| 20 to 24 Year Olds | 777 (73.2%) | 284 (26.8%) |
| 25 to 34 Year Olds | 109 (33.9%) | 213 (66.1%) |
| 35 Years and over | 292 (58.5%) | 207 (41.5%) |
| Total | 10,347 (71.4%) | 4,144 (28.6%) |
Educational Attainment by Field of Study in McLean
Social sciences (6,237 | 20.1%), business (4,613 | 14.9%), engineering (3,182 | 10.3%), literature & languages (2,391 | 7.7%), and bio, nature & agricultural (2,156 | 7.0%) are the most common fields of study among 31,002 individuals in McLean who have obtained a bachelor's degree or higher.
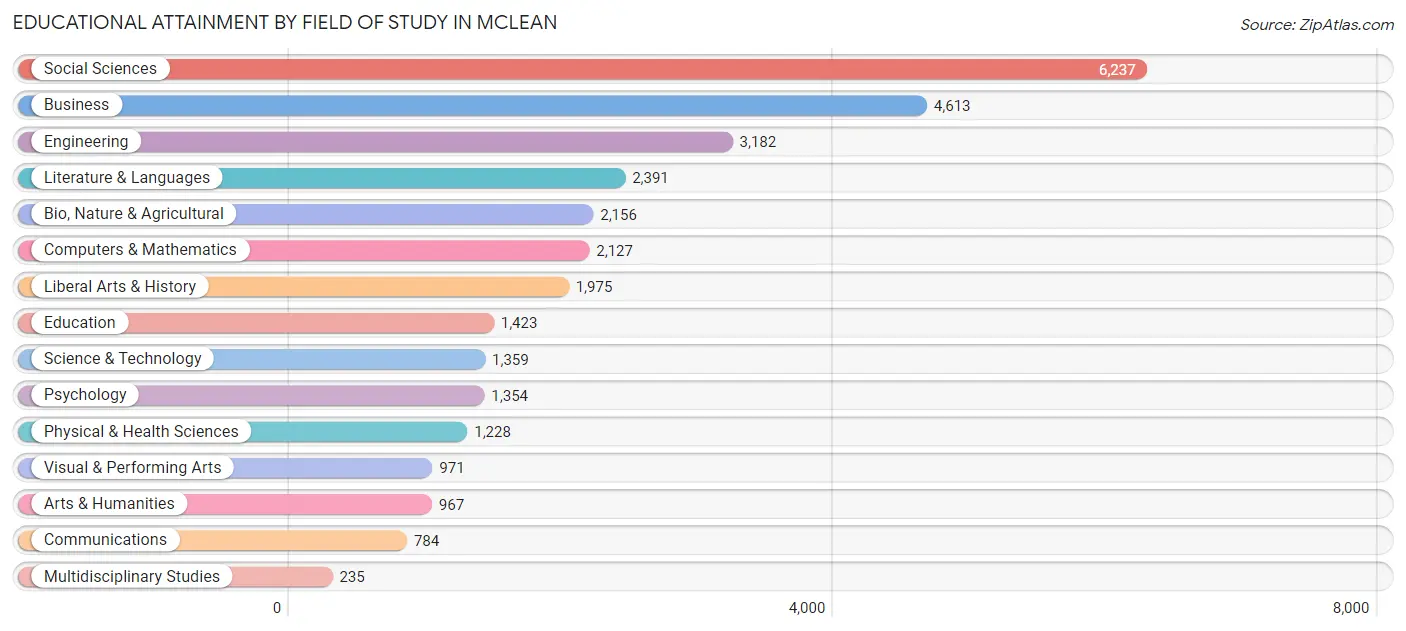
| Field of Study | # Graduates | % Graduates |
| Computers & Mathematics | 2,127 | 6.9% |
| Bio, Nature & Agricultural | 2,156 | 7.0% |
| Physical & Health Sciences | 1,228 | 4.0% |
| Psychology | 1,354 | 4.4% |
| Social Sciences | 6,237 | 20.1% |
| Engineering | 3,182 | 10.3% |
| Multidisciplinary Studies | 235 | 0.8% |
| Science & Technology | 1,359 | 4.4% |
| Business | 4,613 | 14.9% |
| Education | 1,423 | 4.6% |
| Literature & Languages | 2,391 | 7.7% |
| Liberal Arts & History | 1,975 | 6.4% |
| Visual & Performing Arts | 971 | 3.1% |
| Communications | 784 | 2.5% |
| Arts & Humanities | 967 | 3.1% |
| Total | 31,002 | 100.0% |
Transportation & Commute in McLean
Vehicle Availability by Sex in McLean
The most prevalent vehicle ownership categories in McLean are males with 2 vehicles (6,003, accounting for 45.5%) and females with 2 vehicles (4,776, making up 56.7%).
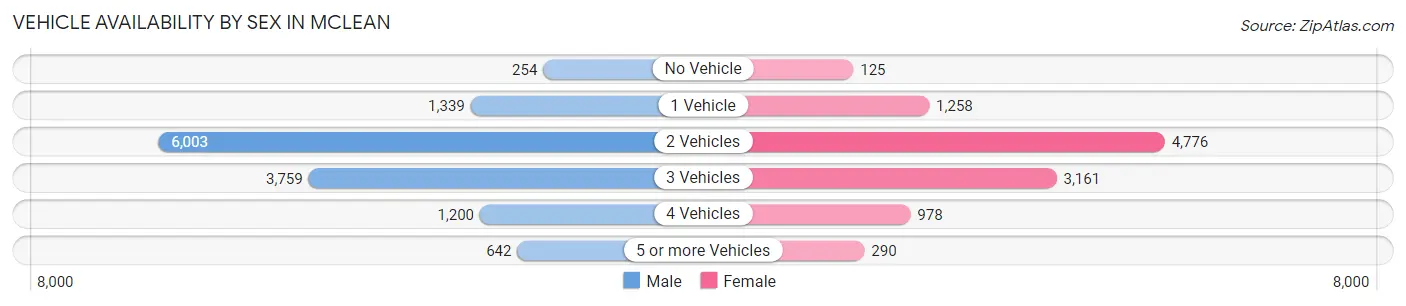
| Vehicles Available | Male | Female |
| No Vehicle | 254 (1.9%) | 125 (1.2%) |
| 1 Vehicle | 1,339 (10.2%) | 1,258 (11.9%) |
| 2 Vehicles | 6,003 (45.5%) | 4,776 (45.1%) |
| 3 Vehicles | 3,759 (28.5%) | 3,161 (29.8%) |
| 4 Vehicles | 1,200 (9.1%) | 978 (9.2%) |
| 5 or more Vehicles | 642 (4.9%) | 290 (2.7%) |
| Total | 13,197 (100.0%) | 10,588 (100.0%) |
Commute Time in McLean
The most frequently occuring commute durations in McLean are 30 to 34 minutes (3,004 commuters, 18.5%), 20 to 24 minutes (2,885 commuters, 17.7%), and 15 to 19 minutes (2,144 commuters, 13.2%).
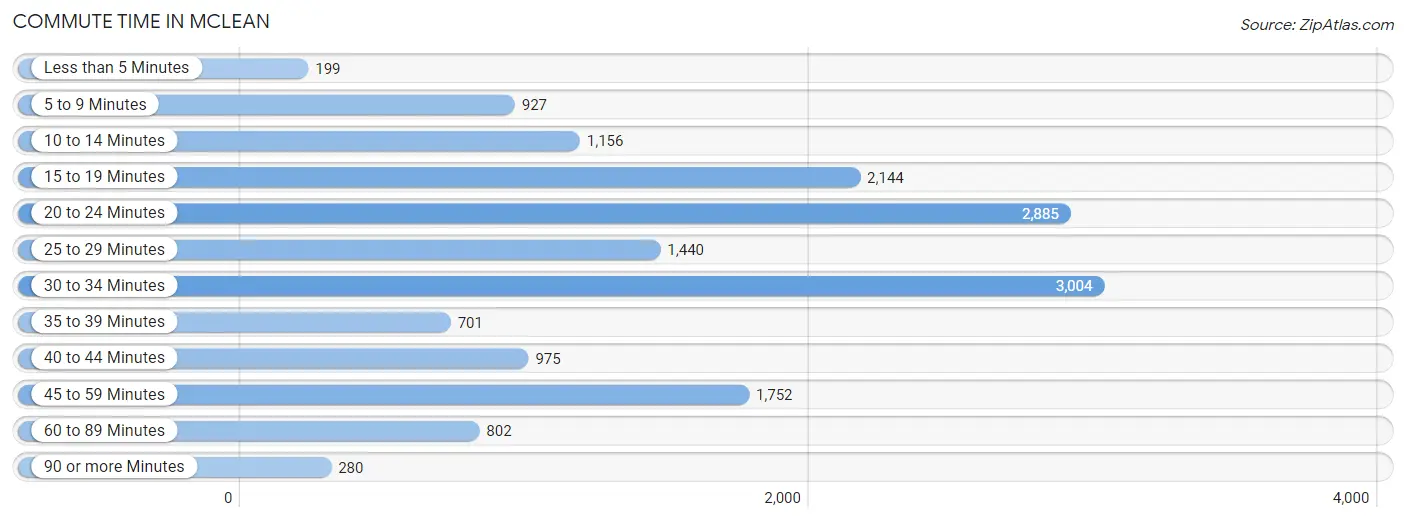
| Commute Time | # Commuters | % Commuters |
| Less than 5 Minutes | 199 | 1.2% |
| 5 to 9 Minutes | 927 | 5.7% |
| 10 to 14 Minutes | 1,156 | 7.1% |
| 15 to 19 Minutes | 2,144 | 13.2% |
| 20 to 24 Minutes | 2,885 | 17.7% |
| 25 to 29 Minutes | 1,440 | 8.8% |
| 30 to 34 Minutes | 3,004 | 18.5% |
| 35 to 39 Minutes | 701 | 4.3% |
| 40 to 44 Minutes | 975 | 6.0% |
| 45 to 59 Minutes | 1,752 | 10.8% |
| 60 to 89 Minutes | 802 | 4.9% |
| 90 or more Minutes | 280 | 1.7% |
Commute Time by Sex in McLean
The most common commute times in McLean are 30 to 34 minutes (1,824 commuters, 19.8%) for males and 20 to 24 minutes (1,206 commuters, 17.1%) for females.
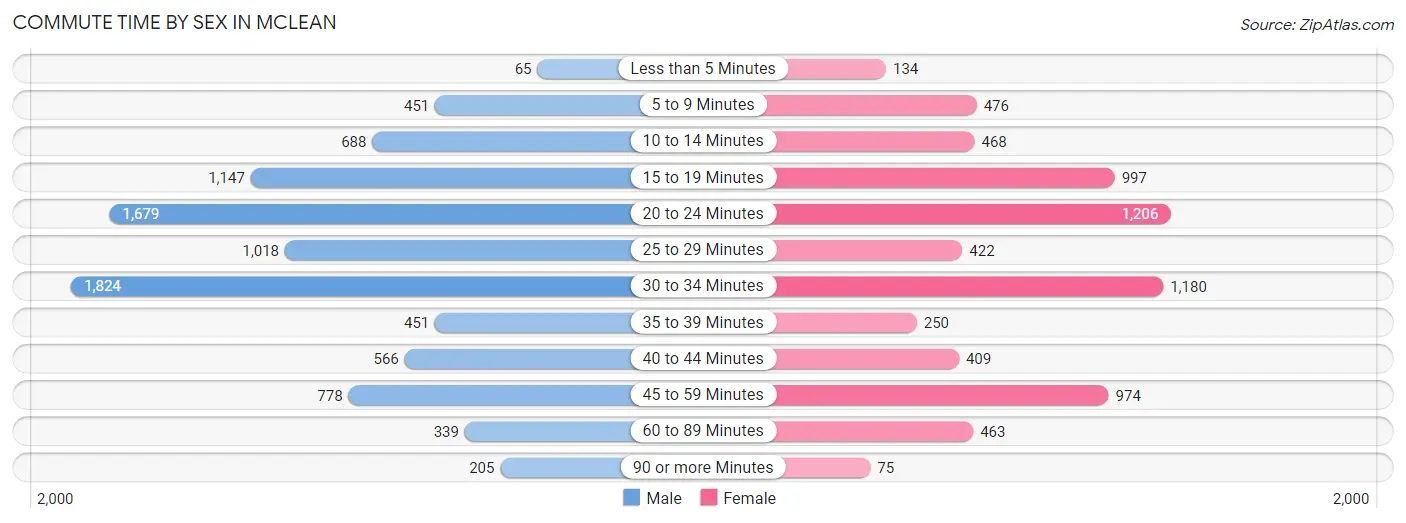
| Commute Time | Male | Female |
| Less than 5 Minutes | 65 (0.7%) | 134 (1.9%) |
| 5 to 9 Minutes | 451 (4.9%) | 476 (6.8%) |
| 10 to 14 Minutes | 688 (7.5%) | 468 (6.6%) |
| 15 to 19 Minutes | 1,147 (12.4%) | 997 (14.1%) |
| 20 to 24 Minutes | 1,679 (18.2%) | 1,206 (17.1%) |
| 25 to 29 Minutes | 1,018 (11.1%) | 422 (6.0%) |
| 30 to 34 Minutes | 1,824 (19.8%) | 1,180 (16.7%) |
| 35 to 39 Minutes | 451 (4.9%) | 250 (3.5%) |
| 40 to 44 Minutes | 566 (6.1%) | 409 (5.8%) |
| 45 to 59 Minutes | 778 (8.5%) | 974 (13.8%) |
| 60 to 89 Minutes | 339 (3.7%) | 463 (6.6%) |
| 90 or more Minutes | 205 (2.2%) | 75 (1.1%) |
Time of Departure to Work by Sex in McLean
The most frequent times of departure to work in McLean are 8:00 AM to 8:29 AM (1,796, 19.5%) for males and 8:00 AM to 8:29 AM (1,423, 20.2%) for females.
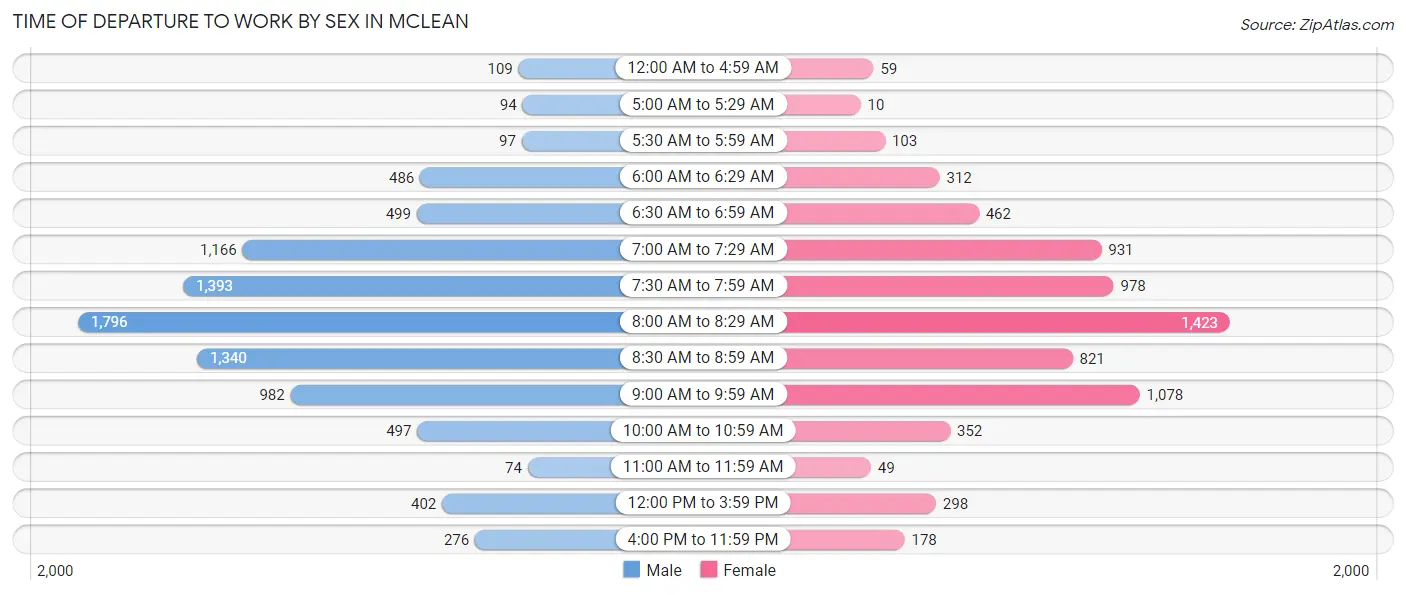
| Time of Departure | Male | Female |
| 12:00 AM to 4:59 AM | 109 (1.2%) | 59 (0.8%) |
| 5:00 AM to 5:29 AM | 94 (1.0%) | 10 (0.1%) |
| 5:30 AM to 5:59 AM | 97 (1.1%) | 103 (1.5%) |
| 6:00 AM to 6:29 AM | 486 (5.3%) | 312 (4.4%) |
| 6:30 AM to 6:59 AM | 499 (5.4%) | 462 (6.6%) |
| 7:00 AM to 7:29 AM | 1,166 (12.7%) | 931 (13.2%) |
| 7:30 AM to 7:59 AM | 1,393 (15.1%) | 978 (13.9%) |
| 8:00 AM to 8:29 AM | 1,796 (19.5%) | 1,423 (20.2%) |
| 8:30 AM to 8:59 AM | 1,340 (14.5%) | 821 (11.6%) |
| 9:00 AM to 9:59 AM | 982 (10.7%) | 1,078 (15.3%) |
| 10:00 AM to 10:59 AM | 497 (5.4%) | 352 (5.0%) |
| 11:00 AM to 11:59 AM | 74 (0.8%) | 49 (0.7%) |
| 12:00 PM to 3:59 PM | 402 (4.4%) | 298 (4.2%) |
| 4:00 PM to 11:59 PM | 276 (3.0%) | 178 (2.5%) |
| Total | 9,211 (100.0%) | 7,054 (100.0%) |
Housing Occupancy in McLean
Occupancy by Ownership in McLean
Of the total 17,005 dwellings in McLean, owner-occupied units account for 14,903 (87.6%), while renter-occupied units make up 2,102 (12.4%).
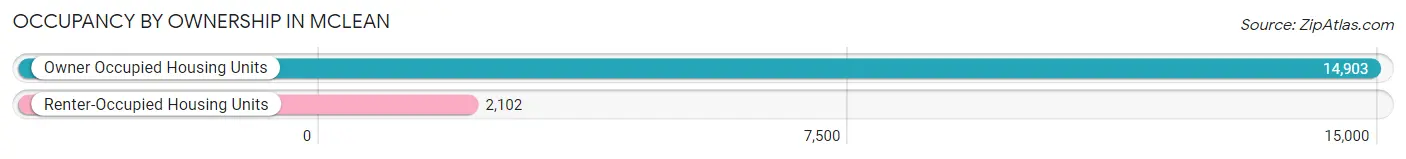
| Occupancy | # Housing Units | % Housing Units |
| Owner Occupied Housing Units | 14,903 | 87.6% |
| Renter-Occupied Housing Units | 2,102 | 12.4% |
| Total Occupied Housing Units | 17,005 | 100.0% |
Occupancy by Household Size in McLean
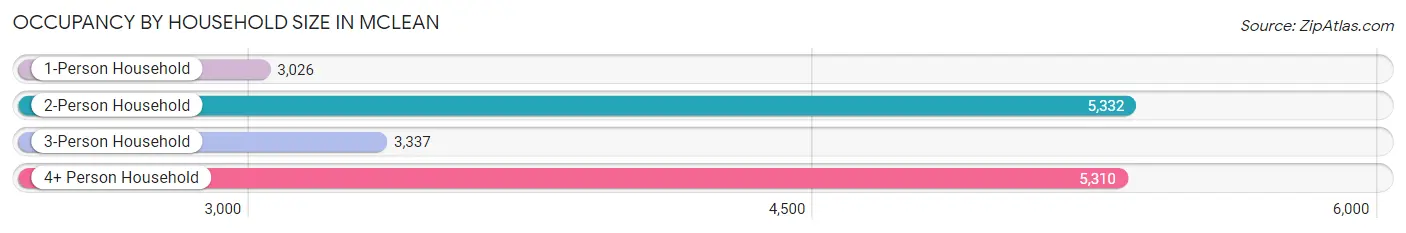
| Household Size | # Housing Units | % Housing Units |
| 1-Person Household | 3,026 | 17.8% |
| 2-Person Household | 5,332 | 31.4% |
| 3-Person Household | 3,337 | 19.6% |
| 4+ Person Household | 5,310 | 31.2% |
| Total Housing Units | 17,005 | 100.0% |
Occupancy by Ownership by Household Size in McLean
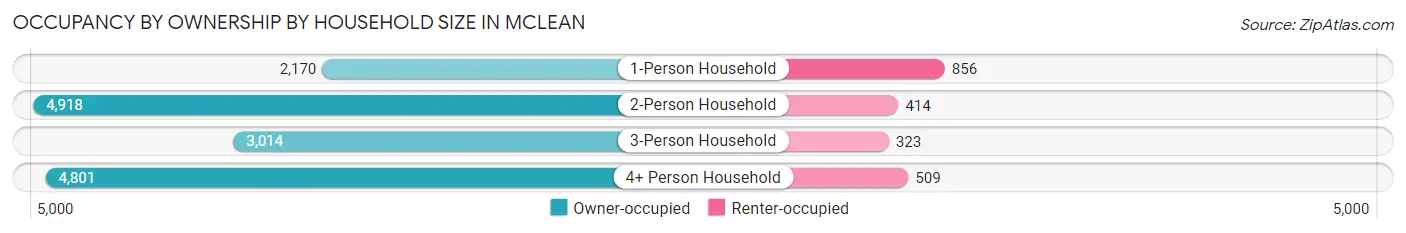
| Household Size | Owner-occupied | Renter-occupied |
| 1-Person Household | 2,170 (71.7%) | 856 (28.3%) |
| 2-Person Household | 4,918 (92.2%) | 414 (7.8%) |
| 3-Person Household | 3,014 (90.3%) | 323 (9.7%) |
| 4+ Person Household | 4,801 (90.4%) | 509 (9.6%) |
| Total Housing Units | 14,903 (87.6%) | 2,102 (12.4%) |
Occupancy by Educational Attainment in McLean
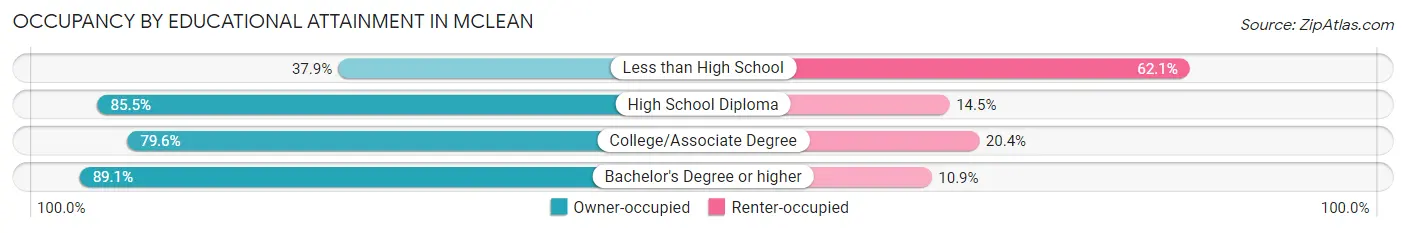
| Household Size | Owner-occupied | Renter-occupied |
| Less than High School | 89 (37.9%) | 146 (62.1%) |
| High School Diploma | 478 (85.5%) | 81 (14.5%) |
| College/Associate Degree | 860 (79.6%) | 220 (20.4%) |
| Bachelor's Degree or higher | 13,476 (89.1%) | 1,655 (10.9%) |
Occupancy by Age of Householder in McLean
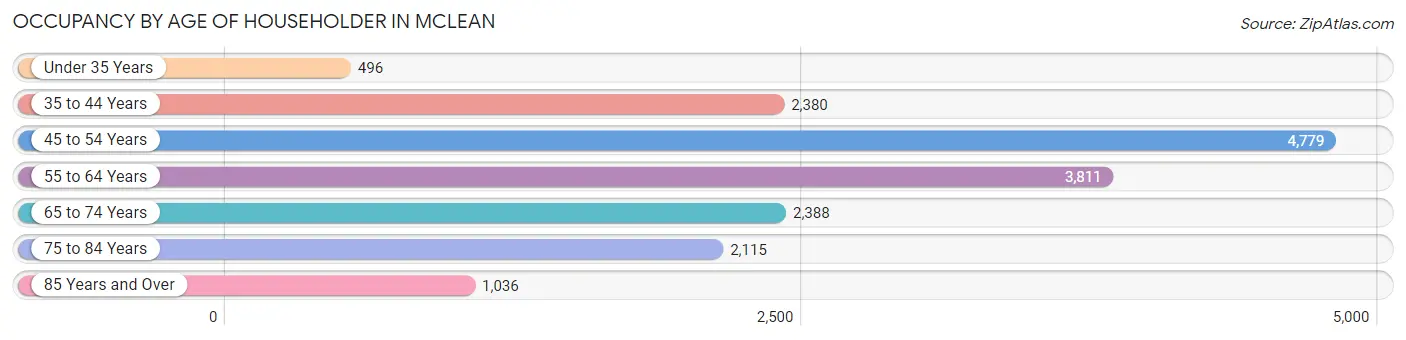
| Age Bracket | # Households | % Households |
| Under 35 Years | 496 | 2.9% |
| 35 to 44 Years | 2,380 | 14.0% |
| 45 to 54 Years | 4,779 | 28.1% |
| 55 to 64 Years | 3,811 | 22.4% |
| 65 to 74 Years | 2,388 | 14.0% |
| 75 to 84 Years | 2,115 | 12.4% |
| 85 Years and Over | 1,036 | 6.1% |
| Total | 17,005 | 100.0% |
Housing Finances in McLean
Median Income by Occupancy in McLean
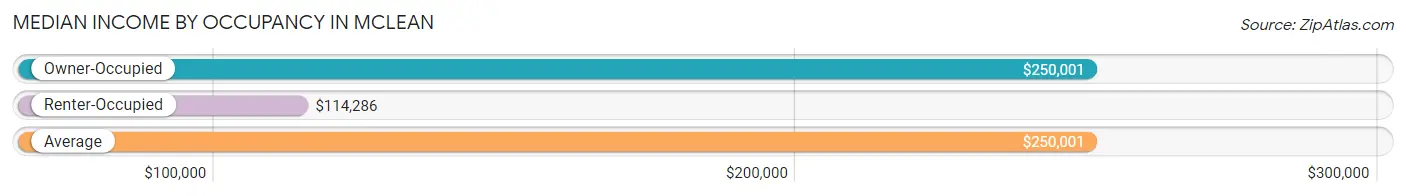
| Occupancy Type | # Households | Median Income |
| Owner-Occupied | 14,903 (87.6%) | $250,001 |
| Renter-Occupied | 2,102 (12.4%) | $114,286 |
| Average | 17,005 (100.0%) | $250,001 |
Occupancy by Householder Income Bracket in McLean
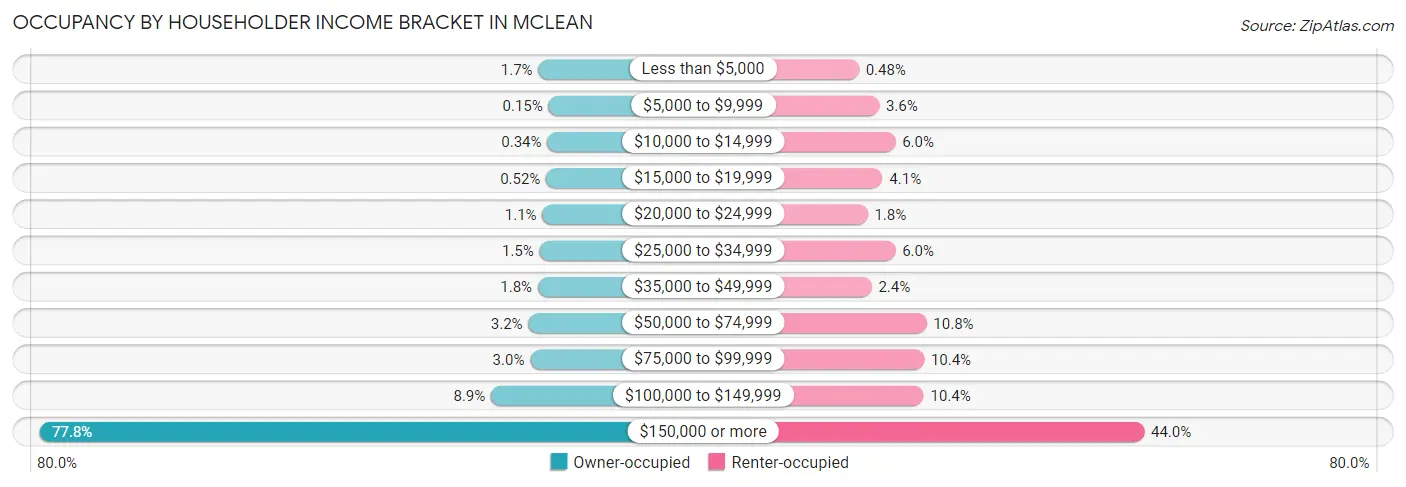
| Income Bracket | Owner-occupied | Renter-occupied |
| Less than $5,000 | 254 (1.7%) | 10 (0.5%) |
| $5,000 to $9,999 | 22 (0.2%) | 75 (3.6%) |
| $10,000 to $14,999 | 50 (0.3%) | 127 (6.0%) |
| $15,000 to $19,999 | 77 (0.5%) | 86 (4.1%) |
| $20,000 to $24,999 | 162 (1.1%) | 38 (1.8%) |
| $25,000 to $34,999 | 227 (1.5%) | 127 (6.0%) |
| $35,000 to $49,999 | 266 (1.8%) | 51 (2.4%) |
| $50,000 to $74,999 | 481 (3.2%) | 227 (10.8%) |
| $75,000 to $99,999 | 440 (2.9%) | 219 (10.4%) |
| $100,000 to $149,999 | 1,328 (8.9%) | 218 (10.4%) |
| $150,000 or more | 11,596 (77.8%) | 924 (44.0%) |
| Total | 14,903 (100.0%) | 2,102 (100.0%) |
Monthly Housing Cost Tiers in McLean
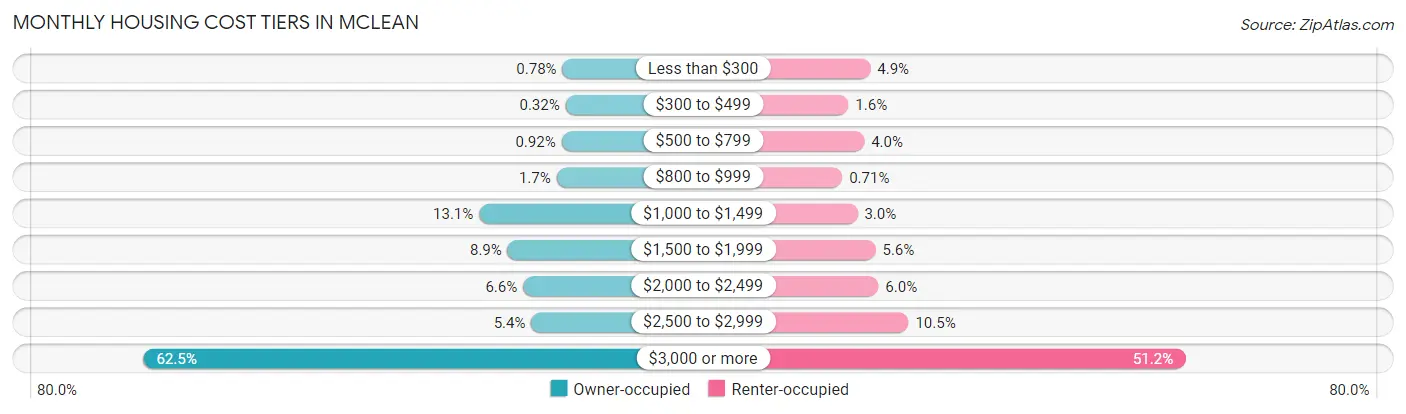
| Monthly Cost | Owner-occupied | Renter-occupied |
| Less than $300 | 116 (0.8%) | 102 (4.9%) |
| $300 to $499 | 47 (0.3%) | 34 (1.6%) |
| $500 to $799 | 137 (0.9%) | 83 (4.0%) |
| $800 to $999 | 246 (1.7%) | 15 (0.7%) |
| $1,000 to $1,499 | 1,945 (13.1%) | 62 (2.9%) |
| $1,500 to $1,999 | 1,319 (8.8%) | 118 (5.6%) |
| $2,000 to $2,499 | 980 (6.6%) | 127 (6.0%) |
| $2,500 to $2,999 | 801 (5.4%) | 220 (10.5%) |
| $3,000 or more | 9,312 (62.5%) | 1,076 (51.2%) |
| Total | 14,903 (100.0%) | 2,102 (100.0%) |
Physical Housing Characteristics in McLean
Housing Structures in McLean
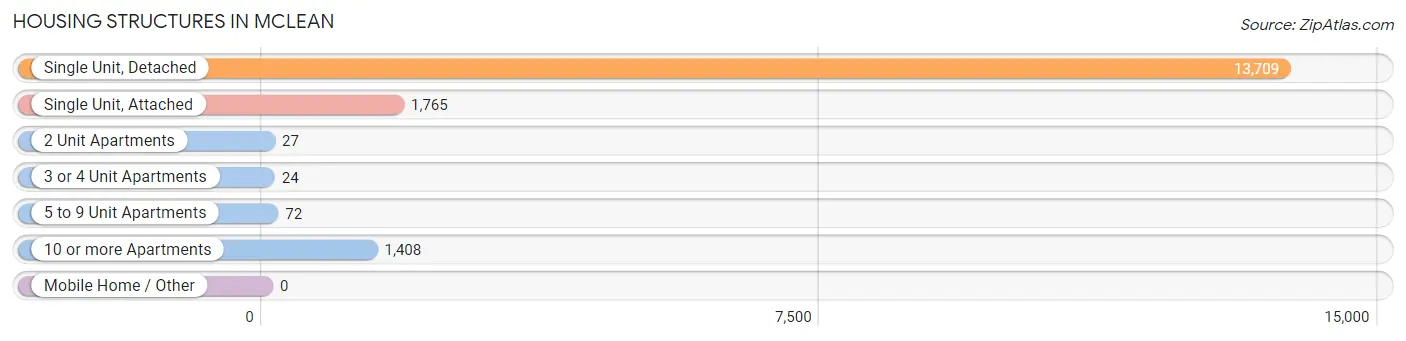
| Structure Type | # Housing Units | % Housing Units |
| Single Unit, Detached | 13,709 | 80.6% |
| Single Unit, Attached | 1,765 | 10.4% |
| 2 Unit Apartments | 27 | 0.2% |
| 3 or 4 Unit Apartments | 24 | 0.1% |
| 5 to 9 Unit Apartments | 72 | 0.4% |
| 10 or more Apartments | 1,408 | 8.3% |
| Mobile Home / Other | 0 | 0.0% |
| Total | 17,005 | 100.0% |
Housing Structures by Occupancy in McLean
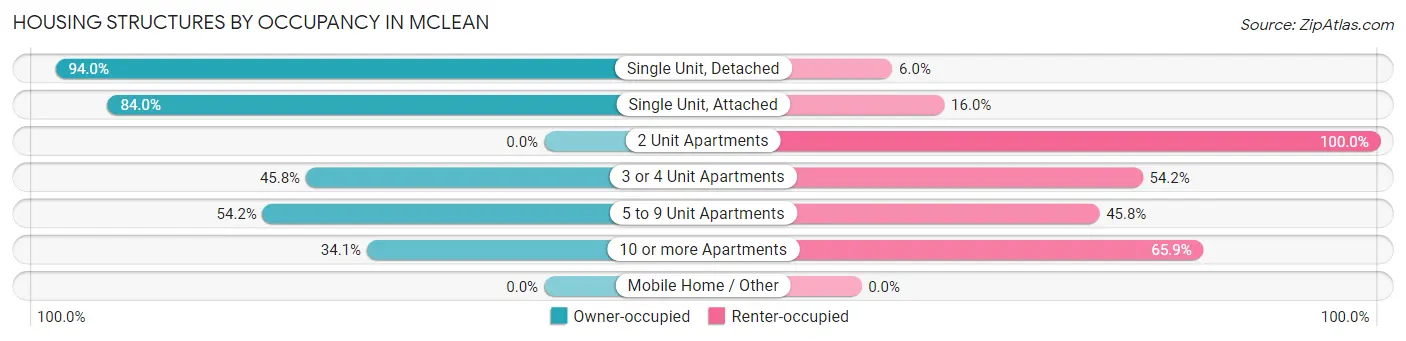
| Structure Type | Owner-occupied | Renter-occupied |
| Single Unit, Detached | 12,890 (94.0%) | 819 (6.0%) |
| Single Unit, Attached | 1,483 (84.0%) | 282 (16.0%) |
| 2 Unit Apartments | 0 (0.0%) | 27 (100.0%) |
| 3 or 4 Unit Apartments | 11 (45.8%) | 13 (54.2%) |
| 5 to 9 Unit Apartments | 39 (54.2%) | 33 (45.8%) |
| 10 or more Apartments | 480 (34.1%) | 928 (65.9%) |
| Mobile Home / Other | 0 (0.0%) | 0 (0.0%) |
| Total | 14,903 (87.6%) | 2,102 (12.4%) |
Housing Structures by Number of Rooms in McLean
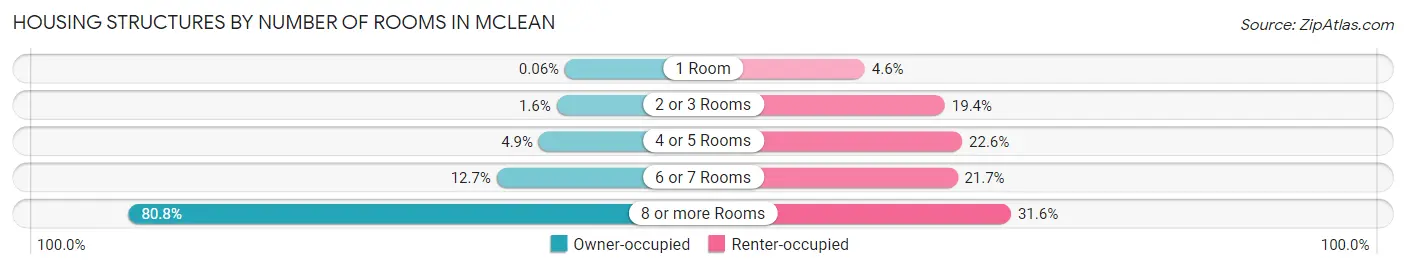
| Number of Rooms | Owner-occupied | Renter-occupied |
| 1 Room | 9 (0.1%) | 97 (4.6%) |
| 2 or 3 Rooms | 240 (1.6%) | 408 (19.4%) |
| 4 or 5 Rooms | 726 (4.9%) | 475 (22.6%) |
| 6 or 7 Rooms | 1,890 (12.7%) | 457 (21.7%) |
| 8 or more Rooms | 12,038 (80.8%) | 665 (31.6%) |
| Total | 14,903 (100.0%) | 2,102 (100.0%) |
Housing Structure by Heating Type in McLean
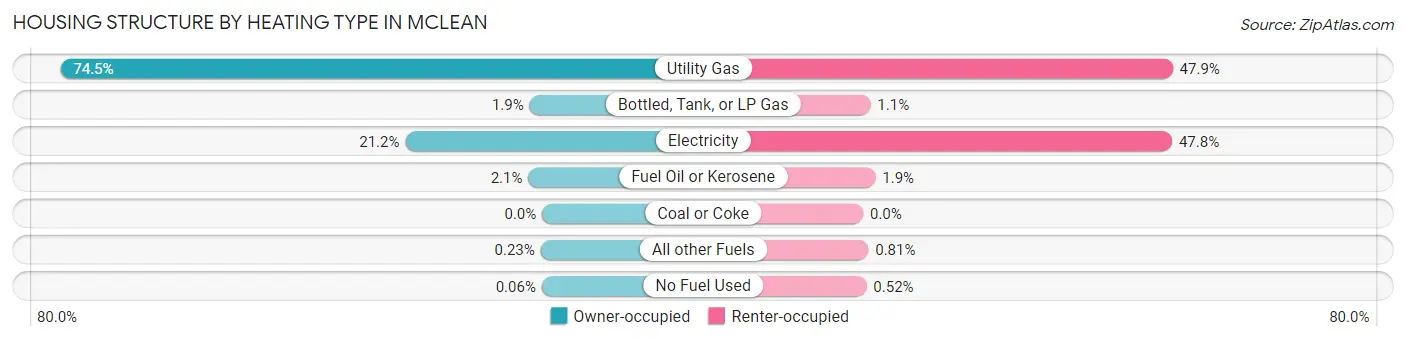
| Heating Type | Owner-occupied | Renter-occupied |
| Utility Gas | 11,099 (74.5%) | 1,006 (47.9%) |
| Bottled, Tank, or LP Gas | 289 (1.9%) | 24 (1.1%) |
| Electricity | 3,152 (21.1%) | 1,004 (47.8%) |
| Fuel Oil or Kerosene | 319 (2.1%) | 40 (1.9%) |
| Coal or Coke | 0 (0.0%) | 0 (0.0%) |
| All other Fuels | 35 (0.2%) | 17 (0.8%) |
| No Fuel Used | 9 (0.1%) | 11 (0.5%) |
| Total | 14,903 (100.0%) | 2,102 (100.0%) |
Household Vehicle Usage in McLean
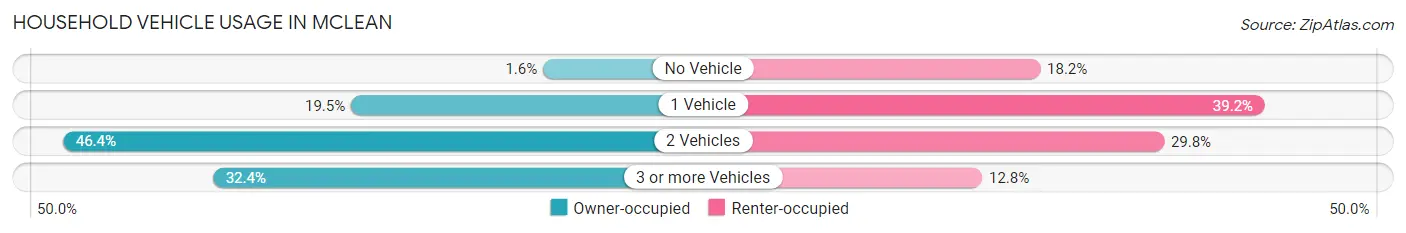
| Vehicles per Household | Owner-occupied | Renter-occupied |
| No Vehicle | 238 (1.6%) | 383 (18.2%) |
| 1 Vehicle | 2,911 (19.5%) | 824 (39.2%) |
| 2 Vehicles | 6,920 (46.4%) | 626 (29.8%) |
| 3 or more Vehicles | 4,834 (32.4%) | 269 (12.8%) |
| Total | 14,903 (100.0%) | 2,102 (100.0%) |
Real Estate & Mortgages in McLean
Real Estate and Mortgage Overview in McLean
| Characteristic | Without Mortgage | With Mortgage |
| Housing Units | 4,844 | 10,059 |
| Median Property Value | $1,178,300 | $1,307,100 |
| Median Household Income | $193,333 | $8,558 |
| Monthly Housing Costs | $1,501 | $8,726 |
| Real Estate Taxes | $10,001 | $48 |
Property Value by Mortgage Status in McLean
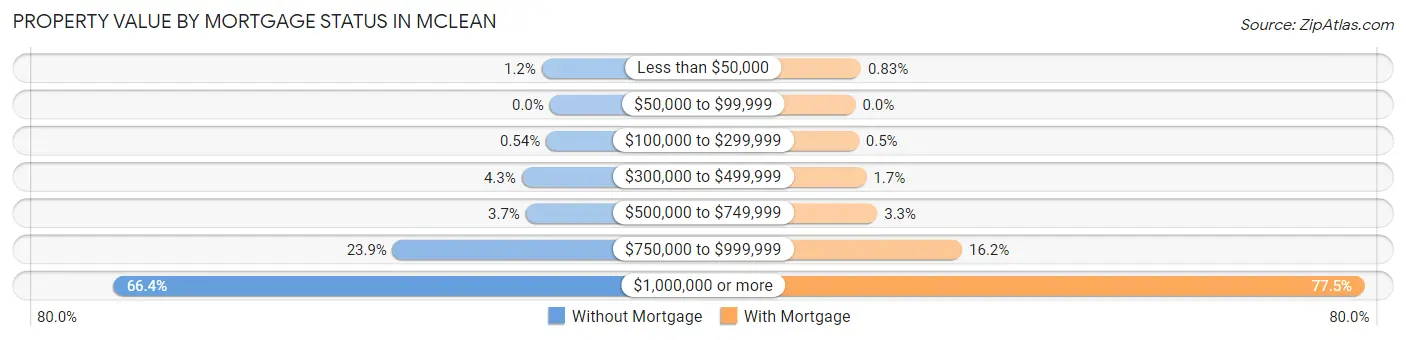
| Property Value | Without Mortgage | With Mortgage |
| Less than $50,000 | 59 (1.2%) | 83 (0.8%) |
| $50,000 to $99,999 | 0 (0.0%) | 0 (0.0%) |
| $100,000 to $299,999 | 26 (0.5%) | 50 (0.5%) |
| $300,000 to $499,999 | 207 (4.3%) | 167 (1.7%) |
| $500,000 to $749,999 | 177 (3.6%) | 333 (3.3%) |
| $750,000 to $999,999 | 1,158 (23.9%) | 1,634 (16.2%) |
| $1,000,000 or more | 3,217 (66.4%) | 7,792 (77.5%) |
| Total | 4,844 (100.0%) | 10,059 (100.0%) |
Household Income by Mortgage Status in McLean
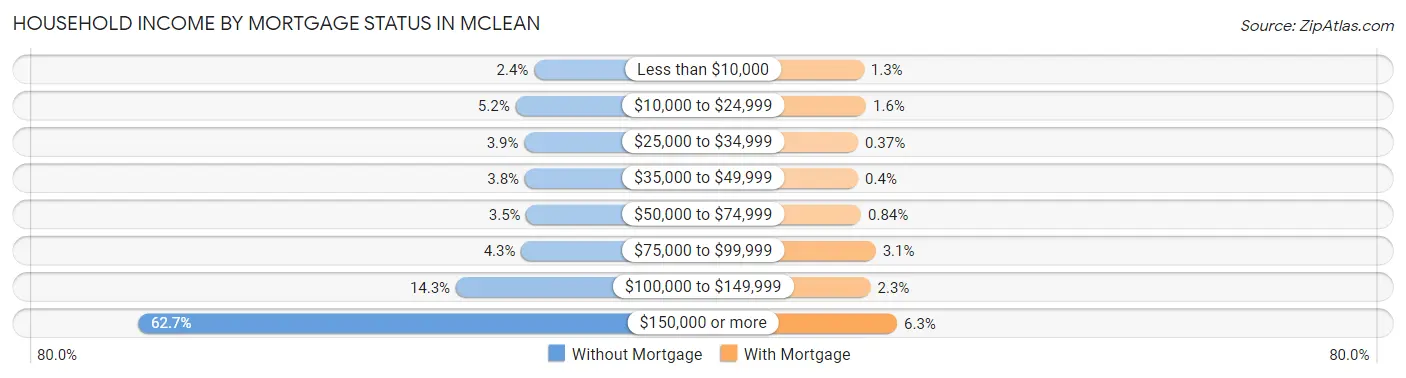
| Household Income | Without Mortgage | With Mortgage |
| Less than $10,000 | 114 (2.4%) | 128 (1.3%) |
| $10,000 to $24,999 | 252 (5.2%) | 162 (1.6%) |
| $25,000 to $34,999 | 187 (3.9%) | 37 (0.4%) |
| $35,000 to $49,999 | 182 (3.8%) | 40 (0.4%) |
| $50,000 to $74,999 | 171 (3.5%) | 84 (0.8%) |
| $75,000 to $99,999 | 209 (4.3%) | 310 (3.1%) |
| $100,000 to $149,999 | 691 (14.3%) | 231 (2.3%) |
| $150,000 or more | 3,038 (62.7%) | 637 (6.3%) |
| Total | 4,844 (100.0%) | 10,059 (100.0%) |
Property Value to Household Income Ratio in McLean
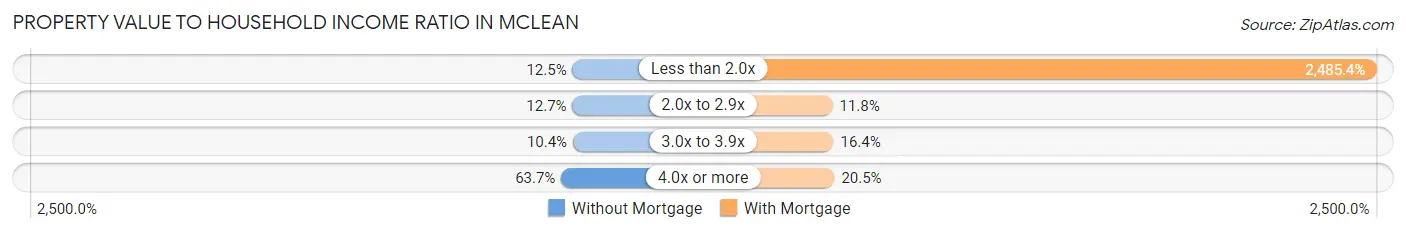
| Value-to-Income Ratio | Without Mortgage | With Mortgage |
| Less than 2.0x | 605 (12.5%) | 250,001 (2,485.4%) |
| 2.0x to 2.9x | 617 (12.7%) | 1,187 (11.8%) |
| 3.0x to 3.9x | 504 (10.4%) | 1,650 (16.4%) |
| 4.0x or more | 3,085 (63.7%) | 2,065 (20.5%) |
| Total | 4,844 (100.0%) | 10,059 (100.0%) |
Real Estate Taxes by Mortgage Status in McLean
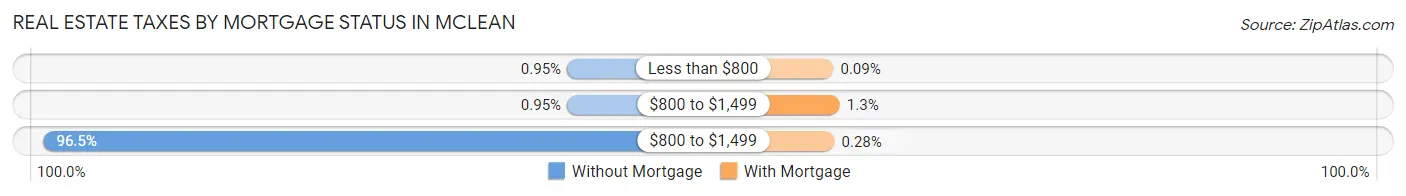
| Property Taxes | Without Mortgage | With Mortgage |
| Less than $800 | 46 (0.9%) | 9 (0.1%) |
| $800 to $1,499 | 46 (0.9%) | 126 (1.3%) |
| $800 to $1,499 | 4,676 (96.5%) | 28 (0.3%) |
| Total | 4,844 (100.0%) | 10,059 (100.0%) |
Health & Disability in McLean
Health Insurance Coverage by Age in McLean
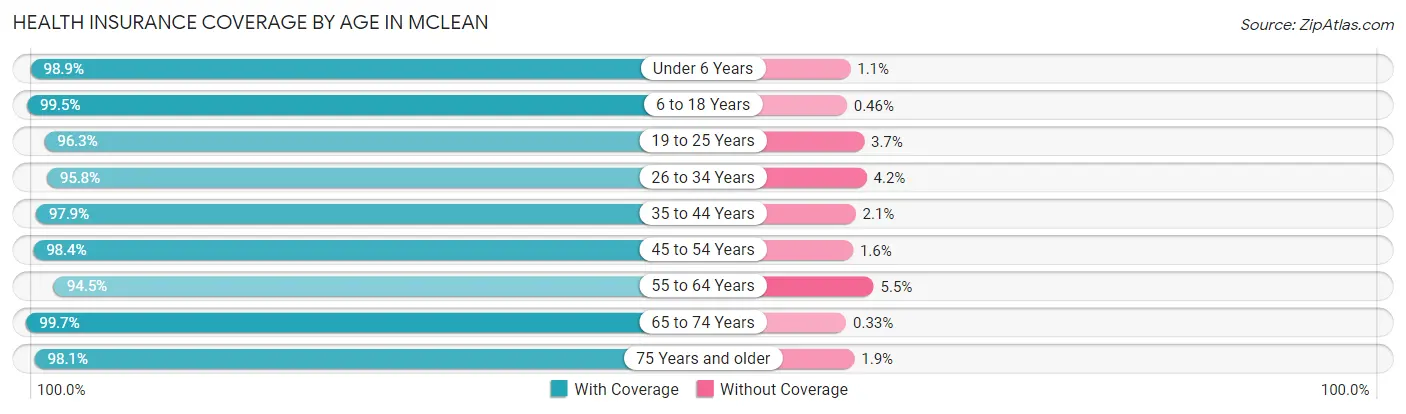
| Age Bracket | With Coverage | Without Coverage |
| Under 6 Years | 2,480 (98.9%) | 28 (1.1%) |
| 6 to 18 Years | 10,855 (99.5%) | 50 (0.5%) |
| 19 to 25 Years | 2,803 (96.3%) | 107 (3.7%) |
| 26 to 34 Years | 1,959 (95.8%) | 85 (4.2%) |
| 35 to 44 Years | 4,823 (97.9%) | 104 (2.1%) |
| 45 to 54 Years | 8,779 (98.4%) | 145 (1.6%) |
| 55 to 64 Years | 7,269 (94.5%) | 421 (5.5%) |
| 65 to 74 Years | 4,504 (99.7%) | 15 (0.3%) |
| 75 Years and older | 4,818 (98.1%) | 92 (1.9%) |
| Total | 48,290 (97.9%) | 1,047 (2.1%) |
Health Insurance Coverage by Citizenship Status in McLean
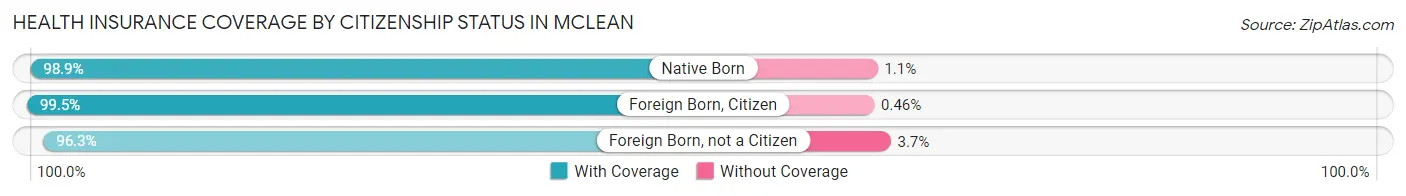
| Citizenship Status | With Coverage | Without Coverage |
| Native Born | 2,480 (98.9%) | 28 (1.1%) |
| Foreign Born, Citizen | 10,855 (99.5%) | 50 (0.5%) |
| Foreign Born, not a Citizen | 2,803 (96.3%) | 107 (3.7%) |
Health Insurance Coverage by Household Income in McLean
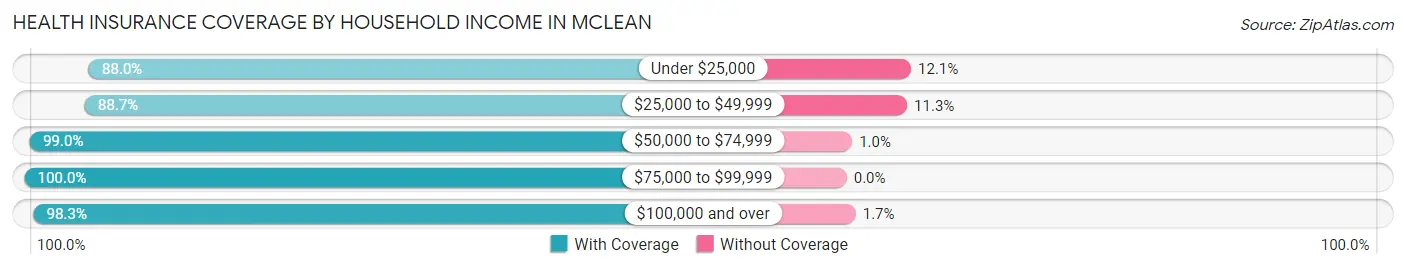
| Household Income | With Coverage | Without Coverage |
| Under $25,000 | 1,139 (87.9%) | 156 (12.0%) |
| $25,000 to $49,999 | 1,012 (88.7%) | 129 (11.3%) |
| $50,000 to $74,999 | 1,072 (99.0%) | 11 (1.0%) |
| $75,000 to $99,999 | 1,737 (100.0%) | 0 (0.0%) |
| $100,000 and over | 43,238 (98.3%) | 740 (1.7%) |
Public vs Private Health Insurance Coverage by Age in McLean
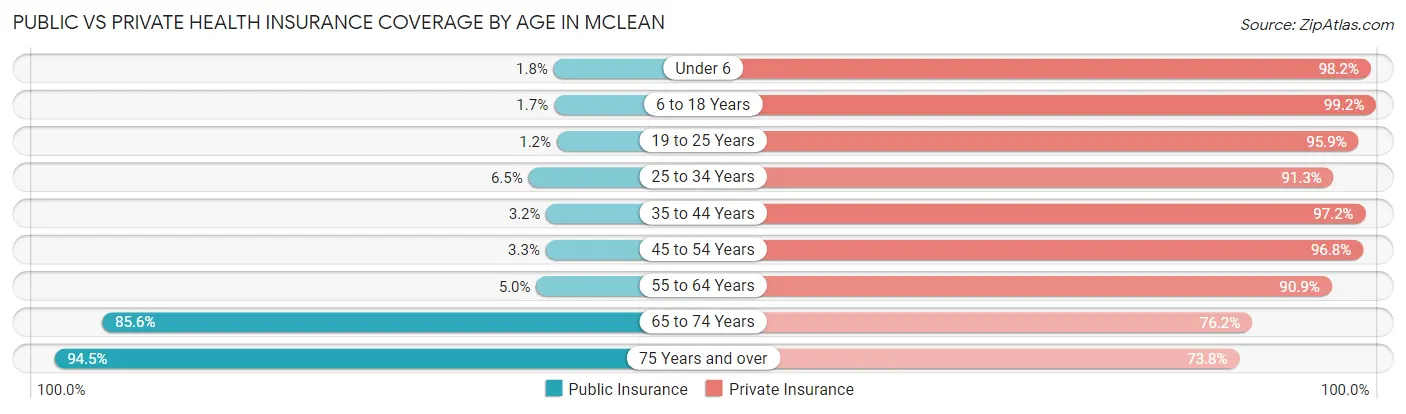
| Age Bracket | Public Insurance | Private Insurance |
| Under 6 | 45 (1.8%) | 2,462 (98.2%) |
| 6 to 18 Years | 190 (1.7%) | 10,816 (99.2%) |
| 19 to 25 Years | 35 (1.2%) | 2,791 (95.9%) |
| 25 to 34 Years | 132 (6.5%) | 1,866 (91.3%) |
| 35 to 44 Years | 155 (3.2%) | 4,788 (97.2%) |
| 45 to 54 Years | 292 (3.3%) | 8,635 (96.8%) |
| 55 to 64 Years | 385 (5.0%) | 6,992 (90.9%) |
| 65 to 74 Years | 3,869 (85.6%) | 3,441 (76.1%) |
| 75 Years and over | 4,640 (94.5%) | 3,622 (73.8%) |
| Total | 9,743 (19.8%) | 45,413 (92.0%) |
Disability Status by Sex by Age in McLean
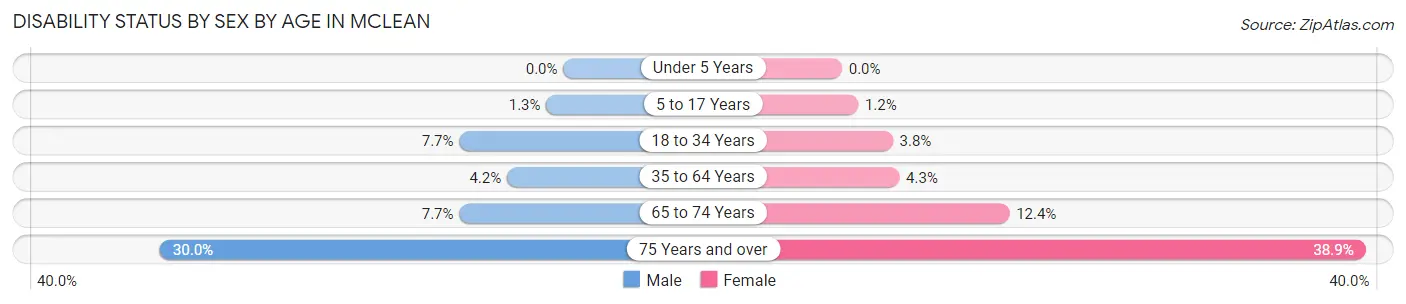
| Age Bracket | Male | Female |
| Under 5 Years | 0 (0.0%) | 0 (0.0%) |
| 5 to 17 Years | 67 (1.3%) | 64 (1.2%) |
| 18 to 34 Years | 240 (7.7%) | 98 (3.8%) |
| 35 to 64 Years | 442 (4.2%) | 467 (4.3%) |
| 65 to 74 Years | 175 (7.7%) | 280 (12.4%) |
| 75 Years and over | 654 (29.9%) | 1,060 (38.9%) |
Disability Class by Sex by Age in McLean
Disability Class: Hearing Difficulty
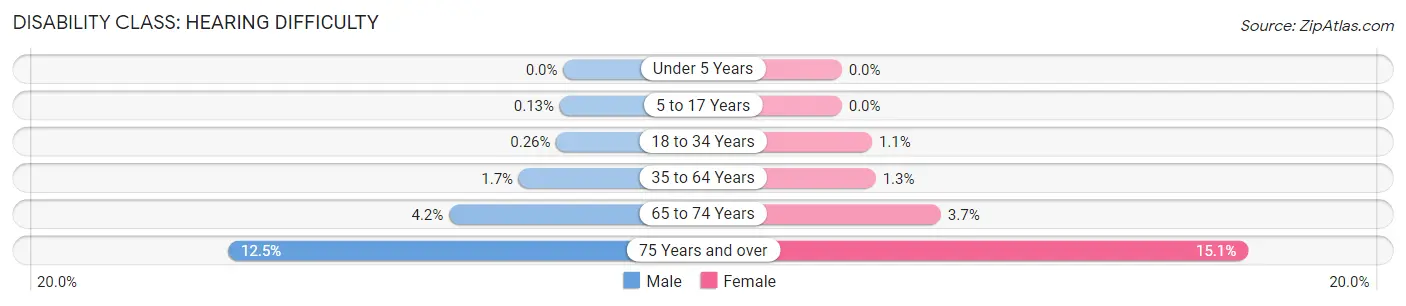
| Age Bracket | Male | Female |
| Under 5 Years | 0 (0.0%) | 0 (0.0%) |
| 5 to 17 Years | 7 (0.1%) | 0 (0.0%) |
| 18 to 34 Years | 8 (0.3%) | 29 (1.1%) |
| 35 to 64 Years | 174 (1.7%) | 138 (1.3%) |
| 65 to 74 Years | 96 (4.2%) | 83 (3.7%) |
| 75 Years and over | 272 (12.4%) | 411 (15.1%) |
Disability Class: Vision Difficulty
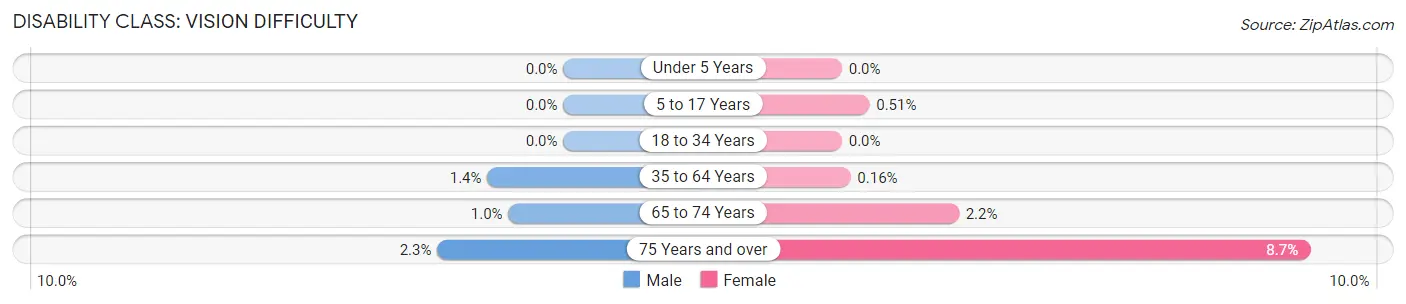
| Age Bracket | Male | Female |
| Under 5 Years | 0 (0.0%) | 0 (0.0%) |
| 5 to 17 Years | 0 (0.0%) | 27 (0.5%) |
| 18 to 34 Years | 0 (0.0%) | 0 (0.0%) |
| 35 to 64 Years | 149 (1.4%) | 18 (0.2%) |
| 65 to 74 Years | 23 (1.0%) | 49 (2.2%) |
| 75 Years and over | 51 (2.3%) | 237 (8.7%) |
Disability Class: Cognitive Difficulty
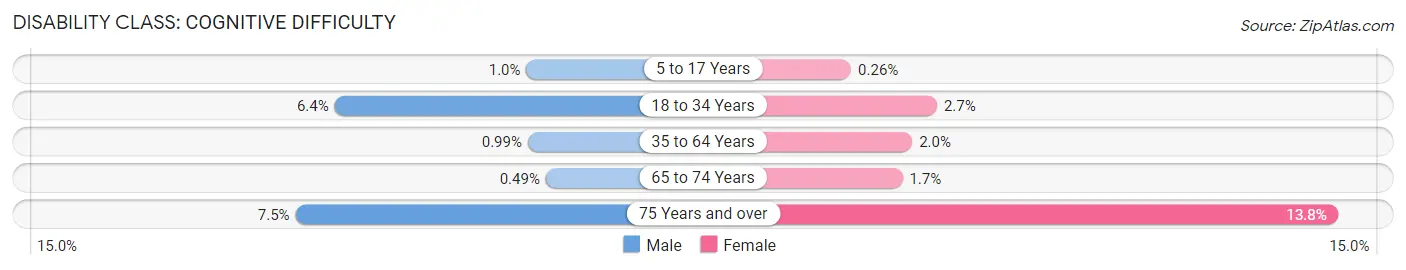
| Age Bracket | Male | Female |
| 5 to 17 Years | 55 (1.0%) | 14 (0.3%) |
| 18 to 34 Years | 198 (6.4%) | 69 (2.6%) |
| 35 to 64 Years | 105 (1.0%) | 215 (2.0%) |
| 65 to 74 Years | 11 (0.5%) | 38 (1.7%) |
| 75 Years and over | 163 (7.5%) | 377 (13.8%) |
Disability Class: Ambulatory Difficulty
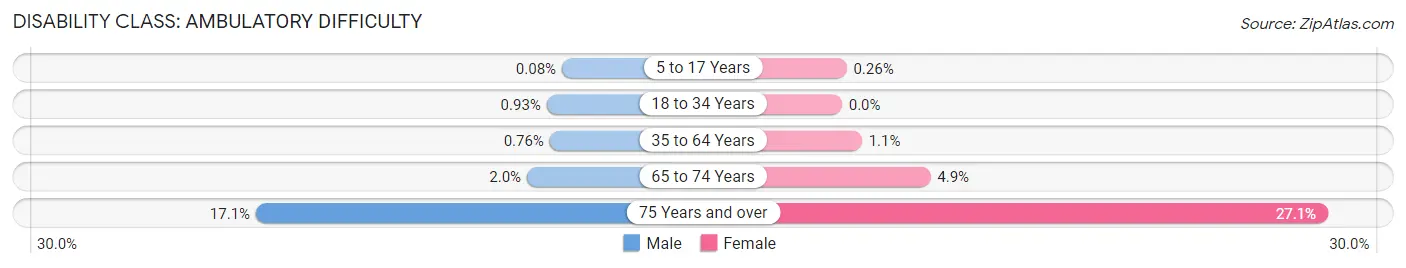
| Age Bracket | Male | Female |
| 5 to 17 Years | 4 (0.1%) | 14 (0.3%) |
| 18 to 34 Years | 29 (0.9%) | 0 (0.0%) |
| 35 to 64 Years | 80 (0.8%) | 122 (1.1%) |
| 65 to 74 Years | 46 (2.0%) | 111 (4.9%) |
| 75 Years and over | 374 (17.1%) | 738 (27.1%) |
Disability Class: Self-Care Difficulty
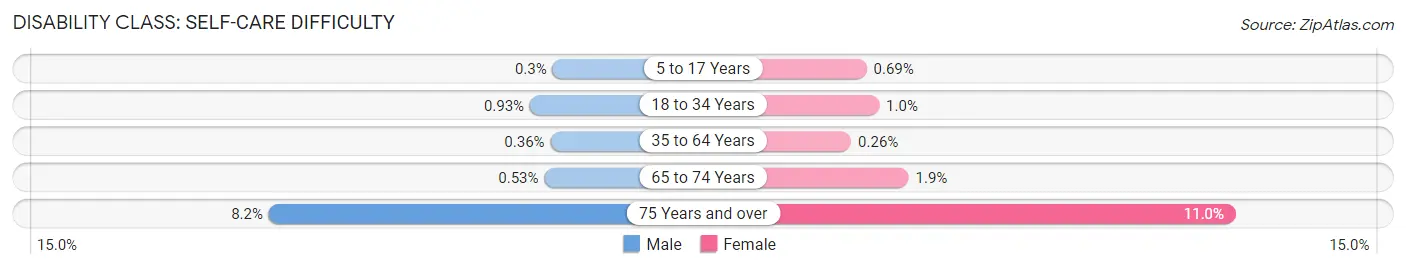
| Age Bracket | Male | Female |
| 5 to 17 Years | 16 (0.3%) | 37 (0.7%) |
| 18 to 34 Years | 29 (0.9%) | 27 (1.0%) |
| 35 to 64 Years | 38 (0.4%) | 28 (0.3%) |
| 65 to 74 Years | 12 (0.5%) | 42 (1.9%) |
| 75 Years and over | 179 (8.2%) | 299 (11.0%) |
Technology Access in McLean
Computing Device Access in McLean
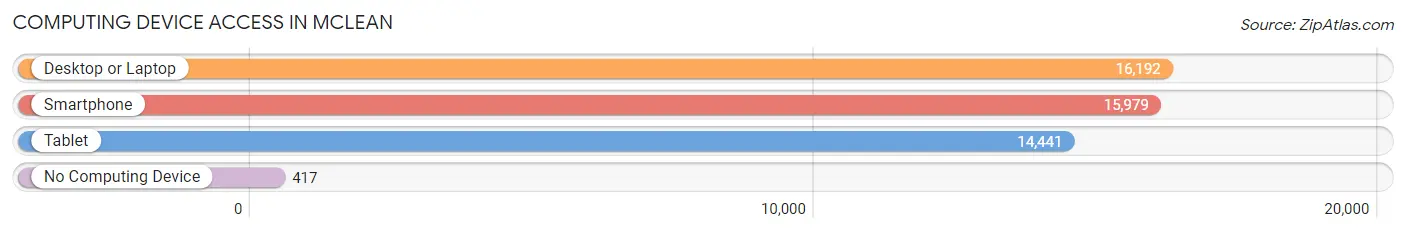
| Device Type | # Households | % Households |
| Desktop or Laptop | 16,192 | 95.2% |
| Smartphone | 15,979 | 94.0% |
| Tablet | 14,441 | 84.9% |
| No Computing Device | 417 | 2.5% |
| Total | 17,005 | 100.0% |
Internet Access in McLean
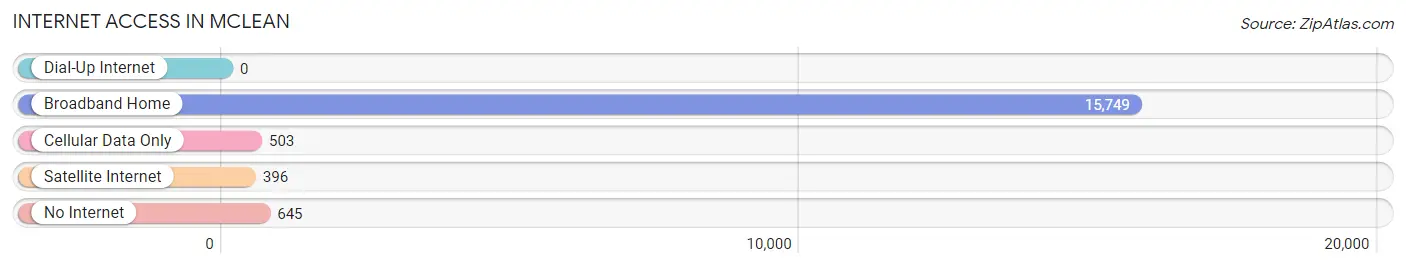
| Internet Type | # Households | % Households |
| Dial-Up Internet | 0 | 0.0% |
| Broadband Home | 15,749 | 92.6% |
| Cellular Data Only | 503 | 3.0% |
| Satellite Internet | 396 | 2.3% |
| No Internet | 645 | 3.8% |
| Total | 17,005 | 100.0% |
McLean Summary
Mclean, Virginia is a census-designated place (CDP) located in Fairfax County, Virginia. It is situated in the Washington metropolitan area and is part of the larger Tysons Corner area. As of the 2010 census, the population of Mclean was 48,115.
Geography
Mclean is located at 38°56'N 77°10'W (38.937, -77.167). It is situated in the Piedmont region of Virginia, and is bordered by the Potomac River to the north, the city of Falls Church to the east, Langley to the south, and Great Falls to the west. The CDP has a total area of 25.2 square miles, of which 24.9 square miles is land and 0.3 square miles is water.
Economy
Mclean is home to many large corporations, including Booz Allen Hamilton, Capital One, Freddie Mac, Gannett, Hilton Worldwide, Mars, and SAIC. The area is also home to many government contractors, including Northrop Grumman, Lockheed Martin, and General Dynamics. The median household income in Mclean is $190,829, and the median family income is $208,125.
Demographics
As of the 2010 census, there were 48,115 people, 17,063 households, and 13,453 families residing in the CDP. The population density was 1,936.2 people per square mile. The racial makeup of the CDP was 79.2% White, 8.2% African American, 0.1% Native American, 10.3% Asian, 0.1% Pacific Islander, 0.7% from other races, and 1.4% from two or more races. Hispanic or Latino of any race were 3.2% of the population.
The median age in Mclean was 43.2 years. 22.2% of residents were under the age of 18; 6.2% were between the ages of 18 and 24; 24.2% were from 25 to 44; 33.2% were from 45 to 64; and 14.2% were 65 years of age or older. The gender makeup of the CDP was 48.2% male and 51.8% female.
Conclusion
Mclean, Virginia is a census-designated place located in Fairfax County, Virginia. It is situated in the Washington metropolitan area and is part of the larger Tysons Corner area. As of the 2010 census, the population of Mclean was 48,115. The CDP has a total area of 25.2 square miles, of which 24.9 square miles is land and 0.3 square miles is water. Mclean is home to many large corporations, including Booz Allen Hamilton, Capital One, Freddie Mac, Gannett, Hilton Worldwide, Mars, and SAIC. The median household income in Mclean is $190,829, and the median family income is $208,125. As of the 2010 census, there were 48,115 people, 17,063 households, and 13,453 families residing in the CDP. The racial makeup of the CDP was 79.2% White, 8.2% African American, 0.1% Native American, 10.3% Asian, 0.1% Pacific Islander, 0.7% from other races, and 1.4% from two or more races. The median age in Mclean was 43.2 years.
Common Questions
What is Per Capita Income in McLean?
Per Capita income in McLean is $125,373.
What is the Median Family Income in McLean?
Median Family Income in McLean is $250,001.
What is the Median Household income in McLean?
Median Household Income in McLean is $250,001.
What is Income or Wage Gap in McLean?
Income or Wage Gap in McLean is 43.5%.
Women in McLean earn 56.5 cents for every dollar earned by a man.
What is Inequality or Gini Index in McLean?
Inequality or Gini Index in McLean is 0.47.
What is the Total Population of McLean?
Total Population of McLean is 49,587.
What is the Total Male Population of McLean?
Total Male Population of McLean is 24,488.
What is the Total Female Population of McLean?
Total Female Population of McLean is 25,099.
What is the Ratio of Males per 100 Females in McLean?
There are 97.57 Males per 100 Females in McLean.
What is the Ratio of Females per 100 Males in McLean?
There are 102.50 Females per 100 Males in McLean.
What is the Median Population Age in McLean?
Median Population Age in McLean is 46.7 Years.
What is the Average Family Size in McLean
Average Family Size in McLean is 3.3 People.
What is the Average Household Size in McLean
Average Household Size in McLean is 2.9 People.
How Large is the Labor Force in McLean?
There are 24,661 People in the Labor Forcein in McLean.
What is the Percentage of People in the Labor Force in McLean?
63.2% of People are in the Labor Force in McLean.
What is the Unemployment Rate in McLean?
Unemployment Rate in McLean is 2.1%.