Wise, VA Map & Demographics
Wise Map
Wise Overview
$26,451
PER CAPITA INCOME
$45,686
AVG FAMILY INCOME
$42,944
AVG HOUSEHOLD INCOME
41.7%
WAGE / INCOME GAP [ % ]
58.3¢/ $1
WAGE / INCOME GAP [ $ ]
0.40
INEQUALITY / GINI INDEX
2,962
TOTAL POPULATION
1,576
MALE POPULATION
1,386
FEMALE POPULATION
113.71
MALES / 100 FEMALES
87.94
FEMALES / 100 MALES
41.4
MEDIAN AGE
2.8
AVG FAMILY SIZE
2.1
AVG HOUSEHOLD SIZE
1,276
LABOR FORCE [ PEOPLE ]
50.5%
PERCENT IN LABOR FORCE
4.2%
UNEMPLOYMENT RATE
Wise Zip Codes
Wise Area Codes
Income in Wise
Income Overview in Wise
Per Capita Income in Wise is $26,451, while median incomes of families and households are $45,686 and $42,944 respectively.
| Characteristic | Number | Measure |
| Per Capita Income | 2,962 | $26,451 |
| Median Family Income | 692 | $45,686 |
| Mean Family Income | 692 | $60,578 |
| Median Household Income | 1,397 | $42,944 |
| Mean Household Income | 1,397 | $53,089 |
| Income Deficit | 692 | $0 |
| Wage / Income Gap (%) | 2,962 | 41.66% |
| Wage / Income Gap ($) | 2,962 | 58.34¢ per $1 |
| Gini / Inequality Index | 2,962 | 0.40 |
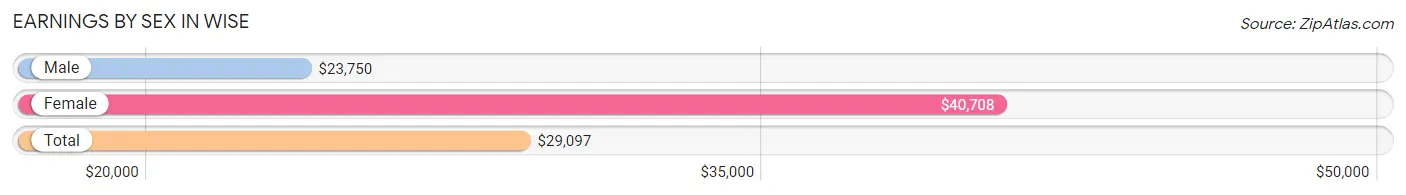
Earnings by Sex in Wise
Average Earnings in Wise are $29,097, $23,750 for men and $40,708 for women, a difference of 41.7%.
| Sex | Number | Average Earnings |
| Male | 760 (55.8%) | $23,750 |
| Female | 603 (44.2%) | $40,708 |
| Total | 1,363 (100.0%) | $29,097 |
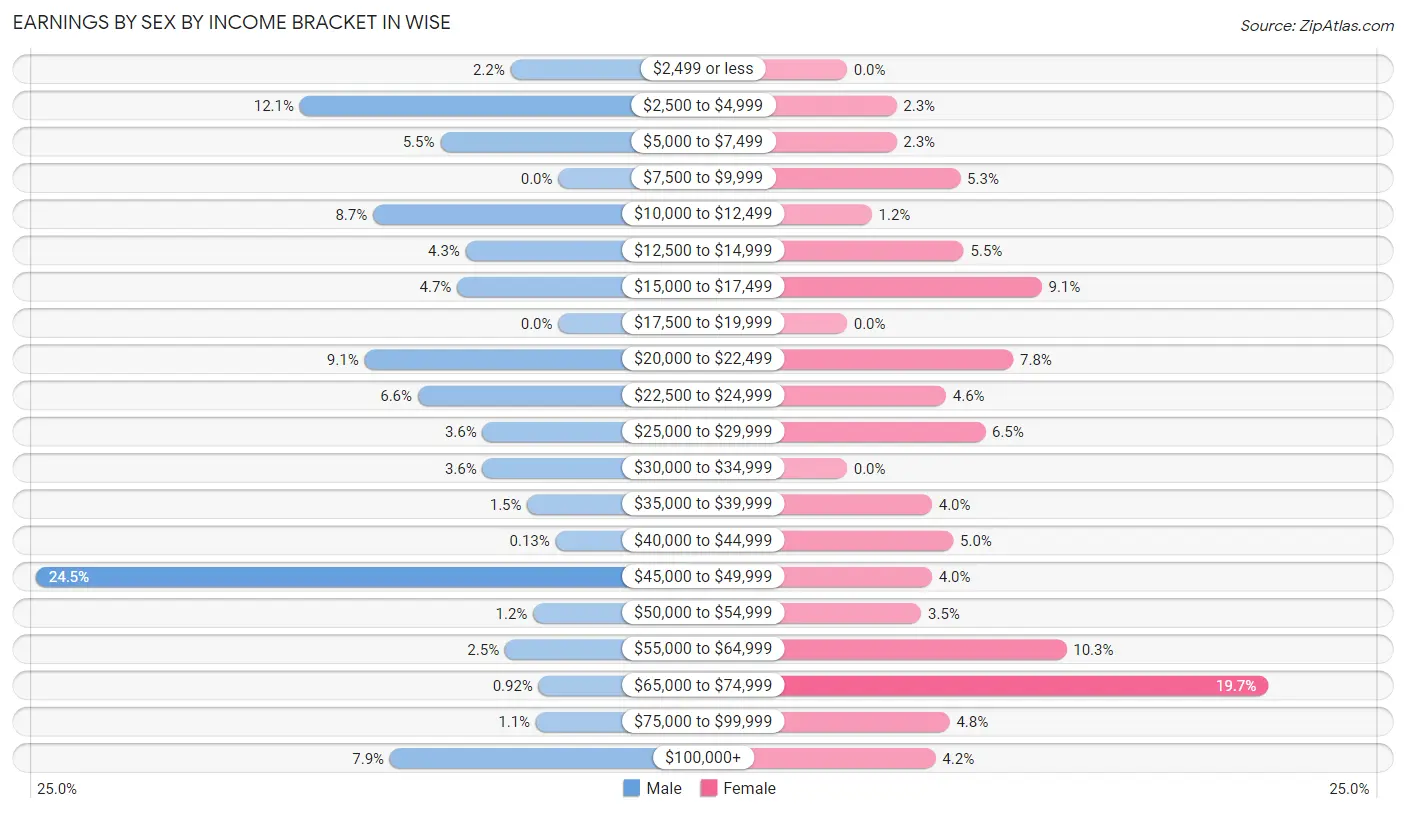
Earnings by Sex by Income Bracket in Wise
The most common earnings brackets in Wise are $45,000 to $49,999 for men (186 | 24.5%) and $65,000 to $74,999 for women (119 | 19.7%).
| Income | Male | Female |
| $2,499 or less | 17 (2.2%) | 0 (0.0%) |
| $2,500 to $4,999 | 92 (12.1%) | 14 (2.3%) |
| $5,000 to $7,499 | 42 (5.5%) | 14 (2.3%) |
| $7,500 to $9,999 | 0 (0.0%) | 32 (5.3%) |
| $10,000 to $12,499 | 66 (8.7%) | 7 (1.2%) |
| $12,500 to $14,999 | 33 (4.3%) | 33 (5.5%) |
| $15,000 to $17,499 | 36 (4.7%) | 55 (9.1%) |
| $17,500 to $19,999 | 0 (0.0%) | 0 (0.0%) |
| $20,000 to $22,499 | 69 (9.1%) | 47 (7.8%) |
| $22,500 to $24,999 | 50 (6.6%) | 28 (4.6%) |
| $25,000 to $29,999 | 27 (3.5%) | 39 (6.5%) |
| $30,000 to $34,999 | 27 (3.5%) | 0 (0.0%) |
| $35,000 to $39,999 | 11 (1.5%) | 24 (4.0%) |
| $40,000 to $44,999 | 1 (0.1%) | 30 (5.0%) |
| $45,000 to $49,999 | 186 (24.5%) | 24 (4.0%) |
| $50,000 to $54,999 | 9 (1.2%) | 21 (3.5%) |
| $55,000 to $64,999 | 19 (2.5%) | 62 (10.3%) |
| $65,000 to $74,999 | 7 (0.9%) | 119 (19.7%) |
| $75,000 to $99,999 | 8 (1.1%) | 29 (4.8%) |
| $100,000+ | 60 (7.9%) | 25 (4.2%) |
| Total | 760 (100.0%) | 603 (100.0%) |
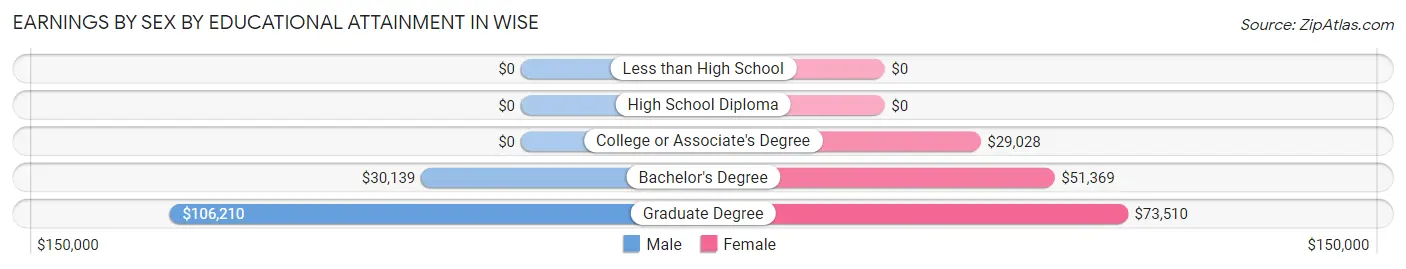
Earnings by Sex by Educational Attainment in Wise
Average earnings in Wise are $30,185 for men and $50,417 for women, a difference of 40.1%. Men with an educational attainment of graduate degree enjoy the highest average annual earnings of $106,210, while those with bachelor's degree education earn the least with $30,139. Women with an educational attainment of graduate degree earn the most with the average annual earnings of $73,510, while those with college or associate's degree education have the smallest earnings of $29,028.
| Educational Attainment | Male Income | Female Income |
| Less than High School | - | - |
| High School Diploma | - | - |
| College or Associate's Degree | - | - |
| Bachelor's Degree | $30,139 | $51,369 |
| Graduate Degree | $106,210 | $73,510 |
| Total | $30,185 | $50,417 |
Family Income in Wise
Family Income Brackets in Wise
According to the Wise family income data, there are 202 families falling into the $35,000 to $49,999 income range, which is the most common income bracket and makes up 29.2% of all families.
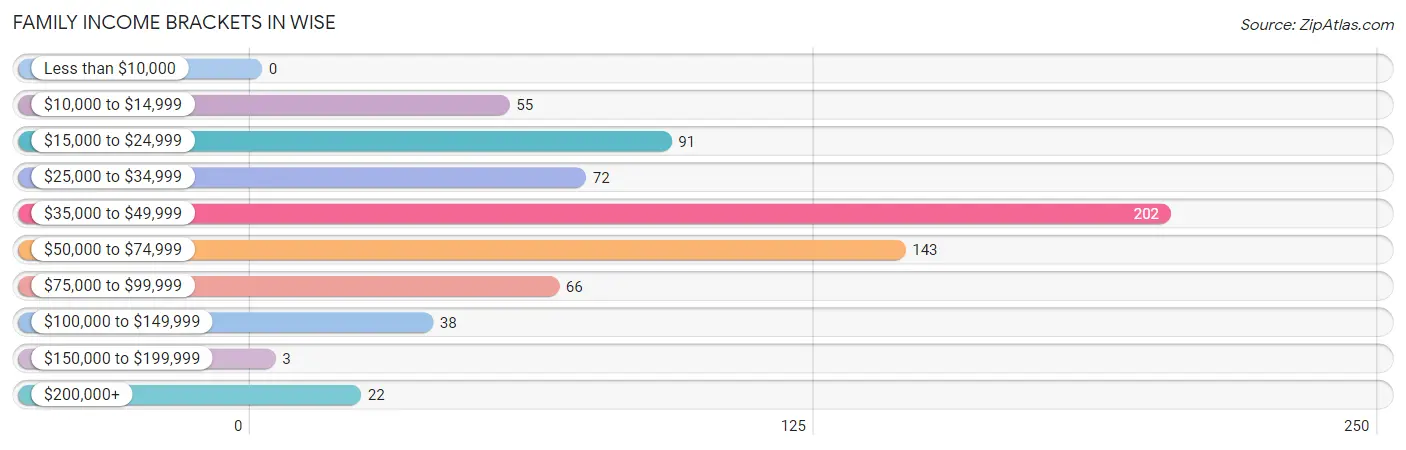
| Income Bracket | # Families | % Families |
| Less than $10,000 | 0 | 0.0% |
| $10,000 to $14,999 | 55 | 7.9% |
| $15,000 to $24,999 | 91 | 13.2% |
| $25,000 to $34,999 | 72 | 10.4% |
| $35,000 to $49,999 | 202 | 29.2% |
| $50,000 to $74,999 | 143 | 20.7% |
| $75,000 to $99,999 | 66 | 9.5% |
| $100,000 to $149,999 | 38 | 5.5% |
| $150,000 to $199,999 | 3 | 0.4% |
| $200,000+ | 22 | 3.2% |
Family Income by Famaliy Size in Wise
2-person families (319 | 46.1%) account for the highest median family income in Wise with $47,292 per family, while 2-person families (319 | 46.1%) have the highest median income of $23,646 per family member.
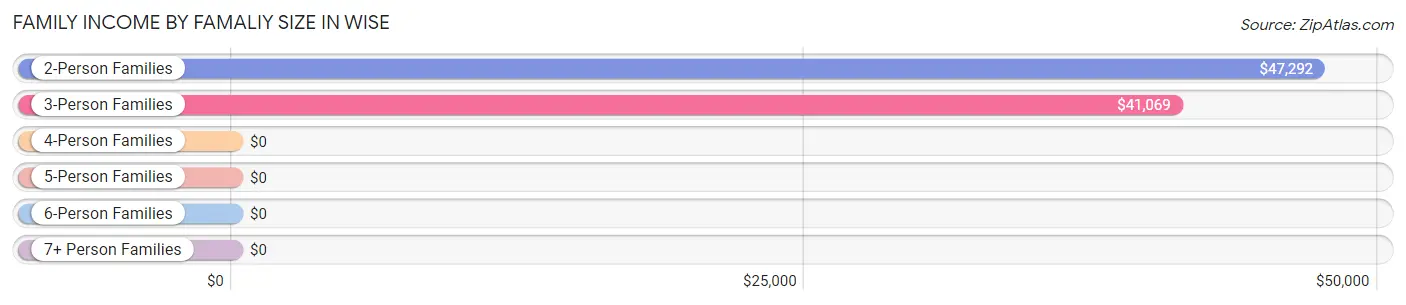
| Income Bracket | # Families | Median Income |
| 2-Person Families | 319 (46.1%) | $47,292 |
| 3-Person Families | 237 (34.3%) | $41,069 |
| 4-Person Families | 100 (14.4%) | $0 |
| 5-Person Families | 18 (2.6%) | $0 |
| 6-Person Families | 13 (1.9%) | $0 |
| 7+ Person Families | 5 (0.7%) | $0 |
| Total | 692 (100.0%) | $45,686 |
Family Income by Number of Earners in Wise
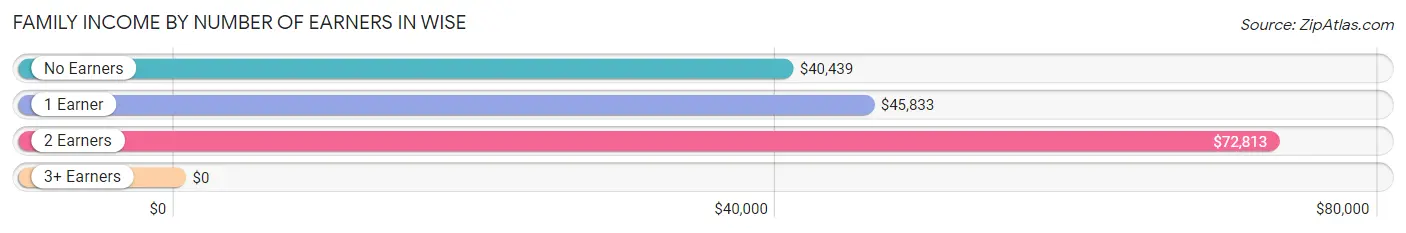
| Number of Earners | # Families | Median Income |
| No Earners | 179 (25.9%) | $40,439 |
| 1 Earner | 258 (37.3%) | $45,833 |
| 2 Earners | 205 (29.6%) | $72,813 |
| 3+ Earners | 50 (7.2%) | $0 |
| Total | 692 (100.0%) | $45,686 |
Household Income in Wise
Household Income Brackets in Wise
With 381 households falling in the category, the $50,000 to $74,999 income range is the most frequent in Wise, accounting for 27.3% of all households. In contrast, only 13 households (0.9%) fall into the less than $10,000 income bracket, making it the least populous group.
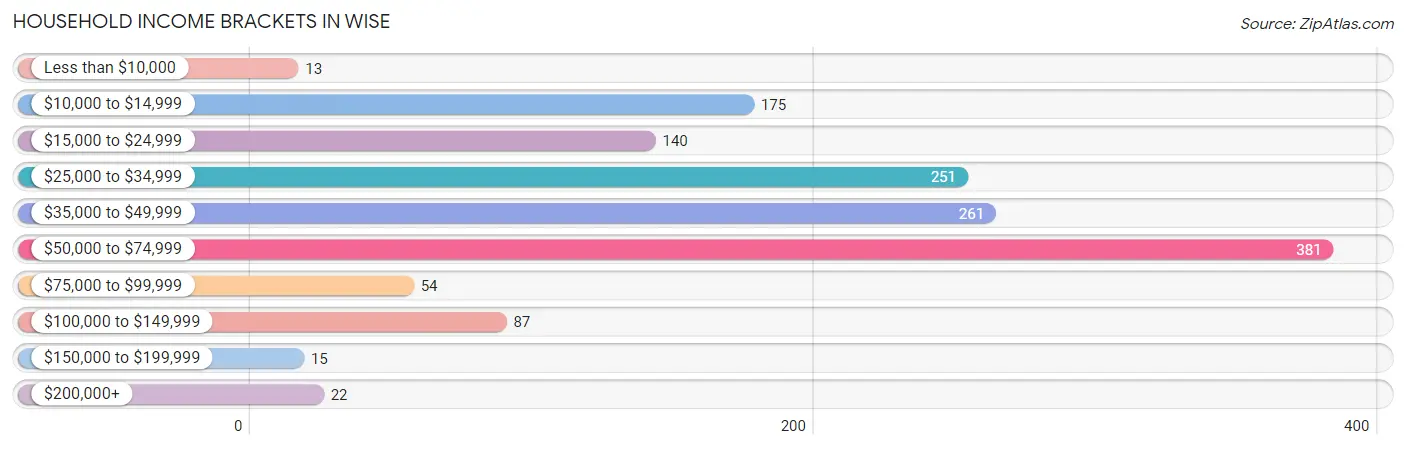
| Income Bracket | # Households | % Households |
| Less than $10,000 | 13 | 0.9% |
| $10,000 to $14,999 | 175 | 12.5% |
| $15,000 to $24,999 | 140 | 10.0% |
| $25,000 to $34,999 | 251 | 18.0% |
| $35,000 to $49,999 | 261 | 18.7% |
| $50,000 to $74,999 | 381 | 27.3% |
| $75,000 to $99,999 | 54 | 3.9% |
| $100,000 to $149,999 | 87 | 6.2% |
| $150,000 to $199,999 | 15 | 1.1% |
| $200,000+ | 22 | 1.6% |
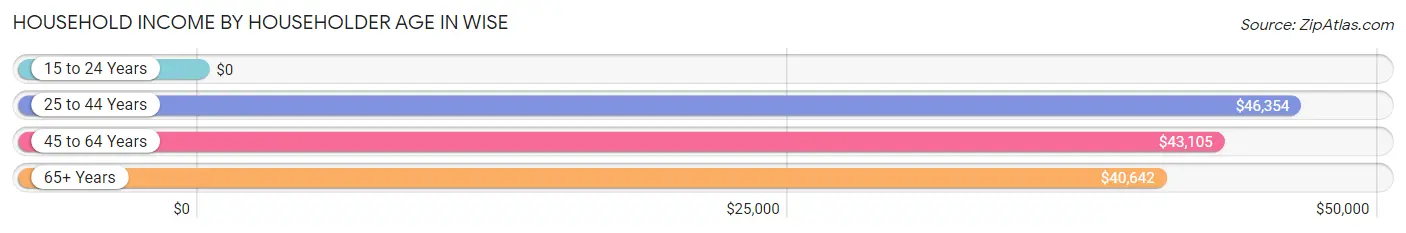
Household Income by Householder Age in Wise
The median household income in Wise is $42,944, with the highest median household income of $46,354 found in the 25 to 44 years age bracket for the primary householder. A total of 457 households (32.7%) fall into this category. Meanwhile, the 15 to 24 years age bracket for the primary householder has the lowest median household income of $0, with 12 households (0.9%) in this group.
| Income Bracket | # Households | Median Income |
| 15 to 24 Years | 12 (0.9%) | $0 |
| 25 to 44 Years | 457 (32.7%) | $46,354 |
| 45 to 64 Years | 527 (37.7%) | $43,105 |
| 65+ Years | 401 (28.7%) | $40,642 |
| Total | 1,397 (100.0%) | $42,944 |
Poverty in Wise
Income Below Poverty by Sex and Age in Wise
With 23.7% poverty level for males and 20.9% for females among the residents of Wise, under 5 year old males and 25 to 34 year old females are the most vulnerable to poverty, with 68 males (60.7%) and 203 females (78.4%) in their respective age groups living below the poverty level.
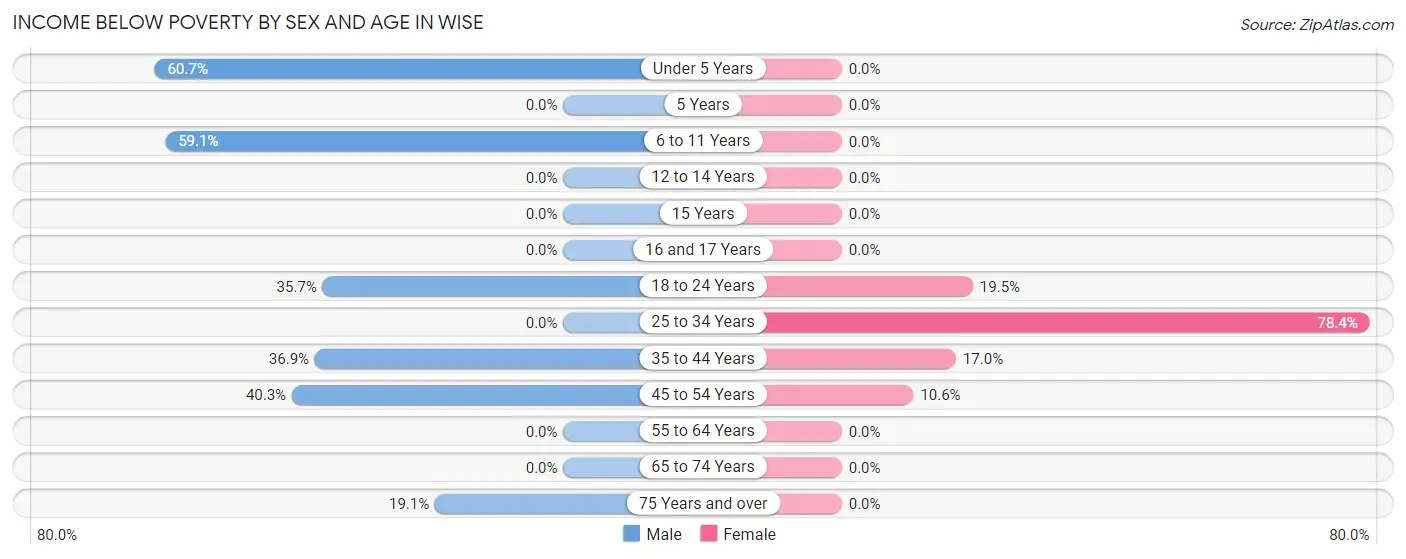
| Age Bracket | Male | Female |
| Under 5 Years | 68 (60.7%) | 0 (0.0%) |
| 5 Years | 0 (0.0%) | 0 (0.0%) |
| 6 to 11 Years | 81 (59.1%) | 0 (0.0%) |
| 12 to 14 Years | 0 (0.0%) | 0 (0.0%) |
| 15 Years | 0 (0.0%) | 0 (0.0%) |
| 16 and 17 Years | 0 (0.0%) | 0 (0.0%) |
| 18 to 24 Years | 84 (35.7%) | 22 (19.5%) |
| 25 to 34 Years | 0 (0.0%) | 203 (78.4%) |
| 35 to 44 Years | 38 (36.9%) | 29 (17.0%) |
| 45 to 54 Years | 81 (40.3%) | 25 (10.6%) |
| 55 to 64 Years | 0 (0.0%) | 0 (0.0%) |
| 65 to 74 Years | 0 (0.0%) | 0 (0.0%) |
| 75 Years and over | 12 (19.1%) | 0 (0.0%) |
| Total | 364 (23.7%) | 279 (20.9%) |
Income Above Poverty by Sex and Age in Wise
According to the poverty statistics in Wise, males aged 12 to 14 years and females aged under 5 years are the age groups that are most secure financially, with 100.0% of males and 100.0% of females in these age groups living above the poverty line.
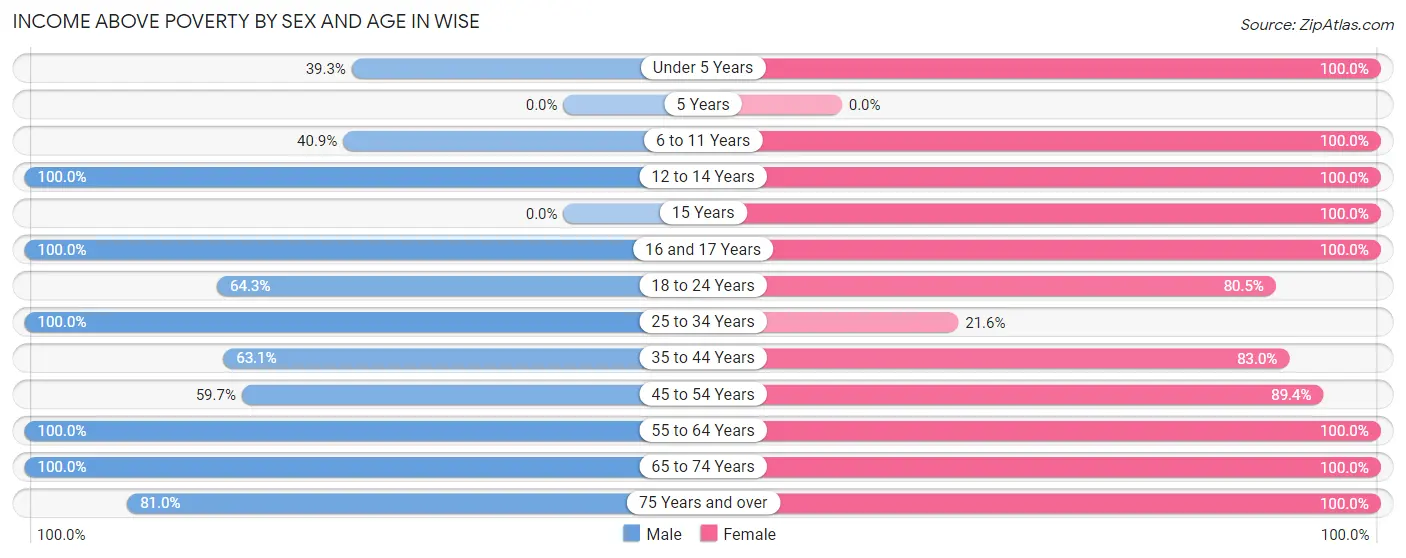
| Age Bracket | Male | Female |
| Under 5 Years | 44 (39.3%) | 24 (100.0%) |
| 5 Years | 0 (0.0%) | 0 (0.0%) |
| 6 to 11 Years | 56 (40.9%) | 19 (100.0%) |
| 12 to 14 Years | 49 (100.0%) | 30 (100.0%) |
| 15 Years | 0 (0.0%) | 10 (100.0%) |
| 16 and 17 Years | 10 (100.0%) | 43 (100.0%) |
| 18 to 24 Years | 151 (64.3%) | 91 (80.5%) |
| 25 to 34 Years | 176 (100.0%) | 56 (21.6%) |
| 35 to 44 Years | 65 (63.1%) | 142 (83.0%) |
| 45 to 54 Years | 120 (59.7%) | 210 (89.4%) |
| 55 to 64 Years | 261 (100.0%) | 193 (100.0%) |
| 65 to 74 Years | 190 (100.0%) | 175 (100.0%) |
| 75 Years and over | 51 (80.9%) | 60 (100.0%) |
| Total | 1,173 (76.3%) | 1,053 (79.0%) |
Income Below Poverty Among Married-Couple Families in Wise
The poverty statistics for married-couple families in Wise show that 13.4% or 63 of the total 469 families live below the poverty line. Families with 1 or 2 children have the highest poverty rate of 45.7%, comprising of 63 families. On the other hand, families with no children have the lowest poverty rate of 0.0%, which includes 0 families.
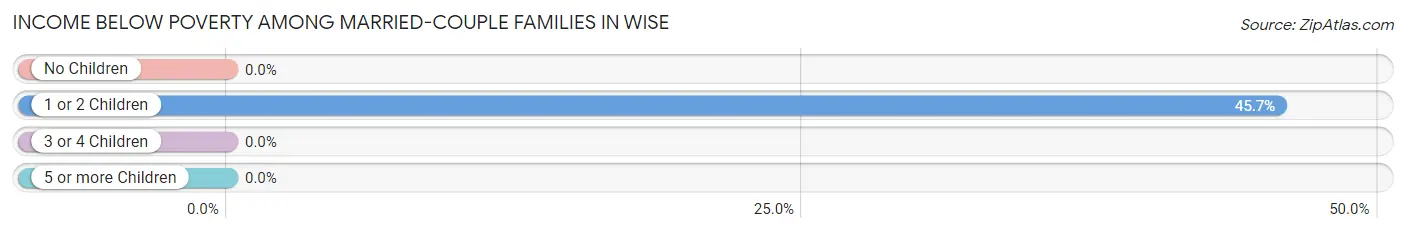
| Children | Above Poverty | Below Poverty |
| No Children | 320 (100.0%) | 0 (0.0%) |
| 1 or 2 Children | 75 (54.3%) | 63 (45.7%) |
| 3 or 4 Children | 11 (100.0%) | 0 (0.0%) |
| 5 or more Children | 0 (0.0%) | 0 (0.0%) |
| Total | 406 (86.6%) | 63 (13.4%) |
Income Below Poverty Among Single-Parent Households in Wise
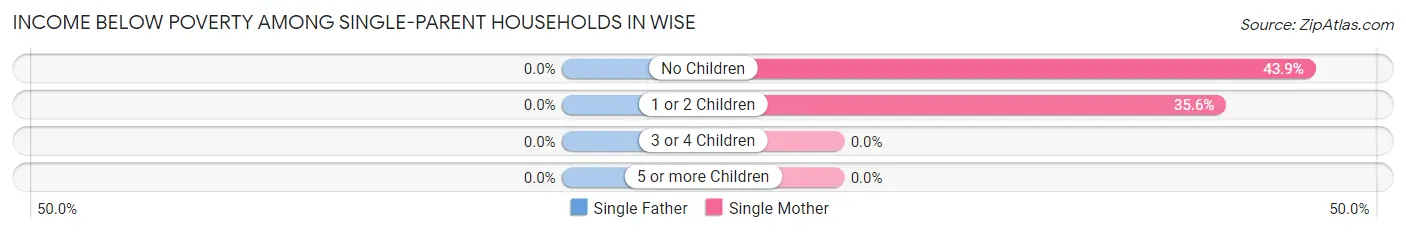
| Children | Single Father | Single Mother |
| No Children | 0 (0.0%) | 29 (43.9%) |
| 1 or 2 Children | 0 (0.0%) | 26 (35.6%) |
| 3 or 4 Children | 0 (0.0%) | 0 (0.0%) |
| 5 or more Children | 0 (0.0%) | 0 (0.0%) |
| Total | 0 (0.0%) | 55 (39.6%) |
Income Below Poverty Among Married-Couple vs Single-Parent Households in Wise
The poverty data for Wise shows that 63 of the married-couple family households (13.4%) and 55 of the single-parent households (24.7%) are living below the poverty level. Within the married-couple family households, those with 1 or 2 children have the highest poverty rate, with 63 households (45.7%) falling below the poverty line. Among the single-parent households, those with no children have the highest poverty rate, with 29 household (43.9%) living below poverty.
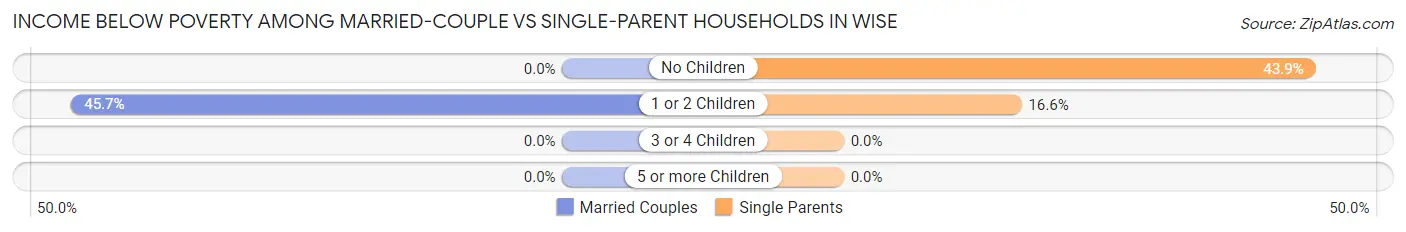
| Children | Married-Couple Families | Single-Parent Households |
| No Children | 0 (0.0%) | 29 (43.9%) |
| 1 or 2 Children | 63 (45.7%) | 26 (16.6%) |
| 3 or 4 Children | 0 (0.0%) | 0 (0.0%) |
| 5 or more Children | 0 (0.0%) | 0 (0.0%) |
| Total | 63 (13.4%) | 55 (24.7%) |
Race in Wise
The most populous races in Wise are White / Caucasian (2,645 | 89.3%), Two or more Races (223 | 7.5%), and Hispanic or Latino (99 | 3.3%).
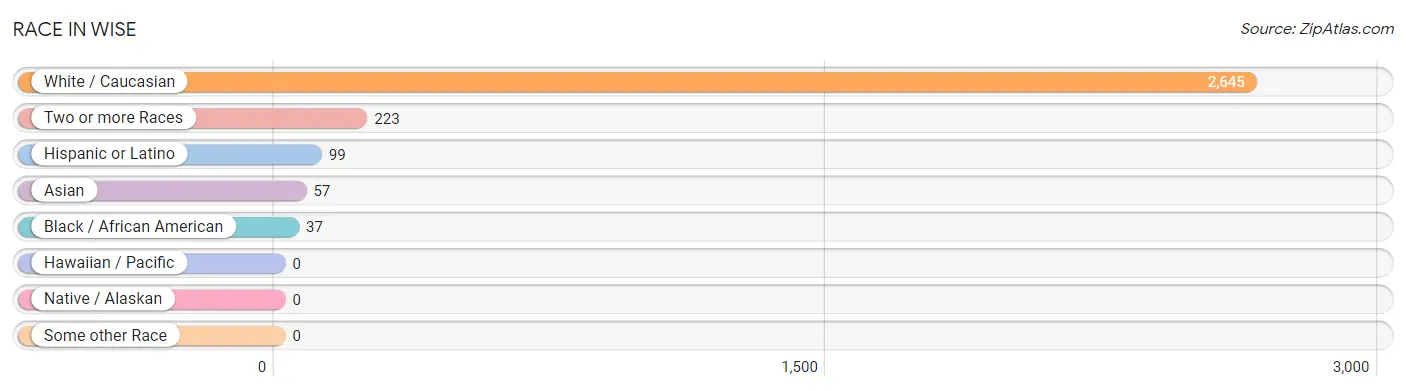
| Race | # Population | % Population |
| Asian | 57 | 1.9% |
| Black / African American | 37 | 1.3% |
| Hawaiian / Pacific | 0 | 0.0% |
| Hispanic or Latino | 99 | 3.3% |
| Native / Alaskan | 0 | 0.0% |
| White / Caucasian | 2,645 | 89.3% |
| Two or more Races | 223 | 7.5% |
| Some other Race | 0 | 0.0% |
| Total | 2,962 | 100.0% |
Ancestry in Wise
The most populous ancestries reported in Wise are American (1,080 | 36.5%), English (323 | 10.9%), Irish (255 | 8.6%), Scottish (196 | 6.6%), and German (129 | 4.4%), together accounting for 66.9% of all Wise residents.
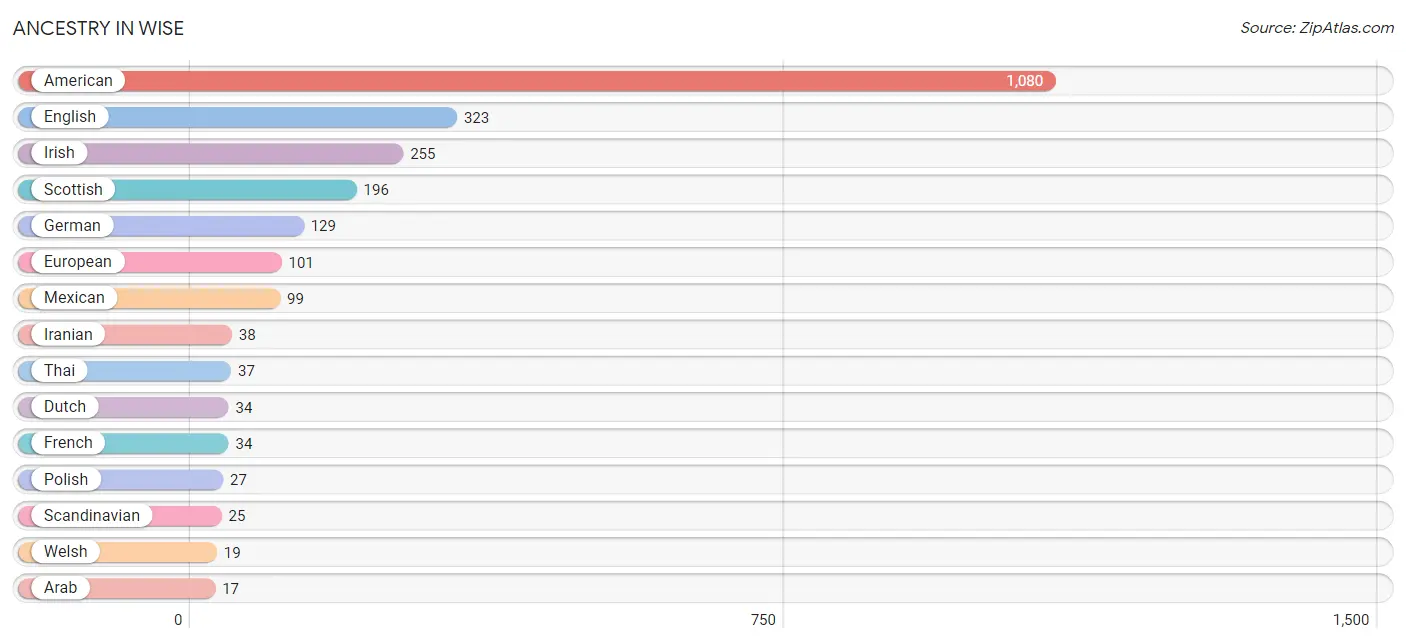
| Ancestry | # Population | % Population |
| American | 1,080 | 36.5% |
| Arab | 17 | 0.6% |
| British | 8 | 0.3% |
| Dutch | 34 | 1.1% |
| English | 323 | 10.9% |
| European | 101 | 3.4% |
| French | 34 | 1.1% |
| German | 129 | 4.4% |
| Iranian | 38 | 1.3% |
| Irish | 255 | 8.6% |
| Italian | 15 | 0.5% |
| Lithuanian | 11 | 0.4% |
| Mexican | 99 | 3.3% |
| Norwegian | 13 | 0.4% |
| Polish | 27 | 0.9% |
| Russian | 11 | 0.4% |
| Scandinavian | 25 | 0.8% |
| Scotch-Irish | 13 | 0.4% |
| Scottish | 196 | 6.6% |
| Syrian | 17 | 0.6% |
| Thai | 37 | 1.3% |
| Welsh | 19 | 0.6% | View All 22 Rows |
Immigrants in Wise
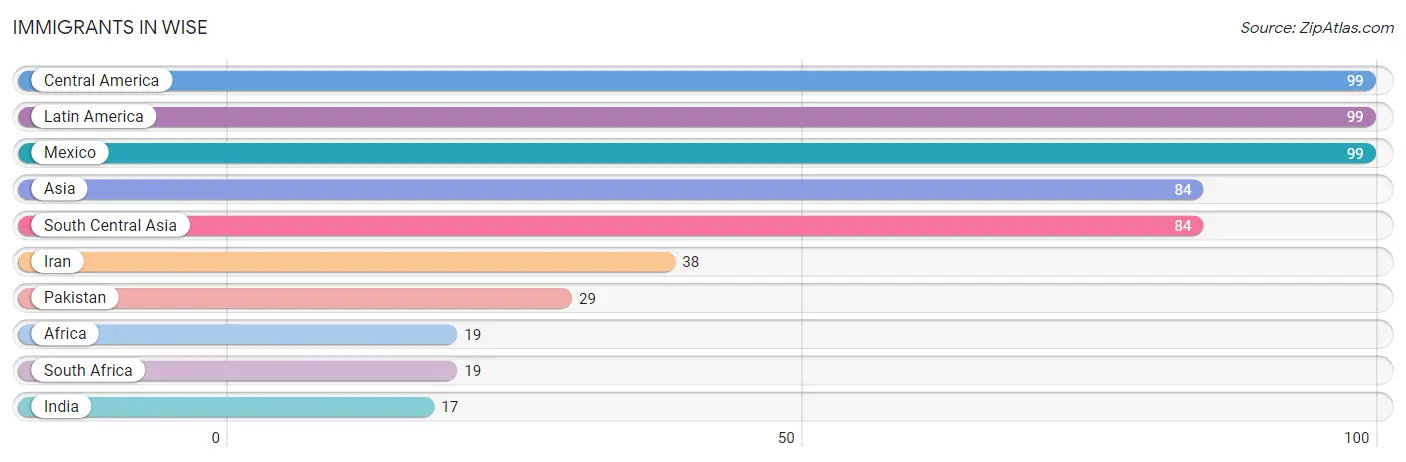
The most numerous immigrant groups reported in Wise came from Central America (99 | 3.3%), Latin America (99 | 3.3%), Mexico (99 | 3.3%), Asia (84 | 2.8%), and South Central Asia (84 | 2.8%), together accounting for 15.7% of all Wise residents.
| Immigration Origin | # Population | % Population |
| Africa | 19 | 0.6% |
| Asia | 84 | 2.8% |
| Central America | 99 | 3.3% |
| India | 17 | 0.6% |
| Iran | 38 | 1.3% |
| Latin America | 99 | 3.3% |
| Mexico | 99 | 3.3% |
| Pakistan | 29 | 1.0% |
| South Africa | 19 | 0.6% |
| South Central Asia | 84 | 2.8% | View All 10 Rows |
Sex and Age in Wise
Sex and Age in Wise
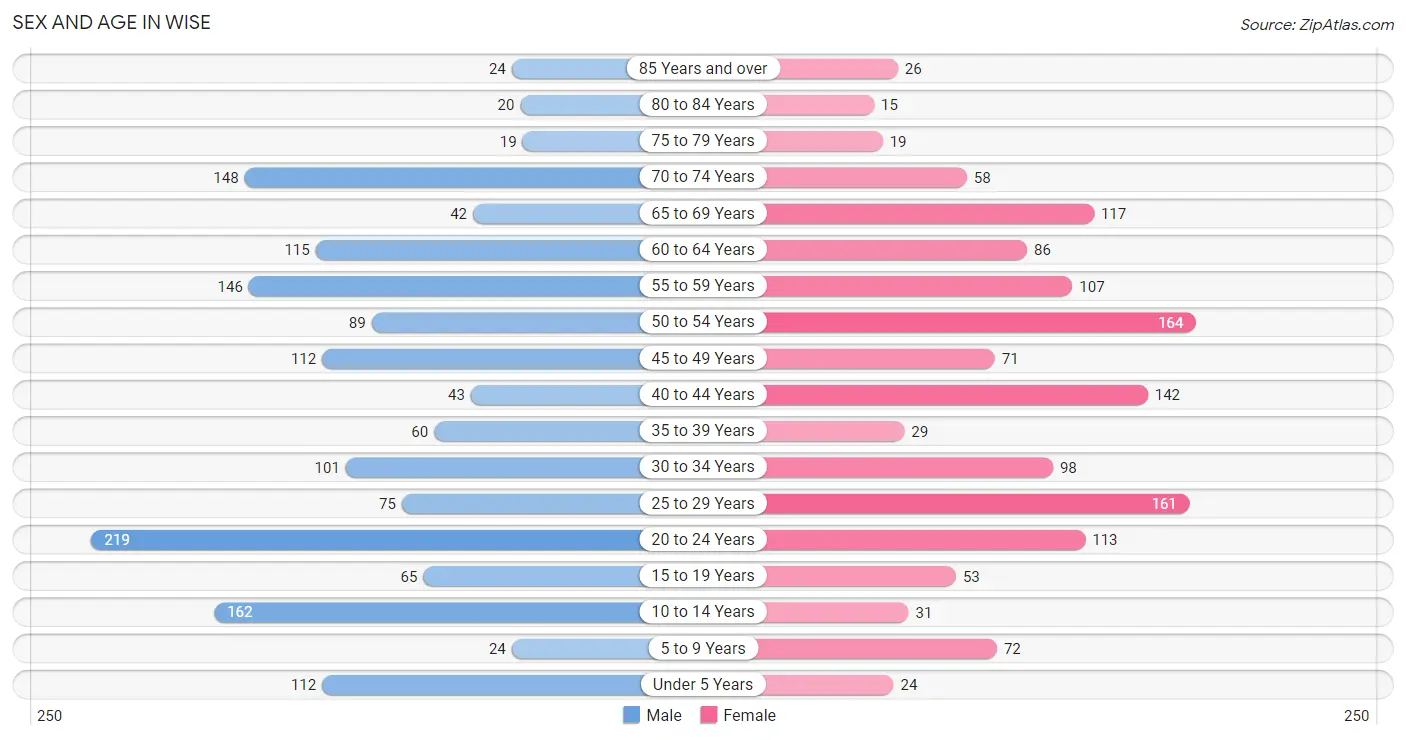
The most populous age groups in Wise are 20 to 24 Years (219 | 13.9%) for men and 50 to 54 Years (164 | 11.8%) for women.
| Age Bracket | Male | Female |
| Under 5 Years | 112 (7.1%) | 24 (1.7%) |
| 5 to 9 Years | 24 (1.5%) | 72 (5.2%) |
| 10 to 14 Years | 162 (10.3%) | 31 (2.2%) |
| 15 to 19 Years | 65 (4.1%) | 53 (3.8%) |
| 20 to 24 Years | 219 (13.9%) | 113 (8.2%) |
| 25 to 29 Years | 75 (4.8%) | 161 (11.6%) |
| 30 to 34 Years | 101 (6.4%) | 98 (7.1%) |
| 35 to 39 Years | 60 (3.8%) | 29 (2.1%) |
| 40 to 44 Years | 43 (2.7%) | 142 (10.2%) |
| 45 to 49 Years | 112 (7.1%) | 71 (5.1%) |
| 50 to 54 Years | 89 (5.7%) | 164 (11.8%) |
| 55 to 59 Years | 146 (9.3%) | 107 (7.7%) |
| 60 to 64 Years | 115 (7.3%) | 86 (6.2%) |
| 65 to 69 Years | 42 (2.7%) | 117 (8.4%) |
| 70 to 74 Years | 148 (9.4%) | 58 (4.2%) |
| 75 to 79 Years | 19 (1.2%) | 19 (1.4%) |
| 80 to 84 Years | 20 (1.3%) | 15 (1.1%) |
| 85 Years and over | 24 (1.5%) | 26 (1.9%) |
| Total | 1,576 (100.0%) | 1,386 (100.0%) |
Families and Households in Wise
Median Family Size in Wise
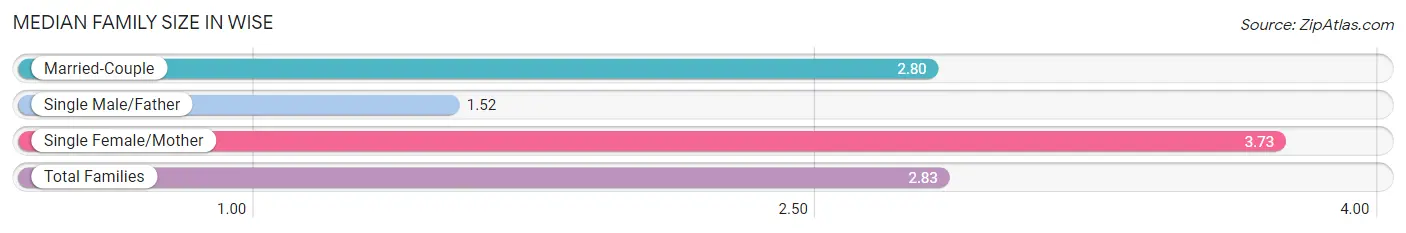
The median family size in Wise is 2.83 persons per family, with single female/mother families (139 | 20.1%) accounting for the largest median family size of 3.73 persons per family. On the other hand, single male/father families (84 | 12.1%) represent the smallest median family size with 1.52 persons per family.
| Family Type | # Families | Family Size |
| Married-Couple | 469 (67.8%) | 2.80 |
| Single Male/Father | 84 (12.1%) | 1.52 |
| Single Female/Mother | 139 (20.1%) | 3.73 |
| Total Families | 692 (100.0%) | 2.83 |
Median Household Size in Wise
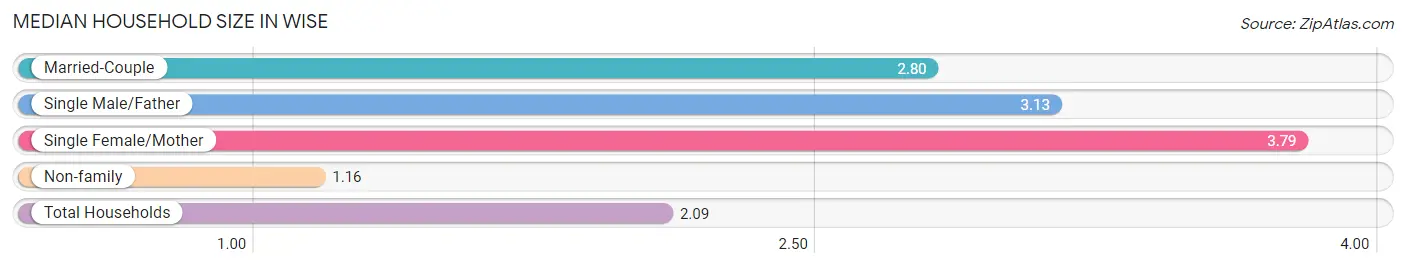
The median household size in Wise is 2.09 persons per household, with single female/mother households (139 | 10.0%) accounting for the largest median household size of 3.79 persons per household. non-family households (705 | 50.5%) represent the smallest median household size with 1.16 persons per household.
| Household Type | # Households | Household Size |
| Married-Couple | 469 (33.6%) | 2.80 |
| Single Male/Father | 84 (6.0%) | 3.13 |
| Single Female/Mother | 139 (10.0%) | 3.79 |
| Non-family | 705 (50.5%) | 1.16 |
| Total Households | 1,397 (100.0%) | 2.09 |
Household Size by Marriage Status in Wise
Out of a total of 1,397 households in Wise, 692 (49.5%) are family households, while 705 (50.5%) are nonfamily households. The most numerous type of family households are 3-person households, comprising 249, and the most common type of nonfamily households are 1-person households, comprising 605.
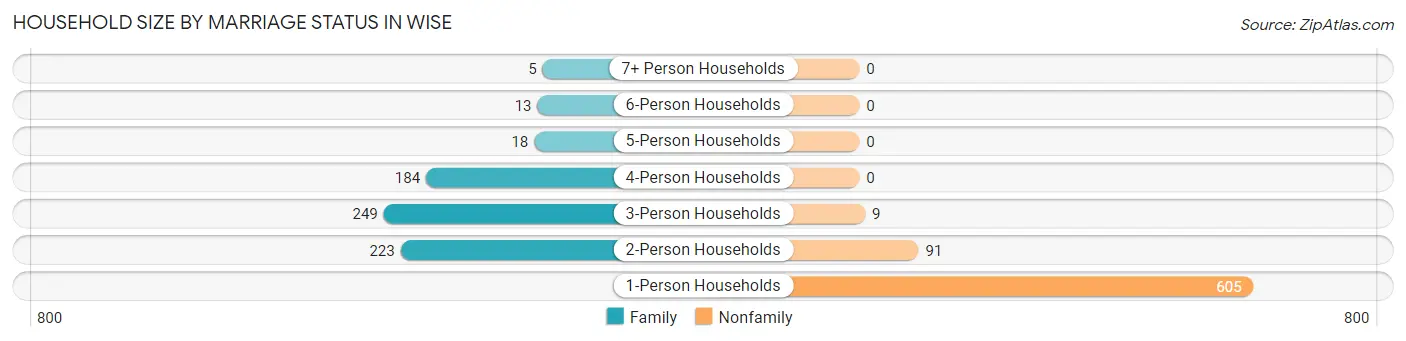
| Household Size | Family Households | Nonfamily Households |
| 1-Person Households | - | 605 (43.3%) |
| 2-Person Households | 223 (16.0%) | 91 (6.5%) |
| 3-Person Households | 249 (17.8%) | 9 (0.6%) |
| 4-Person Households | 184 (13.2%) | 0 (0.0%) |
| 5-Person Households | 18 (1.3%) | 0 (0.0%) |
| 6-Person Households | 13 (0.9%) | 0 (0.0%) |
| 7+ Person Households | 5 (0.4%) | 0 (0.0%) |
| Total | 692 (49.5%) | 705 (50.5%) |
Female Fertility in Wise
Fertility by Age in Wise
| Age Bracket | Women with Births | Births / 1,000 Women |
| 15 to 19 years | 0 (0.0%) | 0.0 |
| 20 to 34 years | 0 (0.0%) | 0.0 |
| 35 to 50 years | 0 (0.0%) | 0.0 |
| Total | 0 (0.0%) | 0.0 |
Fertility by Age by Marriage Status in Wise
| Age Bracket | Married | Unmarried |
| 15 to 19 years | 0 (0.0%) | 0 (0.0%) |
| 20 to 34 years | 0 (0.0%) | 0 (0.0%) |
| 35 to 50 years | 0 (0.0%) | 0 (0.0%) |
| Total | 0 (0.0%) | 0 (0.0%) |
Fertility by Education in Wise
| Educational Attainment | Women with Births | Births / 1,000 Women |
| Less than High School | 0 (0.0%) | 0.0 |
| High School Diploma | 0 (0.0%) | 0.0 |
| College or Associate's Degree | 0 (0.0%) | 0.0 |
| Bachelor's Degree | 0 (0.0%) | 0.0 |
| Graduate Degree | 0 (0.0%) | 0.0 |
| Total | 0 (0.0%) | 0.0 |
Fertility by Education by Marriage Status in Wise
| Educational Attainment | Married | Unmarried |
| Less than High School | 0 (0.0%) | 0 (0.0%) |
| High School Diploma | 0 (0.0%) | 0 (0.0%) |
| College or Associate's Degree | 0 (0.0%) | 0 (0.0%) |
| Bachelor's Degree | 0 (0.0%) | 0 (0.0%) |
| Graduate Degree | 0 (0.0%) | 0 (0.0%) |
| Total | 0 (0.0%) | 0 (0.0%) |
Employment Characteristics in Wise
Employment by Class of Employer in Wise
Among the 1,123 employed individuals in Wise, private company employees (733 | 65.3%), state government employees (139 | 12.4%), and local government employees (109 | 9.7%) make up the most common classes of employment.
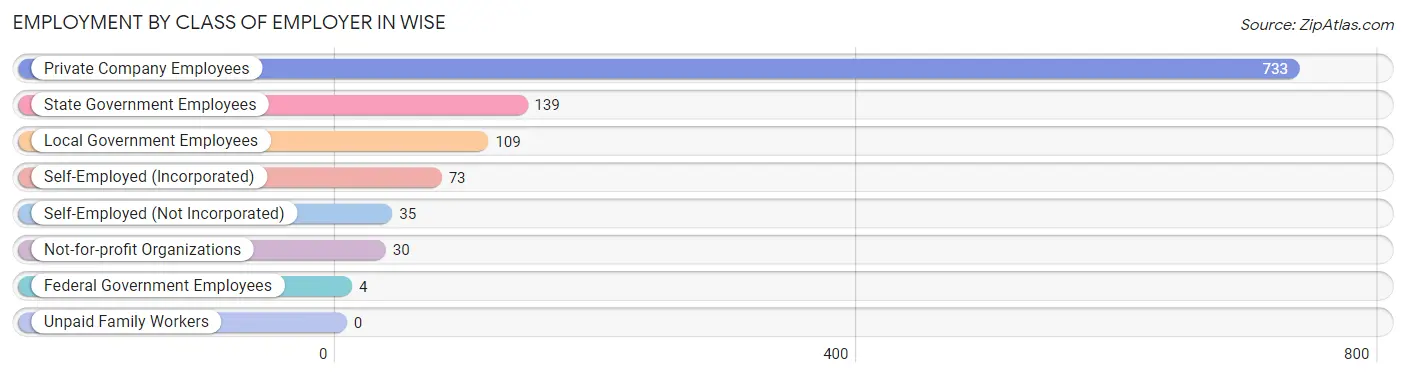
| Employer Class | # Employees | % Employees |
| Private Company Employees | 733 | 65.3% |
| Self-Employed (Incorporated) | 73 | 6.5% |
| Self-Employed (Not Incorporated) | 35 | 3.1% |
| Not-for-profit Organizations | 30 | 2.7% |
| Local Government Employees | 109 | 9.7% |
| State Government Employees | 139 | 12.4% |
| Federal Government Employees | 4 | 0.4% |
| Unpaid Family Workers | 0 | 0.0% |
| Total | 1,123 | 100.0% |
Employment Status by Age in Wise
According to the labor force statistics for Wise, out of the total population over 16 years of age (2,527), 50.5% or 1,276 individuals are in the labor force, with 4.2% or 54 of them unemployed. The age group with the highest labor force participation rate is 30 to 34 years, with 86.9% or 173 individuals in the labor force. Within the labor force, the 25 to 29 years age range has the highest percentage of unemployed individuals, with 20.7% or 19 of them being unemployed.
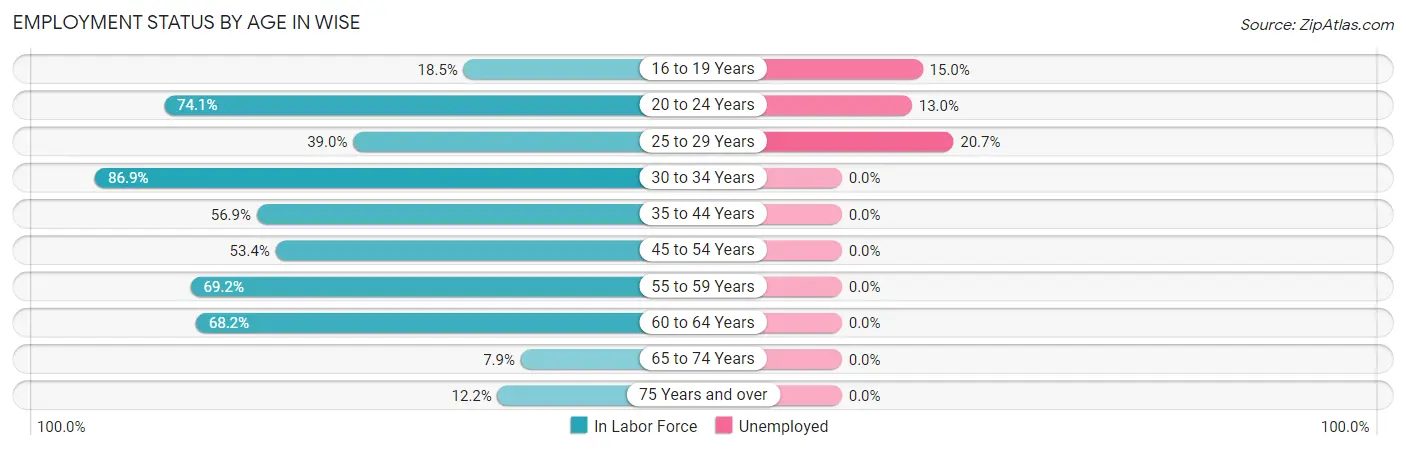
| Age Bracket | In Labor Force | Unemployed |
| 16 to 19 Years | 20 (18.5%) | 3 (15.0%) |
| 20 to 24 Years | 246 (74.1%) | 32 (13.0%) |
| 25 to 29 Years | 92 (39.0%) | 19 (20.7%) |
| 30 to 34 Years | 173 (86.9%) | 0 (0.0%) |
| 35 to 44 Years | 156 (56.9%) | 0 (0.0%) |
| 45 to 54 Years | 233 (53.4%) | 0 (0.0%) |
| 55 to 59 Years | 175 (69.2%) | 0 (0.0%) |
| 60 to 64 Years | 137 (68.2%) | 0 (0.0%) |
| 65 to 74 Years | 29 (7.9%) | 0 (0.0%) |
| 75 Years and over | 15 (12.2%) | 0 (0.0%) |
| Total | 1,276 (50.5%) | 54 (4.2%) |
Employment Status by Educational Attainment in Wise
According to labor force statistics for Wise, 60.4% of individuals (966) out of the total population between 25 and 64 years of age (1,599) are in the labor force, with 2.0% or 19 of them being unemployed. The group with the highest labor force participation rate are those with the educational attainment of bachelor's degree or higher, with 96.0% or 407 individuals in the labor force. Within the labor force, individuals with high school diploma education have the highest percentage of unemployment, with 29.7% or 19 of them being unemployed.
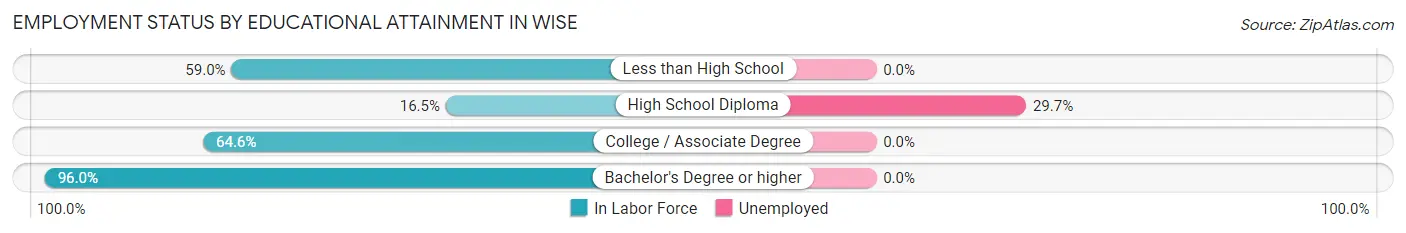
| Educational Attainment | In Labor Force | Unemployed |
| Less than High School | 134 (59.0%) | 0 (0.0%) |
| High School Diploma | 64 (16.5%) | 116 (29.7%) |
| College / Associate Degree | 361 (64.6%) | 0 (0.0%) |
| Bachelor's Degree or higher | 407 (96.0%) | 0 (0.0%) |
| Total | 966 (60.4%) | 32 (2.0%) |
Employment Occupations by Sex in Wise
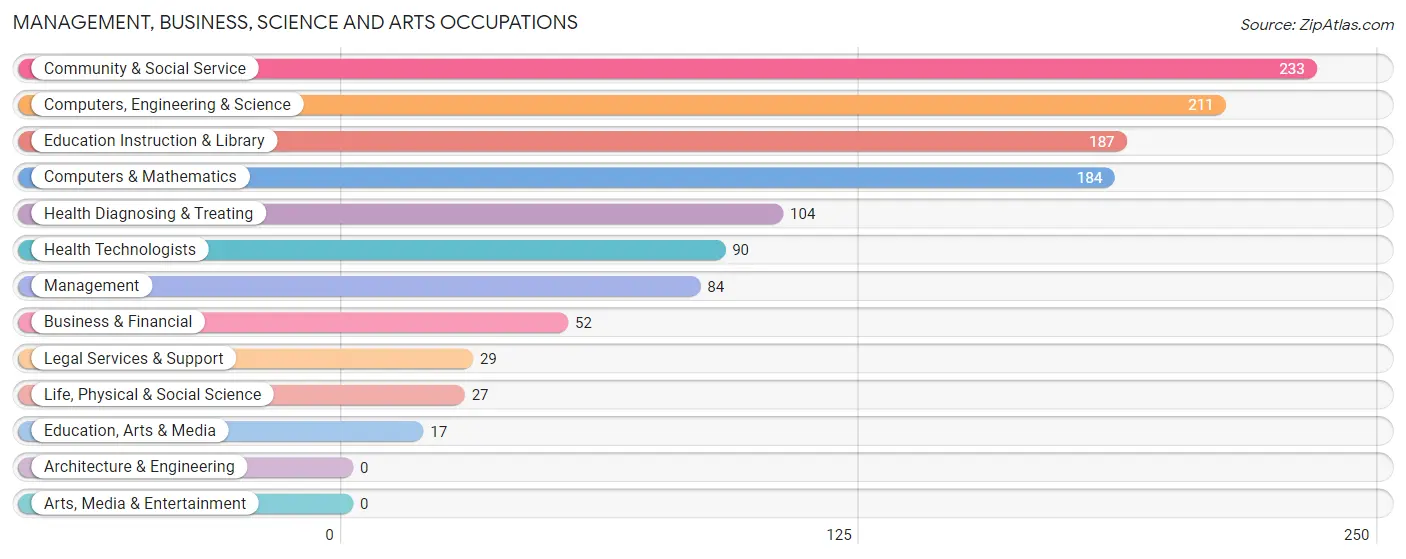
Management, Business, Science and Arts Occupations
The most common Management, Business, Science and Arts occupations in Wise are Community & Social Service (233 | 19.1%), Computers, Engineering & Science (211 | 17.3%), Education Instruction & Library (187 | 15.3%), Computers & Mathematics (184 | 15.1%), and Health Diagnosing & Treating (104 | 8.5%).
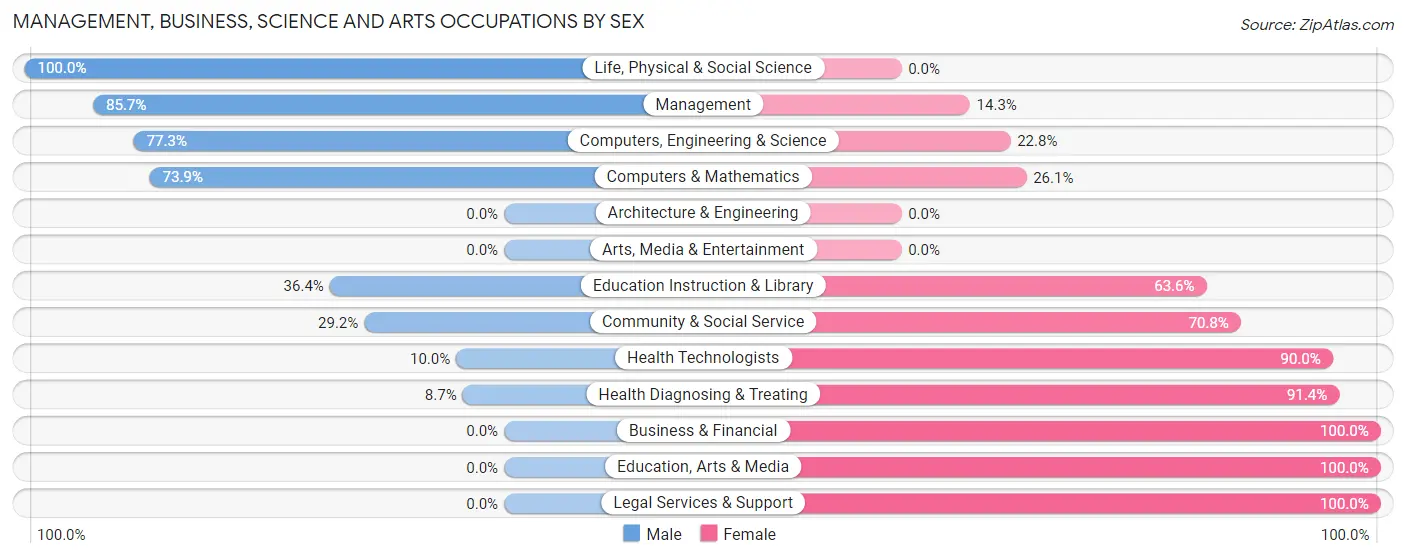
Management, Business, Science and Arts Occupations by Sex
Within the Management, Business, Science and Arts occupations in Wise, the most male-oriented occupations are Life, Physical & Social Science (100.0%), Management (85.7%), and Computers, Engineering & Science (77.2%), while the most female-oriented occupations are Business & Financial (100.0%), Education, Arts & Media (100.0%), and Legal Services & Support (100.0%).
| Occupation | Male | Female |
| Management | 72 (85.7%) | 12 (14.3%) |
| Business & Financial | 0 (0.0%) | 52 (100.0%) |
| Computers, Engineering & Science | 163 (77.2%) | 48 (22.8%) |
| Computers & Mathematics | 136 (73.9%) | 48 (26.1%) |
| Architecture & Engineering | 0 (0.0%) | 0 (0.0%) |
| Life, Physical & Social Science | 27 (100.0%) | 0 (0.0%) |
| Community & Social Service | 68 (29.2%) | 165 (70.8%) |
| Education, Arts & Media | 0 (0.0%) | 17 (100.0%) |
| Legal Services & Support | 0 (0.0%) | 29 (100.0%) |
| Education Instruction & Library | 68 (36.4%) | 119 (63.6%) |
| Arts, Media & Entertainment | 0 (0.0%) | 0 (0.0%) |
| Health Diagnosing & Treating | 9 (8.6%) | 95 (91.3%) |
| Health Technologists | 9 (10.0%) | 81 (90.0%) |
| Total (Category) | 312 (45.6%) | 372 (54.4%) |
| Total (Overall) | 626 (51.2%) | 596 (48.8%) |
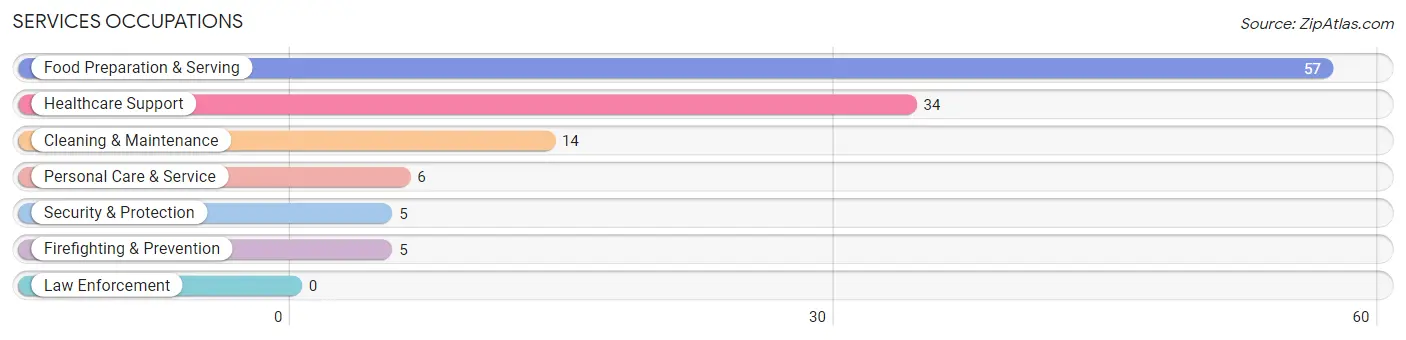
Services Occupations
The most common Services occupations in Wise are Food Preparation & Serving (57 | 4.7%), Healthcare Support (34 | 2.8%), Cleaning & Maintenance (14 | 1.1%), Personal Care & Service (6 | 0.5%), and Security & Protection (5 | 0.4%).
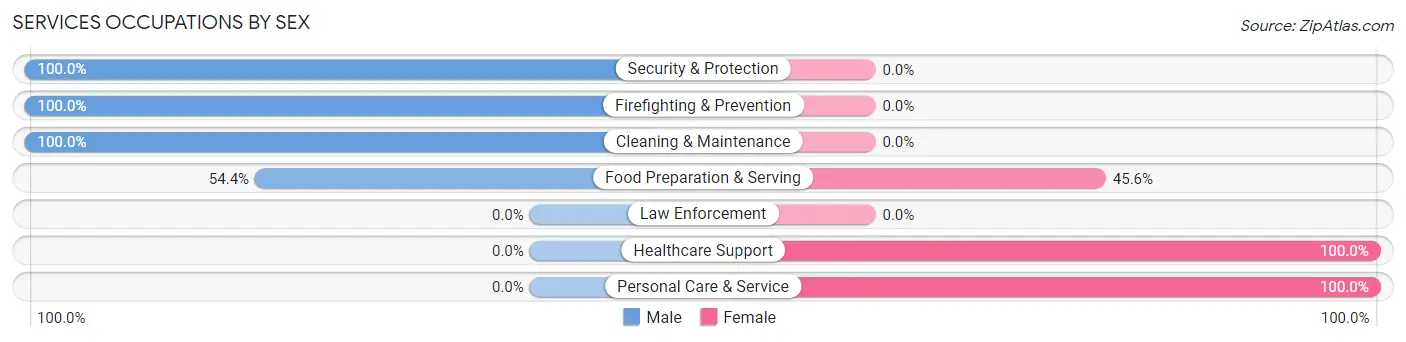
Services Occupations by Sex
Within the Services occupations in Wise, the most male-oriented occupations are Security & Protection (100.0%), Firefighting & Prevention (100.0%), and Cleaning & Maintenance (100.0%), while the most female-oriented occupations are Healthcare Support (100.0%), Personal Care & Service (100.0%), and Food Preparation & Serving (45.6%).
| Occupation | Male | Female |
| Healthcare Support | 0 (0.0%) | 34 (100.0%) |
| Security & Protection | 5 (100.0%) | 0 (0.0%) |
| Firefighting & Prevention | 5 (100.0%) | 0 (0.0%) |
| Law Enforcement | 0 (0.0%) | 0 (0.0%) |
| Food Preparation & Serving | 31 (54.4%) | 26 (45.6%) |
| Cleaning & Maintenance | 14 (100.0%) | 0 (0.0%) |
| Personal Care & Service | 0 (0.0%) | 6 (100.0%) |
| Total (Category) | 50 (43.1%) | 66 (56.9%) |
| Total (Overall) | 626 (51.2%) | 596 (48.8%) |
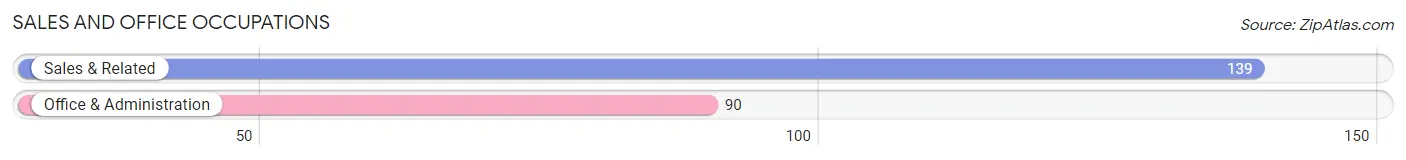
Sales and Office Occupations
The most common Sales and Office occupations in Wise are Sales & Related (139 | 11.4%), and Office & Administration (90 | 7.4%).
Sales and Office Occupations by Sex
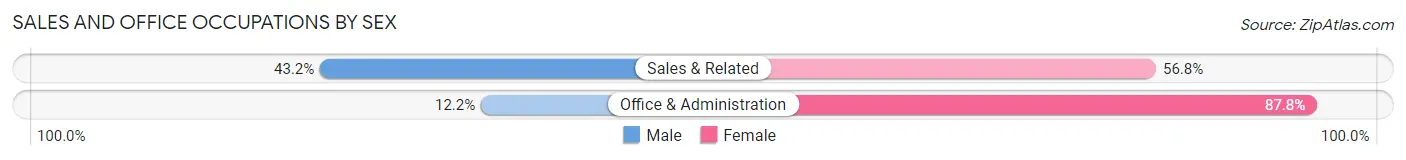
| Occupation | Male | Female |
| Sales & Related | 60 (43.2%) | 79 (56.8%) |
| Office & Administration | 11 (12.2%) | 79 (87.8%) |
| Total (Category) | 71 (31.0%) | 158 (69.0%) |
| Total (Overall) | 626 (51.2%) | 596 (48.8%) |
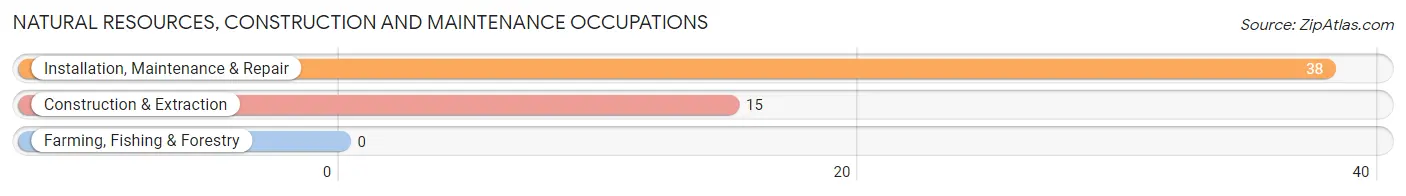
Natural Resources, Construction and Maintenance Occupations
The most common Natural Resources, Construction and Maintenance occupations in Wise are Installation, Maintenance & Repair (38 | 3.1%), and Construction & Extraction (15 | 1.2%).
Natural Resources, Construction and Maintenance Occupations by Sex
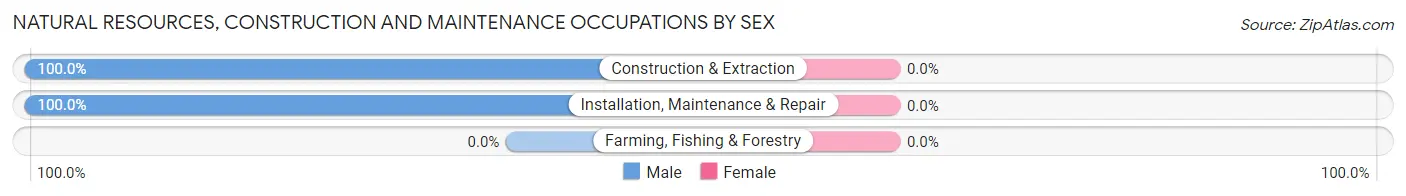
| Occupation | Male | Female |
| Farming, Fishing & Forestry | 0 (0.0%) | 0 (0.0%) |
| Construction & Extraction | 15 (100.0%) | 0 (0.0%) |
| Installation, Maintenance & Repair | 38 (100.0%) | 0 (0.0%) |
| Total (Category) | 53 (100.0%) | 0 (0.0%) |
| Total (Overall) | 626 (51.2%) | 596 (48.8%) |
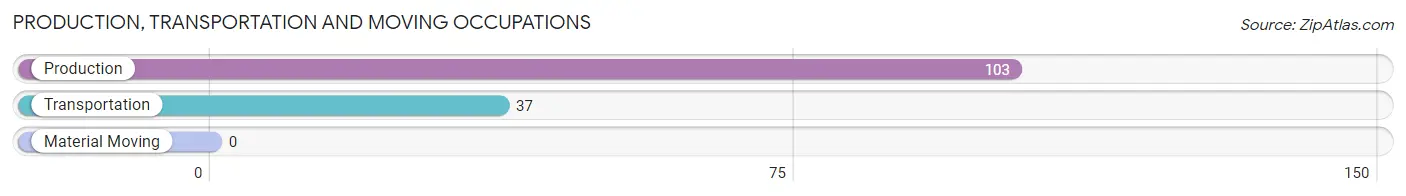
Production, Transportation and Moving Occupations
The most common Production, Transportation and Moving occupations in Wise are Production (103 | 8.4%), and Transportation (37 | 3.0%).
Production, Transportation and Moving Occupations by Sex
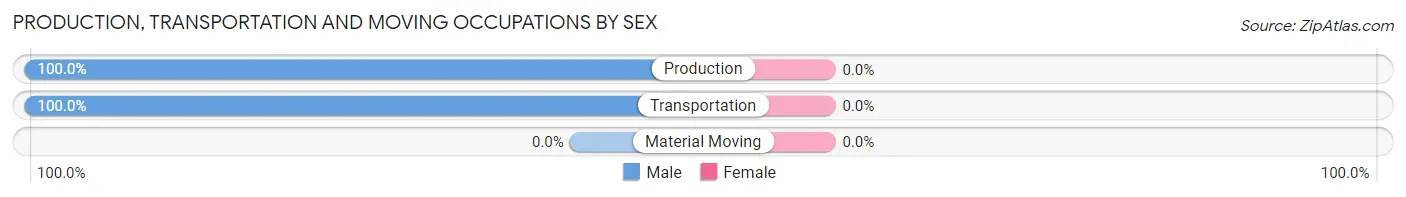
| Occupation | Male | Female |
| Production | 103 (100.0%) | 0 (0.0%) |
| Transportation | 37 (100.0%) | 0 (0.0%) |
| Material Moving | 0 (0.0%) | 0 (0.0%) |
| Total (Category) | 140 (100.0%) | 0 (0.0%) |
| Total (Overall) | 626 (51.2%) | 596 (48.8%) |
Employment Industries by Sex in Wise
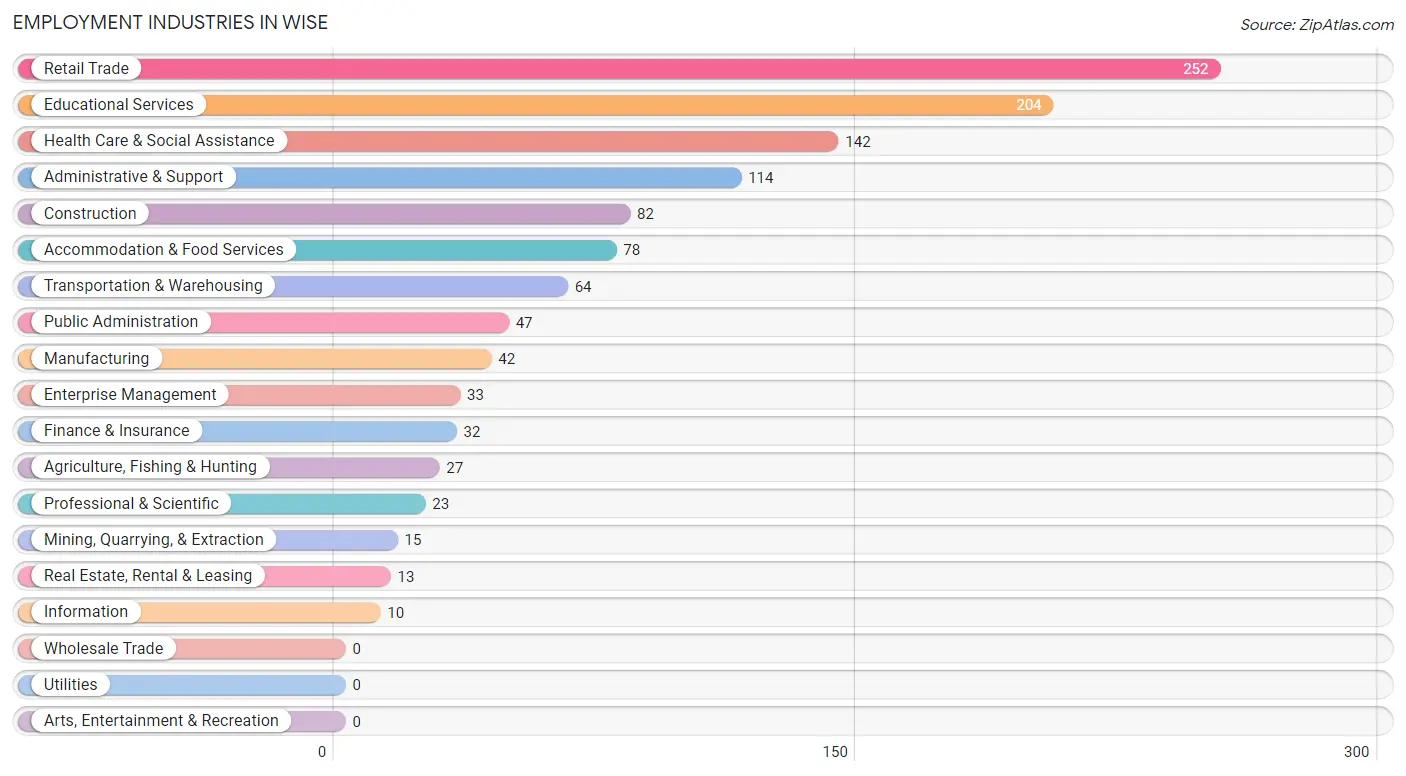
Employment Industries in Wise
The major employment industries in Wise include Retail Trade (252 | 20.6%), Educational Services (204 | 16.7%), Health Care & Social Assistance (142 | 11.6%), Administrative & Support (114 | 9.3%), and Construction (82 | 6.7%).
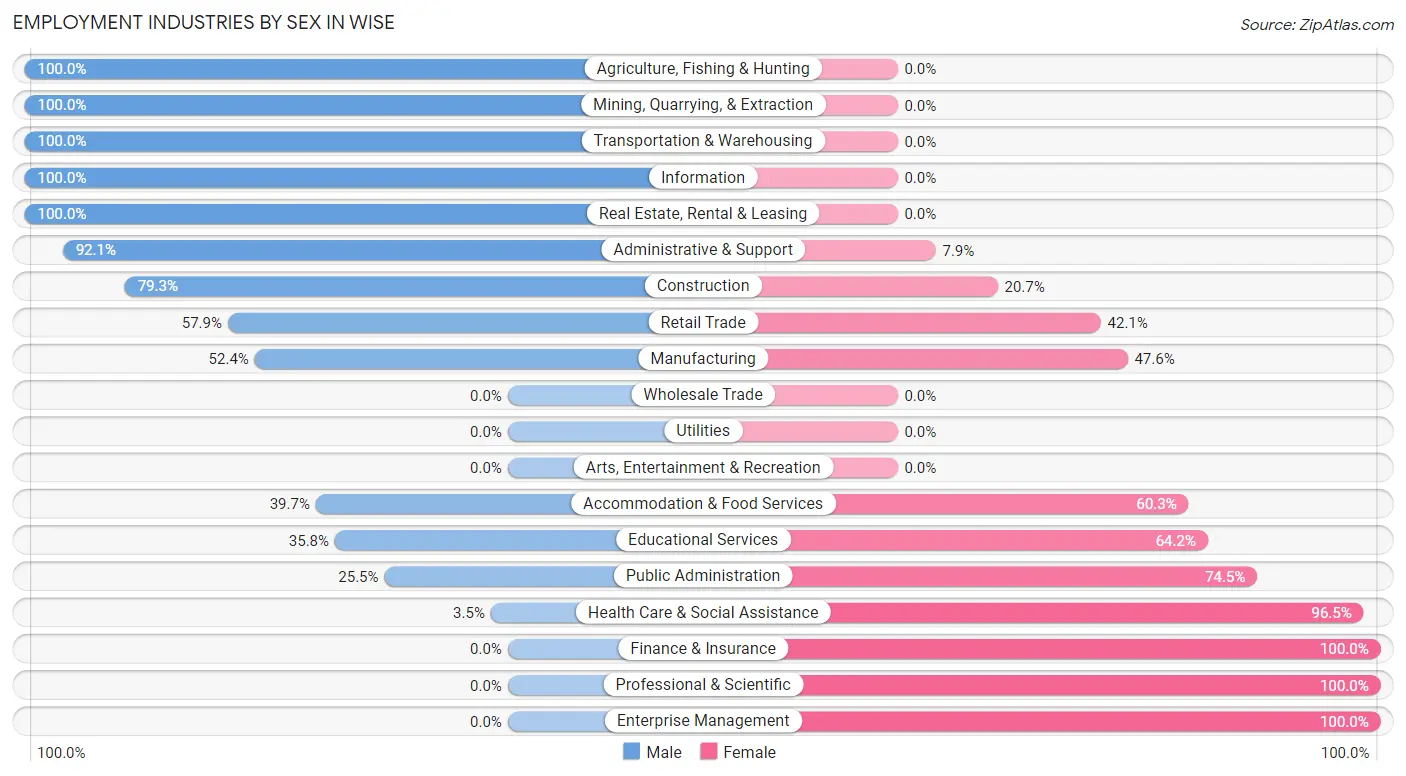
Employment Industries by Sex in Wise
The Wise industries that see more men than women are Agriculture, Fishing & Hunting (100.0%), Mining, Quarrying, & Extraction (100.0%), and Transportation & Warehousing (100.0%), whereas the industries that tend to have a higher number of women are Finance & Insurance (100.0%), Professional & Scientific (100.0%), and Enterprise Management (100.0%).
| Industry | Male | Female |
| Agriculture, Fishing & Hunting | 27 (100.0%) | 0 (0.0%) |
| Mining, Quarrying, & Extraction | 15 (100.0%) | 0 (0.0%) |
| Construction | 65 (79.3%) | 17 (20.7%) |
| Manufacturing | 22 (52.4%) | 20 (47.6%) |
| Wholesale Trade | 0 (0.0%) | 0 (0.0%) |
| Retail Trade | 146 (57.9%) | 106 (42.1%) |
| Transportation & Warehousing | 64 (100.0%) | 0 (0.0%) |
| Utilities | 0 (0.0%) | 0 (0.0%) |
| Information | 10 (100.0%) | 0 (0.0%) |
| Finance & Insurance | 0 (0.0%) | 32 (100.0%) |
| Real Estate, Rental & Leasing | 13 (100.0%) | 0 (0.0%) |
| Professional & Scientific | 0 (0.0%) | 23 (100.0%) |
| Enterprise Management | 0 (0.0%) | 33 (100.0%) |
| Administrative & Support | 105 (92.1%) | 9 (7.9%) |
| Educational Services | 73 (35.8%) | 131 (64.2%) |
| Health Care & Social Assistance | 5 (3.5%) | 137 (96.5%) |
| Arts, Entertainment & Recreation | 0 (0.0%) | 0 (0.0%) |
| Accommodation & Food Services | 31 (39.7%) | 47 (60.3%) |
| Public Administration | 12 (25.5%) | 35 (74.5%) |
| Total | 626 (51.2%) | 596 (48.8%) |
Education in Wise
School Enrollment in Wise
The most common levels of schooling among the 463 students in Wise are college / undergraduate (131 | 28.3%), middle school (127 | 27.4%), and high school (121 | 26.1%).
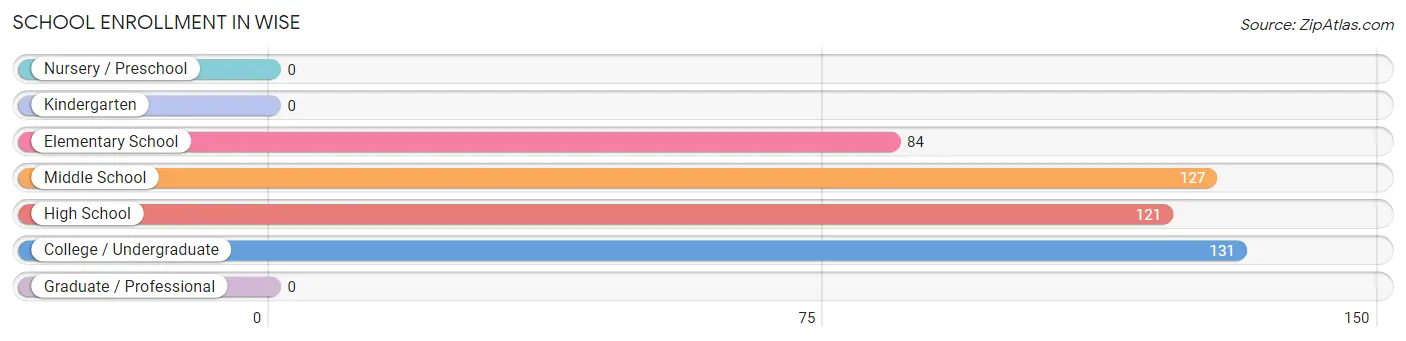
| School Level | # Students | % Students |
| Nursery / Preschool | 0 | 0.0% |
| Kindergarten | 0 | 0.0% |
| Elementary School | 84 | 18.1% |
| Middle School | 127 | 27.4% |
| High School | 121 | 26.1% |
| College / Undergraduate | 131 | 28.3% |
| Graduate / Professional | 0 | 0.0% |
| Total | 463 | 100.0% |
School Enrollment by Age by Funding Source in Wise
Out of a total of 463 students who are enrolled in schools in Wise, 14 (3.0%) attend a private institution, while the remaining 449 (97.0%) are enrolled in public schools. The age group of 5 to 9 year old has the highest likelihood of being enrolled in private schools, with 4 (5.6% in the age bracket) enrolled. Conversely, the age group of 15 to 17 year olds has the lowest likelihood of being enrolled in a private school, with 63 (100.0% in the age bracket) attending a public institution.
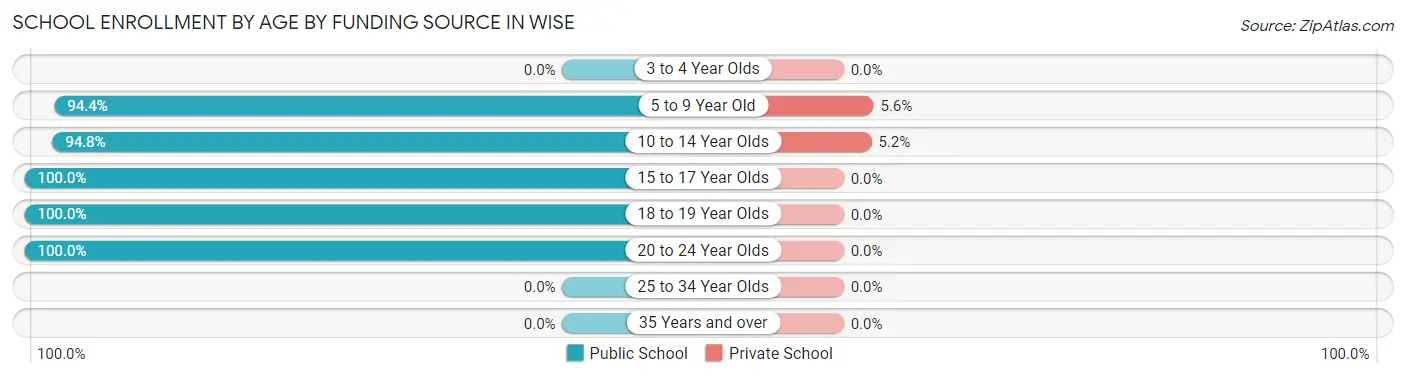
| Age Bracket | Public School | Private School |
| 3 to 4 Year Olds | 0 (0.0%) | 0 (0.0%) |
| 5 to 9 Year Old | 68 (94.4%) | 4 (5.6%) |
| 10 to 14 Year Olds | 183 (94.8%) | 10 (5.2%) |
| 15 to 17 Year Olds | 63 (100.0%) | 0 (0.0%) |
| 18 to 19 Year Olds | 21 (100.0%) | 0 (0.0%) |
| 20 to 24 Year Olds | 114 (100.0%) | 0 (0.0%) |
| 25 to 34 Year Olds | 0 (0.0%) | 0 (0.0%) |
| 35 Years and over | 0 (0.0%) | 0 (0.0%) |
| Total | 449 (97.0%) | 14 (3.0%) |
Educational Attainment by Field of Study in Wise
Education (195 | 29.8%), science & technology (106 | 16.2%), business (70 | 10.7%), arts & humanities (45 | 6.9%), and bio, nature & agricultural (36 | 5.5%) are the most common fields of study among 654 individuals in Wise who have obtained a bachelor's degree or higher.
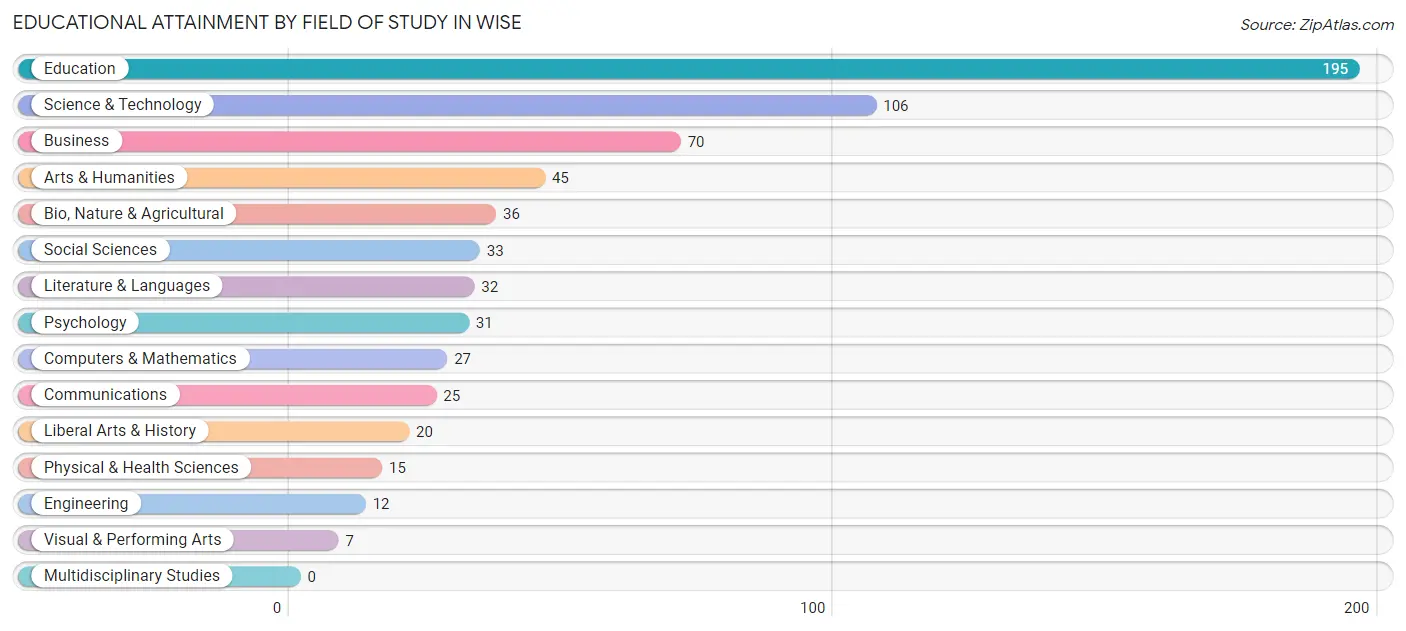
| Field of Study | # Graduates | % Graduates |
| Computers & Mathematics | 27 | 4.1% |
| Bio, Nature & Agricultural | 36 | 5.5% |
| Physical & Health Sciences | 15 | 2.3% |
| Psychology | 31 | 4.7% |
| Social Sciences | 33 | 5.1% |
| Engineering | 12 | 1.8% |
| Multidisciplinary Studies | 0 | 0.0% |
| Science & Technology | 106 | 16.2% |
| Business | 70 | 10.7% |
| Education | 195 | 29.8% |
| Literature & Languages | 32 | 4.9% |
| Liberal Arts & History | 20 | 3.1% |
| Visual & Performing Arts | 7 | 1.1% |
| Communications | 25 | 3.8% |
| Arts & Humanities | 45 | 6.9% |
| Total | 654 | 100.0% |
Transportation & Commute in Wise
Vehicle Availability by Sex in Wise
The most prevalent vehicle ownership categories in Wise are males with 2 vehicles (309, accounting for 50.7%) and females with 2 vehicles (206, making up 62.2%).
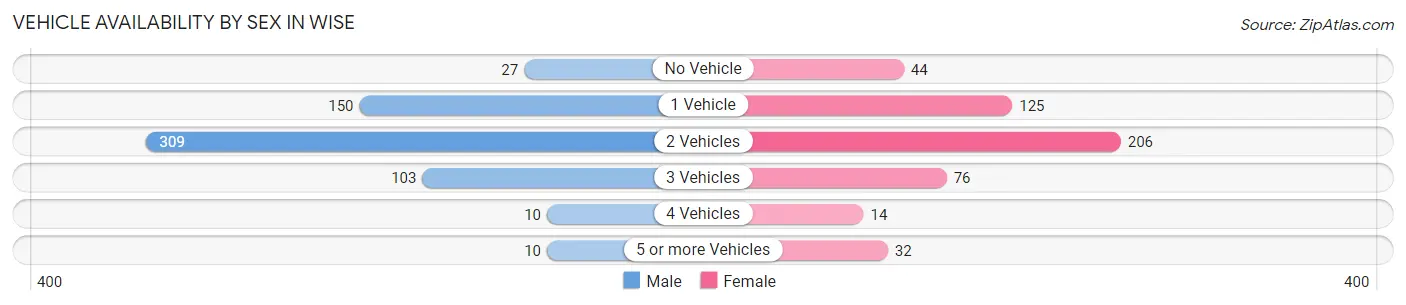
| Vehicles Available | Male | Female |
| No Vehicle | 27 (4.4%) | 44 (8.8%) |
| 1 Vehicle | 150 (24.6%) | 125 (25.2%) |
| 2 Vehicles | 309 (50.7%) | 206 (41.4%) |
| 3 Vehicles | 103 (16.9%) | 76 (15.3%) |
| 4 Vehicles | 10 (1.6%) | 14 (2.8%) |
| 5 or more Vehicles | 10 (1.6%) | 32 (6.4%) |
| Total | 609 (100.0%) | 497 (100.0%) |
Commute Time in Wise
The most frequently occuring commute durations in Wise are 5 to 9 minutes (247 commuters, 25.2%), 10 to 14 minutes (175 commuters, 17.9%), and 30 to 34 minutes (144 commuters, 14.7%).
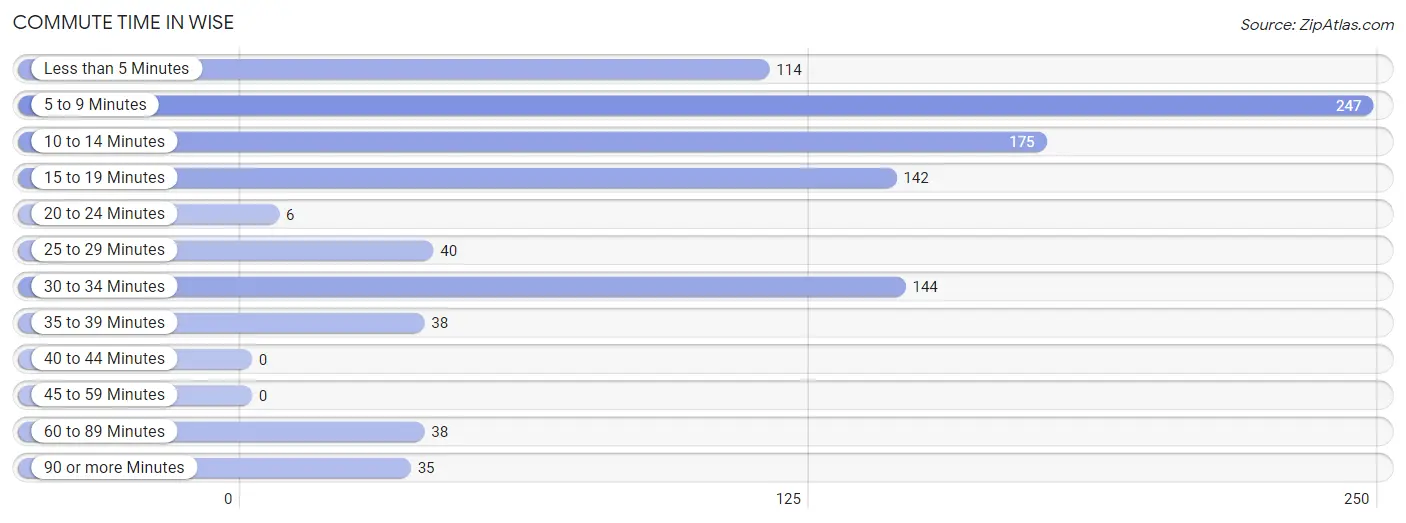
| Commute Time | # Commuters | % Commuters |
| Less than 5 Minutes | 114 | 11.6% |
| 5 to 9 Minutes | 247 | 25.2% |
| 10 to 14 Minutes | 175 | 17.9% |
| 15 to 19 Minutes | 142 | 14.5% |
| 20 to 24 Minutes | 6 | 0.6% |
| 25 to 29 Minutes | 40 | 4.1% |
| 30 to 34 Minutes | 144 | 14.7% |
| 35 to 39 Minutes | 38 | 3.9% |
| 40 to 44 Minutes | 0 | 0.0% |
| 45 to 59 Minutes | 0 | 0.0% |
| 60 to 89 Minutes | 38 | 3.9% |
| 90 or more Minutes | 35 | 3.6% |
Commute Time by Sex in Wise
The most common commute times in Wise are 5 to 9 minutes (89 commuters, 17.3%) for males and 5 to 9 minutes (158 commuters, 34.1%) for females.
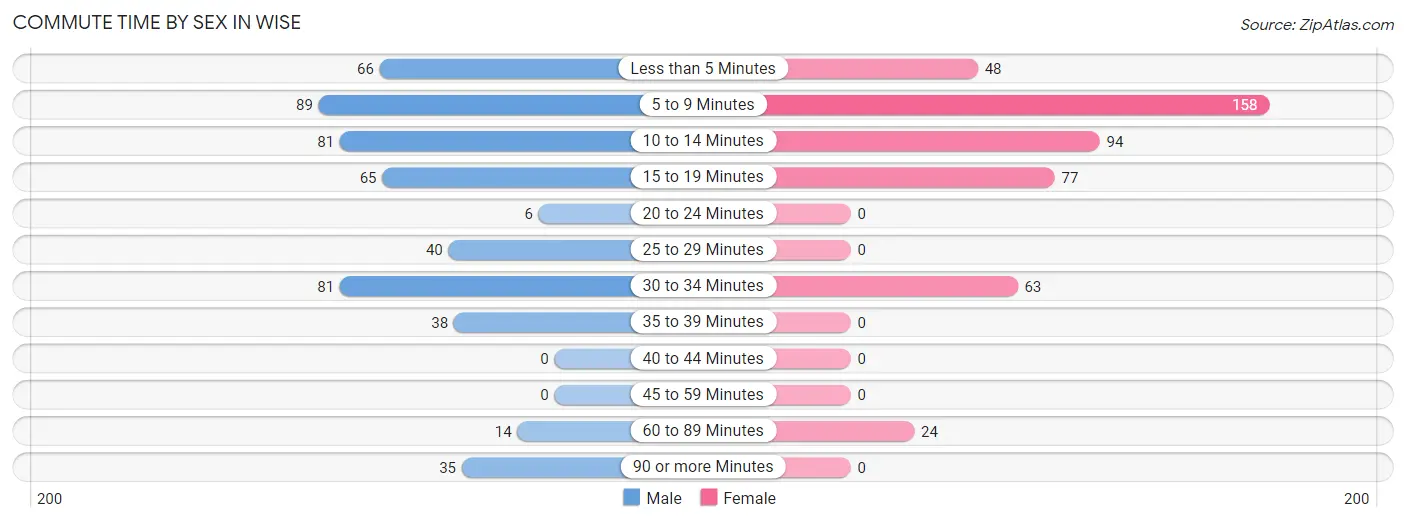
| Commute Time | Male | Female |
| Less than 5 Minutes | 66 (12.8%) | 48 (10.3%) |
| 5 to 9 Minutes | 89 (17.3%) | 158 (34.1%) |
| 10 to 14 Minutes | 81 (15.7%) | 94 (20.3%) |
| 15 to 19 Minutes | 65 (12.6%) | 77 (16.6%) |
| 20 to 24 Minutes | 6 (1.2%) | 0 (0.0%) |
| 25 to 29 Minutes | 40 (7.8%) | 0 (0.0%) |
| 30 to 34 Minutes | 81 (15.7%) | 63 (13.6%) |
| 35 to 39 Minutes | 38 (7.4%) | 0 (0.0%) |
| 40 to 44 Minutes | 0 (0.0%) | 0 (0.0%) |
| 45 to 59 Minutes | 0 (0.0%) | 0 (0.0%) |
| 60 to 89 Minutes | 14 (2.7%) | 24 (5.2%) |
| 90 or more Minutes | 35 (6.8%) | 0 (0.0%) |
Time of Departure to Work by Sex in Wise
The most frequent times of departure to work in Wise are 7:30 AM to 7:59 AM (115, 22.3%) for males and 7:30 AM to 7:59 AM (107, 23.1%) for females.
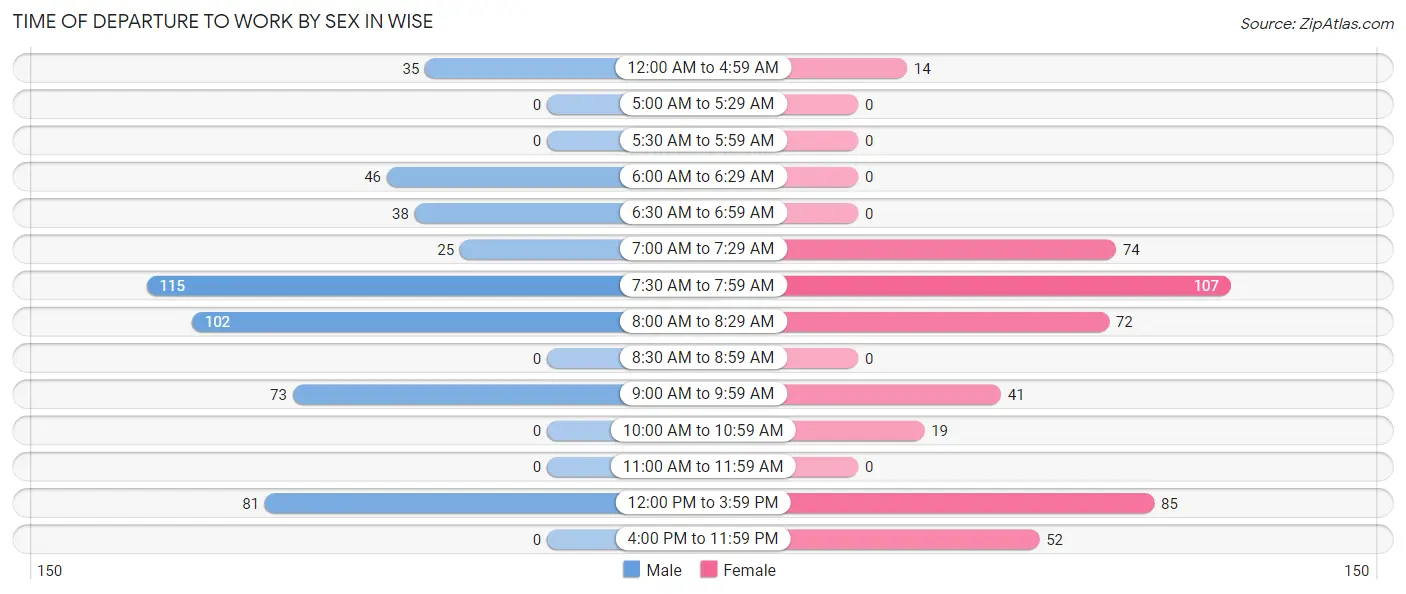
| Time of Departure | Male | Female |
| 12:00 AM to 4:59 AM | 35 (6.8%) | 14 (3.0%) |
| 5:00 AM to 5:29 AM | 0 (0.0%) | 0 (0.0%) |
| 5:30 AM to 5:59 AM | 0 (0.0%) | 0 (0.0%) |
| 6:00 AM to 6:29 AM | 46 (8.9%) | 0 (0.0%) |
| 6:30 AM to 6:59 AM | 38 (7.4%) | 0 (0.0%) |
| 7:00 AM to 7:29 AM | 25 (4.9%) | 74 (16.0%) |
| 7:30 AM to 7:59 AM | 115 (22.3%) | 107 (23.1%) |
| 8:00 AM to 8:29 AM | 102 (19.8%) | 72 (15.5%) |
| 8:30 AM to 8:59 AM | 0 (0.0%) | 0 (0.0%) |
| 9:00 AM to 9:59 AM | 73 (14.2%) | 41 (8.8%) |
| 10:00 AM to 10:59 AM | 0 (0.0%) | 19 (4.1%) |
| 11:00 AM to 11:59 AM | 0 (0.0%) | 0 (0.0%) |
| 12:00 PM to 3:59 PM | 81 (15.7%) | 85 (18.3%) |
| 4:00 PM to 11:59 PM | 0 (0.0%) | 52 (11.2%) |
| Total | 515 (100.0%) | 464 (100.0%) |
Housing Occupancy in Wise
Occupancy by Ownership in Wise
Of the total 1,397 dwellings in Wise, owner-occupied units account for 807 (57.8%), while renter-occupied units make up 590 (42.2%).
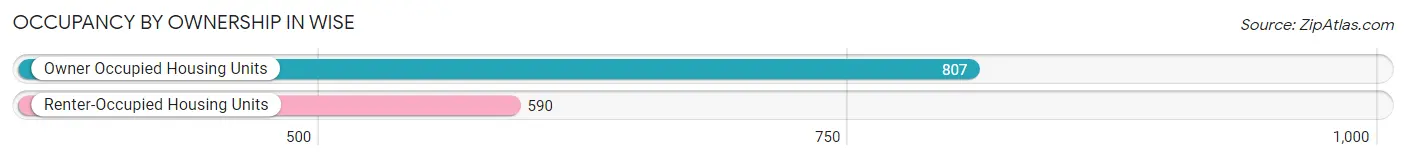
| Occupancy | # Housing Units | % Housing Units |
| Owner Occupied Housing Units | 807 | 57.8% |
| Renter-Occupied Housing Units | 590 | 42.2% |
| Total Occupied Housing Units | 1,397 | 100.0% |
Occupancy by Household Size in Wise
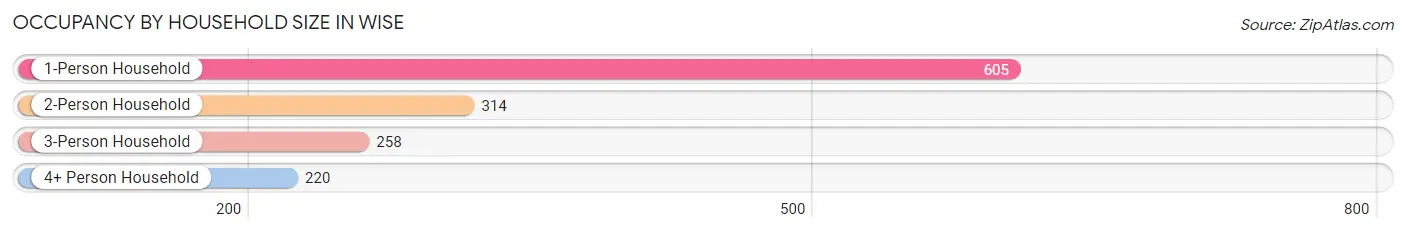
| Household Size | # Housing Units | % Housing Units |
| 1-Person Household | 605 | 43.3% |
| 2-Person Household | 314 | 22.5% |
| 3-Person Household | 258 | 18.5% |
| 4+ Person Household | 220 | 15.8% |
| Total Housing Units | 1,397 | 100.0% |
Occupancy by Ownership by Household Size in Wise
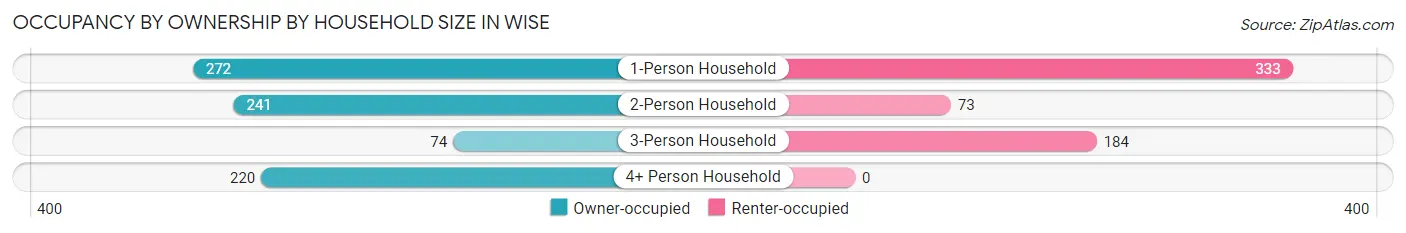
| Household Size | Owner-occupied | Renter-occupied |
| 1-Person Household | 272 (45.0%) | 333 (55.0%) |
| 2-Person Household | 241 (76.7%) | 73 (23.3%) |
| 3-Person Household | 74 (28.7%) | 184 (71.3%) |
| 4+ Person Household | 220 (100.0%) | 0 (0.0%) |
| Total Housing Units | 807 (57.8%) | 590 (42.2%) |
Occupancy by Educational Attainment in Wise
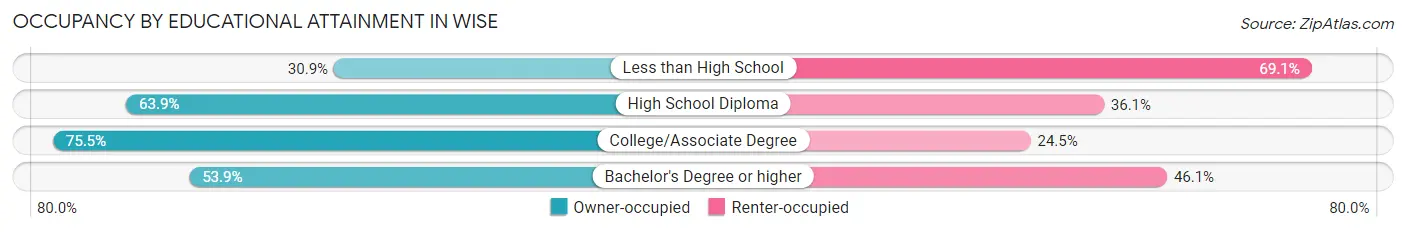
| Household Size | Owner-occupied | Renter-occupied |
| Less than High School | 86 (30.9%) | 192 (69.1%) |
| High School Diploma | 207 (63.9%) | 117 (36.1%) |
| College/Associate Degree | 299 (75.5%) | 97 (24.5%) |
| Bachelor's Degree or higher | 215 (53.9%) | 184 (46.1%) |
Occupancy by Age of Householder in Wise
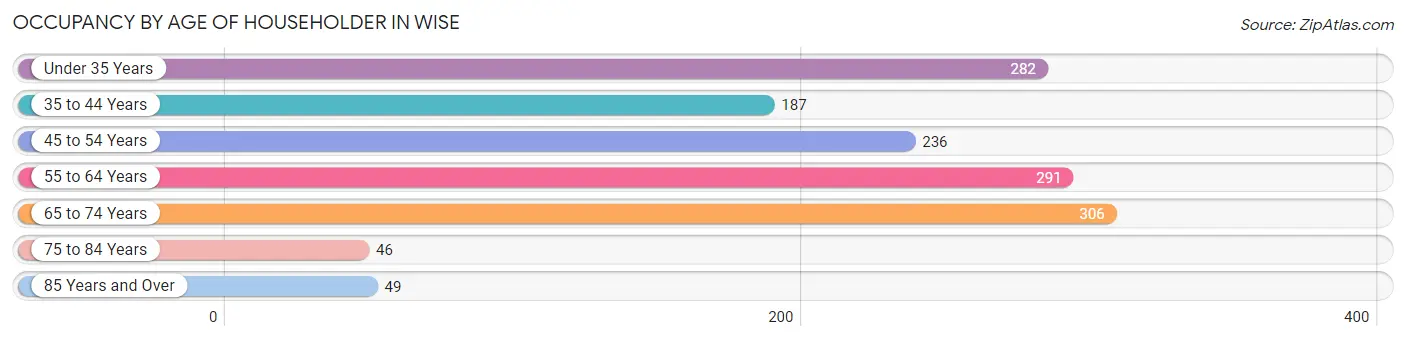
| Age Bracket | # Households | % Households |
| Under 35 Years | 282 | 20.2% |
| 35 to 44 Years | 187 | 13.4% |
| 45 to 54 Years | 236 | 16.9% |
| 55 to 64 Years | 291 | 20.8% |
| 65 to 74 Years | 306 | 21.9% |
| 75 to 84 Years | 46 | 3.3% |
| 85 Years and Over | 49 | 3.5% |
| Total | 1,397 | 100.0% |
Housing Finances in Wise
Median Income by Occupancy in Wise
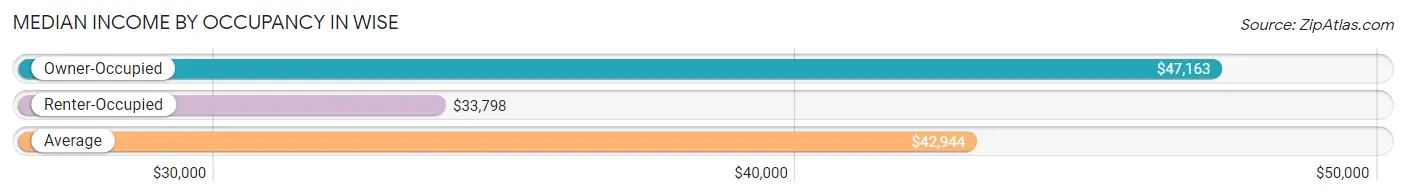
| Occupancy Type | # Households | Median Income |
| Owner-Occupied | 807 (57.8%) | $47,163 |
| Renter-Occupied | 590 (42.2%) | $33,798 |
| Average | 1,397 (100.0%) | $42,944 |
Occupancy by Householder Income Bracket in Wise
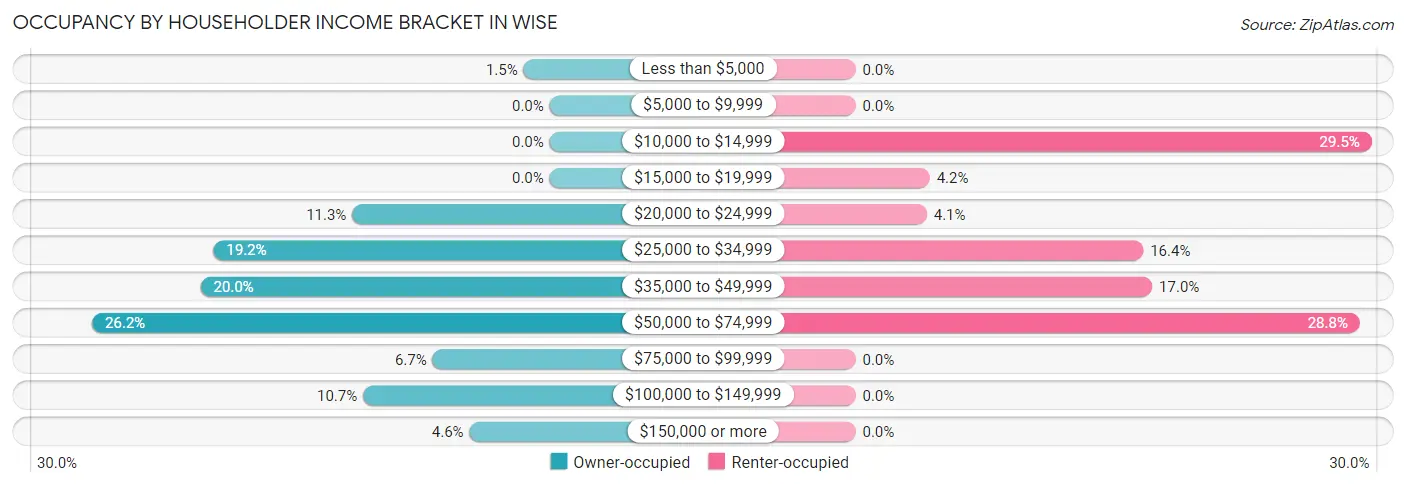
| Income Bracket | Owner-occupied | Renter-occupied |
| Less than $5,000 | 12 (1.5%) | 0 (0.0%) |
| $5,000 to $9,999 | 0 (0.0%) | 0 (0.0%) |
| $10,000 to $14,999 | 0 (0.0%) | 174 (29.5%) |
| $15,000 to $19,999 | 0 (0.0%) | 25 (4.2%) |
| $20,000 to $24,999 | 91 (11.3%) | 24 (4.1%) |
| $25,000 to $34,999 | 155 (19.2%) | 97 (16.4%) |
| $35,000 to $49,999 | 161 (20.0%) | 100 (17.0%) |
| $50,000 to $74,999 | 211 (26.2%) | 170 (28.8%) |
| $75,000 to $99,999 | 54 (6.7%) | 0 (0.0%) |
| $100,000 to $149,999 | 86 (10.7%) | 0 (0.0%) |
| $150,000 or more | 37 (4.6%) | 0 (0.0%) |
| Total | 807 (100.0%) | 590 (100.0%) |
Monthly Housing Cost Tiers in Wise
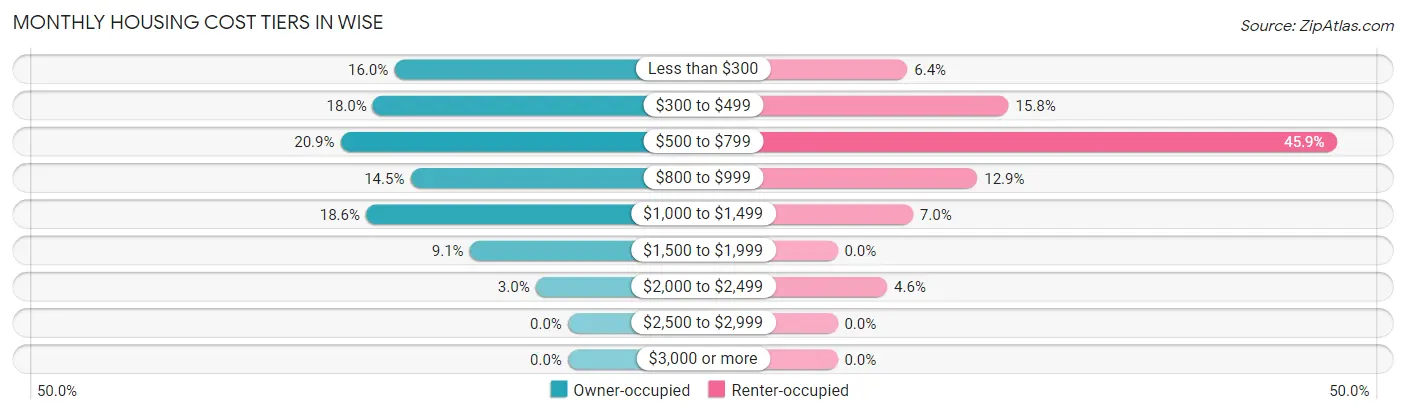
| Monthly Cost | Owner-occupied | Renter-occupied |
| Less than $300 | 129 (16.0%) | 38 (6.4%) |
| $300 to $499 | 145 (18.0%) | 93 (15.8%) |
| $500 to $799 | 169 (20.9%) | 271 (45.9%) |
| $800 to $999 | 117 (14.5%) | 76 (12.9%) |
| $1,000 to $1,499 | 150 (18.6%) | 41 (7.0%) |
| $1,500 to $1,999 | 73 (9.0%) | 0 (0.0%) |
| $2,000 to $2,499 | 24 (3.0%) | 27 (4.6%) |
| $2,500 to $2,999 | 0 (0.0%) | 0 (0.0%) |
| $3,000 or more | 0 (0.0%) | 0 (0.0%) |
| Total | 807 (100.0%) | 590 (100.0%) |
Physical Housing Characteristics in Wise
Housing Structures in Wise
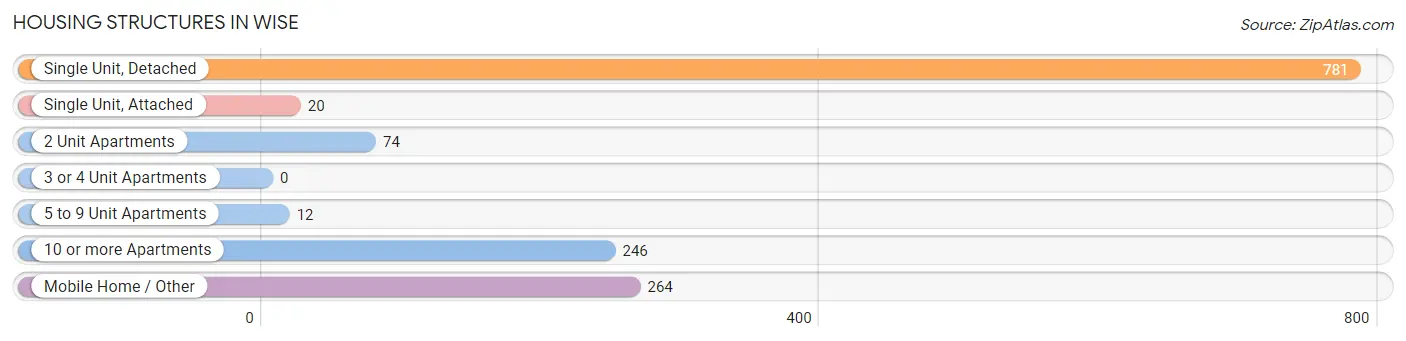
| Structure Type | # Housing Units | % Housing Units |
| Single Unit, Detached | 781 | 55.9% |
| Single Unit, Attached | 20 | 1.4% |
| 2 Unit Apartments | 74 | 5.3% |
| 3 or 4 Unit Apartments | 0 | 0.0% |
| 5 to 9 Unit Apartments | 12 | 0.9% |
| 10 or more Apartments | 246 | 17.6% |
| Mobile Home / Other | 264 | 18.9% |
| Total | 1,397 | 100.0% |
Housing Structures by Occupancy in Wise
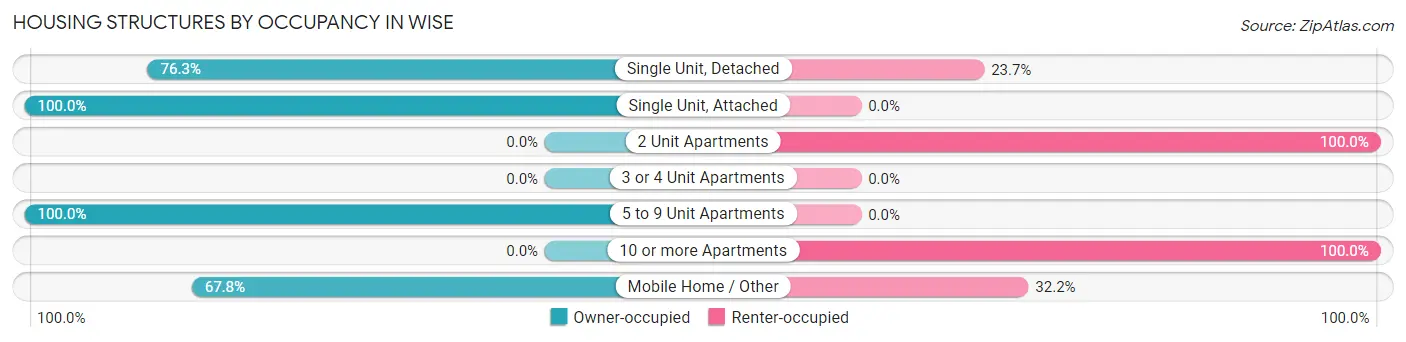
| Structure Type | Owner-occupied | Renter-occupied |
| Single Unit, Detached | 596 (76.3%) | 185 (23.7%) |
| Single Unit, Attached | 20 (100.0%) | 0 (0.0%) |
| 2 Unit Apartments | 0 (0.0%) | 74 (100.0%) |
| 3 or 4 Unit Apartments | 0 (0.0%) | 0 (0.0%) |
| 5 to 9 Unit Apartments | 12 (100.0%) | 0 (0.0%) |
| 10 or more Apartments | 0 (0.0%) | 246 (100.0%) |
| Mobile Home / Other | 179 (67.8%) | 85 (32.2%) |
| Total | 807 (57.8%) | 590 (42.2%) |
Housing Structures by Number of Rooms in Wise
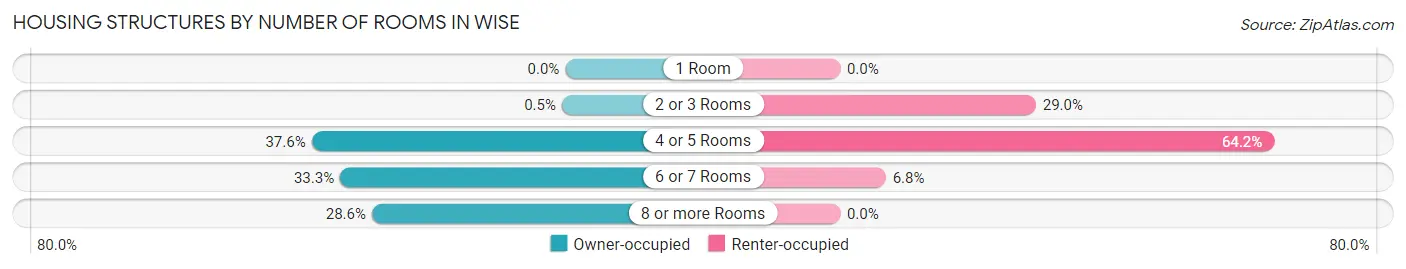
| Number of Rooms | Owner-occupied | Renter-occupied |
| 1 Room | 0 (0.0%) | 0 (0.0%) |
| 2 or 3 Rooms | 4 (0.5%) | 171 (29.0%) |
| 4 or 5 Rooms | 303 (37.6%) | 379 (64.2%) |
| 6 or 7 Rooms | 269 (33.3%) | 40 (6.8%) |
| 8 or more Rooms | 231 (28.6%) | 0 (0.0%) |
| Total | 807 (100.0%) | 590 (100.0%) |
Housing Structure by Heating Type in Wise
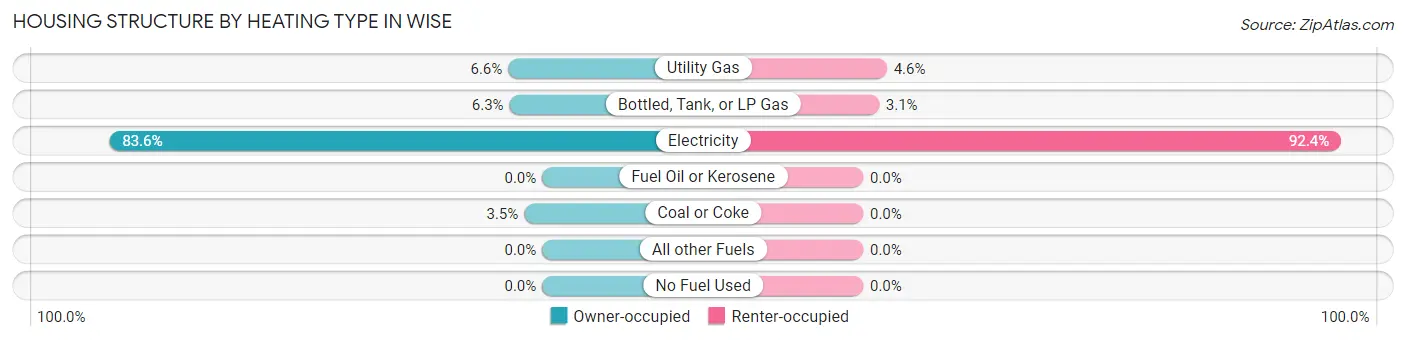
| Heating Type | Owner-occupied | Renter-occupied |
| Utility Gas | 53 (6.6%) | 27 (4.6%) |
| Bottled, Tank, or LP Gas | 51 (6.3%) | 18 (3.0%) |
| Electricity | 675 (83.6%) | 545 (92.4%) |
| Fuel Oil or Kerosene | 0 (0.0%) | 0 (0.0%) |
| Coal or Coke | 28 (3.5%) | 0 (0.0%) |
| All other Fuels | 0 (0.0%) | 0 (0.0%) |
| No Fuel Used | 0 (0.0%) | 0 (0.0%) |
| Total | 807 (100.0%) | 590 (100.0%) |
Household Vehicle Usage in Wise
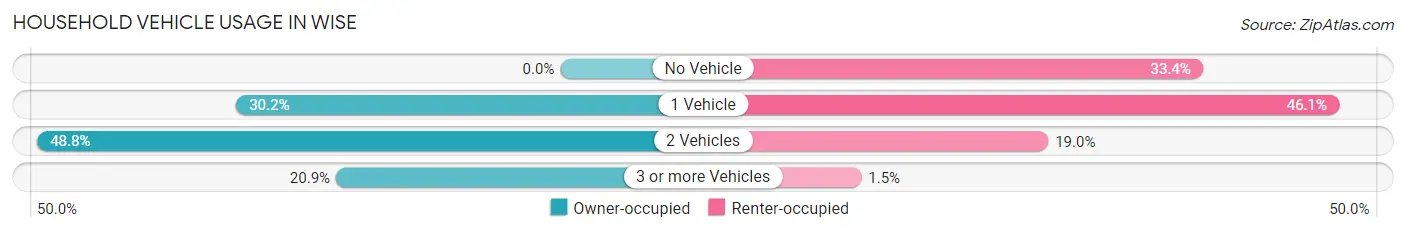
| Vehicles per Household | Owner-occupied | Renter-occupied |
| No Vehicle | 0 (0.0%) | 197 (33.4%) |
| 1 Vehicle | 244 (30.2%) | 272 (46.1%) |
| 2 Vehicles | 394 (48.8%) | 112 (19.0%) |
| 3 or more Vehicles | 169 (20.9%) | 9 (1.5%) |
| Total | 807 (100.0%) | 590 (100.0%) |
Real Estate & Mortgages in Wise
Real Estate and Mortgage Overview in Wise
| Characteristic | Without Mortgage | With Mortgage |
| Housing Units | 470 | 337 |
| Median Property Value | $110,600 | $120,100 |
| Median Household Income | $42,446 | $12 |
| Monthly Housing Costs | $474 | $0 |
| Real Estate Taxes | - | - |
Property Value by Mortgage Status in Wise
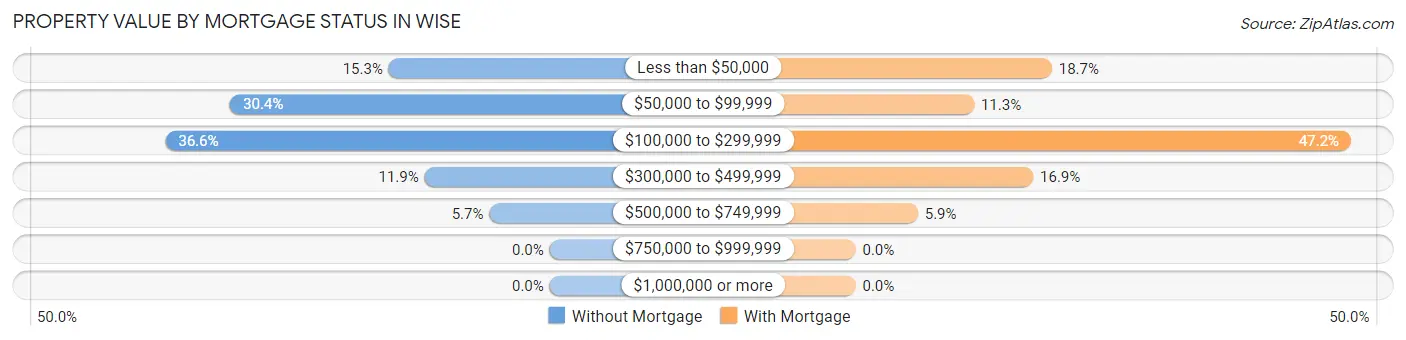
| Property Value | Without Mortgage | With Mortgage |
| Less than $50,000 | 72 (15.3%) | 63 (18.7%) |
| $50,000 to $99,999 | 143 (30.4%) | 38 (11.3%) |
| $100,000 to $299,999 | 172 (36.6%) | 159 (47.2%) |
| $300,000 to $499,999 | 56 (11.9%) | 57 (16.9%) |
| $500,000 to $749,999 | 27 (5.7%) | 20 (5.9%) |
| $750,000 to $999,999 | 0 (0.0%) | 0 (0.0%) |
| $1,000,000 or more | 0 (0.0%) | 0 (0.0%) |
| Total | 470 (100.0%) | 337 (100.0%) |
Household Income by Mortgage Status in Wise
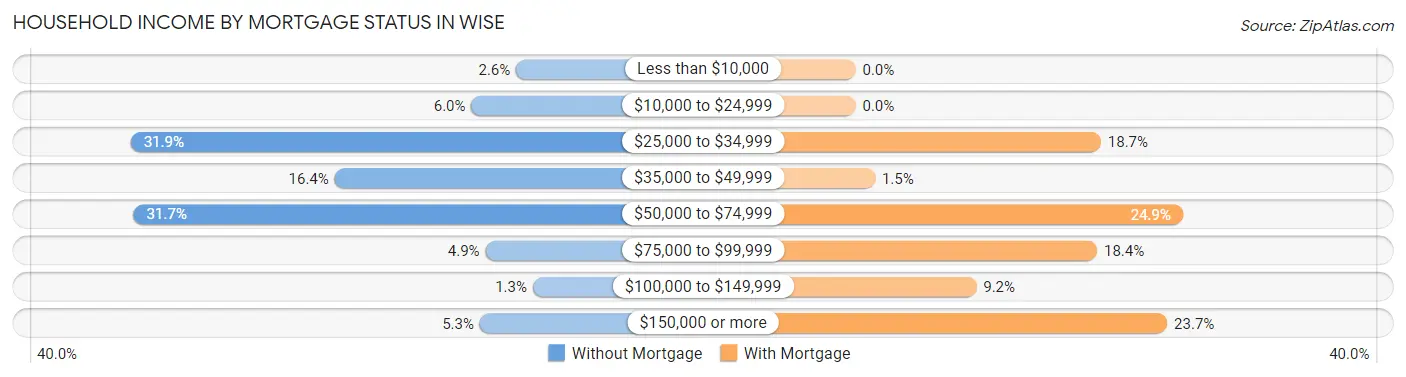
| Household Income | Without Mortgage | With Mortgage |
| Less than $10,000 | 12 (2.5%) | 0 (0.0%) |
| $10,000 to $24,999 | 28 (6.0%) | 0 (0.0%) |
| $25,000 to $34,999 | 150 (31.9%) | 63 (18.7%) |
| $35,000 to $49,999 | 77 (16.4%) | 5 (1.5%) |
| $50,000 to $74,999 | 149 (31.7%) | 84 (24.9%) |
| $75,000 to $99,999 | 23 (4.9%) | 62 (18.4%) |
| $100,000 to $149,999 | 6 (1.3%) | 31 (9.2%) |
| $150,000 or more | 25 (5.3%) | 80 (23.7%) |
| Total | 470 (100.0%) | 337 (100.0%) |
Property Value to Household Income Ratio in Wise
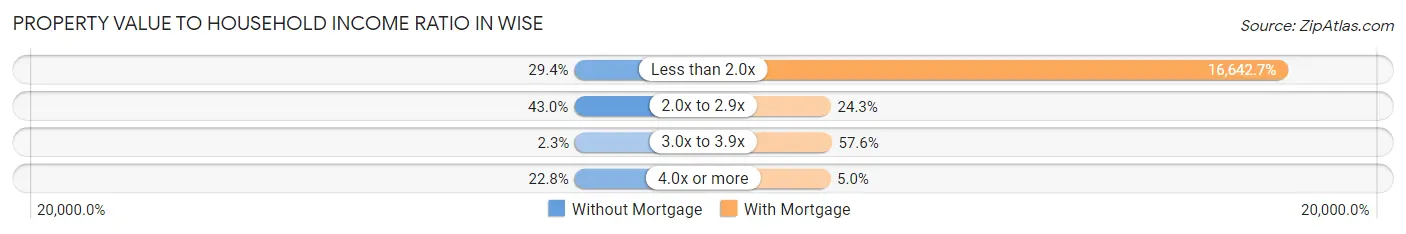
| Value-to-Income Ratio | Without Mortgage | With Mortgage |
| Less than 2.0x | 138 (29.4%) | 56,086 (16,642.7%) |
| 2.0x to 2.9x | 202 (43.0%) | 82 (24.3%) |
| 3.0x to 3.9x | 11 (2.3%) | 194 (57.6%) |
| 4.0x or more | 107 (22.8%) | 17 (5.0%) |
| Total | 470 (100.0%) | 337 (100.0%) |
Real Estate Taxes by Mortgage Status in Wise
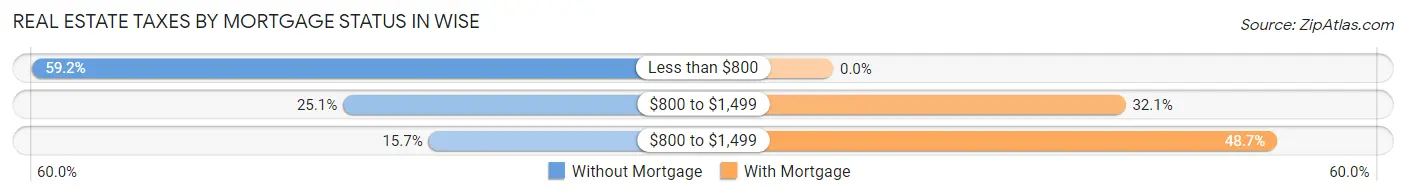
| Property Taxes | Without Mortgage | With Mortgage |
| Less than $800 | 278 (59.2%) | 0 (0.0%) |
| $800 to $1,499 | 118 (25.1%) | 108 (32.1%) |
| $800 to $1,499 | 74 (15.7%) | 164 (48.7%) |
| Total | 470 (100.0%) | 337 (100.0%) |
Health & Disability in Wise
Health Insurance Coverage by Age in Wise
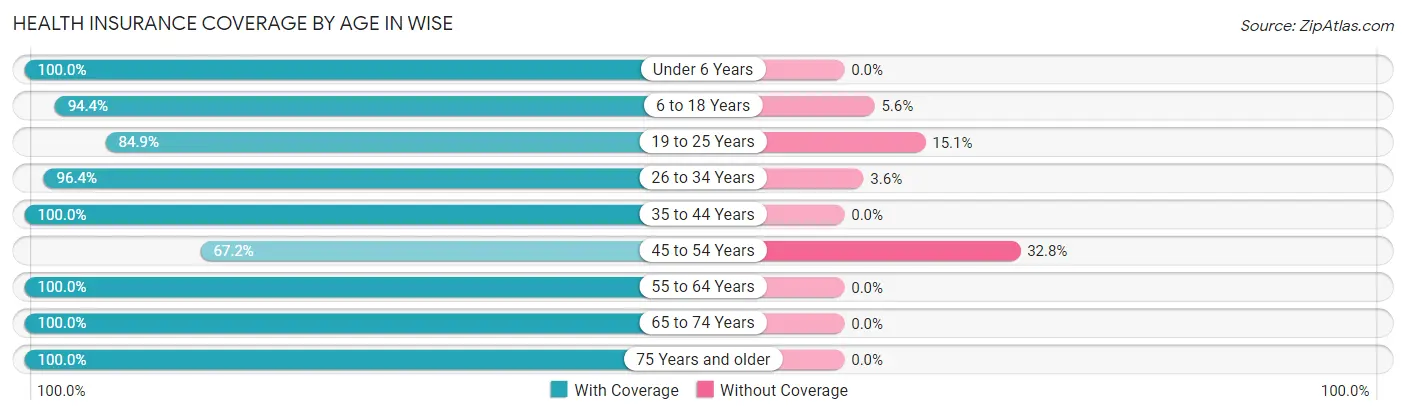
| Age Bracket | With Coverage | Without Coverage |
| Under 6 Years | 136 (100.0%) | 0 (0.0%) |
| 6 to 18 Years | 336 (94.4%) | 20 (5.6%) |
| 19 to 25 Years | 337 (84.9%) | 60 (15.1%) |
| 26 to 34 Years | 406 (96.4%) | 15 (3.6%) |
| 35 to 44 Years | 274 (100.0%) | 0 (0.0%) |
| 45 to 54 Years | 293 (67.2%) | 143 (32.8%) |
| 55 to 64 Years | 454 (100.0%) | 0 (0.0%) |
| 65 to 74 Years | 365 (100.0%) | 0 (0.0%) |
| 75 Years and older | 123 (100.0%) | 0 (0.0%) |
| Total | 2,724 (92.0%) | 238 (8.0%) |
Health Insurance Coverage by Citizenship Status in Wise
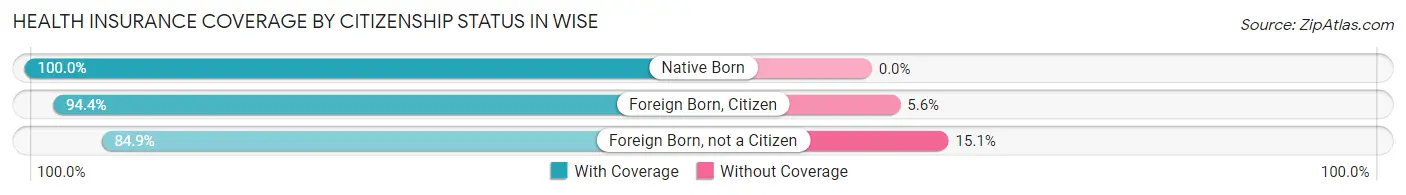
| Citizenship Status | With Coverage | Without Coverage |
| Native Born | 136 (100.0%) | 0 (0.0%) |
| Foreign Born, Citizen | 336 (94.4%) | 20 (5.6%) |
| Foreign Born, not a Citizen | 337 (84.9%) | 60 (15.1%) |
Health Insurance Coverage by Household Income in Wise
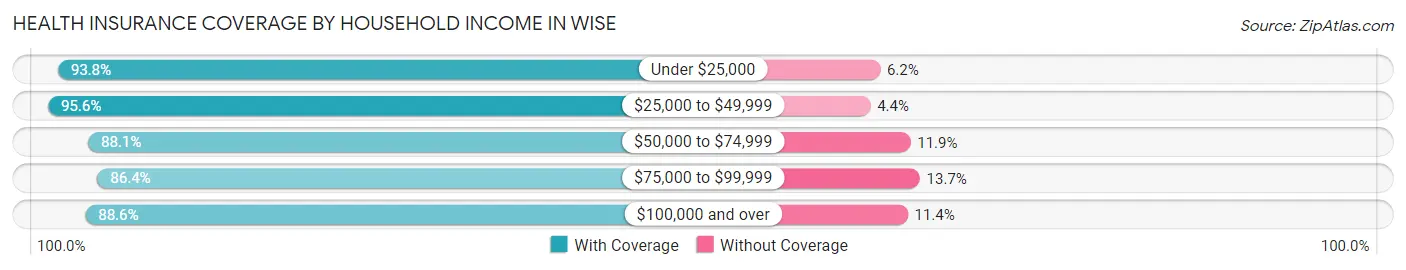
| Household Income | With Coverage | Without Coverage |
| Under $25,000 | 558 (93.8%) | 37 (6.2%) |
| $25,000 to $49,999 | 1,002 (95.6%) | 46 (4.4%) |
| $50,000 to $74,999 | 556 (88.1%) | 75 (11.9%) |
| $75,000 to $99,999 | 234 (86.4%) | 37 (13.7%) |
| $100,000 and over | 335 (88.6%) | 43 (11.4%) |
Public vs Private Health Insurance Coverage by Age in Wise
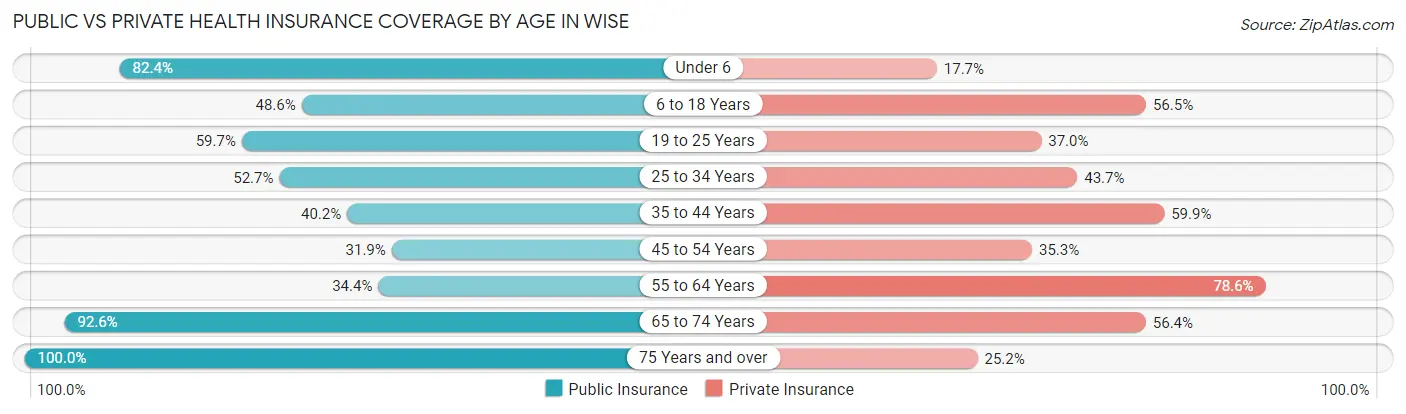
| Age Bracket | Public Insurance | Private Insurance |
| Under 6 | 112 (82.4%) | 24 (17.6%) |
| 6 to 18 Years | 173 (48.6%) | 201 (56.5%) |
| 19 to 25 Years | 237 (59.7%) | 147 (37.0%) |
| 25 to 34 Years | 222 (52.7%) | 184 (43.7%) |
| 35 to 44 Years | 110 (40.2%) | 164 (59.9%) |
| 45 to 54 Years | 139 (31.9%) | 154 (35.3%) |
| 55 to 64 Years | 156 (34.4%) | 357 (78.6%) |
| 65 to 74 Years | 338 (92.6%) | 206 (56.4%) |
| 75 Years and over | 123 (100.0%) | 31 (25.2%) |
| Total | 1,610 (54.4%) | 1,468 (49.6%) |
Disability Status by Sex by Age in Wise
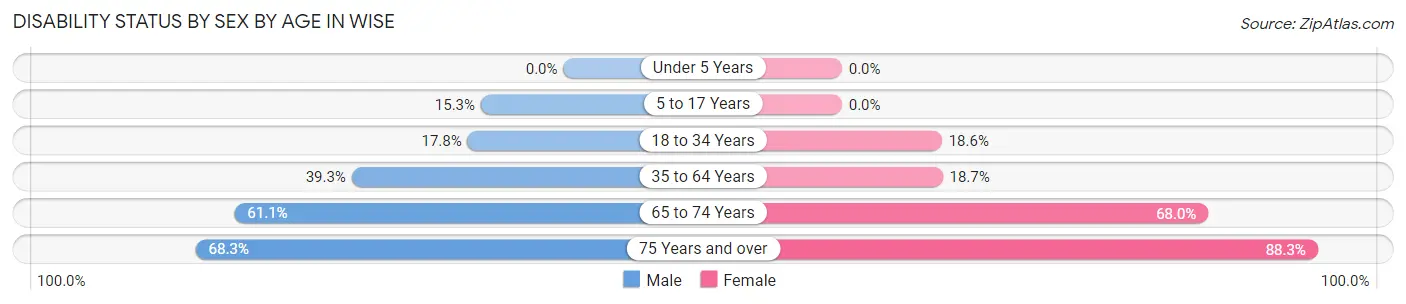
| Age Bracket | Male | Female |
| Under 5 Years | 0 (0.0%) | 0 (0.0%) |
| 5 to 17 Years | 30 (15.3%) | 0 (0.0%) |
| 18 to 34 Years | 80 (17.8%) | 69 (18.5%) |
| 35 to 64 Years | 222 (39.3%) | 112 (18.7%) |
| 65 to 74 Years | 116 (61.1%) | 119 (68.0%) |
| 75 Years and over | 43 (68.2%) | 53 (88.3%) |
Disability Class by Sex by Age in Wise
Disability Class: Hearing Difficulty
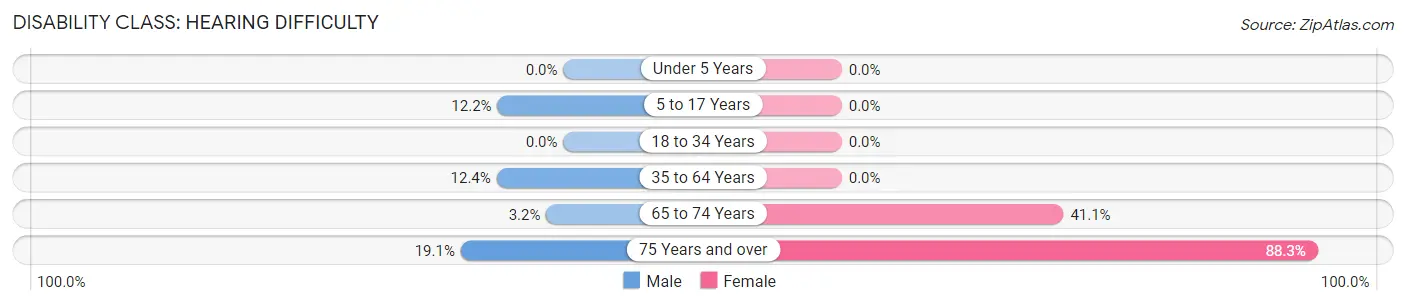
| Age Bracket | Male | Female |
| Under 5 Years | 0 (0.0%) | 0 (0.0%) |
| 5 to 17 Years | 24 (12.2%) | 0 (0.0%) |
| 18 to 34 Years | 0 (0.0%) | 0 (0.0%) |
| 35 to 64 Years | 70 (12.4%) | 0 (0.0%) |
| 65 to 74 Years | 6 (3.2%) | 72 (41.1%) |
| 75 Years and over | 12 (19.1%) | 53 (88.3%) |
Disability Class: Vision Difficulty
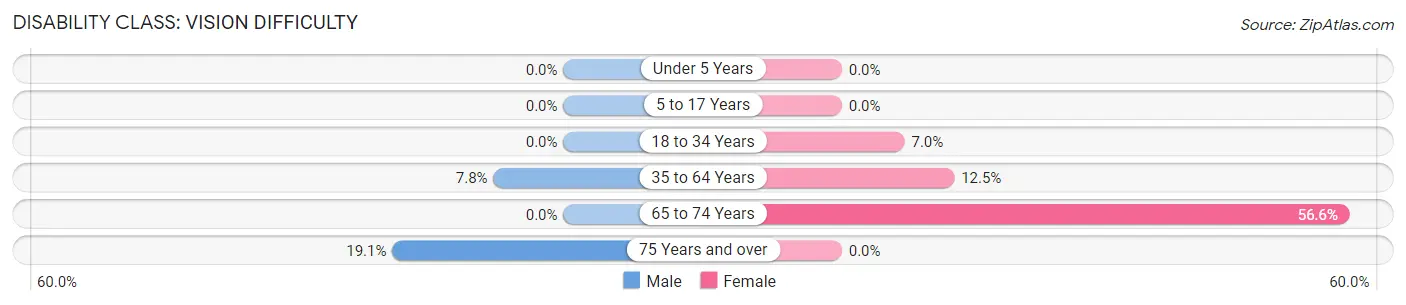
| Age Bracket | Male | Female |
| Under 5 Years | 0 (0.0%) | 0 (0.0%) |
| 5 to 17 Years | 0 (0.0%) | 0 (0.0%) |
| 18 to 34 Years | 0 (0.0%) | 26 (7.0%) |
| 35 to 64 Years | 44 (7.8%) | 75 (12.5%) |
| 65 to 74 Years | 0 (0.0%) | 99 (56.6%) |
| 75 Years and over | 12 (19.1%) | 0 (0.0%) |
Disability Class: Cognitive Difficulty
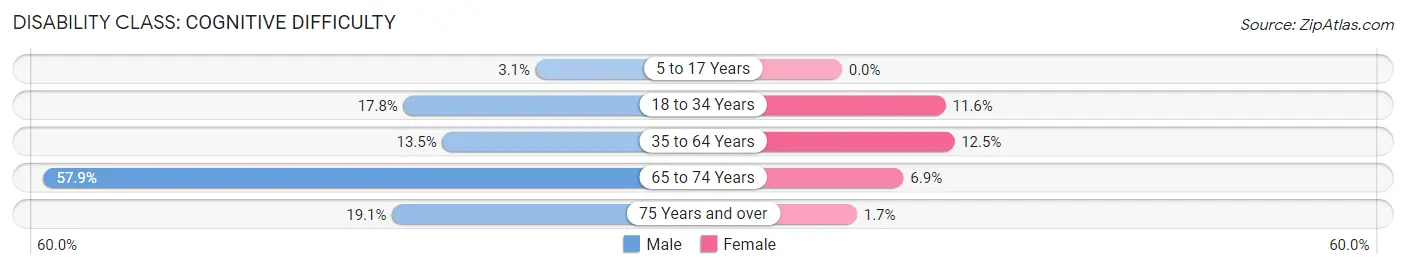
| Age Bracket | Male | Female |
| 5 to 17 Years | 6 (3.1%) | 0 (0.0%) |
| 18 to 34 Years | 80 (17.8%) | 43 (11.6%) |
| 35 to 64 Years | 76 (13.5%) | 75 (12.5%) |
| 65 to 74 Years | 110 (57.9%) | 12 (6.9%) |
| 75 Years and over | 12 (19.1%) | 1 (1.7%) |
Disability Class: Ambulatory Difficulty
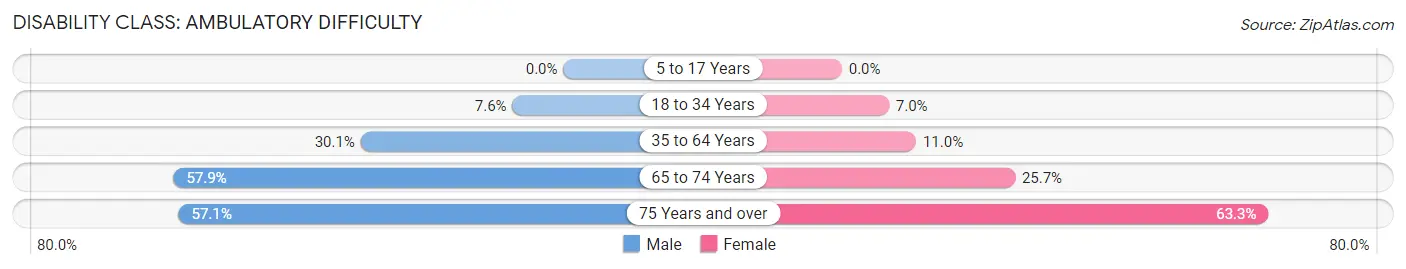
| Age Bracket | Male | Female |
| 5 to 17 Years | 0 (0.0%) | 0 (0.0%) |
| 18 to 34 Years | 34 (7.6%) | 26 (7.0%) |
| 35 to 64 Years | 170 (30.1%) | 66 (11.0%) |
| 65 to 74 Years | 110 (57.9%) | 45 (25.7%) |
| 75 Years and over | 36 (57.1%) | 38 (63.3%) |
Disability Class: Self-Care Difficulty
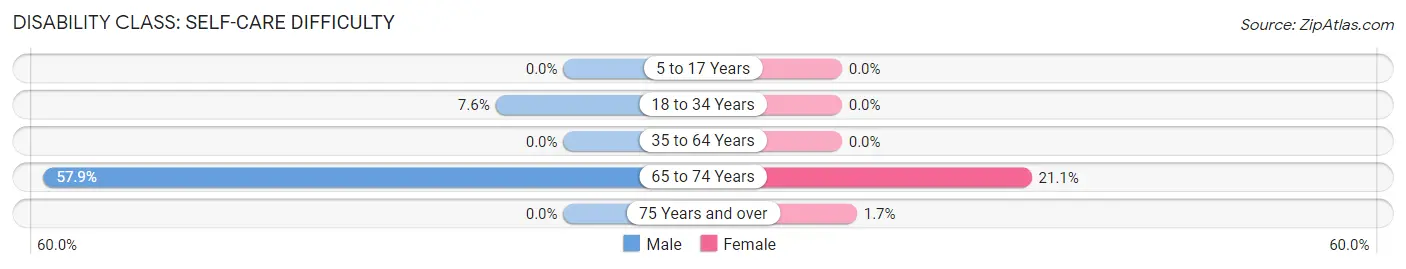
| Age Bracket | Male | Female |
| 5 to 17 Years | 0 (0.0%) | 0 (0.0%) |
| 18 to 34 Years | 34 (7.6%) | 0 (0.0%) |
| 35 to 64 Years | 0 (0.0%) | 0 (0.0%) |
| 65 to 74 Years | 110 (57.9%) | 37 (21.1%) |
| 75 Years and over | 0 (0.0%) | 1 (1.7%) |
Technology Access in Wise
Computing Device Access in Wise
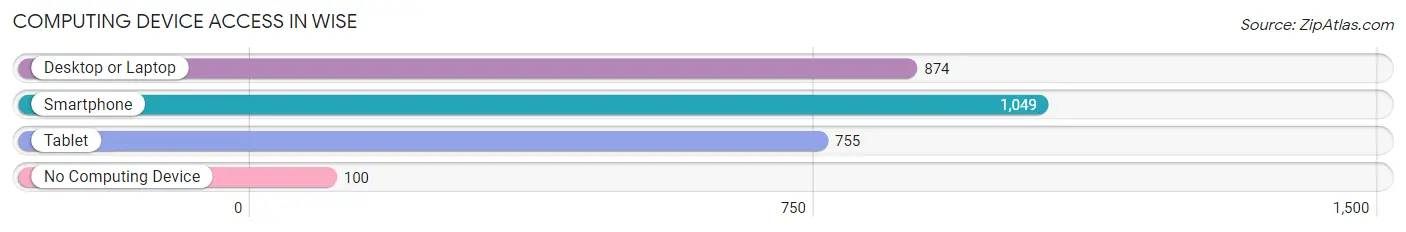
| Device Type | # Households | % Households |
| Desktop or Laptop | 874 | 62.6% |
| Smartphone | 1,049 | 75.1% |
| Tablet | 755 | 54.0% |
| No Computing Device | 100 | 7.2% |
| Total | 1,397 | 100.0% |
Internet Access in Wise
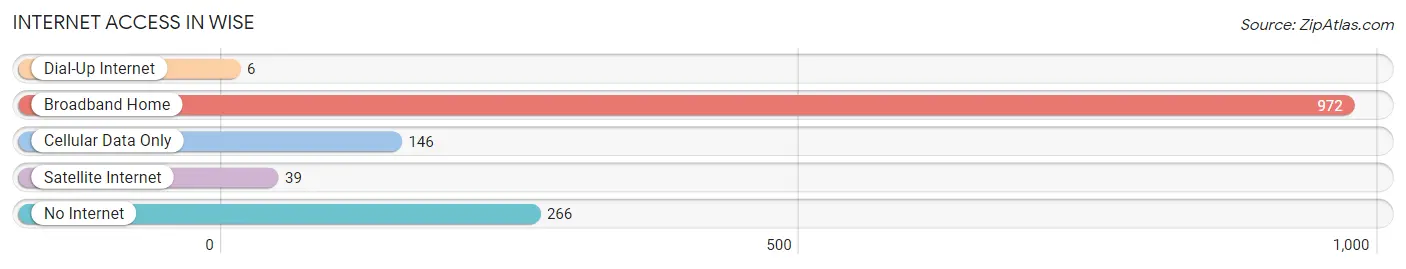
| Internet Type | # Households | % Households |
| Dial-Up Internet | 6 | 0.4% |
| Broadband Home | 972 | 69.6% |
| Cellular Data Only | 146 | 10.4% |
| Satellite Internet | 39 | 2.8% |
| No Internet | 266 | 19.0% |
| Total | 1,397 | 100.0% |
Wise Summary
Virginia is a state located in the Mid-Atlantic region of the United States. It is bordered by Maryland to the northeast, the Atlantic Ocean to the east, North Carolina and Tennessee to the south, and West Virginia to the southwest and Kentucky to the west. Virginia is the 12th most populous state in the United States, with an estimated population of 8.5 million in 2019. It is the 35th largest state in terms of land area, with an area of 42,774 square miles.
History
Virginia was one of the original 13 colonies that formed the United States. It was the first permanent English settlement in the Americas, established in 1607 at Jamestown. Virginia was the home of the first president of the United States, George Washington, and the site of the first capital of the United States, Richmond.
Virginia was one of the original states to ratify the United States Constitution in 1788. It was also the site of the first battle of the American Revolution, the Battle of Great Bridge, in 1775. During the Civil War, Virginia was a Confederate state and the site of several major battles, including the Battle of Bull Run and the Battle of Appomattox Court House.
Geography
Virginia is located in the Mid-Atlantic region of the United States. It is bordered by Maryland to the northeast, the Atlantic Ocean to the east, North Carolina and Tennessee to the south, and West Virginia to the southwest and Kentucky to the west.
Virginia is divided into 95 counties and 38 independent cities. The state is divided into five distinct geographic regions: the Tidewater region, the Piedmont region, the Blue Ridge Mountains, the Valley and Ridge region, and the Appalachian Plateau.
The Tidewater region is located in the southeastern part of the state and is home to the Chesapeake Bay and the Atlantic Ocean. The Piedmont region is located in the central part of the state and is characterized by rolling hills and valleys. The Blue Ridge Mountains are located in the western part of the state and are home to the Shenandoah National Park. The Valley and Ridge region is located in the southwestern part of the state and is characterized by its steep valleys and ridges. The Appalachian Plateau is located in the eastern part of the state and is home to the Great Smoky Mountains National Park.
Economy
Virginia has a diverse economy that is driven by agriculture, manufacturing, technology, and tourism. Agriculture is the largest sector of the state’s economy, accounting for about 10% of the state’s total economic output. The state’s major agricultural products include poultry, dairy, beef, soybeans, corn, and hay.
Manufacturing is the second largest sector of the state’s economy, accounting for about 8% of the state’s total economic output. The state’s major manufacturing industries include food processing, chemicals, electronics, and textiles.
Technology is the third largest sector of the state’s economy, accounting for about 6% of the state’s total economic output. The state’s major technology industries include software development, telecommunications, and biotechnology.
Tourism is the fourth largest sector of the state’s economy, accounting for about 5% of the state’s total economic output. The state’s major tourist attractions include the Blue Ridge Parkway, the Shenandoah National Park, and the Historic Triangle of Jamestown, Williamsburg, and Yorktown.
Demographics
As of 2019, Virginia had an estimated population of 8.5 million. The state’s population is racially and ethnically diverse. The largest racial group is White (71.5%), followed by Black or African American (19.7%), Hispanic or Latino (7.2%), Asian (4.2%), and Native American (0.7%).
The state’s largest religious group is Christian (77.2%), followed by non-religious (14.2%), Jewish (1.2%), Muslim (0.7%), and Buddhist (0.4%). The state’s largest language group is English (90.2%), followed by Spanish (4.2%), Chinese (1.2%), and Vietnamese (0.7%).
Common Questions
What is Per Capita Income in Wise?
Per Capita income in Wise is $26,451.
What is the Median Family Income in Wise?
Median Family Income in Wise is $45,686.
What is the Median Household income in Wise?
Median Household Income in Wise is $42,944.
What is Income or Wage Gap in Wise?
Income or Wage Gap in Wise is 41.7%.
Women in Wise earn 58.3 cents for every dollar earned by a man.
What is Inequality or Gini Index in Wise?
Inequality or Gini Index in Wise is 0.40.
What is the Total Population of Wise?
Total Population of Wise is 2,962.
What is the Total Male Population of Wise?
Total Male Population of Wise is 1,576.
What is the Total Female Population of Wise?
Total Female Population of Wise is 1,386.
What is the Ratio of Males per 100 Females in Wise?
There are 113.71 Males per 100 Females in Wise.
What is the Ratio of Females per 100 Males in Wise?
There are 87.94 Females per 100 Males in Wise.
What is the Median Population Age in Wise?
Median Population Age in Wise is 41.4 Years.
What is the Average Family Size in Wise
Average Family Size in Wise is 2.8 People.
What is the Average Household Size in Wise
Average Household Size in Wise is 2.1 People.
How Large is the Labor Force in Wise?
There are 1,276 People in the Labor Forcein in Wise.
What is the Percentage of People in the Labor Force in Wise?
50.5% of People are in the Labor Force in Wise.
What is the Unemployment Rate in Wise?
Unemployment Rate in Wise is 4.2%.