Aquia Harbour, VA Map & Demographics
Aquia Harbour Map
Aquia Harbour Overview
$50,303
PER CAPITA INCOME
$143,125
AVG FAMILY INCOME
$127,813
AVG HOUSEHOLD INCOME
57.8%
WAGE / INCOME GAP [ % ]
42.2¢/ $1
WAGE / INCOME GAP [ $ ]
0.32
INEQUALITY / GINI INDEX
6,947
TOTAL POPULATION
3,470
MALE POPULATION
3,477
FEMALE POPULATION
99.80
MALES / 100 FEMALES
100.20
FEMALES / 100 MALES
37.6
MEDIAN AGE
3.5
AVG FAMILY SIZE
3.1
AVG HOUSEHOLD SIZE
3,467
LABOR FORCE [ PEOPLE ]
65.1%
PERCENT IN LABOR FORCE
3.6%
UNEMPLOYMENT RATE
Income in Aquia Harbour
Income Overview in Aquia Harbour
Per Capita Income in Aquia Harbour is $50,303, while median incomes of families and households are $143,125 and $127,813 respectively.
| Characteristic | Number | Measure |
| Per Capita Income | 6,947 | $50,303 |
| Median Family Income | 1,809 | $143,125 |
| Mean Family Income | 1,809 | $160,052 |
| Median Household Income | 2,246 | $127,813 |
| Mean Household Income | 2,246 | $152,178 |
| Income Deficit | 1,809 | $0 |
| Wage / Income Gap (%) | 6,947 | 57.84% |
| Wage / Income Gap ($) | 6,947 | 42.16¢ per $1 |
| Gini / Inequality Index | 6,947 | 0.32 |
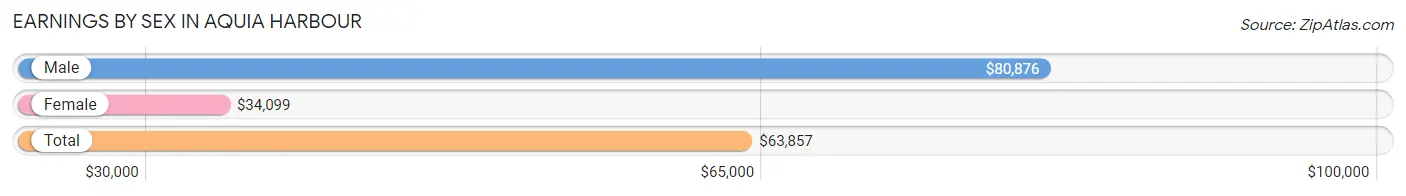
Earnings by Sex in Aquia Harbour
Average Earnings in Aquia Harbour are $63,857, $80,876 for men and $34,099 for women, a difference of 57.8%.
| Sex | Number | Average Earnings |
| Male | 1,845 (52.0%) | $80,876 |
| Female | 1,706 (48.0%) | $34,099 |
| Total | 3,551 (100.0%) | $63,857 |
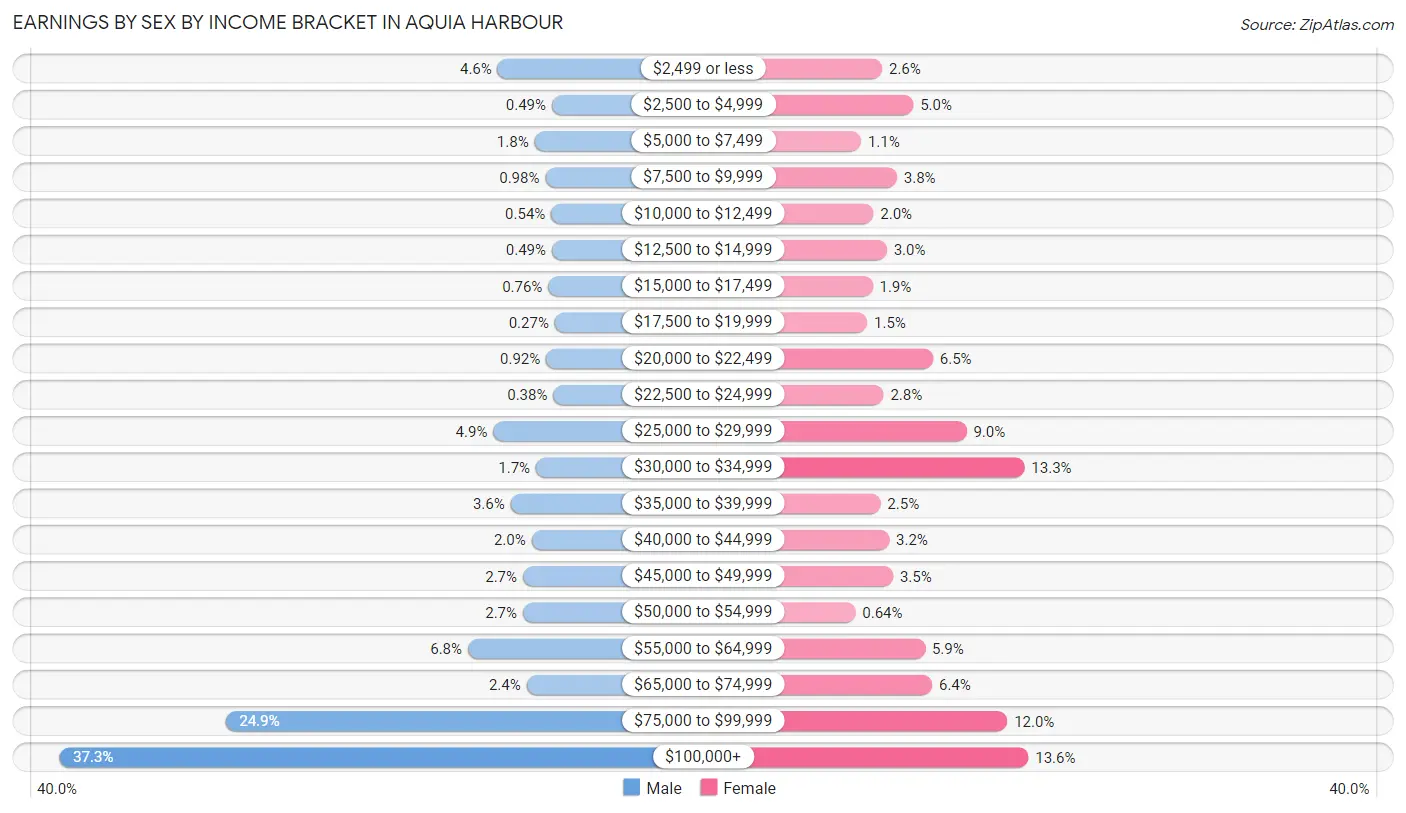
Earnings by Sex by Income Bracket in Aquia Harbour
The most common earnings brackets in Aquia Harbour are $100,000+ for men (689 | 37.3%) and $100,000+ for women (232 | 13.6%).
| Income | Male | Female |
| $2,499 or less | 84 (4.5%) | 45 (2.6%) |
| $2,500 to $4,999 | 9 (0.5%) | 85 (5.0%) |
| $5,000 to $7,499 | 33 (1.8%) | 18 (1.1%) |
| $7,500 to $9,999 | 18 (1.0%) | 64 (3.7%) |
| $10,000 to $12,499 | 10 (0.5%) | 34 (2.0%) |
| $12,500 to $14,999 | 9 (0.5%) | 51 (3.0%) |
| $15,000 to $17,499 | 14 (0.8%) | 33 (1.9%) |
| $17,500 to $19,999 | 5 (0.3%) | 26 (1.5%) |
| $20,000 to $22,499 | 17 (0.9%) | 110 (6.5%) |
| $22,500 to $24,999 | 7 (0.4%) | 47 (2.8%) |
| $25,000 to $29,999 | 90 (4.9%) | 153 (9.0%) |
| $30,000 to $34,999 | 31 (1.7%) | 227 (13.3%) |
| $35,000 to $39,999 | 66 (3.6%) | 43 (2.5%) |
| $40,000 to $44,999 | 37 (2.0%) | 54 (3.2%) |
| $45,000 to $49,999 | 49 (2.7%) | 59 (3.5%) |
| $50,000 to $54,999 | 49 (2.7%) | 11 (0.6%) |
| $55,000 to $64,999 | 125 (6.8%) | 100 (5.9%) |
| $65,000 to $74,999 | 44 (2.4%) | 109 (6.4%) |
| $75,000 to $99,999 | 459 (24.9%) | 205 (12.0%) |
| $100,000+ | 689 (37.3%) | 232 (13.6%) |
| Total | 1,845 (100.0%) | 1,706 (100.0%) |
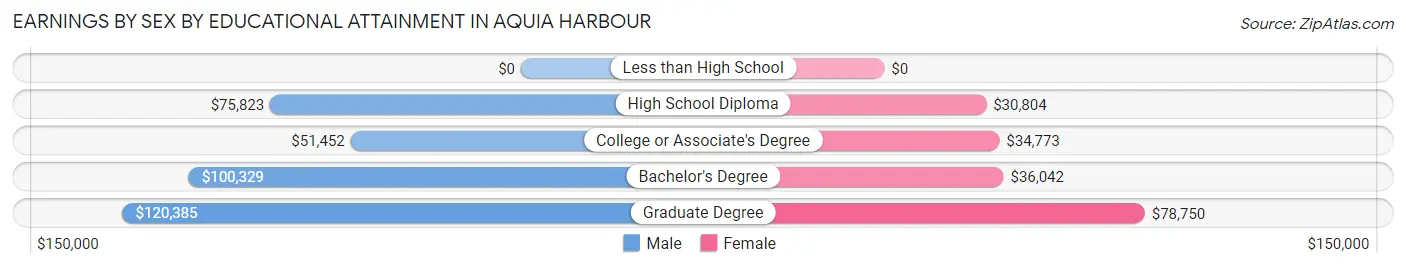
Earnings by Sex by Educational Attainment in Aquia Harbour
Average earnings in Aquia Harbour are $82,264 for men and $40,391 for women, a difference of 50.9%. Men with an educational attainment of graduate degree enjoy the highest average annual earnings of $120,385, while those with college or associate's degree education earn the least with $51,452. Women with an educational attainment of graduate degree earn the most with the average annual earnings of $78,750, while those with high school diploma education have the smallest earnings of $30,804.
| Educational Attainment | Male Income | Female Income |
| Less than High School | - | - |
| High School Diploma | $75,823 | $30,804 |
| College or Associate's Degree | $51,452 | $34,773 |
| Bachelor's Degree | $100,329 | $36,042 |
| Graduate Degree | $120,385 | $78,750 |
| Total | $82,264 | $40,391 |
Family Income in Aquia Harbour
Family Income Brackets in Aquia Harbour
According to the Aquia Harbour family income data, there are 592 families falling into the $200,000+ income range, which is the most common income bracket and makes up 32.7% of all families.
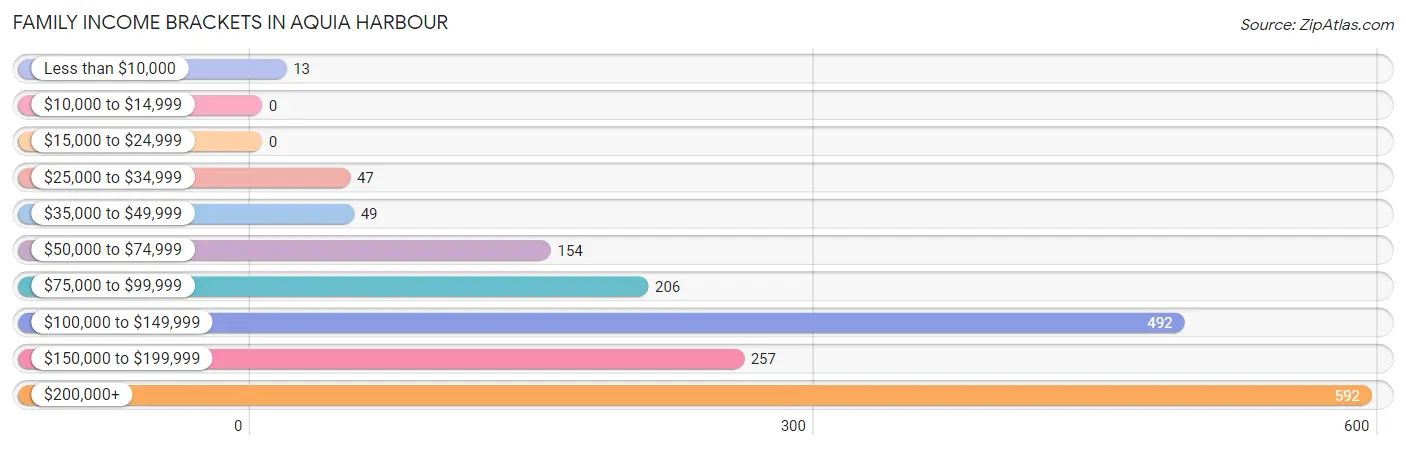
| Income Bracket | # Families | % Families |
| Less than $10,000 | 13 | 0.7% |
| $10,000 to $14,999 | 0 | 0.0% |
| $15,000 to $24,999 | 0 | 0.0% |
| $25,000 to $34,999 | 47 | 2.6% |
| $35,000 to $49,999 | 49 | 2.7% |
| $50,000 to $74,999 | 154 | 8.5% |
| $75,000 to $99,999 | 206 | 11.4% |
| $100,000 to $149,999 | 492 | 27.2% |
| $150,000 to $199,999 | 257 | 14.2% |
| $200,000+ | 592 | 32.7% |
Family Income by Famaliy Size in Aquia Harbour
4-person families (495 | 27.4%) account for the highest median family income in Aquia Harbour with $192,344 per family, while 2-person families (554 | 30.6%) have the highest median income of $73,984 per family member.
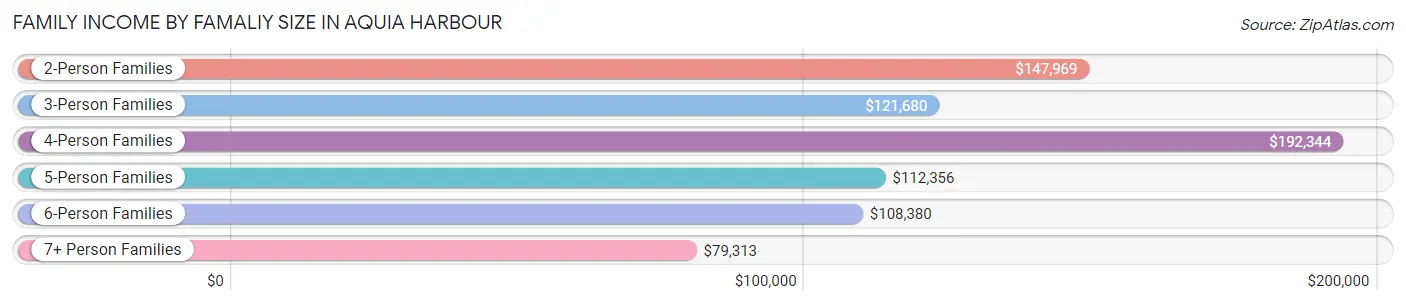
| Income Bracket | # Families | Median Income |
| 2-Person Families | 554 (30.6%) | $147,969 |
| 3-Person Families | 533 (29.5%) | $121,680 |
| 4-Person Families | 495 (27.4%) | $192,344 |
| 5-Person Families | 75 (4.2%) | $112,356 |
| 6-Person Families | 85 (4.7%) | $108,380 |
| 7+ Person Families | 67 (3.7%) | $79,313 |
| Total | 1,809 (100.0%) | $143,125 |
Family Income by Number of Earners in Aquia Harbour
The median family income in Aquia Harbour is $143,125, with families comprising 3+ earners (248) having the highest median family income of $216,196, while families with no earners (202) have the lowest median family income of $102,188, accounting for 13.7% and 11.2% of families, respectively.
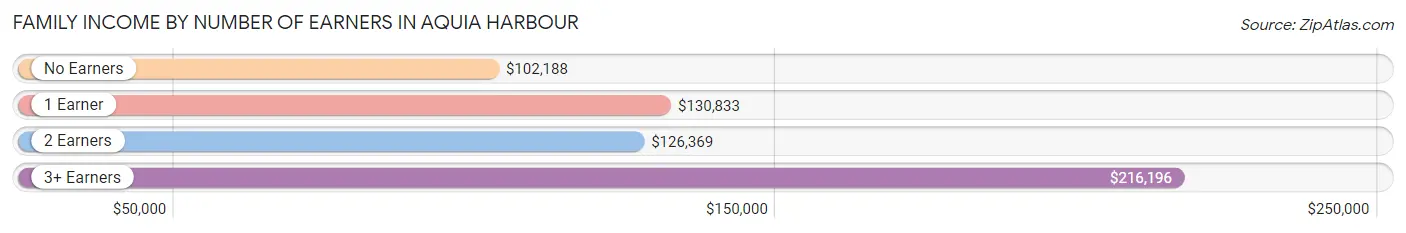
| Number of Earners | # Families | Median Income |
| No Earners | 202 (11.2%) | $102,188 |
| 1 Earner | 466 (25.8%) | $130,833 |
| 2 Earners | 893 (49.4%) | $126,369 |
| 3+ Earners | 248 (13.7%) | $216,196 |
| Total | 1,809 (100.0%) | $143,125 |
Household Income in Aquia Harbour
Household Income Brackets in Aquia Harbour
With 660 households falling in the category, the $100,000 to $149,999 income range is the most frequent in Aquia Harbour, accounting for 29.4% of all households.
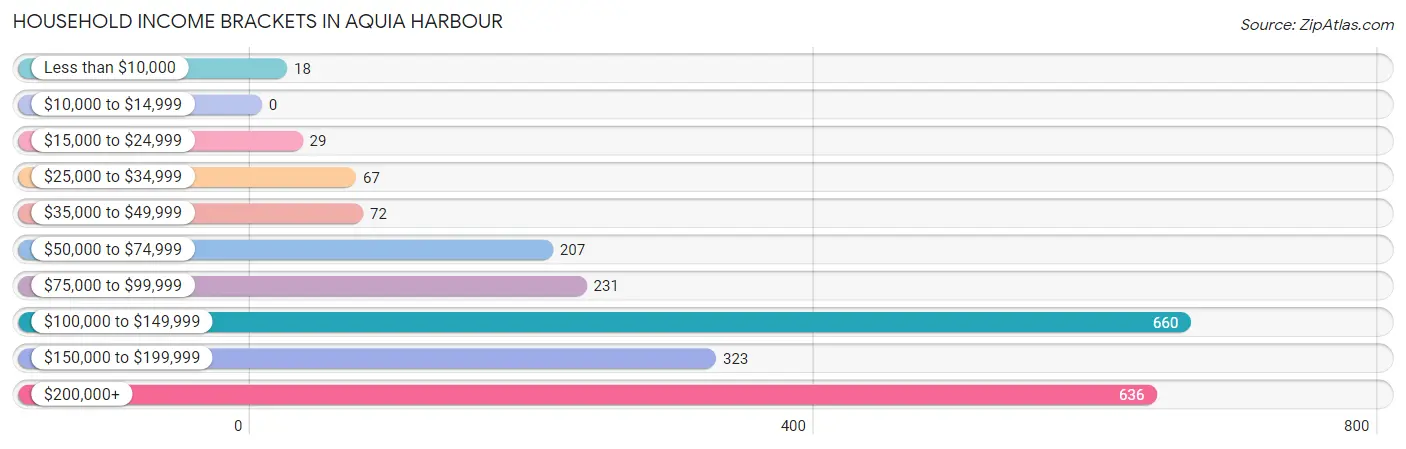
| Income Bracket | # Households | % Households |
| Less than $10,000 | 18 | 0.8% |
| $10,000 to $14,999 | 0 | 0.0% |
| $15,000 to $24,999 | 29 | 1.3% |
| $25,000 to $34,999 | 67 | 3.0% |
| $35,000 to $49,999 | 72 | 3.2% |
| $50,000 to $74,999 | 207 | 9.2% |
| $75,000 to $99,999 | 231 | 10.3% |
| $100,000 to $149,999 | 660 | 29.4% |
| $150,000 to $199,999 | 323 | 14.4% |
| $200,000+ | 636 | 28.3% |
Household Income by Householder Age in Aquia Harbour
The median household income in Aquia Harbour is $127,813, with the highest median household income of $165,260 found in the 45 to 64 years age bracket for the primary householder. A total of 995 households (44.3%) fall into this category. Meanwhile, the 15 to 24 years age bracket for the primary householder has the lowest median household income of $0, with 16 households (0.7%) in this group.
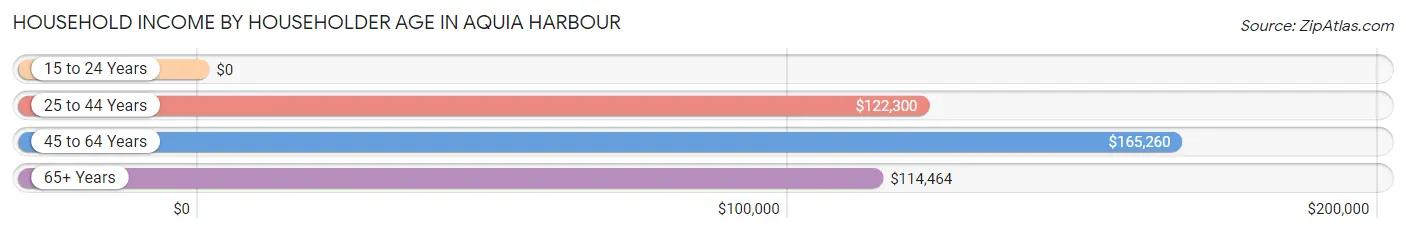
| Income Bracket | # Households | Median Income |
| 15 to 24 Years | 16 (0.7%) | $0 |
| 25 to 44 Years | 772 (34.4%) | $122,300 |
| 45 to 64 Years | 995 (44.3%) | $165,260 |
| 65+ Years | 463 (20.6%) | $114,464 |
| Total | 2,246 (100.0%) | $127,813 |
Poverty in Aquia Harbour
Income Below Poverty by Sex and Age in Aquia Harbour
With 3.3% poverty level for males and 6.0% for females among the residents of Aquia Harbour, 15 year old males and 5 year old females are the most vulnerable to poverty, with 23 males (31.9%) and 17 females (28.3%) in their respective age groups living below the poverty level.
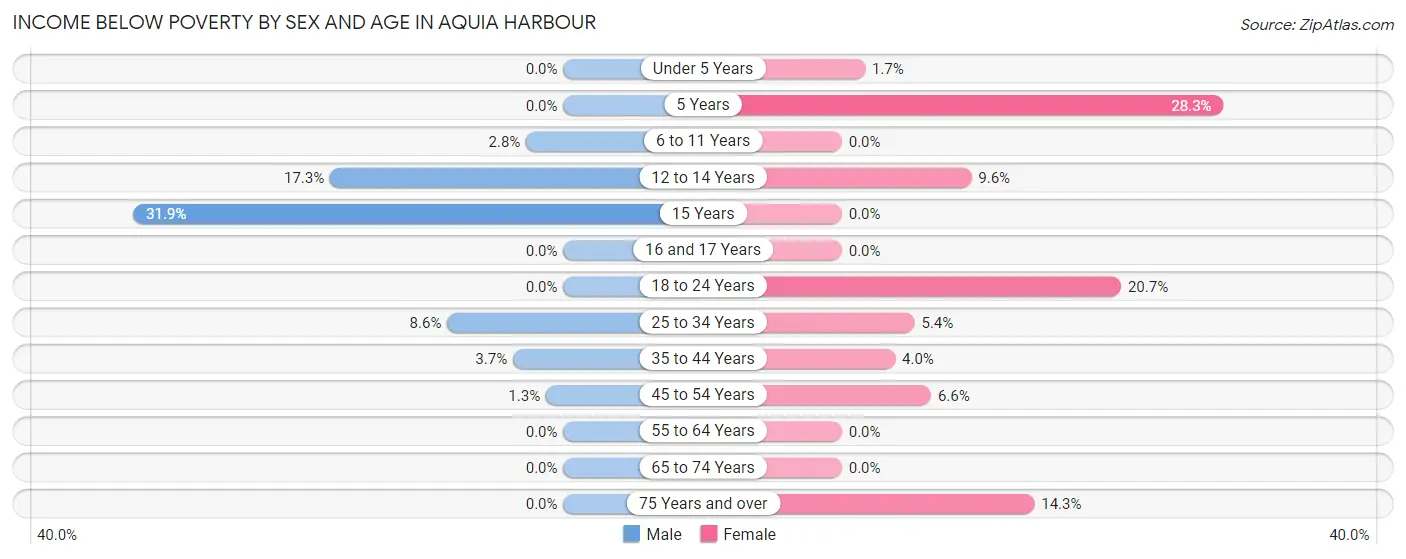
| Age Bracket | Male | Female |
| Under 5 Years | 0 (0.0%) | 5 (1.7%) |
| 5 Years | 0 (0.0%) | 17 (28.3%) |
| 6 to 11 Years | 11 (2.8%) | 0 (0.0%) |
| 12 to 14 Years | 22 (17.3%) | 15 (9.6%) |
| 15 Years | 23 (31.9%) | 0 (0.0%) |
| 16 and 17 Years | 0 (0.0%) | 0 (0.0%) |
| 18 to 24 Years | 0 (0.0%) | 85 (20.7%) |
| 25 to 34 Years | 25 (8.6%) | 19 (5.4%) |
| 35 to 44 Years | 26 (3.7%) | 31 (4.0%) |
| 45 to 54 Years | 7 (1.3%) | 19 (6.6%) |
| 55 to 64 Years | 0 (0.0%) | 0 (0.0%) |
| 65 to 74 Years | 0 (0.0%) | 0 (0.0%) |
| 75 Years and over | 0 (0.0%) | 19 (14.3%) |
| Total | 114 (3.3%) | 210 (6.0%) |
Income Above Poverty by Sex and Age in Aquia Harbour
According to the poverty statistics in Aquia Harbour, males aged under 5 years and females aged 6 to 11 years are the age groups that are most secure financially, with 100.0% of males and 100.0% of females in these age groups living above the poverty line.
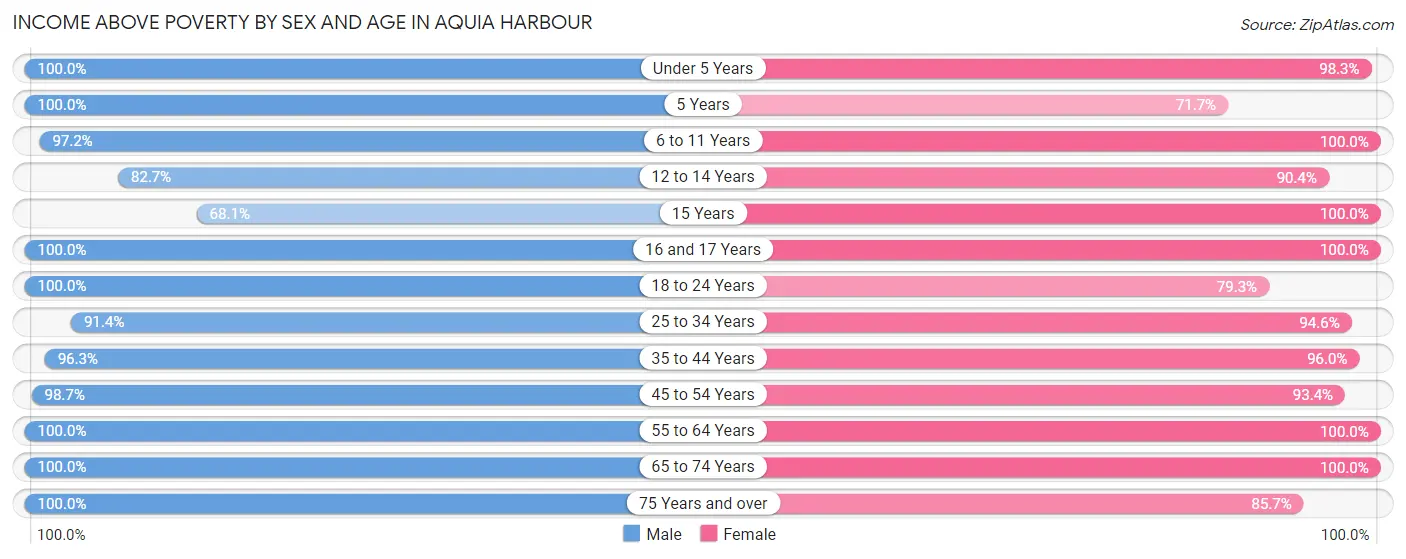
| Age Bracket | Male | Female |
| Under 5 Years | 300 (100.0%) | 286 (98.3%) |
| 5 Years | 37 (100.0%) | 43 (71.7%) |
| 6 to 11 Years | 388 (97.2%) | 152 (100.0%) |
| 12 to 14 Years | 105 (82.7%) | 141 (90.4%) |
| 15 Years | 49 (68.1%) | 28 (100.0%) |
| 16 and 17 Years | 170 (100.0%) | 75 (100.0%) |
| 18 to 24 Years | 151 (100.0%) | 325 (79.3%) |
| 25 to 34 Years | 265 (91.4%) | 333 (94.6%) |
| 35 to 44 Years | 669 (96.3%) | 752 (96.0%) |
| 45 to 54 Years | 536 (98.7%) | 268 (93.4%) |
| 55 to 64 Years | 327 (100.0%) | 440 (100.0%) |
| 65 to 74 Years | 289 (100.0%) | 310 (100.0%) |
| 75 Years and over | 70 (100.0%) | 114 (85.7%) |
| Total | 3,356 (96.7%) | 3,267 (94.0%) |
Income Below Poverty Among Married-Couple Families in Aquia Harbour
The poverty statistics for married-couple families in Aquia Harbour show that 1.9% or 29 of the total 1,508 families live below the poverty line. Families with 3 or 4 children have the highest poverty rate of 24.2%, comprising of 23 families. On the other hand, families with no children have the lowest poverty rate of 0.0%, which includes 0 families.
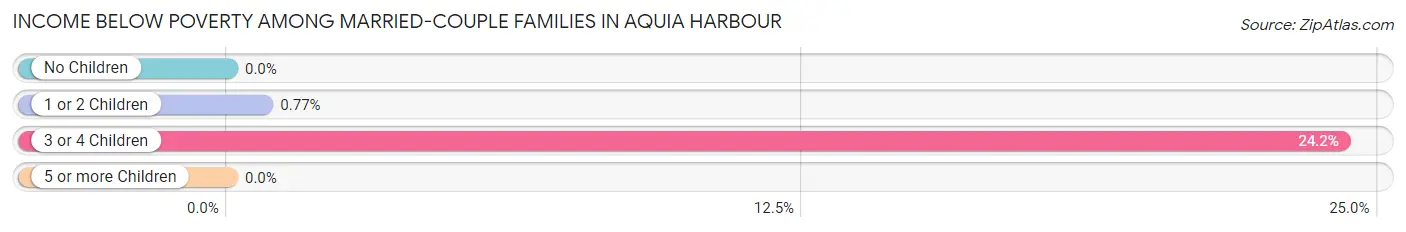
| Children | Above Poverty | Below Poverty |
| No Children | 610 (100.0%) | 0 (0.0%) |
| 1 or 2 Children | 771 (99.2%) | 6 (0.8%) |
| 3 or 4 Children | 72 (75.8%) | 23 (24.2%) |
| 5 or more Children | 26 (100.0%) | 0 (0.0%) |
| Total | 1,479 (98.1%) | 29 (1.9%) |
Income Below Poverty Among Single-Parent Households in Aquia Harbour
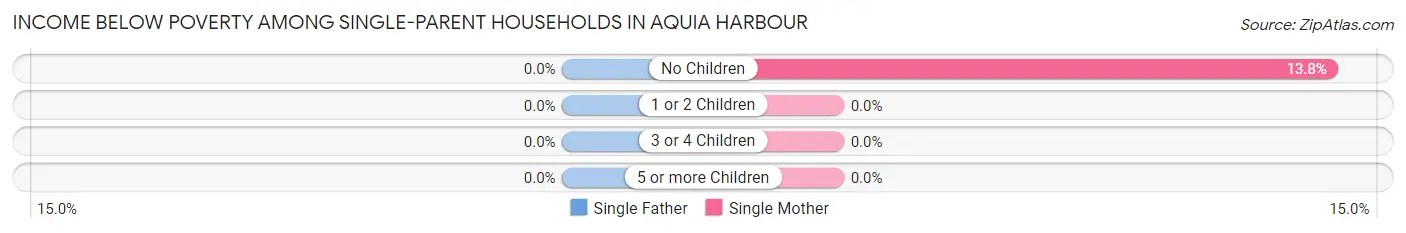
| Children | Single Father | Single Mother |
| No Children | 0 (0.0%) | 13 (13.8%) |
| 1 or 2 Children | 0 (0.0%) | 0 (0.0%) |
| 3 or 4 Children | 0 (0.0%) | 0 (0.0%) |
| 5 or more Children | 0 (0.0%) | 0 (0.0%) |
| Total | 0 (0.0%) | 13 (6.5%) |
Income Below Poverty Among Married-Couple vs Single-Parent Households in Aquia Harbour
The poverty data for Aquia Harbour shows that 29 of the married-couple family households (1.9%) and 13 of the single-parent households (4.3%) are living below the poverty level. Within the married-couple family households, those with 3 or 4 children have the highest poverty rate, with 23 households (24.2%) falling below the poverty line. Among the single-parent households, those with no children have the highest poverty rate, with 13 household (10.3%) living below poverty.
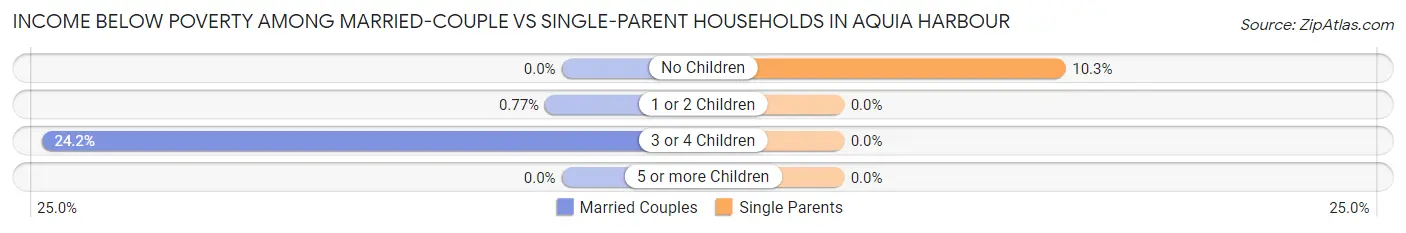
| Children | Married-Couple Families | Single-Parent Households |
| No Children | 0 (0.0%) | 13 (10.3%) |
| 1 or 2 Children | 6 (0.8%) | 0 (0.0%) |
| 3 or 4 Children | 23 (24.2%) | 0 (0.0%) |
| 5 or more Children | 0 (0.0%) | 0 (0.0%) |
| Total | 29 (1.9%) | 13 (4.3%) |
Race in Aquia Harbour
The most populous races in Aquia Harbour are White / Caucasian (4,576 | 65.9%), Hispanic or Latino (1,287 | 18.5%), and Black / African American (856 | 12.3%).
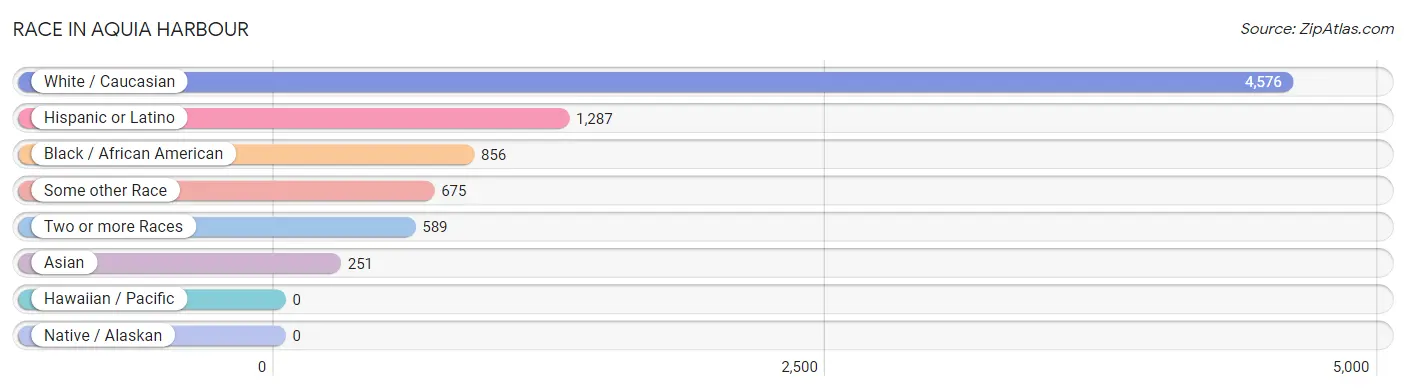
| Race | # Population | % Population |
| Asian | 251 | 3.6% |
| Black / African American | 856 | 12.3% |
| Hawaiian / Pacific | 0 | 0.0% |
| Hispanic or Latino | 1,287 | 18.5% |
| Native / Alaskan | 0 | 0.0% |
| White / Caucasian | 4,576 | 65.9% |
| Two or more Races | 589 | 8.5% |
| Some other Race | 675 | 9.7% |
| Total | 6,947 | 100.0% |
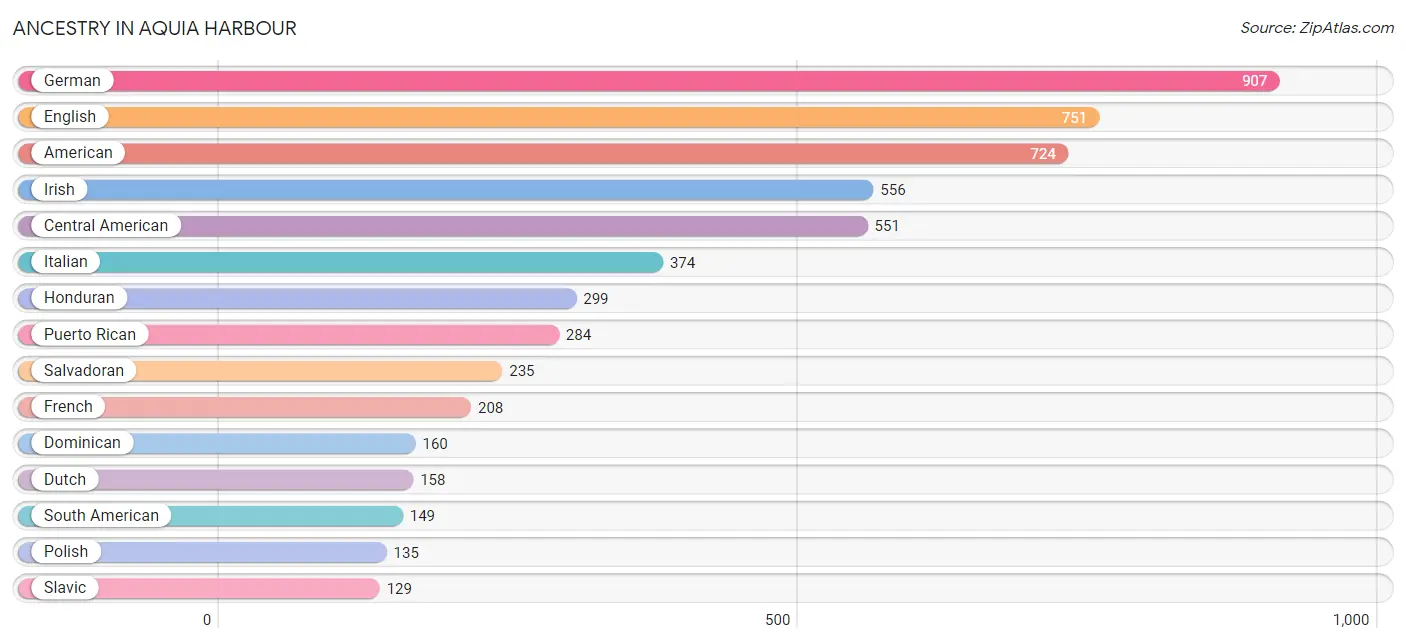
Ancestry in Aquia Harbour
The most populous ancestries reported in Aquia Harbour are German (907 | 13.1%), English (751 | 10.8%), American (724 | 10.4%), Irish (556 | 8.0%), and Central American (551 | 7.9%), together accounting for 50.2% of all Aquia Harbour residents.
| Ancestry | # Population | % Population |
| African | 7 | 0.1% |
| American | 724 | 10.4% |
| Apache | 7 | 0.1% |
| Arab | 38 | 0.5% |
| Argentinean | 13 | 0.2% |
| Australian | 9 | 0.1% |
| Belgian | 7 | 0.1% |
| Bhutanese | 34 | 0.5% |
| Bolivian | 19 | 0.3% |
| British | 17 | 0.2% |
| Burmese | 53 | 0.8% |
| Canadian | 7 | 0.1% |
| Central American | 551 | 7.9% |
| Cherokee | 20 | 0.3% |
| Colombian | 80 | 1.1% |
| Croatian | 9 | 0.1% |
| Cuban | 9 | 0.1% |
| Czech | 8 | 0.1% |
| Dominican | 160 | 2.3% |
| Dutch | 158 | 2.3% |
| Eastern European | 29 | 0.4% |
| Ecuadorian | 9 | 0.1% |
| English | 751 | 10.8% |
| Ethiopian | 10 | 0.1% |
| European | 110 | 1.6% |
| Finnish | 15 | 0.2% |
| French | 208 | 3.0% |
| French Canadian | 13 | 0.2% |
| German | 907 | 13.1% |
| German Russian | 22 | 0.3% |
| Honduran | 299 | 4.3% |
| Hungarian | 44 | 0.6% |
| Indian (Asian) | 59 | 0.9% |
| Irish | 556 | 8.0% |
| Italian | 374 | 5.4% |
| Jamaican | 8 | 0.1% |
| Korean | 74 | 1.1% |
| Lebanese | 7 | 0.1% |
| Lithuanian | 16 | 0.2% |
| Mexican | 33 | 0.5% |
| Navajo | 9 | 0.1% |
| Northern European | 15 | 0.2% |
| Norwegian | 19 | 0.3% |
| Panamanian | 17 | 0.2% |
| Paraguayan | 10 | 0.1% |
| Peruvian | 18 | 0.3% |
| Polish | 135 | 1.9% |
| Portuguese | 42 | 0.6% |
| Puerto Rican | 284 | 4.1% |
| Romanian | 55 | 0.8% |
| Russian | 91 | 1.3% |
| Salvadoran | 235 | 3.4% |
| Scandinavian | 16 | 0.2% |
| Scotch-Irish | 29 | 0.4% |
| Scottish | 89 | 1.3% |
| Slavic | 129 | 1.9% |
| Slovak | 60 | 0.9% |
| South American | 149 | 2.1% |
| Spaniard | 32 | 0.5% |
| Spanish | 22 | 0.3% |
| Sri Lankan | 40 | 0.6% |
| Subsaharan African | 28 | 0.4% |
| Swedish | 37 | 0.5% |
| Swiss | 19 | 0.3% |
| Syrian | 31 | 0.4% |
| Thai | 49 | 0.7% |
| Ukrainian | 14 | 0.2% |
| Vietnamese | 17 | 0.2% |
| Welsh | 43 | 0.6% |
| Yuman | 16 | 0.2% | View All 70 Rows |
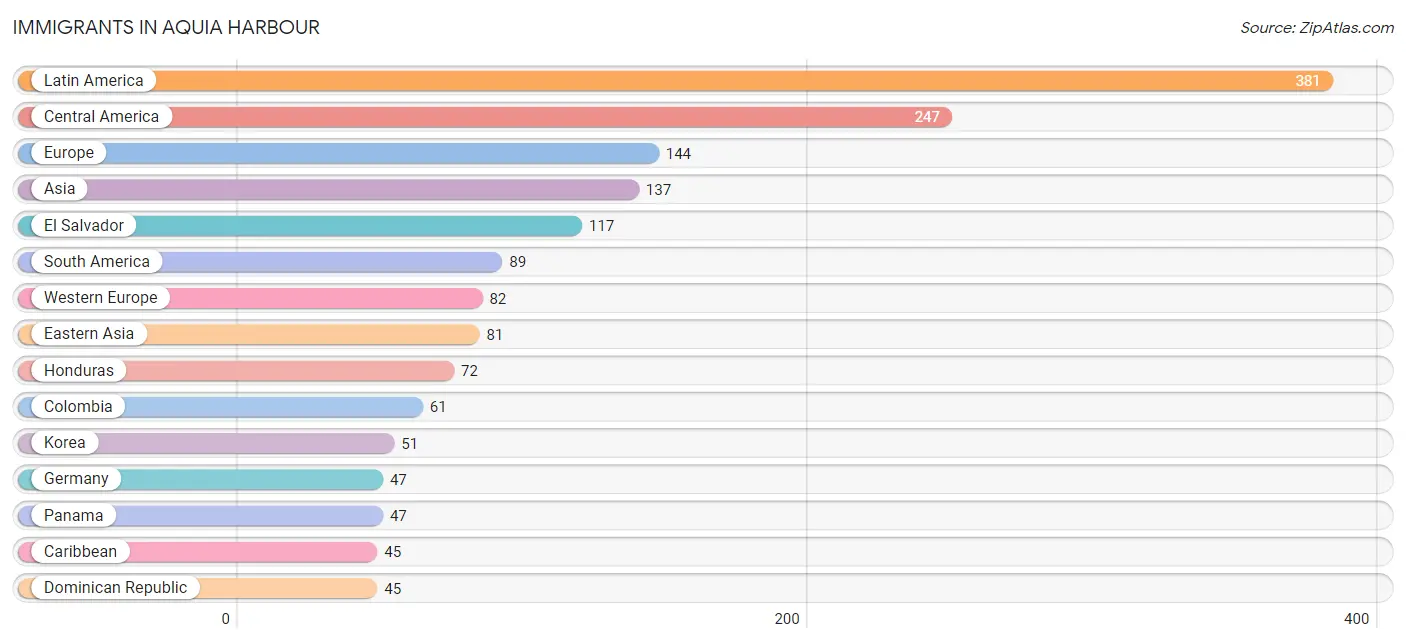
Immigrants in Aquia Harbour
The most numerous immigrant groups reported in Aquia Harbour came from Latin America (381 | 5.5%), Central America (247 | 3.6%), Europe (144 | 2.1%), Asia (137 | 2.0%), and El Salvador (117 | 1.7%), together accounting for 14.8% of all Aquia Harbour residents.
| Immigration Origin | # Population | % Population |
| Africa | 14 | 0.2% |
| Asia | 137 | 2.0% |
| Bangladesh | 17 | 0.2% |
| Bolivia | 19 | 0.3% |
| Canada | 17 | 0.2% |
| Caribbean | 45 | 0.6% |
| Central America | 247 | 3.6% |
| China | 6 | 0.1% |
| Colombia | 61 | 0.9% |
| Czechoslovakia | 8 | 0.1% |
| Dominican Republic | 45 | 0.6% |
| Eastern Africa | 10 | 0.1% |
| Eastern Asia | 81 | 1.2% |
| Eastern Europe | 42 | 0.6% |
| Ecuador | 9 | 0.1% |
| El Salvador | 117 | 1.7% |
| England | 11 | 0.2% |
| Ethiopia | 10 | 0.1% |
| Europe | 144 | 2.1% |
| France | 35 | 0.5% |
| Germany | 47 | 0.7% |
| Ghana | 4 | 0.1% |
| Honduras | 72 | 1.0% |
| Japan | 24 | 0.4% |
| Korea | 51 | 0.7% |
| Latin America | 381 | 5.5% |
| Mexico | 11 | 0.2% |
| Moldova | 13 | 0.2% |
| Northern Europe | 20 | 0.3% |
| Panama | 47 | 0.7% |
| Philippines | 14 | 0.2% |
| Russia | 21 | 0.3% |
| South America | 89 | 1.3% |
| South Central Asia | 17 | 0.2% |
| South Eastern Asia | 39 | 0.6% |
| Vietnam | 25 | 0.4% |
| Western Africa | 4 | 0.1% |
| Western Europe | 82 | 1.2% | View All 38 Rows |
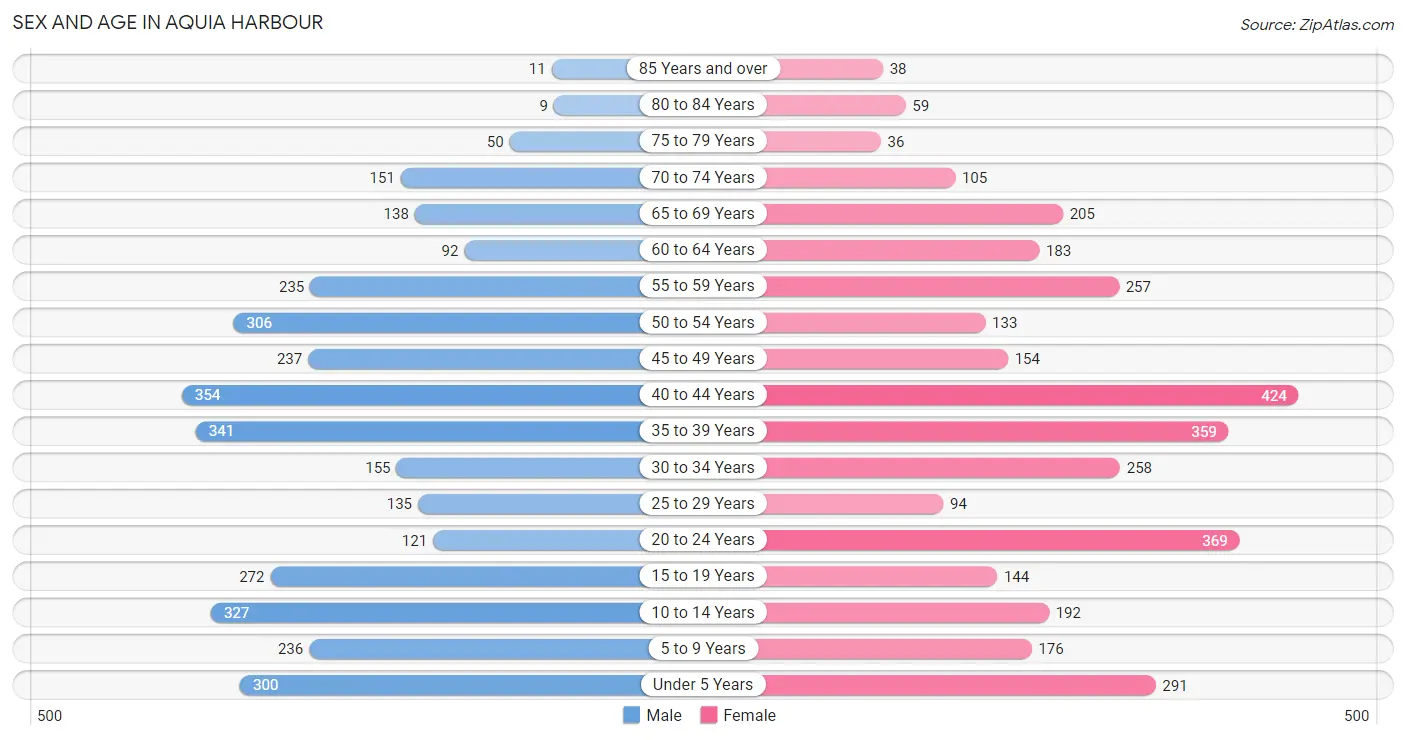
Sex and Age in Aquia Harbour
Sex and Age in Aquia Harbour
The most populous age groups in Aquia Harbour are 40 to 44 Years (354 | 10.2%) for men and 40 to 44 Years (424 | 12.2%) for women.
| Age Bracket | Male | Female |
| Under 5 Years | 300 (8.6%) | 291 (8.4%) |
| 5 to 9 Years | 236 (6.8%) | 176 (5.1%) |
| 10 to 14 Years | 327 (9.4%) | 192 (5.5%) |
| 15 to 19 Years | 272 (7.8%) | 144 (4.1%) |
| 20 to 24 Years | 121 (3.5%) | 369 (10.6%) |
| 25 to 29 Years | 135 (3.9%) | 94 (2.7%) |
| 30 to 34 Years | 155 (4.5%) | 258 (7.4%) |
| 35 to 39 Years | 341 (9.8%) | 359 (10.3%) |
| 40 to 44 Years | 354 (10.2%) | 424 (12.2%) |
| 45 to 49 Years | 237 (6.8%) | 154 (4.4%) |
| 50 to 54 Years | 306 (8.8%) | 133 (3.8%) |
| 55 to 59 Years | 235 (6.8%) | 257 (7.4%) |
| 60 to 64 Years | 92 (2.6%) | 183 (5.3%) |
| 65 to 69 Years | 138 (4.0%) | 205 (5.9%) |
| 70 to 74 Years | 151 (4.3%) | 105 (3.0%) |
| 75 to 79 Years | 50 (1.4%) | 36 (1.0%) |
| 80 to 84 Years | 9 (0.3%) | 59 (1.7%) |
| 85 Years and over | 11 (0.3%) | 38 (1.1%) |
| Total | 3,470 (100.0%) | 3,477 (100.0%) |
Families and Households in Aquia Harbour
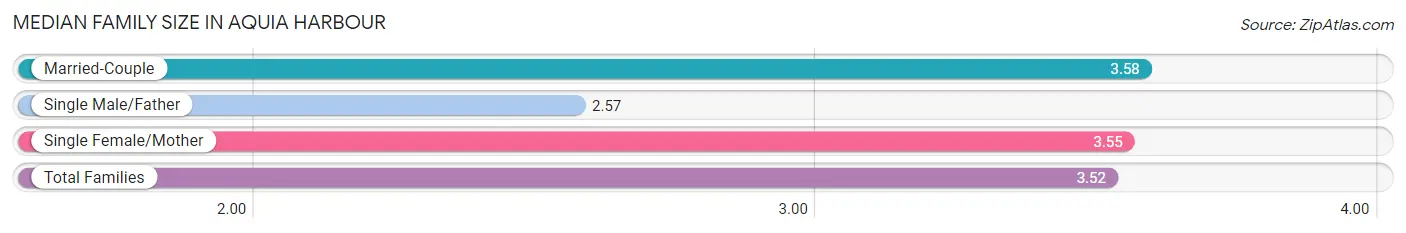
Median Family Size in Aquia Harbour
The median family size in Aquia Harbour is 3.52 persons per family, with married-couple families (1,508 | 83.4%) accounting for the largest median family size of 3.58 persons per family. On the other hand, single male/father families (100 | 5.5%) represent the smallest median family size with 2.57 persons per family.
| Family Type | # Families | Family Size |
| Married-Couple | 1,508 (83.4%) | 3.58 |
| Single Male/Father | 100 (5.5%) | 2.57 |
| Single Female/Mother | 201 (11.1%) | 3.55 |
| Total Families | 1,809 (100.0%) | 3.52 |
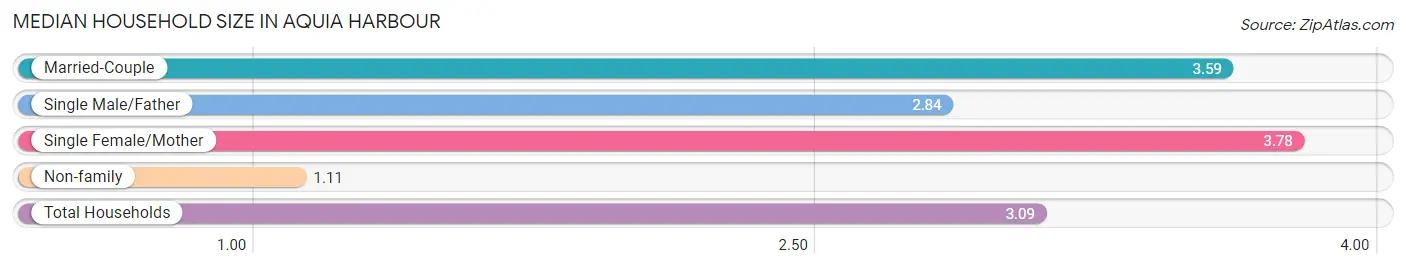
Median Household Size in Aquia Harbour
The median household size in Aquia Harbour is 3.09 persons per household, with single female/mother households (201 | 8.9%) accounting for the largest median household size of 3.78 persons per household. non-family households (437 | 19.5%) represent the smallest median household size with 1.11 persons per household.
| Household Type | # Households | Household Size |
| Married-Couple | 1,508 (67.1%) | 3.59 |
| Single Male/Father | 100 (4.4%) | 2.84 |
| Single Female/Mother | 201 (8.9%) | 3.78 |
| Non-family | 437 (19.5%) | 1.11 |
| Total Households | 2,246 (100.0%) | 3.09 |
Household Size by Marriage Status in Aquia Harbour
Out of a total of 2,246 households in Aquia Harbour, 1,809 (80.5%) are family households, while 437 (19.5%) are nonfamily households. The most numerous type of family households are 4-person households, comprising 560, and the most common type of nonfamily households are 1-person households, comprising 401.
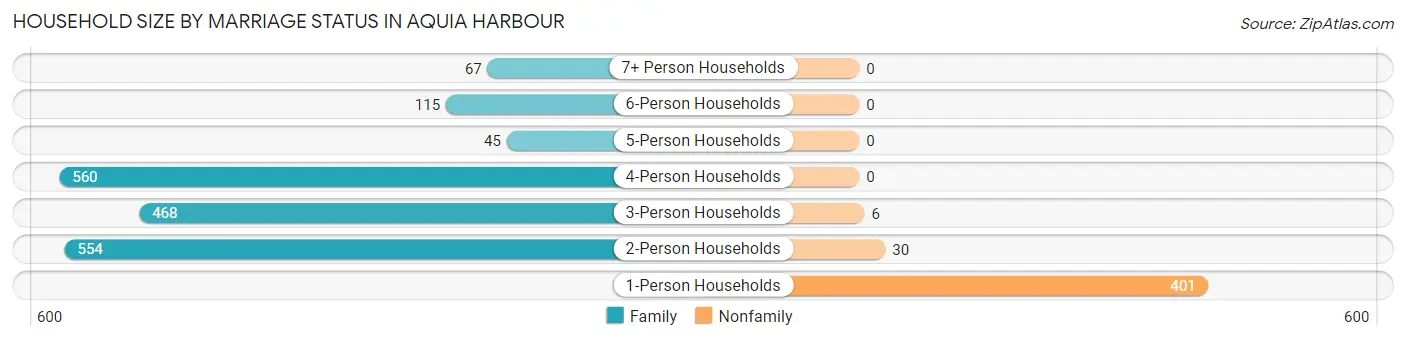
| Household Size | Family Households | Nonfamily Households |
| 1-Person Households | - | 401 (17.8%) |
| 2-Person Households | 554 (24.7%) | 30 (1.3%) |
| 3-Person Households | 468 (20.8%) | 6 (0.3%) |
| 4-Person Households | 560 (24.9%) | 0 (0.0%) |
| 5-Person Households | 45 (2.0%) | 0 (0.0%) |
| 6-Person Households | 115 (5.1%) | 0 (0.0%) |
| 7+ Person Households | 67 (3.0%) | 0 (0.0%) |
| Total | 1,809 (80.5%) | 437 (19.5%) |
Female Fertility in Aquia Harbour
Fertility by Age in Aquia Harbour
Average fertility rate in Aquia Harbour is 60.0 births per 1,000 women. Women in the age bracket of 20 to 34 years have the highest fertility rate with 112.0 births per 1,000 women. Women in the age bracket of 20 to 34 years acount for 73.0% of all women with births.
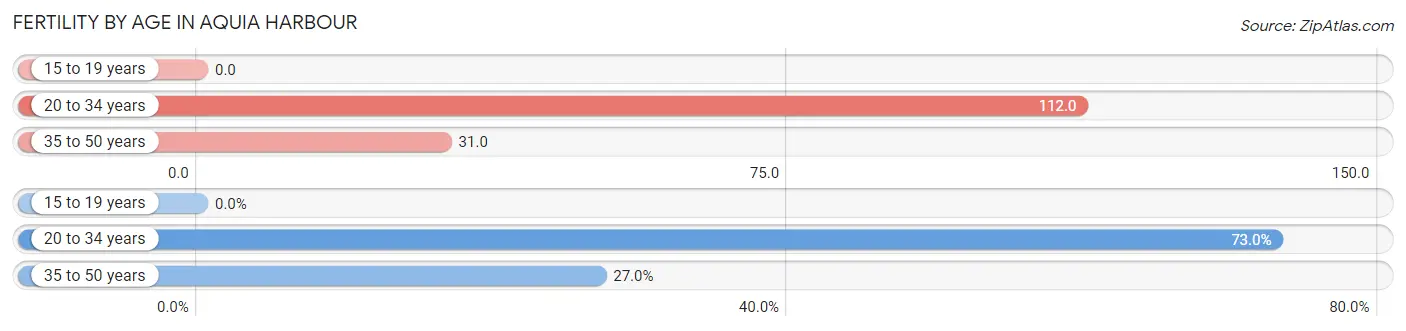
| Age Bracket | Women with Births | Births / 1,000 Women |
| 15 to 19 years | 0 (0.0%) | 0.0 |
| 20 to 34 years | 81 (73.0%) | 112.0 |
| 35 to 50 years | 30 (27.0%) | 31.0 |
| Total | 111 (100.0%) | 60.0 |
Fertility by Age by Marriage Status in Aquia Harbour
92.8% of women with births (111) in Aquia Harbour are married. The highest percentage of unmarried women with births falls into 20 to 34 years age bracket with 9.9% of them unmarried at the time of birth, while the lowest percentage of unmarried women with births belong to 35 to 50 years age bracket with 0.0% of them unmarried.
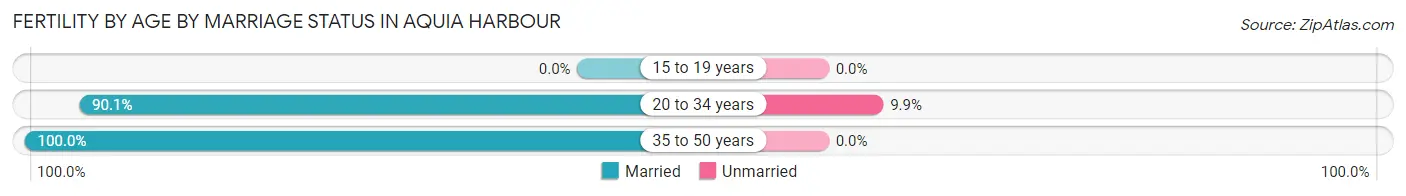
| Age Bracket | Married | Unmarried |
| 15 to 19 years | 0 (0.0%) | 0 (0.0%) |
| 20 to 34 years | 73 (90.1%) | 8 (9.9%) |
| 35 to 50 years | 30 (100.0%) | 0 (0.0%) |
| Total | 103 (92.8%) | 8 (7.2%) |
Fertility by Education in Aquia Harbour
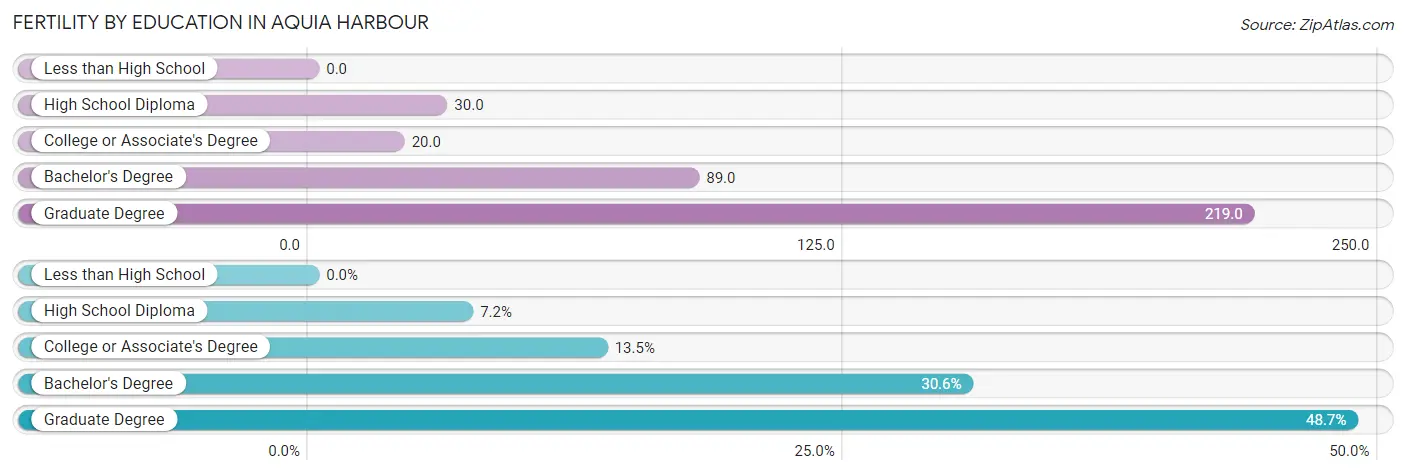
| Educational Attainment | Women with Births | Births / 1,000 Women |
| Less than High School | 0 (0.0%) | 0.0 |
| High School Diploma | 8 (7.2%) | 30.0 |
| College or Associate's Degree | 15 (13.5%) | 20.0 |
| Bachelor's Degree | 34 (30.6%) | 89.0 |
| Graduate Degree | 54 (48.6%) | 219.0 |
| Total | 111 (100.0%) | 60.0 |
Fertility by Education by Marriage Status in Aquia Harbour
7.2% of women with births in Aquia Harbour are unmarried. Women with the educational attainment of high school diploma are most likely to be married with 100.0% of them married at childbirth, while women with the educational attainment of college or associate's degree are least likely to be married with 53.3% of them unmarried at childbirth.
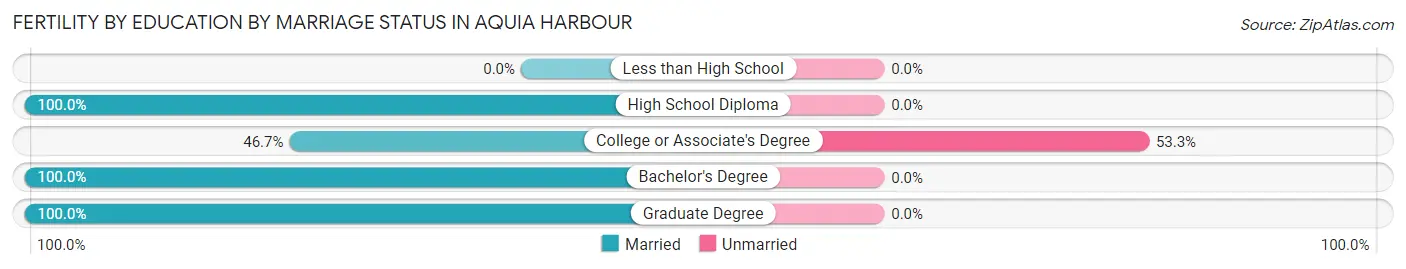
| Educational Attainment | Married | Unmarried |
| Less than High School | 0 (0.0%) | 0 (0.0%) |
| High School Diploma | 8 (100.0%) | 0 (0.0%) |
| College or Associate's Degree | 7 (46.7%) | 8 (53.3%) |
| Bachelor's Degree | 34 (100.0%) | 0 (0.0%) |
| Graduate Degree | 54 (100.0%) | 0 (0.0%) |
| Total | 103 (92.8%) | 8 (7.2%) |
Employment Characteristics in Aquia Harbour
Employment by Class of Employer in Aquia Harbour
Among the 3,285 employed individuals in Aquia Harbour, private company employees (1,790 | 54.5%), federal government employees (683 | 20.8%), and local government employees (322 | 9.8%) make up the most common classes of employment.
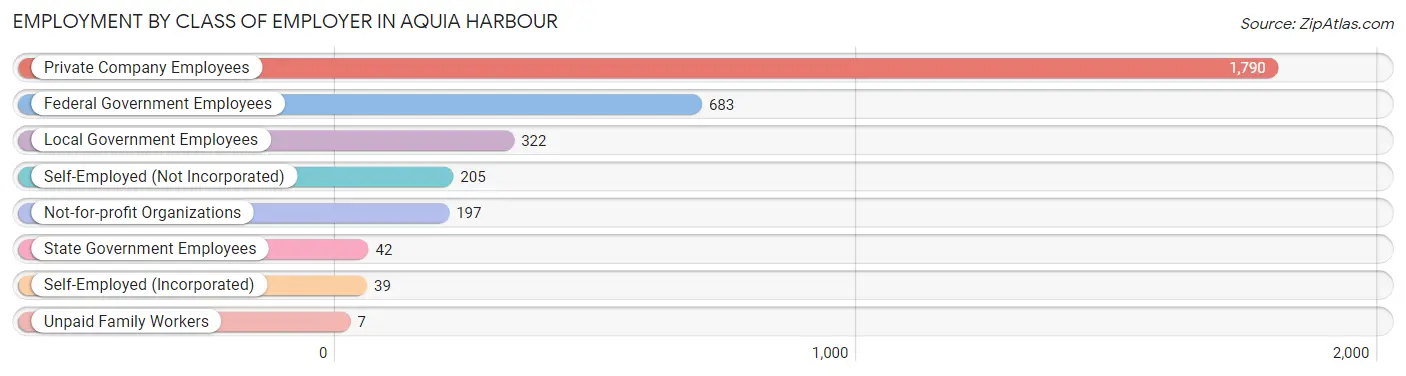
| Employer Class | # Employees | % Employees |
| Private Company Employees | 1,790 | 54.5% |
| Self-Employed (Incorporated) | 39 | 1.2% |
| Self-Employed (Not Incorporated) | 205 | 6.2% |
| Not-for-profit Organizations | 197 | 6.0% |
| Local Government Employees | 322 | 9.8% |
| State Government Employees | 42 | 1.3% |
| Federal Government Employees | 683 | 20.8% |
| Unpaid Family Workers | 7 | 0.2% |
| Total | 3,285 | 100.0% |
Employment Status by Age in Aquia Harbour
According to the labor force statistics for Aquia Harbour, out of the total population over 16 years of age (5,325), 65.1% or 3,467 individuals are in the labor force, with 3.6% or 125 of them unemployed. The age group with the highest labor force participation rate is 30 to 34 years, with 85.2% or 352 individuals in the labor force. Within the labor force, the 16 to 19 years age range has the highest percentage of unemployed individuals, with 28.6% or 24 of them being unemployed.
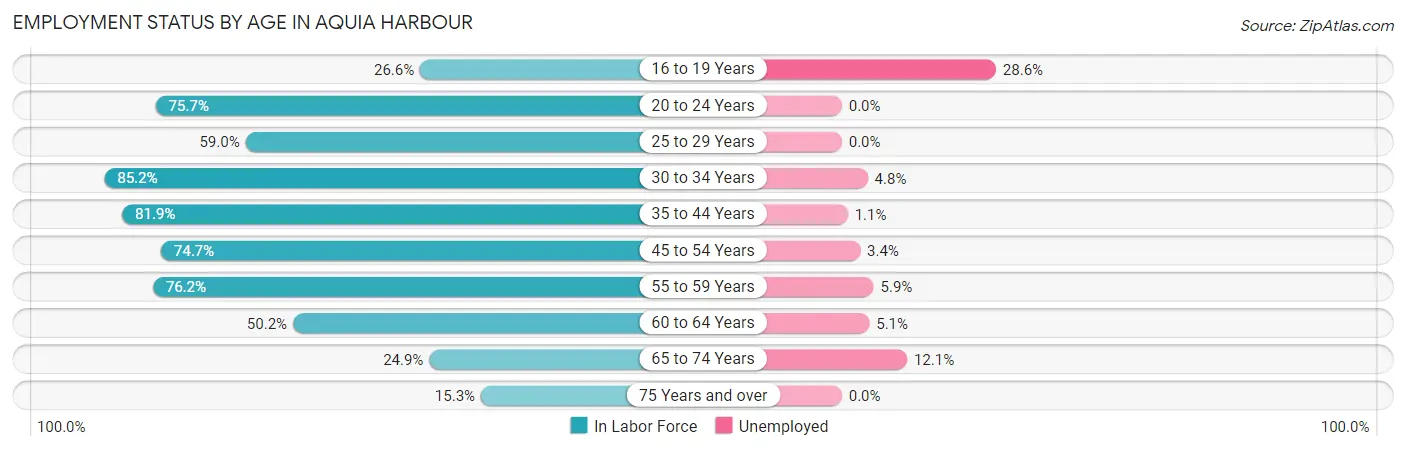
| Age Bracket | In Labor Force | Unemployed |
| 16 to 19 Years | 84 (26.6%) | 24 (28.6%) |
| 20 to 24 Years | 371 (75.7%) | 0 (0.0%) |
| 25 to 29 Years | 135 (59.0%) | 0 (0.0%) |
| 30 to 34 Years | 352 (85.2%) | 17 (4.8%) |
| 35 to 44 Years | 1,210 (81.9%) | 13 (1.1%) |
| 45 to 54 Years | 620 (74.7%) | 21 (3.4%) |
| 55 to 59 Years | 375 (76.2%) | 22 (5.9%) |
| 60 to 64 Years | 138 (50.2%) | 7 (5.1%) |
| 65 to 74 Years | 149 (24.9%) | 18 (12.1%) |
| 75 Years and over | 31 (15.3%) | 0 (0.0%) |
| Total | 3,467 (65.1%) | 125 (3.6%) |
Employment Status by Educational Attainment in Aquia Harbour
According to labor force statistics for Aquia Harbour, 76.1% of individuals (2,829) out of the total population between 25 and 64 years of age (3,717) are in the labor force, with 2.9% or 82 of them being unemployed. The group with the highest labor force participation rate are those with the educational attainment of high school diploma, with 79.0% or 557 individuals in the labor force. Within the labor force, individuals with bachelor's degree or higher education have the highest percentage of unemployment, with 3.9% or 54 of them being unemployed.
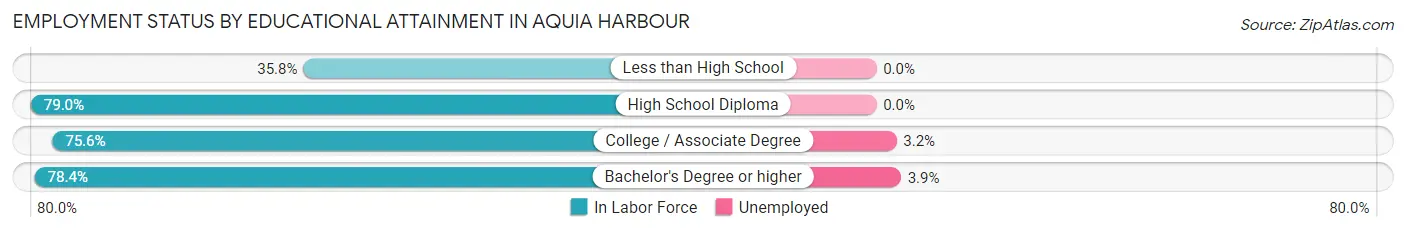
| Educational Attainment | In Labor Force | Unemployed |
| Less than High School | 48 (35.8%) | 0 (0.0%) |
| High School Diploma | 557 (79.0%) | 0 (0.0%) |
| College / Associate Degree | 840 (75.6%) | 36 (3.2%) |
| Bachelor's Degree or higher | 1,385 (78.4%) | 69 (3.9%) |
| Total | 2,829 (76.1%) | 108 (2.9%) |
Employment Occupations by Sex in Aquia Harbour
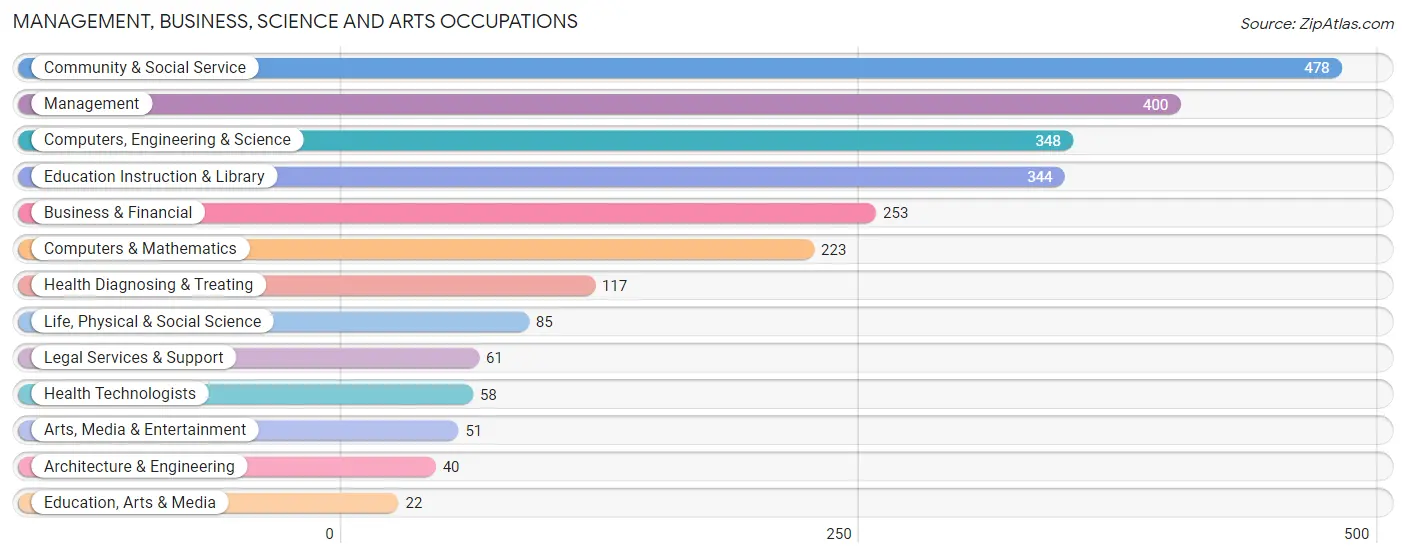
Management, Business, Science and Arts Occupations
The most common Management, Business, Science and Arts occupations in Aquia Harbour are Community & Social Service (478 | 14.7%), Management (400 | 12.3%), Computers, Engineering & Science (348 | 10.7%), Education Instruction & Library (344 | 10.6%), and Business & Financial (253 | 7.8%).
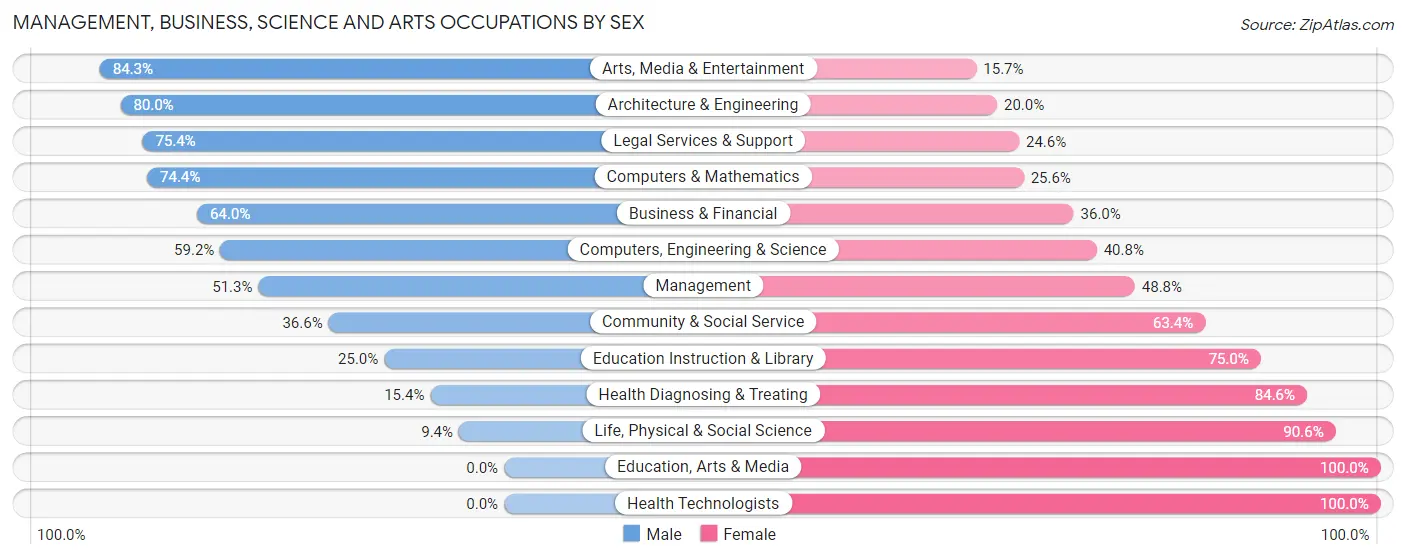
Management, Business, Science and Arts Occupations by Sex
Within the Management, Business, Science and Arts occupations in Aquia Harbour, the most male-oriented occupations are Arts, Media & Entertainment (84.3%), Architecture & Engineering (80.0%), and Legal Services & Support (75.4%), while the most female-oriented occupations are Education, Arts & Media (100.0%), Health Technologists (100.0%), and Life, Physical & Social Science (90.6%).
| Occupation | Male | Female |
| Management | 205 (51.2%) | 195 (48.7%) |
| Business & Financial | 162 (64.0%) | 91 (36.0%) |
| Computers, Engineering & Science | 206 (59.2%) | 142 (40.8%) |
| Computers & Mathematics | 166 (74.4%) | 57 (25.6%) |
| Architecture & Engineering | 32 (80.0%) | 8 (20.0%) |
| Life, Physical & Social Science | 8 (9.4%) | 77 (90.6%) |
| Community & Social Service | 175 (36.6%) | 303 (63.4%) |
| Education, Arts & Media | 0 (0.0%) | 22 (100.0%) |
| Legal Services & Support | 46 (75.4%) | 15 (24.6%) |
| Education Instruction & Library | 86 (25.0%) | 258 (75.0%) |
| Arts, Media & Entertainment | 43 (84.3%) | 8 (15.7%) |
| Health Diagnosing & Treating | 18 (15.4%) | 99 (84.6%) |
| Health Technologists | 0 (0.0%) | 58 (100.0%) |
| Total (Category) | 766 (48.0%) | 830 (52.0%) |
| Total (Overall) | 1,689 (52.0%) | 1,560 (48.0%) |
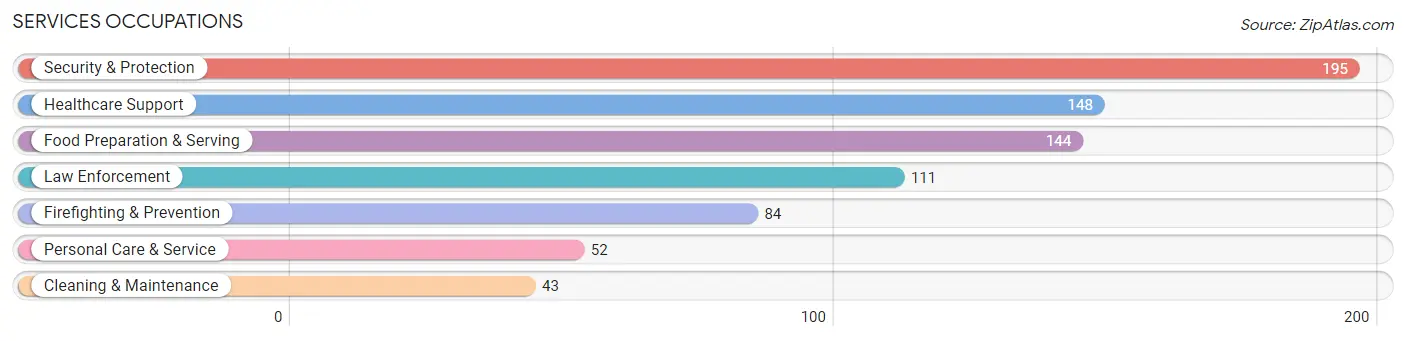
Services Occupations
The most common Services occupations in Aquia Harbour are Security & Protection (195 | 6.0%), Healthcare Support (148 | 4.6%), Food Preparation & Serving (144 | 4.4%), Law Enforcement (111 | 3.4%), and Firefighting & Prevention (84 | 2.6%).
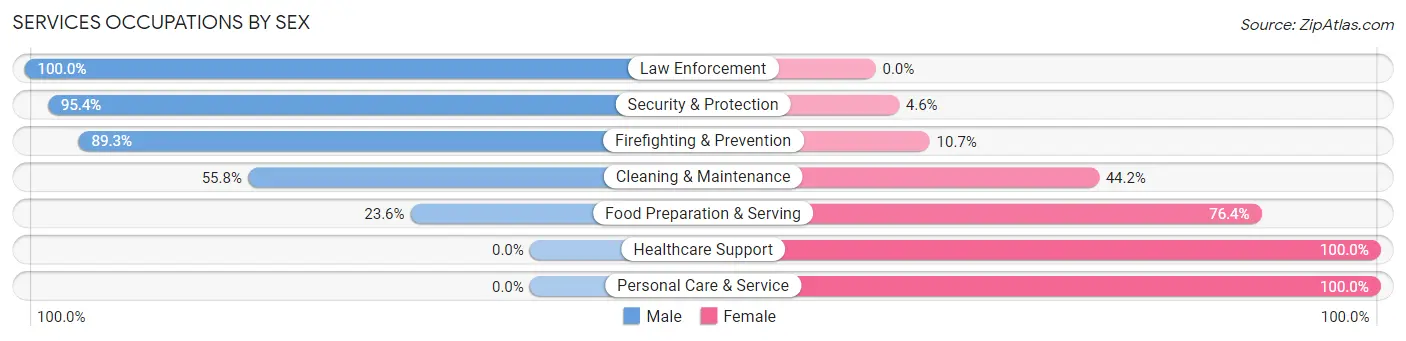
Services Occupations by Sex
Within the Services occupations in Aquia Harbour, the most male-oriented occupations are Law Enforcement (100.0%), Security & Protection (95.4%), and Firefighting & Prevention (89.3%), while the most female-oriented occupations are Healthcare Support (100.0%), Personal Care & Service (100.0%), and Food Preparation & Serving (76.4%).
| Occupation | Male | Female |
| Healthcare Support | 0 (0.0%) | 148 (100.0%) |
| Security & Protection | 186 (95.4%) | 9 (4.6%) |
| Firefighting & Prevention | 75 (89.3%) | 9 (10.7%) |
| Law Enforcement | 111 (100.0%) | 0 (0.0%) |
| Food Preparation & Serving | 34 (23.6%) | 110 (76.4%) |
| Cleaning & Maintenance | 24 (55.8%) | 19 (44.2%) |
| Personal Care & Service | 0 (0.0%) | 52 (100.0%) |
| Total (Category) | 244 (41.9%) | 338 (58.1%) |
| Total (Overall) | 1,689 (52.0%) | 1,560 (48.0%) |
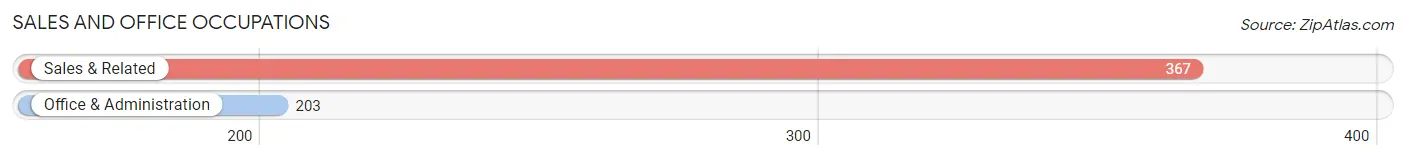
Sales and Office Occupations
The most common Sales and Office occupations in Aquia Harbour are Sales & Related (367 | 11.3%), and Office & Administration (203 | 6.2%).
Sales and Office Occupations by Sex
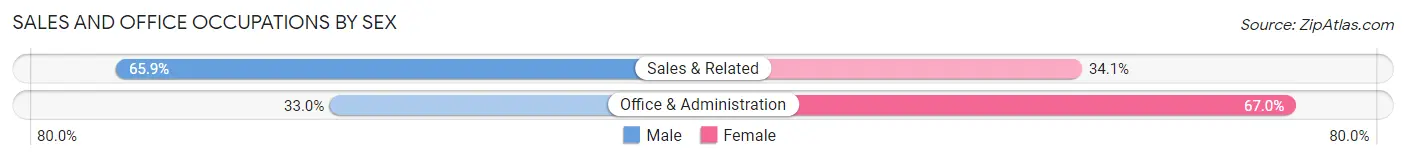
| Occupation | Male | Female |
| Sales & Related | 242 (65.9%) | 125 (34.1%) |
| Office & Administration | 67 (33.0%) | 136 (67.0%) |
| Total (Category) | 309 (54.2%) | 261 (45.8%) |
| Total (Overall) | 1,689 (52.0%) | 1,560 (48.0%) |
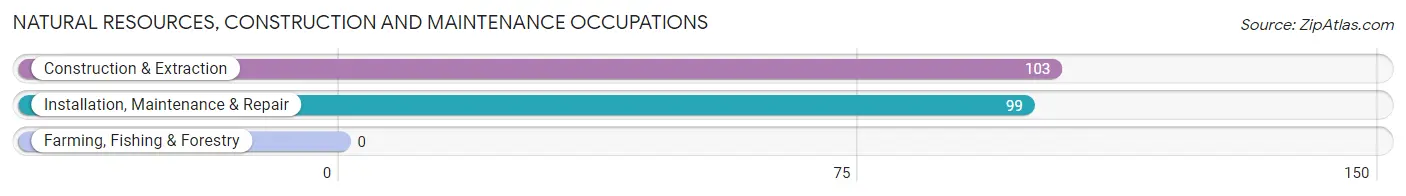
Natural Resources, Construction and Maintenance Occupations
The most common Natural Resources, Construction and Maintenance occupations in Aquia Harbour are Construction & Extraction (103 | 3.2%), and Installation, Maintenance & Repair (99 | 3.0%).
Natural Resources, Construction and Maintenance Occupations by Sex
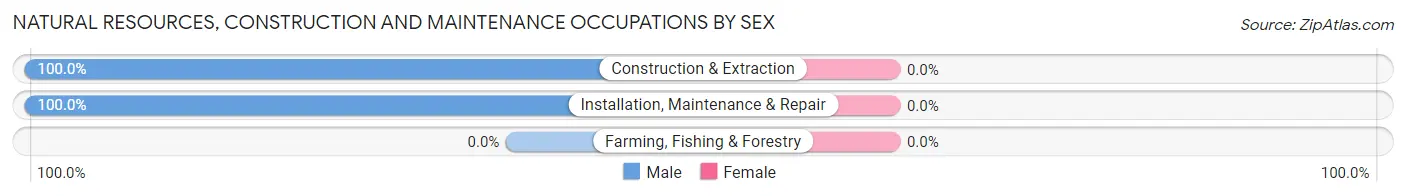
| Occupation | Male | Female |
| Farming, Fishing & Forestry | 0 (0.0%) | 0 (0.0%) |
| Construction & Extraction | 103 (100.0%) | 0 (0.0%) |
| Installation, Maintenance & Repair | 99 (100.0%) | 0 (0.0%) |
| Total (Category) | 202 (100.0%) | 0 (0.0%) |
| Total (Overall) | 1,689 (52.0%) | 1,560 (48.0%) |
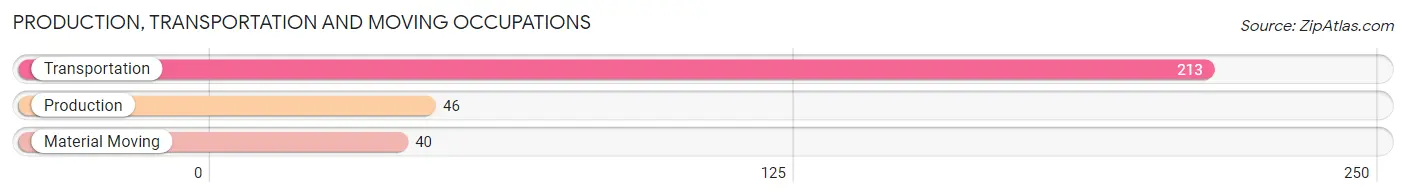
Production, Transportation and Moving Occupations
The most common Production, Transportation and Moving occupations in Aquia Harbour are Transportation (213 | 6.6%), Production (46 | 1.4%), and Material Moving (40 | 1.2%).
Production, Transportation and Moving Occupations by Sex
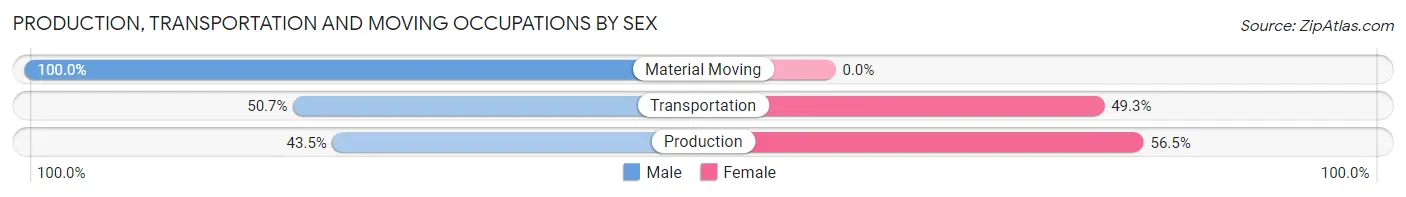
| Occupation | Male | Female |
| Production | 20 (43.5%) | 26 (56.5%) |
| Transportation | 108 (50.7%) | 105 (49.3%) |
| Material Moving | 40 (100.0%) | 0 (0.0%) |
| Total (Category) | 168 (56.2%) | 131 (43.8%) |
| Total (Overall) | 1,689 (52.0%) | 1,560 (48.0%) |
Employment Industries by Sex in Aquia Harbour
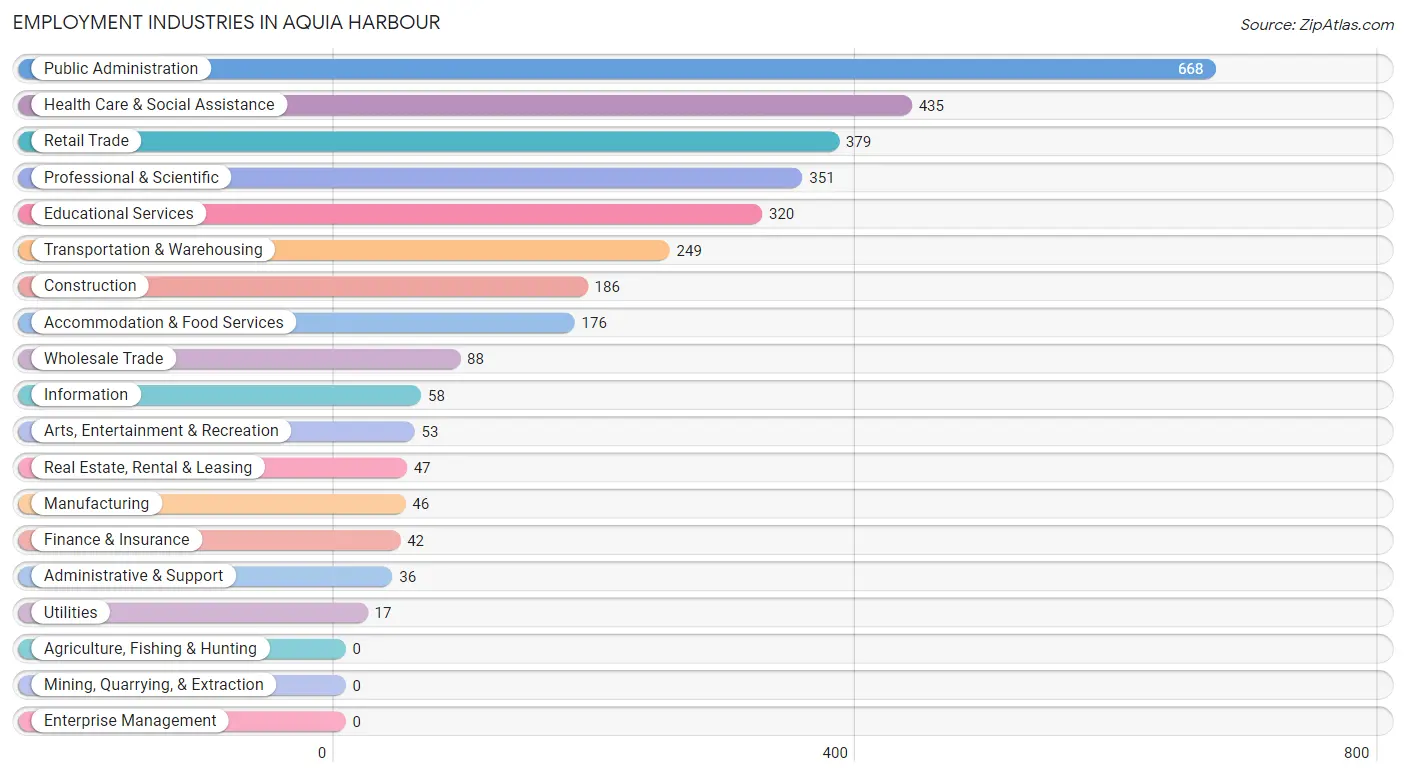
Employment Industries in Aquia Harbour
The major employment industries in Aquia Harbour include Public Administration (668 | 20.6%), Health Care & Social Assistance (435 | 13.4%), Retail Trade (379 | 11.7%), Professional & Scientific (351 | 10.8%), and Educational Services (320 | 9.9%).
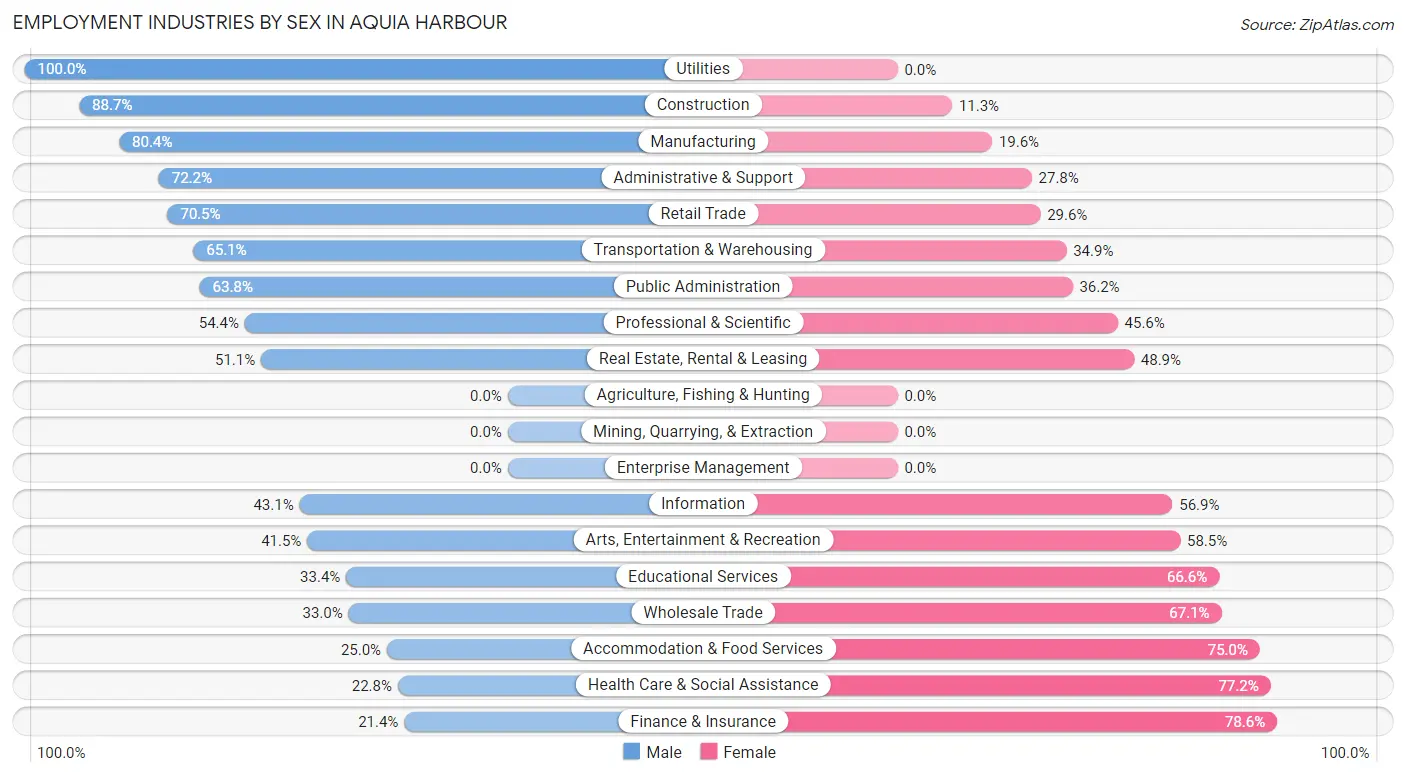
Employment Industries by Sex in Aquia Harbour
The Aquia Harbour industries that see more men than women are Utilities (100.0%), Construction (88.7%), and Manufacturing (80.4%), whereas the industries that tend to have a higher number of women are Finance & Insurance (78.6%), Health Care & Social Assistance (77.2%), and Accommodation & Food Services (75.0%).
| Industry | Male | Female |
| Agriculture, Fishing & Hunting | 0 (0.0%) | 0 (0.0%) |
| Mining, Quarrying, & Extraction | 0 (0.0%) | 0 (0.0%) |
| Construction | 165 (88.7%) | 21 (11.3%) |
| Manufacturing | 37 (80.4%) | 9 (19.6%) |
| Wholesale Trade | 29 (33.0%) | 59 (67.0%) |
| Retail Trade | 267 (70.5%) | 112 (29.5%) |
| Transportation & Warehousing | 162 (65.1%) | 87 (34.9%) |
| Utilities | 17 (100.0%) | 0 (0.0%) |
| Information | 25 (43.1%) | 33 (56.9%) |
| Finance & Insurance | 9 (21.4%) | 33 (78.6%) |
| Real Estate, Rental & Leasing | 24 (51.1%) | 23 (48.9%) |
| Professional & Scientific | 191 (54.4%) | 160 (45.6%) |
| Enterprise Management | 0 (0.0%) | 0 (0.0%) |
| Administrative & Support | 26 (72.2%) | 10 (27.8%) |
| Educational Services | 107 (33.4%) | 213 (66.6%) |
| Health Care & Social Assistance | 99 (22.8%) | 336 (77.2%) |
| Arts, Entertainment & Recreation | 22 (41.5%) | 31 (58.5%) |
| Accommodation & Food Services | 44 (25.0%) | 132 (75.0%) |
| Public Administration | 426 (63.8%) | 242 (36.2%) |
| Total | 1,689 (52.0%) | 1,560 (48.0%) |
Education in Aquia Harbour
School Enrollment in Aquia Harbour
The most common levels of schooling among the 1,874 students in Aquia Harbour are college / undergraduate (421 | 22.5%), high school (417 | 22.3%), and middle school (407 | 21.7%).
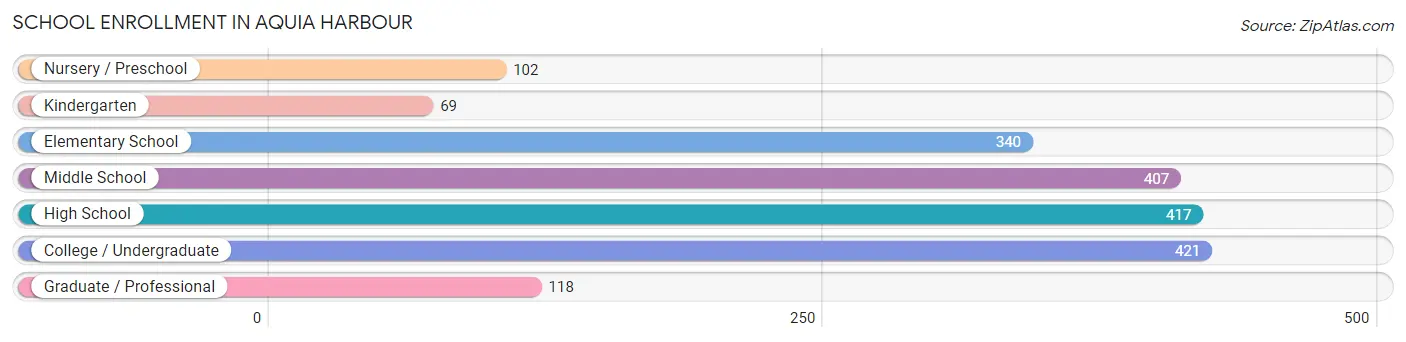
| School Level | # Students | % Students |
| Nursery / Preschool | 102 | 5.4% |
| Kindergarten | 69 | 3.7% |
| Elementary School | 340 | 18.1% |
| Middle School | 407 | 21.7% |
| High School | 417 | 22.3% |
| College / Undergraduate | 421 | 22.5% |
| Graduate / Professional | 118 | 6.3% |
| Total | 1,874 | 100.0% |
School Enrollment by Age by Funding Source in Aquia Harbour
Out of a total of 1,874 students who are enrolled in schools in Aquia Harbour, 285 (15.2%) attend a private institution, while the remaining 1,589 (84.8%) are enrolled in public schools. The age group of 25 to 34 year olds has the highest likelihood of being enrolled in private schools, with 32 (74.4% in the age bracket) enrolled. Conversely, the age group of 20 to 24 year olds has the lowest likelihood of being enrolled in a private school, with 325 (94.5% in the age bracket) attending a public institution.
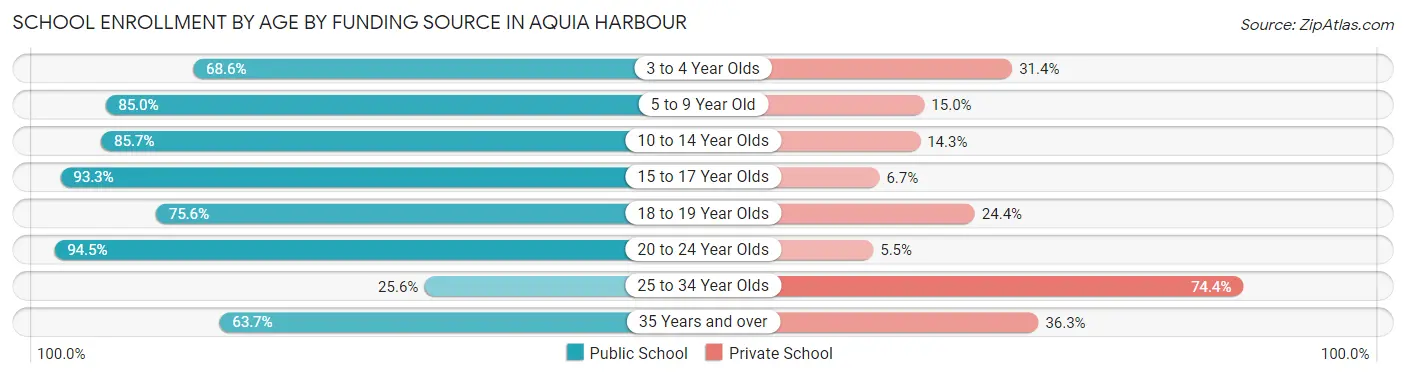
| Age Bracket | Public School | Private School |
| 3 to 4 Year Olds | 59 (68.6%) | 27 (31.4%) |
| 5 to 9 Year Old | 322 (85.0%) | 57 (15.0%) |
| 10 to 14 Year Olds | 445 (85.7%) | 74 (14.3%) |
| 15 to 17 Year Olds | 322 (93.3%) | 23 (6.7%) |
| 18 to 19 Year Olds | 34 (75.6%) | 11 (24.4%) |
| 20 to 24 Year Olds | 325 (94.5%) | 19 (5.5%) |
| 25 to 34 Year Olds | 11 (25.6%) | 32 (74.4%) |
| 35 Years and over | 72 (63.7%) | 41 (36.3%) |
| Total | 1,589 (84.8%) | 285 (15.2%) |
Educational Attainment by Field of Study in Aquia Harbour
Business (432 | 18.8%), engineering (361 | 15.7%), social sciences (287 | 12.5%), arts & humanities (242 | 10.5%), and education (218 | 9.5%) are the most common fields of study among 2,297 individuals in Aquia Harbour who have obtained a bachelor's degree or higher.
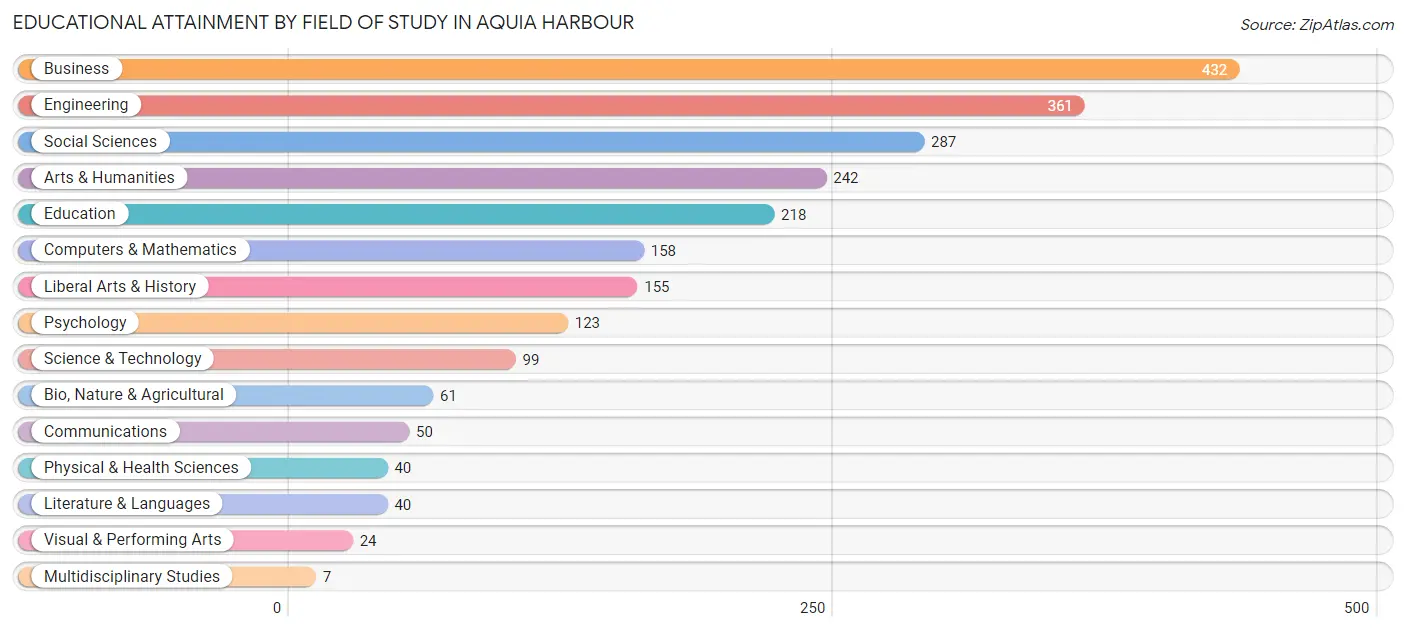
| Field of Study | # Graduates | % Graduates |
| Computers & Mathematics | 158 | 6.9% |
| Bio, Nature & Agricultural | 61 | 2.7% |
| Physical & Health Sciences | 40 | 1.7% |
| Psychology | 123 | 5.3% |
| Social Sciences | 287 | 12.5% |
| Engineering | 361 | 15.7% |
| Multidisciplinary Studies | 7 | 0.3% |
| Science & Technology | 99 | 4.3% |
| Business | 432 | 18.8% |
| Education | 218 | 9.5% |
| Literature & Languages | 40 | 1.7% |
| Liberal Arts & History | 155 | 6.8% |
| Visual & Performing Arts | 24 | 1.0% |
| Communications | 50 | 2.2% |
| Arts & Humanities | 242 | 10.5% |
| Total | 2,297 | 100.0% |
Transportation & Commute in Aquia Harbour
Vehicle Availability by Sex in Aquia Harbour
The most prevalent vehicle ownership categories in Aquia Harbour are males with 2 vehicles (844, accounting for 47.3%) and females with 2 vehicles (529, making up 56.3%).
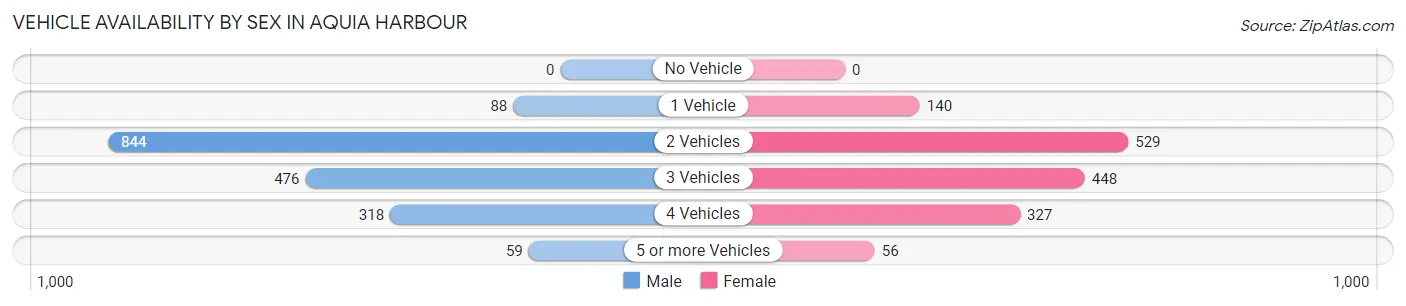
| Vehicles Available | Male | Female |
| No Vehicle | 0 (0.0%) | 0 (0.0%) |
| 1 Vehicle | 88 (4.9%) | 140 (9.3%) |
| 2 Vehicles | 844 (47.3%) | 529 (35.3%) |
| 3 Vehicles | 476 (26.7%) | 448 (29.9%) |
| 4 Vehicles | 318 (17.8%) | 327 (21.8%) |
| 5 or more Vehicles | 59 (3.3%) | 56 (3.7%) |
| Total | 1,785 (100.0%) | 1,500 (100.0%) |
Commute Time in Aquia Harbour
The most frequently occuring commute durations in Aquia Harbour are 60 to 89 minutes (551 commuters, 19.5%), 15 to 19 minutes (377 commuters, 13.4%), and 20 to 24 minutes (355 commuters, 12.6%).
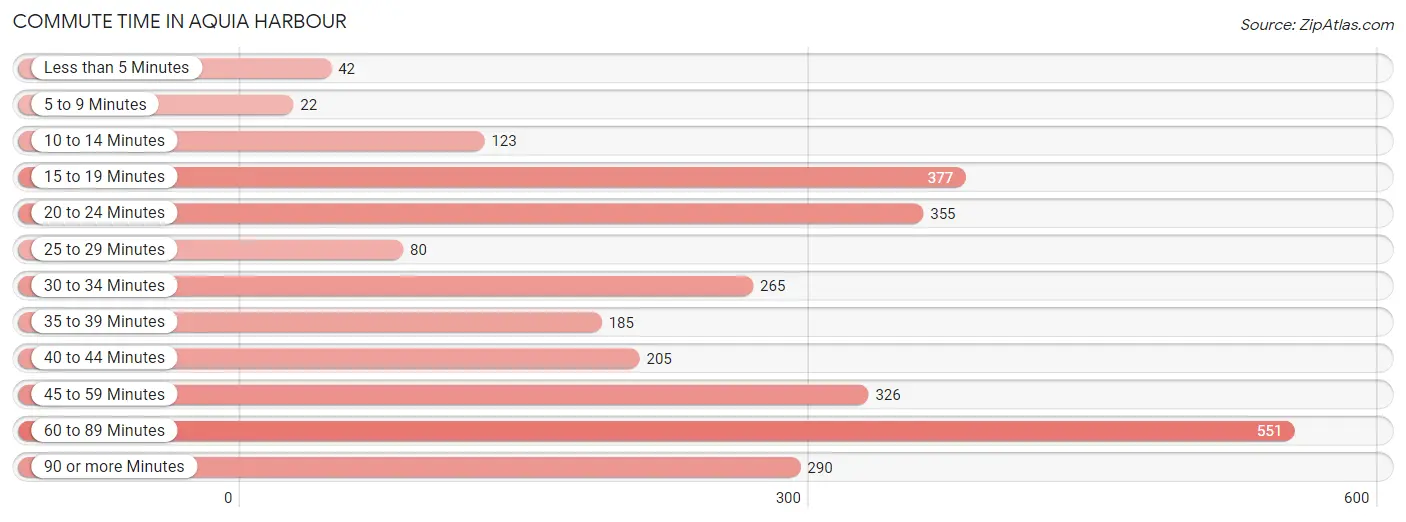
| Commute Time | # Commuters | % Commuters |
| Less than 5 Minutes | 42 | 1.5% |
| 5 to 9 Minutes | 22 | 0.8% |
| 10 to 14 Minutes | 123 | 4.4% |
| 15 to 19 Minutes | 377 | 13.4% |
| 20 to 24 Minutes | 355 | 12.6% |
| 25 to 29 Minutes | 80 | 2.8% |
| 30 to 34 Minutes | 265 | 9.4% |
| 35 to 39 Minutes | 185 | 6.6% |
| 40 to 44 Minutes | 205 | 7.3% |
| 45 to 59 Minutes | 326 | 11.6% |
| 60 to 89 Minutes | 551 | 19.5% |
| 90 or more Minutes | 290 | 10.3% |
Commute Time by Sex in Aquia Harbour
The most common commute times in Aquia Harbour are 60 to 89 minutes (331 commuters, 22.2%) for males and 20 to 24 minutes (250 commuters, 18.8%) for females.
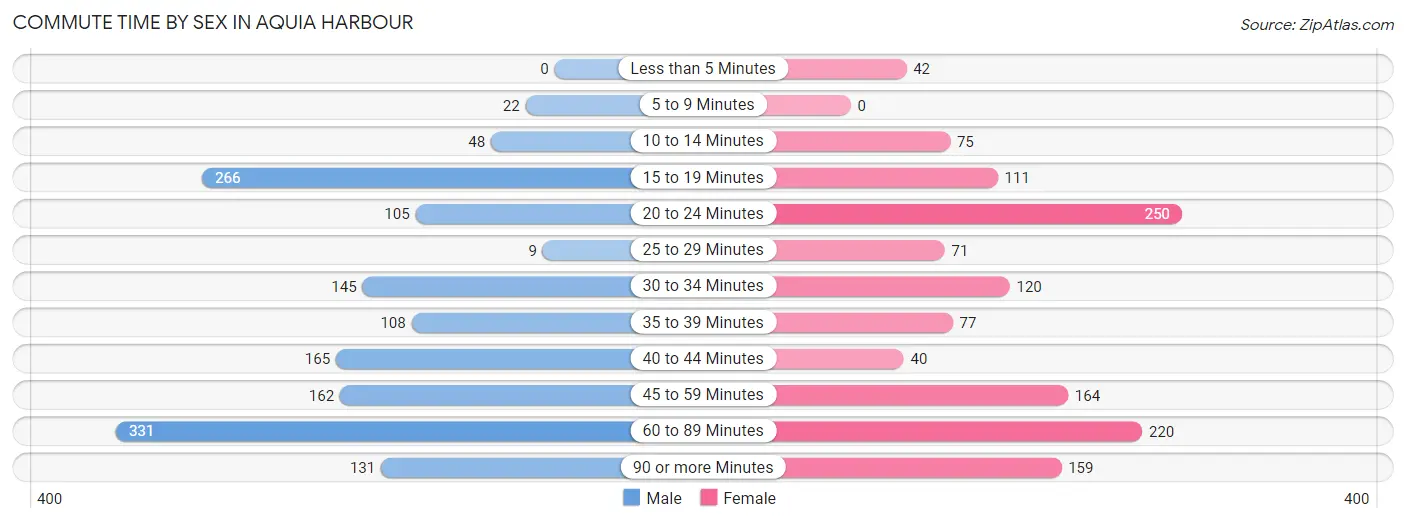
| Commute Time | Male | Female |
| Less than 5 Minutes | 0 (0.0%) | 42 (3.2%) |
| 5 to 9 Minutes | 22 (1.5%) | 0 (0.0%) |
| 10 to 14 Minutes | 48 (3.2%) | 75 (5.6%) |
| 15 to 19 Minutes | 266 (17.8%) | 111 (8.4%) |
| 20 to 24 Minutes | 105 (7.0%) | 250 (18.8%) |
| 25 to 29 Minutes | 9 (0.6%) | 71 (5.3%) |
| 30 to 34 Minutes | 145 (9.7%) | 120 (9.0%) |
| 35 to 39 Minutes | 108 (7.2%) | 77 (5.8%) |
| 40 to 44 Minutes | 165 (11.1%) | 40 (3.0%) |
| 45 to 59 Minutes | 162 (10.9%) | 164 (12.3%) |
| 60 to 89 Minutes | 331 (22.2%) | 220 (16.6%) |
| 90 or more Minutes | 131 (8.8%) | 159 (12.0%) |
Time of Departure to Work by Sex in Aquia Harbour
The most frequent times of departure to work in Aquia Harbour are 12:00 AM to 4:59 AM (373, 25.0%) for males and 7:00 AM to 7:29 AM (203, 15.3%) for females.
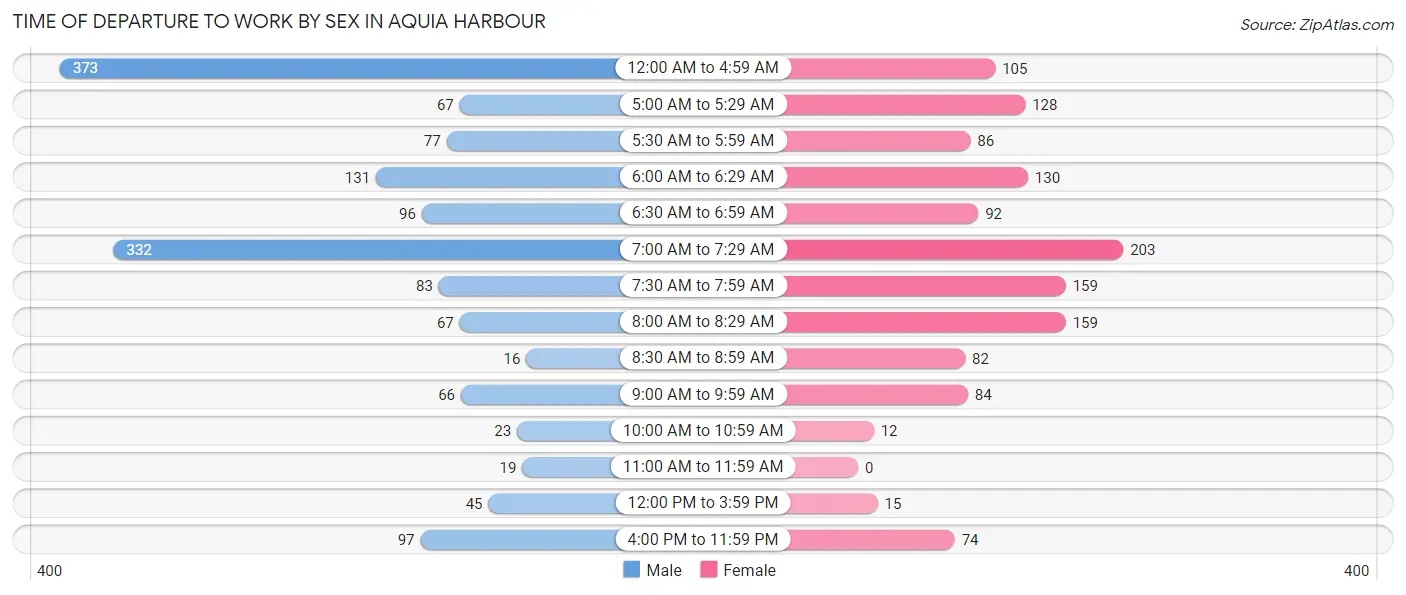
| Time of Departure | Male | Female |
| 12:00 AM to 4:59 AM | 373 (25.0%) | 105 (7.9%) |
| 5:00 AM to 5:29 AM | 67 (4.5%) | 128 (9.6%) |
| 5:30 AM to 5:59 AM | 77 (5.2%) | 86 (6.5%) |
| 6:00 AM to 6:29 AM | 131 (8.8%) | 130 (9.8%) |
| 6:30 AM to 6:59 AM | 96 (6.4%) | 92 (6.9%) |
| 7:00 AM to 7:29 AM | 332 (22.3%) | 203 (15.3%) |
| 7:30 AM to 7:59 AM | 83 (5.6%) | 159 (12.0%) |
| 8:00 AM to 8:29 AM | 67 (4.5%) | 159 (12.0%) |
| 8:30 AM to 8:59 AM | 16 (1.1%) | 82 (6.2%) |
| 9:00 AM to 9:59 AM | 66 (4.4%) | 84 (6.3%) |
| 10:00 AM to 10:59 AM | 23 (1.5%) | 12 (0.9%) |
| 11:00 AM to 11:59 AM | 19 (1.3%) | 0 (0.0%) |
| 12:00 PM to 3:59 PM | 45 (3.0%) | 15 (1.1%) |
| 4:00 PM to 11:59 PM | 97 (6.5%) | 74 (5.6%) |
| Total | 1,492 (100.0%) | 1,329 (100.0%) |
Housing Occupancy in Aquia Harbour
Occupancy by Ownership in Aquia Harbour
Of the total 2,246 dwellings in Aquia Harbour, owner-occupied units account for 2,036 (90.6%), while renter-occupied units make up 210 (9.3%).
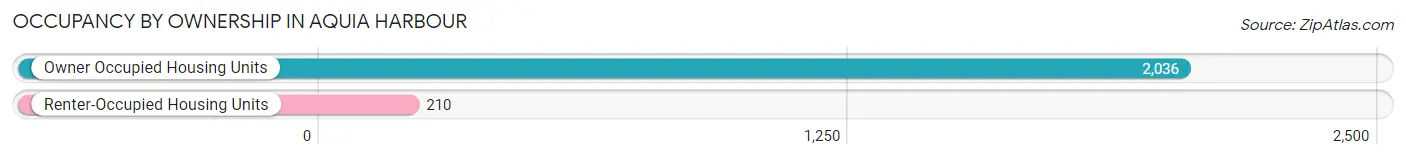
| Occupancy | # Housing Units | % Housing Units |
| Owner Occupied Housing Units | 2,036 | 90.6% |
| Renter-Occupied Housing Units | 210 | 9.3% |
| Total Occupied Housing Units | 2,246 | 100.0% |
Occupancy by Household Size in Aquia Harbour
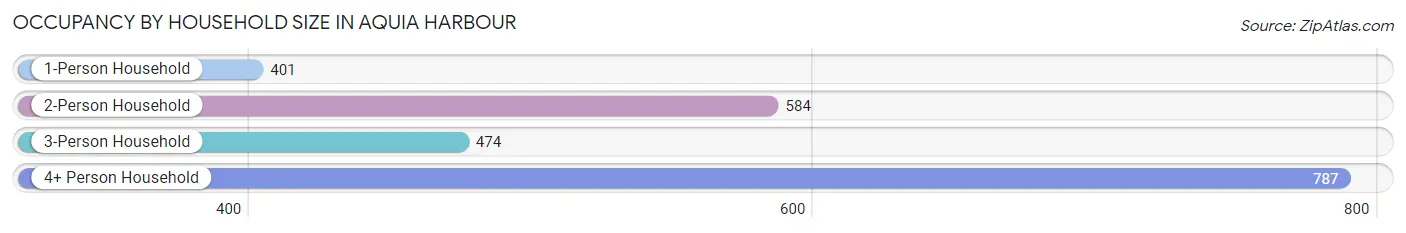
| Household Size | # Housing Units | % Housing Units |
| 1-Person Household | 401 | 17.8% |
| 2-Person Household | 584 | 26.0% |
| 3-Person Household | 474 | 21.1% |
| 4+ Person Household | 787 | 35.0% |
| Total Housing Units | 2,246 | 100.0% |
Occupancy by Ownership by Household Size in Aquia Harbour
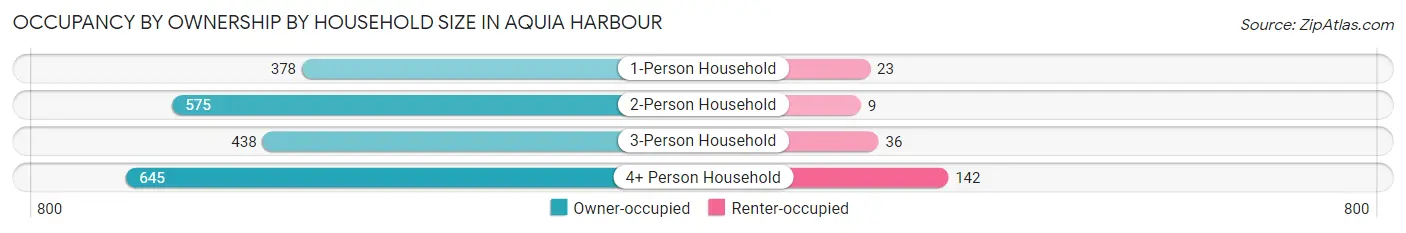
| Household Size | Owner-occupied | Renter-occupied |
| 1-Person Household | 378 (94.3%) | 23 (5.7%) |
| 2-Person Household | 575 (98.5%) | 9 (1.5%) |
| 3-Person Household | 438 (92.4%) | 36 (7.6%) |
| 4+ Person Household | 645 (82.0%) | 142 (18.0%) |
| Total Housing Units | 2,036 (90.6%) | 210 (9.3%) |
Occupancy by Educational Attainment in Aquia Harbour
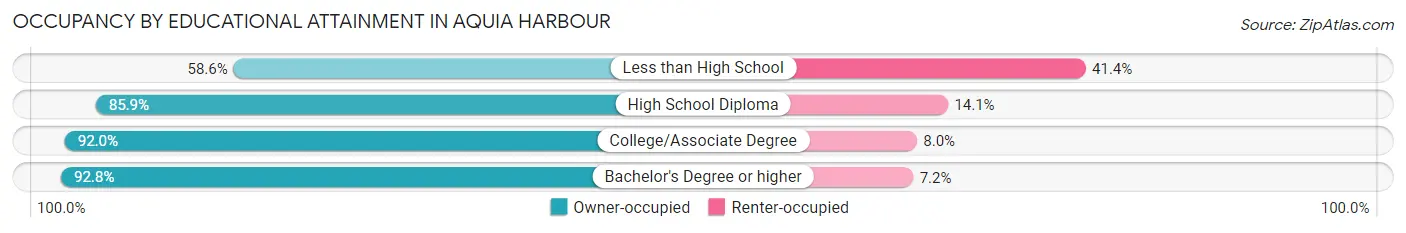
| Household Size | Owner-occupied | Renter-occupied |
| Less than High School | 41 (58.6%) | 29 (41.4%) |
| High School Diploma | 237 (85.9%) | 39 (14.1%) |
| College/Associate Degree | 554 (92.0%) | 48 (8.0%) |
| Bachelor's Degree or higher | 1,204 (92.8%) | 94 (7.2%) |
Occupancy by Age of Householder in Aquia Harbour
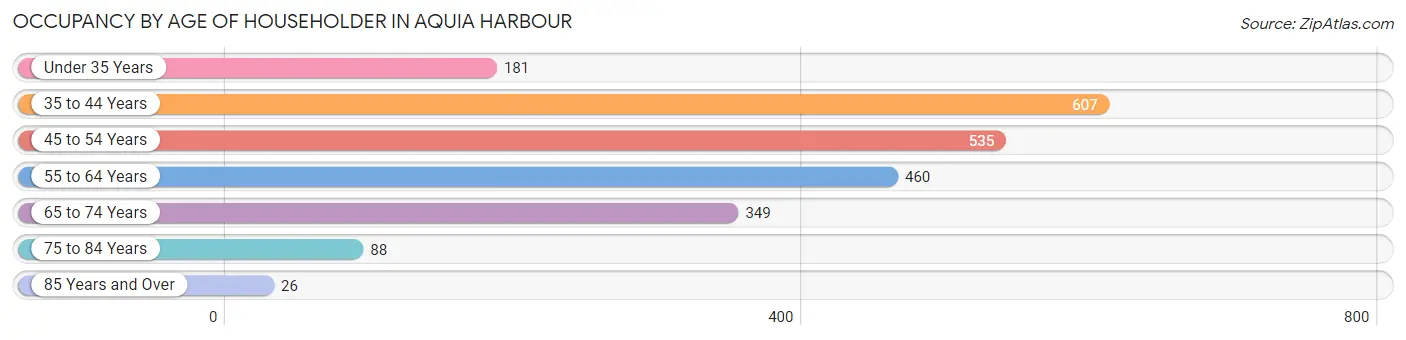
| Age Bracket | # Households | % Households |
| Under 35 Years | 181 | 8.1% |
| 35 to 44 Years | 607 | 27.0% |
| 45 to 54 Years | 535 | 23.8% |
| 55 to 64 Years | 460 | 20.5% |
| 65 to 74 Years | 349 | 15.5% |
| 75 to 84 Years | 88 | 3.9% |
| 85 Years and Over | 26 | 1.2% |
| Total | 2,246 | 100.0% |
Housing Finances in Aquia Harbour
Median Income by Occupancy in Aquia Harbour
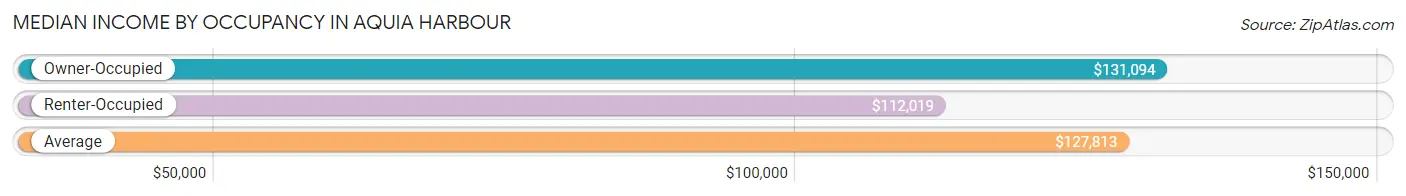
| Occupancy Type | # Households | Median Income |
| Owner-Occupied | 2,036 (90.6%) | $131,094 |
| Renter-Occupied | 210 (9.3%) | $112,019 |
| Average | 2,246 (100.0%) | $127,813 |
Occupancy by Householder Income Bracket in Aquia Harbour
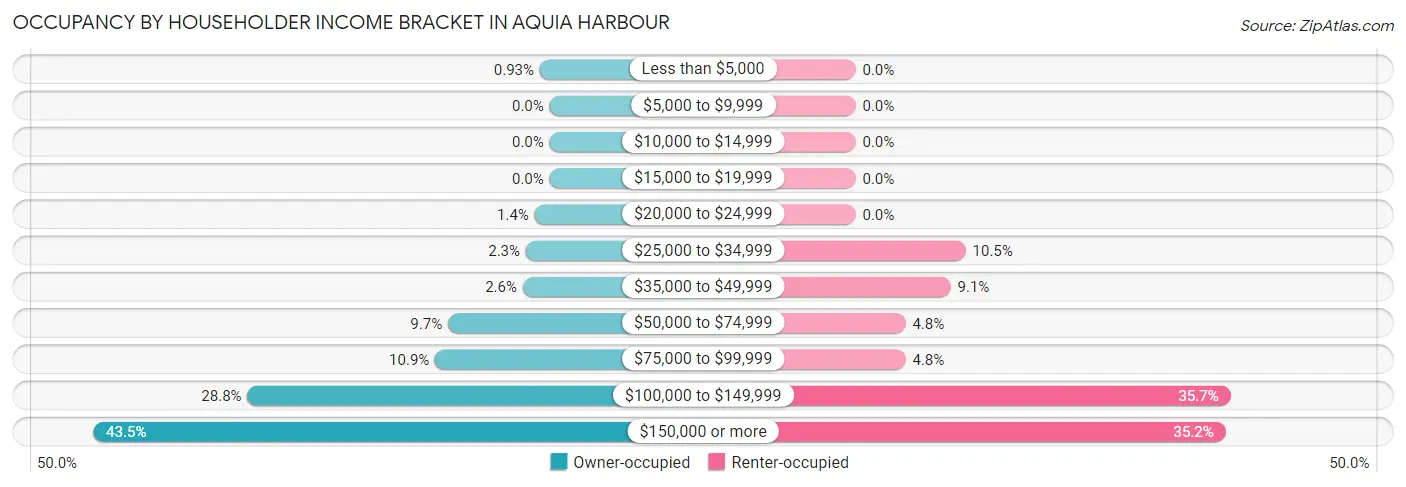
| Income Bracket | Owner-occupied | Renter-occupied |
| Less than $5,000 | 19 (0.9%) | 0 (0.0%) |
| $5,000 to $9,999 | 0 (0.0%) | 0 (0.0%) |
| $10,000 to $14,999 | 0 (0.0%) | 0 (0.0%) |
| $15,000 to $19,999 | 0 (0.0%) | 0 (0.0%) |
| $20,000 to $24,999 | 29 (1.4%) | 0 (0.0%) |
| $25,000 to $34,999 | 46 (2.3%) | 22 (10.5%) |
| $35,000 to $49,999 | 52 (2.5%) | 19 (9.0%) |
| $50,000 to $74,999 | 197 (9.7%) | 10 (4.8%) |
| $75,000 to $99,999 | 222 (10.9%) | 10 (4.8%) |
| $100,000 to $149,999 | 586 (28.8%) | 75 (35.7%) |
| $150,000 or more | 885 (43.5%) | 74 (35.2%) |
| Total | 2,036 (100.0%) | 210 (100.0%) |
Monthly Housing Cost Tiers in Aquia Harbour
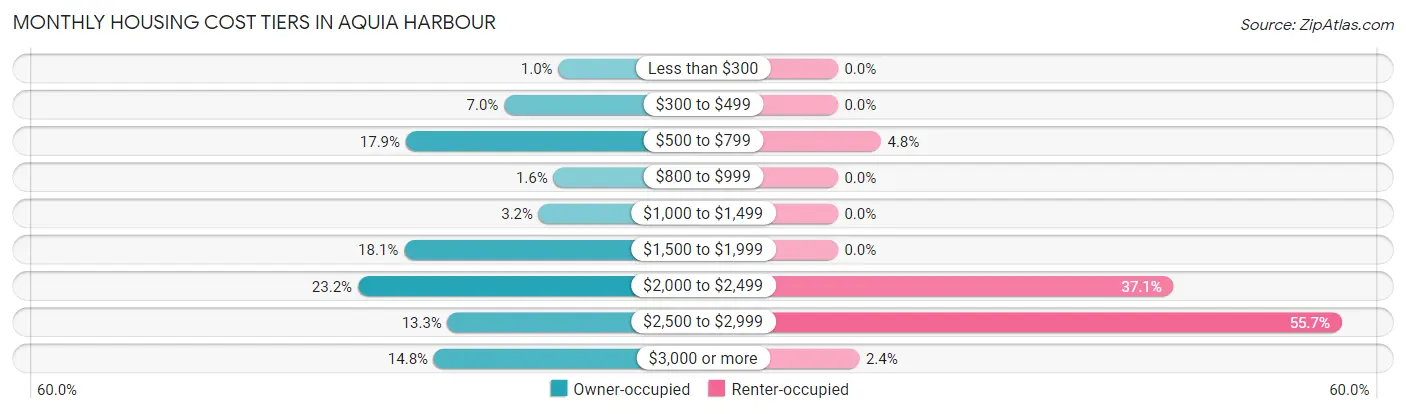
| Monthly Cost | Owner-occupied | Renter-occupied |
| Less than $300 | 21 (1.0%) | 0 (0.0%) |
| $300 to $499 | 143 (7.0%) | 0 (0.0%) |
| $500 to $799 | 364 (17.9%) | 10 (4.8%) |
| $800 to $999 | 32 (1.6%) | 0 (0.0%) |
| $1,000 to $1,499 | 65 (3.2%) | 0 (0.0%) |
| $1,500 to $1,999 | 368 (18.1%) | 0 (0.0%) |
| $2,000 to $2,499 | 472 (23.2%) | 78 (37.1%) |
| $2,500 to $2,999 | 270 (13.3%) | 117 (55.7%) |
| $3,000 or more | 301 (14.8%) | 5 (2.4%) |
| Total | 2,036 (100.0%) | 210 (100.0%) |
Physical Housing Characteristics in Aquia Harbour
Housing Structures in Aquia Harbour
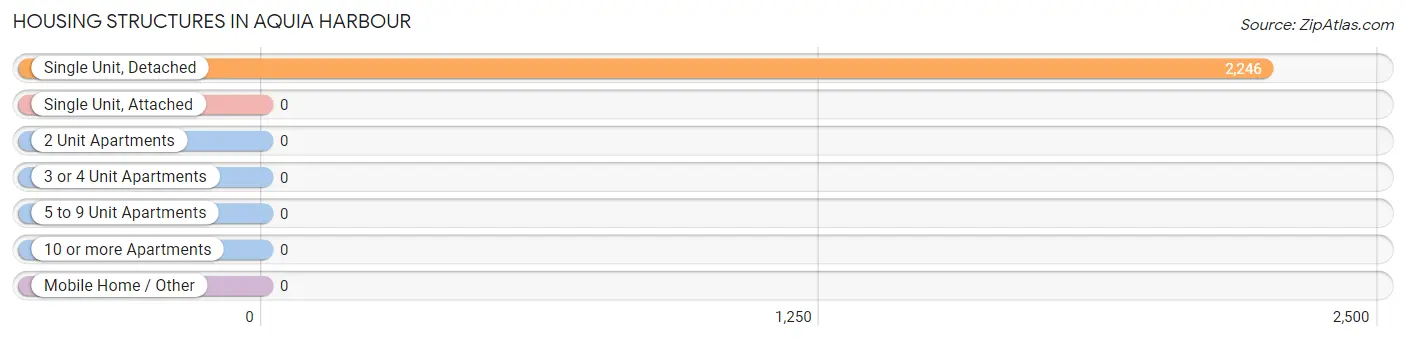
| Structure Type | # Housing Units | % Housing Units |
| Single Unit, Detached | 2,246 | 100.0% |
| Single Unit, Attached | 0 | 0.0% |
| 2 Unit Apartments | 0 | 0.0% |
| 3 or 4 Unit Apartments | 0 | 0.0% |
| 5 to 9 Unit Apartments | 0 | 0.0% |
| 10 or more Apartments | 0 | 0.0% |
| Mobile Home / Other | 0 | 0.0% |
| Total | 2,246 | 100.0% |
Housing Structures by Occupancy in Aquia Harbour
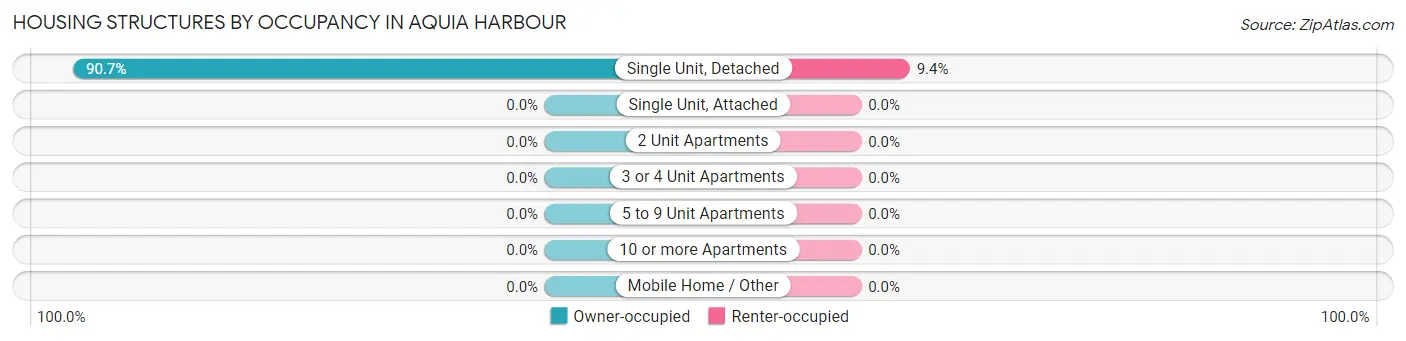
| Structure Type | Owner-occupied | Renter-occupied |
| Single Unit, Detached | 2,036 (90.6%) | 210 (9.3%) |
| Single Unit, Attached | 0 (0.0%) | 0 (0.0%) |
| 2 Unit Apartments | 0 (0.0%) | 0 (0.0%) |
| 3 or 4 Unit Apartments | 0 (0.0%) | 0 (0.0%) |
| 5 to 9 Unit Apartments | 0 (0.0%) | 0 (0.0%) |
| 10 or more Apartments | 0 (0.0%) | 0 (0.0%) |
| Mobile Home / Other | 0 (0.0%) | 0 (0.0%) |
| Total | 2,036 (90.6%) | 210 (9.3%) |
Housing Structures by Number of Rooms in Aquia Harbour
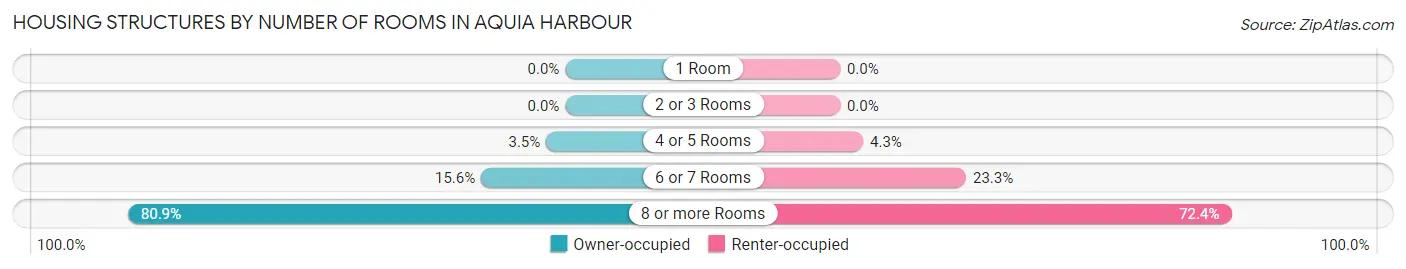
| Number of Rooms | Owner-occupied | Renter-occupied |
| 1 Room | 0 (0.0%) | 0 (0.0%) |
| 2 or 3 Rooms | 0 (0.0%) | 0 (0.0%) |
| 4 or 5 Rooms | 72 (3.5%) | 9 (4.3%) |
| 6 or 7 Rooms | 317 (15.6%) | 49 (23.3%) |
| 8 or more Rooms | 1,647 (80.9%) | 152 (72.4%) |
| Total | 2,036 (100.0%) | 210 (100.0%) |
Housing Structure by Heating Type in Aquia Harbour
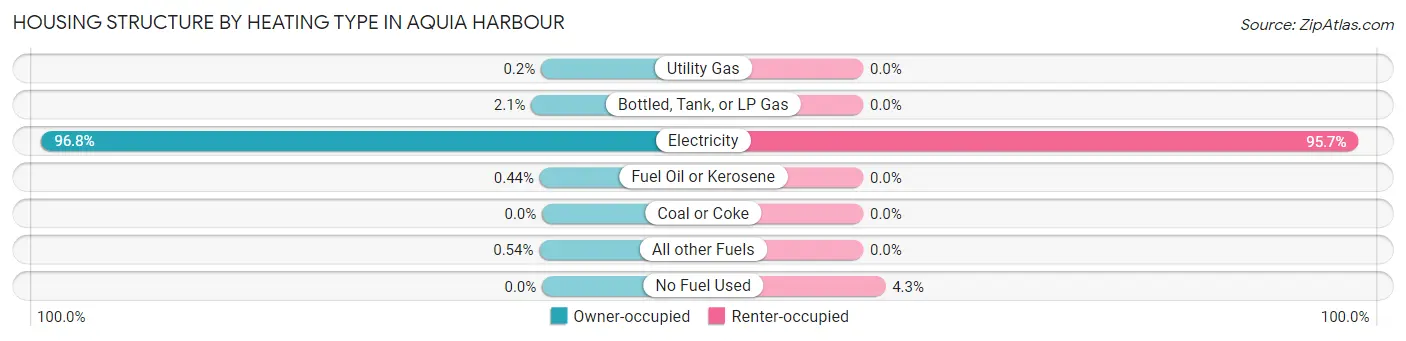
| Heating Type | Owner-occupied | Renter-occupied |
| Utility Gas | 4 (0.2%) | 0 (0.0%) |
| Bottled, Tank, or LP Gas | 42 (2.1%) | 0 (0.0%) |
| Electricity | 1,970 (96.8%) | 201 (95.7%) |
| Fuel Oil or Kerosene | 9 (0.4%) | 0 (0.0%) |
| Coal or Coke | 0 (0.0%) | 0 (0.0%) |
| All other Fuels | 11 (0.5%) | 0 (0.0%) |
| No Fuel Used | 0 (0.0%) | 9 (4.3%) |
| Total | 2,036 (100.0%) | 210 (100.0%) |
Household Vehicle Usage in Aquia Harbour
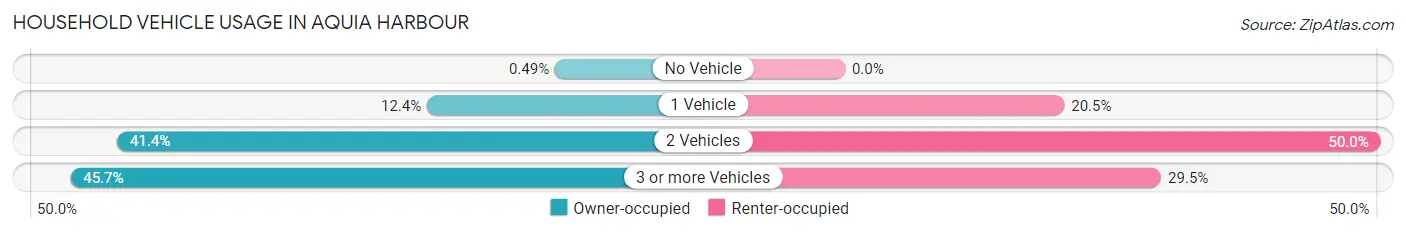
| Vehicles per Household | Owner-occupied | Renter-occupied |
| No Vehicle | 10 (0.5%) | 0 (0.0%) |
| 1 Vehicle | 253 (12.4%) | 43 (20.5%) |
| 2 Vehicles | 842 (41.4%) | 105 (50.0%) |
| 3 or more Vehicles | 931 (45.7%) | 62 (29.5%) |
| Total | 2,036 (100.0%) | 210 (100.0%) |
Real Estate & Mortgages in Aquia Harbour
Real Estate and Mortgage Overview in Aquia Harbour
| Characteristic | Without Mortgage | With Mortgage |
| Housing Units | 549 | 1,487 |
| Median Property Value | $385,800 | $433,100 |
| Median Household Income | $106,502 | $768 |
| Monthly Housing Costs | $620 | $301 |
| Real Estate Taxes | $3,212 | $33 |
Property Value by Mortgage Status in Aquia Harbour
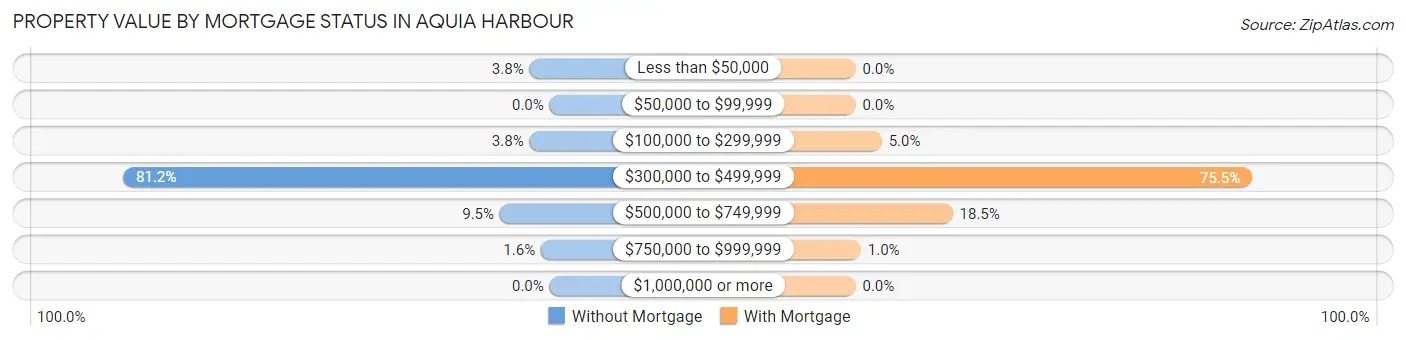
| Property Value | Without Mortgage | With Mortgage |
| Less than $50,000 | 21 (3.8%) | 0 (0.0%) |
| $50,000 to $99,999 | 0 (0.0%) | 0 (0.0%) |
| $100,000 to $299,999 | 21 (3.8%) | 74 (5.0%) |
| $300,000 to $499,999 | 446 (81.2%) | 1,123 (75.5%) |
| $500,000 to $749,999 | 52 (9.5%) | 275 (18.5%) |
| $750,000 to $999,999 | 9 (1.6%) | 15 (1.0%) |
| $1,000,000 or more | 0 (0.0%) | 0 (0.0%) |
| Total | 549 (100.0%) | 1,487 (100.0%) |
Household Income by Mortgage Status in Aquia Harbour
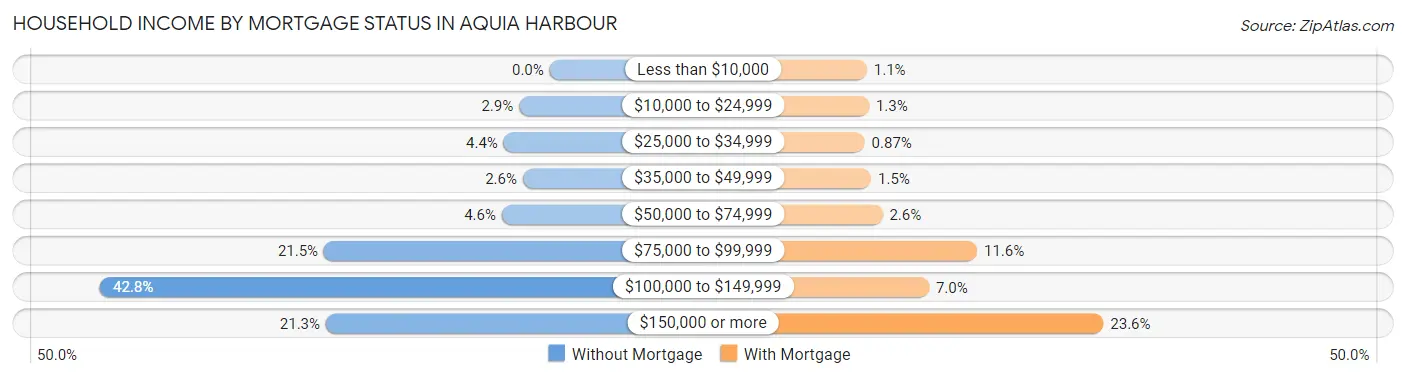
| Household Income | Without Mortgage | With Mortgage |
| Less than $10,000 | 0 (0.0%) | 16 (1.1%) |
| $10,000 to $24,999 | 16 (2.9%) | 19 (1.3%) |
| $25,000 to $34,999 | 24 (4.4%) | 13 (0.9%) |
| $35,000 to $49,999 | 14 (2.5%) | 22 (1.5%) |
| $50,000 to $74,999 | 25 (4.5%) | 38 (2.6%) |
| $75,000 to $99,999 | 118 (21.5%) | 172 (11.6%) |
| $100,000 to $149,999 | 235 (42.8%) | 104 (7.0%) |
| $150,000 or more | 117 (21.3%) | 351 (23.6%) |
| Total | 549 (100.0%) | 1,487 (100.0%) |
Property Value to Household Income Ratio in Aquia Harbour
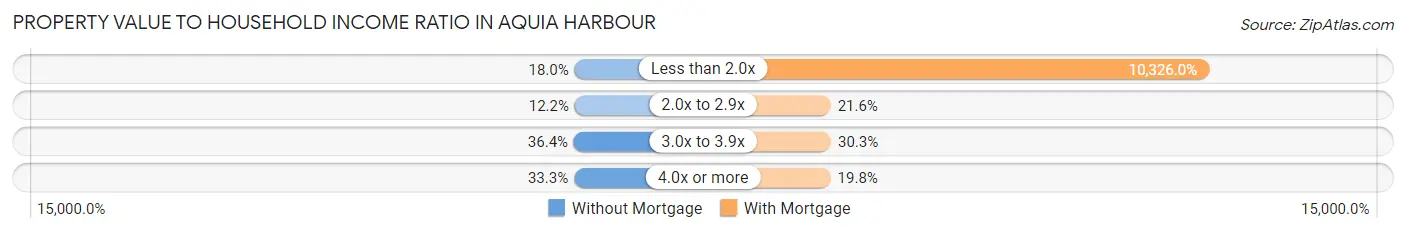
| Value-to-Income Ratio | Without Mortgage | With Mortgage |
| Less than 2.0x | 99 (18.0%) | 153,547 (10,326.0%) |
| 2.0x to 2.9x | 67 (12.2%) | 321 (21.6%) |
| 3.0x to 3.9x | 200 (36.4%) | 451 (30.3%) |
| 4.0x or more | 183 (33.3%) | 295 (19.8%) |
| Total | 549 (100.0%) | 1,487 (100.0%) |
Real Estate Taxes by Mortgage Status in Aquia Harbour
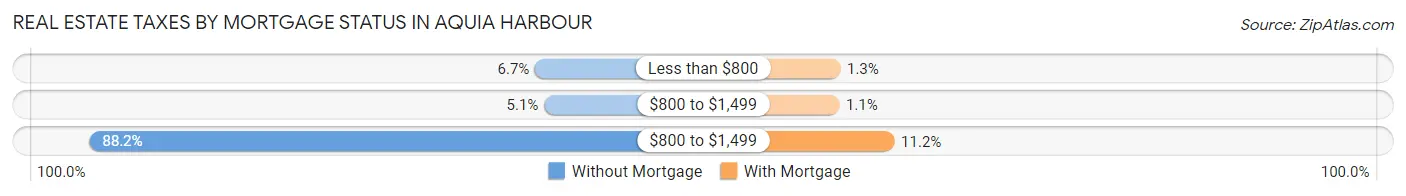
| Property Taxes | Without Mortgage | With Mortgage |
| Less than $800 | 37 (6.7%) | 19 (1.3%) |
| $800 to $1,499 | 28 (5.1%) | 16 (1.1%) |
| $800 to $1,499 | 484 (88.2%) | 166 (11.2%) |
| Total | 549 (100.0%) | 1,487 (100.0%) |
Health & Disability in Aquia Harbour
Health Insurance Coverage by Age in Aquia Harbour
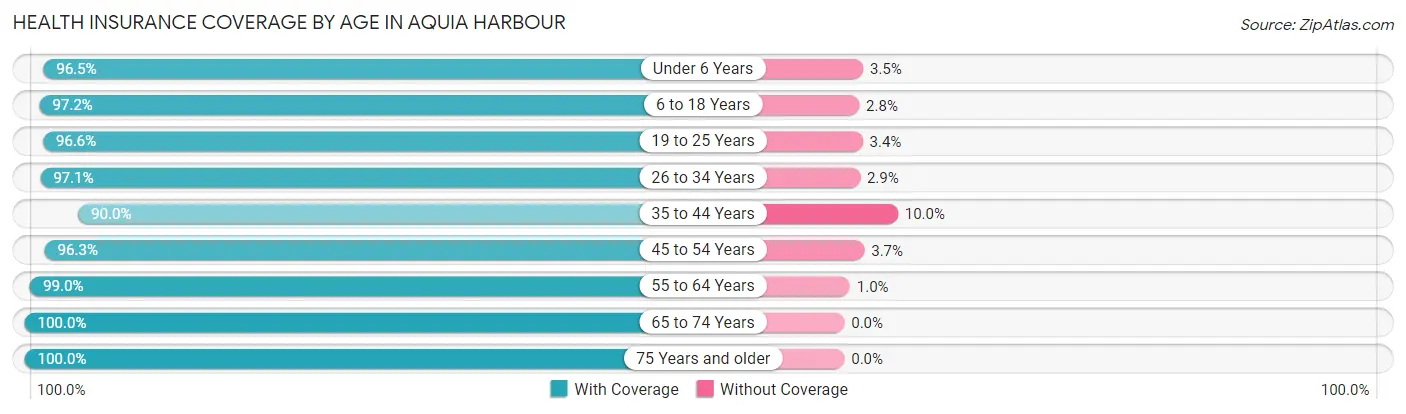
| Age Bracket | With Coverage | Without Coverage |
| Under 6 Years | 664 (96.5%) | 24 (3.5%) |
| 6 to 18 Years | 1,192 (97.2%) | 34 (2.8%) |
| 19 to 25 Years | 567 (96.6%) | 20 (3.4%) |
| 26 to 34 Years | 532 (97.1%) | 16 (2.9%) |
| 35 to 44 Years | 1,263 (90.0%) | 140 (10.0%) |
| 45 to 54 Years | 799 (96.3%) | 31 (3.7%) |
| 55 to 64 Years | 759 (99.0%) | 8 (1.0%) |
| 65 to 74 Years | 599 (100.0%) | 0 (0.0%) |
| 75 Years and older | 203 (100.0%) | 0 (0.0%) |
| Total | 6,578 (96.0%) | 273 (4.0%) |
Health Insurance Coverage by Citizenship Status in Aquia Harbour
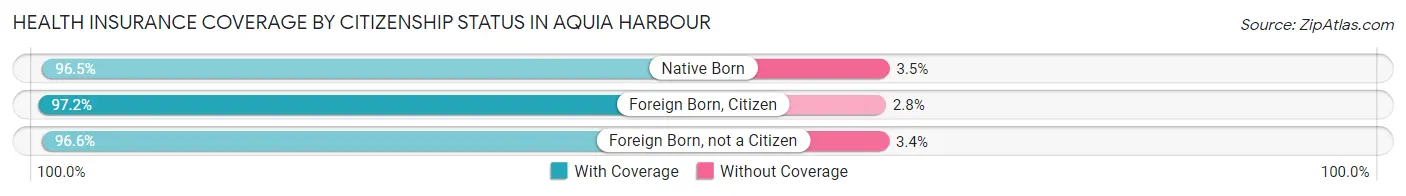
| Citizenship Status | With Coverage | Without Coverage |
| Native Born | 664 (96.5%) | 24 (3.5%) |
| Foreign Born, Citizen | 1,192 (97.2%) | 34 (2.8%) |
| Foreign Born, not a Citizen | 567 (96.6%) | 20 (3.4%) |
Health Insurance Coverage by Household Income in Aquia Harbour
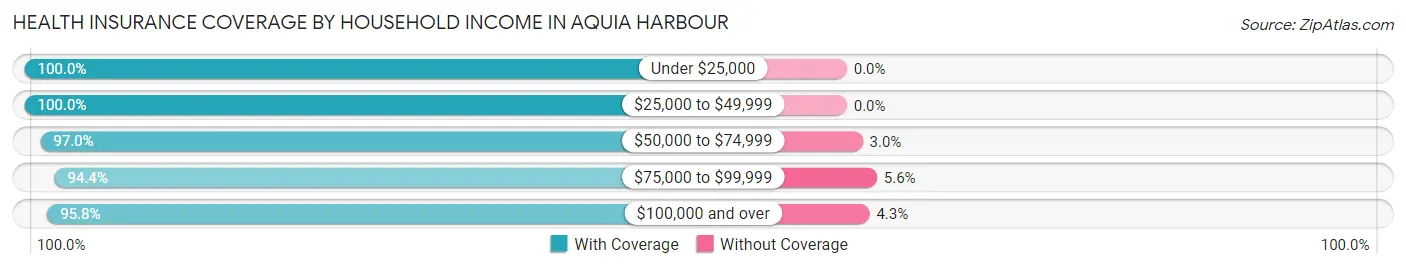
| Household Income | With Coverage | Without Coverage |
| Under $25,000 | 115 (100.0%) | 0 (0.0%) |
| $25,000 to $49,999 | 411 (100.0%) | 0 (0.0%) |
| $50,000 to $74,999 | 524 (97.0%) | 16 (3.0%) |
| $75,000 to $99,999 | 771 (94.4%) | 46 (5.6%) |
| $100,000 and over | 4,757 (95.8%) | 211 (4.3%) |
Public vs Private Health Insurance Coverage by Age in Aquia Harbour
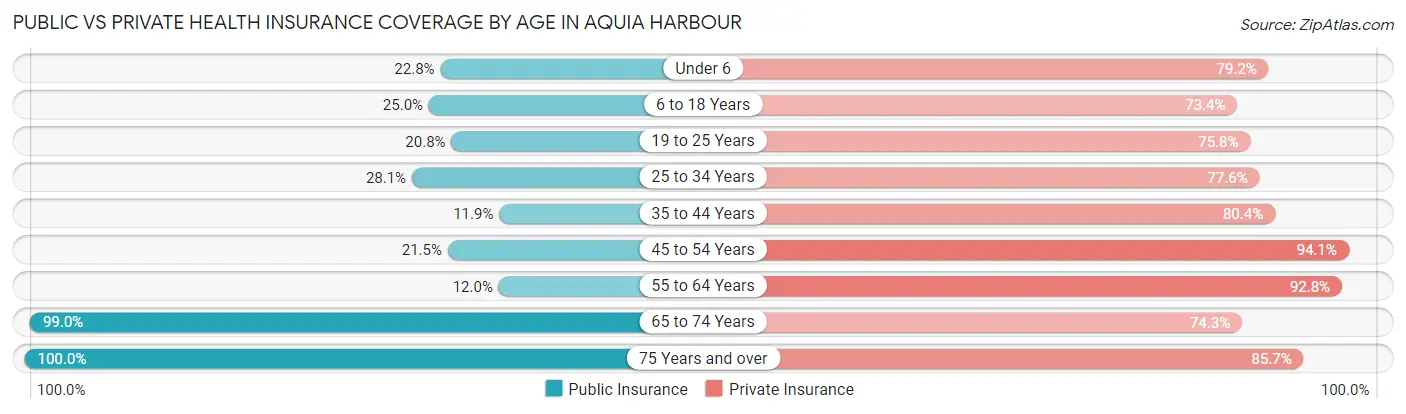
| Age Bracket | Public Insurance | Private Insurance |
| Under 6 | 157 (22.8%) | 545 (79.2%) |
| 6 to 18 Years | 306 (25.0%) | 900 (73.4%) |
| 19 to 25 Years | 122 (20.8%) | 445 (75.8%) |
| 25 to 34 Years | 154 (28.1%) | 425 (77.5%) |
| 35 to 44 Years | 167 (11.9%) | 1,128 (80.4%) |
| 45 to 54 Years | 178 (21.4%) | 781 (94.1%) |
| 55 to 64 Years | 92 (12.0%) | 712 (92.8%) |
| 65 to 74 Years | 593 (99.0%) | 445 (74.3%) |
| 75 Years and over | 203 (100.0%) | 174 (85.7%) |
| Total | 1,972 (28.8%) | 5,555 (81.1%) |
Disability Status by Sex by Age in Aquia Harbour
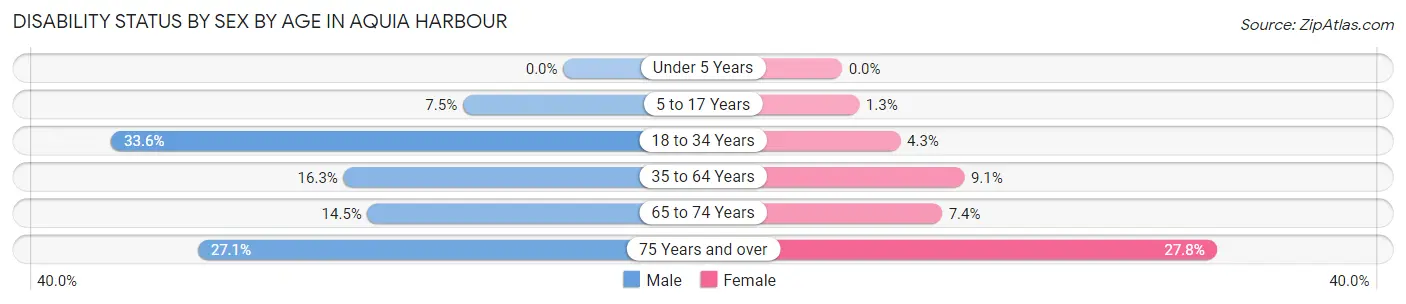
| Age Bracket | Male | Female |
| Under 5 Years | 0 (0.0%) | 0 (0.0%) |
| 5 to 17 Years | 60 (7.4%) | 6 (1.3%) |
| 18 to 34 Years | 141 (33.6%) | 33 (4.3%) |
| 35 to 64 Years | 243 (16.3%) | 137 (9.1%) |
| 65 to 74 Years | 42 (14.5%) | 23 (7.4%) |
| 75 Years and over | 19 (27.1%) | 37 (27.8%) |
Disability Class by Sex by Age in Aquia Harbour
Disability Class: Hearing Difficulty
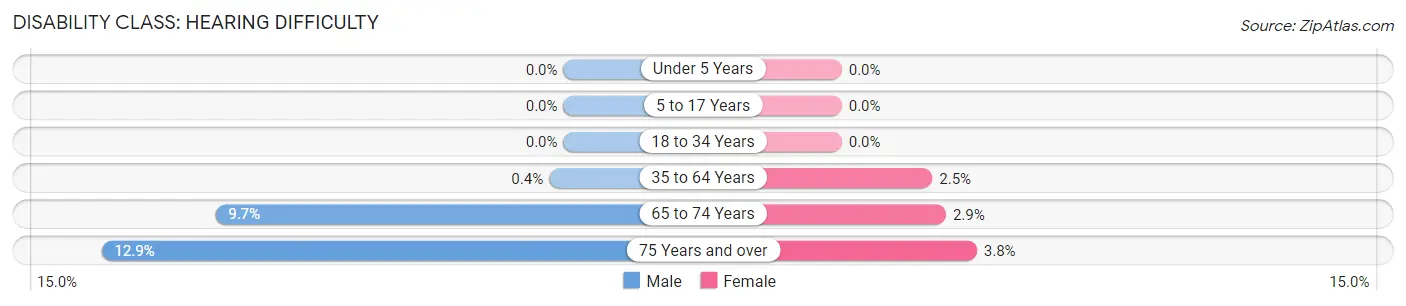
| Age Bracket | Male | Female |
| Under 5 Years | 0 (0.0%) | 0 (0.0%) |
| 5 to 17 Years | 0 (0.0%) | 0 (0.0%) |
| 18 to 34 Years | 0 (0.0%) | 0 (0.0%) |
| 35 to 64 Years | 6 (0.4%) | 38 (2.5%) |
| 65 to 74 Years | 28 (9.7%) | 9 (2.9%) |
| 75 Years and over | 9 (12.9%) | 5 (3.8%) |
Disability Class: Vision Difficulty
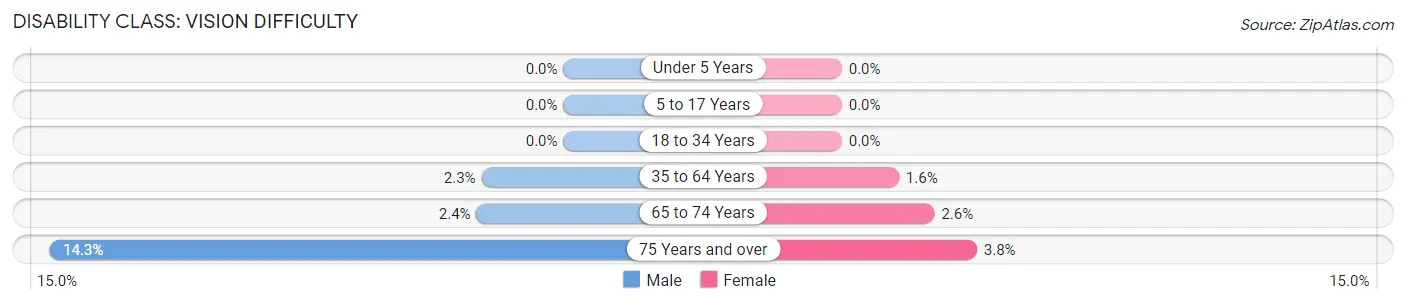
| Age Bracket | Male | Female |
| Under 5 Years | 0 (0.0%) | 0 (0.0%) |
| 5 to 17 Years | 0 (0.0%) | 0 (0.0%) |
| 18 to 34 Years | 0 (0.0%) | 0 (0.0%) |
| 35 to 64 Years | 34 (2.3%) | 24 (1.6%) |
| 65 to 74 Years | 7 (2.4%) | 8 (2.6%) |
| 75 Years and over | 10 (14.3%) | 5 (3.8%) |
Disability Class: Cognitive Difficulty
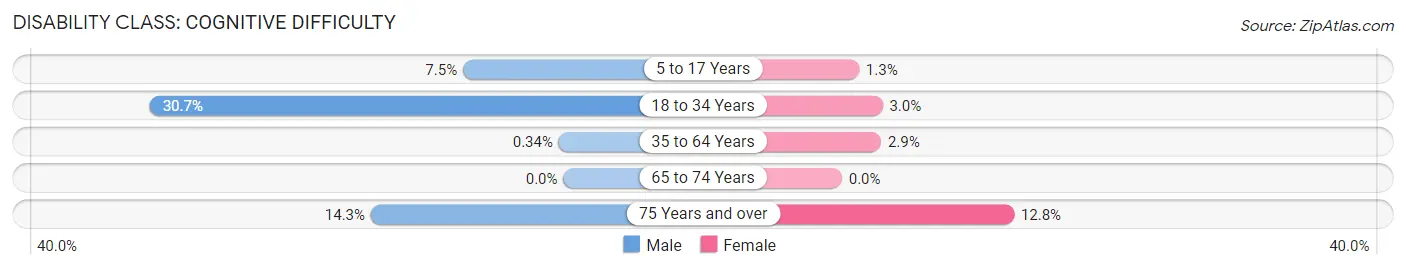
| Age Bracket | Male | Female |
| 5 to 17 Years | 60 (7.4%) | 6 (1.3%) |
| 18 to 34 Years | 129 (30.7%) | 23 (3.0%) |
| 35 to 64 Years | 5 (0.3%) | 44 (2.9%) |
| 65 to 74 Years | 0 (0.0%) | 0 (0.0%) |
| 75 Years and over | 10 (14.3%) | 17 (12.8%) |
Disability Class: Ambulatory Difficulty
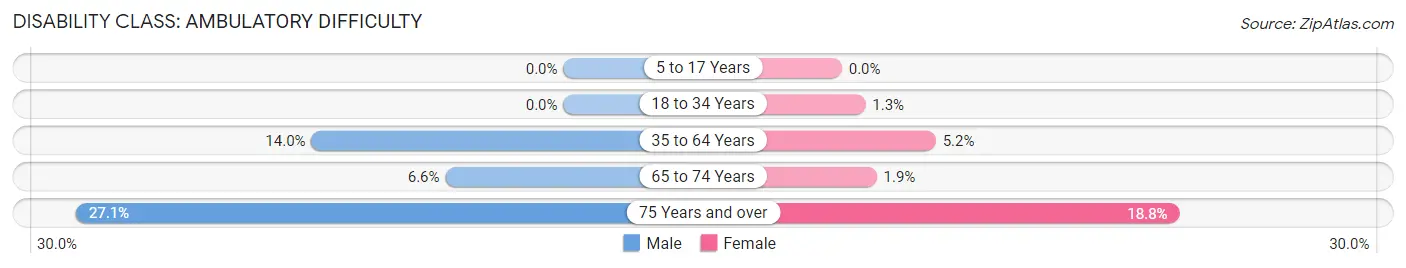
| Age Bracket | Male | Female |
| 5 to 17 Years | 0 (0.0%) | 0 (0.0%) |
| 18 to 34 Years | 0 (0.0%) | 10 (1.3%) |
| 35 to 64 Years | 209 (14.0%) | 79 (5.2%) |
| 65 to 74 Years | 19 (6.6%) | 6 (1.9%) |
| 75 Years and over | 19 (27.1%) | 25 (18.8%) |
Disability Class: Self-Care Difficulty
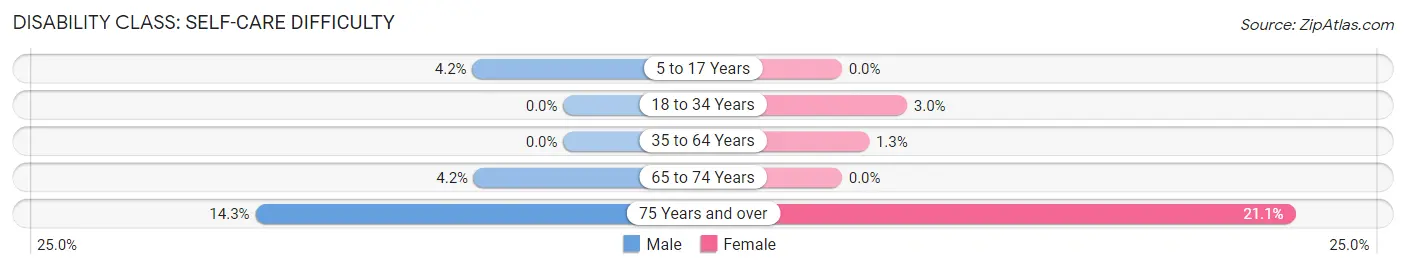
| Age Bracket | Male | Female |
| 5 to 17 Years | 34 (4.2%) | 0 (0.0%) |
| 18 to 34 Years | 0 (0.0%) | 23 (3.0%) |
| 35 to 64 Years | 0 (0.0%) | 19 (1.3%) |
| 65 to 74 Years | 12 (4.2%) | 0 (0.0%) |
| 75 Years and over | 10 (14.3%) | 28 (21.0%) |
Technology Access in Aquia Harbour
Computing Device Access in Aquia Harbour
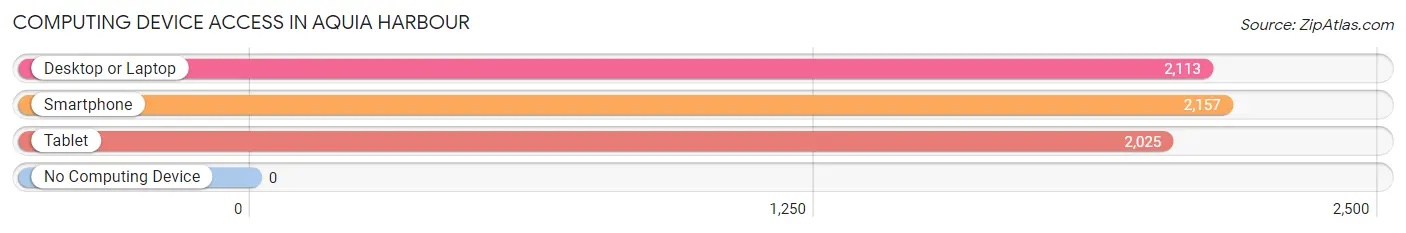
| Device Type | # Households | % Households |
| Desktop or Laptop | 2,113 | 94.1% |
| Smartphone | 2,157 | 96.0% |
| Tablet | 2,025 | 90.2% |
| No Computing Device | 0 | 0.0% |
| Total | 2,246 | 100.0% |
Internet Access in Aquia Harbour
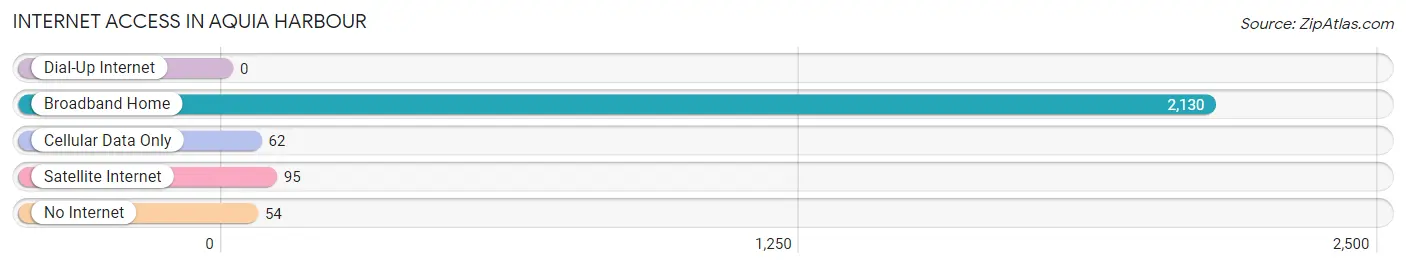
| Internet Type | # Households | % Households |
| Dial-Up Internet | 0 | 0.0% |
| Broadband Home | 2,130 | 94.8% |
| Cellular Data Only | 62 | 2.8% |
| Satellite Internet | 95 | 4.2% |
| No Internet | 54 | 2.4% |
| Total | 2,246 | 100.0% |
Aquia Harbour Summary
Aquia Harbour is a census-designated place (CDP) located in Stafford County, Virginia, United States. It is situated on the Potomac River, approximately 25 miles south of Washington, D.C. The population of Aquia Harbour was 2,945 at the 2010 census.
History
Aquia Harbour was first settled in the early 1700s by the Aquia Indians, who were part of the Powhatan Confederacy. The area was later settled by English colonists in the 1730s. The town was named after the Aquia Creek, which was named after the Aquia Indians.
In 1755, the town was the site of a skirmish between the British and French forces during the French and Indian War. During the American Civil War, Aquia Harbour was the site of a Confederate fortification.
Geography
Aquia Harbour is located at 38°27'25" North, 77°20'45" West (38.456944, -77.345833). According to the United States Census Bureau, the CDP has a total area of 4.2 square miles (10.8 km2), of which 4.1 square miles (10.6 km2) is land and 0.1 square mile (0.2 km2) is water.
Economy
Aquia Harbour is primarily a residential community, with a few small businesses located in the area. The main industry in the area is tourism, with many visitors coming to the area to enjoy the waterfront views and recreational activities.
Demographics
As of the 2010 census, there were 2,945 people, 1,093 households, and 845 families residing in the CDP. The population density was 717.3 people per square mile (277.2/km2). There were 1,183 housing units at an average density of 288.3 per square mile (111.3/km2). The racial makeup of the CDP was 87.2% White, 6.2% African American, 0.3% Native American, 1.2% Asian, 0.1% Pacific Islander, 2.2% from other races, and 2.9% from two or more races. Hispanic or Latino of any race were 5.2% of the population.
There were 1,093 households, out of which 33.2% had children under the age of 18 living with them, 62.2% were married couples living together, 8.7% had a female householder with no husband present, and 24.7% were non-families. 19.7% of all households were made up of individuals, and 6.2% had someone living alone who was 65 years of age or older. The average household size was 2.69 and the average family size was 3.09.
In the CDP, the population was spread out, with 25.2% under the age of 18, 6.2% from 18 to 24, 28.2% from 25 to 44, 28.2% from 45 to 64, and 12.2% who were 65 years of age or older. The median age was 39 years. For every 100 females, there were 97.2 males. For every 100 females age 18 and over, there were 94.2 males.
The median income for a household in the CDP was $76,944, and the median income for a family was $83,958. Males had a median income of $60,000 versus $41,250 for females. The per capita income for the CDP was $32,945. About 2.2% of families and 3.2% of the population were below the poverty line, including 4.2% of those under age 18 and none of those age 65 or over.
Common Questions
What is Per Capita Income in Aquia Harbour?
Per Capita income in Aquia Harbour is $50,303.
What is the Median Family Income in Aquia Harbour?
Median Family Income in Aquia Harbour is $143,125.
What is the Median Household income in Aquia Harbour?
Median Household Income in Aquia Harbour is $127,813.
What is Income or Wage Gap in Aquia Harbour?
Income or Wage Gap in Aquia Harbour is 57.8%.
Women in Aquia Harbour earn 42.2 cents for every dollar earned by a man.
What is Inequality or Gini Index in Aquia Harbour?
Inequality or Gini Index in Aquia Harbour is 0.32.
What is the Total Population of Aquia Harbour?
Total Population of Aquia Harbour is 6,947.
What is the Total Male Population of Aquia Harbour?
Total Male Population of Aquia Harbour is 3,470.
What is the Total Female Population of Aquia Harbour?
Total Female Population of Aquia Harbour is 3,477.
What is the Ratio of Males per 100 Females in Aquia Harbour?
There are 99.80 Males per 100 Females in Aquia Harbour.
What is the Ratio of Females per 100 Males in Aquia Harbour?
There are 100.20 Females per 100 Males in Aquia Harbour.
What is the Median Population Age in Aquia Harbour?
Median Population Age in Aquia Harbour is 37.6 Years.
What is the Average Family Size in Aquia Harbour
Average Family Size in Aquia Harbour is 3.5 People.
What is the Average Household Size in Aquia Harbour
Average Household Size in Aquia Harbour is 3.1 People.
How Large is the Labor Force in Aquia Harbour?
There are 3,467 People in the Labor Forcein in Aquia Harbour.
What is the Percentage of People in the Labor Force in Aquia Harbour?
65.1% of People are in the Labor Force in Aquia Harbour.
What is the Unemployment Rate in Aquia Harbour?
Unemployment Rate in Aquia Harbour is 3.6%.