Zip Codes with the Highest Percentage of Population Employed in Life, Physical & Social Science in Danville, VA
RELATED REPORTS & OPTIONS
Life, Physical & Social Science
Danville
Compare Zip Codes
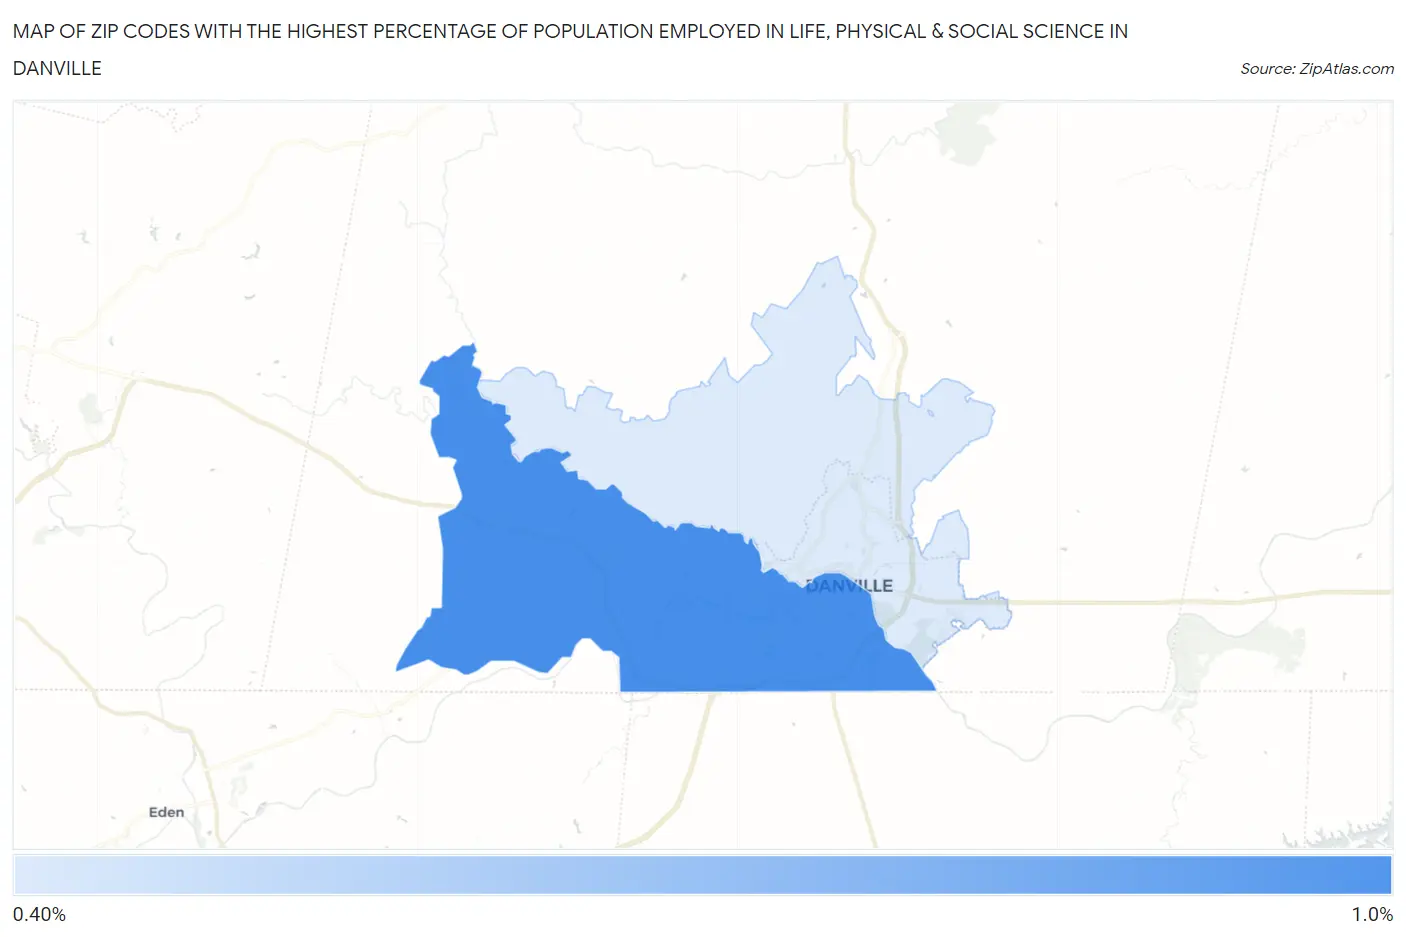
Map of Zip Codes with the Highest Percentage of Population Employed in Life, Physical & Social Science in Danville
0.46%
0.84%
Zip Codes with the Highest Percentage of Population Employed in Life, Physical & Social Science in Danville, VA
| Zip Code | % Employed | vs State | vs National | |
| 1. | 24541 | 0.84% | 1.3%(-0.433)#300 | 1.1%(-0.247)#10,542 |
| 2. | 24540 | 0.46% | 1.3%(-0.814)#412 | 1.1%(-0.628)#14,979 |
1
Common Questions
What are the Top Zip Codes with the Highest Percentage of Population Employed in Life, Physical & Social Science in Danville, VA?
Top Zip Codes with the Highest Percentage of Population Employed in Life, Physical & Social Science in Danville, VA are:
What zip code has the Highest Percentage of Population Employed in Life, Physical & Social Science in Danville, VA?
24541 has the Highest Percentage of Population Employed in Life, Physical & Social Science in Danville, VA with 0.84%.
What is the Percentage of Population Employed in Life, Physical & Social Science in Danville, VA?
Percentage of Population Employed in Life, Physical & Social Science in Danville is 0.55%.
What is the Percentage of Population Employed in Life, Physical & Social Science in Virginia?
Percentage of Population Employed in Life, Physical & Social Science in Virginia is 1.3%.
What is the Percentage of Population Employed in Life, Physical & Social Science in the United States?
Percentage of Population Employed in Life, Physical & Social Science in the United States is 1.1%.