Blacksburg, VA Map & Demographics
Blacksburg Map
Blacksburg Overview
$25,268
PER CAPITA INCOME
$113,723
AVG FAMILY INCOME
$42,012
AVG HOUSEHOLD INCOME
21.0%
WAGE / INCOME GAP [ % ]
79.0¢/ $1
WAGE / INCOME GAP [ $ ]
0.61
INEQUALITY / GINI INDEX
45,147
TOTAL POPULATION
24,792
MALE POPULATION
20,355
FEMALE POPULATION
121.80
MALES / 100 FEMALES
82.10
FEMALES / 100 MALES
21.7
MEDIAN AGE
3.0
AVG FAMILY SIZE
2.6
AVG HOUSEHOLD SIZE
19,690
LABOR FORCE [ PEOPLE ]
47.7%
PERCENT IN LABOR FORCE
3.4%
UNEMPLOYMENT RATE
Blacksburg Area Codes
Income in Blacksburg
Income Overview in Blacksburg
Per Capita Income in Blacksburg is $25,268, while median incomes of families and households are $113,723 and $42,012 respectively.
| Characteristic | Number | Measure |
| Per Capita Income | 45,147 | $25,268 |
| Median Family Income | 4,818 | $113,723 |
| Mean Family Income | 4,818 | $146,384 |
| Median Household Income | 13,318 | $42,012 |
| Mean Household Income | 13,318 | $77,518 |
| Income Deficit | 4,818 | $0 |
| Wage / Income Gap (%) | 45,147 | 21.00% |
| Wage / Income Gap ($) | 45,147 | 79.00¢ per $1 |
| Gini / Inequality Index | 45,147 | 0.61 |
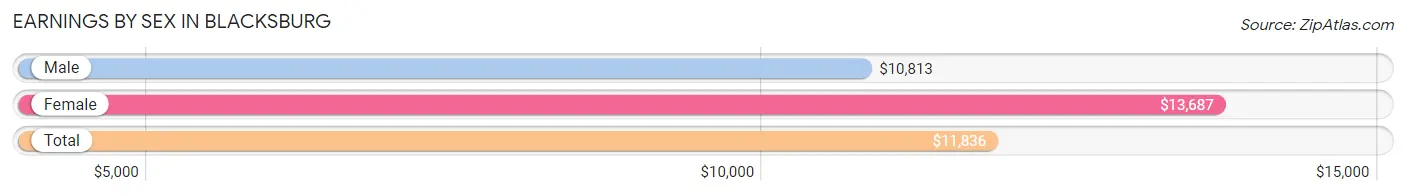
Earnings by Sex in Blacksburg
Average Earnings in Blacksburg are $11,836, $10,813 for men and $13,687 for women, a difference of 21.0%.
| Sex | Number | Average Earnings |
| Male | 15,135 (58.3%) | $10,813 |
| Female | 10,849 (41.7%) | $13,687 |
| Total | 25,984 (100.0%) | $11,836 |
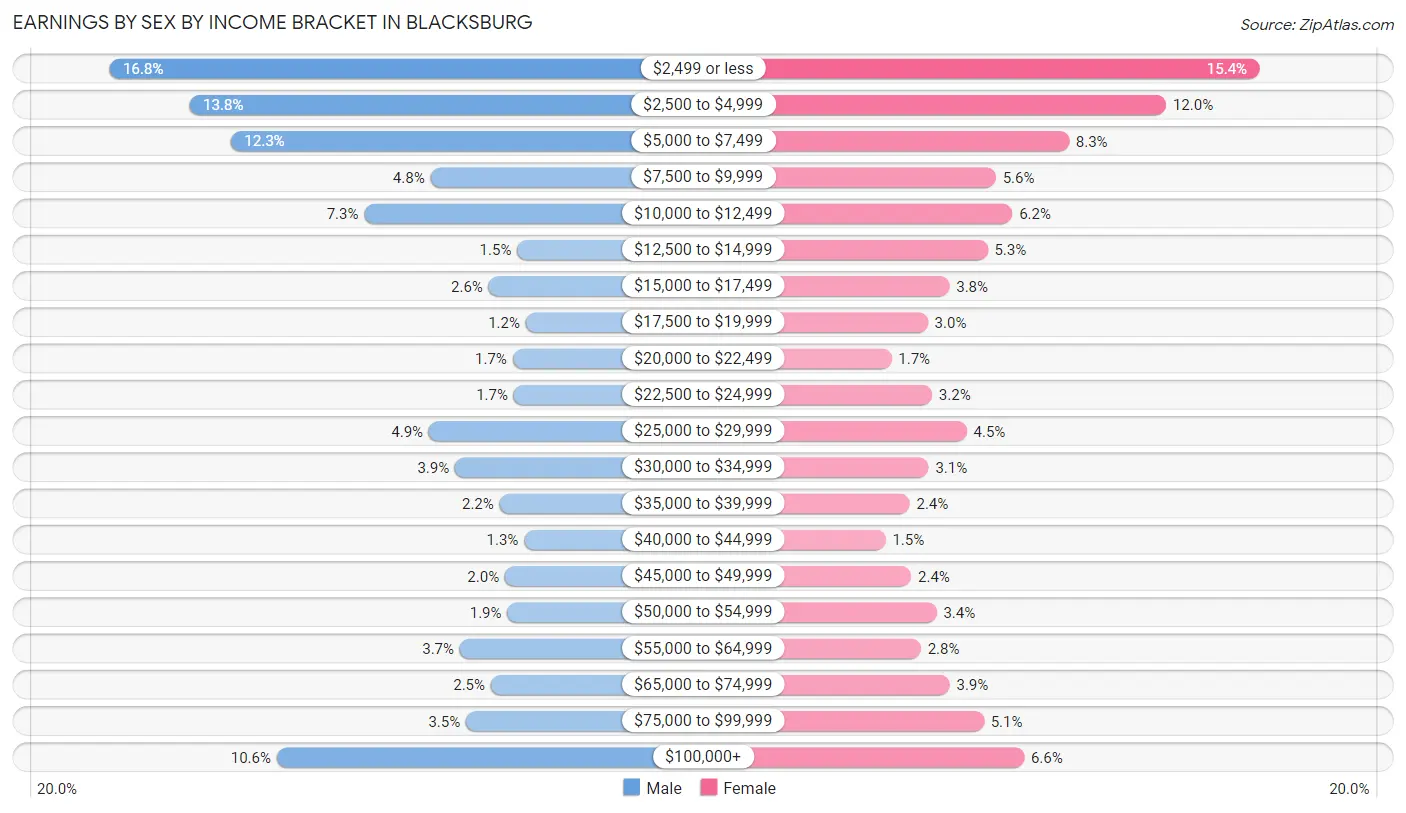
Earnings by Sex by Income Bracket in Blacksburg
The most common earnings brackets in Blacksburg are $2,499 or less for men (2,542 | 16.8%) and $2,499 or less for women (1,675 | 15.4%).
| Income | Male | Female |
| $2,499 or less | 2,542 (16.8%) | 1,675 (15.4%) |
| $2,500 to $4,999 | 2,089 (13.8%) | 1,297 (12.0%) |
| $5,000 to $7,499 | 1,854 (12.2%) | 903 (8.3%) |
| $7,500 to $9,999 | 725 (4.8%) | 605 (5.6%) |
| $10,000 to $12,499 | 1,100 (7.3%) | 673 (6.2%) |
| $12,500 to $14,999 | 233 (1.5%) | 572 (5.3%) |
| $15,000 to $17,499 | 395 (2.6%) | 417 (3.8%) |
| $17,500 to $19,999 | 185 (1.2%) | 329 (3.0%) |
| $20,000 to $22,499 | 259 (1.7%) | 181 (1.7%) |
| $22,500 to $24,999 | 253 (1.7%) | 346 (3.2%) |
| $25,000 to $29,999 | 734 (4.9%) | 487 (4.5%) |
| $30,000 to $34,999 | 586 (3.9%) | 332 (3.1%) |
| $35,000 to $39,999 | 333 (2.2%) | 255 (2.4%) |
| $40,000 to $44,999 | 194 (1.3%) | 157 (1.5%) |
| $45,000 to $49,999 | 303 (2.0%) | 261 (2.4%) |
| $50,000 to $54,999 | 289 (1.9%) | 364 (3.4%) |
| $55,000 to $64,999 | 558 (3.7%) | 300 (2.8%) |
| $65,000 to $74,999 | 383 (2.5%) | 418 (3.8%) |
| $75,000 to $99,999 | 524 (3.5%) | 557 (5.1%) |
| $100,000+ | 1,596 (10.5%) | 720 (6.6%) |
| Total | 15,135 (100.0%) | 10,849 (100.0%) |
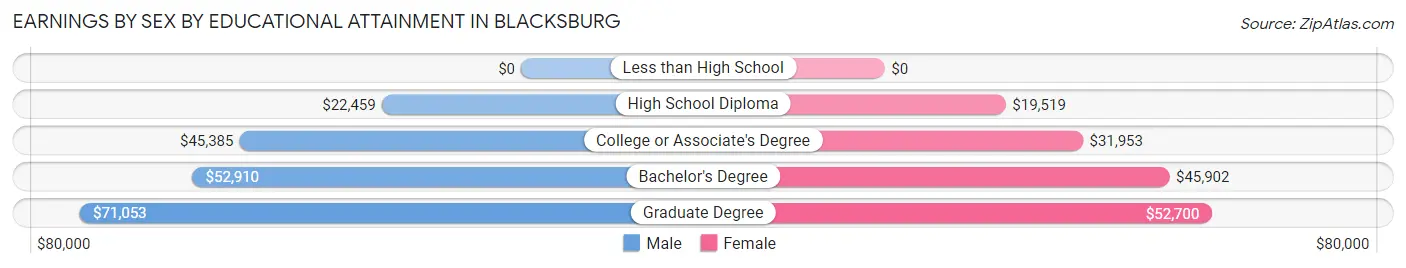
Earnings by Sex by Educational Attainment in Blacksburg
Average earnings in Blacksburg are $54,965 for men and $45,886 for women, a difference of 16.5%. Men with an educational attainment of graduate degree enjoy the highest average annual earnings of $71,053, while those with high school diploma education earn the least with $22,459. Women with an educational attainment of graduate degree earn the most with the average annual earnings of $52,700, while those with high school diploma education have the smallest earnings of $19,519.
| Educational Attainment | Male Income | Female Income |
| Less than High School | - | - |
| High School Diploma | $22,459 | $19,519 |
| College or Associate's Degree | $45,385 | $31,953 |
| Bachelor's Degree | $52,910 | $45,902 |
| Graduate Degree | $71,053 | $52,700 |
| Total | $54,965 | $45,886 |
Family Income in Blacksburg
Family Income Brackets in Blacksburg
According to the Blacksburg family income data, there are 1,070 families falling into the $200,000+ income range, which is the most common income bracket and makes up 22.2% of all families. Conversely, the $10,000 to $14,999 income bracket is the least frequent group with only 120 families (2.5%) belonging to this category.
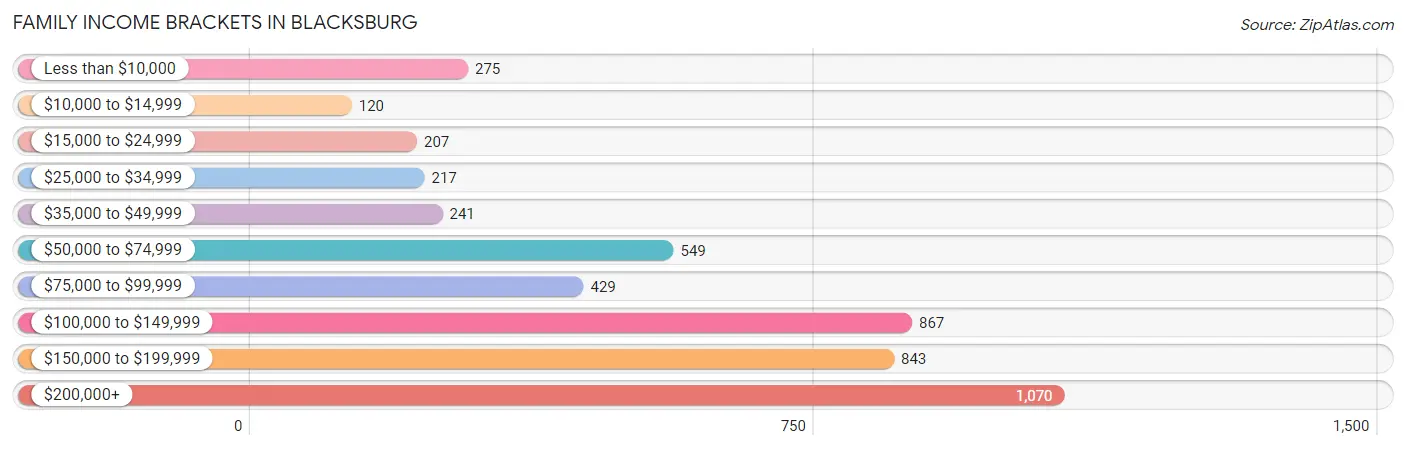
| Income Bracket | # Families | % Families |
| Less than $10,000 | 275 | 5.7% |
| $10,000 to $14,999 | 120 | 2.5% |
| $15,000 to $24,999 | 207 | 4.3% |
| $25,000 to $34,999 | 217 | 4.5% |
| $35,000 to $49,999 | 241 | 5.0% |
| $50,000 to $74,999 | 549 | 11.4% |
| $75,000 to $99,999 | 429 | 8.9% |
| $100,000 to $149,999 | 867 | 18.0% |
| $150,000 to $199,999 | 843 | 17.5% |
| $200,000+ | 1,070 | 22.2% |
Family Income by Famaliy Size in Blacksburg
4-person families (928 | 19.3%) account for the highest median family income in Blacksburg with $159,811 per family, while 2-person families (2,289 | 47.5%) have the highest median income of $52,311 per family member.
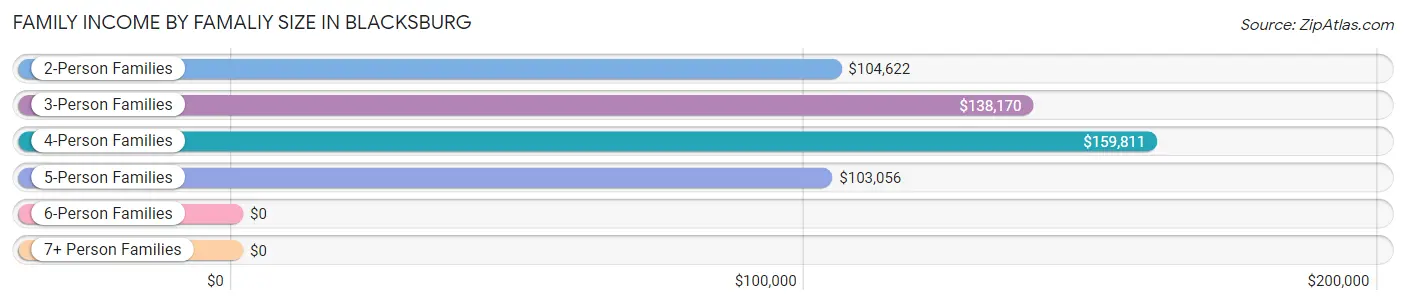
| Income Bracket | # Families | Median Income |
| 2-Person Families | 2,289 (47.5%) | $104,622 |
| 3-Person Families | 1,099 (22.8%) | $138,170 |
| 4-Person Families | 928 (19.3%) | $159,811 |
| 5-Person Families | 320 (6.6%) | $103,056 |
| 6-Person Families | 139 (2.9%) | $0 |
| 7+ Person Families | 43 (0.9%) | $0 |
| Total | 4,818 (100.0%) | $113,723 |
Family Income by Number of Earners in Blacksburg
The median family income in Blacksburg is $113,723, with families comprising 3+ earners (311) having the highest median family income of $182,802, while families with no earners (701) have the lowest median family income of $71,875, accounting for 6.5% and 14.5% of families, respectively.
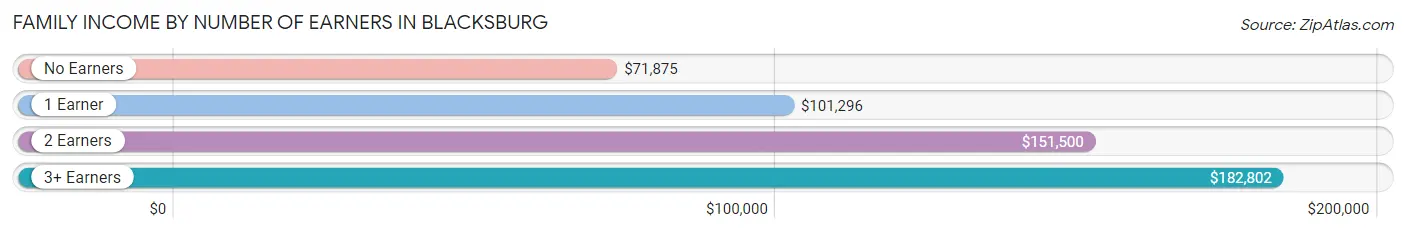
| Number of Earners | # Families | Median Income |
| No Earners | 701 (14.5%) | $71,875 |
| 1 Earner | 1,848 (38.4%) | $101,296 |
| 2 Earners | 1,958 (40.6%) | $151,500 |
| 3+ Earners | 311 (6.5%) | $182,802 |
| Total | 4,818 (100.0%) | $113,723 |
Household Income in Blacksburg
Household Income Brackets in Blacksburg
With 3,330 households falling in the category, the less than $10,000 income range is the most frequent in Blacksburg, accounting for 25.0% of all households. In contrast, only 679 households (5.1%) fall into the $10,000 to $14,999 income bracket, making it the least populous group.
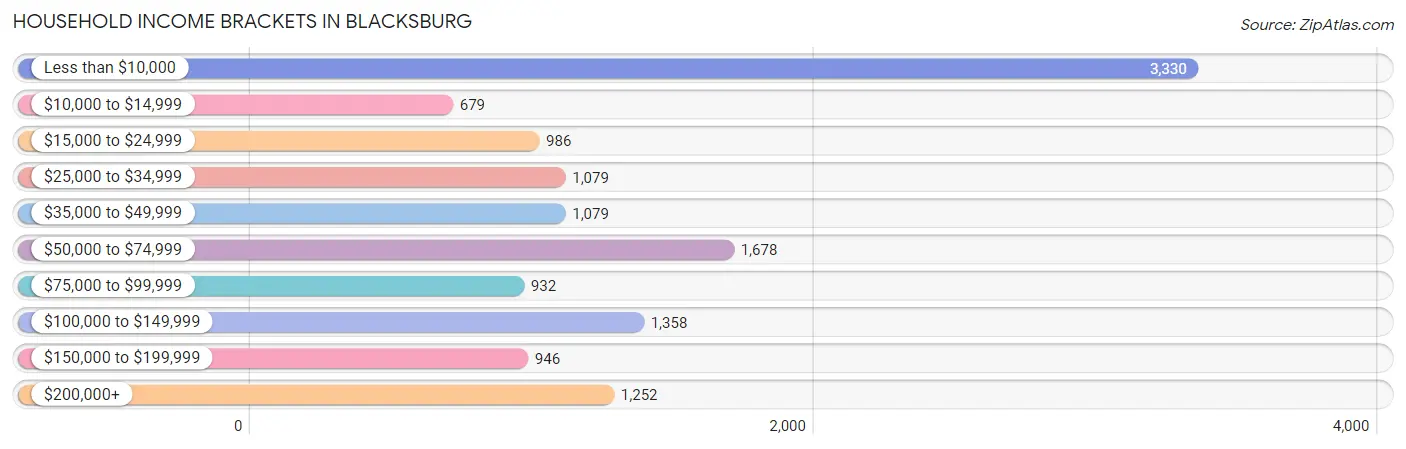
| Income Bracket | # Households | % Households |
| Less than $10,000 | 3,330 | 25.0% |
| $10,000 to $14,999 | 679 | 5.1% |
| $15,000 to $24,999 | 986 | 7.4% |
| $25,000 to $34,999 | 1,079 | 8.1% |
| $35,000 to $49,999 | 1,079 | 8.1% |
| $50,000 to $74,999 | 1,678 | 12.6% |
| $75,000 to $99,999 | 932 | 7.0% |
| $100,000 to $149,999 | 1,358 | 10.2% |
| $150,000 to $199,999 | 946 | 7.1% |
| $200,000+ | 1,252 | 9.4% |
Household Income by Householder Age in Blacksburg
The median household income in Blacksburg is $42,012, with the highest median household income of $104,114 found in the 45 to 64 years age bracket for the primary householder. A total of 2,455 households (18.4%) fall into this category. Meanwhile, the 15 to 24 years age bracket for the primary householder has the lowest median household income of $7,818, with 4,303 households (32.3%) in this group.
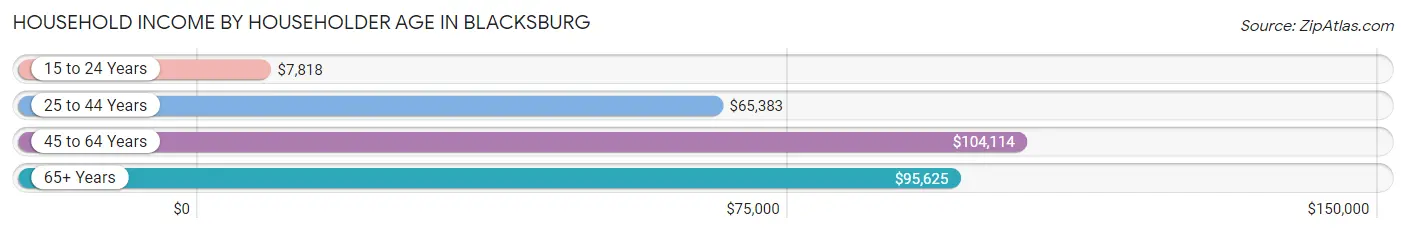
| Income Bracket | # Households | Median Income |
| 15 to 24 Years | 4,303 (32.3%) | $7,818 |
| 25 to 44 Years | 4,531 (34.0%) | $65,383 |
| 45 to 64 Years | 2,455 (18.4%) | $104,114 |
| 65+ Years | 2,029 (15.2%) | $95,625 |
| Total | 13,318 (100.0%) | $42,012 |
Poverty in Blacksburg
Income Below Poverty by Sex and Age in Blacksburg
With 47.0% poverty level for males and 43.0% for females among the residents of Blacksburg, 18 to 24 year old males and 18 to 24 year old females are the most vulnerable to poverty, with 7,544 males (84.6%) and 5,429 females (87.3%) in their respective age groups living below the poverty level.
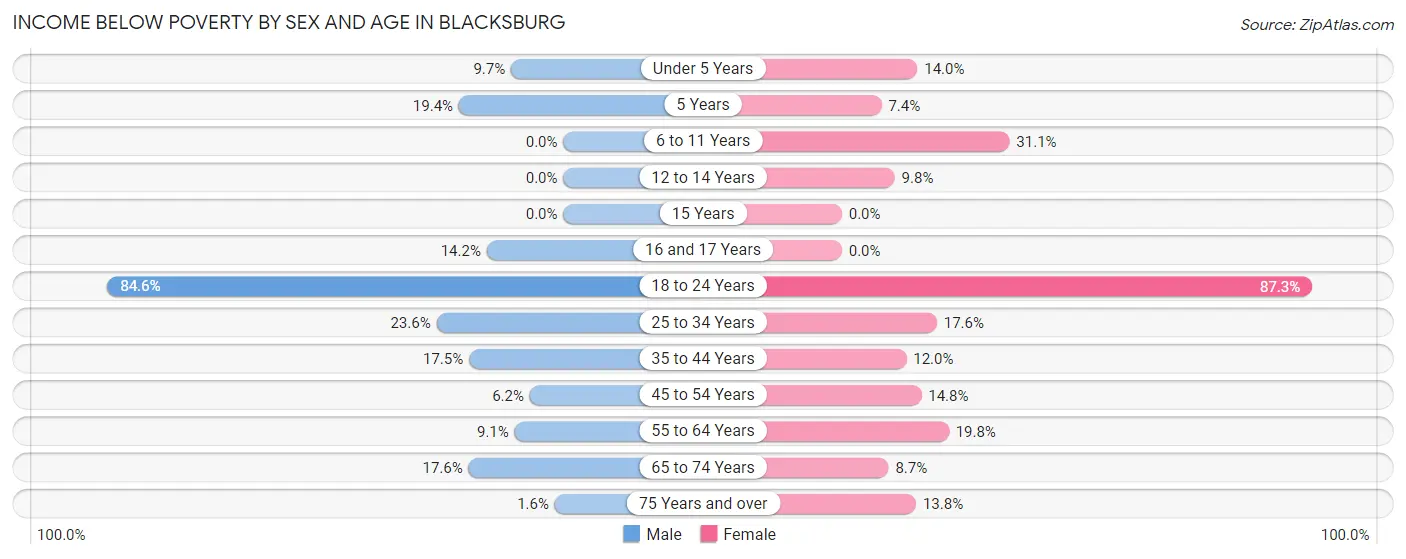
| Age Bracket | Male | Female |
| Under 5 Years | 78 (9.7%) | 60 (14.0%) |
| 5 Years | 19 (19.4%) | 7 (7.4%) |
| 6 to 11 Years | 0 (0.0%) | 270 (31.1%) |
| 12 to 14 Years | 0 (0.0%) | 36 (9.8%) |
| 15 Years | 0 (0.0%) | 0 (0.0%) |
| 16 and 17 Years | 32 (14.2%) | 0 (0.0%) |
| 18 to 24 Years | 7,544 (84.6%) | 5,429 (87.3%) |
| 25 to 34 Years | 597 (23.5%) | 398 (17.6%) |
| 35 to 44 Years | 292 (17.5%) | 173 (12.0%) |
| 45 to 54 Years | 70 (6.2%) | 178 (14.8%) |
| 55 to 64 Years | 83 (9.0%) | 244 (19.8%) |
| 65 to 74 Years | 200 (17.6%) | 91 (8.7%) |
| 75 Years and over | 8 (1.6%) | 104 (13.8%) |
| Total | 8,923 (47.0%) | 6,990 (43.0%) |
Income Above Poverty by Sex and Age in Blacksburg
According to the poverty statistics in Blacksburg, males aged 6 to 11 years and females aged 15 years are the age groups that are most secure financially, with 100.0% of males and 100.0% of females in these age groups living above the poverty line.
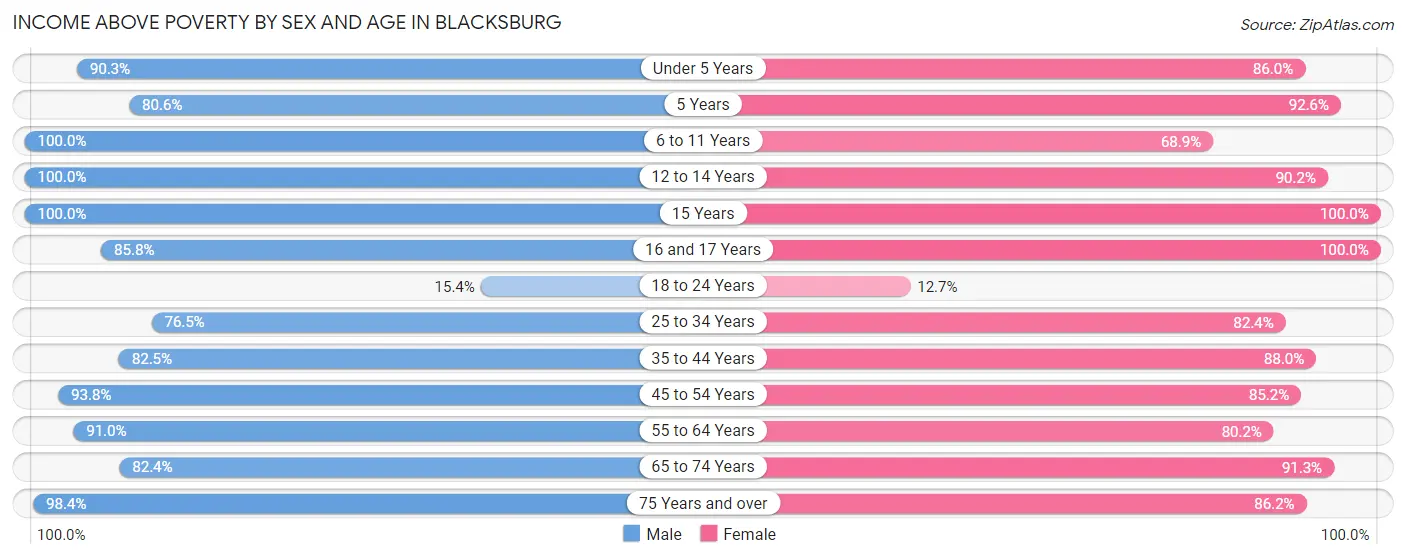
| Age Bracket | Male | Female |
| Under 5 Years | 725 (90.3%) | 368 (86.0%) |
| 5 Years | 79 (80.6%) | 88 (92.6%) |
| 6 to 11 Years | 566 (100.0%) | 598 (68.9%) |
| 12 to 14 Years | 402 (100.0%) | 331 (90.2%) |
| 15 Years | 100 (100.0%) | 116 (100.0%) |
| 16 and 17 Years | 193 (85.8%) | 234 (100.0%) |
| 18 to 24 Years | 1,369 (15.4%) | 791 (12.7%) |
| 25 to 34 Years | 1,938 (76.4%) | 1,859 (82.4%) |
| 35 to 44 Years | 1,377 (82.5%) | 1,272 (88.0%) |
| 45 to 54 Years | 1,054 (93.8%) | 1,028 (85.2%) |
| 55 to 64 Years | 834 (90.9%) | 986 (80.2%) |
| 65 to 74 Years | 937 (82.4%) | 960 (91.3%) |
| 75 Years and over | 495 (98.4%) | 651 (86.2%) |
| Total | 10,069 (53.0%) | 9,282 (57.0%) |
Income Below Poverty Among Married-Couple Families in Blacksburg
The poverty statistics for married-couple families in Blacksburg show that 7.1% or 296 of the total 4,145 families live below the poverty line. Families with 3 or 4 children have the highest poverty rate of 9.8%, comprising of 34 families. On the other hand, families with 5 or more children have the lowest poverty rate of 0.0%, which includes 0 families.
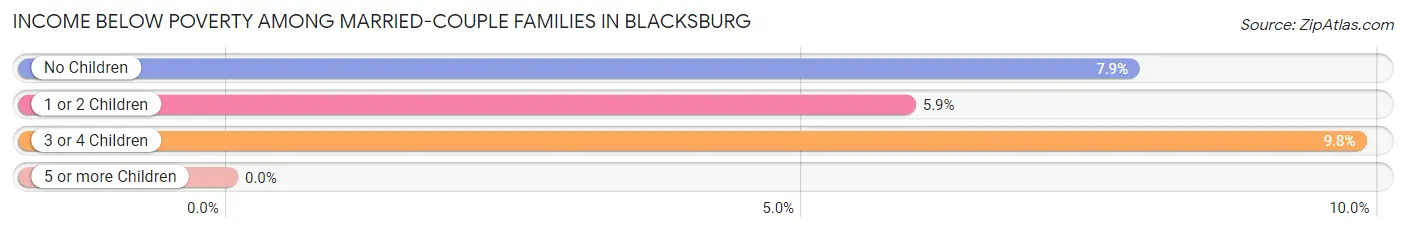
| Children | Above Poverty | Below Poverty |
| No Children | 1,879 (92.1%) | 160 (7.9%) |
| 1 or 2 Children | 1,626 (94.1%) | 102 (5.9%) |
| 3 or 4 Children | 312 (90.2%) | 34 (9.8%) |
| 5 or more Children | 32 (100.0%) | 0 (0.0%) |
| Total | 3,849 (92.9%) | 296 (7.1%) |
Income Below Poverty Among Single-Parent Households in Blacksburg
According to the poverty data in Blacksburg, 15.1% or 21 single-father households and 44.4% or 237 single-mother households are living below the poverty line. Among single-father households, those with no children have the highest poverty rate, with 12 households (33.3%) experiencing poverty. Likewise, among single-mother households, those with 1 or 2 children have the highest poverty rate, with 161 households (61.9%) falling below the poverty line.
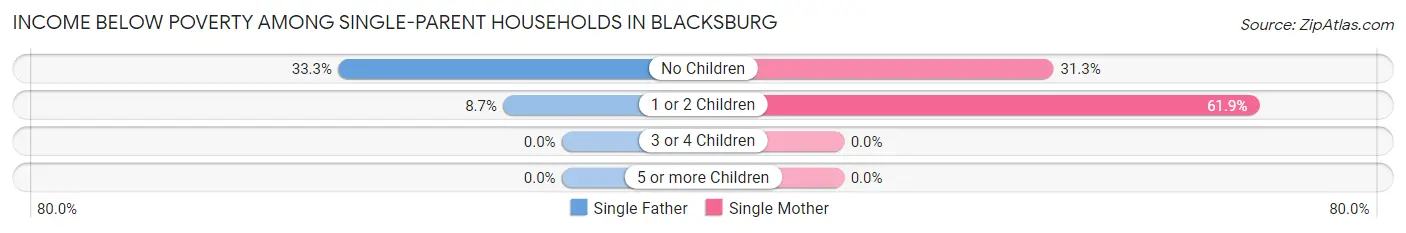
| Children | Single Father | Single Mother |
| No Children | 12 (33.3%) | 76 (31.3%) |
| 1 or 2 Children | 9 (8.7%) | 161 (61.9%) |
| 3 or 4 Children | 0 (0.0%) | 0 (0.0%) |
| 5 or more Children | 0 (0.0%) | 0 (0.0%) |
| Total | 21 (15.1%) | 237 (44.4%) |
Income Below Poverty Among Married-Couple vs Single-Parent Households in Blacksburg
The poverty data for Blacksburg shows that 296 of the married-couple family households (7.1%) and 258 of the single-parent households (38.3%) are living below the poverty level. Within the married-couple family households, those with 3 or 4 children have the highest poverty rate, with 34 households (9.8%) falling below the poverty line. Among the single-parent households, those with 1 or 2 children have the highest poverty rate, with 170 household (46.8%) living below poverty.
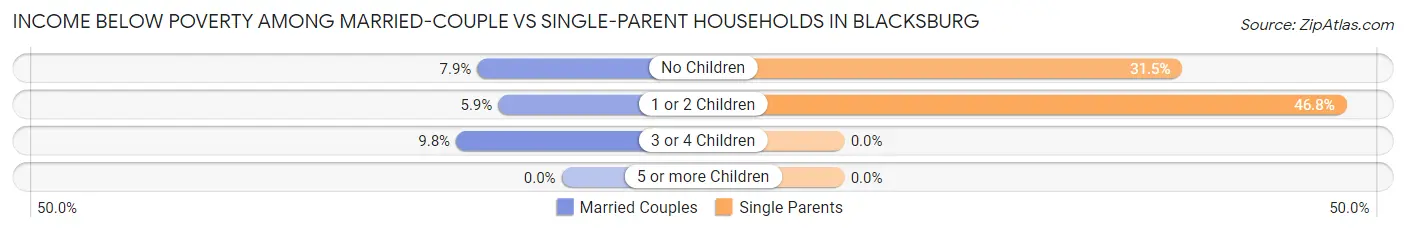
| Children | Married-Couple Families | Single-Parent Households |
| No Children | 160 (7.9%) | 88 (31.5%) |
| 1 or 2 Children | 102 (5.9%) | 170 (46.8%) |
| 3 or 4 Children | 34 (9.8%) | 0 (0.0%) |
| 5 or more Children | 0 (0.0%) | 0 (0.0%) |
| Total | 296 (7.1%) | 258 (38.3%) |
Race in Blacksburg
The most populous races in Blacksburg are White / Caucasian (35,096 | 77.7%), Asian (5,268 | 11.7%), and Black / African American (2,185 | 4.8%).
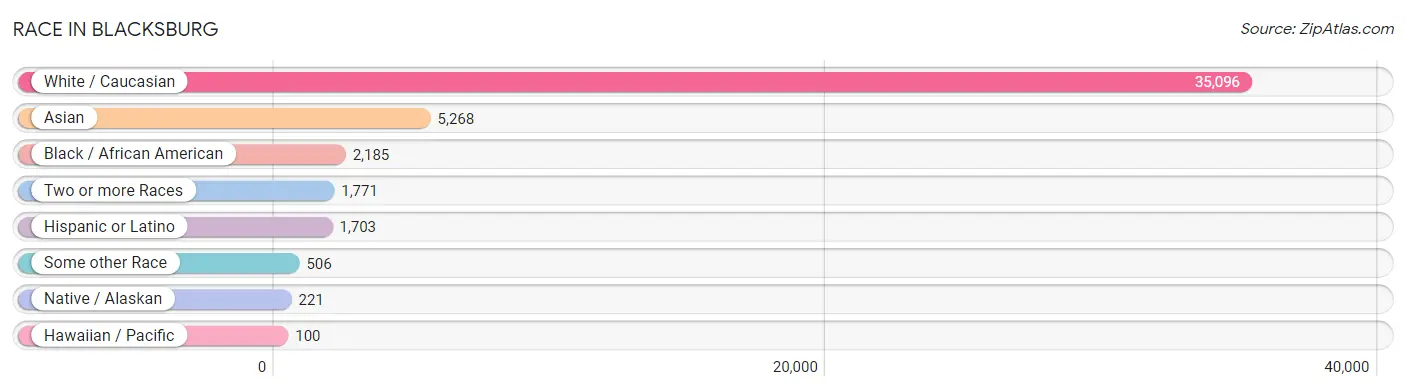
| Race | # Population | % Population |
| Asian | 5,268 | 11.7% |
| Black / African American | 2,185 | 4.8% |
| Hawaiian / Pacific | 100 | 0.2% |
| Hispanic or Latino | 1,703 | 3.8% |
| Native / Alaskan | 221 | 0.5% |
| White / Caucasian | 35,096 | 77.7% |
| Two or more Races | 1,771 | 3.9% |
| Some other Race | 506 | 1.1% |
| Total | 45,147 | 100.0% |
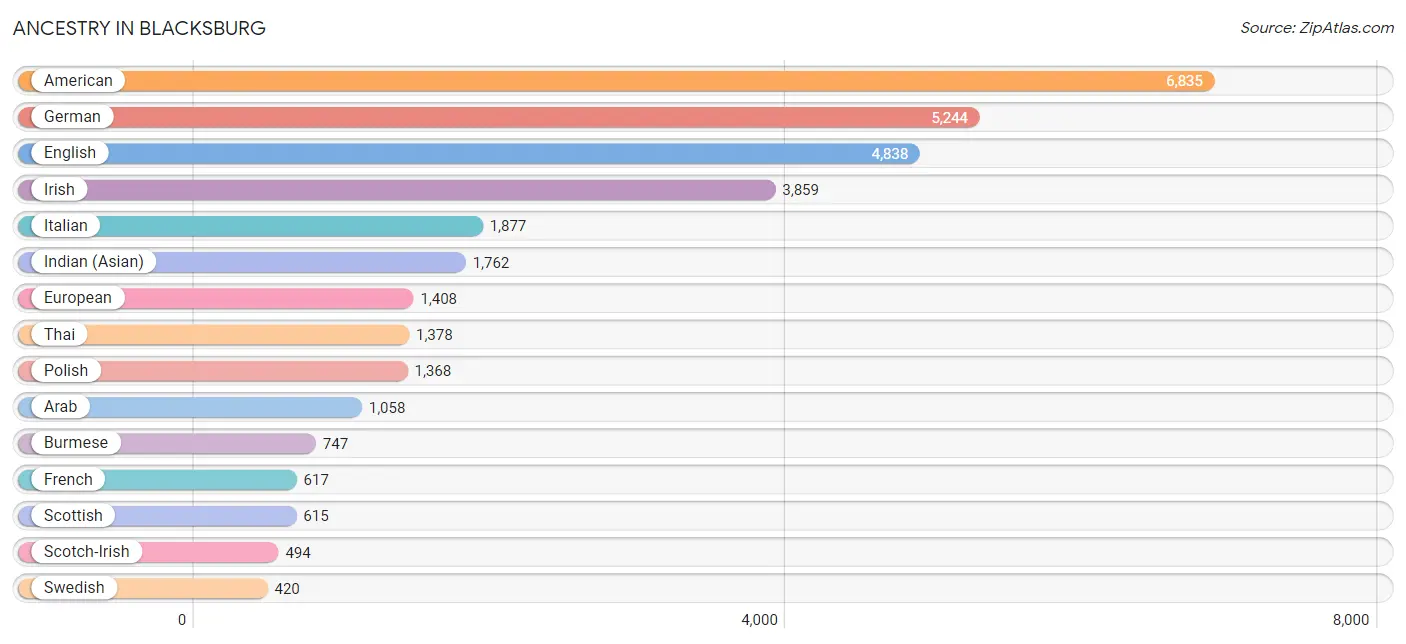
Ancestry in Blacksburg
The most populous ancestries reported in Blacksburg are American (6,835 | 15.1%), German (5,244 | 11.6%), English (4,838 | 10.7%), Irish (3,859 | 8.6%), and Italian (1,877 | 4.2%), together accounting for 50.2% of all Blacksburg residents.
| Ancestry | # Population | % Population |
| African | 171 | 0.4% |
| Albanian | 213 | 0.5% |
| American | 6,835 | 15.1% |
| Arab | 1,058 | 2.3% |
| Argentinean | 35 | 0.1% |
| Australian | 27 | 0.1% |
| Austrian | 78 | 0.2% |
| Bangladeshi | 16 | 0.0% |
| Basque | 11 | 0.0% |
| Belgian | 14 | 0.0% |
| Bhutanese | 322 | 0.7% |
| Blackfeet | 10 | 0.0% |
| Bolivian | 26 | 0.1% |
| Brazilian | 173 | 0.4% |
| British | 389 | 0.9% |
| Bulgarian | 4 | 0.0% |
| Burmese | 747 | 1.7% |
| Cambodian | 14 | 0.0% |
| Canadian | 28 | 0.1% |
| Central American | 67 | 0.2% |
| Cherokee | 41 | 0.1% |
| Chilean | 85 | 0.2% |
| Colombian | 58 | 0.1% |
| Croatian | 28 | 0.1% |
| Cuban | 37 | 0.1% |
| Czech | 134 | 0.3% |
| Czechoslovakian | 24 | 0.1% |
| Danish | 212 | 0.5% |
| Dominican | 37 | 0.1% |
| Dutch | 287 | 0.6% |
| Eastern European | 87 | 0.2% |
| Ecuadorian | 12 | 0.0% |
| Egyptian | 199 | 0.4% |
| English | 4,838 | 10.7% |
| Estonian | 4 | 0.0% |
| Ethiopian | 37 | 0.1% |
| European | 1,408 | 3.1% |
| Filipino | 34 | 0.1% |
| Finnish | 82 | 0.2% |
| French | 617 | 1.4% |
| French Canadian | 198 | 0.4% |
| German | 5,244 | 11.6% |
| Ghanaian | 18 | 0.0% |
| Greek | 110 | 0.2% |
| Guatemalan | 6 | 0.0% |
| Honduran | 21 | 0.1% |
| Hungarian | 118 | 0.3% |
| Indian (Asian) | 1,762 | 3.9% |
| Indonesian | 8 | 0.0% |
| Iranian | 204 | 0.4% |
| Irish | 3,859 | 8.6% |
| Iroquois | 13 | 0.0% |
| Israeli | 8 | 0.0% |
| Italian | 1,877 | 4.2% |
| Jamaican | 135 | 0.3% |
| Jordanian | 11 | 0.0% |
| Korean | 204 | 0.4% |
| Laotian | 5 | 0.0% |
| Lebanese | 126 | 0.3% |
| Lithuanian | 45 | 0.1% |
| Maltese | 20 | 0.0% |
| Mexican | 271 | 0.6% |
| Mongolian | 15 | 0.0% |
| Native Hawaiian | 182 | 0.4% |
| Northern European | 27 | 0.1% |
| Norwegian | 269 | 0.6% |
| Osage | 4 | 0.0% |
| Pakistani | 142 | 0.3% |
| Palestinian | 18 | 0.0% |
| Peruvian | 24 | 0.1% |
| Polish | 1,368 | 3.0% |
| Portuguese | 124 | 0.3% |
| Puerto Rican | 167 | 0.4% |
| Romanian | 51 | 0.1% |
| Russian | 178 | 0.4% |
| Salvadoran | 40 | 0.1% |
| Samoan | 12 | 0.0% |
| Scandinavian | 109 | 0.2% |
| Scotch-Irish | 494 | 1.1% |
| Scottish | 615 | 1.4% |
| Slovak | 76 | 0.2% |
| Slovene | 19 | 0.0% |
| South American | 240 | 0.5% |
| Spaniard | 45 | 0.1% |
| Spanish American | 10 | 0.0% |
| Sri Lankan | 384 | 0.9% |
| Subsaharan African | 238 | 0.5% |
| Sudanese | 12 | 0.0% |
| Swedish | 420 | 0.9% |
| Swiss | 177 | 0.4% |
| Thai | 1,378 | 3.0% |
| Tohono O'Odham | 10 | 0.0% |
| Turkish | 78 | 0.2% |
| Ukrainian | 129 | 0.3% |
| Vietnamese | 27 | 0.1% |
| Welsh | 376 | 0.8% |
| West Indian | 19 | 0.0% |
| Yugoslavian | 179 | 0.4% | View All 98 Rows |
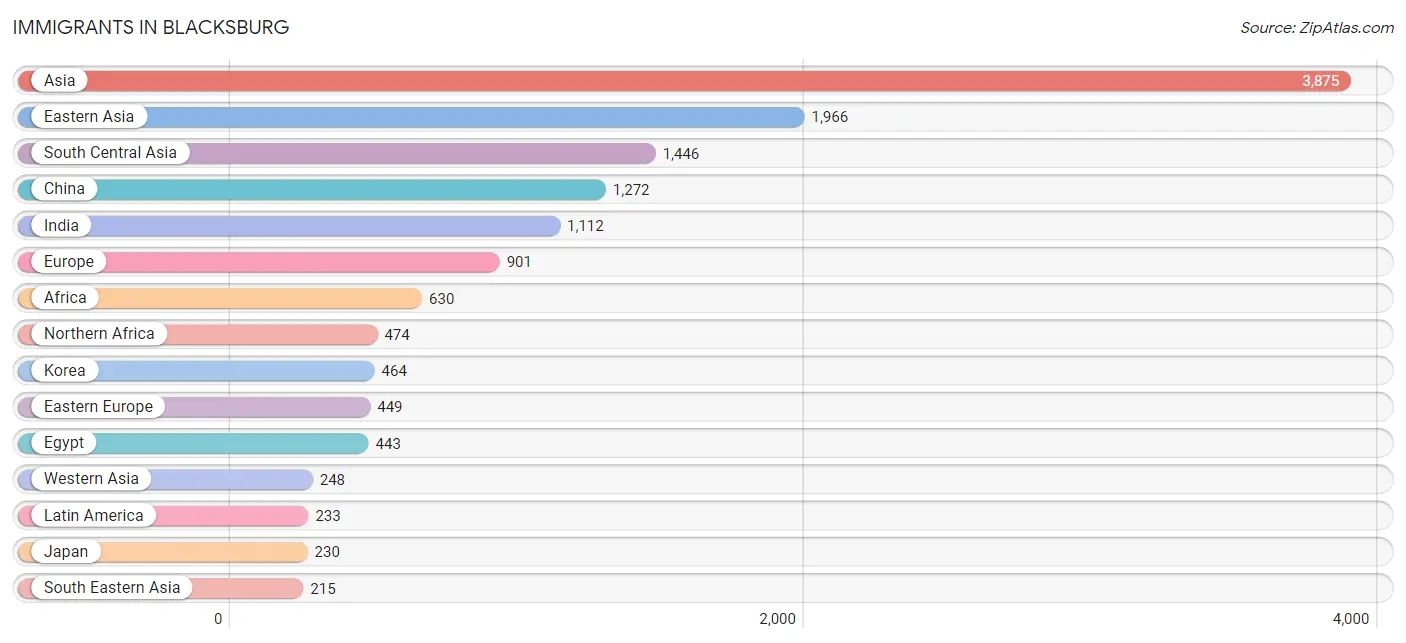
Immigrants in Blacksburg
The most numerous immigrant groups reported in Blacksburg came from Asia (3,875 | 8.6%), Eastern Asia (1,966 | 4.3%), South Central Asia (1,446 | 3.2%), China (1,272 | 2.8%), and India (1,112 | 2.5%), together accounting for 21.4% of all Blacksburg residents.
| Immigration Origin | # Population | % Population |
| Afghanistan | 1 | 0.0% |
| Africa | 630 | 1.4% |
| Albania | 152 | 0.3% |
| Argentina | 13 | 0.0% |
| Asia | 3,875 | 8.6% |
| Australia | 46 | 0.1% |
| Austria | 20 | 0.0% |
| Bangladesh | 125 | 0.3% |
| Brazil | 35 | 0.1% |
| Canada | 210 | 0.5% |
| Caribbean | 95 | 0.2% |
| Central America | 54 | 0.1% |
| China | 1,272 | 2.8% |
| Colombia | 10 | 0.0% |
| Congo | 17 | 0.0% |
| Dominican Republic | 11 | 0.0% |
| Eastern Africa | 27 | 0.1% |
| Eastern Asia | 1,966 | 4.3% |
| Eastern Europe | 449 | 1.0% |
| Ecuador | 19 | 0.0% |
| Egypt | 443 | 1.0% |
| El Salvador | 19 | 0.0% |
| England | 59 | 0.1% |
| Ethiopia | 27 | 0.1% |
| Europe | 901 | 2.0% |
| Germany | 82 | 0.2% |
| Ghana | 93 | 0.2% |
| Honduras | 11 | 0.0% |
| India | 1,112 | 2.5% |
| Indonesia | 5 | 0.0% |
| Iran | 151 | 0.3% |
| Iraq | 139 | 0.3% |
| Italy | 151 | 0.3% |
| Jamaica | 50 | 0.1% |
| Japan | 230 | 0.5% |
| Jordan | 43 | 0.1% |
| Korea | 464 | 1.0% |
| Latin America | 233 | 0.5% |
| Mexico | 24 | 0.1% |
| Middle Africa | 36 | 0.1% |
| Nepal | 46 | 0.1% |
| Netherlands | 34 | 0.1% |
| Northern Africa | 474 | 1.1% |
| Northern Europe | 139 | 0.3% |
| Oceania | 46 | 0.1% |
| Pakistan | 11 | 0.0% |
| Peru | 7 | 0.0% |
| Philippines | 129 | 0.3% |
| Poland | 63 | 0.1% |
| Romania | 14 | 0.0% |
| Serbia | 6 | 0.0% |
| South America | 84 | 0.2% |
| South Central Asia | 1,446 | 3.2% |
| South Eastern Asia | 215 | 0.5% |
| Southern Europe | 177 | 0.4% |
| Spain | 26 | 0.1% |
| Sweden | 47 | 0.1% |
| Taiwan | 7 | 0.0% |
| Thailand | 60 | 0.1% |
| Trinidad and Tobago | 34 | 0.1% |
| Turkey | 66 | 0.2% |
| Ukraine | 13 | 0.0% |
| Vietnam | 21 | 0.1% |
| Western Africa | 93 | 0.2% |
| Western Asia | 248 | 0.5% |
| Western Europe | 136 | 0.3% | View All 66 Rows |
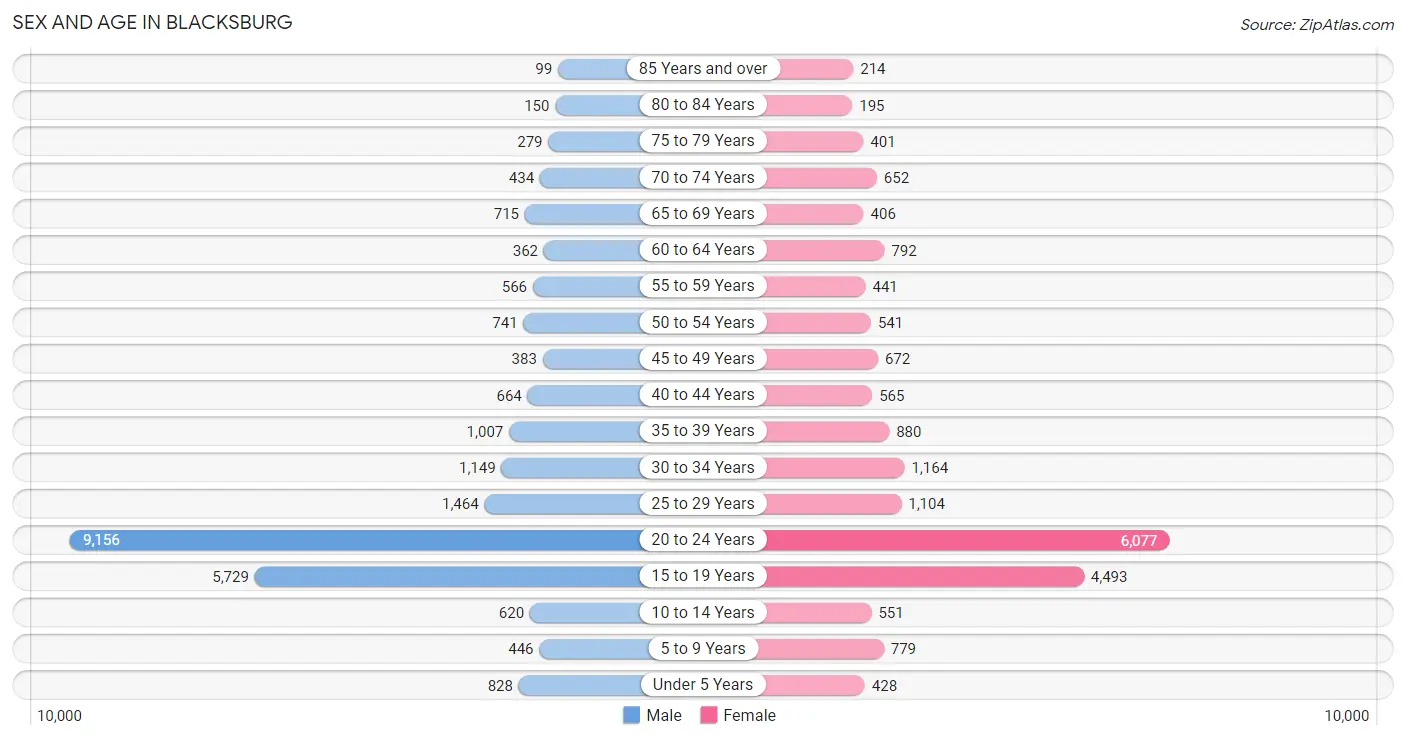
Sex and Age in Blacksburg
Sex and Age in Blacksburg
The most populous age groups in Blacksburg are 20 to 24 Years (9,156 | 36.9%) for men and 20 to 24 Years (6,077 | 29.9%) for women.
| Age Bracket | Male | Female |
| Under 5 Years | 828 (3.3%) | 428 (2.1%) |
| 5 to 9 Years | 446 (1.8%) | 779 (3.8%) |
| 10 to 14 Years | 620 (2.5%) | 551 (2.7%) |
| 15 to 19 Years | 5,729 (23.1%) | 4,493 (22.1%) |
| 20 to 24 Years | 9,156 (36.9%) | 6,077 (29.9%) |
| 25 to 29 Years | 1,464 (5.9%) | 1,104 (5.4%) |
| 30 to 34 Years | 1,149 (4.6%) | 1,164 (5.7%) |
| 35 to 39 Years | 1,007 (4.1%) | 880 (4.3%) |
| 40 to 44 Years | 664 (2.7%) | 565 (2.8%) |
| 45 to 49 Years | 383 (1.5%) | 672 (3.3%) |
| 50 to 54 Years | 741 (3.0%) | 541 (2.7%) |
| 55 to 59 Years | 566 (2.3%) | 441 (2.2%) |
| 60 to 64 Years | 362 (1.5%) | 792 (3.9%) |
| 65 to 69 Years | 715 (2.9%) | 406 (2.0%) |
| 70 to 74 Years | 434 (1.8%) | 652 (3.2%) |
| 75 to 79 Years | 279 (1.1%) | 401 (2.0%) |
| 80 to 84 Years | 150 (0.6%) | 195 (1.0%) |
| 85 Years and over | 99 (0.4%) | 214 (1.1%) |
| Total | 24,792 (100.0%) | 20,355 (100.0%) |
Families and Households in Blacksburg
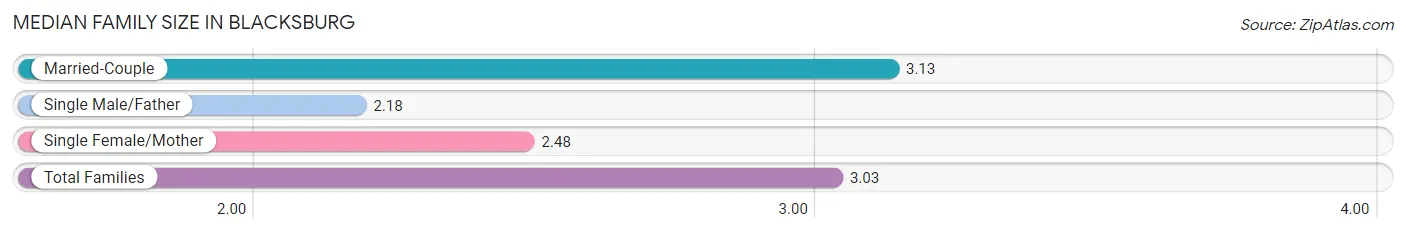
Median Family Size in Blacksburg
The median family size in Blacksburg is 3.03 persons per family, with married-couple families (4,145 | 86.0%) accounting for the largest median family size of 3.13 persons per family. On the other hand, single male/father families (139 | 2.9%) represent the smallest median family size with 2.18 persons per family.
| Family Type | # Families | Family Size |
| Married-Couple | 4,145 (86.0%) | 3.13 |
| Single Male/Father | 139 (2.9%) | 2.18 |
| Single Female/Mother | 534 (11.1%) | 2.48 |
| Total Families | 4,818 (100.0%) | 3.03 |
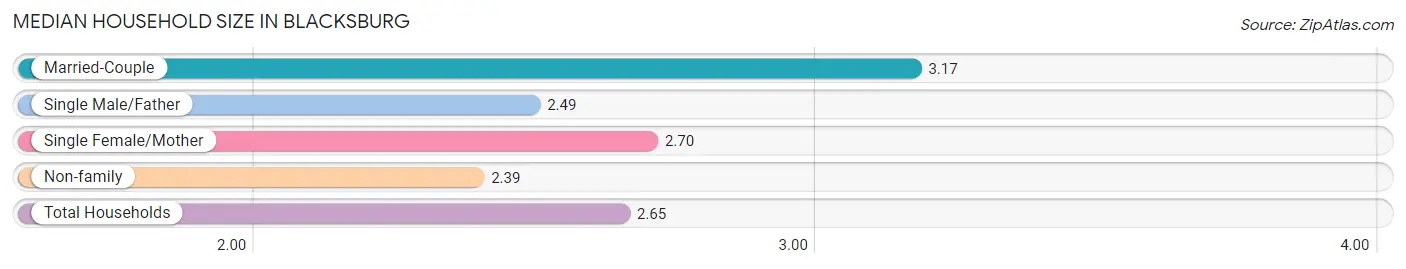
Median Household Size in Blacksburg
The median household size in Blacksburg is 2.65 persons per household, with married-couple households (4,145 | 31.1%) accounting for the largest median household size of 3.17 persons per household. non-family households (8,500 | 63.8%) represent the smallest median household size with 2.39 persons per household.
| Household Type | # Households | Household Size |
| Married-Couple | 4,145 (31.1%) | 3.17 |
| Single Male/Father | 139 (1.0%) | 2.49 |
| Single Female/Mother | 534 (4.0%) | 2.70 |
| Non-family | 8,500 (63.8%) | 2.39 |
| Total Households | 13,318 (100.0%) | 2.65 |
Household Size by Marriage Status in Blacksburg
Out of a total of 13,318 households in Blacksburg, 4,818 (36.2%) are family households, while 8,500 (63.8%) are nonfamily households. The most numerous type of family households are 2-person households, comprising 2,190, and the most common type of nonfamily households are 1-person households, comprising 4,006.
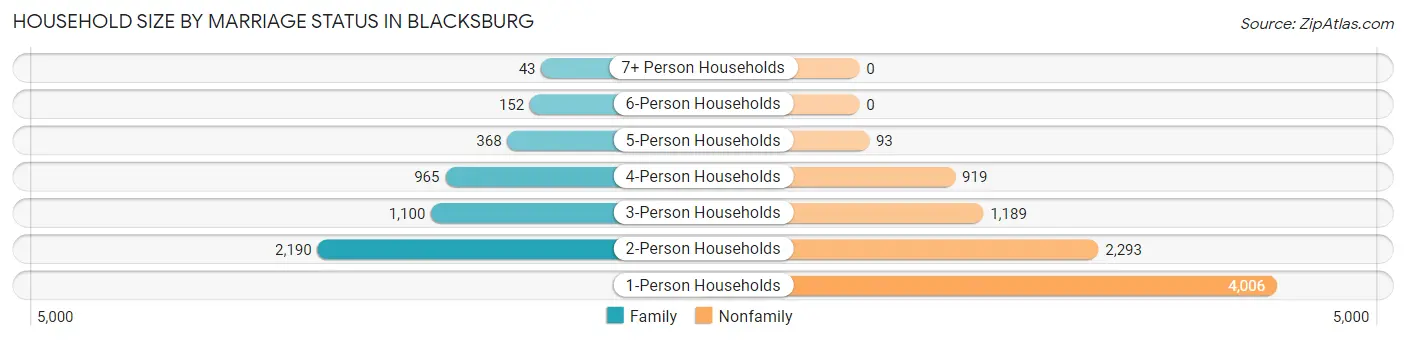
| Household Size | Family Households | Nonfamily Households |
| 1-Person Households | - | 4,006 (30.1%) |
| 2-Person Households | 2,190 (16.4%) | 2,293 (17.2%) |
| 3-Person Households | 1,100 (8.3%) | 1,189 (8.9%) |
| 4-Person Households | 965 (7.2%) | 919 (6.9%) |
| 5-Person Households | 368 (2.8%) | 93 (0.7%) |
| 6-Person Households | 152 (1.1%) | 0 (0.0%) |
| 7+ Person Households | 43 (0.3%) | 0 (0.0%) |
| Total | 4,818 (36.2%) | 8,500 (63.8%) |
Female Fertility in Blacksburg
Fertility by Age in Blacksburg
Average fertility rate in Blacksburg is 17.0 births per 1,000 women. Women in the age bracket of 35 to 50 years have the highest fertility rate with 33.0 births per 1,000 women. Women in the age bracket of 20 to 34 years acount for 71.4% of all women with births.
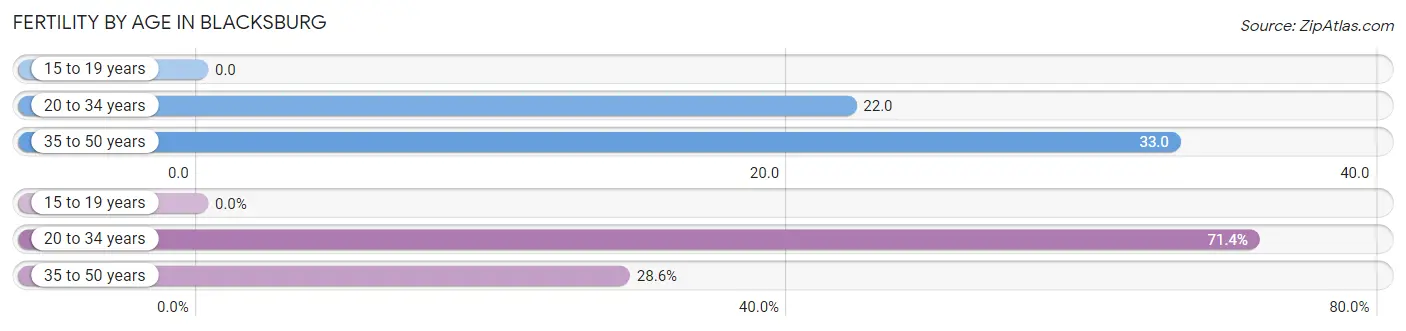
| Age Bracket | Women with Births | Births / 1,000 Women |
| 15 to 19 years | 0 (0.0%) | 0.0 |
| 20 to 34 years | 182 (71.4%) | 22.0 |
| 35 to 50 years | 73 (28.6%) | 33.0 |
| Total | 255 (100.0%) | 17.0 |
Fertility by Age by Marriage Status in Blacksburg
80.8% of women with births (255) in Blacksburg are married. The highest percentage of unmarried women with births falls into 20 to 34 years age bracket with 26.9% of them unmarried at the time of birth, while the lowest percentage of unmarried women with births belong to 35 to 50 years age bracket with 0.0% of them unmarried.
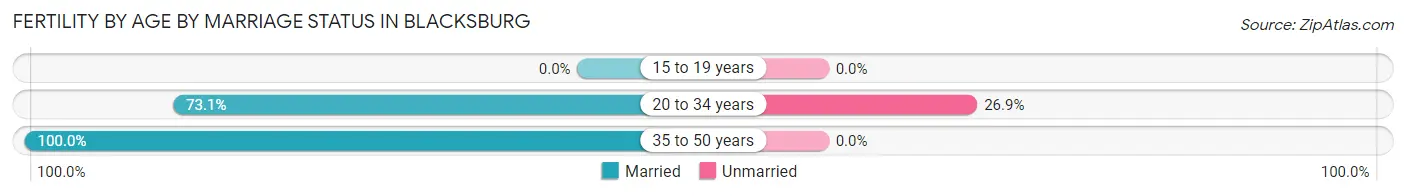
| Age Bracket | Married | Unmarried |
| 15 to 19 years | 0 (0.0%) | 0 (0.0%) |
| 20 to 34 years | 133 (73.1%) | 49 (26.9%) |
| 35 to 50 years | 73 (100.0%) | 0 (0.0%) |
| Total | 206 (80.8%) | 49 (19.2%) |
Fertility by Education in Blacksburg
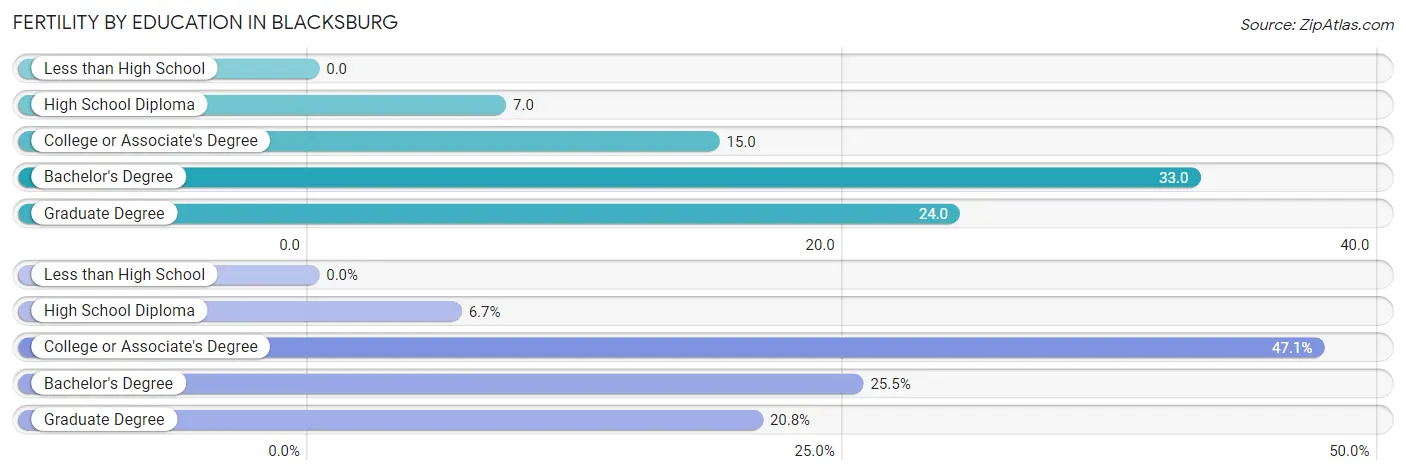
| Educational Attainment | Women with Births | Births / 1,000 Women |
| Less than High School | 0 (0.0%) | 0.0 |
| High School Diploma | 17 (6.7%) | 7.0 |
| College or Associate's Degree | 120 (47.1%) | 15.0 |
| Bachelor's Degree | 65 (25.5%) | 33.0 |
| Graduate Degree | 53 (20.8%) | 24.0 |
| Total | 255 (100.0%) | 17.0 |
Fertility by Education by Marriage Status in Blacksburg
19.2% of women with births in Blacksburg are unmarried. Women with the educational attainment of bachelor's degree are most likely to be married with 100.0% of them married at childbirth, while women with the educational attainment of high school diploma are least likely to be married with 100.0% of them unmarried at childbirth.
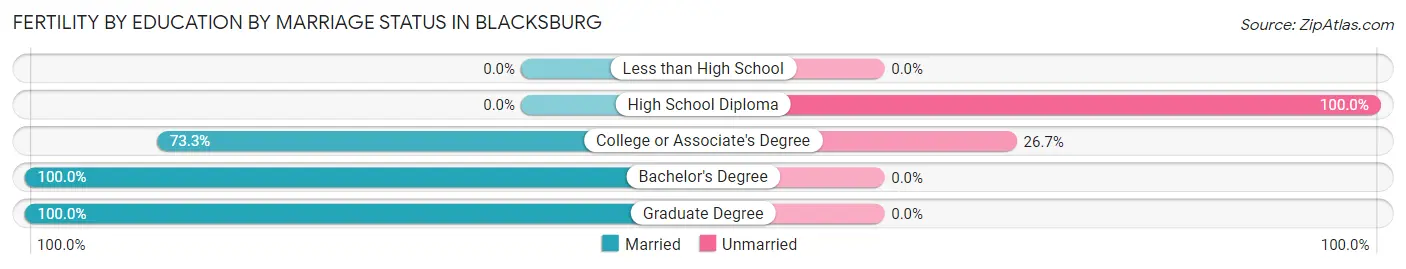
| Educational Attainment | Married | Unmarried |
| Less than High School | 0 (0.0%) | 0 (0.0%) |
| High School Diploma | 0 (0.0%) | 17 (100.0%) |
| College or Associate's Degree | 88 (73.3%) | 32 (26.7%) |
| Bachelor's Degree | 65 (100.0%) | 0 (0.0%) |
| Graduate Degree | 53 (100.0%) | 0 (0.0%) |
| Total | 206 (80.8%) | 49 (19.2%) |
Employment Characteristics in Blacksburg
Employment by Class of Employer in Blacksburg
Among the 17,815 employed individuals in Blacksburg, private company employees (9,142 | 51.3%), state government employees (4,554 | 25.6%), and not-for-profit organizations (2,118 | 11.9%) make up the most common classes of employment.
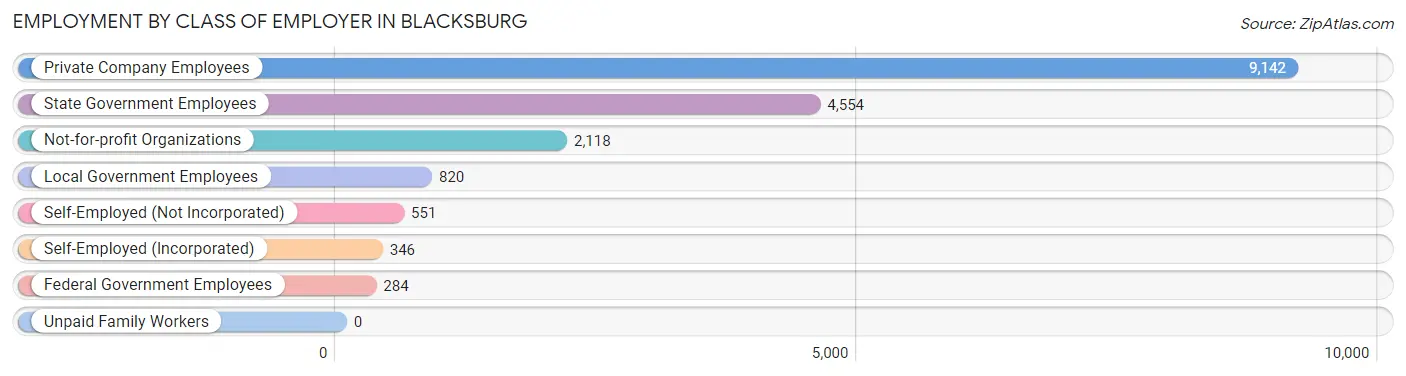
| Employer Class | # Employees | % Employees |
| Private Company Employees | 9,142 | 51.3% |
| Self-Employed (Incorporated) | 346 | 1.9% |
| Self-Employed (Not Incorporated) | 551 | 3.1% |
| Not-for-profit Organizations | 2,118 | 11.9% |
| Local Government Employees | 820 | 4.6% |
| State Government Employees | 4,554 | 25.6% |
| Federal Government Employees | 284 | 1.6% |
| Unpaid Family Workers | 0 | 0.0% |
| Total | 17,815 | 100.0% |
Employment Status by Age in Blacksburg
According to the labor force statistics for Blacksburg, out of the total population over 16 years of age (41,279), 47.7% or 19,690 individuals are in the labor force, with 3.4% or 669 of them unemployed. The age group with the highest labor force participation rate is 30 to 34 years, with 82.7% or 1,913 individuals in the labor force. Within the labor force, the 20 to 24 years age range has the highest percentage of unemployed individuals, with 5.2% or 312 of them being unemployed.
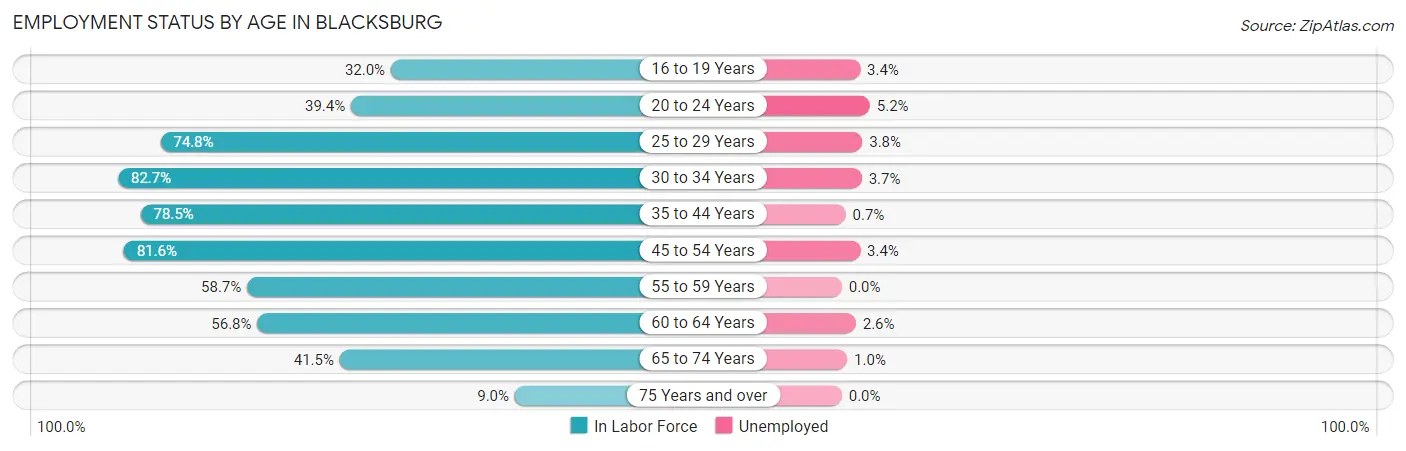
| Age Bracket | In Labor Force | Unemployed |
| 16 to 19 Years | 3,202 (32.0%) | 109 (3.4%) |
| 20 to 24 Years | 6,002 (39.4%) | 312 (5.2%) |
| 25 to 29 Years | 1,921 (74.8%) | 73 (3.8%) |
| 30 to 34 Years | 1,913 (82.7%) | 71 (3.7%) |
| 35 to 44 Years | 2,446 (78.5%) | 17 (0.7%) |
| 45 to 54 Years | 1,907 (81.6%) | 65 (3.4%) |
| 55 to 59 Years | 591 (58.7%) | 0 (0.0%) |
| 60 to 64 Years | 655 (56.8%) | 17 (2.6%) |
| 65 to 74 Years | 916 (41.5%) | 9 (1.0%) |
| 75 Years and over | 120 (9.0%) | 0 (0.0%) |
| Total | 19,690 (47.7%) | 669 (3.4%) |
Employment Status by Educational Attainment in Blacksburg
According to labor force statistics for Blacksburg, 75.5% of individuals (9,434) out of the total population between 25 and 64 years of age (12,495) are in the labor force, with 2.6% or 245 of them being unemployed. The group with the highest labor force participation rate are those with the educational attainment of bachelor's degree or higher, with 84.7% or 7,338 individuals in the labor force. Within the labor force, individuals with less than high school education have the highest percentage of unemployment, with 63.3% or 50 of them being unemployed.
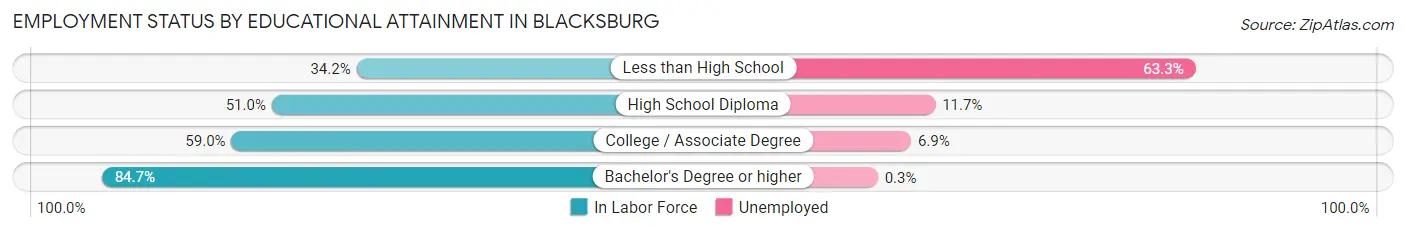
| Educational Attainment | In Labor Force | Unemployed |
| Less than High School | 79 (34.2%) | 146 (63.3%) |
| High School Diploma | 677 (51.0%) | 155 (11.7%) |
| College / Associate Degree | 1,341 (59.0%) | 157 (6.9%) |
| Bachelor's Degree or higher | 7,338 (84.7%) | 26 (0.3%) |
| Total | 9,434 (75.5%) | 325 (2.6%) |
Employment Occupations by Sex in Blacksburg
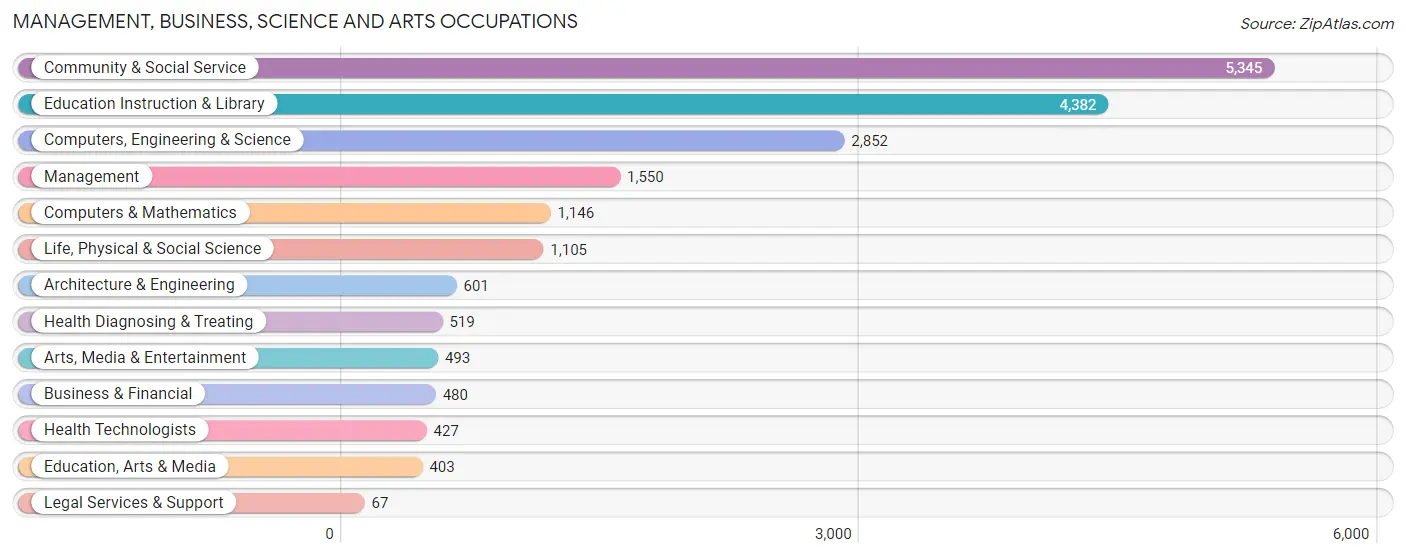
Management, Business, Science and Arts Occupations
The most common Management, Business, Science and Arts occupations in Blacksburg are Community & Social Service (5,345 | 28.2%), Education Instruction & Library (4,382 | 23.2%), Computers, Engineering & Science (2,852 | 15.1%), Management (1,550 | 8.2%), and Computers & Mathematics (1,146 | 6.0%).
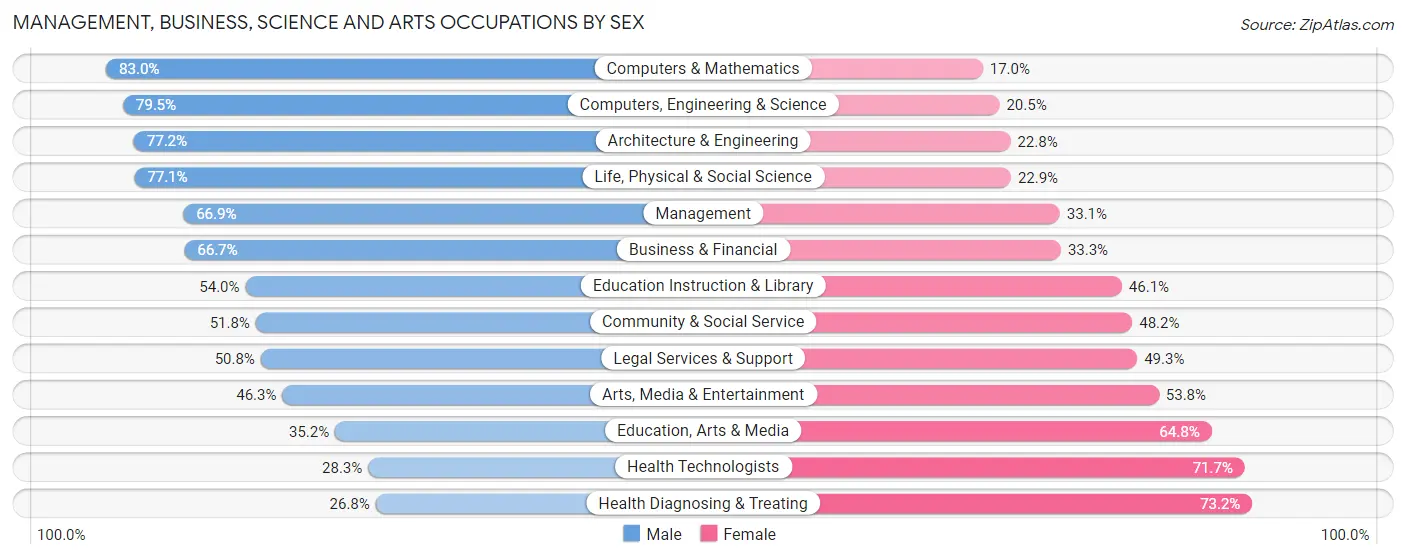
Management, Business, Science and Arts Occupations by Sex
Within the Management, Business, Science and Arts occupations in Blacksburg, the most male-oriented occupations are Computers & Mathematics (83.0%), Computers, Engineering & Science (79.5%), and Architecture & Engineering (77.2%), while the most female-oriented occupations are Health Diagnosing & Treating (73.2%), Health Technologists (71.7%), and Education, Arts & Media (64.8%).
| Occupation | Male | Female |
| Management | 1,037 (66.9%) | 513 (33.1%) |
| Business & Financial | 320 (66.7%) | 160 (33.3%) |
| Computers, Engineering & Science | 2,267 (79.5%) | 585 (20.5%) |
| Computers & Mathematics | 951 (83.0%) | 195 (17.0%) |
| Architecture & Engineering | 464 (77.2%) | 137 (22.8%) |
| Life, Physical & Social Science | 852 (77.1%) | 253 (22.9%) |
| Community & Social Service | 2,768 (51.8%) | 2,577 (48.2%) |
| Education, Arts & Media | 142 (35.2%) | 261 (64.8%) |
| Legal Services & Support | 34 (50.7%) | 33 (49.2%) |
| Education Instruction & Library | 2,364 (53.9%) | 2,018 (46.1%) |
| Arts, Media & Entertainment | 228 (46.3%) | 265 (53.7%) |
| Health Diagnosing & Treating | 139 (26.8%) | 380 (73.2%) |
| Health Technologists | 121 (28.3%) | 306 (71.7%) |
| Total (Category) | 6,531 (60.8%) | 4,215 (39.2%) |
| Total (Overall) | 11,229 (59.3%) | 7,698 (40.7%) |
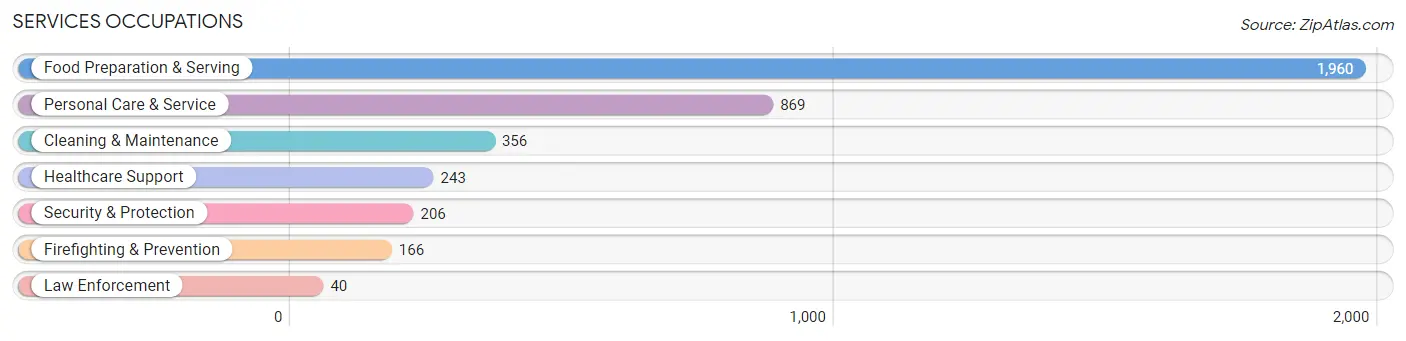
Services Occupations
The most common Services occupations in Blacksburg are Food Preparation & Serving (1,960 | 10.4%), Personal Care & Service (869 | 4.6%), Cleaning & Maintenance (356 | 1.9%), Healthcare Support (243 | 1.3%), and Security & Protection (206 | 1.1%).
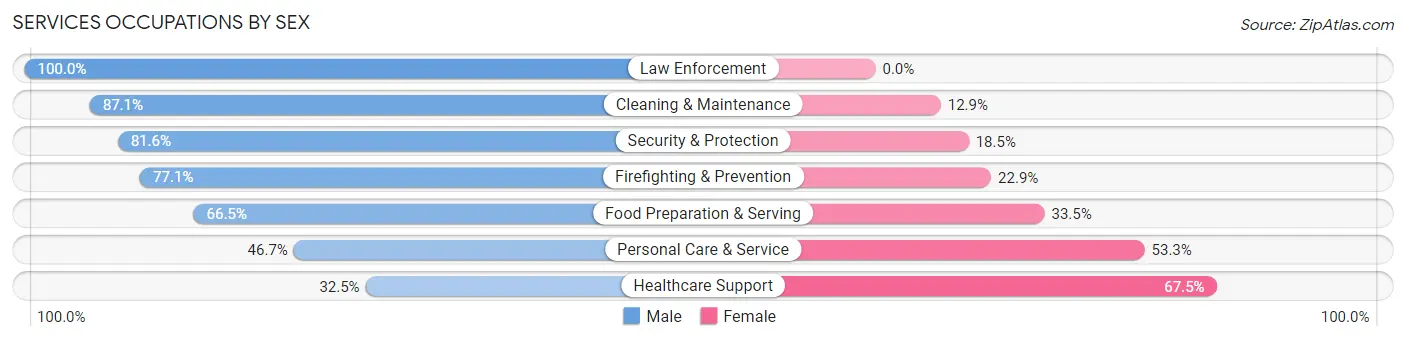
Services Occupations by Sex
Within the Services occupations in Blacksburg, the most male-oriented occupations are Law Enforcement (100.0%), Cleaning & Maintenance (87.1%), and Security & Protection (81.6%), while the most female-oriented occupations are Healthcare Support (67.5%), Personal Care & Service (53.3%), and Food Preparation & Serving (33.5%).
| Occupation | Male | Female |
| Healthcare Support | 79 (32.5%) | 164 (67.5%) |
| Security & Protection | 168 (81.6%) | 38 (18.4%) |
| Firefighting & Prevention | 128 (77.1%) | 38 (22.9%) |
| Law Enforcement | 40 (100.0%) | 0 (0.0%) |
| Food Preparation & Serving | 1,304 (66.5%) | 656 (33.5%) |
| Cleaning & Maintenance | 310 (87.1%) | 46 (12.9%) |
| Personal Care & Service | 406 (46.7%) | 463 (53.3%) |
| Total (Category) | 2,267 (62.4%) | 1,367 (37.6%) |
| Total (Overall) | 11,229 (59.3%) | 7,698 (40.7%) |
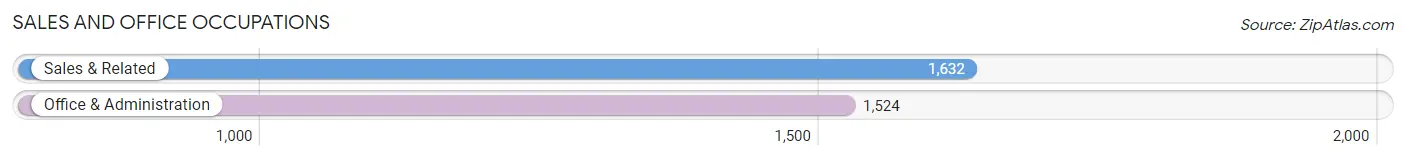
Sales and Office Occupations
The most common Sales and Office occupations in Blacksburg are Sales & Related (1,632 | 8.6%), and Office & Administration (1,524 | 8.1%).
Sales and Office Occupations by Sex
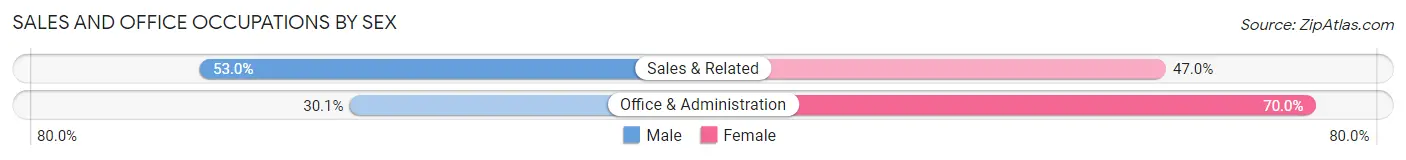
| Occupation | Male | Female |
| Sales & Related | 865 (53.0%) | 767 (47.0%) |
| Office & Administration | 458 (30.0%) | 1,066 (70.0%) |
| Total (Category) | 1,323 (41.9%) | 1,833 (58.1%) |
| Total (Overall) | 11,229 (59.3%) | 7,698 (40.7%) |
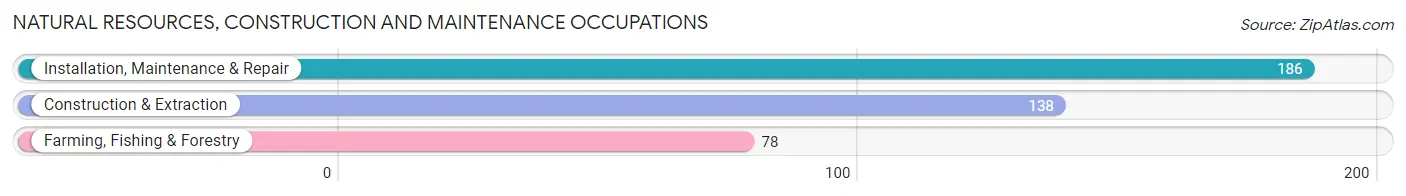
Natural Resources, Construction and Maintenance Occupations
The most common Natural Resources, Construction and Maintenance occupations in Blacksburg are Installation, Maintenance & Repair (186 | 1.0%), Construction & Extraction (138 | 0.7%), and Farming, Fishing & Forestry (78 | 0.4%).
Natural Resources, Construction and Maintenance Occupations by Sex
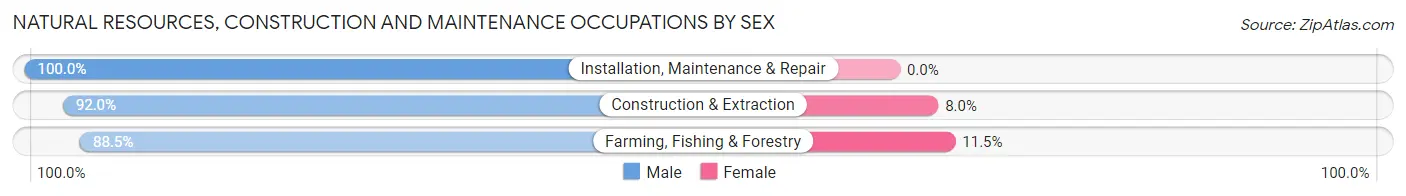
| Occupation | Male | Female |
| Farming, Fishing & Forestry | 69 (88.5%) | 9 (11.5%) |
| Construction & Extraction | 127 (92.0%) | 11 (8.0%) |
| Installation, Maintenance & Repair | 186 (100.0%) | 0 (0.0%) |
| Total (Category) | 382 (95.0%) | 20 (5.0%) |
| Total (Overall) | 11,229 (59.3%) | 7,698 (40.7%) |
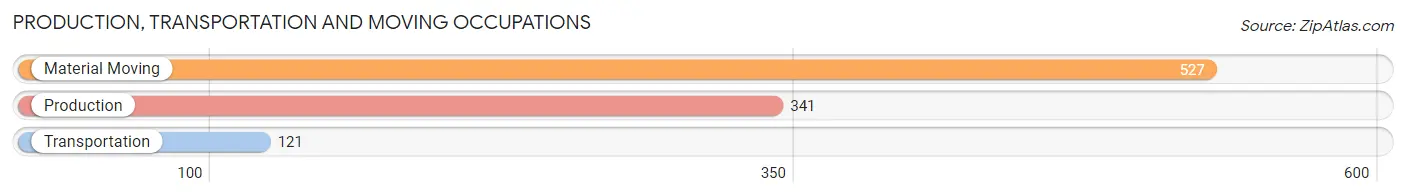
Production, Transportation and Moving Occupations
The most common Production, Transportation and Moving occupations in Blacksburg are Material Moving (527 | 2.8%), Production (341 | 1.8%), and Transportation (121 | 0.6%).
Production, Transportation and Moving Occupations by Sex
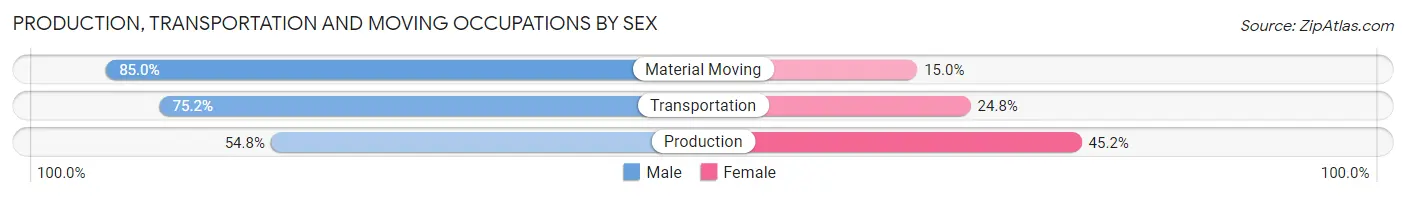
| Occupation | Male | Female |
| Production | 187 (54.8%) | 154 (45.2%) |
| Transportation | 91 (75.2%) | 30 (24.8%) |
| Material Moving | 448 (85.0%) | 79 (15.0%) |
| Total (Category) | 726 (73.4%) | 263 (26.6%) |
| Total (Overall) | 11,229 (59.3%) | 7,698 (40.7%) |
Employment Industries by Sex in Blacksburg
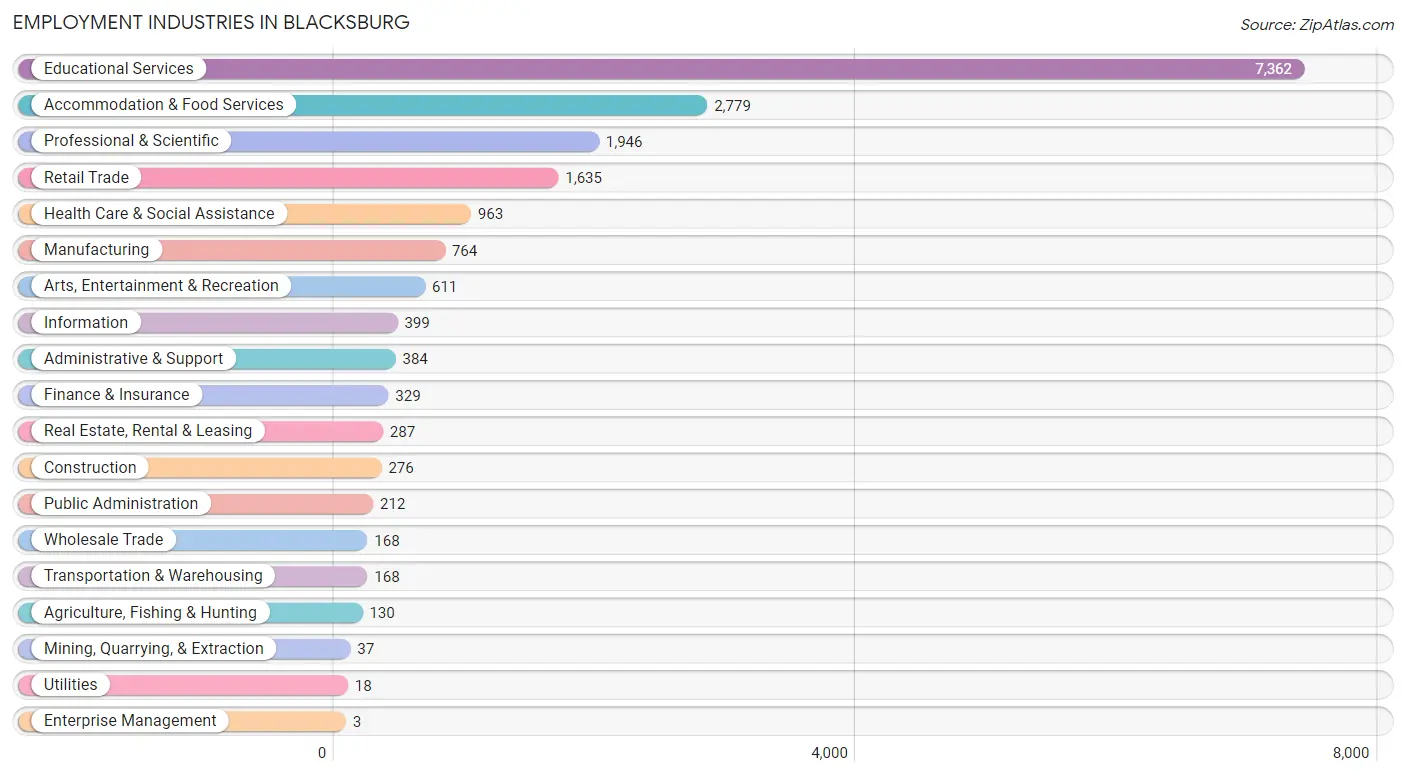
Employment Industries in Blacksburg
The major employment industries in Blacksburg include Educational Services (7,362 | 38.9%), Accommodation & Food Services (2,779 | 14.7%), Professional & Scientific (1,946 | 10.3%), Retail Trade (1,635 | 8.6%), and Health Care & Social Assistance (963 | 5.1%).
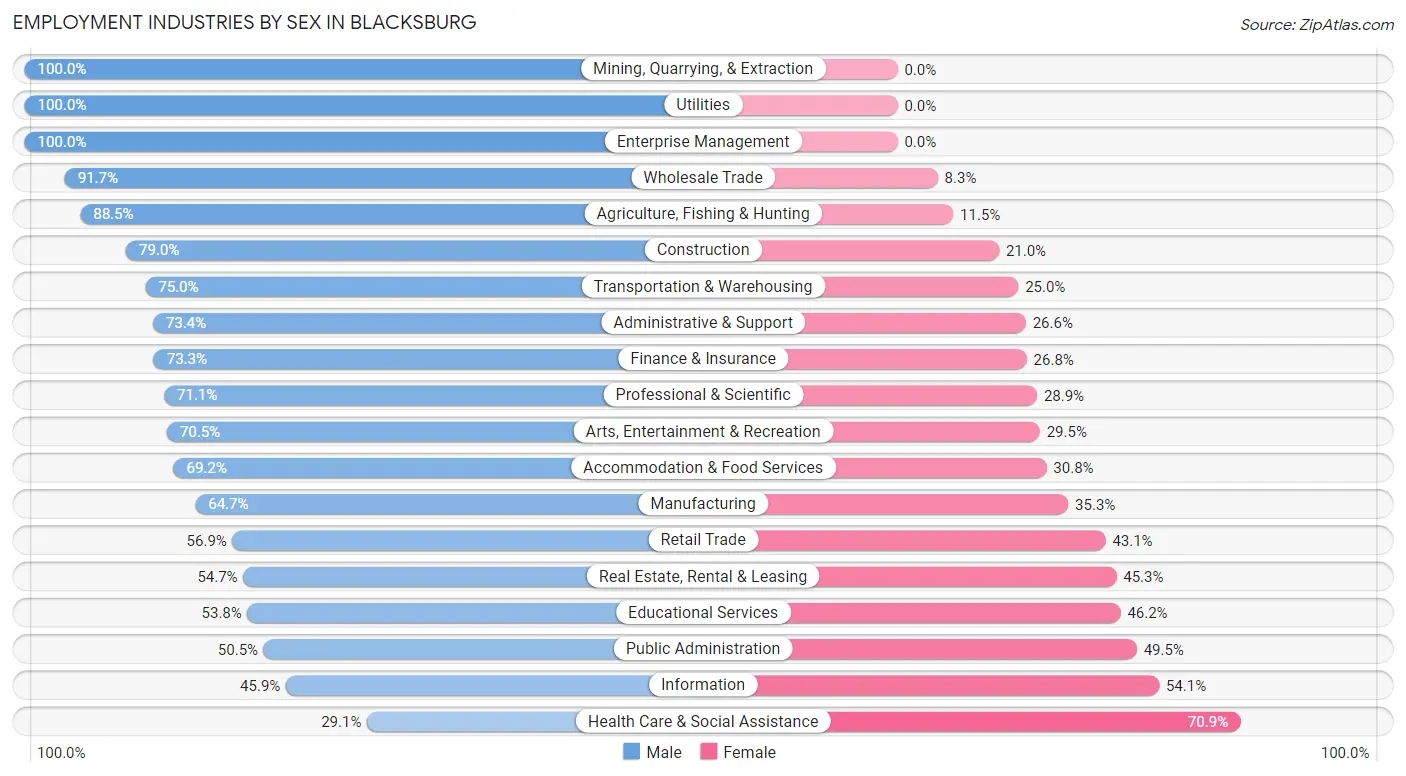
Employment Industries by Sex in Blacksburg
The Blacksburg industries that see more men than women are Mining, Quarrying, & Extraction (100.0%), Utilities (100.0%), and Enterprise Management (100.0%), whereas the industries that tend to have a higher number of women are Health Care & Social Assistance (70.9%), Information (54.1%), and Public Administration (49.5%).
| Industry | Male | Female |
| Agriculture, Fishing & Hunting | 115 (88.5%) | 15 (11.5%) |
| Mining, Quarrying, & Extraction | 37 (100.0%) | 0 (0.0%) |
| Construction | 218 (79.0%) | 58 (21.0%) |
| Manufacturing | 494 (64.7%) | 270 (35.3%) |
| Wholesale Trade | 154 (91.7%) | 14 (8.3%) |
| Retail Trade | 931 (56.9%) | 704 (43.1%) |
| Transportation & Warehousing | 126 (75.0%) | 42 (25.0%) |
| Utilities | 18 (100.0%) | 0 (0.0%) |
| Information | 183 (45.9%) | 216 (54.1%) |
| Finance & Insurance | 241 (73.3%) | 88 (26.8%) |
| Real Estate, Rental & Leasing | 157 (54.7%) | 130 (45.3%) |
| Professional & Scientific | 1,384 (71.1%) | 562 (28.9%) |
| Enterprise Management | 3 (100.0%) | 0 (0.0%) |
| Administrative & Support | 282 (73.4%) | 102 (26.6%) |
| Educational Services | 3,964 (53.8%) | 3,398 (46.2%) |
| Health Care & Social Assistance | 280 (29.1%) | 683 (70.9%) |
| Arts, Entertainment & Recreation | 431 (70.5%) | 180 (29.5%) |
| Accommodation & Food Services | 1,922 (69.2%) | 857 (30.8%) |
| Public Administration | 107 (50.5%) | 105 (49.5%) |
| Total | 11,229 (59.3%) | 7,698 (40.7%) |
Education in Blacksburg
School Enrollment in Blacksburg
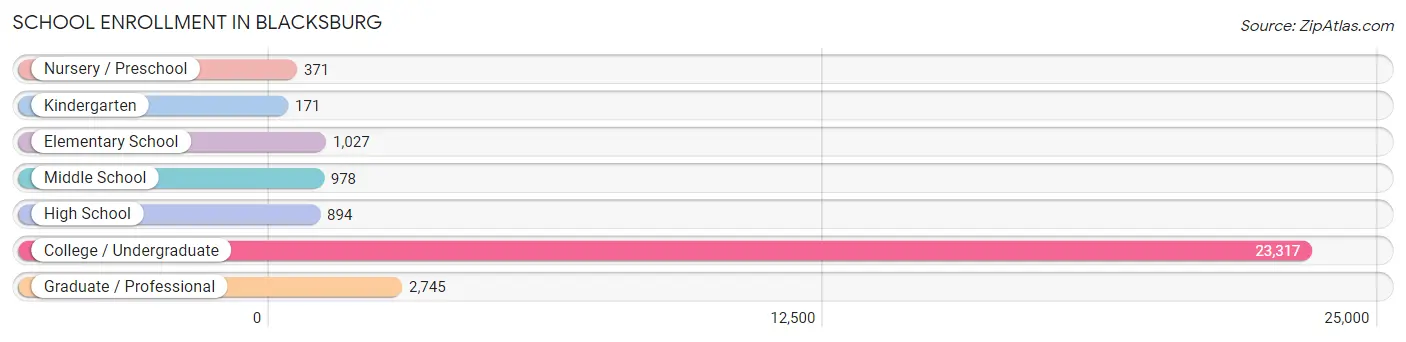
The most common levels of schooling among the 29,503 students in Blacksburg are college / undergraduate (23,317 | 79.0%), graduate / professional (2,745 | 9.3%), and elementary school (1,027 | 3.5%).
| School Level | # Students | % Students |
| Nursery / Preschool | 371 | 1.3% |
| Kindergarten | 171 | 0.6% |
| Elementary School | 1,027 | 3.5% |
| Middle School | 978 | 3.3% |
| High School | 894 | 3.0% |
| College / Undergraduate | 23,317 | 79.0% |
| Graduate / Professional | 2,745 | 9.3% |
| Total | 29,503 | 100.0% |
School Enrollment by Age by Funding Source in Blacksburg
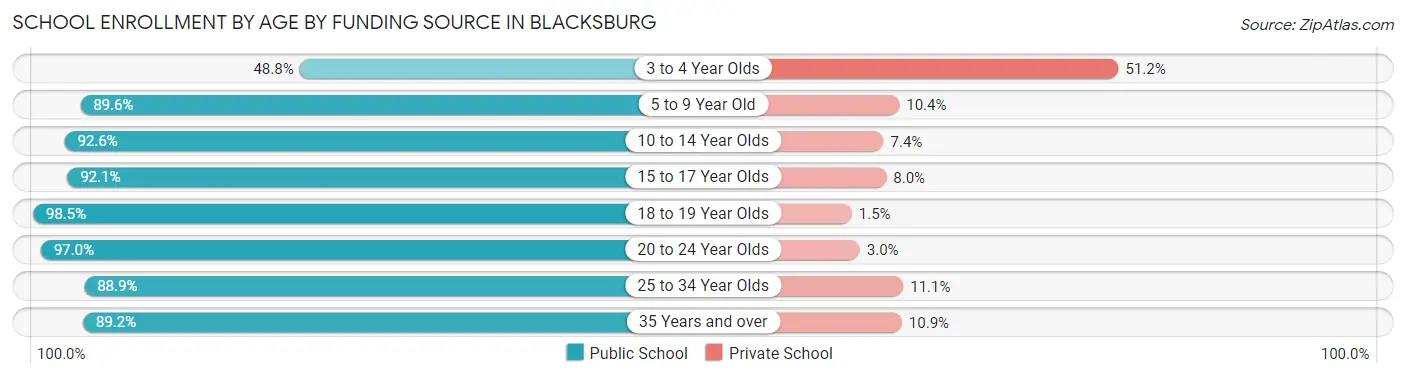
Out of a total of 29,503 students who are enrolled in schools in Blacksburg, 1,298 (4.4%) attend a private institution, while the remaining 28,205 (95.6%) are enrolled in public schools. The age group of 3 to 4 year olds has the highest likelihood of being enrolled in private schools, with 149 (51.2% in the age bracket) enrolled. Conversely, the age group of 18 to 19 year olds has the lowest likelihood of being enrolled in a private school, with 9,137 (98.5% in the age bracket) attending a public institution.
| Age Bracket | Public School | Private School |
| 3 to 4 Year Olds | 142 (48.8%) | 149 (51.2%) |
| 5 to 9 Year Old | 1,081 (89.6%) | 125 (10.4%) |
| 10 to 14 Year Olds | 1,084 (92.6%) | 87 (7.4%) |
| 15 to 17 Year Olds | 741 (92.0%) | 64 (8.0%) |
| 18 to 19 Year Olds | 9,137 (98.5%) | 142 (1.5%) |
| 20 to 24 Year Olds | 13,385 (97.0%) | 416 (3.0%) |
| 25 to 34 Year Olds | 2,057 (88.9%) | 257 (11.1%) |
| 35 Years and over | 567 (89.1%) | 69 (10.8%) |
| Total | 28,205 (95.6%) | 1,298 (4.4%) |
Educational Attainment by Field of Study in Blacksburg
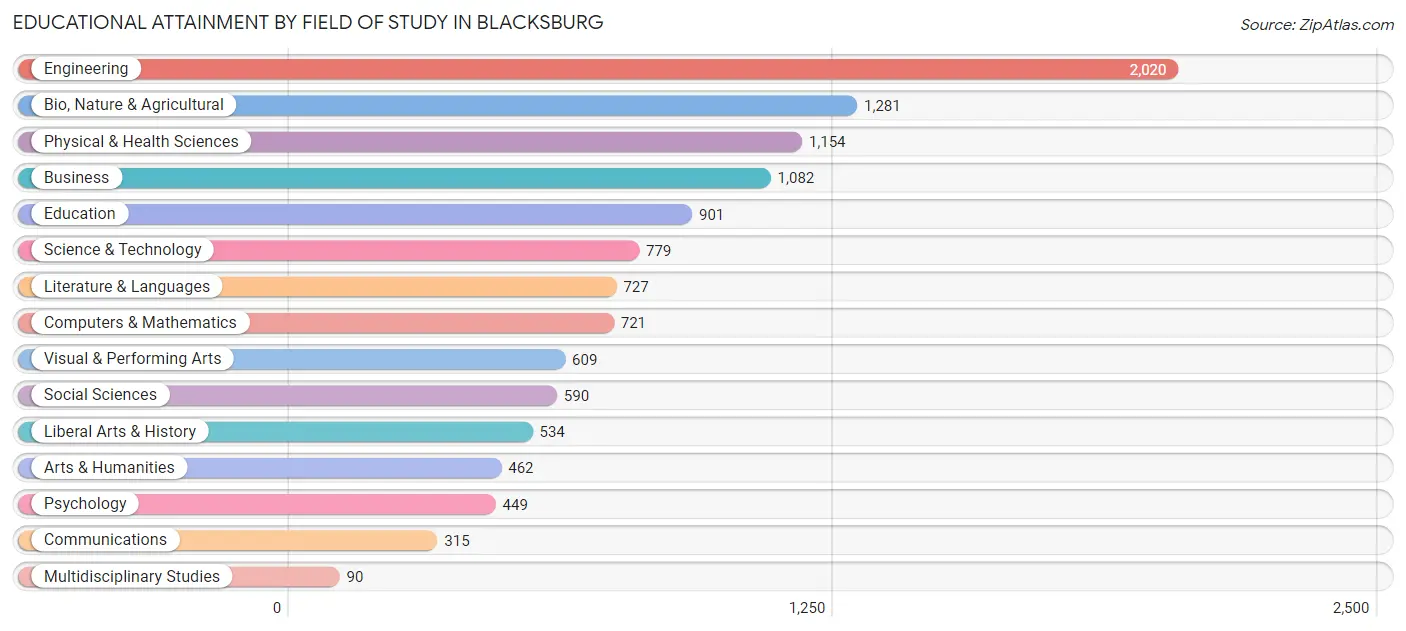
Engineering (2,020 | 17.2%), bio, nature & agricultural (1,281 | 10.9%), physical & health sciences (1,154 | 9.9%), business (1,082 | 9.2%), and education (901 | 7.7%) are the most common fields of study among 11,714 individuals in Blacksburg who have obtained a bachelor's degree or higher.
| Field of Study | # Graduates | % Graduates |
| Computers & Mathematics | 721 | 6.2% |
| Bio, Nature & Agricultural | 1,281 | 10.9% |
| Physical & Health Sciences | 1,154 | 9.9% |
| Psychology | 449 | 3.8% |
| Social Sciences | 590 | 5.0% |
| Engineering | 2,020 | 17.2% |
| Multidisciplinary Studies | 90 | 0.8% |
| Science & Technology | 779 | 6.7% |
| Business | 1,082 | 9.2% |
| Education | 901 | 7.7% |
| Literature & Languages | 727 | 6.2% |
| Liberal Arts & History | 534 | 4.6% |
| Visual & Performing Arts | 609 | 5.2% |
| Communications | 315 | 2.7% |
| Arts & Humanities | 462 | 3.9% |
| Total | 11,714 | 100.0% |
Transportation & Commute in Blacksburg
Vehicle Availability by Sex in Blacksburg
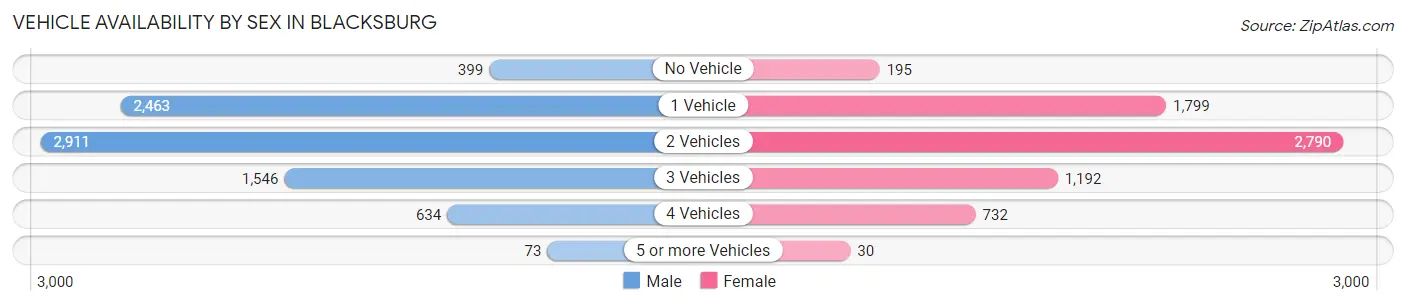
The most prevalent vehicle ownership categories in Blacksburg are males with 2 vehicles (2,911, accounting for 36.3%) and females with 2 vehicles (2,790, making up 43.2%).
| Vehicles Available | Male | Female |
| No Vehicle | 399 (5.0%) | 195 (2.9%) |
| 1 Vehicle | 2,463 (30.7%) | 1,799 (26.7%) |
| 2 Vehicles | 2,911 (36.3%) | 2,790 (41.4%) |
| 3 Vehicles | 1,546 (19.3%) | 1,192 (17.7%) |
| 4 Vehicles | 634 (7.9%) | 732 (10.9%) |
| 5 or more Vehicles | 73 (0.9%) | 30 (0.4%) |
| Total | 8,026 (100.0%) | 6,738 (100.0%) |
Commute Time in Blacksburg
The most frequently occuring commute durations in Blacksburg are 10 to 14 minutes (4,641 commuters, 30.6%), 5 to 9 minutes (3,769 commuters, 24.8%), and 15 to 19 minutes (2,550 commuters, 16.8%).
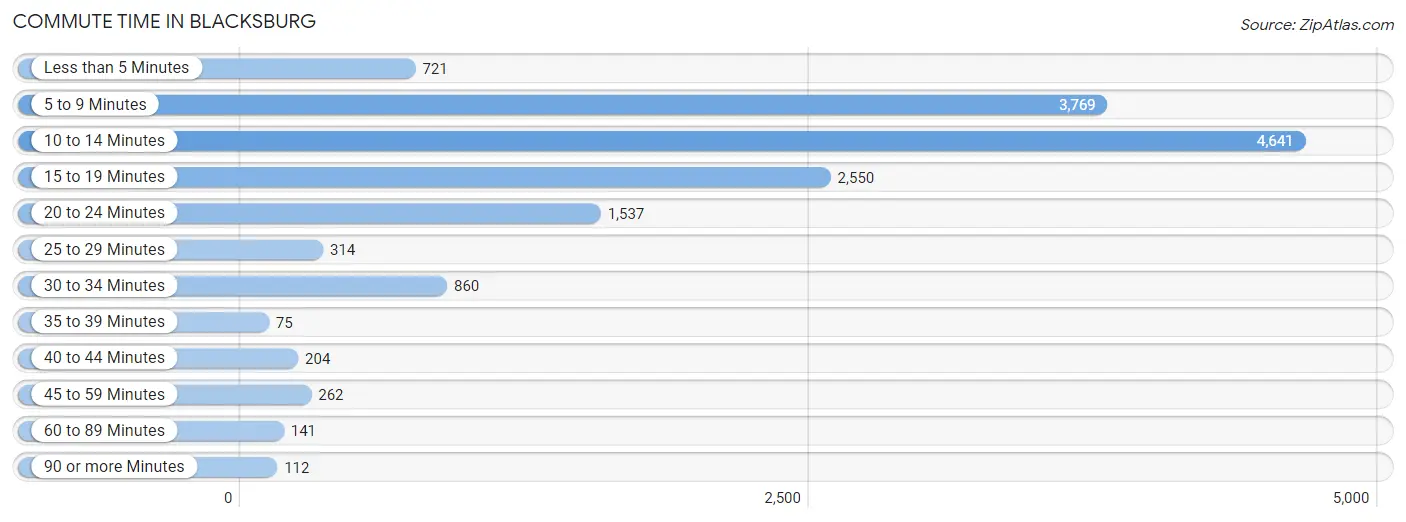
| Commute Time | # Commuters | % Commuters |
| Less than 5 Minutes | 721 | 4.8% |
| 5 to 9 Minutes | 3,769 | 24.8% |
| 10 to 14 Minutes | 4,641 | 30.6% |
| 15 to 19 Minutes | 2,550 | 16.8% |
| 20 to 24 Minutes | 1,537 | 10.1% |
| 25 to 29 Minutes | 314 | 2.1% |
| 30 to 34 Minutes | 860 | 5.7% |
| 35 to 39 Minutes | 75 | 0.5% |
| 40 to 44 Minutes | 204 | 1.3% |
| 45 to 59 Minutes | 262 | 1.7% |
| 60 to 89 Minutes | 141 | 0.9% |
| 90 or more Minutes | 112 | 0.7% |
Commute Time by Sex in Blacksburg
The most common commute times in Blacksburg are 10 to 14 minutes (2,793 commuters, 31.7%) for males and 10 to 14 minutes (1,848 commuters, 29.0%) for females.
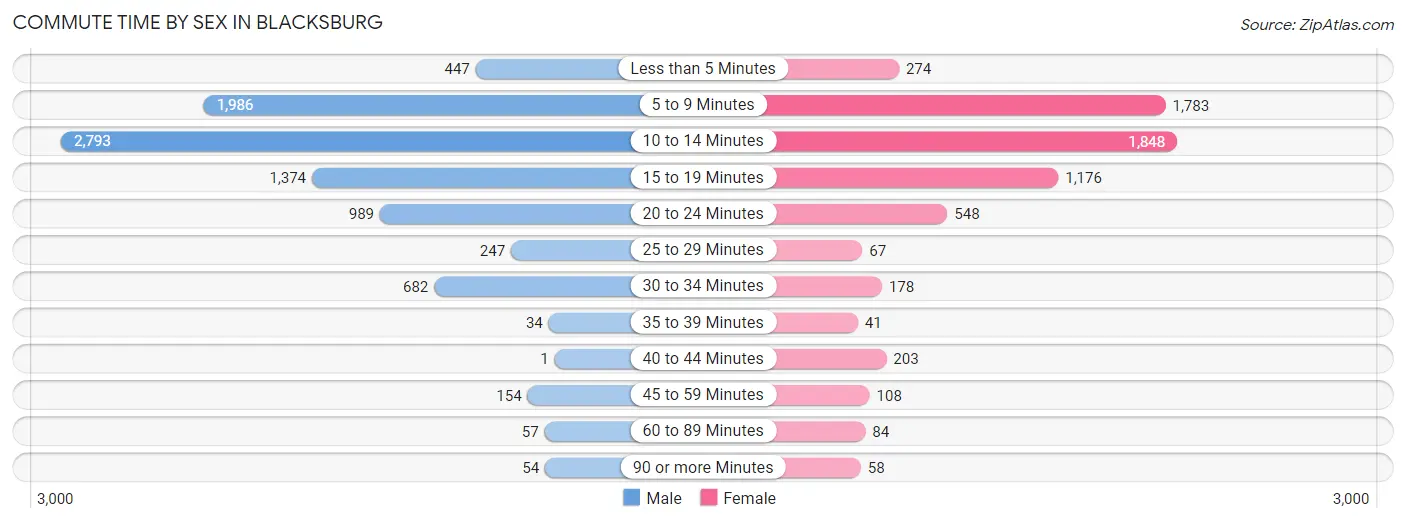
| Commute Time | Male | Female |
| Less than 5 Minutes | 447 (5.1%) | 274 (4.3%) |
| 5 to 9 Minutes | 1,986 (22.5%) | 1,783 (28.0%) |
| 10 to 14 Minutes | 2,793 (31.7%) | 1,848 (29.0%) |
| 15 to 19 Minutes | 1,374 (15.6%) | 1,176 (18.5%) |
| 20 to 24 Minutes | 989 (11.2%) | 548 (8.6%) |
| 25 to 29 Minutes | 247 (2.8%) | 67 (1.1%) |
| 30 to 34 Minutes | 682 (7.7%) | 178 (2.8%) |
| 35 to 39 Minutes | 34 (0.4%) | 41 (0.6%) |
| 40 to 44 Minutes | 1 (0.0%) | 203 (3.2%) |
| 45 to 59 Minutes | 154 (1.8%) | 108 (1.7%) |
| 60 to 89 Minutes | 57 (0.6%) | 84 (1.3%) |
| 90 or more Minutes | 54 (0.6%) | 58 (0.9%) |
Time of Departure to Work by Sex in Blacksburg
The most frequent times of departure to work in Blacksburg are 9:00 AM to 9:59 AM (1,630, 18.5%) for males and 8:00 AM to 8:29 AM (1,120, 17.6%) for females.
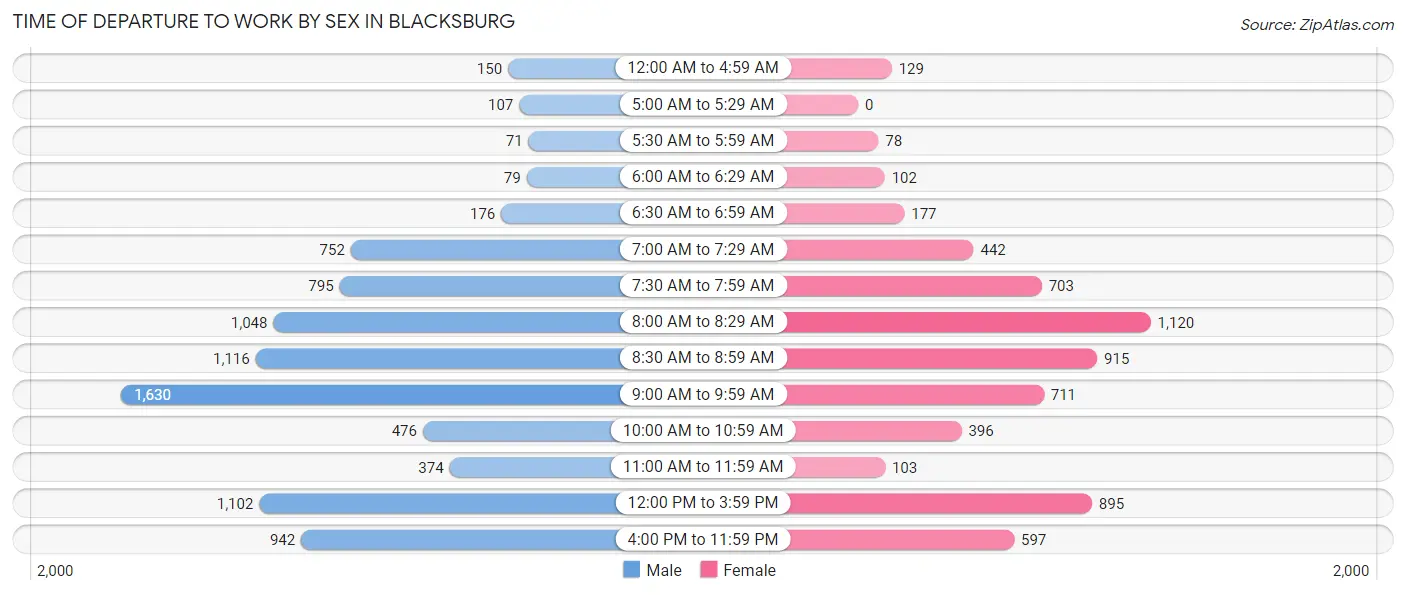
| Time of Departure | Male | Female |
| 12:00 AM to 4:59 AM | 150 (1.7%) | 129 (2.0%) |
| 5:00 AM to 5:29 AM | 107 (1.2%) | 0 (0.0%) |
| 5:30 AM to 5:59 AM | 71 (0.8%) | 78 (1.2%) |
| 6:00 AM to 6:29 AM | 79 (0.9%) | 102 (1.6%) |
| 6:30 AM to 6:59 AM | 176 (2.0%) | 177 (2.8%) |
| 7:00 AM to 7:29 AM | 752 (8.5%) | 442 (6.9%) |
| 7:30 AM to 7:59 AM | 795 (9.0%) | 703 (11.0%) |
| 8:00 AM to 8:29 AM | 1,048 (11.9%) | 1,120 (17.6%) |
| 8:30 AM to 8:59 AM | 1,116 (12.7%) | 915 (14.4%) |
| 9:00 AM to 9:59 AM | 1,630 (18.5%) | 711 (11.2%) |
| 10:00 AM to 10:59 AM | 476 (5.4%) | 396 (6.2%) |
| 11:00 AM to 11:59 AM | 374 (4.2%) | 103 (1.6%) |
| 12:00 PM to 3:59 PM | 1,102 (12.5%) | 895 (14.1%) |
| 4:00 PM to 11:59 PM | 942 (10.7%) | 597 (9.4%) |
| Total | 8,818 (100.0%) | 6,368 (100.0%) |
Housing Occupancy in Blacksburg
Occupancy by Ownership in Blacksburg
Of the total 13,318 dwellings in Blacksburg, owner-occupied units account for 4,419 (33.2%), while renter-occupied units make up 8,899 (66.8%).
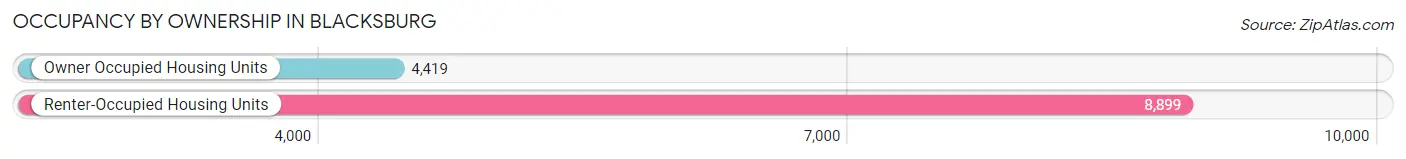
| Occupancy | # Housing Units | % Housing Units |
| Owner Occupied Housing Units | 4,419 | 33.2% |
| Renter-Occupied Housing Units | 8,899 | 66.8% |
| Total Occupied Housing Units | 13,318 | 100.0% |
Occupancy by Household Size in Blacksburg
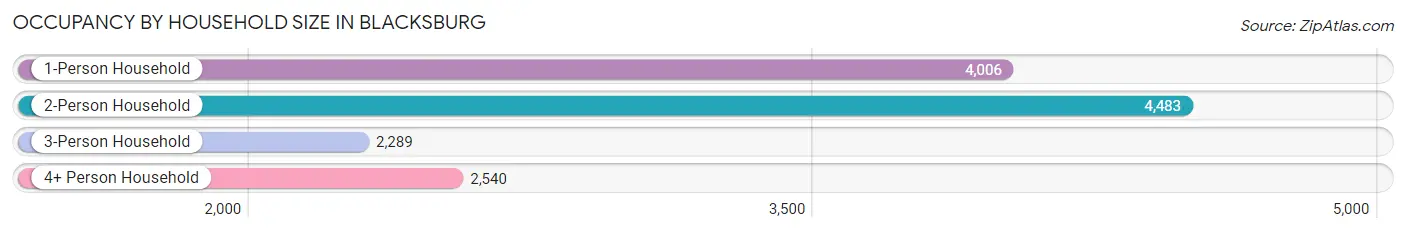
| Household Size | # Housing Units | % Housing Units |
| 1-Person Household | 4,006 | 30.1% |
| 2-Person Household | 4,483 | 33.7% |
| 3-Person Household | 2,289 | 17.2% |
| 4+ Person Household | 2,540 | 19.1% |
| Total Housing Units | 13,318 | 100.0% |
Occupancy by Ownership by Household Size in Blacksburg
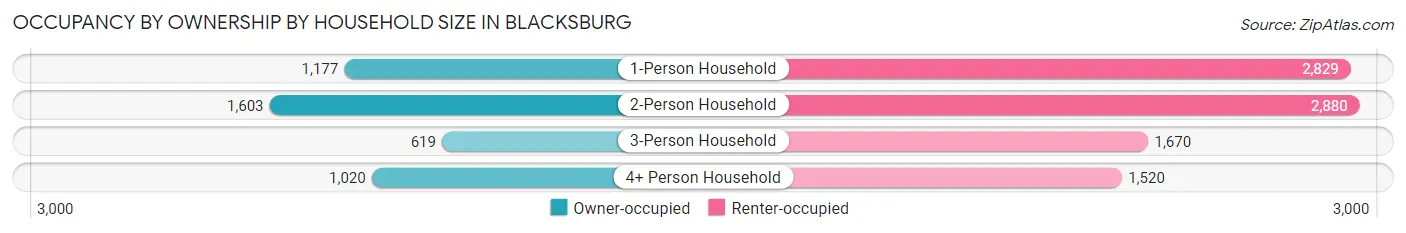
| Household Size | Owner-occupied | Renter-occupied |
| 1-Person Household | 1,177 (29.4%) | 2,829 (70.6%) |
| 2-Person Household | 1,603 (35.8%) | 2,880 (64.2%) |
| 3-Person Household | 619 (27.0%) | 1,670 (73.0%) |
| 4+ Person Household | 1,020 (40.2%) | 1,520 (59.8%) |
| Total Housing Units | 4,419 (33.2%) | 8,899 (66.8%) |
Occupancy by Educational Attainment in Blacksburg
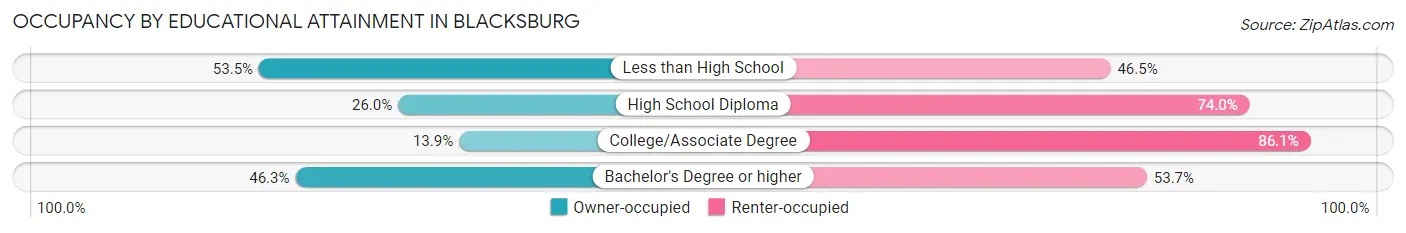
| Household Size | Owner-occupied | Renter-occupied |
| Less than High School | 53 (53.5%) | 46 (46.5%) |
| High School Diploma | 284 (26.0%) | 810 (74.0%) |
| College/Associate Degree | 657 (13.9%) | 4,076 (86.1%) |
| Bachelor's Degree or higher | 3,425 (46.3%) | 3,967 (53.7%) |
Occupancy by Age of Householder in Blacksburg
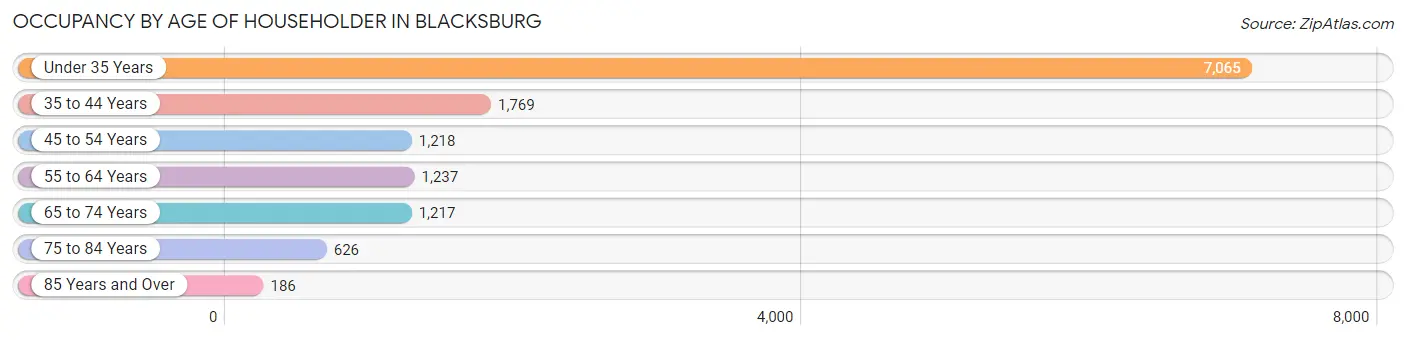
| Age Bracket | # Households | % Households |
| Under 35 Years | 7,065 | 53.0% |
| 35 to 44 Years | 1,769 | 13.3% |
| 45 to 54 Years | 1,218 | 9.1% |
| 55 to 64 Years | 1,237 | 9.3% |
| 65 to 74 Years | 1,217 | 9.1% |
| 75 to 84 Years | 626 | 4.7% |
| 85 Years and Over | 186 | 1.4% |
| Total | 13,318 | 100.0% |
Housing Finances in Blacksburg
Median Income by Occupancy in Blacksburg
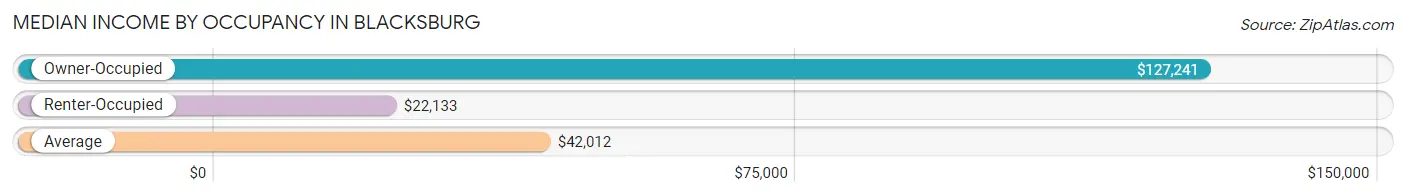
| Occupancy Type | # Households | Median Income |
| Owner-Occupied | 4,419 (33.2%) | $127,241 |
| Renter-Occupied | 8,899 (66.8%) | $22,133 |
| Average | 13,318 (100.0%) | $42,012 |
Occupancy by Householder Income Bracket in Blacksburg
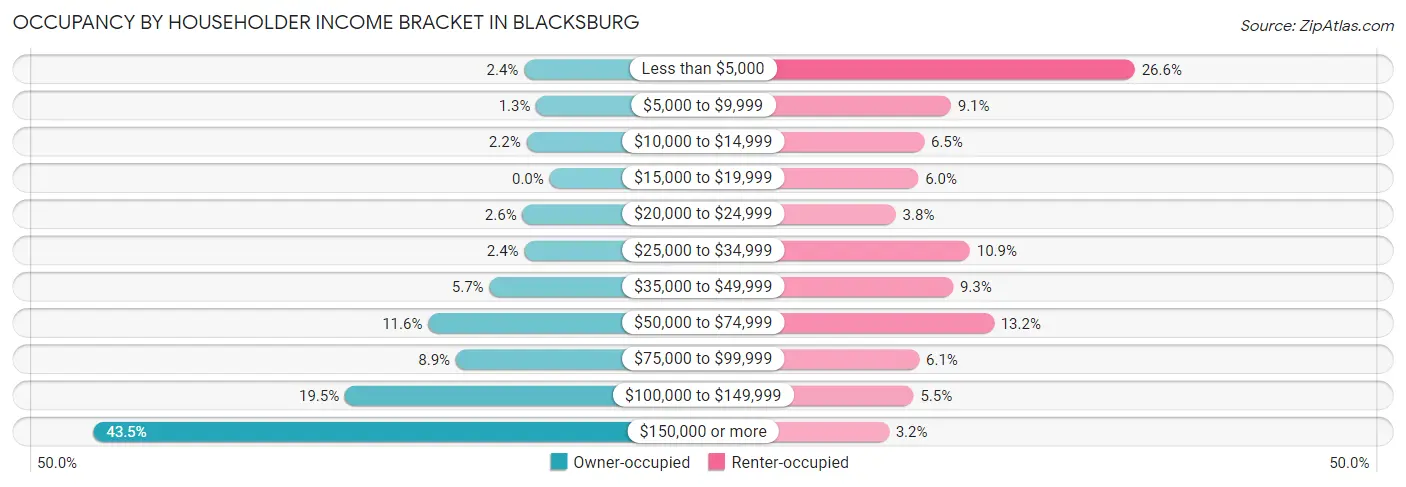
| Income Bracket | Owner-occupied | Renter-occupied |
| Less than $5,000 | 107 (2.4%) | 2,366 (26.6%) |
| $5,000 to $9,999 | 56 (1.3%) | 807 (9.1%) |
| $10,000 to $14,999 | 97 (2.2%) | 580 (6.5%) |
| $15,000 to $19,999 | 0 (0.0%) | 531 (6.0%) |
| $20,000 to $24,999 | 114 (2.6%) | 340 (3.8%) |
| $25,000 to $34,999 | 106 (2.4%) | 968 (10.9%) |
| $35,000 to $49,999 | 253 (5.7%) | 826 (9.3%) |
| $50,000 to $74,999 | 511 (11.6%) | 1,171 (13.2%) |
| $75,000 to $99,999 | 394 (8.9%) | 538 (6.0%) |
| $100,000 to $149,999 | 861 (19.5%) | 491 (5.5%) |
| $150,000 or more | 1,920 (43.4%) | 281 (3.2%) |
| Total | 4,419 (100.0%) | 8,899 (100.0%) |
Monthly Housing Cost Tiers in Blacksburg
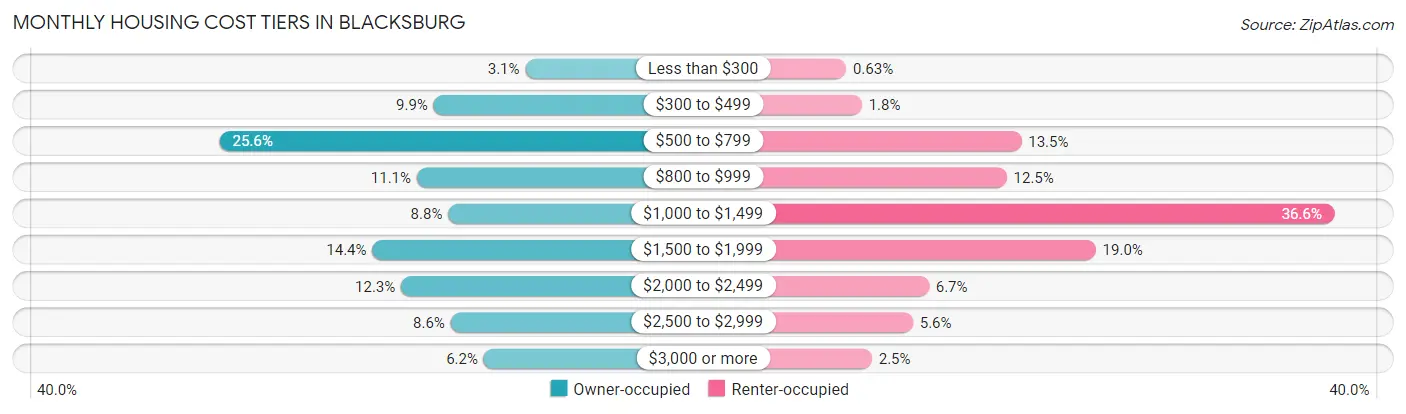
| Monthly Cost | Owner-occupied | Renter-occupied |
| Less than $300 | 138 (3.1%) | 56 (0.6%) |
| $300 to $499 | 436 (9.9%) | 159 (1.8%) |
| $500 to $799 | 1,133 (25.6%) | 1,205 (13.5%) |
| $800 to $999 | 491 (11.1%) | 1,109 (12.5%) |
| $1,000 to $1,499 | 389 (8.8%) | 3,253 (36.5%) |
| $1,500 to $1,999 | 636 (14.4%) | 1,693 (19.0%) |
| $2,000 to $2,499 | 542 (12.3%) | 599 (6.7%) |
| $2,500 to $2,999 | 381 (8.6%) | 494 (5.6%) |
| $3,000 or more | 273 (6.2%) | 225 (2.5%) |
| Total | 4,419 (100.0%) | 8,899 (100.0%) |
Physical Housing Characteristics in Blacksburg
Housing Structures in Blacksburg
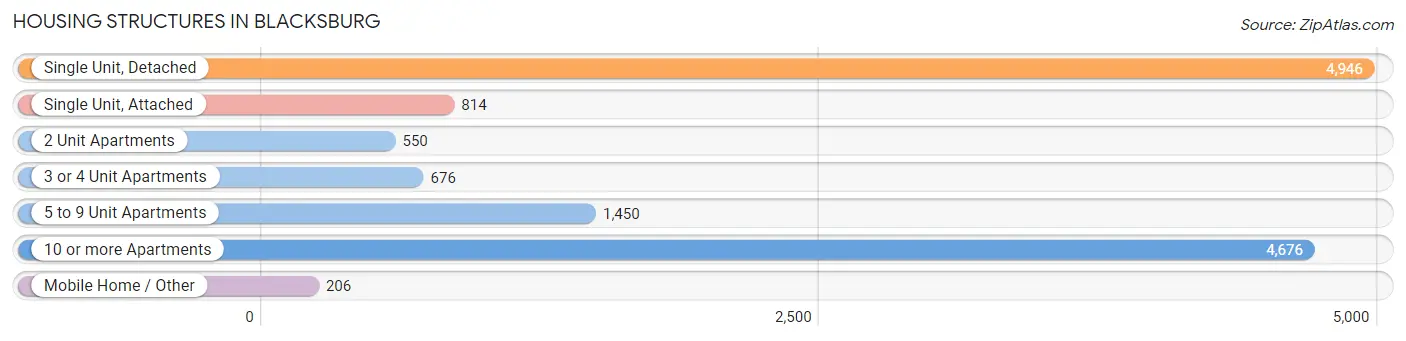
| Structure Type | # Housing Units | % Housing Units |
| Single Unit, Detached | 4,946 | 37.1% |
| Single Unit, Attached | 814 | 6.1% |
| 2 Unit Apartments | 550 | 4.1% |
| 3 or 4 Unit Apartments | 676 | 5.1% |
| 5 to 9 Unit Apartments | 1,450 | 10.9% |
| 10 or more Apartments | 4,676 | 35.1% |
| Mobile Home / Other | 206 | 1.5% |
| Total | 13,318 | 100.0% |
Housing Structures by Occupancy in Blacksburg
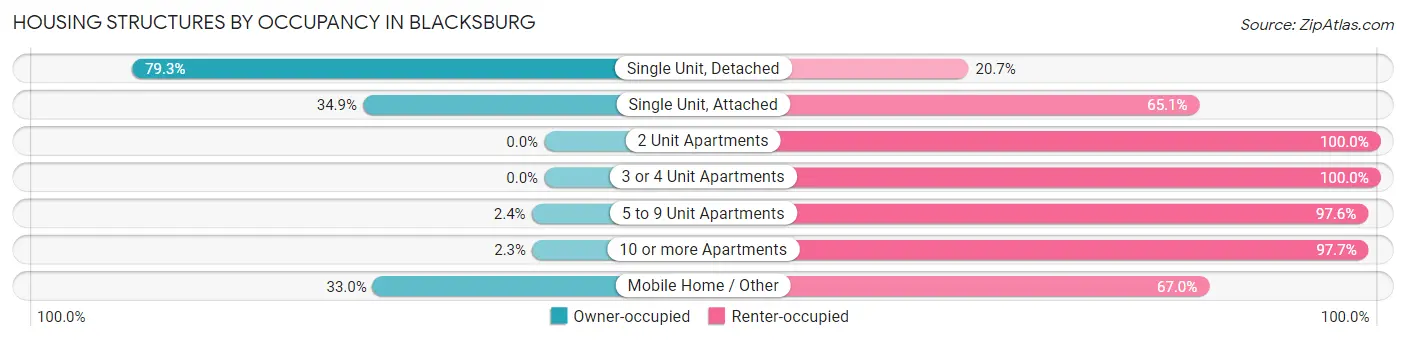
| Structure Type | Owner-occupied | Renter-occupied |
| Single Unit, Detached | 3,923 (79.3%) | 1,023 (20.7%) |
| Single Unit, Attached | 284 (34.9%) | 530 (65.1%) |
| 2 Unit Apartments | 0 (0.0%) | 550 (100.0%) |
| 3 or 4 Unit Apartments | 0 (0.0%) | 676 (100.0%) |
| 5 to 9 Unit Apartments | 35 (2.4%) | 1,415 (97.6%) |
| 10 or more Apartments | 109 (2.3%) | 4,567 (97.7%) |
| Mobile Home / Other | 68 (33.0%) | 138 (67.0%) |
| Total | 4,419 (33.2%) | 8,899 (66.8%) |
Housing Structures by Number of Rooms in Blacksburg
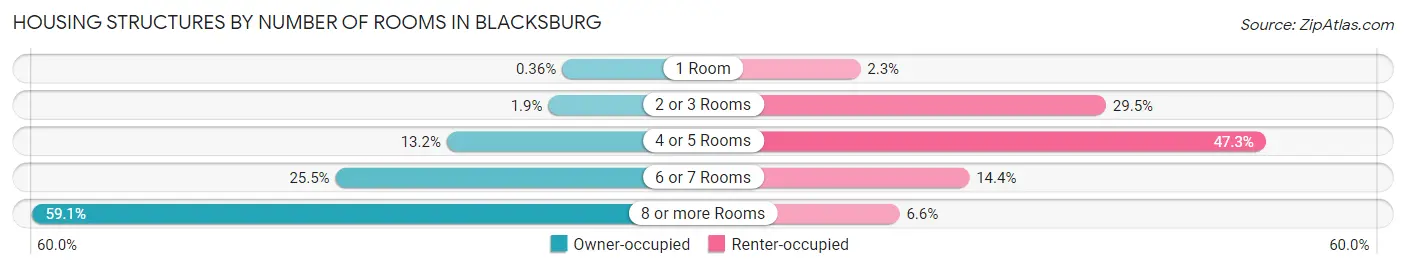
| Number of Rooms | Owner-occupied | Renter-occupied |
| 1 Room | 16 (0.4%) | 202 (2.3%) |
| 2 or 3 Rooms | 83 (1.9%) | 2,627 (29.5%) |
| 4 or 5 Rooms | 581 (13.2%) | 4,205 (47.2%) |
| 6 or 7 Rooms | 1,127 (25.5%) | 1,277 (14.3%) |
| 8 or more Rooms | 2,612 (59.1%) | 588 (6.6%) |
| Total | 4,419 (100.0%) | 8,899 (100.0%) |
Housing Structure by Heating Type in Blacksburg
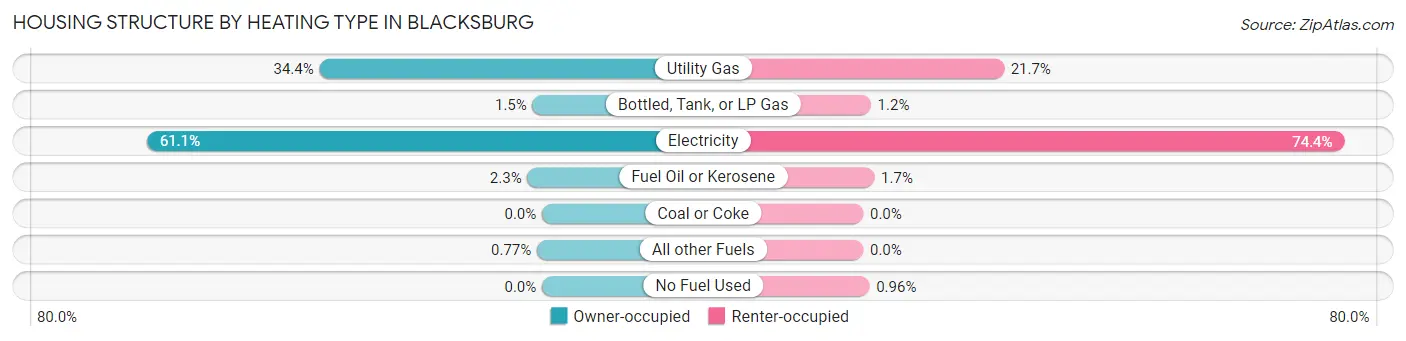
| Heating Type | Owner-occupied | Renter-occupied |
| Utility Gas | 1,520 (34.4%) | 1,935 (21.7%) |
| Bottled, Tank, or LP Gas | 65 (1.5%) | 105 (1.2%) |
| Electricity | 2,700 (61.1%) | 6,621 (74.4%) |
| Fuel Oil or Kerosene | 100 (2.3%) | 153 (1.7%) |
| Coal or Coke | 0 (0.0%) | 0 (0.0%) |
| All other Fuels | 34 (0.8%) | 0 (0.0%) |
| No Fuel Used | 0 (0.0%) | 85 (1.0%) |
| Total | 4,419 (100.0%) | 8,899 (100.0%) |
Household Vehicle Usage in Blacksburg
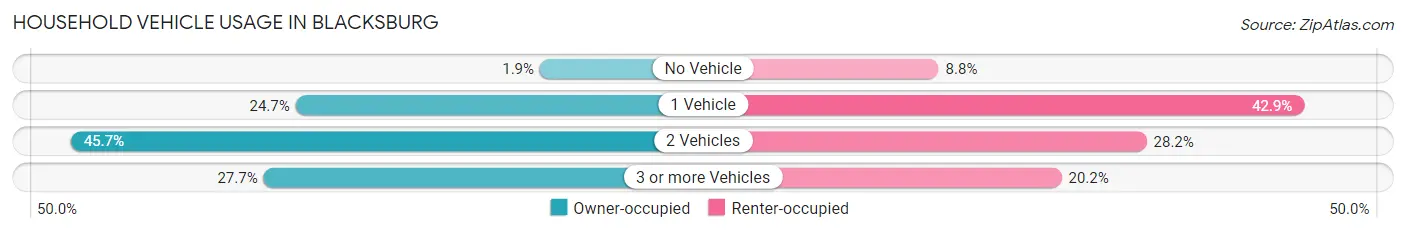
| Vehicles per Household | Owner-occupied | Renter-occupied |
| No Vehicle | 84 (1.9%) | 779 (8.7%) |
| 1 Vehicle | 1,092 (24.7%) | 3,815 (42.9%) |
| 2 Vehicles | 2,019 (45.7%) | 2,506 (28.2%) |
| 3 or more Vehicles | 1,224 (27.7%) | 1,799 (20.2%) |
| Total | 4,419 (100.0%) | 8,899 (100.0%) |
Real Estate & Mortgages in Blacksburg
Real Estate and Mortgage Overview in Blacksburg
| Characteristic | Without Mortgage | With Mortgage |
| Housing Units | 2,115 | 2,304 |
| Median Property Value | $362,100 | $411,200 |
| Median Household Income | $107,232 | $1,260 |
| Monthly Housing Costs | $624 | $273 |
| Real Estate Taxes | $3,283 | $0 |
Property Value by Mortgage Status in Blacksburg
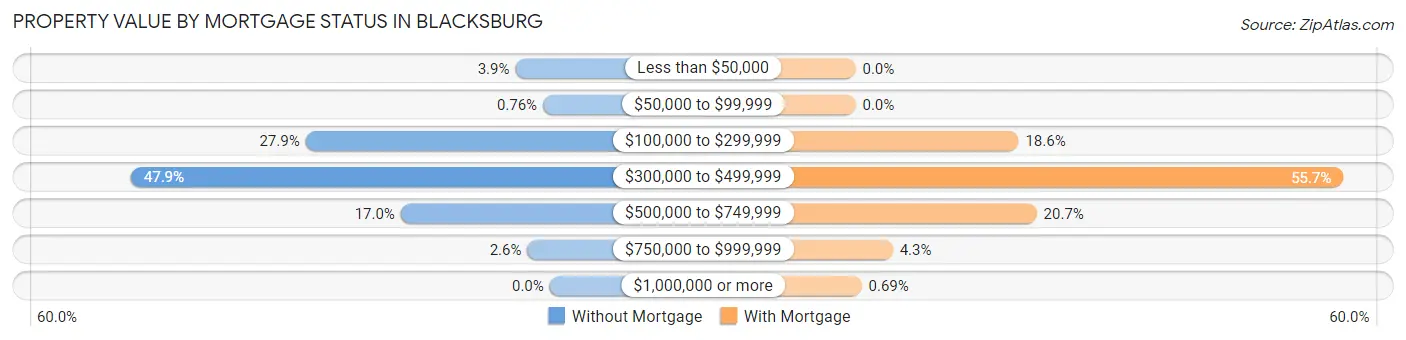
| Property Value | Without Mortgage | With Mortgage |
| Less than $50,000 | 83 (3.9%) | 0 (0.0%) |
| $50,000 to $99,999 | 16 (0.8%) | 0 (0.0%) |
| $100,000 to $299,999 | 590 (27.9%) | 429 (18.6%) |
| $300,000 to $499,999 | 1,012 (47.8%) | 1,284 (55.7%) |
| $500,000 to $749,999 | 360 (17.0%) | 477 (20.7%) |
| $750,000 to $999,999 | 54 (2.5%) | 98 (4.3%) |
| $1,000,000 or more | 0 (0.0%) | 16 (0.7%) |
| Total | 2,115 (100.0%) | 2,304 (100.0%) |
Household Income by Mortgage Status in Blacksburg
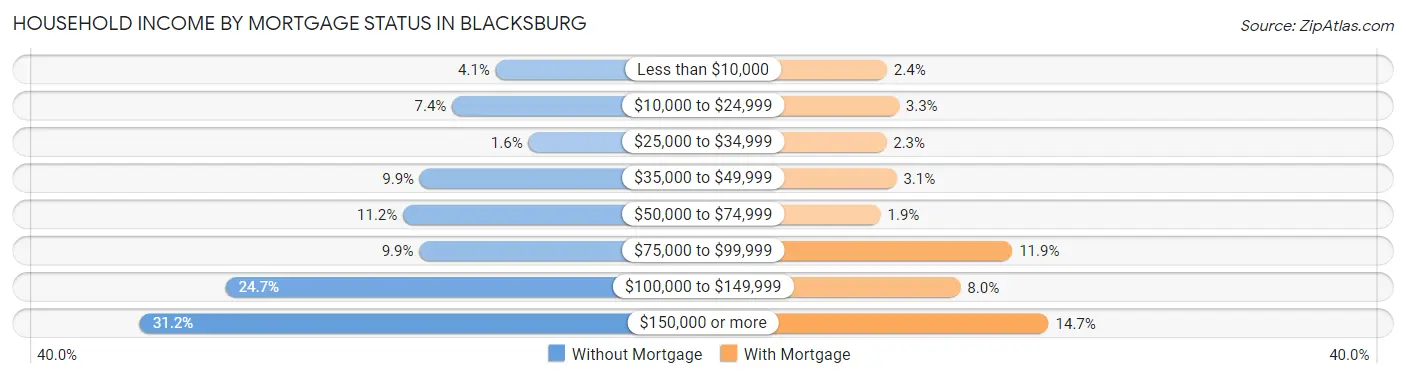
| Household Income | Without Mortgage | With Mortgage |
| Less than $10,000 | 87 (4.1%) | 55 (2.4%) |
| $10,000 to $24,999 | 157 (7.4%) | 76 (3.3%) |
| $25,000 to $34,999 | 34 (1.6%) | 54 (2.3%) |
| $35,000 to $49,999 | 209 (9.9%) | 72 (3.1%) |
| $50,000 to $74,999 | 236 (11.2%) | 44 (1.9%) |
| $75,000 to $99,999 | 210 (9.9%) | 275 (11.9%) |
| $100,000 to $149,999 | 522 (24.7%) | 184 (8.0%) |
| $150,000 or more | 660 (31.2%) | 339 (14.7%) |
| Total | 2,115 (100.0%) | 2,304 (100.0%) |
Property Value to Household Income Ratio in Blacksburg
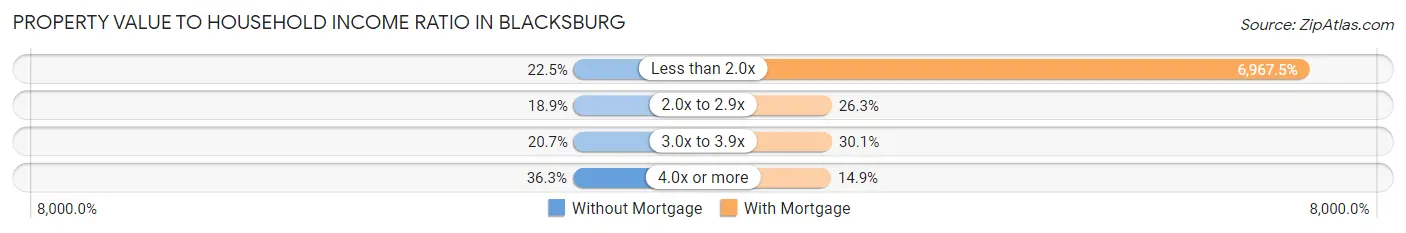
| Value-to-Income Ratio | Without Mortgage | With Mortgage |
| Less than 2.0x | 475 (22.5%) | 160,532 (6,967.5%) |
| 2.0x to 2.9x | 400 (18.9%) | 605 (26.3%) |
| 3.0x to 3.9x | 437 (20.7%) | 694 (30.1%) |
| 4.0x or more | 767 (36.3%) | 343 (14.9%) |
| Total | 2,115 (100.0%) | 2,304 (100.0%) |
Real Estate Taxes by Mortgage Status in Blacksburg
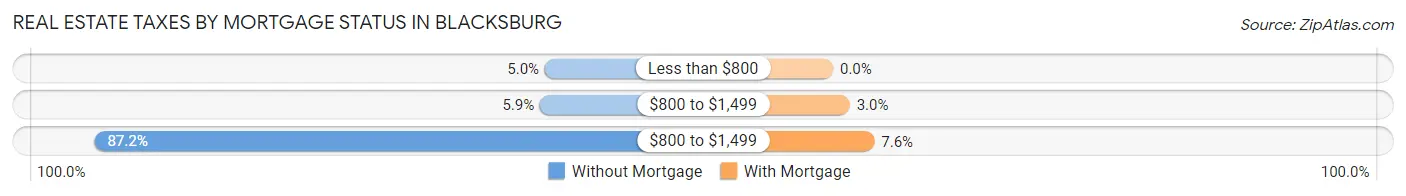
| Property Taxes | Without Mortgage | With Mortgage |
| Less than $800 | 105 (5.0%) | 0 (0.0%) |
| $800 to $1,499 | 124 (5.9%) | 70 (3.0%) |
| $800 to $1,499 | 1,845 (87.2%) | 174 (7.5%) |
| Total | 2,115 (100.0%) | 2,304 (100.0%) |
Health & Disability in Blacksburg
Health Insurance Coverage by Age in Blacksburg
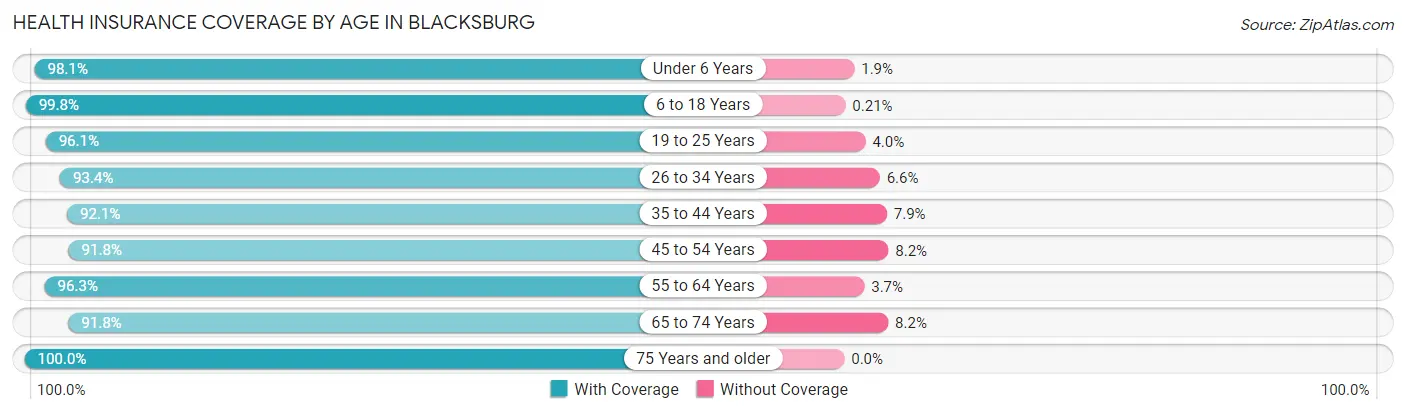
| Age Bracket | With Coverage | Without Coverage |
| Under 6 Years | 1,422 (98.1%) | 27 (1.9%) |
| 6 to 18 Years | 7,204 (99.8%) | 15 (0.2%) |
| 19 to 25 Years | 20,246 (96.1%) | 832 (4.0%) |
| 26 to 34 Years | 3,916 (93.4%) | 277 (6.6%) |
| 35 to 44 Years | 2,868 (92.1%) | 247 (7.9%) |
| 45 to 54 Years | 2,099 (91.8%) | 188 (8.2%) |
| 55 to 64 Years | 2,067 (96.3%) | 80 (3.7%) |
| 65 to 74 Years | 2,009 (91.8%) | 179 (8.2%) |
| 75 Years and older | 1,258 (100.0%) | 0 (0.0%) |
| Total | 43,089 (95.9%) | 1,845 (4.1%) |
Health Insurance Coverage by Citizenship Status in Blacksburg
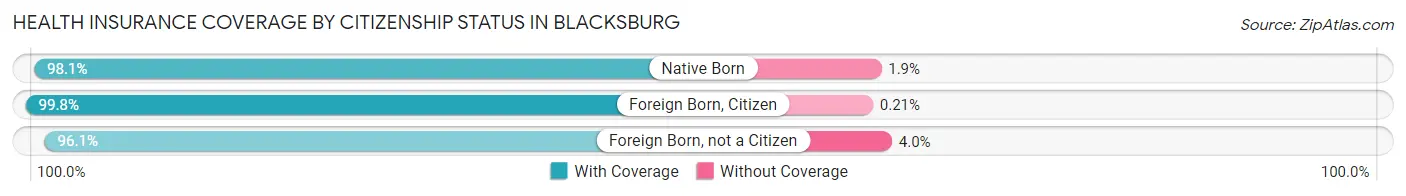
| Citizenship Status | With Coverage | Without Coverage |
| Native Born | 1,422 (98.1%) | 27 (1.9%) |
| Foreign Born, Citizen | 7,204 (99.8%) | 15 (0.2%) |
| Foreign Born, not a Citizen | 20,246 (96.1%) | 832 (4.0%) |
Health Insurance Coverage by Household Income in Blacksburg
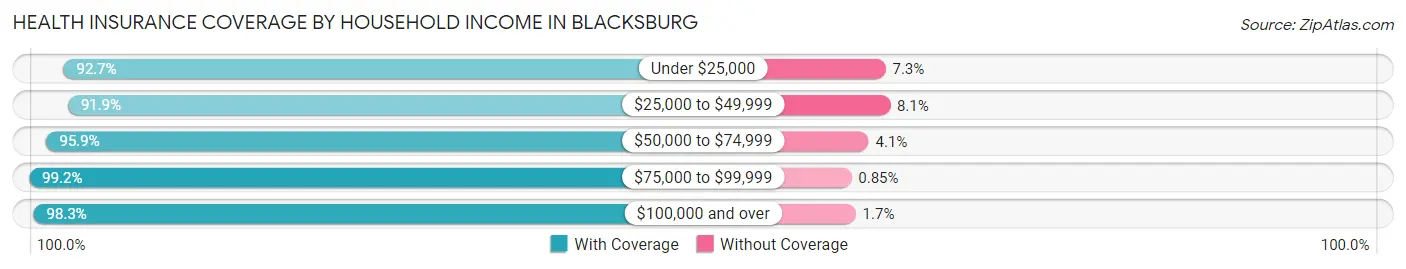
| Household Income | With Coverage | Without Coverage |
| Under $25,000 | 13,241 (92.7%) | 1,036 (7.3%) |
| $25,000 to $49,999 | 4,501 (91.9%) | 396 (8.1%) |
| $50,000 to $74,999 | 3,241 (95.9%) | 138 (4.1%) |
| $75,000 to $99,999 | 2,106 (99.2%) | 18 (0.9%) |
| $100,000 and over | 10,329 (98.3%) | 174 (1.7%) |
Public vs Private Health Insurance Coverage by Age in Blacksburg
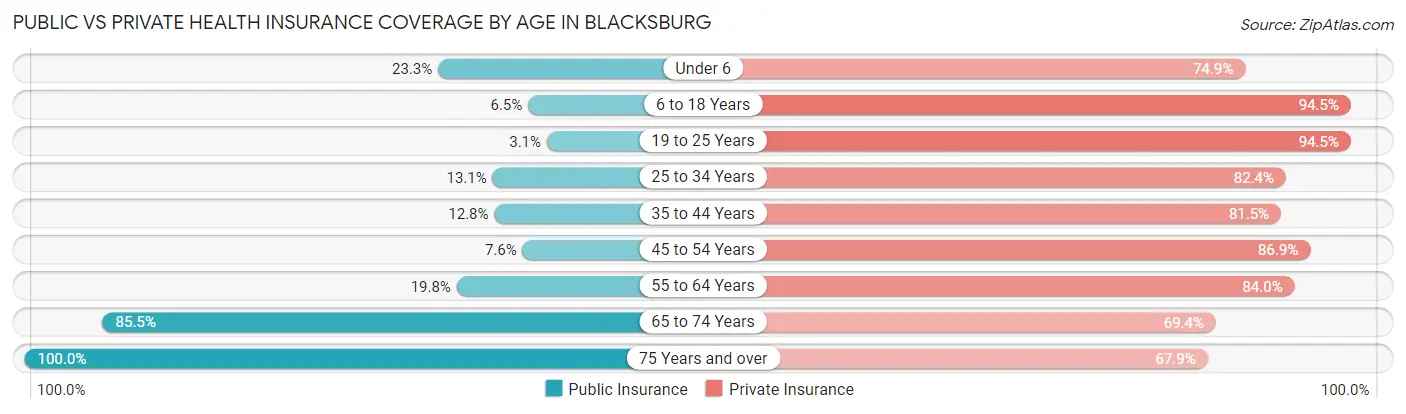
| Age Bracket | Public Insurance | Private Insurance |
| Under 6 | 337 (23.3%) | 1,085 (74.9%) |
| 6 to 18 Years | 472 (6.5%) | 6,820 (94.5%) |
| 19 to 25 Years | 644 (3.1%) | 19,913 (94.5%) |
| 25 to 34 Years | 551 (13.1%) | 3,456 (82.4%) |
| 35 to 44 Years | 399 (12.8%) | 2,539 (81.5%) |
| 45 to 54 Years | 173 (7.6%) | 1,988 (86.9%) |
| 55 to 64 Years | 425 (19.8%) | 1,804 (84.0%) |
| 65 to 74 Years | 1,871 (85.5%) | 1,519 (69.4%) |
| 75 Years and over | 1,258 (100.0%) | 854 (67.9%) |
| Total | 6,130 (13.6%) | 39,978 (89.0%) |
Disability Status by Sex by Age in Blacksburg
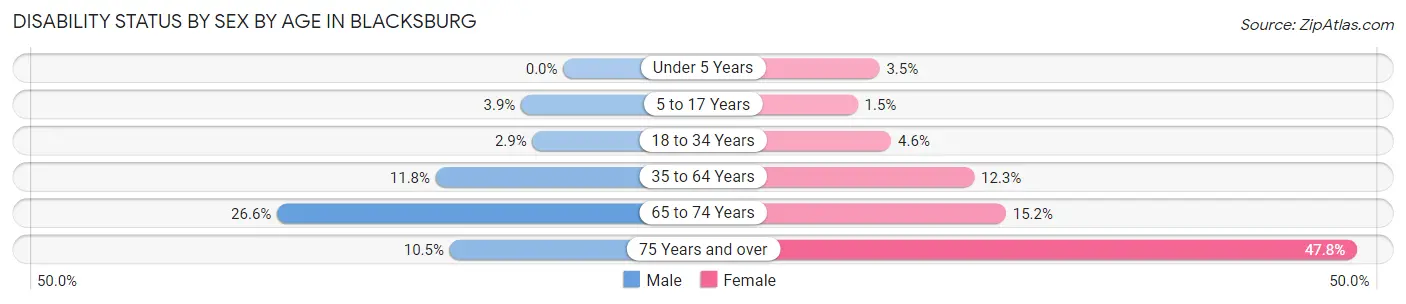
| Age Bracket | Male | Female |
| Under 5 Years | 0 (0.0%) | 15 (3.5%) |
| 5 to 17 Years | 56 (3.9%) | 26 (1.5%) |
| 18 to 34 Years | 489 (2.9%) | 567 (4.6%) |
| 35 to 64 Years | 439 (11.8%) | 471 (12.3%) |
| 65 to 74 Years | 302 (26.6%) | 160 (15.2%) |
| 75 Years and over | 53 (10.5%) | 361 (47.8%) |
Disability Class by Sex by Age in Blacksburg
Disability Class: Hearing Difficulty
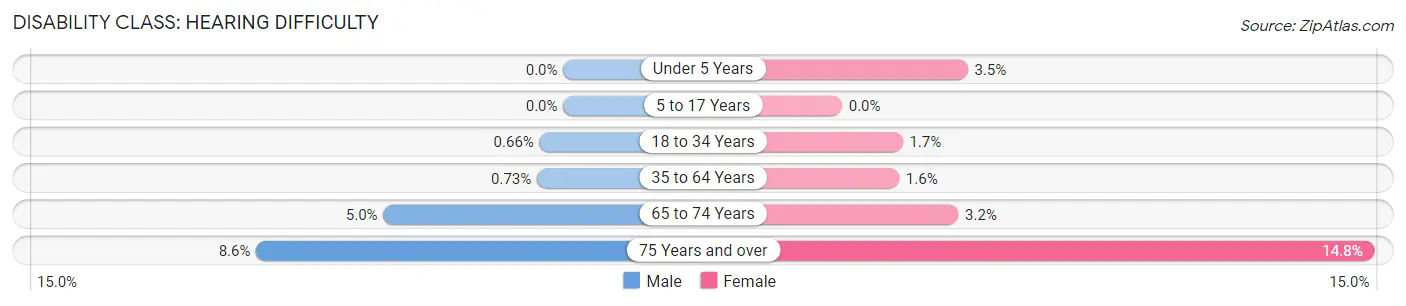
| Age Bracket | Male | Female |
| Under 5 Years | 0 (0.0%) | 15 (3.5%) |
| 5 to 17 Years | 0 (0.0%) | 0 (0.0%) |
| 18 to 34 Years | 112 (0.7%) | 209 (1.7%) |
| 35 to 64 Years | 27 (0.7%) | 61 (1.6%) |
| 65 to 74 Years | 57 (5.0%) | 34 (3.2%) |
| 75 Years and over | 43 (8.6%) | 112 (14.8%) |
Disability Class: Vision Difficulty
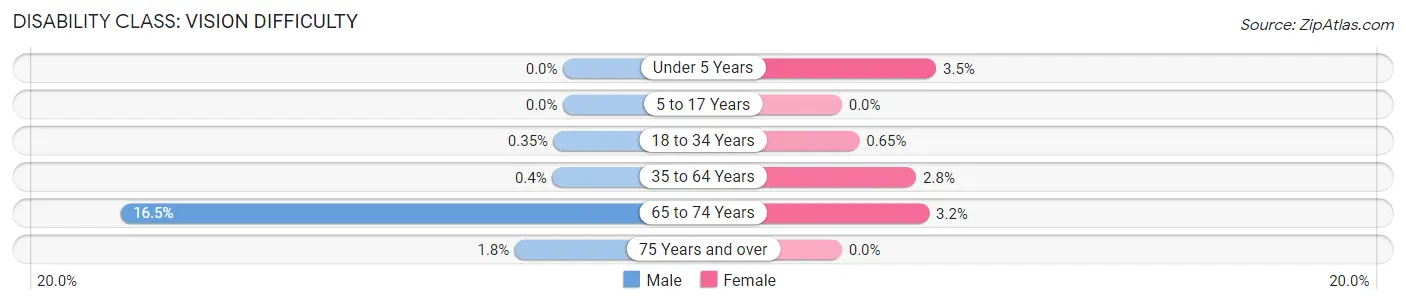
| Age Bracket | Male | Female |
| Under 5 Years | 0 (0.0%) | 15 (3.5%) |
| 5 to 17 Years | 0 (0.0%) | 0 (0.0%) |
| 18 to 34 Years | 60 (0.4%) | 80 (0.6%) |
| 35 to 64 Years | 15 (0.4%) | 106 (2.8%) |
| 65 to 74 Years | 187 (16.5%) | 34 (3.2%) |
| 75 Years and over | 9 (1.8%) | 0 (0.0%) |
Disability Class: Cognitive Difficulty
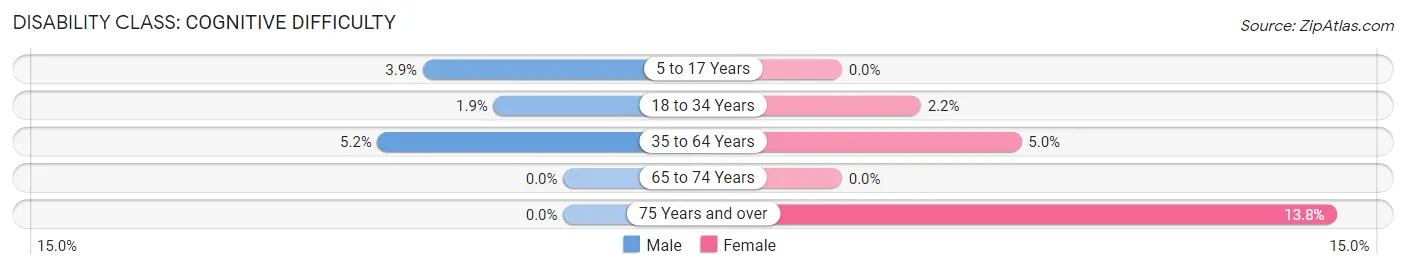
| Age Bracket | Male | Female |
| 5 to 17 Years | 56 (3.9%) | 0 (0.0%) |
| 18 to 34 Years | 332 (1.9%) | 273 (2.2%) |
| 35 to 64 Years | 192 (5.2%) | 192 (5.0%) |
| 65 to 74 Years | 0 (0.0%) | 0 (0.0%) |
| 75 Years and over | 0 (0.0%) | 104 (13.8%) |
Disability Class: Ambulatory Difficulty
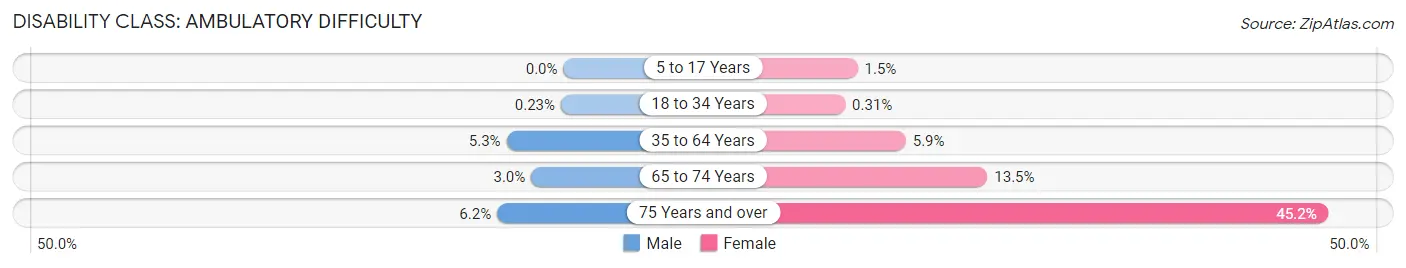
| Age Bracket | Male | Female |
| 5 to 17 Years | 0 (0.0%) | 26 (1.5%) |
| 18 to 34 Years | 40 (0.2%) | 38 (0.3%) |
| 35 to 64 Years | 196 (5.3%) | 228 (5.9%) |
| 65 to 74 Years | 34 (3.0%) | 142 (13.5%) |
| 75 Years and over | 31 (6.2%) | 341 (45.2%) |
Disability Class: Self-Care Difficulty
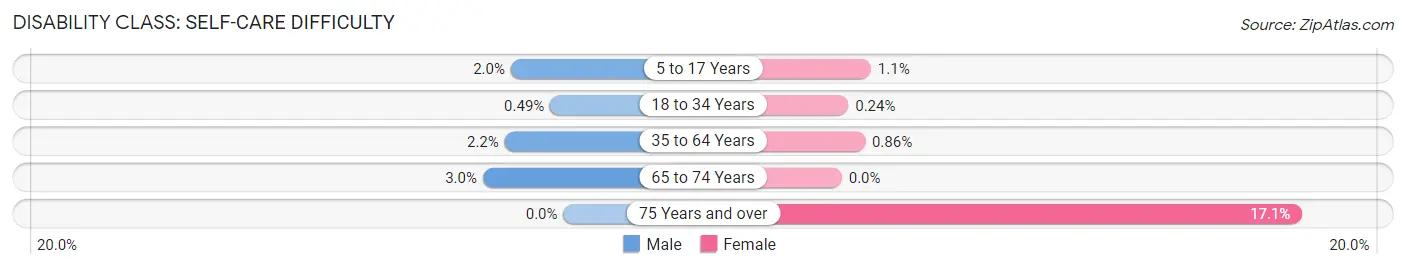
| Age Bracket | Male | Female |
| 5 to 17 Years | 28 (1.9%) | 19 (1.1%) |
| 18 to 34 Years | 83 (0.5%) | 30 (0.2%) |
| 35 to 64 Years | 81 (2.2%) | 33 (0.9%) |
| 65 to 74 Years | 34 (3.0%) | 0 (0.0%) |
| 75 Years and over | 0 (0.0%) | 129 (17.1%) |
Technology Access in Blacksburg
Computing Device Access in Blacksburg
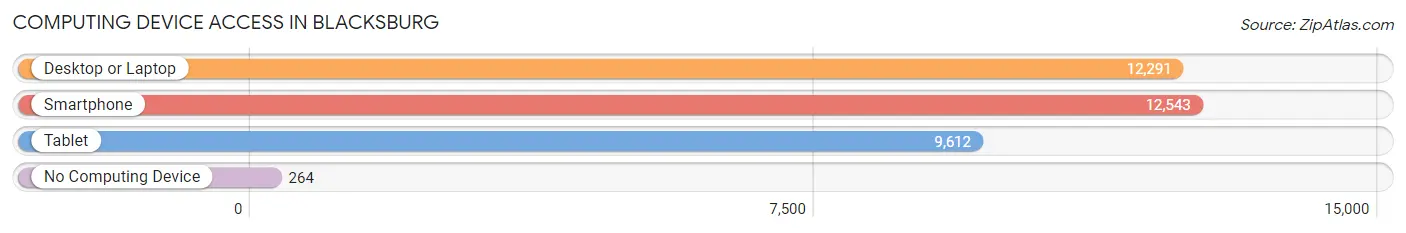
| Device Type | # Households | % Households |
| Desktop or Laptop | 12,291 | 92.3% |
| Smartphone | 12,543 | 94.2% |
| Tablet | 9,612 | 72.2% |
| No Computing Device | 264 | 2.0% |
| Total | 13,318 | 100.0% |
Internet Access in Blacksburg
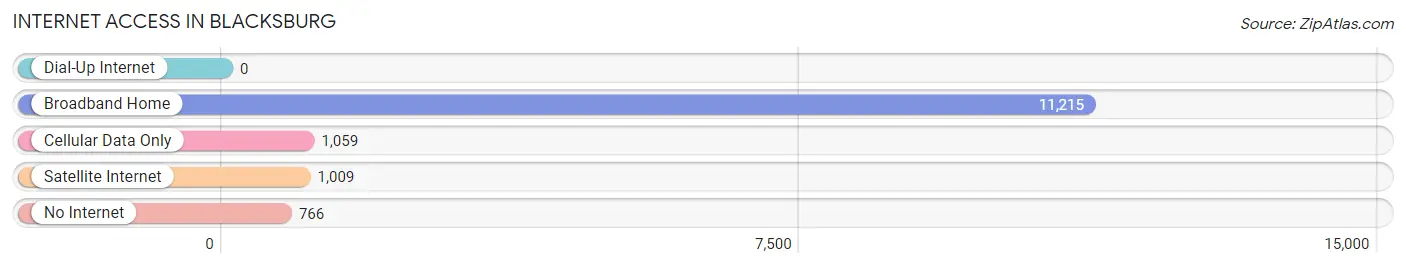
| Internet Type | # Households | % Households |
| Dial-Up Internet | 0 | 0.0% |
| Broadband Home | 11,215 | 84.2% |
| Cellular Data Only | 1,059 | 8.0% |
| Satellite Internet | 1,009 | 7.6% |
| No Internet | 766 | 5.8% |
| Total | 13,318 | 100.0% |
Blacksburg Summary
Blacksburg, Virginia is a town located in Montgomery County, Virginia. It is part of the Blacksburg-Christiansburg-Radford Metropolitan Statistical Area and is the largest town in the county. The town is home to Virginia Tech, a public research university, and is the economic and cultural hub of the New River Valley.
History
Blacksburg was founded in 1798 by William Black, a settler from Botetourt County. The town was originally known as Blacks Fort, but the name was changed to Blacksburg in 1833. The town was incorporated in 1871 and has since grown to become the largest town in Montgomery County.
The town was a major stop on the Virginia and Tennessee Railroad, which connected the town to the rest of the state. The railroad was a major factor in the town’s growth and development. In 1872, the Virginia Agricultural and Mechanical College (now Virginia Tech) was established in Blacksburg. The college has since become the largest employer in the town and has helped to shape the town’s economy and culture.
Geography
Blacksburg is located in the Blue Ridge Mountains of southwestern Virginia. The town is situated in the New River Valley, which is a major agricultural region of the state. The town is located at the intersection of U.S. Route 460 and Interstate 81. The town is approximately 160 miles southwest of Washington, D.C. and is about 25 miles from Roanoke, Virginia.
The town has a total area of 10.3 square miles, of which 10.2 square miles is land and 0.1 square miles is water. The town is located at an elevation of 2,050 feet above sea level. The town is surrounded by the Jefferson National Forest and is home to several parks, including the Huckleberry Trail and the Appalachian Trail.
Economy
Blacksburg’s economy is largely driven by Virginia Tech, which is the largest employer in the town. The university employs over 10,000 people and has an annual economic impact of over $2 billion. Other major employers in the town include Carilion Clinic, Montgomery County Public Schools, and the Montgomery County government.
The town is also home to a number of technology companies, including BAE Systems, General Dynamics, and Lockheed Martin. The town is also home to a number of small businesses, including restaurants, retail stores, and professional services.
Demographics
As of the 2010 census, the population of Blacksburg was 42,620. The population has grown steadily since the 2000 census, when the population was 39,573. The town has a population density of 4,093 people per square mile.
The racial makeup of the town is 87.3% White, 5.3% African American, 0.3% Native American, 4.2% Asian, 0.1% Pacific Islander, 1.2% from other races, and 1.6% from two or more races. The median household income in the town is $45,945 and the median family income is $63,945. The per capita income in the town is $25,945.
Blacksburg is a diverse and vibrant community that is home to a variety of people and businesses. The town is home to Virginia Tech, which is a major economic driver in the region. The town is also home to a number of small businesses and technology companies. The town has a rich history and is a great place to live, work, and play.
Common Questions
What is Per Capita Income in Blacksburg?
Per Capita income in Blacksburg is $25,268.
What is the Median Family Income in Blacksburg?
Median Family Income in Blacksburg is $113,723.
What is the Median Household income in Blacksburg?
Median Household Income in Blacksburg is $42,012.
What is Income or Wage Gap in Blacksburg?
Income or Wage Gap in Blacksburg is 21.0%.
Women in Blacksburg earn 79.0 cents for every dollar earned by a man.
What is Inequality or Gini Index in Blacksburg?
Inequality or Gini Index in Blacksburg is 0.61.
What is the Total Population of Blacksburg?
Total Population of Blacksburg is 45,147.
What is the Total Male Population of Blacksburg?
Total Male Population of Blacksburg is 24,792.
What is the Total Female Population of Blacksburg?
Total Female Population of Blacksburg is 20,355.
What is the Ratio of Males per 100 Females in Blacksburg?
There are 121.80 Males per 100 Females in Blacksburg.
What is the Ratio of Females per 100 Males in Blacksburg?
There are 82.10 Females per 100 Males in Blacksburg.
What is the Median Population Age in Blacksburg?
Median Population Age in Blacksburg is 21.7 Years.
What is the Average Family Size in Blacksburg
Average Family Size in Blacksburg is 3.0 People.
What is the Average Household Size in Blacksburg
Average Household Size in Blacksburg is 2.6 People.
How Large is the Labor Force in Blacksburg?
There are 19,690 People in the Labor Forcein in Blacksburg.
What is the Percentage of People in the Labor Force in Blacksburg?
47.7% of People are in the Labor Force in Blacksburg.
What is the Unemployment Rate in Blacksburg?
Unemployment Rate in Blacksburg is 3.4%.