Falls Church, VA Map & Demographics
Falls Church Map
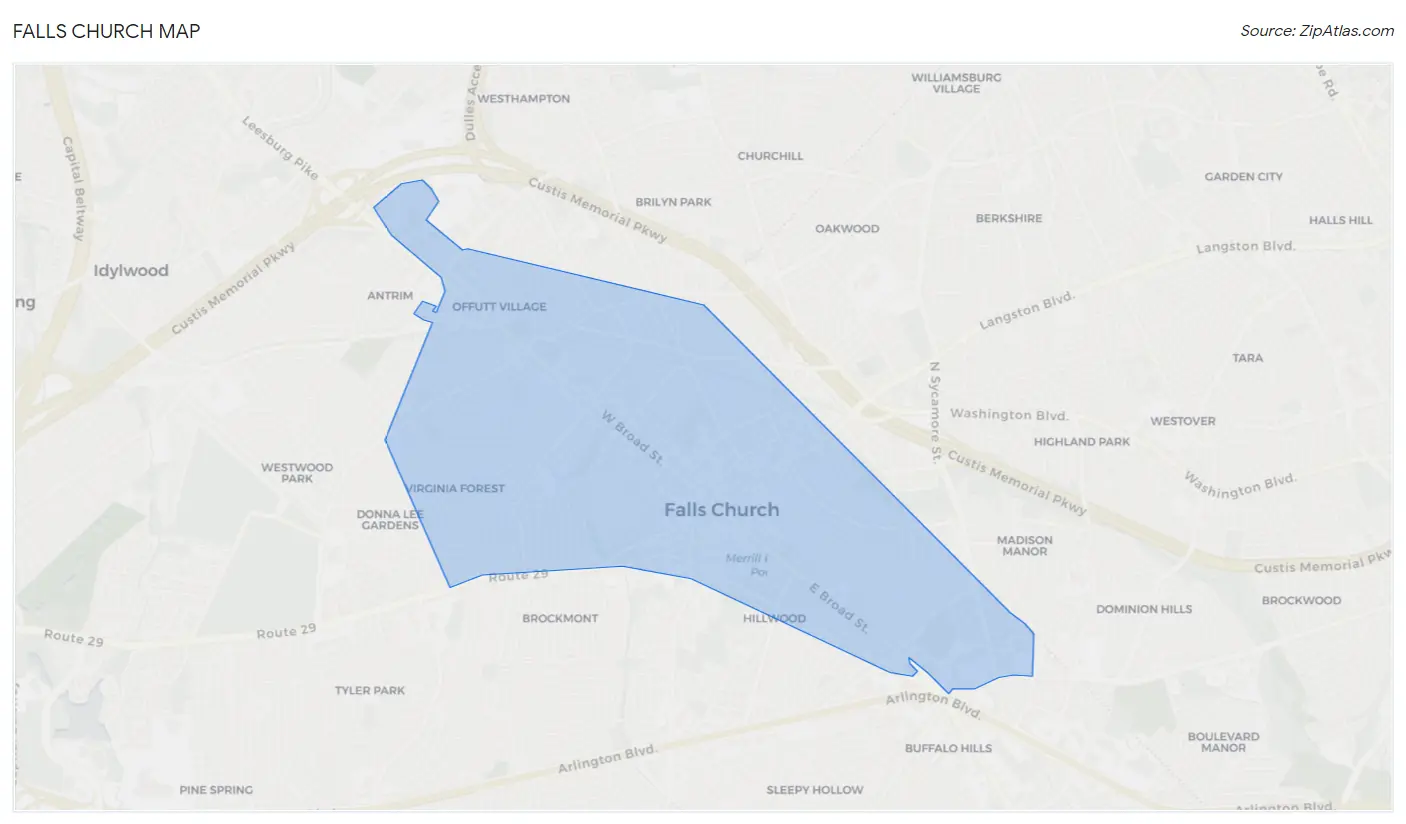
Falls Church Overview
$83,001
PER CAPITA INCOME
$207,090
AVG FAMILY INCOME
$164,536
AVG HOUSEHOLD INCOME
44.3%
WAGE / INCOME GAP [ % ]
55.7¢/ $1
WAGE / INCOME GAP [ $ ]
0.44
INEQUALITY / GINI INDEX
14,576
TOTAL POPULATION
7,274
MALE POPULATION
7,302
FEMALE POPULATION
99.62
MALES / 100 FEMALES
100.38
FEMALES / 100 MALES
38.8
MEDIAN AGE
3.3
AVG FAMILY SIZE
2.5
AVG HOUSEHOLD SIZE
8,570
LABOR FORCE [ PEOPLE ]
73.7%
PERCENT IN LABOR FORCE
6.0%
UNEMPLOYMENT RATE
Income in Falls Church
Income Overview in Falls Church
Per Capita Income in Falls Church is $83,001, while median incomes of families and households are $207,090 and $164,536 respectively.
| Characteristic | Number | Measure |
| Per Capita Income | 14,576 | $83,001 |
| Median Family Income | 3,457 | $207,090 |
| Mean Family Income | 3,457 | $261,255 |
| Median Household Income | 5,740 | $164,536 |
| Mean Household Income | 5,740 | $209,659 |
| Income Deficit | 3,457 | $0 |
| Wage / Income Gap (%) | 14,576 | 44.29% |
| Wage / Income Gap ($) | 14,576 | 55.71¢ per $1 |
| Gini / Inequality Index | 14,576 | 0.44 |
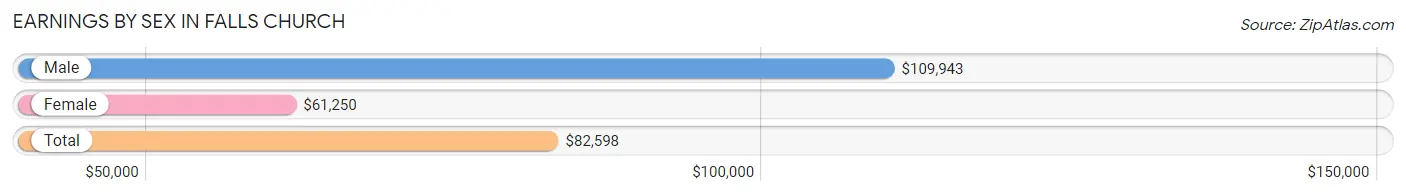
Earnings by Sex in Falls Church
Average Earnings in Falls Church are $82,598, $109,943 for men and $61,250 for women, a difference of 44.3%.
| Sex | Number | Average Earnings |
| Male | 4,455 (49.6%) | $109,943 |
| Female | 4,527 (50.4%) | $61,250 |
| Total | 8,982 (100.0%) | $82,598 |
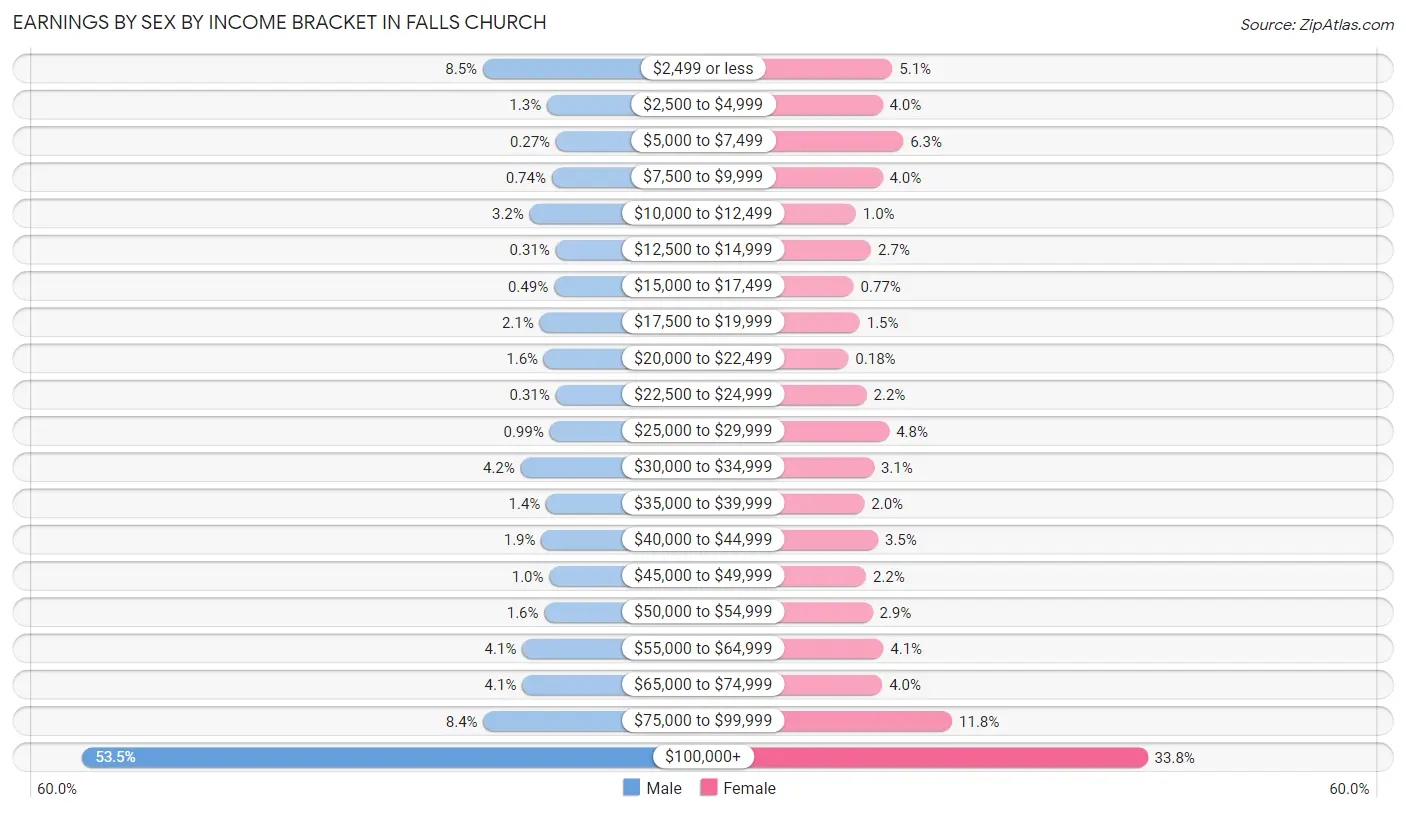
Earnings by Sex by Income Bracket in Falls Church
The most common earnings brackets in Falls Church are $100,000+ for men (2,384 | 53.5%) and $100,000+ for women (1,531 | 33.8%).
| Income | Male | Female |
| $2,499 or less | 378 (8.5%) | 232 (5.1%) |
| $2,500 to $4,999 | 57 (1.3%) | 182 (4.0%) |
| $5,000 to $7,499 | 12 (0.3%) | 287 (6.3%) |
| $7,500 to $9,999 | 33 (0.7%) | 182 (4.0%) |
| $10,000 to $12,499 | 144 (3.2%) | 46 (1.0%) |
| $12,500 to $14,999 | 14 (0.3%) | 124 (2.7%) |
| $15,000 to $17,499 | 22 (0.5%) | 35 (0.8%) |
| $17,500 to $19,999 | 94 (2.1%) | 66 (1.5%) |
| $20,000 to $22,499 | 72 (1.6%) | 8 (0.2%) |
| $22,500 to $24,999 | 14 (0.3%) | 101 (2.2%) |
| $25,000 to $29,999 | 44 (1.0%) | 216 (4.8%) |
| $30,000 to $34,999 | 189 (4.2%) | 138 (3.0%) |
| $35,000 to $39,999 | 61 (1.4%) | 89 (2.0%) |
| $40,000 to $44,999 | 85 (1.9%) | 159 (3.5%) |
| $45,000 to $49,999 | 45 (1.0%) | 98 (2.2%) |
| $50,000 to $54,999 | 70 (1.6%) | 131 (2.9%) |
| $55,000 to $64,999 | 181 (4.1%) | 186 (4.1%) |
| $65,000 to $74,999 | 181 (4.1%) | 180 (4.0%) |
| $75,000 to $99,999 | 375 (8.4%) | 536 (11.8%) |
| $100,000+ | 2,384 (53.5%) | 1,531 (33.8%) |
| Total | 4,455 (100.0%) | 4,527 (100.0%) |
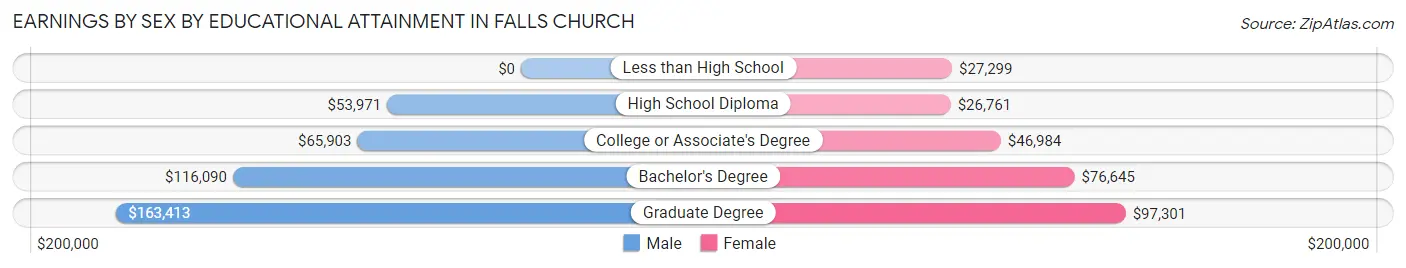
Earnings by Sex by Educational Attainment in Falls Church
Average earnings in Falls Church are $129,969 for men and $78,534 for women, a difference of 39.6%. Men with an educational attainment of graduate degree enjoy the highest average annual earnings of $163,413, while those with high school diploma education earn the least with $53,971. Women with an educational attainment of graduate degree earn the most with the average annual earnings of $97,301, while those with high school diploma education have the smallest earnings of $26,761.
| Educational Attainment | Male Income | Female Income |
| Less than High School | - | - |
| High School Diploma | $53,971 | $26,761 |
| College or Associate's Degree | $65,903 | $46,984 |
| Bachelor's Degree | $116,090 | $76,645 |
| Graduate Degree | $163,413 | $97,301 |
| Total | $129,969 | $78,534 |
Family Income in Falls Church
Family Income Brackets in Falls Church
According to the Falls Church family income data, there are 1,822 families falling into the $200,000+ income range, which is the most common income bracket and makes up 52.7% of all families. Conversely, the $10,000 to $14,999 income bracket is the least frequent group with only 7 families (0.2%) belonging to this category.
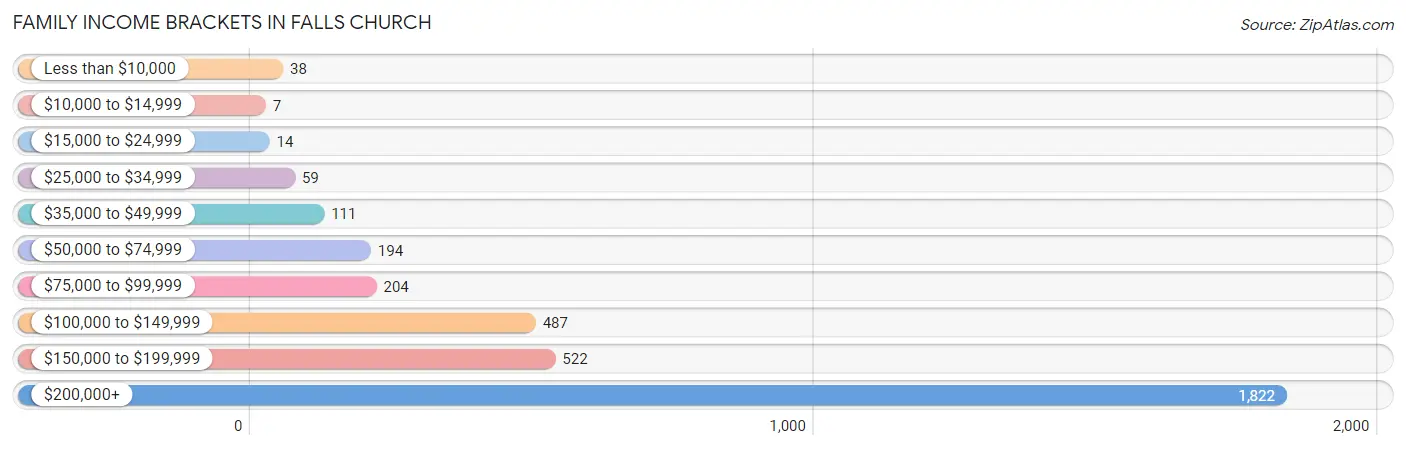
| Income Bracket | # Families | % Families |
| Less than $10,000 | 38 | 1.1% |
| $10,000 to $14,999 | 7 | 0.2% |
| $15,000 to $24,999 | 14 | 0.4% |
| $25,000 to $34,999 | 59 | 1.7% |
| $35,000 to $49,999 | 111 | 3.2% |
| $50,000 to $74,999 | 194 | 5.6% |
| $75,000 to $99,999 | 204 | 5.9% |
| $100,000 to $149,999 | 487 | 14.1% |
| $150,000 to $199,999 | 522 | 15.1% |
| $200,000+ | 1,822 | 52.7% |
Family Income by Famaliy Size in Falls Church
4-person families (767 | 22.2%) account for the highest median family income in Falls Church with $250,001 per family, while 2-person families (1,264 | 36.6%) have the highest median income of $80,500 per family member.
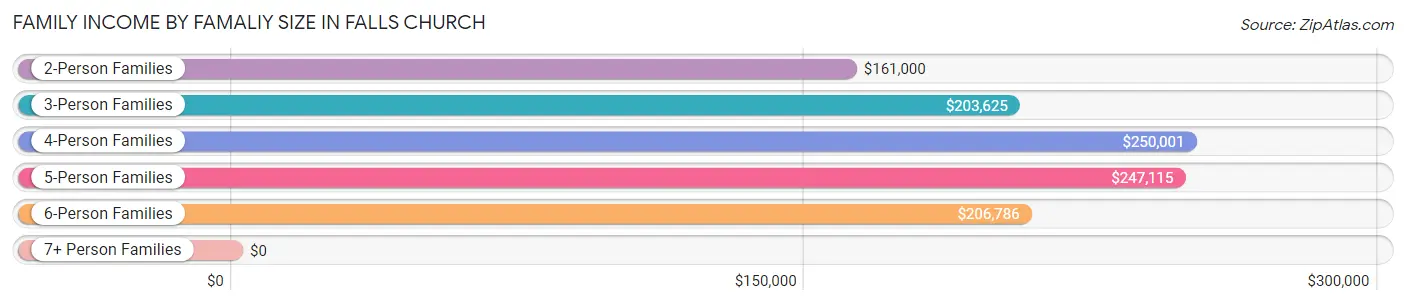
| Income Bracket | # Families | Median Income |
| 2-Person Families | 1,264 (36.6%) | $161,000 |
| 3-Person Families | 1,000 (28.9%) | $203,625 |
| 4-Person Families | 767 (22.2%) | $250,001 |
| 5-Person Families | 390 (11.3%) | $247,115 |
| 6-Person Families | 32 (0.9%) | $206,786 |
| 7+ Person Families | 4 (0.1%) | $0 |
| Total | 3,457 (100.0%) | $207,090 |
Family Income by Number of Earners in Falls Church
The median family income in Falls Church is $207,090, with families comprising 2 earners (1,613) having the highest median family income of $250,001, while families with no earners (283) have the lowest median family income of $107,946, accounting for 46.7% and 8.2% of families, respectively.
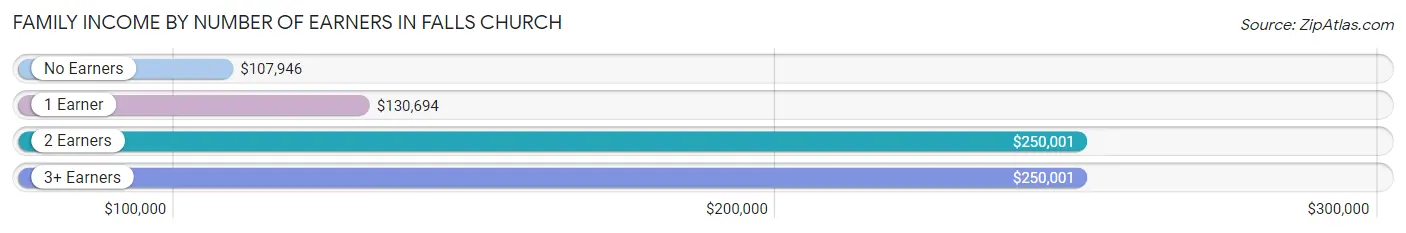
| Number of Earners | # Families | Median Income |
| No Earners | 283 (8.2%) | $107,946 |
| 1 Earner | 1,001 (29.0%) | $130,694 |
| 2 Earners | 1,613 (46.7%) | $250,001 |
| 3+ Earners | 560 (16.2%) | $250,001 |
| Total | 3,457 (100.0%) | $207,090 |
Household Income in Falls Church
Household Income Brackets in Falls Church
With 2,290 households falling in the category, the $200,000+ income range is the most frequent in Falls Church, accounting for 39.9% of all households. In contrast, only 6 households (0.1%) fall into the $10,000 to $14,999 income bracket, making it the least populous group.
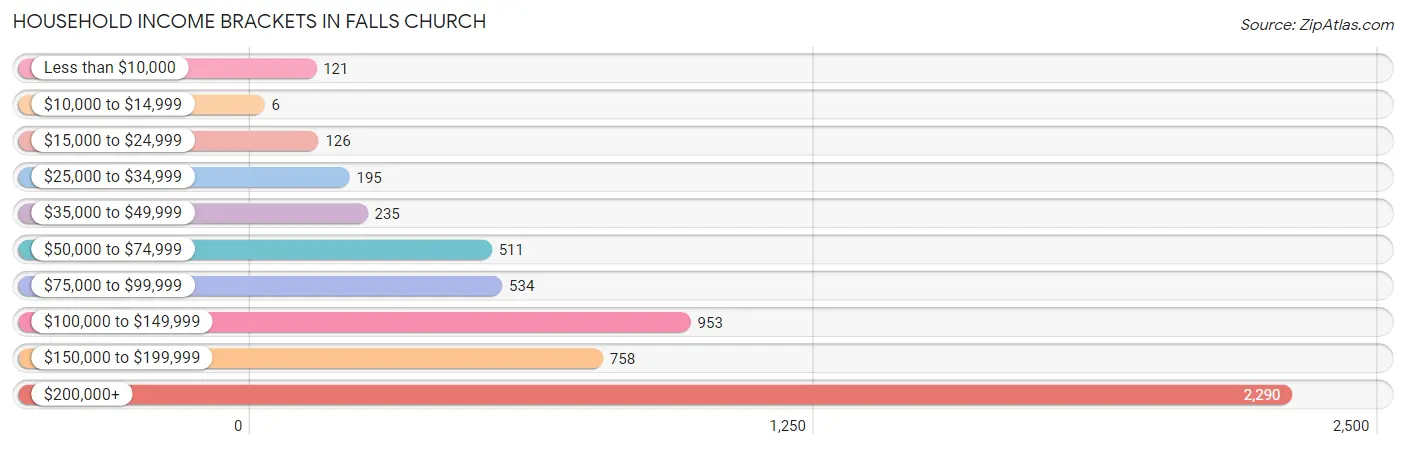
| Income Bracket | # Households | % Households |
| Less than $10,000 | 121 | 2.1% |
| $10,000 to $14,999 | 6 | 0.1% |
| $15,000 to $24,999 | 126 | 2.2% |
| $25,000 to $34,999 | 195 | 3.4% |
| $35,000 to $49,999 | 235 | 4.1% |
| $50,000 to $74,999 | 511 | 8.9% |
| $75,000 to $99,999 | 534 | 9.3% |
| $100,000 to $149,999 | 953 | 16.6% |
| $150,000 to $199,999 | 758 | 13.2% |
| $200,000+ | 2,290 | 39.9% |
Household Income by Householder Age in Falls Church
The median household income in Falls Church is $164,536, with the highest median household income of $207,639 found in the 45 to 64 years age bracket for the primary householder. A total of 2,199 households (38.3%) fall into this category. Meanwhile, the 15 to 24 years age bracket for the primary householder has the lowest median household income of $0, with 179 households (3.1%) in this group.
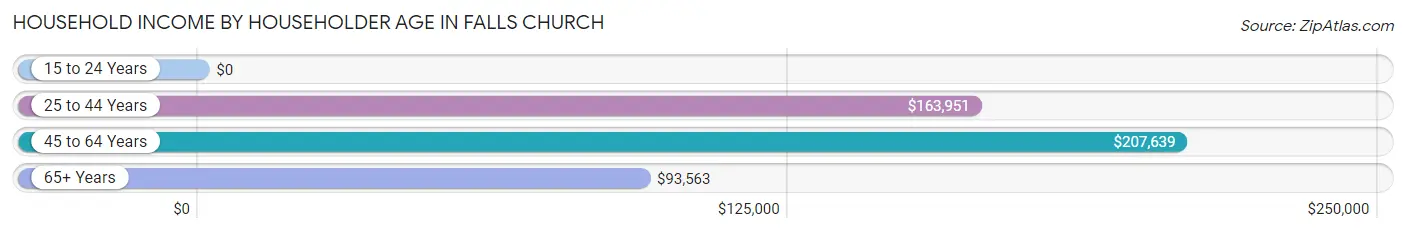
| Income Bracket | # Households | Median Income |
| 15 to 24 Years | 179 (3.1%) | $0 |
| 25 to 44 Years | 2,053 (35.8%) | $163,951 |
| 45 to 64 Years | 2,199 (38.3%) | $207,639 |
| 65+ Years | 1,309 (22.8%) | $93,563 |
| Total | 5,740 (100.0%) | $164,536 |
Poverty in Falls Church
Income Below Poverty by Sex and Age in Falls Church
With 0.9% poverty level for males and 3.7% for females among the residents of Falls Church, 16 and 17 year old males and 65 to 74 year old females are the most vulnerable to poverty, with 15 males (4.4%) and 73 females (11.2%) in their respective age groups living below the poverty level.
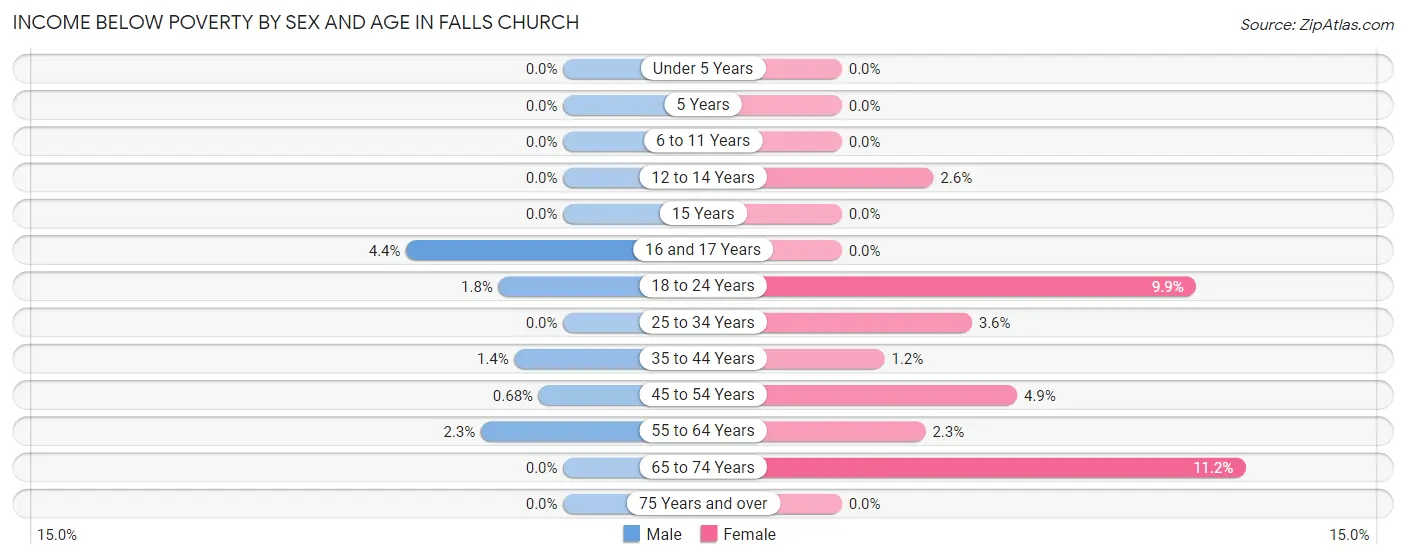
| Age Bracket | Male | Female |
| Under 5 Years | 0 (0.0%) | 0 (0.0%) |
| 5 Years | 0 (0.0%) | 0 (0.0%) |
| 6 to 11 Years | 0 (0.0%) | 0 (0.0%) |
| 12 to 14 Years | 0 (0.0%) | 11 (2.5%) |
| 15 Years | 0 (0.0%) | 0 (0.0%) |
| 16 and 17 Years | 15 (4.4%) | 0 (0.0%) |
| 18 to 24 Years | 11 (1.8%) | 70 (9.9%) |
| 25 to 34 Years | 0 (0.0%) | 30 (3.6%) |
| 35 to 44 Years | 13 (1.4%) | 13 (1.2%) |
| 45 to 54 Years | 7 (0.7%) | 52 (4.9%) |
| 55 to 64 Years | 20 (2.3%) | 23 (2.3%) |
| 65 to 74 Years | 0 (0.0%) | 73 (11.2%) |
| 75 Years and over | 0 (0.0%) | 0 (0.0%) |
| Total | 66 (0.9%) | 272 (3.7%) |
Income Above Poverty by Sex and Age in Falls Church
According to the poverty statistics in Falls Church, males aged under 5 years and females aged under 5 years are the age groups that are most secure financially, with 100.0% of males and 100.0% of females in these age groups living above the poverty line.
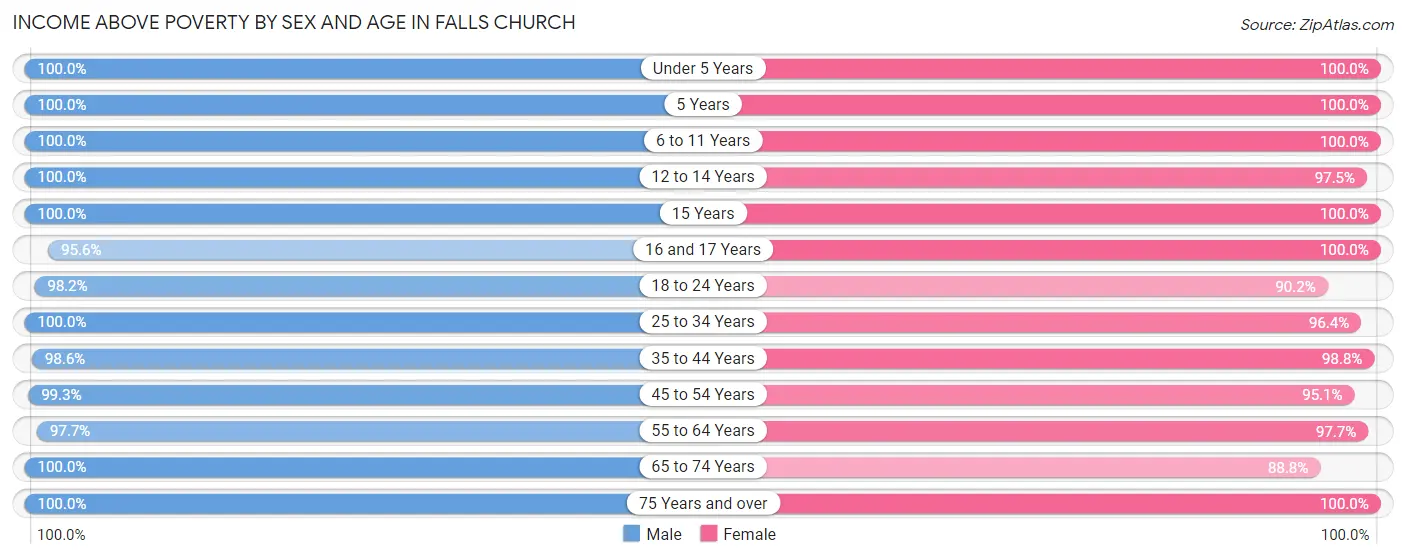
| Age Bracket | Male | Female |
| Under 5 Years | 412 (100.0%) | 293 (100.0%) |
| 5 Years | 100 (100.0%) | 35 (100.0%) |
| 6 to 11 Years | 663 (100.0%) | 497 (100.0%) |
| 12 to 14 Years | 346 (100.0%) | 420 (97.5%) |
| 15 Years | 129 (100.0%) | 29 (100.0%) |
| 16 and 17 Years | 328 (95.6%) | 245 (100.0%) |
| 18 to 24 Years | 601 (98.2%) | 641 (90.1%) |
| 25 to 34 Years | 888 (100.0%) | 798 (96.4%) |
| 35 to 44 Years | 942 (98.6%) | 1,078 (98.8%) |
| 45 to 54 Years | 1,016 (99.3%) | 1,013 (95.1%) |
| 55 to 64 Years | 853 (97.7%) | 965 (97.7%) |
| 65 to 74 Years | 639 (100.0%) | 577 (88.8%) |
| 75 Years and over | 272 (100.0%) | 412 (100.0%) |
| Total | 7,189 (99.1%) | 7,003 (96.3%) |
Income Below Poverty Among Married-Couple Families in Falls Church
The poverty statistics for married-couple families in Falls Church show that 1.0% or 30 of the total 2,955 families live below the poverty line. Families with no children have the highest poverty rate of 2.2%, comprising of 30 families. On the other hand, families with 1 or 2 children have the lowest poverty rate of 0.0%, which includes 0 families.
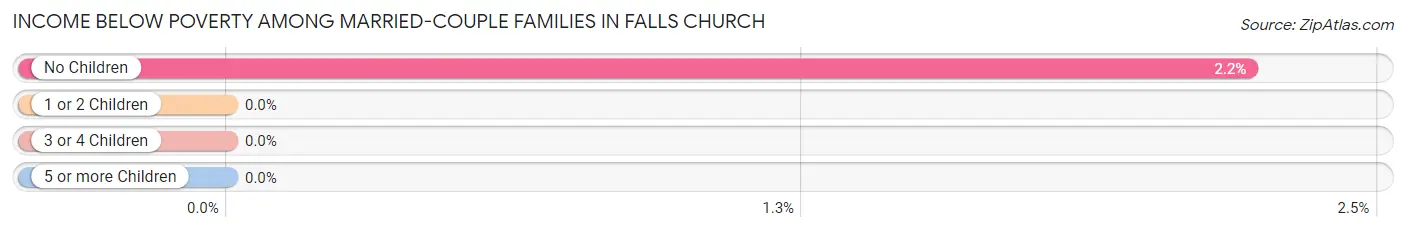
| Children | Above Poverty | Below Poverty |
| No Children | 1,323 (97.8%) | 30 (2.2%) |
| 1 or 2 Children | 1,313 (100.0%) | 0 (0.0%) |
| 3 or 4 Children | 285 (100.0%) | 0 (0.0%) |
| 5 or more Children | 4 (100.0%) | 0 (0.0%) |
| Total | 2,925 (99.0%) | 30 (1.0%) |
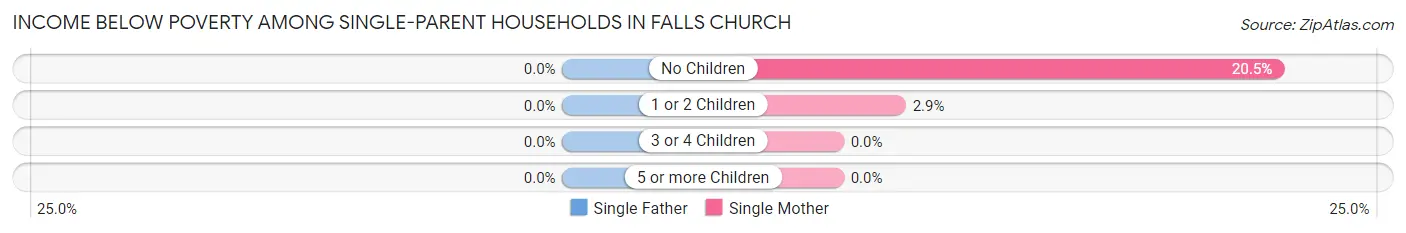
Income Below Poverty Among Single-Parent Households in Falls Church
| Children | Single Father | Single Mother |
| No Children | 0 (0.0%) | 16 (20.5%) |
| 1 or 2 Children | 0 (0.0%) | 9 (2.9%) |
| 3 or 4 Children | 0 (0.0%) | 0 (0.0%) |
| 5 or more Children | 0 (0.0%) | 0 (0.0%) |
| Total | 0 (0.0%) | 25 (6.4%) |
Income Below Poverty Among Married-Couple vs Single-Parent Households in Falls Church
The poverty data for Falls Church shows that 30 of the married-couple family households (1.0%) and 25 of the single-parent households (5.0%) are living below the poverty level. Within the married-couple family households, those with no children have the highest poverty rate, with 30 households (2.2%) falling below the poverty line. Among the single-parent households, those with no children have the highest poverty rate, with 16 household (14.0%) living below poverty.
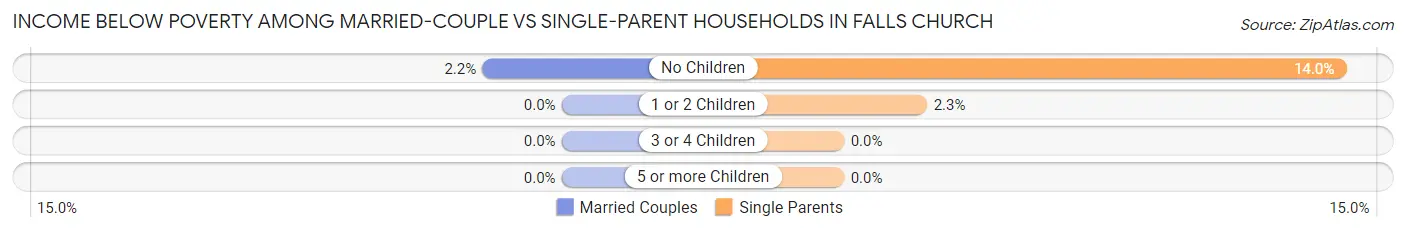
| Children | Married-Couple Families | Single-Parent Households |
| No Children | 30 (2.2%) | 16 (14.0%) |
| 1 or 2 Children | 0 (0.0%) | 9 (2.3%) |
| 3 or 4 Children | 0 (0.0%) | 0 (0.0%) |
| 5 or more Children | 0 (0.0%) | 0 (0.0%) |
| Total | 30 (1.0%) | 25 (5.0%) |
Race in Falls Church
The most populous races in Falls Church are White / Caucasian (10,567 | 72.5%), Hispanic or Latino (1,640 | 11.3%), and Two or more Races (1,523 | 10.4%).
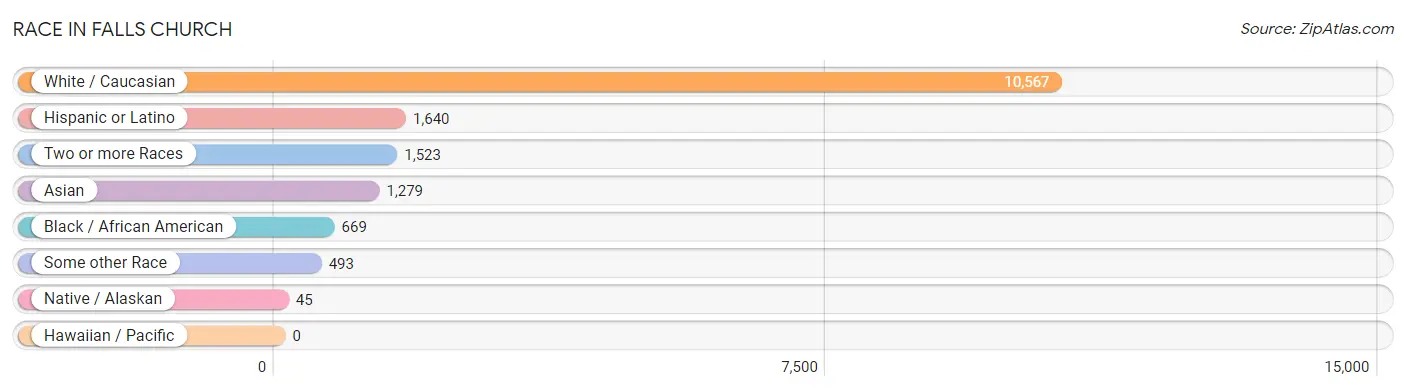
| Race | # Population | % Population |
| Asian | 1,279 | 8.8% |
| Black / African American | 669 | 4.6% |
| Hawaiian / Pacific | 0 | 0.0% |
| Hispanic or Latino | 1,640 | 11.3% |
| Native / Alaskan | 45 | 0.3% |
| White / Caucasian | 10,567 | 72.5% |
| Two or more Races | 1,523 | 10.4% |
| Some other Race | 493 | 3.4% |
| Total | 14,576 | 100.0% |
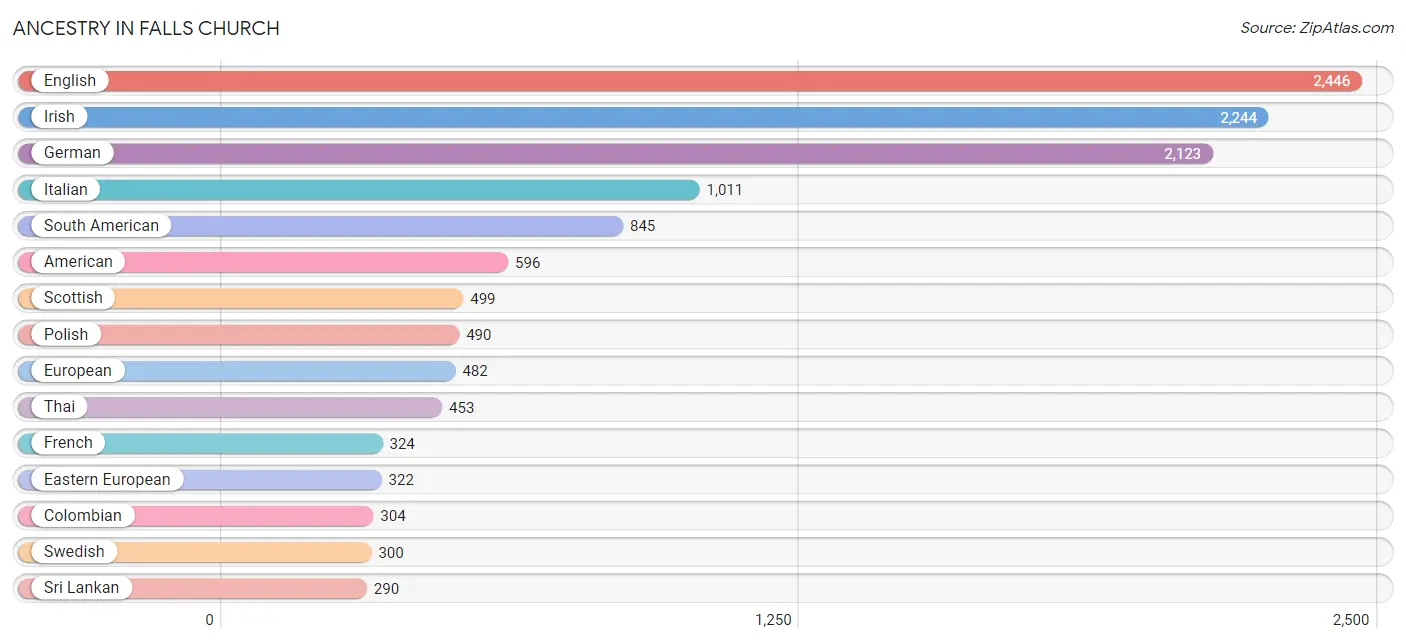
Ancestry in Falls Church
The most populous ancestries reported in Falls Church are English (2,446 | 16.8%), Irish (2,244 | 15.4%), German (2,123 | 14.6%), Italian (1,011 | 6.9%), and South American (845 | 5.8%), together accounting for 59.5% of all Falls Church residents.
| Ancestry | # Population | % Population |
| Afghan | 20 | 0.1% |
| African | 31 | 0.2% |
| Albanian | 101 | 0.7% |
| American | 596 | 4.1% |
| Arab | 280 | 1.9% |
| Australian | 44 | 0.3% |
| Austrian | 149 | 1.0% |
| Belgian | 56 | 0.4% |
| Bhutanese | 80 | 0.5% |
| Bolivian | 162 | 1.1% |
| Brazilian | 23 | 0.2% |
| British | 227 | 1.6% |
| British West Indian | 12 | 0.1% |
| Bulgarian | 43 | 0.3% |
| Burmese | 248 | 1.7% |
| Cajun | 72 | 0.5% |
| Canadian | 29 | 0.2% |
| Central American | 88 | 0.6% |
| Central American Indian | 47 | 0.3% |
| Cherokee | 18 | 0.1% |
| Chinese | 37 | 0.3% |
| Colombian | 304 | 2.1% |
| Costa Rican | 58 | 0.4% |
| Cuban | 72 | 0.5% |
| Czech | 32 | 0.2% |
| Danish | 81 | 0.6% |
| Dutch | 122 | 0.8% |
| Eastern European | 322 | 2.2% |
| Ecuadorian | 26 | 0.2% |
| English | 2,446 | 16.8% |
| Ethiopian | 37 | 0.3% |
| European | 482 | 3.3% |
| Filipino | 63 | 0.4% |
| Finnish | 75 | 0.5% |
| French | 324 | 2.2% |
| French Canadian | 20 | 0.1% |
| German | 2,123 | 14.6% |
| Greek | 70 | 0.5% |
| Guatemalan | 29 | 0.2% |
| Haitian | 46 | 0.3% |
| Honduran | 1 | 0.0% |
| Hungarian | 73 | 0.5% |
| Indian (Asian) | 218 | 1.5% |
| Iranian | 98 | 0.7% |
| Iraqi | 15 | 0.1% |
| Irish | 2,244 | 15.4% |
| Italian | 1,011 | 6.9% |
| Jamaican | 21 | 0.1% |
| Japanese | 150 | 1.0% |
| Kenyan | 20 | 0.1% |
| Korean | 261 | 1.8% |
| Laotian | 22 | 0.2% |
| Latvian | 47 | 0.3% |
| Lebanese | 67 | 0.5% |
| Lithuanian | 92 | 0.6% |
| Macedonian | 15 | 0.1% |
| Mexican | 209 | 1.4% |
| Moroccan | 24 | 0.2% |
| Native Hawaiian | 31 | 0.2% |
| Nigerian | 12 | 0.1% |
| Northern European | 108 | 0.7% |
| Norwegian | 214 | 1.5% |
| Pakistani | 52 | 0.4% |
| Palestinian | 93 | 0.6% |
| Peruvian | 232 | 1.6% |
| Polish | 490 | 3.4% |
| Pueblo | 29 | 0.2% |
| Puerto Rican | 281 | 1.9% |
| Romanian | 48 | 0.3% |
| Russian | 245 | 1.7% |
| Scandinavian | 41 | 0.3% |
| Scotch-Irish | 232 | 1.6% |
| Scottish | 499 | 3.4% |
| Slovak | 43 | 0.3% |
| Slovene | 13 | 0.1% |
| Somali | 13 | 0.1% |
| South African | 29 | 0.2% |
| South American | 845 | 5.8% |
| South American Indian | 84 | 0.6% |
| Spaniard | 24 | 0.2% |
| Spanish | 94 | 0.6% |
| Sri Lankan | 290 | 2.0% |
| Subsaharan African | 138 | 0.9% |
| Swedish | 300 | 2.1% |
| Swiss | 81 | 0.6% |
| Syrian | 31 | 0.2% |
| Thai | 453 | 3.1% |
| Tlingit-Haida | 34 | 0.2% |
| Turkish | 88 | 0.6% |
| Ukrainian | 55 | 0.4% |
| Venezuelan | 85 | 0.6% |
| Vietnamese | 44 | 0.3% |
| Welsh | 45 | 0.3% |
| Zimbabwean | 11 | 0.1% | View All 94 Rows |
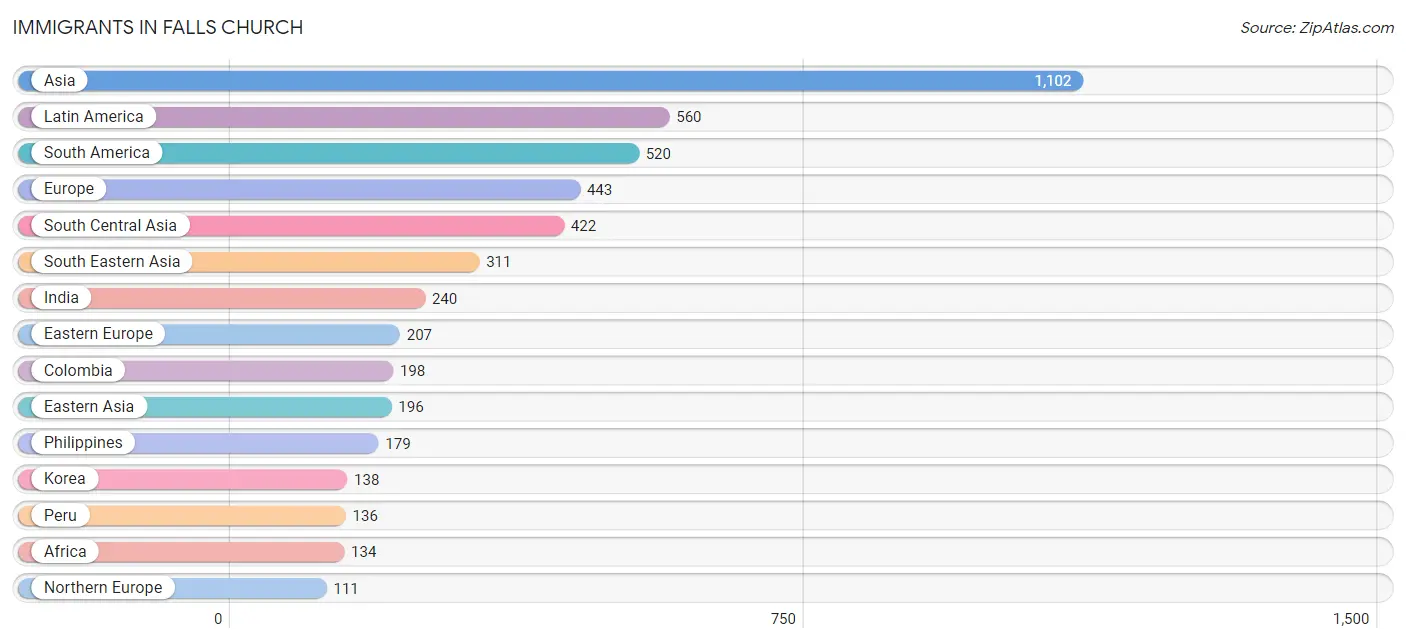
Immigrants in Falls Church
The most numerous immigrant groups reported in Falls Church came from Asia (1,102 | 7.6%), Latin America (560 | 3.8%), South America (520 | 3.6%), Europe (443 | 3.0%), and South Central Asia (422 | 2.9%), together accounting for 20.9% of all Falls Church residents.
| Immigration Origin | # Population | % Population |
| Afghanistan | 11 | 0.1% |
| Africa | 134 | 0.9% |
| Albania | 59 | 0.4% |
| Argentina | 23 | 0.2% |
| Asia | 1,102 | 7.6% |
| Australia | 17 | 0.1% |
| Austria | 12 | 0.1% |
| Bangladesh | 25 | 0.2% |
| Belarus | 16 | 0.1% |
| Bolivia | 48 | 0.3% |
| Brazil | 33 | 0.2% |
| Bulgaria | 24 | 0.2% |
| Canada | 7 | 0.1% |
| Caribbean | 21 | 0.1% |
| Central America | 19 | 0.1% |
| China | 44 | 0.3% |
| Colombia | 198 | 1.4% |
| Eastern Africa | 53 | 0.4% |
| Eastern Asia | 196 | 1.3% |
| Eastern Europe | 207 | 1.4% |
| Ecuador | 26 | 0.2% |
| England | 63 | 0.4% |
| Ethiopia | 29 | 0.2% |
| Europe | 443 | 3.0% |
| Germany | 15 | 0.1% |
| Greece | 23 | 0.2% |
| Guatemala | 16 | 0.1% |
| Honduras | 3 | 0.0% |
| Hungary | 20 | 0.1% |
| India | 240 | 1.7% |
| Iran | 74 | 0.5% |
| Iraq | 11 | 0.1% |
| Ireland | 9 | 0.1% |
| Italy | 47 | 0.3% |
| Jamaica | 21 | 0.1% |
| Japan | 14 | 0.1% |
| Kenya | 15 | 0.1% |
| Korea | 138 | 0.9% |
| Laos | 2 | 0.0% |
| Latin America | 560 | 3.8% |
| Lebanon | 10 | 0.1% |
| Lithuania | 11 | 0.1% |
| Malaysia | 18 | 0.1% |
| Netherlands | 28 | 0.2% |
| Northern Africa | 81 | 0.6% |
| Northern Europe | 111 | 0.8% |
| Oceania | 17 | 0.1% |
| Peru | 136 | 0.9% |
| Philippines | 179 | 1.2% |
| Poland | 31 | 0.2% |
| Russia | 46 | 0.3% |
| Scotland | 14 | 0.1% |
| South America | 520 | 3.6% |
| South Central Asia | 422 | 2.9% |
| South Eastern Asia | 311 | 2.1% |
| Southern Europe | 70 | 0.5% |
| Sri Lanka | 55 | 0.4% |
| Thailand | 26 | 0.2% |
| Turkey | 88 | 0.6% |
| Uzbekistan | 17 | 0.1% |
| Venezuela | 56 | 0.4% |
| Vietnam | 86 | 0.6% |
| Western Asia | 109 | 0.7% |
| Western Europe | 55 | 0.4% | View All 64 Rows |
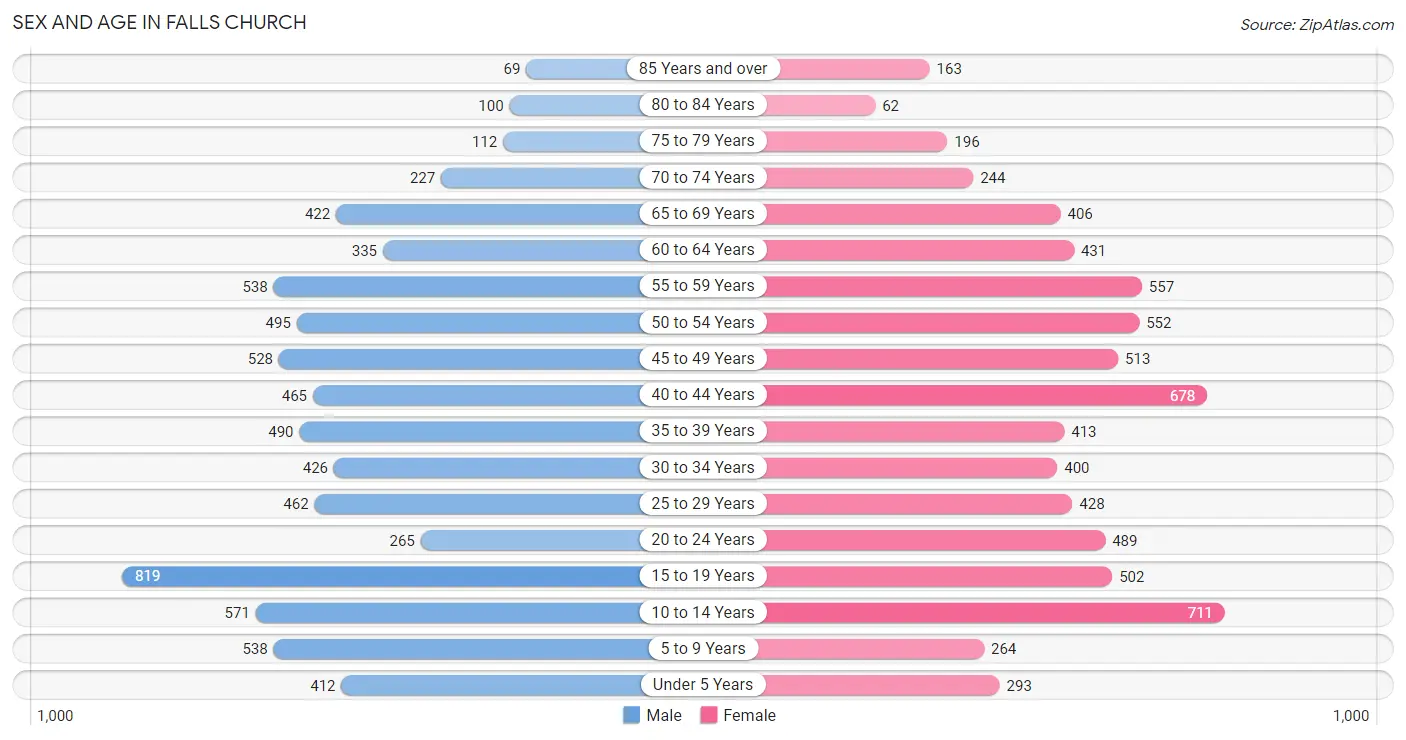
Sex and Age in Falls Church
Sex and Age in Falls Church
The most populous age groups in Falls Church are 15 to 19 Years (819 | 11.3%) for men and 10 to 14 Years (711 | 9.7%) for women.
| Age Bracket | Male | Female |
| Under 5 Years | 412 (5.7%) | 293 (4.0%) |
| 5 to 9 Years | 538 (7.4%) | 264 (3.6%) |
| 10 to 14 Years | 571 (7.9%) | 711 (9.7%) |
| 15 to 19 Years | 819 (11.3%) | 502 (6.9%) |
| 20 to 24 Years | 265 (3.6%) | 489 (6.7%) |
| 25 to 29 Years | 462 (6.4%) | 428 (5.9%) |
| 30 to 34 Years | 426 (5.9%) | 400 (5.5%) |
| 35 to 39 Years | 490 (6.7%) | 413 (5.7%) |
| 40 to 44 Years | 465 (6.4%) | 678 (9.3%) |
| 45 to 49 Years | 528 (7.3%) | 513 (7.0%) |
| 50 to 54 Years | 495 (6.8%) | 552 (7.6%) |
| 55 to 59 Years | 538 (7.4%) | 557 (7.6%) |
| 60 to 64 Years | 335 (4.6%) | 431 (5.9%) |
| 65 to 69 Years | 422 (5.8%) | 406 (5.6%) |
| 70 to 74 Years | 227 (3.1%) | 244 (3.3%) |
| 75 to 79 Years | 112 (1.5%) | 196 (2.7%) |
| 80 to 84 Years | 100 (1.4%) | 62 (0.9%) |
| 85 Years and over | 69 (0.9%) | 163 (2.2%) |
| Total | 7,274 (100.0%) | 7,302 (100.0%) |
Families and Households in Falls Church
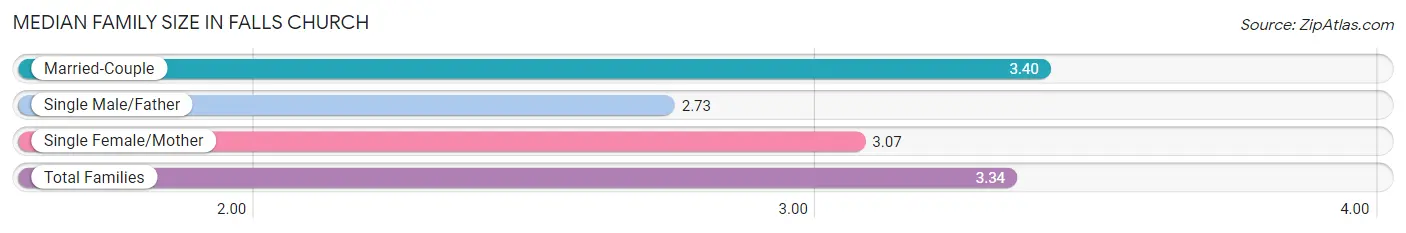
Median Family Size in Falls Church
The median family size in Falls Church is 3.34 persons per family, with married-couple families (2,955 | 85.5%) accounting for the largest median family size of 3.4 persons per family. On the other hand, single male/father families (113 | 3.3%) represent the smallest median family size with 2.73 persons per family.
| Family Type | # Families | Family Size |
| Married-Couple | 2,955 (85.5%) | 3.40 |
| Single Male/Father | 113 (3.3%) | 2.73 |
| Single Female/Mother | 389 (11.3%) | 3.07 |
| Total Families | 3,457 (100.0%) | 3.34 |
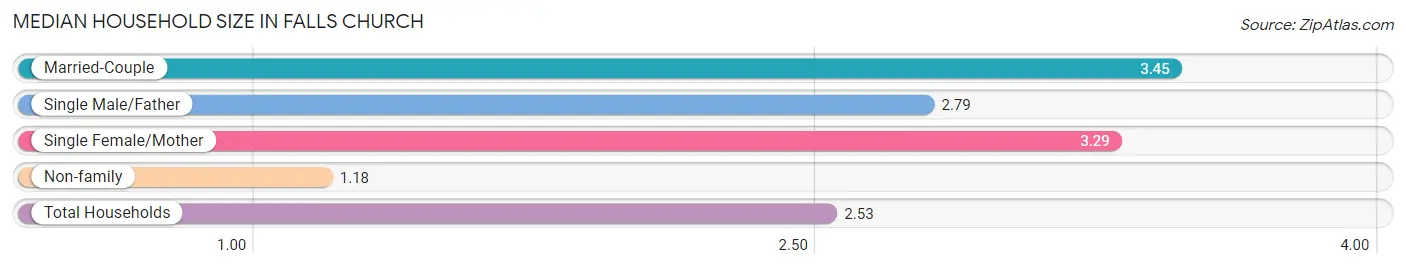
Median Household Size in Falls Church
The median household size in Falls Church is 2.53 persons per household, with married-couple households (2,955 | 51.5%) accounting for the largest median household size of 3.45 persons per household. non-family households (2,283 | 39.8%) represent the smallest median household size with 1.18 persons per household.
| Household Type | # Households | Household Size |
| Married-Couple | 2,955 (51.5%) | 3.45 |
| Single Male/Father | 113 (2.0%) | 2.79 |
| Single Female/Mother | 389 (6.8%) | 3.29 |
| Non-family | 2,283 (39.8%) | 1.18 |
| Total Households | 5,740 (100.0%) | 2.53 |
Household Size by Marriage Status in Falls Church
Out of a total of 5,740 households in Falls Church, 3,457 (60.2%) are family households, while 2,283 (39.8%) are nonfamily households. The most numerous type of family households are 2-person households, comprising 1,238, and the most common type of nonfamily households are 1-person households, comprising 1,872.
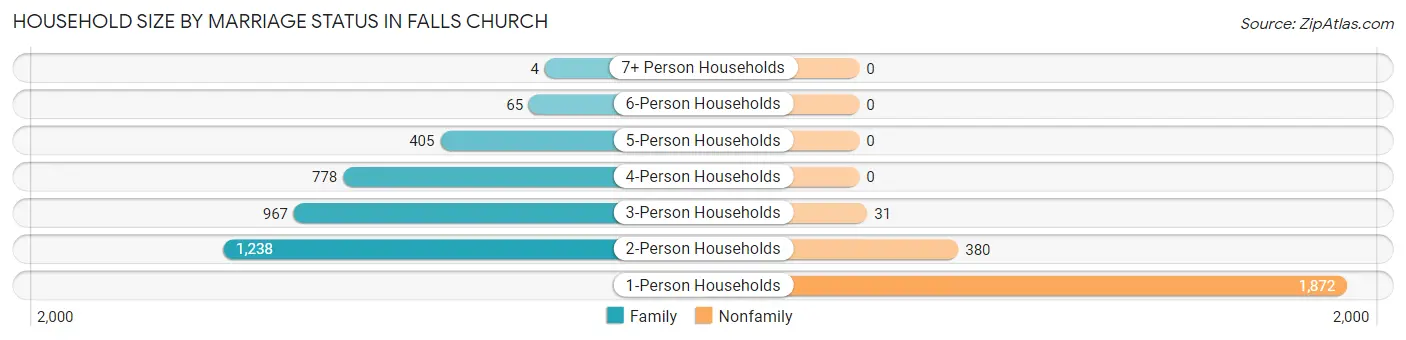
| Household Size | Family Households | Nonfamily Households |
| 1-Person Households | - | 1,872 (32.6%) |
| 2-Person Households | 1,238 (21.6%) | 380 (6.6%) |
| 3-Person Households | 967 (16.9%) | 31 (0.5%) |
| 4-Person Households | 778 (13.6%) | 0 (0.0%) |
| 5-Person Households | 405 (7.1%) | 0 (0.0%) |
| 6-Person Households | 65 (1.1%) | 0 (0.0%) |
| 7+ Person Households | 4 (0.1%) | 0 (0.0%) |
| Total | 3,457 (60.2%) | 2,283 (39.8%) |
Female Fertility in Falls Church
Fertility by Age in Falls Church
Average fertility rate in Falls Church is 31.0 births per 1,000 women. Women in the age bracket of 20 to 34 years have the highest fertility rate with 63.0 births per 1,000 women. Women in the age bracket of 20 to 34 years acount for 76.1% of all women with births.
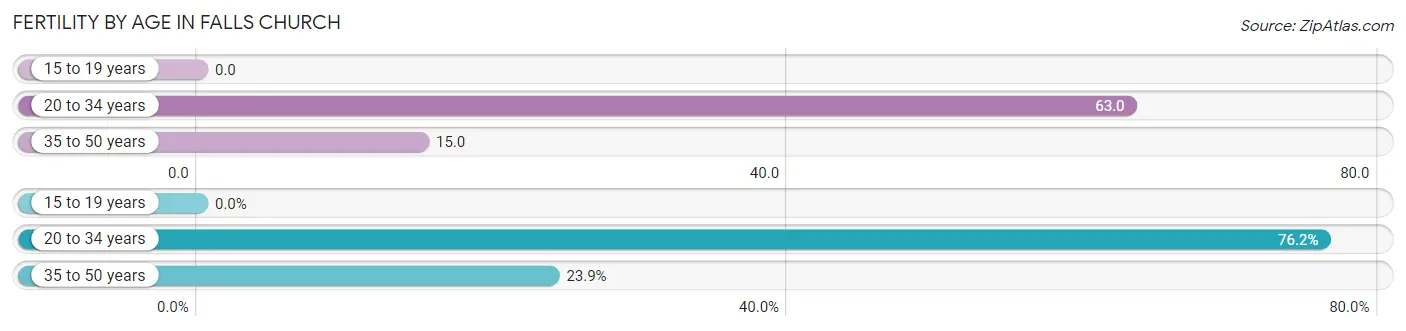
| Age Bracket | Women with Births | Births / 1,000 Women |
| 15 to 19 years | 0 (0.0%) | 0.0 |
| 20 to 34 years | 83 (76.1%) | 63.0 |
| 35 to 50 years | 26 (23.8%) | 15.0 |
| Total | 109 (100.0%) | 31.0 |
Fertility by Age by Marriage Status in Falls Church
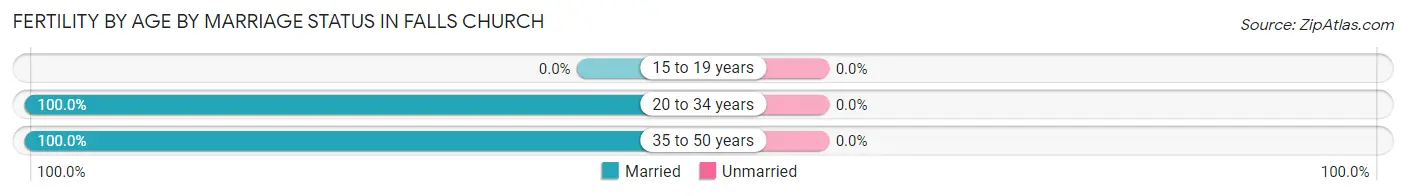
| Age Bracket | Married | Unmarried |
| 15 to 19 years | 0 (0.0%) | 0 (0.0%) |
| 20 to 34 years | 83 (100.0%) | 0 (0.0%) |
| 35 to 50 years | 26 (100.0%) | 0 (0.0%) |
| Total | 109 (100.0%) | 0 (0.0%) |
Fertility by Education in Falls Church
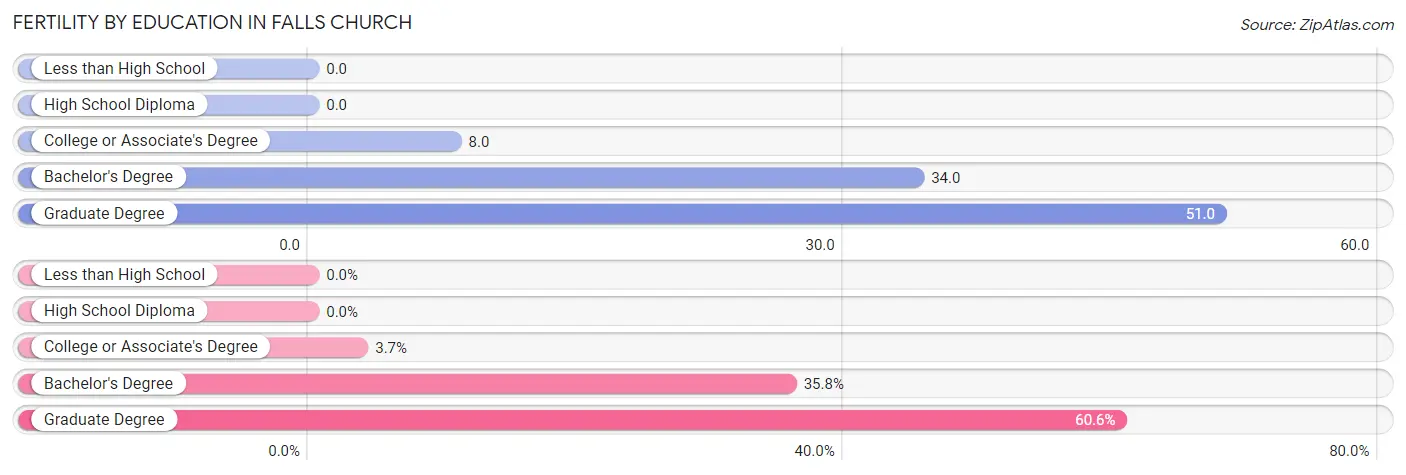
| Educational Attainment | Women with Births | Births / 1,000 Women |
| Less than High School | 0 (0.0%) | 0.0 |
| High School Diploma | 0 (0.0%) | 0.0 |
| College or Associate's Degree | 4 (3.7%) | 8.0 |
| Bachelor's Degree | 39 (35.8%) | 34.0 |
| Graduate Degree | 66 (60.6%) | 51.0 |
| Total | 109 (100.0%) | 31.0 |
Fertility by Education by Marriage Status in Falls Church
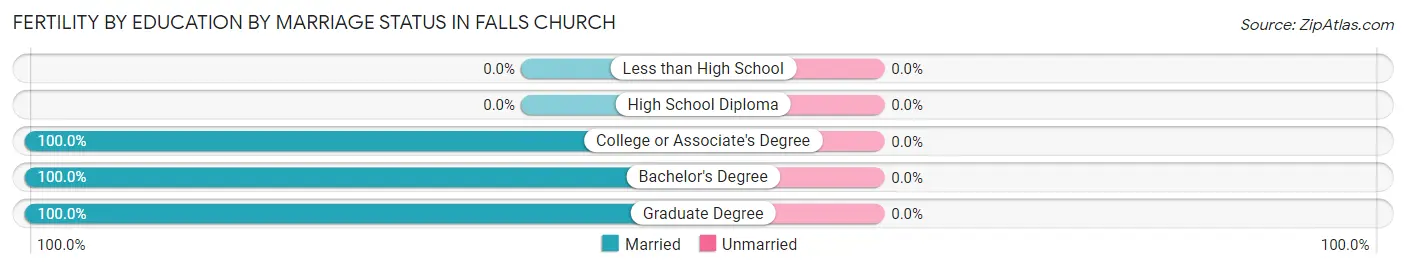
| Educational Attainment | Married | Unmarried |
| Less than High School | 0 (0.0%) | 0 (0.0%) |
| High School Diploma | 0 (0.0%) | 0 (0.0%) |
| College or Associate's Degree | 4 (100.0%) | 0 (0.0%) |
| Bachelor's Degree | 39 (100.0%) | 0 (0.0%) |
| Graduate Degree | 66 (100.0%) | 0 (0.0%) |
| Total | 109 (100.0%) | 0 (0.0%) |
Employment Characteristics in Falls Church
Employment by Class of Employer in Falls Church
Among the 7,948 employed individuals in Falls Church, private company employees (4,032 | 50.7%), federal government employees (1,476 | 18.6%), and not-for-profit organizations (994 | 12.5%) make up the most common classes of employment.
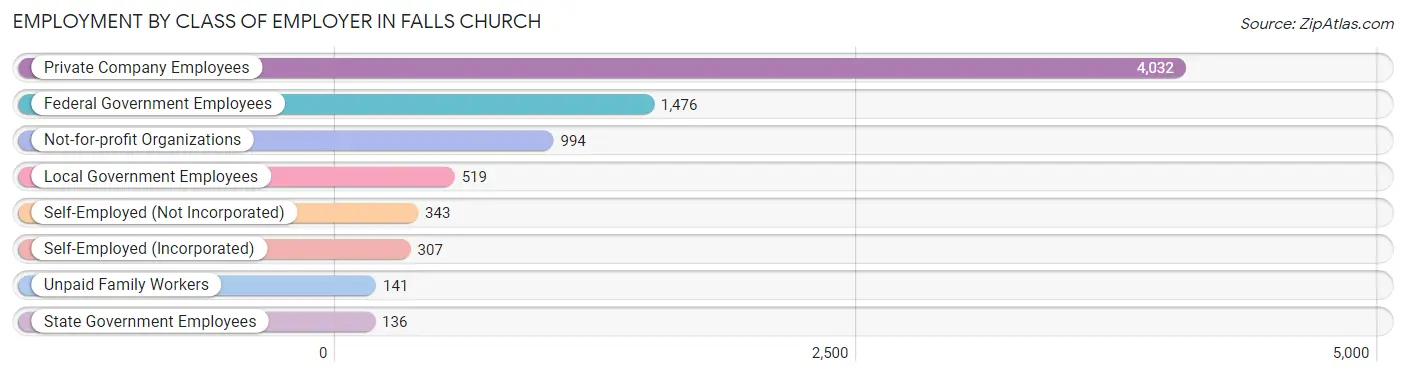
| Employer Class | # Employees | % Employees |
| Private Company Employees | 4,032 | 50.7% |
| Self-Employed (Incorporated) | 307 | 3.9% |
| Self-Employed (Not Incorporated) | 343 | 4.3% |
| Not-for-profit Organizations | 994 | 12.5% |
| Local Government Employees | 519 | 6.5% |
| State Government Employees | 136 | 1.7% |
| Federal Government Employees | 1,476 | 18.6% |
| Unpaid Family Workers | 141 | 1.8% |
| Total | 7,948 | 100.0% |
Employment Status by Age in Falls Church
According to the labor force statistics for Falls Church, out of the total population over 16 years of age (11,628), 73.7% or 8,570 individuals are in the labor force, with 6.0% or 514 of them unemployed. The age group with the highest labor force participation rate is 25 to 29 years, with 97.8% or 870 individuals in the labor force. Within the labor force, the 65 to 74 years age range has the highest percentage of unemployed individuals, with 32.9% or 153 of them being unemployed.
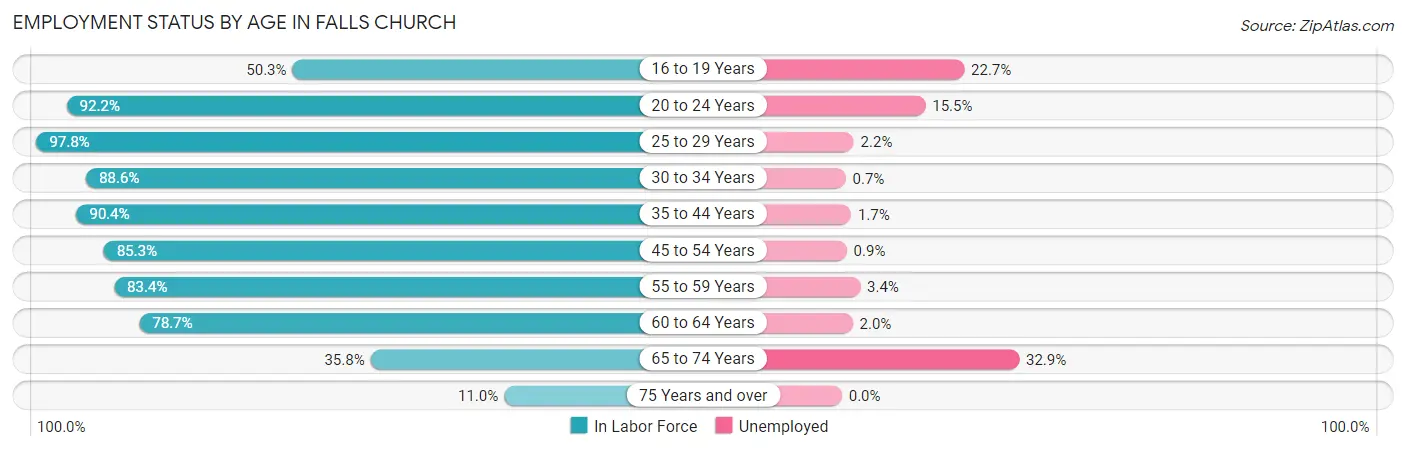
| Age Bracket | In Labor Force | Unemployed |
| 16 to 19 Years | 584 (50.3%) | 133 (22.7%) |
| 20 to 24 Years | 695 (92.2%) | 108 (15.5%) |
| 25 to 29 Years | 870 (97.8%) | 19 (2.2%) |
| 30 to 34 Years | 732 (88.6%) | 5 (0.7%) |
| 35 to 44 Years | 1,850 (90.4%) | 31 (1.7%) |
| 45 to 54 Years | 1,781 (85.3%) | 16 (0.9%) |
| 55 to 59 Years | 913 (83.4%) | 31 (3.4%) |
| 60 to 64 Years | 603 (78.7%) | 12 (2.0%) |
| 65 to 74 Years | 465 (35.8%) | 153 (32.9%) |
| 75 Years and over | 77 (11.0%) | 0 (0.0%) |
| Total | 8,570 (73.7%) | 514 (6.0%) |
Employment Status by Educational Attainment in Falls Church
According to labor force statistics for Falls Church, 87.5% of individuals (6,747) out of the total population between 25 and 64 years of age (7,711) are in the labor force, with 1.7% or 115 of them being unemployed. The group with the highest labor force participation rate are those with the educational attainment of bachelor's degree or higher, with 89.3% or 5,536 individuals in the labor force. Within the labor force, individuals with bachelor's degree or higher education have the highest percentage of unemployment, with 1.8% or 100 of them being unemployed.
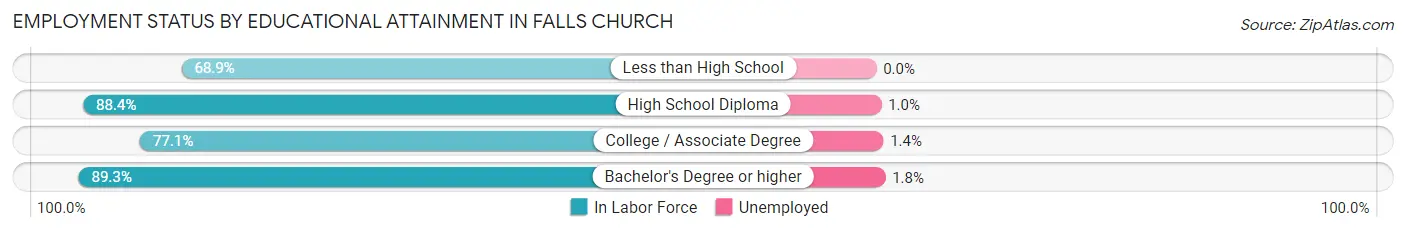
| Educational Attainment | In Labor Force | Unemployed |
| Less than High School | 133 (68.9%) | 0 (0.0%) |
| High School Diploma | 493 (88.4%) | 6 (1.0%) |
| College / Associate Degree | 587 (77.1%) | 11 (1.4%) |
| Bachelor's Degree or higher | 5,536 (89.3%) | 112 (1.8%) |
| Total | 6,747 (87.5%) | 131 (1.7%) |
Employment Occupations by Sex in Falls Church
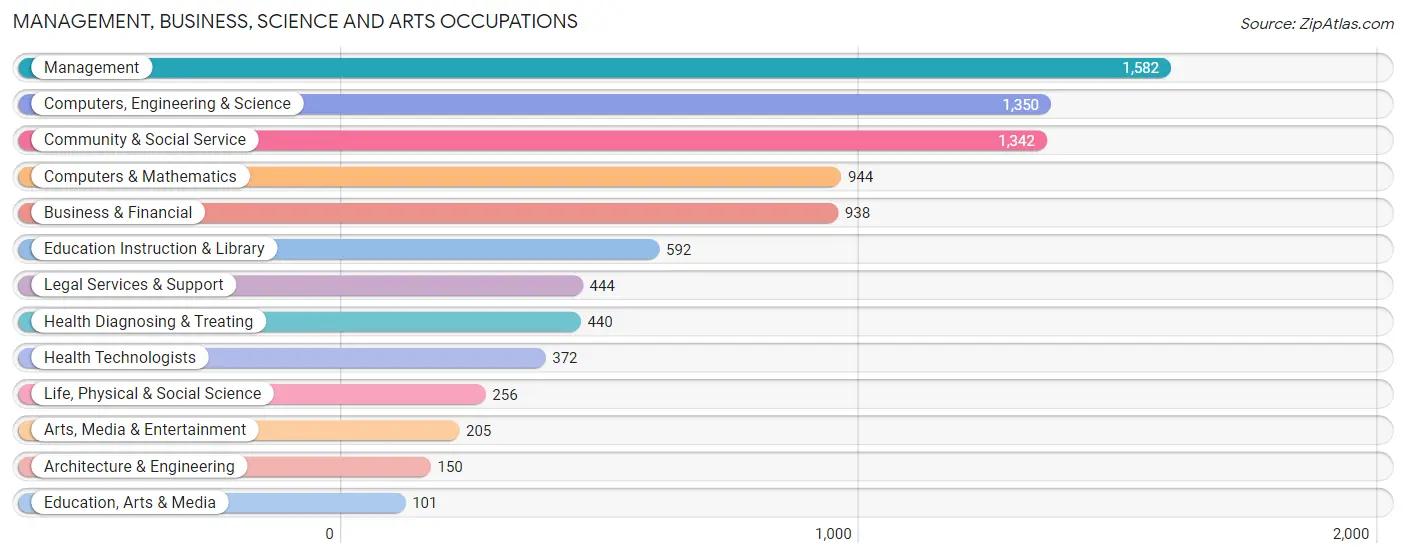
Management, Business, Science and Arts Occupations
The most common Management, Business, Science and Arts occupations in Falls Church are Management (1,582 | 19.9%), Computers, Engineering & Science (1,350 | 17.0%), Community & Social Service (1,342 | 16.9%), Computers & Mathematics (944 | 11.9%), and Business & Financial (938 | 11.8%).
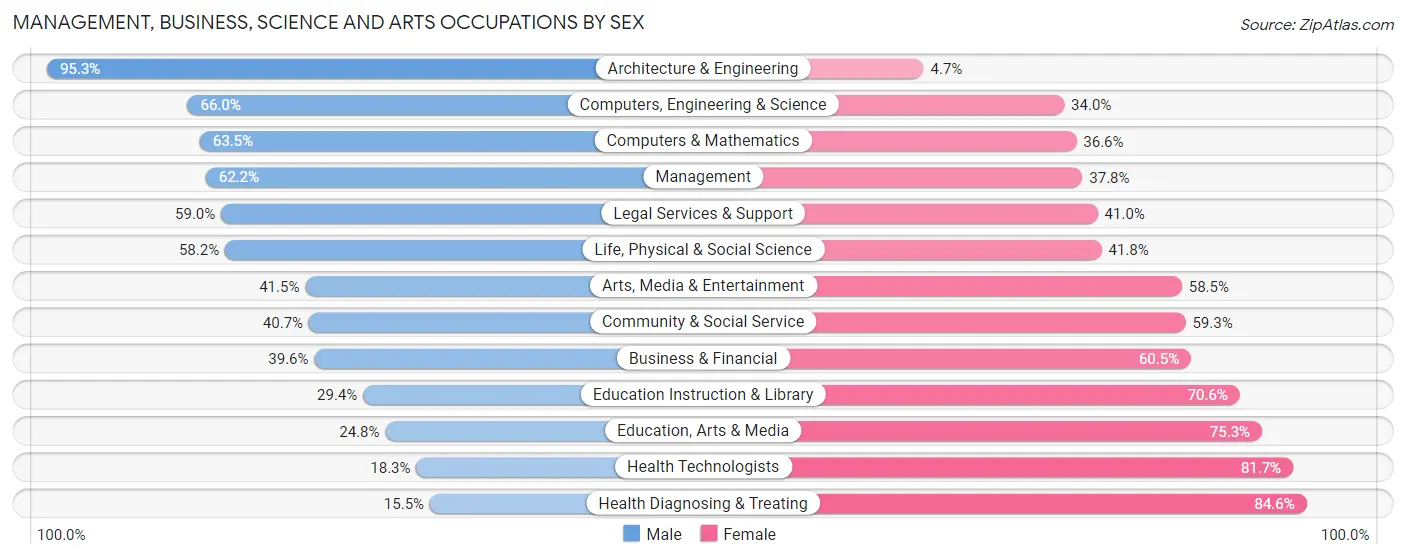
Management, Business, Science and Arts Occupations by Sex
Within the Management, Business, Science and Arts occupations in Falls Church, the most male-oriented occupations are Architecture & Engineering (95.3%), Computers, Engineering & Science (66.0%), and Computers & Mathematics (63.4%), while the most female-oriented occupations are Health Diagnosing & Treating (84.6%), Health Technologists (81.7%), and Education, Arts & Media (75.2%).
| Occupation | Male | Female |
| Management | 984 (62.2%) | 598 (37.8%) |
| Business & Financial | 371 (39.6%) | 567 (60.5%) |
| Computers, Engineering & Science | 891 (66.0%) | 459 (34.0%) |
| Computers & Mathematics | 599 (63.4%) | 345 (36.5%) |
| Architecture & Engineering | 143 (95.3%) | 7 (4.7%) |
| Life, Physical & Social Science | 149 (58.2%) | 107 (41.8%) |
| Community & Social Service | 546 (40.7%) | 796 (59.3%) |
| Education, Arts & Media | 25 (24.7%) | 76 (75.2%) |
| Legal Services & Support | 262 (59.0%) | 182 (41.0%) |
| Education Instruction & Library | 174 (29.4%) | 418 (70.6%) |
| Arts, Media & Entertainment | 85 (41.5%) | 120 (58.5%) |
| Health Diagnosing & Treating | 68 (15.4%) | 372 (84.6%) |
| Health Technologists | 68 (18.3%) | 304 (81.7%) |
| Total (Category) | 2,860 (50.6%) | 2,792 (49.4%) |
| Total (Overall) | 3,986 (50.2%) | 3,955 (49.8%) |
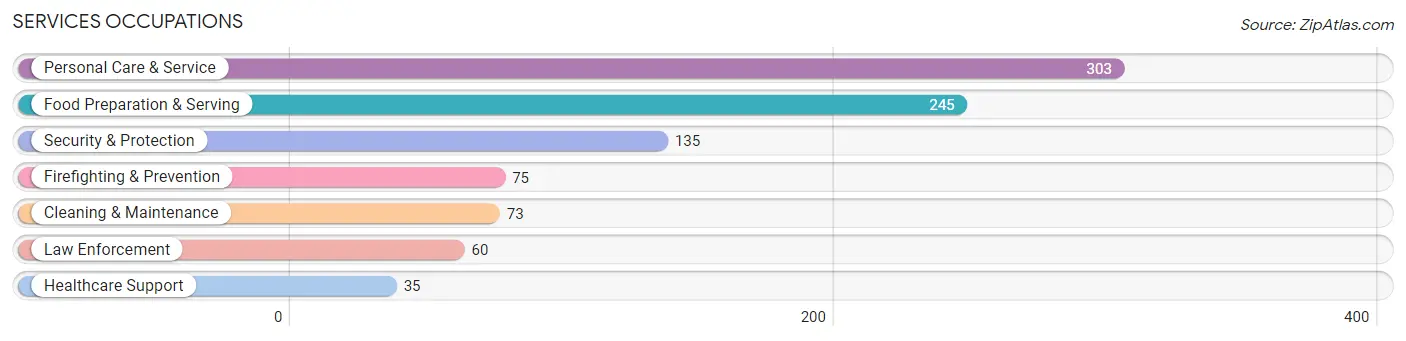
Services Occupations
The most common Services occupations in Falls Church are Personal Care & Service (303 | 3.8%), Food Preparation & Serving (245 | 3.1%), Security & Protection (135 | 1.7%), Firefighting & Prevention (75 | 0.9%), and Cleaning & Maintenance (73 | 0.9%).
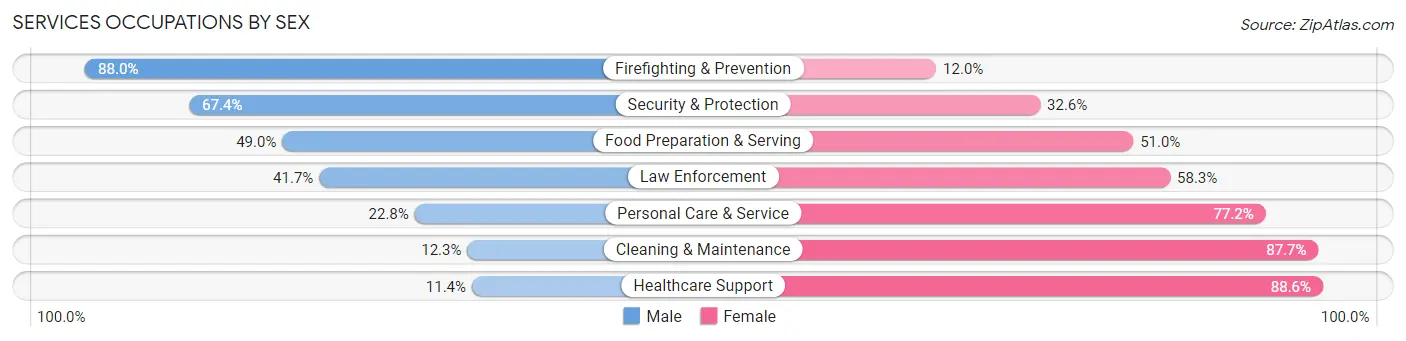
Services Occupations by Sex
Within the Services occupations in Falls Church, the most male-oriented occupations are Firefighting & Prevention (88.0%), Security & Protection (67.4%), and Food Preparation & Serving (49.0%), while the most female-oriented occupations are Healthcare Support (88.6%), Cleaning & Maintenance (87.7%), and Personal Care & Service (77.2%).
| Occupation | Male | Female |
| Healthcare Support | 4 (11.4%) | 31 (88.6%) |
| Security & Protection | 91 (67.4%) | 44 (32.6%) |
| Firefighting & Prevention | 66 (88.0%) | 9 (12.0%) |
| Law Enforcement | 25 (41.7%) | 35 (58.3%) |
| Food Preparation & Serving | 120 (49.0%) | 125 (51.0%) |
| Cleaning & Maintenance | 9 (12.3%) | 64 (87.7%) |
| Personal Care & Service | 69 (22.8%) | 234 (77.2%) |
| Total (Category) | 293 (37.0%) | 498 (63.0%) |
| Total (Overall) | 3,986 (50.2%) | 3,955 (49.8%) |
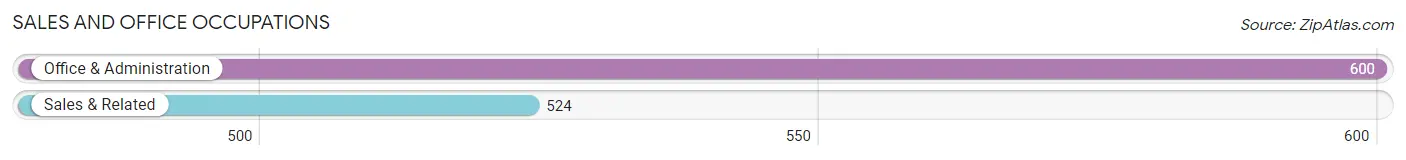
Sales and Office Occupations
The most common Sales and Office occupations in Falls Church are Office & Administration (600 | 7.6%), and Sales & Related (524 | 6.6%).
Sales and Office Occupations by Sex
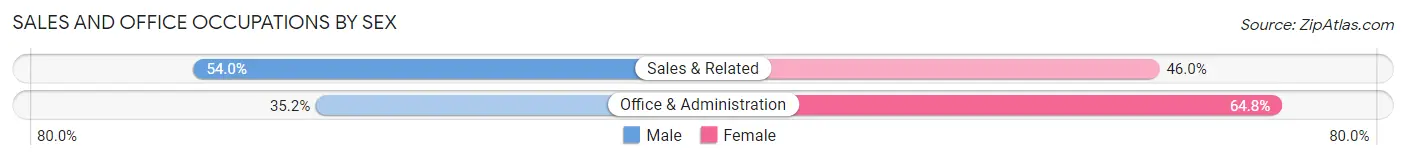
| Occupation | Male | Female |
| Sales & Related | 283 (54.0%) | 241 (46.0%) |
| Office & Administration | 211 (35.2%) | 389 (64.8%) |
| Total (Category) | 494 (44.0%) | 630 (56.0%) |
| Total (Overall) | 3,986 (50.2%) | 3,955 (49.8%) |
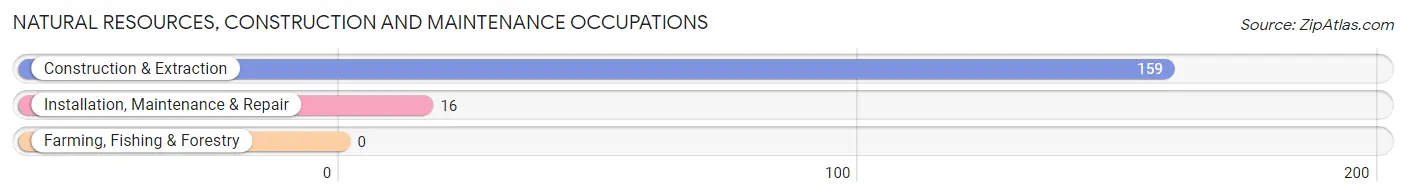
Natural Resources, Construction and Maintenance Occupations
The most common Natural Resources, Construction and Maintenance occupations in Falls Church are Construction & Extraction (159 | 2.0%), and Installation, Maintenance & Repair (16 | 0.2%).
Natural Resources, Construction and Maintenance Occupations by Sex
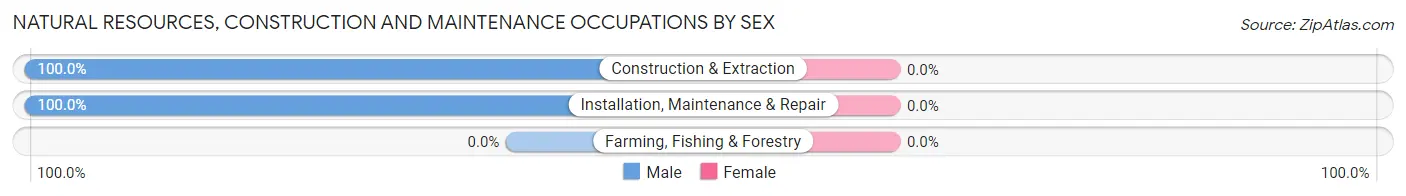
| Occupation | Male | Female |
| Farming, Fishing & Forestry | 0 (0.0%) | 0 (0.0%) |
| Construction & Extraction | 159 (100.0%) | 0 (0.0%) |
| Installation, Maintenance & Repair | 16 (100.0%) | 0 (0.0%) |
| Total (Category) | 175 (100.0%) | 0 (0.0%) |
| Total (Overall) | 3,986 (50.2%) | 3,955 (49.8%) |
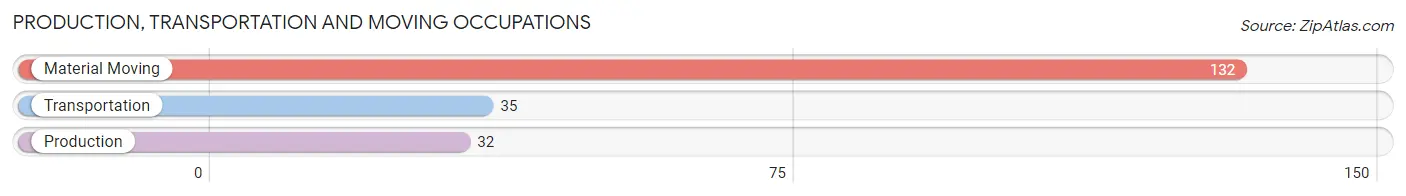
Production, Transportation and Moving Occupations
The most common Production, Transportation and Moving occupations in Falls Church are Material Moving (132 | 1.7%), Transportation (35 | 0.4%), and Production (32 | 0.4%).
Production, Transportation and Moving Occupations by Sex
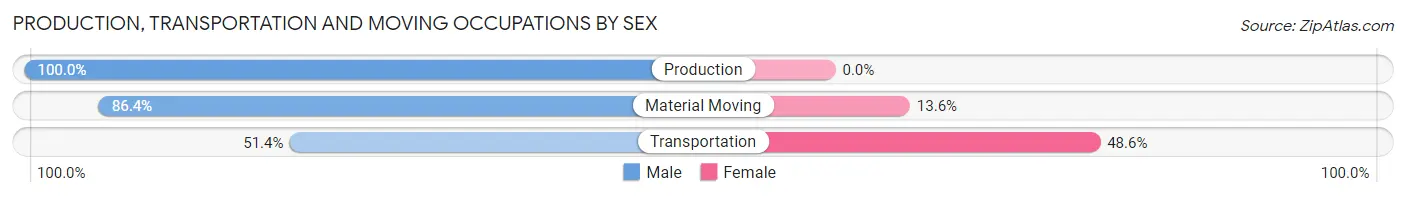
| Occupation | Male | Female |
| Production | 32 (100.0%) | 0 (0.0%) |
| Transportation | 18 (51.4%) | 17 (48.6%) |
| Material Moving | 114 (86.4%) | 18 (13.6%) |
| Total (Category) | 164 (82.4%) | 35 (17.6%) |
| Total (Overall) | 3,986 (50.2%) | 3,955 (49.8%) |
Employment Industries by Sex in Falls Church
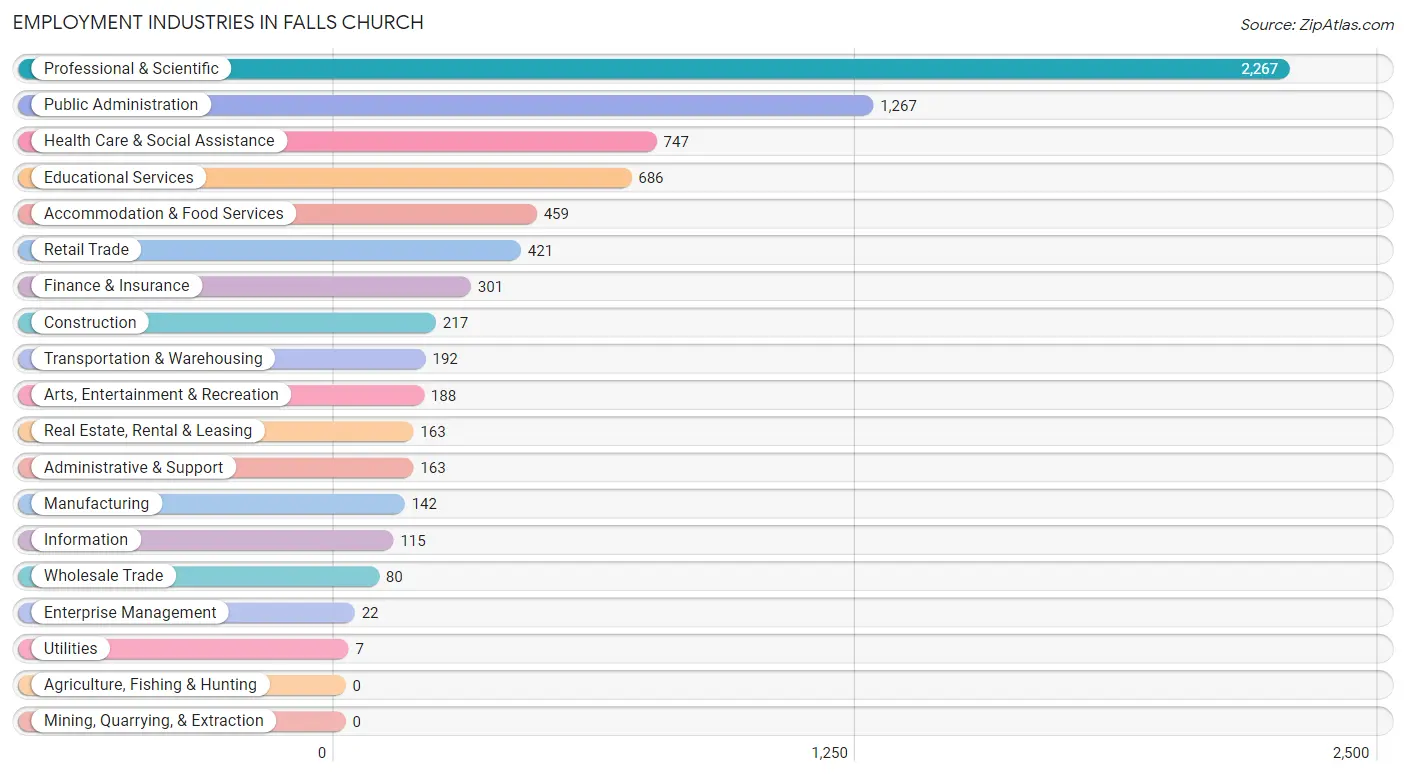
Employment Industries in Falls Church
The major employment industries in Falls Church include Professional & Scientific (2,267 | 28.5%), Public Administration (1,267 | 16.0%), Health Care & Social Assistance (747 | 9.4%), Educational Services (686 | 8.6%), and Accommodation & Food Services (459 | 5.8%).
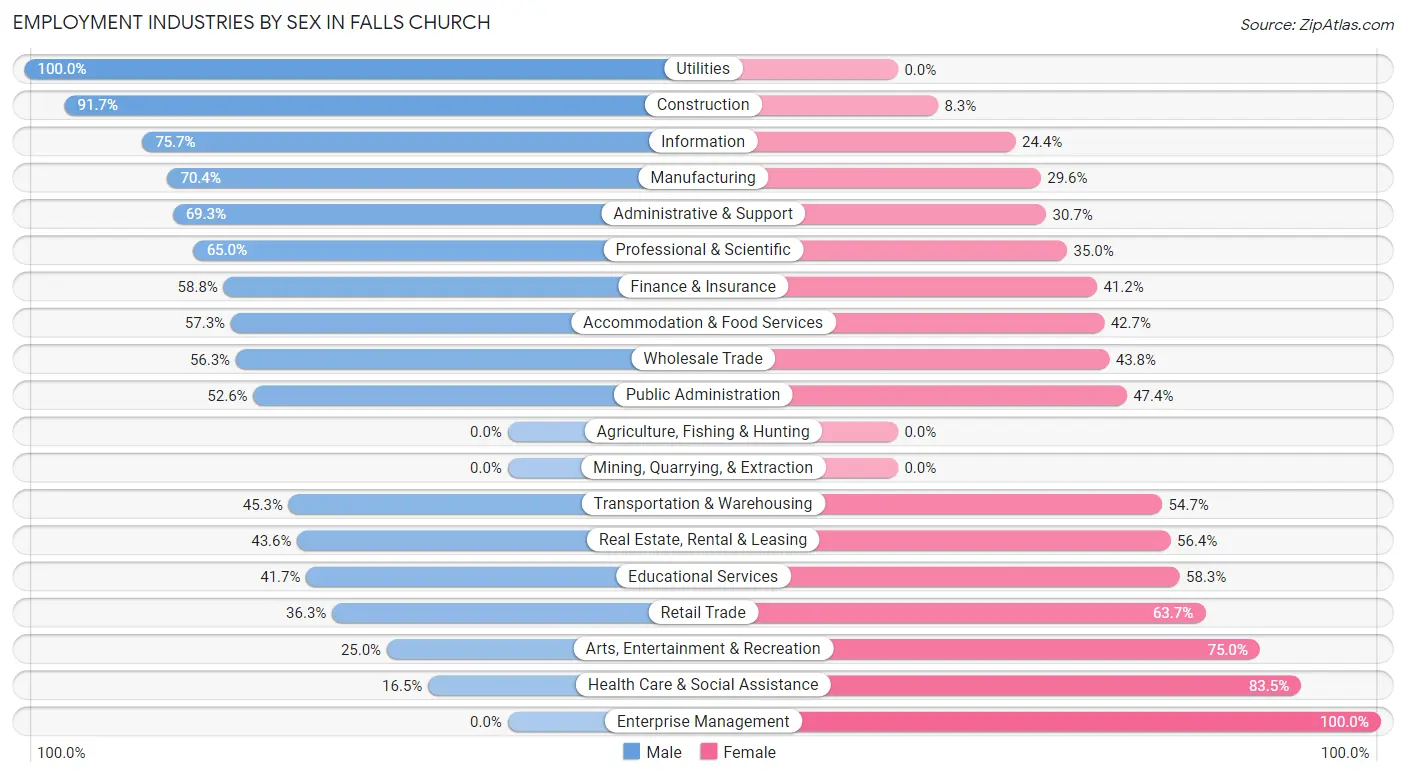
Employment Industries by Sex in Falls Church
The Falls Church industries that see more men than women are Utilities (100.0%), Construction (91.7%), and Information (75.6%), whereas the industries that tend to have a higher number of women are Enterprise Management (100.0%), Health Care & Social Assistance (83.5%), and Arts, Entertainment & Recreation (75.0%).
| Industry | Male | Female |
| Agriculture, Fishing & Hunting | 0 (0.0%) | 0 (0.0%) |
| Mining, Quarrying, & Extraction | 0 (0.0%) | 0 (0.0%) |
| Construction | 199 (91.7%) | 18 (8.3%) |
| Manufacturing | 100 (70.4%) | 42 (29.6%) |
| Wholesale Trade | 45 (56.2%) | 35 (43.8%) |
| Retail Trade | 153 (36.3%) | 268 (63.7%) |
| Transportation & Warehousing | 87 (45.3%) | 105 (54.7%) |
| Utilities | 7 (100.0%) | 0 (0.0%) |
| Information | 87 (75.6%) | 28 (24.3%) |
| Finance & Insurance | 177 (58.8%) | 124 (41.2%) |
| Real Estate, Rental & Leasing | 71 (43.6%) | 92 (56.4%) |
| Professional & Scientific | 1,473 (65.0%) | 794 (35.0%) |
| Enterprise Management | 0 (0.0%) | 22 (100.0%) |
| Administrative & Support | 113 (69.3%) | 50 (30.7%) |
| Educational Services | 286 (41.7%) | 400 (58.3%) |
| Health Care & Social Assistance | 123 (16.5%) | 624 (83.5%) |
| Arts, Entertainment & Recreation | 47 (25.0%) | 141 (75.0%) |
| Accommodation & Food Services | 263 (57.3%) | 196 (42.7%) |
| Public Administration | 667 (52.6%) | 600 (47.4%) |
| Total | 3,986 (50.2%) | 3,955 (49.8%) |
Education in Falls Church
School Enrollment in Falls Church
The most common levels of schooling among the 4,221 students in Falls Church are high school (1,172 | 27.8%), middle school (993 | 23.5%), and elementary school (710 | 16.8%).
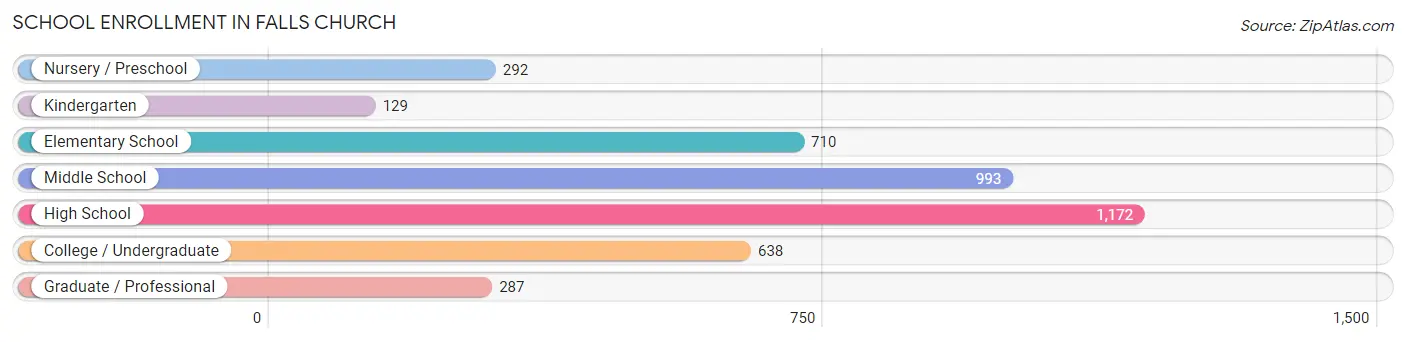
| School Level | # Students | % Students |
| Nursery / Preschool | 292 | 6.9% |
| Kindergarten | 129 | 3.1% |
| Elementary School | 710 | 16.8% |
| Middle School | 993 | 23.5% |
| High School | 1,172 | 27.8% |
| College / Undergraduate | 638 | 15.1% |
| Graduate / Professional | 287 | 6.8% |
| Total | 4,221 | 100.0% |
School Enrollment by Age by Funding Source in Falls Church
Out of a total of 4,221 students who are enrolled in schools in Falls Church, 726 (17.2%) attend a private institution, while the remaining 3,495 (82.8%) are enrolled in public schools. The age group of 3 to 4 year olds has the highest likelihood of being enrolled in private schools, with 131 (57.5% in the age bracket) enrolled. Conversely, the age group of 5 to 9 year old has the lowest likelihood of being enrolled in a private school, with 718 (89.5% in the age bracket) attending a public institution.
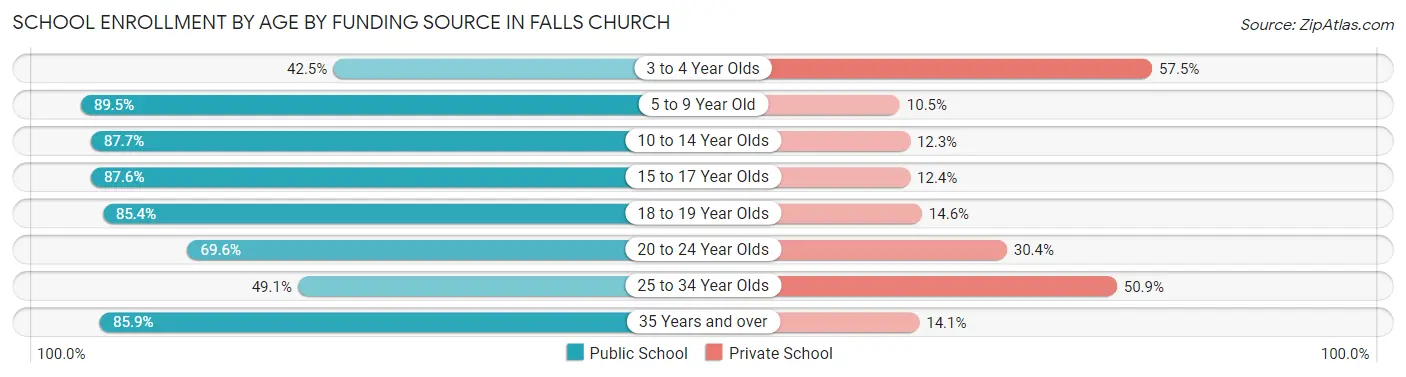
| Age Bracket | Public School | Private School |
| 3 to 4 Year Olds | 97 (42.5%) | 131 (57.5%) |
| 5 to 9 Year Old | 718 (89.5%) | 84 (10.5%) |
| 10 to 14 Year Olds | 1,094 (87.7%) | 154 (12.3%) |
| 15 to 17 Year Olds | 652 (87.6%) | 92 (12.4%) |
| 18 to 19 Year Olds | 475 (85.4%) | 81 (14.6%) |
| 20 to 24 Year Olds | 220 (69.6%) | 96 (30.4%) |
| 25 to 34 Year Olds | 56 (49.1%) | 58 (50.9%) |
| 35 Years and over | 183 (85.9%) | 30 (14.1%) |
| Total | 3,495 (82.8%) | 726 (17.2%) |
Educational Attainment by Field of Study in Falls Church
Social sciences (1,530 | 17.8%), business (1,230 | 14.3%), literature & languages (747 | 8.7%), engineering (706 | 8.2%), and liberal arts & history (706 | 8.2%) are the most common fields of study among 8,611 individuals in Falls Church who have obtained a bachelor's degree or higher.
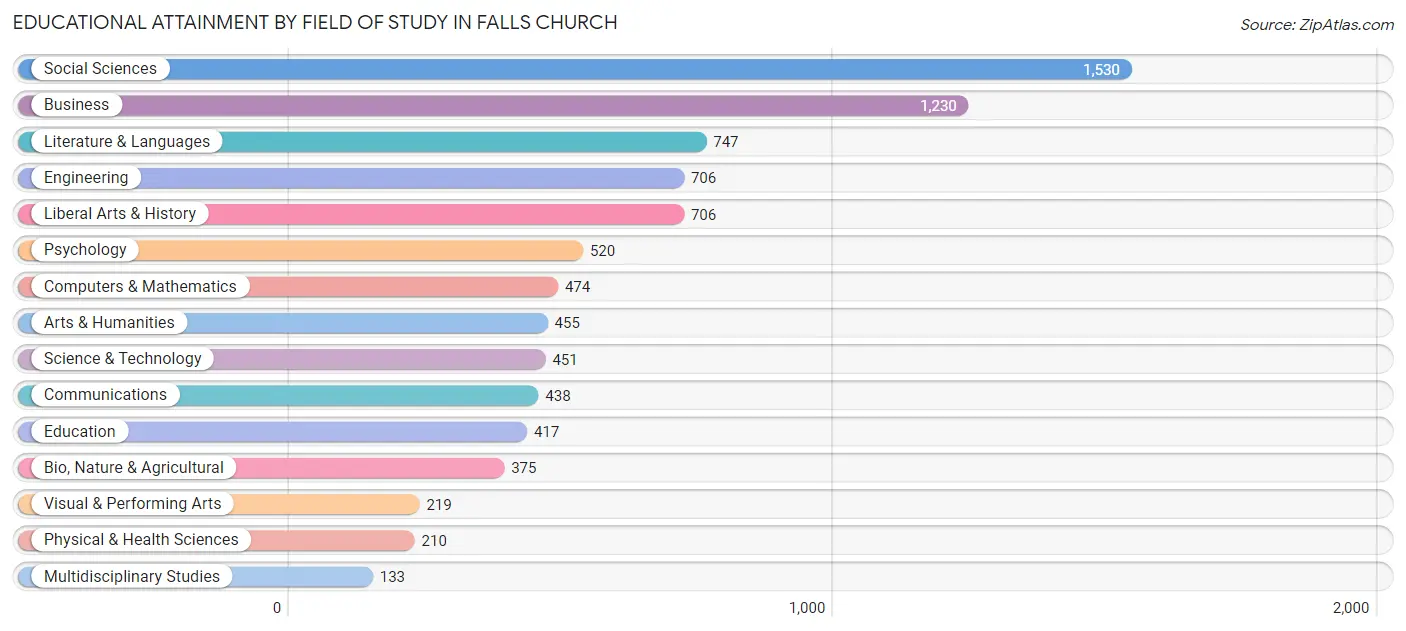
| Field of Study | # Graduates | % Graduates |
| Computers & Mathematics | 474 | 5.5% |
| Bio, Nature & Agricultural | 375 | 4.3% |
| Physical & Health Sciences | 210 | 2.4% |
| Psychology | 520 | 6.0% |
| Social Sciences | 1,530 | 17.8% |
| Engineering | 706 | 8.2% |
| Multidisciplinary Studies | 133 | 1.5% |
| Science & Technology | 451 | 5.2% |
| Business | 1,230 | 14.3% |
| Education | 417 | 4.8% |
| Literature & Languages | 747 | 8.7% |
| Liberal Arts & History | 706 | 8.2% |
| Visual & Performing Arts | 219 | 2.5% |
| Communications | 438 | 5.1% |
| Arts & Humanities | 455 | 5.3% |
| Total | 8,611 | 100.0% |
Transportation & Commute in Falls Church
Vehicle Availability by Sex in Falls Church
The most prevalent vehicle ownership categories in Falls Church are males with 2 vehicles (1,977, accounting for 49.3%) and females with 2 vehicles (1,699, making up 50.5%).
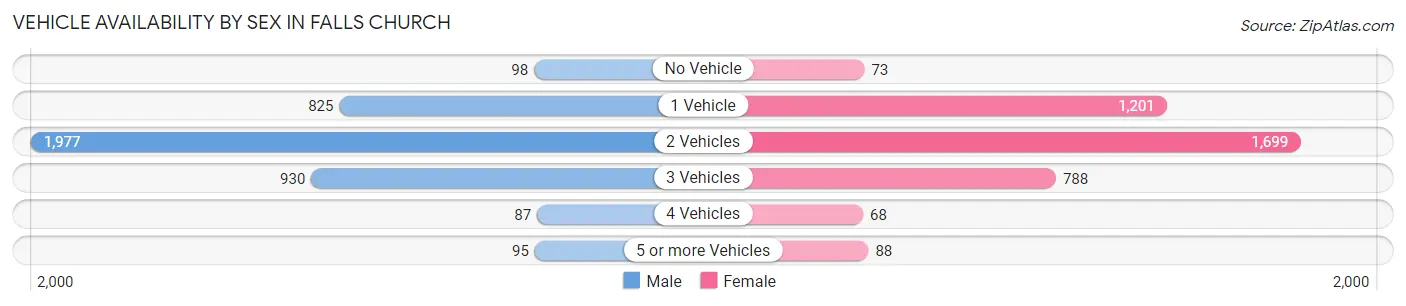
| Vehicles Available | Male | Female |
| No Vehicle | 98 (2.4%) | 73 (1.9%) |
| 1 Vehicle | 825 (20.6%) | 1,201 (30.7%) |
| 2 Vehicles | 1,977 (49.3%) | 1,699 (43.4%) |
| 3 Vehicles | 930 (23.2%) | 788 (20.1%) |
| 4 Vehicles | 87 (2.2%) | 68 (1.7%) |
| 5 or more Vehicles | 95 (2.4%) | 88 (2.2%) |
| Total | 4,012 (100.0%) | 3,917 (100.0%) |
Commute Time in Falls Church
The most frequently occuring commute durations in Falls Church are 20 to 24 minutes (1,019 commuters, 17.5%), 45 to 59 minutes (895 commuters, 15.4%), and 15 to 19 minutes (822 commuters, 14.1%).
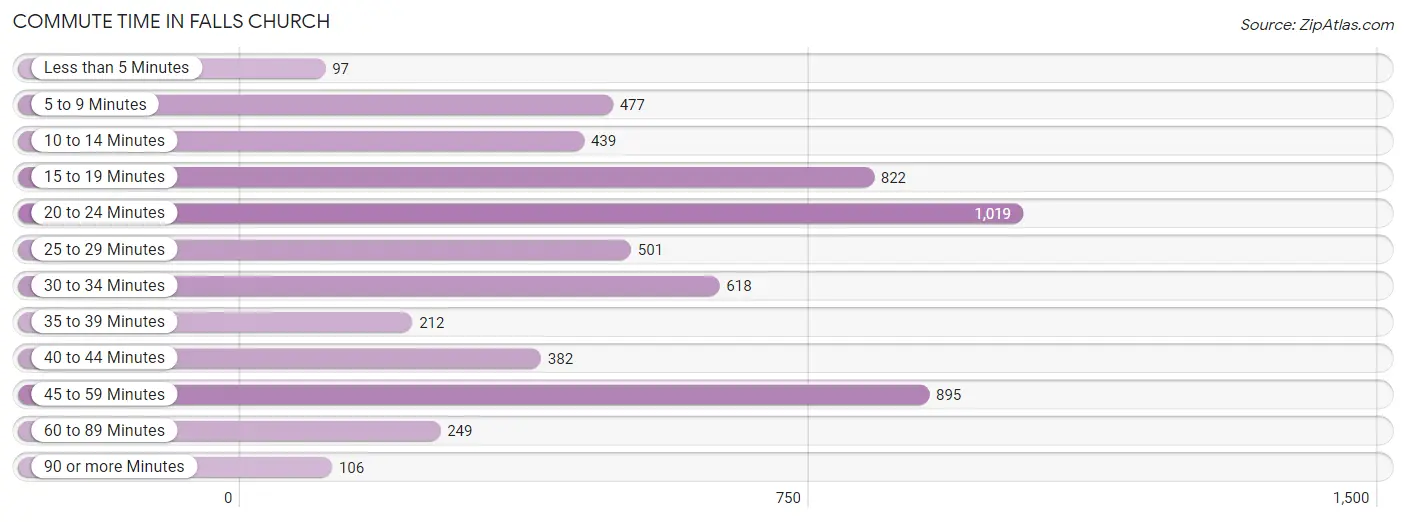
| Commute Time | # Commuters | % Commuters |
| Less than 5 Minutes | 97 | 1.7% |
| 5 to 9 Minutes | 477 | 8.2% |
| 10 to 14 Minutes | 439 | 7.5% |
| 15 to 19 Minutes | 822 | 14.1% |
| 20 to 24 Minutes | 1,019 | 17.5% |
| 25 to 29 Minutes | 501 | 8.6% |
| 30 to 34 Minutes | 618 | 10.6% |
| 35 to 39 Minutes | 212 | 3.6% |
| 40 to 44 Minutes | 382 | 6.6% |
| 45 to 59 Minutes | 895 | 15.4% |
| 60 to 89 Minutes | 249 | 4.3% |
| 90 or more Minutes | 106 | 1.8% |
Commute Time by Sex in Falls Church
The most common commute times in Falls Church are 20 to 24 minutes (621 commuters, 20.6%) for males and 20 to 24 minutes (398 commuters, 14.2%) for females.
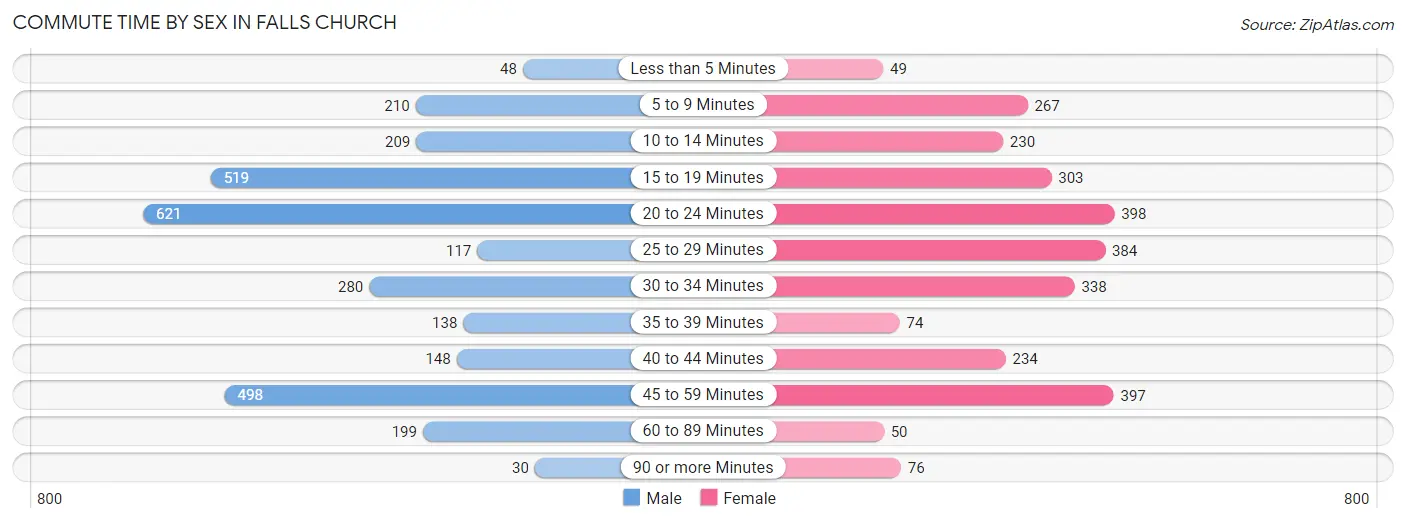
| Commute Time | Male | Female |
| Less than 5 Minutes | 48 (1.6%) | 49 (1.8%) |
| 5 to 9 Minutes | 210 (7.0%) | 267 (9.5%) |
| 10 to 14 Minutes | 209 (6.9%) | 230 (8.2%) |
| 15 to 19 Minutes | 519 (17.2%) | 303 (10.8%) |
| 20 to 24 Minutes | 621 (20.6%) | 398 (14.2%) |
| 25 to 29 Minutes | 117 (3.9%) | 384 (13.7%) |
| 30 to 34 Minutes | 280 (9.3%) | 338 (12.1%) |
| 35 to 39 Minutes | 138 (4.6%) | 74 (2.6%) |
| 40 to 44 Minutes | 148 (4.9%) | 234 (8.4%) |
| 45 to 59 Minutes | 498 (16.5%) | 397 (14.2%) |
| 60 to 89 Minutes | 199 (6.6%) | 50 (1.8%) |
| 90 or more Minutes | 30 (1.0%) | 76 (2.7%) |
Time of Departure to Work by Sex in Falls Church
The most frequent times of departure to work in Falls Church are 8:00 AM to 8:29 AM (502, 16.6%) for males and 8:00 AM to 8:29 AM (571, 20.4%) for females.
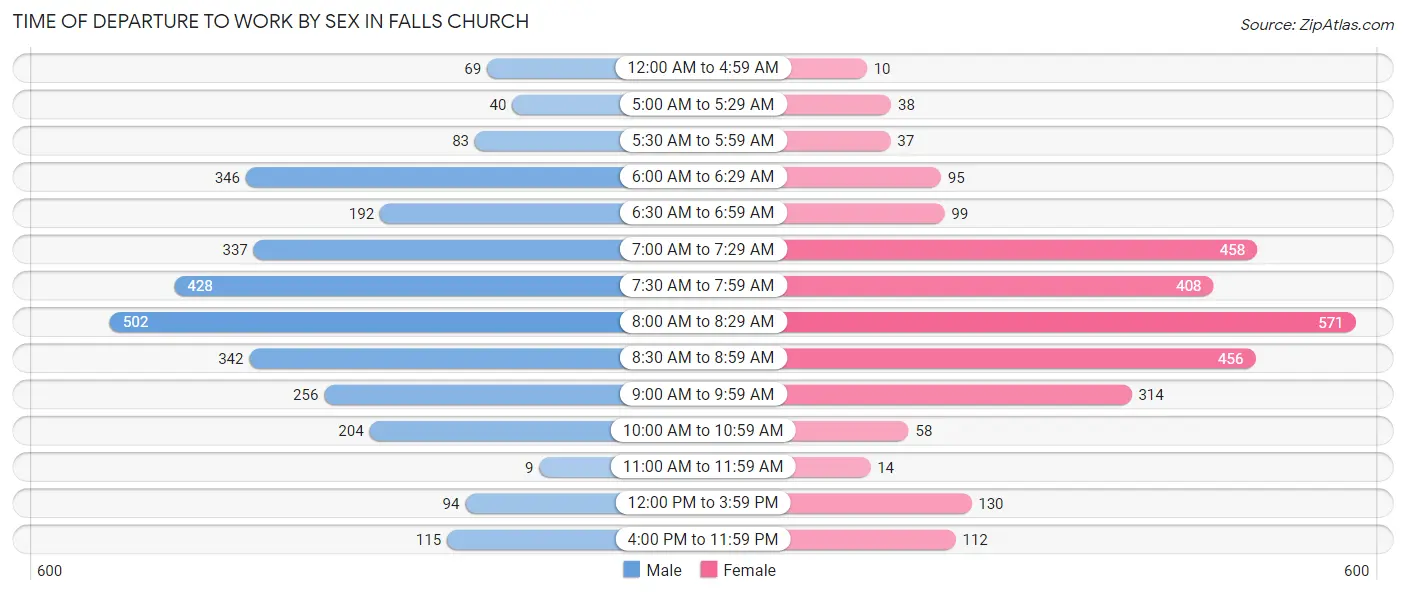
| Time of Departure | Male | Female |
| 12:00 AM to 4:59 AM | 69 (2.3%) | 10 (0.4%) |
| 5:00 AM to 5:29 AM | 40 (1.3%) | 38 (1.4%) |
| 5:30 AM to 5:59 AM | 83 (2.8%) | 37 (1.3%) |
| 6:00 AM to 6:29 AM | 346 (11.5%) | 95 (3.4%) |
| 6:30 AM to 6:59 AM | 192 (6.4%) | 99 (3.5%) |
| 7:00 AM to 7:29 AM | 337 (11.2%) | 458 (16.4%) |
| 7:30 AM to 7:59 AM | 428 (14.2%) | 408 (14.6%) |
| 8:00 AM to 8:29 AM | 502 (16.6%) | 571 (20.4%) |
| 8:30 AM to 8:59 AM | 342 (11.3%) | 456 (16.3%) |
| 9:00 AM to 9:59 AM | 256 (8.5%) | 314 (11.2%) |
| 10:00 AM to 10:59 AM | 204 (6.8%) | 58 (2.1%) |
| 11:00 AM to 11:59 AM | 9 (0.3%) | 14 (0.5%) |
| 12:00 PM to 3:59 PM | 94 (3.1%) | 130 (4.6%) |
| 4:00 PM to 11:59 PM | 115 (3.8%) | 112 (4.0%) |
| Total | 3,017 (100.0%) | 2,800 (100.0%) |
Housing Occupancy in Falls Church
Occupancy by Ownership in Falls Church
Of the total 5,740 dwellings in Falls Church, owner-occupied units account for 3,191 (55.6%), while renter-occupied units make up 2,549 (44.4%).
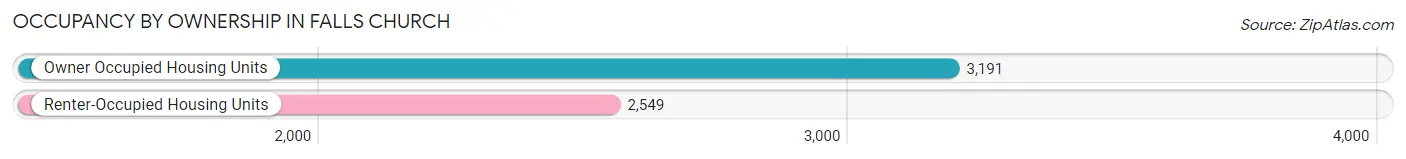
| Occupancy | # Housing Units | % Housing Units |
| Owner Occupied Housing Units | 3,191 | 55.6% |
| Renter-Occupied Housing Units | 2,549 | 44.4% |
| Total Occupied Housing Units | 5,740 | 100.0% |
Occupancy by Household Size in Falls Church
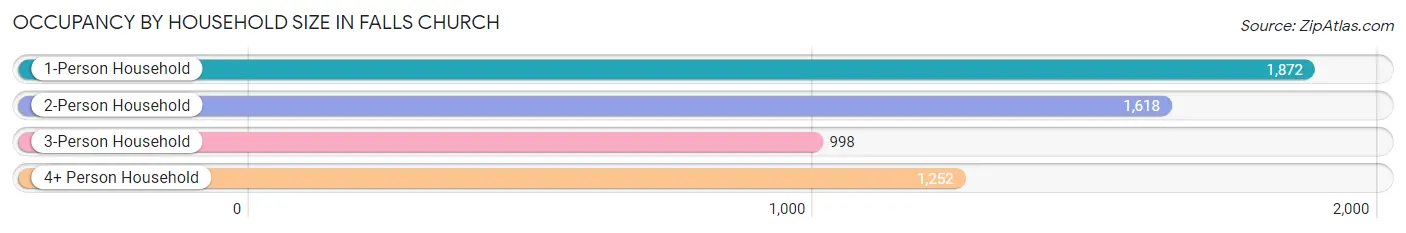
| Household Size | # Housing Units | % Housing Units |
| 1-Person Household | 1,872 | 32.6% |
| 2-Person Household | 1,618 | 28.2% |
| 3-Person Household | 998 | 17.4% |
| 4+ Person Household | 1,252 | 21.8% |
| Total Housing Units | 5,740 | 100.0% |
Occupancy by Ownership by Household Size in Falls Church
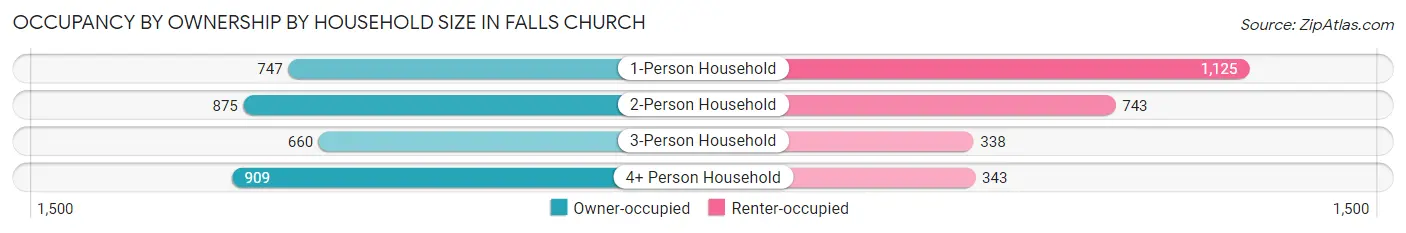
| Household Size | Owner-occupied | Renter-occupied |
| 1-Person Household | 747 (39.9%) | 1,125 (60.1%) |
| 2-Person Household | 875 (54.1%) | 743 (45.9%) |
| 3-Person Household | 660 (66.1%) | 338 (33.9%) |
| 4+ Person Household | 909 (72.6%) | 343 (27.4%) |
| Total Housing Units | 3,191 (55.6%) | 2,549 (44.4%) |
Occupancy by Educational Attainment in Falls Church
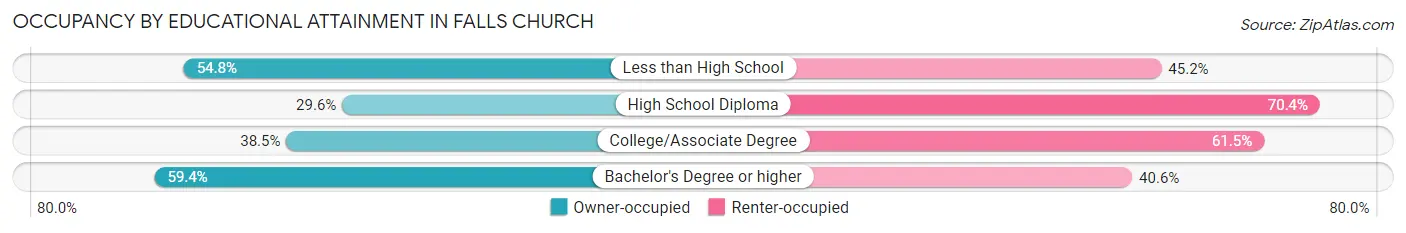
| Household Size | Owner-occupied | Renter-occupied |
| Less than High School | 23 (54.8%) | 19 (45.2%) |
| High School Diploma | 72 (29.6%) | 171 (70.4%) |
| College/Associate Degree | 266 (38.5%) | 425 (61.5%) |
| Bachelor's Degree or higher | 2,830 (59.4%) | 1,934 (40.6%) |
Occupancy by Age of Householder in Falls Church
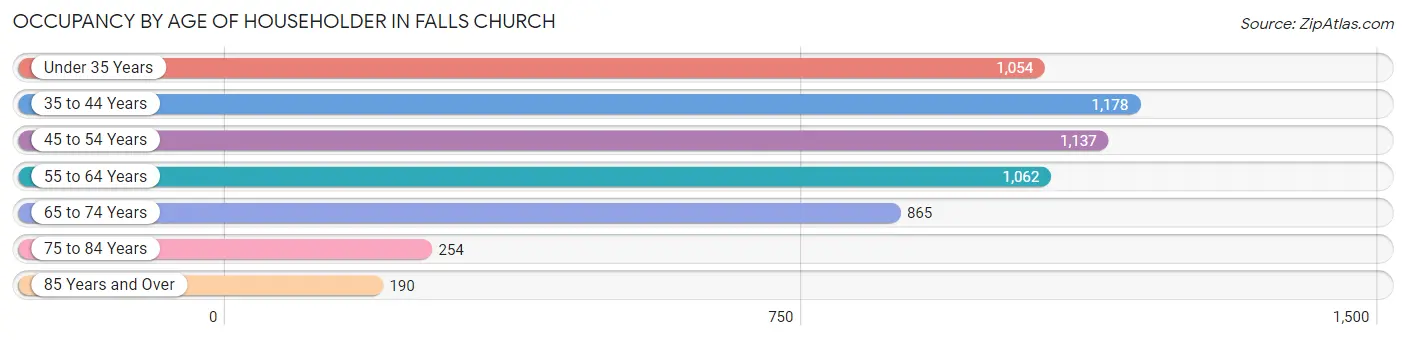
| Age Bracket | # Households | % Households |
| Under 35 Years | 1,054 | 18.4% |
| 35 to 44 Years | 1,178 | 20.5% |
| 45 to 54 Years | 1,137 | 19.8% |
| 55 to 64 Years | 1,062 | 18.5% |
| 65 to 74 Years | 865 | 15.1% |
| 75 to 84 Years | 254 | 4.4% |
| 85 Years and Over | 190 | 3.3% |
| Total | 5,740 | 100.0% |
Housing Finances in Falls Church
Median Income by Occupancy in Falls Church
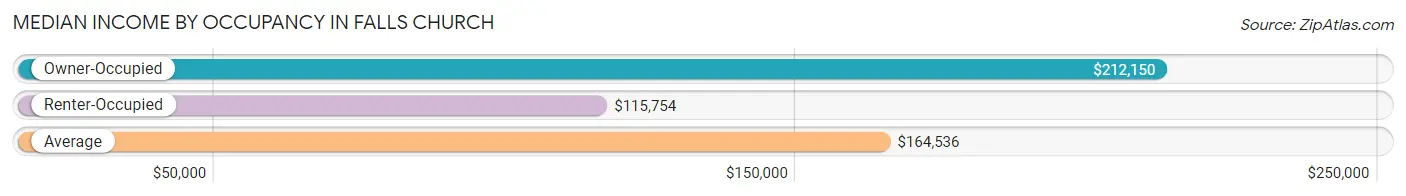
| Occupancy Type | # Households | Median Income |
| Owner-Occupied | 3,191 (55.6%) | $212,150 |
| Renter-Occupied | 2,549 (44.4%) | $115,754 |
| Average | 5,740 (100.0%) | $164,536 |
Occupancy by Householder Income Bracket in Falls Church
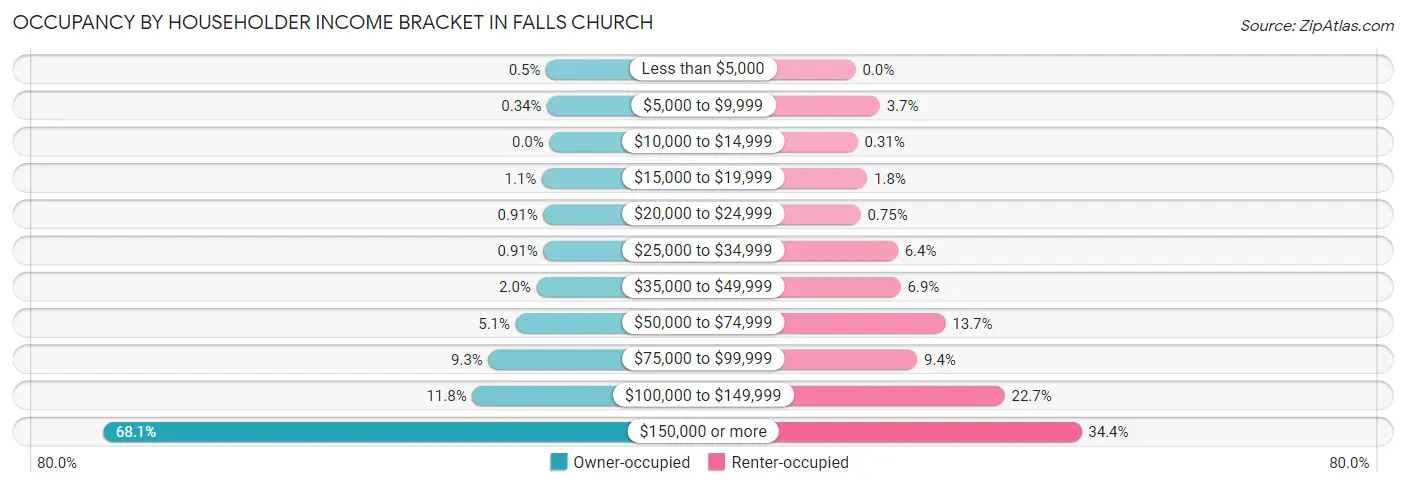
| Income Bracket | Owner-occupied | Renter-occupied |
| Less than $5,000 | 16 (0.5%) | 0 (0.0%) |
| $5,000 to $9,999 | 11 (0.3%) | 94 (3.7%) |
| $10,000 to $14,999 | 0 (0.0%) | 8 (0.3%) |
| $15,000 to $19,999 | 36 (1.1%) | 45 (1.8%) |
| $20,000 to $24,999 | 29 (0.9%) | 19 (0.7%) |
| $25,000 to $34,999 | 29 (0.9%) | 164 (6.4%) |
| $35,000 to $49,999 | 63 (2.0%) | 175 (6.9%) |
| $50,000 to $74,999 | 164 (5.1%) | 349 (13.7%) |
| $75,000 to $99,999 | 296 (9.3%) | 239 (9.4%) |
| $100,000 to $149,999 | 375 (11.7%) | 579 (22.7%) |
| $150,000 or more | 2,172 (68.1%) | 877 (34.4%) |
| Total | 3,191 (100.0%) | 2,549 (100.0%) |
Monthly Housing Cost Tiers in Falls Church
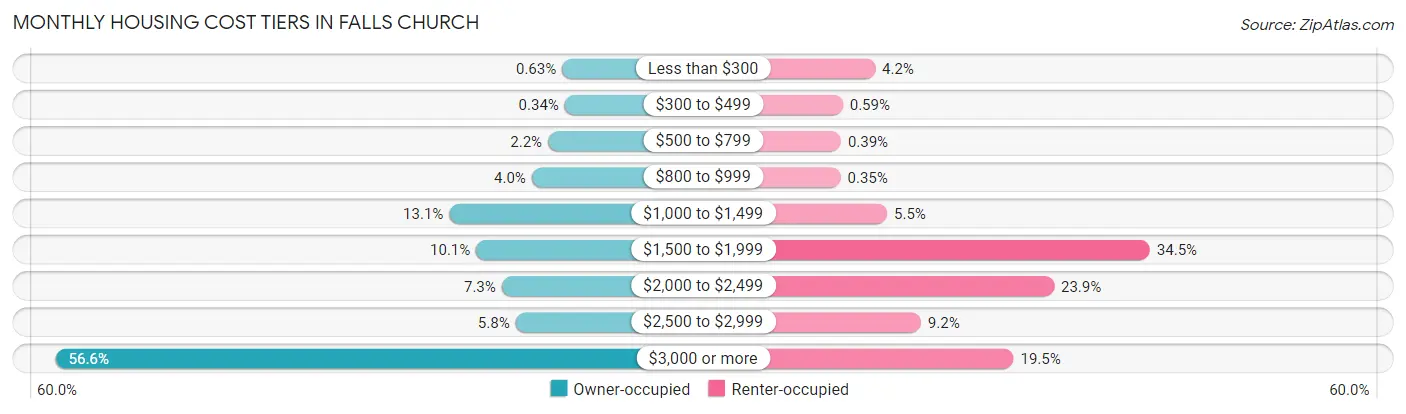
| Monthly Cost | Owner-occupied | Renter-occupied |
| Less than $300 | 20 (0.6%) | 106 (4.2%) |
| $300 to $499 | 11 (0.3%) | 15 (0.6%) |
| $500 to $799 | 70 (2.2%) | 10 (0.4%) |
| $800 to $999 | 127 (4.0%) | 9 (0.4%) |
| $1,000 to $1,499 | 418 (13.1%) | 140 (5.5%) |
| $1,500 to $1,999 | 323 (10.1%) | 880 (34.5%) |
| $2,000 to $2,499 | 233 (7.3%) | 610 (23.9%) |
| $2,500 to $2,999 | 184 (5.8%) | 235 (9.2%) |
| $3,000 or more | 1,805 (56.6%) | 496 (19.5%) |
| Total | 3,191 (100.0%) | 2,549 (100.0%) |
Physical Housing Characteristics in Falls Church
Housing Structures in Falls Church
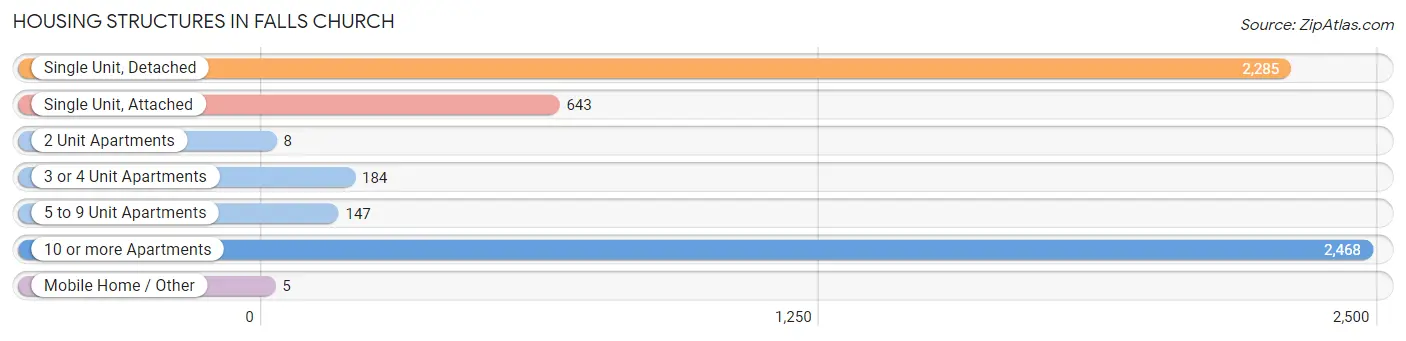
| Structure Type | # Housing Units | % Housing Units |
| Single Unit, Detached | 2,285 | 39.8% |
| Single Unit, Attached | 643 | 11.2% |
| 2 Unit Apartments | 8 | 0.1% |
| 3 or 4 Unit Apartments | 184 | 3.2% |
| 5 to 9 Unit Apartments | 147 | 2.6% |
| 10 or more Apartments | 2,468 | 43.0% |
| Mobile Home / Other | 5 | 0.1% |
| Total | 5,740 | 100.0% |
Housing Structures by Occupancy in Falls Church
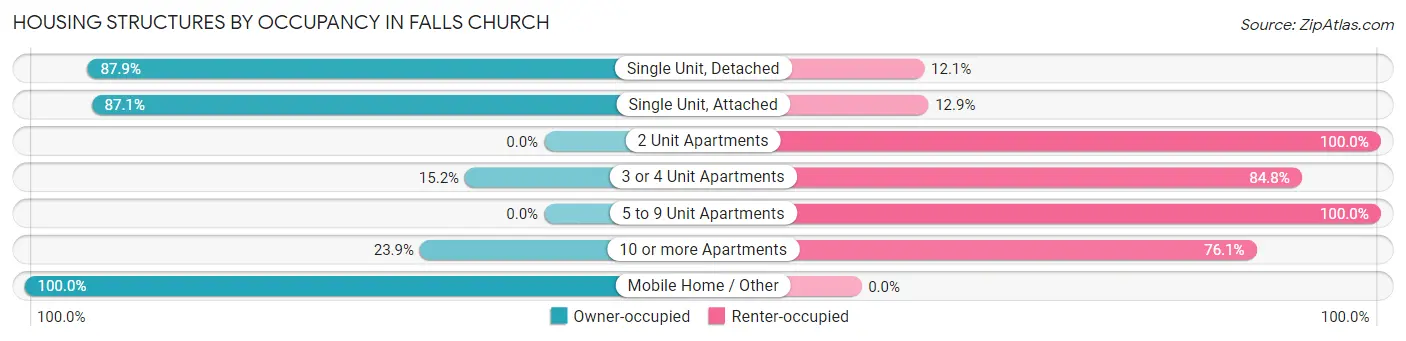
| Structure Type | Owner-occupied | Renter-occupied |
| Single Unit, Detached | 2,008 (87.9%) | 277 (12.1%) |
| Single Unit, Attached | 560 (87.1%) | 83 (12.9%) |
| 2 Unit Apartments | 0 (0.0%) | 8 (100.0%) |
| 3 or 4 Unit Apartments | 28 (15.2%) | 156 (84.8%) |
| 5 to 9 Unit Apartments | 0 (0.0%) | 147 (100.0%) |
| 10 or more Apartments | 590 (23.9%) | 1,878 (76.1%) |
| Mobile Home / Other | 5 (100.0%) | 0 (0.0%) |
| Total | 3,191 (55.6%) | 2,549 (44.4%) |
Housing Structures by Number of Rooms in Falls Church
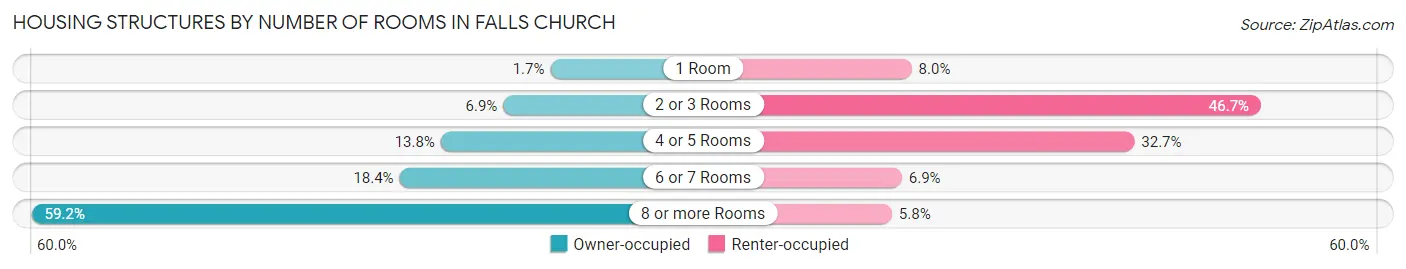
| Number of Rooms | Owner-occupied | Renter-occupied |
| 1 Room | 53 (1.7%) | 203 (8.0%) |
| 2 or 3 Rooms | 220 (6.9%) | 1,191 (46.7%) |
| 4 or 5 Rooms | 441 (13.8%) | 833 (32.7%) |
| 6 or 7 Rooms | 587 (18.4%) | 175 (6.9%) |
| 8 or more Rooms | 1,890 (59.2%) | 147 (5.8%) |
| Total | 3,191 (100.0%) | 2,549 (100.0%) |
Housing Structure by Heating Type in Falls Church
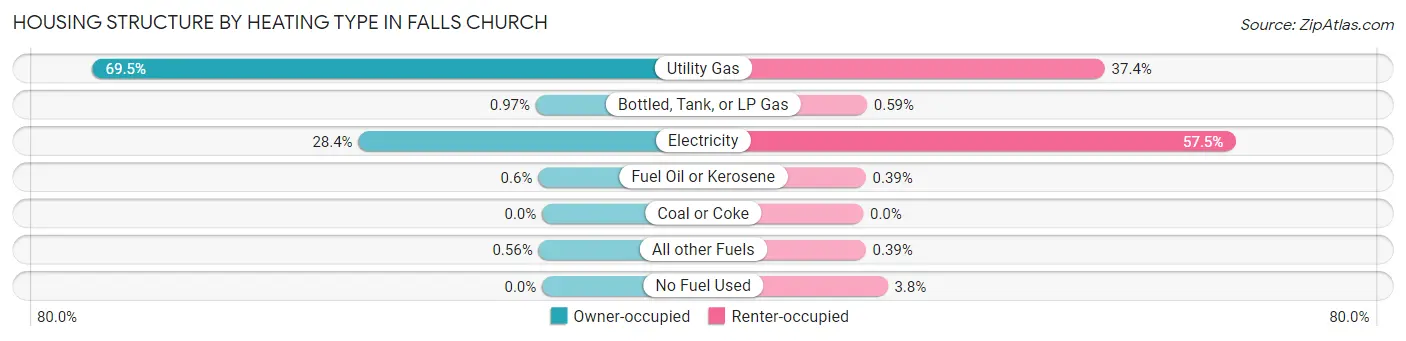
| Heating Type | Owner-occupied | Renter-occupied |
| Utility Gas | 2,217 (69.5%) | 952 (37.3%) |
| Bottled, Tank, or LP Gas | 31 (1.0%) | 15 (0.6%) |
| Electricity | 906 (28.4%) | 1,466 (57.5%) |
| Fuel Oil or Kerosene | 19 (0.6%) | 10 (0.4%) |
| Coal or Coke | 0 (0.0%) | 0 (0.0%) |
| All other Fuels | 18 (0.6%) | 10 (0.4%) |
| No Fuel Used | 0 (0.0%) | 96 (3.8%) |
| Total | 3,191 (100.0%) | 2,549 (100.0%) |
Household Vehicle Usage in Falls Church
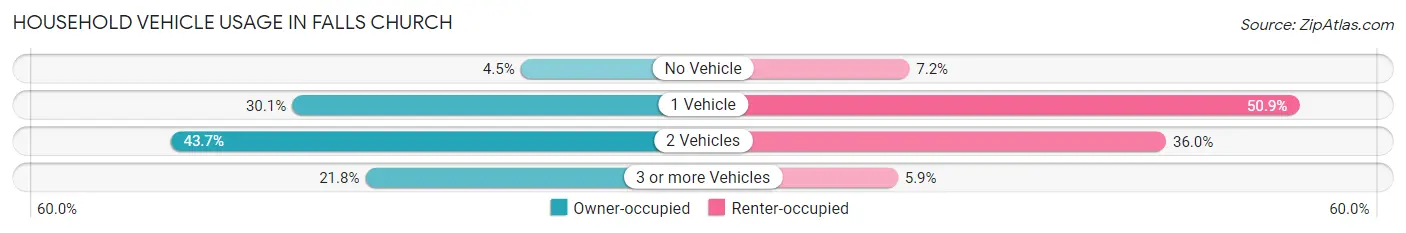
| Vehicles per Household | Owner-occupied | Renter-occupied |
| No Vehicle | 142 (4.4%) | 184 (7.2%) |
| 1 Vehicle | 959 (30.0%) | 1,297 (50.9%) |
| 2 Vehicles | 1,393 (43.6%) | 917 (36.0%) |
| 3 or more Vehicles | 697 (21.8%) | 151 (5.9%) |
| Total | 3,191 (100.0%) | 2,549 (100.0%) |
Real Estate & Mortgages in Falls Church
Real Estate and Mortgage Overview in Falls Church
| Characteristic | Without Mortgage | With Mortgage |
| Housing Units | 957 | 2,234 |
| Median Property Value | $753,400 | $1,024,600 |
| Median Household Income | $114,375 | $1,793 |
| Monthly Housing Costs | $1,199 | $1,795 |
| Real Estate Taxes | $10,001 | $0 |
Property Value by Mortgage Status in Falls Church
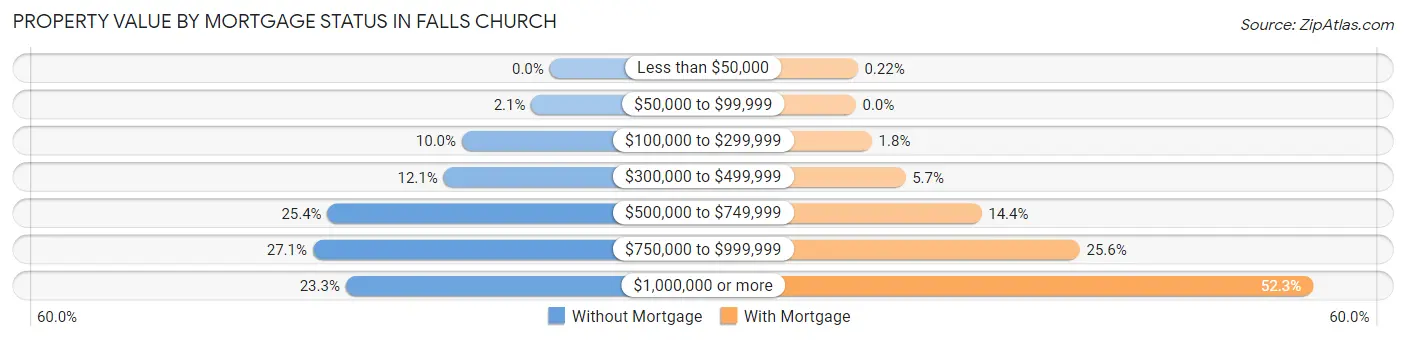
| Property Value | Without Mortgage | With Mortgage |
| Less than $50,000 | 0 (0.0%) | 5 (0.2%) |
| $50,000 to $99,999 | 20 (2.1%) | 0 (0.0%) |
| $100,000 to $299,999 | 96 (10.0%) | 41 (1.8%) |
| $300,000 to $499,999 | 116 (12.1%) | 127 (5.7%) |
| $500,000 to $749,999 | 243 (25.4%) | 321 (14.4%) |
| $750,000 to $999,999 | 259 (27.1%) | 572 (25.6%) |
| $1,000,000 or more | 223 (23.3%) | 1,168 (52.3%) |
| Total | 957 (100.0%) | 2,234 (100.0%) |
Household Income by Mortgage Status in Falls Church
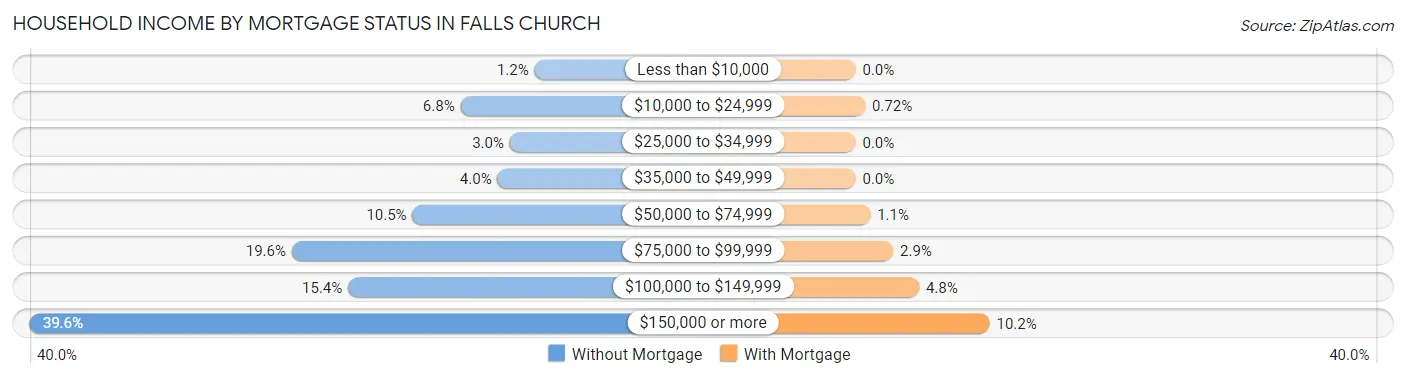
| Household Income | Without Mortgage | With Mortgage |
| Less than $10,000 | 11 (1.1%) | 0 (0.0%) |
| $10,000 to $24,999 | 65 (6.8%) | 16 (0.7%) |
| $25,000 to $34,999 | 29 (3.0%) | 0 (0.0%) |
| $35,000 to $49,999 | 38 (4.0%) | 0 (0.0%) |
| $50,000 to $74,999 | 100 (10.4%) | 25 (1.1%) |
| $75,000 to $99,999 | 188 (19.6%) | 64 (2.9%) |
| $100,000 to $149,999 | 147 (15.4%) | 108 (4.8%) |
| $150,000 or more | 379 (39.6%) | 228 (10.2%) |
| Total | 957 (100.0%) | 2,234 (100.0%) |
Property Value to Household Income Ratio in Falls Church
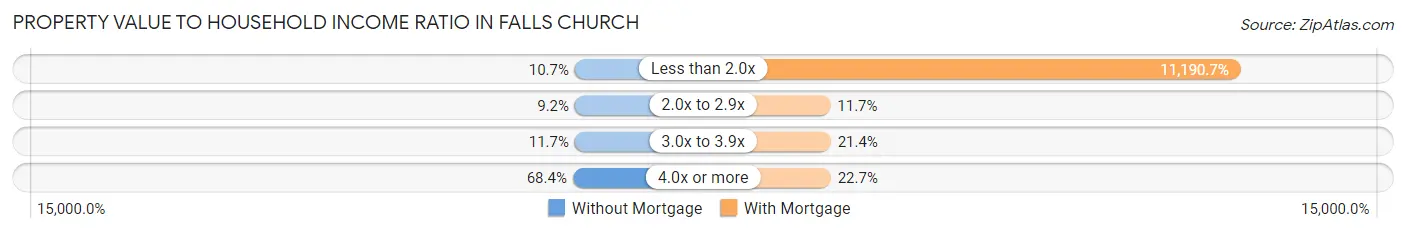
| Value-to-Income Ratio | Without Mortgage | With Mortgage |
| Less than 2.0x | 102 (10.7%) | 250,001 (11,190.7%) |
| 2.0x to 2.9x | 88 (9.2%) | 262 (11.7%) |
| 3.0x to 3.9x | 112 (11.7%) | 478 (21.4%) |
| 4.0x or more | 655 (68.4%) | 508 (22.7%) |
| Total | 957 (100.0%) | 2,234 (100.0%) |
Real Estate Taxes by Mortgage Status in Falls Church
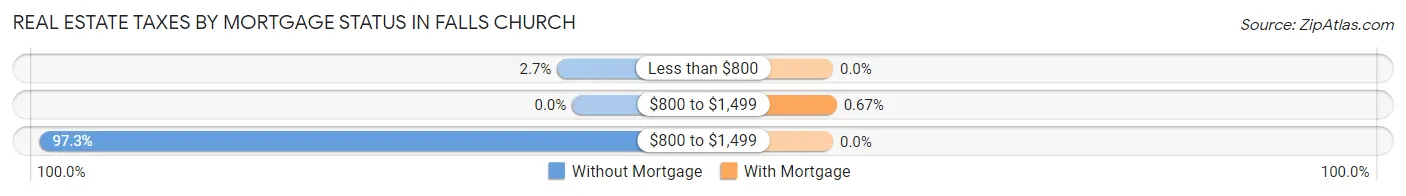
| Property Taxes | Without Mortgage | With Mortgage |
| Less than $800 | 26 (2.7%) | 0 (0.0%) |
| $800 to $1,499 | 0 (0.0%) | 15 (0.7%) |
| $800 to $1,499 | 931 (97.3%) | 0 (0.0%) |
| Total | 957 (100.0%) | 2,234 (100.0%) |
Health & Disability in Falls Church
Health Insurance Coverage by Age in Falls Church
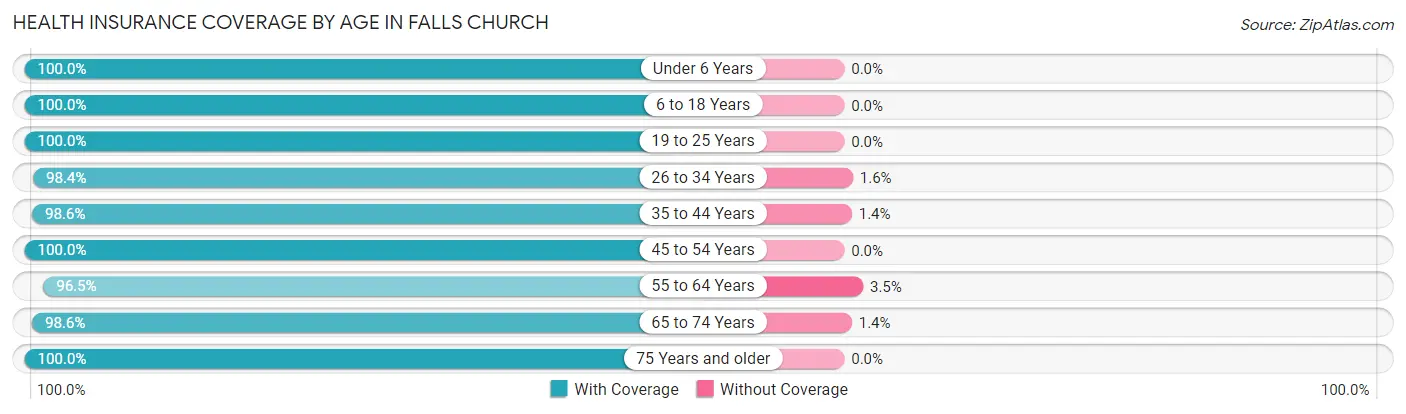
| Age Bracket | With Coverage | Without Coverage |
| Under 6 Years | 840 (100.0%) | 0 (0.0%) |
| 6 to 18 Years | 2,994 (100.0%) | 0 (0.0%) |
| 19 to 25 Years | 1,194 (100.0%) | 0 (0.0%) |
| 26 to 34 Years | 1,482 (98.4%) | 24 (1.6%) |
| 35 to 44 Years | 1,969 (98.6%) | 28 (1.4%) |
| 45 to 54 Years | 2,052 (100.0%) | 0 (0.0%) |
| 55 to 64 Years | 1,796 (96.5%) | 65 (3.5%) |
| 65 to 74 Years | 1,271 (98.6%) | 18 (1.4%) |
| 75 Years and older | 684 (100.0%) | 0 (0.0%) |
| Total | 14,282 (99.1%) | 135 (0.9%) |
Health Insurance Coverage by Citizenship Status in Falls Church
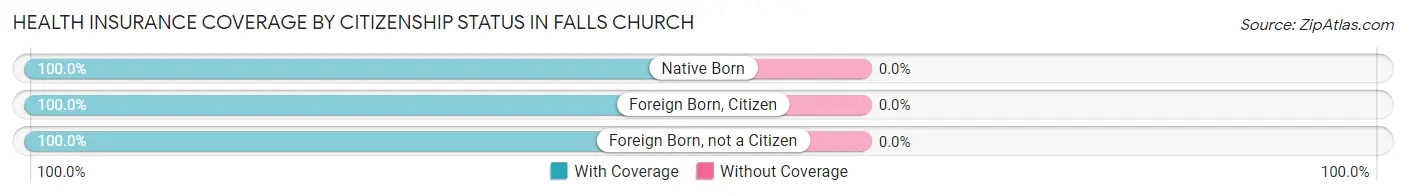
| Citizenship Status | With Coverage | Without Coverage |
| Native Born | 840 (100.0%) | 0 (0.0%) |
| Foreign Born, Citizen | 2,994 (100.0%) | 0 (0.0%) |
| Foreign Born, not a Citizen | 1,194 (100.0%) | 0 (0.0%) |
Health Insurance Coverage by Household Income in Falls Church
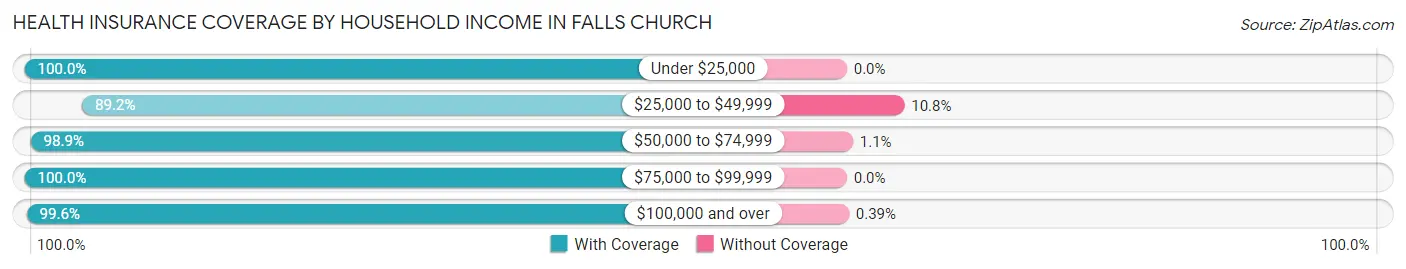
| Household Income | With Coverage | Without Coverage |
| Under $25,000 | 379 (100.0%) | 0 (0.0%) |
| $25,000 to $49,999 | 530 (89.2%) | 64 (10.8%) |
| $50,000 to $74,999 | 954 (98.9%) | 11 (1.1%) |
| $75,000 to $99,999 | 908 (100.0%) | 0 (0.0%) |
| $100,000 and over | 11,485 (99.6%) | 45 (0.4%) |
Public vs Private Health Insurance Coverage by Age in Falls Church
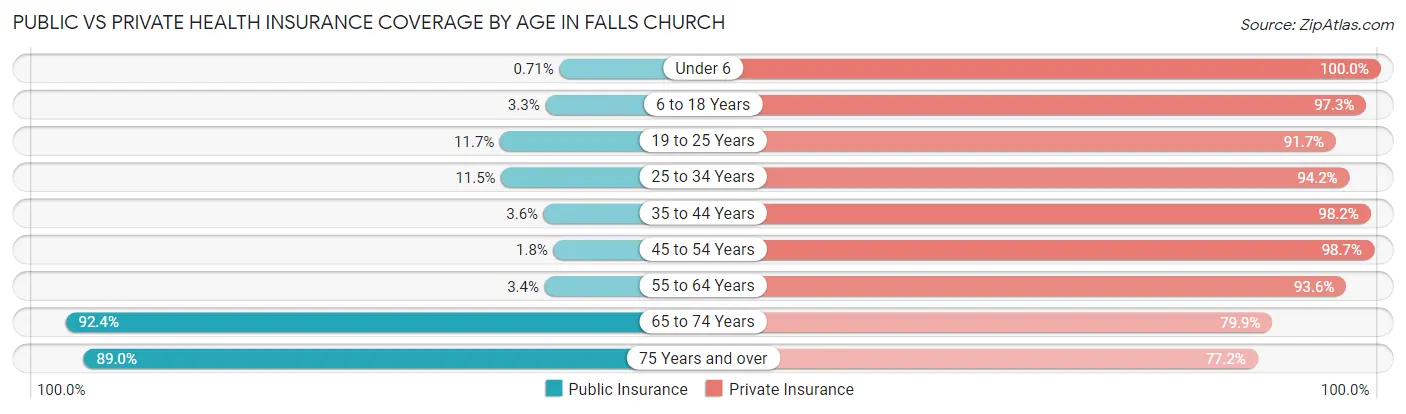
| Age Bracket | Public Insurance | Private Insurance |
| Under 6 | 6 (0.7%) | 840 (100.0%) |
| 6 to 18 Years | 99 (3.3%) | 2,914 (97.3%) |
| 19 to 25 Years | 140 (11.7%) | 1,095 (91.7%) |
| 25 to 34 Years | 173 (11.5%) | 1,419 (94.2%) |
| 35 to 44 Years | 72 (3.6%) | 1,960 (98.2%) |
| 45 to 54 Years | 37 (1.8%) | 2,026 (98.7%) |
| 55 to 64 Years | 64 (3.4%) | 1,742 (93.6%) |
| 65 to 74 Years | 1,191 (92.4%) | 1,030 (79.9%) |
| 75 Years and over | 609 (89.0%) | 528 (77.2%) |
| Total | 2,391 (16.6%) | 13,554 (94.0%) |
Disability Status by Sex by Age in Falls Church
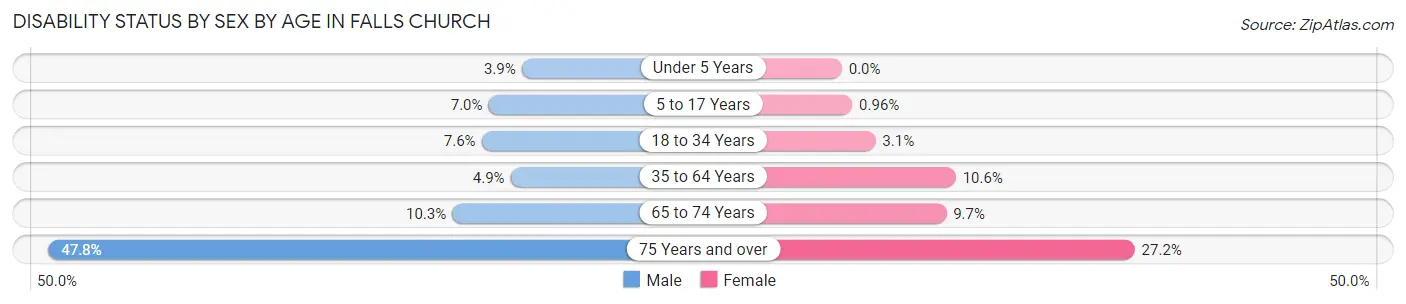
| Age Bracket | Male | Female |
| Under 5 Years | 16 (3.9%) | 0 (0.0%) |
| 5 to 17 Years | 110 (7.0%) | 12 (1.0%) |
| 18 to 34 Years | 111 (7.6%) | 48 (3.1%) |
| 35 to 64 Years | 138 (4.9%) | 328 (10.6%) |
| 65 to 74 Years | 66 (10.3%) | 63 (9.7%) |
| 75 Years and over | 130 (47.8%) | 112 (27.2%) |
Disability Class by Sex by Age in Falls Church
Disability Class: Hearing Difficulty
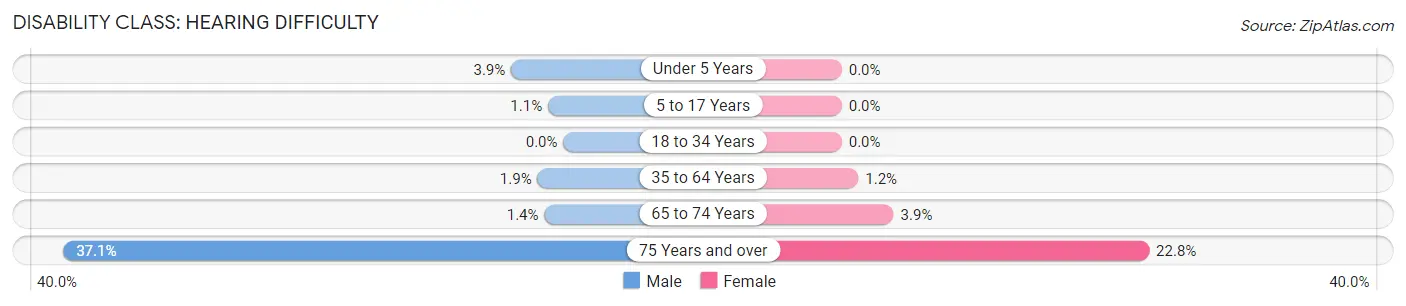
| Age Bracket | Male | Female |
| Under 5 Years | 16 (3.9%) | 0 (0.0%) |
| 5 to 17 Years | 18 (1.1%) | 0 (0.0%) |
| 18 to 34 Years | 0 (0.0%) | 0 (0.0%) |
| 35 to 64 Years | 54 (1.9%) | 38 (1.2%) |
| 65 to 74 Years | 9 (1.4%) | 25 (3.8%) |
| 75 Years and over | 101 (37.1%) | 94 (22.8%) |
Disability Class: Vision Difficulty
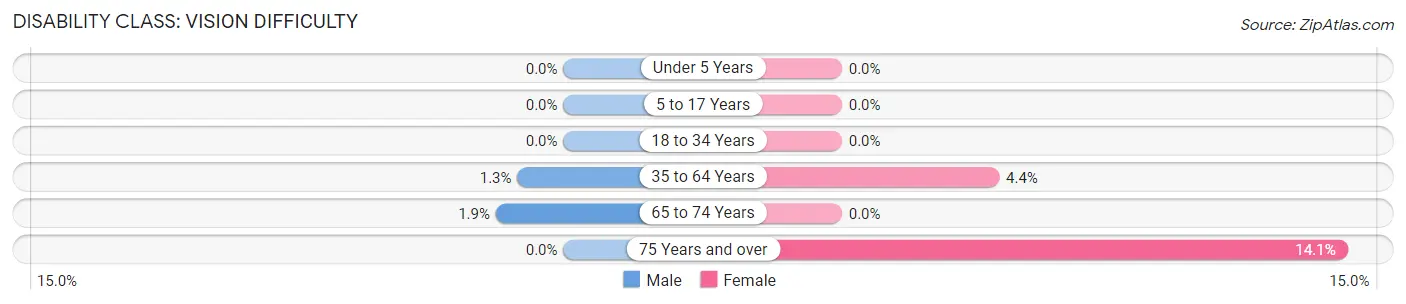
| Age Bracket | Male | Female |
| Under 5 Years | 0 (0.0%) | 0 (0.0%) |
| 5 to 17 Years | 0 (0.0%) | 0 (0.0%) |
| 18 to 34 Years | 0 (0.0%) | 0 (0.0%) |
| 35 to 64 Years | 36 (1.3%) | 136 (4.4%) |
| 65 to 74 Years | 12 (1.9%) | 0 (0.0%) |
| 75 Years and over | 0 (0.0%) | 58 (14.1%) |
Disability Class: Cognitive Difficulty
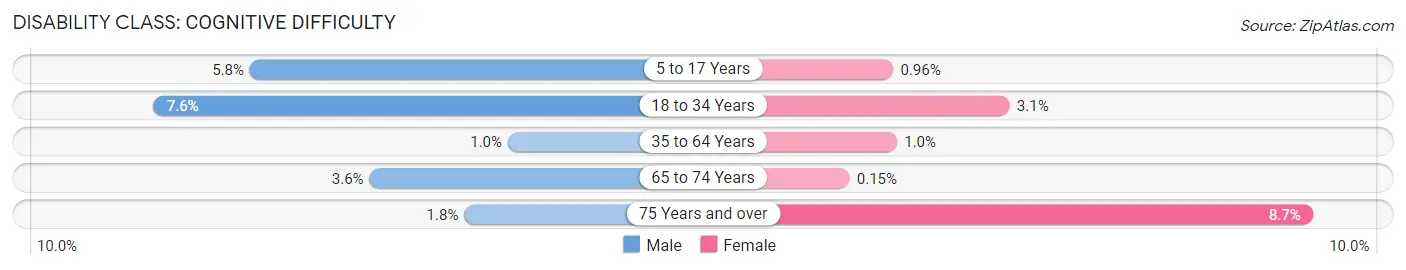
| Age Bracket | Male | Female |
| 5 to 17 Years | 92 (5.8%) | 12 (1.0%) |
| 18 to 34 Years | 111 (7.6%) | 48 (3.1%) |
| 35 to 64 Years | 29 (1.0%) | 32 (1.0%) |
| 65 to 74 Years | 23 (3.6%) | 1 (0.2%) |
| 75 Years and over | 5 (1.8%) | 36 (8.7%) |
Disability Class: Ambulatory Difficulty
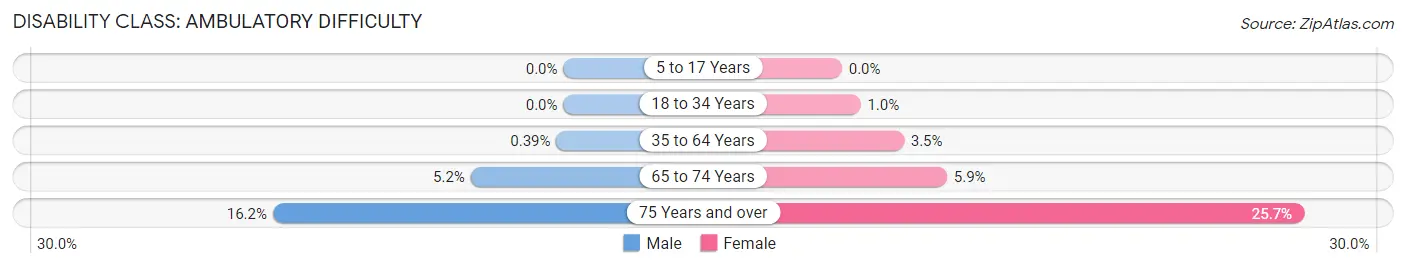
| Age Bracket | Male | Female |
| 5 to 17 Years | 0 (0.0%) | 0 (0.0%) |
| 18 to 34 Years | 0 (0.0%) | 16 (1.0%) |
| 35 to 64 Years | 11 (0.4%) | 107 (3.5%) |
| 65 to 74 Years | 33 (5.2%) | 38 (5.9%) |
| 75 Years and over | 44 (16.2%) | 106 (25.7%) |
Disability Class: Self-Care Difficulty
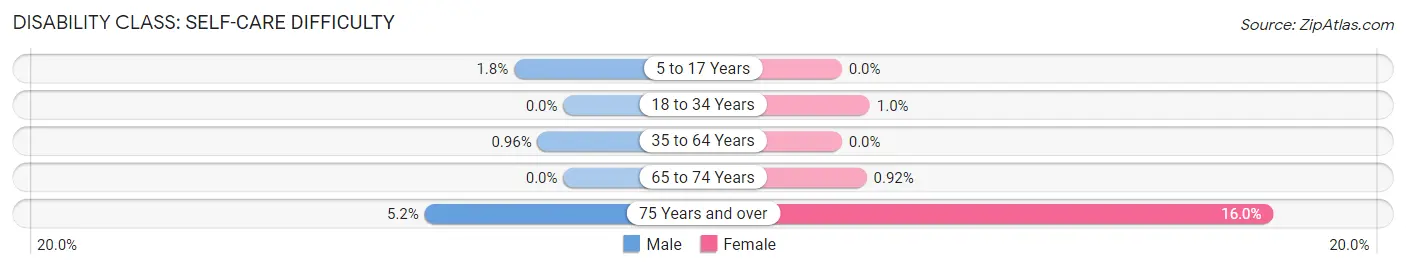
| Age Bracket | Male | Female |
| 5 to 17 Years | 29 (1.8%) | 0 (0.0%) |
| 18 to 34 Years | 0 (0.0%) | 16 (1.0%) |
| 35 to 64 Years | 27 (1.0%) | 0 (0.0%) |
| 65 to 74 Years | 0 (0.0%) | 6 (0.9%) |
| 75 Years and over | 14 (5.1%) | 66 (16.0%) |
Technology Access in Falls Church
Computing Device Access in Falls Church
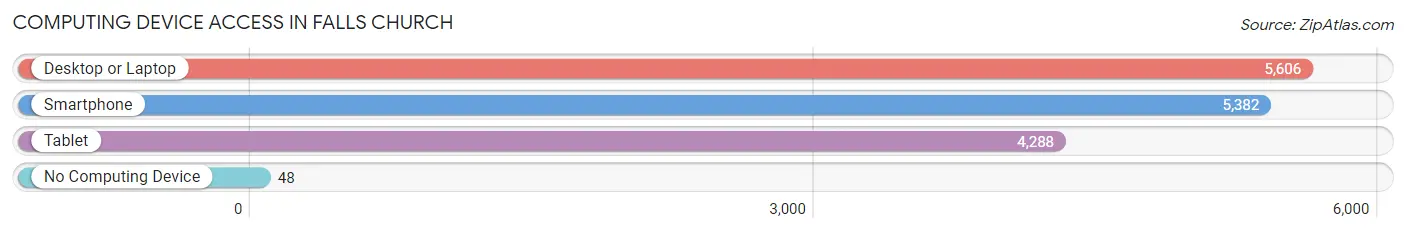
| Device Type | # Households | % Households |
| Desktop or Laptop | 5,606 | 97.7% |
| Smartphone | 5,382 | 93.8% |
| Tablet | 4,288 | 74.7% |
| No Computing Device | 48 | 0.8% |
| Total | 5,740 | 100.0% |
Internet Access in Falls Church
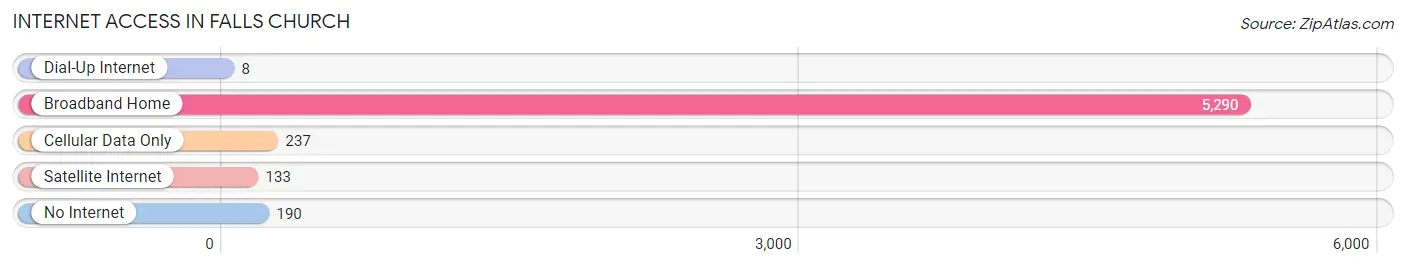
| Internet Type | # Households | % Households |
| Dial-Up Internet | 8 | 0.1% |
| Broadband Home | 5,290 | 92.2% |
| Cellular Data Only | 237 | 4.1% |
| Satellite Internet | 133 | 2.3% |
| No Internet | 190 | 3.3% |
| Total | 5,740 | 100.0% |
Falls Church Summary
Falls Church, Virginia is a small city located in the northern part of the state, just outside of Washington, D.C. It is an independent city, meaning it is not part of any county or state. The city is home to a population of 12,332 people, according to the 2010 census.
History
Falls Church was first settled in the late 1600s by English colonists. The city was originally known as The Falls Church, named after the Anglican parish of the same name. The parish was established in 1734 and the city was officially incorporated in 1948.
The city was a major agricultural center during the colonial period, and it was home to several prominent families, including the Mason family. George Mason, a Founding Father of the United States, was born in the city in 1725.
During the Civil War, the city was occupied by Union forces and was the site of several battles. After the war, the city experienced a period of growth and development, and it became a popular suburb of Washington, D.C.
Geography
Falls Church is located in the northern part of Virginia, just outside of Washington, D.C. It is bordered by Fairfax County to the north and east, Arlington County to the south, and the City of Alexandria to the west.
The city covers an area of 2.2 square miles and is located at an elevation of about 200 feet. The city is situated on the banks of the Potomac River and is home to several parks and recreational areas, including the Falls Church City Park and the Washington & Old Dominion Trail.
Economy
Falls Church is home to a diverse economy, with a mix of government, retail, and professional services. The city is home to several government agencies, including the Department of Defense, the Department of Homeland Security, and the Central Intelligence Agency.
The city is also home to several large retail stores, including Target, Best Buy, and Walmart. The city is also home to several professional services firms, including law firms, accounting firms, and consulting firms.
Demographics
As of the 2010 census, Falls Church had a population of 12,332 people. The city has a population density of 5,541 people per square mile. The median age of the population is 37.7 years, and the median household income is $107,817.
The city is racially diverse, with a population that is 54.3% White, 16.2% African American, 16.2% Asian, and 8.3% Hispanic or Latino. The city is also home to a large number of foreign-born residents, with about 25% of the population being foreign-born.
Falls Church is a vibrant and diverse city with a rich history and a strong economy. The city is home to a variety of government agencies, retail stores, and professional services firms, and it is a popular suburb of Washington, D.C. The city is also home to a diverse population, with a mix of racial and ethnic backgrounds.
Common Questions
What is Per Capita Income in Falls Church?
Per Capita income in Falls Church is $83,001.
What is the Median Family Income in Falls Church?
Median Family Income in Falls Church is $207,090.
What is the Median Household income in Falls Church?
Median Household Income in Falls Church is $164,536.
What is Income or Wage Gap in Falls Church?
Income or Wage Gap in Falls Church is 44.3%.
Women in Falls Church earn 55.7 cents for every dollar earned by a man.
What is Inequality or Gini Index in Falls Church?
Inequality or Gini Index in Falls Church is 0.44.
What is the Total Population of Falls Church?
Total Population of Falls Church is 14,576.
What is the Total Male Population of Falls Church?
Total Male Population of Falls Church is 7,274.
What is the Total Female Population of Falls Church?
Total Female Population of Falls Church is 7,302.
What is the Ratio of Males per 100 Females in Falls Church?
There are 99.62 Males per 100 Females in Falls Church.
What is the Ratio of Females per 100 Males in Falls Church?
There are 100.38 Females per 100 Males in Falls Church.
What is the Median Population Age in Falls Church?
Median Population Age in Falls Church is 38.8 Years.
What is the Average Family Size in Falls Church
Average Family Size in Falls Church is 3.3 People.
What is the Average Household Size in Falls Church
Average Household Size in Falls Church is 2.5 People.
How Large is the Labor Force in Falls Church?
There are 8,570 People in the Labor Forcein in Falls Church.
What is the Percentage of People in the Labor Force in Falls Church?
73.7% of People are in the Labor Force in Falls Church.
What is the Unemployment Rate in Falls Church?
Unemployment Rate in Falls Church is 6.0%.