Stanardsville, VA Map & Demographics
Stanardsville Map
Stanardsville Overview
$46,498
PER CAPITA INCOME
$63,750
AVG FAMILY INCOME
$60,833
AVG HOUSEHOLD INCOME
34.1%
WAGE / INCOME GAP [ % ]
65.9¢/ $1
WAGE / INCOME GAP [ $ ]
0.56
INEQUALITY / GINI INDEX
492
TOTAL POPULATION
263
MALE POPULATION
229
FEMALE POPULATION
114.85
MALES / 100 FEMALES
87.07
FEMALES / 100 MALES
42.2
MEDIAN AGE
2.7
AVG FAMILY SIZE
2.3
AVG HOUSEHOLD SIZE
248
LABOR FORCE [ PEOPLE ]
63.9%
PERCENT IN LABOR FORCE
6.5%
UNEMPLOYMENT RATE
Stanardsville Zip Codes
Stanardsville Area Codes
Income in Stanardsville
Income Overview in Stanardsville
Per Capita Income in Stanardsville is $46,498, while median incomes of families and households are $63,750 and $60,833 respectively.
| Characteristic | Number | Measure |
| Per Capita Income | 492 | $46,498 |
| Median Family Income | 140 | $63,750 |
| Mean Family Income | 140 | $132,113 |
| Median Household Income | 218 | $60,833 |
| Mean Household Income | 218 | $104,385 |
| Income Deficit | 140 | $0 |
| Wage / Income Gap (%) | 492 | 34.09% |
| Wage / Income Gap ($) | 492 | 65.91¢ per $1 |
| Gini / Inequality Index | 492 | 0.56 |
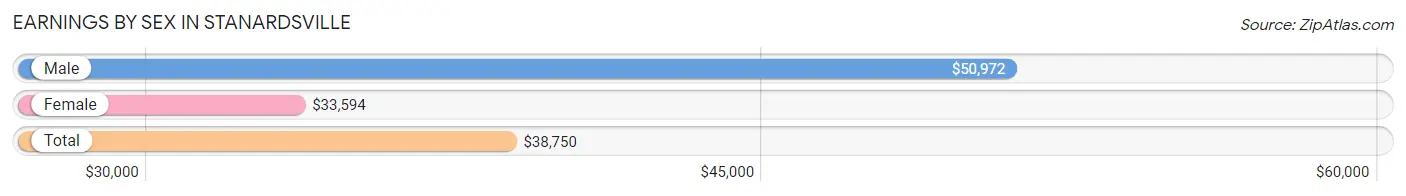
Earnings by Sex in Stanardsville
Average Earnings in Stanardsville are $38,750, $50,972 for men and $33,594 for women, a difference of 34.1%.
| Sex | Number | Average Earnings |
| Male | 130 (51.8%) | $50,972 |
| Female | 121 (48.2%) | $33,594 |
| Total | 251 (100.0%) | $38,750 |
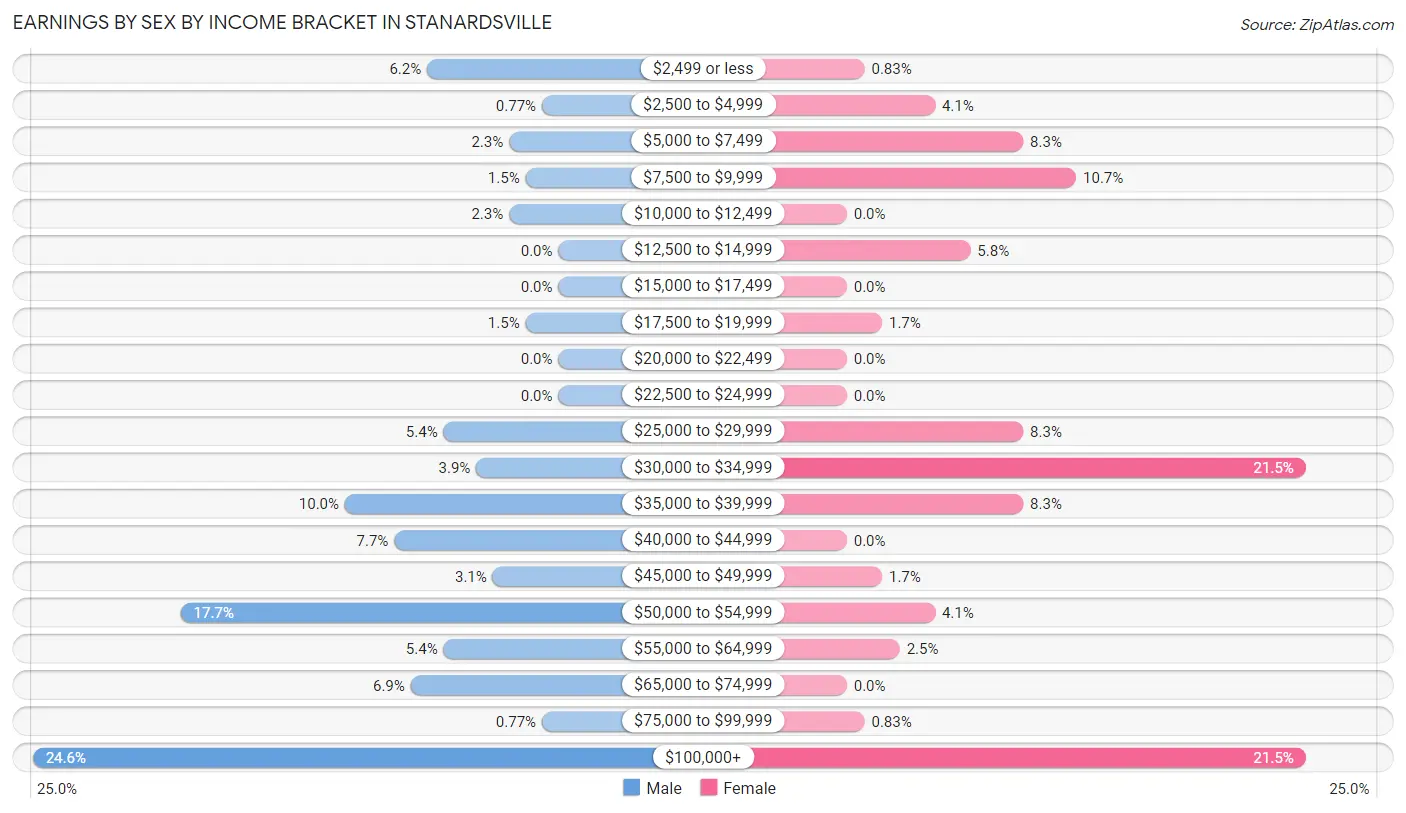
Earnings by Sex by Income Bracket in Stanardsville
The most common earnings brackets in Stanardsville are $100,000+ for men (32 | 24.6%) and $30,000 to $34,999 for women (26 | 21.5%).
| Income | Male | Female |
| $2,499 or less | 8 (6.1%) | 1 (0.8%) |
| $2,500 to $4,999 | 1 (0.8%) | 5 (4.1%) |
| $5,000 to $7,499 | 3 (2.3%) | 10 (8.3%) |
| $7,500 to $9,999 | 2 (1.5%) | 13 (10.7%) |
| $10,000 to $12,499 | 3 (2.3%) | 0 (0.0%) |
| $12,500 to $14,999 | 0 (0.0%) | 7 (5.8%) |
| $15,000 to $17,499 | 0 (0.0%) | 0 (0.0%) |
| $17,500 to $19,999 | 2 (1.5%) | 2 (1.7%) |
| $20,000 to $22,499 | 0 (0.0%) | 0 (0.0%) |
| $22,500 to $24,999 | 0 (0.0%) | 0 (0.0%) |
| $25,000 to $29,999 | 7 (5.4%) | 10 (8.3%) |
| $30,000 to $34,999 | 5 (3.8%) | 26 (21.5%) |
| $35,000 to $39,999 | 13 (10.0%) | 10 (8.3%) |
| $40,000 to $44,999 | 10 (7.7%) | 0 (0.0%) |
| $45,000 to $49,999 | 4 (3.1%) | 2 (1.7%) |
| $50,000 to $54,999 | 23 (17.7%) | 5 (4.1%) |
| $55,000 to $64,999 | 7 (5.4%) | 3 (2.5%) |
| $65,000 to $74,999 | 9 (6.9%) | 0 (0.0%) |
| $75,000 to $99,999 | 1 (0.8%) | 1 (0.8%) |
| $100,000+ | 32 (24.6%) | 26 (21.5%) |
| Total | 130 (100.0%) | 121 (100.0%) |
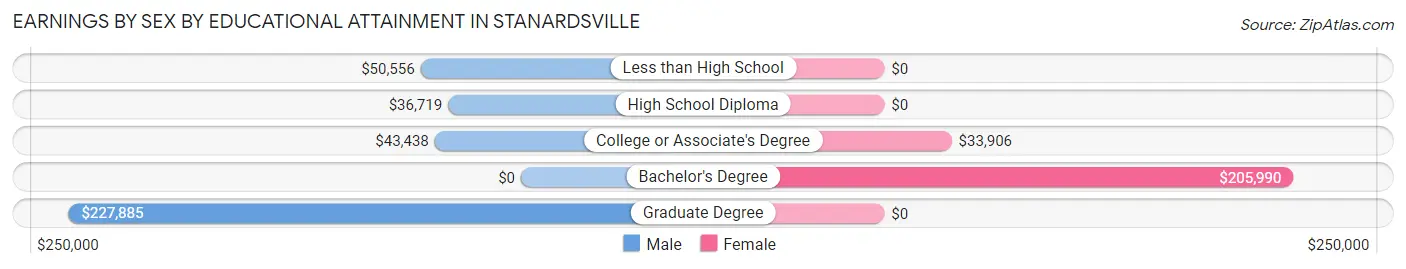
Earnings by Sex by Educational Attainment in Stanardsville
Average earnings in Stanardsville are $51,319 for men and $33,698 for women, a difference of 34.3%. Men with an educational attainment of graduate degree enjoy the highest average annual earnings of $227,885, while those with high school diploma education earn the least with $36,719. Women with an educational attainment of bachelor's degree earn the most with the average annual earnings of $205,990, while those with college or associate's degree education have the smallest earnings of $33,906.
| Educational Attainment | Male Income | Female Income |
| Less than High School | $50,556 | $0 |
| High School Diploma | $36,719 | $0 |
| College or Associate's Degree | $43,438 | $33,906 |
| Bachelor's Degree | - | - |
| Graduate Degree | $227,885 | $0 |
| Total | $51,319 | $33,698 |
Family Income in Stanardsville
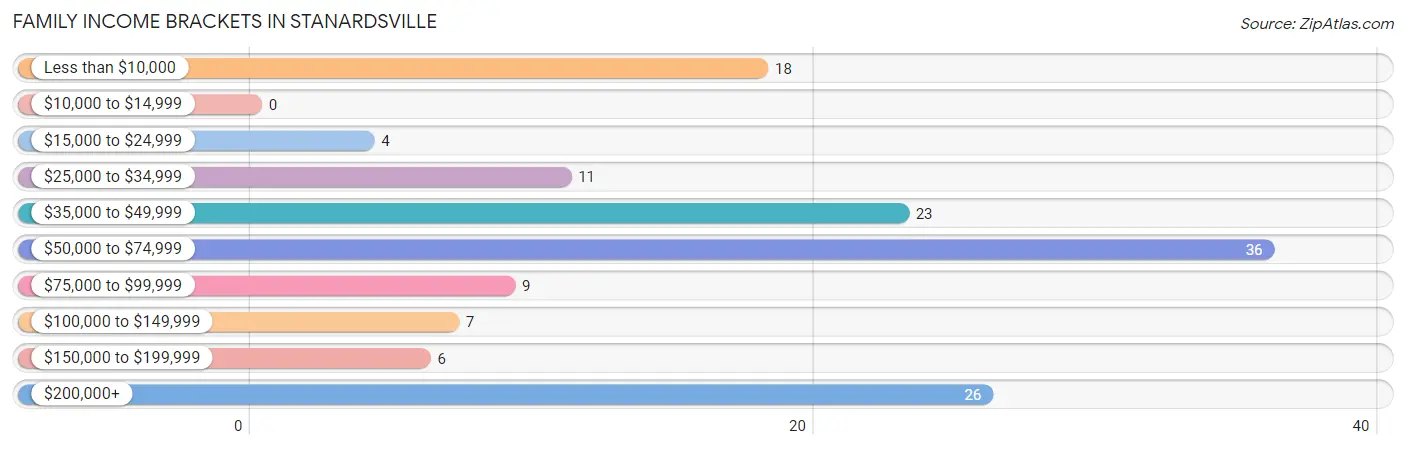
Family Income Brackets in Stanardsville
According to the Stanardsville family income data, there are 36 families falling into the $50,000 to $74,999 income range, which is the most common income bracket and makes up 25.7% of all families.
| Income Bracket | # Families | % Families |
| Less than $10,000 | 18 | 12.9% |
| $10,000 to $14,999 | 0 | 0.0% |
| $15,000 to $24,999 | 4 | 2.9% |
| $25,000 to $34,999 | 11 | 7.9% |
| $35,000 to $49,999 | 23 | 16.4% |
| $50,000 to $74,999 | 36 | 25.7% |
| $75,000 to $99,999 | 9 | 6.4% |
| $100,000 to $149,999 | 7 | 5.0% |
| $150,000 to $199,999 | 6 | 4.3% |
| $200,000+ | 26 | 18.6% |
Family Income by Famaliy Size in Stanardsville
| Income Bracket | # Families | Median Income |
| 2-Person Families | 82 (58.6%) | $0 |
| 3-Person Families | 29 (20.7%) | $0 |
| 4-Person Families | 25 (17.9%) | $0 |
| 5-Person Families | 0 (0.0%) | $0 |
| 6-Person Families | 4 (2.9%) | $0 |
| 7+ Person Families | 0 (0.0%) | $0 |
| Total | 140 (100.0%) | $63,750 |
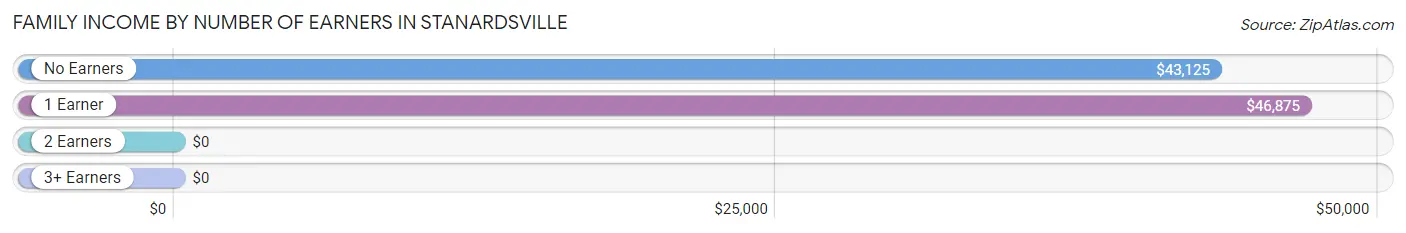
Family Income by Number of Earners in Stanardsville
| Number of Earners | # Families | Median Income |
| No Earners | 28 (20.0%) | $43,125 |
| 1 Earner | 55 (39.3%) | $46,875 |
| 2 Earners | 55 (39.3%) | $0 |
| 3+ Earners | 2 (1.4%) | $0 |
| Total | 140 (100.0%) | $63,750 |
Household Income in Stanardsville
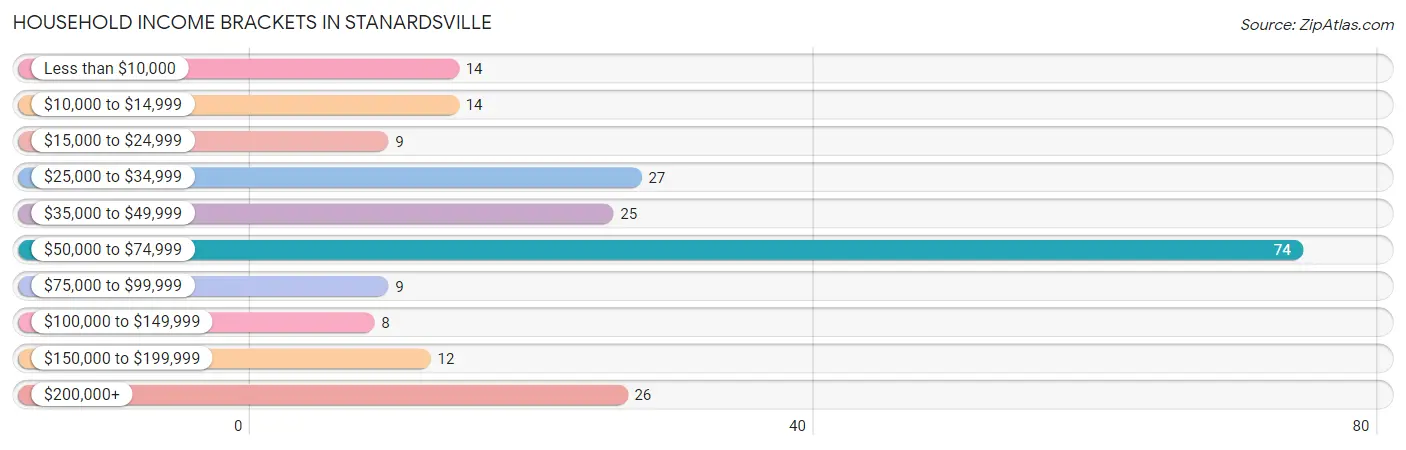
Household Income Brackets in Stanardsville
With 74 households falling in the category, the $50,000 to $74,999 income range is the most frequent in Stanardsville, accounting for 33.9% of all households. In contrast, only 8 households (3.7%) fall into the $100,000 to $149,999 income bracket, making it the least populous group.
| Income Bracket | # Households | % Households |
| Less than $10,000 | 14 | 6.4% |
| $10,000 to $14,999 | 14 | 6.4% |
| $15,000 to $24,999 | 9 | 4.1% |
| $25,000 to $34,999 | 27 | 12.4% |
| $35,000 to $49,999 | 25 | 11.5% |
| $50,000 to $74,999 | 74 | 33.9% |
| $75,000 to $99,999 | 9 | 4.1% |
| $100,000 to $149,999 | 8 | 3.7% |
| $150,000 to $199,999 | 12 | 5.5% |
| $200,000+ | 26 | 11.9% |
Household Income by Householder Age in Stanardsville
The median household income in Stanardsville is $60,833, with the highest median household income of $65,156 found in the 65+ years age bracket for the primary householder. A total of 91 households (41.7%) fall into this category. Meanwhile, the 15 to 24 years age bracket for the primary householder has the lowest median household income of $0, with 3 households (1.4%) in this group.
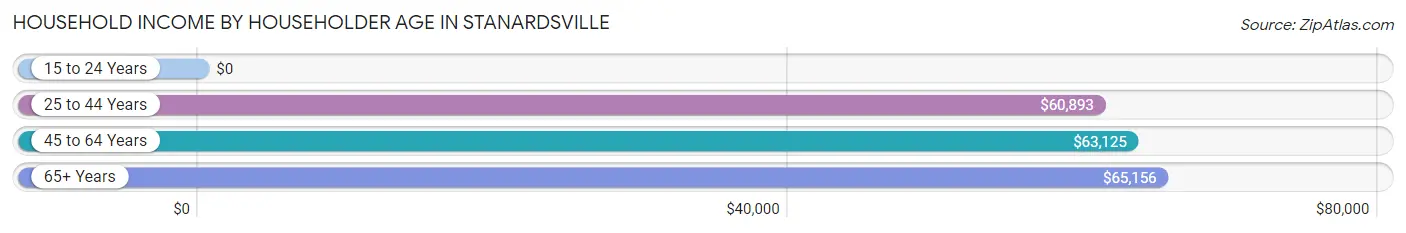
| Income Bracket | # Households | Median Income |
| 15 to 24 Years | 3 (1.4%) | $0 |
| 25 to 44 Years | 95 (43.6%) | $60,893 |
| 45 to 64 Years | 29 (13.3%) | $63,125 |
| 65+ Years | 91 (41.7%) | $65,156 |
| Total | 218 (100.0%) | $60,833 |
Poverty in Stanardsville
Income Below Poverty by Sex and Age in Stanardsville
With 16.0% poverty level for males and 23.6% for females among the residents of Stanardsville, 5 year old males and 6 to 11 year old females are the most vulnerable to poverty, with 4 males (100.0%) and 10 females (76.9%) in their respective age groups living below the poverty level.
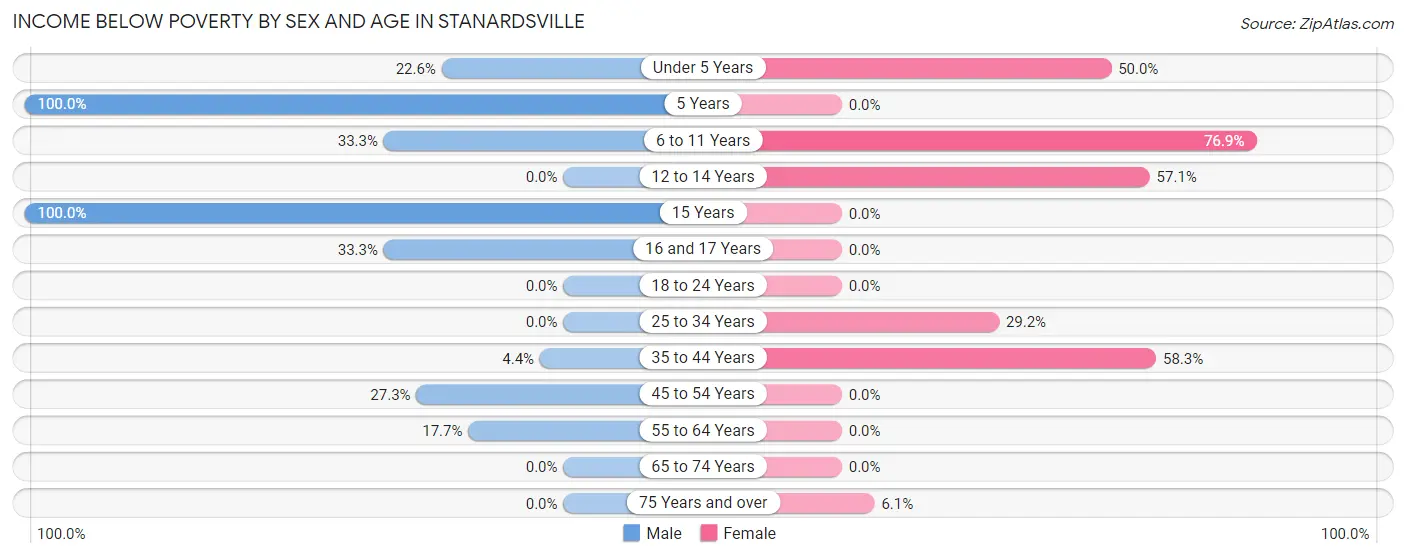
| Age Bracket | Male | Female |
| Under 5 Years | 7 (22.6%) | 2 (50.0%) |
| 5 Years | 4 (100.0%) | 0 (0.0%) |
| 6 to 11 Years | 8 (33.3%) | 10 (76.9%) |
| 12 to 14 Years | 0 (0.0%) | 12 (57.1%) |
| 15 Years | 6 (100.0%) | 0 (0.0%) |
| 16 and 17 Years | 4 (33.3%) | 0 (0.0%) |
| 18 to 24 Years | 0 (0.0%) | 0 (0.0%) |
| 25 to 34 Years | 0 (0.0%) | 14 (29.2%) |
| 35 to 44 Years | 1 (4.3%) | 14 (58.3%) |
| 45 to 54 Years | 9 (27.3%) | 0 (0.0%) |
| 55 to 64 Years | 3 (17.6%) | 0 (0.0%) |
| 65 to 74 Years | 0 (0.0%) | 0 (0.0%) |
| 75 Years and over | 0 (0.0%) | 2 (6.1%) |
| Total | 42 (16.0%) | 54 (23.6%) |
Income Above Poverty by Sex and Age in Stanardsville
According to the poverty statistics in Stanardsville, males aged 12 to 14 years and females aged 16 and 17 years are the age groups that are most secure financially, with 100.0% of males and 100.0% of females in these age groups living above the poverty line.
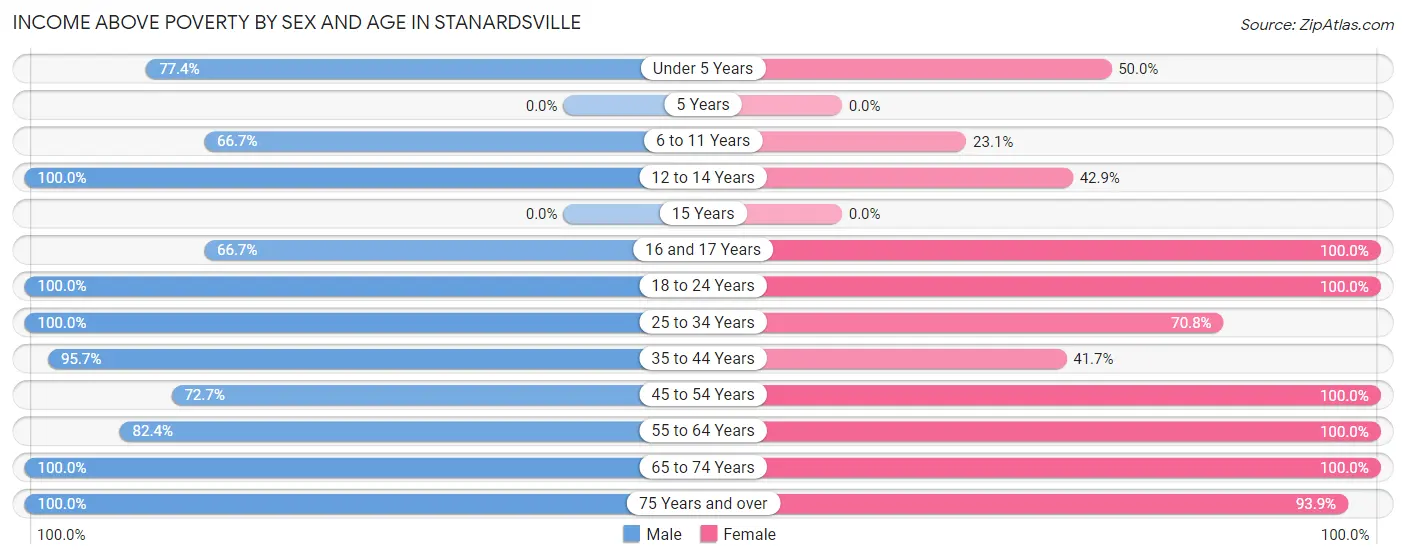
| Age Bracket | Male | Female |
| Under 5 Years | 24 (77.4%) | 2 (50.0%) |
| 5 Years | 0 (0.0%) | 0 (0.0%) |
| 6 to 11 Years | 16 (66.7%) | 3 (23.1%) |
| 12 to 14 Years | 1 (100.0%) | 9 (42.9%) |
| 15 Years | 0 (0.0%) | 0 (0.0%) |
| 16 and 17 Years | 8 (66.7%) | 2 (100.0%) |
| 18 to 24 Years | 5 (100.0%) | 1 (100.0%) |
| 25 to 34 Years | 40 (100.0%) | 34 (70.8%) |
| 35 to 44 Years | 22 (95.7%) | 10 (41.7%) |
| 45 to 54 Years | 24 (72.7%) | 6 (100.0%) |
| 55 to 64 Years | 14 (82.4%) | 36 (100.0%) |
| 65 to 74 Years | 38 (100.0%) | 41 (100.0%) |
| 75 Years and over | 29 (100.0%) | 31 (93.9%) |
| Total | 221 (84.0%) | 175 (76.4%) |
Income Below Poverty Among Married-Couple Families in Stanardsville
The poverty statistics for married-couple families in Stanardsville show that 2.0% or 2 of the total 99 families live below the poverty line. Families with 1 or 2 children have the highest poverty rate of 7.7%, comprising of 2 families. On the other hand, families with no children have the lowest poverty rate of 0.0%, which includes 0 families.
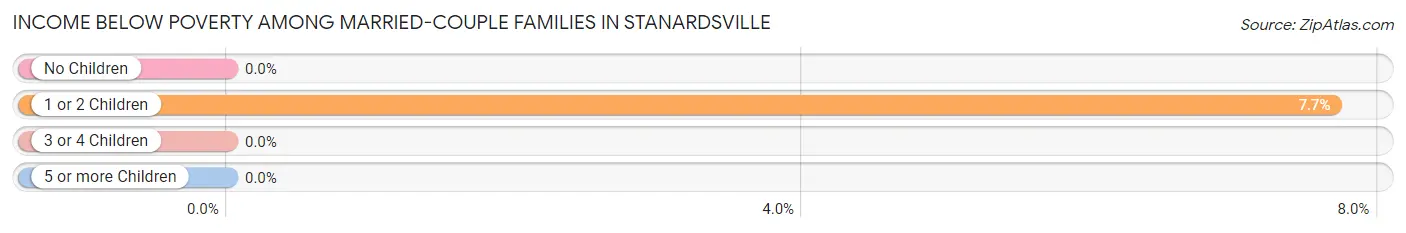
| Children | Above Poverty | Below Poverty |
| No Children | 69 (100.0%) | 0 (0.0%) |
| 1 or 2 Children | 24 (92.3%) | 2 (7.7%) |
| 3 or 4 Children | 4 (100.0%) | 0 (0.0%) |
| 5 or more Children | 0 (0.0%) | 0 (0.0%) |
| Total | 97 (98.0%) | 2 (2.0%) |
Income Below Poverty Among Single-Parent Households in Stanardsville
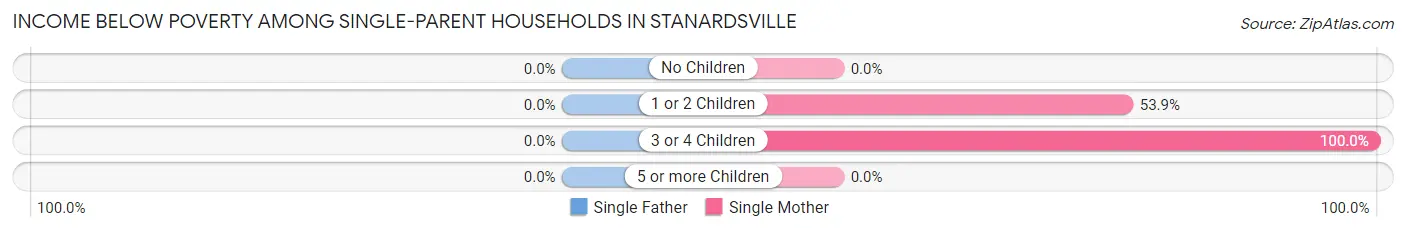
| Children | Single Father | Single Mother |
| No Children | 0 (0.0%) | 0 (0.0%) |
| 1 or 2 Children | 0 (0.0%) | 7 (53.8%) |
| 3 or 4 Children | 0 (0.0%) | 9 (100.0%) |
| 5 or more Children | 0 (0.0%) | 0 (0.0%) |
| Total | 0 (0.0%) | 16 (66.7%) |
Income Below Poverty Among Married-Couple vs Single-Parent Households in Stanardsville
The poverty data for Stanardsville shows that 2 of the married-couple family households (2.0%) and 16 of the single-parent households (39.0%) are living below the poverty level. Within the married-couple family households, those with 1 or 2 children have the highest poverty rate, with 2 households (7.7%) falling below the poverty line. Among the single-parent households, those with 3 or 4 children have the highest poverty rate, with 9 household (60.0%) living below poverty.
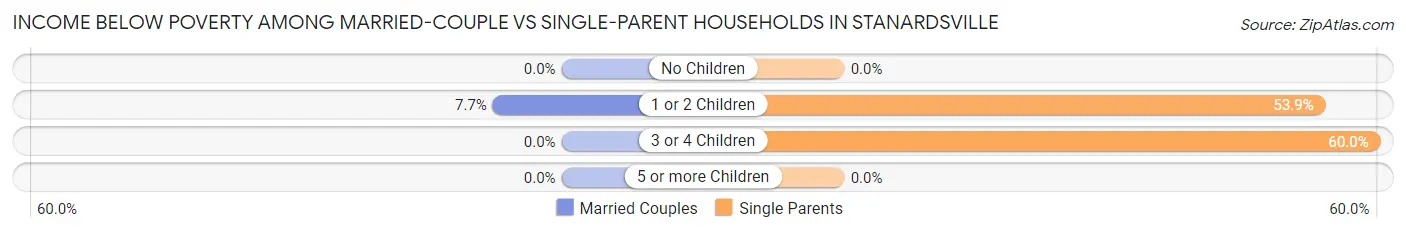
| Children | Married-Couple Families | Single-Parent Households |
| No Children | 0 (0.0%) | 0 (0.0%) |
| 1 or 2 Children | 2 (7.7%) | 7 (53.8%) |
| 3 or 4 Children | 0 (0.0%) | 9 (60.0%) |
| 5 or more Children | 0 (0.0%) | 0 (0.0%) |
| Total | 2 (2.0%) | 16 (39.0%) |
Race in Stanardsville
The most populous races in Stanardsville are White / Caucasian (398 | 80.9%), Two or more Races (46 | 9.3%), and Black / African American (41 | 8.3%).
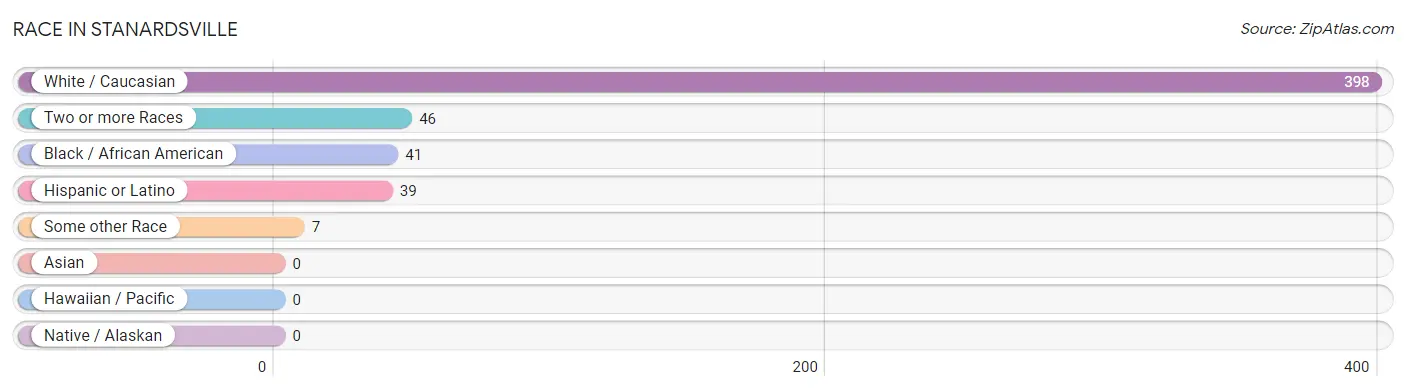
| Race | # Population | % Population |
| Asian | 0 | 0.0% |
| Black / African American | 41 | 8.3% |
| Hawaiian / Pacific | 0 | 0.0% |
| Hispanic or Latino | 39 | 7.9% |
| Native / Alaskan | 0 | 0.0% |
| White / Caucasian | 398 | 80.9% |
| Two or more Races | 46 | 9.3% |
| Some other Race | 7 | 1.4% |
| Total | 492 | 100.0% |
Ancestry in Stanardsville
The most populous ancestries reported in Stanardsville are American (55 | 11.2%), Irish (52 | 10.6%), Central American (39 | 7.9%), English (39 | 7.9%), and Salvadoran (39 | 7.9%), together accounting for 45.5% of all Stanardsville residents.
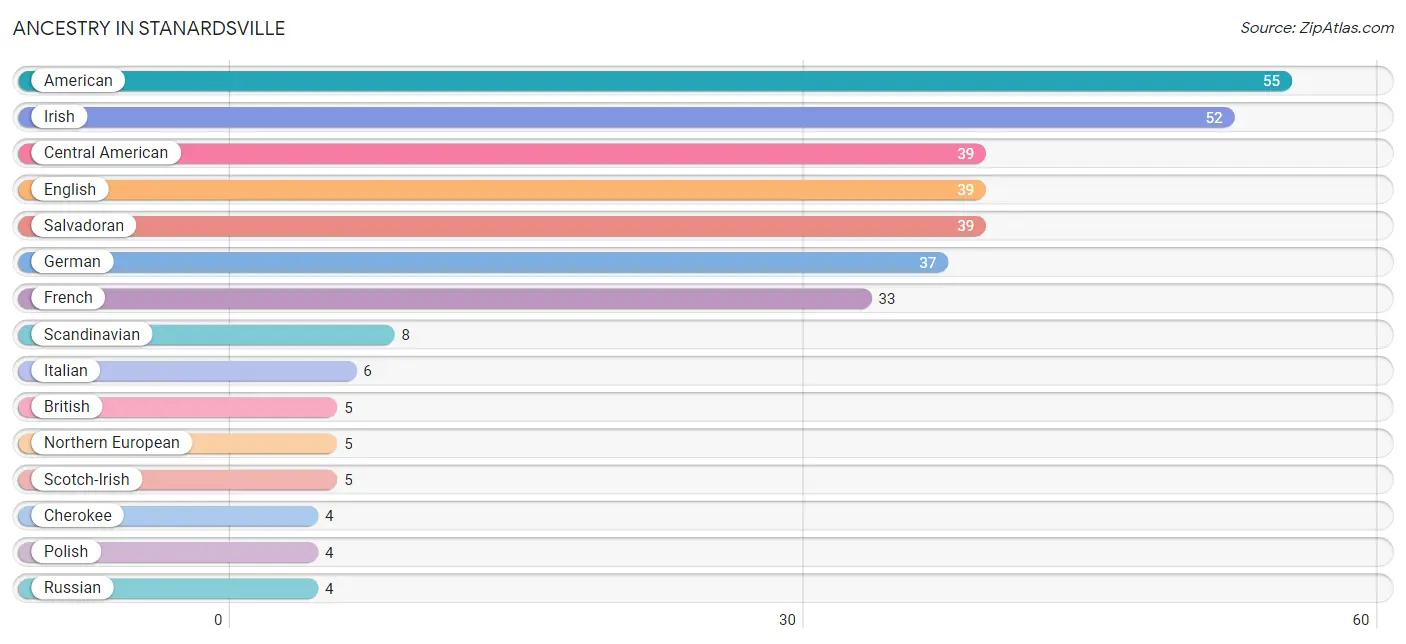
| Ancestry | # Population | % Population |
| American | 55 | 11.2% |
| British | 5 | 1.0% |
| Central American | 39 | 7.9% |
| Cherokee | 4 | 0.8% |
| English | 39 | 7.9% |
| European | 2 | 0.4% |
| French | 33 | 6.7% |
| German | 37 | 7.5% |
| Irish | 52 | 10.6% |
| Italian | 6 | 1.2% |
| Lithuanian | 2 | 0.4% |
| Northern European | 5 | 1.0% |
| Polish | 4 | 0.8% |
| Russian | 4 | 0.8% |
| Salvadoran | 39 | 7.9% |
| Scandinavian | 8 | 1.6% |
| Scotch-Irish | 5 | 1.0% |
| Scottish | 1 | 0.2% |
| Slovak | 2 | 0.4% |
| South African | 2 | 0.4% |
| Subsaharan African | 2 | 0.4% | View All 21 Rows |
Immigrants in Stanardsville
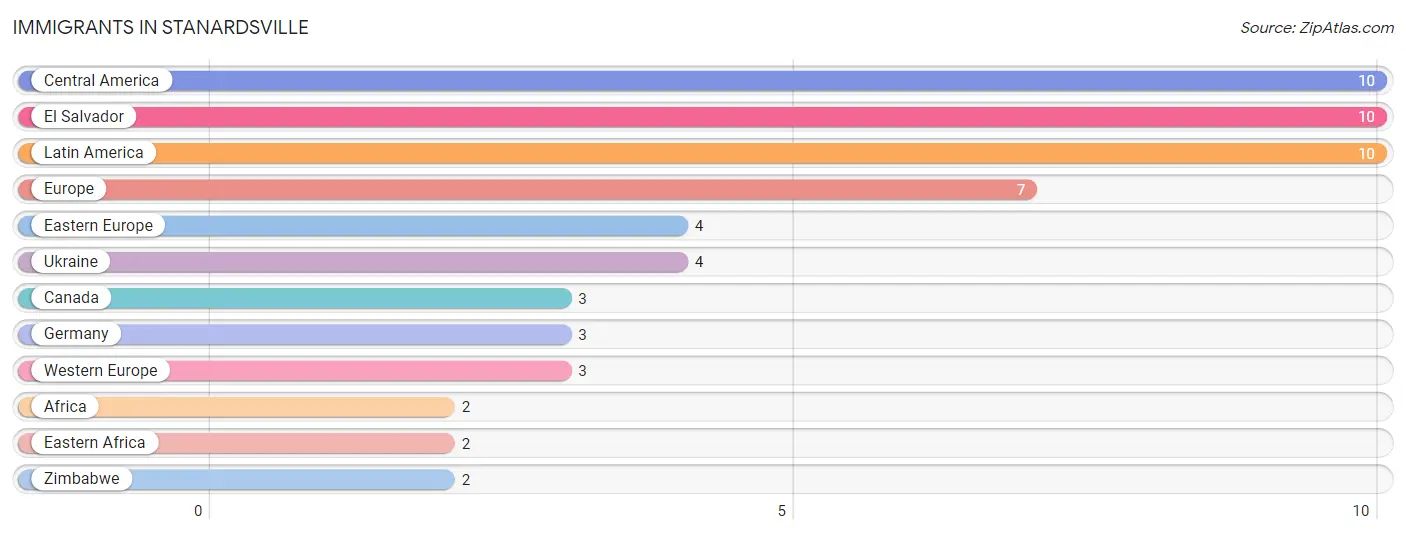
The most numerous immigrant groups reported in Stanardsville came from Central America (10 | 2.0%), El Salvador (10 | 2.0%), Latin America (10 | 2.0%), Europe (7 | 1.4%), and Eastern Europe (4 | 0.8%), together accounting for 8.3% of all Stanardsville residents.
| Immigration Origin | # Population | % Population |
| Africa | 2 | 0.4% |
| Canada | 3 | 0.6% |
| Central America | 10 | 2.0% |
| Eastern Africa | 2 | 0.4% |
| Eastern Europe | 4 | 0.8% |
| El Salvador | 10 | 2.0% |
| Europe | 7 | 1.4% |
| Germany | 3 | 0.6% |
| Latin America | 10 | 2.0% |
| Ukraine | 4 | 0.8% |
| Western Europe | 3 | 0.6% |
| Zimbabwe | 2 | 0.4% | View All 12 Rows |
Sex and Age in Stanardsville
Sex and Age in Stanardsville
The most populous age groups in Stanardsville are 65 to 69 Years (35 | 13.3%) for men and 10 to 14 Years (32 | 14.0%) for women.
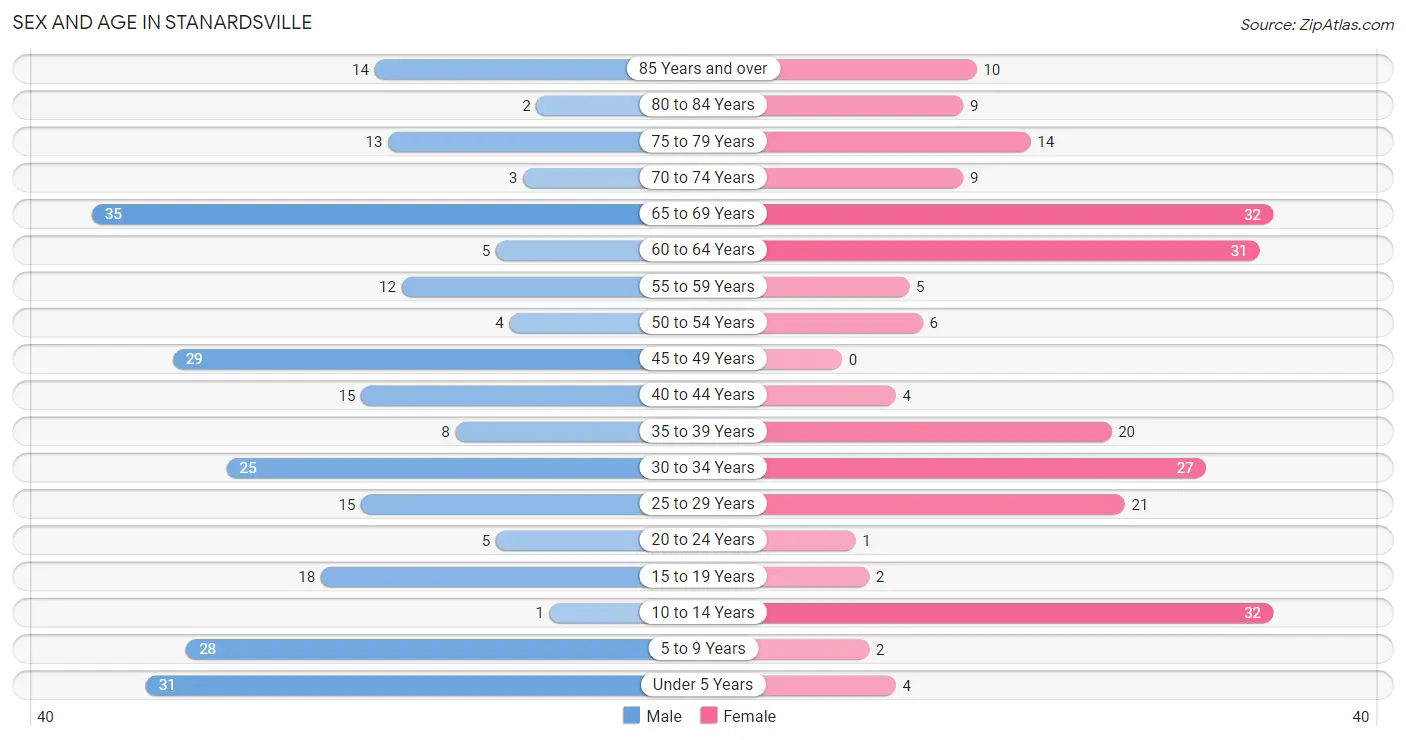
| Age Bracket | Male | Female |
| Under 5 Years | 31 (11.8%) | 4 (1.8%) |
| 5 to 9 Years | 28 (10.6%) | 2 (0.9%) |
| 10 to 14 Years | 1 (0.4%) | 32 (14.0%) |
| 15 to 19 Years | 18 (6.8%) | 2 (0.9%) |
| 20 to 24 Years | 5 (1.9%) | 1 (0.4%) |
| 25 to 29 Years | 15 (5.7%) | 21 (9.2%) |
| 30 to 34 Years | 25 (9.5%) | 27 (11.8%) |
| 35 to 39 Years | 8 (3.0%) | 20 (8.7%) |
| 40 to 44 Years | 15 (5.7%) | 4 (1.8%) |
| 45 to 49 Years | 29 (11.0%) | 0 (0.0%) |
| 50 to 54 Years | 4 (1.5%) | 6 (2.6%) |
| 55 to 59 Years | 12 (4.6%) | 5 (2.2%) |
| 60 to 64 Years | 5 (1.9%) | 31 (13.5%) |
| 65 to 69 Years | 35 (13.3%) | 32 (14.0%) |
| 70 to 74 Years | 3 (1.1%) | 9 (3.9%) |
| 75 to 79 Years | 13 (4.9%) | 14 (6.1%) |
| 80 to 84 Years | 2 (0.8%) | 9 (3.9%) |
| 85 Years and over | 14 (5.3%) | 10 (4.4%) |
| Total | 263 (100.0%) | 229 (100.0%) |
Families and Households in Stanardsville
Median Family Size in Stanardsville
The median family size in Stanardsville is 2.66 persons per family, with single male/father families (17 | 12.1%) accounting for the largest median family size of 3.88 persons per family. On the other hand, married-couple families (99 | 70.7%) represent the smallest median family size with 2.25 persons per family.
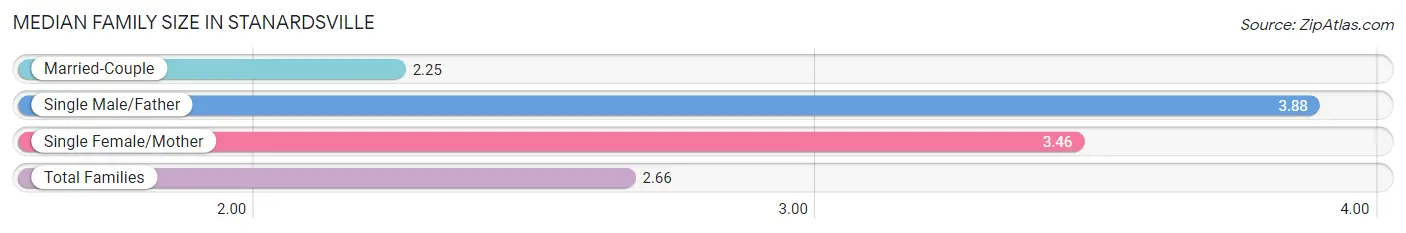
| Family Type | # Families | Family Size |
| Married-Couple | 99 (70.7%) | 2.25 |
| Single Male/Father | 17 (12.1%) | 3.88 |
| Single Female/Mother | 24 (17.1%) | 3.46 |
| Total Families | 140 (100.0%) | 2.66 |
Median Household Size in Stanardsville
The median household size in Stanardsville is 2.26 persons per household, with single male/father households (17 | 7.8%) accounting for the largest median household size of 3.88 persons per household. non-family households (78 | 35.8%) represent the smallest median household size with 1.44 persons per household.
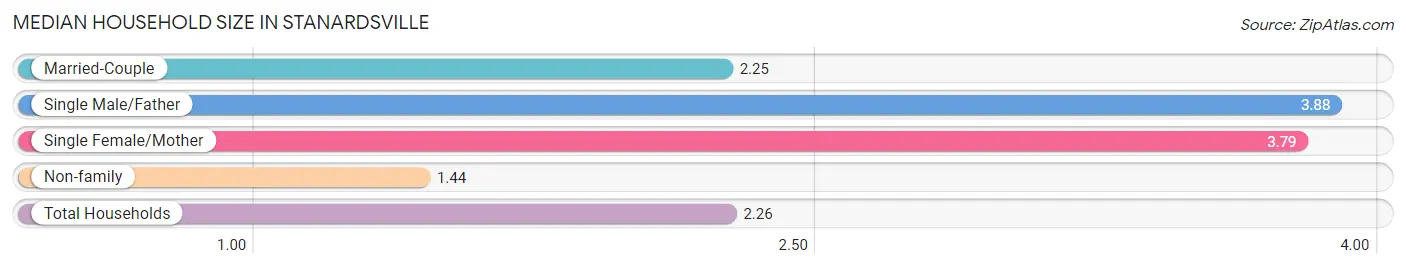
| Household Type | # Households | Household Size |
| Married-Couple | 99 (45.4%) | 2.25 |
| Single Male/Father | 17 (7.8%) | 3.88 |
| Single Female/Mother | 24 (11.0%) | 3.79 |
| Non-family | 78 (35.8%) | 1.44 |
| Total Households | 218 (100.0%) | 2.26 |
Household Size by Marriage Status in Stanardsville
Out of a total of 218 households in Stanardsville, 140 (64.2%) are family households, while 78 (35.8%) are nonfamily households. The most numerous type of family households are 2-person households, comprising 81, and the most common type of nonfamily households are 1-person households, comprising 55.
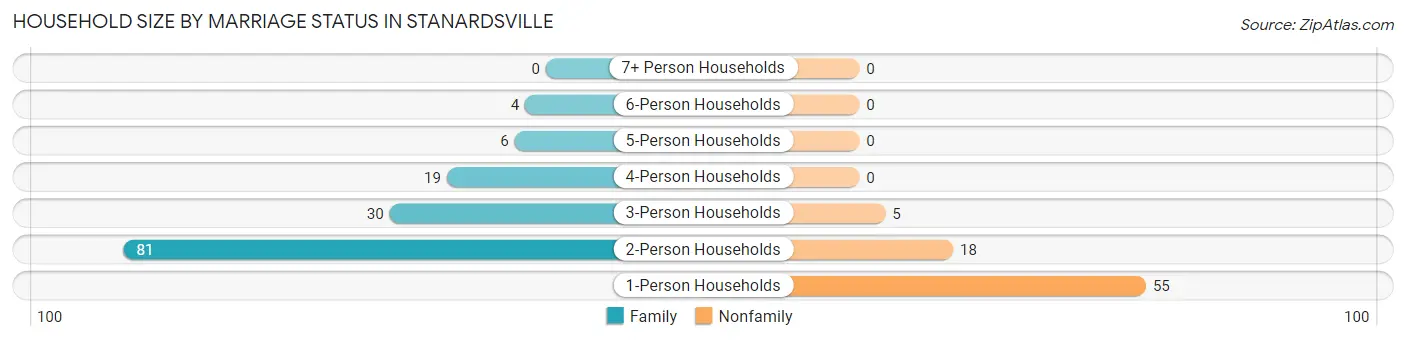
| Household Size | Family Households | Nonfamily Households |
| 1-Person Households | - | 55 (25.2%) |
| 2-Person Households | 81 (37.2%) | 18 (8.3%) |
| 3-Person Households | 30 (13.8%) | 5 (2.3%) |
| 4-Person Households | 19 (8.7%) | 0 (0.0%) |
| 5-Person Households | 6 (2.8%) | 0 (0.0%) |
| 6-Person Households | 4 (1.8%) | 0 (0.0%) |
| 7+ Person Households | 0 (0.0%) | 0 (0.0%) |
| Total | 140 (64.2%) | 78 (35.8%) |
Female Fertility in Stanardsville
Fertility by Age in Stanardsville
Average fertility rate in Stanardsville is 27.0 births per 1,000 women. Women in the age bracket of 20 to 34 years have the highest fertility rate with 41.0 births per 1,000 women. Women in the age bracket of 20 to 34 years acount for 100.0% of all women with births.
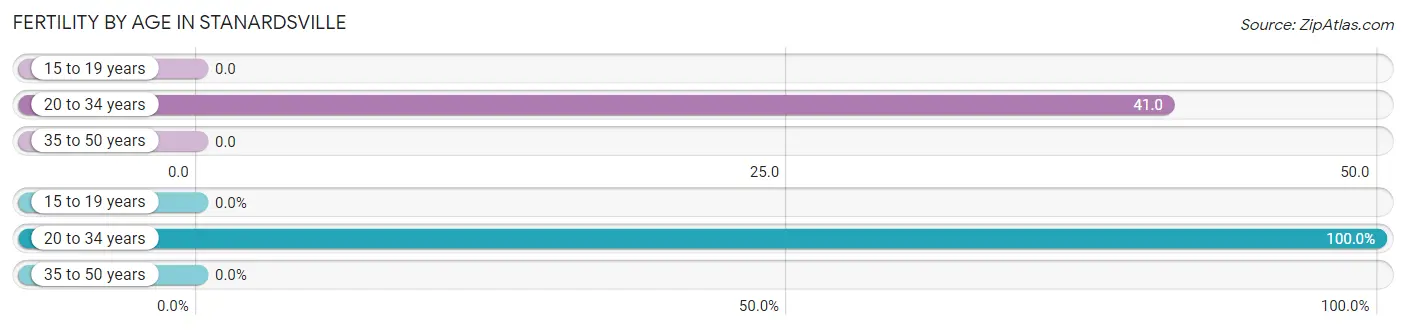
| Age Bracket | Women with Births | Births / 1,000 Women |
| 15 to 19 years | 0 (0.0%) | 0.0 |
| 20 to 34 years | 2 (100.0%) | 41.0 |
| 35 to 50 years | 0 (0.0%) | 0.0 |
| Total | 2 (100.0%) | 27.0 |
Fertility by Age by Marriage Status in Stanardsville
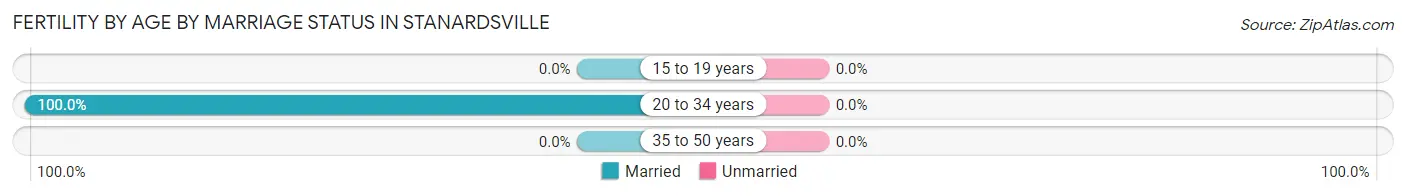
| Age Bracket | Married | Unmarried |
| 15 to 19 years | 0 (0.0%) | 0 (0.0%) |
| 20 to 34 years | 2 (100.0%) | 0 (0.0%) |
| 35 to 50 years | 0 (0.0%) | 0 (0.0%) |
| Total | 2 (100.0%) | 0 (0.0%) |
Fertility by Education in Stanardsville
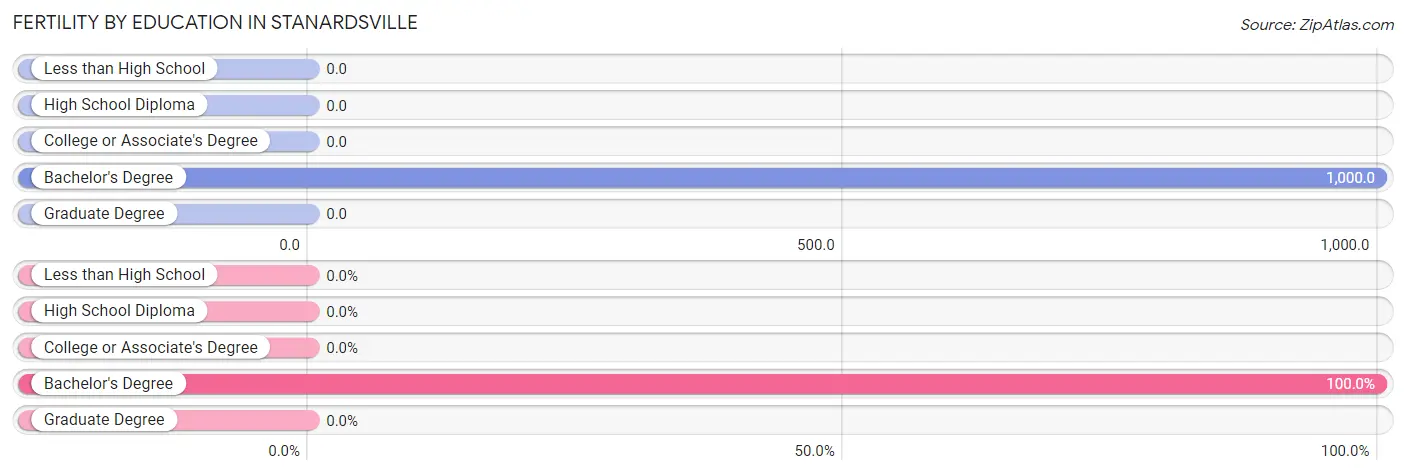
| Educational Attainment | Women with Births | Births / 1,000 Women |
| Less than High School | 0 (0.0%) | 0.0 |
| High School Diploma | 0 (0.0%) | 0.0 |
| College or Associate's Degree | 0 (0.0%) | 0.0 |
| Bachelor's Degree | 2 (100.0%) | 1,000.0 |
| Graduate Degree | 0 (0.0%) | 0.0 |
| Total | 2 (100.0%) | 27.0 |
Fertility by Education by Marriage Status in Stanardsville
| Educational Attainment | Married | Unmarried |
| Less than High School | 0 (0.0%) | 0 (0.0%) |
| High School Diploma | 0 (0.0%) | 0 (0.0%) |
| College or Associate's Degree | 0 (0.0%) | 0 (0.0%) |
| Bachelor's Degree | 2 (100.0%) | 0 (0.0%) |
| Graduate Degree | 0 (0.0%) | 0 (0.0%) |
| Total | 2 (100.0%) | 0 (0.0%) |
Employment Characteristics in Stanardsville
Employment by Class of Employer in Stanardsville
Among the 232 employed individuals in Stanardsville, private company employees (152 | 65.5%), state government employees (29 | 12.5%), and not-for-profit organizations (16 | 6.9%) make up the most common classes of employment.
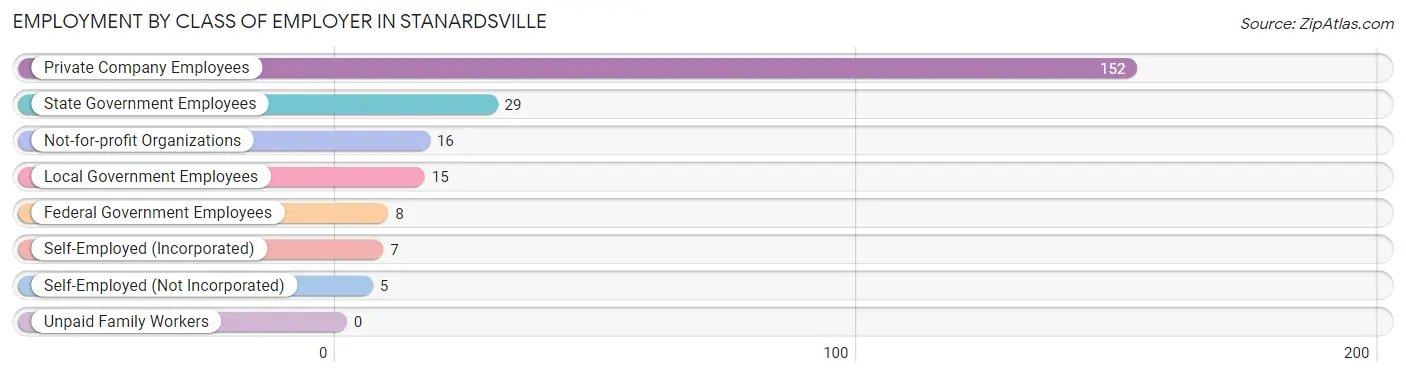
| Employer Class | # Employees | % Employees |
| Private Company Employees | 152 | 65.5% |
| Self-Employed (Incorporated) | 7 | 3.0% |
| Self-Employed (Not Incorporated) | 5 | 2.2% |
| Not-for-profit Organizations | 16 | 6.9% |
| Local Government Employees | 15 | 6.5% |
| State Government Employees | 29 | 12.5% |
| Federal Government Employees | 8 | 3.5% |
| Unpaid Family Workers | 0 | 0.0% |
| Total | 232 | 100.0% |
Employment Status by Age in Stanardsville
According to the labor force statistics for Stanardsville, out of the total population over 16 years of age (388), 63.9% or 248 individuals are in the labor force, with 6.5% or 16 of them unemployed. The age group with the highest labor force participation rate is 20 to 24 years, with 100.0% or 6 individuals in the labor force. Within the labor force, the 16 to 19 years age range has the highest percentage of unemployed individuals, with 50.0% or 1 of them being unemployed.
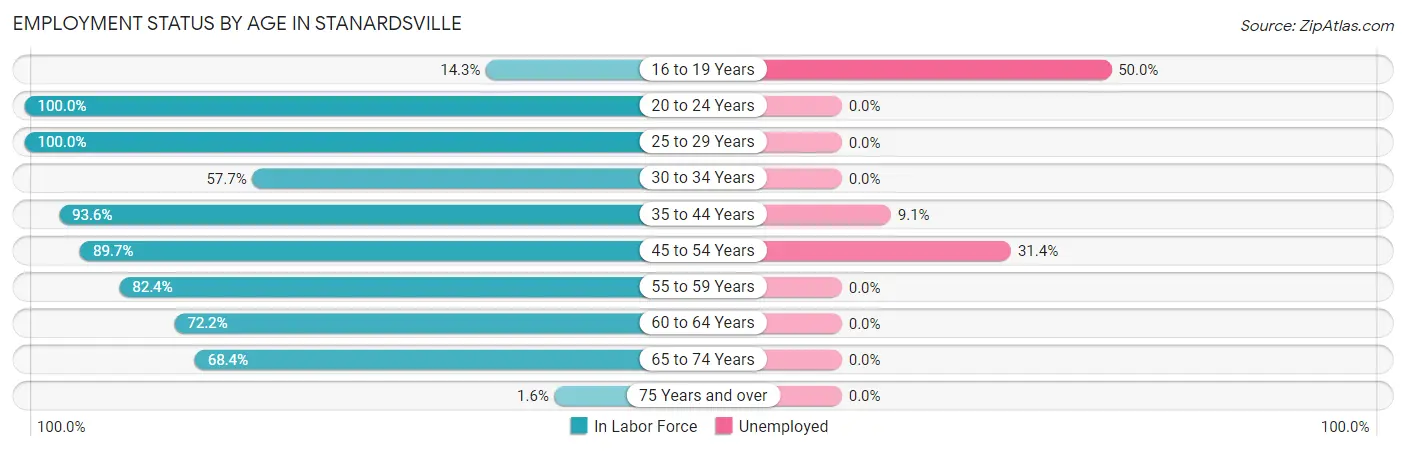
| Age Bracket | In Labor Force | Unemployed |
| 16 to 19 Years | 2 (14.3%) | 1 (50.0%) |
| 20 to 24 Years | 6 (100.0%) | 0 (0.0%) |
| 25 to 29 Years | 36 (100.0%) | 0 (0.0%) |
| 30 to 34 Years | 30 (57.7%) | 0 (0.0%) |
| 35 to 44 Years | 44 (93.6%) | 4 (9.1%) |
| 45 to 54 Years | 35 (89.7%) | 11 (31.4%) |
| 55 to 59 Years | 14 (82.4%) | 0 (0.0%) |
| 60 to 64 Years | 26 (72.2%) | 0 (0.0%) |
| 65 to 74 Years | 54 (68.4%) | 0 (0.0%) |
| 75 Years and over | 1 (1.6%) | 0 (0.0%) |
| Total | 248 (63.9%) | 16 (6.5%) |
Employment Status by Educational Attainment in Stanardsville
According to labor force statistics for Stanardsville, 81.5% of individuals (185) out of the total population between 25 and 64 years of age (227) are in the labor force, with 8.2% or 15 of them being unemployed. The group with the highest labor force participation rate are those with the educational attainment of bachelor's degree or higher, with 89.3% or 25 individuals in the labor force. Within the labor force, individuals with bachelor's degree or higher education have the highest percentage of unemployment, with 16.0% or 4 of them being unemployed.
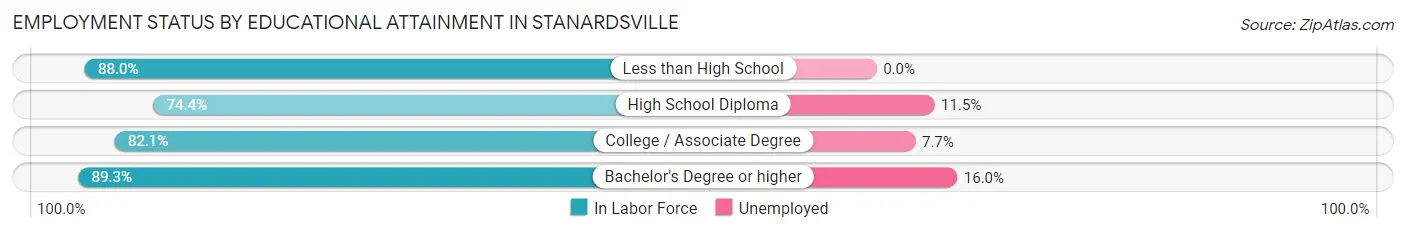
| Educational Attainment | In Labor Force | Unemployed |
| Less than High School | 44 (88.0%) | 0 (0.0%) |
| High School Diploma | 61 (74.4%) | 9 (11.5%) |
| College / Associate Degree | 55 (82.1%) | 5 (7.7%) |
| Bachelor's Degree or higher | 25 (89.3%) | 4 (16.0%) |
| Total | 185 (81.5%) | 19 (8.2%) |
Employment Occupations by Sex in Stanardsville
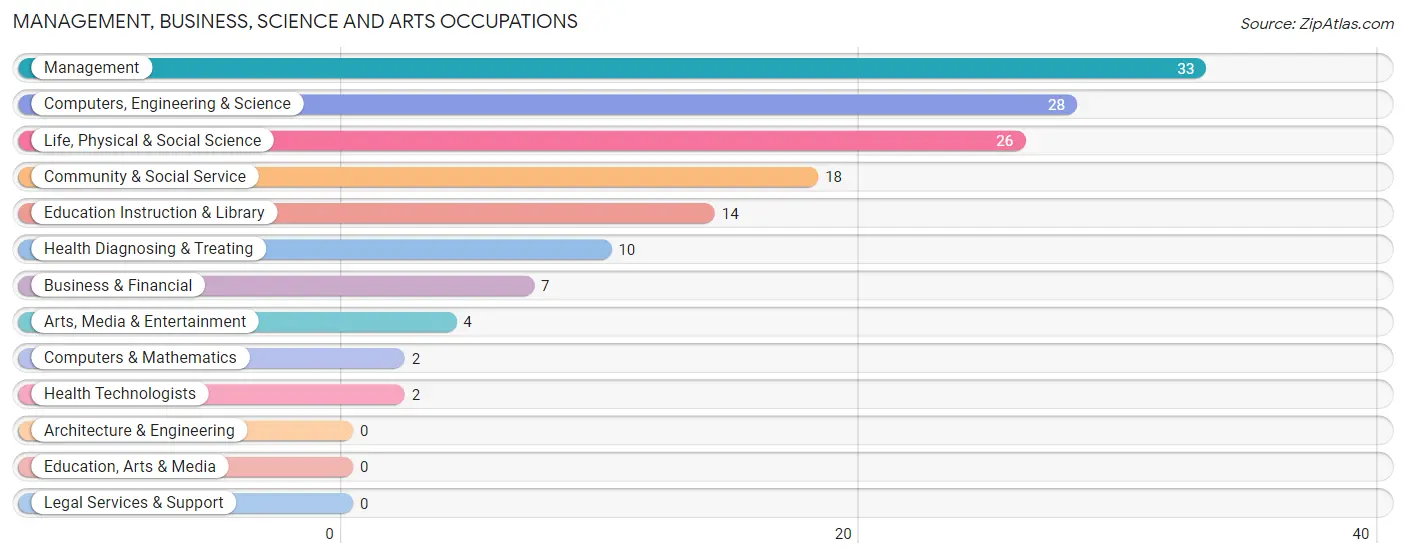
Management, Business, Science and Arts Occupations
The most common Management, Business, Science and Arts occupations in Stanardsville are Management (33 | 14.4%), Computers, Engineering & Science (28 | 12.2%), Life, Physical & Social Science (26 | 11.4%), Community & Social Service (18 | 7.9%), and Education Instruction & Library (14 | 6.1%).
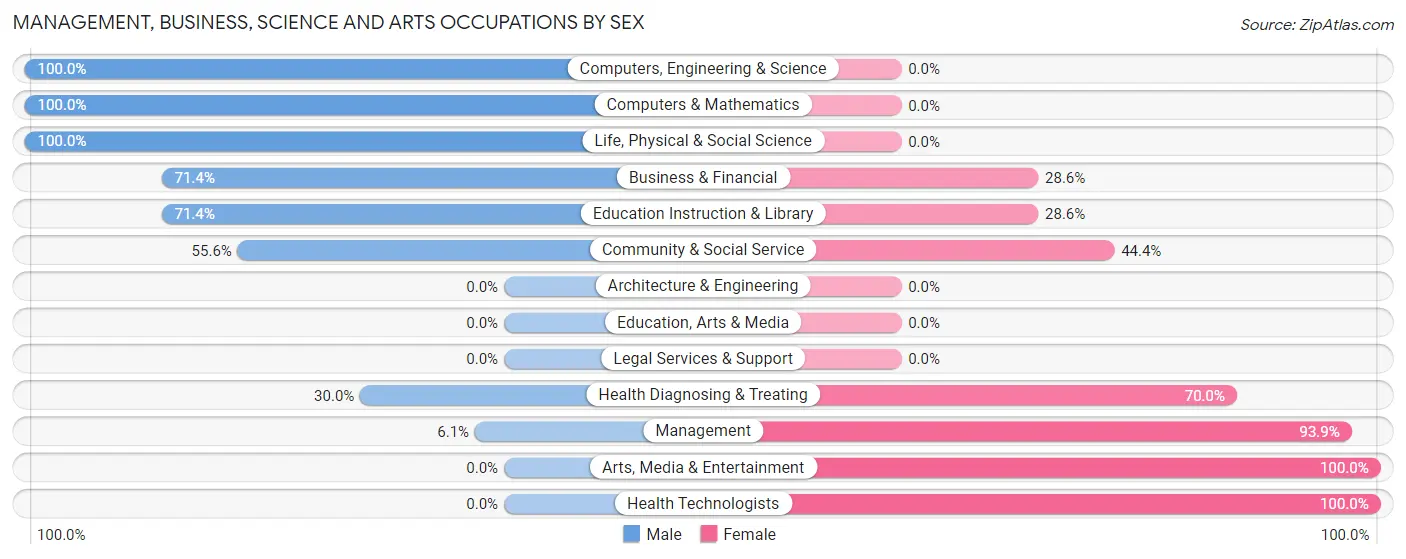
Management, Business, Science and Arts Occupations by Sex
Within the Management, Business, Science and Arts occupations in Stanardsville, the most male-oriented occupations are Computers, Engineering & Science (100.0%), Computers & Mathematics (100.0%), and Life, Physical & Social Science (100.0%), while the most female-oriented occupations are Arts, Media & Entertainment (100.0%), Health Technologists (100.0%), and Management (93.9%).
| Occupation | Male | Female |
| Management | 2 (6.1%) | 31 (93.9%) |
| Business & Financial | 5 (71.4%) | 2 (28.6%) |
| Computers, Engineering & Science | 28 (100.0%) | 0 (0.0%) |
| Computers & Mathematics | 2 (100.0%) | 0 (0.0%) |
| Architecture & Engineering | 0 (0.0%) | 0 (0.0%) |
| Life, Physical & Social Science | 26 (100.0%) | 0 (0.0%) |
| Community & Social Service | 10 (55.6%) | 8 (44.4%) |
| Education, Arts & Media | 0 (0.0%) | 0 (0.0%) |
| Legal Services & Support | 0 (0.0%) | 0 (0.0%) |
| Education Instruction & Library | 10 (71.4%) | 4 (28.6%) |
| Arts, Media & Entertainment | 0 (0.0%) | 4 (100.0%) |
| Health Diagnosing & Treating | 3 (30.0%) | 7 (70.0%) |
| Health Technologists | 0 (0.0%) | 2 (100.0%) |
| Total (Category) | 48 (50.0%) | 48 (50.0%) |
| Total (Overall) | 115 (50.2%) | 114 (49.8%) |
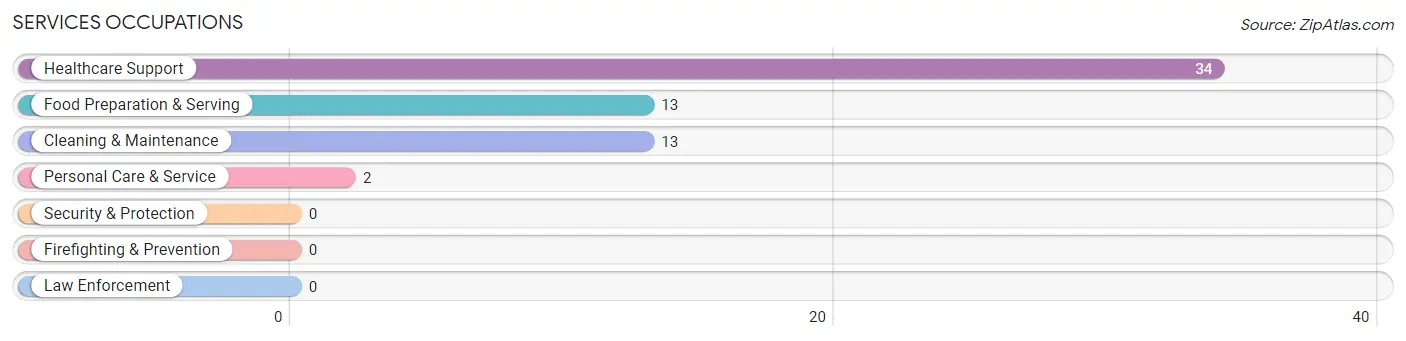
Services Occupations
The most common Services occupations in Stanardsville are Healthcare Support (34 | 14.8%), Food Preparation & Serving (13 | 5.7%), Cleaning & Maintenance (13 | 5.7%), and Personal Care & Service (2 | 0.9%).
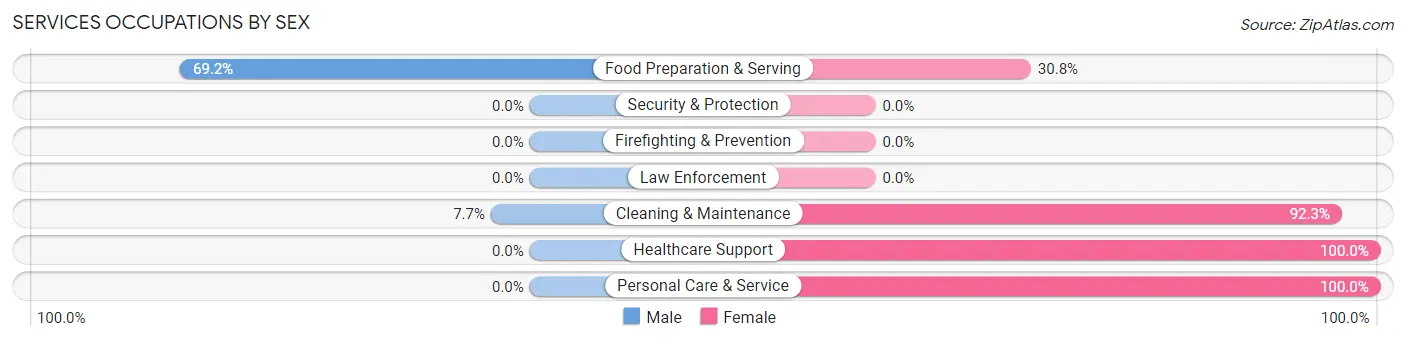
Services Occupations by Sex
Within the Services occupations in Stanardsville, the most male-oriented occupations are Food Preparation & Serving (69.2%), and Cleaning & Maintenance (7.7%), while the most female-oriented occupations are Healthcare Support (100.0%), Personal Care & Service (100.0%), and Cleaning & Maintenance (92.3%).
| Occupation | Male | Female |
| Healthcare Support | 0 (0.0%) | 34 (100.0%) |
| Security & Protection | 0 (0.0%) | 0 (0.0%) |
| Firefighting & Prevention | 0 (0.0%) | 0 (0.0%) |
| Law Enforcement | 0 (0.0%) | 0 (0.0%) |
| Food Preparation & Serving | 9 (69.2%) | 4 (30.8%) |
| Cleaning & Maintenance | 1 (7.7%) | 12 (92.3%) |
| Personal Care & Service | 0 (0.0%) | 2 (100.0%) |
| Total (Category) | 10 (16.1%) | 52 (83.9%) |
| Total (Overall) | 115 (50.2%) | 114 (49.8%) |
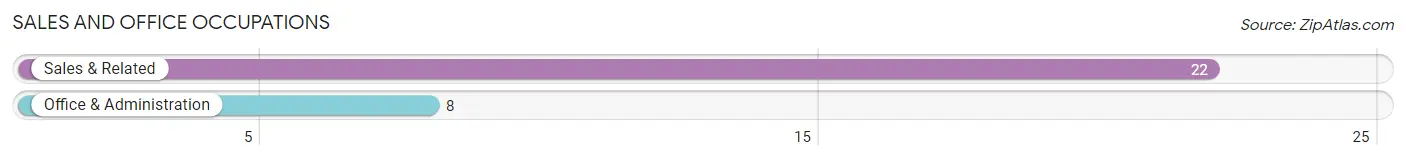
Sales and Office Occupations
The most common Sales and Office occupations in Stanardsville are Sales & Related (22 | 9.6%), and Office & Administration (8 | 3.5%).
Sales and Office Occupations by Sex
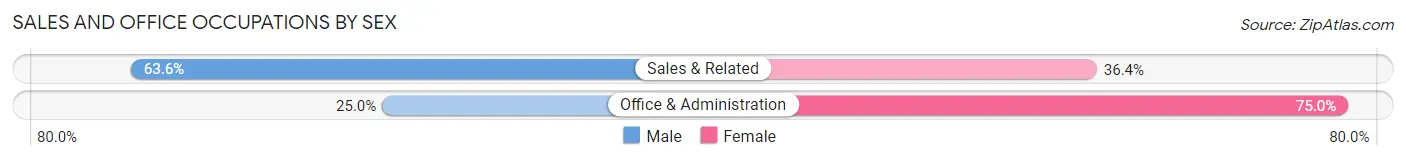
| Occupation | Male | Female |
| Sales & Related | 14 (63.6%) | 8 (36.4%) |
| Office & Administration | 2 (25.0%) | 6 (75.0%) |
| Total (Category) | 16 (53.3%) | 14 (46.7%) |
| Total (Overall) | 115 (50.2%) | 114 (49.8%) |
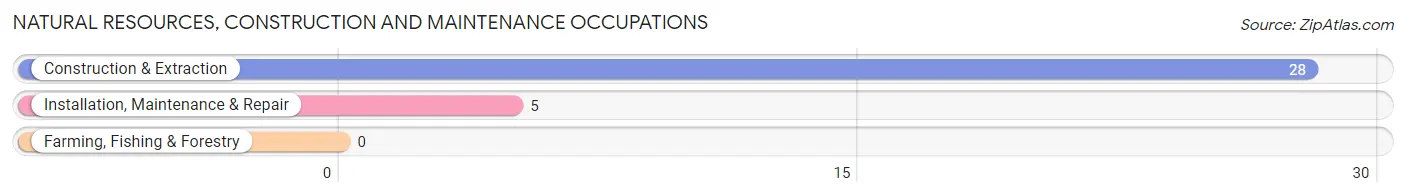
Natural Resources, Construction and Maintenance Occupations
The most common Natural Resources, Construction and Maintenance occupations in Stanardsville are Construction & Extraction (28 | 12.2%), and Installation, Maintenance & Repair (5 | 2.2%).
Natural Resources, Construction and Maintenance Occupations by Sex
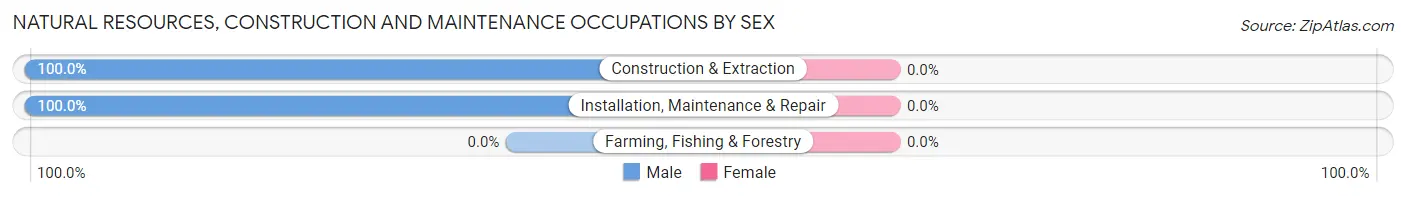
| Occupation | Male | Female |
| Farming, Fishing & Forestry | 0 (0.0%) | 0 (0.0%) |
| Construction & Extraction | 28 (100.0%) | 0 (0.0%) |
| Installation, Maintenance & Repair | 5 (100.0%) | 0 (0.0%) |
| Total (Category) | 33 (100.0%) | 0 (0.0%) |
| Total (Overall) | 115 (50.2%) | 114 (49.8%) |
Production, Transportation and Moving Occupations
The most common Production, Transportation and Moving occupations in Stanardsville are Transportation (4 | 1.8%), Production (3 | 1.3%), and Material Moving (1 | 0.4%).
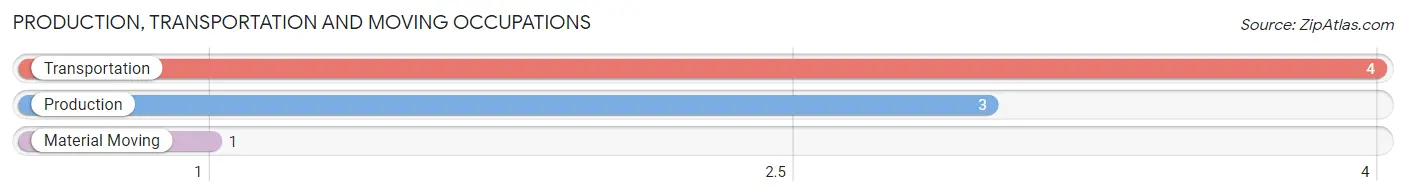
Production, Transportation and Moving Occupations by Sex
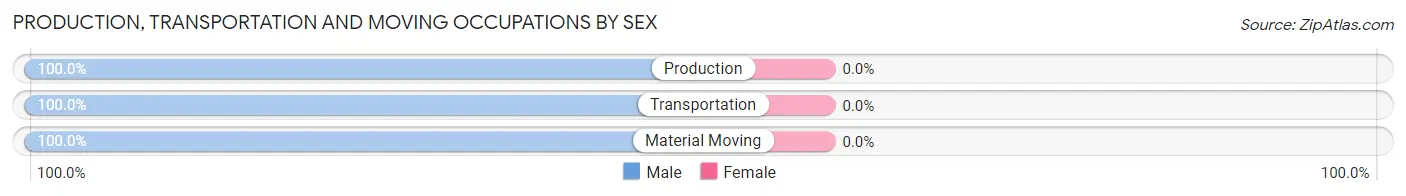
| Occupation | Male | Female |
| Production | 3 (100.0%) | 0 (0.0%) |
| Transportation | 4 (100.0%) | 0 (0.0%) |
| Material Moving | 1 (100.0%) | 0 (0.0%) |
| Total (Category) | 8 (100.0%) | 0 (0.0%) |
| Total (Overall) | 115 (50.2%) | 114 (49.8%) |
Employment Industries by Sex in Stanardsville
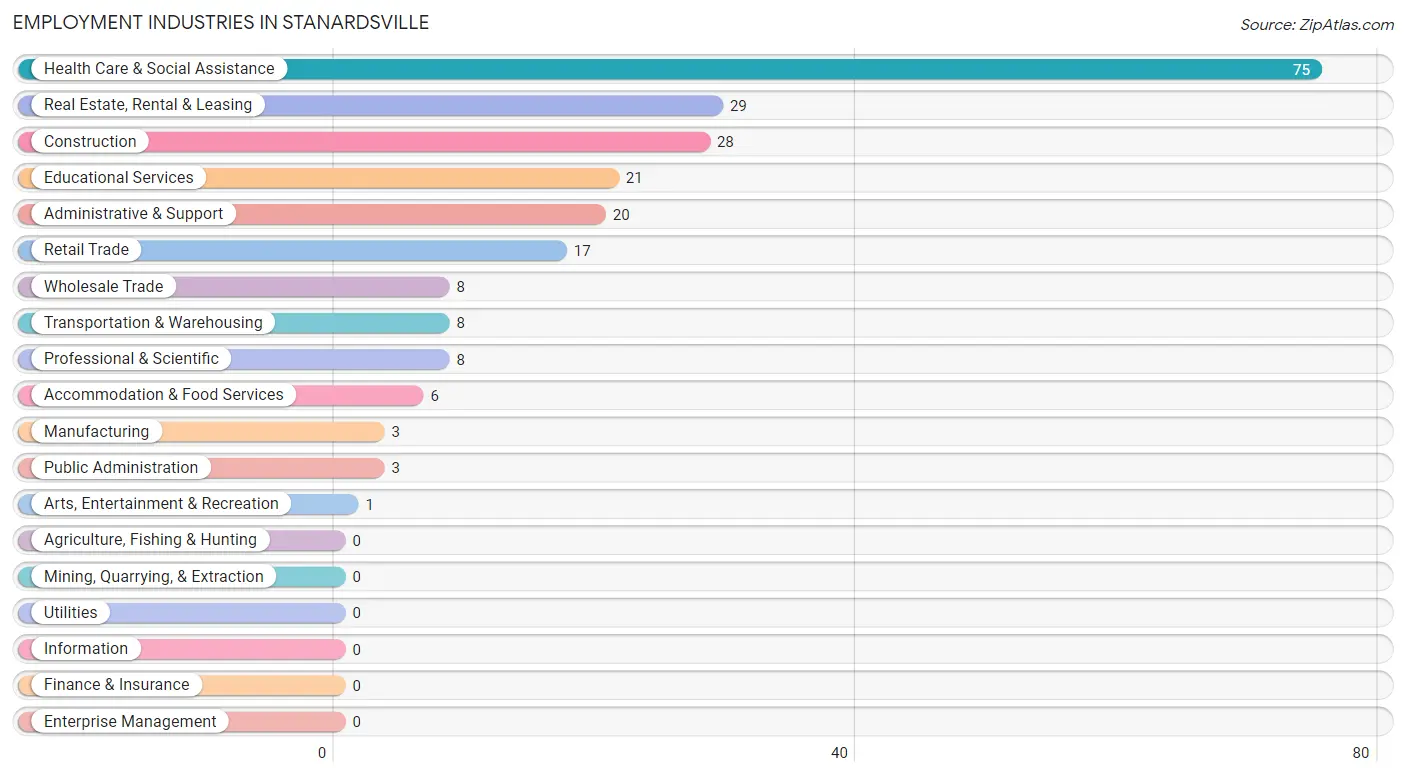
Employment Industries in Stanardsville
The major employment industries in Stanardsville include Health Care & Social Assistance (75 | 32.8%), Real Estate, Rental & Leasing (29 | 12.7%), Construction (28 | 12.2%), Educational Services (21 | 9.2%), and Administrative & Support (20 | 8.7%).
Employment Industries by Sex in Stanardsville
The Stanardsville industries that see more men than women are Construction (100.0%), Manufacturing (100.0%), and Wholesale Trade (100.0%), whereas the industries that tend to have a higher number of women are Transportation & Warehousing (87.5%), Administrative & Support (85.0%), and Real Estate, Rental & Leasing (82.8%).
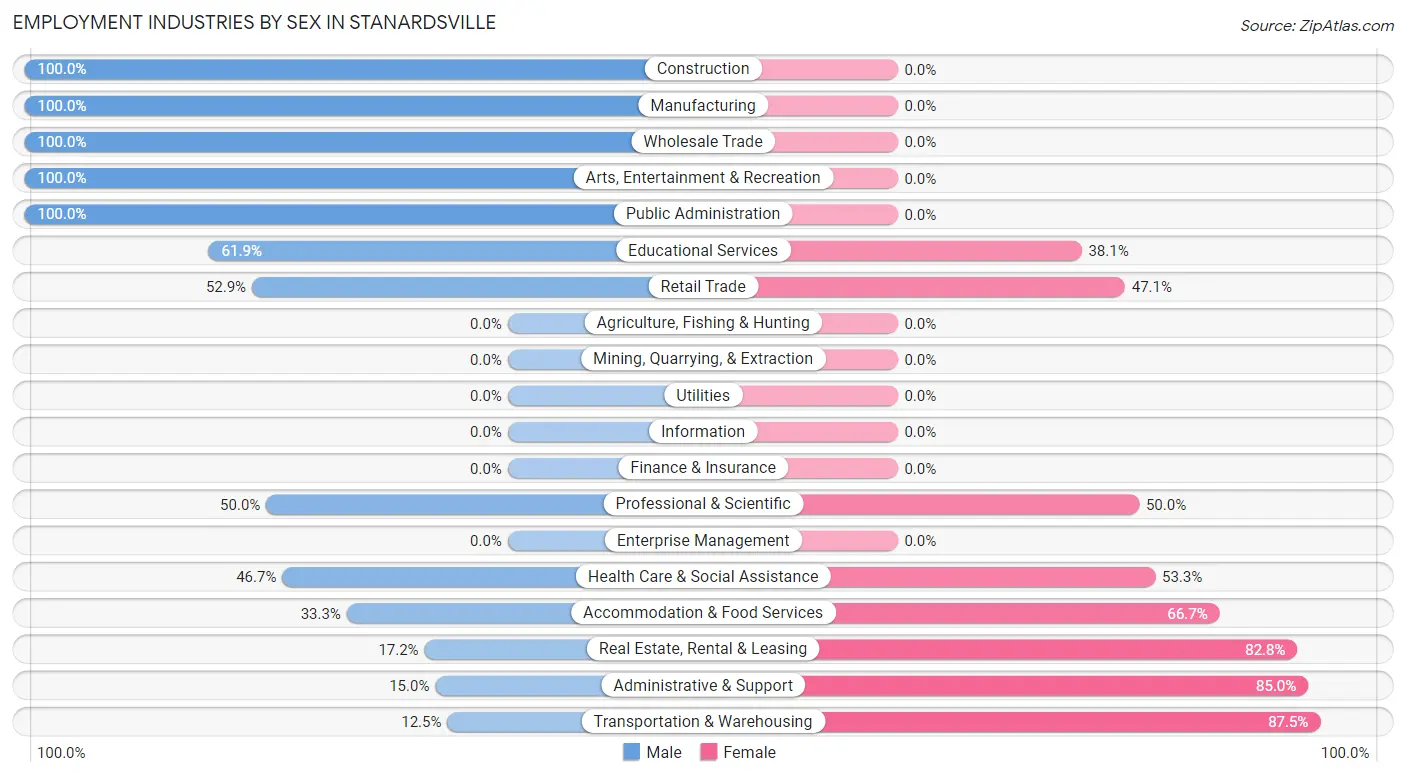
| Industry | Male | Female |
| Agriculture, Fishing & Hunting | 0 (0.0%) | 0 (0.0%) |
| Mining, Quarrying, & Extraction | 0 (0.0%) | 0 (0.0%) |
| Construction | 28 (100.0%) | 0 (0.0%) |
| Manufacturing | 3 (100.0%) | 0 (0.0%) |
| Wholesale Trade | 8 (100.0%) | 0 (0.0%) |
| Retail Trade | 9 (52.9%) | 8 (47.1%) |
| Transportation & Warehousing | 1 (12.5%) | 7 (87.5%) |
| Utilities | 0 (0.0%) | 0 (0.0%) |
| Information | 0 (0.0%) | 0 (0.0%) |
| Finance & Insurance | 0 (0.0%) | 0 (0.0%) |
| Real Estate, Rental & Leasing | 5 (17.2%) | 24 (82.8%) |
| Professional & Scientific | 4 (50.0%) | 4 (50.0%) |
| Enterprise Management | 0 (0.0%) | 0 (0.0%) |
| Administrative & Support | 3 (15.0%) | 17 (85.0%) |
| Educational Services | 13 (61.9%) | 8 (38.1%) |
| Health Care & Social Assistance | 35 (46.7%) | 40 (53.3%) |
| Arts, Entertainment & Recreation | 1 (100.0%) | 0 (0.0%) |
| Accommodation & Food Services | 2 (33.3%) | 4 (66.7%) |
| Public Administration | 3 (100.0%) | 0 (0.0%) |
| Total | 115 (50.2%) | 114 (49.8%) |
Education in Stanardsville
School Enrollment in Stanardsville
The most common levels of schooling among the 98 students in Stanardsville are high school (41 | 41.8%), elementary school (27 | 27.6%), and middle school (11 | 11.2%).
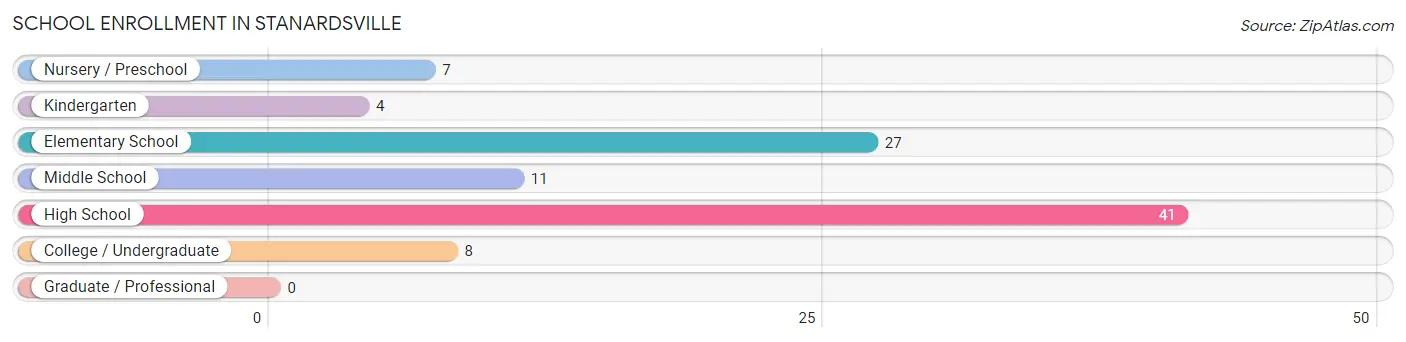
| School Level | # Students | % Students |
| Nursery / Preschool | 7 | 7.1% |
| Kindergarten | 4 | 4.1% |
| Elementary School | 27 | 27.6% |
| Middle School | 11 | 11.2% |
| High School | 41 | 41.8% |
| College / Undergraduate | 8 | 8.2% |
| Graduate / Professional | 0 | 0.0% |
| Total | 98 | 100.0% |
School Enrollment by Age by Funding Source in Stanardsville
Out of a total of 98 students who are enrolled in schools in Stanardsville, 1 (1.0%) attend a private institution, while the remaining 97 (99.0%) are enrolled in public schools. The age group of 3 to 4 year olds has the highest likelihood of being enrolled in private schools, with 1 (14.3% in the age bracket) enrolled. Conversely, the age group of 5 to 9 year old has the lowest likelihood of being enrolled in a private school, with 30 (100.0% in the age bracket) attending a public institution.
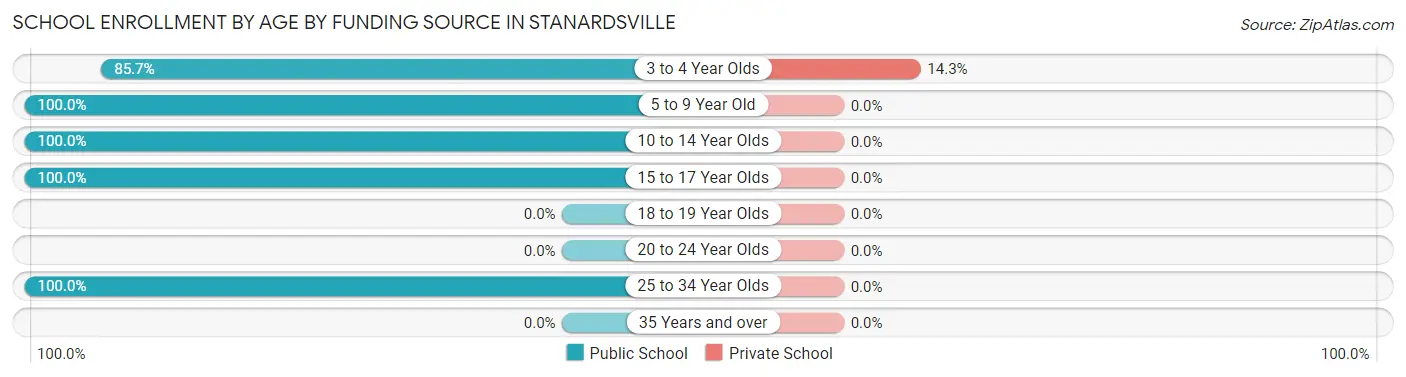
| Age Bracket | Public School | Private School |
| 3 to 4 Year Olds | 6 (85.7%) | 1 (14.3%) |
| 5 to 9 Year Old | 30 (100.0%) | 0 (0.0%) |
| 10 to 14 Year Olds | 33 (100.0%) | 0 (0.0%) |
| 15 to 17 Year Olds | 20 (100.0%) | 0 (0.0%) |
| 18 to 19 Year Olds | 0 (0.0%) | 0 (0.0%) |
| 20 to 24 Year Olds | 0 (0.0%) | 0 (0.0%) |
| 25 to 34 Year Olds | 8 (100.0%) | 0 (0.0%) |
| 35 Years and over | 0 (0.0%) | 0 (0.0%) |
| Total | 97 (99.0%) | 1 (1.0%) |
Educational Attainment by Field of Study in Stanardsville
Liberal arts & history (39 | 30.2%), education (28 | 21.7%), psychology (26 | 20.2%), literature & languages (18 | 14.0%), and computers & mathematics (6 | 4.6%) are the most common fields of study among 129 individuals in Stanardsville who have obtained a bachelor's degree or higher.
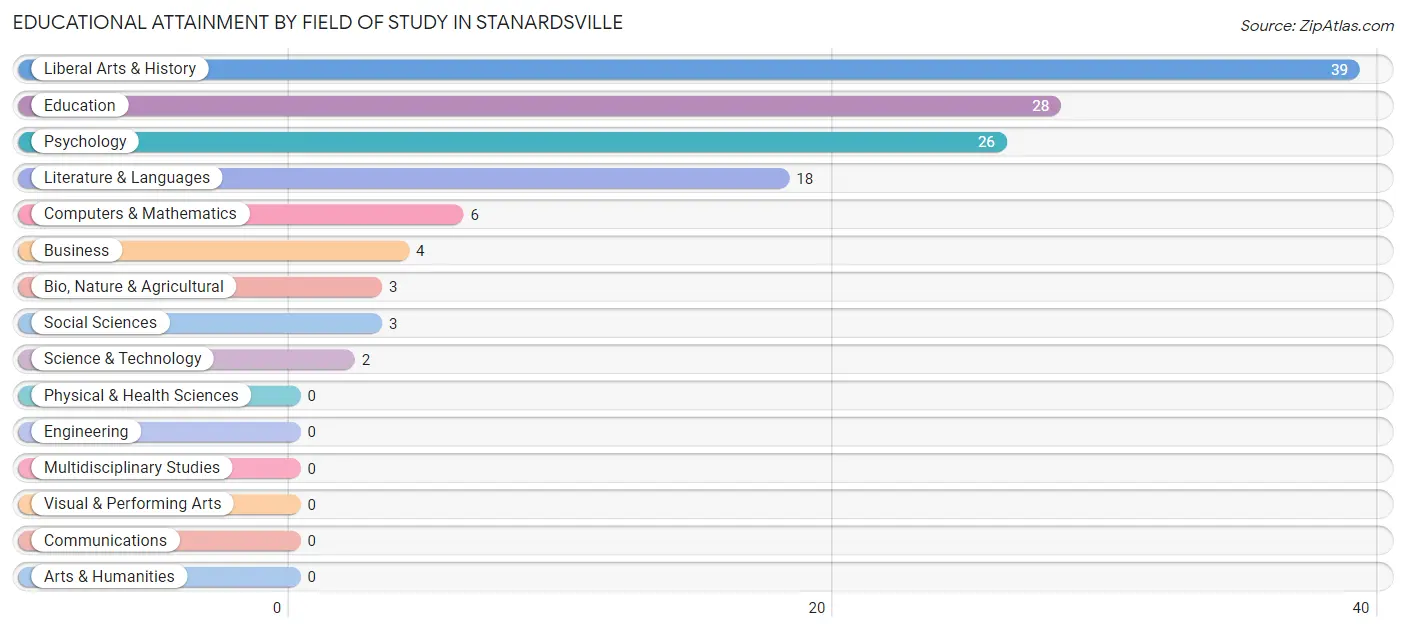
| Field of Study | # Graduates | % Graduates |
| Computers & Mathematics | 6 | 4.6% |
| Bio, Nature & Agricultural | 3 | 2.3% |
| Physical & Health Sciences | 0 | 0.0% |
| Psychology | 26 | 20.2% |
| Social Sciences | 3 | 2.3% |
| Engineering | 0 | 0.0% |
| Multidisciplinary Studies | 0 | 0.0% |
| Science & Technology | 2 | 1.5% |
| Business | 4 | 3.1% |
| Education | 28 | 21.7% |
| Literature & Languages | 18 | 14.0% |
| Liberal Arts & History | 39 | 30.2% |
| Visual & Performing Arts | 0 | 0.0% |
| Communications | 0 | 0.0% |
| Arts & Humanities | 0 | 0.0% |
| Total | 129 | 100.0% |
Transportation & Commute in Stanardsville
Vehicle Availability by Sex in Stanardsville
The most prevalent vehicle ownership categories in Stanardsville are males with 2 vehicles (58, accounting for 49.1%) and females with 2 vehicles (56, making up 50.9%).
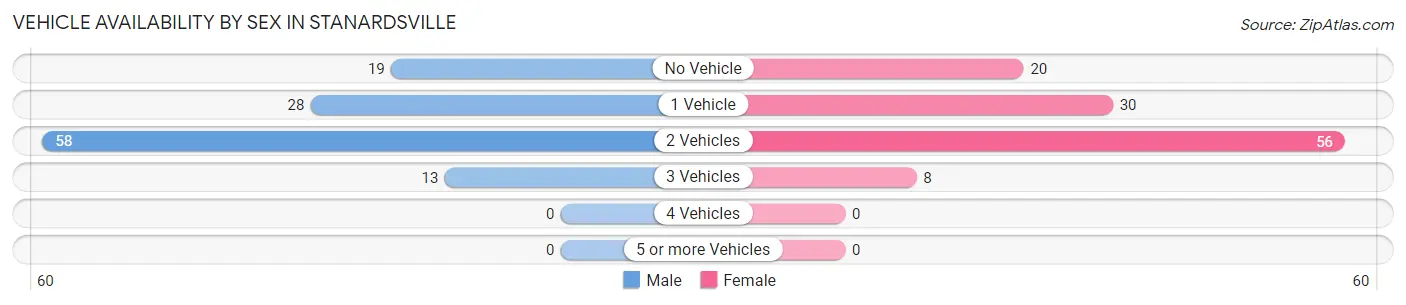
| Vehicles Available | Male | Female |
| No Vehicle | 19 (16.1%) | 20 (17.5%) |
| 1 Vehicle | 28 (23.7%) | 30 (26.3%) |
| 2 Vehicles | 58 (49.1%) | 56 (49.1%) |
| 3 Vehicles | 13 (11.0%) | 8 (7.0%) |
| 4 Vehicles | 0 (0.0%) | 0 (0.0%) |
| 5 or more Vehicles | 0 (0.0%) | 0 (0.0%) |
| Total | 118 (100.0%) | 114 (100.0%) |
Commute Time in Stanardsville
The most frequently occuring commute durations in Stanardsville are 10 to 14 minutes (72 commuters, 35.5%), 30 to 34 minutes (33 commuters, 16.3%), and 15 to 19 minutes (31 commuters, 15.3%).
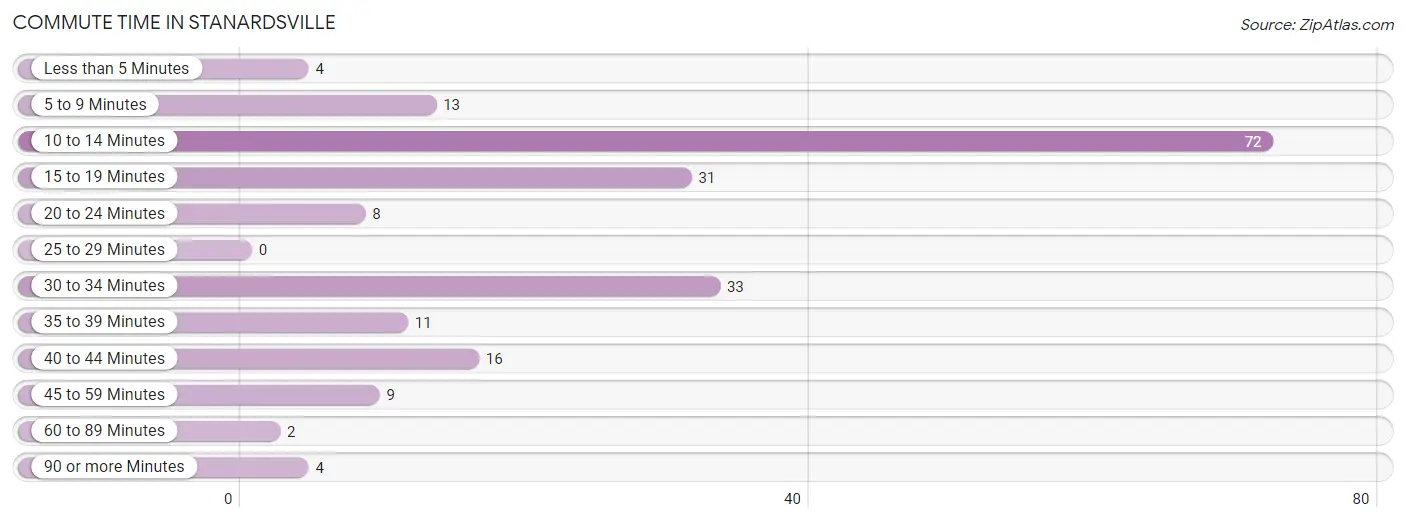
| Commute Time | # Commuters | % Commuters |
| Less than 5 Minutes | 4 | 2.0% |
| 5 to 9 Minutes | 13 | 6.4% |
| 10 to 14 Minutes | 72 | 35.5% |
| 15 to 19 Minutes | 31 | 15.3% |
| 20 to 24 Minutes | 8 | 3.9% |
| 25 to 29 Minutes | 0 | 0.0% |
| 30 to 34 Minutes | 33 | 16.3% |
| 35 to 39 Minutes | 11 | 5.4% |
| 40 to 44 Minutes | 16 | 7.9% |
| 45 to 59 Minutes | 9 | 4.4% |
| 60 to 89 Minutes | 2 | 1.0% |
| 90 or more Minutes | 4 | 2.0% |
Commute Time by Sex in Stanardsville
The most common commute times in Stanardsville are 10 to 14 minutes (35 commuters, 31.2%) for males and 10 to 14 minutes (37 commuters, 40.7%) for females.
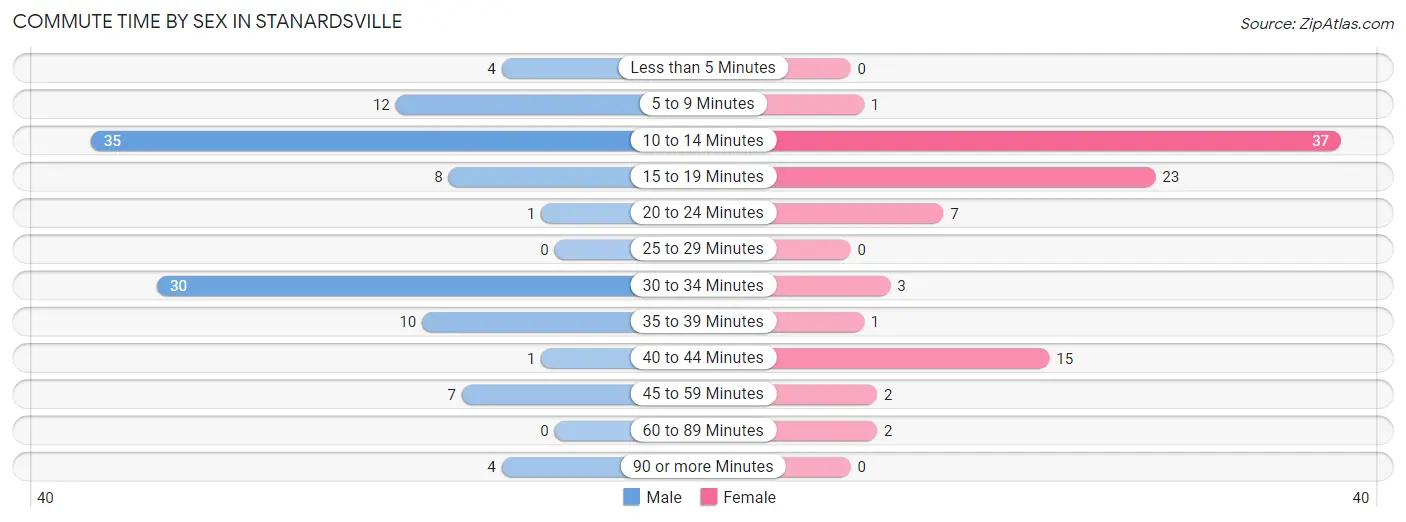
| Commute Time | Male | Female |
| Less than 5 Minutes | 4 (3.6%) | 0 (0.0%) |
| 5 to 9 Minutes | 12 (10.7%) | 1 (1.1%) |
| 10 to 14 Minutes | 35 (31.2%) | 37 (40.7%) |
| 15 to 19 Minutes | 8 (7.1%) | 23 (25.3%) |
| 20 to 24 Minutes | 1 (0.9%) | 7 (7.7%) |
| 25 to 29 Minutes | 0 (0.0%) | 0 (0.0%) |
| 30 to 34 Minutes | 30 (26.8%) | 3 (3.3%) |
| 35 to 39 Minutes | 10 (8.9%) | 1 (1.1%) |
| 40 to 44 Minutes | 1 (0.9%) | 15 (16.5%) |
| 45 to 59 Minutes | 7 (6.2%) | 2 (2.2%) |
| 60 to 89 Minutes | 0 (0.0%) | 2 (2.2%) |
| 90 or more Minutes | 4 (3.6%) | 0 (0.0%) |
Time of Departure to Work by Sex in Stanardsville
The most frequent times of departure to work in Stanardsville are 6:30 AM to 6:59 AM (27, 24.1%) for males and 7:30 AM to 7:59 AM (24, 26.4%) for females.
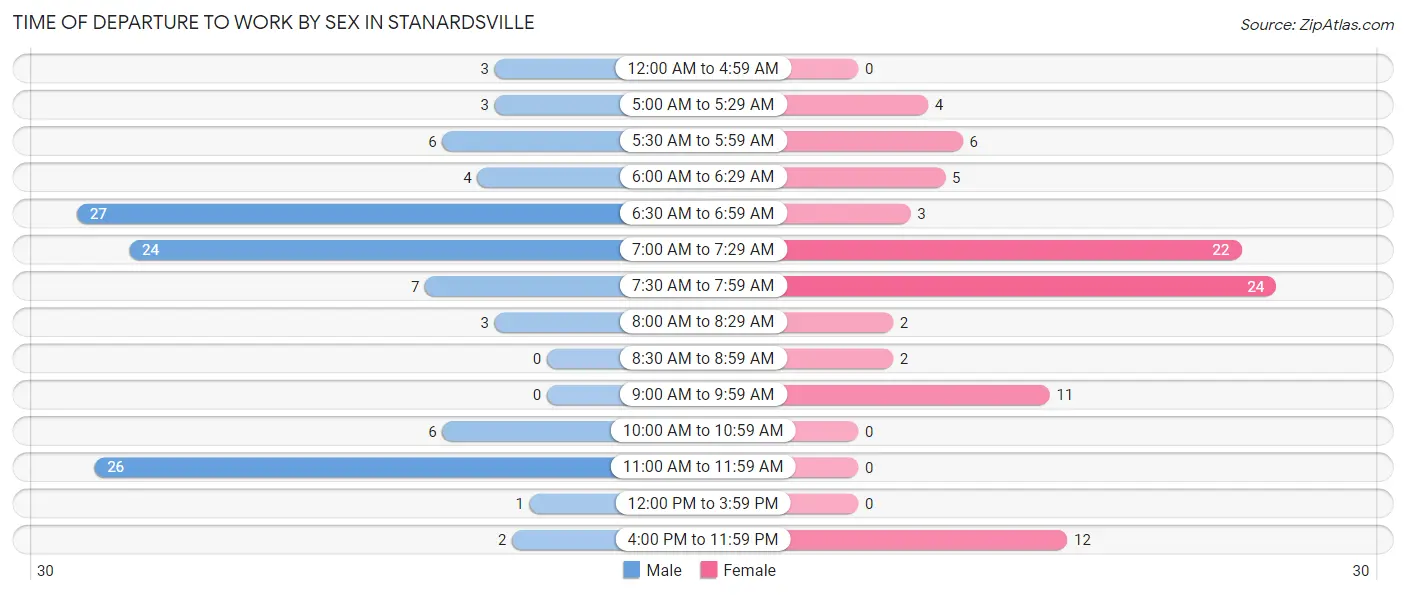
| Time of Departure | Male | Female |
| 12:00 AM to 4:59 AM | 3 (2.7%) | 0 (0.0%) |
| 5:00 AM to 5:29 AM | 3 (2.7%) | 4 (4.4%) |
| 5:30 AM to 5:59 AM | 6 (5.4%) | 6 (6.6%) |
| 6:00 AM to 6:29 AM | 4 (3.6%) | 5 (5.5%) |
| 6:30 AM to 6:59 AM | 27 (24.1%) | 3 (3.3%) |
| 7:00 AM to 7:29 AM | 24 (21.4%) | 22 (24.2%) |
| 7:30 AM to 7:59 AM | 7 (6.2%) | 24 (26.4%) |
| 8:00 AM to 8:29 AM | 3 (2.7%) | 2 (2.2%) |
| 8:30 AM to 8:59 AM | 0 (0.0%) | 2 (2.2%) |
| 9:00 AM to 9:59 AM | 0 (0.0%) | 11 (12.1%) |
| 10:00 AM to 10:59 AM | 6 (5.4%) | 0 (0.0%) |
| 11:00 AM to 11:59 AM | 26 (23.2%) | 0 (0.0%) |
| 12:00 PM to 3:59 PM | 1 (0.9%) | 0 (0.0%) |
| 4:00 PM to 11:59 PM | 2 (1.8%) | 12 (13.2%) |
| Total | 112 (100.0%) | 91 (100.0%) |
Housing Occupancy in Stanardsville
Occupancy by Ownership in Stanardsville
Of the total 218 dwellings in Stanardsville, owner-occupied units account for 107 (49.1%), while renter-occupied units make up 111 (50.9%).
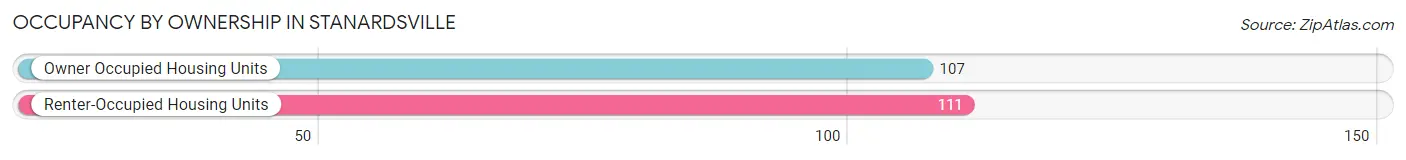
| Occupancy | # Housing Units | % Housing Units |
| Owner Occupied Housing Units | 107 | 49.1% |
| Renter-Occupied Housing Units | 111 | 50.9% |
| Total Occupied Housing Units | 218 | 100.0% |
Occupancy by Household Size in Stanardsville
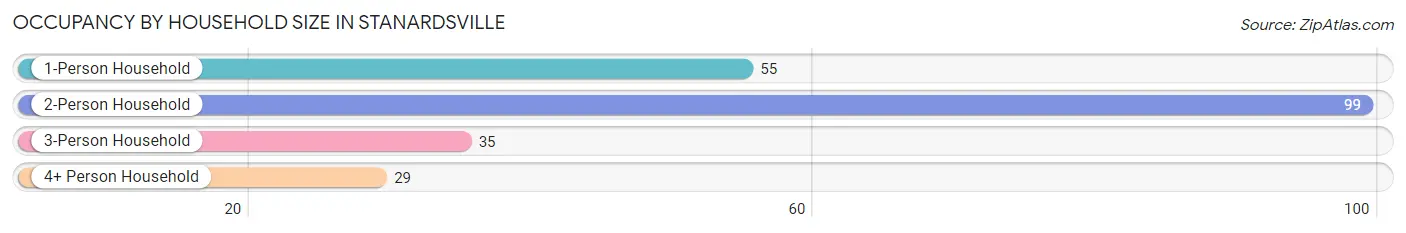
| Household Size | # Housing Units | % Housing Units |
| 1-Person Household | 55 | 25.2% |
| 2-Person Household | 99 | 45.4% |
| 3-Person Household | 35 | 16.1% |
| 4+ Person Household | 29 | 13.3% |
| Total Housing Units | 218 | 100.0% |
Occupancy by Ownership by Household Size in Stanardsville
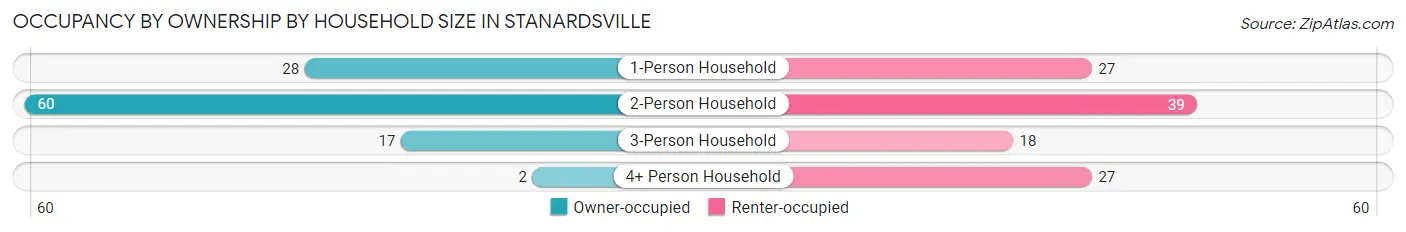
| Household Size | Owner-occupied | Renter-occupied |
| 1-Person Household | 28 (50.9%) | 27 (49.1%) |
| 2-Person Household | 60 (60.6%) | 39 (39.4%) |
| 3-Person Household | 17 (48.6%) | 18 (51.4%) |
| 4+ Person Household | 2 (6.9%) | 27 (93.1%) |
| Total Housing Units | 107 (49.1%) | 111 (50.9%) |
Occupancy by Educational Attainment in Stanardsville
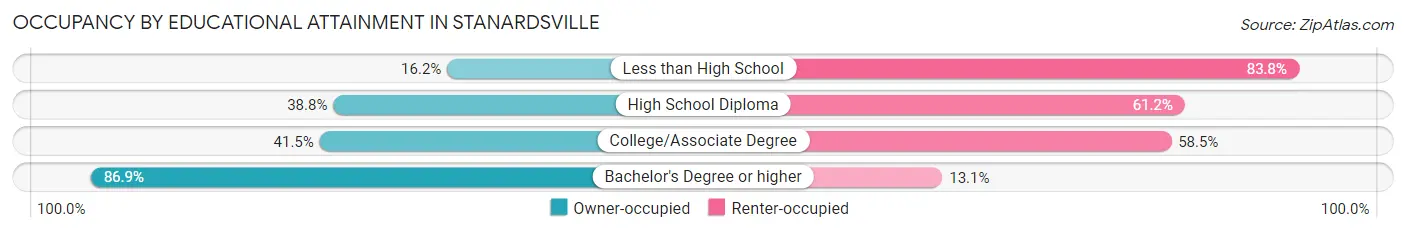
| Household Size | Owner-occupied | Renter-occupied |
| Less than High School | 6 (16.2%) | 31 (83.8%) |
| High School Diploma | 26 (38.8%) | 41 (61.2%) |
| College/Associate Degree | 22 (41.5%) | 31 (58.5%) |
| Bachelor's Degree or higher | 53 (86.9%) | 8 (13.1%) |
Occupancy by Age of Householder in Stanardsville
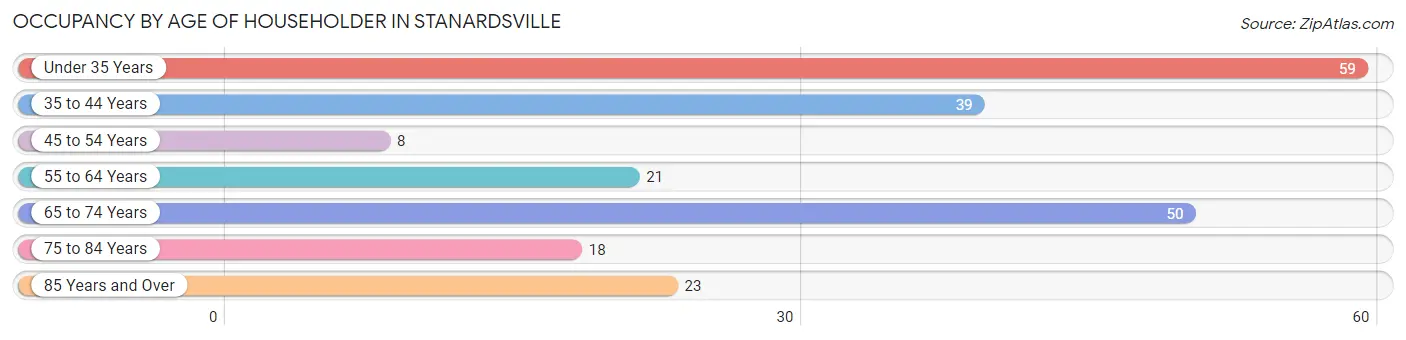
| Age Bracket | # Households | % Households |
| Under 35 Years | 59 | 27.1% |
| 35 to 44 Years | 39 | 17.9% |
| 45 to 54 Years | 8 | 3.7% |
| 55 to 64 Years | 21 | 9.6% |
| 65 to 74 Years | 50 | 22.9% |
| 75 to 84 Years | 18 | 8.3% |
| 85 Years and Over | 23 | 10.5% |
| Total | 218 | 100.0% |
Housing Finances in Stanardsville
Median Income by Occupancy in Stanardsville
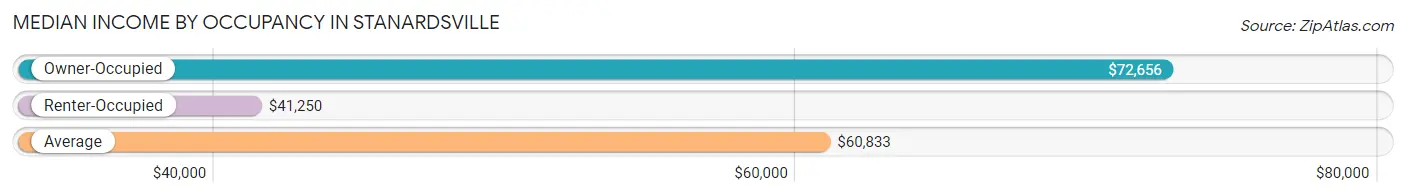
| Occupancy Type | # Households | Median Income |
| Owner-Occupied | 107 (49.1%) | $72,656 |
| Renter-Occupied | 111 (50.9%) | $41,250 |
| Average | 218 (100.0%) | $60,833 |
Occupancy by Householder Income Bracket in Stanardsville
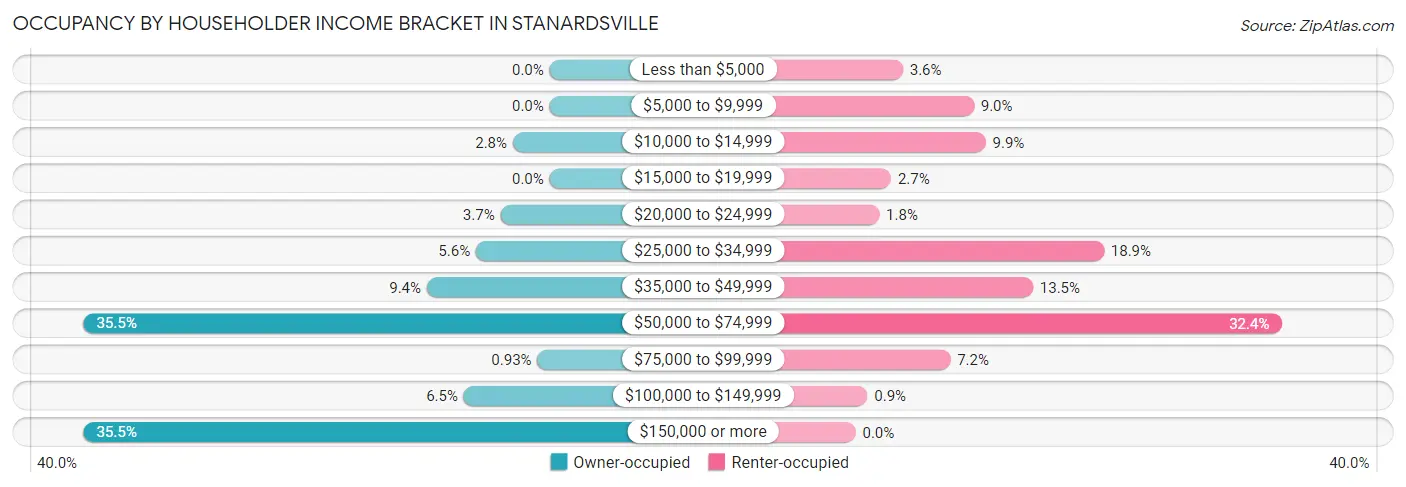
| Income Bracket | Owner-occupied | Renter-occupied |
| Less than $5,000 | 0 (0.0%) | 4 (3.6%) |
| $5,000 to $9,999 | 0 (0.0%) | 10 (9.0%) |
| $10,000 to $14,999 | 3 (2.8%) | 11 (9.9%) |
| $15,000 to $19,999 | 0 (0.0%) | 3 (2.7%) |
| $20,000 to $24,999 | 4 (3.7%) | 2 (1.8%) |
| $25,000 to $34,999 | 6 (5.6%) | 21 (18.9%) |
| $35,000 to $49,999 | 10 (9.3%) | 15 (13.5%) |
| $50,000 to $74,999 | 38 (35.5%) | 36 (32.4%) |
| $75,000 to $99,999 | 1 (0.9%) | 8 (7.2%) |
| $100,000 to $149,999 | 7 (6.5%) | 1 (0.9%) |
| $150,000 or more | 38 (35.5%) | 0 (0.0%) |
| Total | 107 (100.0%) | 111 (100.0%) |
Monthly Housing Cost Tiers in Stanardsville
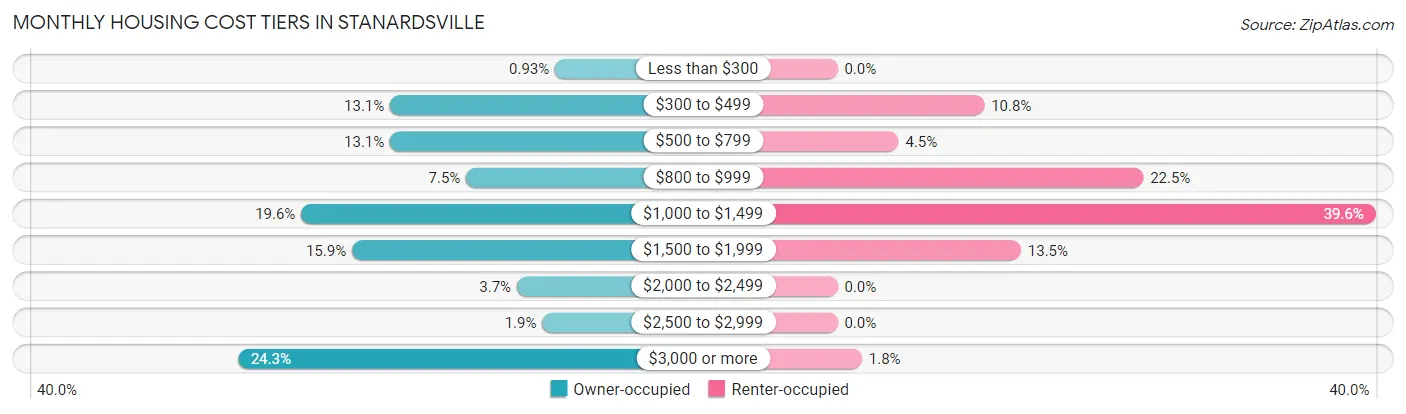
| Monthly Cost | Owner-occupied | Renter-occupied |
| Less than $300 | 1 (0.9%) | 0 (0.0%) |
| $300 to $499 | 14 (13.1%) | 12 (10.8%) |
| $500 to $799 | 14 (13.1%) | 5 (4.5%) |
| $800 to $999 | 8 (7.5%) | 25 (22.5%) |
| $1,000 to $1,499 | 21 (19.6%) | 44 (39.6%) |
| $1,500 to $1,999 | 17 (15.9%) | 15 (13.5%) |
| $2,000 to $2,499 | 4 (3.7%) | 0 (0.0%) |
| $2,500 to $2,999 | 2 (1.9%) | 0 (0.0%) |
| $3,000 or more | 26 (24.3%) | 2 (1.8%) |
| Total | 107 (100.0%) | 111 (100.0%) |
Physical Housing Characteristics in Stanardsville
Housing Structures in Stanardsville
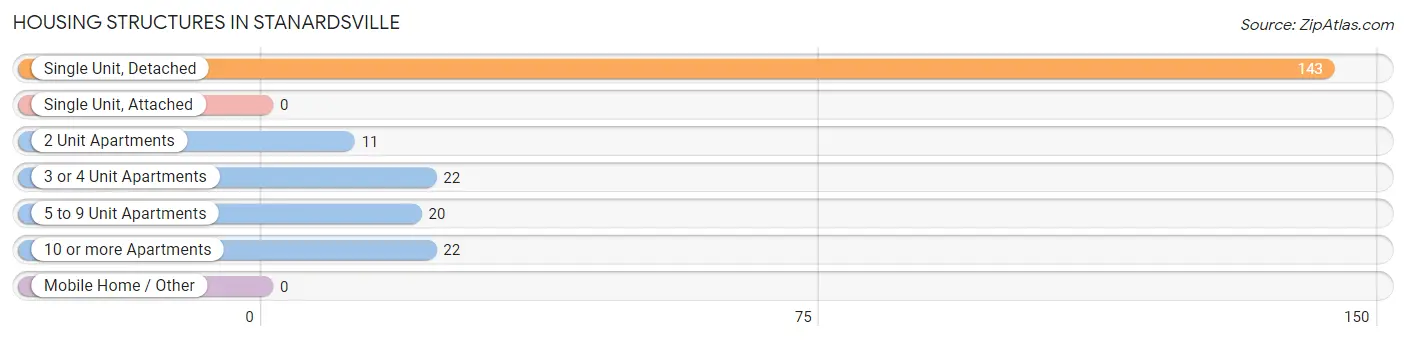
| Structure Type | # Housing Units | % Housing Units |
| Single Unit, Detached | 143 | 65.6% |
| Single Unit, Attached | 0 | 0.0% |
| 2 Unit Apartments | 11 | 5.1% |
| 3 or 4 Unit Apartments | 22 | 10.1% |
| 5 to 9 Unit Apartments | 20 | 9.2% |
| 10 or more Apartments | 22 | 10.1% |
| Mobile Home / Other | 0 | 0.0% |
| Total | 218 | 100.0% |
Housing Structures by Occupancy in Stanardsville
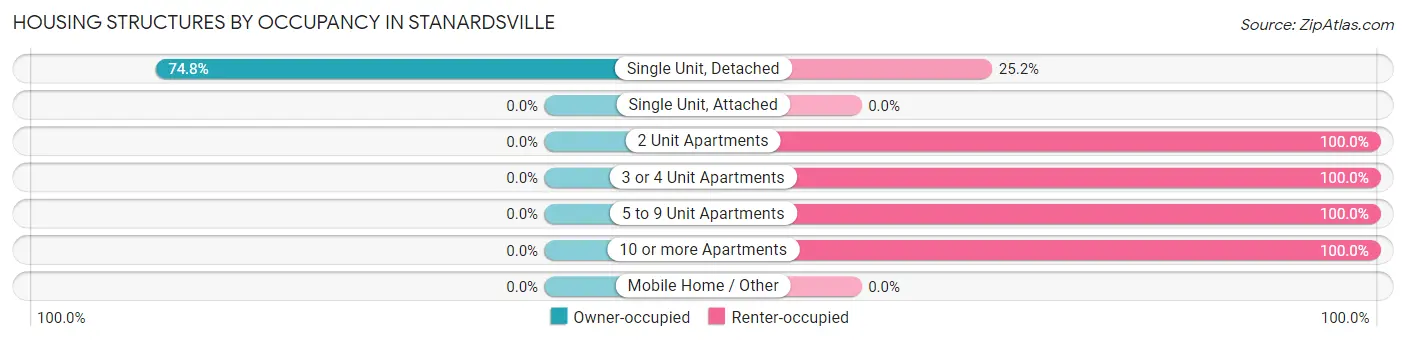
| Structure Type | Owner-occupied | Renter-occupied |
| Single Unit, Detached | 107 (74.8%) | 36 (25.2%) |
| Single Unit, Attached | 0 (0.0%) | 0 (0.0%) |
| 2 Unit Apartments | 0 (0.0%) | 11 (100.0%) |
| 3 or 4 Unit Apartments | 0 (0.0%) | 22 (100.0%) |
| 5 to 9 Unit Apartments | 0 (0.0%) | 20 (100.0%) |
| 10 or more Apartments | 0 (0.0%) | 22 (100.0%) |
| Mobile Home / Other | 0 (0.0%) | 0 (0.0%) |
| Total | 107 (49.1%) | 111 (50.9%) |
Housing Structures by Number of Rooms in Stanardsville
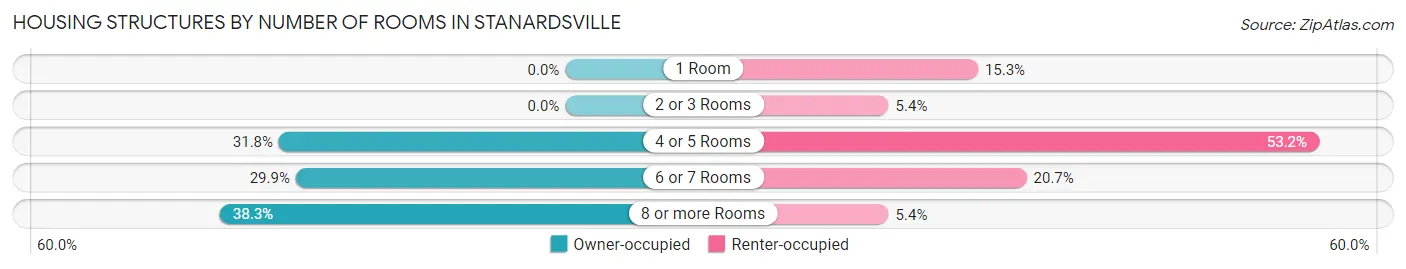
| Number of Rooms | Owner-occupied | Renter-occupied |
| 1 Room | 0 (0.0%) | 17 (15.3%) |
| 2 or 3 Rooms | 0 (0.0%) | 6 (5.4%) |
| 4 or 5 Rooms | 34 (31.8%) | 59 (53.1%) |
| 6 or 7 Rooms | 32 (29.9%) | 23 (20.7%) |
| 8 or more Rooms | 41 (38.3%) | 6 (5.4%) |
| Total | 107 (100.0%) | 111 (100.0%) |
Housing Structure by Heating Type in Stanardsville
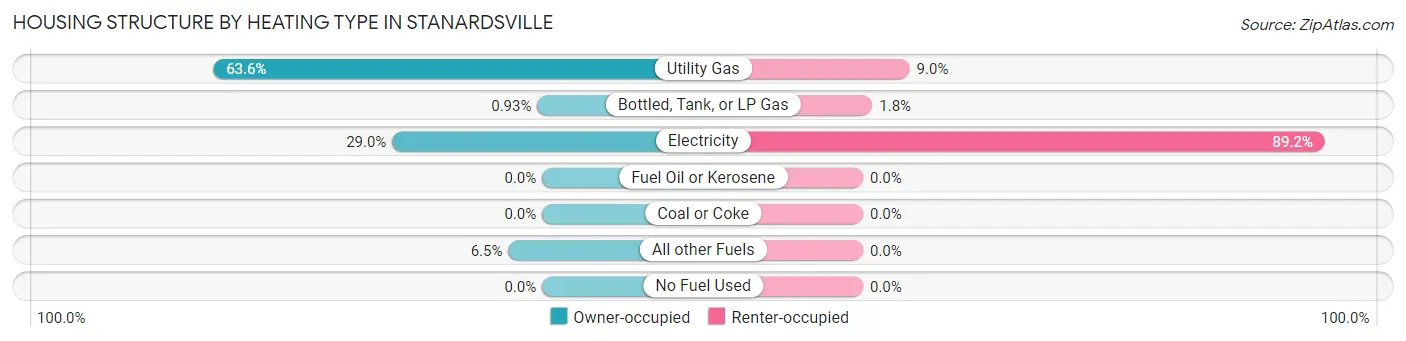
| Heating Type | Owner-occupied | Renter-occupied |
| Utility Gas | 68 (63.5%) | 10 (9.0%) |
| Bottled, Tank, or LP Gas | 1 (0.9%) | 2 (1.8%) |
| Electricity | 31 (29.0%) | 99 (89.2%) |
| Fuel Oil or Kerosene | 0 (0.0%) | 0 (0.0%) |
| Coal or Coke | 0 (0.0%) | 0 (0.0%) |
| All other Fuels | 7 (6.5%) | 0 (0.0%) |
| No Fuel Used | 0 (0.0%) | 0 (0.0%) |
| Total | 107 (100.0%) | 111 (100.0%) |
Household Vehicle Usage in Stanardsville
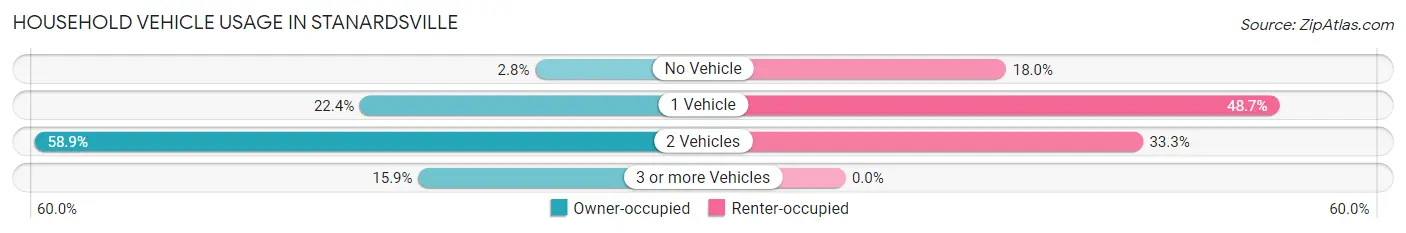
| Vehicles per Household | Owner-occupied | Renter-occupied |
| No Vehicle | 3 (2.8%) | 20 (18.0%) |
| 1 Vehicle | 24 (22.4%) | 54 (48.6%) |
| 2 Vehicles | 63 (58.9%) | 37 (33.3%) |
| 3 or more Vehicles | 17 (15.9%) | 0 (0.0%) |
| Total | 107 (100.0%) | 111 (100.0%) |
Real Estate & Mortgages in Stanardsville
Real Estate and Mortgage Overview in Stanardsville
| Characteristic | Without Mortgage | With Mortgage |
| Housing Units | 32 | 75 |
| Median Property Value | $270,800 | $243,400 |
| Median Household Income | $44,375 | $38 |
| Monthly Housing Costs | $533 | $26 |
| Real Estate Taxes | $2,429 | $3 |
Property Value by Mortgage Status in Stanardsville
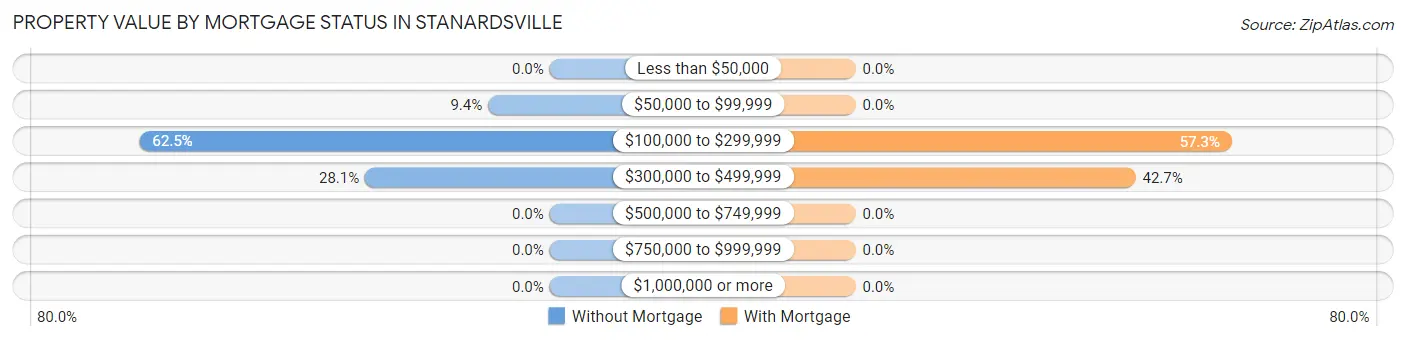
| Property Value | Without Mortgage | With Mortgage |
| Less than $50,000 | 0 (0.0%) | 0 (0.0%) |
| $50,000 to $99,999 | 3 (9.4%) | 0 (0.0%) |
| $100,000 to $299,999 | 20 (62.5%) | 43 (57.3%) |
| $300,000 to $499,999 | 9 (28.1%) | 32 (42.7%) |
| $500,000 to $749,999 | 0 (0.0%) | 0 (0.0%) |
| $750,000 to $999,999 | 0 (0.0%) | 0 (0.0%) |
| $1,000,000 or more | 0 (0.0%) | 0 (0.0%) |
| Total | 32 (100.0%) | 75 (100.0%) |
Household Income by Mortgage Status in Stanardsville
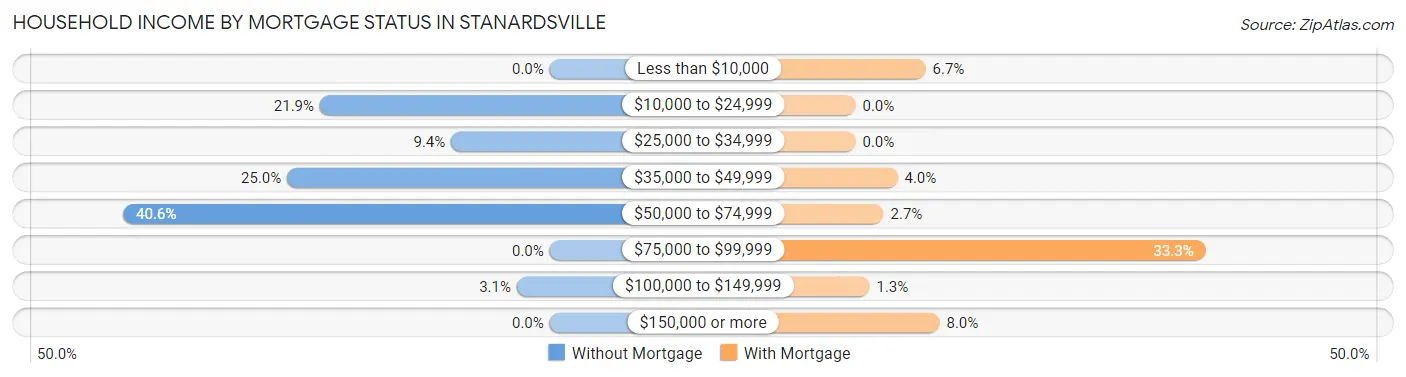
| Household Income | Without Mortgage | With Mortgage |
| Less than $10,000 | 0 (0.0%) | 5 (6.7%) |
| $10,000 to $24,999 | 7 (21.9%) | 0 (0.0%) |
| $25,000 to $34,999 | 3 (9.4%) | 0 (0.0%) |
| $35,000 to $49,999 | 8 (25.0%) | 3 (4.0%) |
| $50,000 to $74,999 | 13 (40.6%) | 2 (2.7%) |
| $75,000 to $99,999 | 0 (0.0%) | 25 (33.3%) |
| $100,000 to $149,999 | 1 (3.1%) | 1 (1.3%) |
| $150,000 or more | 0 (0.0%) | 6 (8.0%) |
| Total | 32 (100.0%) | 75 (100.0%) |
Property Value to Household Income Ratio in Stanardsville
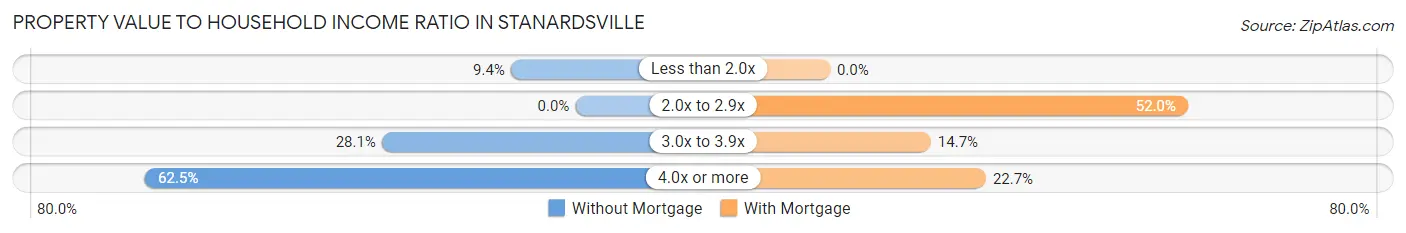
| Value-to-Income Ratio | Without Mortgage | With Mortgage |
| Less than 2.0x | 3 (9.4%) | 0 (0.0%) |
| 2.0x to 2.9x | 0 (0.0%) | 39 (52.0%) |
| 3.0x to 3.9x | 9 (28.1%) | 11 (14.7%) |
| 4.0x or more | 20 (62.5%) | 17 (22.7%) |
| Total | 32 (100.0%) | 75 (100.0%) |
Real Estate Taxes by Mortgage Status in Stanardsville
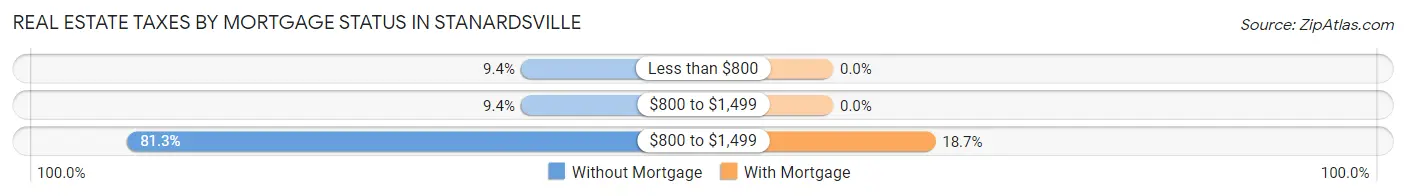
| Property Taxes | Without Mortgage | With Mortgage |
| Less than $800 | 3 (9.4%) | 0 (0.0%) |
| $800 to $1,499 | 3 (9.4%) | 0 (0.0%) |
| $800 to $1,499 | 26 (81.2%) | 14 (18.7%) |
| Total | 32 (100.0%) | 75 (100.0%) |
Health & Disability in Stanardsville
Health Insurance Coverage by Age in Stanardsville
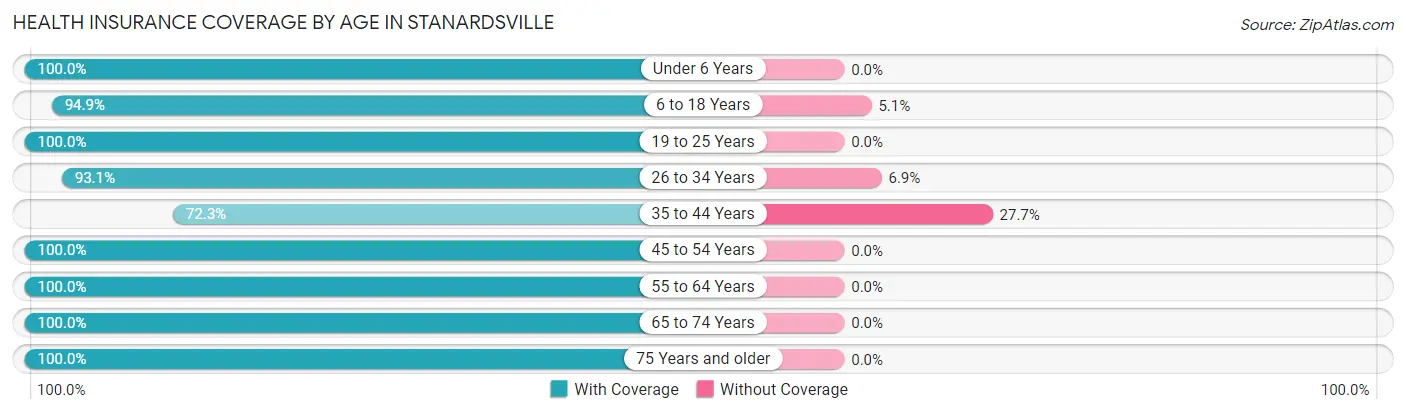
| Age Bracket | With Coverage | Without Coverage |
| Under 6 Years | 39 (100.0%) | 0 (0.0%) |
| 6 to 18 Years | 75 (94.9%) | 4 (5.1%) |
| 19 to 25 Years | 19 (100.0%) | 0 (0.0%) |
| 26 to 34 Years | 67 (93.1%) | 5 (6.9%) |
| 35 to 44 Years | 34 (72.3%) | 13 (27.7%) |
| 45 to 54 Years | 39 (100.0%) | 0 (0.0%) |
| 55 to 64 Years | 53 (100.0%) | 0 (0.0%) |
| 65 to 74 Years | 79 (100.0%) | 0 (0.0%) |
| 75 Years and older | 62 (100.0%) | 0 (0.0%) |
| Total | 467 (95.5%) | 22 (4.5%) |
Health Insurance Coverage by Citizenship Status in Stanardsville
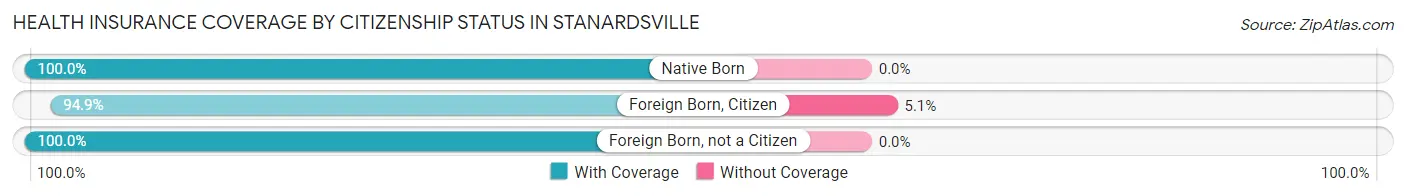
| Citizenship Status | With Coverage | Without Coverage |
| Native Born | 39 (100.0%) | 0 (0.0%) |
| Foreign Born, Citizen | 75 (94.9%) | 4 (5.1%) |
| Foreign Born, not a Citizen | 19 (100.0%) | 0 (0.0%) |
Health Insurance Coverage by Household Income in Stanardsville
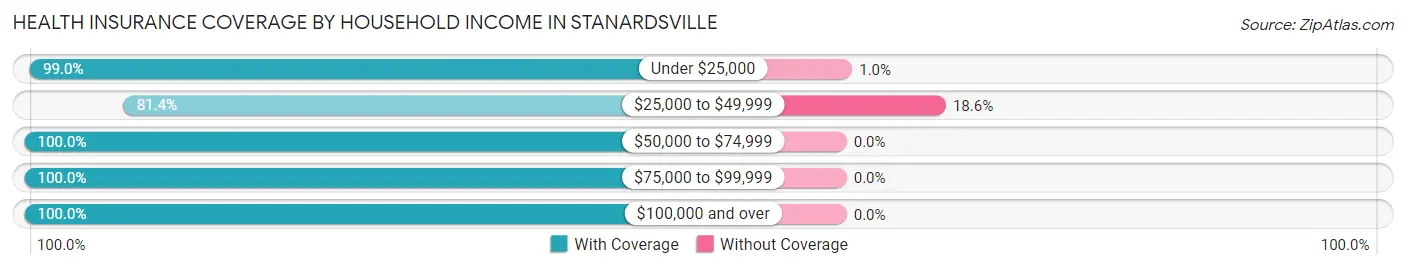
| Household Income | With Coverage | Without Coverage |
| Under $25,000 | 96 (99.0%) | 1 (1.0%) |
| $25,000 to $49,999 | 92 (81.4%) | 21 (18.6%) |
| $50,000 to $74,999 | 159 (100.0%) | 0 (0.0%) |
| $75,000 to $99,999 | 21 (100.0%) | 0 (0.0%) |
| $100,000 and over | 99 (100.0%) | 0 (0.0%) |
Public vs Private Health Insurance Coverage by Age in Stanardsville
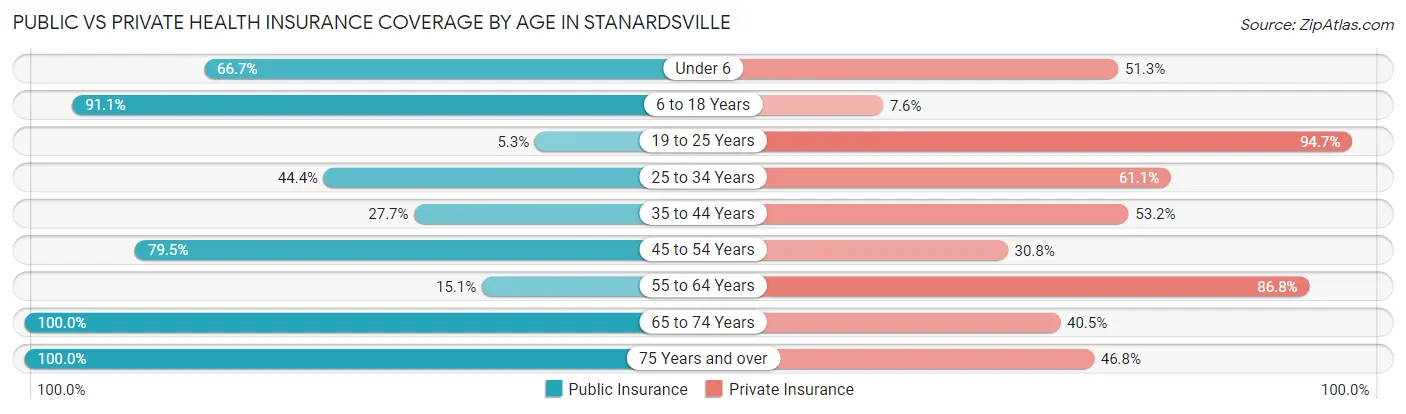
| Age Bracket | Public Insurance | Private Insurance |
| Under 6 | 26 (66.7%) | 20 (51.3%) |
| 6 to 18 Years | 72 (91.1%) | 6 (7.6%) |
| 19 to 25 Years | 1 (5.3%) | 18 (94.7%) |
| 25 to 34 Years | 32 (44.4%) | 44 (61.1%) |
| 35 to 44 Years | 13 (27.7%) | 25 (53.2%) |
| 45 to 54 Years | 31 (79.5%) | 12 (30.8%) |
| 55 to 64 Years | 8 (15.1%) | 46 (86.8%) |
| 65 to 74 Years | 79 (100.0%) | 32 (40.5%) |
| 75 Years and over | 62 (100.0%) | 29 (46.8%) |
| Total | 324 (66.3%) | 232 (47.4%) |
Disability Status by Sex by Age in Stanardsville
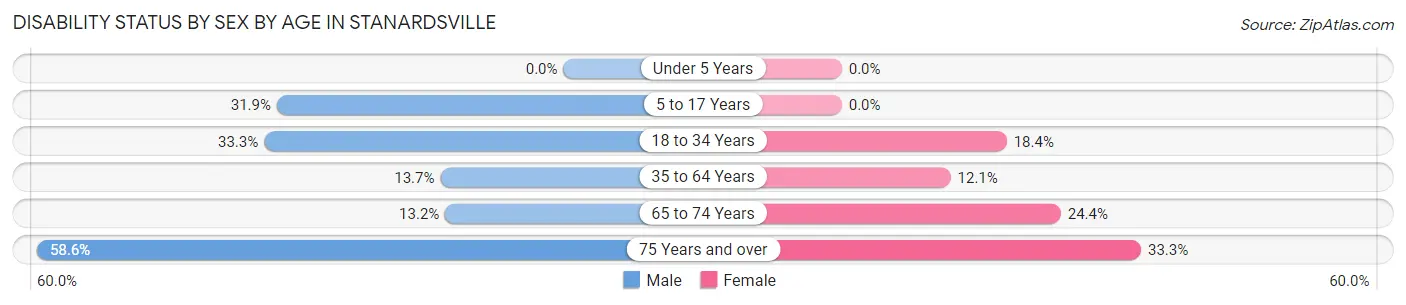
| Age Bracket | Male | Female |
| Under 5 Years | 0 (0.0%) | 0 (0.0%) |
| 5 to 17 Years | 15 (31.9%) | 0 (0.0%) |
| 18 to 34 Years | 14 (33.3%) | 9 (18.4%) |
| 35 to 64 Years | 10 (13.7%) | 8 (12.1%) |
| 65 to 74 Years | 5 (13.2%) | 10 (24.4%) |
| 75 Years and over | 17 (58.6%) | 11 (33.3%) |
Disability Class by Sex by Age in Stanardsville
Disability Class: Hearing Difficulty
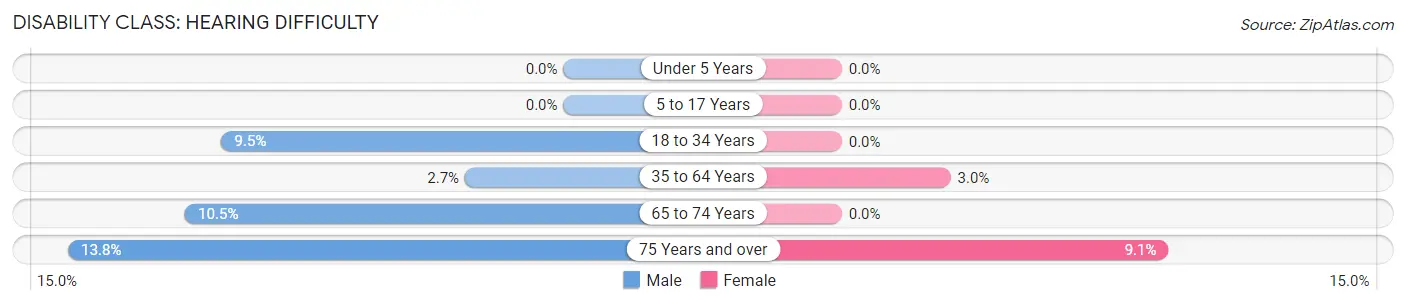
| Age Bracket | Male | Female |
| Under 5 Years | 0 (0.0%) | 0 (0.0%) |
| 5 to 17 Years | 0 (0.0%) | 0 (0.0%) |
| 18 to 34 Years | 4 (9.5%) | 0 (0.0%) |
| 35 to 64 Years | 2 (2.7%) | 2 (3.0%) |
| 65 to 74 Years | 4 (10.5%) | 0 (0.0%) |
| 75 Years and over | 4 (13.8%) | 3 (9.1%) |
Disability Class: Vision Difficulty
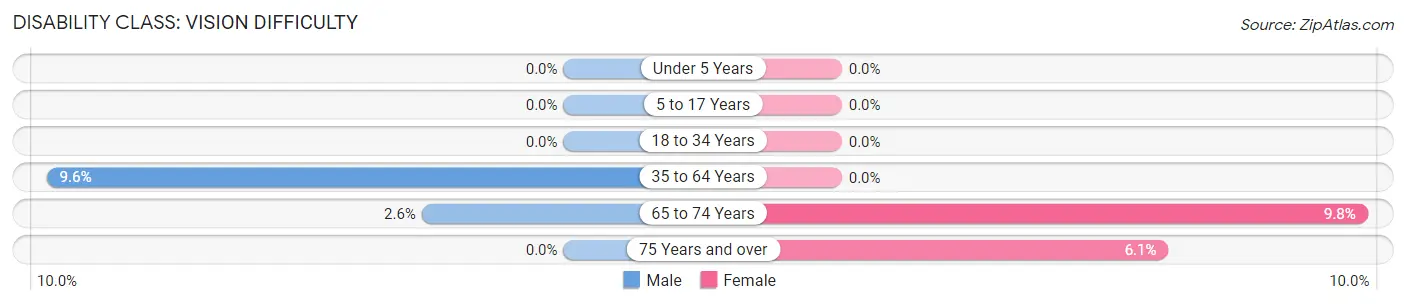
| Age Bracket | Male | Female |
| Under 5 Years | 0 (0.0%) | 0 (0.0%) |
| 5 to 17 Years | 0 (0.0%) | 0 (0.0%) |
| 18 to 34 Years | 0 (0.0%) | 0 (0.0%) |
| 35 to 64 Years | 7 (9.6%) | 0 (0.0%) |
| 65 to 74 Years | 1 (2.6%) | 4 (9.8%) |
| 75 Years and over | 0 (0.0%) | 2 (6.1%) |
Disability Class: Cognitive Difficulty
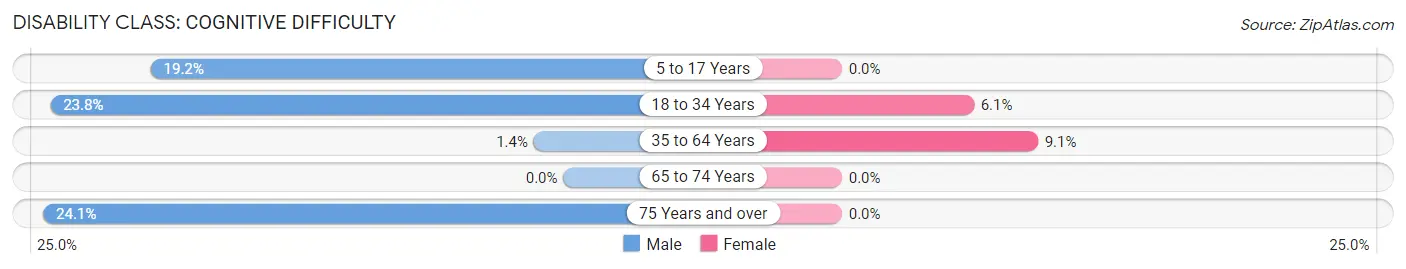
| Age Bracket | Male | Female |
| 5 to 17 Years | 9 (19.2%) | 0 (0.0%) |
| 18 to 34 Years | 10 (23.8%) | 3 (6.1%) |
| 35 to 64 Years | 1 (1.4%) | 6 (9.1%) |
| 65 to 74 Years | 0 (0.0%) | 0 (0.0%) |
| 75 Years and over | 7 (24.1%) | 0 (0.0%) |
Disability Class: Ambulatory Difficulty
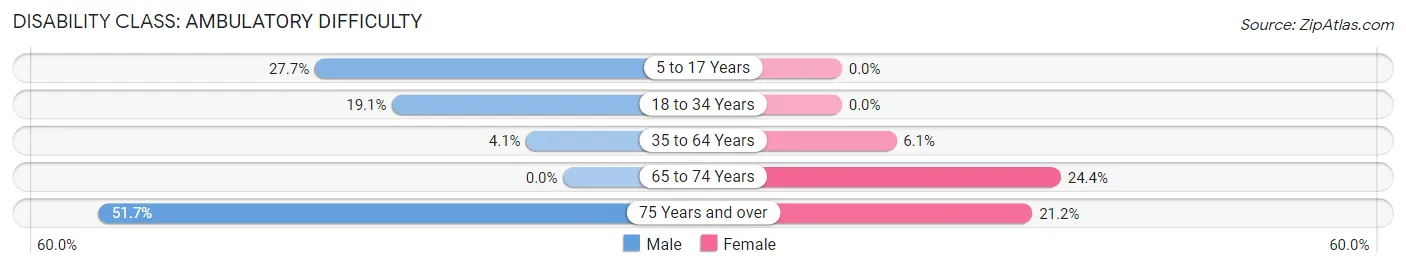
| Age Bracket | Male | Female |
| 5 to 17 Years | 13 (27.7%) | 0 (0.0%) |
| 18 to 34 Years | 8 (19.1%) | 0 (0.0%) |
| 35 to 64 Years | 3 (4.1%) | 4 (6.1%) |
| 65 to 74 Years | 0 (0.0%) | 10 (24.4%) |
| 75 Years and over | 15 (51.7%) | 7 (21.2%) |
Disability Class: Self-Care Difficulty
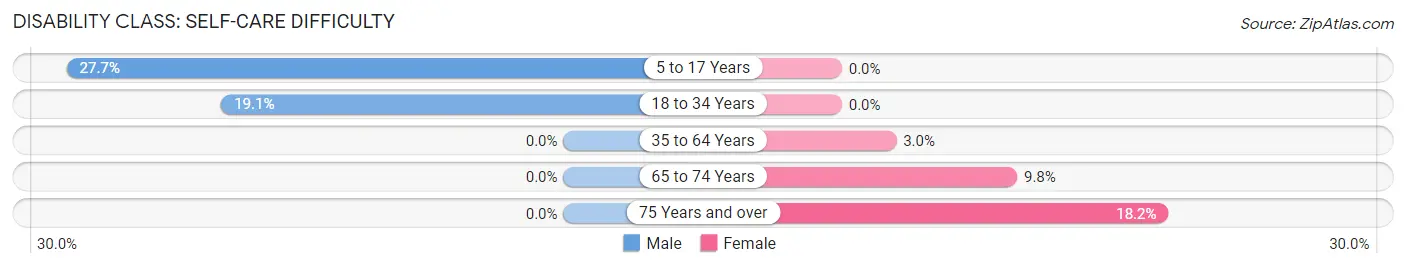
| Age Bracket | Male | Female |
| 5 to 17 Years | 13 (27.7%) | 0 (0.0%) |
| 18 to 34 Years | 8 (19.1%) | 0 (0.0%) |
| 35 to 64 Years | 0 (0.0%) | 2 (3.0%) |
| 65 to 74 Years | 0 (0.0%) | 4 (9.8%) |
| 75 Years and over | 0 (0.0%) | 6 (18.2%) |
Technology Access in Stanardsville
Computing Device Access in Stanardsville
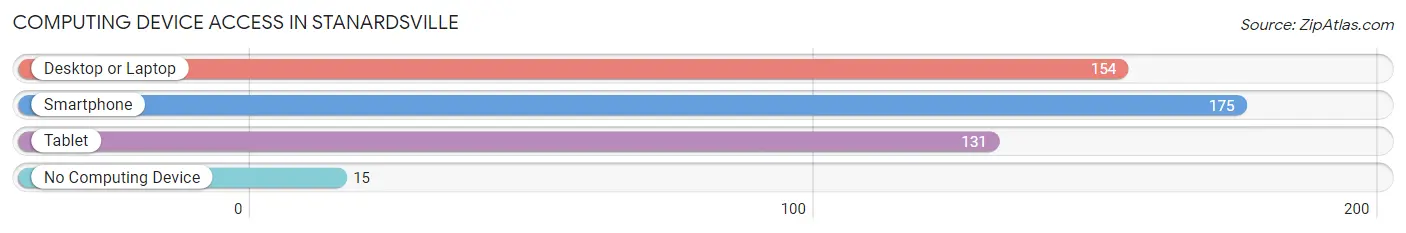
| Device Type | # Households | % Households |
| Desktop or Laptop | 154 | 70.6% |
| Smartphone | 175 | 80.3% |
| Tablet | 131 | 60.1% |
| No Computing Device | 15 | 6.9% |
| Total | 218 | 100.0% |
Internet Access in Stanardsville
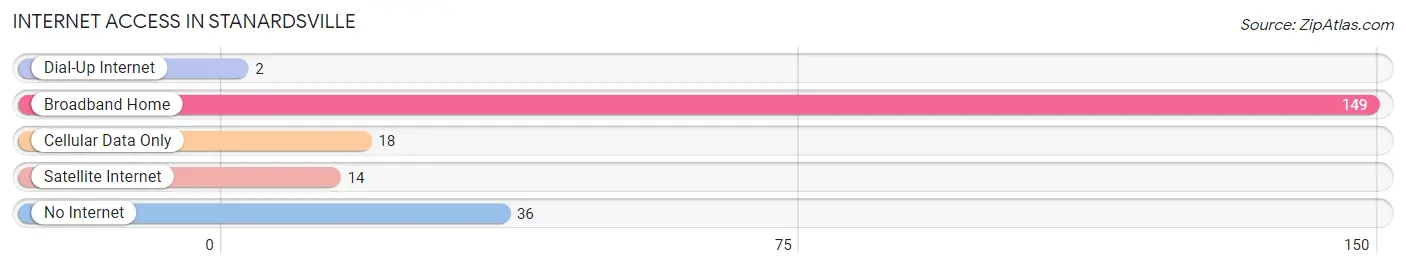
| Internet Type | # Households | % Households |
| Dial-Up Internet | 2 | 0.9% |
| Broadband Home | 149 | 68.3% |
| Cellular Data Only | 18 | 8.3% |
| Satellite Internet | 14 | 6.4% |
| No Internet | 36 | 16.5% |
| Total | 218 | 100.0% |
Stanardsville Summary
Standardsville, Virginia is a small town located in the foothills of the Blue Ridge Mountains in the Shenandoah Valley. It is situated in the northern part of the state, about 25 miles west of Charlottesville. The town was founded in 1790 and is the county seat of Augusta County. The population of Standardsville was 1,845 in the 2010 census.
History
The town of Standardsville was founded in 1790 by a group of settlers from Pennsylvania. The town was named after the Standard family, who were among the first settlers. The Standards were Quakers who had come to the area to escape religious persecution in their home state. The town was originally known as Standardstown, but the name was changed to Standardsville in 1820.
The town was an important stop on the Staunton-Parkersburg Turnpike, which was a major route for settlers heading west. The turnpike was also used by the Confederate Army during the Civil War. The town was the site of a skirmish between Union and Confederate forces in 1862.
Geography
Standardsville is located in the northern part of Virginia, in the foothills of the Blue Ridge Mountains. The town is situated in the Shenandoah Valley, about 25 miles west of Charlottesville. The town is surrounded by rolling hills and farmland. The town is located near the South River, which is a tributary of the Shenandoah River.
The climate in Standardsville is temperate, with hot summers and cold winters. The average temperature in the summer is around 80 degrees Fahrenheit, and the average temperature in the winter is around 40 degrees Fahrenheit.
Economy
The economy of Standardsville is largely based on agriculture. The town is home to several farms, which produce a variety of crops, including corn, wheat, soybeans, and hay. The town is also home to several small businesses, including a hardware store, a grocery store, and a restaurant.
The town is also home to several manufacturing companies, including a furniture factory and a plastics factory. The town is also home to a number of small businesses, including a bakery, a florist, and a gift shop.
Demographics
The population of Standardsville was 1,845 in the 2010 census. The town is predominantly white, with a small African American population. The median household income in the town is $41,000, and the median age is 40. The town is home to a number of churches, including Baptist, Methodist, and Presbyterian.
Conclusion
Standardsville, Virginia is a small town located in the foothills of the Blue Ridge Mountains in the Shenandoah Valley. The town was founded in 1790 and is the county seat of Augusta County. The town is largely agricultural, with a number of small businesses and manufacturing companies. The population of Standardsville was 1,845 in the 2010 census, and the town is predominantly white, with a small African American population.
Common Questions
What is Per Capita Income in Stanardsville?
Per Capita income in Stanardsville is $46,498.
What is the Median Family Income in Stanardsville?
Median Family Income in Stanardsville is $63,750.
What is the Median Household income in Stanardsville?
Median Household Income in Stanardsville is $60,833.
What is Income or Wage Gap in Stanardsville?
Income or Wage Gap in Stanardsville is 34.1%.
Women in Stanardsville earn 65.9 cents for every dollar earned by a man.
What is Inequality or Gini Index in Stanardsville?
Inequality or Gini Index in Stanardsville is 0.56.
What is the Total Population of Stanardsville?
Total Population of Stanardsville is 492.
What is the Total Male Population of Stanardsville?
Total Male Population of Stanardsville is 263.
What is the Total Female Population of Stanardsville?
Total Female Population of Stanardsville is 229.
What is the Ratio of Males per 100 Females in Stanardsville?
There are 114.85 Males per 100 Females in Stanardsville.
What is the Ratio of Females per 100 Males in Stanardsville?
There are 87.07 Females per 100 Males in Stanardsville.
What is the Median Population Age in Stanardsville?
Median Population Age in Stanardsville is 42.2 Years.
What is the Average Family Size in Stanardsville
Average Family Size in Stanardsville is 2.7 People.
What is the Average Household Size in Stanardsville
Average Household Size in Stanardsville is 2.3 People.
How Large is the Labor Force in Stanardsville?
There are 248 People in the Labor Forcein in Stanardsville.
What is the Percentage of People in the Labor Force in Stanardsville?
63.9% of People are in the Labor Force in Stanardsville.
What is the Unemployment Rate in Stanardsville?
Unemployment Rate in Stanardsville is 6.5%.