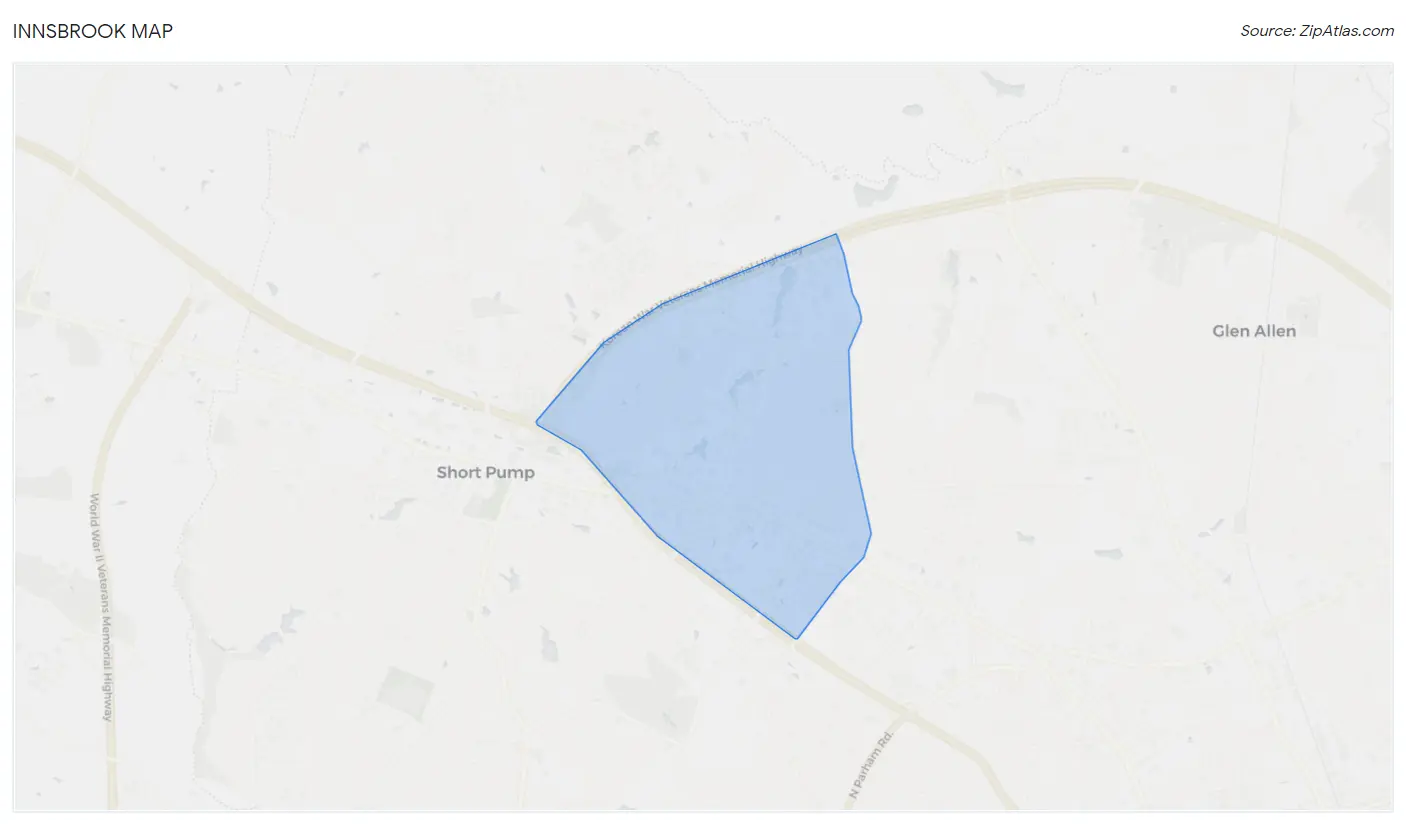
Innsbrook, VA Map & Demographics
Innsbrook Map
Innsbrook Overview
$54,111
PER CAPITA INCOME
$138,709
AVG FAMILY INCOME
$113,814
AVG HOUSEHOLD INCOME
28.9%
WAGE / INCOME GAP [ % ]
71.1¢/ $1
WAGE / INCOME GAP [ $ ]
0.44
INEQUALITY / GINI INDEX
8,699
TOTAL POPULATION
4,503
MALE POPULATION
4,196
FEMALE POPULATION
107.32
MALES / 100 FEMALES
93.18
FEMALES / 100 MALES
34.9
MEDIAN AGE
3.2
AVG FAMILY SIZE
2.6
AVG HOUSEHOLD SIZE
4,762
LABOR FORCE [ PEOPLE ]
72.8%
PERCENT IN LABOR FORCE
4.4%
UNEMPLOYMENT RATE
Income in Innsbrook
Income Overview in Innsbrook
Per Capita Income in Innsbrook is $54,111, while median incomes of families and households are $138,709 and $113,814 respectively.
| Characteristic | Number | Measure |
| Per Capita Income | 8,699 | $54,111 |
| Median Family Income | 2,323 | $138,709 |
| Mean Family Income | 2,323 | $156,583 |
| Median Household Income | 3,300 | $113,814 |
| Mean Household Income | 3,300 | $141,864 |
| Income Deficit | 2,323 | $0 |
| Wage / Income Gap (%) | 8,699 | 28.86% |
| Wage / Income Gap ($) | 8,699 | 71.14¢ per $1 |
| Gini / Inequality Index | 8,699 | 0.44 |
Earnings by Sex in Innsbrook
Average Earnings in Innsbrook are $65,800, $80,827 for men and $57,500 for women, a difference of 28.9%.
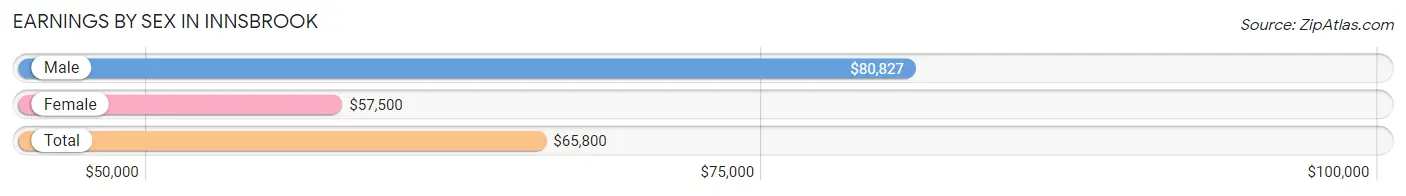
| Sex | Number | Average Earnings |
| Male | 2,375 (50.5%) | $80,827 |
| Female | 2,328 (49.5%) | $57,500 |
| Total | 4,703 (100.0%) | $65,800 |
Earnings by Sex by Income Bracket in Innsbrook
The most common earnings brackets in Innsbrook are $100,000+ for men (979 | 41.2%) and $100,000+ for women (555 | 23.8%).
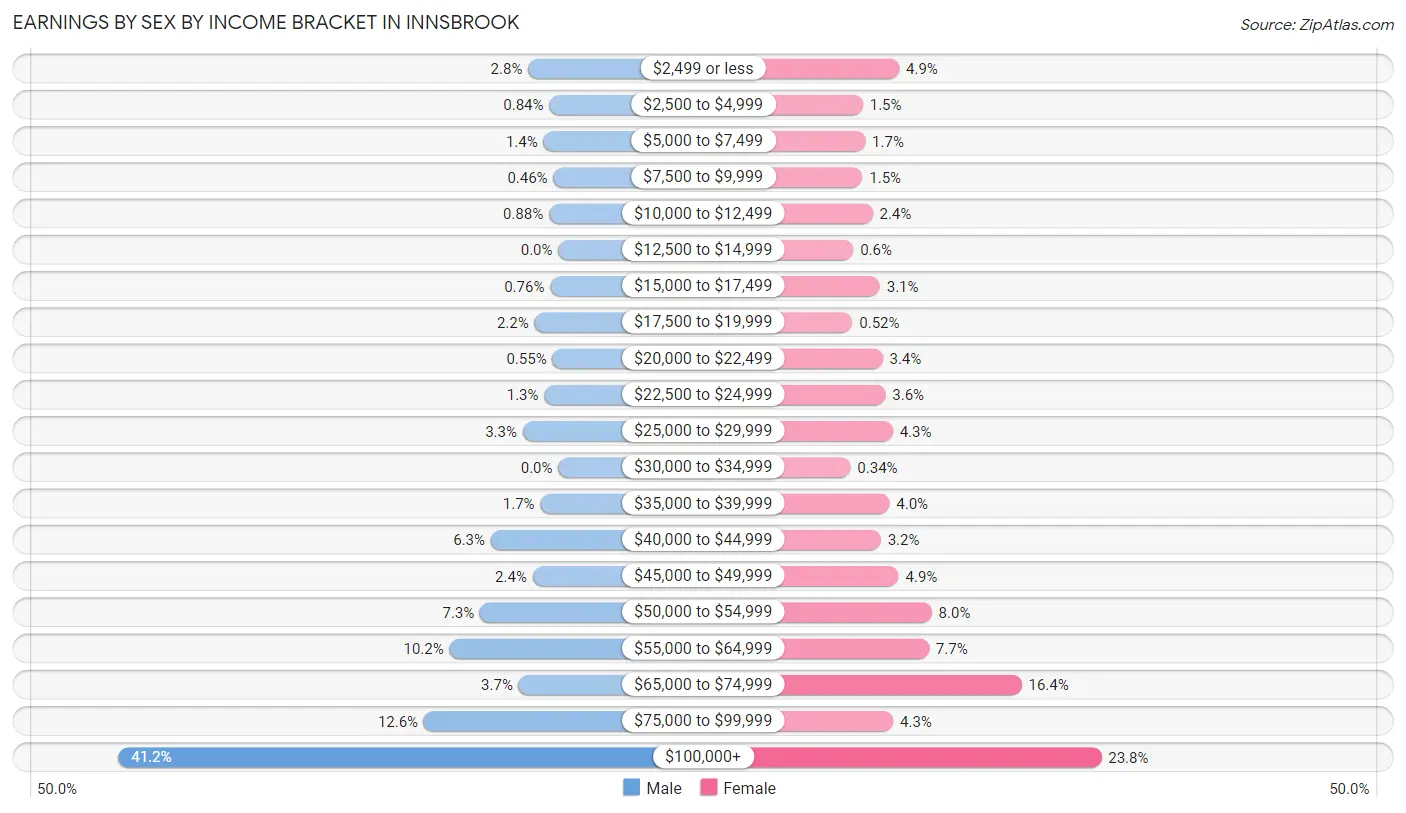
| Income | Male | Female |
| $2,499 or less | 67 (2.8%) | 114 (4.9%) |
| $2,500 to $4,999 | 20 (0.8%) | 35 (1.5%) |
| $5,000 to $7,499 | 33 (1.4%) | 40 (1.7%) |
| $7,500 to $9,999 | 11 (0.5%) | 34 (1.5%) |
| $10,000 to $12,499 | 21 (0.9%) | 56 (2.4%) |
| $12,500 to $14,999 | 0 (0.0%) | 14 (0.6%) |
| $15,000 to $17,499 | 18 (0.8%) | 72 (3.1%) |
| $17,500 to $19,999 | 53 (2.2%) | 12 (0.5%) |
| $20,000 to $22,499 | 13 (0.5%) | 78 (3.4%) |
| $22,500 to $24,999 | 31 (1.3%) | 84 (3.6%) |
| $25,000 to $29,999 | 79 (3.3%) | 100 (4.3%) |
| $30,000 to $34,999 | 0 (0.0%) | 8 (0.3%) |
| $35,000 to $39,999 | 40 (1.7%) | 93 (4.0%) |
| $40,000 to $44,999 | 150 (6.3%) | 74 (3.2%) |
| $45,000 to $49,999 | 57 (2.4%) | 113 (4.9%) |
| $50,000 to $54,999 | 174 (7.3%) | 185 (8.0%) |
| $55,000 to $64,999 | 242 (10.2%) | 179 (7.7%) |
| $65,000 to $74,999 | 88 (3.7%) | 381 (16.4%) |
| $75,000 to $99,999 | 299 (12.6%) | 101 (4.3%) |
| $100,000+ | 979 (41.2%) | 555 (23.8%) |
| Total | 2,375 (100.0%) | 2,328 (100.0%) |
Earnings by Sex by Educational Attainment in Innsbrook
Average earnings in Innsbrook are $88,458 for men and $64,861 for women, a difference of 26.7%. Men with an educational attainment of graduate degree enjoy the highest average annual earnings of $135,452, while those with high school diploma education earn the least with $51,225. Women with an educational attainment of bachelor's degree earn the most with the average annual earnings of $68,170, while those with high school diploma education have the smallest earnings of $27,885.
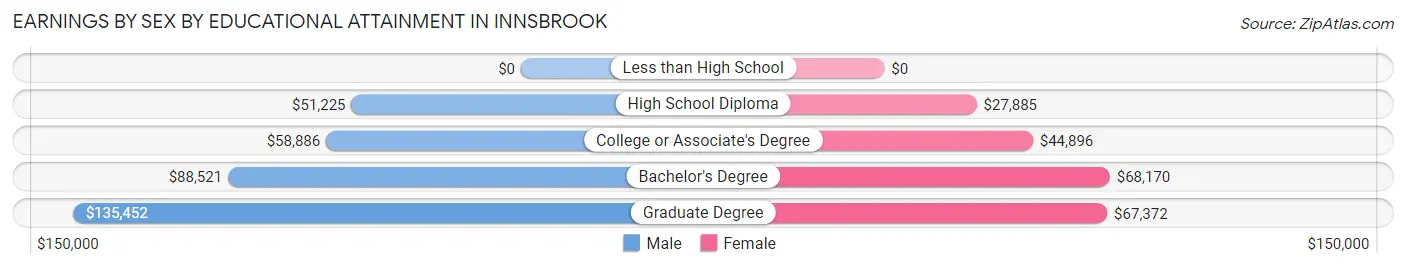
| Educational Attainment | Male Income | Female Income |
| Less than High School | - | - |
| High School Diploma | $51,225 | $27,885 |
| College or Associate's Degree | $58,886 | $44,896 |
| Bachelor's Degree | $88,521 | $68,170 |
| Graduate Degree | $135,452 | $67,372 |
| Total | $88,458 | $64,861 |
Family Income in Innsbrook
Family Income Brackets in Innsbrook
According to the Innsbrook family income data, there are 611 families falling into the $100,000 to $149,999 income range, which is the most common income bracket and makes up 26.3% of all families.
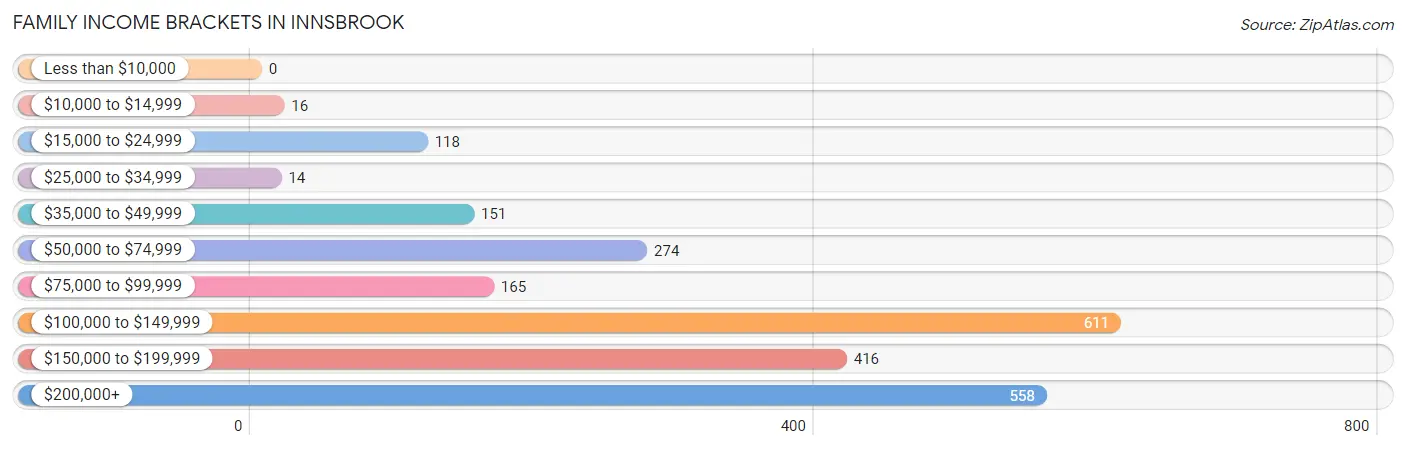
| Income Bracket | # Families | % Families |
| Less than $10,000 | 0 | 0.0% |
| $10,000 to $14,999 | 16 | 0.7% |
| $15,000 to $24,999 | 118 | 5.1% |
| $25,000 to $34,999 | 14 | 0.6% |
| $35,000 to $49,999 | 151 | 6.5% |
| $50,000 to $74,999 | 274 | 11.8% |
| $75,000 to $99,999 | 165 | 7.1% |
| $100,000 to $149,999 | 611 | 26.3% |
| $150,000 to $199,999 | 416 | 17.9% |
| $200,000+ | 558 | 24.0% |
Family Income by Famaliy Size in Innsbrook
6-person families (30 | 1.3%) account for the highest median family income in Innsbrook with $250,001 per family, while 2-person families (839 | 36.1%) have the highest median income of $52,316 per family member.
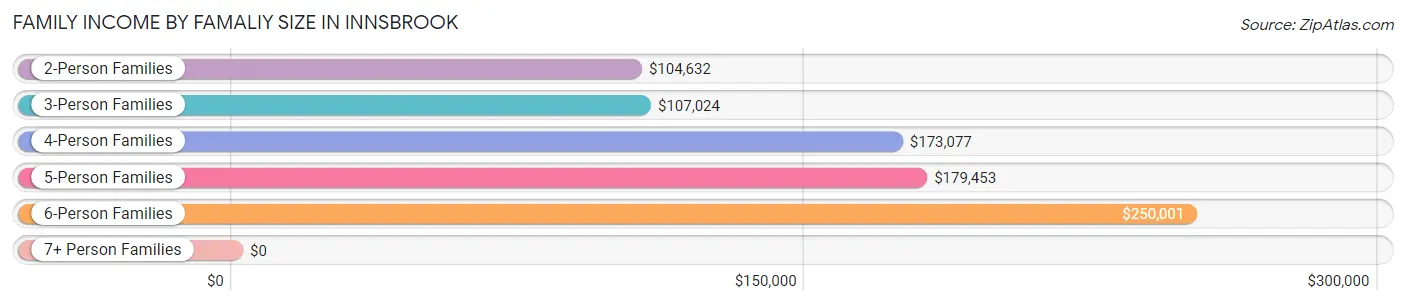
| Income Bracket | # Families | Median Income |
| 2-Person Families | 839 (36.1%) | $104,632 |
| 3-Person Families | 596 (25.7%) | $107,024 |
| 4-Person Families | 688 (29.6%) | $173,077 |
| 5-Person Families | 148 (6.4%) | $179,453 |
| 6-Person Families | 30 (1.3%) | $250,001 |
| 7+ Person Families | 22 (0.9%) | $0 |
| Total | 2,323 (100.0%) | $138,709 |
Family Income by Number of Earners in Innsbrook
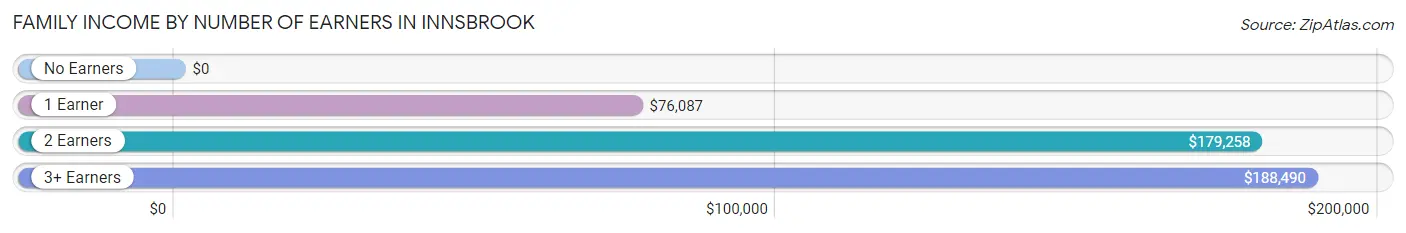
| Number of Earners | # Families | Median Income |
| No Earners | 221 (9.5%) | $0 |
| 1 Earner | 756 (32.5%) | $76,087 |
| 2 Earners | 1,151 (49.5%) | $179,258 |
| 3+ Earners | 195 (8.4%) | $188,490 |
| Total | 2,323 (100.0%) | $138,709 |
Household Income in Innsbrook
Household Income Brackets in Innsbrook
With 742 households falling in the category, the $100,000 to $149,999 income range is the most frequent in Innsbrook, accounting for 22.5% of all households. In contrast, only 46 households (1.4%) fall into the $10,000 to $14,999 income bracket, making it the least populous group.
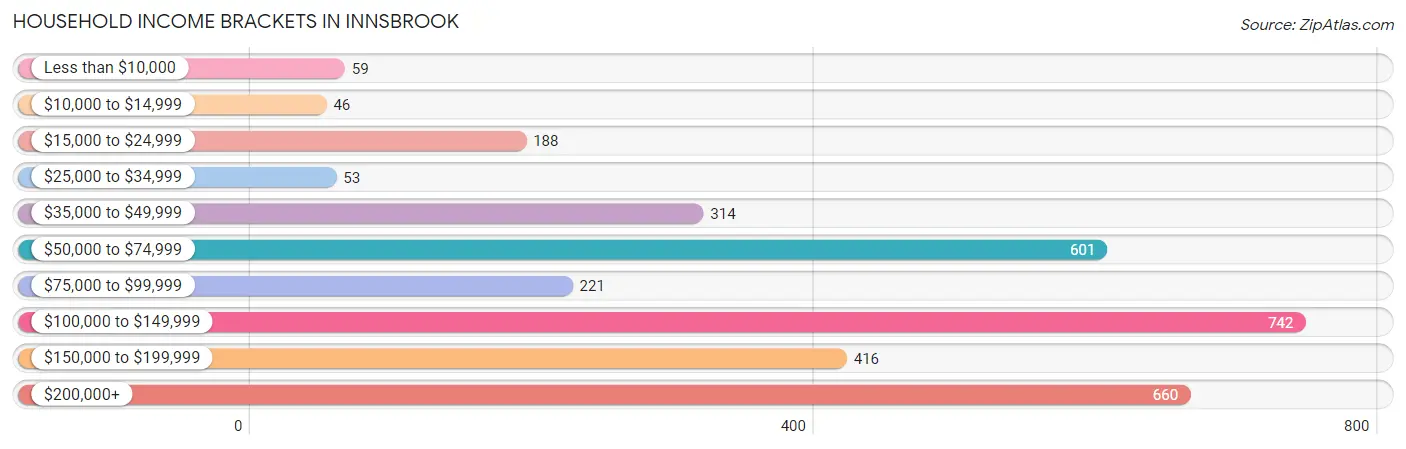
| Income Bracket | # Households | % Households |
| Less than $10,000 | 59 | 1.8% |
| $10,000 to $14,999 | 46 | 1.4% |
| $15,000 to $24,999 | 188 | 5.7% |
| $25,000 to $34,999 | 53 | 1.6% |
| $35,000 to $49,999 | 314 | 9.5% |
| $50,000 to $74,999 | 601 | 18.2% |
| $75,000 to $99,999 | 221 | 6.7% |
| $100,000 to $149,999 | 742 | 22.5% |
| $150,000 to $199,999 | 416 | 12.6% |
| $200,000+ | 660 | 20.0% |
Household Income by Householder Age in Innsbrook
The median household income in Innsbrook is $113,814, with the highest median household income of $127,672 found in the 45 to 64 years age bracket for the primary householder. A total of 1,094 households (33.2%) fall into this category. Meanwhile, the 65+ years age bracket for the primary householder has the lowest median household income of $63,964, with 517 households (15.7%) in this group.
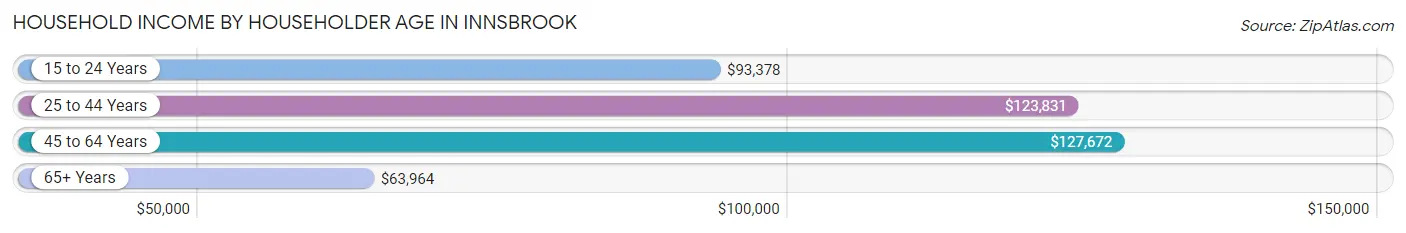
| Income Bracket | # Households | Median Income |
| 15 to 24 Years | 82 (2.5%) | $93,378 |
| 25 to 44 Years | 1,607 (48.7%) | $123,831 |
| 45 to 64 Years | 1,094 (33.2%) | $127,672 |
| 65+ Years | 517 (15.7%) | $63,964 |
| Total | 3,300 (100.0%) | $113,814 |
Poverty in Innsbrook
Income Below Poverty by Sex and Age in Innsbrook
With 4.1% poverty level for males and 7.9% for females among the residents of Innsbrook, 65 to 74 year old males and 12 to 14 year old females are the most vulnerable to poverty, with 41 males (16.1%) and 101 females (40.2%) in their respective age groups living below the poverty level.
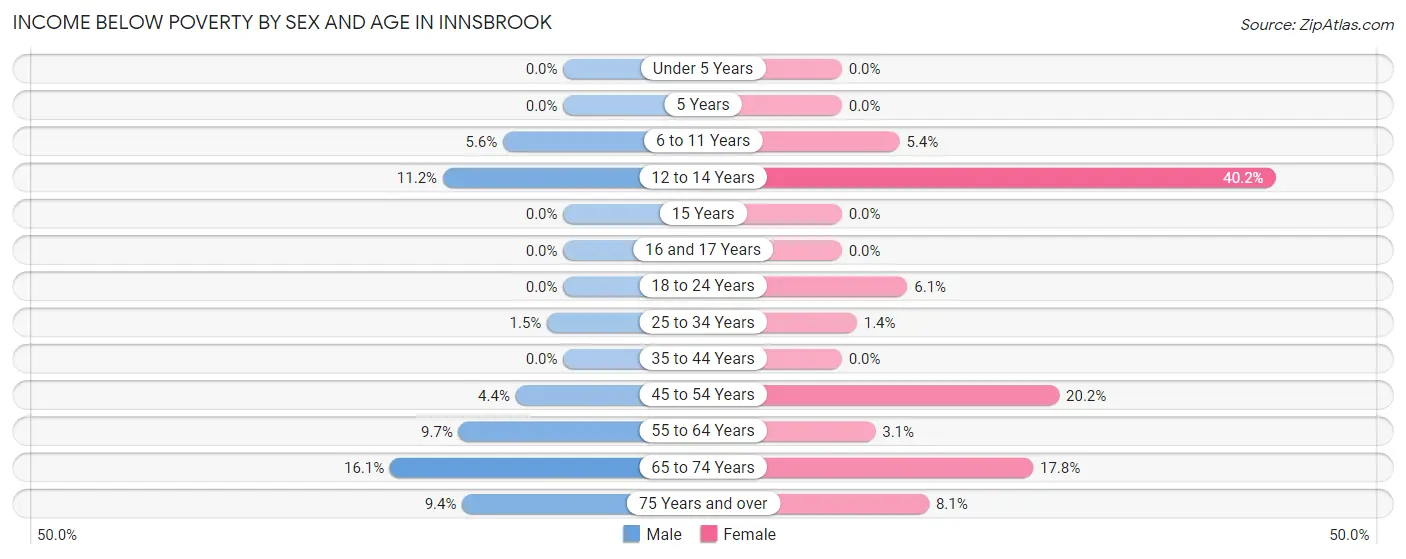
| Age Bracket | Male | Female |
| Under 5 Years | 0 (0.0%) | 0 (0.0%) |
| 5 Years | 0 (0.0%) | 0 (0.0%) |
| 6 to 11 Years | 40 (5.6%) | 15 (5.4%) |
| 12 to 14 Years | 17 (11.2%) | 101 (40.2%) |
| 15 Years | 0 (0.0%) | 0 (0.0%) |
| 16 and 17 Years | 0 (0.0%) | 0 (0.0%) |
| 18 to 24 Years | 0 (0.0%) | 22 (6.1%) |
| 25 to 34 Years | 10 (1.5%) | 10 (1.4%) |
| 35 to 44 Years | 0 (0.0%) | 0 (0.0%) |
| 45 to 54 Years | 17 (4.4%) | 97 (20.2%) |
| 55 to 64 Years | 43 (9.7%) | 14 (3.1%) |
| 65 to 74 Years | 41 (16.1%) | 63 (17.7%) |
| 75 Years and over | 18 (9.4%) | 11 (8.1%) |
| Total | 186 (4.1%) | 333 (7.9%) |
Income Above Poverty by Sex and Age in Innsbrook
According to the poverty statistics in Innsbrook, males aged under 5 years and females aged under 5 years are the age groups that are most secure financially, with 100.0% of males and 100.0% of females in these age groups living above the poverty line.
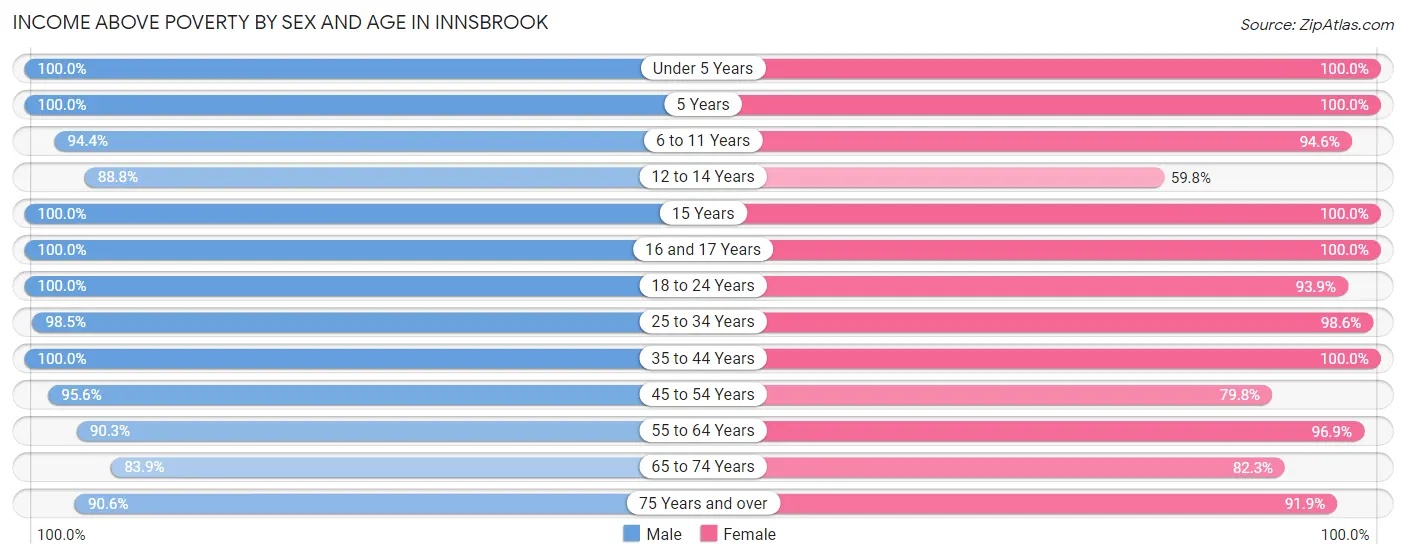
| Age Bracket | Male | Female |
| Under 5 Years | 258 (100.0%) | 141 (100.0%) |
| 5 Years | 211 (100.0%) | 57 (100.0%) |
| 6 to 11 Years | 676 (94.4%) | 265 (94.6%) |
| 12 to 14 Years | 135 (88.8%) | 150 (59.8%) |
| 15 Years | 64 (100.0%) | 28 (100.0%) |
| 16 and 17 Years | 125 (100.0%) | 79 (100.0%) |
| 18 to 24 Years | 266 (100.0%) | 340 (93.9%) |
| 25 to 34 Years | 656 (98.5%) | 711 (98.6%) |
| 35 to 44 Years | 770 (100.0%) | 855 (100.0%) |
| 45 to 54 Years | 368 (95.6%) | 384 (79.8%) |
| 55 to 64 Years | 400 (90.3%) | 436 (96.9%) |
| 65 to 74 Years | 214 (83.9%) | 292 (82.3%) |
| 75 Years and over | 174 (90.6%) | 125 (91.9%) |
| Total | 4,317 (95.9%) | 3,863 (92.1%) |
Income Below Poverty Among Married-Couple Families in Innsbrook
The poverty statistics for married-couple families in Innsbrook show that 3.0% or 58 of the total 1,917 families live below the poverty line. Families with 1 or 2 children have the highest poverty rate of 5.8%, comprising of 58 families. On the other hand, families with no children have the lowest poverty rate of 0.0%, which includes 0 families.
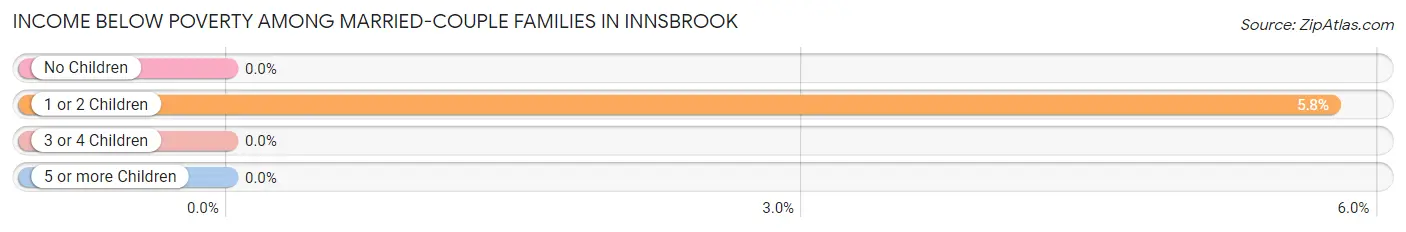
| Children | Above Poverty | Below Poverty |
| No Children | 807 (100.0%) | 0 (0.0%) |
| 1 or 2 Children | 949 (94.2%) | 58 (5.8%) |
| 3 or 4 Children | 103 (100.0%) | 0 (0.0%) |
| 5 or more Children | 0 (0.0%) | 0 (0.0%) |
| Total | 1,859 (97.0%) | 58 (3.0%) |
Income Below Poverty Among Single-Parent Households in Innsbrook
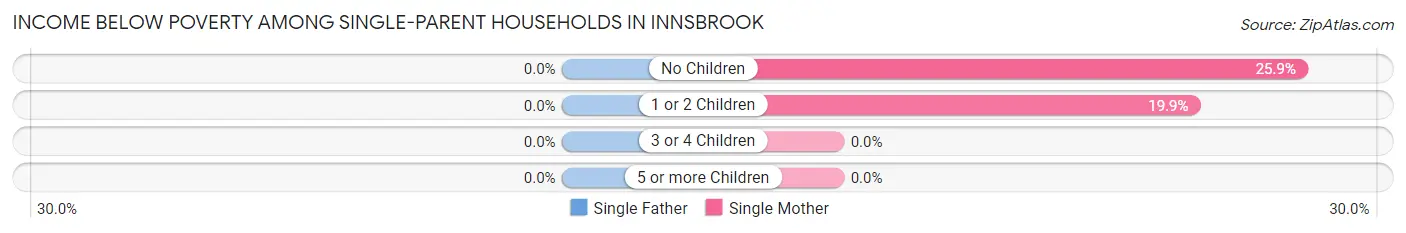
| Children | Single Father | Single Mother |
| No Children | 0 (0.0%) | 14 (25.9%) |
| 1 or 2 Children | 0 (0.0%) | 54 (19.9%) |
| 3 or 4 Children | 0 (0.0%) | 0 (0.0%) |
| 5 or more Children | 0 (0.0%) | 0 (0.0%) |
| Total | 0 (0.0%) | 68 (20.9%) |
Income Below Poverty Among Married-Couple vs Single-Parent Households in Innsbrook
The poverty data for Innsbrook shows that 58 of the married-couple family households (3.0%) and 68 of the single-parent households (16.8%) are living below the poverty level. Within the married-couple family households, those with 1 or 2 children have the highest poverty rate, with 58 households (5.8%) falling below the poverty line. Among the single-parent households, those with 1 or 2 children have the highest poverty rate, with 54 household (19.1%) living below poverty.
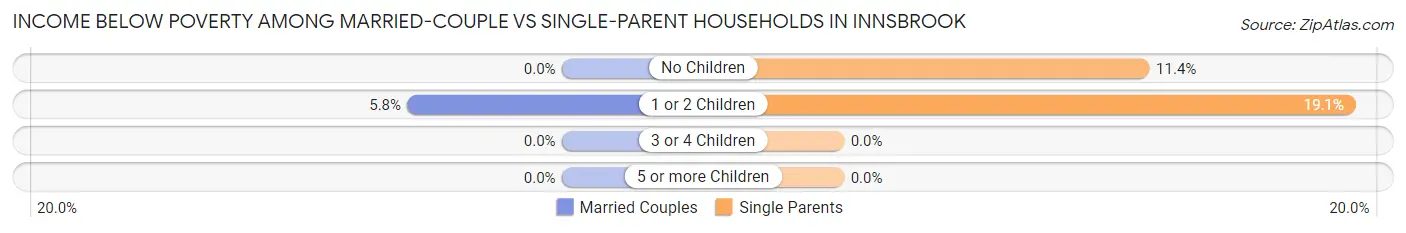
| Children | Married-Couple Families | Single-Parent Households |
| No Children | 0 (0.0%) | 14 (11.4%) |
| 1 or 2 Children | 58 (5.8%) | 54 (19.1%) |
| 3 or 4 Children | 0 (0.0%) | 0 (0.0%) |
| 5 or more Children | 0 (0.0%) | 0 (0.0%) |
| Total | 58 (3.0%) | 68 (16.8%) |
Race in Innsbrook
The most populous races in Innsbrook are White / Caucasian (4,844 | 55.7%), Asian (2,394 | 27.5%), and Black / African American (834 | 9.6%).
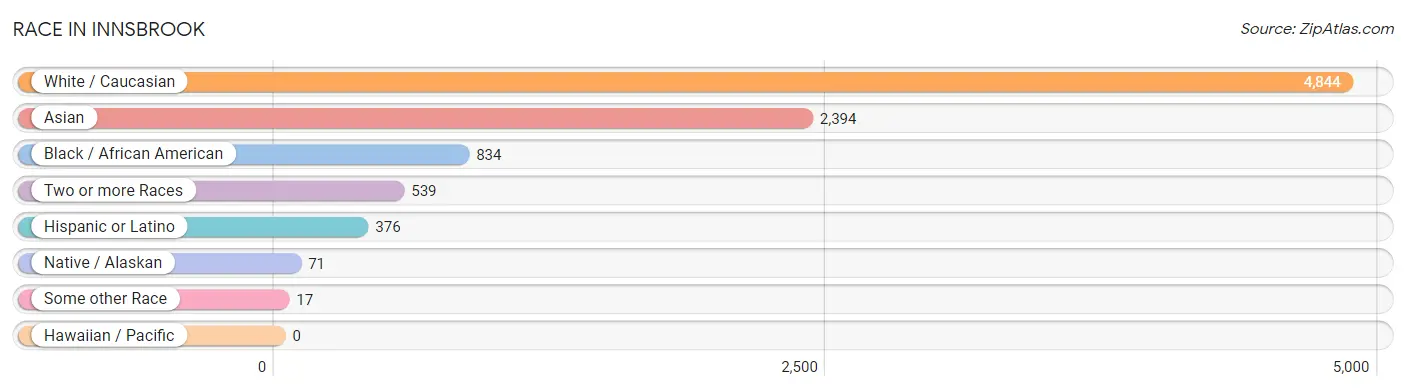
| Race | # Population | % Population |
| Asian | 2,394 | 27.5% |
| Black / African American | 834 | 9.6% |
| Hawaiian / Pacific | 0 | 0.0% |
| Hispanic or Latino | 376 | 4.3% |
| Native / Alaskan | 71 | 0.8% |
| White / Caucasian | 4,844 | 55.7% |
| Two or more Races | 539 | 6.2% |
| Some other Race | 17 | 0.2% |
| Total | 8,699 | 100.0% |
Ancestry in Innsbrook
The most populous ancestries reported in Innsbrook are Thai (1,438 | 16.5%), German (1,258 | 14.5%), Irish (1,120 | 12.9%), English (897 | 10.3%), and American (483 | 5.6%), together accounting for 59.7% of all Innsbrook residents.
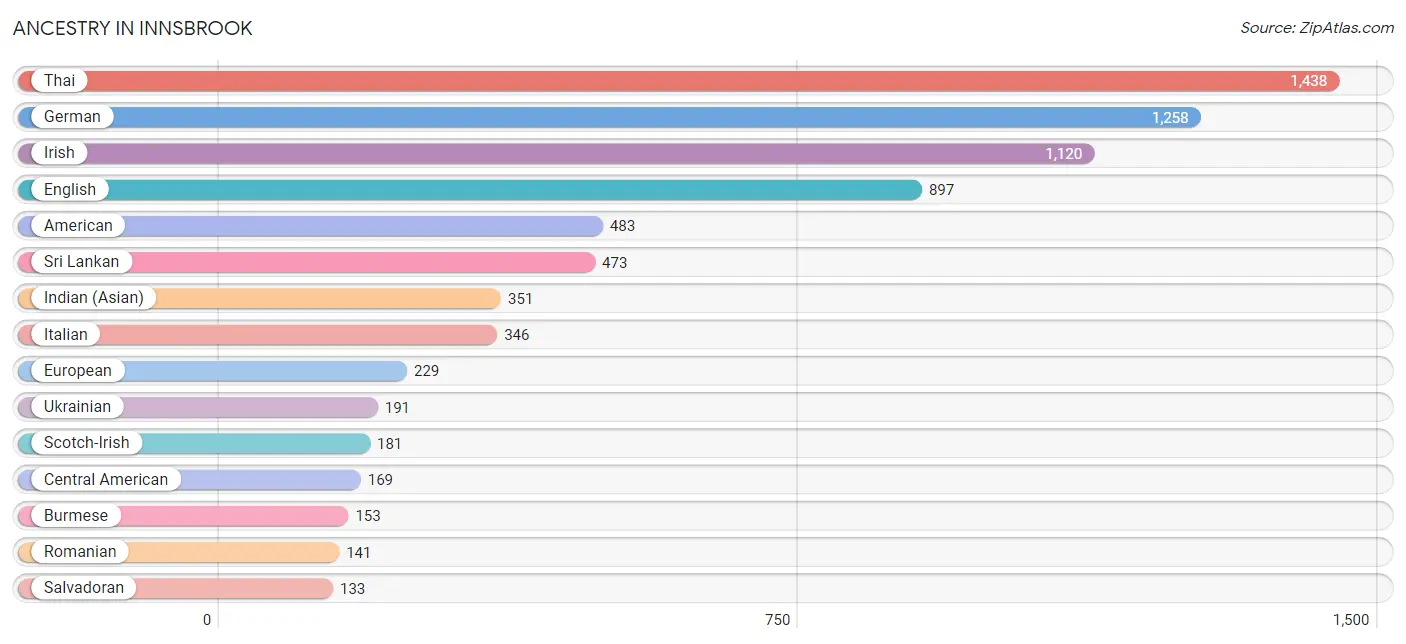
| Ancestry | # Population | % Population |
| American | 483 | 5.6% |
| Arab | 120 | 1.4% |
| Blackfeet | 17 | 0.2% |
| Burmese | 153 | 1.8% |
| Central American | 169 | 1.9% |
| Central American Indian | 71 | 0.8% |
| Colombian | 12 | 0.1% |
| Dutch | 61 | 0.7% |
| Eastern European | 74 | 0.9% |
| English | 897 | 10.3% |
| European | 229 | 2.6% |
| French | 41 | 0.5% |
| French Canadian | 26 | 0.3% |
| German | 1,258 | 14.5% |
| Greek | 88 | 1.0% |
| Honduran | 25 | 0.3% |
| Hungarian | 36 | 0.4% |
| Indian (Asian) | 351 | 4.0% |
| Iranian | 43 | 0.5% |
| Irish | 1,120 | 12.9% |
| Italian | 346 | 4.0% |
| Jamaican | 29 | 0.3% |
| Japanese | 73 | 0.8% |
| Korean | 117 | 1.3% |
| Lebanese | 120 | 1.4% |
| Lithuanian | 44 | 0.5% |
| Mexican | 88 | 1.0% |
| Nigerian | 13 | 0.2% |
| Northern European | 37 | 0.4% |
| Norwegian | 100 | 1.1% |
| Panamanian | 11 | 0.1% |
| Peruvian | 8 | 0.1% |
| Polish | 89 | 1.0% |
| Portuguese | 15 | 0.2% |
| Puerto Rican | 99 | 1.1% |
| Romanian | 141 | 1.6% |
| Russian | 69 | 0.8% |
| Salvadoran | 133 | 1.5% |
| Scotch-Irish | 181 | 2.1% |
| Scottish | 117 | 1.3% |
| Slovak | 41 | 0.5% |
| Slovene | 35 | 0.4% |
| South American | 20 | 0.2% |
| Sri Lankan | 473 | 5.4% |
| Subsaharan African | 13 | 0.2% |
| Swedish | 27 | 0.3% |
| Swiss | 14 | 0.2% |
| Thai | 1,438 | 16.5% |
| Turkish | 17 | 0.2% |
| Ukrainian | 191 | 2.2% |
| Welsh | 47 | 0.5% | View All 51 Rows |
Immigrants in Innsbrook
The most numerous immigrant groups reported in Innsbrook came from Asia (1,688 | 19.4%), South Central Asia (1,222 | 14.1%), India (1,120 | 12.9%), South Eastern Asia (246 | 2.8%), and Vietnam (179 | 2.1%), together accounting for 51.2% of all Innsbrook residents.
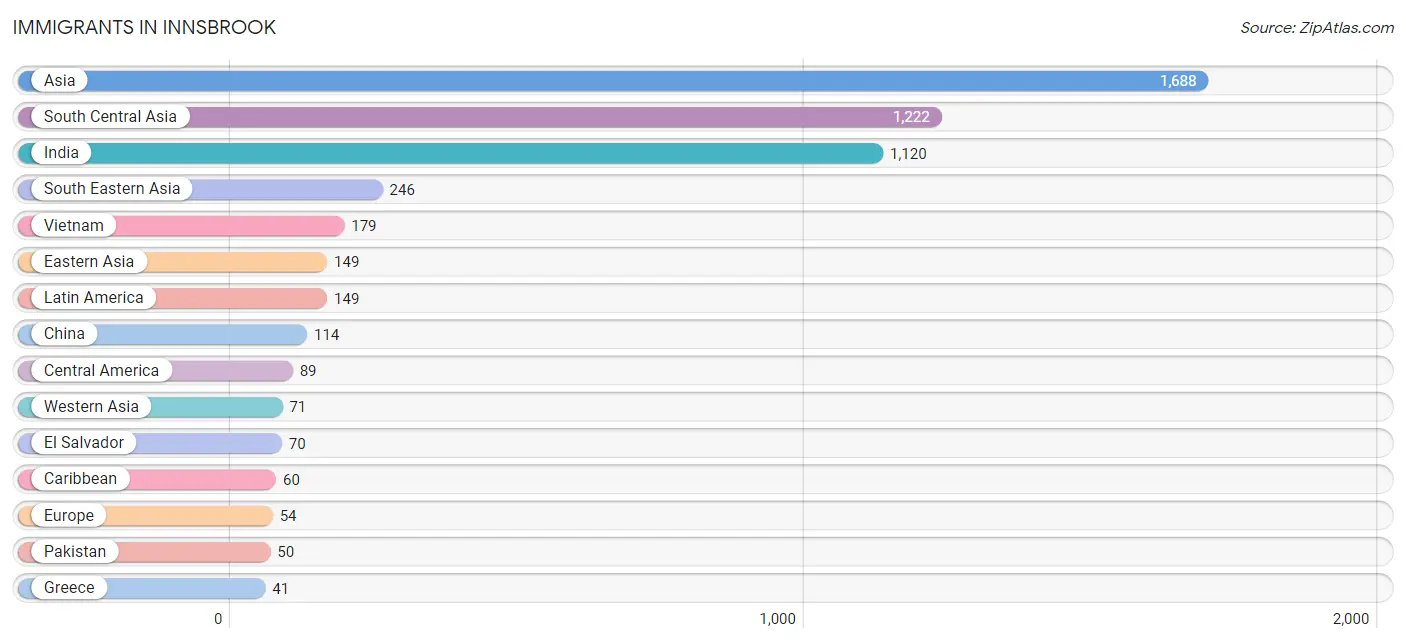
| Immigration Origin | # Population | % Population |
| Africa | 8 | 0.1% |
| Asia | 1,688 | 19.4% |
| Cambodia | 39 | 0.4% |
| Canada | 22 | 0.3% |
| Caribbean | 60 | 0.7% |
| Central America | 89 | 1.0% |
| China | 114 | 1.3% |
| Eastern Asia | 149 | 1.7% |
| Eastern Europe | 13 | 0.2% |
| Egypt | 8 | 0.1% |
| El Salvador | 70 | 0.8% |
| Europe | 54 | 0.6% |
| Greece | 41 | 0.5% |
| India | 1,120 | 12.9% |
| Iran | 13 | 0.2% |
| Jamaica | 29 | 0.3% |
| Korea | 35 | 0.4% |
| Latin America | 149 | 1.7% |
| Lebanon | 32 | 0.4% |
| Nepal | 39 | 0.4% |
| Nicaragua | 19 | 0.2% |
| Northern Africa | 8 | 0.1% |
| Pakistan | 50 | 0.6% |
| Saudi Arabia | 22 | 0.3% |
| South Central Asia | 1,222 | 14.1% |
| South Eastern Asia | 246 | 2.8% |
| Southern Europe | 41 | 0.5% |
| Taiwan | 37 | 0.4% |
| Trinidad and Tobago | 16 | 0.2% |
| Turkey | 17 | 0.2% |
| Vietnam | 179 | 2.1% |
| West Indies | 15 | 0.2% |
| Western Asia | 71 | 0.8% | View All 33 Rows |
Sex and Age in Innsbrook
Sex and Age in Innsbrook
The most populous age groups in Innsbrook are 5 to 9 Years (685 | 15.2%) for men and 35 to 39 Years (493 | 11.7%) for women.
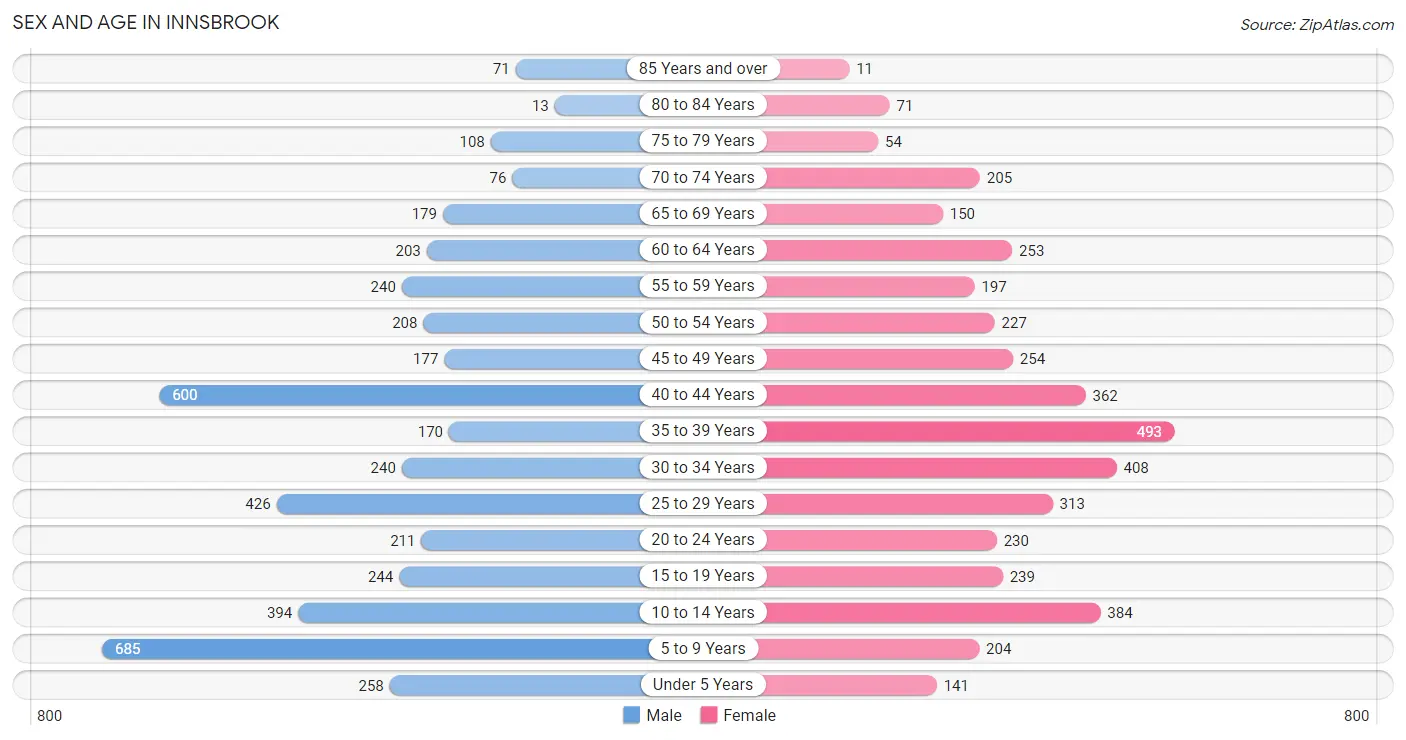
| Age Bracket | Male | Female |
| Under 5 Years | 258 (5.7%) | 141 (3.4%) |
| 5 to 9 Years | 685 (15.2%) | 204 (4.9%) |
| 10 to 14 Years | 394 (8.7%) | 384 (9.1%) |
| 15 to 19 Years | 244 (5.4%) | 239 (5.7%) |
| 20 to 24 Years | 211 (4.7%) | 230 (5.5%) |
| 25 to 29 Years | 426 (9.5%) | 313 (7.5%) |
| 30 to 34 Years | 240 (5.3%) | 408 (9.7%) |
| 35 to 39 Years | 170 (3.8%) | 493 (11.7%) |
| 40 to 44 Years | 600 (13.3%) | 362 (8.6%) |
| 45 to 49 Years | 177 (3.9%) | 254 (6.0%) |
| 50 to 54 Years | 208 (4.6%) | 227 (5.4%) |
| 55 to 59 Years | 240 (5.3%) | 197 (4.7%) |
| 60 to 64 Years | 203 (4.5%) | 253 (6.0%) |
| 65 to 69 Years | 179 (4.0%) | 150 (3.6%) |
| 70 to 74 Years | 76 (1.7%) | 205 (4.9%) |
| 75 to 79 Years | 108 (2.4%) | 54 (1.3%) |
| 80 to 84 Years | 13 (0.3%) | 71 (1.7%) |
| 85 Years and over | 71 (1.6%) | 11 (0.3%) |
| Total | 4,503 (100.0%) | 4,196 (100.0%) |
Families and Households in Innsbrook
Median Family Size in Innsbrook
The median family size in Innsbrook is 3.20 persons per family, with married-couple families (1,917 | 82.5%) accounting for the largest median family size of 3.32 persons per family. On the other hand, single female/mother families (325 | 14.0%) represent the smallest median family size with 2.48 persons per family.
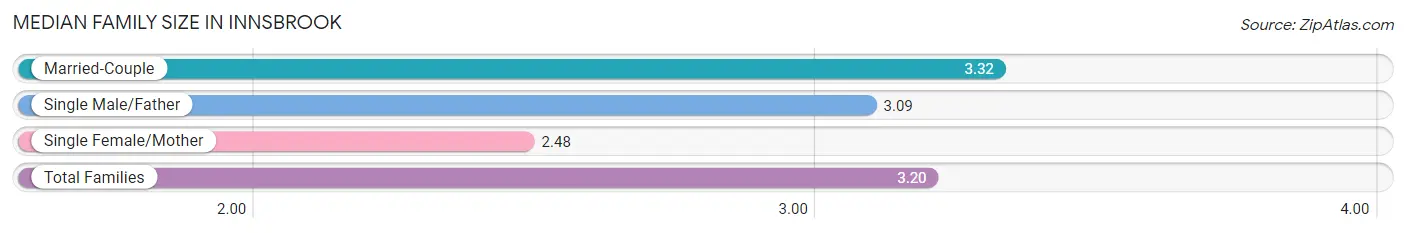
| Family Type | # Families | Family Size |
| Married-Couple | 1,917 (82.5%) | 3.32 |
| Single Male/Father | 81 (3.5%) | 3.09 |
| Single Female/Mother | 325 (14.0%) | 2.48 |
| Total Families | 2,323 (100.0%) | 3.20 |
Median Household Size in Innsbrook
The median household size in Innsbrook is 2.64 persons per household, with married-couple households (1,917 | 58.1%) accounting for the largest median household size of 3.34 persons per household. non-family households (977 | 29.6%) represent the smallest median household size with 1.28 persons per household.
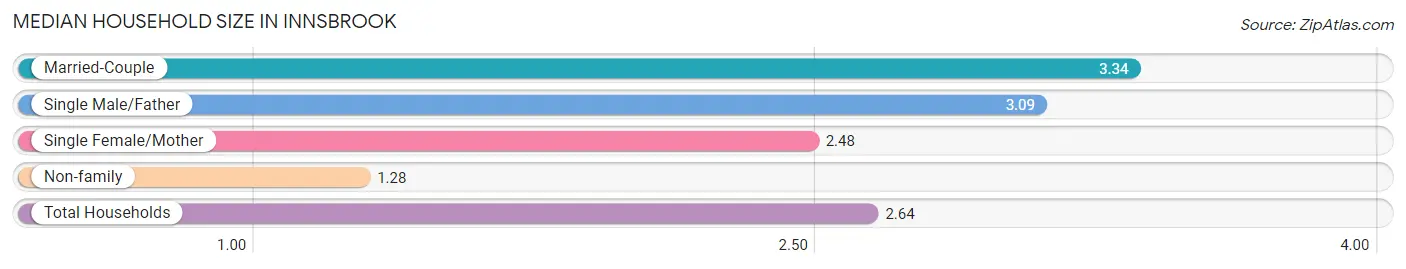
| Household Type | # Households | Household Size |
| Married-Couple | 1,917 (58.1%) | 3.34 |
| Single Male/Father | 81 (2.5%) | 3.09 |
| Single Female/Mother | 325 (9.9%) | 2.48 |
| Non-family | 977 (29.6%) | 1.28 |
| Total Households | 3,300 (100.0%) | 2.64 |
Household Size by Marriage Status in Innsbrook
Out of a total of 3,300 households in Innsbrook, 2,323 (70.4%) are family households, while 977 (29.6%) are nonfamily households. The most numerous type of family households are 2-person households, comprising 818, and the most common type of nonfamily households are 1-person households, comprising 791.
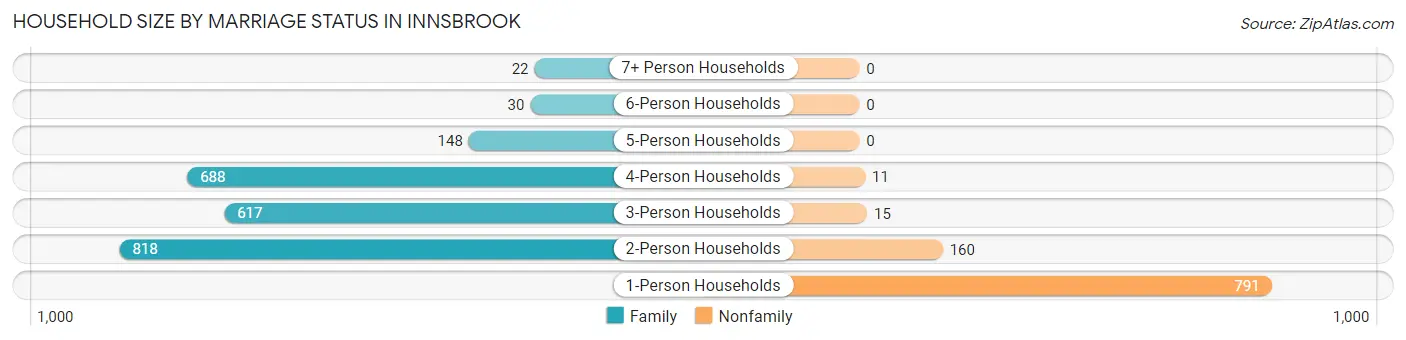
| Household Size | Family Households | Nonfamily Households |
| 1-Person Households | - | 791 (24.0%) |
| 2-Person Households | 818 (24.8%) | 160 (4.9%) |
| 3-Person Households | 617 (18.7%) | 15 (0.4%) |
| 4-Person Households | 688 (20.8%) | 11 (0.3%) |
| 5-Person Households | 148 (4.5%) | 0 (0.0%) |
| 6-Person Households | 30 (0.9%) | 0 (0.0%) |
| 7+ Person Households | 22 (0.7%) | 0 (0.0%) |
| Total | 2,323 (70.4%) | 977 (29.6%) |
Female Fertility in Innsbrook
Fertility by Age in Innsbrook
Average fertility rate in Innsbrook is 34.0 births per 1,000 women. Women in the age bracket of 20 to 34 years have the highest fertility rate with 65.0 births per 1,000 women. Women in the age bracket of 20 to 34 years acount for 79.5% of all women with births.
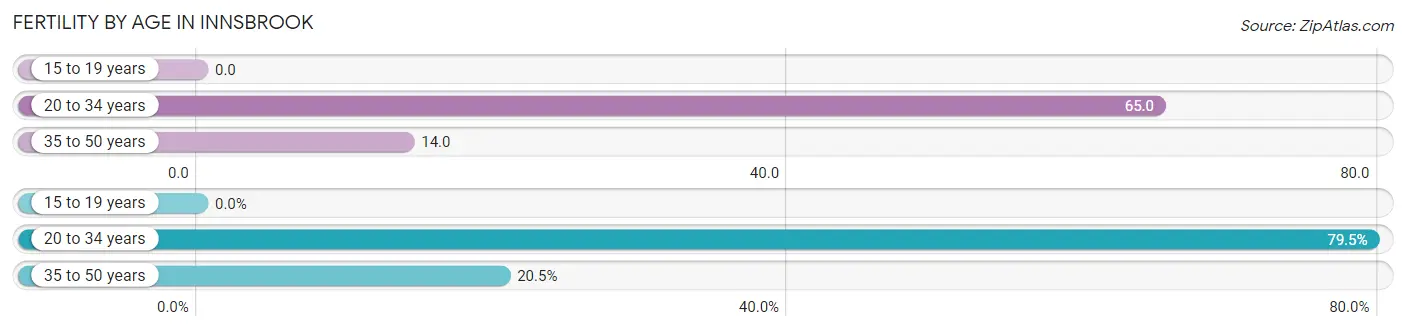
| Age Bracket | Women with Births | Births / 1,000 Women |
| 15 to 19 years | 0 (0.0%) | 0.0 |
| 20 to 34 years | 62 (79.5%) | 65.0 |
| 35 to 50 years | 16 (20.5%) | 14.0 |
| Total | 78 (100.0%) | 34.0 |
Fertility by Age by Marriage Status in Innsbrook
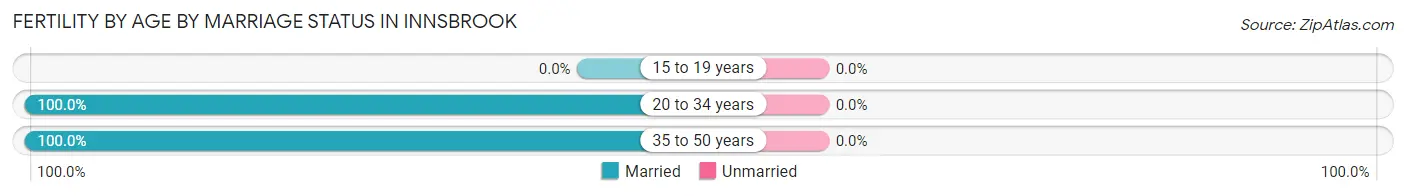
| Age Bracket | Married | Unmarried |
| 15 to 19 years | 0 (0.0%) | 0 (0.0%) |
| 20 to 34 years | 62 (100.0%) | 0 (0.0%) |
| 35 to 50 years | 16 (100.0%) | 0 (0.0%) |
| Total | 78 (100.0%) | 0 (0.0%) |
Fertility by Education in Innsbrook
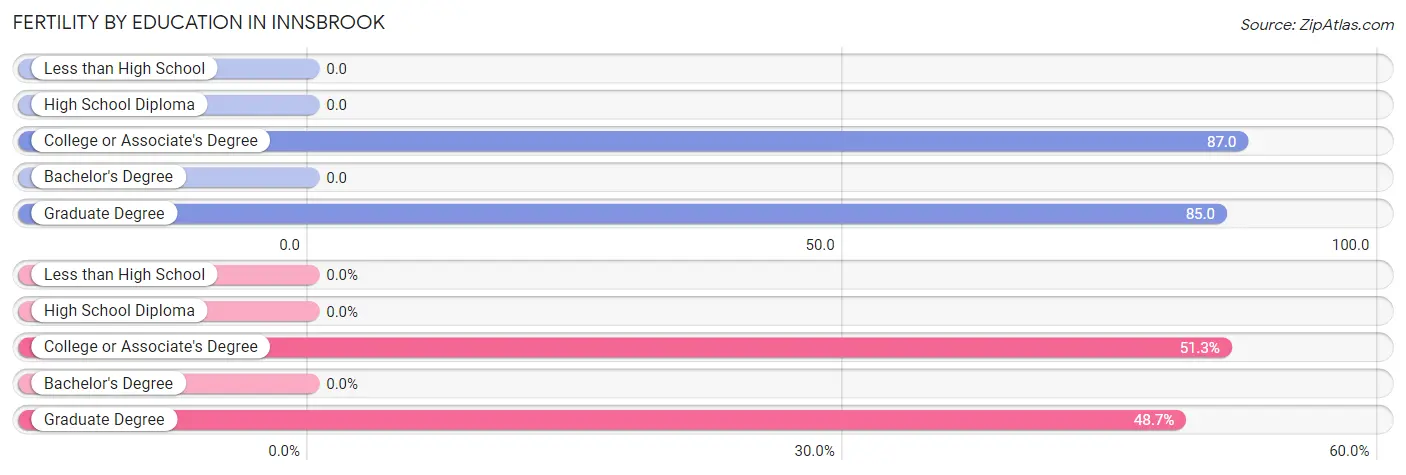
| Educational Attainment | Women with Births | Births / 1,000 Women |
| Less than High School | 0 (0.0%) | 0.0 |
| High School Diploma | 0 (0.0%) | 0.0 |
| College or Associate's Degree | 40 (51.3%) | 87.0 |
| Bachelor's Degree | 0 (0.0%) | 0.0 |
| Graduate Degree | 38 (48.7%) | 85.0 |
| Total | 78 (100.0%) | 34.0 |
Fertility by Education by Marriage Status in Innsbrook
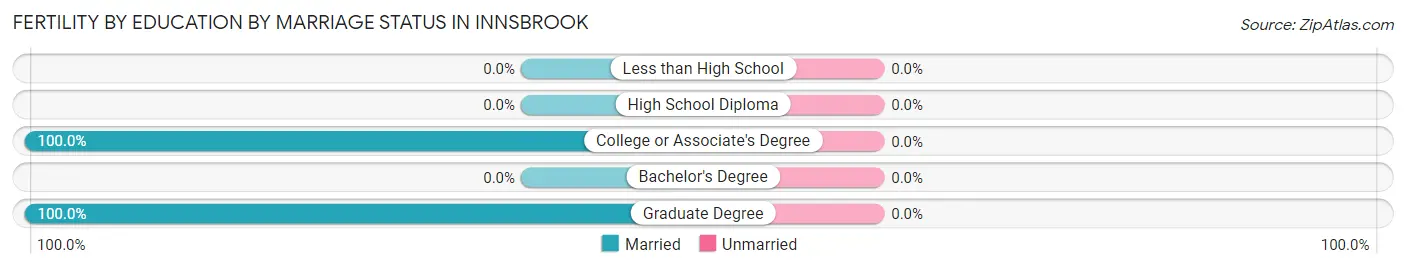
| Educational Attainment | Married | Unmarried |
| Less than High School | 0 (0.0%) | 0 (0.0%) |
| High School Diploma | 0 (0.0%) | 0 (0.0%) |
| College or Associate's Degree | 40 (100.0%) | 0 (0.0%) |
| Bachelor's Degree | 0 (0.0%) | 0 (0.0%) |
| Graduate Degree | 38 (100.0%) | 0 (0.0%) |
| Total | 78 (100.0%) | 0 (0.0%) |
Employment Characteristics in Innsbrook
Employment by Class of Employer in Innsbrook
Among the 4,479 employed individuals in Innsbrook, private company employees (3,511 | 78.4%), not-for-profit organizations (316 | 7.1%), and state government employees (235 | 5.2%) make up the most common classes of employment.
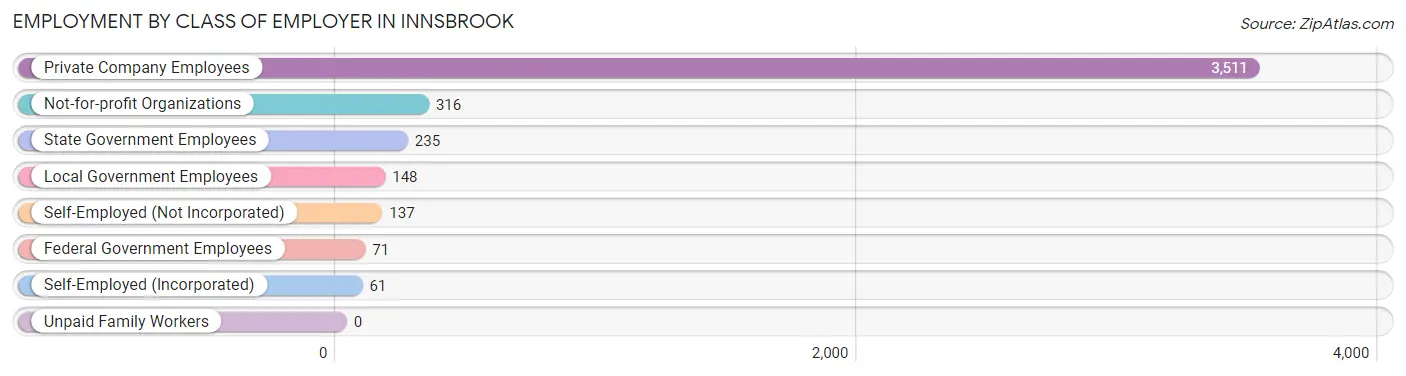
| Employer Class | # Employees | % Employees |
| Private Company Employees | 3,511 | 78.4% |
| Self-Employed (Incorporated) | 61 | 1.4% |
| Self-Employed (Not Incorporated) | 137 | 3.1% |
| Not-for-profit Organizations | 316 | 7.1% |
| Local Government Employees | 148 | 3.3% |
| State Government Employees | 235 | 5.2% |
| Federal Government Employees | 71 | 1.6% |
| Unpaid Family Workers | 0 | 0.0% |
| Total | 4,479 | 100.0% |
Employment Status by Age in Innsbrook
According to the labor force statistics for Innsbrook, out of the total population over 16 years of age (6,541), 72.8% or 4,762 individuals are in the labor force, with 4.4% or 210 of them unemployed. The age group with the highest labor force participation rate is 25 to 29 years, with 100.0% or 739 individuals in the labor force. Within the labor force, the 16 to 19 years age range has the highest percentage of unemployed individuals, with 28.4% or 31 of them being unemployed.
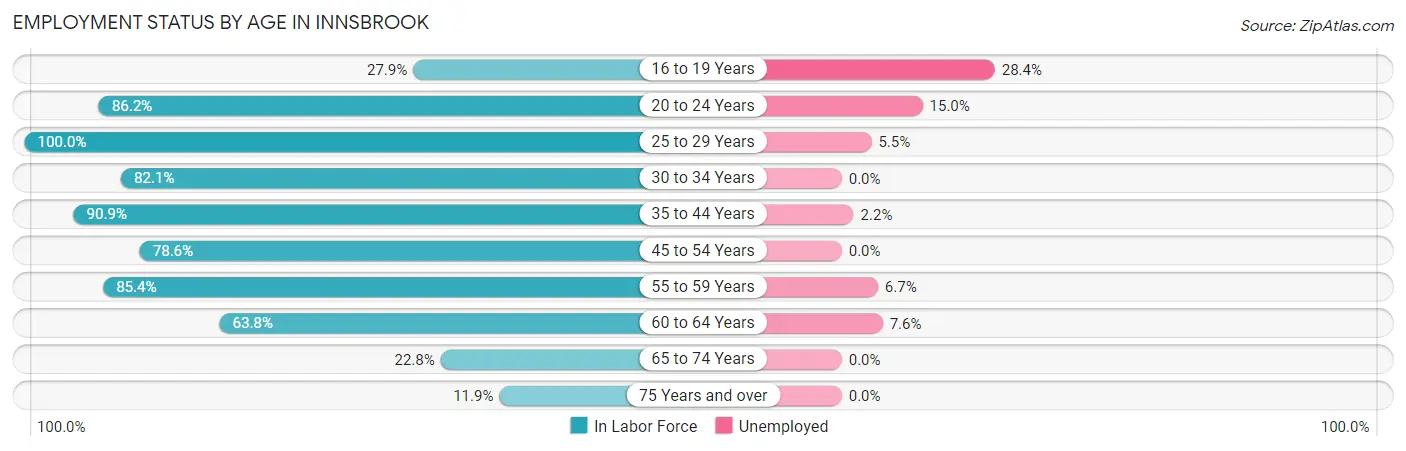
| Age Bracket | In Labor Force | Unemployed |
| 16 to 19 Years | 109 (27.9%) | 31 (28.4%) |
| 20 to 24 Years | 380 (86.2%) | 57 (15.0%) |
| 25 to 29 Years | 739 (100.0%) | 41 (5.5%) |
| 30 to 34 Years | 532 (82.1%) | 0 (0.0%) |
| 35 to 44 Years | 1,477 (90.9%) | 32 (2.2%) |
| 45 to 54 Years | 681 (78.6%) | 0 (0.0%) |
| 55 to 59 Years | 373 (85.4%) | 25 (6.7%) |
| 60 to 64 Years | 291 (63.8%) | 22 (7.6%) |
| 65 to 74 Years | 139 (22.8%) | 0 (0.0%) |
| 75 Years and over | 39 (11.9%) | 0 (0.0%) |
| Total | 4,762 (72.8%) | 210 (4.4%) |
Employment Status by Educational Attainment in Innsbrook
According to labor force statistics for Innsbrook, 85.8% of individuals (4,094) out of the total population between 25 and 64 years of age (4,771) are in the labor force, with 2.9% or 119 of them being unemployed. The group with the highest labor force participation rate are those with the educational attainment of less than high school, with 100.0% or 101 individuals in the labor force. Within the labor force, individuals with less than high school education have the highest percentage of unemployment, with 24.8% or 25 of them being unemployed.
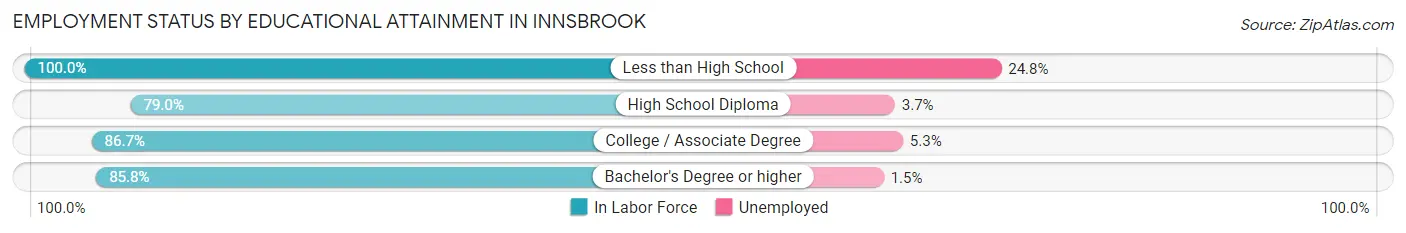
| Educational Attainment | In Labor Force | Unemployed |
| Less than High School | 101 (100.0%) | 25 (24.8%) |
| High School Diploma | 256 (79.0%) | 12 (3.7%) |
| College / Associate Degree | 754 (86.7%) | 46 (5.3%) |
| Bachelor's Degree or higher | 2,982 (85.8%) | 52 (1.5%) |
| Total | 4,094 (85.8%) | 138 (2.9%) |
Employment Occupations by Sex in Innsbrook
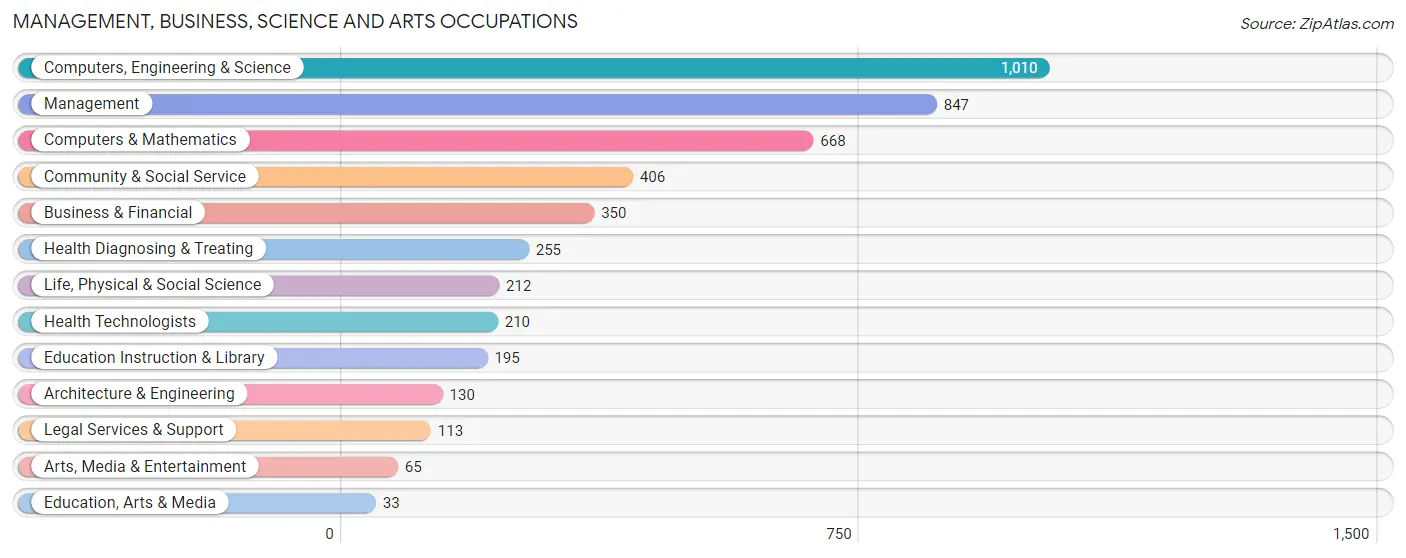
Management, Business, Science and Arts Occupations
The most common Management, Business, Science and Arts occupations in Innsbrook are Computers, Engineering & Science (1,010 | 22.2%), Management (847 | 18.6%), Computers & Mathematics (668 | 14.7%), Community & Social Service (406 | 8.9%), and Business & Financial (350 | 7.7%).
Management, Business, Science and Arts Occupations by Sex
Within the Management, Business, Science and Arts occupations in Innsbrook, the most male-oriented occupations are Architecture & Engineering (66.9%), Computers & Mathematics (63.9%), and Legal Services & Support (58.4%), while the most female-oriented occupations are Education, Arts & Media (100.0%), Arts, Media & Entertainment (100.0%), and Health Technologists (89.5%).
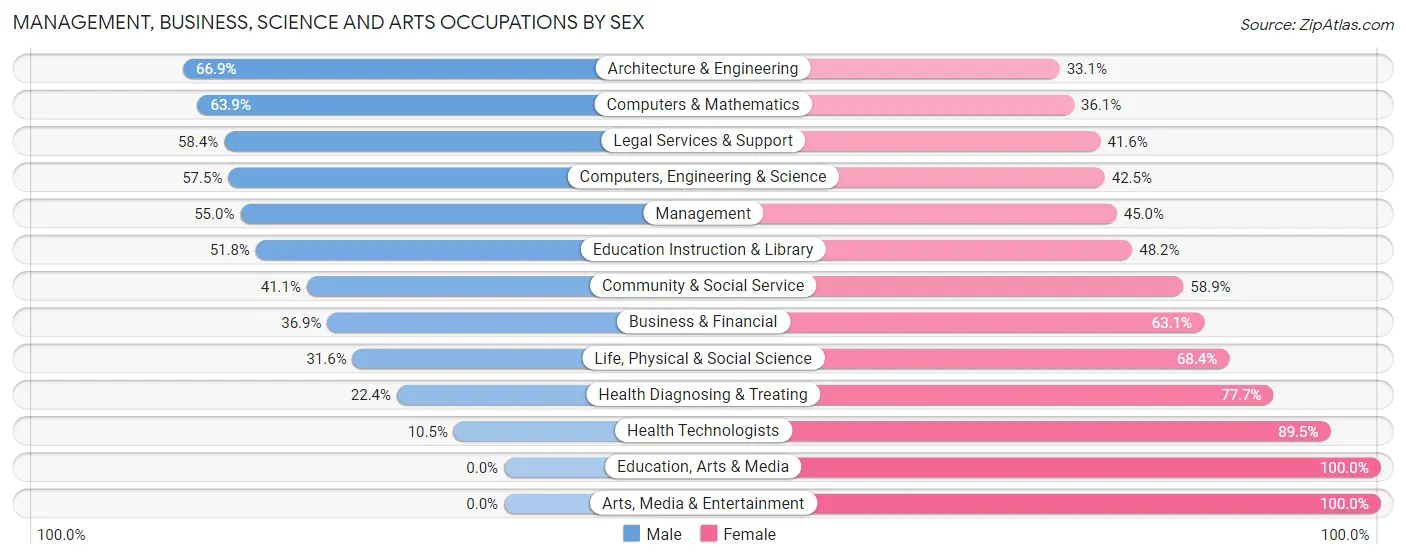
| Occupation | Male | Female |
| Management | 466 (55.0%) | 381 (45.0%) |
| Business & Financial | 129 (36.9%) | 221 (63.1%) |
| Computers, Engineering & Science | 581 (57.5%) | 429 (42.5%) |
| Computers & Mathematics | 427 (63.9%) | 241 (36.1%) |
| Architecture & Engineering | 87 (66.9%) | 43 (33.1%) |
| Life, Physical & Social Science | 67 (31.6%) | 145 (68.4%) |
| Community & Social Service | 167 (41.1%) | 239 (58.9%) |
| Education, Arts & Media | 0 (0.0%) | 33 (100.0%) |
| Legal Services & Support | 66 (58.4%) | 47 (41.6%) |
| Education Instruction & Library | 101 (51.8%) | 94 (48.2%) |
| Arts, Media & Entertainment | 0 (0.0%) | 65 (100.0%) |
| Health Diagnosing & Treating | 57 (22.4%) | 198 (77.6%) |
| Health Technologists | 22 (10.5%) | 188 (89.5%) |
| Total (Category) | 1,400 (48.8%) | 1,468 (51.2%) |
| Total (Overall) | 2,289 (50.4%) | 2,254 (49.6%) |
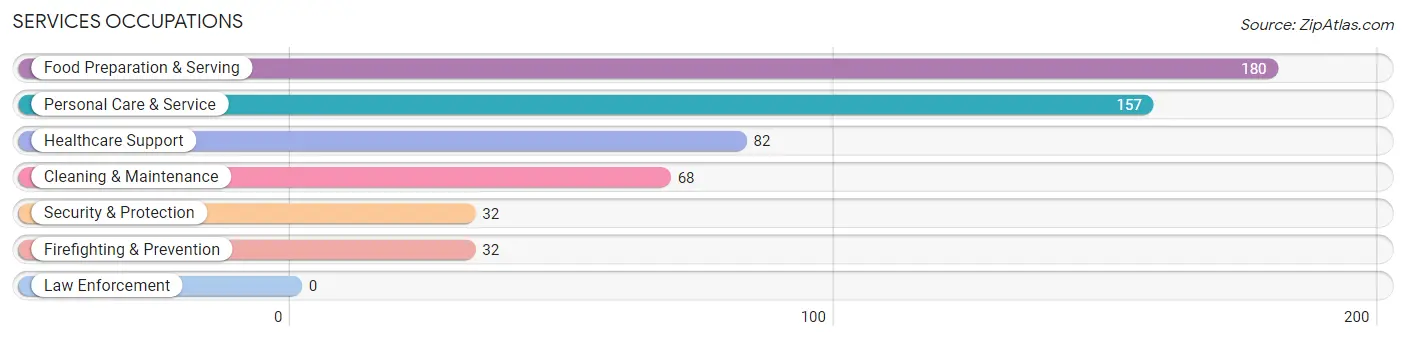
Services Occupations
The most common Services occupations in Innsbrook are Food Preparation & Serving (180 | 4.0%), Personal Care & Service (157 | 3.5%), Healthcare Support (82 | 1.8%), Cleaning & Maintenance (68 | 1.5%), and Security & Protection (32 | 0.7%).
Services Occupations by Sex
Within the Services occupations in Innsbrook, the most male-oriented occupations are Cleaning & Maintenance (64.7%), Security & Protection (56.2%), and Firefighting & Prevention (56.2%), while the most female-oriented occupations are Healthcare Support (84.2%), Personal Care & Service (73.3%), and Food Preparation & Serving (50.0%).
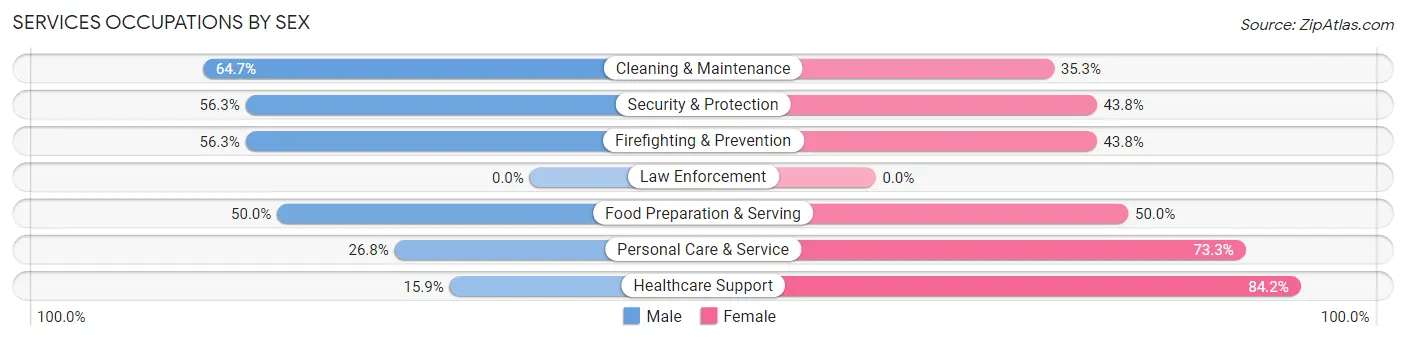
| Occupation | Male | Female |
| Healthcare Support | 13 (15.9%) | 69 (84.2%) |
| Security & Protection | 18 (56.2%) | 14 (43.8%) |
| Firefighting & Prevention | 18 (56.2%) | 14 (43.8%) |
| Law Enforcement | 0 (0.0%) | 0 (0.0%) |
| Food Preparation & Serving | 90 (50.0%) | 90 (50.0%) |
| Cleaning & Maintenance | 44 (64.7%) | 24 (35.3%) |
| Personal Care & Service | 42 (26.8%) | 115 (73.3%) |
| Total (Category) | 207 (39.9%) | 312 (60.1%) |
| Total (Overall) | 2,289 (50.4%) | 2,254 (49.6%) |
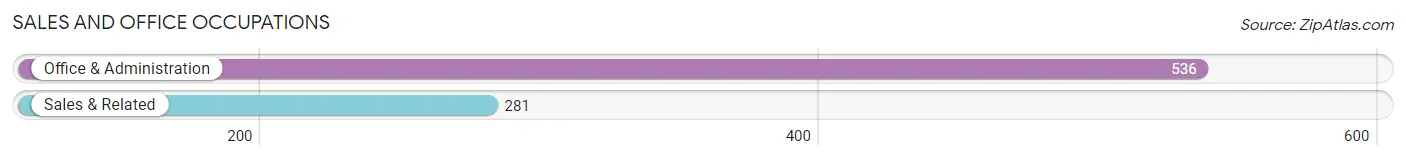
Sales and Office Occupations
The most common Sales and Office occupations in Innsbrook are Office & Administration (536 | 11.8%), and Sales & Related (281 | 6.2%).
Sales and Office Occupations by Sex
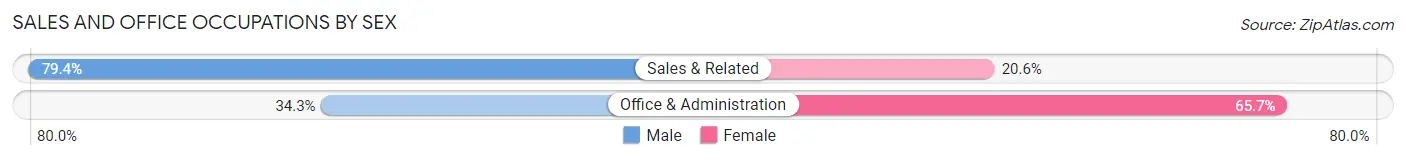
| Occupation | Male | Female |
| Sales & Related | 223 (79.4%) | 58 (20.6%) |
| Office & Administration | 184 (34.3%) | 352 (65.7%) |
| Total (Category) | 407 (49.8%) | 410 (50.2%) |
| Total (Overall) | 2,289 (50.4%) | 2,254 (49.6%) |
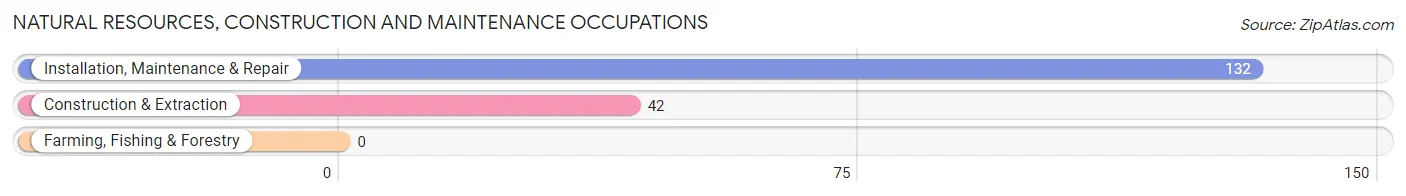
Natural Resources, Construction and Maintenance Occupations
The most common Natural Resources, Construction and Maintenance occupations in Innsbrook are Installation, Maintenance & Repair (132 | 2.9%), and Construction & Extraction (42 | 0.9%).
Natural Resources, Construction and Maintenance Occupations by Sex
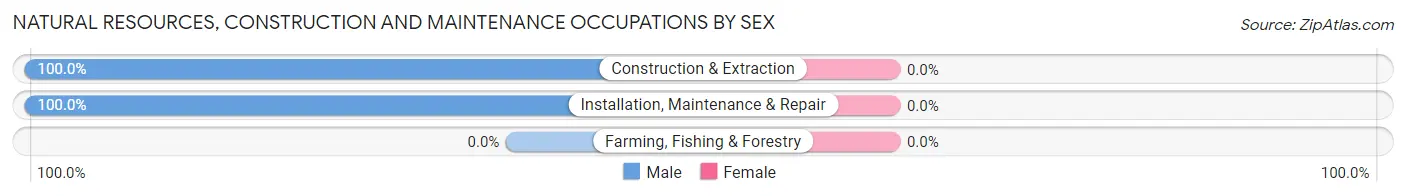
| Occupation | Male | Female |
| Farming, Fishing & Forestry | 0 (0.0%) | 0 (0.0%) |
| Construction & Extraction | 42 (100.0%) | 0 (0.0%) |
| Installation, Maintenance & Repair | 132 (100.0%) | 0 (0.0%) |
| Total (Category) | 174 (100.0%) | 0 (0.0%) |
| Total (Overall) | 2,289 (50.4%) | 2,254 (49.6%) |
Production, Transportation and Moving Occupations
The most common Production, Transportation and Moving occupations in Innsbrook are Material Moving (65 | 1.4%), Transportation (61 | 1.3%), and Production (39 | 0.9%).
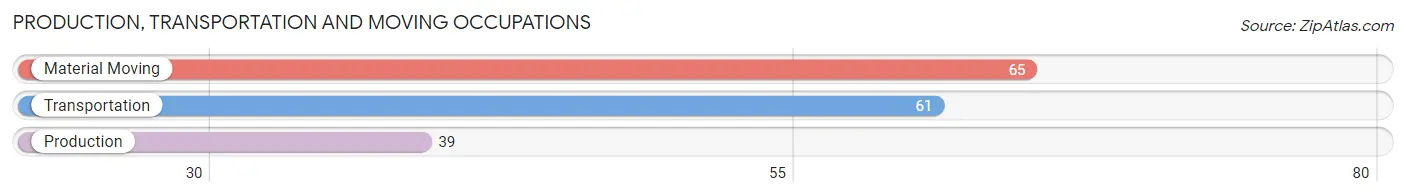
Production, Transportation and Moving Occupations by Sex
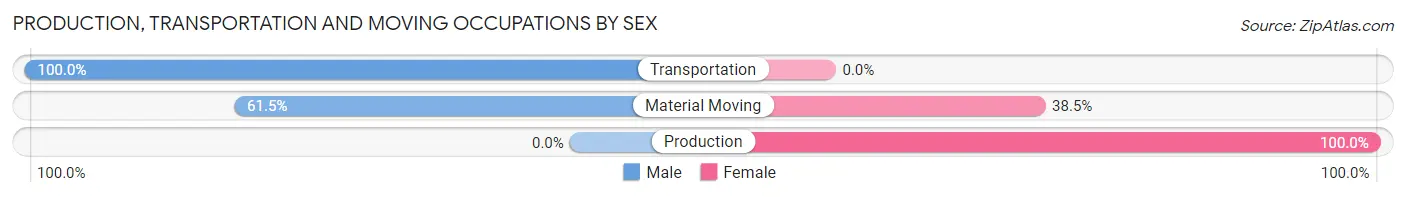
| Occupation | Male | Female |
| Production | 0 (0.0%) | 39 (100.0%) |
| Transportation | 61 (100.0%) | 0 (0.0%) |
| Material Moving | 40 (61.5%) | 25 (38.5%) |
| Total (Category) | 101 (61.2%) | 64 (38.8%) |
| Total (Overall) | 2,289 (50.4%) | 2,254 (49.6%) |
Employment Industries by Sex in Innsbrook
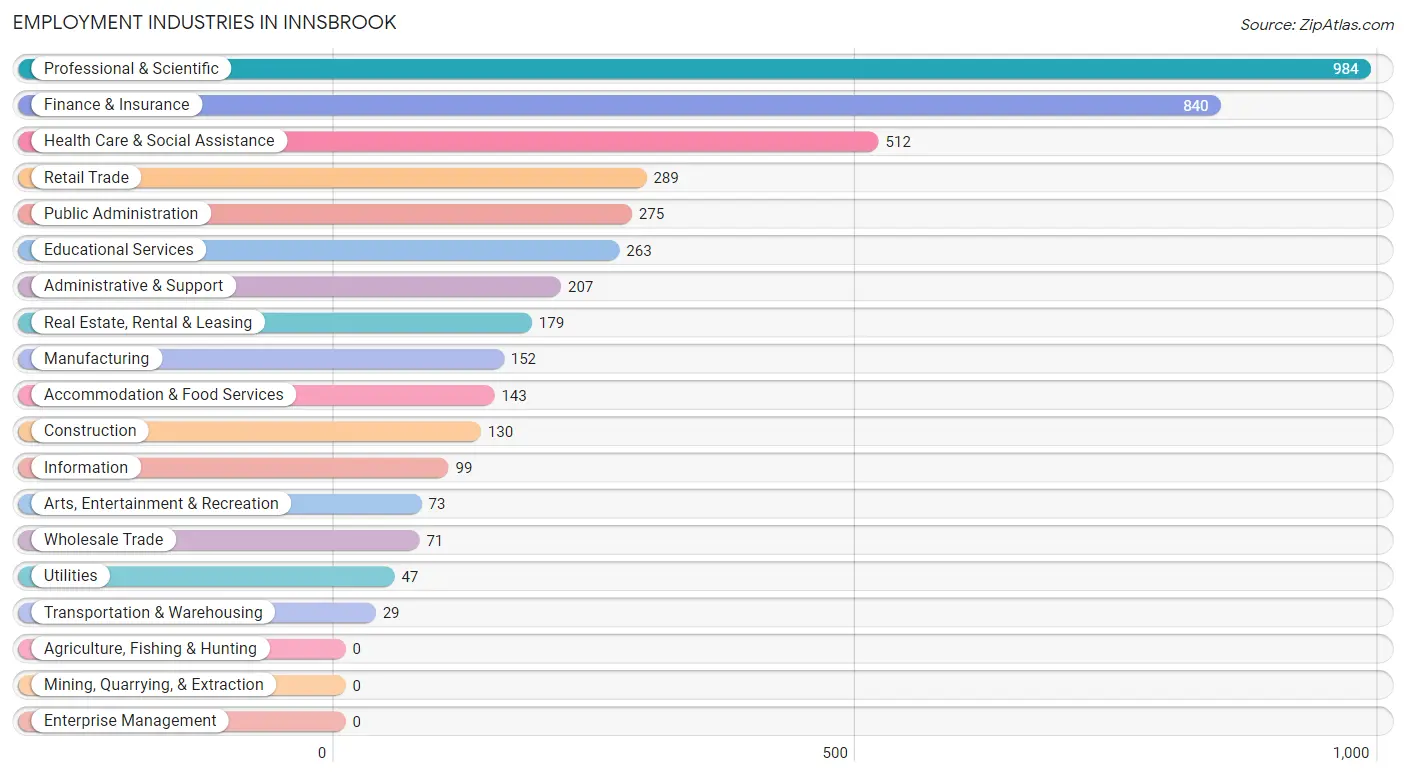
Employment Industries in Innsbrook
The major employment industries in Innsbrook include Professional & Scientific (984 | 21.7%), Finance & Insurance (840 | 18.5%), Health Care & Social Assistance (512 | 11.3%), Retail Trade (289 | 6.4%), and Public Administration (275 | 6.0%).
Employment Industries by Sex in Innsbrook
The Innsbrook industries that see more men than women are Construction (100.0%), Transportation & Warehousing (100.0%), and Wholesale Trade (85.9%), whereas the industries that tend to have a higher number of women are Finance & Insurance (66.3%), Health Care & Social Assistance (66.2%), and Information (57.6%).
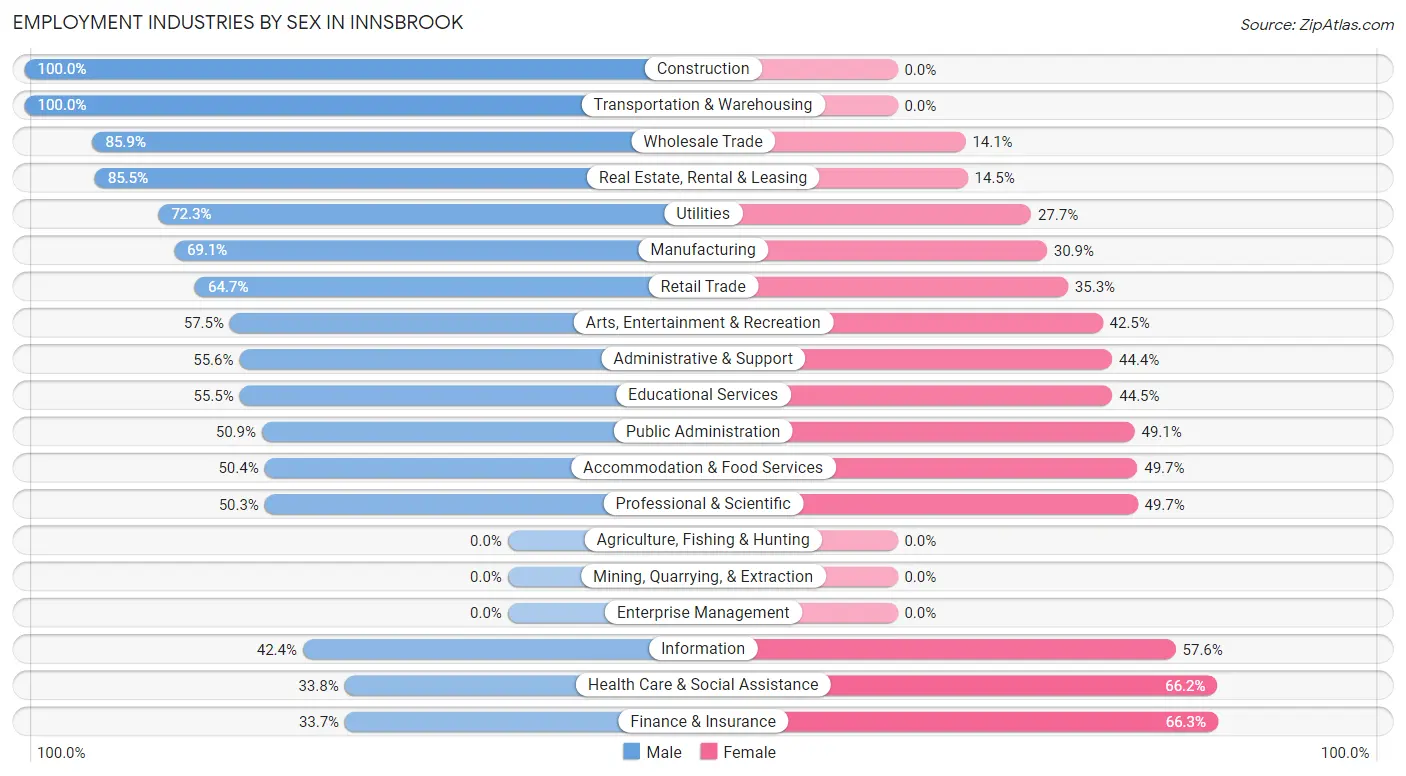
| Industry | Male | Female |
| Agriculture, Fishing & Hunting | 0 (0.0%) | 0 (0.0%) |
| Mining, Quarrying, & Extraction | 0 (0.0%) | 0 (0.0%) |
| Construction | 130 (100.0%) | 0 (0.0%) |
| Manufacturing | 105 (69.1%) | 47 (30.9%) |
| Wholesale Trade | 61 (85.9%) | 10 (14.1%) |
| Retail Trade | 187 (64.7%) | 102 (35.3%) |
| Transportation & Warehousing | 29 (100.0%) | 0 (0.0%) |
| Utilities | 34 (72.3%) | 13 (27.7%) |
| Information | 42 (42.4%) | 57 (57.6%) |
| Finance & Insurance | 283 (33.7%) | 557 (66.3%) |
| Real Estate, Rental & Leasing | 153 (85.5%) | 26 (14.5%) |
| Professional & Scientific | 495 (50.3%) | 489 (49.7%) |
| Enterprise Management | 0 (0.0%) | 0 (0.0%) |
| Administrative & Support | 115 (55.6%) | 92 (44.4%) |
| Educational Services | 146 (55.5%) | 117 (44.5%) |
| Health Care & Social Assistance | 173 (33.8%) | 339 (66.2%) |
| Arts, Entertainment & Recreation | 42 (57.5%) | 31 (42.5%) |
| Accommodation & Food Services | 72 (50.3%) | 71 (49.6%) |
| Public Administration | 140 (50.9%) | 135 (49.1%) |
| Total | 2,289 (50.4%) | 2,254 (49.6%) |
Education in Innsbrook
School Enrollment in Innsbrook
The most common levels of schooling among the 2,467 students in Innsbrook are middle school (669 | 27.1%), elementary school (648 | 26.3%), and high school (498 | 20.2%).
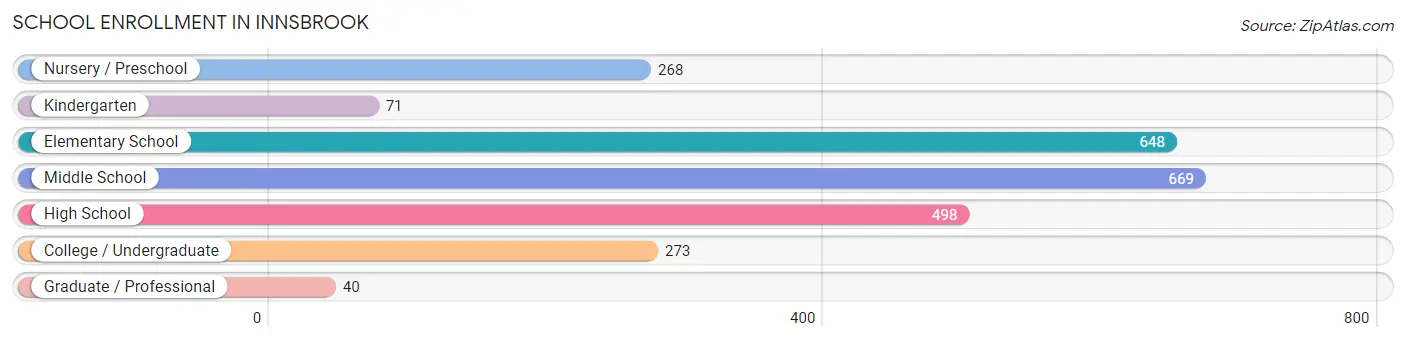
| School Level | # Students | % Students |
| Nursery / Preschool | 268 | 10.9% |
| Kindergarten | 71 | 2.9% |
| Elementary School | 648 | 26.3% |
| Middle School | 669 | 27.1% |
| High School | 498 | 20.2% |
| College / Undergraduate | 273 | 11.1% |
| Graduate / Professional | 40 | 1.6% |
| Total | 2,467 | 100.0% |
School Enrollment by Age by Funding Source in Innsbrook
Out of a total of 2,467 students who are enrolled in schools in Innsbrook, 368 (14.9%) attend a private institution, while the remaining 2,099 (85.1%) are enrolled in public schools. The age group of 3 to 4 year olds has the highest likelihood of being enrolled in private schools, with 94 (100.0% in the age bracket) enrolled. Conversely, the age group of 18 to 19 year olds has the lowest likelihood of being enrolled in a private school, with 176 (100.0% in the age bracket) attending a public institution.
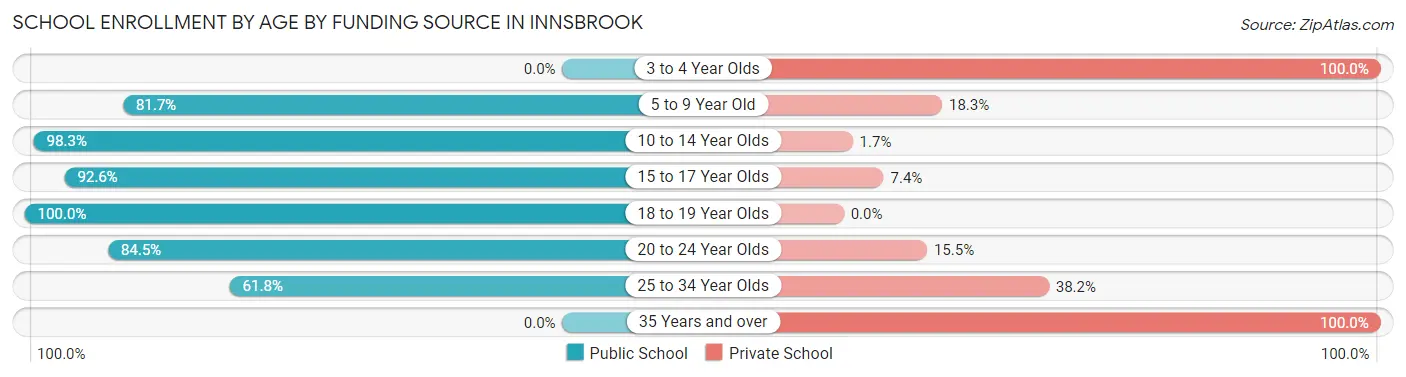
| Age Bracket | Public School | Private School |
| 3 to 4 Year Olds | 0 (0.0%) | 94 (100.0%) |
| 5 to 9 Year Old | 682 (81.7%) | 153 (18.3%) |
| 10 to 14 Year Olds | 765 (98.3%) | 13 (1.7%) |
| 15 to 17 Year Olds | 274 (92.6%) | 22 (7.4%) |
| 18 to 19 Year Olds | 176 (100.0%) | 0 (0.0%) |
| 20 to 24 Year Olds | 147 (84.5%) | 27 (15.5%) |
| 25 to 34 Year Olds | 55 (61.8%) | 34 (38.2%) |
| 35 Years and over | 0 (0.0%) | 25 (100.0%) |
| Total | 2,099 (85.1%) | 368 (14.9%) |
Educational Attainment by Field of Study in Innsbrook
Business (658 | 15.6%), computers & mathematics (638 | 15.1%), engineering (490 | 11.6%), science & technology (429 | 10.2%), and social sciences (425 | 10.1%) are the most common fields of study among 4,217 individuals in Innsbrook who have obtained a bachelor's degree or higher.
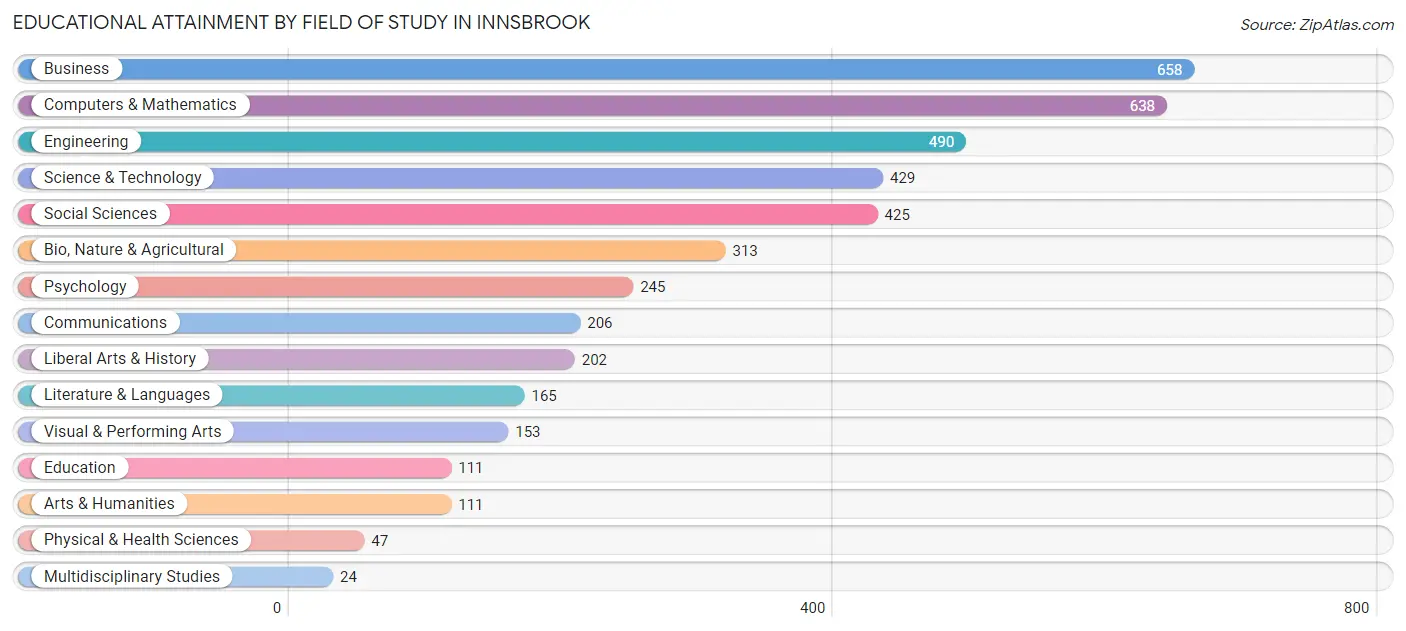
| Field of Study | # Graduates | % Graduates |
| Computers & Mathematics | 638 | 15.1% |
| Bio, Nature & Agricultural | 313 | 7.4% |
| Physical & Health Sciences | 47 | 1.1% |
| Psychology | 245 | 5.8% |
| Social Sciences | 425 | 10.1% |
| Engineering | 490 | 11.6% |
| Multidisciplinary Studies | 24 | 0.6% |
| Science & Technology | 429 | 10.2% |
| Business | 658 | 15.6% |
| Education | 111 | 2.6% |
| Literature & Languages | 165 | 3.9% |
| Liberal Arts & History | 202 | 4.8% |
| Visual & Performing Arts | 153 | 3.6% |
| Communications | 206 | 4.9% |
| Arts & Humanities | 111 | 2.6% |
| Total | 4,217 | 100.0% |
Transportation & Commute in Innsbrook
Vehicle Availability by Sex in Innsbrook
The most prevalent vehicle ownership categories in Innsbrook are males with 2 vehicles (1,210, accounting for 52.9%) and females with 2 vehicles (1,218, making up 55.2%).
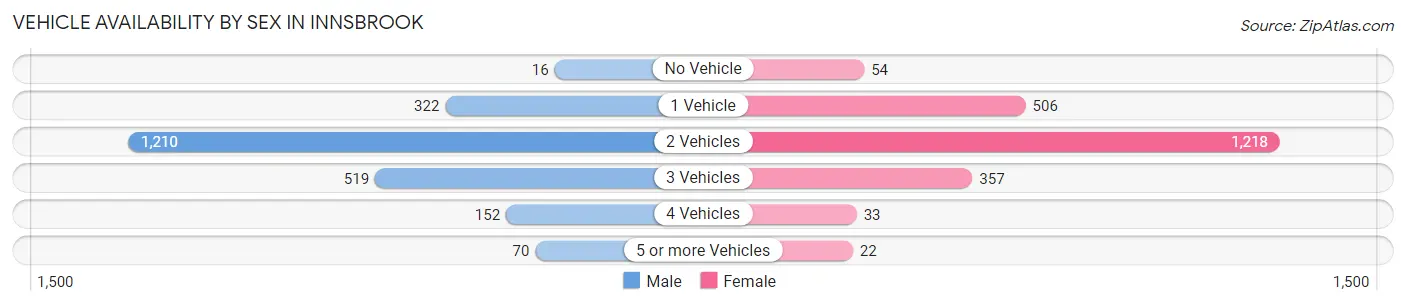
| Vehicles Available | Male | Female |
| No Vehicle | 16 (0.7%) | 54 (2.5%) |
| 1 Vehicle | 322 (14.1%) | 506 (23.1%) |
| 2 Vehicles | 1,210 (52.9%) | 1,218 (55.6%) |
| 3 Vehicles | 519 (22.7%) | 357 (16.3%) |
| 4 Vehicles | 152 (6.6%) | 33 (1.5%) |
| 5 or more Vehicles | 70 (3.1%) | 22 (1.0%) |
| Total | 2,289 (100.0%) | 2,190 (100.0%) |
Commute Time in Innsbrook
The most frequently occuring commute durations in Innsbrook are 15 to 19 minutes (752 commuters, 23.1%), 20 to 24 minutes (615 commuters, 18.9%), and 10 to 14 minutes (605 commuters, 18.6%).
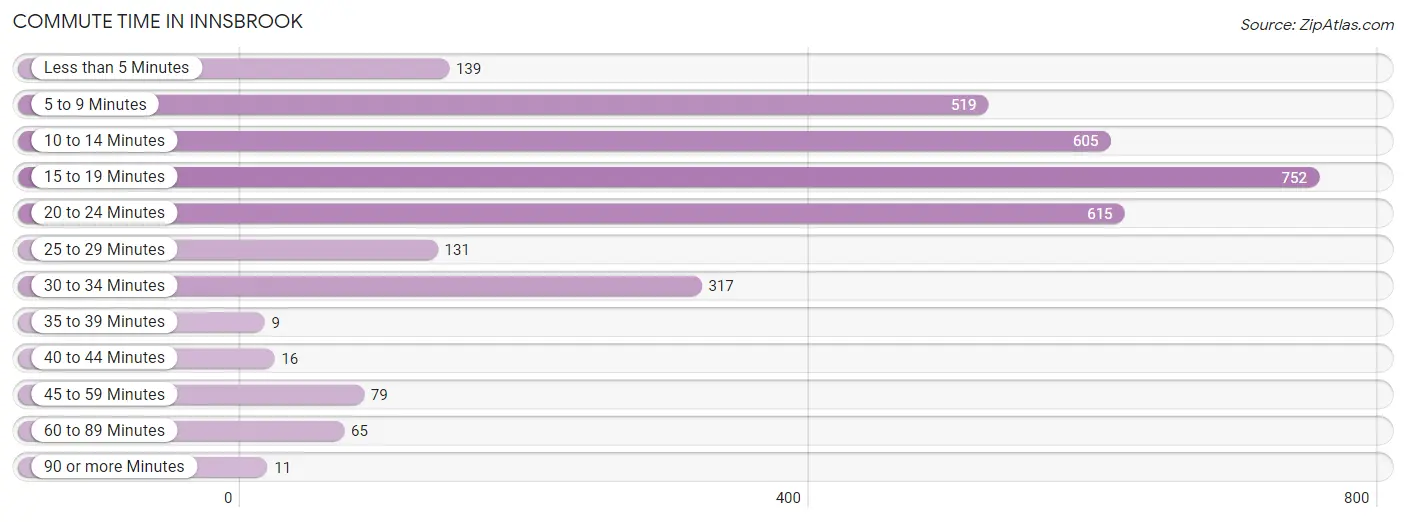
| Commute Time | # Commuters | % Commuters |
| Less than 5 Minutes | 139 | 4.3% |
| 5 to 9 Minutes | 519 | 15.9% |
| 10 to 14 Minutes | 605 | 18.6% |
| 15 to 19 Minutes | 752 | 23.1% |
| 20 to 24 Minutes | 615 | 18.9% |
| 25 to 29 Minutes | 131 | 4.0% |
| 30 to 34 Minutes | 317 | 9.7% |
| 35 to 39 Minutes | 9 | 0.3% |
| 40 to 44 Minutes | 16 | 0.5% |
| 45 to 59 Minutes | 79 | 2.4% |
| 60 to 89 Minutes | 65 | 2.0% |
| 90 or more Minutes | 11 | 0.3% |
Commute Time by Sex in Innsbrook
The most common commute times in Innsbrook are 15 to 19 minutes (378 commuters, 21.8%) for males and 15 to 19 minutes (374 commuters, 24.5%) for females.
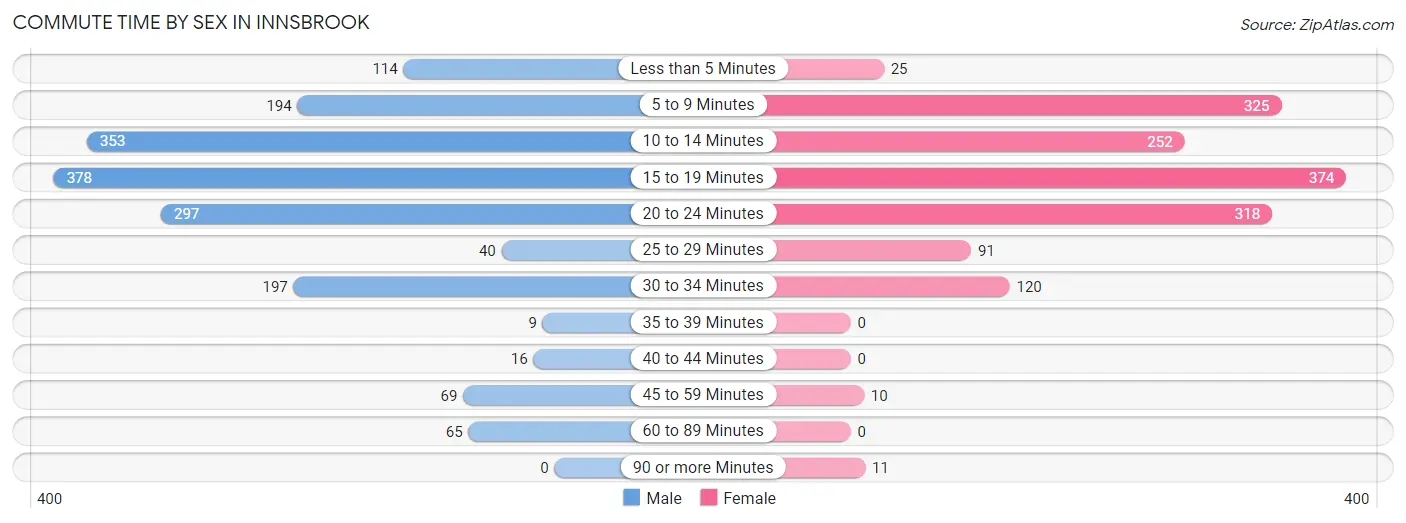
| Commute Time | Male | Female |
| Less than 5 Minutes | 114 (6.6%) | 25 (1.6%) |
| 5 to 9 Minutes | 194 (11.2%) | 325 (21.3%) |
| 10 to 14 Minutes | 353 (20.4%) | 252 (16.5%) |
| 15 to 19 Minutes | 378 (21.8%) | 374 (24.5%) |
| 20 to 24 Minutes | 297 (17.2%) | 318 (20.8%) |
| 25 to 29 Minutes | 40 (2.3%) | 91 (6.0%) |
| 30 to 34 Minutes | 197 (11.4%) | 120 (7.9%) |
| 35 to 39 Minutes | 9 (0.5%) | 0 (0.0%) |
| 40 to 44 Minutes | 16 (0.9%) | 0 (0.0%) |
| 45 to 59 Minutes | 69 (4.0%) | 10 (0.7%) |
| 60 to 89 Minutes | 65 (3.7%) | 0 (0.0%) |
| 90 or more Minutes | 0 (0.0%) | 11 (0.7%) |
Time of Departure to Work by Sex in Innsbrook
The most frequent times of departure to work in Innsbrook are 8:30 AM to 8:59 AM (411, 23.7%) for males and 8:00 AM to 8:29 AM (422, 27.7%) for females.
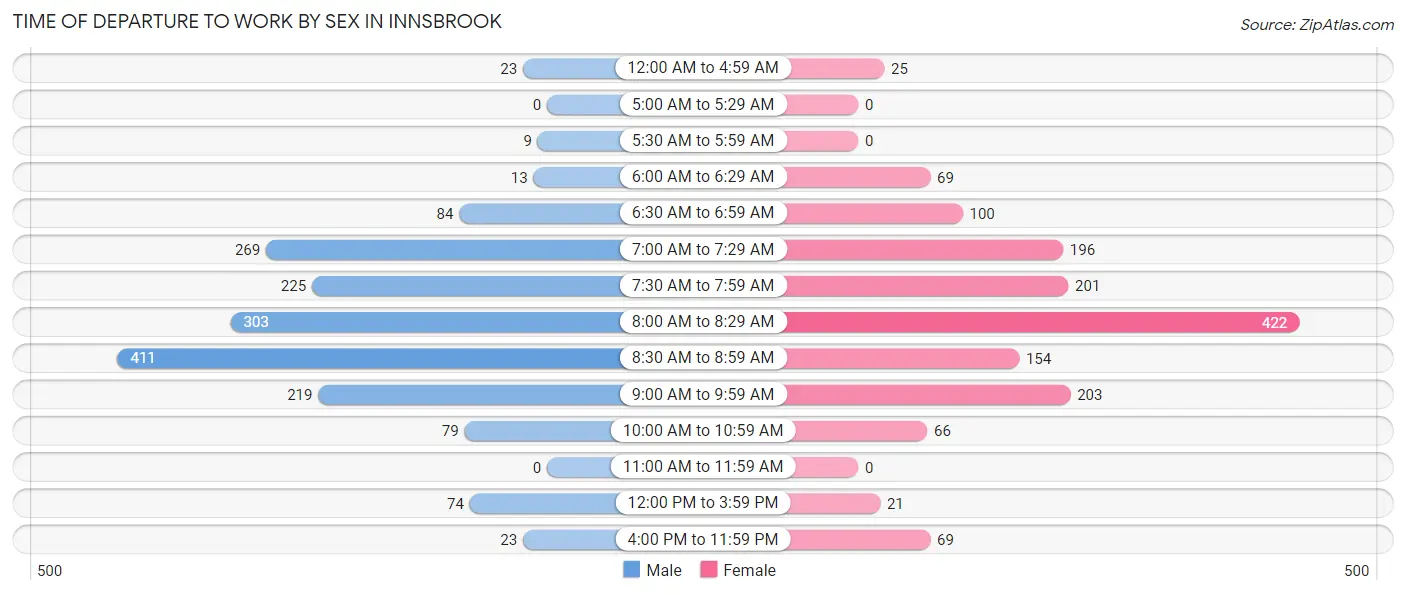
| Time of Departure | Male | Female |
| 12:00 AM to 4:59 AM | 23 (1.3%) | 25 (1.6%) |
| 5:00 AM to 5:29 AM | 0 (0.0%) | 0 (0.0%) |
| 5:30 AM to 5:59 AM | 9 (0.5%) | 0 (0.0%) |
| 6:00 AM to 6:29 AM | 13 (0.7%) | 69 (4.5%) |
| 6:30 AM to 6:59 AM | 84 (4.9%) | 100 (6.6%) |
| 7:00 AM to 7:29 AM | 269 (15.5%) | 196 (12.8%) |
| 7:30 AM to 7:59 AM | 225 (13.0%) | 201 (13.2%) |
| 8:00 AM to 8:29 AM | 303 (17.5%) | 422 (27.7%) |
| 8:30 AM to 8:59 AM | 411 (23.7%) | 154 (10.1%) |
| 9:00 AM to 9:59 AM | 219 (12.6%) | 203 (13.3%) |
| 10:00 AM to 10:59 AM | 79 (4.6%) | 66 (4.3%) |
| 11:00 AM to 11:59 AM | 0 (0.0%) | 0 (0.0%) |
| 12:00 PM to 3:59 PM | 74 (4.3%) | 21 (1.4%) |
| 4:00 PM to 11:59 PM | 23 (1.3%) | 69 (4.5%) |
| Total | 1,732 (100.0%) | 1,526 (100.0%) |
Housing Occupancy in Innsbrook
Occupancy by Ownership in Innsbrook
Of the total 3,300 dwellings in Innsbrook, owner-occupied units account for 2,119 (64.2%), while renter-occupied units make up 1,181 (35.8%).
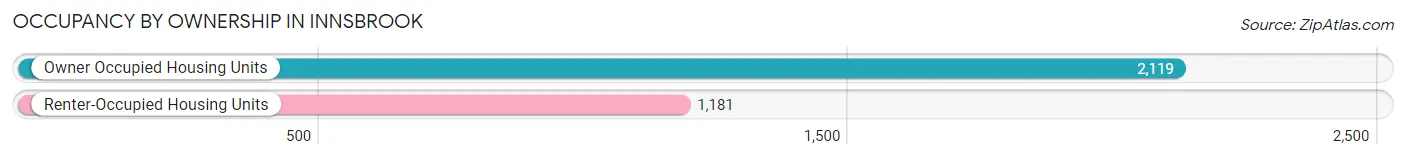
| Occupancy | # Housing Units | % Housing Units |
| Owner Occupied Housing Units | 2,119 | 64.2% |
| Renter-Occupied Housing Units | 1,181 | 35.8% |
| Total Occupied Housing Units | 3,300 | 100.0% |
Occupancy by Household Size in Innsbrook
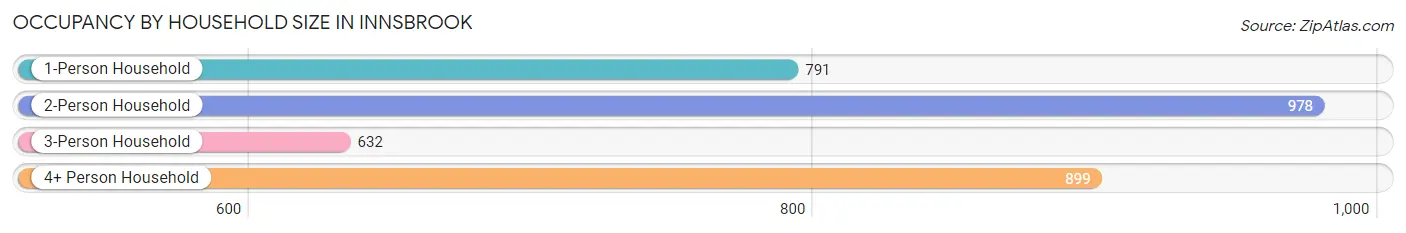
| Household Size | # Housing Units | % Housing Units |
| 1-Person Household | 791 | 24.0% |
| 2-Person Household | 978 | 29.6% |
| 3-Person Household | 632 | 19.2% |
| 4+ Person Household | 899 | 27.2% |
| Total Housing Units | 3,300 | 100.0% |
Occupancy by Ownership by Household Size in Innsbrook
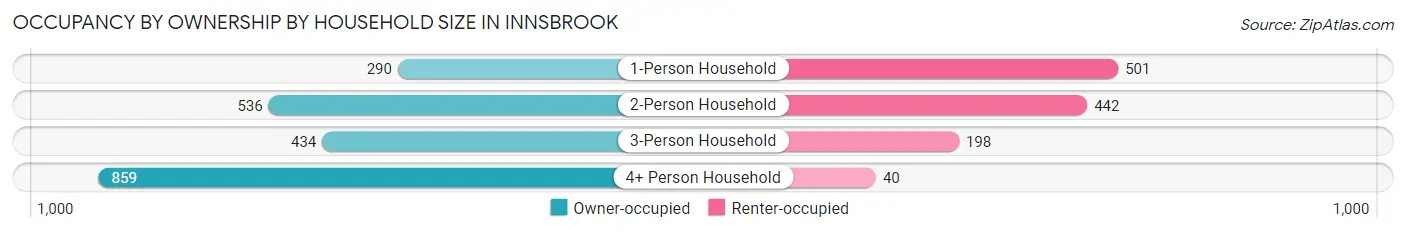
| Household Size | Owner-occupied | Renter-occupied |
| 1-Person Household | 290 (36.7%) | 501 (63.3%) |
| 2-Person Household | 536 (54.8%) | 442 (45.2%) |
| 3-Person Household | 434 (68.7%) | 198 (31.3%) |
| 4+ Person Household | 859 (95.6%) | 40 (4.4%) |
| Total Housing Units | 2,119 (64.2%) | 1,181 (35.8%) |
Occupancy by Educational Attainment in Innsbrook
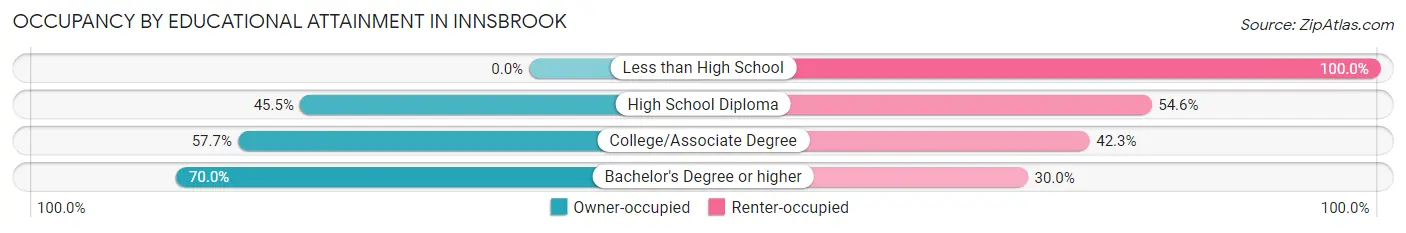
| Household Size | Owner-occupied | Renter-occupied |
| Less than High School | 0 (0.0%) | 45 (100.0%) |
| High School Diploma | 160 (45.5%) | 192 (54.5%) |
| College/Associate Degree | 343 (57.7%) | 251 (42.3%) |
| Bachelor's Degree or higher | 1,616 (70.0%) | 693 (30.0%) |
Occupancy by Age of Householder in Innsbrook
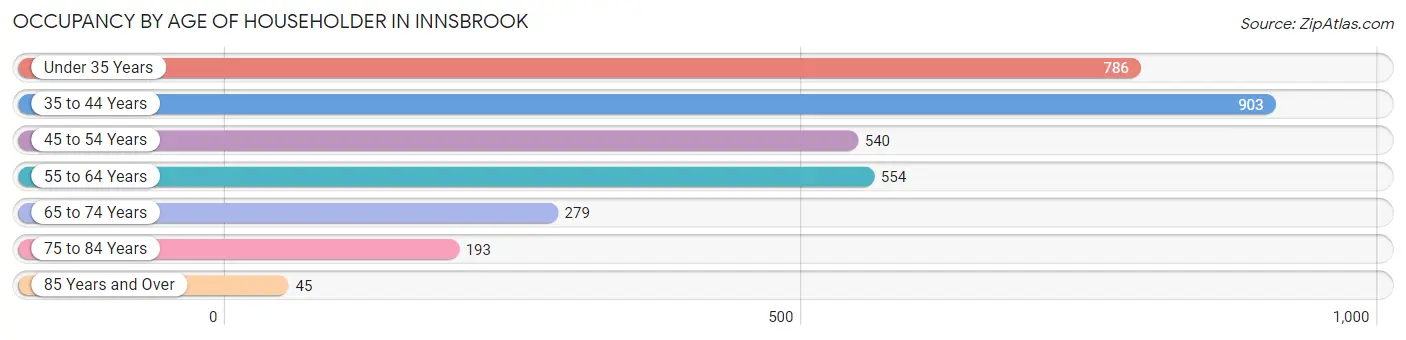
| Age Bracket | # Households | % Households |
| Under 35 Years | 786 | 23.8% |
| 35 to 44 Years | 903 | 27.4% |
| 45 to 54 Years | 540 | 16.4% |
| 55 to 64 Years | 554 | 16.8% |
| 65 to 74 Years | 279 | 8.5% |
| 75 to 84 Years | 193 | 5.9% |
| 85 Years and Over | 45 | 1.4% |
| Total | 3,300 | 100.0% |
Housing Finances in Innsbrook
Median Income by Occupancy in Innsbrook
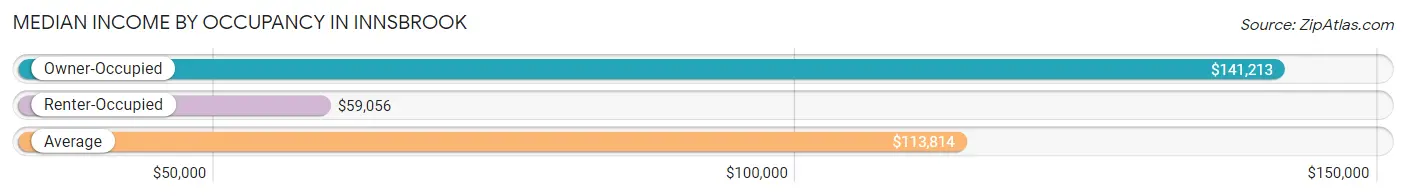
| Occupancy Type | # Households | Median Income |
| Owner-Occupied | 2,119 (64.2%) | $141,213 |
| Renter-Occupied | 1,181 (35.8%) | $59,056 |
| Average | 3,300 (100.0%) | $113,814 |
Occupancy by Householder Income Bracket in Innsbrook
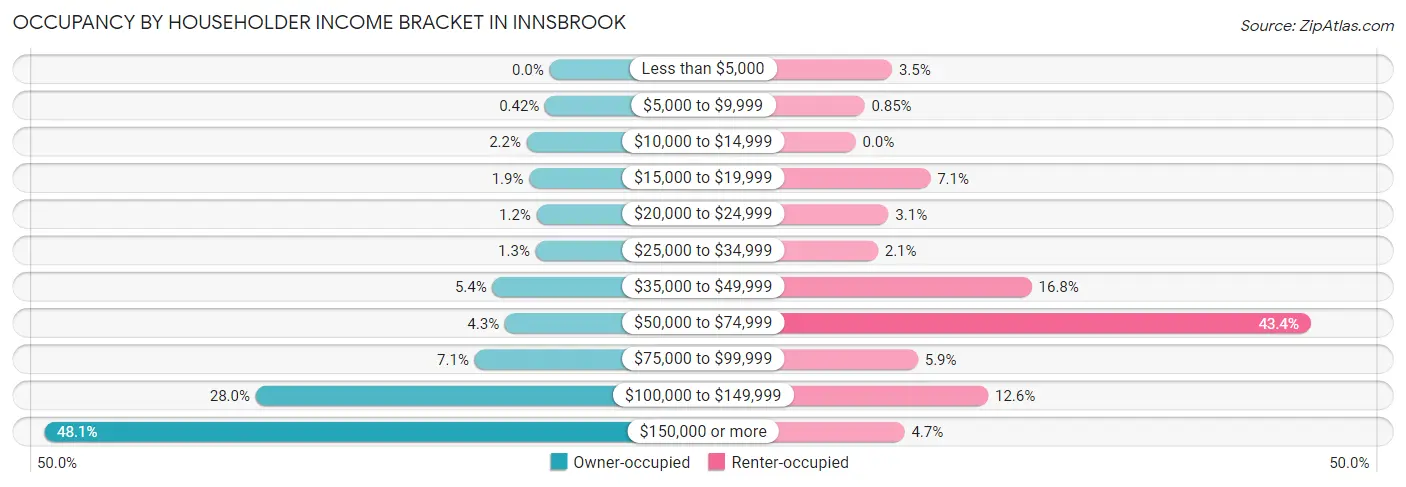
| Income Bracket | Owner-occupied | Renter-occupied |
| Less than $5,000 | 0 (0.0%) | 41 (3.5%) |
| $5,000 to $9,999 | 9 (0.4%) | 10 (0.9%) |
| $10,000 to $14,999 | 46 (2.2%) | 0 (0.0%) |
| $15,000 to $19,999 | 41 (1.9%) | 84 (7.1%) |
| $20,000 to $24,999 | 26 (1.2%) | 37 (3.1%) |
| $25,000 to $34,999 | 28 (1.3%) | 25 (2.1%) |
| $35,000 to $49,999 | 115 (5.4%) | 198 (16.8%) |
| $50,000 to $74,999 | 90 (4.3%) | 512 (43.3%) |
| $75,000 to $99,999 | 151 (7.1%) | 70 (5.9%) |
| $100,000 to $149,999 | 593 (28.0%) | 149 (12.6%) |
| $150,000 or more | 1,020 (48.1%) | 55 (4.7%) |
| Total | 2,119 (100.0%) | 1,181 (100.0%) |
Monthly Housing Cost Tiers in Innsbrook
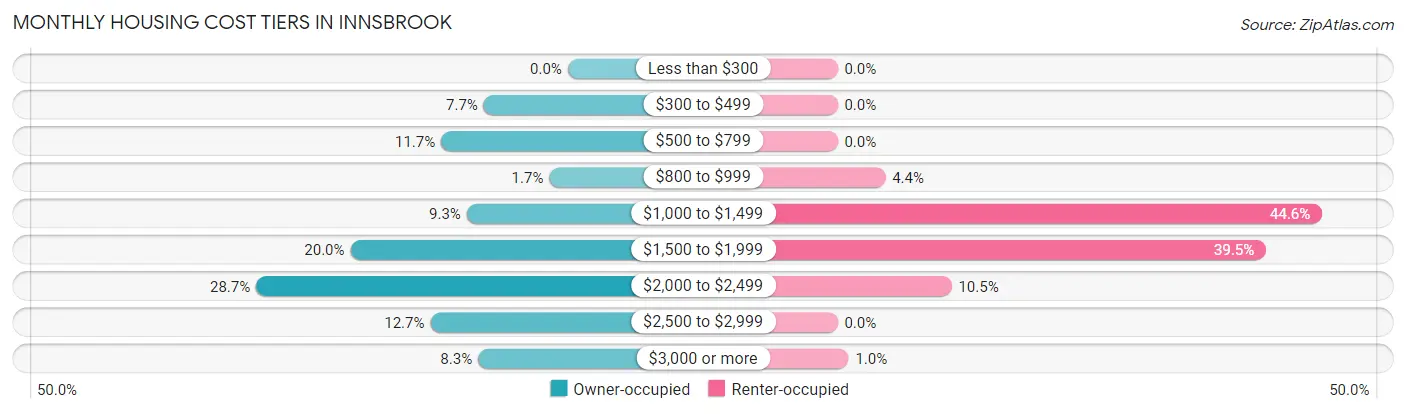
| Monthly Cost | Owner-occupied | Renter-occupied |
| Less than $300 | 0 (0.0%) | 0 (0.0%) |
| $300 to $499 | 164 (7.7%) | 0 (0.0%) |
| $500 to $799 | 247 (11.7%) | 0 (0.0%) |
| $800 to $999 | 36 (1.7%) | 52 (4.4%) |
| $1,000 to $1,499 | 197 (9.3%) | 527 (44.6%) |
| $1,500 to $1,999 | 424 (20.0%) | 466 (39.5%) |
| $2,000 to $2,499 | 608 (28.7%) | 124 (10.5%) |
| $2,500 to $2,999 | 268 (12.7%) | 0 (0.0%) |
| $3,000 or more | 175 (8.3%) | 12 (1.0%) |
| Total | 2,119 (100.0%) | 1,181 (100.0%) |
Physical Housing Characteristics in Innsbrook
Housing Structures in Innsbrook
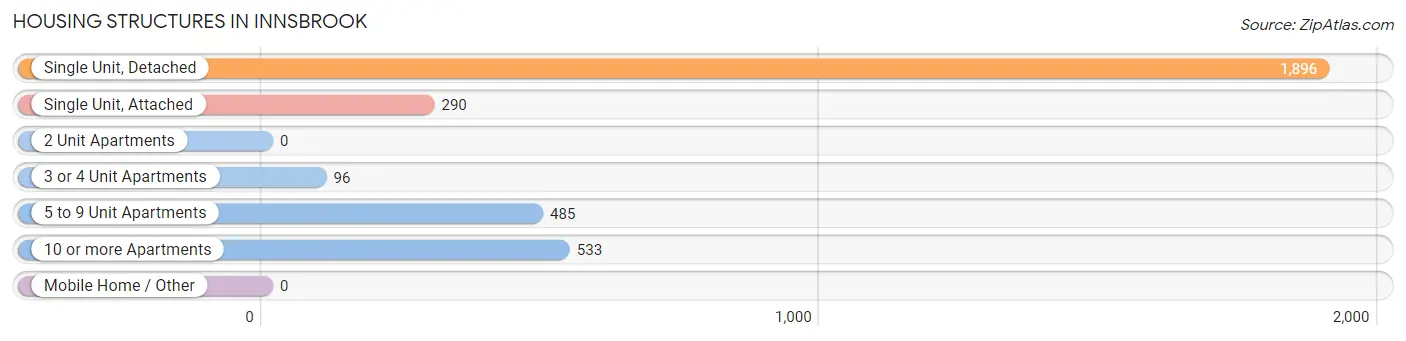
| Structure Type | # Housing Units | % Housing Units |
| Single Unit, Detached | 1,896 | 57.5% |
| Single Unit, Attached | 290 | 8.8% |
| 2 Unit Apartments | 0 | 0.0% |
| 3 or 4 Unit Apartments | 96 | 2.9% |
| 5 to 9 Unit Apartments | 485 | 14.7% |
| 10 or more Apartments | 533 | 16.2% |
| Mobile Home / Other | 0 | 0.0% |
| Total | 3,300 | 100.0% |
Housing Structures by Occupancy in Innsbrook
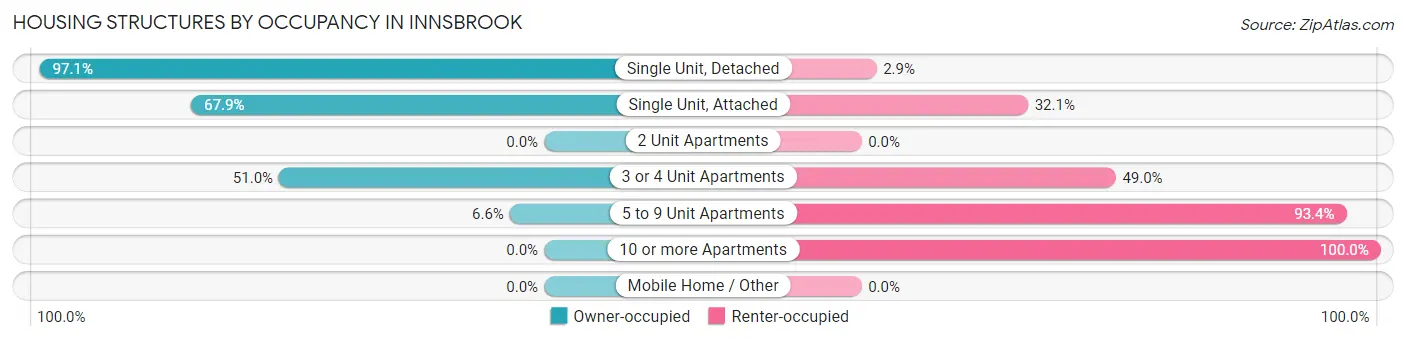
| Structure Type | Owner-occupied | Renter-occupied |
| Single Unit, Detached | 1,841 (97.1%) | 55 (2.9%) |
| Single Unit, Attached | 197 (67.9%) | 93 (32.1%) |
| 2 Unit Apartments | 0 (0.0%) | 0 (0.0%) |
| 3 or 4 Unit Apartments | 49 (51.0%) | 47 (49.0%) |
| 5 to 9 Unit Apartments | 32 (6.6%) | 453 (93.4%) |
| 10 or more Apartments | 0 (0.0%) | 533 (100.0%) |
| Mobile Home / Other | 0 (0.0%) | 0 (0.0%) |
| Total | 2,119 (64.2%) | 1,181 (35.8%) |
Housing Structures by Number of Rooms in Innsbrook
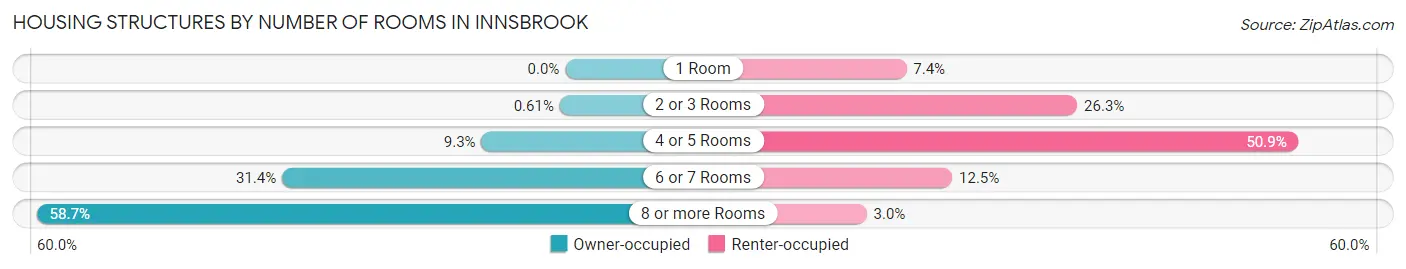
| Number of Rooms | Owner-occupied | Renter-occupied |
| 1 Room | 0 (0.0%) | 87 (7.4%) |
| 2 or 3 Rooms | 13 (0.6%) | 311 (26.3%) |
| 4 or 5 Rooms | 197 (9.3%) | 601 (50.9%) |
| 6 or 7 Rooms | 666 (31.4%) | 147 (12.4%) |
| 8 or more Rooms | 1,243 (58.7%) | 35 (3.0%) |
| Total | 2,119 (100.0%) | 1,181 (100.0%) |
Housing Structure by Heating Type in Innsbrook
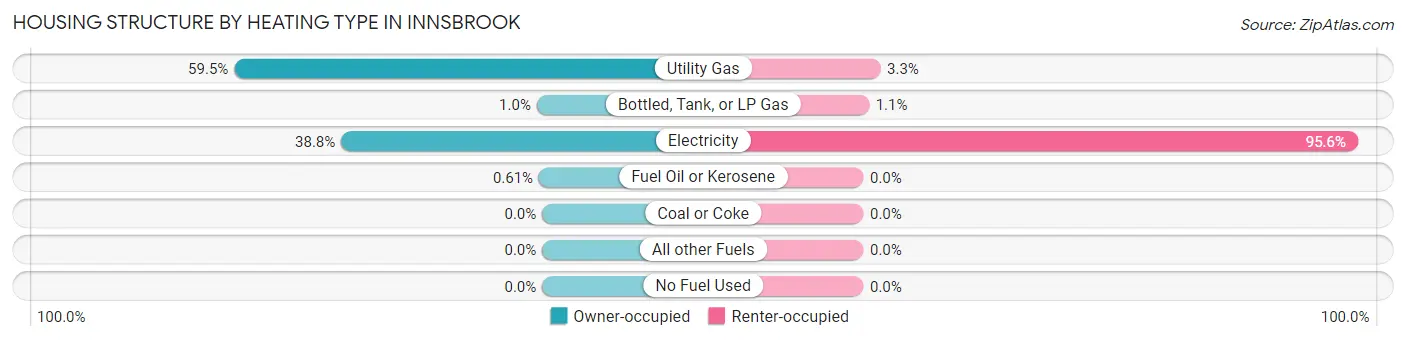
| Heating Type | Owner-occupied | Renter-occupied |
| Utility Gas | 1,261 (59.5%) | 39 (3.3%) |
| Bottled, Tank, or LP Gas | 22 (1.0%) | 13 (1.1%) |
| Electricity | 823 (38.8%) | 1,129 (95.6%) |
| Fuel Oil or Kerosene | 13 (0.6%) | 0 (0.0%) |
| Coal or Coke | 0 (0.0%) | 0 (0.0%) |
| All other Fuels | 0 (0.0%) | 0 (0.0%) |
| No Fuel Used | 0 (0.0%) | 0 (0.0%) |
| Total | 2,119 (100.0%) | 1,181 (100.0%) |
Household Vehicle Usage in Innsbrook
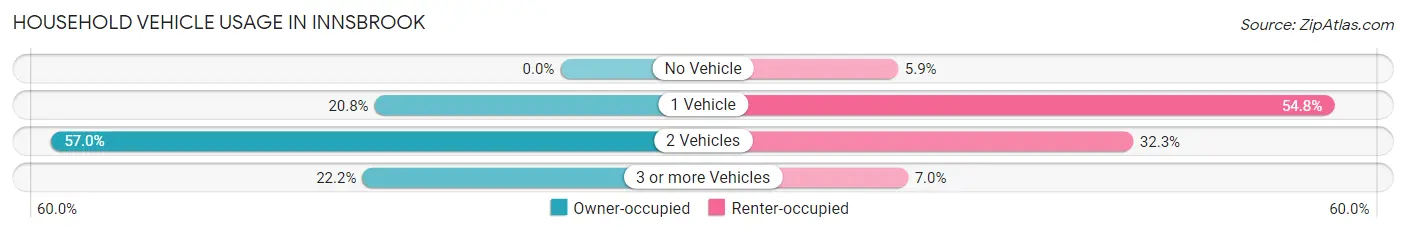
| Vehicles per Household | Owner-occupied | Renter-occupied |
| No Vehicle | 0 (0.0%) | 70 (5.9%) |
| 1 Vehicle | 441 (20.8%) | 647 (54.8%) |
| 2 Vehicles | 1,208 (57.0%) | 381 (32.3%) |
| 3 or more Vehicles | 470 (22.2%) | 83 (7.0%) |
| Total | 2,119 (100.0%) | 1,181 (100.0%) |
Real Estate & Mortgages in Innsbrook
Real Estate and Mortgage Overview in Innsbrook
| Characteristic | Without Mortgage | With Mortgage |
| Housing Units | 446 | 1,673 |
| Median Property Value | $455,900 | $437,400 |
| Median Household Income | $99,500 | $884 |
| Monthly Housing Costs | $565 | $175 |
| Real Estate Taxes | $2,682 | $11 |
Property Value by Mortgage Status in Innsbrook
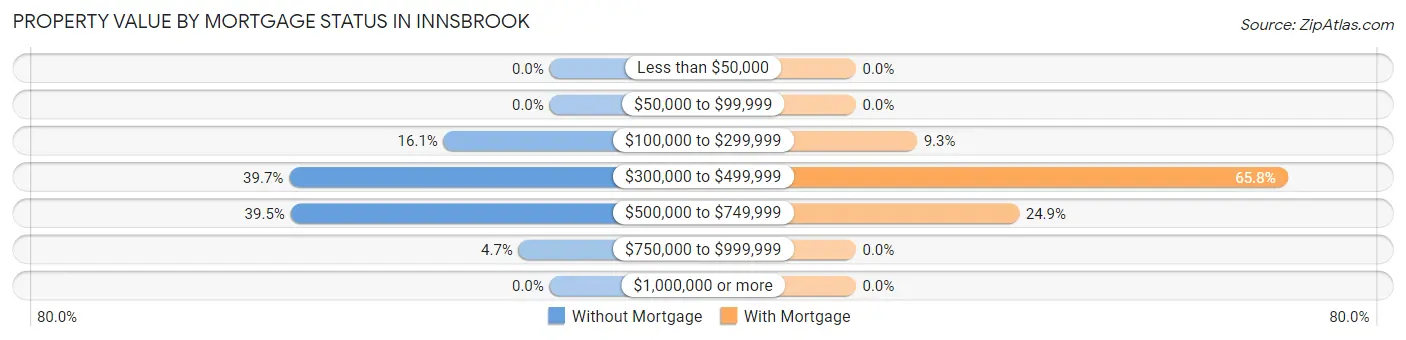
| Property Value | Without Mortgage | With Mortgage |
| Less than $50,000 | 0 (0.0%) | 0 (0.0%) |
| $50,000 to $99,999 | 0 (0.0%) | 0 (0.0%) |
| $100,000 to $299,999 | 72 (16.1%) | 156 (9.3%) |
| $300,000 to $499,999 | 177 (39.7%) | 1,101 (65.8%) |
| $500,000 to $749,999 | 176 (39.5%) | 416 (24.9%) |
| $750,000 to $999,999 | 21 (4.7%) | 0 (0.0%) |
| $1,000,000 or more | 0 (0.0%) | 0 (0.0%) |
| Total | 446 (100.0%) | 1,673 (100.0%) |
Household Income by Mortgage Status in Innsbrook
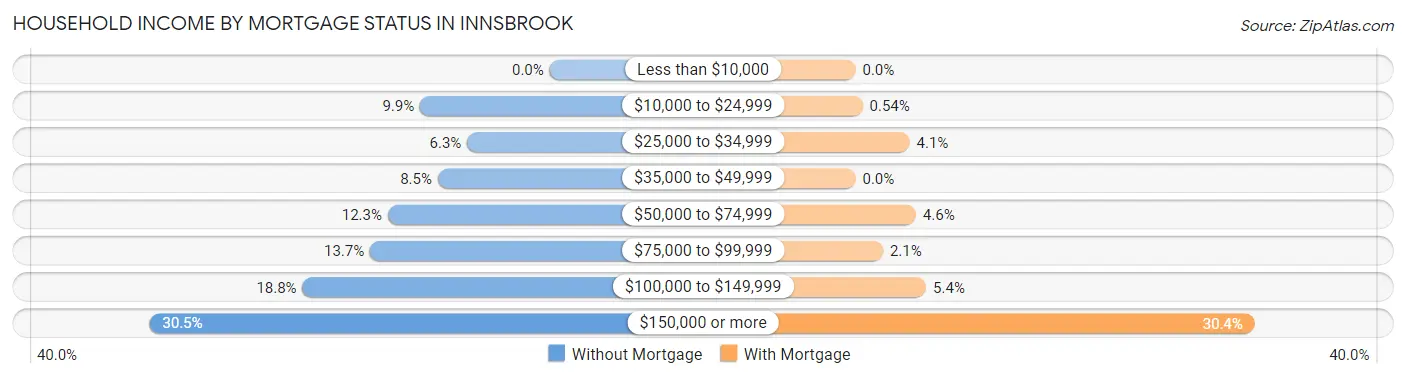
| Household Income | Without Mortgage | With Mortgage |
| Less than $10,000 | 0 (0.0%) | 0 (0.0%) |
| $10,000 to $24,999 | 44 (9.9%) | 9 (0.5%) |
| $25,000 to $34,999 | 28 (6.3%) | 69 (4.1%) |
| $35,000 to $49,999 | 38 (8.5%) | 0 (0.0%) |
| $50,000 to $74,999 | 55 (12.3%) | 77 (4.6%) |
| $75,000 to $99,999 | 61 (13.7%) | 35 (2.1%) |
| $100,000 to $149,999 | 84 (18.8%) | 90 (5.4%) |
| $150,000 or more | 136 (30.5%) | 509 (30.4%) |
| Total | 446 (100.0%) | 1,673 (100.0%) |
Property Value to Household Income Ratio in Innsbrook
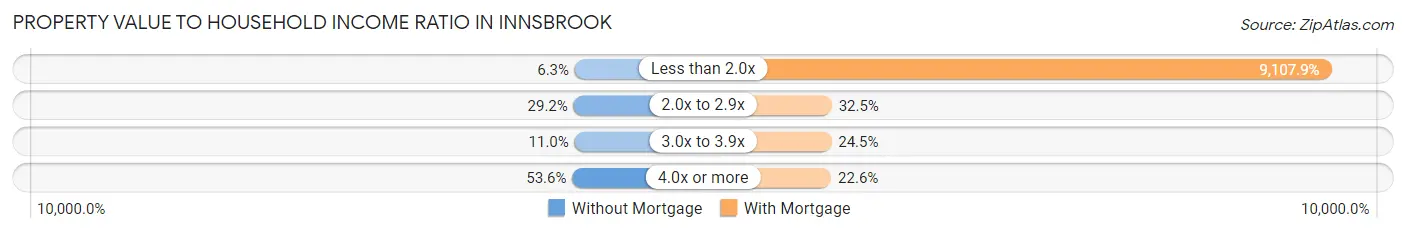
| Value-to-Income Ratio | Without Mortgage | With Mortgage |
| Less than 2.0x | 28 (6.3%) | 152,375 (9,107.9%) |
| 2.0x to 2.9x | 130 (29.1%) | 544 (32.5%) |
| 3.0x to 3.9x | 49 (11.0%) | 410 (24.5%) |
| 4.0x or more | 239 (53.6%) | 378 (22.6%) |
| Total | 446 (100.0%) | 1,673 (100.0%) |
Real Estate Taxes by Mortgage Status in Innsbrook
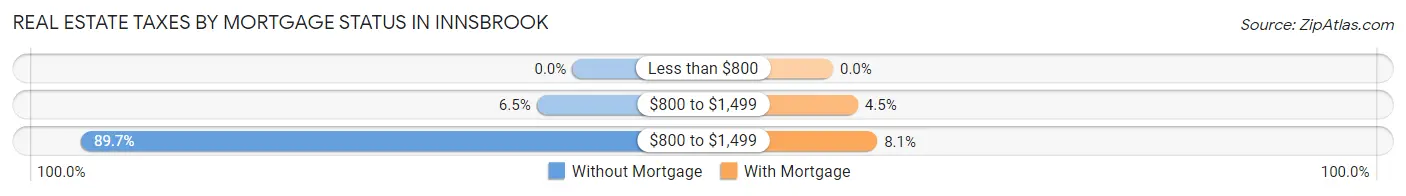
| Property Taxes | Without Mortgage | With Mortgage |
| Less than $800 | 0 (0.0%) | 0 (0.0%) |
| $800 to $1,499 | 29 (6.5%) | 76 (4.5%) |
| $800 to $1,499 | 400 (89.7%) | 135 (8.1%) |
| Total | 446 (100.0%) | 1,673 (100.0%) |
Health & Disability in Innsbrook
Health Insurance Coverage by Age in Innsbrook
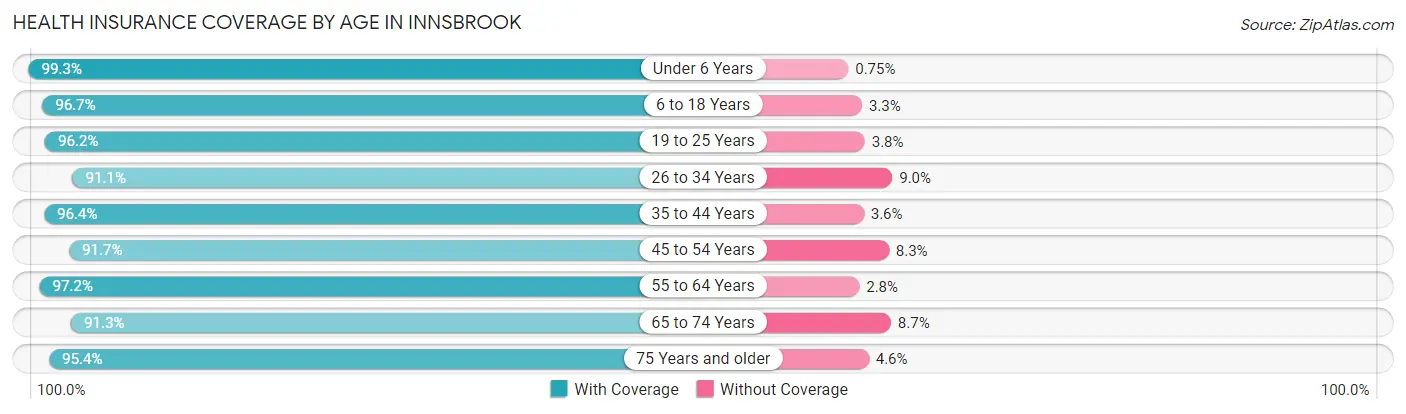
| Age Bracket | With Coverage | Without Coverage |
| Under 6 Years | 662 (99.3%) | 5 (0.7%) |
| 6 to 18 Years | 1,785 (96.7%) | 61 (3.3%) |
| 19 to 25 Years | 730 (96.2%) | 29 (3.8%) |
| 26 to 34 Years | 997 (91.0%) | 98 (8.9%) |
| 35 to 44 Years | 1,566 (96.4%) | 59 (3.6%) |
| 45 to 54 Years | 794 (91.7%) | 72 (8.3%) |
| 55 to 64 Years | 868 (97.2%) | 25 (2.8%) |
| 65 to 74 Years | 557 (91.3%) | 53 (8.7%) |
| 75 Years and older | 313 (95.4%) | 15 (4.6%) |
| Total | 8,272 (95.2%) | 417 (4.8%) |
Health Insurance Coverage by Citizenship Status in Innsbrook
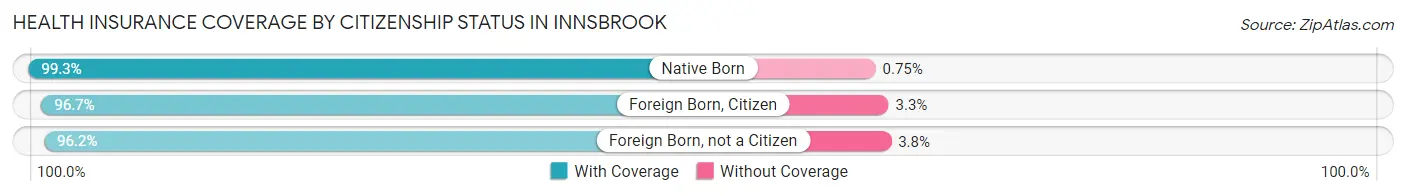
| Citizenship Status | With Coverage | Without Coverage |
| Native Born | 662 (99.3%) | 5 (0.7%) |
| Foreign Born, Citizen | 1,785 (96.7%) | 61 (3.3%) |
| Foreign Born, not a Citizen | 730 (96.2%) | 29 (3.8%) |
Health Insurance Coverage by Household Income in Innsbrook
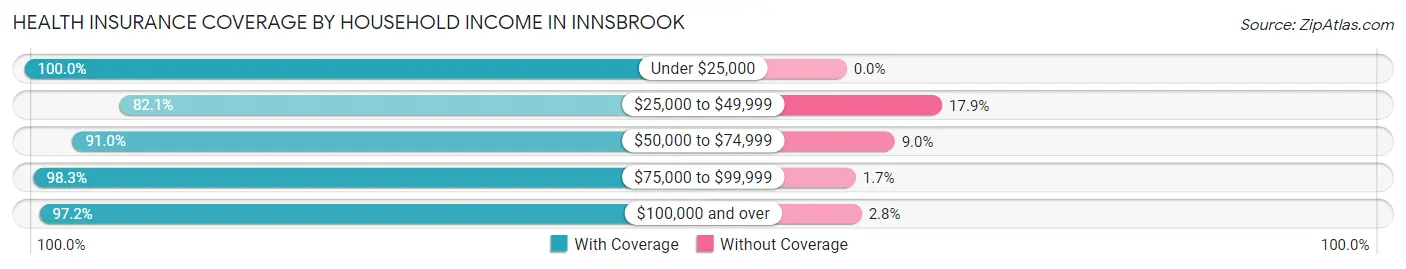
| Household Income | With Coverage | Without Coverage |
| Under $25,000 | 576 (100.0%) | 0 (0.0%) |
| $25,000 to $49,999 | 726 (82.1%) | 158 (17.9%) |
| $50,000 to $74,999 | 922 (91.0%) | 91 (9.0%) |
| $75,000 to $99,999 | 469 (98.3%) | 8 (1.7%) |
| $100,000 and over | 5,579 (97.2%) | 160 (2.8%) |
Public vs Private Health Insurance Coverage by Age in Innsbrook
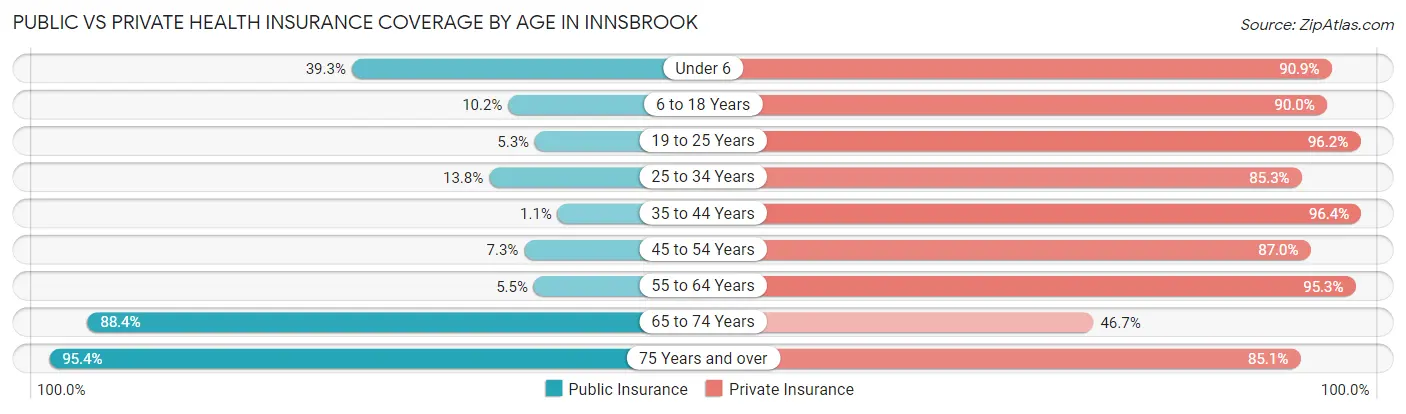
| Age Bracket | Public Insurance | Private Insurance |
| Under 6 | 262 (39.3%) | 606 (90.8%) |
| 6 to 18 Years | 189 (10.2%) | 1,661 (90.0%) |
| 19 to 25 Years | 40 (5.3%) | 730 (96.2%) |
| 25 to 34 Years | 151 (13.8%) | 934 (85.3%) |
| 35 to 44 Years | 17 (1.1%) | 1,566 (96.4%) |
| 45 to 54 Years | 63 (7.3%) | 753 (87.0%) |
| 55 to 64 Years | 49 (5.5%) | 851 (95.3%) |
| 65 to 74 Years | 539 (88.4%) | 285 (46.7%) |
| 75 Years and over | 313 (95.4%) | 279 (85.1%) |
| Total | 1,623 (18.7%) | 7,665 (88.2%) |
Disability Status by Sex by Age in Innsbrook
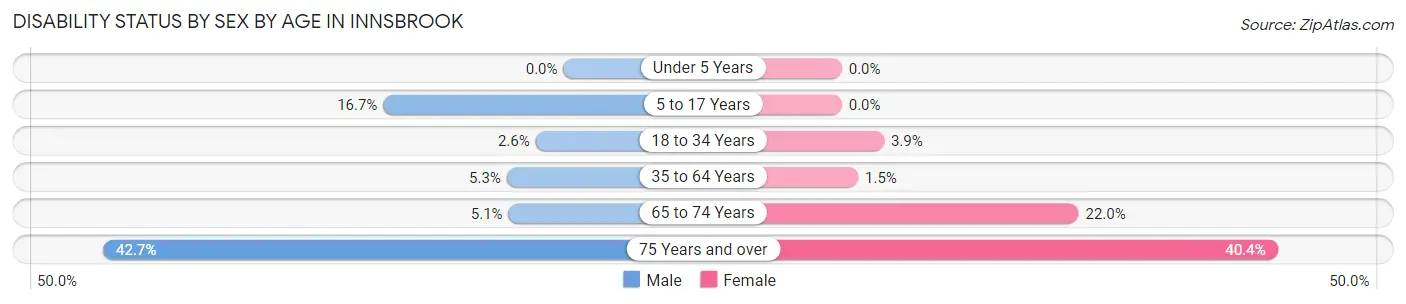
| Age Bracket | Male | Female |
| Under 5 Years | 0 (0.0%) | 0 (0.0%) |
| 5 to 17 Years | 212 (16.7%) | 0 (0.0%) |
| 18 to 34 Years | 24 (2.6%) | 42 (3.9%) |
| 35 to 64 Years | 84 (5.3%) | 27 (1.5%) |
| 65 to 74 Years | 13 (5.1%) | 78 (22.0%) |
| 75 Years and over | 82 (42.7%) | 55 (40.4%) |
Disability Class by Sex by Age in Innsbrook
Disability Class: Hearing Difficulty
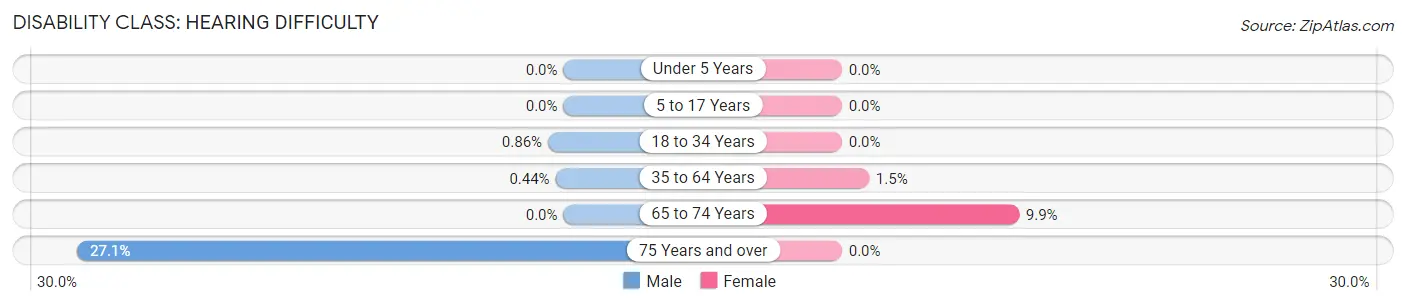
| Age Bracket | Male | Female |
| Under 5 Years | 0 (0.0%) | 0 (0.0%) |
| 5 to 17 Years | 0 (0.0%) | 0 (0.0%) |
| 18 to 34 Years | 8 (0.9%) | 0 (0.0%) |
| 35 to 64 Years | 7 (0.4%) | 27 (1.5%) |
| 65 to 74 Years | 0 (0.0%) | 35 (9.9%) |
| 75 Years and over | 52 (27.1%) | 0 (0.0%) |
Disability Class: Vision Difficulty
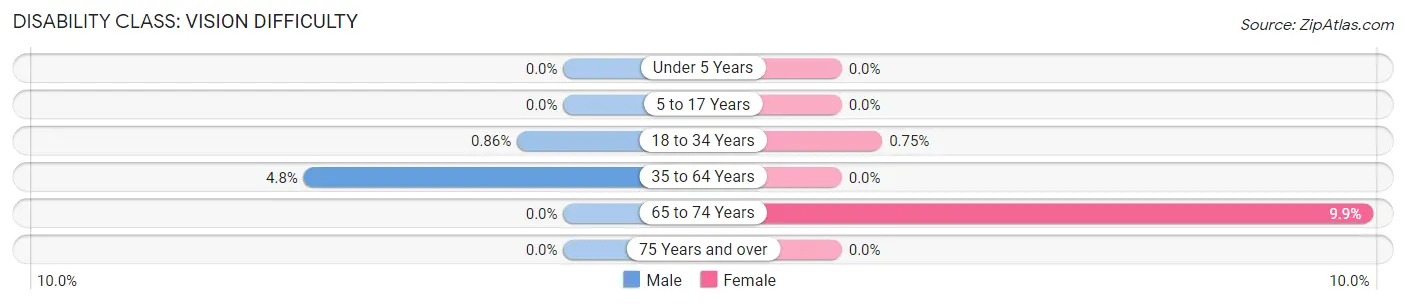
| Age Bracket | Male | Female |
| Under 5 Years | 0 (0.0%) | 0 (0.0%) |
| 5 to 17 Years | 0 (0.0%) | 0 (0.0%) |
| 18 to 34 Years | 8 (0.9%) | 8 (0.7%) |
| 35 to 64 Years | 77 (4.8%) | 0 (0.0%) |
| 65 to 74 Years | 0 (0.0%) | 35 (9.9%) |
| 75 Years and over | 0 (0.0%) | 0 (0.0%) |
Disability Class: Cognitive Difficulty
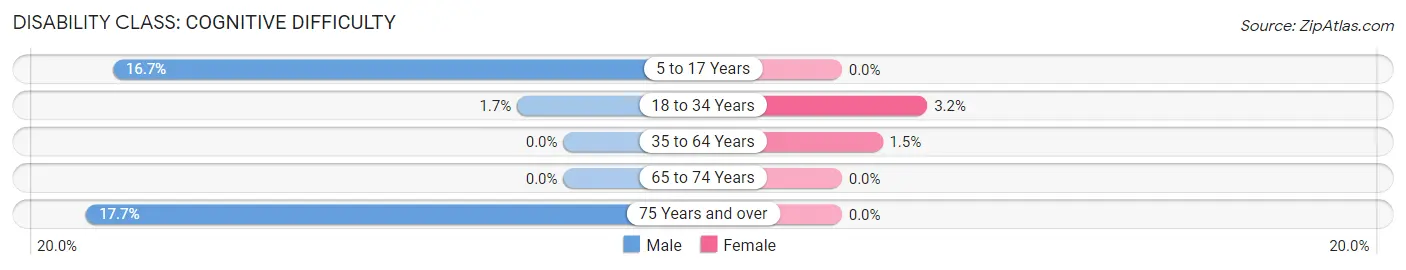
| Age Bracket | Male | Female |
| 5 to 17 Years | 212 (16.7%) | 0 (0.0%) |
| 18 to 34 Years | 16 (1.7%) | 34 (3.2%) |
| 35 to 64 Years | 0 (0.0%) | 27 (1.5%) |
| 65 to 74 Years | 0 (0.0%) | 0 (0.0%) |
| 75 Years and over | 34 (17.7%) | 0 (0.0%) |
Disability Class: Ambulatory Difficulty
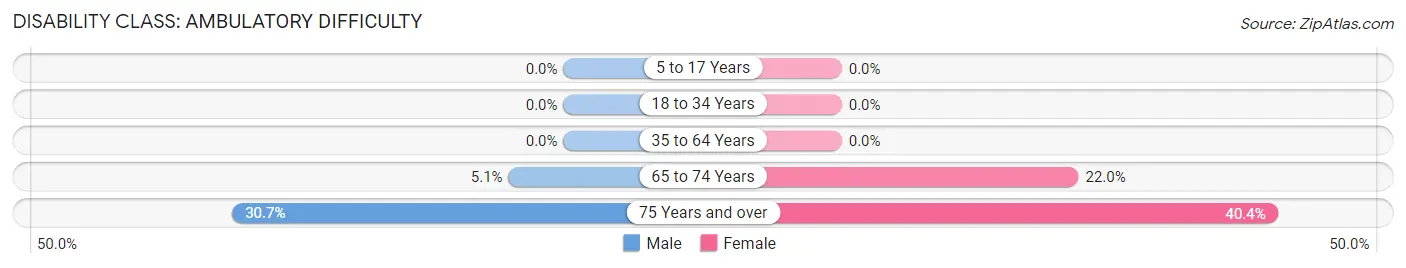
| Age Bracket | Male | Female |
| 5 to 17 Years | 0 (0.0%) | 0 (0.0%) |
| 18 to 34 Years | 0 (0.0%) | 0 (0.0%) |
| 35 to 64 Years | 0 (0.0%) | 0 (0.0%) |
| 65 to 74 Years | 13 (5.1%) | 78 (22.0%) |
| 75 Years and over | 59 (30.7%) | 55 (40.4%) |
Disability Class: Self-Care Difficulty
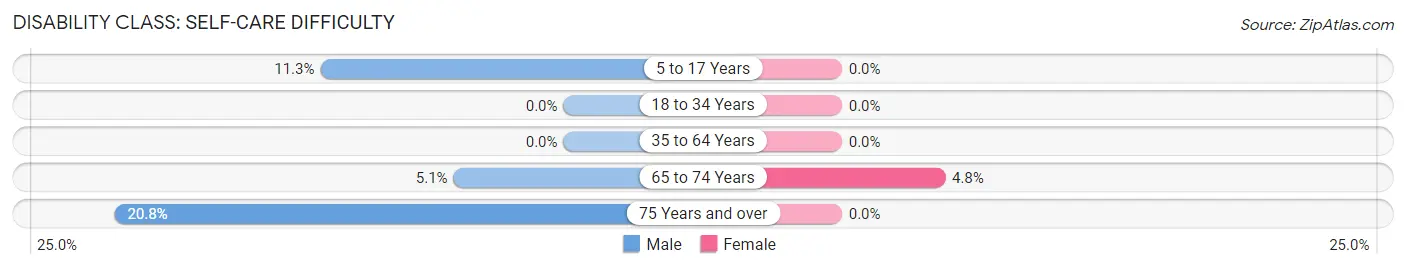
| Age Bracket | Male | Female |
| 5 to 17 Years | 143 (11.3%) | 0 (0.0%) |
| 18 to 34 Years | 0 (0.0%) | 0 (0.0%) |
| 35 to 64 Years | 0 (0.0%) | 0 (0.0%) |
| 65 to 74 Years | 13 (5.1%) | 17 (4.8%) |
| 75 Years and over | 40 (20.8%) | 0 (0.0%) |
Technology Access in Innsbrook
Computing Device Access in Innsbrook
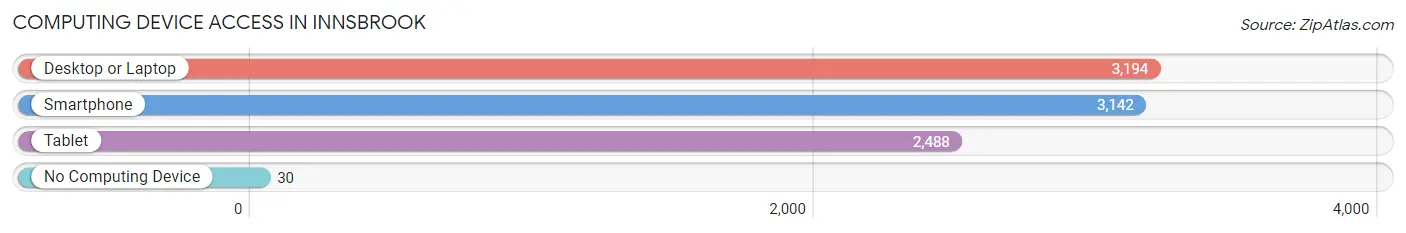
| Device Type | # Households | % Households |
| Desktop or Laptop | 3,194 | 96.8% |
| Smartphone | 3,142 | 95.2% |
| Tablet | 2,488 | 75.4% |
| No Computing Device | 30 | 0.9% |
| Total | 3,300 | 100.0% |
Internet Access in Innsbrook
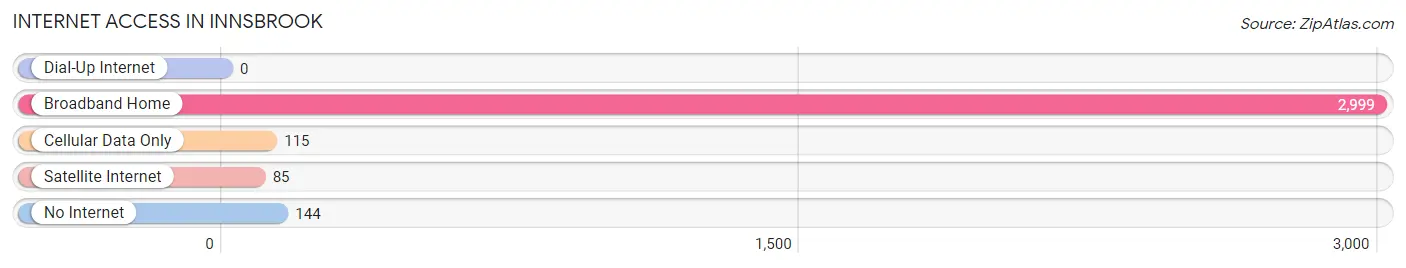
| Internet Type | # Households | % Households |
| Dial-Up Internet | 0 | 0.0% |
| Broadband Home | 2,999 | 90.9% |
| Cellular Data Only | 115 | 3.5% |
| Satellite Internet | 85 | 2.6% |
| No Internet | 144 | 4.4% |
| Total | 3,300 | 100.0% |
Innsbrook Summary
Innsbrook, Virginia is a census-designated place (CDP) located in Henrico County, Virginia. It is a suburban area located just west of Richmond, the state capital. Innsbrook is home to a variety of businesses, including a large office park, a golf course, and a shopping center. The population of Innsbrook was 8,845 at the 2010 census.
History
Innsbrook was first settled in the late 1700s by German immigrants. The area was originally known as “Innsbrook” due to its proximity to a nearby inn. In the early 1900s, the area was primarily used for farming and timber production. In the 1950s, the area began to be developed as a residential community. In the 1970s, the area was further developed with the construction of a large office park, a golf course, and a shopping center.
Geography
Innsbrook is located in Henrico County, Virginia, just west of Richmond. It is bordered by the city of Richmond to the east, Short Pump to the north, and Glen Allen to the south. The area is mostly flat, with an elevation of about 200 feet above sea level. The area is drained by the Chickahominy River, which flows through the western part of the CDP.
Economy
Innsbrook is home to a variety of businesses, including a large office park, a golf course, and a shopping center. The office park is home to a variety of businesses, including banks, insurance companies, and law firms. The golf course is a popular destination for golfers, and the shopping center is home to a variety of stores and restaurants. Innsbrook is also home to a number of hotels and other businesses.
Demographics
As of the 2010 census, the population of Innsbrook was 8,845. The racial makeup of the CDP was 79.2% White, 11.2% African American, 4.2% Asian, and 5.4% from other races. The median household income was $90,945, and the median family income was $103,945. The per capita income was $41,945.
Innsbrook is a diverse community, with a variety of cultures and backgrounds represented. The area is home to a variety of churches, including Baptist, Methodist, and Catholic. The area is also home to a variety of schools, including public, private, and charter schools.
Innsbrook is a vibrant and growing community. The area is home to a variety of businesses, and the population is steadily increasing. The area is a great place to live, work, and play, and is a great place to call home.
Common Questions
What is Per Capita Income in Innsbrook?
Per Capita income in Innsbrook is $54,111.
What is the Median Family Income in Innsbrook?
Median Family Income in Innsbrook is $138,709.
What is the Median Household income in Innsbrook?
Median Household Income in Innsbrook is $113,814.
What is Income or Wage Gap in Innsbrook?
Income or Wage Gap in Innsbrook is 28.9%.
Women in Innsbrook earn 71.1 cents for every dollar earned by a man.
What is Inequality or Gini Index in Innsbrook?
Inequality or Gini Index in Innsbrook is 0.44.
What is the Total Population of Innsbrook?
Total Population of Innsbrook is 8,699.
What is the Total Male Population of Innsbrook?
Total Male Population of Innsbrook is 4,503.
What is the Total Female Population of Innsbrook?
Total Female Population of Innsbrook is 4,196.
What is the Ratio of Males per 100 Females in Innsbrook?
There are 107.32 Males per 100 Females in Innsbrook.
What is the Ratio of Females per 100 Males in Innsbrook?
There are 93.18 Females per 100 Males in Innsbrook.
What is the Median Population Age in Innsbrook?
Median Population Age in Innsbrook is 34.9 Years.
What is the Average Family Size in Innsbrook
Average Family Size in Innsbrook is 3.2 People.
What is the Average Household Size in Innsbrook
Average Household Size in Innsbrook is 2.6 People.
How Large is the Labor Force in Innsbrook?
There are 4,762 People in the Labor Forcein in Innsbrook.
What is the Percentage of People in the Labor Force in Innsbrook?
72.8% of People are in the Labor Force in Innsbrook.
What is the Unemployment Rate in Innsbrook?
Unemployment Rate in Innsbrook is 4.4%.