Low Moor, VA Map & Demographics
Low Moor Map
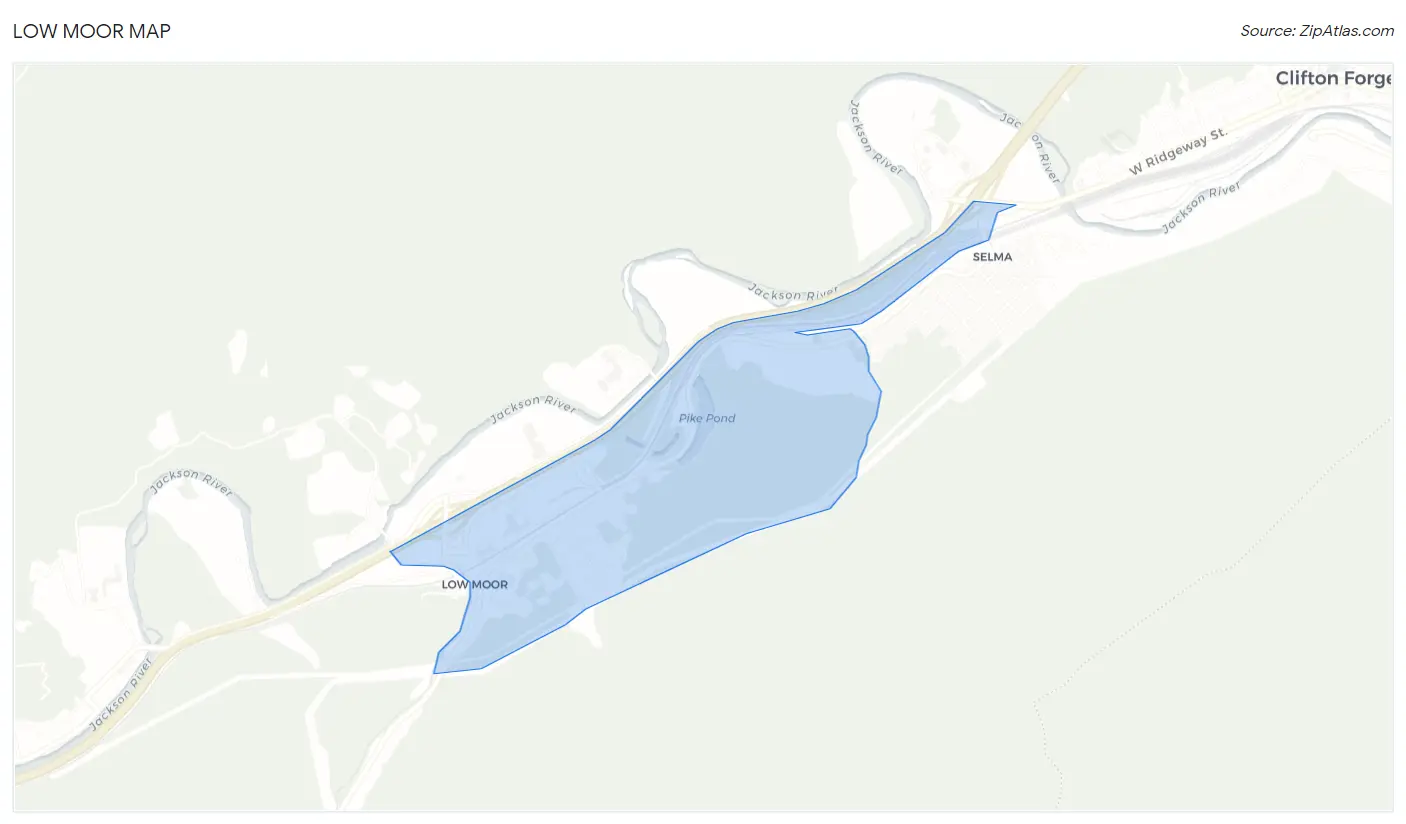
Low Moor Overview
$24,503
PER CAPITA INCOME
$92,885
AVG HOUSEHOLD INCOME
29.4%
WAGE / INCOME GAP [ % ]
70.6¢/ $1
WAGE / INCOME GAP [ $ ]
0.27
INEQUALITY / GINI INDEX
389
TOTAL POPULATION
182
MALE POPULATION
207
FEMALE POPULATION
87.92
MALES / 100 FEMALES
113.74
FEMALES / 100 MALES
51.0
MEDIAN AGE
2.7
AVG FAMILY SIZE
3.1
AVG HOUSEHOLD SIZE
173
LABOR FORCE [ PEOPLE ]
48.7%
PERCENT IN LABOR FORCE
Low Moor Zip Codes
Low Moor Area Codes
Income in Low Moor
Income Overview in Low Moor
| Characteristic | Number | Measure |
| Per Capita Income | 389 | $24,503 |
| Median Family Income | 94 | $0 |
| Mean Family Income | 94 | $60,148 |
| Median Household Income | 100 | $92,885 |
| Mean Household Income | 100 | $81,562 |
| Income Deficit | 94 | $0 |
| Wage / Income Gap (%) | 389 | 29.41% |
| Wage / Income Gap ($) | 389 | 70.59¢ per $1 |
| Gini / Inequality Index | 389 | 0.27 |
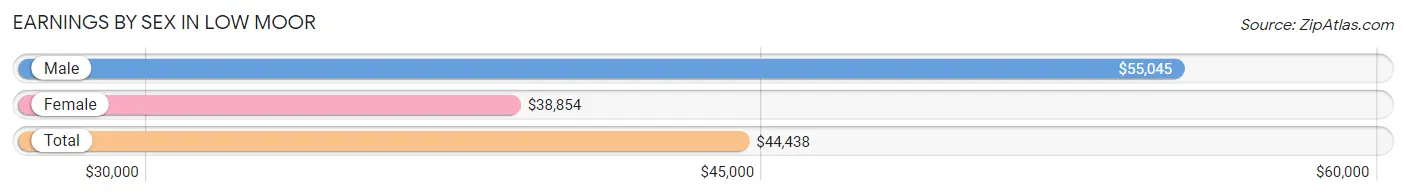
Earnings by Sex in Low Moor
Average Earnings in Low Moor are $44,438, $55,045 for men and $38,854 for women, a difference of 29.4%.
| Sex | Number | Average Earnings |
| Male | 110 (63.6%) | $55,045 |
| Female | 63 (36.4%) | $38,854 |
| Total | 173 (100.0%) | $44,438 |
Earnings by Sex by Income Bracket in Low Moor
The most common earnings brackets in Low Moor are $55,000 to $64,999 for men (56 | 50.9%) and $45,000 to $49,999 for women (26 | 41.3%).
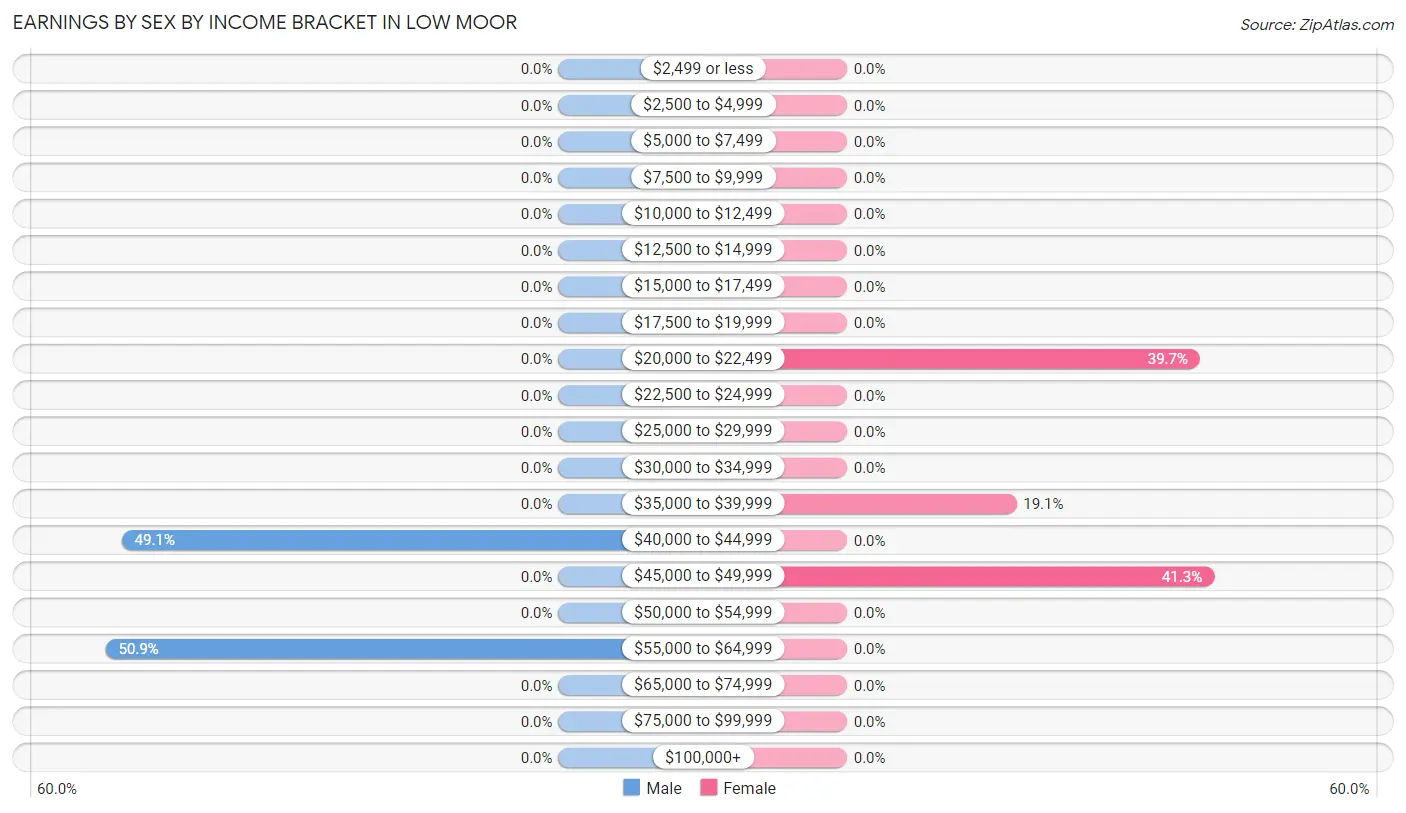
| Income | Male | Female |
| $2,499 or less | 0 (0.0%) | 0 (0.0%) |
| $2,500 to $4,999 | 0 (0.0%) | 0 (0.0%) |
| $5,000 to $7,499 | 0 (0.0%) | 0 (0.0%) |
| $7,500 to $9,999 | 0 (0.0%) | 0 (0.0%) |
| $10,000 to $12,499 | 0 (0.0%) | 0 (0.0%) |
| $12,500 to $14,999 | 0 (0.0%) | 0 (0.0%) |
| $15,000 to $17,499 | 0 (0.0%) | 0 (0.0%) |
| $17,500 to $19,999 | 0 (0.0%) | 0 (0.0%) |
| $20,000 to $22,499 | 0 (0.0%) | 25 (39.7%) |
| $22,500 to $24,999 | 0 (0.0%) | 0 (0.0%) |
| $25,000 to $29,999 | 0 (0.0%) | 0 (0.0%) |
| $30,000 to $34,999 | 0 (0.0%) | 0 (0.0%) |
| $35,000 to $39,999 | 0 (0.0%) | 12 (19.1%) |
| $40,000 to $44,999 | 54 (49.1%) | 0 (0.0%) |
| $45,000 to $49,999 | 0 (0.0%) | 26 (41.3%) |
| $50,000 to $54,999 | 0 (0.0%) | 0 (0.0%) |
| $55,000 to $64,999 | 56 (50.9%) | 0 (0.0%) |
| $65,000 to $74,999 | 0 (0.0%) | 0 (0.0%) |
| $75,000 to $99,999 | 0 (0.0%) | 0 (0.0%) |
| $100,000+ | 0 (0.0%) | 0 (0.0%) |
| Total | 110 (100.0%) | 63 (100.0%) |
Earnings by Sex by Educational Attainment in Low Moor
| Educational Attainment | Male Income | Female Income |
| Less than High School | - | - |
| High School Diploma | - | - |
| College or Associate's Degree | - | - |
| Bachelor's Degree | - | - |
| Graduate Degree | - | - |
| Total | $55,804 | $38,854 |
Family Income in Low Moor
Family Income Brackets in Low Moor
According to the Low Moor family income data, there are 38 families falling into the $35,000 to $49,999 income range, which is the most common income bracket and makes up 40.4% of all families.
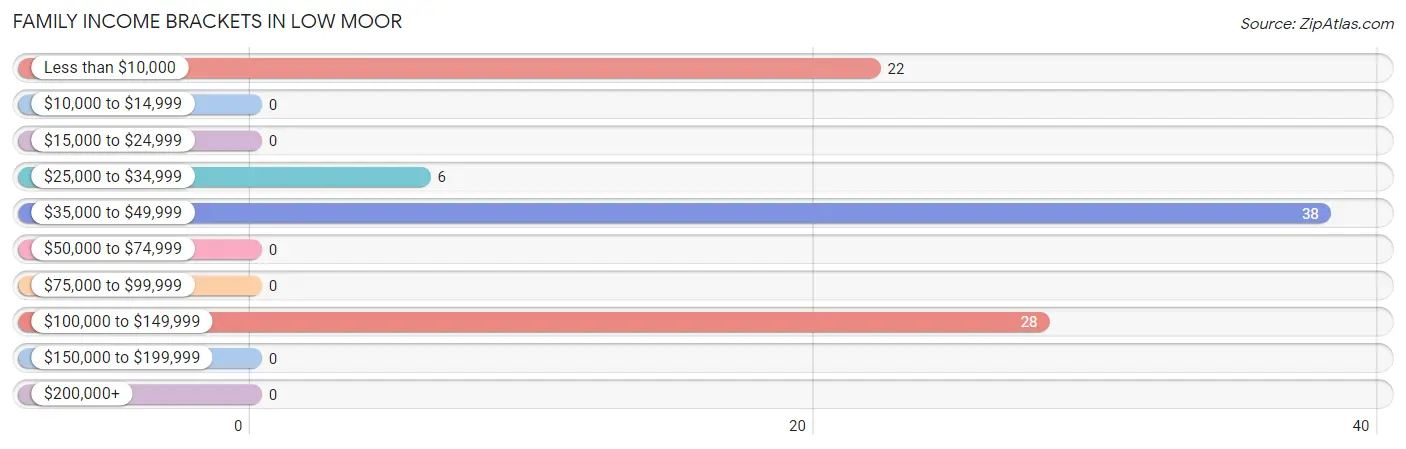
| Income Bracket | # Families | % Families |
| Less than $10,000 | 22 | 23.4% |
| $10,000 to $14,999 | 0 | 0.0% |
| $15,000 to $24,999 | 0 | 0.0% |
| $25,000 to $34,999 | 6 | 6.4% |
| $35,000 to $49,999 | 38 | 40.4% |
| $50,000 to $74,999 | 0 | 0.0% |
| $75,000 to $99,999 | 0 | 0.0% |
| $100,000 to $149,999 | 28 | 29.8% |
| $150,000 to $199,999 | 0 | 0.0% |
| $200,000+ | 0 | 0.0% |
Family Income by Famaliy Size in Low Moor
| Income Bracket | # Families | Median Income |
| 2-Person Families | 66 (70.2%) | $0 |
| 3-Person Families | 0 (0.0%) | $0 |
| 4-Person Families | 28 (29.8%) | $0 |
| 5-Person Families | 0 (0.0%) | $0 |
| 6-Person Families | 0 (0.0%) | $0 |
| 7+ Person Families | 0 (0.0%) | $0 |
| Total | 94 (100.0%) | $0 |
Family Income by Number of Earners in Low Moor
| Number of Earners | # Families | Median Income |
| No Earners | 28 (29.8%) | $0 |
| 1 Earner | 38 (40.4%) | $0 |
| 2 Earners | 0 (0.0%) | $0 |
| 3+ Earners | 28 (29.8%) | $0 |
| Total | 94 (100.0%) | $0 |
Household Income in Low Moor
Household Income Brackets in Low Moor
With 28 households falling in the category, the $100,000 to $149,999 income range is the most frequent in Low Moor, accounting for 28.0% of all households.
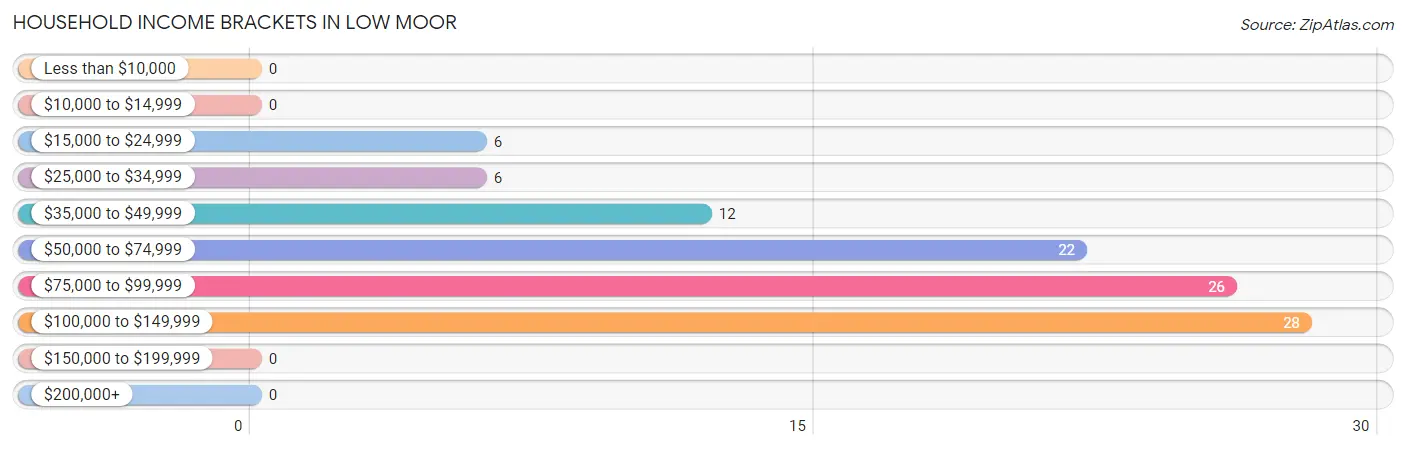
| Income Bracket | # Households | % Households |
| Less than $10,000 | 0 | 0.0% |
| $10,000 to $14,999 | 0 | 0.0% |
| $15,000 to $24,999 | 6 | 6.0% |
| $25,000 to $34,999 | 6 | 6.0% |
| $35,000 to $49,999 | 12 | 12.0% |
| $50,000 to $74,999 | 22 | 22.0% |
| $75,000 to $99,999 | 26 | 26.0% |
| $100,000 to $149,999 | 28 | 28.0% |
| $150,000 to $199,999 | 0 | 0.0% |
| $200,000+ | 0 | 0.0% |
Household Income by Householder Age in Low Moor
| Income Bracket | # Households | Median Income |
| 15 to 24 Years | 0 (0.0%) | $0 |
| 25 to 44 Years | 38 (38.0%) | $0 |
| 45 to 64 Years | 50 (50.0%) | $0 |
| 65+ Years | 12 (12.0%) | $0 |
| Total | 100 (100.0%) | $92,885 |
Poverty in Low Moor
Income Below Poverty by Sex and Age in Low Moor
With 25.7% poverty level for males and 15.9% for females among the residents of Low Moor, 35 to 44 year old males and 55 to 64 year old females are the most vulnerable to poverty, with 44 males (68.8%) and 22 females (100.0%) in their respective age groups living below the poverty level.
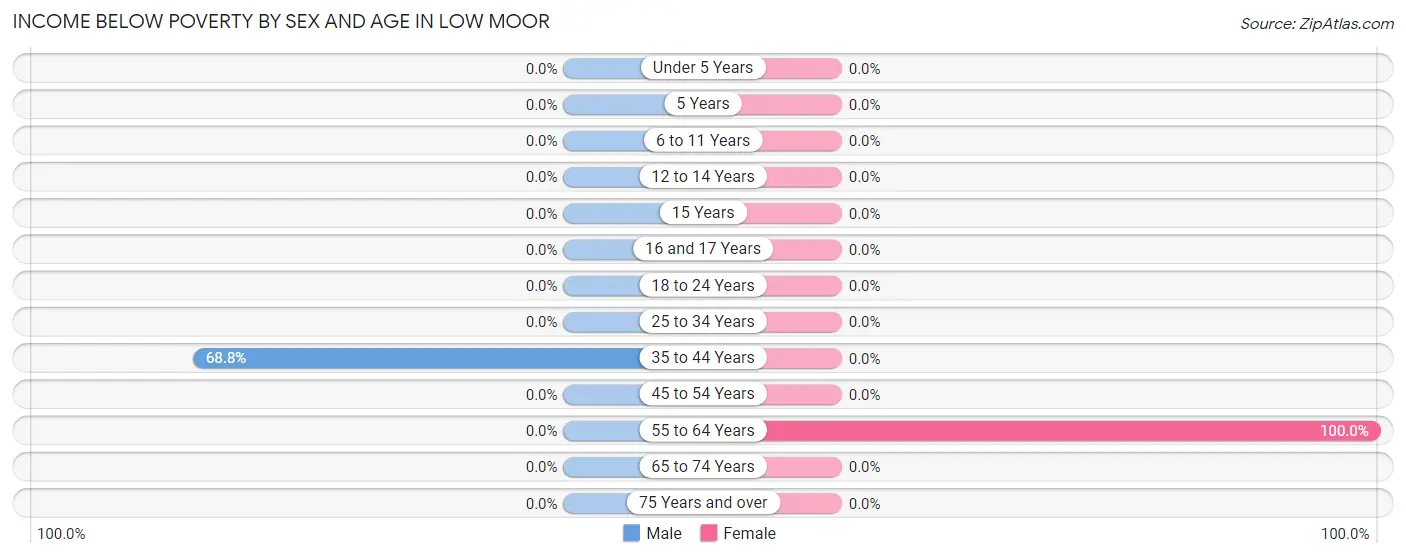
| Age Bracket | Male | Female |
| Under 5 Years | 0 (0.0%) | 0 (0.0%) |
| 5 Years | 0 (0.0%) | 0 (0.0%) |
| 6 to 11 Years | 0 (0.0%) | 0 (0.0%) |
| 12 to 14 Years | 0 (0.0%) | 0 (0.0%) |
| 15 Years | 0 (0.0%) | 0 (0.0%) |
| 16 and 17 Years | 0 (0.0%) | 0 (0.0%) |
| 18 to 24 Years | 0 (0.0%) | 0 (0.0%) |
| 25 to 34 Years | 0 (0.0%) | 0 (0.0%) |
| 35 to 44 Years | 44 (68.8%) | 0 (0.0%) |
| 45 to 54 Years | 0 (0.0%) | 0 (0.0%) |
| 55 to 64 Years | 0 (0.0%) | 22 (100.0%) |
| 65 to 74 Years | 0 (0.0%) | 0 (0.0%) |
| 75 Years and over | 0 (0.0%) | 0 (0.0%) |
| Total | 44 (25.7%) | 22 (15.9%) |
Income Above Poverty by Sex and Age in Low Moor
According to the poverty statistics in Low Moor, males aged 12 to 14 years and females aged 6 to 11 years are the age groups that are most secure financially, with 100.0% of males and 100.0% of females in these age groups living above the poverty line.
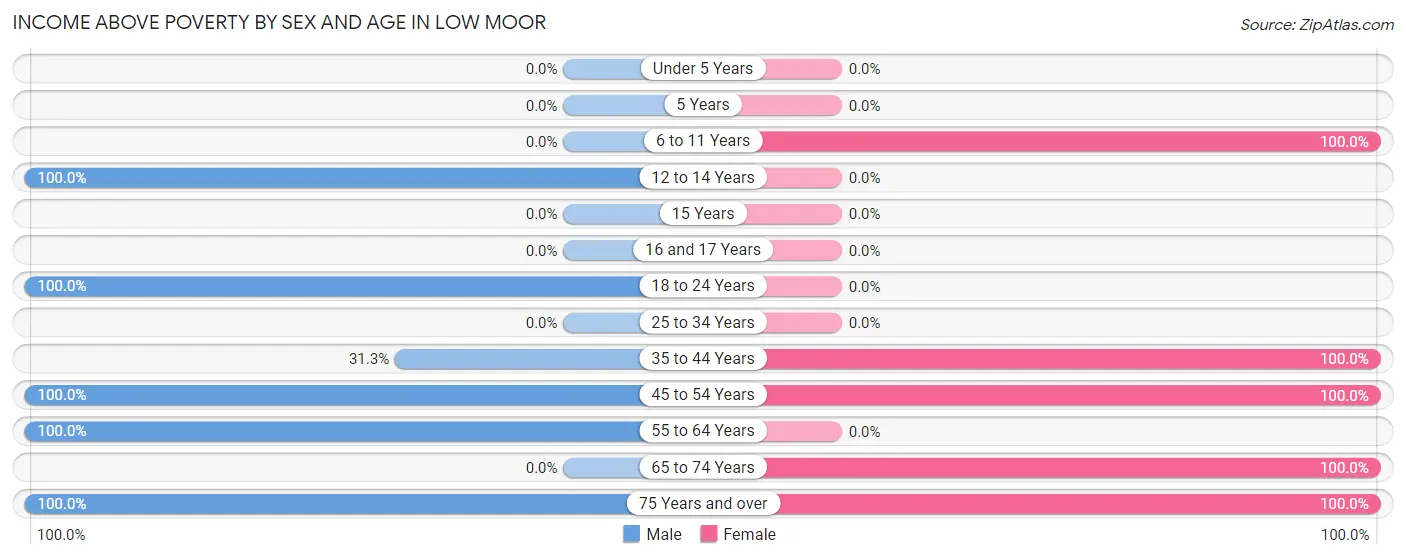
| Age Bracket | Male | Female |
| Under 5 Years | 0 (0.0%) | 0 (0.0%) |
| 5 Years | 0 (0.0%) | 0 (0.0%) |
| 6 to 11 Years | 0 (0.0%) | 23 (100.0%) |
| 12 to 14 Years | 11 (100.0%) | 0 (0.0%) |
| 15 Years | 0 (0.0%) | 0 (0.0%) |
| 16 and 17 Years | 0 (0.0%) | 0 (0.0%) |
| 18 to 24 Years | 34 (100.0%) | 0 (0.0%) |
| 25 to 34 Years | 0 (0.0%) | 0 (0.0%) |
| 35 to 44 Years | 20 (31.2%) | 38 (100.0%) |
| 45 to 54 Years | 28 (100.0%) | 25 (100.0%) |
| 55 to 64 Years | 28 (100.0%) | 0 (0.0%) |
| 65 to 74 Years | 0 (0.0%) | 19 (100.0%) |
| 75 Years and over | 6 (100.0%) | 11 (100.0%) |
| Total | 127 (74.3%) | 116 (84.1%) |
Income Below Poverty Among Married-Couple Families in Low Moor
| Children | Above Poverty | Below Poverty |
| No Children | 34 (100.0%) | 0 (0.0%) |
| 1 or 2 Children | 0 (0.0%) | 0 (0.0%) |
| 3 or 4 Children | 0 (0.0%) | 0 (0.0%) |
| 5 or more Children | 0 (0.0%) | 0 (0.0%) |
| Total | 34 (100.0%) | 0 (0.0%) |
Income Below Poverty Among Single-Parent Households in Low Moor
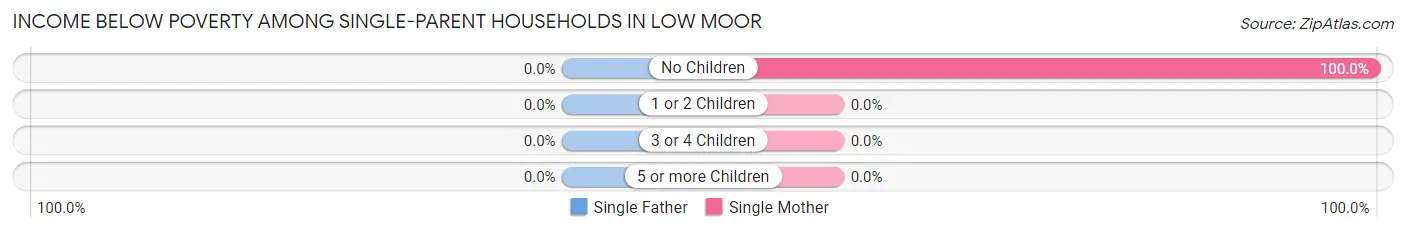
| Children | Single Father | Single Mother |
| No Children | 0 (0.0%) | 22 (100.0%) |
| 1 or 2 Children | 0 (0.0%) | 0 (0.0%) |
| 3 or 4 Children | 0 (0.0%) | 0 (0.0%) |
| 5 or more Children | 0 (0.0%) | 0 (0.0%) |
| Total | 0 (0.0%) | 22 (36.7%) |
Income Below Poverty Among Married-Couple vs Single-Parent Households in Low Moor
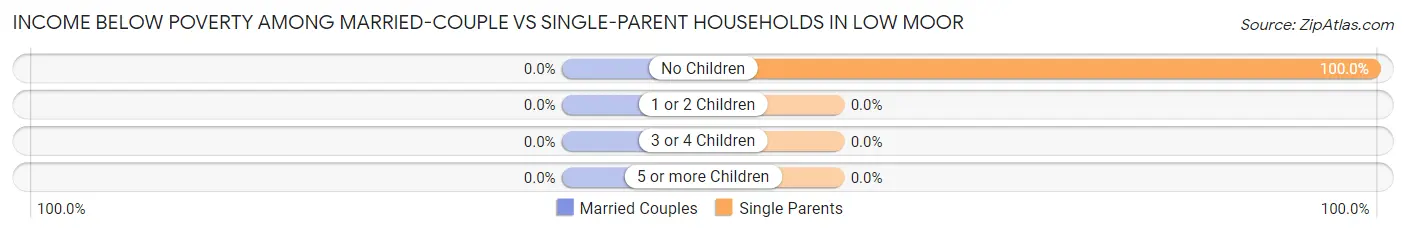
| Children | Married-Couple Families | Single-Parent Households |
| No Children | 0 (0.0%) | 22 (100.0%) |
| 1 or 2 Children | 0 (0.0%) | 0 (0.0%) |
| 3 or 4 Children | 0 (0.0%) | 0 (0.0%) |
| 5 or more Children | 0 (0.0%) | 0 (0.0%) |
| Total | 0 (0.0%) | 22 (36.7%) |
Race in Low Moor
The most populous races in Low Moor are White / Caucasian (374 | 96.1%), and Black / African American (15 | 3.9%).
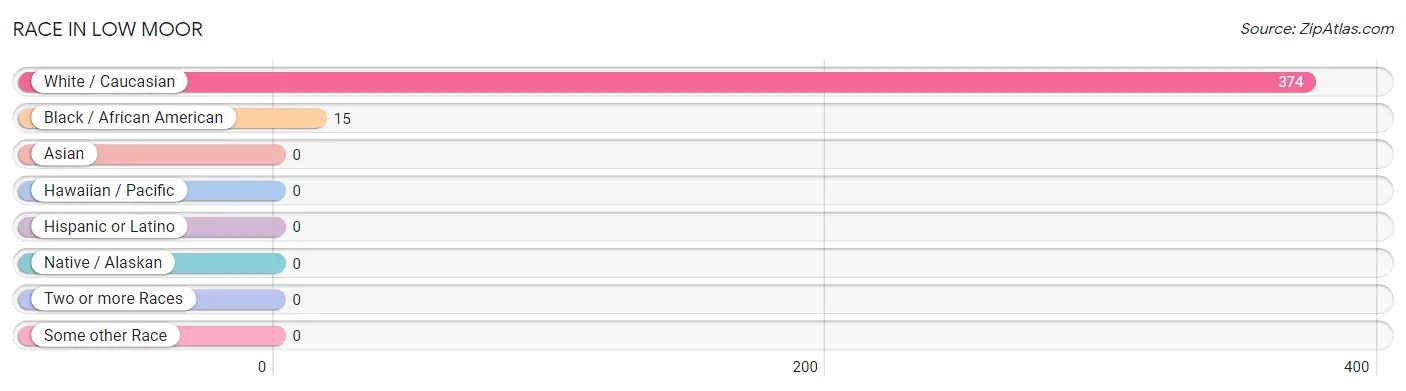
| Race | # Population | % Population |
| Asian | 0 | 0.0% |
| Black / African American | 15 | 3.9% |
| Hawaiian / Pacific | 0 | 0.0% |
| Hispanic or Latino | 0 | 0.0% |
| Native / Alaskan | 0 | 0.0% |
| White / Caucasian | 374 | 96.1% |
| Two or more Races | 0 | 0.0% |
| Some other Race | 0 | 0.0% |
| Total | 389 | 100.0% |
Ancestry in Low Moor
The most populous ancestries reported in Low Moor are German (78 | 20.1%), Scandinavian (78 | 20.1%), American (66 | 17.0%), Italian (51 | 13.1%), and French (28 | 7.2%), together accounting for 77.4% of all Low Moor residents.
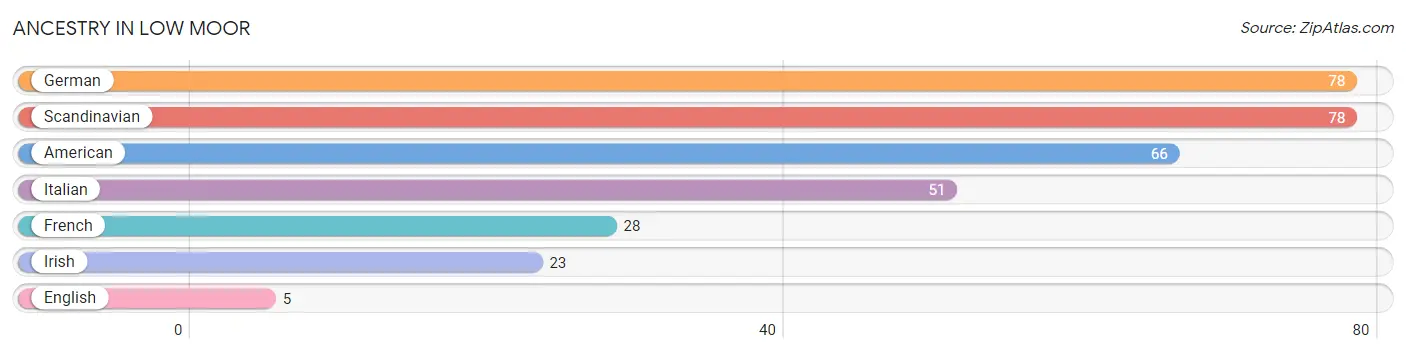
| Ancestry | # Population | % Population |
| American | 66 | 17.0% |
| English | 5 | 1.3% |
| French | 28 | 7.2% |
| German | 78 | 20.1% |
| Irish | 23 | 5.9% |
| Italian | 51 | 13.1% |
| Scandinavian | 78 | 20.1% | View All 7 Rows |
Immigrants in Low Moor
The most numerous immigrant groups reported in Low Moor came from Canada (6 | 1.5%), Europe (5 | 1.3%), Ireland (5 | 1.3%), and Northern Europe (5 | 1.3%), together accounting for 5.4% of all Low Moor residents.
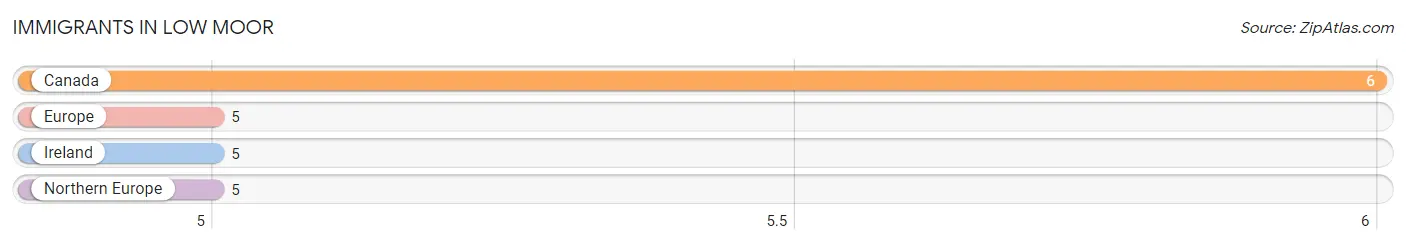
| Immigration Origin | # Population | % Population |
| Canada | 6 | 1.5% |
| Europe | 5 | 1.3% |
| Ireland | 5 | 1.3% |
| Northern Europe | 5 | 1.3% | View All 4 Rows |
Sex and Age in Low Moor
Sex and Age in Low Moor
The most populous age groups in Low Moor are 35 to 39 Years (44 | 24.2%) for men and 85 Years and over (40 | 19.3%) for women.
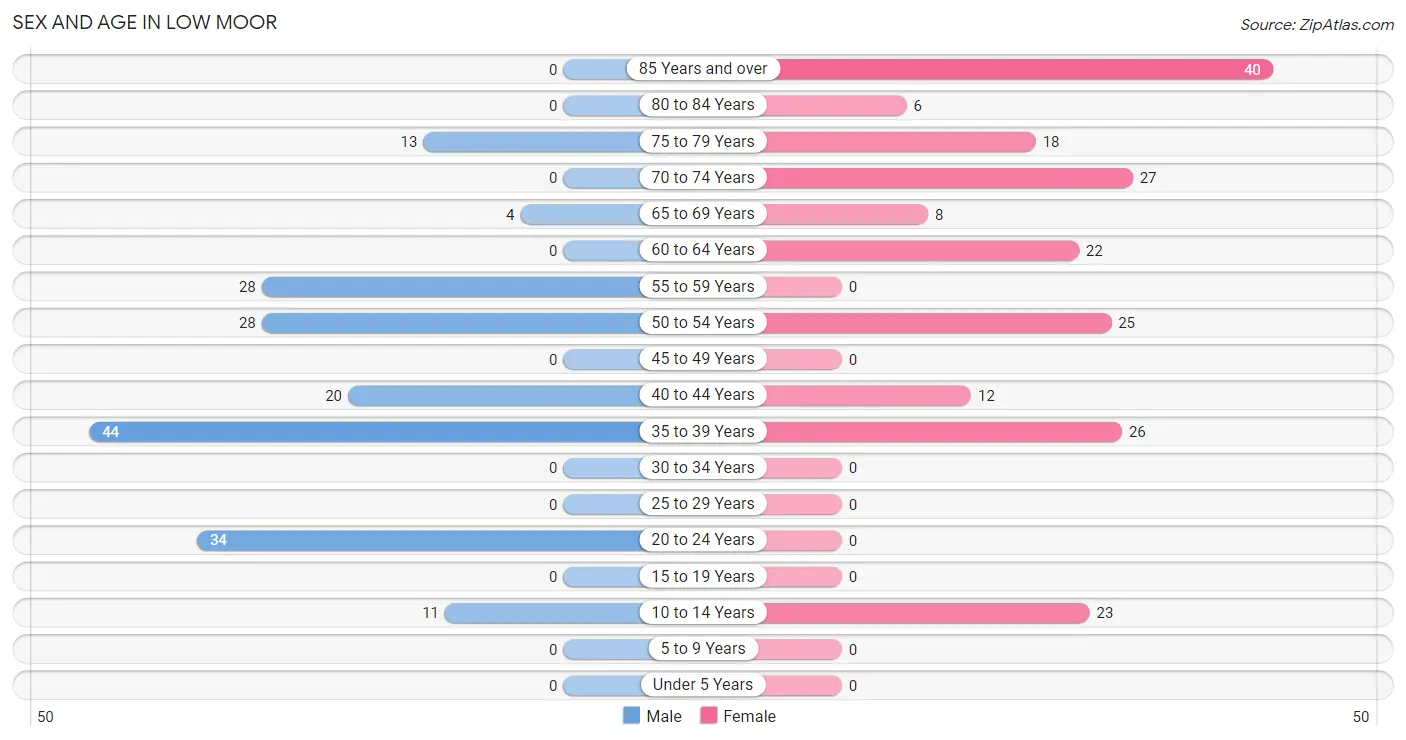
| Age Bracket | Male | Female |
| Under 5 Years | 0 (0.0%) | 0 (0.0%) |
| 5 to 9 Years | 0 (0.0%) | 0 (0.0%) |
| 10 to 14 Years | 11 (6.0%) | 23 (11.1%) |
| 15 to 19 Years | 0 (0.0%) | 0 (0.0%) |
| 20 to 24 Years | 34 (18.7%) | 0 (0.0%) |
| 25 to 29 Years | 0 (0.0%) | 0 (0.0%) |
| 30 to 34 Years | 0 (0.0%) | 0 (0.0%) |
| 35 to 39 Years | 44 (24.2%) | 26 (12.6%) |
| 40 to 44 Years | 20 (11.0%) | 12 (5.8%) |
| 45 to 49 Years | 0 (0.0%) | 0 (0.0%) |
| 50 to 54 Years | 28 (15.4%) | 25 (12.1%) |
| 55 to 59 Years | 28 (15.4%) | 0 (0.0%) |
| 60 to 64 Years | 0 (0.0%) | 22 (10.6%) |
| 65 to 69 Years | 4 (2.2%) | 8 (3.9%) |
| 70 to 74 Years | 0 (0.0%) | 27 (13.0%) |
| 75 to 79 Years | 13 (7.1%) | 18 (8.7%) |
| 80 to 84 Years | 0 (0.0%) | 6 (2.9%) |
| 85 Years and over | 0 (0.0%) | 40 (19.3%) |
| Total | 182 (100.0%) | 207 (100.0%) |
Families and Households in Low Moor
Median Family Size in Low Moor
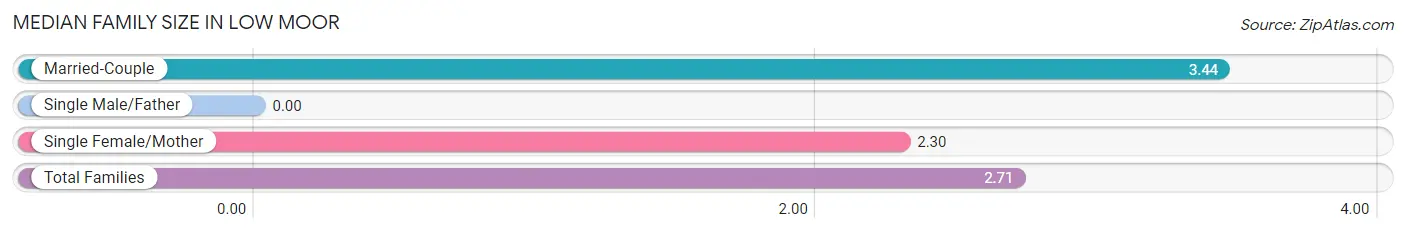
| Family Type | # Families | Family Size |
| Married-Couple | 34 (36.2%) | 3.44 |
| Single Male/Father | 0 (0.0%) | - |
| Single Female/Mother | 60 (63.8%) | 2.30 |
| Total Families | 94 (100.0%) | 2.71 |
Median Household Size in Low Moor
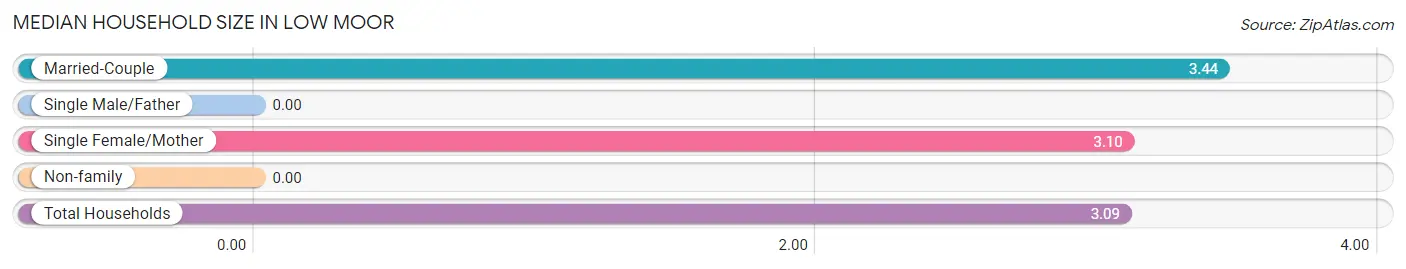
| Household Type | # Households | Household Size |
| Married-Couple | 34 (34.0%) | 3.44 |
| Single Male/Father | 0 (0.0%) | - |
| Single Female/Mother | 60 (60.0%) | 3.10 |
| Non-family | 6 (6.0%) | - |
| Total Households | 100 (100.0%) | 3.09 |
Household Size by Marriage Status in Low Moor
Out of a total of 100 households in Low Moor, 94 (94.0%) are family households, while 6 (6.0%) are nonfamily households. The most numerous type of family households are 3-person households, comprising 48, and the most common type of nonfamily households are 1-person households, comprising 6.
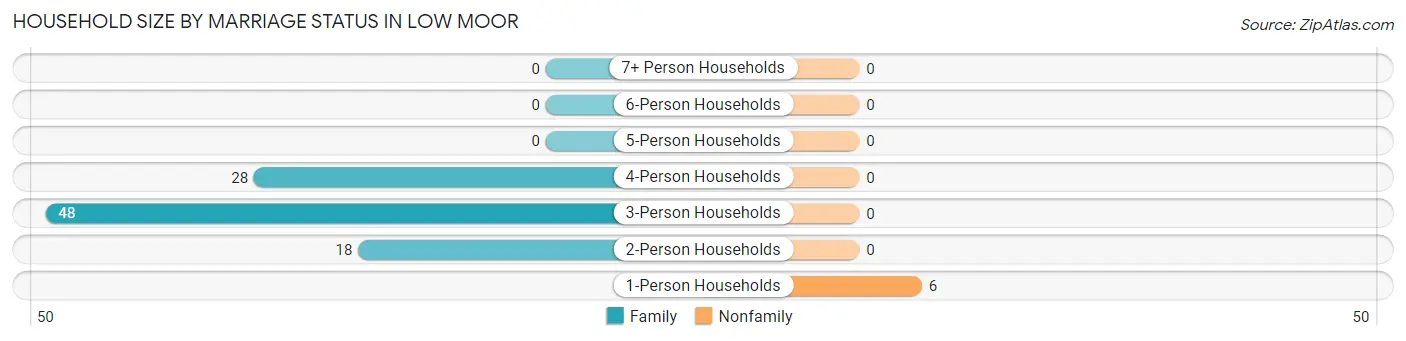
| Household Size | Family Households | Nonfamily Households |
| 1-Person Households | - | 6 (6.0%) |
| 2-Person Households | 18 (18.0%) | 0 (0.0%) |
| 3-Person Households | 48 (48.0%) | 0 (0.0%) |
| 4-Person Households | 28 (28.0%) | 0 (0.0%) |
| 5-Person Households | 0 (0.0%) | 0 (0.0%) |
| 6-Person Households | 0 (0.0%) | 0 (0.0%) |
| 7+ Person Households | 0 (0.0%) | 0 (0.0%) |
| Total | 94 (94.0%) | 6 (6.0%) |
Female Fertility in Low Moor
Fertility by Age in Low Moor
| Age Bracket | Women with Births | Births / 1,000 Women |
| 15 to 19 years | 0 (0.0%) | 0.0 |
| 20 to 34 years | 0 (0.0%) | 0.0 |
| 35 to 50 years | 0 (0.0%) | 0.0 |
| Total | 0 (0.0%) | 0.0 |
Fertility by Age by Marriage Status in Low Moor
| Age Bracket | Married | Unmarried |
| 15 to 19 years | 0 (0.0%) | 0 (0.0%) |
| 20 to 34 years | 0 (0.0%) | 0 (0.0%) |
| 35 to 50 years | 0 (0.0%) | 0 (0.0%) |
| Total | 0 (0.0%) | 0 (0.0%) |
Fertility by Education in Low Moor
| Educational Attainment | Women with Births | Births / 1,000 Women |
| Less than High School | 0 (0.0%) | 0.0 |
| High School Diploma | 0 (0.0%) | 0.0 |
| College or Associate's Degree | 0 (0.0%) | 0.0 |
| Bachelor's Degree | 0 (0.0%) | 0.0 |
| Graduate Degree | 0 (0.0%) | 0.0 |
| Total | 0 (0.0%) | 0.0 |
Fertility by Education by Marriage Status in Low Moor
| Educational Attainment | Married | Unmarried |
| Less than High School | 0 (0.0%) | 0 (0.0%) |
| High School Diploma | 0 (0.0%) | 0 (0.0%) |
| College or Associate's Degree | 0 (0.0%) | 0 (0.0%) |
| Bachelor's Degree | 0 (0.0%) | 0 (0.0%) |
| Graduate Degree | 0 (0.0%) | 0 (0.0%) |
| Total | 0 (0.0%) | 0 (0.0%) |
Employment Characteristics in Low Moor
Employment by Class of Employer in Low Moor
Among the 173 employed individuals in Low Moor, private company employees (136 | 78.6%), and local government employees (37 | 21.4%) make up the most common classes of employment.
| Employer Class | # Employees | % Employees |
| Private Company Employees | 136 | 78.6% |
| Self-Employed (Incorporated) | 0 | 0.0% |
| Self-Employed (Not Incorporated) | 0 | 0.0% |
| Not-for-profit Organizations | 0 | 0.0% |
| Local Government Employees | 37 | 21.4% |
| State Government Employees | 0 | 0.0% |
| Federal Government Employees | 0 | 0.0% |
| Unpaid Family Workers | 0 | 0.0% |
| Total | 173 | 100.0% |
Employment Status by Age in Low Moor
| Age Bracket | In Labor Force | Unemployed |
| 16 to 19 Years | 0 (0.0%) | 0 (0.0%) |
| 20 to 24 Years | 34 (100.0%) | 0 (0.0%) |
| 25 to 29 Years | 0 (0.0%) | 0 (0.0%) |
| 30 to 34 Years | 0 (0.0%) | 0 (0.0%) |
| 35 to 44 Years | 58 (56.9%) | 0 (0.0%) |
| 45 to 54 Years | 53 (100.0%) | 0 (0.0%) |
| 55 to 59 Years | 28 (100.0%) | 0 (0.0%) |
| 60 to 64 Years | 0 (0.0%) | 0 (0.0%) |
| 65 to 74 Years | 0 (0.0%) | 0 (0.0%) |
| 75 Years and over | 0 (0.0%) | 0 (0.0%) |
| Total | 173 (48.7%) | 0 (0.0%) |
Employment Status by Educational Attainment in Low Moor
| Educational Attainment | In Labor Force | Unemployed |
| Less than High School | 28 (29.8%) | 0 (0.0%) |
| High School Diploma | 46 (100.0%) | 0 (0.0%) |
| College / Associate Degree | 65 (100.0%) | 0 (0.0%) |
| Bachelor's Degree or higher | 0 (0.0%) | 0 (0.0%) |
| Total | 139 (67.8%) | 0 (0.0%) |
Employment Occupations by Sex in Low Moor
Management, Business, Science and Arts Occupations
The most common Management, Business, Science and Arts occupations in Low Moor are Computers, Engineering & Science (34 | 19.7%), Life, Physical & Social Science (34 | 19.7%), Management (28 | 16.2%), Health Diagnosing & Treating (26 | 15.0%), and Community & Social Service (25 | 14.4%).
Management, Business, Science and Arts Occupations by Sex
Within the Management, Business, Science and Arts occupations in Low Moor, the most male-oriented occupations are Management (100.0%), Computers, Engineering & Science (100.0%), and Life, Physical & Social Science (100.0%), while the most female-oriented occupations are Community & Social Service (100.0%), Education Instruction & Library (100.0%), and Health Diagnosing & Treating (100.0%).
| Occupation | Male | Female |
| Management | 28 (100.0%) | 0 (0.0%) |
| Business & Financial | 0 (0.0%) | 0 (0.0%) |
| Computers, Engineering & Science | 34 (100.0%) | 0 (0.0%) |
| Computers & Mathematics | 0 (0.0%) | 0 (0.0%) |
| Architecture & Engineering | 0 (0.0%) | 0 (0.0%) |
| Life, Physical & Social Science | 34 (100.0%) | 0 (0.0%) |
| Community & Social Service | 0 (0.0%) | 25 (100.0%) |
| Education, Arts & Media | 0 (0.0%) | 0 (0.0%) |
| Legal Services & Support | 0 (0.0%) | 0 (0.0%) |
| Education Instruction & Library | 0 (0.0%) | 25 (100.0%) |
| Arts, Media & Entertainment | 0 (0.0%) | 0 (0.0%) |
| Health Diagnosing & Treating | 0 (0.0%) | 26 (100.0%) |
| Health Technologists | 0 (0.0%) | 0 (0.0%) |
| Total (Category) | 62 (54.9%) | 51 (45.1%) |
| Total (Overall) | 110 (63.6%) | 63 (36.4%) |
Services Occupations
Services Occupations by Sex
| Occupation | Male | Female |
| Healthcare Support | 0 (0.0%) | 0 (0.0%) |
| Security & Protection | 0 (0.0%) | 0 (0.0%) |
| Firefighting & Prevention | 0 (0.0%) | 0 (0.0%) |
| Law Enforcement | 0 (0.0%) | 0 (0.0%) |
| Food Preparation & Serving | 0 (0.0%) | 0 (0.0%) |
| Cleaning & Maintenance | 0 (0.0%) | 0 (0.0%) |
| Personal Care & Service | 0 (0.0%) | 0 (0.0%) |
| Total (Category) | 0 (0.0%) | 0 (0.0%) |
| Total (Overall) | 110 (63.6%) | 63 (36.4%) |
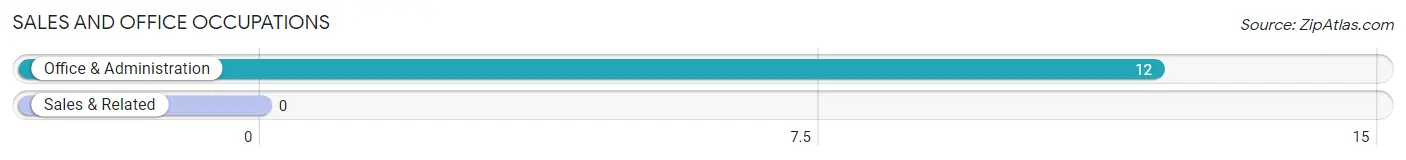
Sales and Office Occupations
The most common Sales and Office occupations in Low Moor are , and Office & Administration (12 | 6.9%).
Sales and Office Occupations by Sex
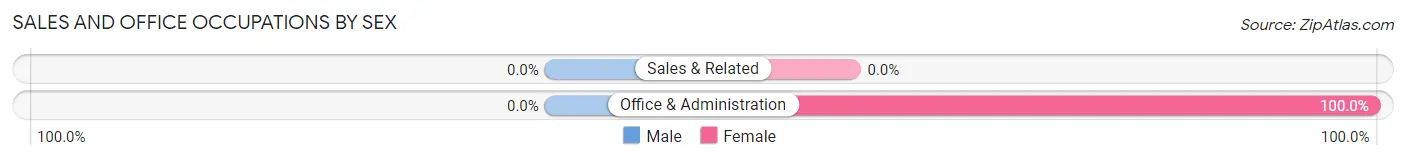
| Occupation | Male | Female |
| Sales & Related | 0 (0.0%) | 0 (0.0%) |
| Office & Administration | 0 (0.0%) | 12 (100.0%) |
| Total (Category) | 0 (0.0%) | 12 (100.0%) |
| Total (Overall) | 110 (63.6%) | 63 (36.4%) |
Natural Resources, Construction and Maintenance Occupations
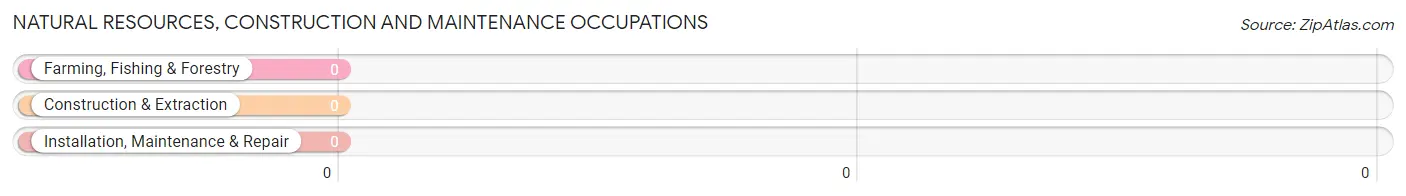
Natural Resources, Construction and Maintenance Occupations by Sex
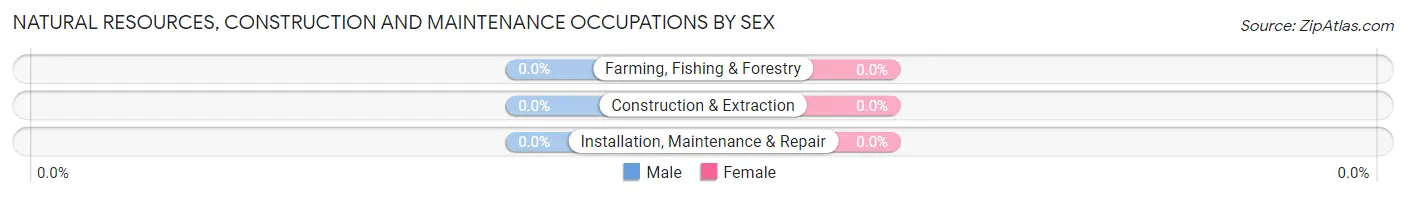
| Occupation | Male | Female |
| Farming, Fishing & Forestry | 0 (0.0%) | 0 (0.0%) |
| Construction & Extraction | 0 (0.0%) | 0 (0.0%) |
| Installation, Maintenance & Repair | 0 (0.0%) | 0 (0.0%) |
| Total (Category) | 0 (0.0%) | 0 (0.0%) |
| Total (Overall) | 110 (63.6%) | 63 (36.4%) |
Production, Transportation and Moving Occupations
The most common Production, Transportation and Moving occupations in Low Moor are , and Transportation (48 | 27.8%).
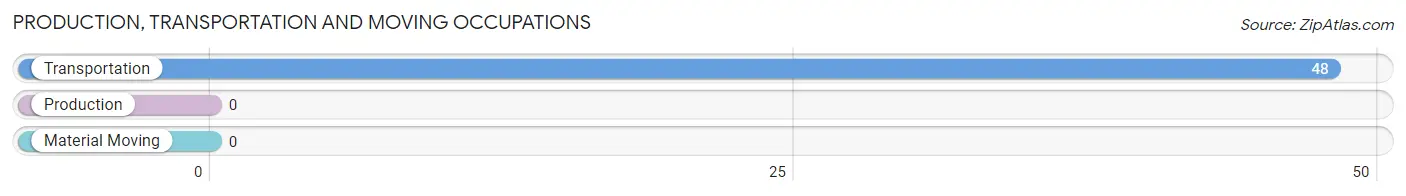
Production, Transportation and Moving Occupations by Sex
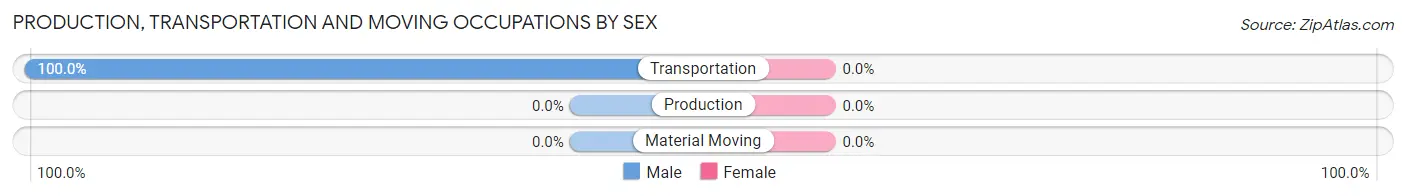
| Occupation | Male | Female |
| Production | 0 (0.0%) | 0 (0.0%) |
| Transportation | 48 (100.0%) | 0 (0.0%) |
| Material Moving | 0 (0.0%) | 0 (0.0%) |
| Total (Category) | 48 (100.0%) | 0 (0.0%) |
| Total (Overall) | 110 (63.6%) | 63 (36.4%) |
Employment Industries by Sex in Low Moor
Employment Industries in Low Moor
The major employment industries in Low Moor include Educational Services (37 | 21.4%), Manufacturing (34 | 19.7%), Construction (28 | 16.2%), Accommodation & Food Services (28 | 16.2%), and Health Care & Social Assistance (26 | 15.0%).
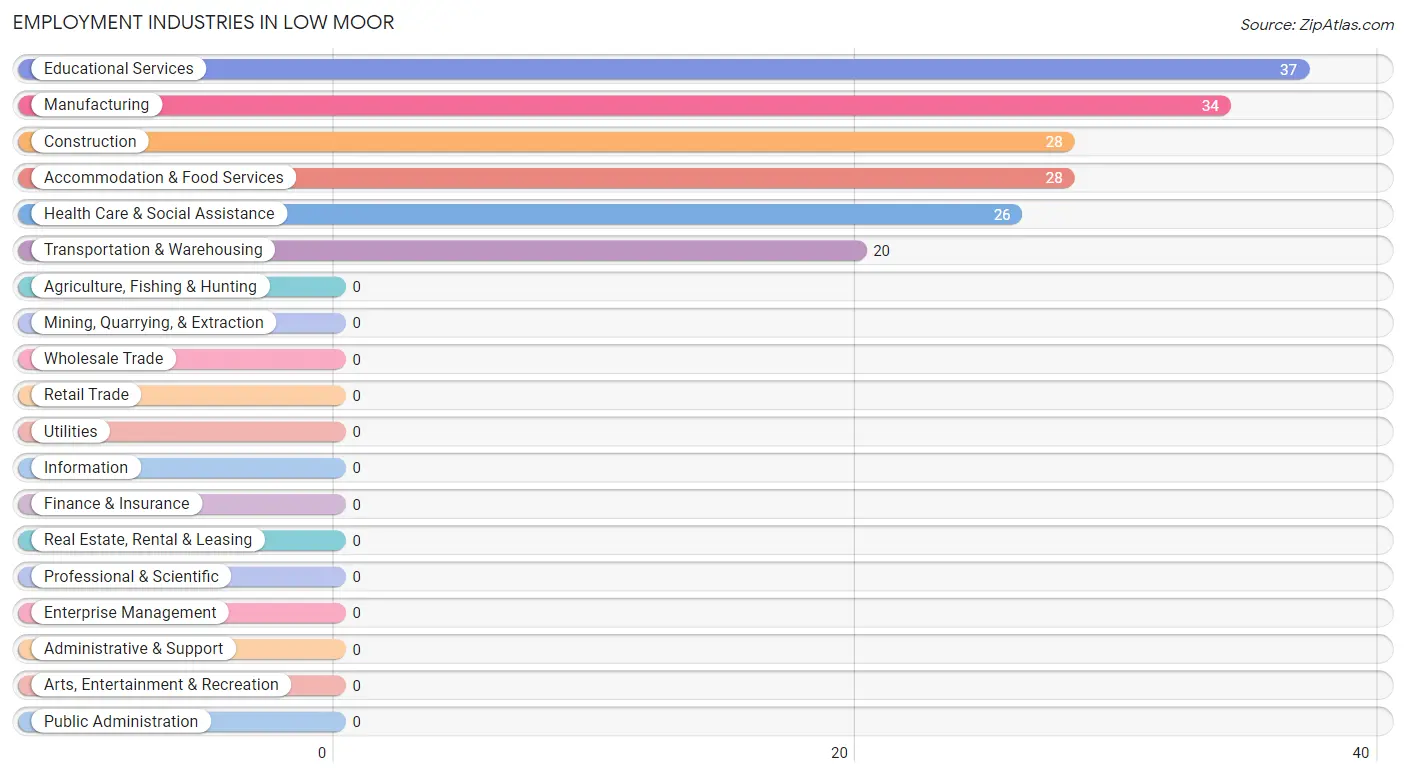
Employment Industries by Sex in Low Moor
The Low Moor industries that see more men than women are Construction (100.0%), Manufacturing (100.0%), and Transportation & Warehousing (100.0%), whereas the industries that tend to have a higher number of women are Educational Services (100.0%), and Health Care & Social Assistance (100.0%).
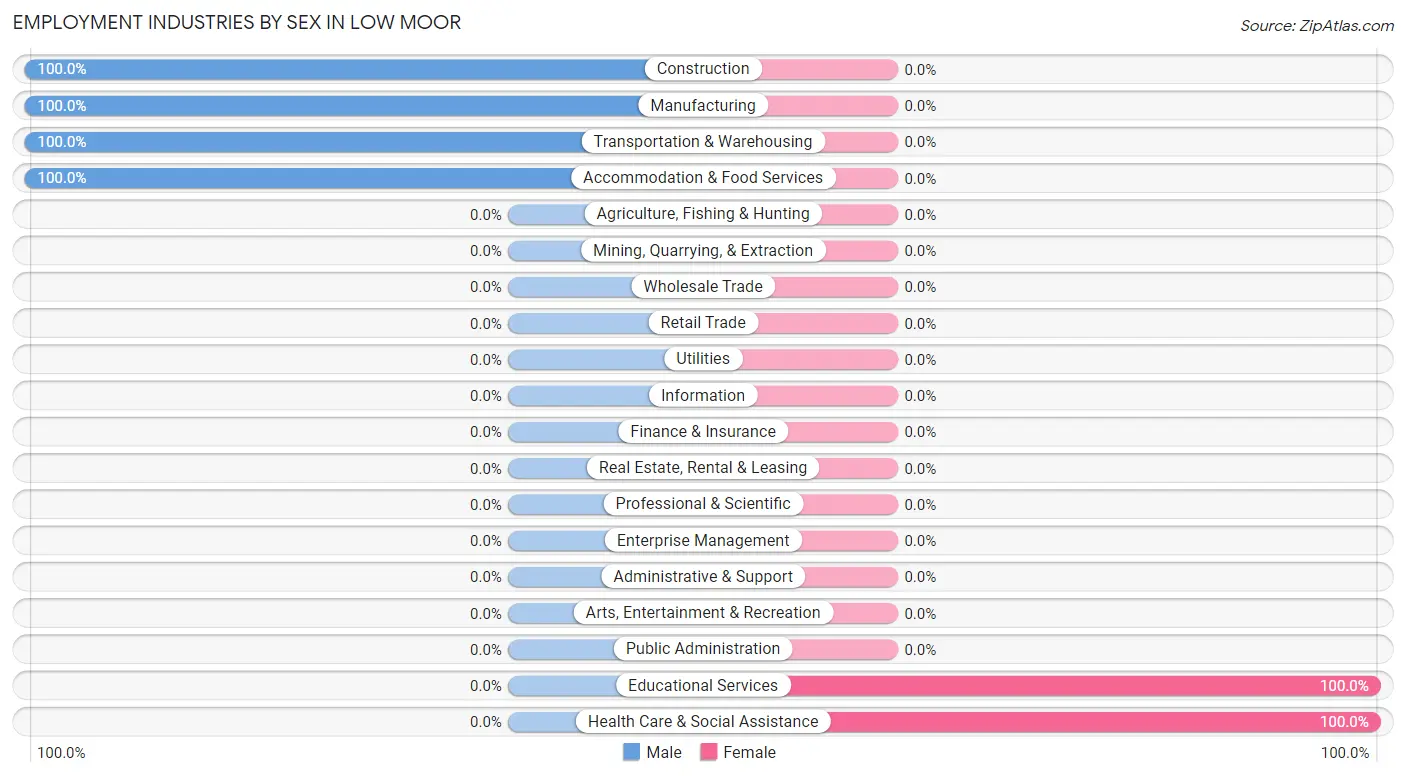
| Industry | Male | Female |
| Agriculture, Fishing & Hunting | 0 (0.0%) | 0 (0.0%) |
| Mining, Quarrying, & Extraction | 0 (0.0%) | 0 (0.0%) |
| Construction | 28 (100.0%) | 0 (0.0%) |
| Manufacturing | 34 (100.0%) | 0 (0.0%) |
| Wholesale Trade | 0 (0.0%) | 0 (0.0%) |
| Retail Trade | 0 (0.0%) | 0 (0.0%) |
| Transportation & Warehousing | 20 (100.0%) | 0 (0.0%) |
| Utilities | 0 (0.0%) | 0 (0.0%) |
| Information | 0 (0.0%) | 0 (0.0%) |
| Finance & Insurance | 0 (0.0%) | 0 (0.0%) |
| Real Estate, Rental & Leasing | 0 (0.0%) | 0 (0.0%) |
| Professional & Scientific | 0 (0.0%) | 0 (0.0%) |
| Enterprise Management | 0 (0.0%) | 0 (0.0%) |
| Administrative & Support | 0 (0.0%) | 0 (0.0%) |
| Educational Services | 0 (0.0%) | 37 (100.0%) |
| Health Care & Social Assistance | 0 (0.0%) | 26 (100.0%) |
| Arts, Entertainment & Recreation | 0 (0.0%) | 0 (0.0%) |
| Accommodation & Food Services | 28 (100.0%) | 0 (0.0%) |
| Public Administration | 0 (0.0%) | 0 (0.0%) |
| Total | 110 (63.6%) | 63 (36.4%) |
Education in Low Moor
School Enrollment in Low Moor
The most common levels of schooling among the 34 students in Low Moor are middle school (23 | 67.6%), and high school (11 | 32.4%).
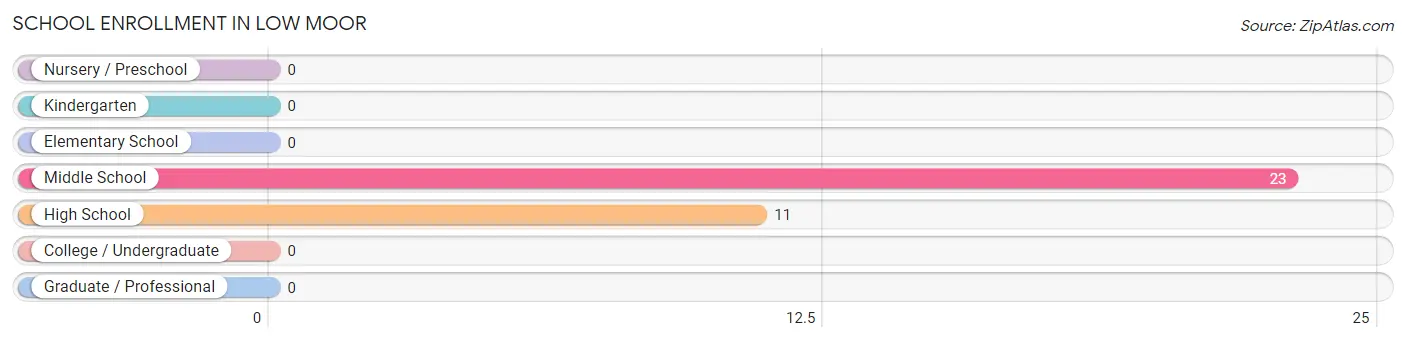
| School Level | # Students | % Students |
| Nursery / Preschool | 0 | 0.0% |
| Kindergarten | 0 | 0.0% |
| Elementary School | 0 | 0.0% |
| Middle School | 23 | 67.6% |
| High School | 11 | 32.4% |
| College / Undergraduate | 0 | 0.0% |
| Graduate / Professional | 0 | 0.0% |
| Total | 34 | 100.0% |
School Enrollment by Age by Funding Source in Low Moor
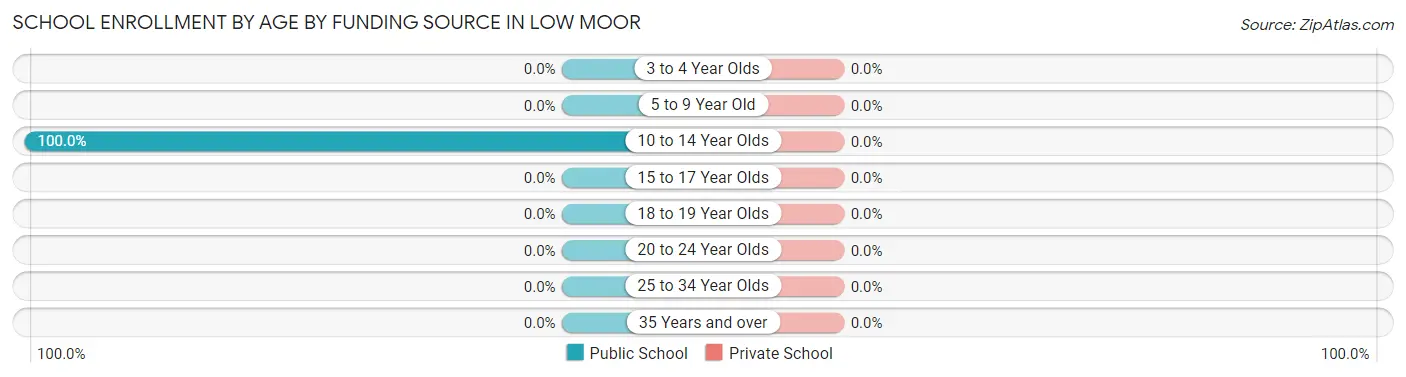
| Age Bracket | Public School | Private School |
| 3 to 4 Year Olds | 0 (0.0%) | 0 (0.0%) |
| 5 to 9 Year Old | 0 (0.0%) | 0 (0.0%) |
| 10 to 14 Year Olds | 34 (100.0%) | 0 (0.0%) |
| 15 to 17 Year Olds | 0 (0.0%) | 0 (0.0%) |
| 18 to 19 Year Olds | 0 (0.0%) | 0 (0.0%) |
| 20 to 24 Year Olds | 0 (0.0%) | 0 (0.0%) |
| 25 to 34 Year Olds | 0 (0.0%) | 0 (0.0%) |
| 35 Years and over | 0 (0.0%) | 0 (0.0%) |
| Total | 34 (100.0%) | 0 (0.0%) |
Educational Attainment by Field of Study in Low Moor
, and arts & humanities (3 | 100.0%) are the most common fields of study among 3 individuals in Low Moor who have obtained a bachelor's degree or higher.
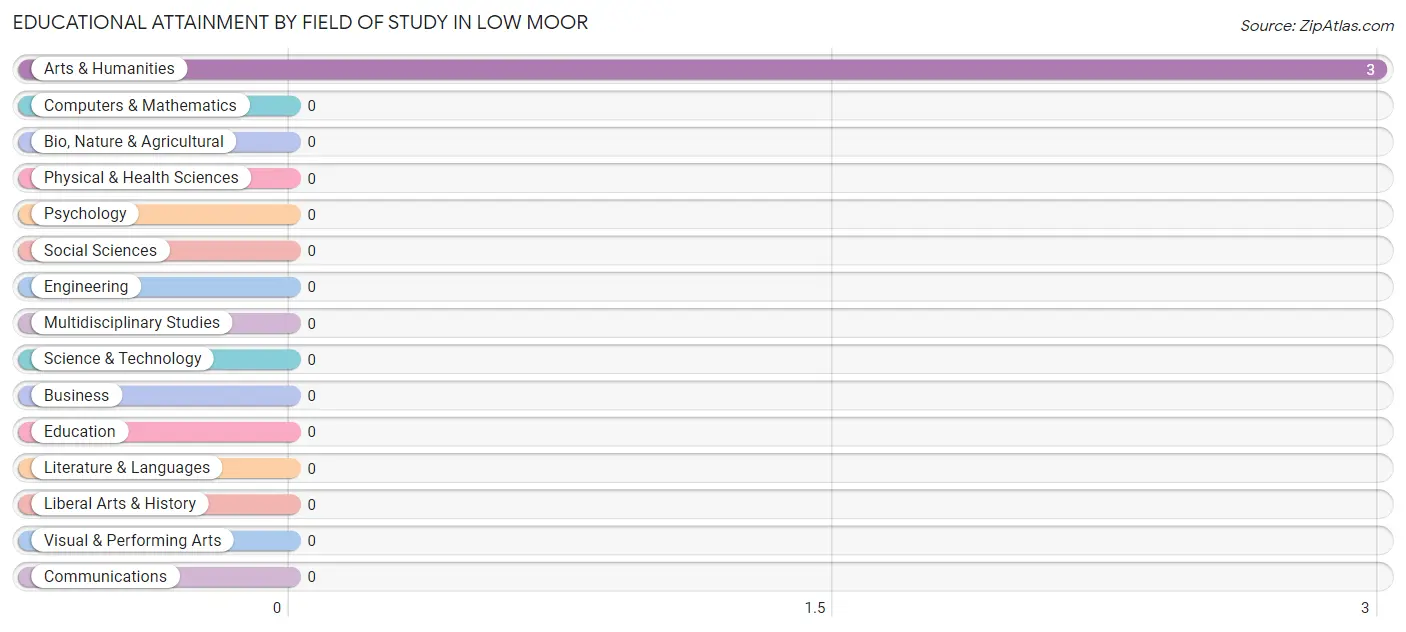
| Field of Study | # Graduates | % Graduates |
| Computers & Mathematics | 0 | 0.0% |
| Bio, Nature & Agricultural | 0 | 0.0% |
| Physical & Health Sciences | 0 | 0.0% |
| Psychology | 0 | 0.0% |
| Social Sciences | 0 | 0.0% |
| Engineering | 0 | 0.0% |
| Multidisciplinary Studies | 0 | 0.0% |
| Science & Technology | 0 | 0.0% |
| Business | 0 | 0.0% |
| Education | 0 | 0.0% |
| Literature & Languages | 0 | 0.0% |
| Liberal Arts & History | 0 | 0.0% |
| Visual & Performing Arts | 0 | 0.0% |
| Communications | 0 | 0.0% |
| Arts & Humanities | 3 | 100.0% |
| Total | 3 | 100.0% |
Transportation & Commute in Low Moor
Vehicle Availability by Sex in Low Moor
The most prevalent vehicle ownership categories in Low Moor are males with 5 or more vehicles (62, accounting for 56.4%) and females with 5 or more vehicles (25, making up 98.4%).
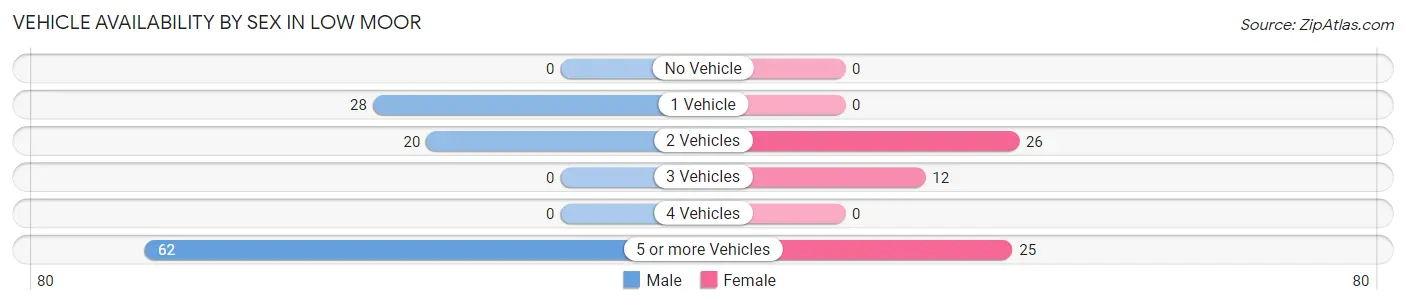
| Vehicles Available | Male | Female |
| No Vehicle | 0 (0.0%) | 0 (0.0%) |
| 1 Vehicle | 28 (25.5%) | 0 (0.0%) |
| 2 Vehicles | 20 (18.2%) | 26 (41.3%) |
| 3 Vehicles | 0 (0.0%) | 12 (19.1%) |
| 4 Vehicles | 0 (0.0%) | 0 (0.0%) |
| 5 or more Vehicles | 62 (56.4%) | 25 (39.7%) |
| Total | 110 (100.0%) | 63 (100.0%) |
Commute Time in Low Moor
The most frequently occuring commute durations in Low Moor are 30 to 34 minutes (54 commuters, 31.2%), 5 to 9 minutes (34 commuters, 19.7%), and 45 to 59 minutes (28 commuters, 16.2%).
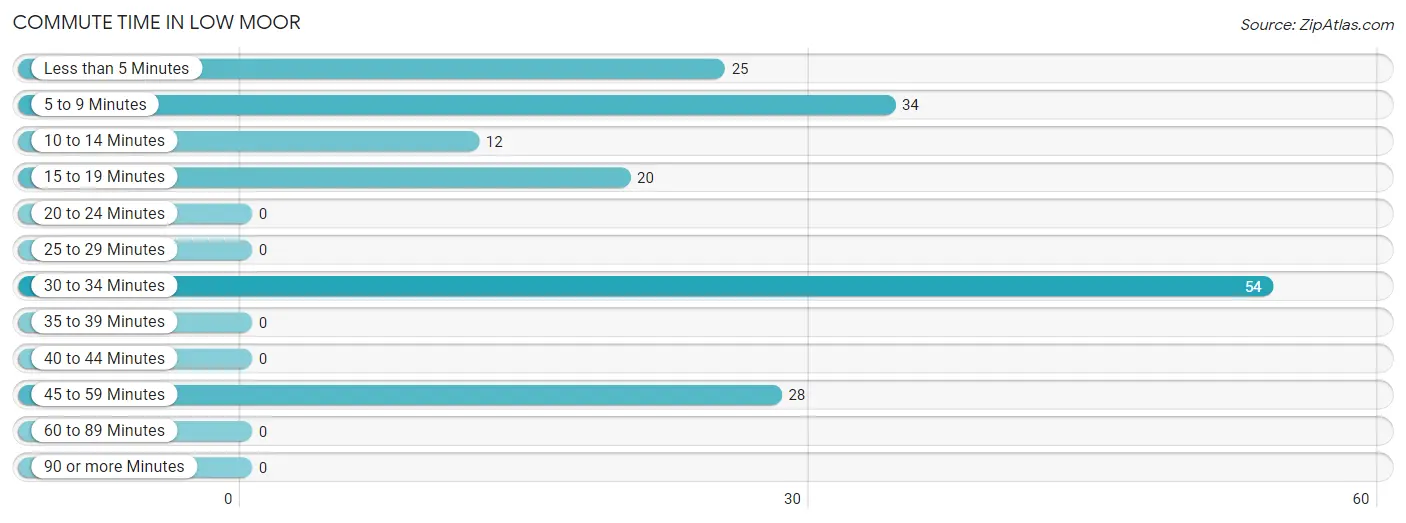
| Commute Time | # Commuters | % Commuters |
| Less than 5 Minutes | 25 | 14.4% |
| 5 to 9 Minutes | 34 | 19.7% |
| 10 to 14 Minutes | 12 | 6.9% |
| 15 to 19 Minutes | 20 | 11.6% |
| 20 to 24 Minutes | 0 | 0.0% |
| 25 to 29 Minutes | 0 | 0.0% |
| 30 to 34 Minutes | 54 | 31.2% |
| 35 to 39 Minutes | 0 | 0.0% |
| 40 to 44 Minutes | 0 | 0.0% |
| 45 to 59 Minutes | 28 | 16.2% |
| 60 to 89 Minutes | 0 | 0.0% |
| 90 or more Minutes | 0 | 0.0% |
Commute Time by Sex in Low Moor
The most common commute times in Low Moor are 5 to 9 minutes (34 commuters, 30.9%) for males and 30 to 34 minutes (26 commuters, 41.3%) for females.
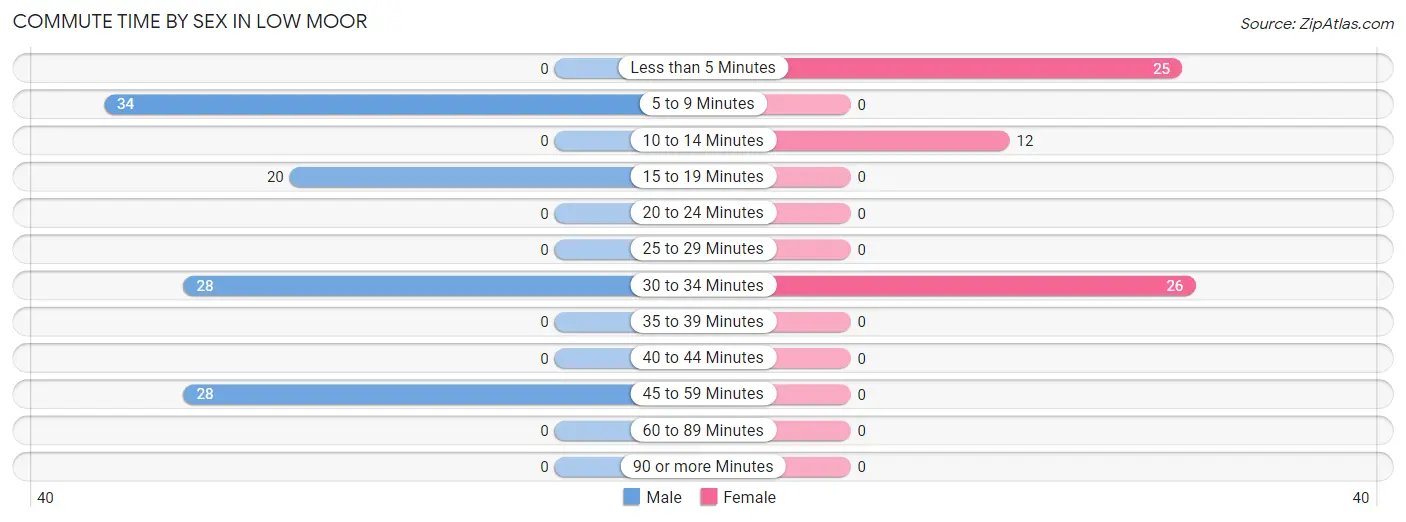
| Commute Time | Male | Female |
| Less than 5 Minutes | 0 (0.0%) | 25 (39.7%) |
| 5 to 9 Minutes | 34 (30.9%) | 0 (0.0%) |
| 10 to 14 Minutes | 0 (0.0%) | 12 (19.1%) |
| 15 to 19 Minutes | 20 (18.2%) | 0 (0.0%) |
| 20 to 24 Minutes | 0 (0.0%) | 0 (0.0%) |
| 25 to 29 Minutes | 0 (0.0%) | 0 (0.0%) |
| 30 to 34 Minutes | 28 (25.5%) | 26 (41.3%) |
| 35 to 39 Minutes | 0 (0.0%) | 0 (0.0%) |
| 40 to 44 Minutes | 0 (0.0%) | 0 (0.0%) |
| 45 to 59 Minutes | 28 (25.5%) | 0 (0.0%) |
| 60 to 89 Minutes | 0 (0.0%) | 0 (0.0%) |
| 90 or more Minutes | 0 (0.0%) | 0 (0.0%) |
Time of Departure to Work by Sex in Low Moor
The most frequent times of departure to work in Low Moor are 8:00 AM to 8:29 AM (34, 30.9%) for males and 6:30 AM to 6:59 AM (26, 41.3%) for females.
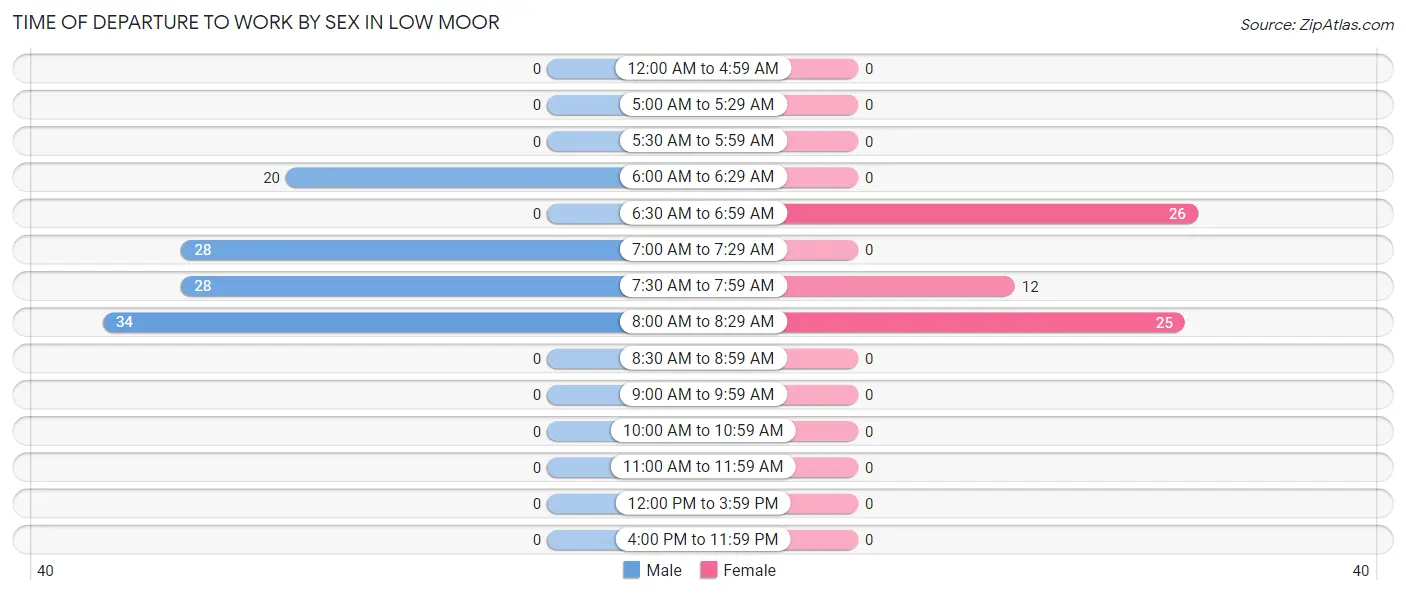
| Time of Departure | Male | Female |
| 12:00 AM to 4:59 AM | 0 (0.0%) | 0 (0.0%) |
| 5:00 AM to 5:29 AM | 0 (0.0%) | 0 (0.0%) |
| 5:30 AM to 5:59 AM | 0 (0.0%) | 0 (0.0%) |
| 6:00 AM to 6:29 AM | 20 (18.2%) | 0 (0.0%) |
| 6:30 AM to 6:59 AM | 0 (0.0%) | 26 (41.3%) |
| 7:00 AM to 7:29 AM | 28 (25.5%) | 0 (0.0%) |
| 7:30 AM to 7:59 AM | 28 (25.5%) | 12 (19.1%) |
| 8:00 AM to 8:29 AM | 34 (30.9%) | 25 (39.7%) |
| 8:30 AM to 8:59 AM | 0 (0.0%) | 0 (0.0%) |
| 9:00 AM to 9:59 AM | 0 (0.0%) | 0 (0.0%) |
| 10:00 AM to 10:59 AM | 0 (0.0%) | 0 (0.0%) |
| 11:00 AM to 11:59 AM | 0 (0.0%) | 0 (0.0%) |
| 12:00 PM to 3:59 PM | 0 (0.0%) | 0 (0.0%) |
| 4:00 PM to 11:59 PM | 0 (0.0%) | 0 (0.0%) |
| Total | 110 (100.0%) | 63 (100.0%) |
Housing Occupancy in Low Moor
Occupancy by Ownership in Low Moor
Of the total 100 dwellings in Low Moor, owner-occupied units account for 50 (50.0%), while renter-occupied units make up 50 (50.0%).
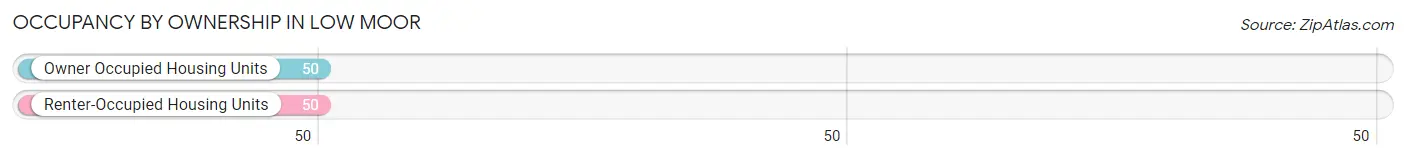
| Occupancy | # Housing Units | % Housing Units |
| Owner Occupied Housing Units | 50 | 50.0% |
| Renter-Occupied Housing Units | 50 | 50.0% |
| Total Occupied Housing Units | 100 | 100.0% |
Occupancy by Household Size in Low Moor
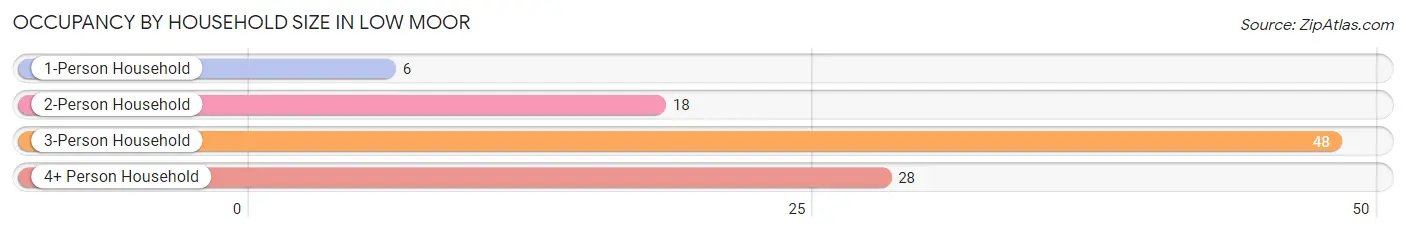
| Household Size | # Housing Units | % Housing Units |
| 1-Person Household | 6 | 6.0% |
| 2-Person Household | 18 | 18.0% |
| 3-Person Household | 48 | 48.0% |
| 4+ Person Household | 28 | 28.0% |
| Total Housing Units | 100 | 100.0% |
Occupancy by Ownership by Household Size in Low Moor
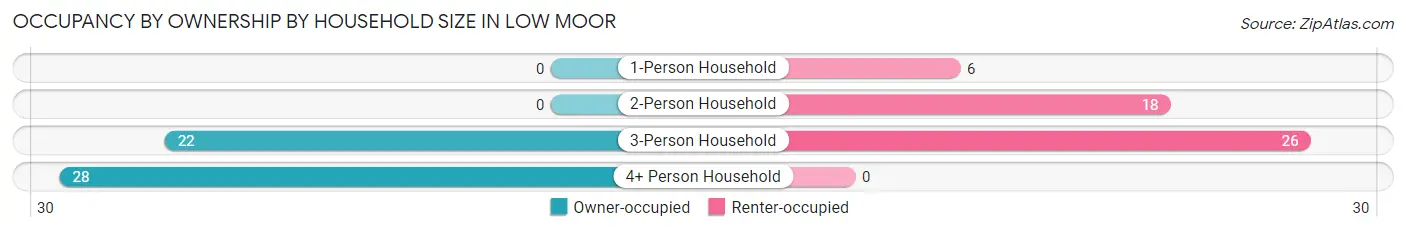
| Household Size | Owner-occupied | Renter-occupied |
| 1-Person Household | 0 (0.0%) | 6 (100.0%) |
| 2-Person Household | 0 (0.0%) | 18 (100.0%) |
| 3-Person Household | 22 (45.8%) | 26 (54.2%) |
| 4+ Person Household | 28 (100.0%) | 0 (0.0%) |
| Total Housing Units | 50 (50.0%) | 50 (50.0%) |
Occupancy by Educational Attainment in Low Moor
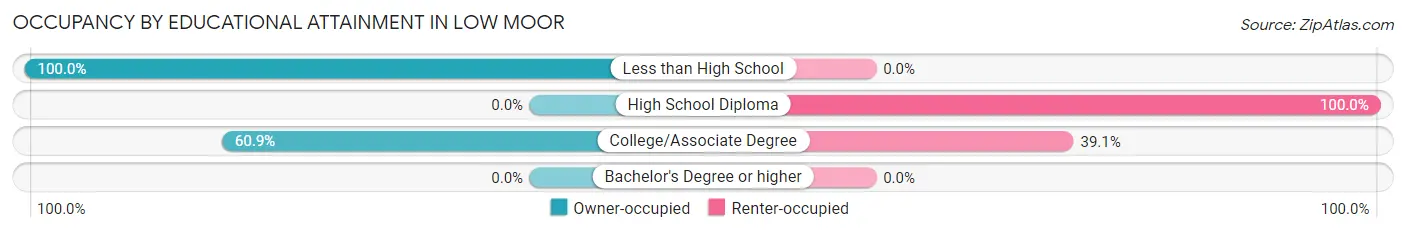
| Household Size | Owner-occupied | Renter-occupied |
| Less than High School | 22 (100.0%) | 0 (0.0%) |
| High School Diploma | 0 (0.0%) | 32 (100.0%) |
| College/Associate Degree | 28 (60.9%) | 18 (39.1%) |
| Bachelor's Degree or higher | 0 (0.0%) | 0 (0.0%) |
Occupancy by Age of Householder in Low Moor
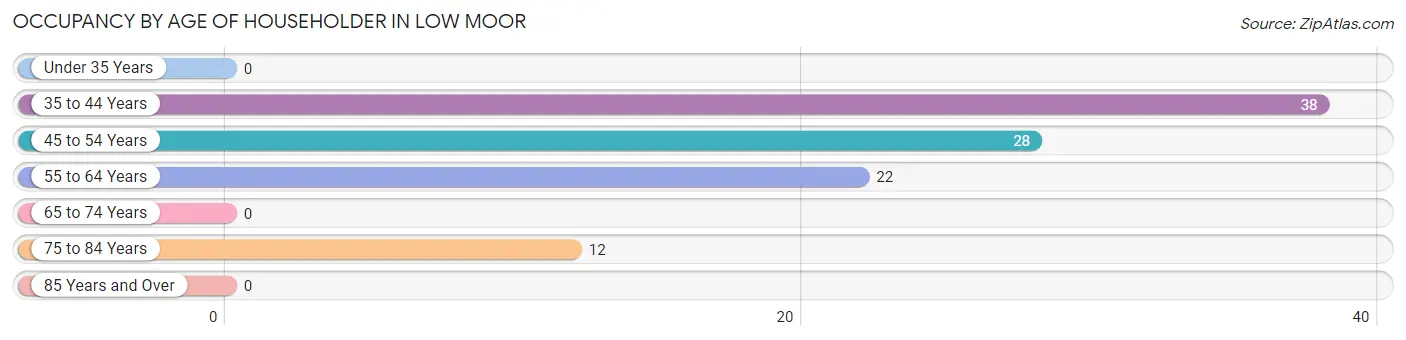
| Age Bracket | # Households | % Households |
| Under 35 Years | 0 | 0.0% |
| 35 to 44 Years | 38 | 38.0% |
| 45 to 54 Years | 28 | 28.0% |
| 55 to 64 Years | 22 | 22.0% |
| 65 to 74 Years | 0 | 0.0% |
| 75 to 84 Years | 12 | 12.0% |
| 85 Years and Over | 0 | 0.0% |
| Total | 100 | 100.0% |
Housing Finances in Low Moor
Median Income by Occupancy in Low Moor
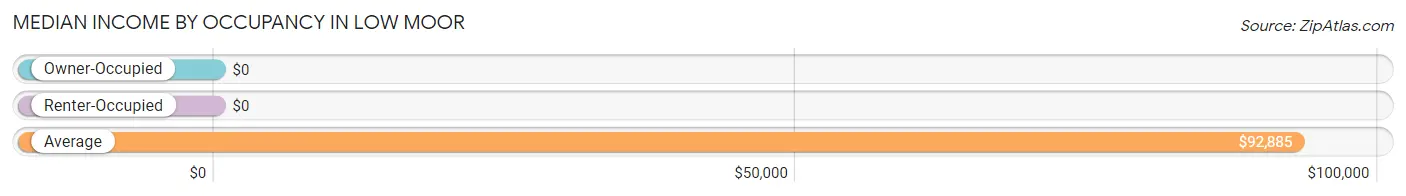
| Occupancy Type | # Households | Median Income |
| Owner-Occupied | 50 (50.0%) | $0 |
| Renter-Occupied | 50 (50.0%) | $0 |
| Average | 100 (100.0%) | $92,885 |
Occupancy by Householder Income Bracket in Low Moor
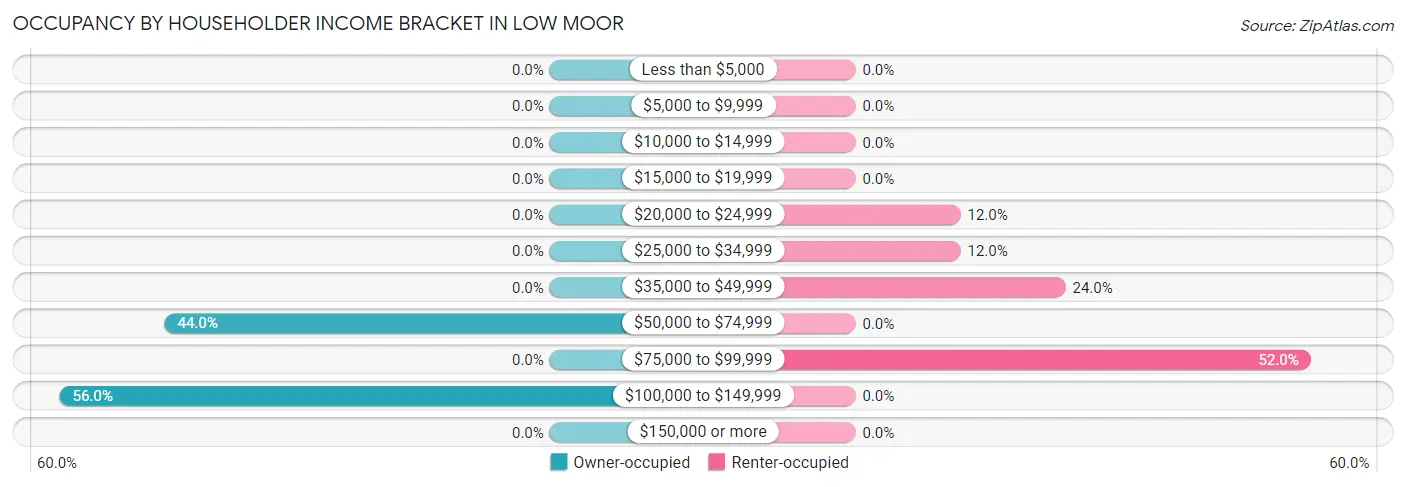
| Income Bracket | Owner-occupied | Renter-occupied |
| Less than $5,000 | 0 (0.0%) | 0 (0.0%) |
| $5,000 to $9,999 | 0 (0.0%) | 0 (0.0%) |
| $10,000 to $14,999 | 0 (0.0%) | 0 (0.0%) |
| $15,000 to $19,999 | 0 (0.0%) | 0 (0.0%) |
| $20,000 to $24,999 | 0 (0.0%) | 6 (12.0%) |
| $25,000 to $34,999 | 0 (0.0%) | 6 (12.0%) |
| $35,000 to $49,999 | 0 (0.0%) | 12 (24.0%) |
| $50,000 to $74,999 | 22 (44.0%) | 0 (0.0%) |
| $75,000 to $99,999 | 0 (0.0%) | 26 (52.0%) |
| $100,000 to $149,999 | 28 (56.0%) | 0 (0.0%) |
| $150,000 or more | 0 (0.0%) | 0 (0.0%) |
| Total | 50 (100.0%) | 50 (100.0%) |
Monthly Housing Cost Tiers in Low Moor
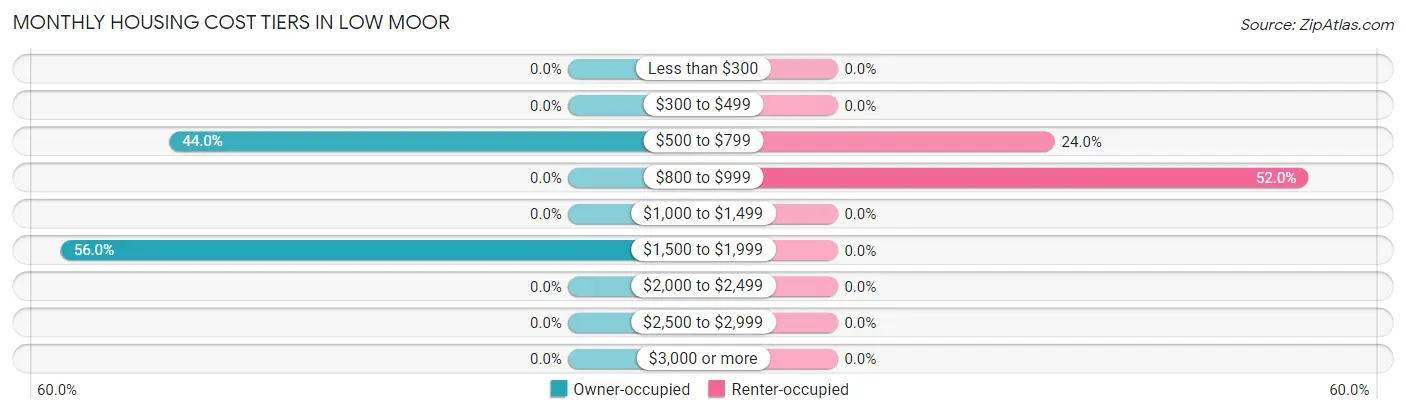
| Monthly Cost | Owner-occupied | Renter-occupied |
| Less than $300 | 0 (0.0%) | 0 (0.0%) |
| $300 to $499 | 0 (0.0%) | 0 (0.0%) |
| $500 to $799 | 22 (44.0%) | 12 (24.0%) |
| $800 to $999 | 0 (0.0%) | 26 (52.0%) |
| $1,000 to $1,499 | 0 (0.0%) | 0 (0.0%) |
| $1,500 to $1,999 | 28 (56.0%) | 0 (0.0%) |
| $2,000 to $2,499 | 0 (0.0%) | 0 (0.0%) |
| $2,500 to $2,999 | 0 (0.0%) | 0 (0.0%) |
| $3,000 or more | 0 (0.0%) | 0 (0.0%) |
| Total | 50 (100.0%) | 50 (100.0%) |
Physical Housing Characteristics in Low Moor
Housing Structures in Low Moor
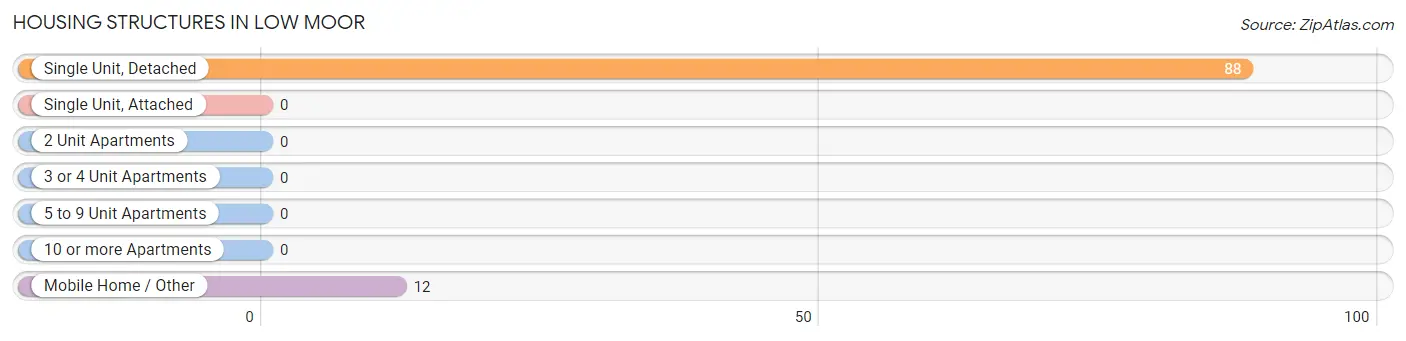
| Structure Type | # Housing Units | % Housing Units |
| Single Unit, Detached | 88 | 88.0% |
| Single Unit, Attached | 0 | 0.0% |
| 2 Unit Apartments | 0 | 0.0% |
| 3 or 4 Unit Apartments | 0 | 0.0% |
| 5 to 9 Unit Apartments | 0 | 0.0% |
| 10 or more Apartments | 0 | 0.0% |
| Mobile Home / Other | 12 | 12.0% |
| Total | 100 | 100.0% |
Housing Structures by Occupancy in Low Moor
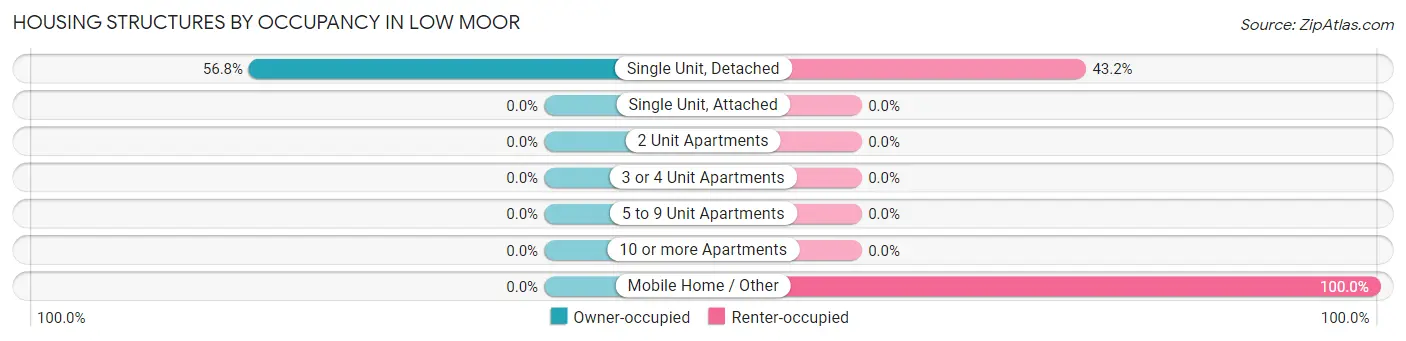
| Structure Type | Owner-occupied | Renter-occupied |
| Single Unit, Detached | 50 (56.8%) | 38 (43.2%) |
| Single Unit, Attached | 0 (0.0%) | 0 (0.0%) |
| 2 Unit Apartments | 0 (0.0%) | 0 (0.0%) |
| 3 or 4 Unit Apartments | 0 (0.0%) | 0 (0.0%) |
| 5 to 9 Unit Apartments | 0 (0.0%) | 0 (0.0%) |
| 10 or more Apartments | 0 (0.0%) | 0 (0.0%) |
| Mobile Home / Other | 0 (0.0%) | 12 (100.0%) |
| Total | 50 (50.0%) | 50 (50.0%) |
Housing Structures by Number of Rooms in Low Moor
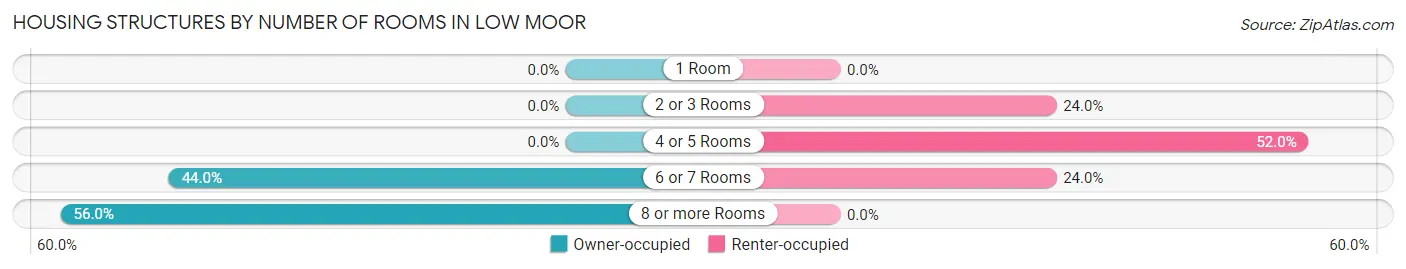
| Number of Rooms | Owner-occupied | Renter-occupied |
| 1 Room | 0 (0.0%) | 0 (0.0%) |
| 2 or 3 Rooms | 0 (0.0%) | 12 (24.0%) |
| 4 or 5 Rooms | 0 (0.0%) | 26 (52.0%) |
| 6 or 7 Rooms | 22 (44.0%) | 12 (24.0%) |
| 8 or more Rooms | 28 (56.0%) | 0 (0.0%) |
| Total | 50 (100.0%) | 50 (100.0%) |
Housing Structure by Heating Type in Low Moor
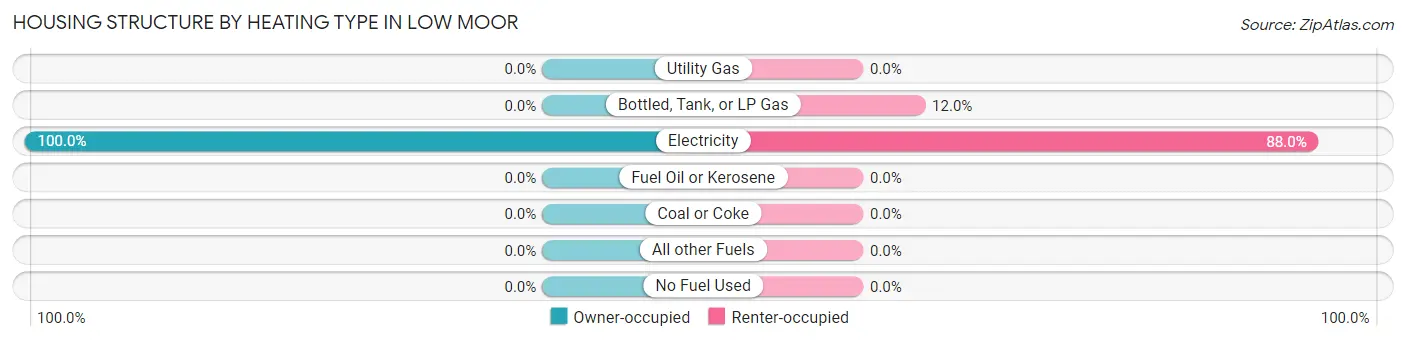
| Heating Type | Owner-occupied | Renter-occupied |
| Utility Gas | 0 (0.0%) | 0 (0.0%) |
| Bottled, Tank, or LP Gas | 0 (0.0%) | 6 (12.0%) |
| Electricity | 50 (100.0%) | 44 (88.0%) |
| Fuel Oil or Kerosene | 0 (0.0%) | 0 (0.0%) |
| Coal or Coke | 0 (0.0%) | 0 (0.0%) |
| All other Fuels | 0 (0.0%) | 0 (0.0%) |
| No Fuel Used | 0 (0.0%) | 0 (0.0%) |
| Total | 50 (100.0%) | 50 (100.0%) |
Household Vehicle Usage in Low Moor
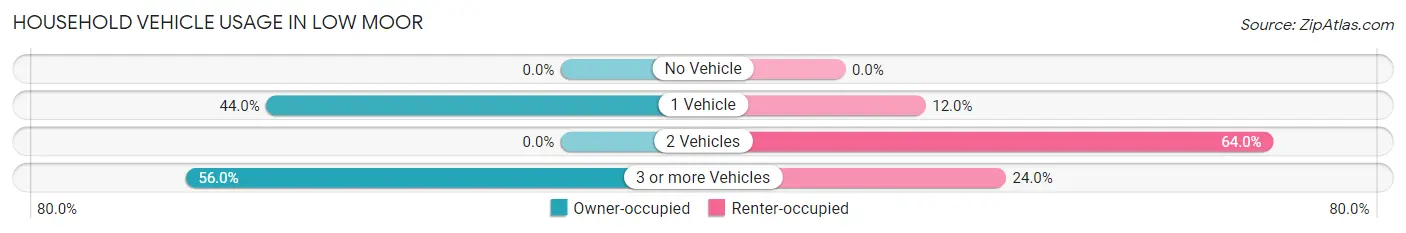
| Vehicles per Household | Owner-occupied | Renter-occupied |
| No Vehicle | 0 (0.0%) | 0 (0.0%) |
| 1 Vehicle | 22 (44.0%) | 6 (12.0%) |
| 2 Vehicles | 0 (0.0%) | 32 (64.0%) |
| 3 or more Vehicles | 28 (56.0%) | 12 (24.0%) |
| Total | 50 (100.0%) | 50 (100.0%) |
Real Estate & Mortgages in Low Moor
Real Estate and Mortgage Overview in Low Moor
| Characteristic | Without Mortgage | With Mortgage |
| Housing Units | 22 | 28 |
| Median Property Value | - | - |
| Median Household Income | - | - |
| Monthly Housing Costs | - | - |
| Real Estate Taxes | - | - |
Property Value by Mortgage Status in Low Moor
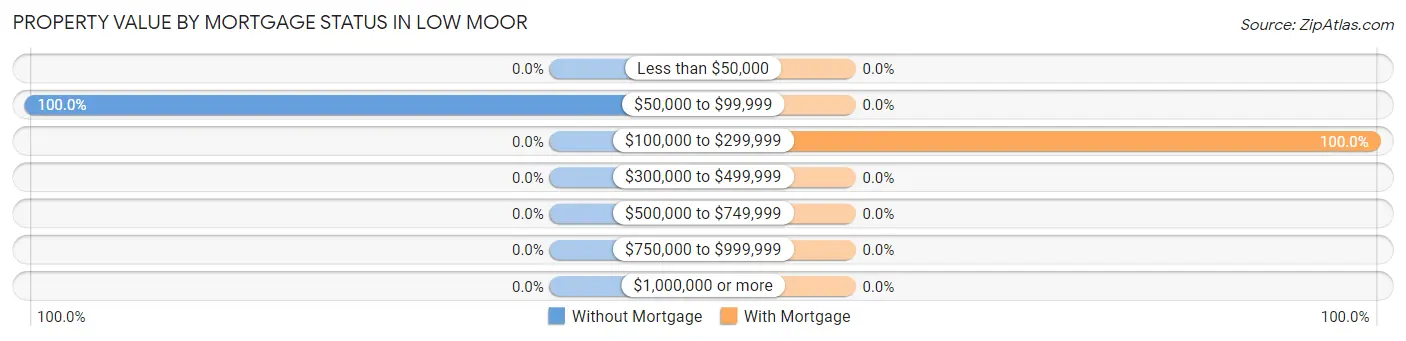
| Property Value | Without Mortgage | With Mortgage |
| Less than $50,000 | 0 (0.0%) | 0 (0.0%) |
| $50,000 to $99,999 | 22 (100.0%) | 0 (0.0%) |
| $100,000 to $299,999 | 0 (0.0%) | 28 (100.0%) |
| $300,000 to $499,999 | 0 (0.0%) | 0 (0.0%) |
| $500,000 to $749,999 | 0 (0.0%) | 0 (0.0%) |
| $750,000 to $999,999 | 0 (0.0%) | 0 (0.0%) |
| $1,000,000 or more | 0 (0.0%) | 0 (0.0%) |
| Total | 22 (100.0%) | 28 (100.0%) |
Household Income by Mortgage Status in Low Moor
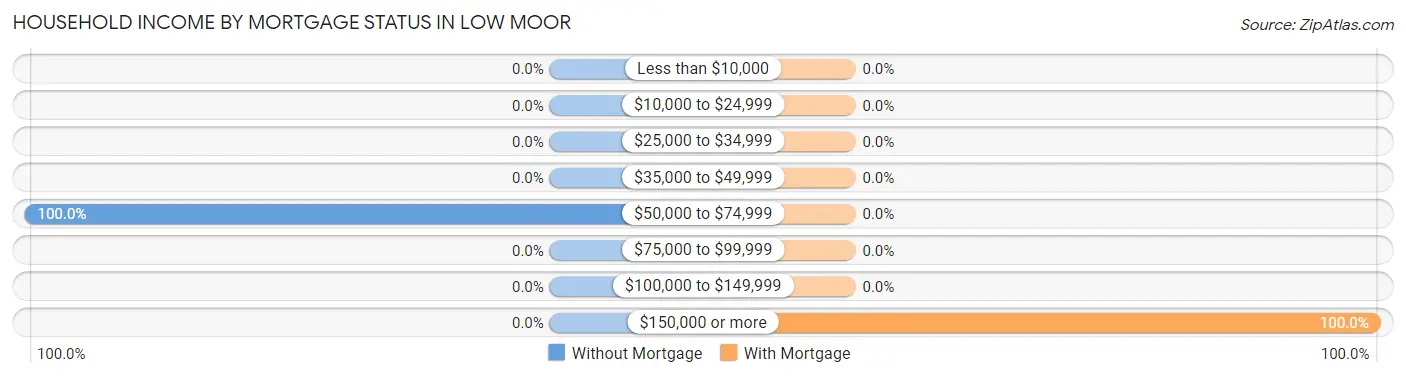
| Household Income | Without Mortgage | With Mortgage |
| Less than $10,000 | 0 (0.0%) | 0 (0.0%) |
| $10,000 to $24,999 | 0 (0.0%) | 0 (0.0%) |
| $25,000 to $34,999 | 0 (0.0%) | 0 (0.0%) |
| $35,000 to $49,999 | 0 (0.0%) | 0 (0.0%) |
| $50,000 to $74,999 | 22 (100.0%) | 0 (0.0%) |
| $75,000 to $99,999 | 0 (0.0%) | 0 (0.0%) |
| $100,000 to $149,999 | 0 (0.0%) | 0 (0.0%) |
| $150,000 or more | 0 (0.0%) | 28 (100.0%) |
| Total | 22 (100.0%) | 28 (100.0%) |
Property Value to Household Income Ratio in Low Moor
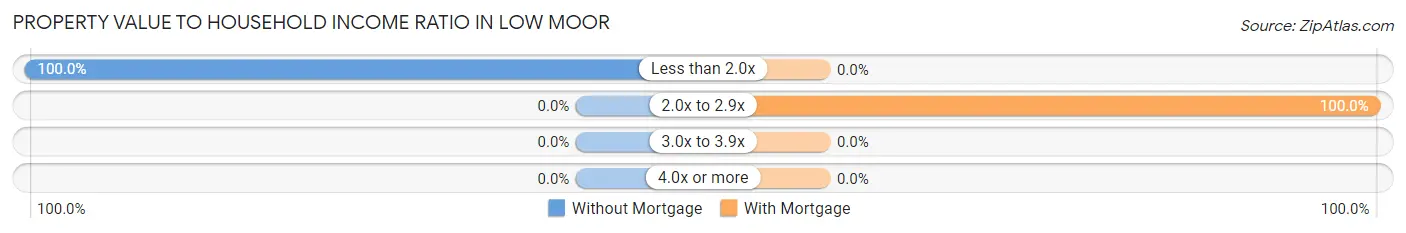
| Value-to-Income Ratio | Without Mortgage | With Mortgage |
| Less than 2.0x | 22 (100.0%) | 0 (0.0%) |
| 2.0x to 2.9x | 0 (0.0%) | 28 (100.0%) |
| 3.0x to 3.9x | 0 (0.0%) | 0 (0.0%) |
| 4.0x or more | 0 (0.0%) | 0 (0.0%) |
| Total | 22 (100.0%) | 28 (100.0%) |
Real Estate Taxes by Mortgage Status in Low Moor
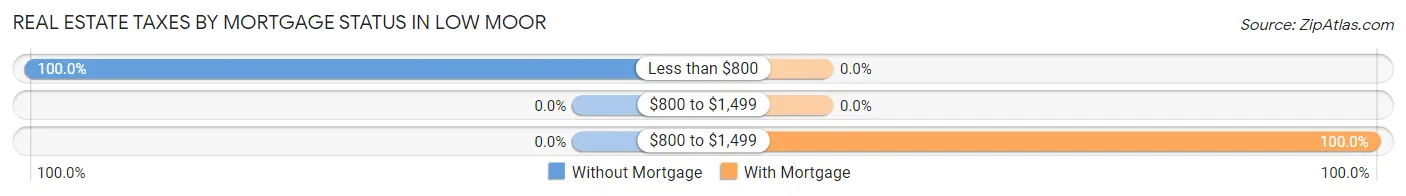
| Property Taxes | Without Mortgage | With Mortgage |
| Less than $800 | 22 (100.0%) | 0 (0.0%) |
| $800 to $1,499 | 0 (0.0%) | 0 (0.0%) |
| $800 to $1,499 | 0 (0.0%) | 28 (100.0%) |
| Total | 22 (100.0%) | 28 (100.0%) |
Health & Disability in Low Moor
Health Insurance Coverage by Age in Low Moor
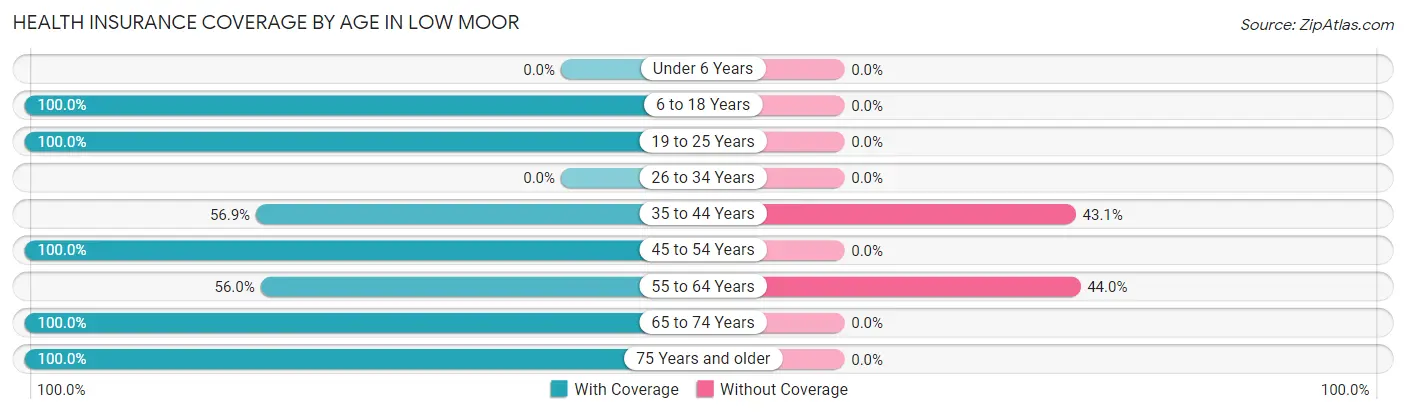
| Age Bracket | With Coverage | Without Coverage |
| Under 6 Years | 0 (0.0%) | 0 (0.0%) |
| 6 to 18 Years | 34 (100.0%) | 0 (0.0%) |
| 19 to 25 Years | 34 (100.0%) | 0 (0.0%) |
| 26 to 34 Years | 0 (0.0%) | 0 (0.0%) |
| 35 to 44 Years | 58 (56.9%) | 44 (43.1%) |
| 45 to 54 Years | 53 (100.0%) | 0 (0.0%) |
| 55 to 64 Years | 28 (56.0%) | 22 (44.0%) |
| 65 to 74 Years | 19 (100.0%) | 0 (0.0%) |
| 75 Years and older | 17 (100.0%) | 0 (0.0%) |
| Total | 243 (78.6%) | 66 (21.4%) |
Health Insurance Coverage by Citizenship Status in Low Moor
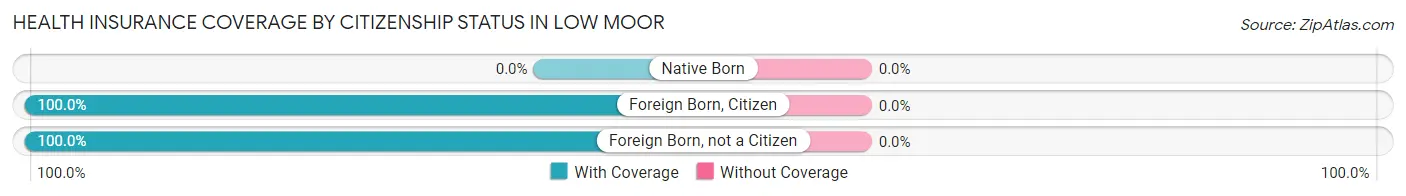
| Citizenship Status | With Coverage | Without Coverage |
| Native Born | 0 (0.0%) | 0 (0.0%) |
| Foreign Born, Citizen | 34 (100.0%) | 0 (0.0%) |
| Foreign Born, not a Citizen | 34 (100.0%) | 0 (0.0%) |
Health Insurance Coverage by Household Income in Low Moor
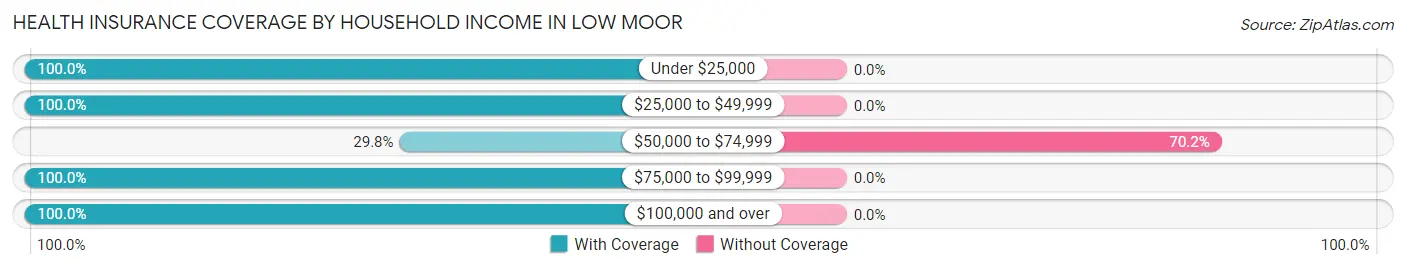
| Household Income | With Coverage | Without Coverage |
| Under $25,000 | 6 (100.0%) | 0 (0.0%) |
| $25,000 to $49,999 | 34 (100.0%) | 0 (0.0%) |
| $50,000 to $74,999 | 28 (29.8%) | 66 (70.2%) |
| $75,000 to $99,999 | 69 (100.0%) | 0 (0.0%) |
| $100,000 and over | 106 (100.0%) | 0 (0.0%) |
Public vs Private Health Insurance Coverage by Age in Low Moor
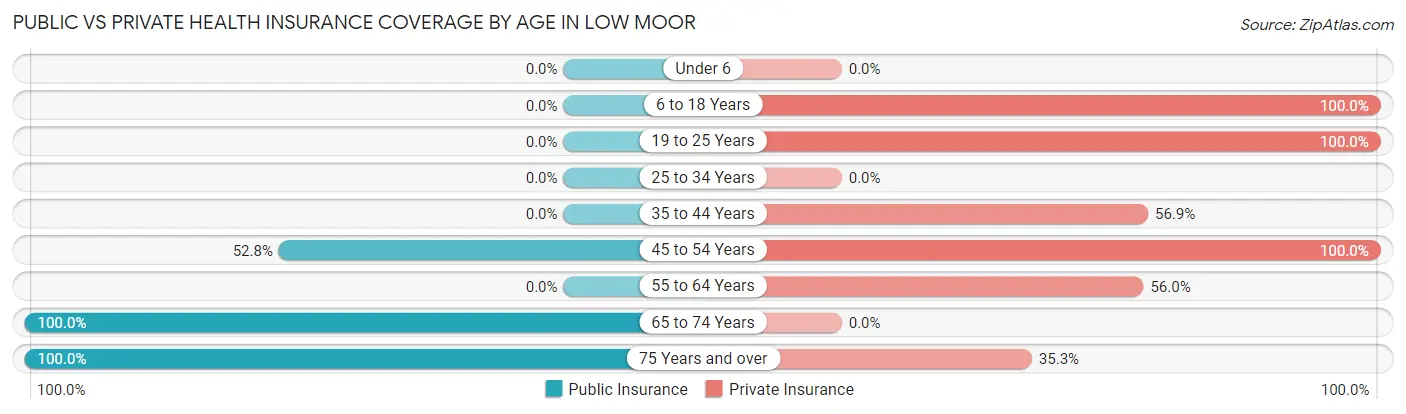
| Age Bracket | Public Insurance | Private Insurance |
| Under 6 | 0 (0.0%) | 0 (0.0%) |
| 6 to 18 Years | 0 (0.0%) | 34 (100.0%) |
| 19 to 25 Years | 0 (0.0%) | 34 (100.0%) |
| 25 to 34 Years | 0 (0.0%) | 0 (0.0%) |
| 35 to 44 Years | 0 (0.0%) | 58 (56.9%) |
| 45 to 54 Years | 28 (52.8%) | 53 (100.0%) |
| 55 to 64 Years | 0 (0.0%) | 28 (56.0%) |
| 65 to 74 Years | 19 (100.0%) | 0 (0.0%) |
| 75 Years and over | 17 (100.0%) | 6 (35.3%) |
| Total | 64 (20.7%) | 213 (68.9%) |
Disability Status by Sex by Age in Low Moor
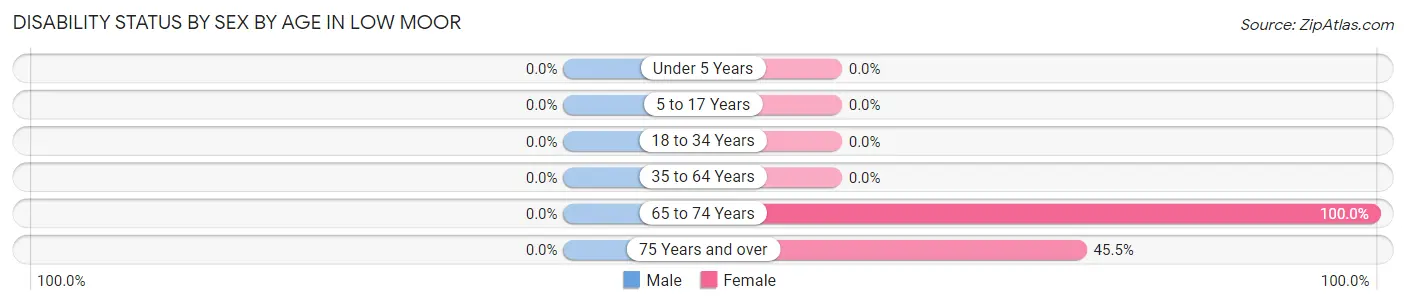
| Age Bracket | Male | Female |
| Under 5 Years | 0 (0.0%) | 0 (0.0%) |
| 5 to 17 Years | 0 (0.0%) | 0 (0.0%) |
| 18 to 34 Years | 0 (0.0%) | 0 (0.0%) |
| 35 to 64 Years | 0 (0.0%) | 0 (0.0%) |
| 65 to 74 Years | 0 (0.0%) | 19 (100.0%) |
| 75 Years and over | 0 (0.0%) | 5 (45.5%) |
Disability Class by Sex by Age in Low Moor
Disability Class: Hearing Difficulty
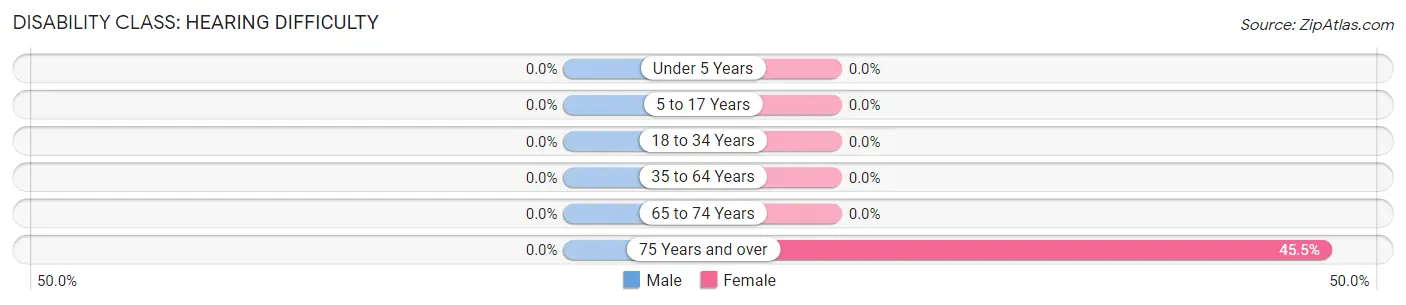
| Age Bracket | Male | Female |
| Under 5 Years | 0 (0.0%) | 0 (0.0%) |
| 5 to 17 Years | 0 (0.0%) | 0 (0.0%) |
| 18 to 34 Years | 0 (0.0%) | 0 (0.0%) |
| 35 to 64 Years | 0 (0.0%) | 0 (0.0%) |
| 65 to 74 Years | 0 (0.0%) | 0 (0.0%) |
| 75 Years and over | 0 (0.0%) | 5 (45.5%) |
Disability Class: Vision Difficulty
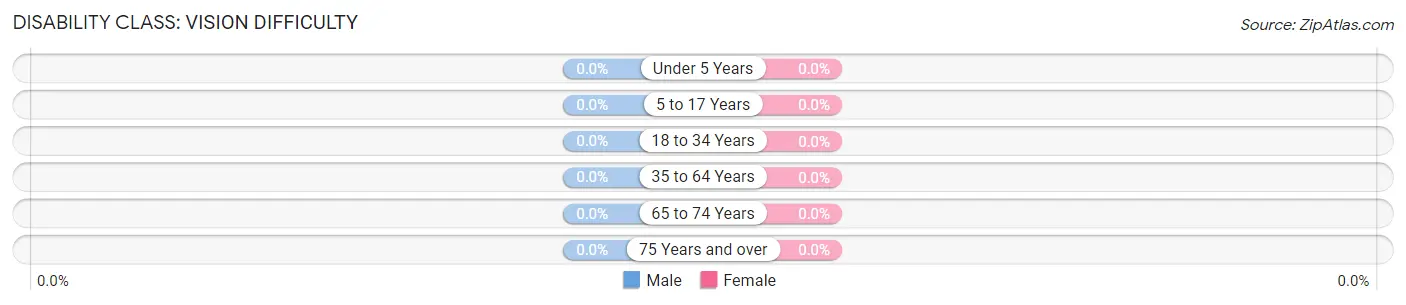
| Age Bracket | Male | Female |
| Under 5 Years | 0 (0.0%) | 0 (0.0%) |
| 5 to 17 Years | 0 (0.0%) | 0 (0.0%) |
| 18 to 34 Years | 0 (0.0%) | 0 (0.0%) |
| 35 to 64 Years | 0 (0.0%) | 0 (0.0%) |
| 65 to 74 Years | 0 (0.0%) | 0 (0.0%) |
| 75 Years and over | 0 (0.0%) | 0 (0.0%) |
Disability Class: Cognitive Difficulty
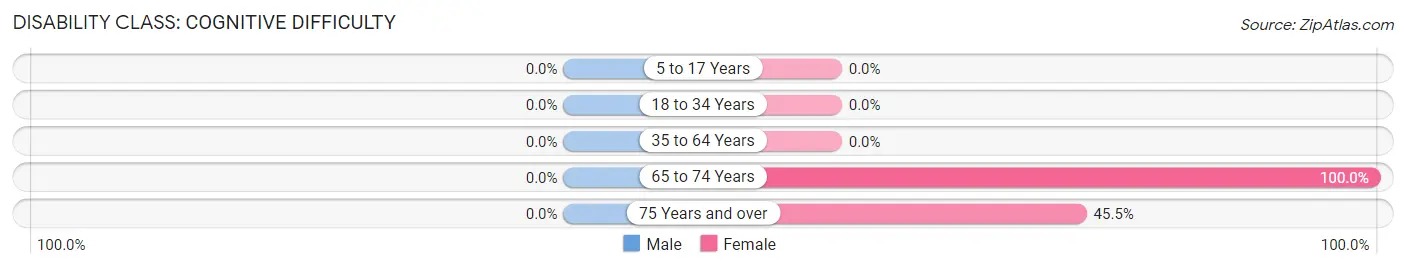
| Age Bracket | Male | Female |
| 5 to 17 Years | 0 (0.0%) | 0 (0.0%) |
| 18 to 34 Years | 0 (0.0%) | 0 (0.0%) |
| 35 to 64 Years | 0 (0.0%) | 0 (0.0%) |
| 65 to 74 Years | 0 (0.0%) | 19 (100.0%) |
| 75 Years and over | 0 (0.0%) | 5 (45.5%) |
Disability Class: Ambulatory Difficulty
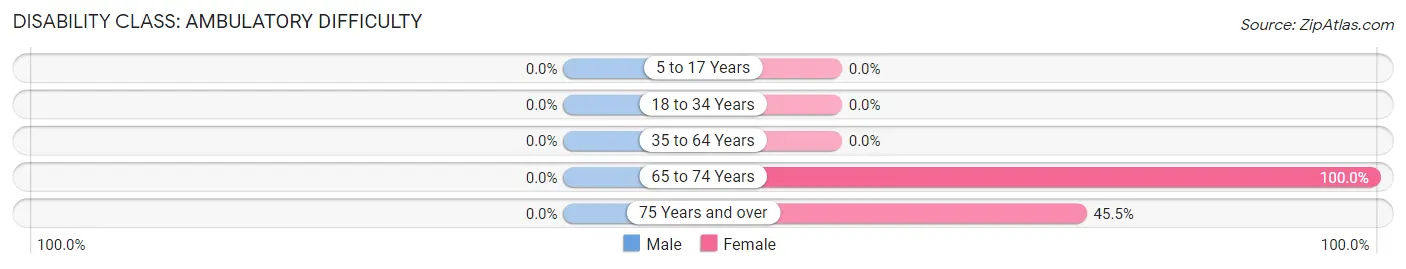
| Age Bracket | Male | Female |
| 5 to 17 Years | 0 (0.0%) | 0 (0.0%) |
| 18 to 34 Years | 0 (0.0%) | 0 (0.0%) |
| 35 to 64 Years | 0 (0.0%) | 0 (0.0%) |
| 65 to 74 Years | 0 (0.0%) | 19 (100.0%) |
| 75 Years and over | 0 (0.0%) | 5 (45.5%) |
Disability Class: Self-Care Difficulty

| Age Bracket | Male | Female |
| 5 to 17 Years | 0 (0.0%) | 0 (0.0%) |
| 18 to 34 Years | 0 (0.0%) | 0 (0.0%) |
| 35 to 64 Years | 0 (0.0%) | 0 (0.0%) |
| 65 to 74 Years | 0 (0.0%) | 19 (100.0%) |
| 75 Years and over | 0 (0.0%) | 5 (45.5%) |
Technology Access in Low Moor
Computing Device Access in Low Moor
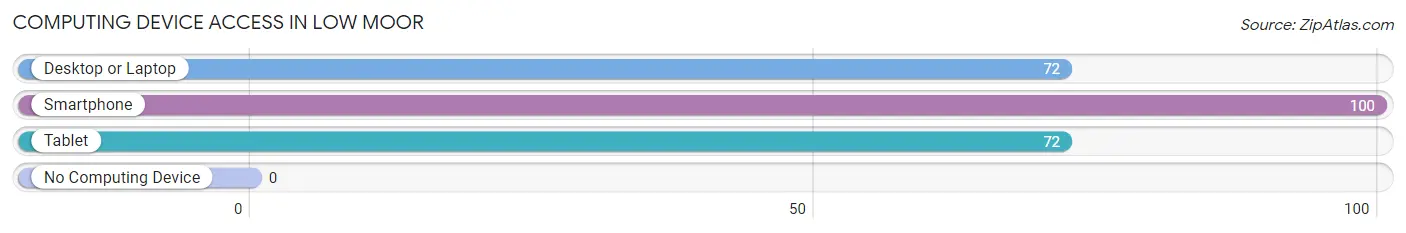
| Device Type | # Households | % Households |
| Desktop or Laptop | 72 | 72.0% |
| Smartphone | 100 | 100.0% |
| Tablet | 72 | 72.0% |
| No Computing Device | 0 | 0.0% |
| Total | 100 | 100.0% |
Internet Access in Low Moor
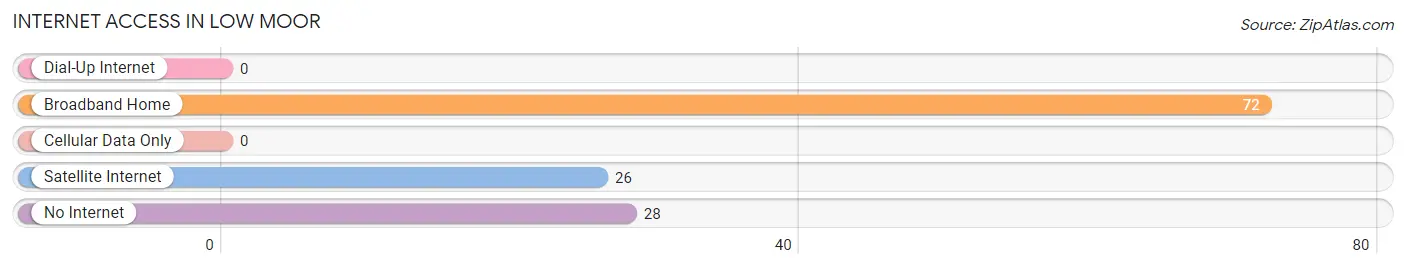
| Internet Type | # Households | % Households |
| Dial-Up Internet | 0 | 0.0% |
| Broadband Home | 72 | 72.0% |
| Cellular Data Only | 0 | 0.0% |
| Satellite Internet | 26 | 26.0% |
| No Internet | 28 | 28.0% |
| Total | 100 | 100.0% |
Low Moor Summary
Introduction
Low Moor is a small unincorporated community located in Alleghany County, Virginia. It is situated in the Appalachian Mountains, and is part of the Roanoke Metropolitan Statistical Area. The population of Low Moor was estimated to be 1,845 in the year 2000. The town is known for its rich history, diverse geography, and vibrant economy. This paper will explore the history, geography, economy, and demographics of Low Moor in 2000 words.
History
Low Moor has a long and rich history. The town was first settled in the late 1700s by a group of German immigrants. The town was originally known as “Lowmoor”, and was named after the nearby Low Moor Ironworks. The ironworks was established in 1791 and was the first of its kind in the United States. The ironworks was a major source of employment for the town, and it helped to spur the growth of the local economy.
The town was officially incorporated in 1837, and it quickly became a hub for the local coal mining industry. The coal mines provided employment for many of the town’s residents, and it helped to fuel the local economy. The town also became a major stop on the Norfolk and Western Railway, which connected the town to the rest of the country.
The town experienced a period of decline in the early 20th century, as the coal industry began to decline and the ironworks closed. However, the town has experienced a resurgence in recent years, as it has become a popular tourist destination. The town is home to several historic sites, including the Low Moor Ironworks, the Low Moor Depot, and the Low Moor Historic District.
Geography
Low Moor is located in the Appalachian Mountains of southwestern Virginia. The town is situated in the Roanoke Valley, and is surrounded by the Blue Ridge Mountains to the east and the Allegheny Mountains to the west. The town is located at an elevation of 1,845 feet, and is situated on the banks of the Roanoke River.
The town is located in a temperate climate, with mild winters and warm summers. The average annual temperature is around 55 degrees Fahrenheit, and the average annual precipitation is around 40 inches. The town is located in a rural area, and is surrounded by forests and rolling hills.
Economy
Low Moor’s economy is largely based on tourism and agriculture. The town is home to several historic sites, including the Low Moor Ironworks, the Low Moor Depot, and the Low Moor Historic District. These sites attract visitors from all over the country, and they help to boost the local economy.
The town is also home to several farms, which produce a variety of crops, including corn, soybeans, and hay. The farms also raise livestock, including cattle, sheep, and pigs. The town is also home to several small businesses, including restaurants, shops, and other services.
Demographics
The population of Low Moor was estimated to be 1,845 in the year 2000. The town is predominantly white, with a small African American population. The median household income is around $35,000, and the median home value is around $90,000. The town has a low unemployment rate, and the majority of the population is employed in the tourism and agriculture industries.
Conclusion
Low Moor is a small unincorporated community located in Alleghany County, Virginia. The town is known for its rich history, diverse geography, and vibrant economy. The town was first settled in the late 1700s, and it quickly became a hub for the local coal mining industry. The town is now home to several historic sites, and it is a popular tourist destination. The town’s economy is largely based on tourism and agriculture, and the population is predominantly white. Low Moor is a unique and vibrant community, and it is an important part of the Roanoke Metropolitan Statistical Area.
Common Questions
What is Per Capita Income in Low Moor?
Per Capita income in Low Moor is $24,503.
What is the Median Household income in Low Moor?
Median Household Income in Low Moor is $92,885.
What is Income or Wage Gap in Low Moor?
Income or Wage Gap in Low Moor is 29.4%.
Women in Low Moor earn 70.6 cents for every dollar earned by a man.
What is Inequality or Gini Index in Low Moor?
Inequality or Gini Index in Low Moor is 0.27.
What is the Total Population of Low Moor?
Total Population of Low Moor is 389.
What is the Total Male Population of Low Moor?
Total Male Population of Low Moor is 182.
What is the Total Female Population of Low Moor?
Total Female Population of Low Moor is 207.
What is the Ratio of Males per 100 Females in Low Moor?
There are 87.92 Males per 100 Females in Low Moor.
What is the Ratio of Females per 100 Males in Low Moor?
There are 113.74 Females per 100 Males in Low Moor.
What is the Median Population Age in Low Moor?
Median Population Age in Low Moor is 51.0 Years.
What is the Average Family Size in Low Moor
Average Family Size in Low Moor is 2.7 People.
What is the Average Household Size in Low Moor
Average Household Size in Low Moor is 3.1 People.
How Large is the Labor Force in Low Moor?
There are 173 People in the Labor Forcein in Low Moor.
What is the Percentage of People in the Labor Force in Low Moor?
48.7% of People are in the Labor Force in Low Moor.