Amherst, VA Map & Demographics
Amherst Map
Amherst Overview
$32,241
PER CAPITA INCOME
$80,250
AVG FAMILY INCOME
$59,306
AVG HOUSEHOLD INCOME
59.5%
WAGE / INCOME GAP [ % ]
40.5¢/ $1
WAGE / INCOME GAP [ $ ]
0.41
INEQUALITY / GINI INDEX
2,299
TOTAL POPULATION
1,136
MALE POPULATION
1,163
FEMALE POPULATION
97.68
MALES / 100 FEMALES
102.38
FEMALES / 100 MALES
51.1
MEDIAN AGE
2.9
AVG FAMILY SIZE
2.1
AVG HOUSEHOLD SIZE
965
LABOR FORCE [ PEOPLE ]
48.7%
PERCENT IN LABOR FORCE
1.2%
UNEMPLOYMENT RATE
Amherst Zip Codes
Amherst Area Codes
Income in Amherst
Income Overview in Amherst
Per Capita Income in Amherst is $32,241, while median incomes of families and households are $80,250 and $59,306 respectively.
| Characteristic | Number | Measure |
| Per Capita Income | 2,299 | $32,241 |
| Median Family Income | 565 | $80,250 |
| Mean Family Income | 565 | $83,635 |
| Median Household Income | 1,013 | $59,306 |
| Mean Household Income | 1,013 | $70,274 |
| Income Deficit | 565 | $0 |
| Wage / Income Gap (%) | 2,299 | 59.50% |
| Wage / Income Gap ($) | 2,299 | 40.50¢ per $1 |
| Gini / Inequality Index | 2,299 | 0.41 |
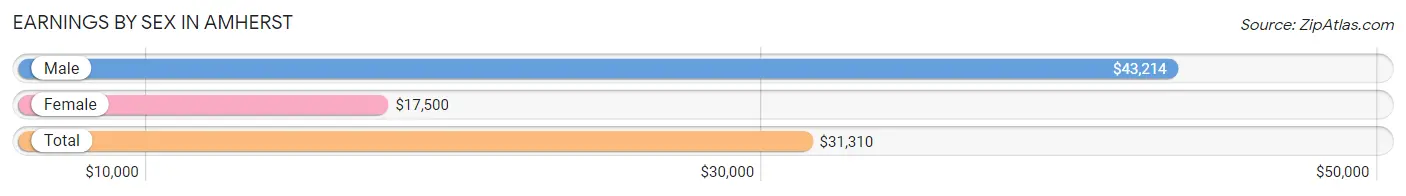
Earnings by Sex in Amherst
Average Earnings in Amherst are $31,310, $43,214 for men and $17,500 for women, a difference of 59.5%.
| Sex | Number | Average Earnings |
| Male | 646 (62.2%) | $43,214 |
| Female | 392 (37.8%) | $17,500 |
| Total | 1,038 (100.0%) | $31,310 |
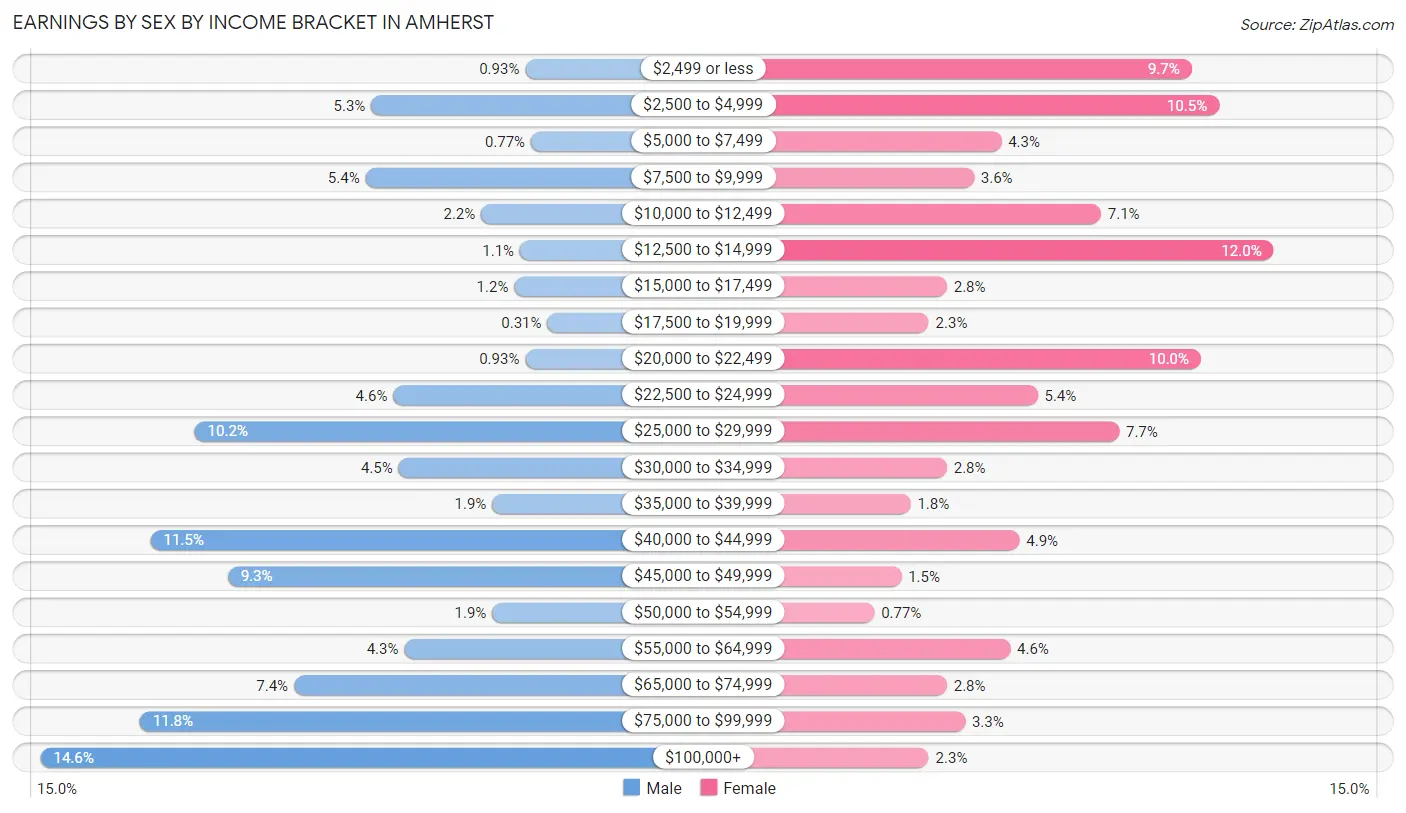
Earnings by Sex by Income Bracket in Amherst
The most common earnings brackets in Amherst are $100,000+ for men (94 | 14.5%) and $12,500 to $14,999 for women (47 | 12.0%).
| Income | Male | Female |
| $2,499 or less | 6 (0.9%) | 38 (9.7%) |
| $2,500 to $4,999 | 34 (5.3%) | 41 (10.5%) |
| $5,000 to $7,499 | 5 (0.8%) | 17 (4.3%) |
| $7,500 to $9,999 | 35 (5.4%) | 14 (3.6%) |
| $10,000 to $12,499 | 14 (2.2%) | 28 (7.1%) |
| $12,500 to $14,999 | 7 (1.1%) | 47 (12.0%) |
| $15,000 to $17,499 | 8 (1.2%) | 11 (2.8%) |
| $17,500 to $19,999 | 2 (0.3%) | 9 (2.3%) |
| $20,000 to $22,499 | 6 (0.9%) | 39 (10.0%) |
| $22,500 to $24,999 | 30 (4.6%) | 21 (5.4%) |
| $25,000 to $29,999 | 66 (10.2%) | 30 (7.6%) |
| $30,000 to $34,999 | 29 (4.5%) | 11 (2.8%) |
| $35,000 to $39,999 | 12 (1.9%) | 7 (1.8%) |
| $40,000 to $44,999 | 74 (11.5%) | 19 (4.9%) |
| $45,000 to $49,999 | 60 (9.3%) | 6 (1.5%) |
| $50,000 to $54,999 | 12 (1.9%) | 3 (0.8%) |
| $55,000 to $64,999 | 28 (4.3%) | 18 (4.6%) |
| $65,000 to $74,999 | 48 (7.4%) | 11 (2.8%) |
| $75,000 to $99,999 | 76 (11.8%) | 13 (3.3%) |
| $100,000+ | 94 (14.5%) | 9 (2.3%) |
| Total | 646 (100.0%) | 392 (100.0%) |
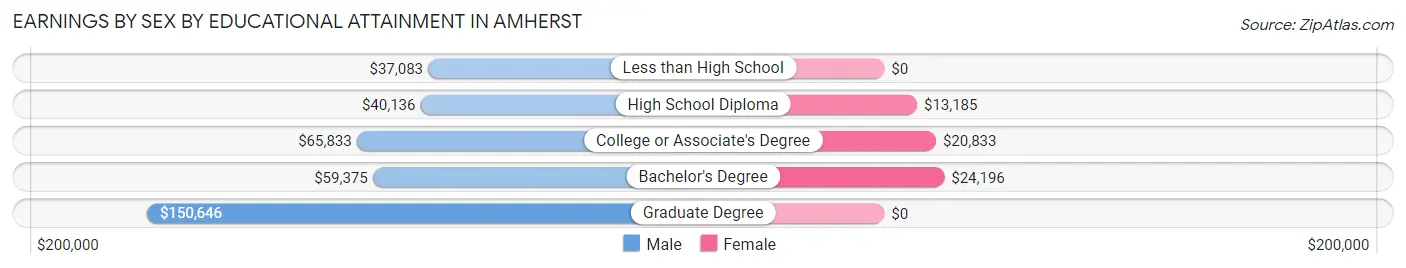
Earnings by Sex by Educational Attainment in Amherst
Average earnings in Amherst are $46,875 for men and $20,449 for women, a difference of 56.4%. Men with an educational attainment of graduate degree enjoy the highest average annual earnings of $150,646, while those with less than high school education earn the least with $37,083. Women with an educational attainment of bachelor's degree earn the most with the average annual earnings of $24,196, while those with high school diploma education have the smallest earnings of $13,185.
| Educational Attainment | Male Income | Female Income |
| Less than High School | $37,083 | $0 |
| High School Diploma | $40,136 | $13,185 |
| College or Associate's Degree | $65,833 | $20,833 |
| Bachelor's Degree | $59,375 | $24,196 |
| Graduate Degree | $150,646 | $0 |
| Total | $46,875 | $20,449 |
Family Income in Amherst
Family Income Brackets in Amherst
According to the Amherst family income data, there are 170 families falling into the $100,000 to $149,999 income range, which is the most common income bracket and makes up 30.1% of all families. Conversely, the less than $10,000 income bracket is the least frequent group with only 5 families (0.9%) belonging to this category.
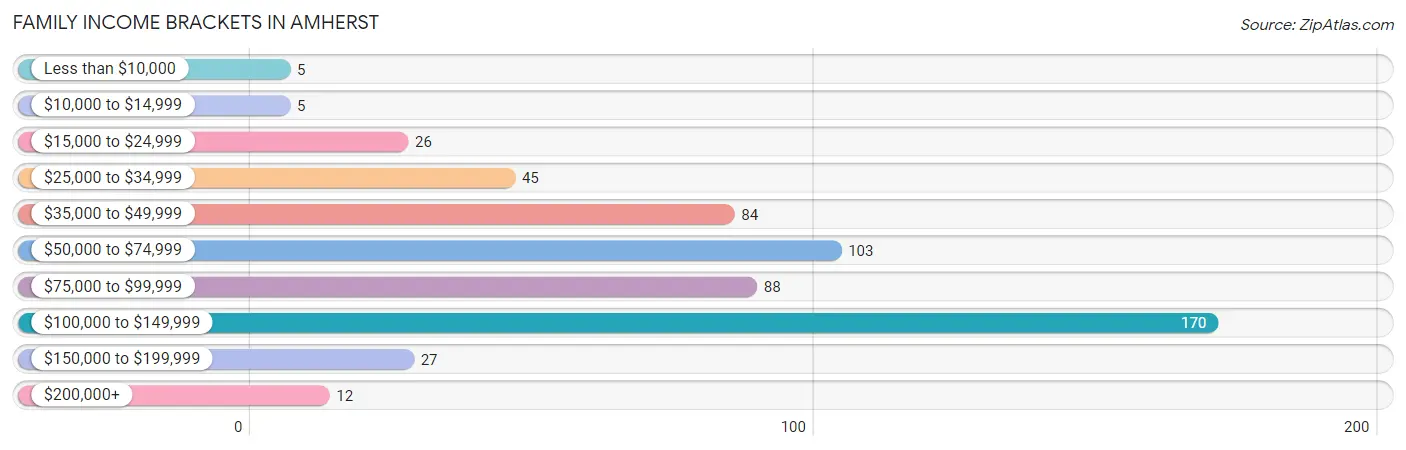
| Income Bracket | # Families | % Families |
| Less than $10,000 | 5 | 0.9% |
| $10,000 to $14,999 | 5 | 0.9% |
| $15,000 to $24,999 | 26 | 4.6% |
| $25,000 to $34,999 | 45 | 8.0% |
| $35,000 to $49,999 | 84 | 14.9% |
| $50,000 to $74,999 | 103 | 18.2% |
| $75,000 to $99,999 | 88 | 15.6% |
| $100,000 to $149,999 | 170 | 30.1% |
| $150,000 to $199,999 | 27 | 4.8% |
| $200,000+ | 12 | 2.1% |
Family Income by Famaliy Size in Amherst
2-person families (301 | 53.3%) account for the highest median family income in Amherst with $86,369 per family, while 2-person families (301 | 53.3%) have the highest median income of $43,184 per family member.
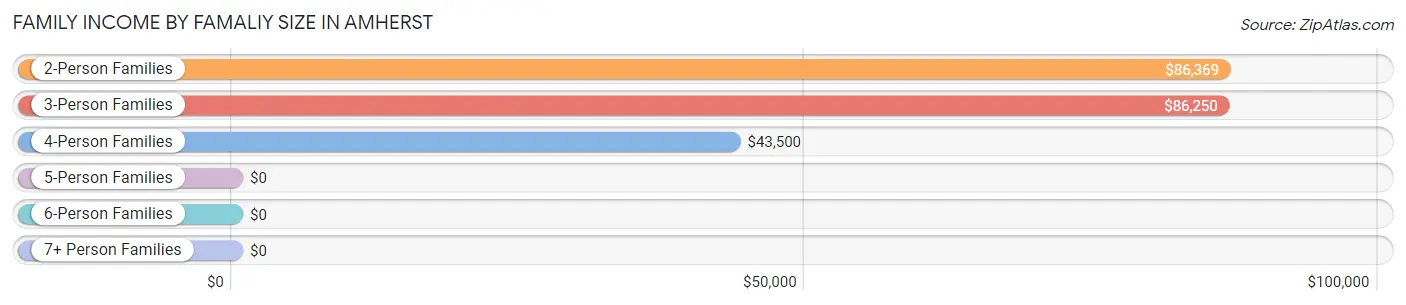
| Income Bracket | # Families | Median Income |
| 2-Person Families | 301 (53.3%) | $86,369 |
| 3-Person Families | 113 (20.0%) | $86,250 |
| 4-Person Families | 120 (21.2%) | $43,500 |
| 5-Person Families | 31 (5.5%) | $0 |
| 6-Person Families | 0 (0.0%) | $0 |
| 7+ Person Families | 0 (0.0%) | $0 |
| Total | 565 (100.0%) | $80,250 |
Family Income by Number of Earners in Amherst
The median family income in Amherst is $80,250, with families comprising 3+ earners (61) having the highest median family income of $87,202, while families with 2 earners (176) have the lowest median family income of $66,855, accounting for 10.8% and 31.1% of families, respectively.
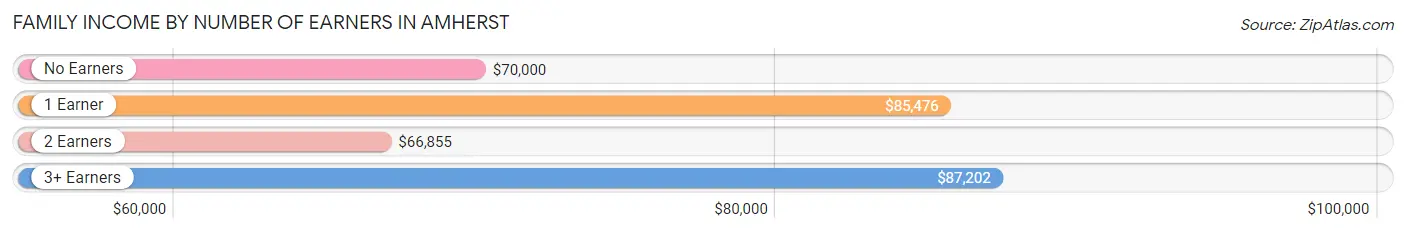
| Number of Earners | # Families | Median Income |
| No Earners | 110 (19.5%) | $70,000 |
| 1 Earner | 218 (38.6%) | $85,476 |
| 2 Earners | 176 (31.1%) | $66,855 |
| 3+ Earners | 61 (10.8%) | $87,202 |
| Total | 565 (100.0%) | $80,250 |
Household Income in Amherst
Household Income Brackets in Amherst
With 181 households falling in the category, the $100,000 to $149,999 income range is the most frequent in Amherst, accounting for 17.9% of all households. In contrast, only 20 households (2.0%) fall into the $200,000+ income bracket, making it the least populous group.
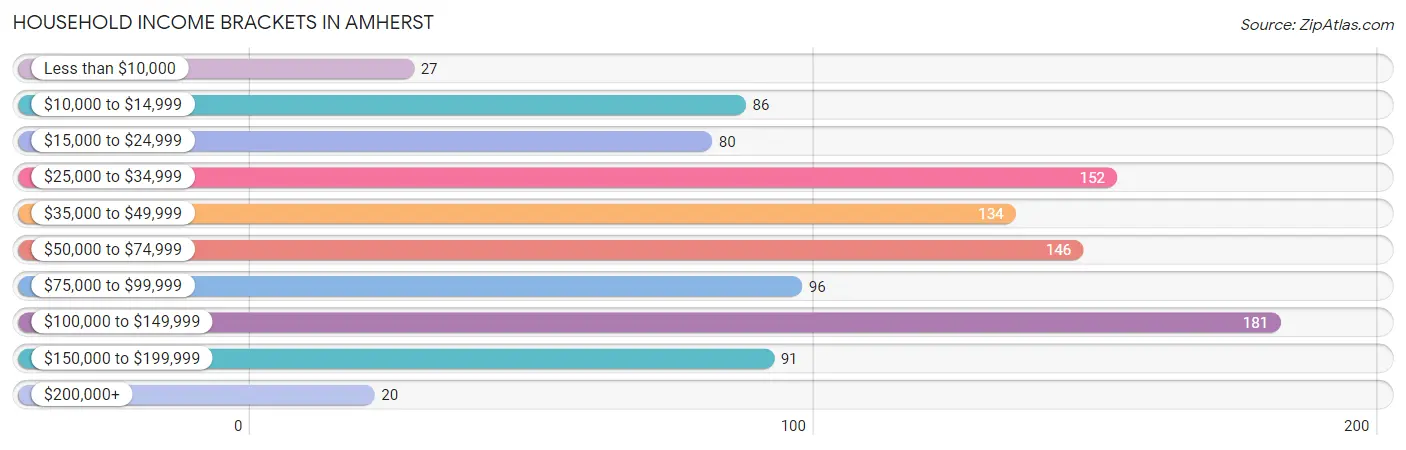
| Income Bracket | # Households | % Households |
| Less than $10,000 | 27 | 2.7% |
| $10,000 to $14,999 | 86 | 8.5% |
| $15,000 to $24,999 | 80 | 7.9% |
| $25,000 to $34,999 | 152 | 15.0% |
| $35,000 to $49,999 | 134 | 13.2% |
| $50,000 to $74,999 | 146 | 14.4% |
| $75,000 to $99,999 | 96 | 9.5% |
| $100,000 to $149,999 | 181 | 17.9% |
| $150,000 to $199,999 | 91 | 9.0% |
| $200,000+ | 20 | 2.0% |
Household Income by Householder Age in Amherst
The median household income in Amherst is $59,306, with the highest median household income of $92,857 found in the 45 to 64 years age bracket for the primary householder. A total of 290 households (28.6%) fall into this category. Meanwhile, the 15 to 24 years age bracket for the primary householder has the lowest median household income of $0, with 22 households (2.2%) in this group.
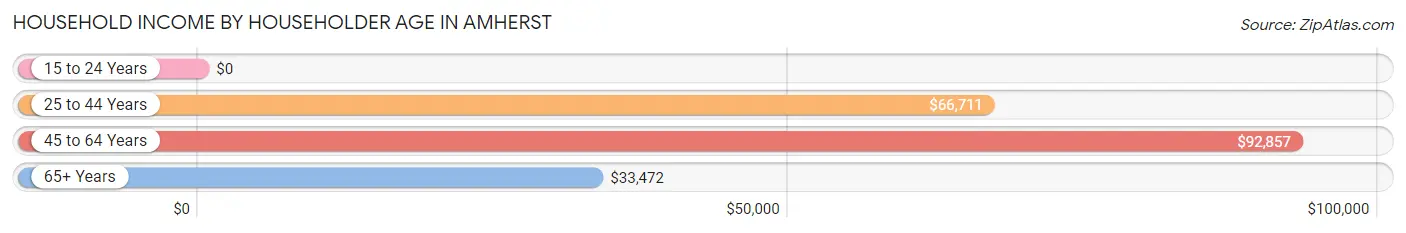
| Income Bracket | # Households | Median Income |
| 15 to 24 Years | 22 (2.2%) | $0 |
| 25 to 44 Years | 262 (25.9%) | $66,711 |
| 45 to 64 Years | 290 (28.6%) | $92,857 |
| 65+ Years | 439 (43.3%) | $33,472 |
| Total | 1,013 (100.0%) | $59,306 |
Poverty in Amherst
Income Below Poverty by Sex and Age in Amherst
With 3.4% poverty level for males and 10.3% for females among the residents of Amherst, under 5 year old males and 65 to 74 year old females are the most vulnerable to poverty, with 5 males (8.5%) and 35 females (19.9%) in their respective age groups living below the poverty level.
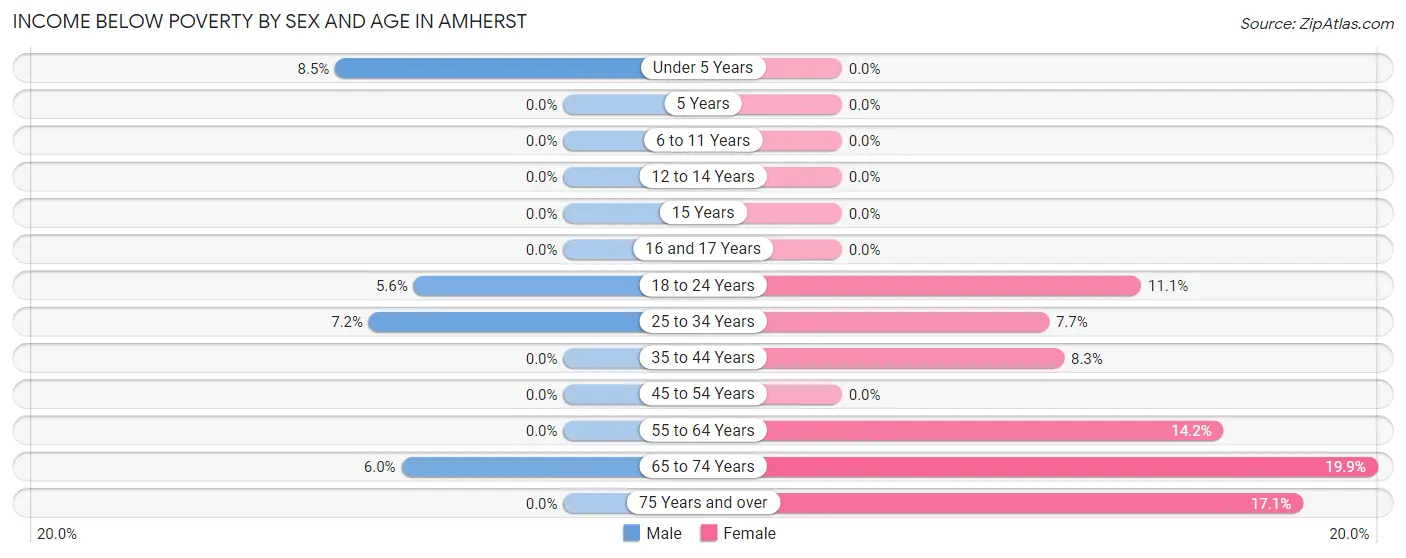
| Age Bracket | Male | Female |
| Under 5 Years | 5 (8.5%) | 0 (0.0%) |
| 5 Years | 0 (0.0%) | 0 (0.0%) |
| 6 to 11 Years | 0 (0.0%) | 0 (0.0%) |
| 12 to 14 Years | 0 (0.0%) | 0 (0.0%) |
| 15 Years | 0 (0.0%) | 0 (0.0%) |
| 16 and 17 Years | 0 (0.0%) | 0 (0.0%) |
| 18 to 24 Years | 5 (5.6%) | 4 (11.1%) |
| 25 to 34 Years | 14 (7.2%) | 9 (7.7%) |
| 35 to 44 Years | 0 (0.0%) | 8 (8.3%) |
| 45 to 54 Years | 0 (0.0%) | 0 (0.0%) |
| 55 to 64 Years | 0 (0.0%) | 17 (14.2%) |
| 65 to 74 Years | 11 (6.0%) | 35 (19.9%) |
| 75 Years and over | 0 (0.0%) | 38 (17.1%) |
| Total | 35 (3.4%) | 111 (10.3%) |
Income Above Poverty by Sex and Age in Amherst
According to the poverty statistics in Amherst, males aged 5 years and females aged under 5 years are the age groups that are most secure financially, with 100.0% of males and 100.0% of females in these age groups living above the poverty line.
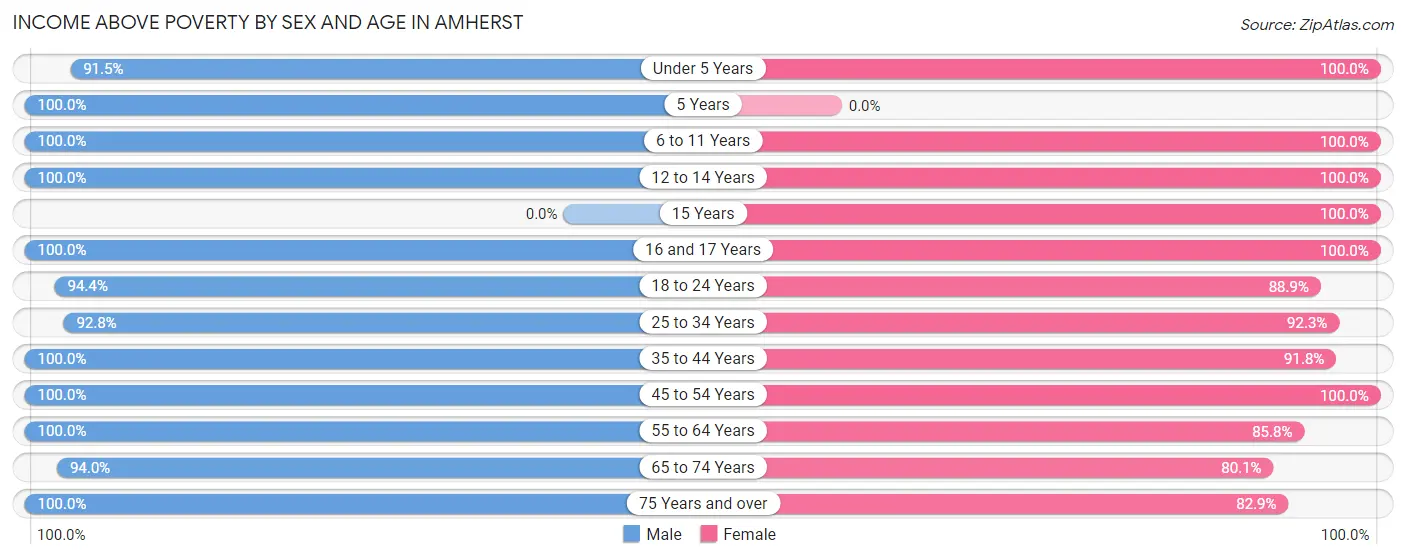
| Age Bracket | Male | Female |
| Under 5 Years | 54 (91.5%) | 85 (100.0%) |
| 5 Years | 25 (100.0%) | 0 (0.0%) |
| 6 to 11 Years | 38 (100.0%) | 52 (100.0%) |
| 12 to 14 Years | 33 (100.0%) | 24 (100.0%) |
| 15 Years | 0 (0.0%) | 1 (100.0%) |
| 16 and 17 Years | 33 (100.0%) | 32 (100.0%) |
| 18 to 24 Years | 85 (94.4%) | 32 (88.9%) |
| 25 to 34 Years | 180 (92.8%) | 108 (92.3%) |
| 35 to 44 Years | 103 (100.0%) | 89 (91.7%) |
| 45 to 54 Years | 144 (100.0%) | 111 (100.0%) |
| 55 to 64 Years | 78 (100.0%) | 103 (85.8%) |
| 65 to 74 Years | 172 (94.0%) | 141 (80.1%) |
| 75 Years and over | 55 (100.0%) | 184 (82.9%) |
| Total | 1,000 (96.6%) | 962 (89.7%) |
Income Below Poverty Among Married-Couple Families in Amherst
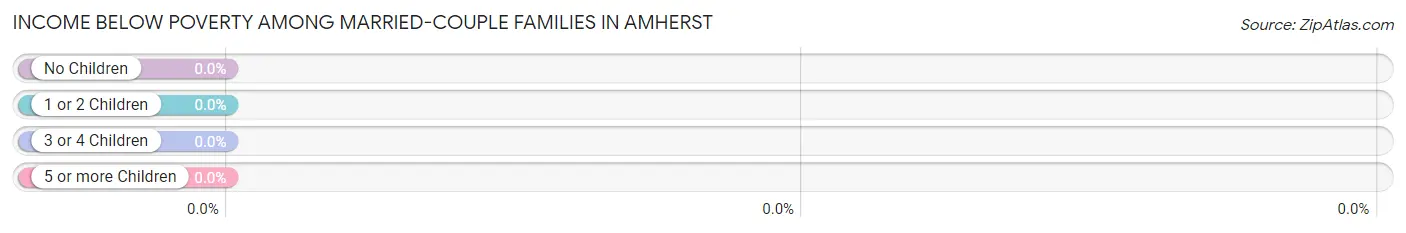
| Children | Above Poverty | Below Poverty |
| No Children | 335 (100.0%) | 0 (0.0%) |
| 1 or 2 Children | 100 (100.0%) | 0 (0.0%) |
| 3 or 4 Children | 31 (100.0%) | 0 (0.0%) |
| 5 or more Children | 0 (0.0%) | 0 (0.0%) |
| Total | 466 (100.0%) | 0 (0.0%) |
Income Below Poverty Among Single-Parent Households in Amherst
According to the poverty data in Amherst, 100.0% or 5 single-father households and 5.3% or 5 single-mother households are living below the poverty line. Among single-father households, those with 1 or 2 children have the highest poverty rate, with 5 households (100.0%) experiencing poverty. Likewise, among single-mother households, those with no children have the highest poverty rate, with 5 households (9.4%) falling below the poverty line.
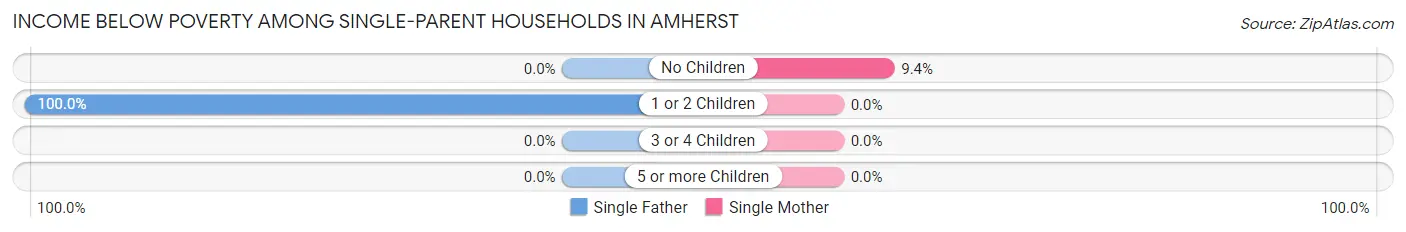
| Children | Single Father | Single Mother |
| No Children | 0 (0.0%) | 5 (9.4%) |
| 1 or 2 Children | 5 (100.0%) | 0 (0.0%) |
| 3 or 4 Children | 0 (0.0%) | 0 (0.0%) |
| 5 or more Children | 0 (0.0%) | 0 (0.0%) |
| Total | 5 (100.0%) | 5 (5.3%) |
Income Below Poverty Among Married-Couple vs Single-Parent Households in Amherst
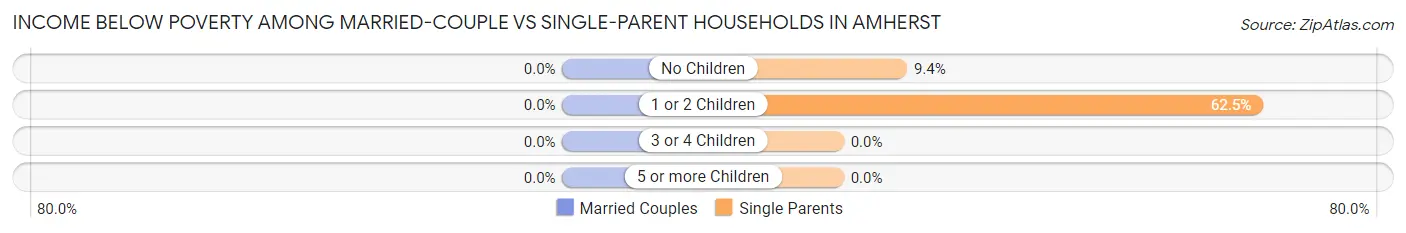
| Children | Married-Couple Families | Single-Parent Households |
| No Children | 0 (0.0%) | 5 (9.4%) |
| 1 or 2 Children | 0 (0.0%) | 5 (62.5%) |
| 3 or 4 Children | 0 (0.0%) | 0 (0.0%) |
| 5 or more Children | 0 (0.0%) | 0 (0.0%) |
| Total | 0 (0.0%) | 10 (10.1%) |
Race in Amherst
The most populous races in Amherst are White / Caucasian (1,749 | 76.1%), Black / African American (515 | 22.4%), and Hispanic or Latino (70 | 3.0%).
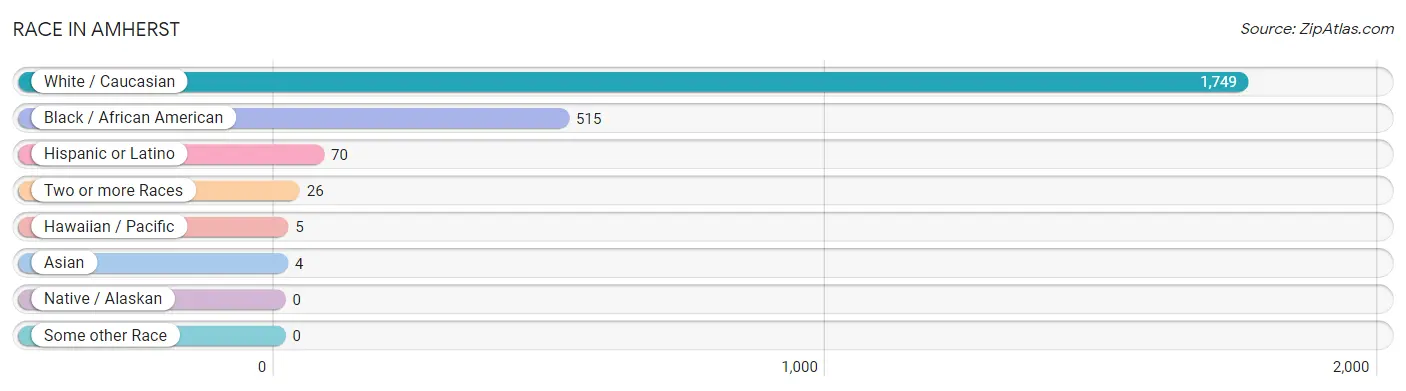
| Race | # Population | % Population |
| Asian | 4 | 0.2% |
| Black / African American | 515 | 22.4% |
| Hawaiian / Pacific | 5 | 0.2% |
| Hispanic or Latino | 70 | 3.0% |
| Native / Alaskan | 0 | 0.0% |
| White / Caucasian | 1,749 | 76.1% |
| Two or more Races | 26 | 1.1% |
| Some other Race | 0 | 0.0% |
| Total | 2,299 | 100.0% |
Ancestry in Amherst
The most populous ancestries reported in Amherst are American (576 | 25.1%), English (351 | 15.3%), Irish (153 | 6.7%), German (122 | 5.3%), and European (86 | 3.7%), together accounting for 56.0% of all Amherst residents.
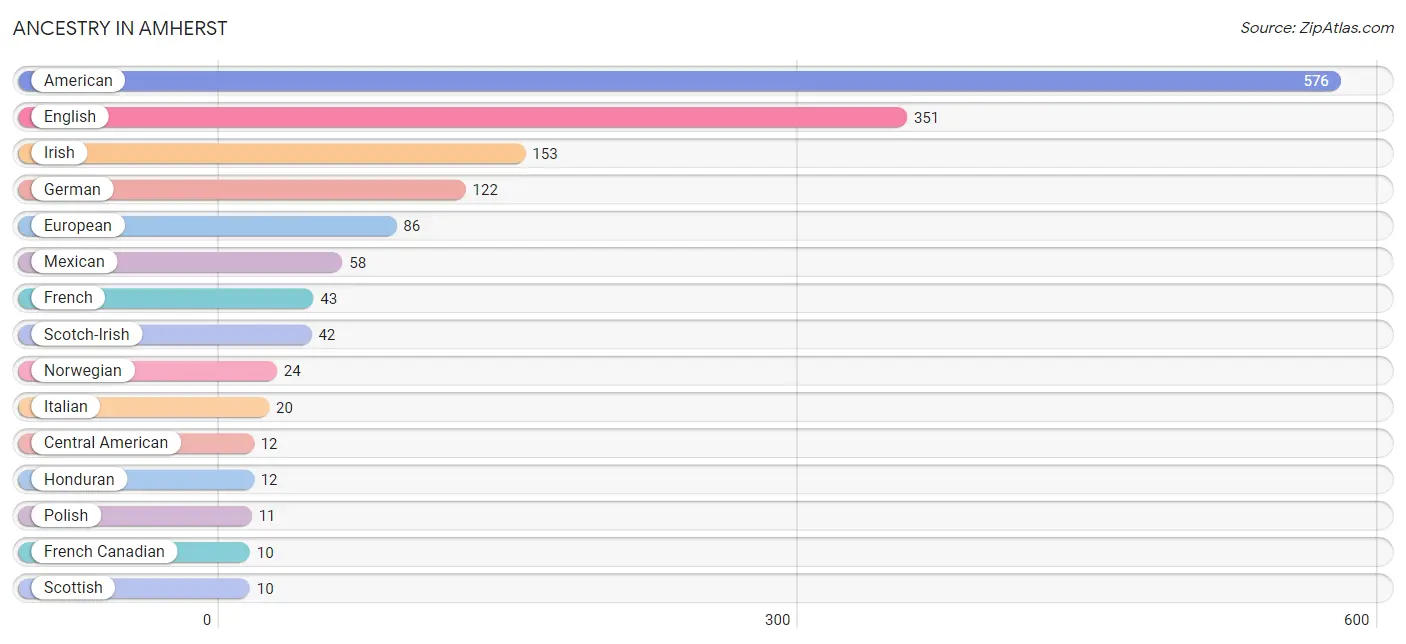
| Ancestry | # Population | % Population |
| African | 4 | 0.2% |
| American | 576 | 25.1% |
| British | 2 | 0.1% |
| Cajun | 7 | 0.3% |
| Central American | 12 | 0.5% |
| Dutch | 2 | 0.1% |
| English | 351 | 15.3% |
| European | 86 | 3.7% |
| French | 43 | 1.9% |
| French Canadian | 10 | 0.4% |
| German | 122 | 5.3% |
| Honduran | 12 | 0.5% |
| Indian (Asian) | 4 | 0.2% |
| Irish | 153 | 6.7% |
| Italian | 20 | 0.9% |
| Mexican | 58 | 2.5% |
| Native Hawaiian | 5 | 0.2% |
| Norwegian | 24 | 1.0% |
| Polish | 11 | 0.5% |
| Scotch-Irish | 42 | 1.8% |
| Scottish | 10 | 0.4% |
| Subsaharan African | 4 | 0.2% |
| Swiss | 5 | 0.2% |
| Ukrainian | 3 | 0.1% | View All 24 Rows |
Immigrants in Amherst
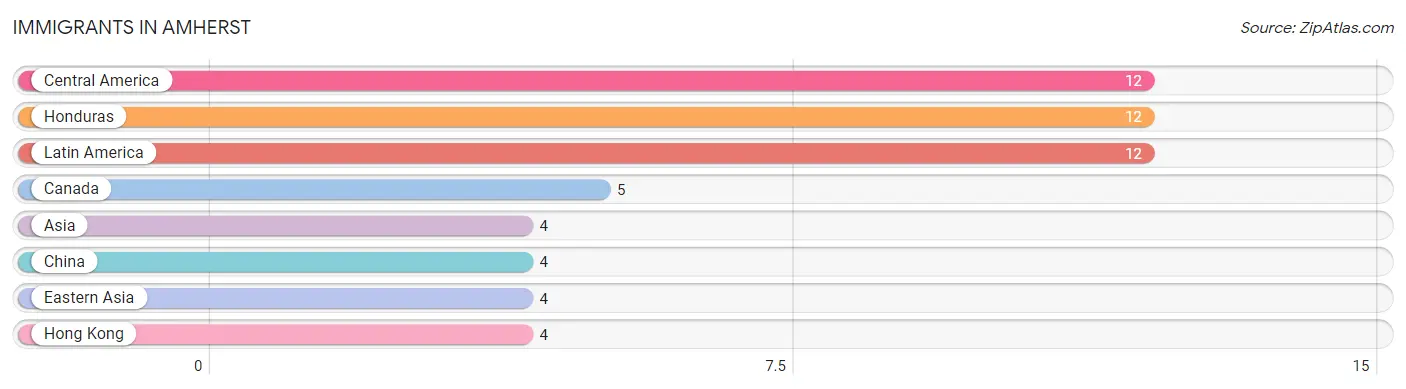
The most numerous immigrant groups reported in Amherst came from Central America (12 | 0.5%), Honduras (12 | 0.5%), Latin America (12 | 0.5%), Canada (5 | 0.2%), and Asia (4 | 0.2%), together accounting for 1.9% of all Amherst residents.
| Immigration Origin | # Population | % Population |
| Asia | 4 | 0.2% |
| Canada | 5 | 0.2% |
| Central America | 12 | 0.5% |
| China | 4 | 0.2% |
| Eastern Asia | 4 | 0.2% |
| Honduras | 12 | 0.5% |
| Hong Kong | 4 | 0.2% |
| Latin America | 12 | 0.5% | View All 8 Rows |
Sex and Age in Amherst
Sex and Age in Amherst
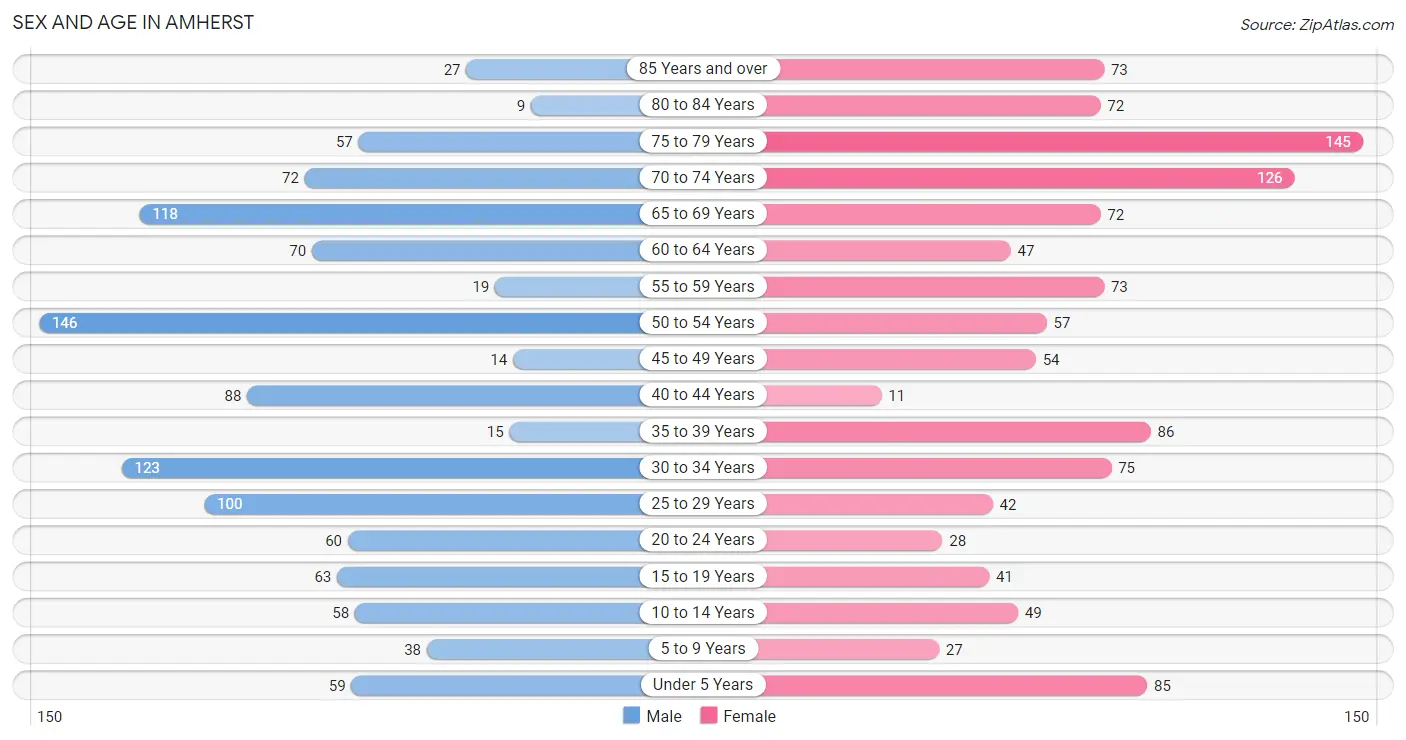
The most populous age groups in Amherst are 50 to 54 Years (146 | 12.9%) for men and 75 to 79 Years (145 | 12.5%) for women.
| Age Bracket | Male | Female |
| Under 5 Years | 59 (5.2%) | 85 (7.3%) |
| 5 to 9 Years | 38 (3.4%) | 27 (2.3%) |
| 10 to 14 Years | 58 (5.1%) | 49 (4.2%) |
| 15 to 19 Years | 63 (5.6%) | 41 (3.5%) |
| 20 to 24 Years | 60 (5.3%) | 28 (2.4%) |
| 25 to 29 Years | 100 (8.8%) | 42 (3.6%) |
| 30 to 34 Years | 123 (10.8%) | 75 (6.5%) |
| 35 to 39 Years | 15 (1.3%) | 86 (7.4%) |
| 40 to 44 Years | 88 (7.7%) | 11 (0.9%) |
| 45 to 49 Years | 14 (1.2%) | 54 (4.6%) |
| 50 to 54 Years | 146 (12.9%) | 57 (4.9%) |
| 55 to 59 Years | 19 (1.7%) | 73 (6.3%) |
| 60 to 64 Years | 70 (6.2%) | 47 (4.0%) |
| 65 to 69 Years | 118 (10.4%) | 72 (6.2%) |
| 70 to 74 Years | 72 (6.3%) | 126 (10.8%) |
| 75 to 79 Years | 57 (5.0%) | 145 (12.5%) |
| 80 to 84 Years | 9 (0.8%) | 72 (6.2%) |
| 85 Years and over | 27 (2.4%) | 73 (6.3%) |
| Total | 1,136 (100.0%) | 1,163 (100.0%) |
Families and Households in Amherst
Median Family Size in Amherst
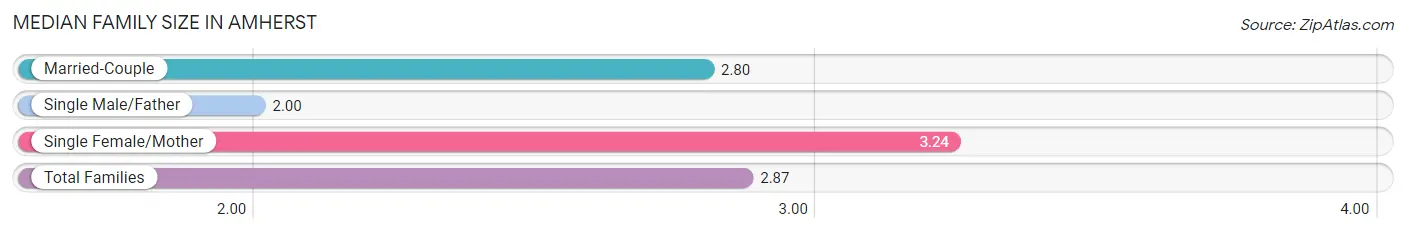
The median family size in Amherst is 2.87 persons per family, with single female/mother families (94 | 16.6%) accounting for the largest median family size of 3.24 persons per family. On the other hand, single male/father families (5 | 0.9%) represent the smallest median family size with 2.00 persons per family.
| Family Type | # Families | Family Size |
| Married-Couple | 466 (82.5%) | 2.80 |
| Single Male/Father | 5 (0.9%) | 2.00 |
| Single Female/Mother | 94 (16.6%) | 3.24 |
| Total Families | 565 (100.0%) | 2.87 |
Median Household Size in Amherst
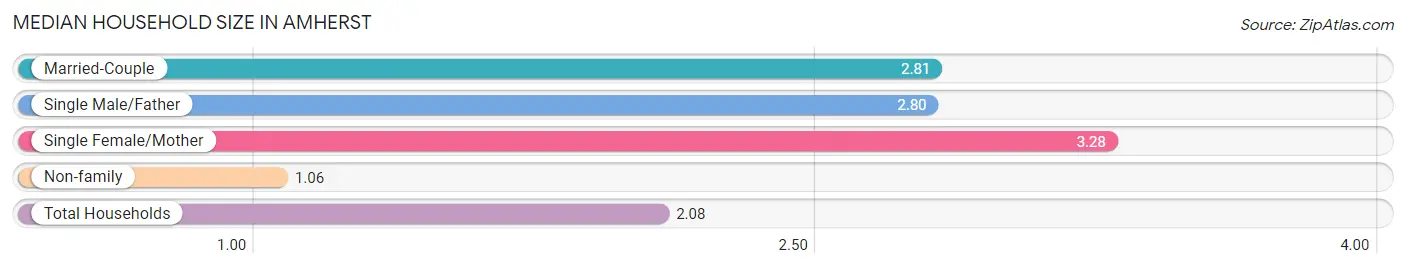
The median household size in Amherst is 2.08 persons per household, with single female/mother households (94 | 9.3%) accounting for the largest median household size of 3.28 persons per household. non-family households (448 | 44.2%) represent the smallest median household size with 1.06 persons per household.
| Household Type | # Households | Household Size |
| Married-Couple | 466 (46.0%) | 2.81 |
| Single Male/Father | 5 (0.5%) | 2.80 |
| Single Female/Mother | 94 (9.3%) | 3.28 |
| Non-family | 448 (44.2%) | 1.06 |
| Total Households | 1,013 (100.0%) | 2.08 |
Household Size by Marriage Status in Amherst
Out of a total of 1,013 households in Amherst, 565 (55.8%) are family households, while 448 (44.2%) are nonfamily households. The most numerous type of family households are 2-person households, comprising 291, and the most common type of nonfamily households are 1-person households, comprising 431.
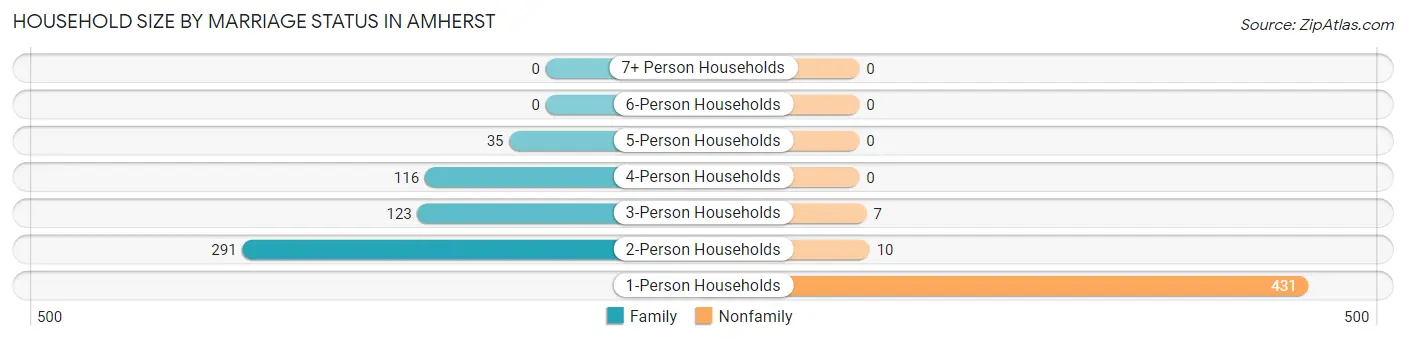
| Household Size | Family Households | Nonfamily Households |
| 1-Person Households | - | 431 (42.5%) |
| 2-Person Households | 291 (28.7%) | 10 (1.0%) |
| 3-Person Households | 123 (12.1%) | 7 (0.7%) |
| 4-Person Households | 116 (11.5%) | 0 (0.0%) |
| 5-Person Households | 35 (3.5%) | 0 (0.0%) |
| 6-Person Households | 0 (0.0%) | 0 (0.0%) |
| 7+ Person Households | 0 (0.0%) | 0 (0.0%) |
| Total | 565 (55.8%) | 448 (44.2%) |
Female Fertility in Amherst
Fertility by Age in Amherst
Average fertility rate in Amherst is 48.0 births per 1,000 women. Women in the age bracket of 20 to 34 years have the highest fertility rate with 117.0 births per 1,000 women. Women in the age bracket of 20 to 34 years acount for 100.0% of all women with births.
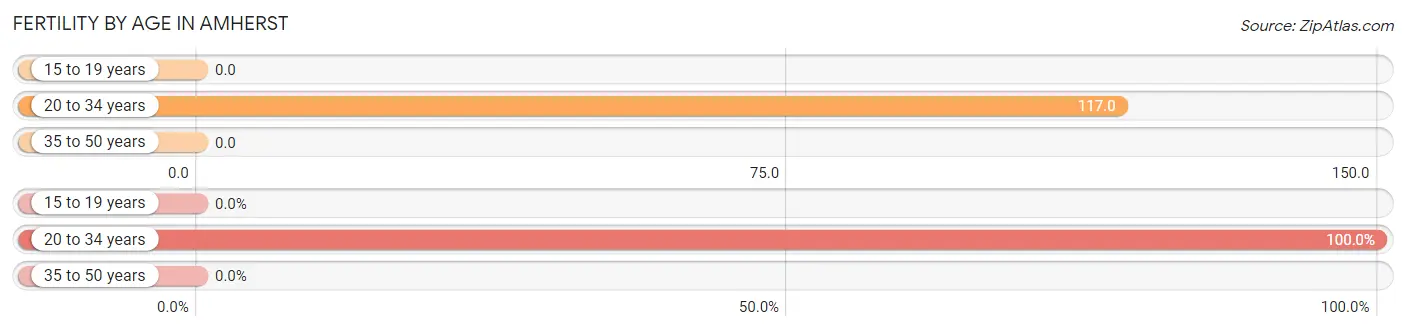
| Age Bracket | Women with Births | Births / 1,000 Women |
| 15 to 19 years | 0 (0.0%) | 0.0 |
| 20 to 34 years | 17 (100.0%) | 117.0 |
| 35 to 50 years | 0 (0.0%) | 0.0 |
| Total | 17 (100.0%) | 48.0 |
Fertility by Age by Marriage Status in Amherst
76.5% of women with births (17) in Amherst are married. The highest percentage of unmarried women with births falls into 20 to 34 years age bracket with 23.5% of them unmarried at the time of birth, while the lowest percentage of unmarried women with births belong to 20 to 34 years age bracket with 23.5% of them unmarried.
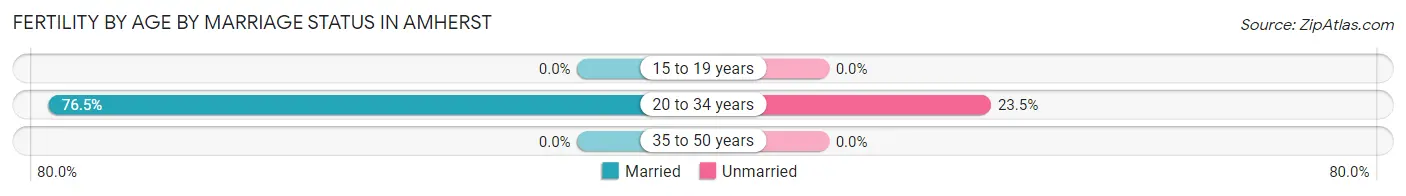
| Age Bracket | Married | Unmarried |
| 15 to 19 years | 0 (0.0%) | 0 (0.0%) |
| 20 to 34 years | 13 (76.5%) | 4 (23.5%) |
| 35 to 50 years | 0 (0.0%) | 0 (0.0%) |
| Total | 13 (76.5%) | 4 (23.5%) |
Fertility by Education in Amherst
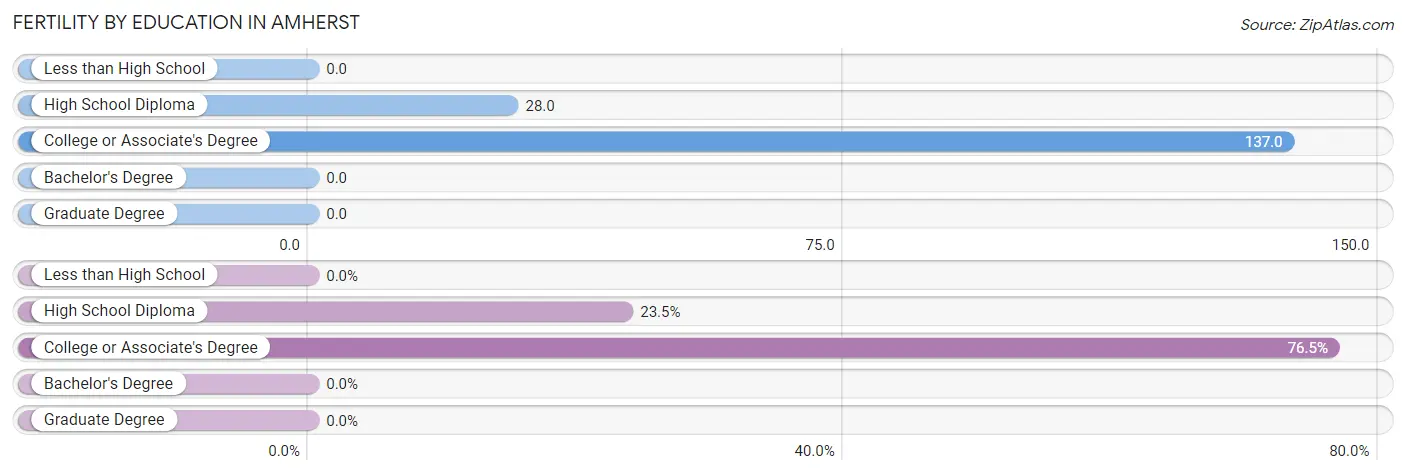
| Educational Attainment | Women with Births | Births / 1,000 Women |
| Less than High School | 0 (0.0%) | 0.0 |
| High School Diploma | 4 (23.5%) | 28.0 |
| College or Associate's Degree | 13 (76.5%) | 137.0 |
| Bachelor's Degree | 0 (0.0%) | 0.0 |
| Graduate Degree | 0 (0.0%) | 0.0 |
| Total | 17 (100.0%) | 48.0 |
Fertility by Education by Marriage Status in Amherst
23.5% of women with births in Amherst are unmarried. Women with the educational attainment of college or associate's degree are most likely to be married with 100.0% of them married at childbirth, while women with the educational attainment of high school diploma are least likely to be married with 100.0% of them unmarried at childbirth.
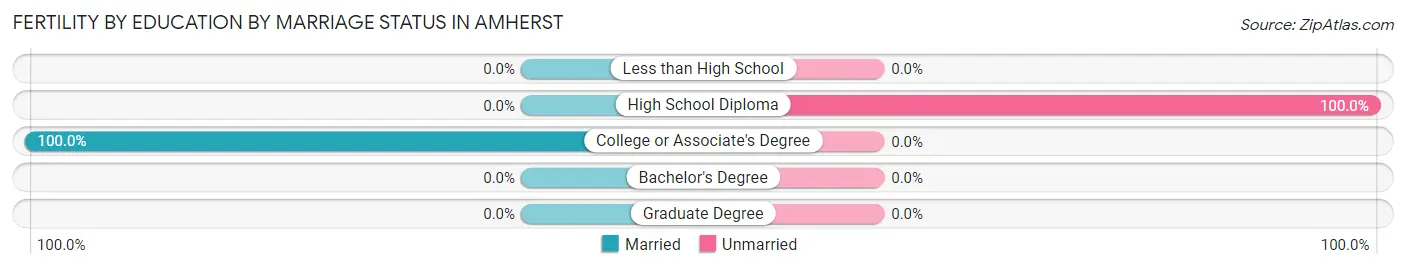
| Educational Attainment | Married | Unmarried |
| Less than High School | 0 (0.0%) | 0 (0.0%) |
| High School Diploma | 0 (0.0%) | 4 (100.0%) |
| College or Associate's Degree | 13 (100.0%) | 0 (0.0%) |
| Bachelor's Degree | 0 (0.0%) | 0 (0.0%) |
| Graduate Degree | 0 (0.0%) | 0 (0.0%) |
| Total | 13 (76.5%) | 4 (23.5%) |
Employment Characteristics in Amherst
Employment by Class of Employer in Amherst
Among the 910 employed individuals in Amherst, private company employees (654 | 71.9%), not-for-profit organizations (102 | 11.2%), and local government employees (67 | 7.4%) make up the most common classes of employment.
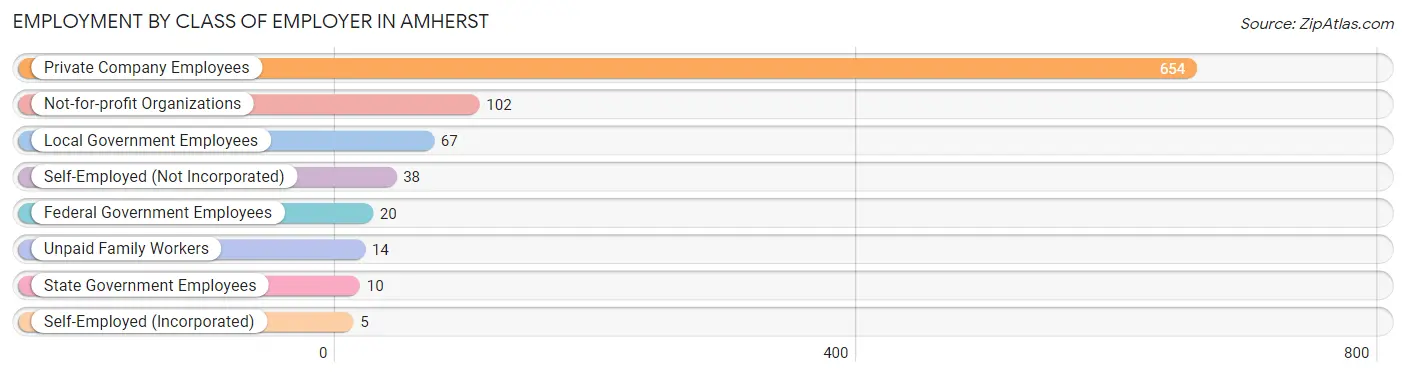
| Employer Class | # Employees | % Employees |
| Private Company Employees | 654 | 71.9% |
| Self-Employed (Incorporated) | 5 | 0.5% |
| Self-Employed (Not Incorporated) | 38 | 4.2% |
| Not-for-profit Organizations | 102 | 11.2% |
| Local Government Employees | 67 | 7.4% |
| State Government Employees | 10 | 1.1% |
| Federal Government Employees | 20 | 2.2% |
| Unpaid Family Workers | 14 | 1.5% |
| Total | 910 | 100.0% |
Employment Status by Age in Amherst
According to the labor force statistics for Amherst, out of the total population over 16 years of age (1,982), 48.7% or 965 individuals are in the labor force, with 1.2% or 12 of them unemployed. The age group with the highest labor force participation rate is 35 to 44 years, with 84.5% or 169 individuals in the labor force. Within the labor force, the 35 to 44 years age range has the highest percentage of unemployed individuals, with 4.7% or 8 of them being unemployed.
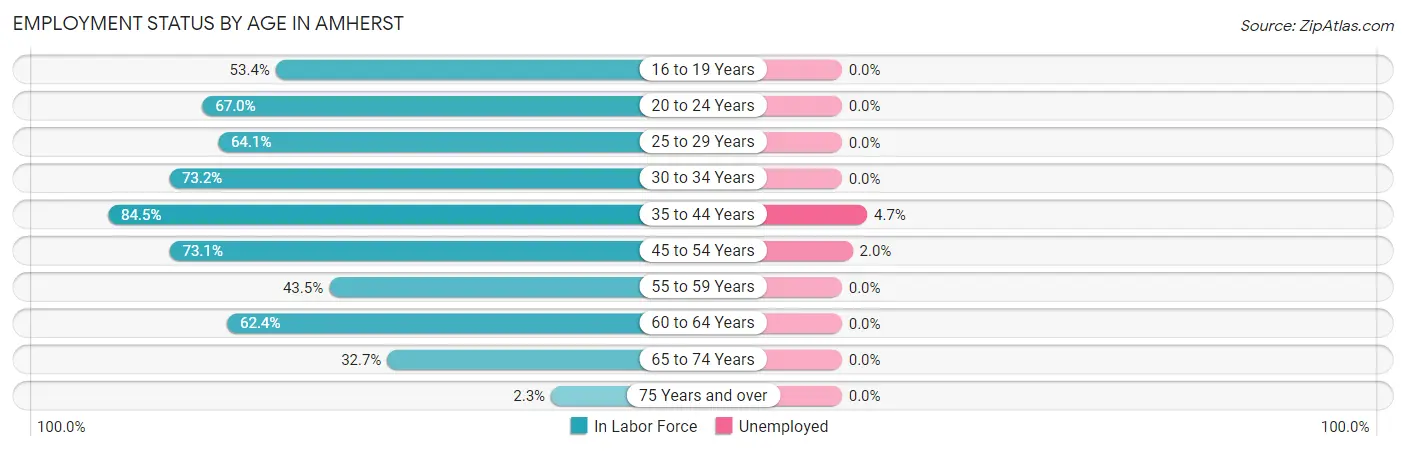
| Age Bracket | In Labor Force | Unemployed |
| 16 to 19 Years | 55 (53.4%) | 0 (0.0%) |
| 20 to 24 Years | 59 (67.0%) | 0 (0.0%) |
| 25 to 29 Years | 91 (64.1%) | 0 (0.0%) |
| 30 to 34 Years | 145 (73.2%) | 0 (0.0%) |
| 35 to 44 Years | 169 (84.5%) | 8 (4.7%) |
| 45 to 54 Years | 198 (73.1%) | 4 (2.0%) |
| 55 to 59 Years | 40 (43.5%) | 0 (0.0%) |
| 60 to 64 Years | 73 (62.4%) | 0 (0.0%) |
| 65 to 74 Years | 127 (32.7%) | 0 (0.0%) |
| 75 Years and over | 9 (2.3%) | 0 (0.0%) |
| Total | 965 (48.7%) | 12 (1.2%) |
Employment Status by Educational Attainment in Amherst
According to labor force statistics for Amherst, 70.2% of individuals (716) out of the total population between 25 and 64 years of age (1,020) are in the labor force, with 1.7% or 12 of them being unemployed. The group with the highest labor force participation rate are those with the educational attainment of bachelor's degree or higher, with 83.0% or 249 individuals in the labor force. Within the labor force, individuals with college / associate degree education have the highest percentage of unemployment, with 6.2% or 8 of them being unemployed.
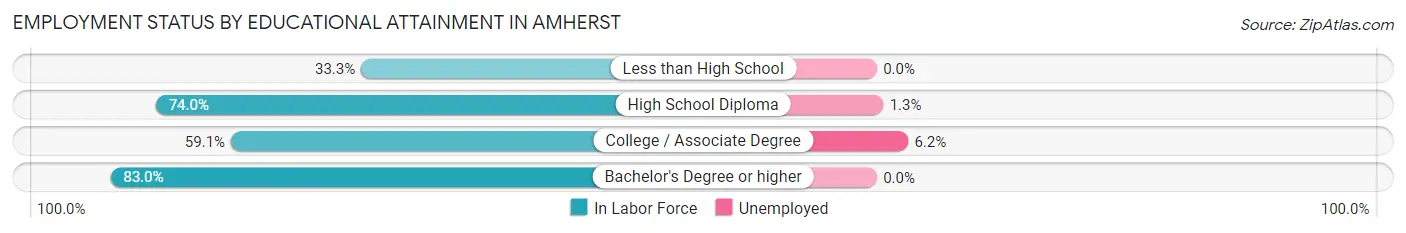
| Educational Attainment | In Labor Force | Unemployed |
| Less than High School | 27 (33.3%) | 0 (0.0%) |
| High School Diploma | 310 (74.0%) | 5 (1.3%) |
| College / Associate Degree | 130 (59.1%) | 14 (6.2%) |
| Bachelor's Degree or higher | 249 (83.0%) | 0 (0.0%) |
| Total | 716 (70.2%) | 17 (1.7%) |
Employment Occupations by Sex in Amherst
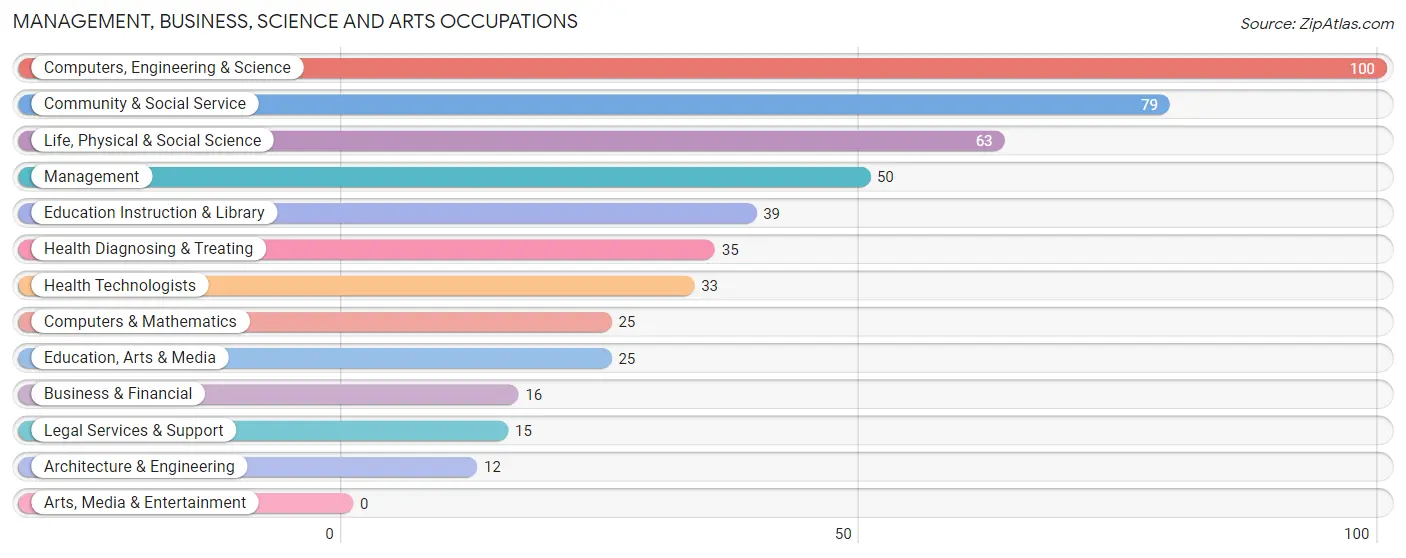
Management, Business, Science and Arts Occupations
The most common Management, Business, Science and Arts occupations in Amherst are Computers, Engineering & Science (100 | 10.5%), Community & Social Service (79 | 8.3%), Life, Physical & Social Science (63 | 6.6%), Management (50 | 5.2%), and Education Instruction & Library (39 | 4.1%).
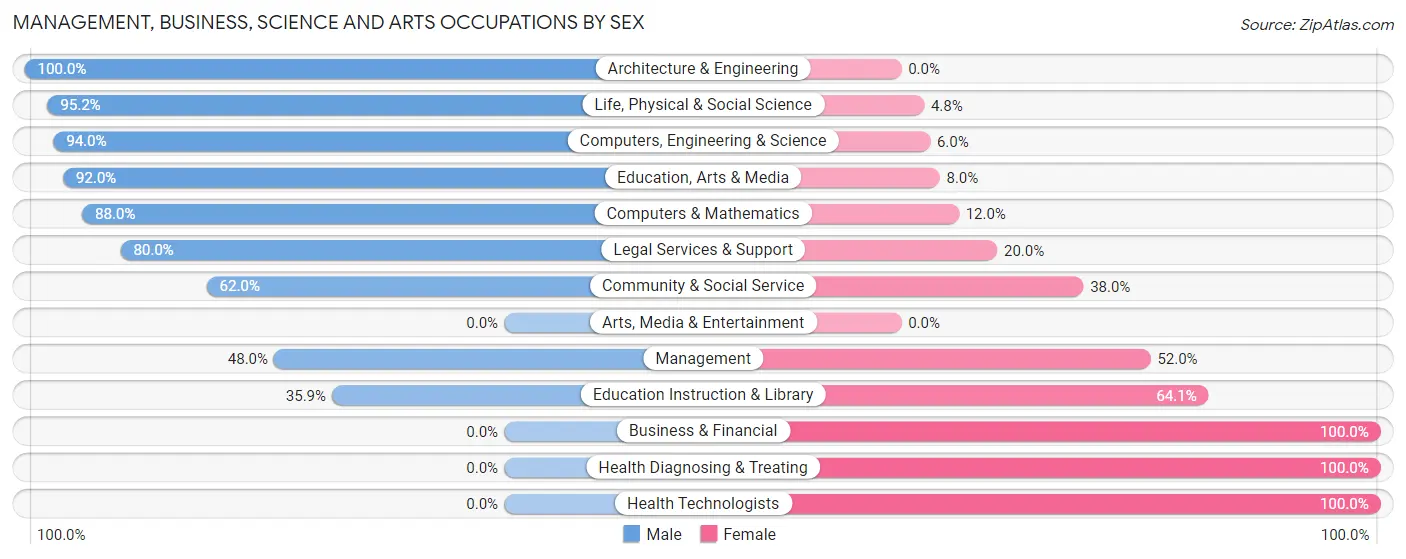
Management, Business, Science and Arts Occupations by Sex
Within the Management, Business, Science and Arts occupations in Amherst, the most male-oriented occupations are Architecture & Engineering (100.0%), Life, Physical & Social Science (95.2%), and Computers, Engineering & Science (94.0%), while the most female-oriented occupations are Business & Financial (100.0%), Health Diagnosing & Treating (100.0%), and Health Technologists (100.0%).
| Occupation | Male | Female |
| Management | 24 (48.0%) | 26 (52.0%) |
| Business & Financial | 0 (0.0%) | 16 (100.0%) |
| Computers, Engineering & Science | 94 (94.0%) | 6 (6.0%) |
| Computers & Mathematics | 22 (88.0%) | 3 (12.0%) |
| Architecture & Engineering | 12 (100.0%) | 0 (0.0%) |
| Life, Physical & Social Science | 60 (95.2%) | 3 (4.8%) |
| Community & Social Service | 49 (62.0%) | 30 (38.0%) |
| Education, Arts & Media | 23 (92.0%) | 2 (8.0%) |
| Legal Services & Support | 12 (80.0%) | 3 (20.0%) |
| Education Instruction & Library | 14 (35.9%) | 25 (64.1%) |
| Arts, Media & Entertainment | 0 (0.0%) | 0 (0.0%) |
| Health Diagnosing & Treating | 0 (0.0%) | 35 (100.0%) |
| Health Technologists | 0 (0.0%) | 33 (100.0%) |
| Total (Category) | 167 (59.6%) | 113 (40.4%) |
| Total (Overall) | 601 (63.0%) | 353 (37.0%) |
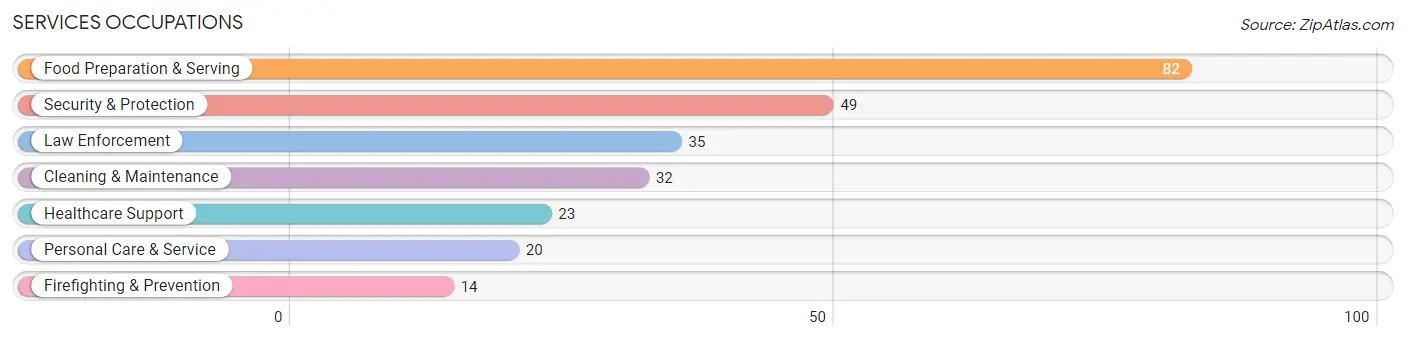
Services Occupations
The most common Services occupations in Amherst are Food Preparation & Serving (82 | 8.6%), Security & Protection (49 | 5.1%), Law Enforcement (35 | 3.7%), Cleaning & Maintenance (32 | 3.4%), and Healthcare Support (23 | 2.4%).
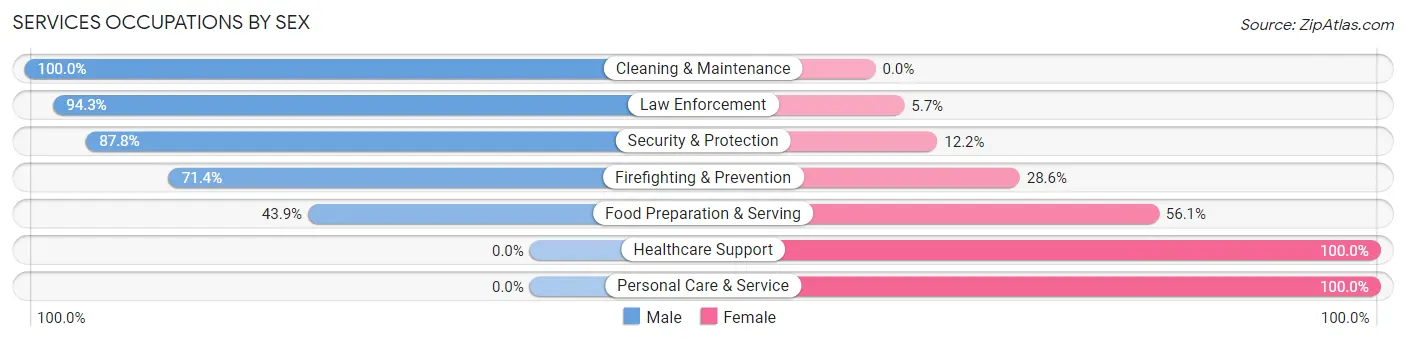
Services Occupations by Sex
Within the Services occupations in Amherst, the most male-oriented occupations are Cleaning & Maintenance (100.0%), Law Enforcement (94.3%), and Security & Protection (87.8%), while the most female-oriented occupations are Healthcare Support (100.0%), Personal Care & Service (100.0%), and Food Preparation & Serving (56.1%).
| Occupation | Male | Female |
| Healthcare Support | 0 (0.0%) | 23 (100.0%) |
| Security & Protection | 43 (87.8%) | 6 (12.2%) |
| Firefighting & Prevention | 10 (71.4%) | 4 (28.6%) |
| Law Enforcement | 33 (94.3%) | 2 (5.7%) |
| Food Preparation & Serving | 36 (43.9%) | 46 (56.1%) |
| Cleaning & Maintenance | 32 (100.0%) | 0 (0.0%) |
| Personal Care & Service | 0 (0.0%) | 20 (100.0%) |
| Total (Category) | 111 (53.9%) | 95 (46.1%) |
| Total (Overall) | 601 (63.0%) | 353 (37.0%) |
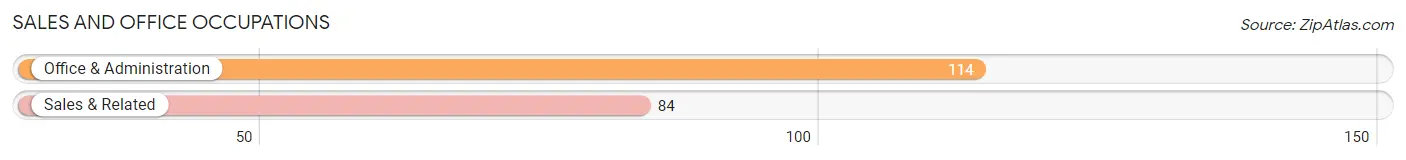
Sales and Office Occupations
The most common Sales and Office occupations in Amherst are Office & Administration (114 | 11.9%), and Sales & Related (84 | 8.8%).
Sales and Office Occupations by Sex
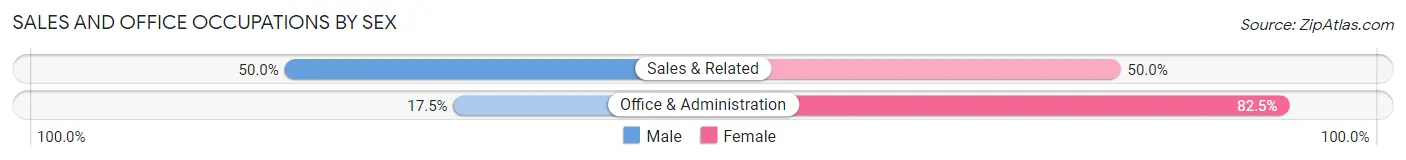
| Occupation | Male | Female |
| Sales & Related | 42 (50.0%) | 42 (50.0%) |
| Office & Administration | 20 (17.5%) | 94 (82.5%) |
| Total (Category) | 62 (31.3%) | 136 (68.7%) |
| Total (Overall) | 601 (63.0%) | 353 (37.0%) |
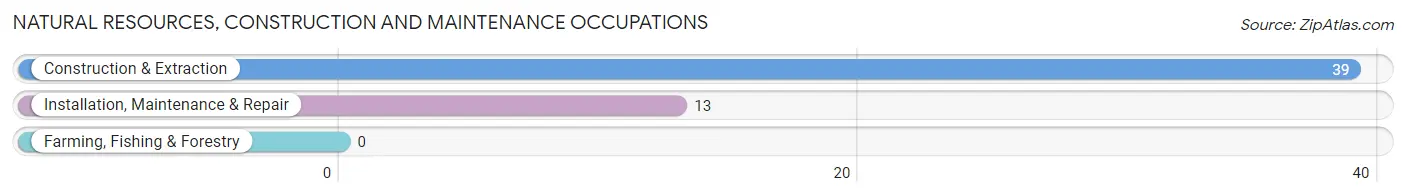
Natural Resources, Construction and Maintenance Occupations
The most common Natural Resources, Construction and Maintenance occupations in Amherst are Construction & Extraction (39 | 4.1%), and Installation, Maintenance & Repair (13 | 1.4%).
Natural Resources, Construction and Maintenance Occupations by Sex
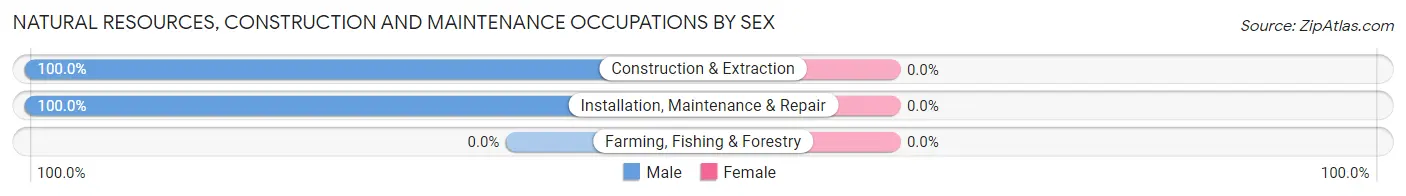
| Occupation | Male | Female |
| Farming, Fishing & Forestry | 0 (0.0%) | 0 (0.0%) |
| Construction & Extraction | 39 (100.0%) | 0 (0.0%) |
| Installation, Maintenance & Repair | 13 (100.0%) | 0 (0.0%) |
| Total (Category) | 52 (100.0%) | 0 (0.0%) |
| Total (Overall) | 601 (63.0%) | 353 (37.0%) |
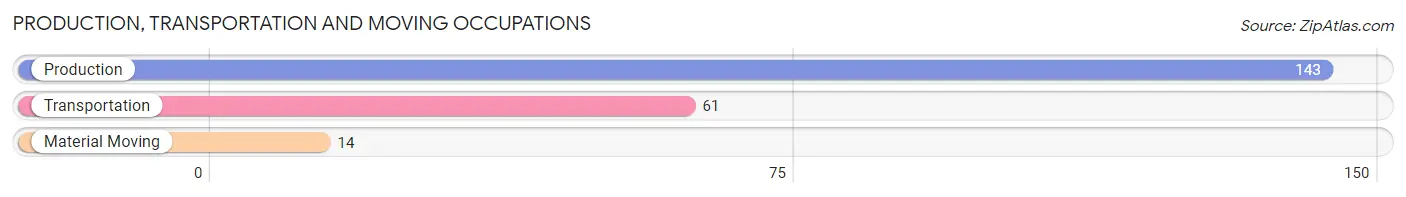
Production, Transportation and Moving Occupations
The most common Production, Transportation and Moving occupations in Amherst are Production (143 | 15.0%), Transportation (61 | 6.4%), and Material Moving (14 | 1.5%).
Production, Transportation and Moving Occupations by Sex
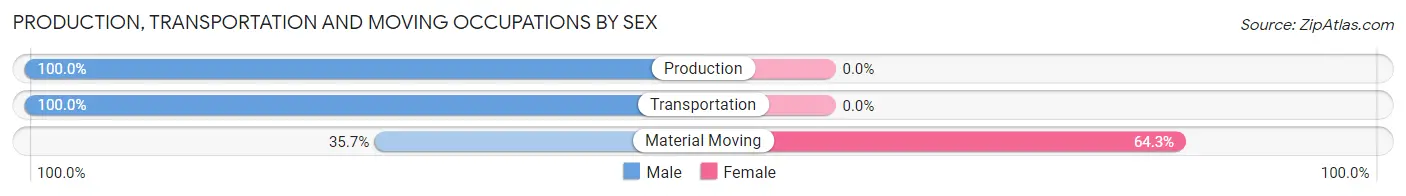
| Occupation | Male | Female |
| Production | 143 (100.0%) | 0 (0.0%) |
| Transportation | 61 (100.0%) | 0 (0.0%) |
| Material Moving | 5 (35.7%) | 9 (64.3%) |
| Total (Category) | 209 (95.9%) | 9 (4.1%) |
| Total (Overall) | 601 (63.0%) | 353 (37.0%) |
Employment Industries by Sex in Amherst
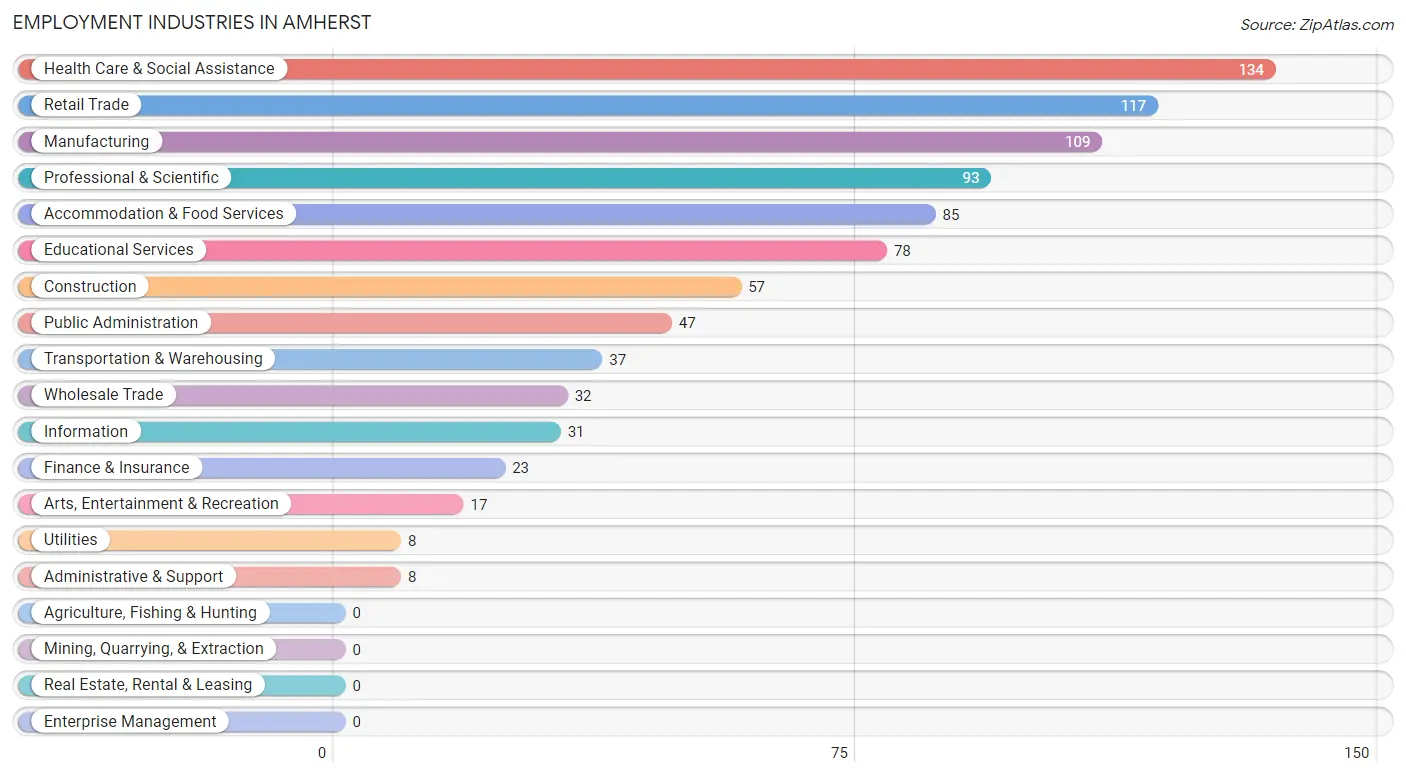
Employment Industries in Amherst
The major employment industries in Amherst include Health Care & Social Assistance (134 | 14.1%), Retail Trade (117 | 12.3%), Manufacturing (109 | 11.4%), Professional & Scientific (93 | 9.8%), and Accommodation & Food Services (85 | 8.9%).
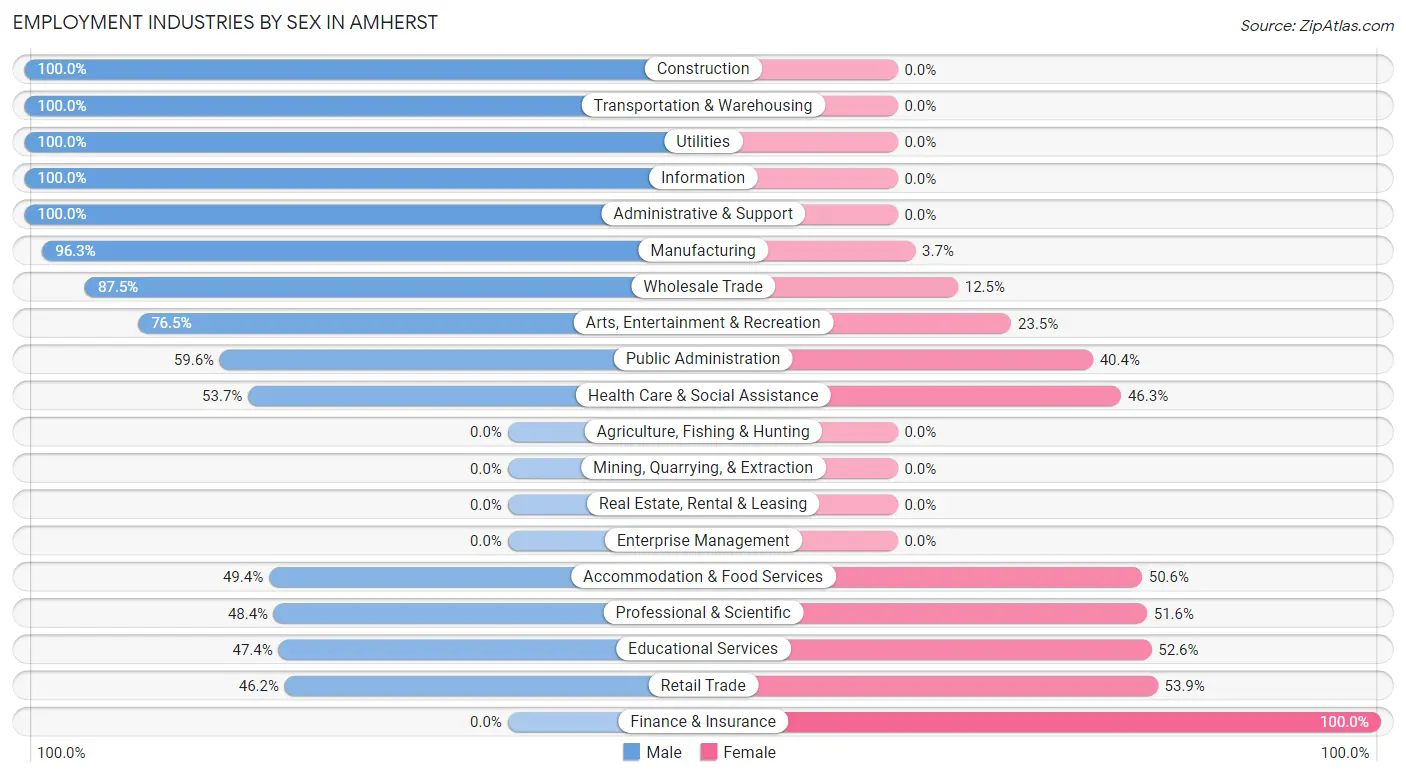
Employment Industries by Sex in Amherst
The Amherst industries that see more men than women are Construction (100.0%), Transportation & Warehousing (100.0%), and Utilities (100.0%), whereas the industries that tend to have a higher number of women are Finance & Insurance (100.0%), Retail Trade (53.8%), and Educational Services (52.6%).
| Industry | Male | Female |
| Agriculture, Fishing & Hunting | 0 (0.0%) | 0 (0.0%) |
| Mining, Quarrying, & Extraction | 0 (0.0%) | 0 (0.0%) |
| Construction | 57 (100.0%) | 0 (0.0%) |
| Manufacturing | 105 (96.3%) | 4 (3.7%) |
| Wholesale Trade | 28 (87.5%) | 4 (12.5%) |
| Retail Trade | 54 (46.2%) | 63 (53.8%) |
| Transportation & Warehousing | 37 (100.0%) | 0 (0.0%) |
| Utilities | 8 (100.0%) | 0 (0.0%) |
| Information | 31 (100.0%) | 0 (0.0%) |
| Finance & Insurance | 0 (0.0%) | 23 (100.0%) |
| Real Estate, Rental & Leasing | 0 (0.0%) | 0 (0.0%) |
| Professional & Scientific | 45 (48.4%) | 48 (51.6%) |
| Enterprise Management | 0 (0.0%) | 0 (0.0%) |
| Administrative & Support | 8 (100.0%) | 0 (0.0%) |
| Educational Services | 37 (47.4%) | 41 (52.6%) |
| Health Care & Social Assistance | 72 (53.7%) | 62 (46.3%) |
| Arts, Entertainment & Recreation | 13 (76.5%) | 4 (23.5%) |
| Accommodation & Food Services | 42 (49.4%) | 43 (50.6%) |
| Public Administration | 28 (59.6%) | 19 (40.4%) |
| Total | 601 (63.0%) | 353 (37.0%) |
Education in Amherst
School Enrollment in Amherst
The most common levels of schooling among the 371 students in Amherst are middle school (101 | 27.2%), high school (71 | 19.1%), and college / undergraduate (64 | 17.2%).
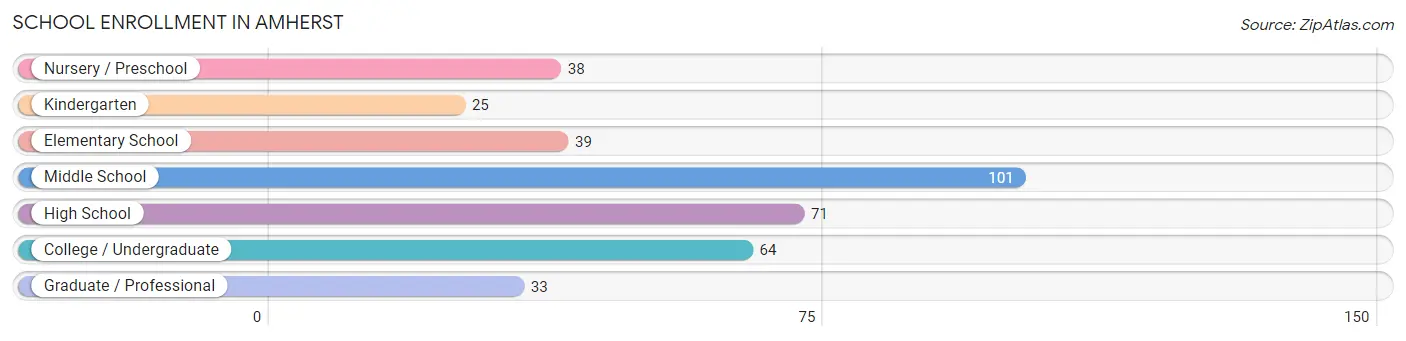
| School Level | # Students | % Students |
| Nursery / Preschool | 38 | 10.2% |
| Kindergarten | 25 | 6.7% |
| Elementary School | 39 | 10.5% |
| Middle School | 101 | 27.2% |
| High School | 71 | 19.1% |
| College / Undergraduate | 64 | 17.2% |
| Graduate / Professional | 33 | 8.9% |
| Total | 371 | 100.0% |
School Enrollment by Age by Funding Source in Amherst
Out of a total of 371 students who are enrolled in schools in Amherst, 93 (25.1%) attend a private institution, while the remaining 278 (74.9%) are enrolled in public schools. The age group of 18 to 19 year olds has the highest likelihood of being enrolled in private schools, with 8 (100.0% in the age bracket) enrolled. Conversely, the age group of 35 years and over has the lowest likelihood of being enrolled in a private school, with 37 (100.0% in the age bracket) attending a public institution.
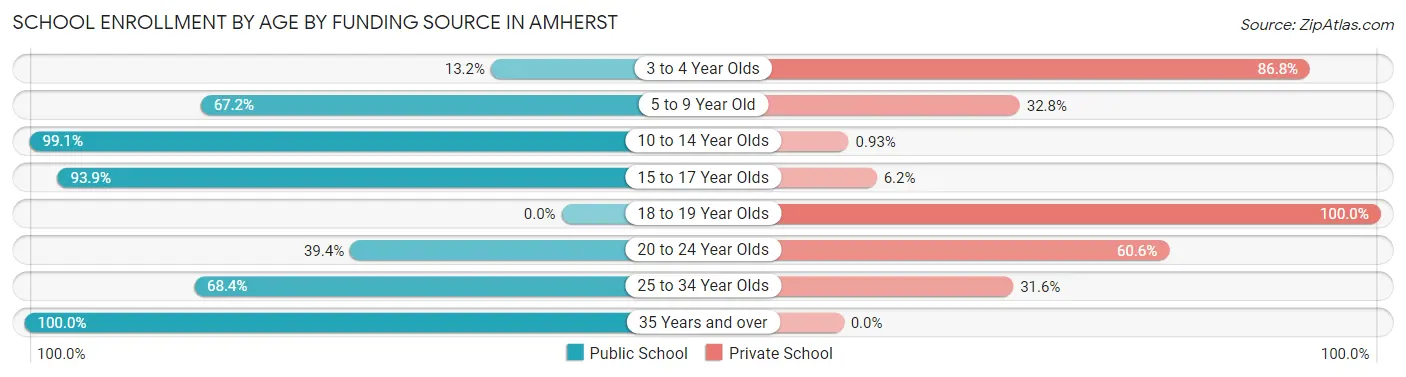
| Age Bracket | Public School | Private School |
| 3 to 4 Year Olds | 5 (13.2%) | 33 (86.8%) |
| 5 to 9 Year Old | 43 (67.2%) | 21 (32.8%) |
| 10 to 14 Year Olds | 106 (99.1%) | 1 (0.9%) |
| 15 to 17 Year Olds | 61 (93.9%) | 4 (6.1%) |
| 18 to 19 Year Olds | 0 (0.0%) | 8 (100.0%) |
| 20 to 24 Year Olds | 13 (39.4%) | 20 (60.6%) |
| 25 to 34 Year Olds | 13 (68.4%) | 6 (31.6%) |
| 35 Years and over | 37 (100.0%) | 0 (0.0%) |
| Total | 278 (74.9%) | 93 (25.1%) |
Educational Attainment by Field of Study in Amherst
Business (145 | 30.3%), education (85 | 17.8%), psychology (61 | 12.8%), social sciences (44 | 9.2%), and science & technology (35 | 7.3%) are the most common fields of study among 478 individuals in Amherst who have obtained a bachelor's degree or higher.
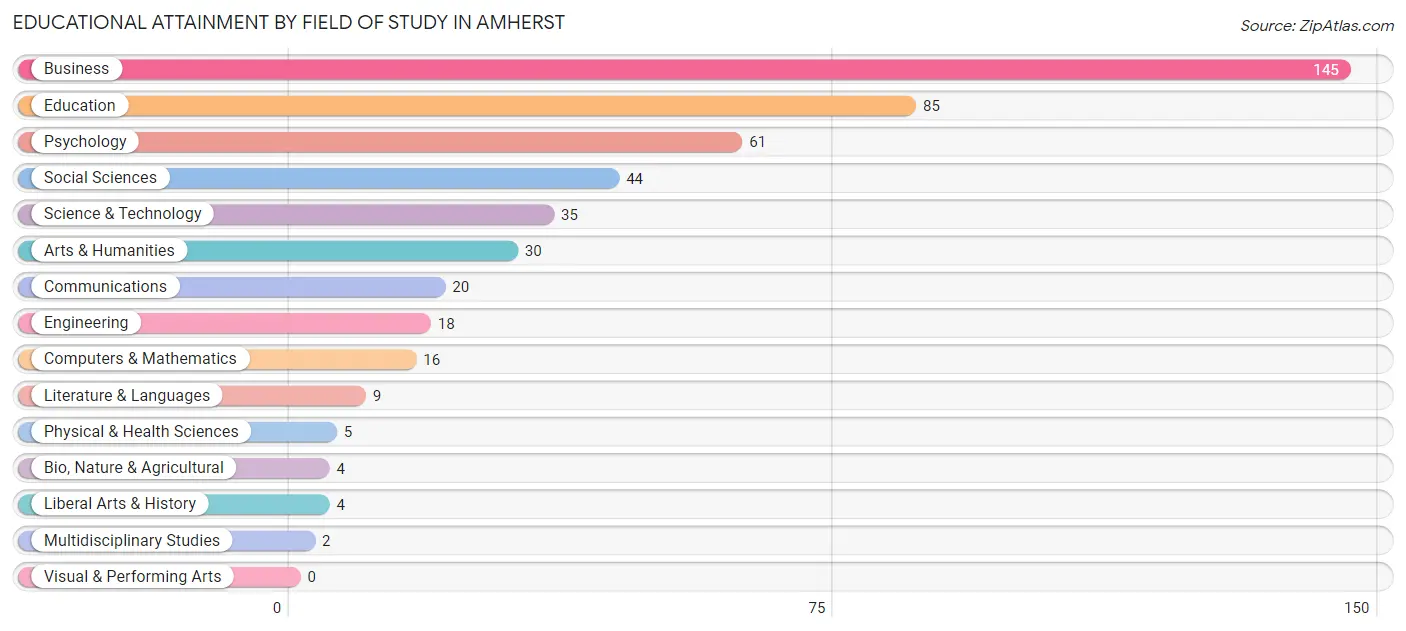
| Field of Study | # Graduates | % Graduates |
| Computers & Mathematics | 16 | 3.4% |
| Bio, Nature & Agricultural | 4 | 0.8% |
| Physical & Health Sciences | 5 | 1.1% |
| Psychology | 61 | 12.8% |
| Social Sciences | 44 | 9.2% |
| Engineering | 18 | 3.8% |
| Multidisciplinary Studies | 2 | 0.4% |
| Science & Technology | 35 | 7.3% |
| Business | 145 | 30.3% |
| Education | 85 | 17.8% |
| Literature & Languages | 9 | 1.9% |
| Liberal Arts & History | 4 | 0.8% |
| Visual & Performing Arts | 0 | 0.0% |
| Communications | 20 | 4.2% |
| Arts & Humanities | 30 | 6.3% |
| Total | 478 | 100.0% |
Transportation & Commute in Amherst
Vehicle Availability by Sex in Amherst
The most prevalent vehicle ownership categories in Amherst are males with 3 vehicles (275, accounting for 47.6%) and females with 3 vehicles (121, making up 82.8%).
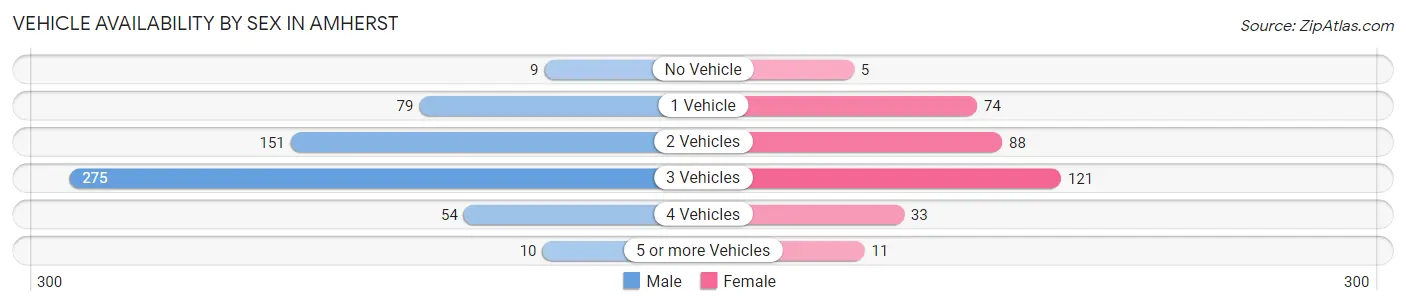
| Vehicles Available | Male | Female |
| No Vehicle | 9 (1.6%) | 5 (1.5%) |
| 1 Vehicle | 79 (13.7%) | 74 (22.3%) |
| 2 Vehicles | 151 (26.1%) | 88 (26.5%) |
| 3 Vehicles | 275 (47.6%) | 121 (36.4%) |
| 4 Vehicles | 54 (9.3%) | 33 (9.9%) |
| 5 or more Vehicles | 10 (1.7%) | 11 (3.3%) |
| Total | 578 (100.0%) | 332 (100.0%) |
Commute Time in Amherst
The most frequently occuring commute durations in Amherst are 5 to 9 minutes (238 commuters, 28.5%), 20 to 24 minutes (103 commuters, 12.3%), and less than 5 minutes (99 commuters, 11.9%).
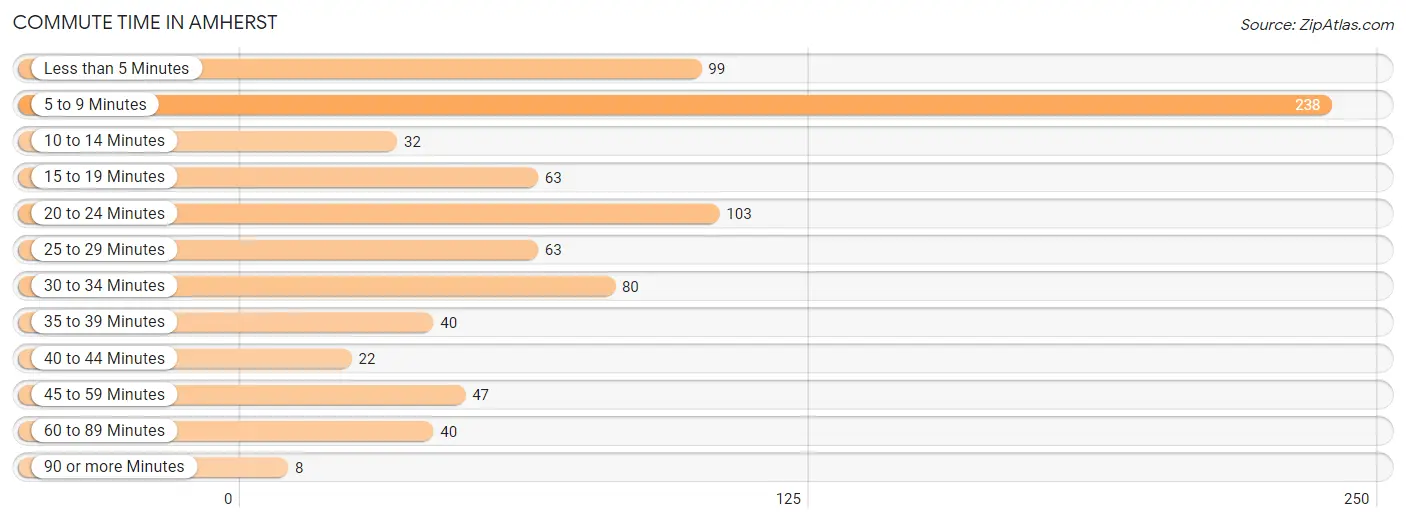
| Commute Time | # Commuters | % Commuters |
| Less than 5 Minutes | 99 | 11.9% |
| 5 to 9 Minutes | 238 | 28.5% |
| 10 to 14 Minutes | 32 | 3.8% |
| 15 to 19 Minutes | 63 | 7.5% |
| 20 to 24 Minutes | 103 | 12.3% |
| 25 to 29 Minutes | 63 | 7.5% |
| 30 to 34 Minutes | 80 | 9.6% |
| 35 to 39 Minutes | 40 | 4.8% |
| 40 to 44 Minutes | 22 | 2.6% |
| 45 to 59 Minutes | 47 | 5.6% |
| 60 to 89 Minutes | 40 | 4.8% |
| 90 or more Minutes | 8 | 1.0% |
Commute Time by Sex in Amherst
The most common commute times in Amherst are 5 to 9 minutes (168 commuters, 33.1%) for males and 5 to 9 minutes (70 commuters, 21.4%) for females.
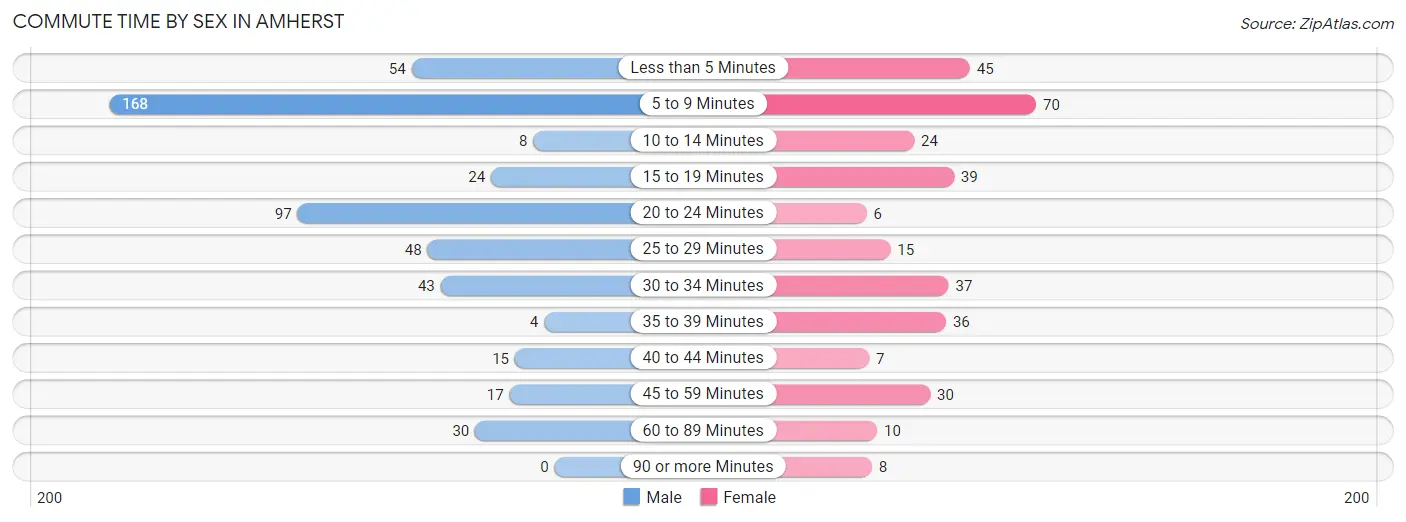
| Commute Time | Male | Female |
| Less than 5 Minutes | 54 (10.6%) | 45 (13.8%) |
| 5 to 9 Minutes | 168 (33.1%) | 70 (21.4%) |
| 10 to 14 Minutes | 8 (1.6%) | 24 (7.3%) |
| 15 to 19 Minutes | 24 (4.7%) | 39 (11.9%) |
| 20 to 24 Minutes | 97 (19.1%) | 6 (1.8%) |
| 25 to 29 Minutes | 48 (9.5%) | 15 (4.6%) |
| 30 to 34 Minutes | 43 (8.5%) | 37 (11.3%) |
| 35 to 39 Minutes | 4 (0.8%) | 36 (11.0%) |
| 40 to 44 Minutes | 15 (2.9%) | 7 (2.1%) |
| 45 to 59 Minutes | 17 (3.4%) | 30 (9.2%) |
| 60 to 89 Minutes | 30 (5.9%) | 10 (3.1%) |
| 90 or more Minutes | 0 (0.0%) | 8 (2.5%) |
Time of Departure to Work by Sex in Amherst
The most frequent times of departure to work in Amherst are 6:00 AM to 6:29 AM (94, 18.5%) for males and 6:30 AM to 6:59 AM (70, 21.4%) for females.
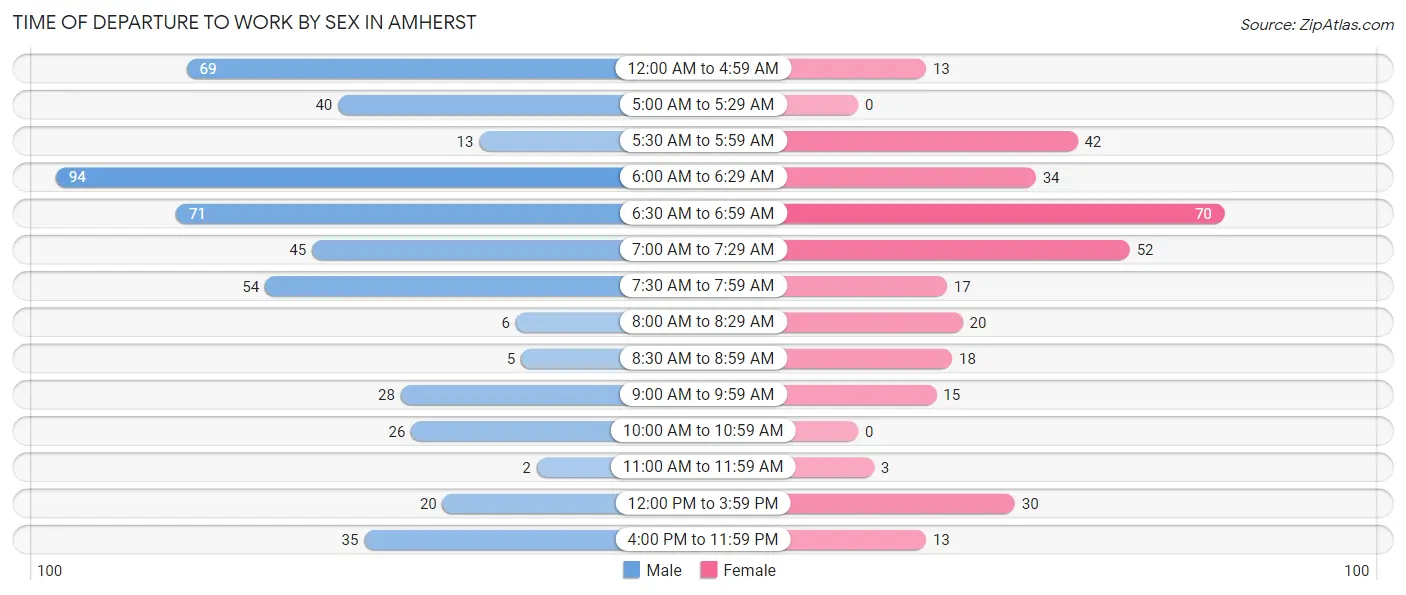
| Time of Departure | Male | Female |
| 12:00 AM to 4:59 AM | 69 (13.6%) | 13 (4.0%) |
| 5:00 AM to 5:29 AM | 40 (7.9%) | 0 (0.0%) |
| 5:30 AM to 5:59 AM | 13 (2.6%) | 42 (12.8%) |
| 6:00 AM to 6:29 AM | 94 (18.5%) | 34 (10.4%) |
| 6:30 AM to 6:59 AM | 71 (14.0%) | 70 (21.4%) |
| 7:00 AM to 7:29 AM | 45 (8.9%) | 52 (15.9%) |
| 7:30 AM to 7:59 AM | 54 (10.6%) | 17 (5.2%) |
| 8:00 AM to 8:29 AM | 6 (1.2%) | 20 (6.1%) |
| 8:30 AM to 8:59 AM | 5 (1.0%) | 18 (5.5%) |
| 9:00 AM to 9:59 AM | 28 (5.5%) | 15 (4.6%) |
| 10:00 AM to 10:59 AM | 26 (5.1%) | 0 (0.0%) |
| 11:00 AM to 11:59 AM | 2 (0.4%) | 3 (0.9%) |
| 12:00 PM to 3:59 PM | 20 (3.9%) | 30 (9.2%) |
| 4:00 PM to 11:59 PM | 35 (6.9%) | 13 (4.0%) |
| Total | 508 (100.0%) | 327 (100.0%) |
Housing Occupancy in Amherst
Occupancy by Ownership in Amherst
Of the total 1,013 dwellings in Amherst, owner-occupied units account for 677 (66.8%), while renter-occupied units make up 336 (33.2%).
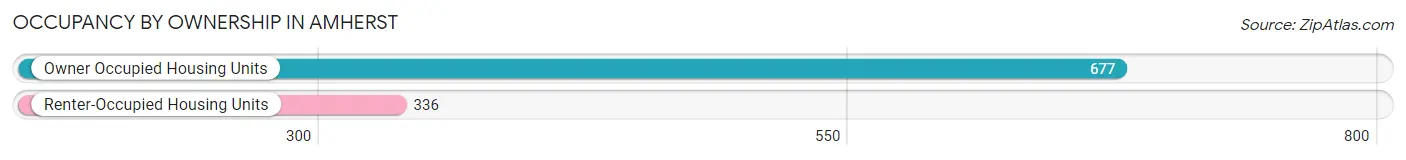
| Occupancy | # Housing Units | % Housing Units |
| Owner Occupied Housing Units | 677 | 66.8% |
| Renter-Occupied Housing Units | 336 | 33.2% |
| Total Occupied Housing Units | 1,013 | 100.0% |
Occupancy by Household Size in Amherst
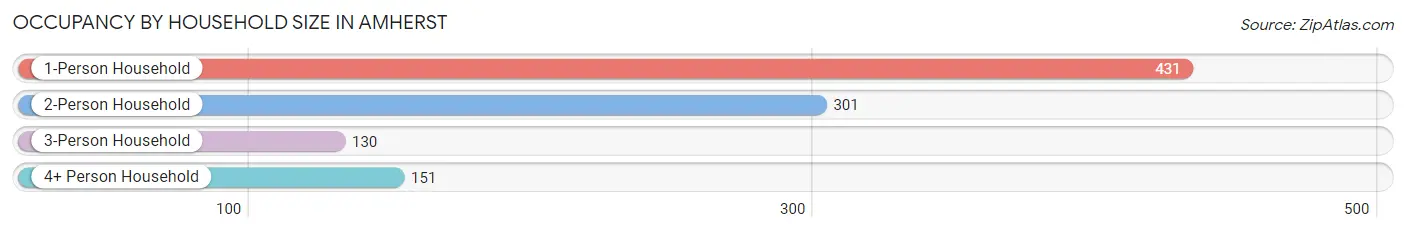
| Household Size | # Housing Units | % Housing Units |
| 1-Person Household | 431 | 42.5% |
| 2-Person Household | 301 | 29.7% |
| 3-Person Household | 130 | 12.8% |
| 4+ Person Household | 151 | 14.9% |
| Total Housing Units | 1,013 | 100.0% |
Occupancy by Ownership by Household Size in Amherst
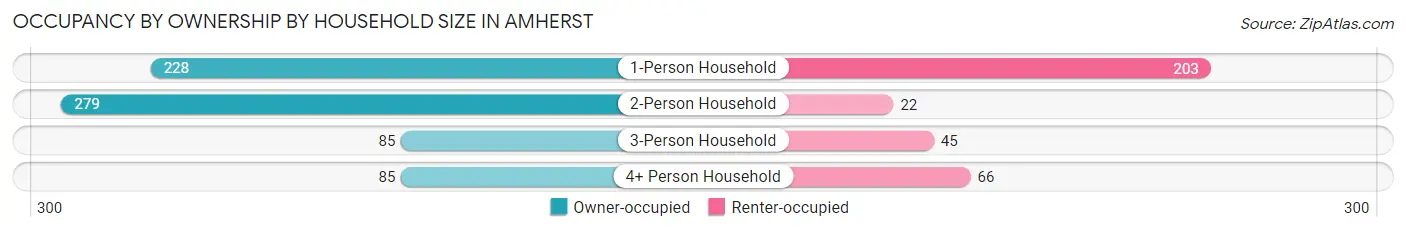
| Household Size | Owner-occupied | Renter-occupied |
| 1-Person Household | 228 (52.9%) | 203 (47.1%) |
| 2-Person Household | 279 (92.7%) | 22 (7.3%) |
| 3-Person Household | 85 (65.4%) | 45 (34.6%) |
| 4+ Person Household | 85 (56.3%) | 66 (43.7%) |
| Total Housing Units | 677 (66.8%) | 336 (33.2%) |
Occupancy by Educational Attainment in Amherst
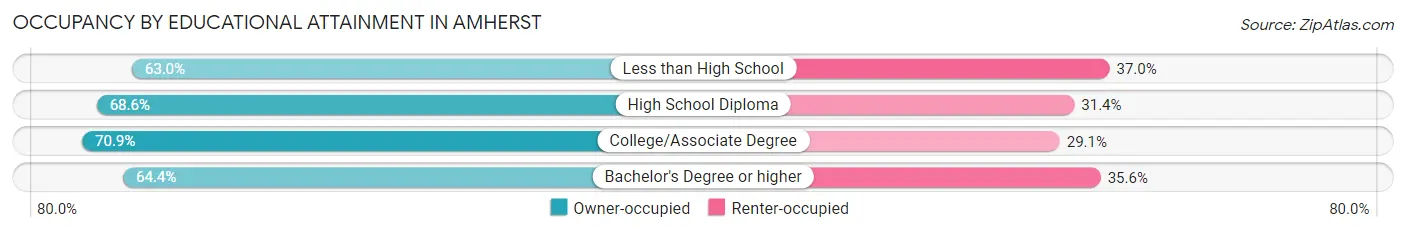
| Household Size | Owner-occupied | Renter-occupied |
| Less than High School | 114 (63.0%) | 67 (37.0%) |
| High School Diploma | 229 (68.6%) | 105 (31.4%) |
| College/Associate Degree | 146 (70.9%) | 60 (29.1%) |
| Bachelor's Degree or higher | 188 (64.4%) | 104 (35.6%) |
Occupancy by Age of Householder in Amherst
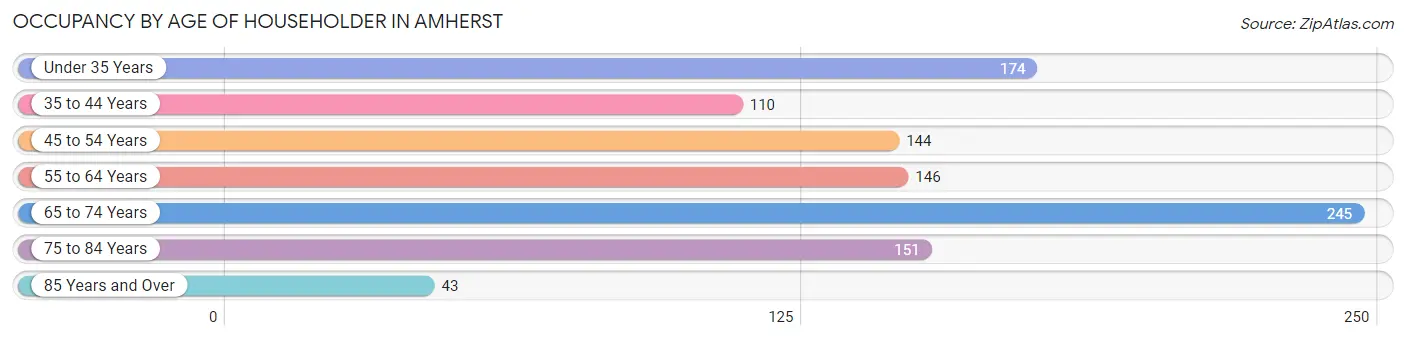
| Age Bracket | # Households | % Households |
| Under 35 Years | 174 | 17.2% |
| 35 to 44 Years | 110 | 10.9% |
| 45 to 54 Years | 144 | 14.2% |
| 55 to 64 Years | 146 | 14.4% |
| 65 to 74 Years | 245 | 24.2% |
| 75 to 84 Years | 151 | 14.9% |
| 85 Years and Over | 43 | 4.2% |
| Total | 1,013 | 100.0% |
Housing Finances in Amherst
Median Income by Occupancy in Amherst
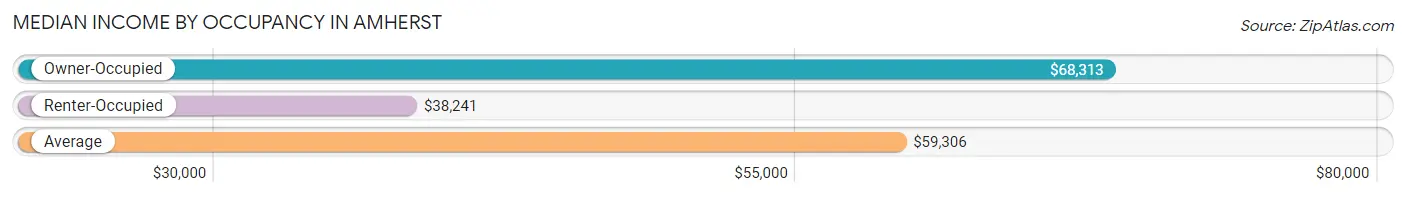
| Occupancy Type | # Households | Median Income |
| Owner-Occupied | 677 (66.8%) | $68,313 |
| Renter-Occupied | 336 (33.2%) | $38,241 |
| Average | 1,013 (100.0%) | $59,306 |
Occupancy by Householder Income Bracket in Amherst
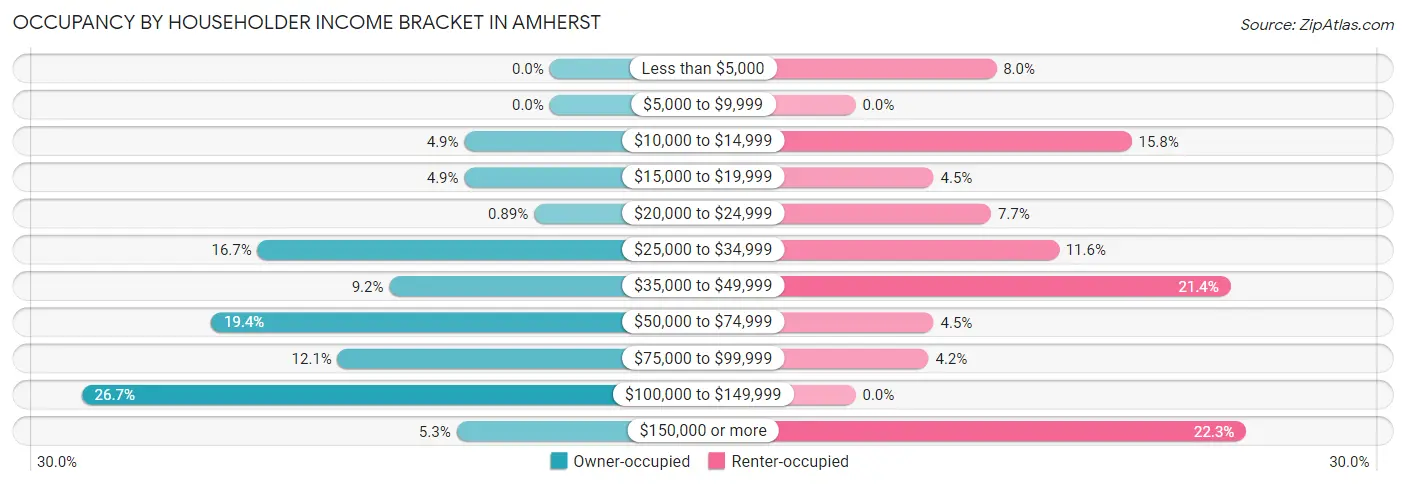
| Income Bracket | Owner-occupied | Renter-occupied |
| Less than $5,000 | 0 (0.0%) | 27 (8.0%) |
| $5,000 to $9,999 | 0 (0.0%) | 0 (0.0%) |
| $10,000 to $14,999 | 33 (4.9%) | 53 (15.8%) |
| $15,000 to $19,999 | 33 (4.9%) | 15 (4.5%) |
| $20,000 to $24,999 | 6 (0.9%) | 26 (7.7%) |
| $25,000 to $34,999 | 113 (16.7%) | 39 (11.6%) |
| $35,000 to $49,999 | 62 (9.2%) | 72 (21.4%) |
| $50,000 to $74,999 | 131 (19.4%) | 15 (4.5%) |
| $75,000 to $99,999 | 82 (12.1%) | 14 (4.2%) |
| $100,000 to $149,999 | 181 (26.7%) | 0 (0.0%) |
| $150,000 or more | 36 (5.3%) | 75 (22.3%) |
| Total | 677 (100.0%) | 336 (100.0%) |
Monthly Housing Cost Tiers in Amherst
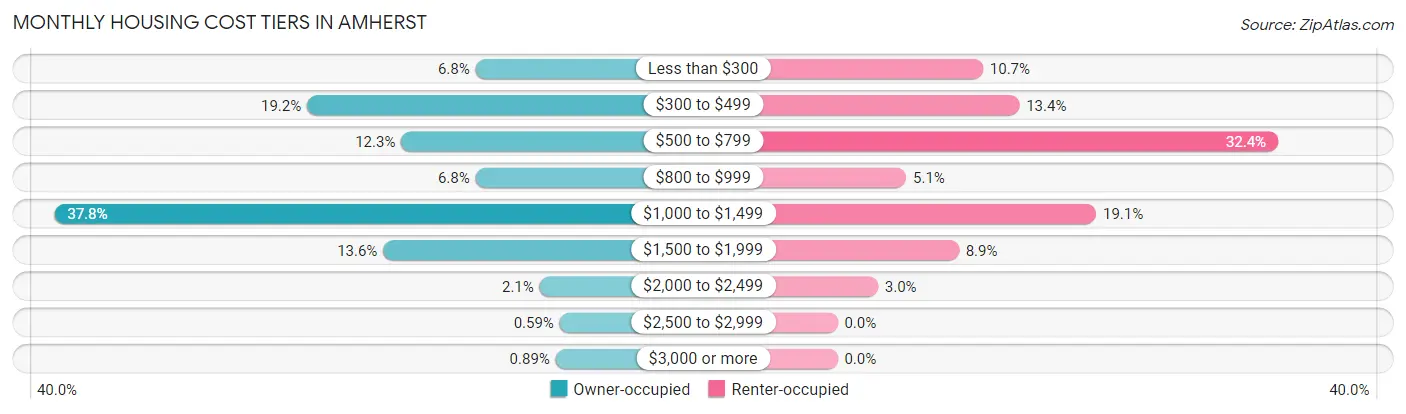
| Monthly Cost | Owner-occupied | Renter-occupied |
| Less than $300 | 46 (6.8%) | 36 (10.7%) |
| $300 to $499 | 130 (19.2%) | 45 (13.4%) |
| $500 to $799 | 83 (12.3%) | 109 (32.4%) |
| $800 to $999 | 46 (6.8%) | 17 (5.1%) |
| $1,000 to $1,499 | 256 (37.8%) | 64 (19.1%) |
| $1,500 to $1,999 | 92 (13.6%) | 30 (8.9%) |
| $2,000 to $2,499 | 14 (2.1%) | 10 (3.0%) |
| $2,500 to $2,999 | 4 (0.6%) | 0 (0.0%) |
| $3,000 or more | 6 (0.9%) | 0 (0.0%) |
| Total | 677 (100.0%) | 336 (100.0%) |
Physical Housing Characteristics in Amherst
Housing Structures in Amherst
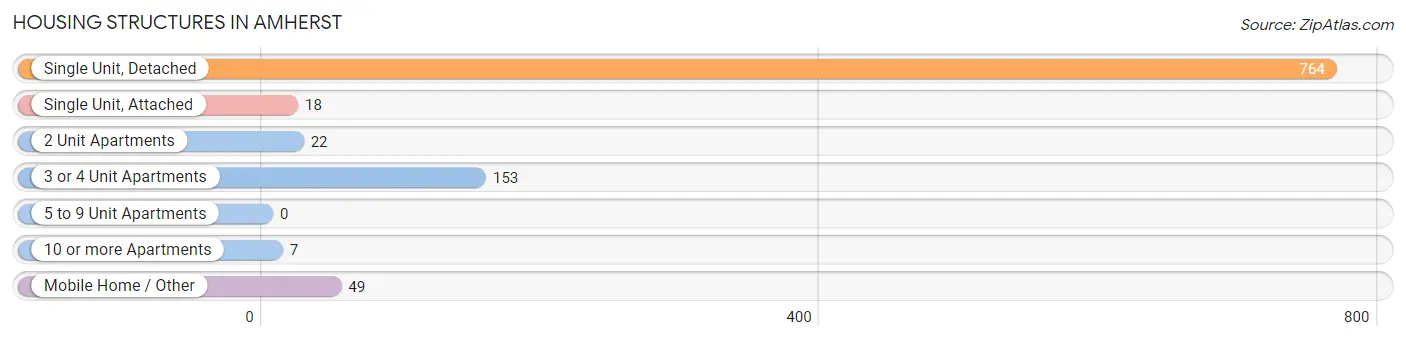
| Structure Type | # Housing Units | % Housing Units |
| Single Unit, Detached | 764 | 75.4% |
| Single Unit, Attached | 18 | 1.8% |
| 2 Unit Apartments | 22 | 2.2% |
| 3 or 4 Unit Apartments | 153 | 15.1% |
| 5 to 9 Unit Apartments | 0 | 0.0% |
| 10 or more Apartments | 7 | 0.7% |
| Mobile Home / Other | 49 | 4.8% |
| Total | 1,013 | 100.0% |
Housing Structures by Occupancy in Amherst
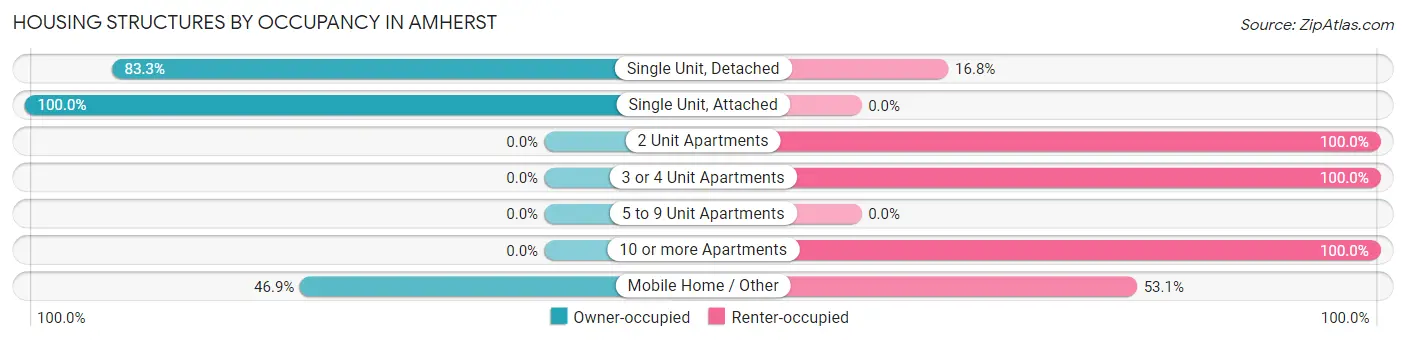
| Structure Type | Owner-occupied | Renter-occupied |
| Single Unit, Detached | 636 (83.3%) | 128 (16.8%) |
| Single Unit, Attached | 18 (100.0%) | 0 (0.0%) |
| 2 Unit Apartments | 0 (0.0%) | 22 (100.0%) |
| 3 or 4 Unit Apartments | 0 (0.0%) | 153 (100.0%) |
| 5 to 9 Unit Apartments | 0 (0.0%) | 0 (0.0%) |
| 10 or more Apartments | 0 (0.0%) | 7 (100.0%) |
| Mobile Home / Other | 23 (46.9%) | 26 (53.1%) |
| Total | 677 (66.8%) | 336 (33.2%) |
Housing Structures by Number of Rooms in Amherst
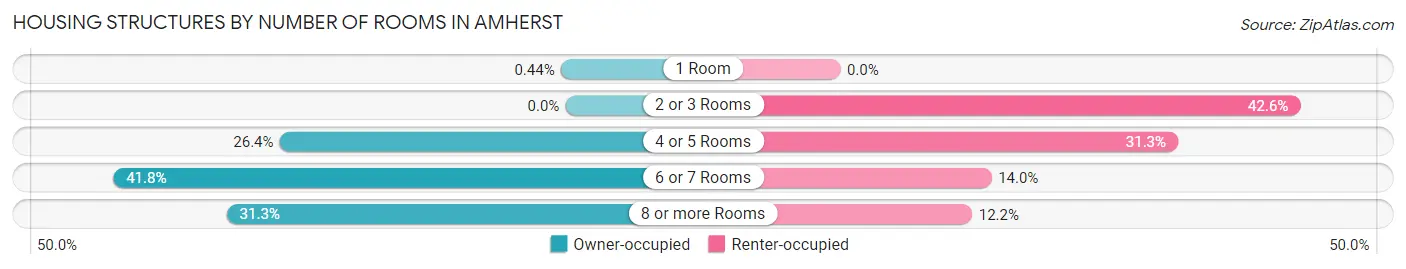
| Number of Rooms | Owner-occupied | Renter-occupied |
| 1 Room | 3 (0.4%) | 0 (0.0%) |
| 2 or 3 Rooms | 0 (0.0%) | 143 (42.6%) |
| 4 or 5 Rooms | 179 (26.4%) | 105 (31.2%) |
| 6 or 7 Rooms | 283 (41.8%) | 47 (14.0%) |
| 8 or more Rooms | 212 (31.3%) | 41 (12.2%) |
| Total | 677 (100.0%) | 336 (100.0%) |
Housing Structure by Heating Type in Amherst
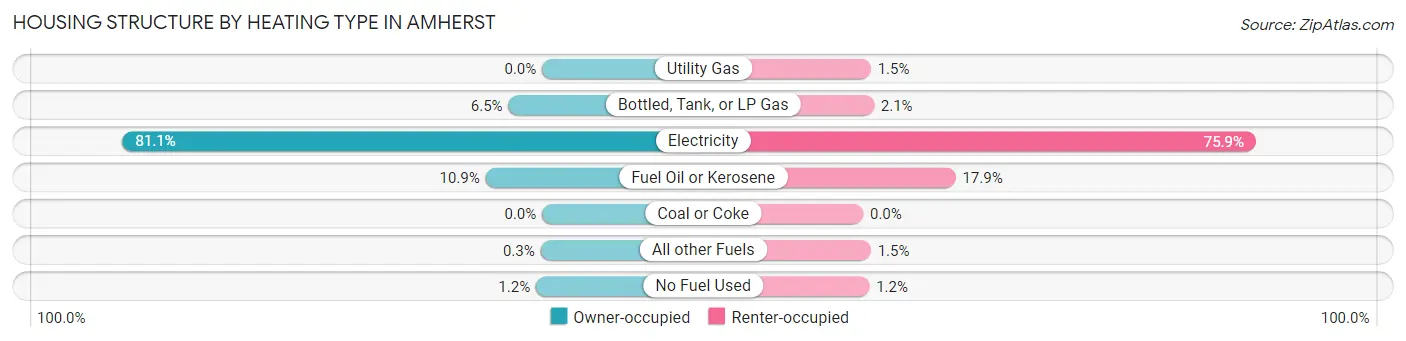
| Heating Type | Owner-occupied | Renter-occupied |
| Utility Gas | 0 (0.0%) | 5 (1.5%) |
| Bottled, Tank, or LP Gas | 44 (6.5%) | 7 (2.1%) |
| Electricity | 549 (81.1%) | 255 (75.9%) |
| Fuel Oil or Kerosene | 74 (10.9%) | 60 (17.9%) |
| Coal or Coke | 0 (0.0%) | 0 (0.0%) |
| All other Fuels | 2 (0.3%) | 5 (1.5%) |
| No Fuel Used | 8 (1.2%) | 4 (1.2%) |
| Total | 677 (100.0%) | 336 (100.0%) |
Household Vehicle Usage in Amherst
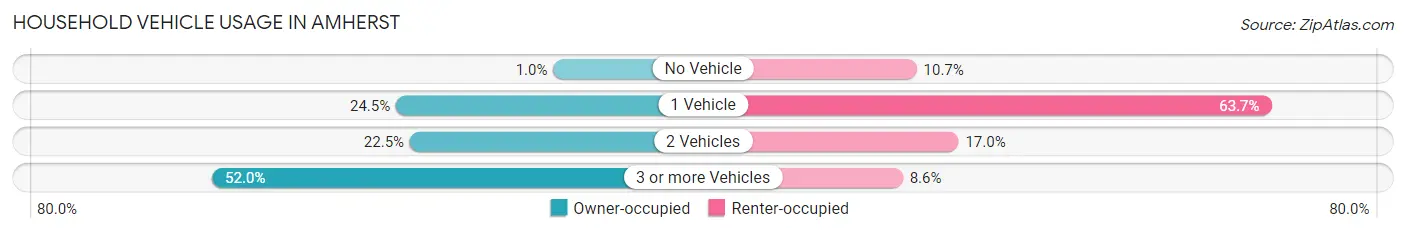
| Vehicles per Household | Owner-occupied | Renter-occupied |
| No Vehicle | 7 (1.0%) | 36 (10.7%) |
| 1 Vehicle | 166 (24.5%) | 214 (63.7%) |
| 2 Vehicles | 152 (22.5%) | 57 (17.0%) |
| 3 or more Vehicles | 352 (52.0%) | 29 (8.6%) |
| Total | 677 (100.0%) | 336 (100.0%) |
Real Estate & Mortgages in Amherst
Real Estate and Mortgage Overview in Amherst
| Characteristic | Without Mortgage | With Mortgage |
| Housing Units | 242 | 435 |
| Median Property Value | $206,500 | $186,500 |
| Median Household Income | $77,857 | $20 |
| Monthly Housing Costs | $404 | $6 |
| Real Estate Taxes | $1,042 | $49 |
Property Value by Mortgage Status in Amherst
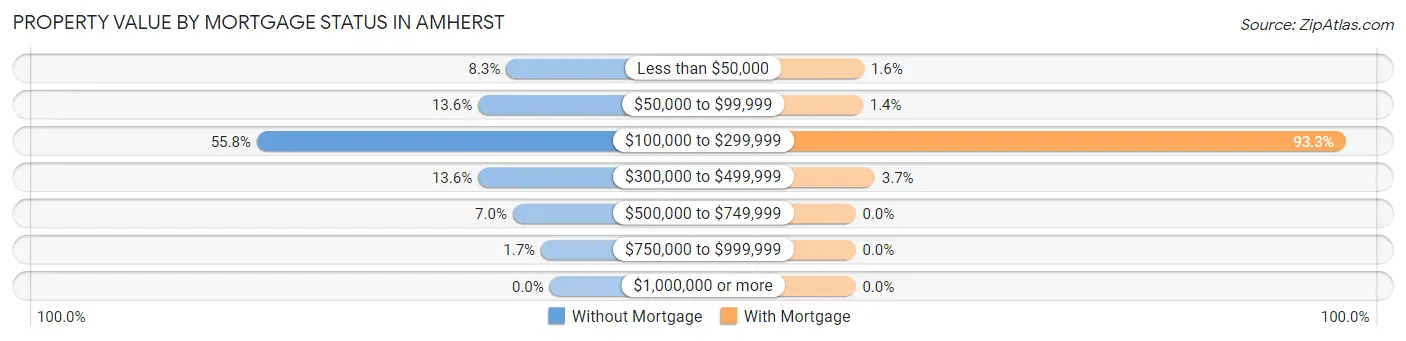
| Property Value | Without Mortgage | With Mortgage |
| Less than $50,000 | 20 (8.3%) | 7 (1.6%) |
| $50,000 to $99,999 | 33 (13.6%) | 6 (1.4%) |
| $100,000 to $299,999 | 135 (55.8%) | 406 (93.3%) |
| $300,000 to $499,999 | 33 (13.6%) | 16 (3.7%) |
| $500,000 to $749,999 | 17 (7.0%) | 0 (0.0%) |
| $750,000 to $999,999 | 4 (1.7%) | 0 (0.0%) |
| $1,000,000 or more | 0 (0.0%) | 0 (0.0%) |
| Total | 242 (100.0%) | 435 (100.0%) |
Household Income by Mortgage Status in Amherst
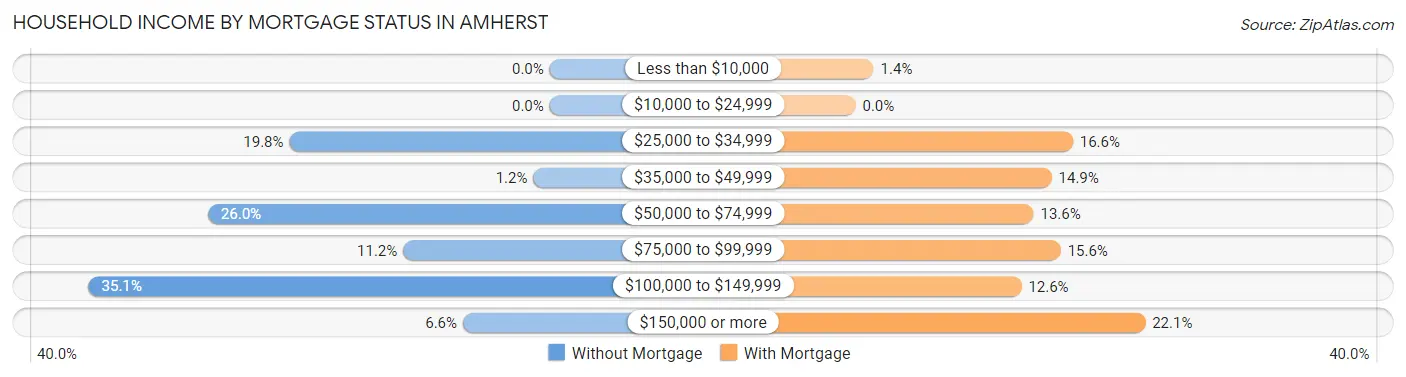
| Household Income | Without Mortgage | With Mortgage |
| Less than $10,000 | 0 (0.0%) | 6 (1.4%) |
| $10,000 to $24,999 | 0 (0.0%) | 0 (0.0%) |
| $25,000 to $34,999 | 48 (19.8%) | 72 (16.6%) |
| $35,000 to $49,999 | 3 (1.2%) | 65 (14.9%) |
| $50,000 to $74,999 | 63 (26.0%) | 59 (13.6%) |
| $75,000 to $99,999 | 27 (11.2%) | 68 (15.6%) |
| $100,000 to $149,999 | 85 (35.1%) | 55 (12.6%) |
| $150,000 or more | 16 (6.6%) | 96 (22.1%) |
| Total | 242 (100.0%) | 435 (100.0%) |
Property Value to Household Income Ratio in Amherst
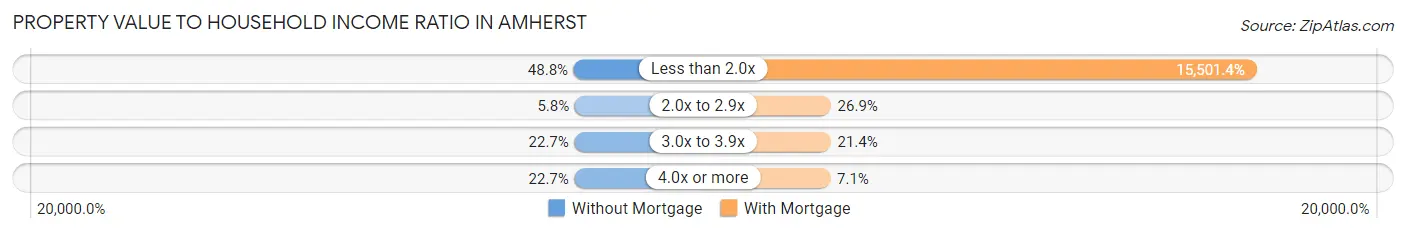
| Value-to-Income Ratio | Without Mortgage | With Mortgage |
| Less than 2.0x | 118 (48.8%) | 67,431 (15,501.4%) |
| 2.0x to 2.9x | 14 (5.8%) | 117 (26.9%) |
| 3.0x to 3.9x | 55 (22.7%) | 93 (21.4%) |
| 4.0x or more | 55 (22.7%) | 31 (7.1%) |
| Total | 242 (100.0%) | 435 (100.0%) |
Real Estate Taxes by Mortgage Status in Amherst
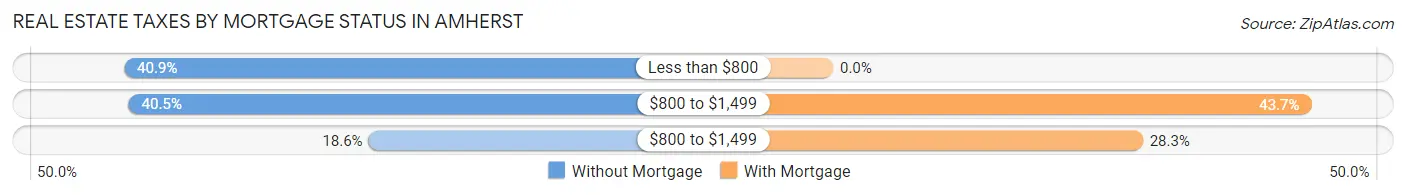
| Property Taxes | Without Mortgage | With Mortgage |
| Less than $800 | 99 (40.9%) | 0 (0.0%) |
| $800 to $1,499 | 98 (40.5%) | 190 (43.7%) |
| $800 to $1,499 | 45 (18.6%) | 123 (28.3%) |
| Total | 242 (100.0%) | 435 (100.0%) |
Health & Disability in Amherst
Health Insurance Coverage by Age in Amherst
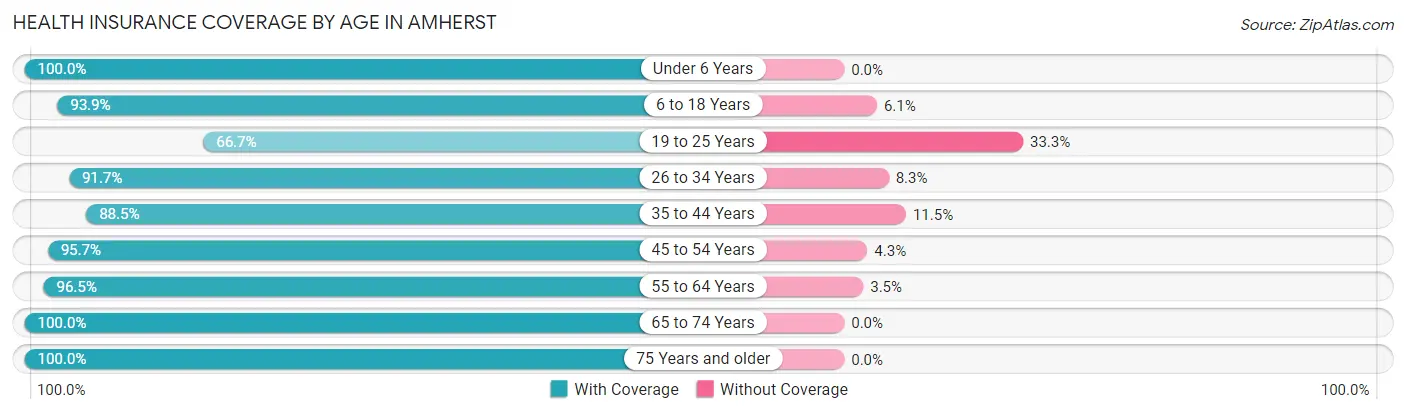
| Age Bracket | With Coverage | Without Coverage |
| Under 6 Years | 169 (100.0%) | 0 (0.0%) |
| 6 to 18 Years | 200 (93.9%) | 13 (6.1%) |
| 19 to 25 Years | 90 (66.7%) | 45 (33.3%) |
| 26 to 34 Years | 277 (91.7%) | 25 (8.3%) |
| 35 to 44 Years | 177 (88.5%) | 23 (11.5%) |
| 45 to 54 Years | 244 (95.7%) | 11 (4.3%) |
| 55 to 64 Years | 191 (96.5%) | 7 (3.5%) |
| 65 to 74 Years | 359 (100.0%) | 0 (0.0%) |
| 75 Years and older | 277 (100.0%) | 0 (0.0%) |
| Total | 1,984 (94.1%) | 124 (5.9%) |
Health Insurance Coverage by Citizenship Status in Amherst
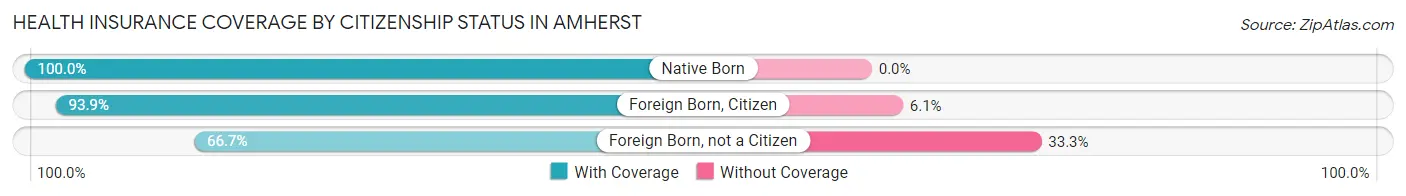
| Citizenship Status | With Coverage | Without Coverage |
| Native Born | 169 (100.0%) | 0 (0.0%) |
| Foreign Born, Citizen | 200 (93.9%) | 13 (6.1%) |
| Foreign Born, not a Citizen | 90 (66.7%) | 45 (33.3%) |
Health Insurance Coverage by Household Income in Amherst
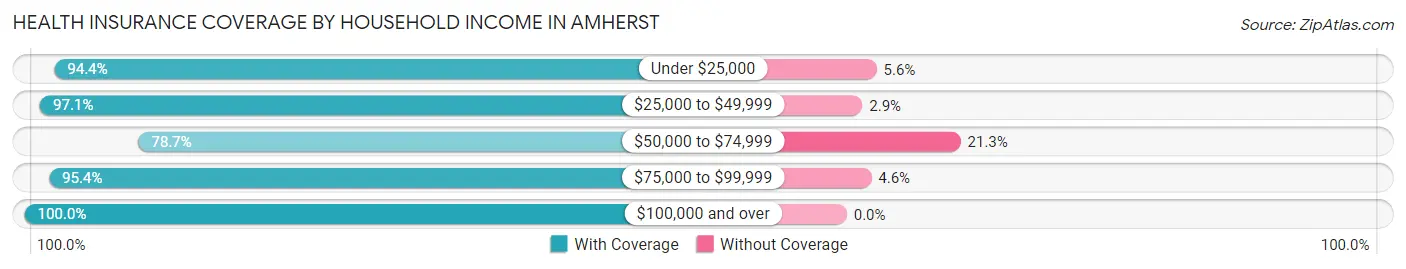
| Household Income | With Coverage | Without Coverage |
| Under $25,000 | 220 (94.4%) | 13 (5.6%) |
| $25,000 to $49,999 | 633 (97.1%) | 19 (2.9%) |
| $50,000 to $74,999 | 299 (78.7%) | 81 (21.3%) |
| $75,000 to $99,999 | 228 (95.4%) | 11 (4.6%) |
| $100,000 and over | 604 (100.0%) | 0 (0.0%) |
Public vs Private Health Insurance Coverage by Age in Amherst
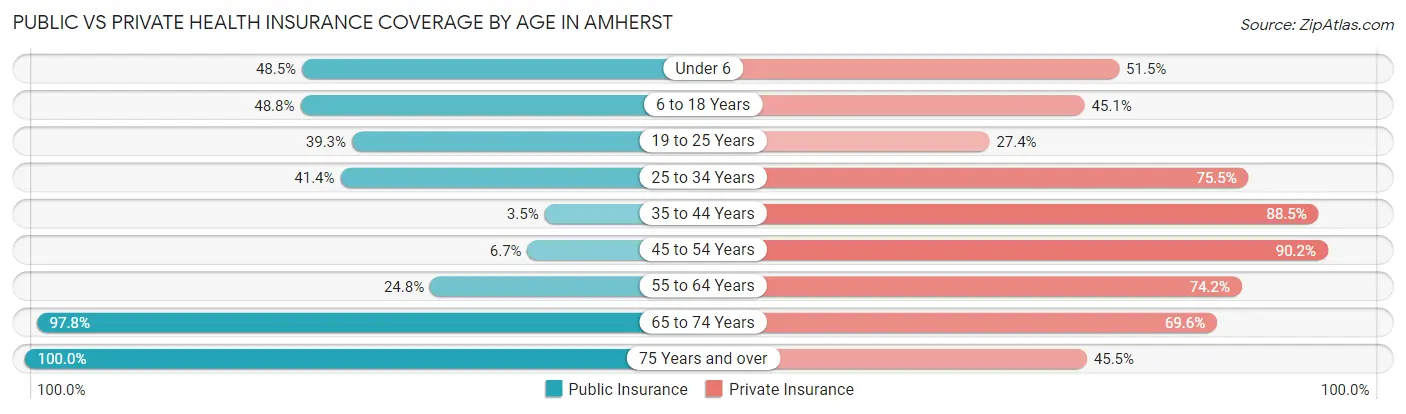
| Age Bracket | Public Insurance | Private Insurance |
| Under 6 | 82 (48.5%) | 87 (51.5%) |
| 6 to 18 Years | 104 (48.8%) | 96 (45.1%) |
| 19 to 25 Years | 53 (39.3%) | 37 (27.4%) |
| 25 to 34 Years | 125 (41.4%) | 228 (75.5%) |
| 35 to 44 Years | 7 (3.5%) | 177 (88.5%) |
| 45 to 54 Years | 17 (6.7%) | 230 (90.2%) |
| 55 to 64 Years | 49 (24.7%) | 147 (74.2%) |
| 65 to 74 Years | 351 (97.8%) | 250 (69.6%) |
| 75 Years and over | 277 (100.0%) | 126 (45.5%) |
| Total | 1,065 (50.5%) | 1,378 (65.4%) |
Disability Status by Sex by Age in Amherst
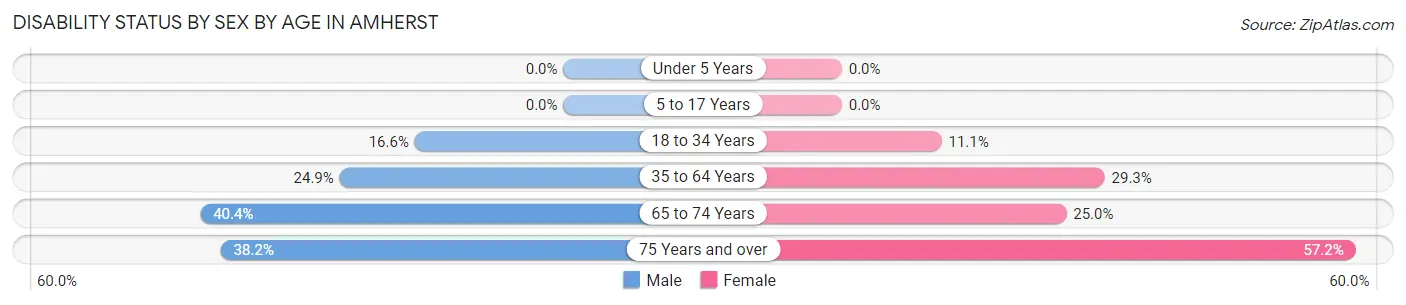
| Age Bracket | Male | Female |
| Under 5 Years | 0 (0.0%) | 0 (0.0%) |
| 5 to 17 Years | 0 (0.0%) | 0 (0.0%) |
| 18 to 34 Years | 47 (16.6%) | 17 (11.1%) |
| 35 to 64 Years | 81 (24.9%) | 96 (29.3%) |
| 65 to 74 Years | 74 (40.4%) | 44 (25.0%) |
| 75 Years and over | 21 (38.2%) | 127 (57.2%) |
Disability Class by Sex by Age in Amherst
Disability Class: Hearing Difficulty
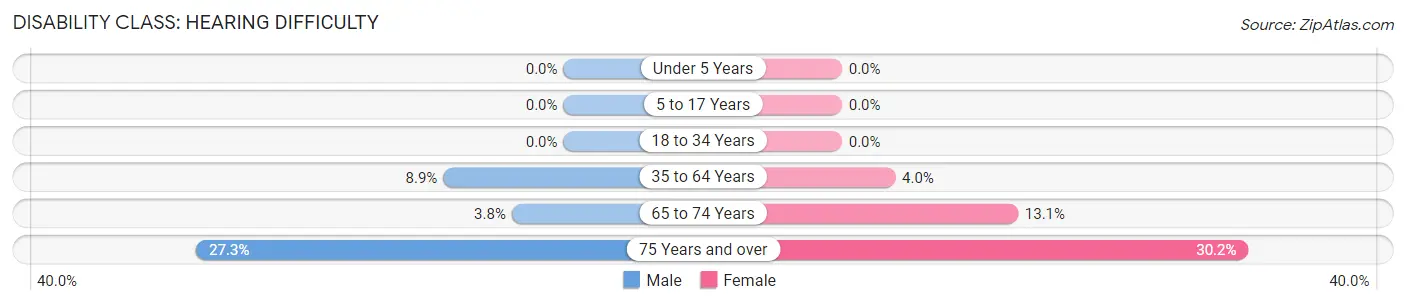
| Age Bracket | Male | Female |
| Under 5 Years | 0 (0.0%) | 0 (0.0%) |
| 5 to 17 Years | 0 (0.0%) | 0 (0.0%) |
| 18 to 34 Years | 0 (0.0%) | 0 (0.0%) |
| 35 to 64 Years | 29 (8.9%) | 13 (4.0%) |
| 65 to 74 Years | 7 (3.8%) | 23 (13.1%) |
| 75 Years and over | 15 (27.3%) | 67 (30.2%) |
Disability Class: Vision Difficulty
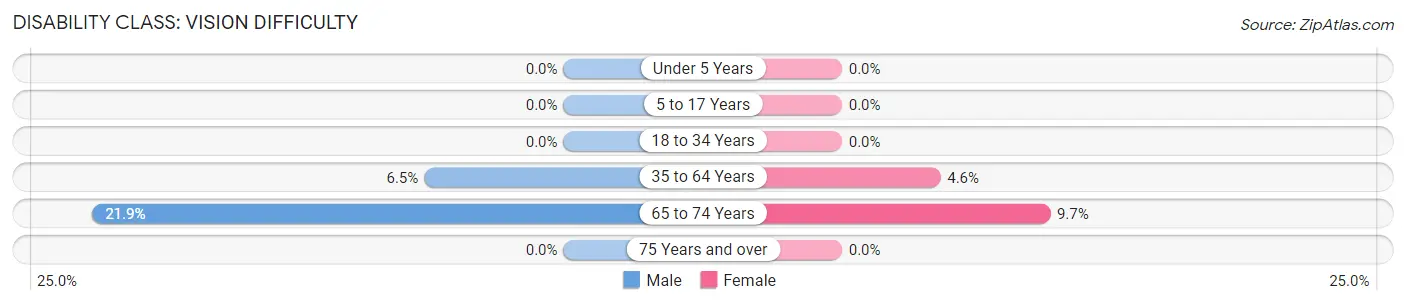
| Age Bracket | Male | Female |
| Under 5 Years | 0 (0.0%) | 0 (0.0%) |
| 5 to 17 Years | 0 (0.0%) | 0 (0.0%) |
| 18 to 34 Years | 0 (0.0%) | 0 (0.0%) |
| 35 to 64 Years | 21 (6.5%) | 15 (4.6%) |
| 65 to 74 Years | 40 (21.9%) | 17 (9.7%) |
| 75 Years and over | 0 (0.0%) | 0 (0.0%) |
Disability Class: Cognitive Difficulty
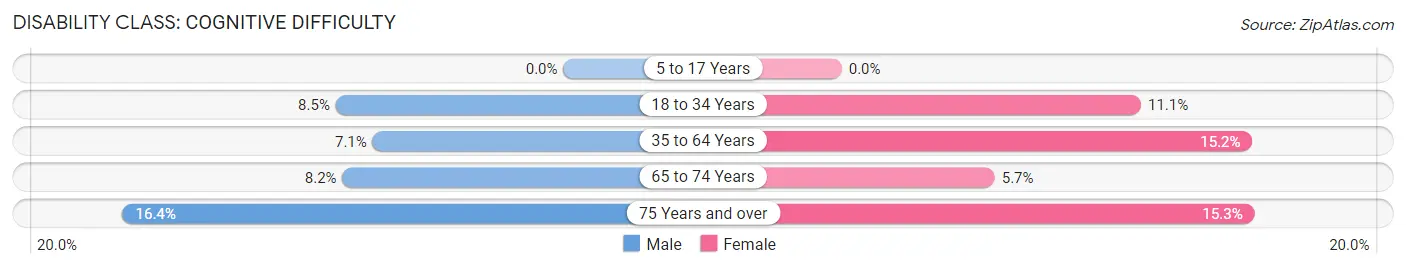
| Age Bracket | Male | Female |
| 5 to 17 Years | 0 (0.0%) | 0 (0.0%) |
| 18 to 34 Years | 24 (8.5%) | 17 (11.1%) |
| 35 to 64 Years | 23 (7.1%) | 50 (15.2%) |
| 65 to 74 Years | 15 (8.2%) | 10 (5.7%) |
| 75 Years and over | 9 (16.4%) | 34 (15.3%) |
Disability Class: Ambulatory Difficulty
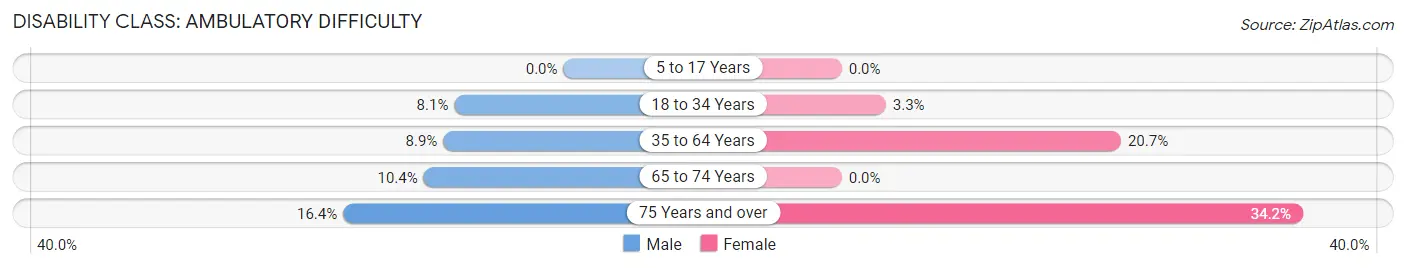
| Age Bracket | Male | Female |
| 5 to 17 Years | 0 (0.0%) | 0 (0.0%) |
| 18 to 34 Years | 23 (8.1%) | 5 (3.3%) |
| 35 to 64 Years | 29 (8.9%) | 68 (20.7%) |
| 65 to 74 Years | 19 (10.4%) | 0 (0.0%) |
| 75 Years and over | 9 (16.4%) | 76 (34.2%) |
Disability Class: Self-Care Difficulty
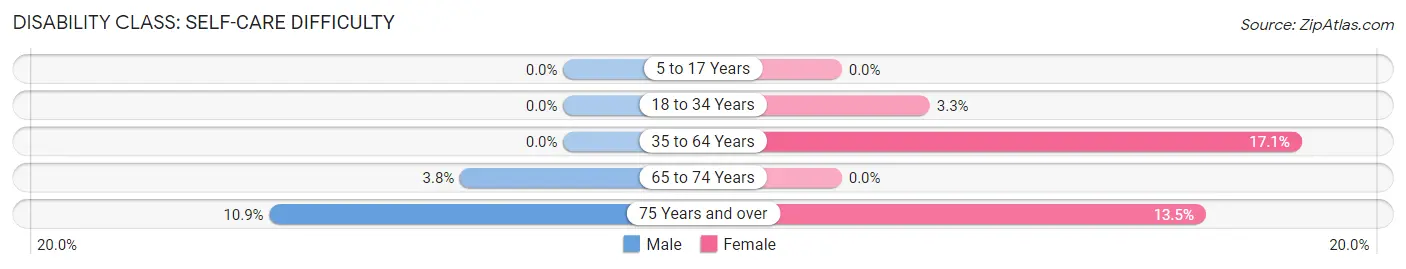
| Age Bracket | Male | Female |
| 5 to 17 Years | 0 (0.0%) | 0 (0.0%) |
| 18 to 34 Years | 0 (0.0%) | 5 (3.3%) |
| 35 to 64 Years | 0 (0.0%) | 56 (17.1%) |
| 65 to 74 Years | 7 (3.8%) | 0 (0.0%) |
| 75 Years and over | 6 (10.9%) | 30 (13.5%) |
Technology Access in Amherst
Computing Device Access in Amherst
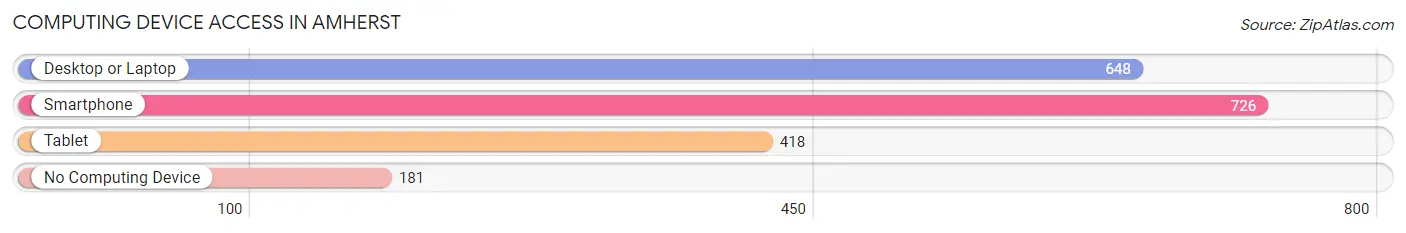
| Device Type | # Households | % Households |
| Desktop or Laptop | 648 | 64.0% |
| Smartphone | 726 | 71.7% |
| Tablet | 418 | 41.3% |
| No Computing Device | 181 | 17.9% |
| Total | 1,013 | 100.0% |
Internet Access in Amherst
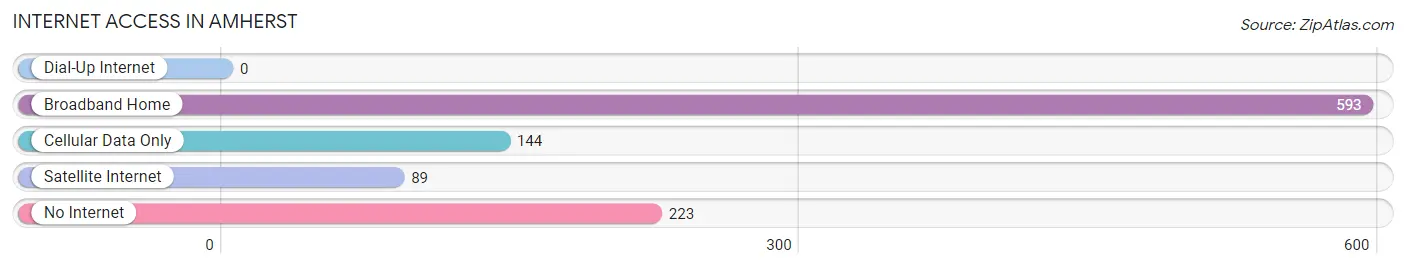
| Internet Type | # Households | % Households |
| Dial-Up Internet | 0 | 0.0% |
| Broadband Home | 593 | 58.5% |
| Cellular Data Only | 144 | 14.2% |
| Satellite Internet | 89 | 8.8% |
| No Internet | 223 | 22.0% |
| Total | 1,013 | 100.0% |
Amherst Summary
Amherst is a town located in the foothills of the Blue Ridge Mountains in Amherst County, Virginia. It is situated along the James River, and is the county seat of Amherst County. The town has a population of approximately 6,000 people, and is located about 25 miles northeast of Lynchburg.
History
The town of Amherst was founded in 1761 by William Cabell, a prominent Virginia planter and politician. Cabell named the town after his friend, Lord Jeffrey Amherst, who was a British general during the French and Indian War. The town was officially incorporated in 1763.
During the American Revolution, Amherst was a major supply center for the Continental Army. The town was also the site of a major battle in 1781, when General Lafayette and his troops defeated the British forces.
In the 19th century, Amherst became an important center for the production of tobacco. The town was also home to several prominent families, including the Cabells, the Harrisons, and the Randolphs.
Geography
Amherst is located in the foothills of the Blue Ridge Mountains in Amherst County, Virginia. The town is situated along the James River, and is about 25 miles northeast of Lynchburg. The town has a total area of 4.2 square miles, all of which is land.
The town is located in a hilly region, and is surrounded by forests and rolling hills. The highest point in Amherst is the summit of Mount Pleasant, which has an elevation of 1,845 feet.
Economy
The economy of Amherst is largely based on agriculture and tourism. The town is home to several farms, which produce a variety of crops, including tobacco, corn, soybeans, and hay.
The town is also home to several small businesses, including restaurants, shops, and other services. The town is also home to several manufacturing companies, which produce a variety of products, including furniture, textiles, and electronics.
Demographics
As of the 2010 census, the town of Amherst had a population of 6,000 people. The racial makeup of the town was 87.3% White, 8.2% African American, 0.7% Native American, 0.5% Asian, 0.1% Pacific Islander, and 2.2% from other races.
The median household income in Amherst was $37,000, and the median family income was $45,000. The per capita income in Amherst was $19,000. About 11.3% of the population was below the poverty line.
Conclusion
Amherst is a small town located in the foothills of the Blue Ridge Mountains in Amherst County, Virginia. The town has a population of approximately 6,000 people, and is situated along the James River. The town has a long and rich history, and is home to several farms and small businesses. The economy of Amherst is largely based on agriculture and tourism, and the town has a diverse population.
Common Questions
What is Per Capita Income in Amherst?
Per Capita income in Amherst is $32,241.
What is the Median Family Income in Amherst?
Median Family Income in Amherst is $80,250.
What is the Median Household income in Amherst?
Median Household Income in Amherst is $59,306.
What is Income or Wage Gap in Amherst?
Income or Wage Gap in Amherst is 59.5%.
Women in Amherst earn 40.5 cents for every dollar earned by a man.
What is Inequality or Gini Index in Amherst?
Inequality or Gini Index in Amherst is 0.41.
What is the Total Population of Amherst?
Total Population of Amherst is 2,299.
What is the Total Male Population of Amherst?
Total Male Population of Amherst is 1,136.
What is the Total Female Population of Amherst?
Total Female Population of Amherst is 1,163.
What is the Ratio of Males per 100 Females in Amherst?
There are 97.68 Males per 100 Females in Amherst.
What is the Ratio of Females per 100 Males in Amherst?
There are 102.38 Females per 100 Males in Amherst.
What is the Median Population Age in Amherst?
Median Population Age in Amherst is 51.1 Years.
What is the Average Family Size in Amherst
Average Family Size in Amherst is 2.9 People.
What is the Average Household Size in Amherst
Average Household Size in Amherst is 2.1 People.
How Large is the Labor Force in Amherst?
There are 965 People in the Labor Forcein in Amherst.
What is the Percentage of People in the Labor Force in Amherst?
48.7% of People are in the Labor Force in Amherst.
What is the Unemployment Rate in Amherst?
Unemployment Rate in Amherst is 1.2%.