Rivanna, VA Map & Demographics
Rivanna Map
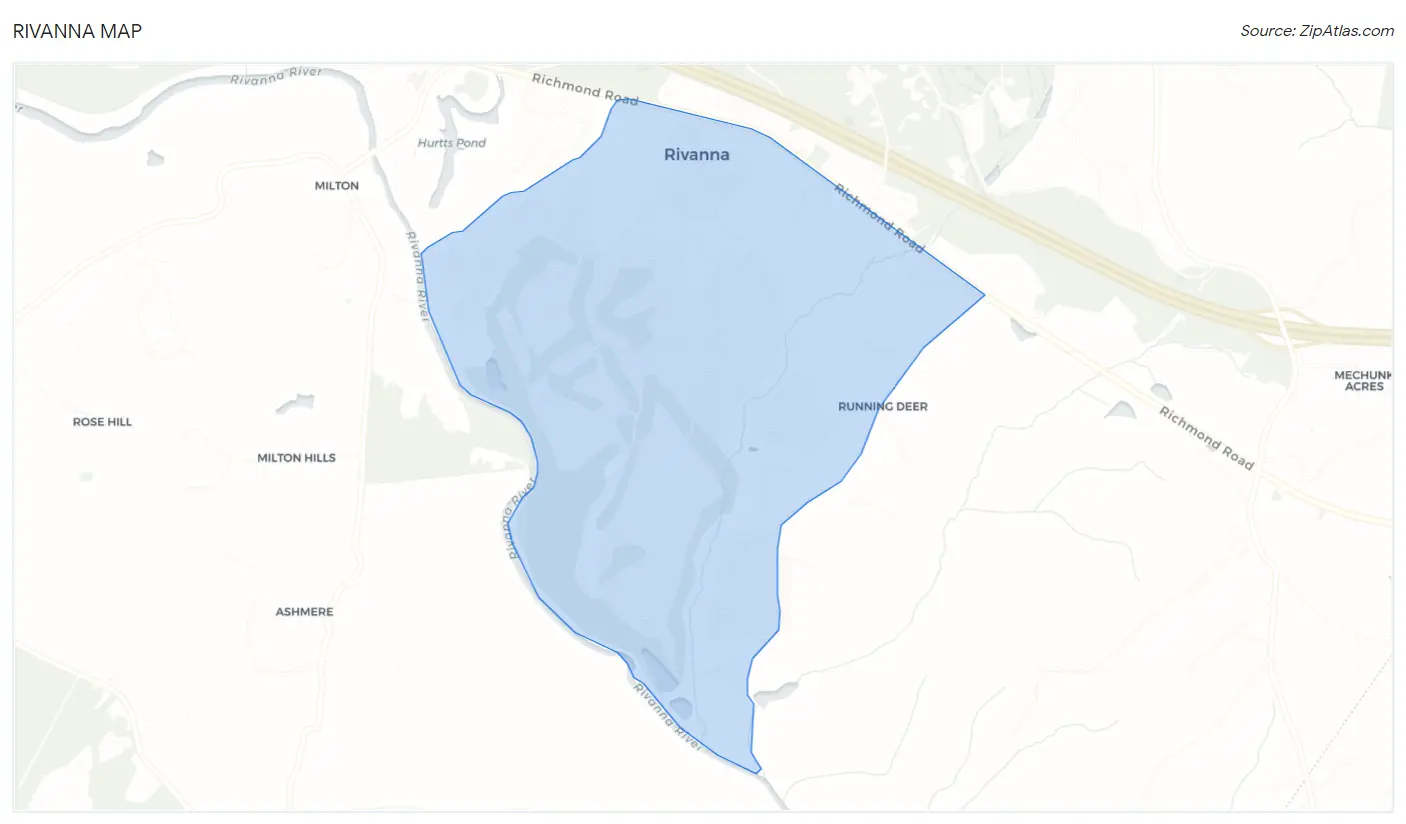
Rivanna Overview
$89,424
PER CAPITA INCOME
$178,971
AVG FAMILY INCOME
$153,125
AVG HOUSEHOLD INCOME
56.4%
WAGE / INCOME GAP [ % ]
43.6¢/ $1
WAGE / INCOME GAP [ $ ]
0.44
INEQUALITY / GINI INDEX
2,088
TOTAL POPULATION
955
MALE POPULATION
1,133
FEMALE POPULATION
84.29
MALES / 100 FEMALES
118.64
FEMALES / 100 MALES
56.8
MEDIAN AGE
2.7
AVG FAMILY SIZE
2.4
AVG HOUSEHOLD SIZE
685
LABOR FORCE [ PEOPLE ]
38.9%
PERCENT IN LABOR FORCE
5.7%
UNEMPLOYMENT RATE
Income in Rivanna
Income Overview in Rivanna
Per Capita Income in Rivanna is $89,424, while median incomes of families and households are $178,971 and $153,125 respectively.
| Characteristic | Number | Measure |
| Per Capita Income | 2,088 | $89,424 |
| Median Family Income | 714 | $178,971 |
| Mean Family Income | 714 | $228,689 |
| Median Household Income | 863 | $153,125 |
| Mean Household Income | 863 | $211,704 |
| Income Deficit | 714 | $0 |
| Wage / Income Gap (%) | 2,088 | 56.41% |
| Wage / Income Gap ($) | 2,088 | 43.59¢ per $1 |
| Gini / Inequality Index | 2,088 | 0.44 |
Earnings by Sex in Rivanna
Average Earnings in Rivanna are $92,632, $114,063 for men and $49,722 for women, a difference of 56.4%.
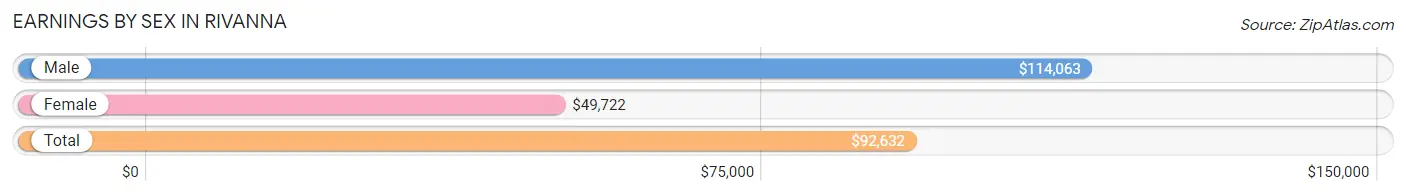
| Sex | Number | Average Earnings |
| Male | 420 (54.0%) | $114,063 |
| Female | 358 (46.0%) | $49,722 |
| Total | 778 (100.0%) | $92,632 |
Earnings by Sex by Income Bracket in Rivanna
The most common earnings brackets in Rivanna are $100,000+ for men (242 | 57.6%) and $100,000+ for women (104 | 29.0%).
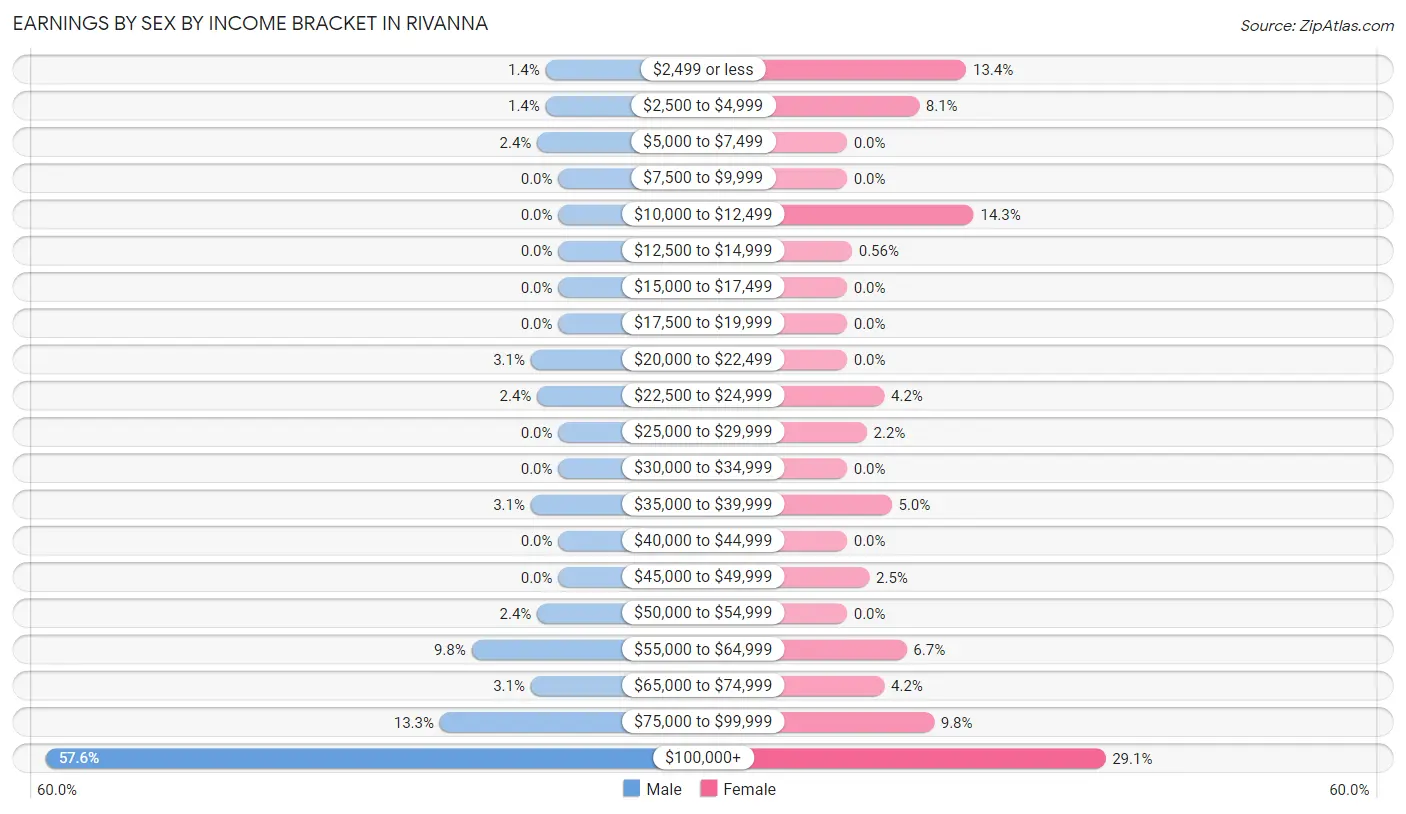
| Income | Male | Female |
| $2,499 or less | 6 (1.4%) | 48 (13.4%) |
| $2,500 to $4,999 | 6 (1.4%) | 29 (8.1%) |
| $5,000 to $7,499 | 10 (2.4%) | 0 (0.0%) |
| $7,500 to $9,999 | 0 (0.0%) | 0 (0.0%) |
| $10,000 to $12,499 | 0 (0.0%) | 51 (14.2%) |
| $12,500 to $14,999 | 0 (0.0%) | 2 (0.6%) |
| $15,000 to $17,499 | 0 (0.0%) | 0 (0.0%) |
| $17,500 to $19,999 | 0 (0.0%) | 0 (0.0%) |
| $20,000 to $22,499 | 13 (3.1%) | 0 (0.0%) |
| $22,500 to $24,999 | 10 (2.4%) | 15 (4.2%) |
| $25,000 to $29,999 | 0 (0.0%) | 8 (2.2%) |
| $30,000 to $34,999 | 0 (0.0%) | 0 (0.0%) |
| $35,000 to $39,999 | 13 (3.1%) | 18 (5.0%) |
| $40,000 to $44,999 | 0 (0.0%) | 0 (0.0%) |
| $45,000 to $49,999 | 0 (0.0%) | 9 (2.5%) |
| $50,000 to $54,999 | 10 (2.4%) | 0 (0.0%) |
| $55,000 to $64,999 | 41 (9.8%) | 24 (6.7%) |
| $65,000 to $74,999 | 13 (3.1%) | 15 (4.2%) |
| $75,000 to $99,999 | 56 (13.3%) | 35 (9.8%) |
| $100,000+ | 242 (57.6%) | 104 (29.0%) |
| Total | 420 (100.0%) | 358 (100.0%) |
Earnings by Sex by Educational Attainment in Rivanna
Average earnings in Rivanna are $116,618 for men and $61,823 for women, a difference of 47.0%. Men with an educational attainment of graduate degree enjoy the highest average annual earnings of $190,417, while those with college or associate's degree education earn the least with $63,750. Women with an educational attainment of bachelor's degree earn the most with the average annual earnings of $60,260, while those with bachelor's degree education have the smallest earnings of $60,260.
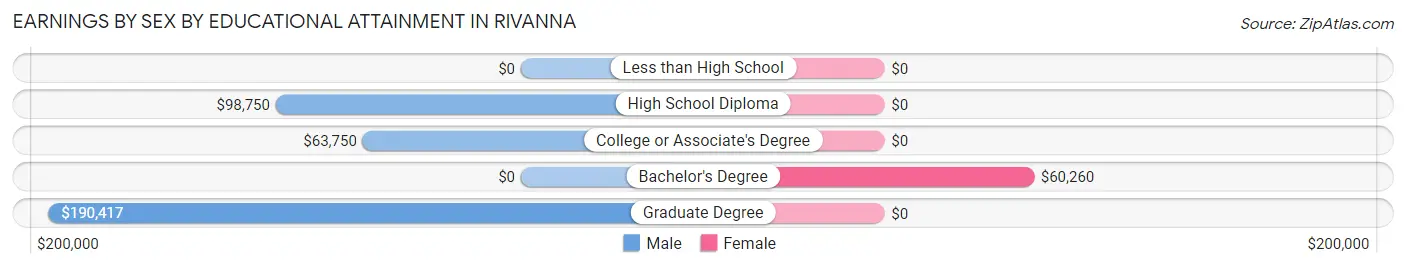
| Educational Attainment | Male Income | Female Income |
| Less than High School | - | - |
| High School Diploma | $98,750 | $0 |
| College or Associate's Degree | $63,750 | $0 |
| Bachelor's Degree | - | - |
| Graduate Degree | $190,417 | $0 |
| Total | $116,618 | $61,823 |
Family Income in Rivanna
Family Income Brackets in Rivanna
According to the Rivanna family income data, there are 341 families falling into the $200,000+ income range, which is the most common income bracket and makes up 47.8% of all families.
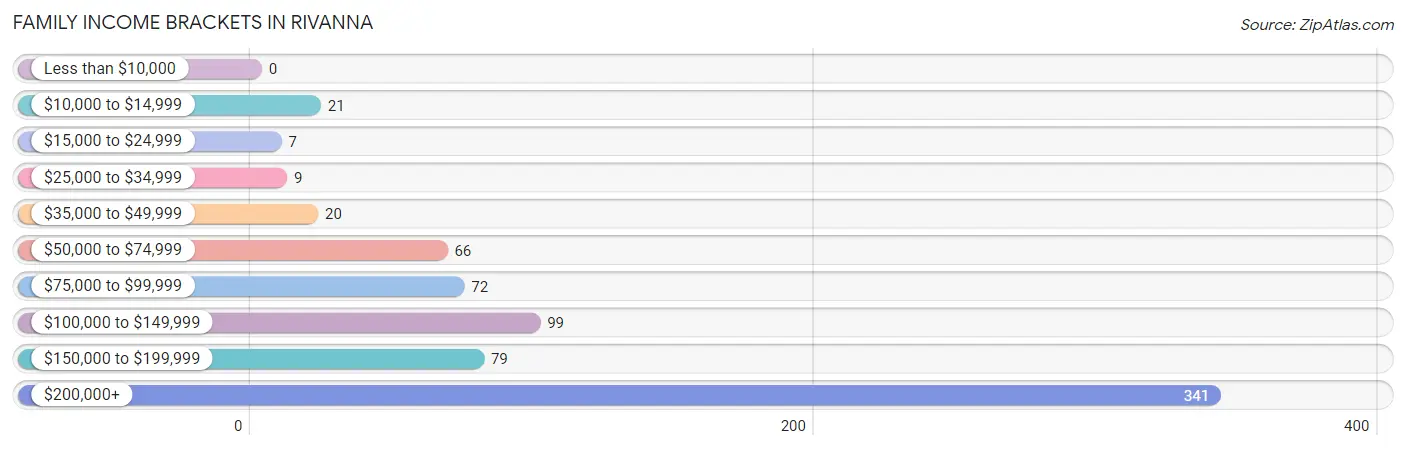
| Income Bracket | # Families | % Families |
| Less than $10,000 | 0 | 0.0% |
| $10,000 to $14,999 | 21 | 2.9% |
| $15,000 to $24,999 | 7 | 1.0% |
| $25,000 to $34,999 | 9 | 1.3% |
| $35,000 to $49,999 | 20 | 2.8% |
| $50,000 to $74,999 | 66 | 9.2% |
| $75,000 to $99,999 | 72 | 10.1% |
| $100,000 to $149,999 | 99 | 13.9% |
| $150,000 to $199,999 | 79 | 11.1% |
| $200,000+ | 341 | 47.8% |
Family Income by Famaliy Size in Rivanna
2-person families (541 | 75.8%) account for the highest median family income in Rivanna with $200,795 per family, while 2-person families (541 | 75.8%) have the highest median income of $100,398 per family member.
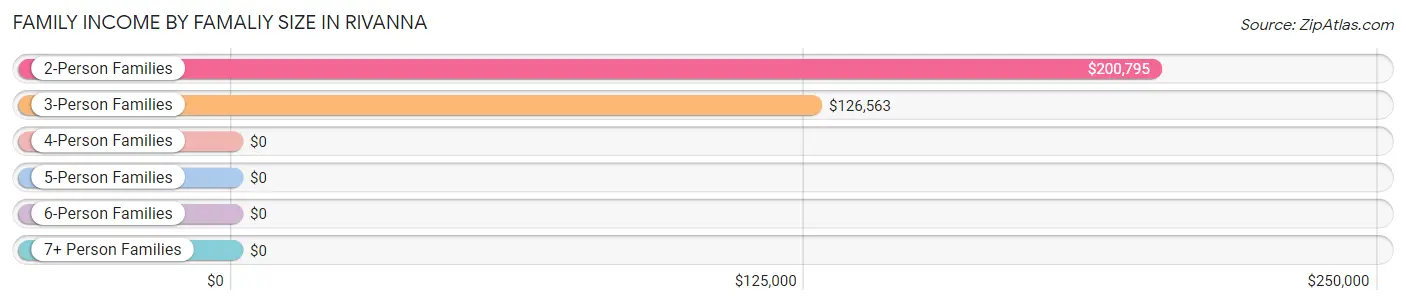
| Income Bracket | # Families | Median Income |
| 2-Person Families | 541 (75.8%) | $200,795 |
| 3-Person Families | 52 (7.3%) | $126,563 |
| 4-Person Families | 77 (10.8%) | $0 |
| 5-Person Families | 21 (2.9%) | $0 |
| 6-Person Families | 13 (1.8%) | $0 |
| 7+ Person Families | 10 (1.4%) | $0 |
| Total | 714 (100.0%) | $178,971 |
Family Income by Number of Earners in Rivanna
The median family income in Rivanna is $178,971, with families comprising 1 earner (180) having the highest median family income of $250,001, while families with no earners (299) have the lowest median family income of $128,750, accounting for 25.2% and 41.9% of families, respectively.
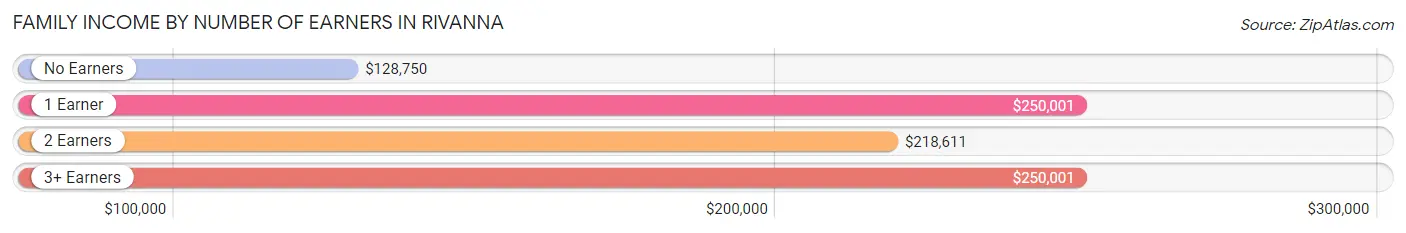
| Number of Earners | # Families | Median Income |
| No Earners | 299 (41.9%) | $128,750 |
| 1 Earner | 180 (25.2%) | $250,001 |
| 2 Earners | 212 (29.7%) | $218,611 |
| 3+ Earners | 23 (3.2%) | $250,001 |
| Total | 714 (100.0%) | $178,971 |
Household Income in Rivanna
Household Income Brackets in Rivanna
With 346 households falling in the category, the $200,000+ income range is the most frequent in Rivanna, accounting for 40.1% of all households.
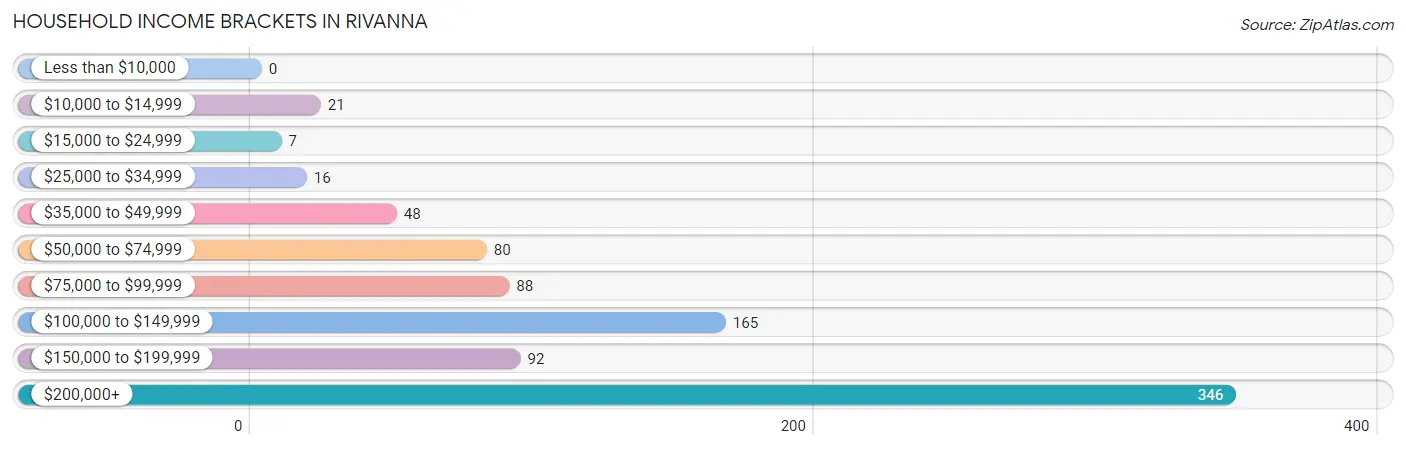
| Income Bracket | # Households | % Households |
| Less than $10,000 | 0 | 0.0% |
| $10,000 to $14,999 | 21 | 2.4% |
| $15,000 to $24,999 | 7 | 0.8% |
| $25,000 to $34,999 | 16 | 1.9% |
| $35,000 to $49,999 | 48 | 5.6% |
| $50,000 to $74,999 | 80 | 9.3% |
| $75,000 to $99,999 | 88 | 10.2% |
| $100,000 to $149,999 | 165 | 19.1% |
| $150,000 to $199,999 | 92 | 10.7% |
| $200,000+ | 346 | 40.1% |
Household Income by Householder Age in Rivanna
The median household income in Rivanna is $153,125, with the highest median household income of $219,250 found in the 25 to 44 years age bracket for the primary householder. A total of 131 households (15.2%) fall into this category.
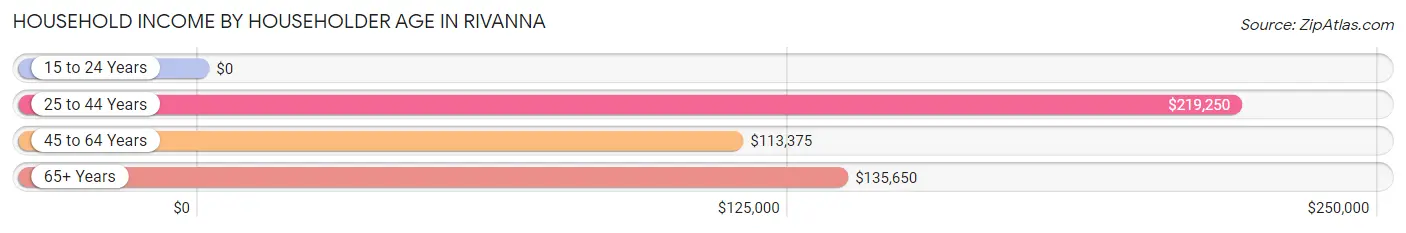
| Income Bracket | # Households | Median Income |
| 15 to 24 Years | 0 (0.0%) | $0 |
| 25 to 44 Years | 131 (15.2%) | $219,250 |
| 45 to 64 Years | 251 (29.1%) | $113,375 |
| 65+ Years | 481 (55.7%) | $135,650 |
| Total | 863 (100.0%) | $153,125 |
Poverty in Rivanna
Income Below Poverty by Sex and Age in Rivanna
With 4.3% poverty level for males and 3.7% for females among the residents of Rivanna, 16 and 17 year old males and 12 to 14 year old females are the most vulnerable to poverty, with 20 males (76.9%) and 22 females (37.3%) in their respective age groups living below the poverty level.
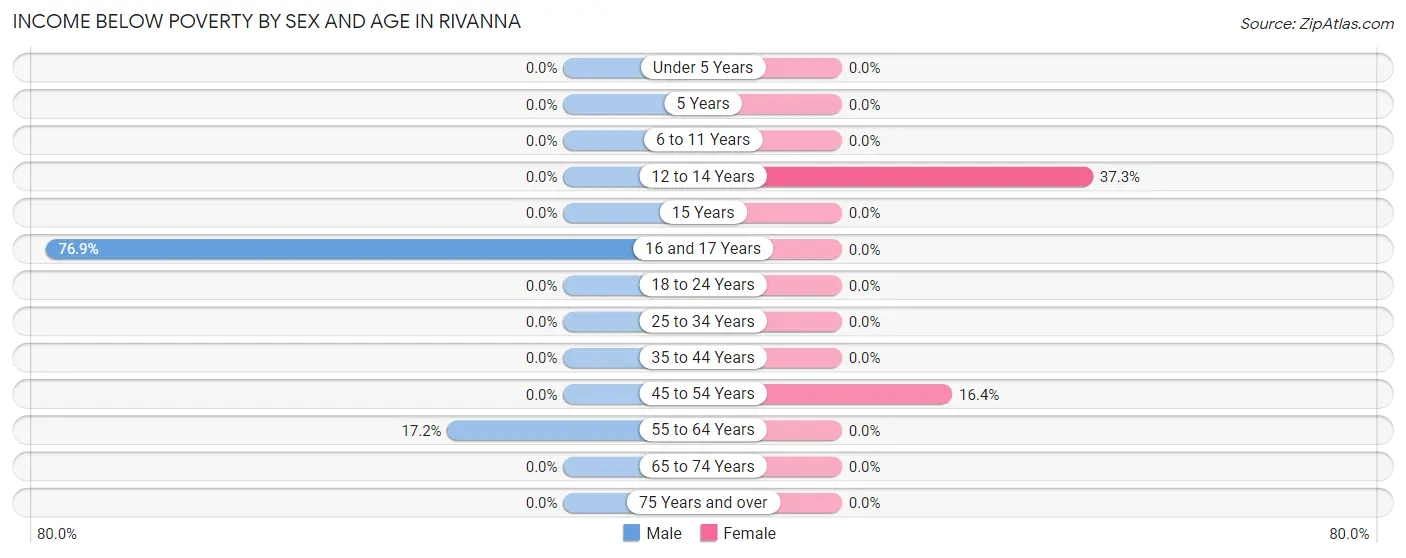
| Age Bracket | Male | Female |
| Under 5 Years | 0 (0.0%) | 0 (0.0%) |
| 5 Years | 0 (0.0%) | 0 (0.0%) |
| 6 to 11 Years | 0 (0.0%) | 0 (0.0%) |
| 12 to 14 Years | 0 (0.0%) | 22 (37.3%) |
| 15 Years | 0 (0.0%) | 0 (0.0%) |
| 16 and 17 Years | 20 (76.9%) | 0 (0.0%) |
| 18 to 24 Years | 0 (0.0%) | 0 (0.0%) |
| 25 to 34 Years | 0 (0.0%) | 0 (0.0%) |
| 35 to 44 Years | 0 (0.0%) | 0 (0.0%) |
| 45 to 54 Years | 0 (0.0%) | 20 (16.4%) |
| 55 to 64 Years | 21 (17.2%) | 0 (0.0%) |
| 65 to 74 Years | 0 (0.0%) | 0 (0.0%) |
| 75 Years and over | 0 (0.0%) | 0 (0.0%) |
| Total | 41 (4.3%) | 42 (3.7%) |
Income Above Poverty by Sex and Age in Rivanna
According to the poverty statistics in Rivanna, males aged under 5 years and females aged under 5 years are the age groups that are most secure financially, with 100.0% of males and 100.0% of females in these age groups living above the poverty line.
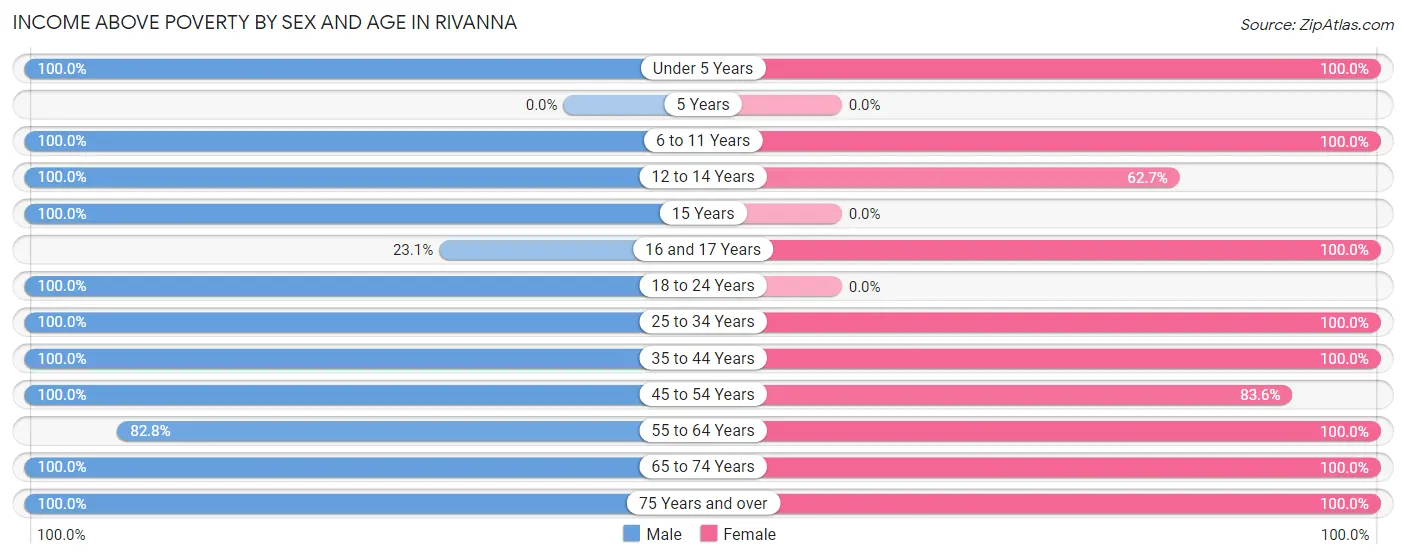
| Age Bracket | Male | Female |
| Under 5 Years | 24 (100.0%) | 79 (100.0%) |
| 5 Years | 0 (0.0%) | 0 (0.0%) |
| 6 to 11 Years | 33 (100.0%) | 105 (100.0%) |
| 12 to 14 Years | 25 (100.0%) | 37 (62.7%) |
| 15 Years | 2 (100.0%) | 0 (0.0%) |
| 16 and 17 Years | 6 (23.1%) | 80 (100.0%) |
| 18 to 24 Years | 34 (100.0%) | 0 (0.0%) |
| 25 to 34 Years | 86 (100.0%) | 85 (100.0%) |
| 35 to 44 Years | 53 (100.0%) | 62 (100.0%) |
| 45 to 54 Years | 123 (100.0%) | 102 (83.6%) |
| 55 to 64 Years | 101 (82.8%) | 115 (100.0%) |
| 65 to 74 Years | 203 (100.0%) | 288 (100.0%) |
| 75 Years and over | 224 (100.0%) | 138 (100.0%) |
| Total | 914 (95.7%) | 1,091 (96.3%) |
Income Below Poverty Among Married-Couple Families in Rivanna
The poverty statistics for married-couple families in Rivanna show that 3.0% or 21 of the total 690 families live below the poverty line. Families with 1 or 2 children have the highest poverty rate of 18.1%, comprising of 21 families. On the other hand, families with no children have the lowest poverty rate of 0.0%, which includes 0 families.
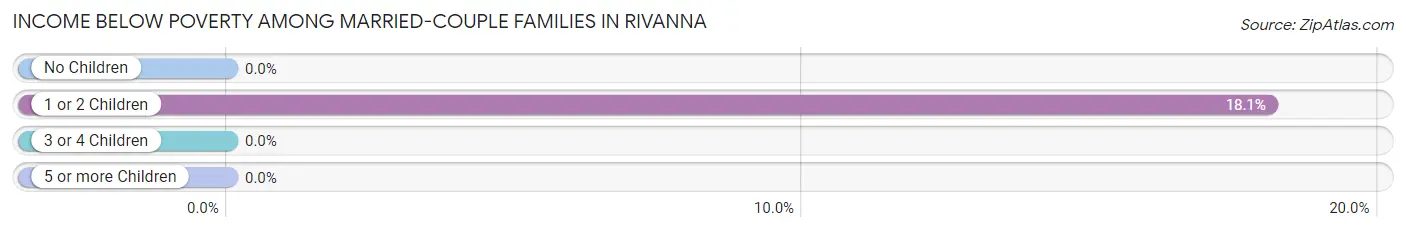
| Children | Above Poverty | Below Poverty |
| No Children | 551 (100.0%) | 0 (0.0%) |
| 1 or 2 Children | 95 (81.9%) | 21 (18.1%) |
| 3 or 4 Children | 13 (100.0%) | 0 (0.0%) |
| 5 or more Children | 10 (100.0%) | 0 (0.0%) |
| Total | 669 (97.0%) | 21 (3.0%) |
Income Below Poverty Among Single-Parent Households in Rivanna
| Children | Single Father | Single Mother |
| No Children | 0 (0.0%) | 0 (0.0%) |
| 1 or 2 Children | 0 (0.0%) | 0 (0.0%) |
| 3 or 4 Children | 0 (0.0%) | 0 (0.0%) |
| 5 or more Children | 0 (0.0%) | 0 (0.0%) |
| Total | 0 (0.0%) | 0 (0.0%) |
Income Below Poverty Among Married-Couple vs Single-Parent Households in Rivanna
| Children | Married-Couple Families | Single-Parent Households |
| No Children | 0 (0.0%) | 0 (0.0%) |
| 1 or 2 Children | 21 (18.1%) | 0 (0.0%) |
| 3 or 4 Children | 0 (0.0%) | 0 (0.0%) |
| 5 or more Children | 0 (0.0%) | 0 (0.0%) |
| Total | 21 (3.0%) | 0 (0.0%) |
Race in Rivanna
The most populous races in Rivanna are White / Caucasian (1,662 | 79.6%), Two or more Races (303 | 14.5%), and Asian (87 | 4.2%).
| Race | # Population | % Population |
| Asian | 87 | 4.2% |
| Black / African American | 30 | 1.4% |
| Hawaiian / Pacific | 0 | 0.0% |
| Hispanic or Latino | 61 | 2.9% |
| Native / Alaskan | 2 | 0.1% |
| White / Caucasian | 1,662 | 79.6% |
| Two or more Races | 303 | 14.5% |
| Some other Race | 4 | 0.2% |
| Total | 2,088 | 100.0% |
Ancestry in Rivanna
The most populous ancestries reported in Rivanna are English (430 | 20.6%), German (322 | 15.4%), Irish (279 | 13.4%), Italian (224 | 10.7%), and Scottish (113 | 5.4%), together accounting for 65.5% of all Rivanna residents.
| Ancestry | # Population | % Population |
| American | 47 | 2.2% |
| British | 9 | 0.4% |
| Burmese | 29 | 1.4% |
| Cherokee | 15 | 0.7% |
| Danish | 11 | 0.5% |
| Dutch | 81 | 3.9% |
| Eastern European | 37 | 1.8% |
| English | 430 | 20.6% |
| French | 32 | 1.5% |
| French Canadian | 43 | 2.1% |
| German | 322 | 15.4% |
| Greek | 34 | 1.6% |
| Hungarian | 9 | 0.4% |
| Irish | 279 | 13.4% |
| Italian | 224 | 10.7% |
| Korean | 18 | 0.9% |
| Latvian | 6 | 0.3% |
| Northern European | 8 | 0.4% |
| Norwegian | 14 | 0.7% |
| Polish | 69 | 3.3% |
| Portuguese | 7 | 0.3% |
| Puerto Rican | 20 | 1.0% |
| Scotch-Irish | 84 | 4.0% |
| Scottish | 113 | 5.4% |
| Spanish | 41 | 2.0% |
| Sri Lankan | 42 | 2.0% |
| Swedish | 57 | 2.7% |
| Thai | 91 | 4.4% |
| Welsh | 10 | 0.5% | View All 29 Rows |
Immigrants in Rivanna
The most numerous immigrant groups reported in Rivanna came from Asia (71 | 3.4%), South Eastern Asia (42 | 2.0%), Vietnam (42 | 2.0%), Eastern Asia (29 | 1.4%), and Korea (29 | 1.4%), together accounting for 10.2% of all Rivanna residents.
| Immigration Origin | # Population | % Population |
| Asia | 71 | 3.4% |
| Canada | 10 | 0.5% |
| Eastern Asia | 29 | 1.4% |
| Europe | 17 | 0.8% |
| Korea | 29 | 1.4% |
| Northern Europe | 10 | 0.5% |
| Norway | 10 | 0.5% |
| Portugal | 7 | 0.3% |
| South Eastern Asia | 42 | 2.0% |
| Southern Europe | 7 | 0.3% |
| Vietnam | 42 | 2.0% | View All 11 Rows |
Sex and Age in Rivanna
Sex and Age in Rivanna
The most populous age groups in Rivanna are 75 to 79 Years (114 | 11.9%) for men and 70 to 74 Years (152 | 13.4%) for women.
| Age Bracket | Male | Female |
| Under 5 Years | 24 (2.5%) | 79 (7.0%) |
| 5 to 9 Years | 13 (1.4%) | 29 (2.6%) |
| 10 to 14 Years | 45 (4.7%) | 135 (11.9%) |
| 15 to 19 Years | 34 (3.6%) | 80 (7.1%) |
| 20 to 24 Years | 28 (2.9%) | 0 (0.0%) |
| 25 to 29 Years | 3 (0.3%) | 2 (0.2%) |
| 30 to 34 Years | 83 (8.7%) | 83 (7.3%) |
| 35 to 39 Years | 1 (0.1%) | 24 (2.1%) |
| 40 to 44 Years | 52 (5.4%) | 38 (3.4%) |
| 45 to 49 Years | 84 (8.8%) | 72 (6.4%) |
| 50 to 54 Years | 39 (4.1%) | 50 (4.4%) |
| 55 to 59 Years | 70 (7.3%) | 47 (4.2%) |
| 60 to 64 Years | 52 (5.4%) | 68 (6.0%) |
| 65 to 69 Years | 102 (10.7%) | 136 (12.0%) |
| 70 to 74 Years | 101 (10.6%) | 152 (13.4%) |
| 75 to 79 Years | 114 (11.9%) | 74 (6.5%) |
| 80 to 84 Years | 51 (5.3%) | 31 (2.7%) |
| 85 Years and over | 59 (6.2%) | 33 (2.9%) |
| Total | 955 (100.0%) | 1,133 (100.0%) |
Families and Households in Rivanna
Median Family Size in Rivanna
The median family size in Rivanna is 2.68 persons per family, with single male/father families (21 | 2.9%) accounting for the largest median family size of 4.81 persons per family. On the other hand, single female/mother families (3 | 0.4%) represent the smallest median family size with 1.67 persons per family.
| Family Type | # Families | Family Size |
| Married-Couple | 690 (96.6%) | 2.61 |
| Single Male/Father | 21 (2.9%) | 4.81 |
| Single Female/Mother | 3 (0.4%) | 1.67 |
| Total Families | 714 (100.0%) | 2.68 |
Median Household Size in Rivanna
The median household size in Rivanna is 2.42 persons per household, with single male/father households (21 | 2.4%) accounting for the largest median household size of 4.81 persons per household. non-family households (149 | 17.3%) represent the smallest median household size with 1.19 persons per household.
| Household Type | # Households | Household Size |
| Married-Couple | 690 (79.9%) | 2.61 |
| Single Male/Father | 21 (2.4%) | 4.81 |
| Single Female/Mother | 3 (0.4%) | 1.67 |
| Non-family | 149 (17.3%) | 1.19 |
| Total Households | 863 (100.0%) | 2.42 |
Household Size by Marriage Status in Rivanna
Out of a total of 863 households in Rivanna, 714 (82.7%) are family households, while 149 (17.3%) are nonfamily households. The most numerous type of family households are 2-person households, comprising 541, and the most common type of nonfamily households are 1-person households, comprising 115.
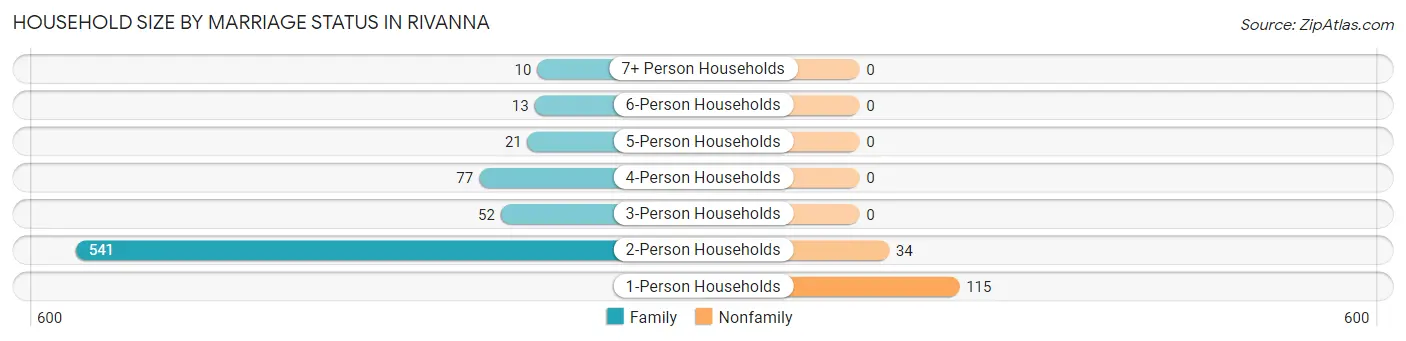
| Household Size | Family Households | Nonfamily Households |
| 1-Person Households | - | 115 (13.3%) |
| 2-Person Households | 541 (62.7%) | 34 (3.9%) |
| 3-Person Households | 52 (6.0%) | 0 (0.0%) |
| 4-Person Households | 77 (8.9%) | 0 (0.0%) |
| 5-Person Households | 21 (2.4%) | 0 (0.0%) |
| 6-Person Households | 13 (1.5%) | 0 (0.0%) |
| 7+ Person Households | 10 (1.2%) | 0 (0.0%) |
| Total | 714 (82.7%) | 149 (17.3%) |
Female Fertility in Rivanna
Fertility by Age in Rivanna
Average fertility rate in Rivanna is 72.0 births per 1,000 women. Women in the age bracket of 35 to 50 years have the highest fertility rate with 148.0 births per 1,000 women. Women in the age bracket of 35 to 50 years acount for 100.0% of all women with births.
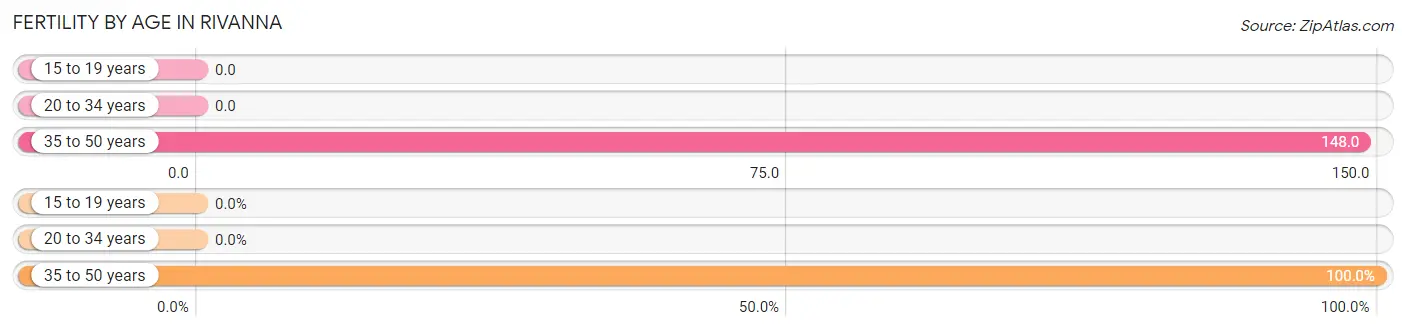
| Age Bracket | Women with Births | Births / 1,000 Women |
| 15 to 19 years | 0 (0.0%) | 0.0 |
| 20 to 34 years | 0 (0.0%) | 0.0 |
| 35 to 50 years | 23 (100.0%) | 148.0 |
| Total | 23 (100.0%) | 72.0 |
Fertility by Age by Marriage Status in Rivanna
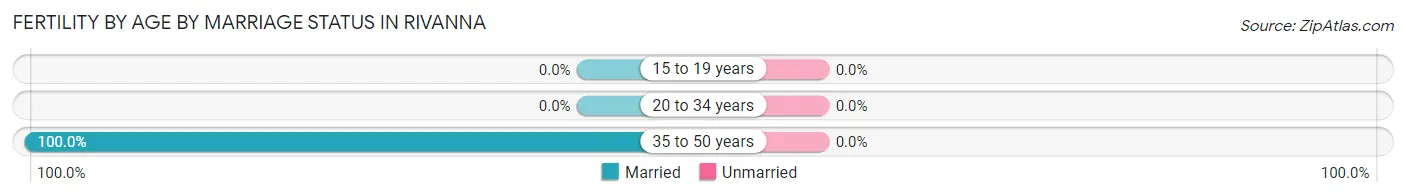
| Age Bracket | Married | Unmarried |
| 15 to 19 years | 0 (0.0%) | 0 (0.0%) |
| 20 to 34 years | 0 (0.0%) | 0 (0.0%) |
| 35 to 50 years | 23 (100.0%) | 0 (0.0%) |
| Total | 23 (100.0%) | 0 (0.0%) |
Fertility by Education in Rivanna
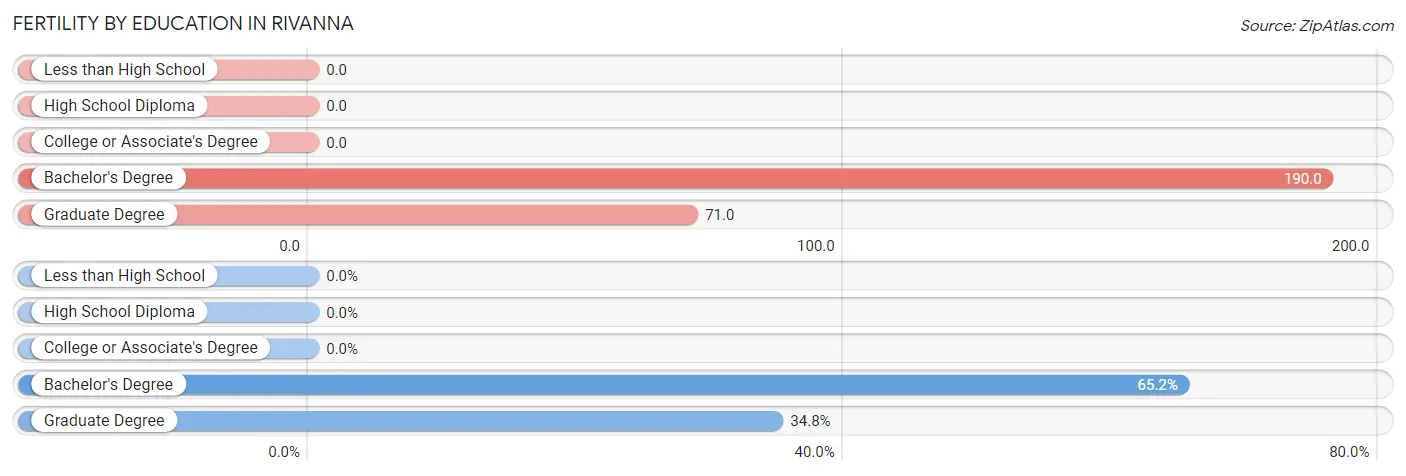
| Educational Attainment | Women with Births | Births / 1,000 Women |
| Less than High School | 0 (0.0%) | 0.0 |
| High School Diploma | 0 (0.0%) | 0.0 |
| College or Associate's Degree | 0 (0.0%) | 0.0 |
| Bachelor's Degree | 15 (65.2%) | 190.0 |
| Graduate Degree | 8 (34.8%) | 71.0 |
| Total | 23 (100.0%) | 72.0 |
Fertility by Education by Marriage Status in Rivanna
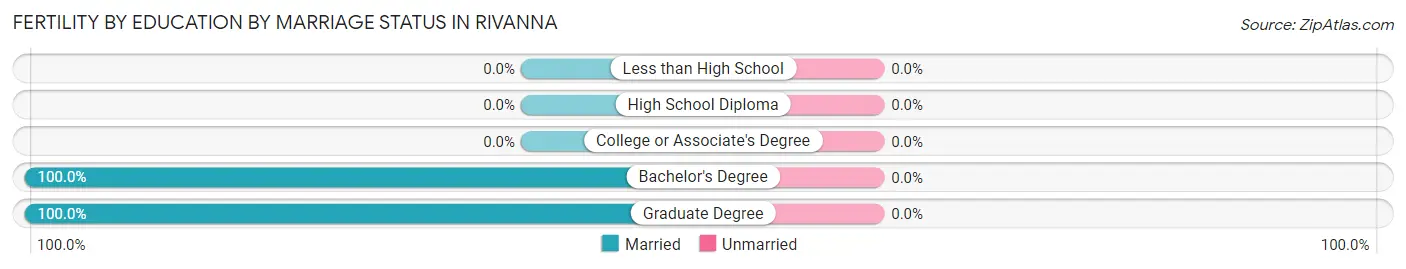
| Educational Attainment | Married | Unmarried |
| Less than High School | 0 (0.0%) | 0 (0.0%) |
| High School Diploma | 0 (0.0%) | 0 (0.0%) |
| College or Associate's Degree | 0 (0.0%) | 0 (0.0%) |
| Bachelor's Degree | 15 (100.0%) | 0 (0.0%) |
| Graduate Degree | 8 (100.0%) | 0 (0.0%) |
| Total | 23 (100.0%) | 0 (0.0%) |
Employment Characteristics in Rivanna
Employment by Class of Employer in Rivanna
Among the 631 employed individuals in Rivanna, private company employees (368 | 58.3%), self-employed (incorporated) (76 | 12.0%), and state government employees (65 | 10.3%) make up the most common classes of employment.
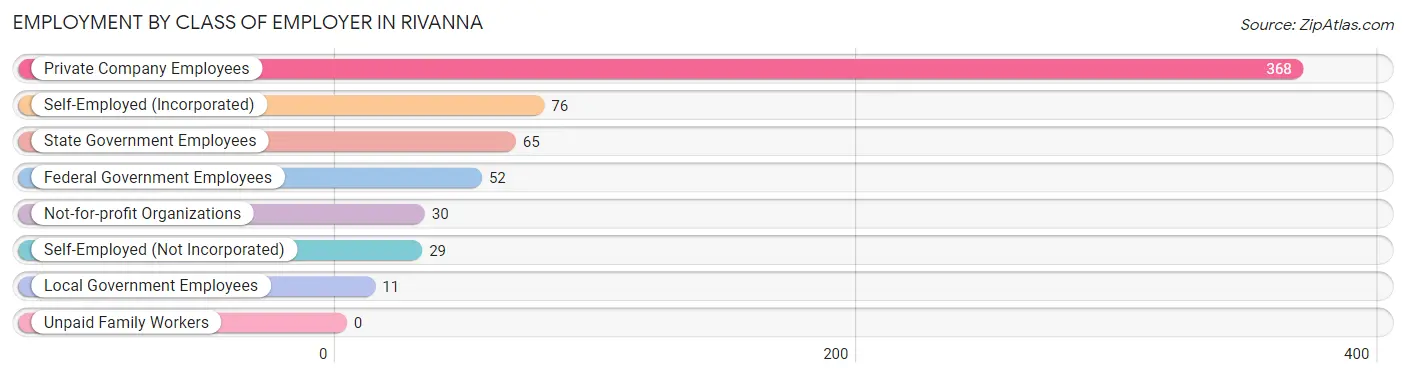
| Employer Class | # Employees | % Employees |
| Private Company Employees | 368 | 58.3% |
| Self-Employed (Incorporated) | 76 | 12.0% |
| Self-Employed (Not Incorporated) | 29 | 4.6% |
| Not-for-profit Organizations | 30 | 4.8% |
| Local Government Employees | 11 | 1.7% |
| State Government Employees | 65 | 10.3% |
| Federal Government Employees | 52 | 8.2% |
| Unpaid Family Workers | 0 | 0.0% |
| Total | 631 | 100.0% |
Employment Status by Age in Rivanna
According to the labor force statistics for Rivanna, out of the total population over 16 years of age (1,761), 38.9% or 685 individuals are in the labor force, with 5.7% or 39 of them unemployed. The age group with the highest labor force participation rate is 20 to 24 years, with 100.0% or 28 individuals in the labor force. Within the labor force, the 20 to 24 years age range has the highest percentage of unemployed individuals, with 35.7% or 10 of them being unemployed.
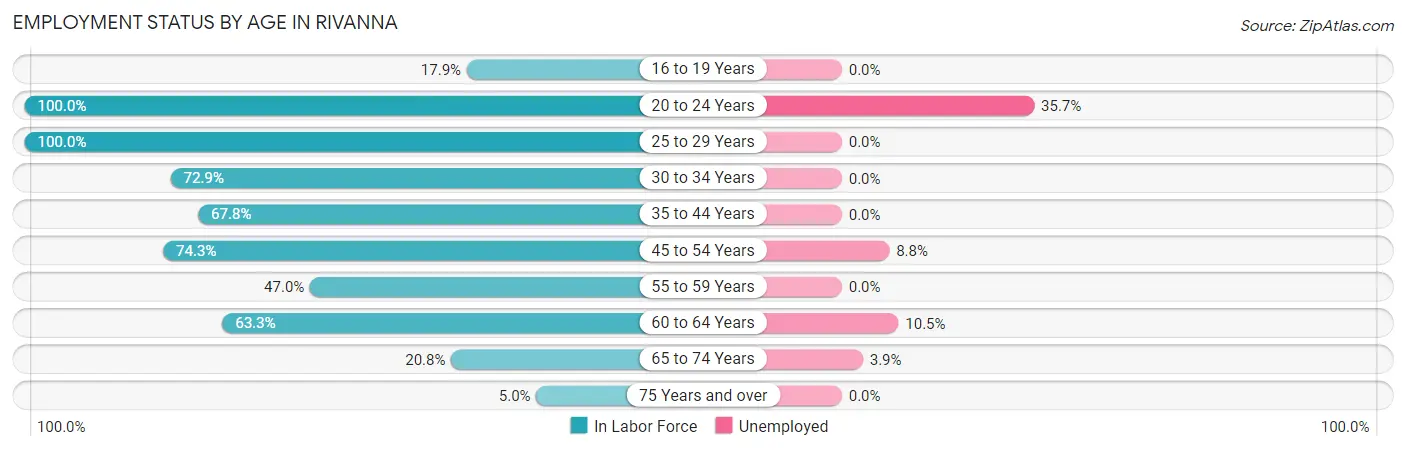
| Age Bracket | In Labor Force | Unemployed |
| 16 to 19 Years | 20 (17.9%) | 0 (0.0%) |
| 20 to 24 Years | 28 (100.0%) | 10 (35.7%) |
| 25 to 29 Years | 5 (100.0%) | 0 (0.0%) |
| 30 to 34 Years | 121 (72.9%) | 0 (0.0%) |
| 35 to 44 Years | 78 (67.8%) | 0 (0.0%) |
| 45 to 54 Years | 182 (74.3%) | 16 (8.8%) |
| 55 to 59 Years | 55 (47.0%) | 0 (0.0%) |
| 60 to 64 Years | 76 (63.3%) | 8 (10.5%) |
| 65 to 74 Years | 102 (20.8%) | 4 (3.9%) |
| 75 Years and over | 18 (5.0%) | 0 (0.0%) |
| Total | 685 (38.9%) | 39 (5.7%) |
Employment Status by Educational Attainment in Rivanna
According to labor force statistics for Rivanna, 67.3% of individuals (517) out of the total population between 25 and 64 years of age (768) are in the labor force, with 4.8% or 25 of them being unemployed. The group with the highest labor force participation rate are those with the educational attainment of college / associate degree, with 81.3% or 122 individuals in the labor force. Within the labor force, individuals with high school diploma education have the highest percentage of unemployment, with 50.0% or 8 of them being unemployed.
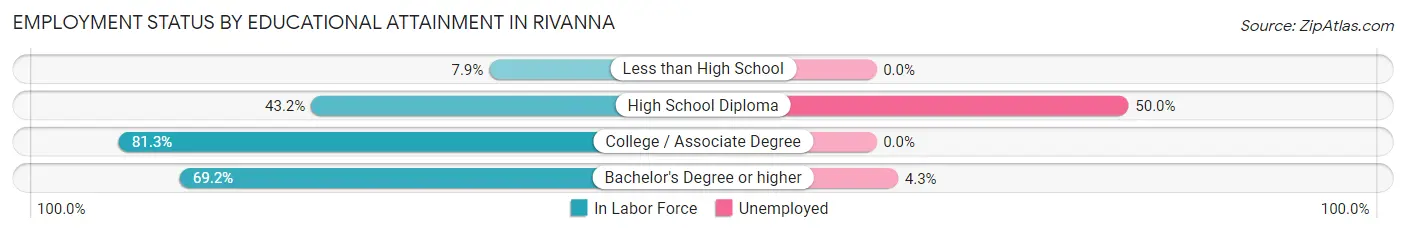
| Educational Attainment | In Labor Force | Unemployed |
| Less than High School | 3 (7.9%) | 0 (0.0%) |
| High School Diploma | 16 (43.2%) | 18 (50.0%) |
| College / Associate Degree | 122 (81.3%) | 0 (0.0%) |
| Bachelor's Degree or higher | 376 (69.2%) | 23 (4.3%) |
| Total | 517 (67.3%) | 37 (4.8%) |
Employment Occupations by Sex in Rivanna
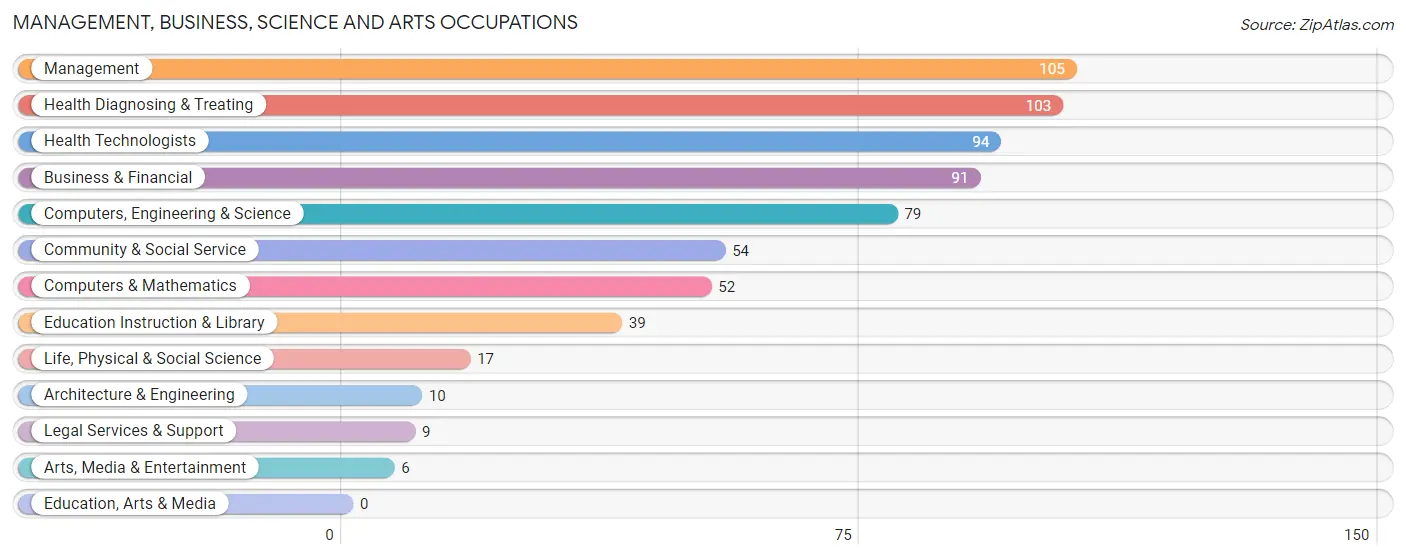
Management, Business, Science and Arts Occupations
The most common Management, Business, Science and Arts occupations in Rivanna are Management (105 | 16.6%), Health Diagnosing & Treating (103 | 16.3%), Health Technologists (94 | 14.8%), Business & Financial (91 | 14.4%), and Computers, Engineering & Science (79 | 12.5%).
Management, Business, Science and Arts Occupations by Sex
Within the Management, Business, Science and Arts occupations in Rivanna, the most male-oriented occupations are Architecture & Engineering (100.0%), Life, Physical & Social Science (100.0%), and Arts, Media & Entertainment (100.0%), while the most female-oriented occupations are Health Diagnosing & Treating (46.6%), Education Instruction & Library (46.2%), and Business & Financial (44.0%).
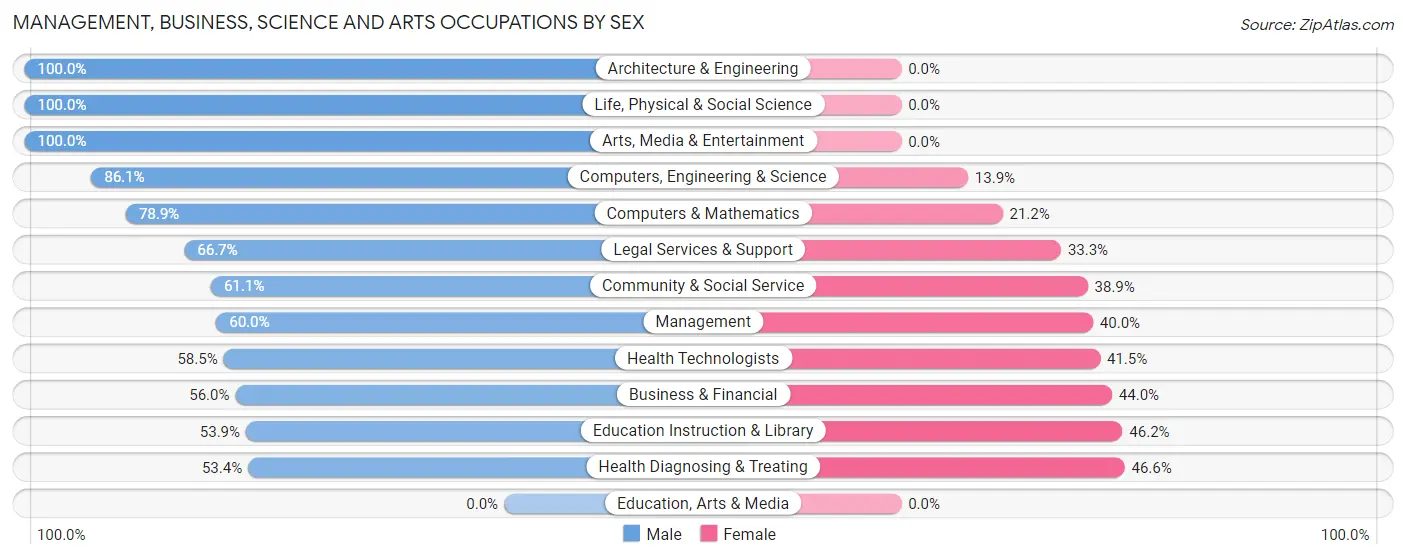
| Occupation | Male | Female |
| Management | 63 (60.0%) | 42 (40.0%) |
| Business & Financial | 51 (56.0%) | 40 (44.0%) |
| Computers, Engineering & Science | 68 (86.1%) | 11 (13.9%) |
| Computers & Mathematics | 41 (78.8%) | 11 (21.1%) |
| Architecture & Engineering | 10 (100.0%) | 0 (0.0%) |
| Life, Physical & Social Science | 17 (100.0%) | 0 (0.0%) |
| Community & Social Service | 33 (61.1%) | 21 (38.9%) |
| Education, Arts & Media | 0 (0.0%) | 0 (0.0%) |
| Legal Services & Support | 6 (66.7%) | 3 (33.3%) |
| Education Instruction & Library | 21 (53.8%) | 18 (46.2%) |
| Arts, Media & Entertainment | 6 (100.0%) | 0 (0.0%) |
| Health Diagnosing & Treating | 55 (53.4%) | 48 (46.6%) |
| Health Technologists | 55 (58.5%) | 39 (41.5%) |
| Total (Category) | 270 (62.5%) | 162 (37.5%) |
| Total (Overall) | 385 (60.8%) | 248 (39.2%) |
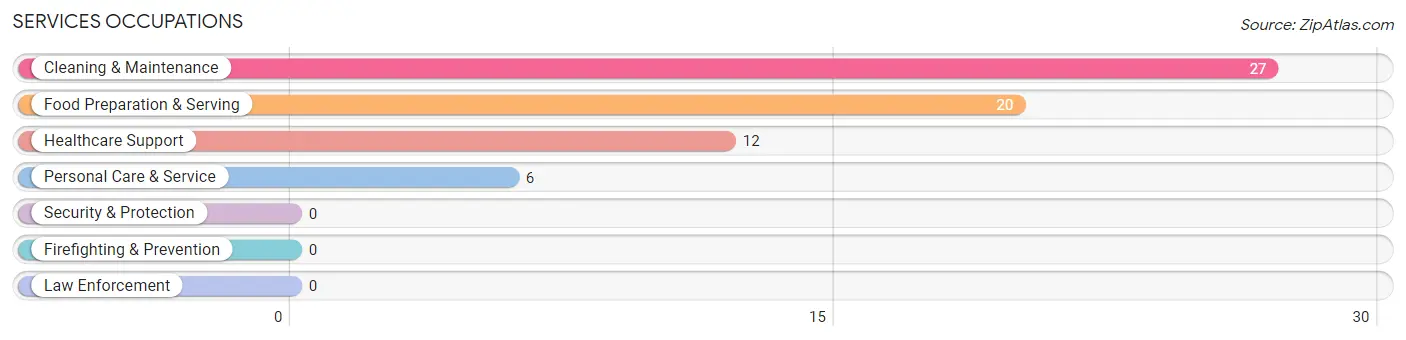
Services Occupations
The most common Services occupations in Rivanna are Cleaning & Maintenance (27 | 4.3%), Food Preparation & Serving (20 | 3.2%), Healthcare Support (12 | 1.9%), and Personal Care & Service (6 | 0.9%).
Services Occupations by Sex
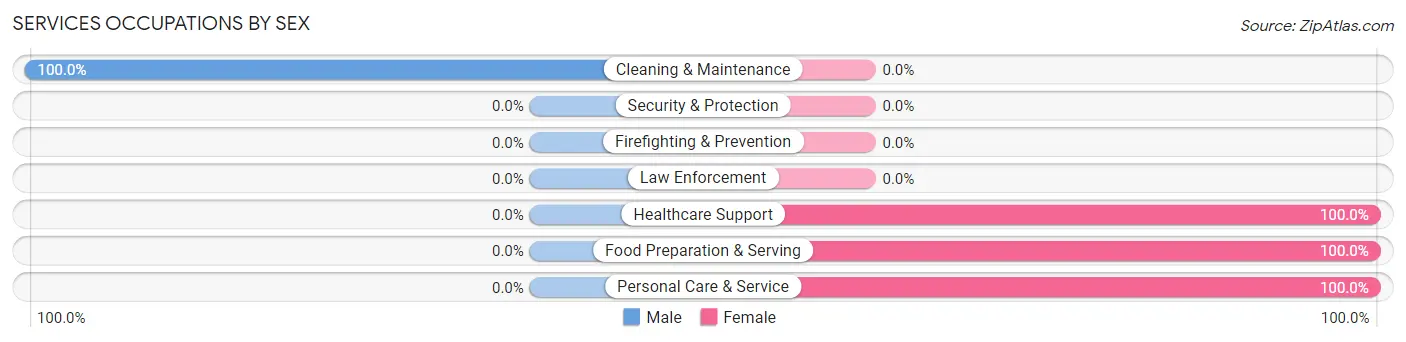
| Occupation | Male | Female |
| Healthcare Support | 0 (0.0%) | 12 (100.0%) |
| Security & Protection | 0 (0.0%) | 0 (0.0%) |
| Firefighting & Prevention | 0 (0.0%) | 0 (0.0%) |
| Law Enforcement | 0 (0.0%) | 0 (0.0%) |
| Food Preparation & Serving | 0 (0.0%) | 20 (100.0%) |
| Cleaning & Maintenance | 27 (100.0%) | 0 (0.0%) |
| Personal Care & Service | 0 (0.0%) | 6 (100.0%) |
| Total (Category) | 27 (41.5%) | 38 (58.5%) |
| Total (Overall) | 385 (60.8%) | 248 (39.2%) |
Sales and Office Occupations
The most common Sales and Office occupations in Rivanna are Sales & Related (56 | 8.8%), and Office & Administration (29 | 4.6%).
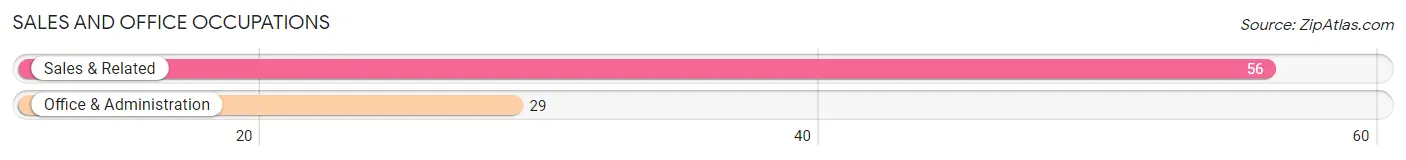
Sales and Office Occupations by Sex
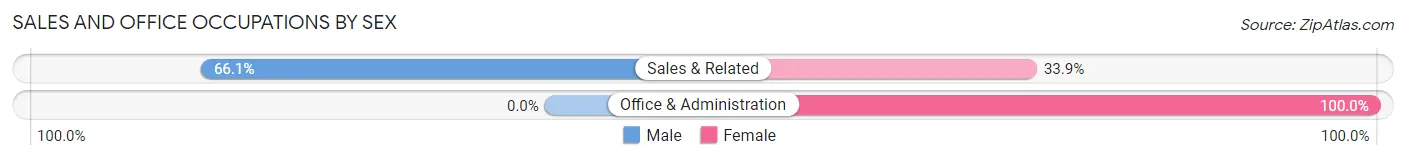
| Occupation | Male | Female |
| Sales & Related | 37 (66.1%) | 19 (33.9%) |
| Office & Administration | 0 (0.0%) | 29 (100.0%) |
| Total (Category) | 37 (43.5%) | 48 (56.5%) |
| Total (Overall) | 385 (60.8%) | 248 (39.2%) |
Natural Resources, Construction and Maintenance Occupations
The most common Natural Resources, Construction and Maintenance occupations in Rivanna are , and Installation, Maintenance & Repair (18 | 2.8%).
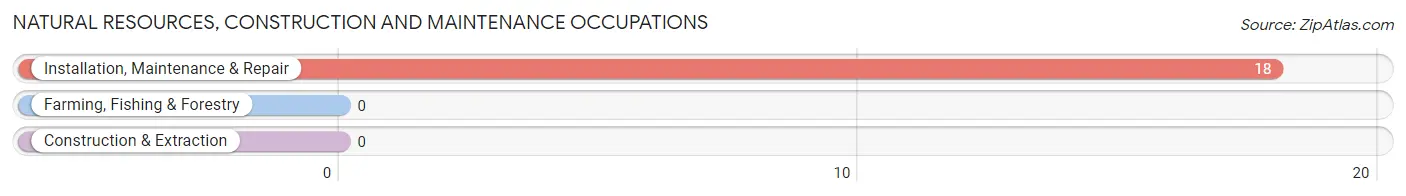
Natural Resources, Construction and Maintenance Occupations by Sex
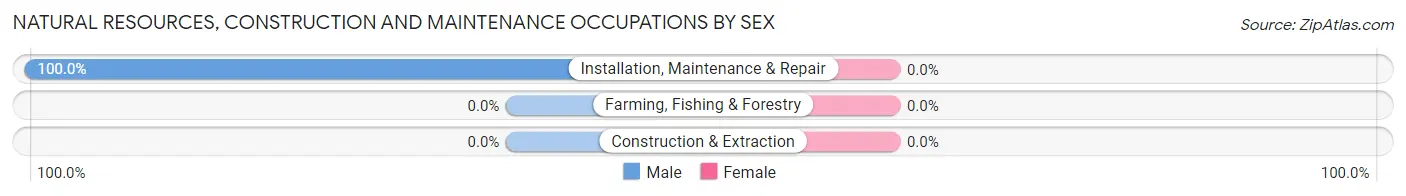
| Occupation | Male | Female |
| Farming, Fishing & Forestry | 0 (0.0%) | 0 (0.0%) |
| Construction & Extraction | 0 (0.0%) | 0 (0.0%) |
| Installation, Maintenance & Repair | 18 (100.0%) | 0 (0.0%) |
| Total (Category) | 18 (100.0%) | 0 (0.0%) |
| Total (Overall) | 385 (60.8%) | 248 (39.2%) |
Production, Transportation and Moving Occupations
The most common Production, Transportation and Moving occupations in Rivanna are , and Transportation (33 | 5.2%).
Production, Transportation and Moving Occupations by Sex
| Occupation | Male | Female |
| Production | 0 (0.0%) | 0 (0.0%) |
| Transportation | 33 (100.0%) | 0 (0.0%) |
| Material Moving | 0 (0.0%) | 0 (0.0%) |
| Total (Category) | 33 (100.0%) | 0 (0.0%) |
| Total (Overall) | 385 (60.8%) | 248 (39.2%) |
Employment Industries by Sex in Rivanna
Employment Industries in Rivanna
The major employment industries in Rivanna include Educational Services (100 | 15.8%), Professional & Scientific (99 | 15.6%), Health Care & Social Assistance (90 | 14.2%), Finance & Insurance (55 | 8.7%), and Public Administration (44 | 7.0%).
Employment Industries by Sex in Rivanna
The Rivanna industries that see more men than women are Agriculture, Fishing & Hunting (100.0%), Manufacturing (100.0%), and Utilities (100.0%), whereas the industries that tend to have a higher number of women are Educational Services (74.0%), Accommodation & Food Services (72.2%), and Wholesale Trade (65.5%).
| Industry | Male | Female |
| Agriculture, Fishing & Hunting | 3 (100.0%) | 0 (0.0%) |
| Mining, Quarrying, & Extraction | 0 (0.0%) | 0 (0.0%) |
| Construction | 18 (69.2%) | 8 (30.8%) |
| Manufacturing | 1 (100.0%) | 0 (0.0%) |
| Wholesale Trade | 10 (34.5%) | 19 (65.5%) |
| Retail Trade | 26 (81.2%) | 6 (18.8%) |
| Transportation & Warehousing | 30 (78.9%) | 8 (21.0%) |
| Utilities | 13 (100.0%) | 0 (0.0%) |
| Information | 6 (100.0%) | 0 (0.0%) |
| Finance & Insurance | 43 (78.2%) | 12 (21.8%) |
| Real Estate, Rental & Leasing | 11 (100.0%) | 0 (0.0%) |
| Professional & Scientific | 70 (70.7%) | 29 (29.3%) |
| Enterprise Management | 0 (0.0%) | 0 (0.0%) |
| Administrative & Support | 17 (53.1%) | 15 (46.9%) |
| Educational Services | 26 (26.0%) | 74 (74.0%) |
| Health Care & Social Assistance | 66 (73.3%) | 24 (26.7%) |
| Arts, Entertainment & Recreation | 0 (0.0%) | 0 (0.0%) |
| Accommodation & Food Services | 10 (27.8%) | 26 (72.2%) |
| Public Administration | 17 (38.6%) | 27 (61.4%) |
| Total | 385 (60.8%) | 248 (39.2%) |
Education in Rivanna
School Enrollment in Rivanna
The most common levels of schooling among the 377 students in Rivanna are middle school (168 | 44.6%), high school (120 | 31.8%), and elementary school (23 | 6.1%).
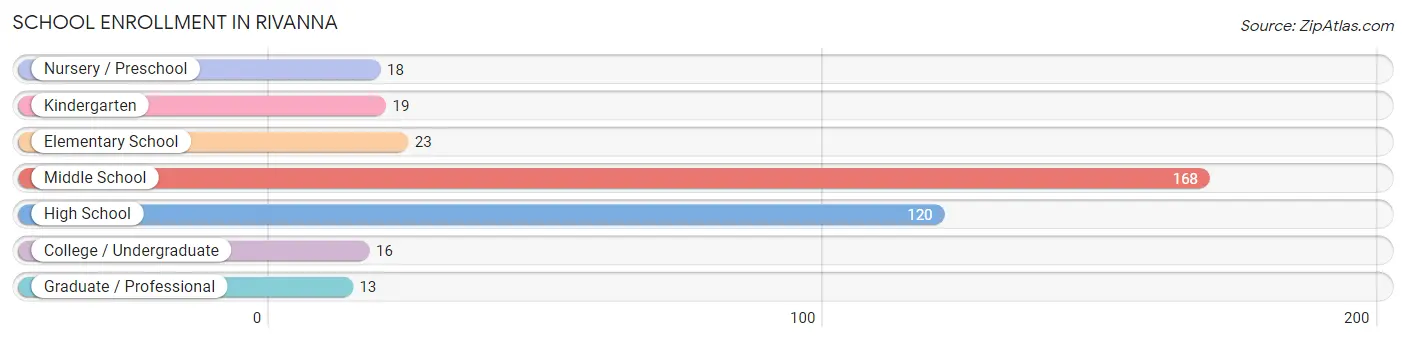
| School Level | # Students | % Students |
| Nursery / Preschool | 18 | 4.8% |
| Kindergarten | 19 | 5.0% |
| Elementary School | 23 | 6.1% |
| Middle School | 168 | 44.6% |
| High School | 120 | 31.8% |
| College / Undergraduate | 16 | 4.2% |
| Graduate / Professional | 13 | 3.5% |
| Total | 377 | 100.0% |
School Enrollment by Age by Funding Source in Rivanna
Out of a total of 377 students who are enrolled in schools in Rivanna, 22 (5.8%) attend a private institution, while the remaining 355 (94.2%) are enrolled in public schools. The age group of 3 to 4 year olds has the highest likelihood of being enrolled in private schools, with 16 (88.9% in the age bracket) enrolled. Conversely, the age group of 5 to 9 year old has the lowest likelihood of being enrolled in a private school, with 42 (100.0% in the age bracket) attending a public institution.
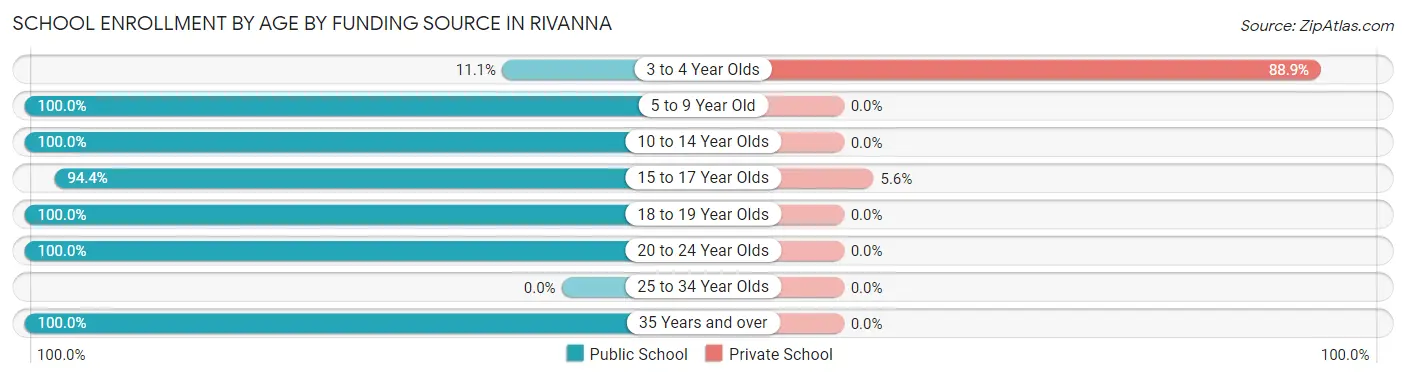
| Age Bracket | Public School | Private School |
| 3 to 4 Year Olds | 2 (11.1%) | 16 (88.9%) |
| 5 to 9 Year Old | 42 (100.0%) | 0 (0.0%) |
| 10 to 14 Year Olds | 180 (100.0%) | 0 (0.0%) |
| 15 to 17 Year Olds | 102 (94.4%) | 6 (5.6%) |
| 18 to 19 Year Olds | 6 (100.0%) | 0 (0.0%) |
| 20 to 24 Year Olds | 10 (100.0%) | 0 (0.0%) |
| 25 to 34 Year Olds | 0 (0.0%) | 0 (0.0%) |
| 35 Years and over | 13 (100.0%) | 0 (0.0%) |
| Total | 355 (94.2%) | 22 (5.8%) |
Educational Attainment by Field of Study in Rivanna
Science & technology (187 | 14.2%), social sciences (184 | 14.0%), education (141 | 10.7%), business (131 | 9.9%), and literature & languages (122 | 9.3%) are the most common fields of study among 1,318 individuals in Rivanna who have obtained a bachelor's degree or higher.
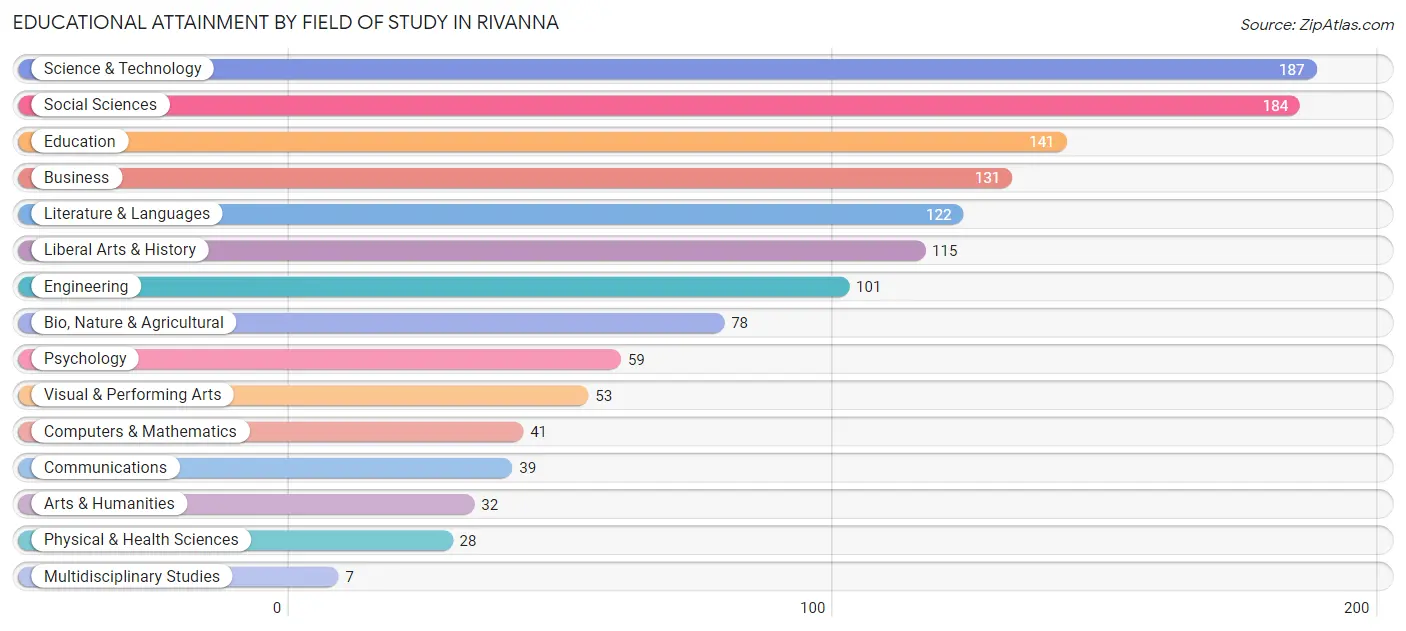
| Field of Study | # Graduates | % Graduates |
| Computers & Mathematics | 41 | 3.1% |
| Bio, Nature & Agricultural | 78 | 5.9% |
| Physical & Health Sciences | 28 | 2.1% |
| Psychology | 59 | 4.5% |
| Social Sciences | 184 | 14.0% |
| Engineering | 101 | 7.7% |
| Multidisciplinary Studies | 7 | 0.5% |
| Science & Technology | 187 | 14.2% |
| Business | 131 | 9.9% |
| Education | 141 | 10.7% |
| Literature & Languages | 122 | 9.3% |
| Liberal Arts & History | 115 | 8.7% |
| Visual & Performing Arts | 53 | 4.0% |
| Communications | 39 | 3.0% |
| Arts & Humanities | 32 | 2.4% |
| Total | 1,318 | 100.0% |
Transportation & Commute in Rivanna
Vehicle Availability by Sex in Rivanna
The most prevalent vehicle ownership categories in Rivanna are males with 2 vehicles (267, accounting for 69.4%) and females with 2 vehicles (103, making up 108.5%).
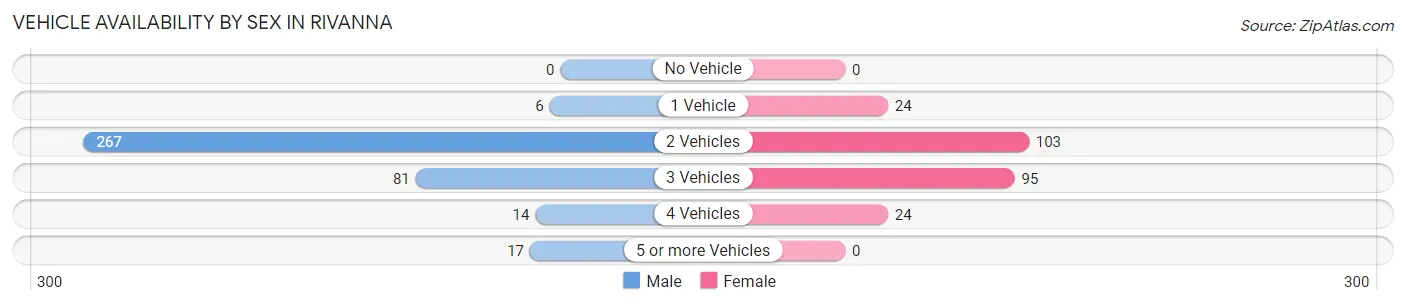
| Vehicles Available | Male | Female |
| No Vehicle | 0 (0.0%) | 0 (0.0%) |
| 1 Vehicle | 6 (1.6%) | 24 (9.8%) |
| 2 Vehicles | 267 (69.4%) | 103 (41.9%) |
| 3 Vehicles | 81 (21.0%) | 95 (38.6%) |
| 4 Vehicles | 14 (3.6%) | 24 (9.8%) |
| 5 or more Vehicles | 17 (4.4%) | 0 (0.0%) |
| Total | 385 (100.0%) | 246 (100.0%) |
Commute Time in Rivanna
The most frequently occuring commute durations in Rivanna are 20 to 24 minutes (100 commuters, 23.0%), 15 to 19 minutes (90 commuters, 20.7%), and 30 to 34 minutes (72 commuters, 16.6%).
| Commute Time | # Commuters | % Commuters |
| Less than 5 Minutes | 0 | 0.0% |
| 5 to 9 Minutes | 31 | 7.1% |
| 10 to 14 Minutes | 44 | 10.1% |
| 15 to 19 Minutes | 90 | 20.7% |
| 20 to 24 Minutes | 100 | 23.0% |
| 25 to 29 Minutes | 20 | 4.6% |
| 30 to 34 Minutes | 72 | 16.6% |
| 35 to 39 Minutes | 14 | 3.2% |
| 40 to 44 Minutes | 0 | 0.0% |
| 45 to 59 Minutes | 63 | 14.5% |
| 60 to 89 Minutes | 0 | 0.0% |
| 90 or more Minutes | 0 | 0.0% |
Commute Time by Sex in Rivanna
The most common commute times in Rivanna are 15 to 19 minutes (74 commuters, 27.0%) for males and 30 to 34 minutes (47 commuters, 29.4%) for females.
| Commute Time | Male | Female |
| Less than 5 Minutes | 0 (0.0%) | 0 (0.0%) |
| 5 to 9 Minutes | 31 (11.3%) | 0 (0.0%) |
| 10 to 14 Minutes | 26 (9.5%) | 18 (11.3%) |
| 15 to 19 Minutes | 74 (27.0%) | 16 (10.0%) |
| 20 to 24 Minutes | 70 (25.6%) | 30 (18.8%) |
| 25 to 29 Minutes | 11 (4.0%) | 9 (5.6%) |
| 30 to 34 Minutes | 25 (9.1%) | 47 (29.4%) |
| 35 to 39 Minutes | 0 (0.0%) | 14 (8.7%) |
| 40 to 44 Minutes | 0 (0.0%) | 0 (0.0%) |
| 45 to 59 Minutes | 37 (13.5%) | 26 (16.3%) |
| 60 to 89 Minutes | 0 (0.0%) | 0 (0.0%) |
| 90 or more Minutes | 0 (0.0%) | 0 (0.0%) |
Time of Departure to Work by Sex in Rivanna
The most frequent times of departure to work in Rivanna are 9:00 AM to 9:59 AM (68, 24.8%) for males and 7:00 AM to 7:29 AM (64, 40.0%) for females.
| Time of Departure | Male | Female |
| 12:00 AM to 4:59 AM | 0 (0.0%) | 0 (0.0%) |
| 5:00 AM to 5:29 AM | 0 (0.0%) | 0 (0.0%) |
| 5:30 AM to 5:59 AM | 48 (17.5%) | 14 (8.7%) |
| 6:00 AM to 6:29 AM | 0 (0.0%) | 6 (3.7%) |
| 6:30 AM to 6:59 AM | 26 (9.5%) | 0 (0.0%) |
| 7:00 AM to 7:29 AM | 51 (18.6%) | 64 (40.0%) |
| 7:30 AM to 7:59 AM | 8 (2.9%) | 17 (10.6%) |
| 8:00 AM to 8:29 AM | 36 (13.1%) | 26 (16.3%) |
| 8:30 AM to 8:59 AM | 28 (10.2%) | 15 (9.4%) |
| 9:00 AM to 9:59 AM | 68 (24.8%) | 6 (3.7%) |
| 10:00 AM to 10:59 AM | 0 (0.0%) | 0 (0.0%) |
| 11:00 AM to 11:59 AM | 0 (0.0%) | 0 (0.0%) |
| 12:00 PM to 3:59 PM | 9 (3.3%) | 12 (7.5%) |
| 4:00 PM to 11:59 PM | 0 (0.0%) | 0 (0.0%) |
| Total | 274 (100.0%) | 160 (100.0%) |
Housing Occupancy in Rivanna
Occupancy by Ownership in Rivanna
Of the total 863 dwellings in Rivanna, owner-occupied units account for 824 (95.5%), while renter-occupied units make up 39 (4.5%).
| Occupancy | # Housing Units | % Housing Units |
| Owner Occupied Housing Units | 824 | 95.5% |
| Renter-Occupied Housing Units | 39 | 4.5% |
| Total Occupied Housing Units | 863 | 100.0% |
Occupancy by Household Size in Rivanna
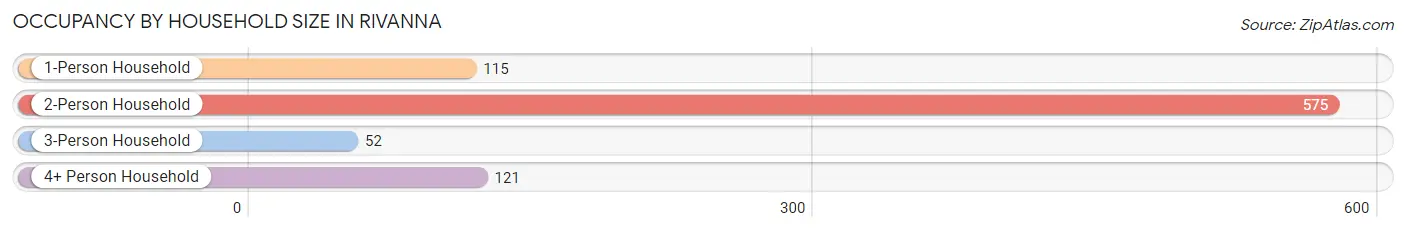
| Household Size | # Housing Units | % Housing Units |
| 1-Person Household | 115 | 13.3% |
| 2-Person Household | 575 | 66.6% |
| 3-Person Household | 52 | 6.0% |
| 4+ Person Household | 121 | 14.0% |
| Total Housing Units | 863 | 100.0% |
Occupancy by Ownership by Household Size in Rivanna
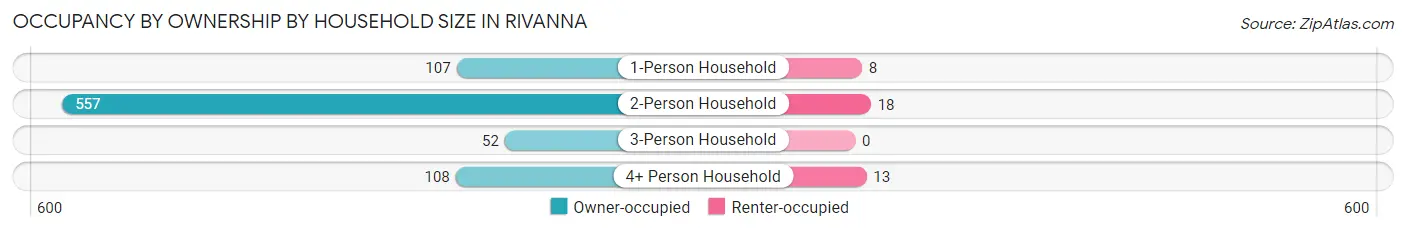
| Household Size | Owner-occupied | Renter-occupied |
| 1-Person Household | 107 (93.0%) | 8 (7.0%) |
| 2-Person Household | 557 (96.9%) | 18 (3.1%) |
| 3-Person Household | 52 (100.0%) | 0 (0.0%) |
| 4+ Person Household | 108 (89.3%) | 13 (10.7%) |
| Total Housing Units | 824 (95.5%) | 39 (4.5%) |
Occupancy by Educational Attainment in Rivanna
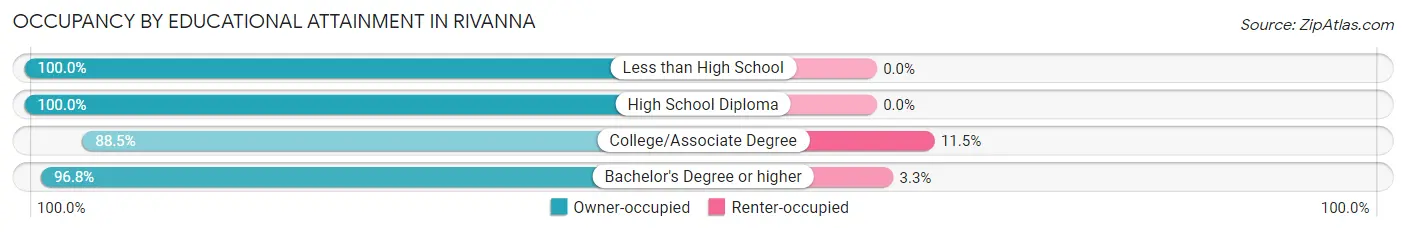
| Household Size | Owner-occupied | Renter-occupied |
| Less than High School | 21 (100.0%) | 0 (0.0%) |
| High School Diploma | 39 (100.0%) | 0 (0.0%) |
| College/Associate Degree | 139 (88.5%) | 18 (11.5%) |
| Bachelor's Degree or higher | 625 (96.8%) | 21 (3.3%) |
Occupancy by Age of Householder in Rivanna
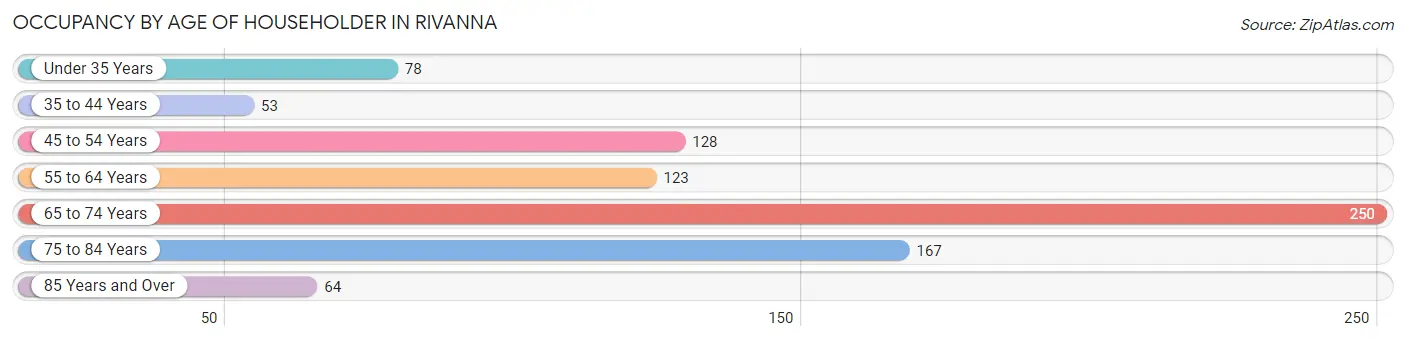
| Age Bracket | # Households | % Households |
| Under 35 Years | 78 | 9.0% |
| 35 to 44 Years | 53 | 6.1% |
| 45 to 54 Years | 128 | 14.8% |
| 55 to 64 Years | 123 | 14.2% |
| 65 to 74 Years | 250 | 29.0% |
| 75 to 84 Years | 167 | 19.4% |
| 85 Years and Over | 64 | 7.4% |
| Total | 863 | 100.0% |
Housing Finances in Rivanna
Median Income by Occupancy in Rivanna
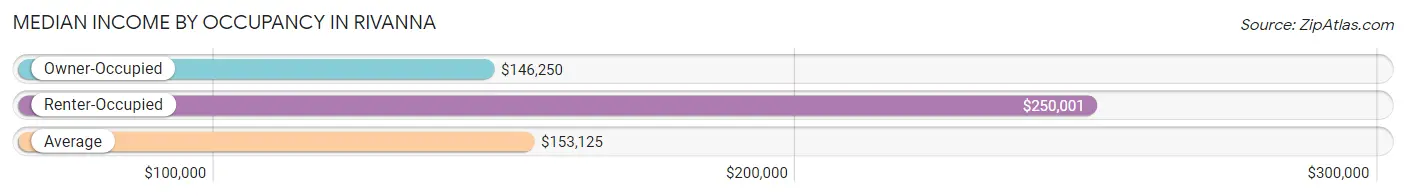
| Occupancy Type | # Households | Median Income |
| Owner-Occupied | 824 (95.5%) | $146,250 |
| Renter-Occupied | 39 (4.5%) | $250,001 |
| Average | 863 (100.0%) | $153,125 |
Occupancy by Householder Income Bracket in Rivanna
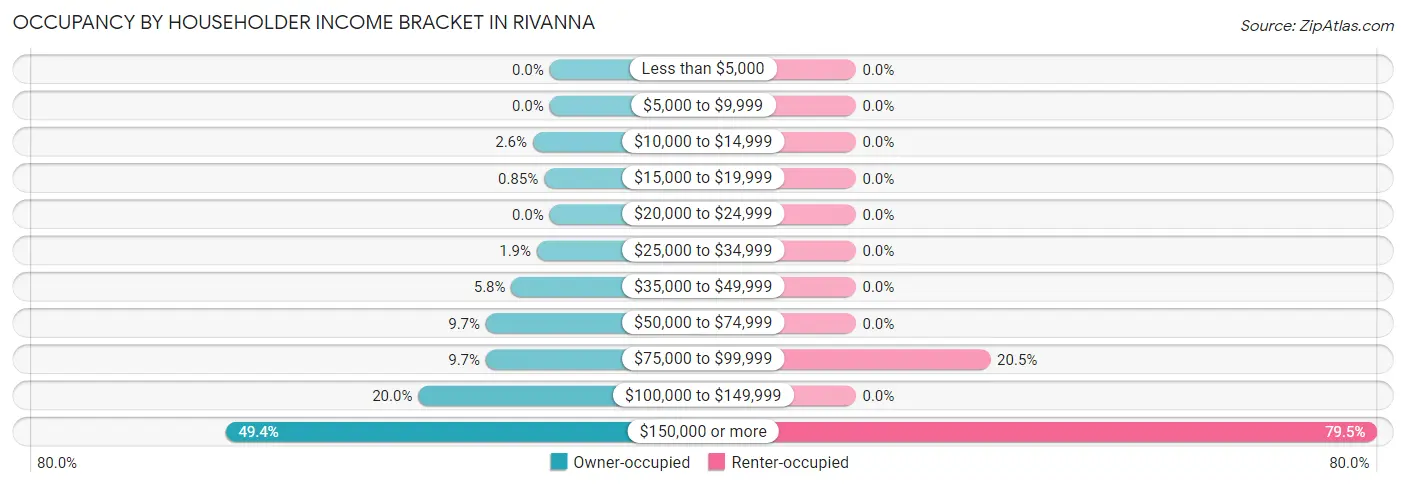
| Income Bracket | Owner-occupied | Renter-occupied |
| Less than $5,000 | 0 (0.0%) | 0 (0.0%) |
| $5,000 to $9,999 | 0 (0.0%) | 0 (0.0%) |
| $10,000 to $14,999 | 21 (2.5%) | 0 (0.0%) |
| $15,000 to $19,999 | 7 (0.9%) | 0 (0.0%) |
| $20,000 to $24,999 | 0 (0.0%) | 0 (0.0%) |
| $25,000 to $34,999 | 16 (1.9%) | 0 (0.0%) |
| $35,000 to $49,999 | 48 (5.8%) | 0 (0.0%) |
| $50,000 to $74,999 | 80 (9.7%) | 0 (0.0%) |
| $75,000 to $99,999 | 80 (9.7%) | 8 (20.5%) |
| $100,000 to $149,999 | 165 (20.0%) | 0 (0.0%) |
| $150,000 or more | 407 (49.4%) | 31 (79.5%) |
| Total | 824 (100.0%) | 39 (100.0%) |
Monthly Housing Cost Tiers in Rivanna
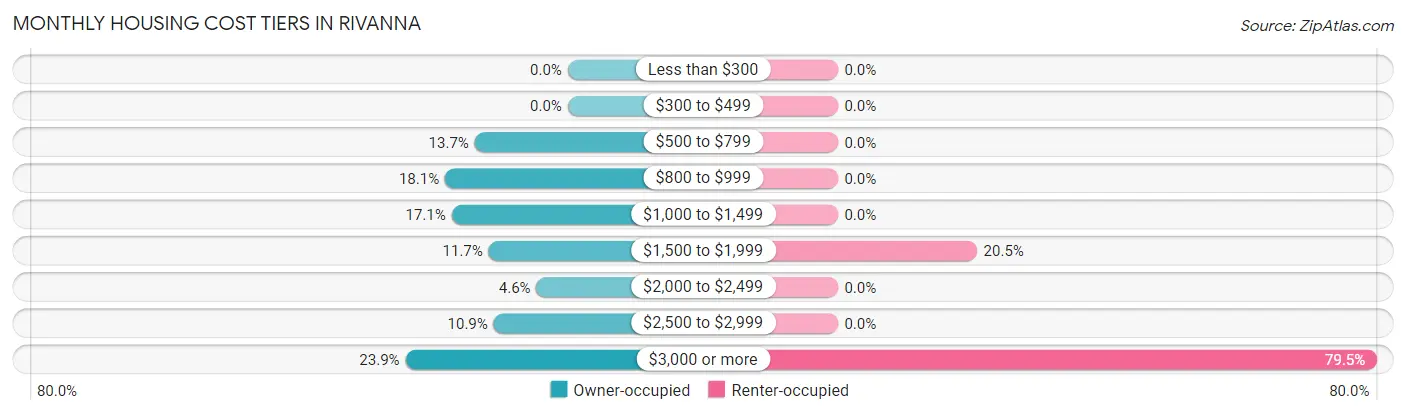
| Monthly Cost | Owner-occupied | Renter-occupied |
| Less than $300 | 0 (0.0%) | 0 (0.0%) |
| $300 to $499 | 0 (0.0%) | 0 (0.0%) |
| $500 to $799 | 113 (13.7%) | 0 (0.0%) |
| $800 to $999 | 149 (18.1%) | 0 (0.0%) |
| $1,000 to $1,499 | 141 (17.1%) | 0 (0.0%) |
| $1,500 to $1,999 | 96 (11.7%) | 8 (20.5%) |
| $2,000 to $2,499 | 38 (4.6%) | 0 (0.0%) |
| $2,500 to $2,999 | 90 (10.9%) | 0 (0.0%) |
| $3,000 or more | 197 (23.9%) | 31 (79.5%) |
| Total | 824 (100.0%) | 39 (100.0%) |
Physical Housing Characteristics in Rivanna
Housing Structures in Rivanna
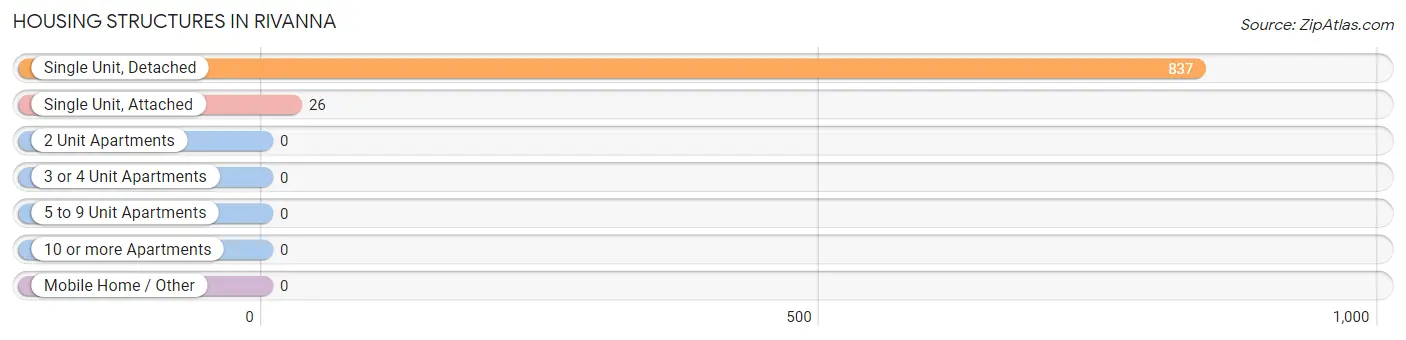
| Structure Type | # Housing Units | % Housing Units |
| Single Unit, Detached | 837 | 97.0% |
| Single Unit, Attached | 26 | 3.0% |
| 2 Unit Apartments | 0 | 0.0% |
| 3 or 4 Unit Apartments | 0 | 0.0% |
| 5 to 9 Unit Apartments | 0 | 0.0% |
| 10 or more Apartments | 0 | 0.0% |
| Mobile Home / Other | 0 | 0.0% |
| Total | 863 | 100.0% |
Housing Structures by Occupancy in Rivanna
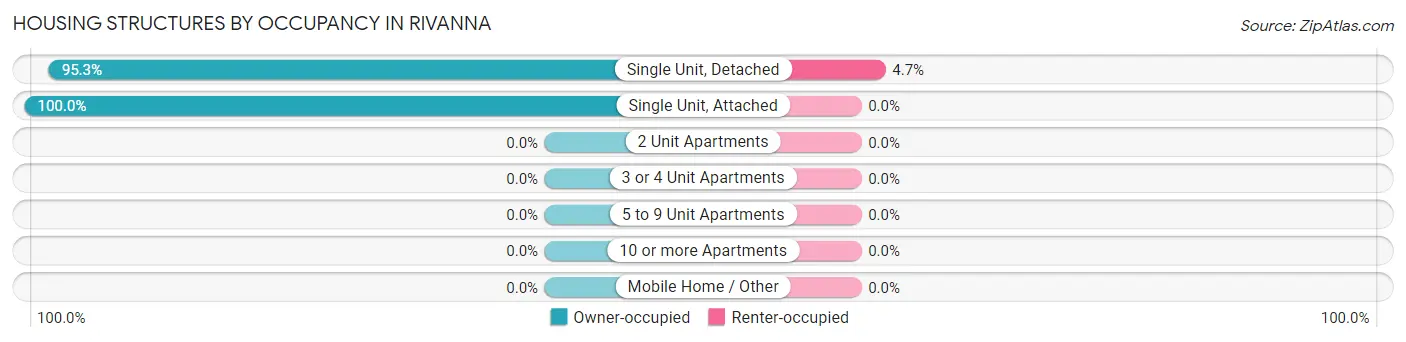
| Structure Type | Owner-occupied | Renter-occupied |
| Single Unit, Detached | 798 (95.3%) | 39 (4.7%) |
| Single Unit, Attached | 26 (100.0%) | 0 (0.0%) |
| 2 Unit Apartments | 0 (0.0%) | 0 (0.0%) |
| 3 or 4 Unit Apartments | 0 (0.0%) | 0 (0.0%) |
| 5 to 9 Unit Apartments | 0 (0.0%) | 0 (0.0%) |
| 10 or more Apartments | 0 (0.0%) | 0 (0.0%) |
| Mobile Home / Other | 0 (0.0%) | 0 (0.0%) |
| Total | 824 (95.5%) | 39 (4.5%) |
Housing Structures by Number of Rooms in Rivanna
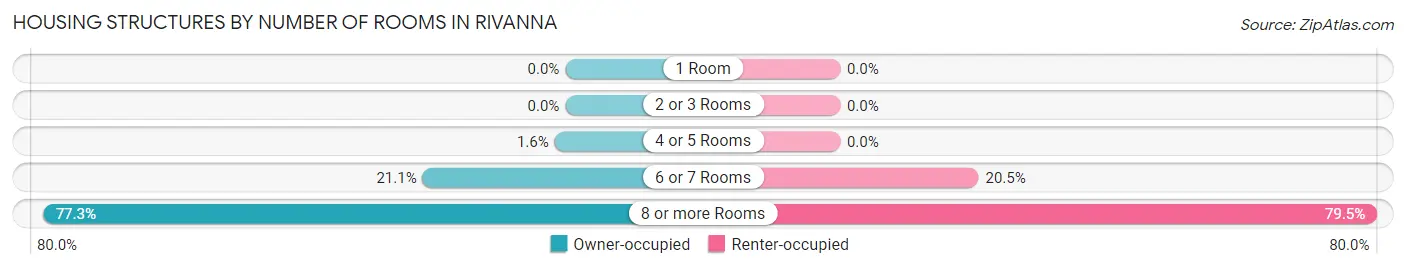
| Number of Rooms | Owner-occupied | Renter-occupied |
| 1 Room | 0 (0.0%) | 0 (0.0%) |
| 2 or 3 Rooms | 0 (0.0%) | 0 (0.0%) |
| 4 or 5 Rooms | 13 (1.6%) | 0 (0.0%) |
| 6 or 7 Rooms | 174 (21.1%) | 8 (20.5%) |
| 8 or more Rooms | 637 (77.3%) | 31 (79.5%) |
| Total | 824 (100.0%) | 39 (100.0%) |
Housing Structure by Heating Type in Rivanna
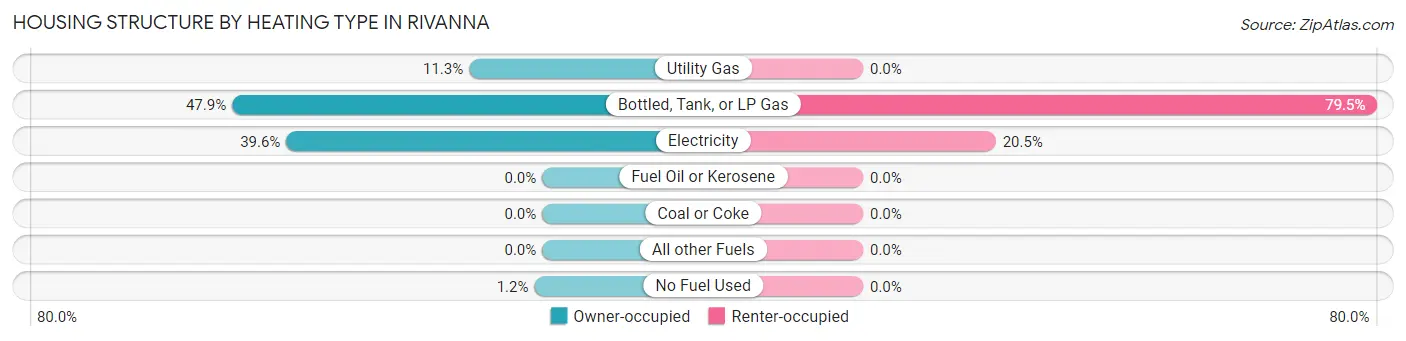
| Heating Type | Owner-occupied | Renter-occupied |
| Utility Gas | 93 (11.3%) | 0 (0.0%) |
| Bottled, Tank, or LP Gas | 395 (47.9%) | 31 (79.5%) |
| Electricity | 326 (39.6%) | 8 (20.5%) |
| Fuel Oil or Kerosene | 0 (0.0%) | 0 (0.0%) |
| Coal or Coke | 0 (0.0%) | 0 (0.0%) |
| All other Fuels | 0 (0.0%) | 0 (0.0%) |
| No Fuel Used | 10 (1.2%) | 0 (0.0%) |
| Total | 824 (100.0%) | 39 (100.0%) |
Household Vehicle Usage in Rivanna
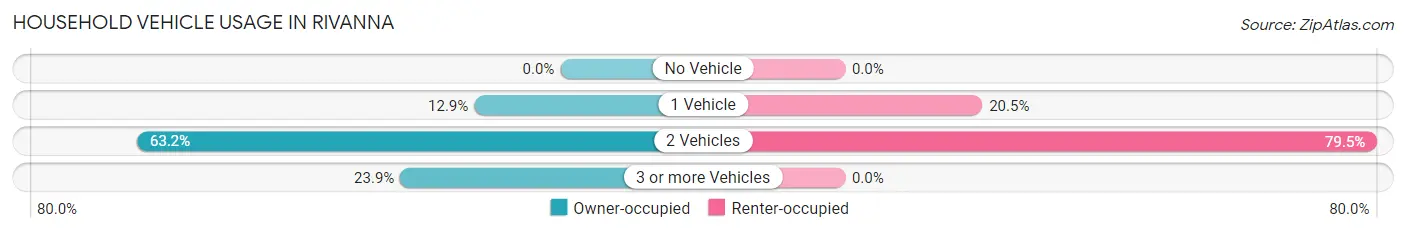
| Vehicles per Household | Owner-occupied | Renter-occupied |
| No Vehicle | 0 (0.0%) | 0 (0.0%) |
| 1 Vehicle | 106 (12.9%) | 8 (20.5%) |
| 2 Vehicles | 521 (63.2%) | 31 (79.5%) |
| 3 or more Vehicles | 197 (23.9%) | 0 (0.0%) |
| Total | 824 (100.0%) | 39 (100.0%) |
Real Estate & Mortgages in Rivanna
Real Estate and Mortgage Overview in Rivanna
| Characteristic | Without Mortgage | With Mortgage |
| Housing Units | 428 | 396 |
| Median Property Value | $808,900 | $677,600 |
| Median Household Income | $118,333 | $254 |
| Monthly Housing Costs | $946 | $197 |
| Real Estate Taxes | $6,136 | $0 |
Property Value by Mortgage Status in Rivanna
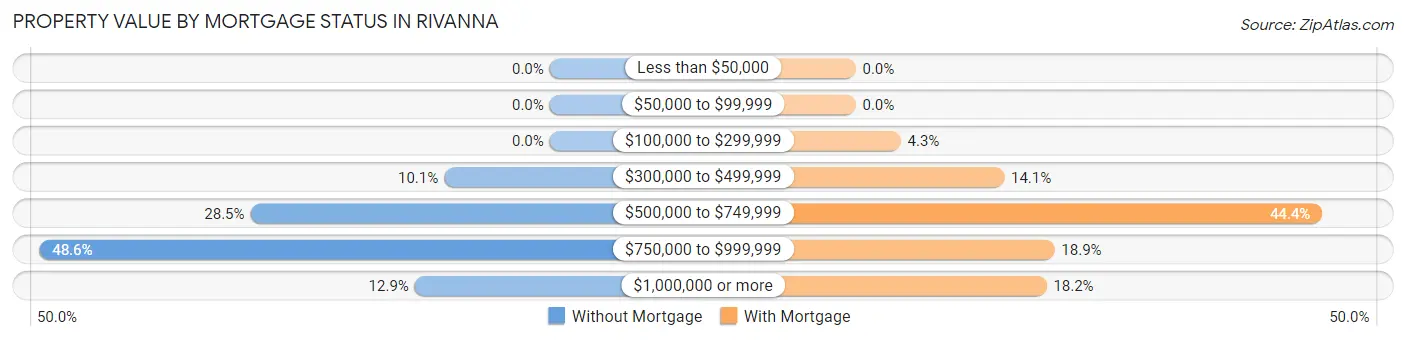
| Property Value | Without Mortgage | With Mortgage |
| Less than $50,000 | 0 (0.0%) | 0 (0.0%) |
| $50,000 to $99,999 | 0 (0.0%) | 0 (0.0%) |
| $100,000 to $299,999 | 0 (0.0%) | 17 (4.3%) |
| $300,000 to $499,999 | 43 (10.1%) | 56 (14.1%) |
| $500,000 to $749,999 | 122 (28.5%) | 176 (44.4%) |
| $750,000 to $999,999 | 208 (48.6%) | 75 (18.9%) |
| $1,000,000 or more | 55 (12.9%) | 72 (18.2%) |
| Total | 428 (100.0%) | 396 (100.0%) |
Household Income by Mortgage Status in Rivanna
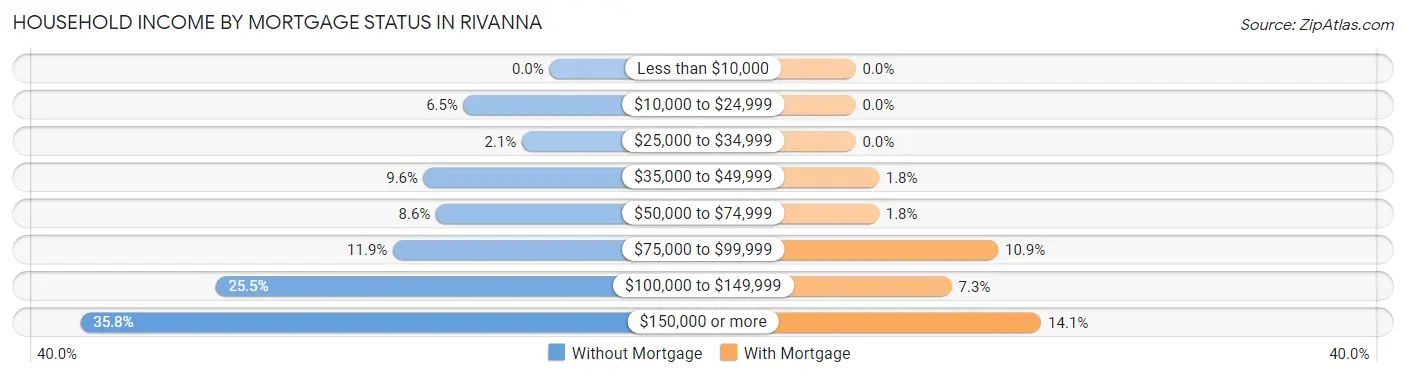
| Household Income | Without Mortgage | With Mortgage |
| Less than $10,000 | 0 (0.0%) | 0 (0.0%) |
| $10,000 to $24,999 | 28 (6.5%) | 0 (0.0%) |
| $25,000 to $34,999 | 9 (2.1%) | 0 (0.0%) |
| $35,000 to $49,999 | 41 (9.6%) | 7 (1.8%) |
| $50,000 to $74,999 | 37 (8.6%) | 7 (1.8%) |
| $75,000 to $99,999 | 51 (11.9%) | 43 (10.9%) |
| $100,000 to $149,999 | 109 (25.5%) | 29 (7.3%) |
| $150,000 or more | 153 (35.7%) | 56 (14.1%) |
| Total | 428 (100.0%) | 396 (100.0%) |
Property Value to Household Income Ratio in Rivanna
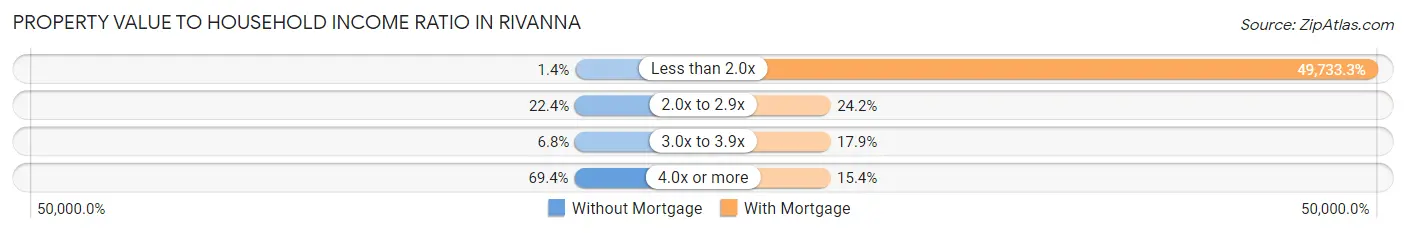
| Value-to-Income Ratio | Without Mortgage | With Mortgage |
| Less than 2.0x | 6 (1.4%) | 196,944 (49,733.3%) |
| 2.0x to 2.9x | 96 (22.4%) | 96 (24.2%) |
| 3.0x to 3.9x | 29 (6.8%) | 71 (17.9%) |
| 4.0x or more | 297 (69.4%) | 61 (15.4%) |
| Total | 428 (100.0%) | 396 (100.0%) |
Real Estate Taxes by Mortgage Status in Rivanna
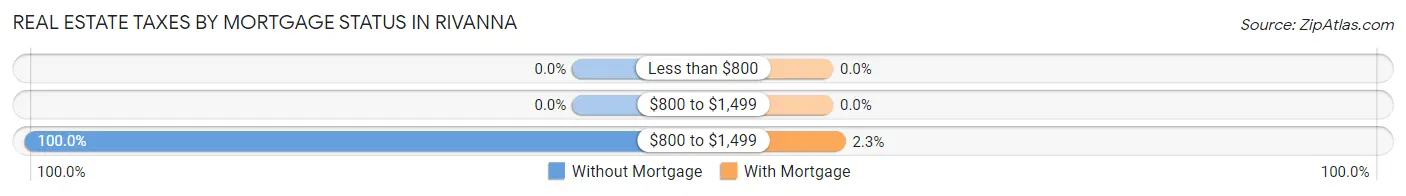
| Property Taxes | Without Mortgage | With Mortgage |
| Less than $800 | 0 (0.0%) | 0 (0.0%) |
| $800 to $1,499 | 0 (0.0%) | 0 (0.0%) |
| $800 to $1,499 | 428 (100.0%) | 9 (2.3%) |
| Total | 428 (100.0%) | 396 (100.0%) |
Health & Disability in Rivanna
Health Insurance Coverage by Age in Rivanna
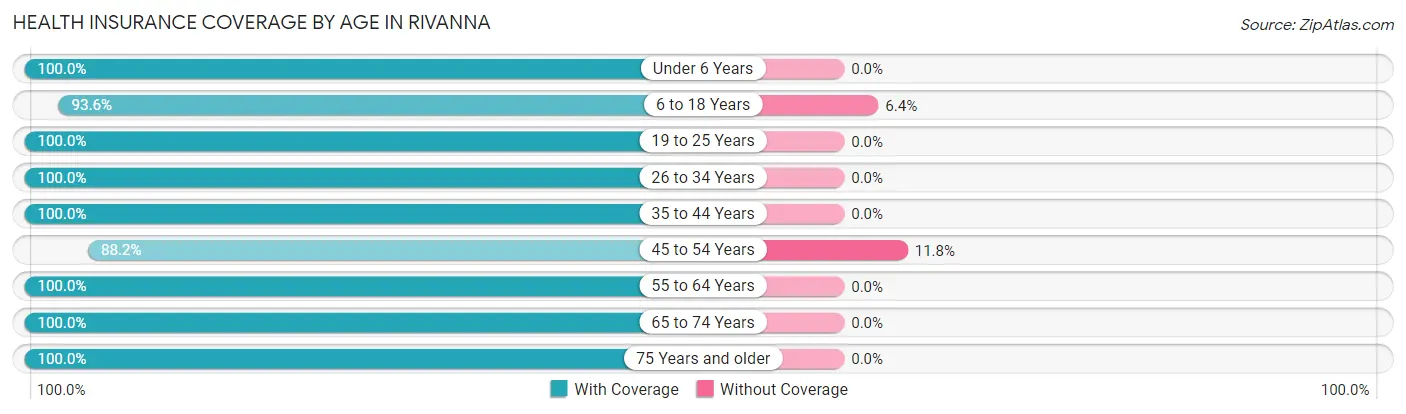
| Age Bracket | With Coverage | Without Coverage |
| Under 6 Years | 103 (100.0%) | 0 (0.0%) |
| 6 to 18 Years | 309 (93.6%) | 21 (6.4%) |
| 19 to 25 Years | 34 (100.0%) | 0 (0.0%) |
| 26 to 34 Years | 157 (100.0%) | 0 (0.0%) |
| 35 to 44 Years | 115 (100.0%) | 0 (0.0%) |
| 45 to 54 Years | 216 (88.2%) | 29 (11.8%) |
| 55 to 64 Years | 237 (100.0%) | 0 (0.0%) |
| 65 to 74 Years | 491 (100.0%) | 0 (0.0%) |
| 75 Years and older | 362 (100.0%) | 0 (0.0%) |
| Total | 2,024 (97.6%) | 50 (2.4%) |
Health Insurance Coverage by Citizenship Status in Rivanna
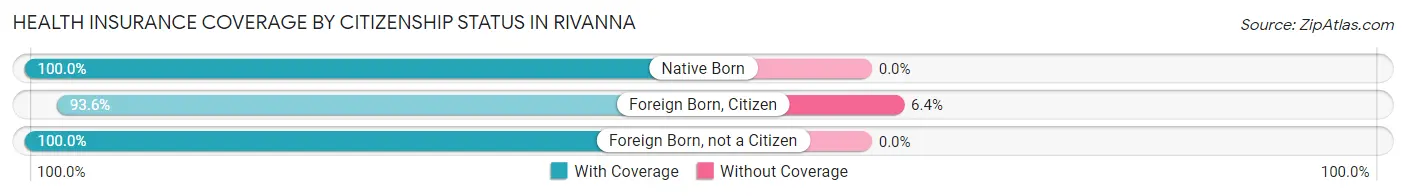
| Citizenship Status | With Coverage | Without Coverage |
| Native Born | 103 (100.0%) | 0 (0.0%) |
| Foreign Born, Citizen | 309 (93.6%) | 21 (6.4%) |
| Foreign Born, not a Citizen | 34 (100.0%) | 0 (0.0%) |
Health Insurance Coverage by Household Income in Rivanna
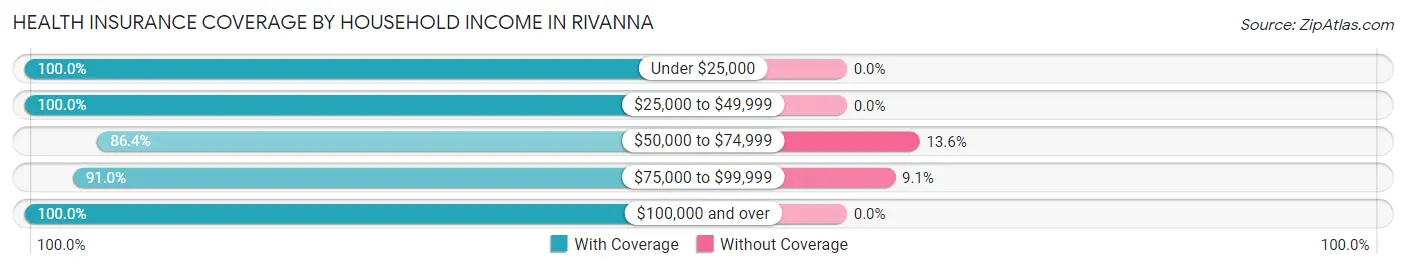
| Household Income | With Coverage | Without Coverage |
| Under $25,000 | 95 (100.0%) | 0 (0.0%) |
| $25,000 to $49,999 | 97 (100.0%) | 0 (0.0%) |
| $50,000 to $74,999 | 184 (86.4%) | 29 (13.6%) |
| $75,000 to $99,999 | 211 (90.9%) | 21 (9.0%) |
| $100,000 and over | 1,437 (100.0%) | 0 (0.0%) |
Public vs Private Health Insurance Coverage by Age in Rivanna
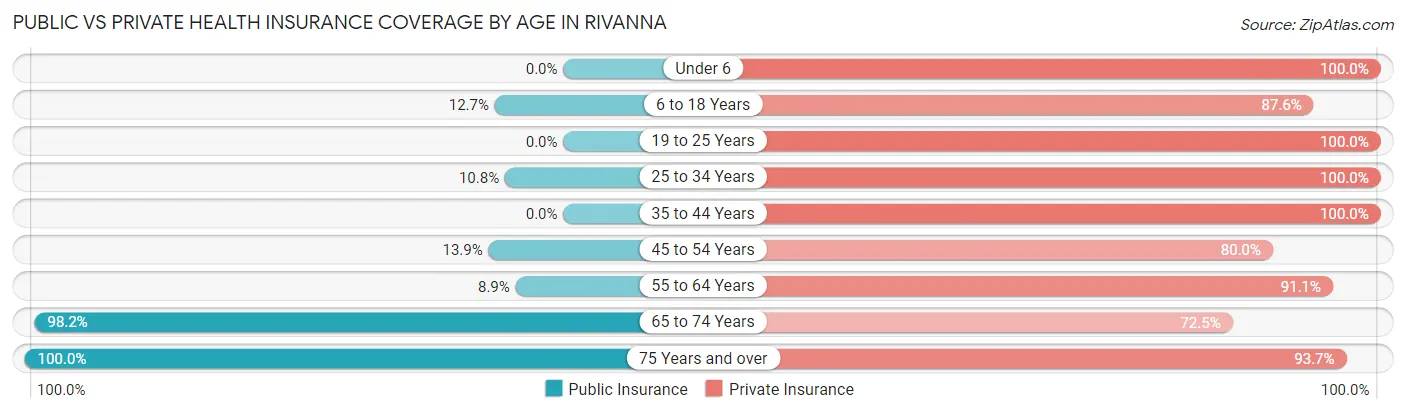
| Age Bracket | Public Insurance | Private Insurance |
| Under 6 | 0 (0.0%) | 103 (100.0%) |
| 6 to 18 Years | 42 (12.7%) | 289 (87.6%) |
| 19 to 25 Years | 0 (0.0%) | 34 (100.0%) |
| 25 to 34 Years | 17 (10.8%) | 157 (100.0%) |
| 35 to 44 Years | 0 (0.0%) | 115 (100.0%) |
| 45 to 54 Years | 34 (13.9%) | 196 (80.0%) |
| 55 to 64 Years | 21 (8.9%) | 216 (91.1%) |
| 65 to 74 Years | 482 (98.2%) | 356 (72.5%) |
| 75 Years and over | 362 (100.0%) | 339 (93.6%) |
| Total | 958 (46.2%) | 1,805 (87.0%) |
Disability Status by Sex by Age in Rivanna
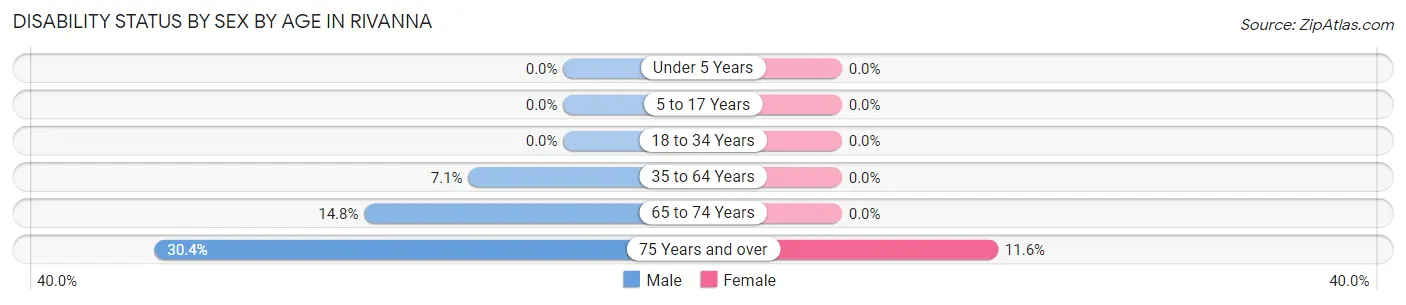
| Age Bracket | Male | Female |
| Under 5 Years | 0 (0.0%) | 0 (0.0%) |
| 5 to 17 Years | 0 (0.0%) | 0 (0.0%) |
| 18 to 34 Years | 0 (0.0%) | 0 (0.0%) |
| 35 to 64 Years | 21 (7.0%) | 0 (0.0%) |
| 65 to 74 Years | 30 (14.8%) | 0 (0.0%) |
| 75 Years and over | 68 (30.4%) | 16 (11.6%) |
Disability Class by Sex by Age in Rivanna
Disability Class: Hearing Difficulty
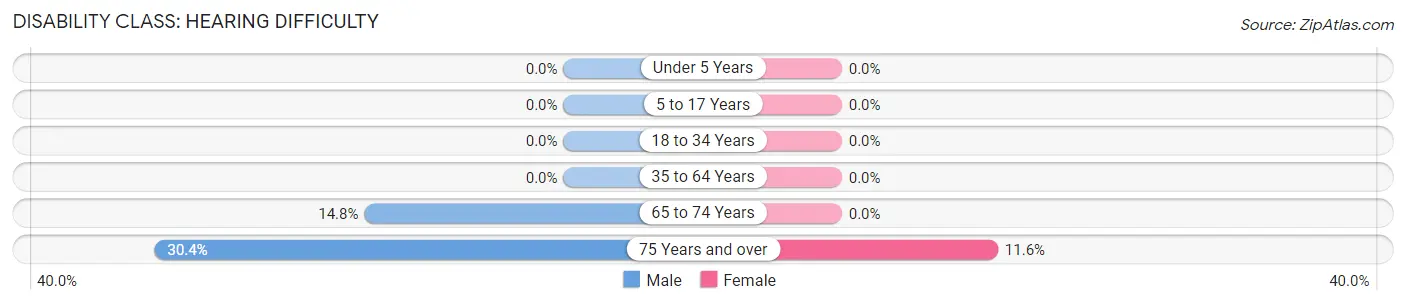
| Age Bracket | Male | Female |
| Under 5 Years | 0 (0.0%) | 0 (0.0%) |
| 5 to 17 Years | 0 (0.0%) | 0 (0.0%) |
| 18 to 34 Years | 0 (0.0%) | 0 (0.0%) |
| 35 to 64 Years | 0 (0.0%) | 0 (0.0%) |
| 65 to 74 Years | 30 (14.8%) | 0 (0.0%) |
| 75 Years and over | 68 (30.4%) | 16 (11.6%) |
Disability Class: Vision Difficulty
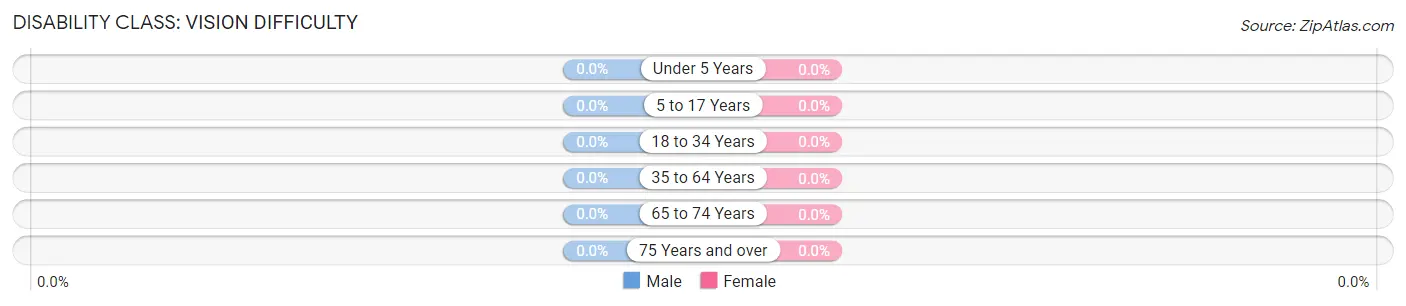
| Age Bracket | Male | Female |
| Under 5 Years | 0 (0.0%) | 0 (0.0%) |
| 5 to 17 Years | 0 (0.0%) | 0 (0.0%) |
| 18 to 34 Years | 0 (0.0%) | 0 (0.0%) |
| 35 to 64 Years | 0 (0.0%) | 0 (0.0%) |
| 65 to 74 Years | 0 (0.0%) | 0 (0.0%) |
| 75 Years and over | 0 (0.0%) | 0 (0.0%) |
Disability Class: Cognitive Difficulty
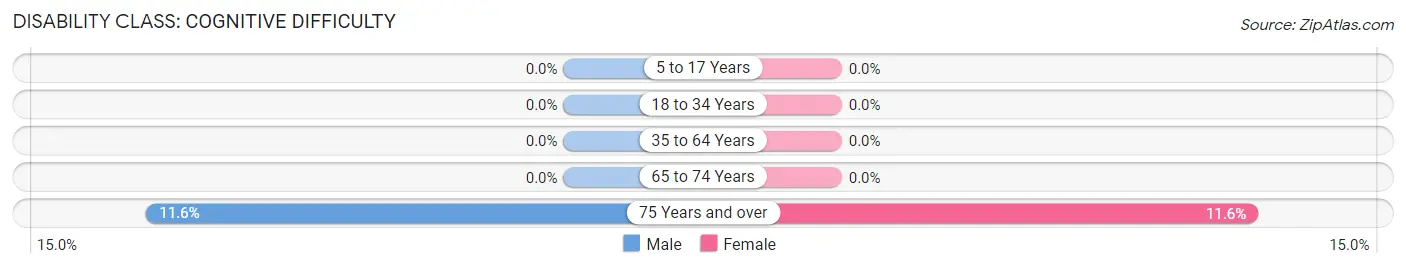
| Age Bracket | Male | Female |
| 5 to 17 Years | 0 (0.0%) | 0 (0.0%) |
| 18 to 34 Years | 0 (0.0%) | 0 (0.0%) |
| 35 to 64 Years | 0 (0.0%) | 0 (0.0%) |
| 65 to 74 Years | 0 (0.0%) | 0 (0.0%) |
| 75 Years and over | 26 (11.6%) | 16 (11.6%) |
Disability Class: Ambulatory Difficulty
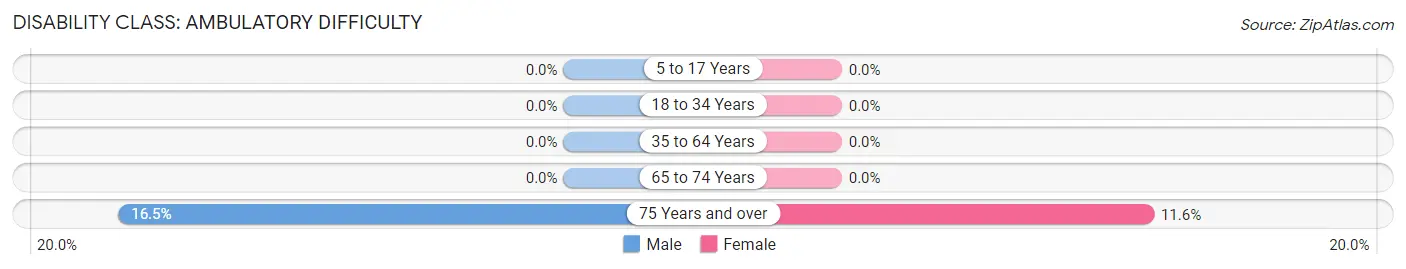
| Age Bracket | Male | Female |
| 5 to 17 Years | 0 (0.0%) | 0 (0.0%) |
| 18 to 34 Years | 0 (0.0%) | 0 (0.0%) |
| 35 to 64 Years | 0 (0.0%) | 0 (0.0%) |
| 65 to 74 Years | 0 (0.0%) | 0 (0.0%) |
| 75 Years and over | 37 (16.5%) | 16 (11.6%) |
Disability Class: Self-Care Difficulty
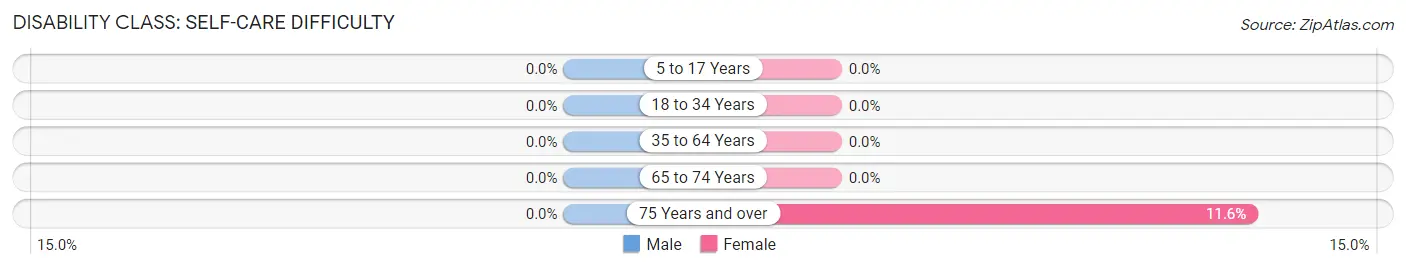
| Age Bracket | Male | Female |
| 5 to 17 Years | 0 (0.0%) | 0 (0.0%) |
| 18 to 34 Years | 0 (0.0%) | 0 (0.0%) |
| 35 to 64 Years | 0 (0.0%) | 0 (0.0%) |
| 65 to 74 Years | 0 (0.0%) | 0 (0.0%) |
| 75 Years and over | 0 (0.0%) | 16 (11.6%) |
Technology Access in Rivanna
Computing Device Access in Rivanna
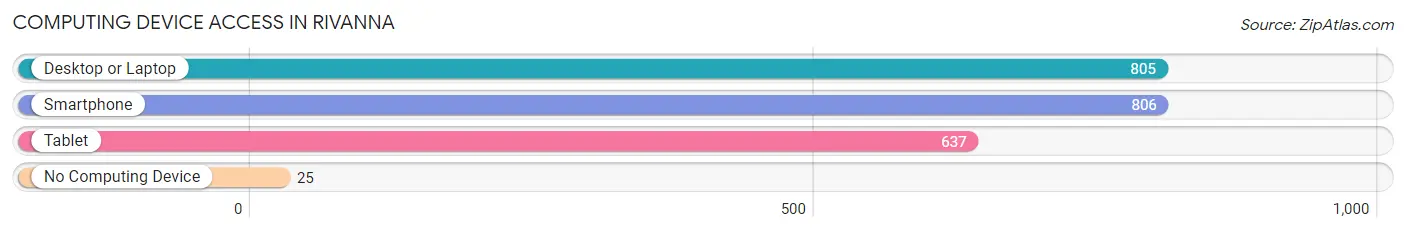
| Device Type | # Households | % Households |
| Desktop or Laptop | 805 | 93.3% |
| Smartphone | 806 | 93.4% |
| Tablet | 637 | 73.8% |
| No Computing Device | 25 | 2.9% |
| Total | 863 | 100.0% |
Internet Access in Rivanna
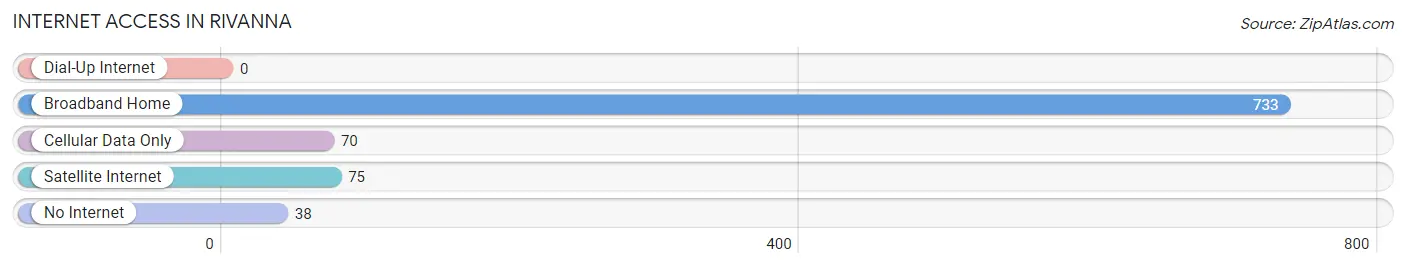
| Internet Type | # Households | % Households |
| Dial-Up Internet | 0 | 0.0% |
| Broadband Home | 733 | 84.9% |
| Cellular Data Only | 70 | 8.1% |
| Satellite Internet | 75 | 8.7% |
| No Internet | 38 | 4.4% |
| Total | 863 | 100.0% |
Rivanna Summary
Rivanna is a small unincorporated community located in Albemarle County, Virginia. It is situated on the Rivanna River, which is a tributary of the James River. The community is located approximately 10 miles north of Charlottesville and is part of the Charlottesville Metropolitan Statistical Area.
History
The Rivanna area was first settled in the late 1700s by European settlers. The area was originally known as “Rivanna”, which is derived from the Native American word for “river”. The area was primarily used for farming and the production of tobacco. In the early 1800s, the area was home to a number of mills, including a gristmill, sawmill, and a woolen mill.
In the mid-1800s, the area was home to a number of small businesses, including a blacksmith shop, a general store, and a post office. The post office was established in 1851 and was in operation until it was discontinued in 1904.
Geography
Rivanna is located in the foothills of the Blue Ridge Mountains in central Virginia. The area is characterized by rolling hills and valleys, with the Rivanna River running through the center of the community. The area is home to a number of small creeks and streams, as well as several small lakes.
The climate in Rivanna is temperate, with hot summers and mild winters. The average annual temperature is around 60 degrees Fahrenheit. The area receives an average of 45 inches of precipitation per year, with most of it falling in the form of rain.
Economy
The economy of Rivanna is largely based on agriculture. The area is home to a number of small farms, which produce a variety of crops, including corn, soybeans, wheat, and hay. The area is also home to a number of small businesses, including a general store, a gas station, and a few restaurants.
Demographics
As of the 2010 census, the population of Rivanna was 1,093. The population is primarily white (94.3%), with a small percentage of African Americans (2.7%) and Hispanics (2.0%). The median household income in Rivanna is $50,000, and the median home value is $200,000. The area is served by the Albemarle County Public Schools system.
Common Questions
What is Per Capita Income in Rivanna?
Per Capita income in Rivanna is $89,424.
What is the Median Family Income in Rivanna?
Median Family Income in Rivanna is $178,971.
What is the Median Household income in Rivanna?
Median Household Income in Rivanna is $153,125.
What is Income or Wage Gap in Rivanna?
Income or Wage Gap in Rivanna is 56.4%.
Women in Rivanna earn 43.6 cents for every dollar earned by a man.
What is Inequality or Gini Index in Rivanna?
Inequality or Gini Index in Rivanna is 0.44.
What is the Total Population of Rivanna?
Total Population of Rivanna is 2,088.
What is the Total Male Population of Rivanna?
Total Male Population of Rivanna is 955.
What is the Total Female Population of Rivanna?
Total Female Population of Rivanna is 1,133.
What is the Ratio of Males per 100 Females in Rivanna?
There are 84.29 Males per 100 Females in Rivanna.
What is the Ratio of Females per 100 Males in Rivanna?
There are 118.64 Females per 100 Males in Rivanna.
What is the Median Population Age in Rivanna?
Median Population Age in Rivanna is 56.8 Years.
What is the Average Family Size in Rivanna
Average Family Size in Rivanna is 2.7 People.
What is the Average Household Size in Rivanna
Average Household Size in Rivanna is 2.4 People.
How Large is the Labor Force in Rivanna?
There are 685 People in the Labor Forcein in Rivanna.
What is the Percentage of People in the Labor Force in Rivanna?
38.9% of People are in the Labor Force in Rivanna.
What is the Unemployment Rate in Rivanna?
Unemployment Rate in Rivanna is 5.7%.