Dranesville, VA Map & Demographics
Dranesville Map
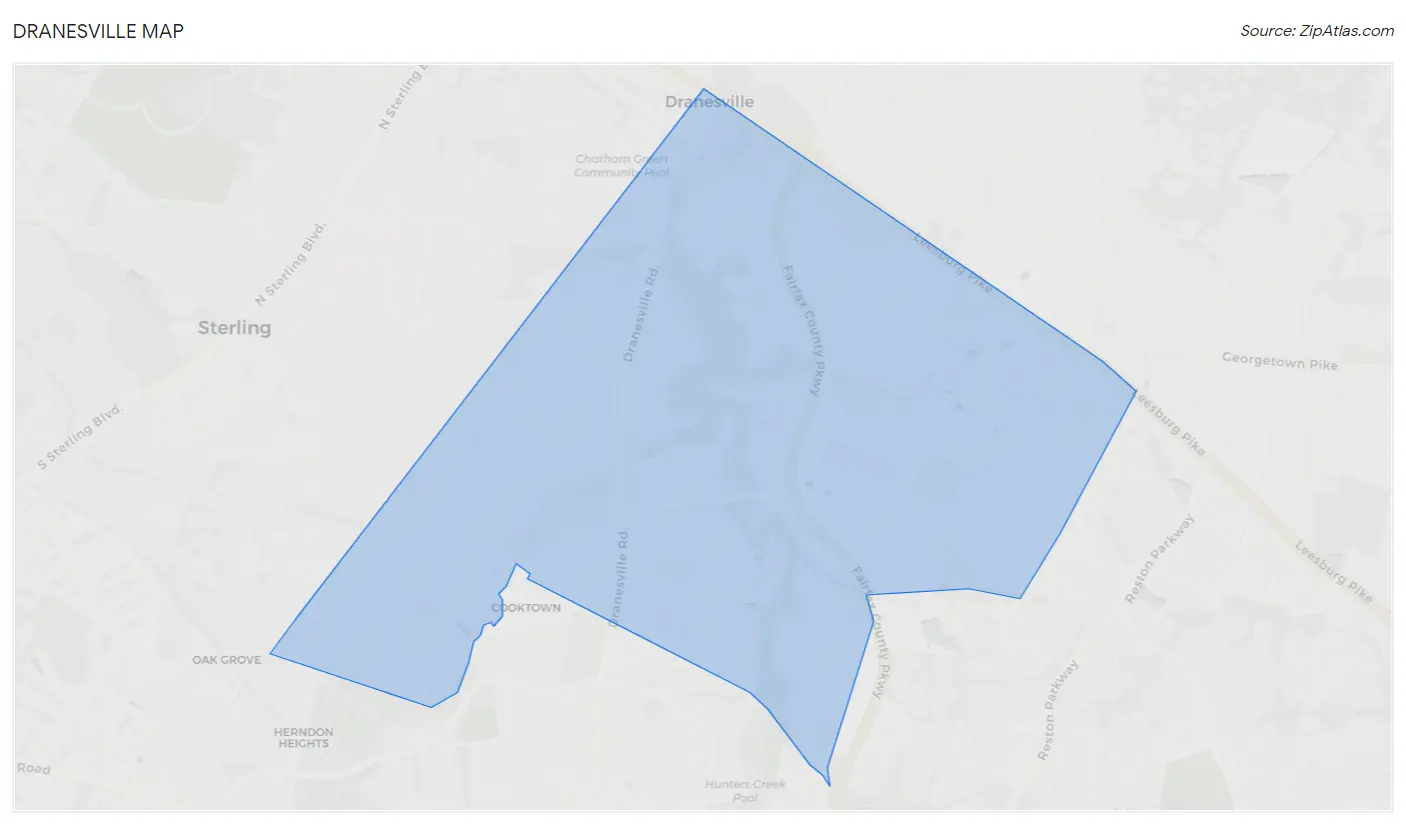
Dranesville Overview
$74,325
PER CAPITA INCOME
$217,019
AVG FAMILY INCOME
$206,344
AVG HOUSEHOLD INCOME
38.9%
WAGE / INCOME GAP [ % ]
61.1¢/ $1
WAGE / INCOME GAP [ $ ]
0.32
INEQUALITY / GINI INDEX
12,154
TOTAL POPULATION
6,504
MALE POPULATION
5,650
FEMALE POPULATION
115.12
MALES / 100 FEMALES
86.87
FEMALES / 100 MALES
40.0
MEDIAN AGE
3.4
AVG FAMILY SIZE
3.2
AVG HOUSEHOLD SIZE
6,735
LABOR FORCE [ PEOPLE ]
70.0%
PERCENT IN LABOR FORCE
3.4%
UNEMPLOYMENT RATE
Income in Dranesville
Income Overview in Dranesville
Per Capita Income in Dranesville is $74,325, while median incomes of families and households are $217,019 and $206,344 respectively.
| Characteristic | Number | Measure |
| Per Capita Income | 12,154 | $74,325 |
| Median Family Income | 3,278 | $217,019 |
| Mean Family Income | 3,278 | $245,875 |
| Median Household Income | 3,849 | $206,344 |
| Mean Household Income | 3,849 | $231,944 |
| Income Deficit | 3,278 | $0 |
| Wage / Income Gap (%) | 12,154 | 38.90% |
| Wage / Income Gap ($) | 12,154 | 61.10¢ per $1 |
| Gini / Inequality Index | 12,154 | 0.32 |
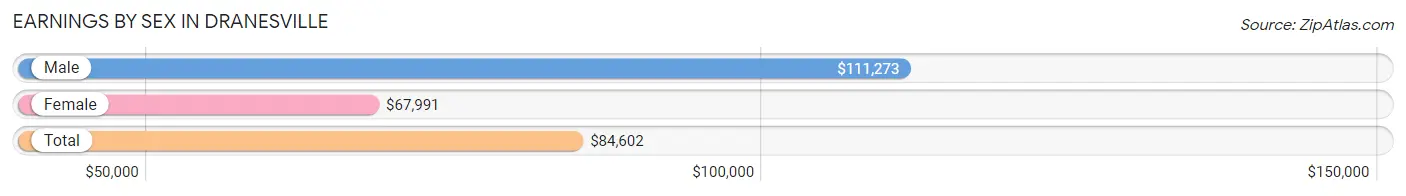
Earnings by Sex in Dranesville
Average Earnings in Dranesville are $84,602, $111,273 for men and $67,991 for women, a difference of 38.9%.
| Sex | Number | Average Earnings |
| Male | 4,101 (57.6%) | $111,273 |
| Female | 3,019 (42.4%) | $67,991 |
| Total | 7,120 (100.0%) | $84,602 |
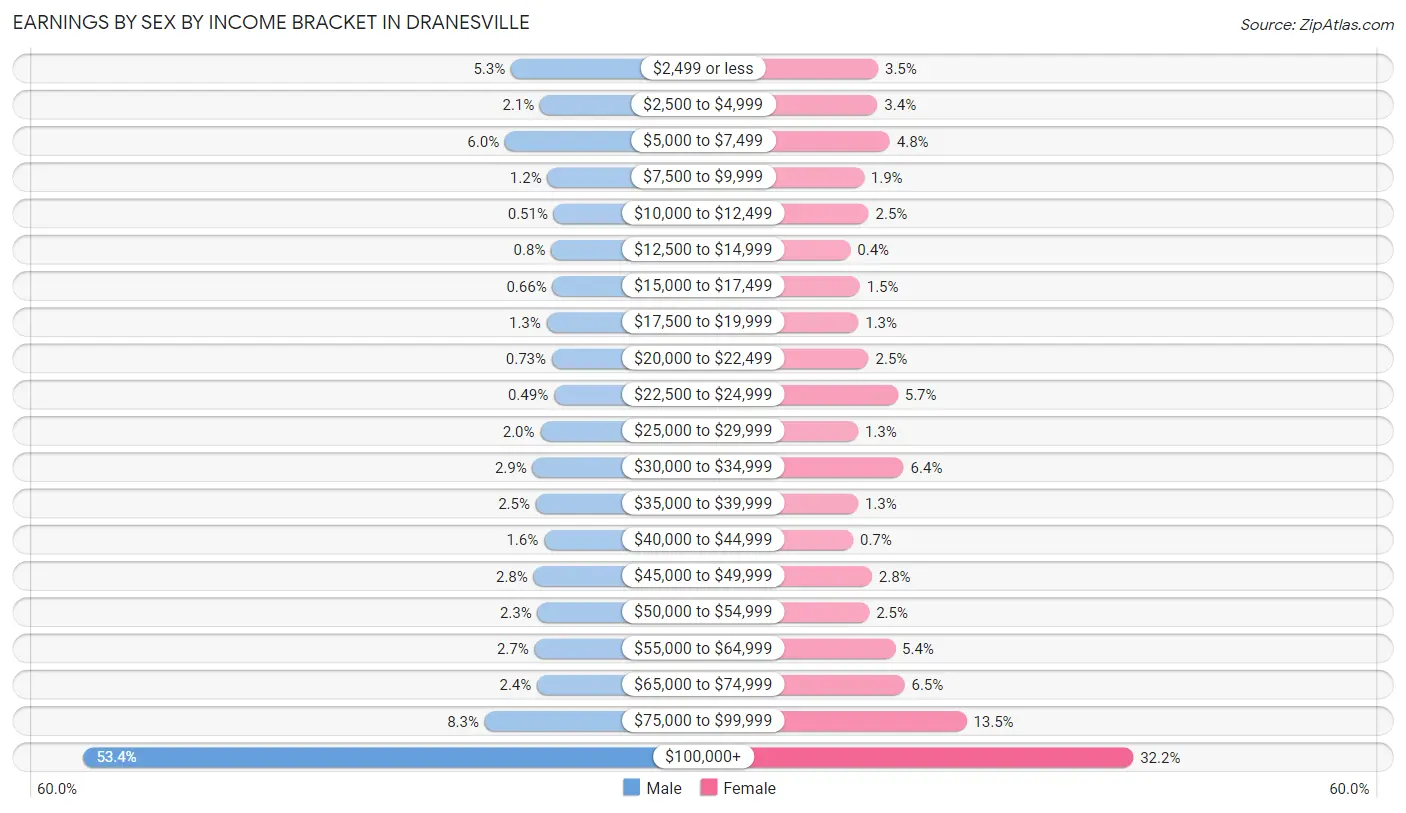
Earnings by Sex by Income Bracket in Dranesville
The most common earnings brackets in Dranesville are $100,000+ for men (2,189 | 53.4%) and $100,000+ for women (972 | 32.2%).
| Income | Male | Female |
| $2,499 or less | 218 (5.3%) | 106 (3.5%) |
| $2,500 to $4,999 | 84 (2.1%) | 104 (3.4%) |
| $5,000 to $7,499 | 246 (6.0%) | 146 (4.8%) |
| $7,500 to $9,999 | 50 (1.2%) | 58 (1.9%) |
| $10,000 to $12,499 | 21 (0.5%) | 74 (2.5%) |
| $12,500 to $14,999 | 33 (0.8%) | 12 (0.4%) |
| $15,000 to $17,499 | 27 (0.7%) | 44 (1.5%) |
| $17,500 to $19,999 | 54 (1.3%) | 39 (1.3%) |
| $20,000 to $22,499 | 30 (0.7%) | 74 (2.5%) |
| $22,500 to $24,999 | 20 (0.5%) | 173 (5.7%) |
| $25,000 to $29,999 | 83 (2.0%) | 38 (1.3%) |
| $30,000 to $34,999 | 119 (2.9%) | 193 (6.4%) |
| $35,000 to $39,999 | 104 (2.5%) | 38 (1.3%) |
| $40,000 to $44,999 | 66 (1.6%) | 21 (0.7%) |
| $45,000 to $49,999 | 114 (2.8%) | 85 (2.8%) |
| $50,000 to $54,999 | 96 (2.3%) | 76 (2.5%) |
| $55,000 to $64,999 | 110 (2.7%) | 164 (5.4%) |
| $65,000 to $74,999 | 98 (2.4%) | 196 (6.5%) |
| $75,000 to $99,999 | 339 (8.3%) | 406 (13.5%) |
| $100,000+ | 2,189 (53.4%) | 972 (32.2%) |
| Total | 4,101 (100.0%) | 3,019 (100.0%) |
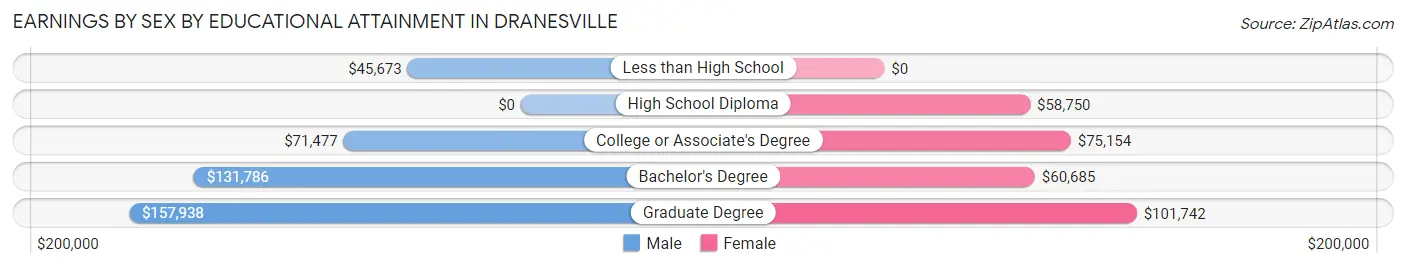
Earnings by Sex by Educational Attainment in Dranesville
Average earnings in Dranesville are $125,147 for men and $76,653 for women, a difference of 38.8%. Men with an educational attainment of graduate degree enjoy the highest average annual earnings of $157,938, while those with less than high school education earn the least with $45,673. Women with an educational attainment of graduate degree earn the most with the average annual earnings of $101,742, while those with high school diploma education have the smallest earnings of $58,750.
| Educational Attainment | Male Income | Female Income |
| Less than High School | $45,673 | $0 |
| High School Diploma | - | - |
| College or Associate's Degree | $71,477 | $75,154 |
| Bachelor's Degree | $131,786 | $60,685 |
| Graduate Degree | $157,938 | $101,742 |
| Total | $125,147 | $76,653 |
Family Income in Dranesville
Family Income Brackets in Dranesville
According to the Dranesville family income data, there are 1,855 families falling into the $200,000+ income range, which is the most common income bracket and makes up 56.6% of all families.
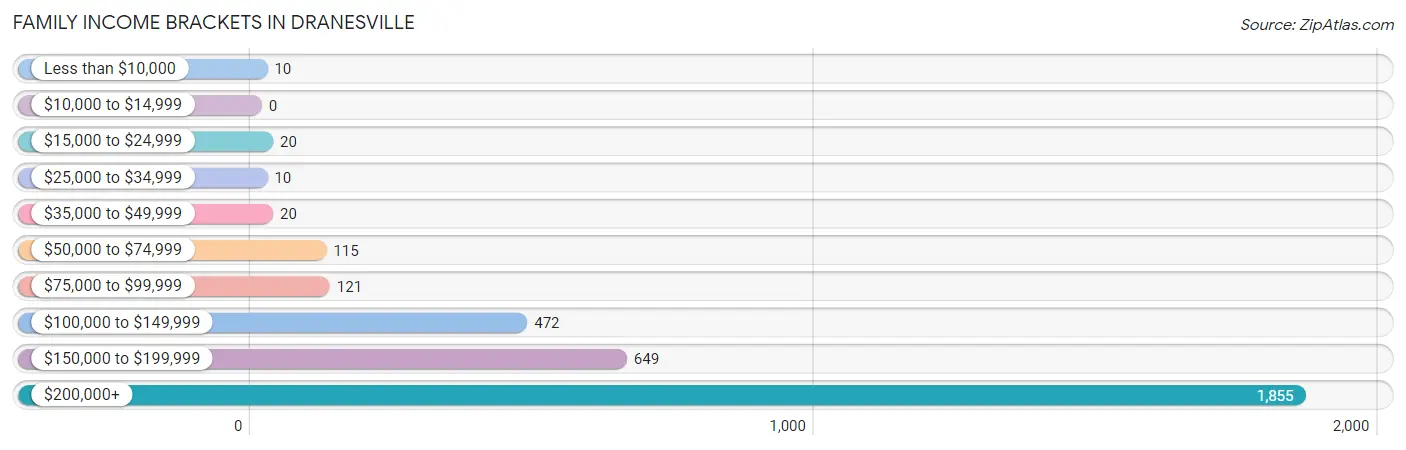
| Income Bracket | # Families | % Families |
| Less than $10,000 | 10 | 0.3% |
| $10,000 to $14,999 | 0 | 0.0% |
| $15,000 to $24,999 | 20 | 0.6% |
| $25,000 to $34,999 | 10 | 0.3% |
| $35,000 to $49,999 | 20 | 0.6% |
| $50,000 to $74,999 | 115 | 3.5% |
| $75,000 to $99,999 | 121 | 3.7% |
| $100,000 to $149,999 | 472 | 14.4% |
| $150,000 to $199,999 | 649 | 19.8% |
| $200,000+ | 1,855 | 56.6% |
Family Income by Famaliy Size in Dranesville
4-person families (660 | 20.1%) account for the highest median family income in Dranesville with $250,001 per family, while 2-person families (1,204 | 36.7%) have the highest median income of $98,318 per family member.
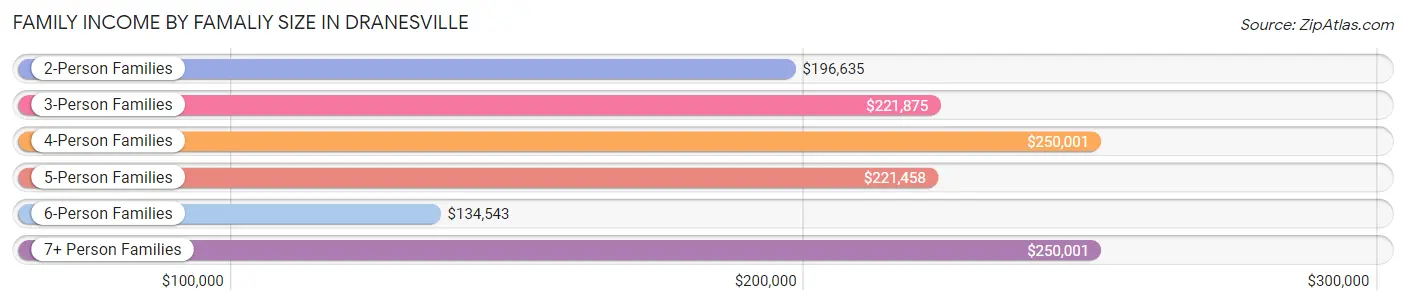
| Income Bracket | # Families | Median Income |
| 2-Person Families | 1,204 (36.7%) | $196,635 |
| 3-Person Families | 942 (28.7%) | $221,875 |
| 4-Person Families | 660 (20.1%) | $250,001 |
| 5-Person Families | 205 (6.2%) | $221,458 |
| 6-Person Families | 188 (5.7%) | $134,543 |
| 7+ Person Families | 79 (2.4%) | $250,001 |
| Total | 3,278 (100.0%) | $217,019 |
Family Income by Number of Earners in Dranesville
The median family income in Dranesville is $217,019, with families comprising 3+ earners (496) having the highest median family income of $250,001, while families with 1 earner (744) have the lowest median family income of $180,385, accounting for 15.1% and 22.7% of families, respectively.
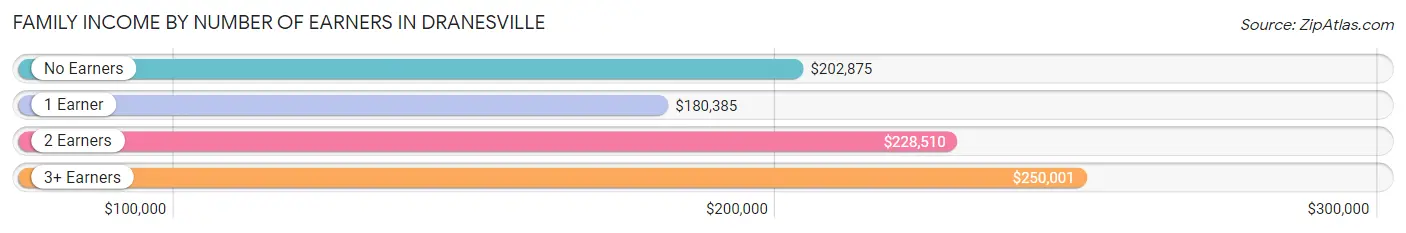
| Number of Earners | # Families | Median Income |
| No Earners | 277 (8.5%) | $202,875 |
| 1 Earner | 744 (22.7%) | $180,385 |
| 2 Earners | 1,761 (53.7%) | $228,510 |
| 3+ Earners | 496 (15.1%) | $250,001 |
| Total | 3,278 (100.0%) | $217,019 |
Household Income in Dranesville
Household Income Brackets in Dranesville
With 2,005 households falling in the category, the $200,000+ income range is the most frequent in Dranesville, accounting for 52.1% of all households. In contrast, only 12 households (0.3%) fall into the $10,000 to $14,999 income bracket, making it the least populous group.
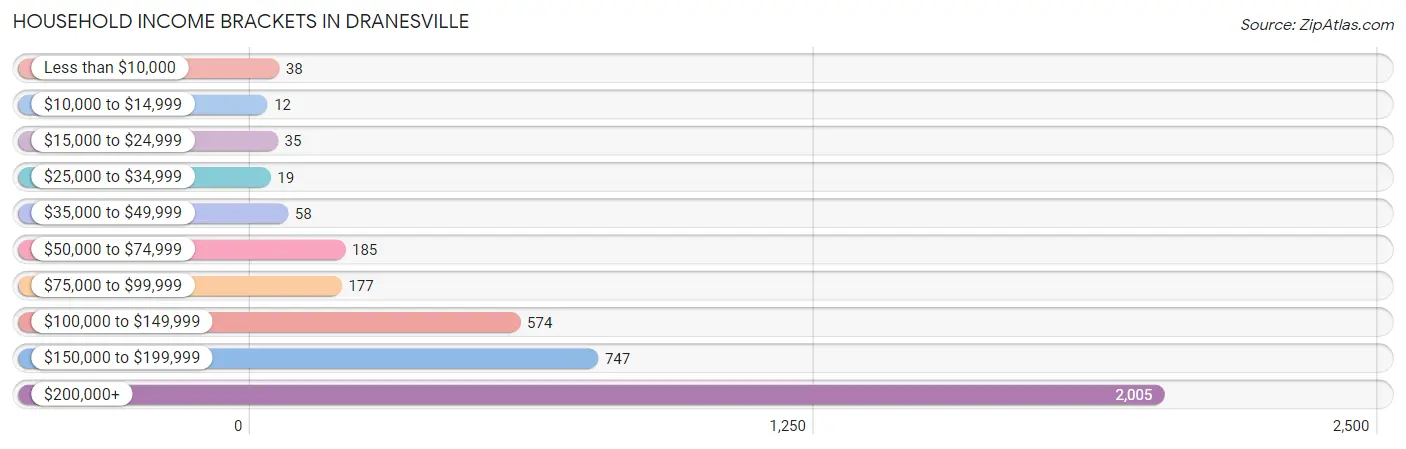
| Income Bracket | # Households | % Households |
| Less than $10,000 | 38 | 1.0% |
| $10,000 to $14,999 | 12 | 0.3% |
| $15,000 to $24,999 | 35 | 0.9% |
| $25,000 to $34,999 | 19 | 0.5% |
| $35,000 to $49,999 | 58 | 1.5% |
| $50,000 to $74,999 | 185 | 4.8% |
| $75,000 to $99,999 | 177 | 4.6% |
| $100,000 to $149,999 | 574 | 14.9% |
| $150,000 to $199,999 | 747 | 19.4% |
| $200,000+ | 2,005 | 52.1% |
Household Income by Householder Age in Dranesville
The median household income in Dranesville is $206,344, with the highest median household income of $243,456 found in the 45 to 64 years age bracket for the primary householder. A total of 1,795 households (46.6%) fall into this category.
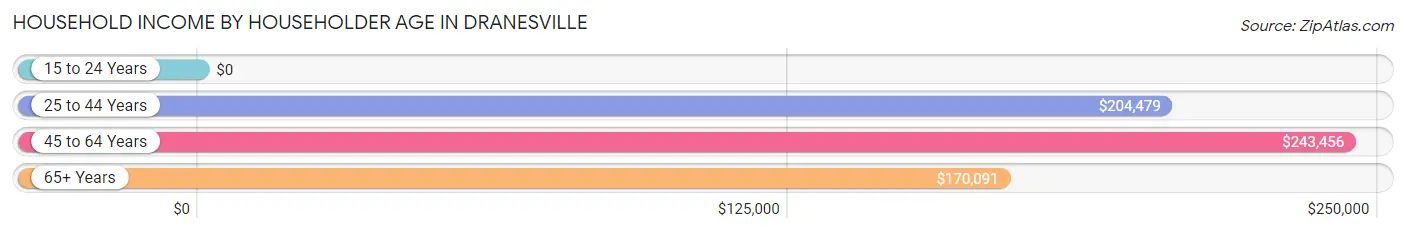
| Income Bracket | # Households | Median Income |
| 15 to 24 Years | 0 (0.0%) | $0 |
| 25 to 44 Years | 1,084 (28.2%) | $204,479 |
| 45 to 64 Years | 1,795 (46.6%) | $243,456 |
| 65+ Years | 970 (25.2%) | $170,091 |
| Total | 3,849 (100.0%) | $206,344 |
Poverty in Dranesville
Income Below Poverty by Sex and Age in Dranesville
With 3.3% poverty level for males and 2.8% for females among the residents of Dranesville, 25 to 34 year old males and 75 year old and over females are the most vulnerable to poverty, with 64 males (8.8%) and 31 females (9.2%) in their respective age groups living below the poverty level.
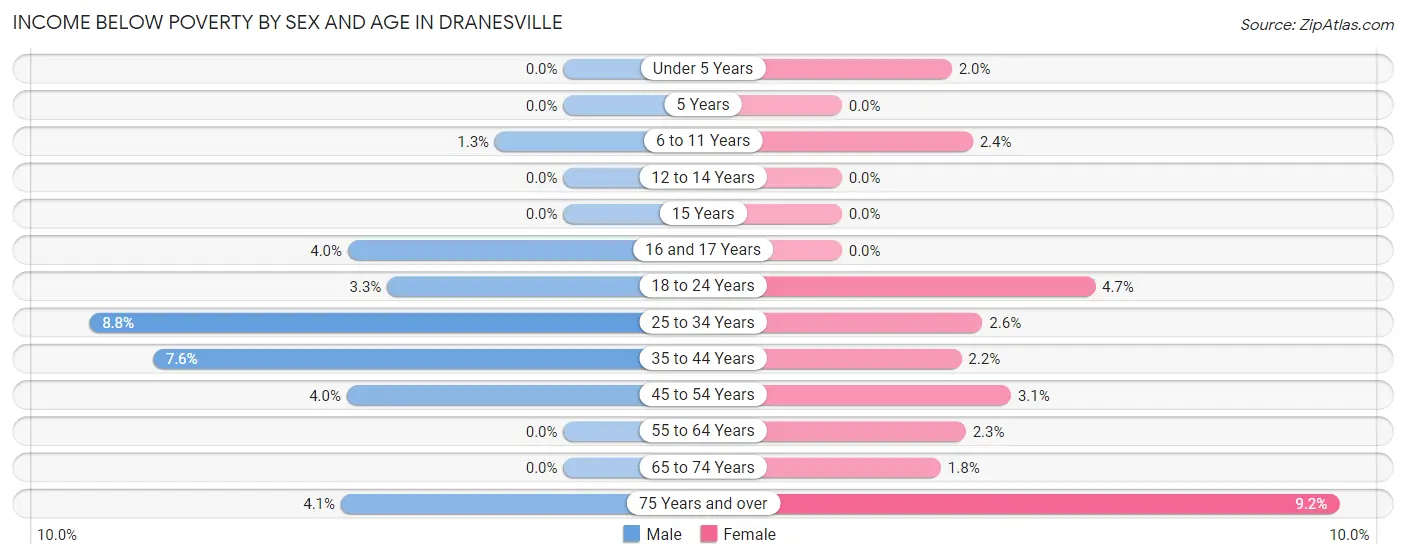
| Age Bracket | Male | Female |
| Under 5 Years | 0 (0.0%) | 10 (2.0%) |
| 5 Years | 0 (0.0%) | 0 (0.0%) |
| 6 to 11 Years | 9 (1.3%) | 9 (2.4%) |
| 12 to 14 Years | 0 (0.0%) | 0 (0.0%) |
| 15 Years | 0 (0.0%) | 0 (0.0%) |
| 16 and 17 Years | 9 (4.0%) | 0 (0.0%) |
| 18 to 24 Years | 21 (3.3%) | 19 (4.7%) |
| 25 to 34 Years | 64 (8.8%) | 11 (2.6%) |
| 35 to 44 Years | 66 (7.6%) | 18 (2.2%) |
| 45 to 54 Years | 36 (4.0%) | 25 (3.1%) |
| 55 to 64 Years | 0 (0.0%) | 24 (2.3%) |
| 65 to 74 Years | 0 (0.0%) | 10 (1.8%) |
| 75 Years and over | 10 (4.1%) | 31 (9.2%) |
| Total | 215 (3.3%) | 157 (2.8%) |
Income Above Poverty by Sex and Age in Dranesville
According to the poverty statistics in Dranesville, males aged under 5 years and females aged 5 years are the age groups that are most secure financially, with 100.0% of males and 100.0% of females in these age groups living above the poverty line.
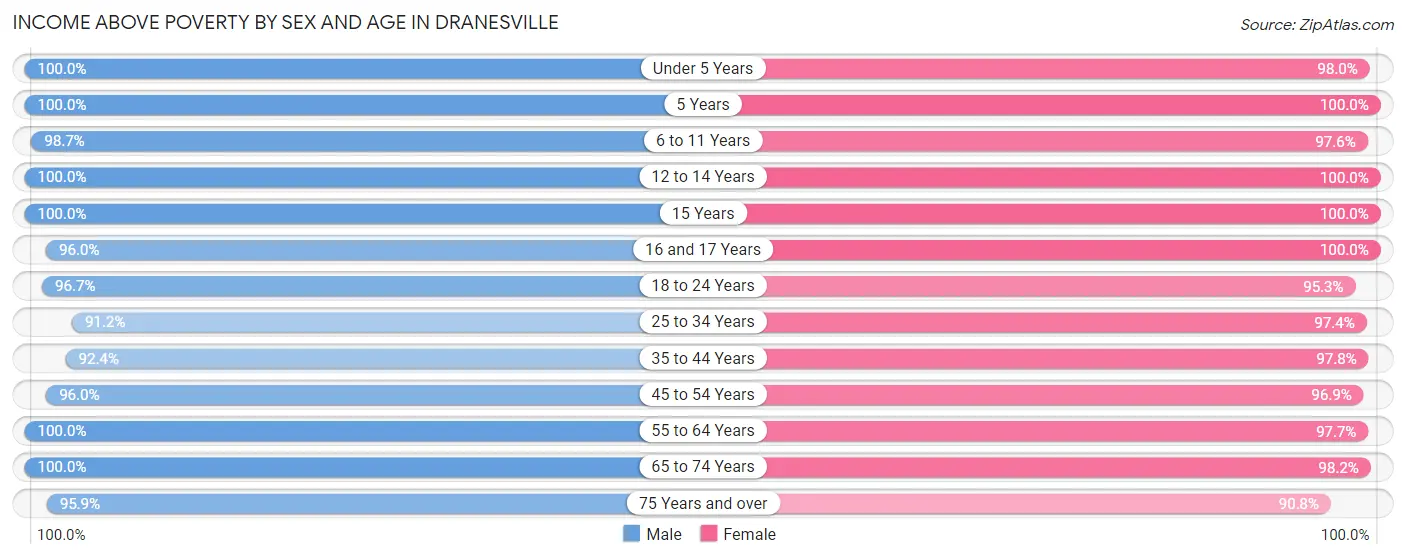
| Age Bracket | Male | Female |
| Under 5 Years | 270 (100.0%) | 481 (98.0%) |
| 5 Years | 23 (100.0%) | 46 (100.0%) |
| 6 to 11 Years | 699 (98.7%) | 361 (97.6%) |
| 12 to 14 Years | 275 (100.0%) | 181 (100.0%) |
| 15 Years | 96 (100.0%) | 59 (100.0%) |
| 16 and 17 Years | 216 (96.0%) | 151 (100.0%) |
| 18 to 24 Years | 621 (96.7%) | 385 (95.3%) |
| 25 to 34 Years | 663 (91.2%) | 410 (97.4%) |
| 35 to 44 Years | 800 (92.4%) | 792 (97.8%) |
| 45 to 54 Years | 859 (96.0%) | 770 (96.9%) |
| 55 to 64 Years | 843 (100.0%) | 1,018 (97.7%) |
| 65 to 74 Years | 679 (100.0%) | 534 (98.2%) |
| 75 Years and over | 232 (95.9%) | 305 (90.8%) |
| Total | 6,276 (96.7%) | 5,493 (97.2%) |
Income Below Poverty Among Married-Couple Families in Dranesville
The poverty statistics for married-couple families in Dranesville show that 0.7% or 20 of the total 2,965 families live below the poverty line. Families with 3 or 4 children have the highest poverty rate of 2.5%, comprising of 9 families. On the other hand, families with 1 or 2 children have the lowest poverty rate of 0.0%, which includes 0 families.
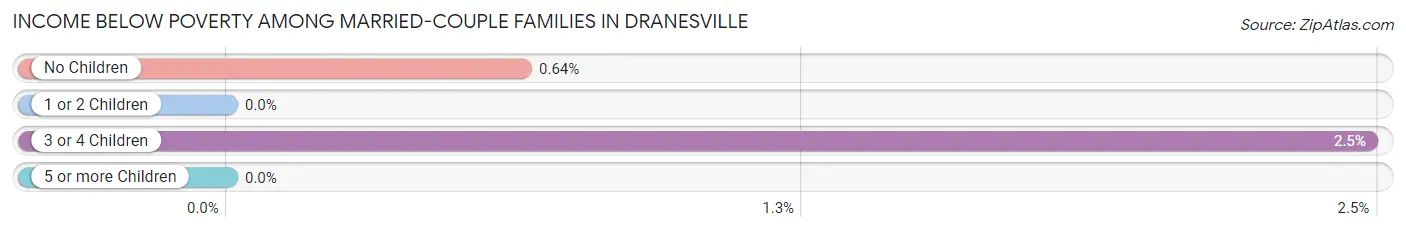
| Children | Above Poverty | Below Poverty |
| No Children | 1,706 (99.4%) | 11 (0.6%) |
| 1 or 2 Children | 873 (100.0%) | 0 (0.0%) |
| 3 or 4 Children | 354 (97.5%) | 9 (2.5%) |
| 5 or more Children | 12 (100.0%) | 0 (0.0%) |
| Total | 2,945 (99.3%) | 20 (0.7%) |
Income Below Poverty Among Single-Parent Households in Dranesville
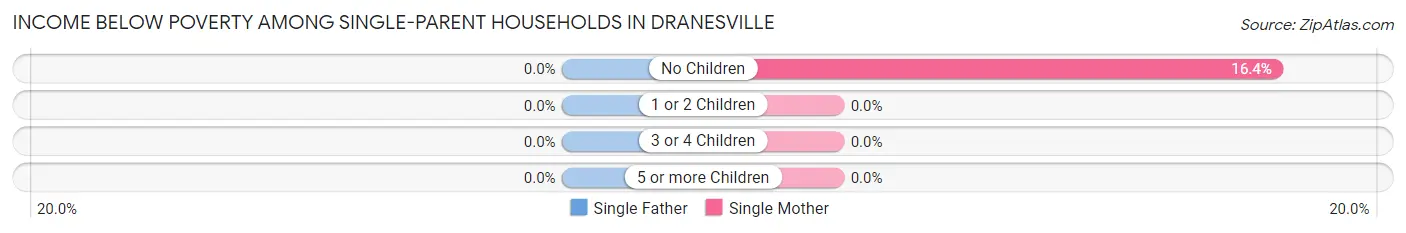
| Children | Single Father | Single Mother |
| No Children | 0 (0.0%) | 10 (16.4%) |
| 1 or 2 Children | 0 (0.0%) | 0 (0.0%) |
| 3 or 4 Children | 0 (0.0%) | 0 (0.0%) |
| 5 or more Children | 0 (0.0%) | 0 (0.0%) |
| Total | 0 (0.0%) | 10 (7.0%) |
Income Below Poverty Among Married-Couple vs Single-Parent Households in Dranesville
The poverty data for Dranesville shows that 20 of the married-couple family households (0.7%) and 10 of the single-parent households (3.2%) are living below the poverty level. Within the married-couple family households, those with 3 or 4 children have the highest poverty rate, with 9 households (2.5%) falling below the poverty line. Among the single-parent households, those with no children have the highest poverty rate, with 10 household (8.1%) living below poverty.
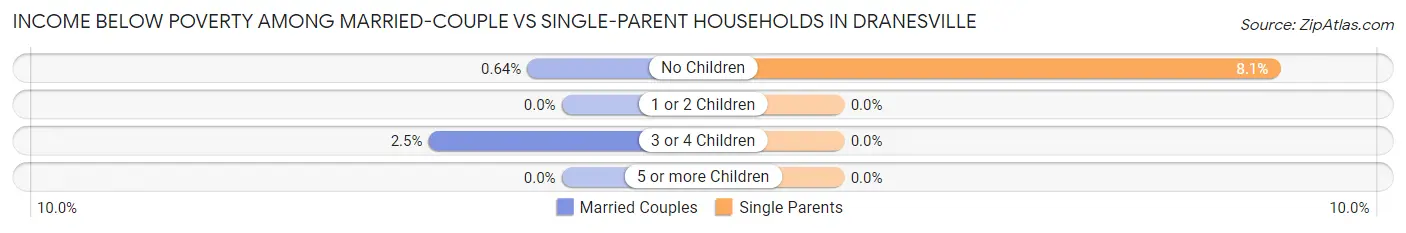
| Children | Married-Couple Families | Single-Parent Households |
| No Children | 11 (0.6%) | 10 (8.1%) |
| 1 or 2 Children | 0 (0.0%) | 0 (0.0%) |
| 3 or 4 Children | 9 (2.5%) | 0 (0.0%) |
| 5 or more Children | 0 (0.0%) | 0 (0.0%) |
| Total | 20 (0.7%) | 10 (3.2%) |
Race in Dranesville
The most populous races in Dranesville are White / Caucasian (8,980 | 73.9%), Asian (1,572 | 12.9%), and Hispanic or Latino (849 | 7.0%).
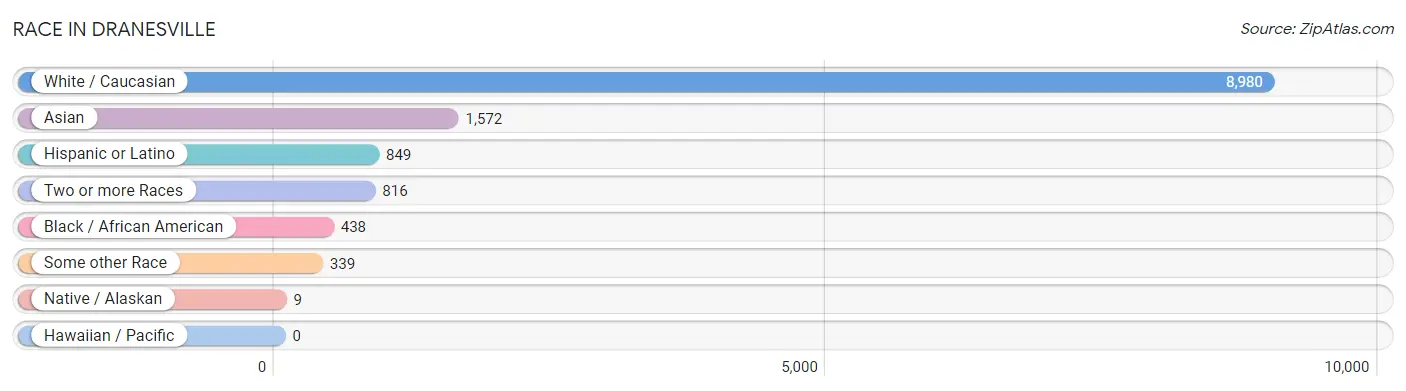
| Race | # Population | % Population |
| Asian | 1,572 | 12.9% |
| Black / African American | 438 | 3.6% |
| Hawaiian / Pacific | 0 | 0.0% |
| Hispanic or Latino | 849 | 7.0% |
| Native / Alaskan | 9 | 0.1% |
| White / Caucasian | 8,980 | 73.9% |
| Two or more Races | 816 | 6.7% |
| Some other Race | 339 | 2.8% |
| Total | 12,154 | 100.0% |
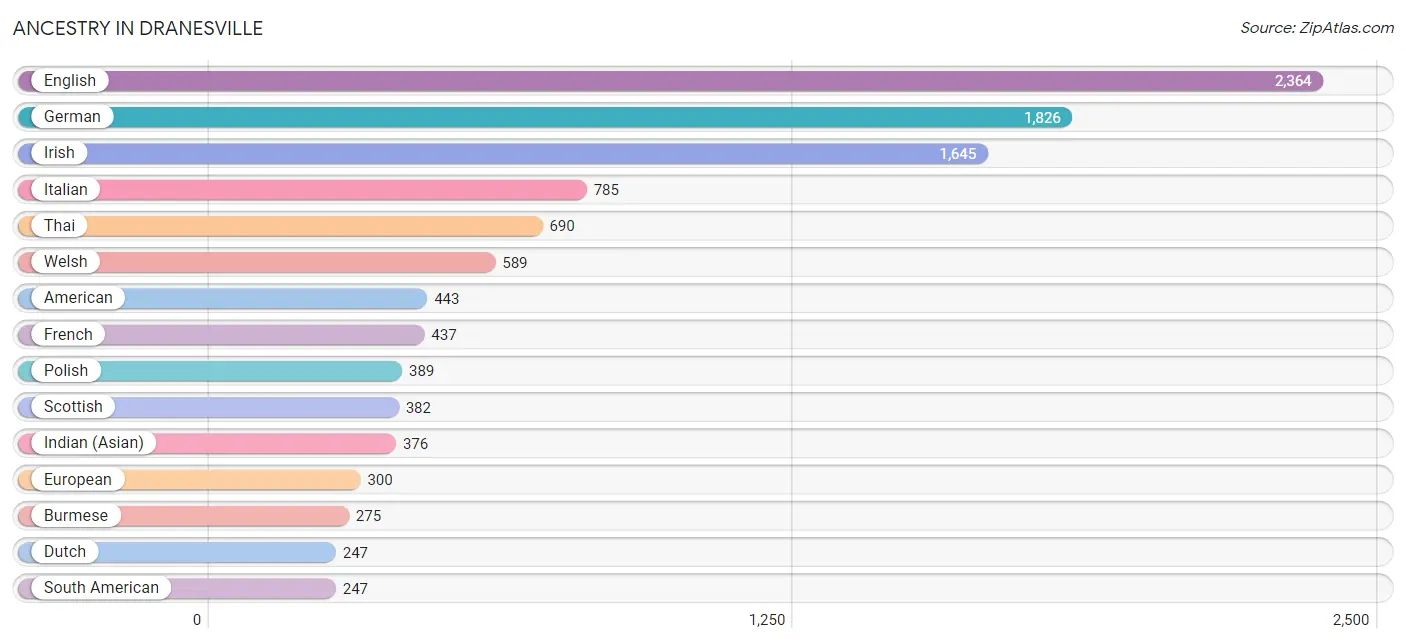
Ancestry in Dranesville
The most populous ancestries reported in Dranesville are English (2,364 | 19.5%), German (1,826 | 15.0%), Irish (1,645 | 13.5%), Italian (785 | 6.5%), and Thai (690 | 5.7%), together accounting for 60.1% of all Dranesville residents.
| Ancestry | # Population | % Population |
| Afghan | 54 | 0.4% |
| African | 54 | 0.4% |
| Albanian | 7 | 0.1% |
| American | 443 | 3.6% |
| Arab | 176 | 1.5% |
| Austrian | 41 | 0.3% |
| Bhutanese | 94 | 0.8% |
| Bolivian | 49 | 0.4% |
| British | 84 | 0.7% |
| Burmese | 275 | 2.3% |
| Central American | 174 | 1.4% |
| Central American Indian | 9 | 0.1% |
| Cherokee | 114 | 0.9% |
| Chilean | 24 | 0.2% |
| Choctaw | 58 | 0.5% |
| Colombian | 69 | 0.6% |
| Cuban | 9 | 0.1% |
| Czech | 40 | 0.3% |
| Danish | 26 | 0.2% |
| Dominican | 7 | 0.1% |
| Dutch | 247 | 2.0% |
| Eastern European | 33 | 0.3% |
| Ecuadorian | 11 | 0.1% |
| English | 2,364 | 19.5% |
| Estonian | 12 | 0.1% |
| Ethiopian | 60 | 0.5% |
| European | 300 | 2.5% |
| Finnish | 40 | 0.3% |
| French | 437 | 3.6% |
| French Canadian | 39 | 0.3% |
| German | 1,826 | 15.0% |
| Greek | 25 | 0.2% |
| Guatemalan | 43 | 0.4% |
| Haitian | 18 | 0.2% |
| Hungarian | 69 | 0.6% |
| Indian (Asian) | 376 | 3.1% |
| Iranian | 144 | 1.2% |
| Iraqi | 35 | 0.3% |
| Irish | 1,645 | 13.5% |
| Israeli | 9 | 0.1% |
| Italian | 785 | 6.5% |
| Jamaican | 12 | 0.1% |
| Japanese | 68 | 0.6% |
| Jordanian | 22 | 0.2% |
| Korean | 42 | 0.4% |
| Laotian | 7 | 0.1% |
| Latvian | 10 | 0.1% |
| Lebanese | 43 | 0.4% |
| Lithuanian | 86 | 0.7% |
| Mexican | 73 | 0.6% |
| Native Hawaiian | 54 | 0.4% |
| Nicaraguan | 39 | 0.3% |
| Northern European | 62 | 0.5% |
| Norwegian | 47 | 0.4% |
| Pakistani | 15 | 0.1% |
| Palestinian | 3 | 0.0% |
| Panamanian | 24 | 0.2% |
| Pennsylvania German | 7 | 0.1% |
| Peruvian | 70 | 0.6% |
| Polish | 389 | 3.2% |
| Portuguese | 80 | 0.7% |
| Puerto Rican | 60 | 0.5% |
| Romanian | 13 | 0.1% |
| Russian | 145 | 1.2% |
| Salvadoran | 68 | 0.6% |
| Scandinavian | 63 | 0.5% |
| Scotch-Irish | 193 | 1.6% |
| Scottish | 382 | 3.1% |
| Seminole | 59 | 0.5% |
| Slovak | 13 | 0.1% |
| Slovene | 6 | 0.1% |
| South American | 247 | 2.0% |
| South American Indian | 42 | 0.4% |
| Spaniard | 9 | 0.1% |
| Spanish | 171 | 1.4% |
| Sri Lankan | 71 | 0.6% |
| Subsaharan African | 124 | 1.0% |
| Swedish | 171 | 1.4% |
| Swiss | 71 | 0.6% |
| Thai | 690 | 5.7% |
| Turkish | 6 | 0.1% |
| Ukrainian | 7 | 0.1% |
| Vietnamese | 25 | 0.2% |
| Welsh | 589 | 4.9% |
| West Indian | 10 | 0.1% | View All 85 Rows |
Immigrants in Dranesville
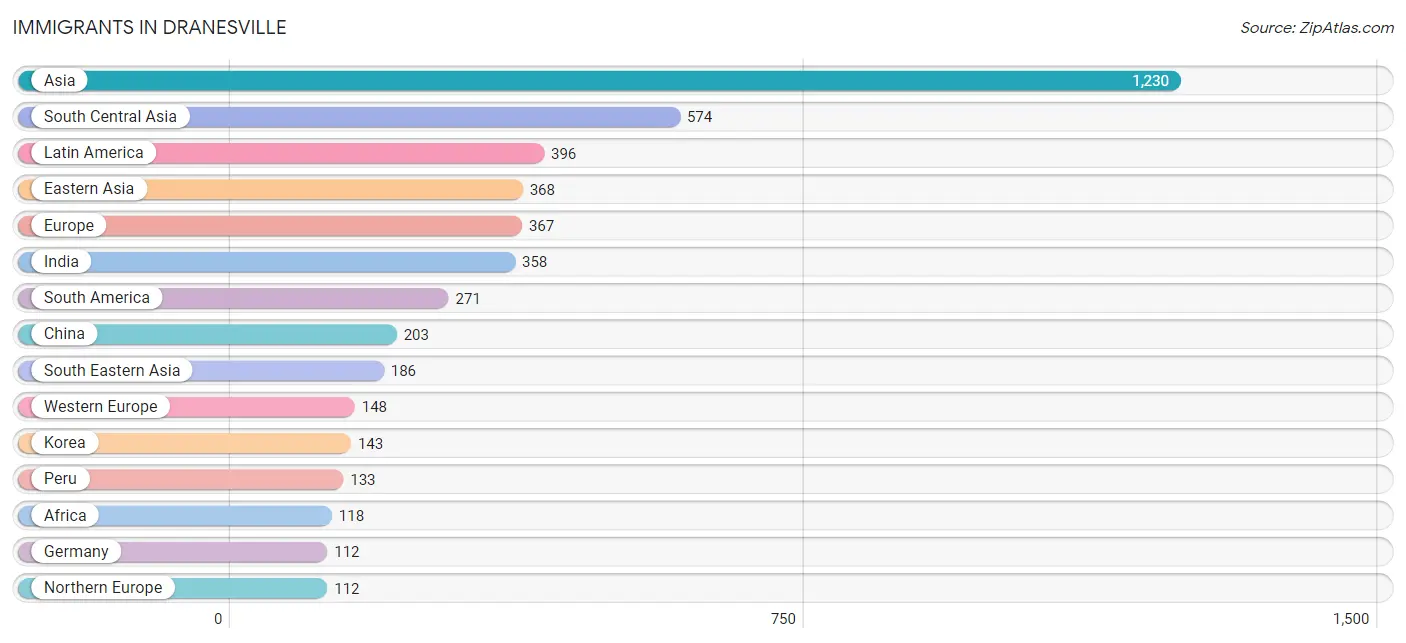
The most numerous immigrant groups reported in Dranesville came from Asia (1,230 | 10.1%), South Central Asia (574 | 4.7%), Latin America (396 | 3.3%), Eastern Asia (368 | 3.0%), and Europe (367 | 3.0%), together accounting for 24.1% of all Dranesville residents.
| Immigration Origin | # Population | % Population |
| Afghanistan | 17 | 0.1% |
| Africa | 118 | 1.0% |
| Asia | 1,230 | 10.1% |
| Austria | 9 | 0.1% |
| Bangladesh | 15 | 0.1% |
| Bolivia | 49 | 0.4% |
| Cambodia | 46 | 0.4% |
| Canada | 11 | 0.1% |
| Caribbean | 36 | 0.3% |
| Central America | 89 | 0.7% |
| China | 203 | 1.7% |
| Colombia | 47 | 0.4% |
| Eastern Africa | 88 | 0.7% |
| Eastern Asia | 368 | 3.0% |
| Eastern Europe | 88 | 0.7% |
| Ecuador | 11 | 0.1% |
| El Salvador | 13 | 0.1% |
| England | 29 | 0.2% |
| Ethiopia | 60 | 0.5% |
| Europe | 367 | 3.0% |
| France | 27 | 0.2% |
| Germany | 112 | 0.9% |
| Guatemala | 65 | 0.5% |
| Haiti | 18 | 0.2% |
| Hong Kong | 11 | 0.1% |
| Hungary | 6 | 0.1% |
| India | 358 | 2.9% |
| Indonesia | 22 | 0.2% |
| Iran | 65 | 0.5% |
| Iraq | 35 | 0.3% |
| Ireland | 14 | 0.1% |
| Israel | 9 | 0.1% |
| Italy | 10 | 0.1% |
| Jamaica | 18 | 0.2% |
| Japan | 22 | 0.2% |
| Jordan | 13 | 0.1% |
| Kazakhstan | 7 | 0.1% |
| Korea | 143 | 1.2% |
| Kuwait | 15 | 0.1% |
| Latin America | 396 | 3.3% |
| Latvia | 10 | 0.1% |
| Lebanon | 20 | 0.2% |
| Mexico | 11 | 0.1% |
| Nepal | 22 | 0.2% |
| Northern Europe | 112 | 0.9% |
| Pakistan | 22 | 0.2% |
| Peru | 133 | 1.1% |
| Philippines | 33 | 0.3% |
| Russia | 65 | 0.5% |
| South Africa | 22 | 0.2% |
| South America | 271 | 2.2% |
| South Central Asia | 574 | 4.7% |
| South Eastern Asia | 186 | 1.5% |
| Southern Europe | 19 | 0.2% |
| Spain | 9 | 0.1% |
| Sri Lanka | 68 | 0.6% |
| Sweden | 12 | 0.1% |
| Taiwan | 16 | 0.1% |
| Thailand | 15 | 0.1% |
| Turkey | 6 | 0.1% |
| Ukraine | 7 | 0.1% |
| Venezuela | 31 | 0.3% |
| Vietnam | 70 | 0.6% |
| Western Africa | 8 | 0.1% |
| Western Asia | 102 | 0.8% |
| Western Europe | 148 | 1.2% |
| Zimbabwe | 9 | 0.1% | View All 67 Rows |
Sex and Age in Dranesville
Sex and Age in Dranesville
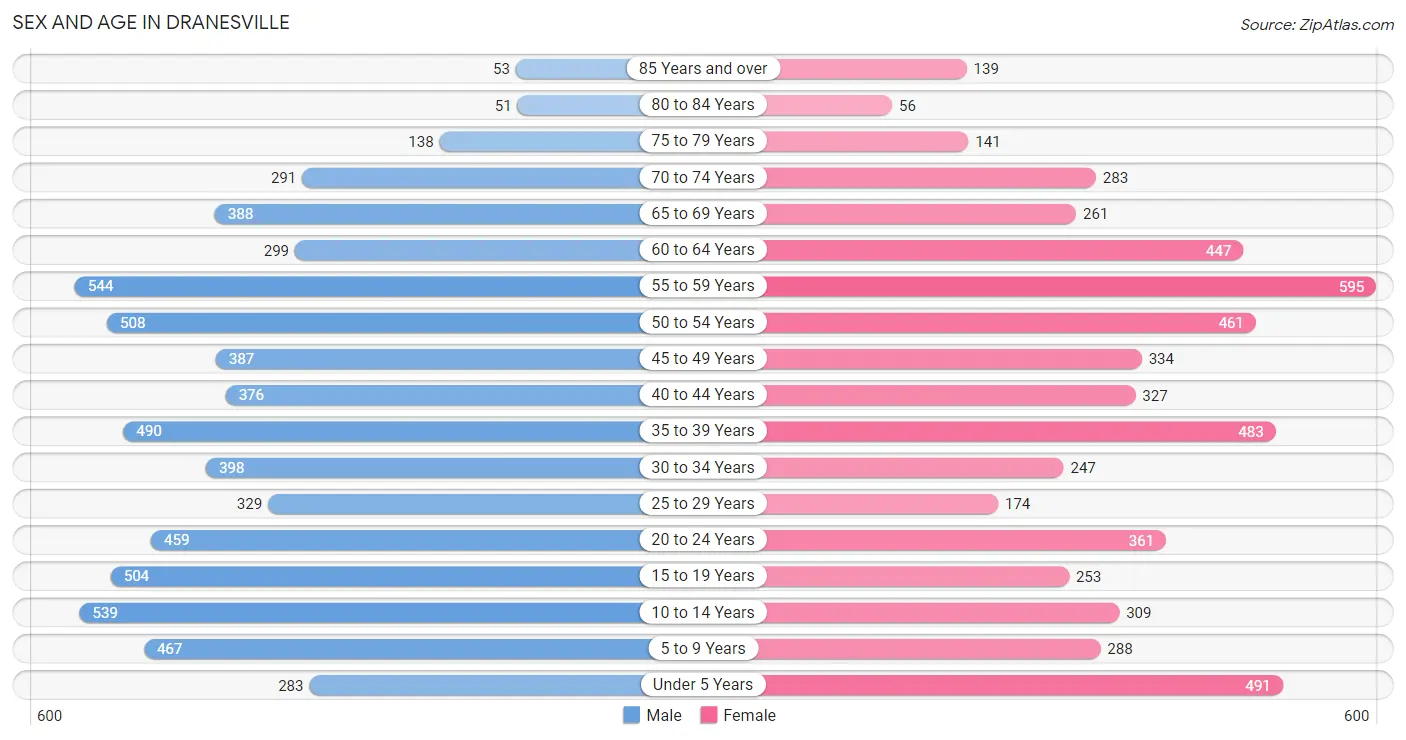
The most populous age groups in Dranesville are 55 to 59 Years (544 | 8.4%) for men and 55 to 59 Years (595 | 10.5%) for women.
| Age Bracket | Male | Female |
| Under 5 Years | 283 (4.3%) | 491 (8.7%) |
| 5 to 9 Years | 467 (7.2%) | 288 (5.1%) |
| 10 to 14 Years | 539 (8.3%) | 309 (5.5%) |
| 15 to 19 Years | 504 (7.7%) | 253 (4.5%) |
| 20 to 24 Years | 459 (7.1%) | 361 (6.4%) |
| 25 to 29 Years | 329 (5.1%) | 174 (3.1%) |
| 30 to 34 Years | 398 (6.1%) | 247 (4.4%) |
| 35 to 39 Years | 490 (7.5%) | 483 (8.6%) |
| 40 to 44 Years | 376 (5.8%) | 327 (5.8%) |
| 45 to 49 Years | 387 (5.9%) | 334 (5.9%) |
| 50 to 54 Years | 508 (7.8%) | 461 (8.2%) |
| 55 to 59 Years | 544 (8.4%) | 595 (10.5%) |
| 60 to 64 Years | 299 (4.6%) | 447 (7.9%) |
| 65 to 69 Years | 388 (6.0%) | 261 (4.6%) |
| 70 to 74 Years | 291 (4.5%) | 283 (5.0%) |
| 75 to 79 Years | 138 (2.1%) | 141 (2.5%) |
| 80 to 84 Years | 51 (0.8%) | 56 (1.0%) |
| 85 Years and over | 53 (0.8%) | 139 (2.5%) |
| Total | 6,504 (100.0%) | 5,650 (100.0%) |
Families and Households in Dranesville
Median Family Size in Dranesville
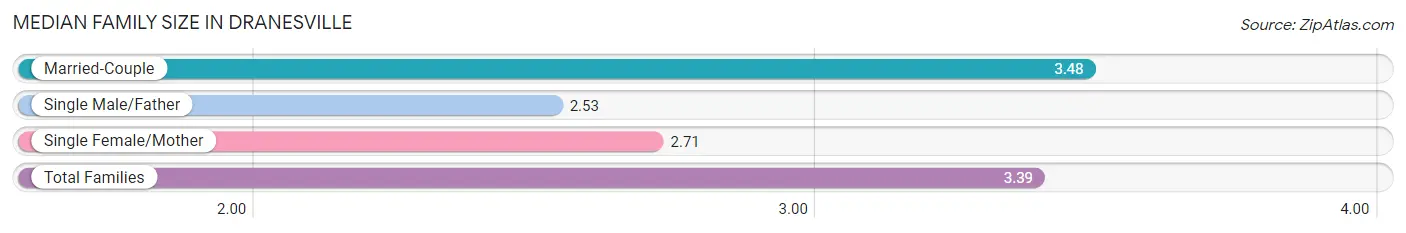
The median family size in Dranesville is 3.39 persons per family, with married-couple families (2,965 | 90.4%) accounting for the largest median family size of 3.48 persons per family. On the other hand, single male/father families (171 | 5.2%) represent the smallest median family size with 2.53 persons per family.
| Family Type | # Families | Family Size |
| Married-Couple | 2,965 (90.4%) | 3.48 |
| Single Male/Father | 171 (5.2%) | 2.53 |
| Single Female/Mother | 142 (4.3%) | 2.71 |
| Total Families | 3,278 (100.0%) | 3.39 |
Median Household Size in Dranesville
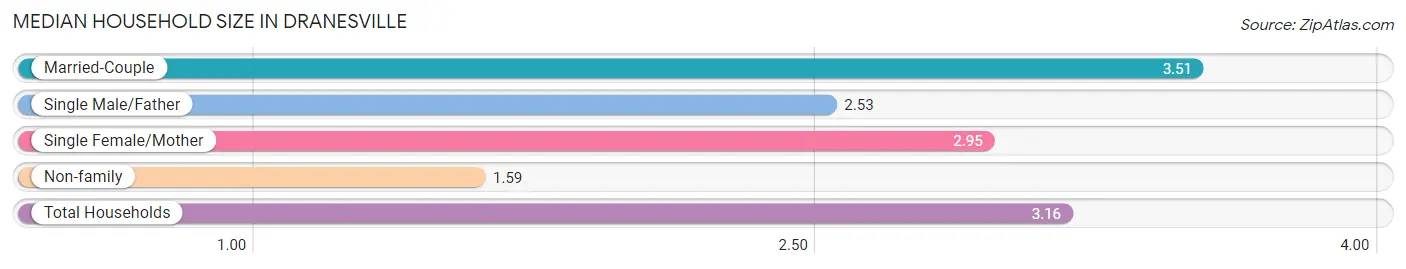
The median household size in Dranesville is 3.16 persons per household, with married-couple households (2,965 | 77.0%) accounting for the largest median household size of 3.51 persons per household. non-family households (571 | 14.8%) represent the smallest median household size with 1.59 persons per household.
| Household Type | # Households | Household Size |
| Married-Couple | 2,965 (77.0%) | 3.51 |
| Single Male/Father | 171 (4.4%) | 2.53 |
| Single Female/Mother | 142 (3.7%) | 2.95 |
| Non-family | 571 (14.8%) | 1.59 |
| Total Households | 3,849 (100.0%) | 3.16 |
Household Size by Marriage Status in Dranesville
Out of a total of 3,849 households in Dranesville, 3,278 (85.2%) are family households, while 571 (14.8%) are nonfamily households. The most numerous type of family households are 2-person households, comprising 1,163, and the most common type of nonfamily households are 1-person households, comprising 406.
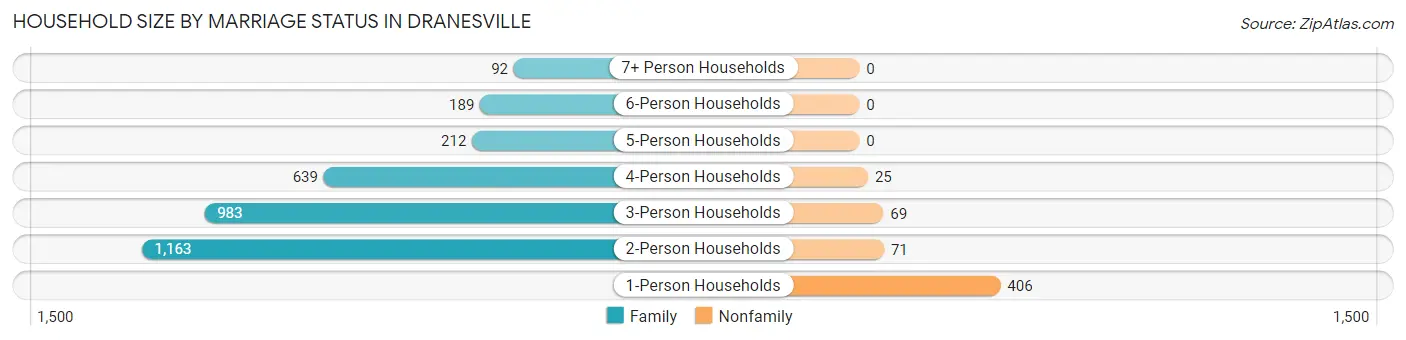
| Household Size | Family Households | Nonfamily Households |
| 1-Person Households | - | 406 (10.5%) |
| 2-Person Households | 1,163 (30.2%) | 71 (1.8%) |
| 3-Person Households | 983 (25.5%) | 69 (1.8%) |
| 4-Person Households | 639 (16.6%) | 25 (0.6%) |
| 5-Person Households | 212 (5.5%) | 0 (0.0%) |
| 6-Person Households | 189 (4.9%) | 0 (0.0%) |
| 7+ Person Households | 92 (2.4%) | 0 (0.0%) |
| Total | 3,278 (85.2%) | 571 (14.8%) |
Female Fertility in Dranesville
Fertility by Age in Dranesville
Average fertility rate in Dranesville is 42.0 births per 1,000 women. Women in the age bracket of 20 to 34 years have the highest fertility rate with 52.0 births per 1,000 women. Women in the age bracket of 35 to 50 years acount for 56.4% of all women with births.
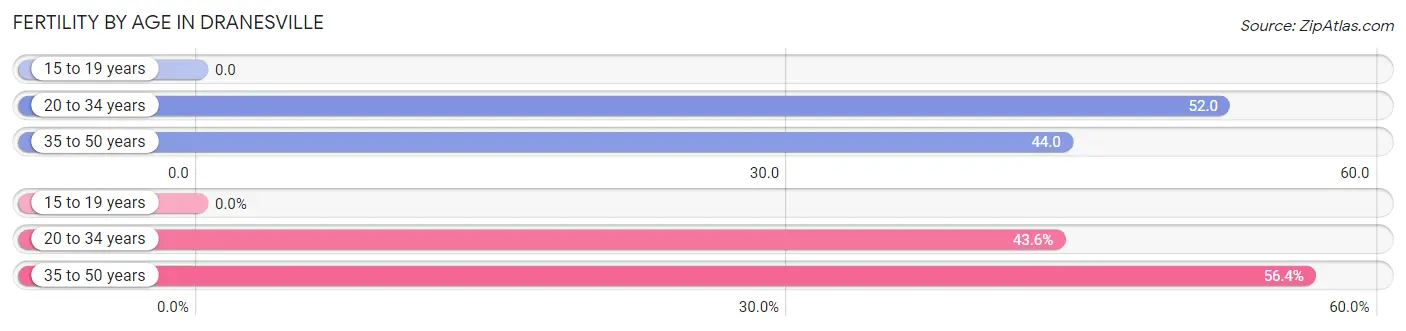
| Age Bracket | Women with Births | Births / 1,000 Women |
| 15 to 19 years | 0 (0.0%) | 0.0 |
| 20 to 34 years | 41 (43.6%) | 52.0 |
| 35 to 50 years | 53 (56.4%) | 44.0 |
| Total | 94 (100.0%) | 42.0 |
Fertility by Age by Marriage Status in Dranesville
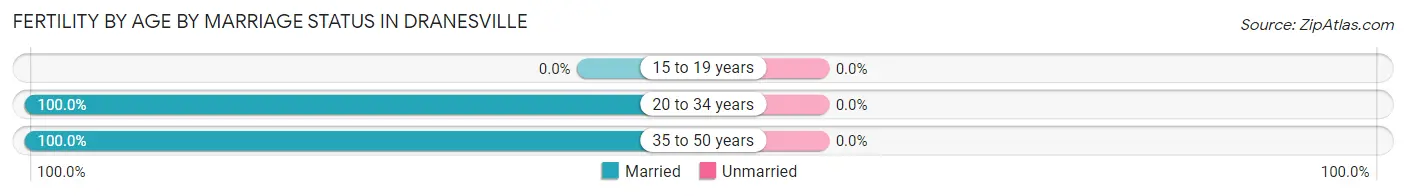
| Age Bracket | Married | Unmarried |
| 15 to 19 years | 0 (0.0%) | 0 (0.0%) |
| 20 to 34 years | 41 (100.0%) | 0 (0.0%) |
| 35 to 50 years | 53 (100.0%) | 0 (0.0%) |
| Total | 94 (100.0%) | 0 (0.0%) |
Fertility by Education in Dranesville
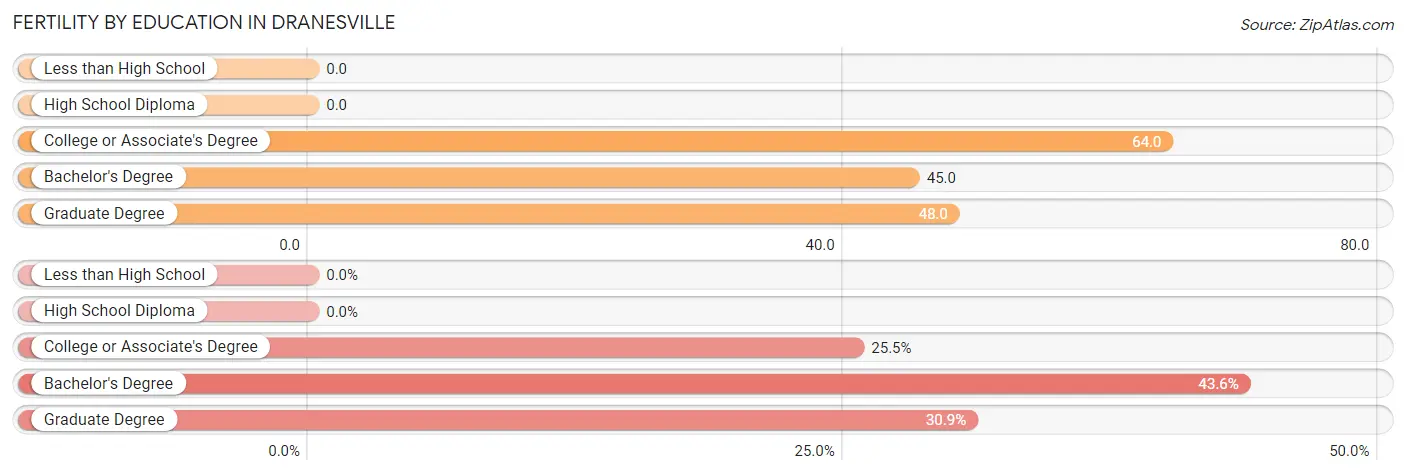
| Educational Attainment | Women with Births | Births / 1,000 Women |
| Less than High School | 0 (0.0%) | 0.0 |
| High School Diploma | 0 (0.0%) | 0.0 |
| College or Associate's Degree | 24 (25.5%) | 64.0 |
| Bachelor's Degree | 41 (43.6%) | 45.0 |
| Graduate Degree | 29 (30.8%) | 48.0 |
| Total | 94 (100.0%) | 42.0 |
Fertility by Education by Marriage Status in Dranesville
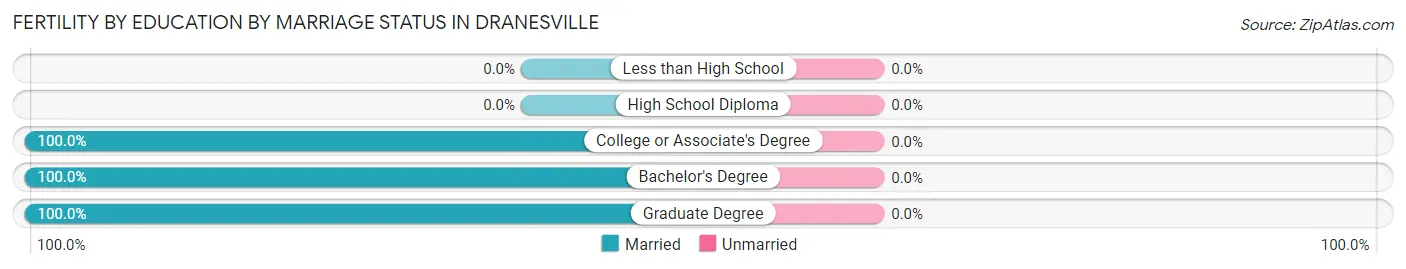
| Educational Attainment | Married | Unmarried |
| Less than High School | 0 (0.0%) | 0 (0.0%) |
| High School Diploma | 0 (0.0%) | 0 (0.0%) |
| College or Associate's Degree | 24 (100.0%) | 0 (0.0%) |
| Bachelor's Degree | 41 (100.0%) | 0 (0.0%) |
| Graduate Degree | 29 (100.0%) | 0 (0.0%) |
| Total | 94 (100.0%) | 0 (0.0%) |
Employment Characteristics in Dranesville
Employment by Class of Employer in Dranesville
Among the 6,323 employed individuals in Dranesville, private company employees (3,506 | 55.4%), federal government employees (756 | 12.0%), and not-for-profit organizations (638 | 10.1%) make up the most common classes of employment.
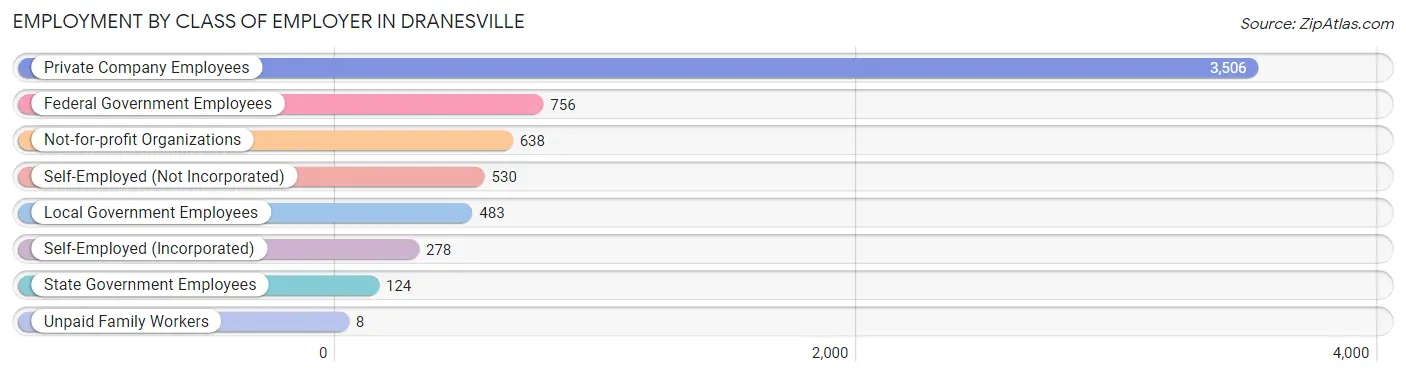
| Employer Class | # Employees | % Employees |
| Private Company Employees | 3,506 | 55.4% |
| Self-Employed (Incorporated) | 278 | 4.4% |
| Self-Employed (Not Incorporated) | 530 | 8.4% |
| Not-for-profit Organizations | 638 | 10.1% |
| Local Government Employees | 483 | 7.6% |
| State Government Employees | 124 | 2.0% |
| Federal Government Employees | 756 | 12.0% |
| Unpaid Family Workers | 8 | 0.1% |
| Total | 6,323 | 100.0% |
Employment Status by Age in Dranesville
According to the labor force statistics for Dranesville, out of the total population over 16 years of age (9,622), 70.0% or 6,735 individuals are in the labor force, with 3.4% or 229 of them unemployed. The age group with the highest labor force participation rate is 25 to 29 years, with 92.2% or 464 individuals in the labor force. Within the labor force, the 20 to 24 years age range has the highest percentage of unemployed individuals, with 14.9% or 91 of them being unemployed.
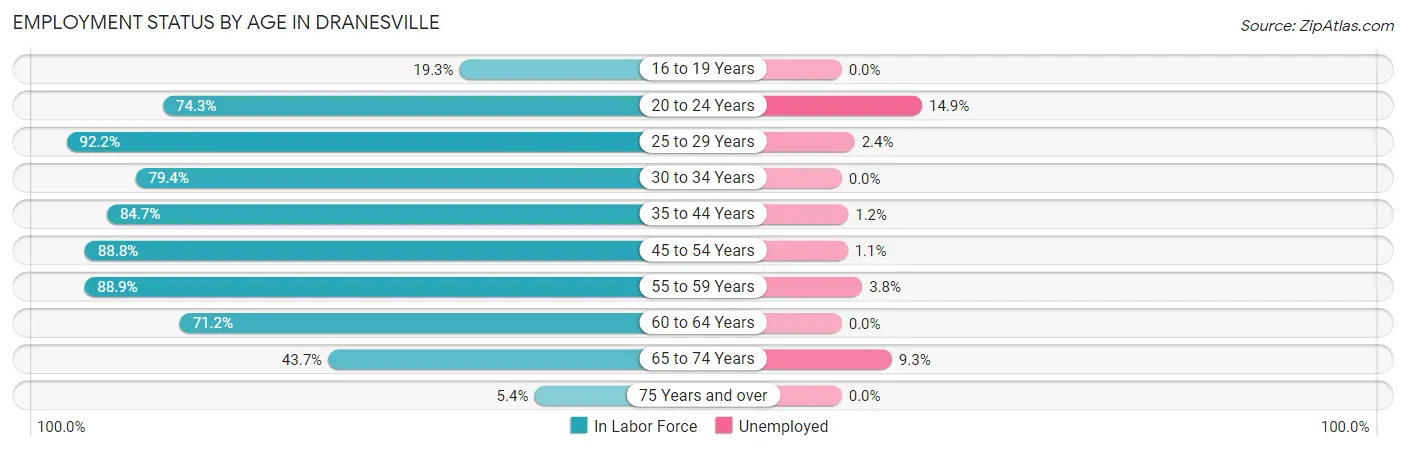
| Age Bracket | In Labor Force | Unemployed |
| 16 to 19 Years | 116 (19.3%) | 0 (0.0%) |
| 20 to 24 Years | 609 (74.3%) | 91 (14.9%) |
| 25 to 29 Years | 464 (92.2%) | 11 (2.4%) |
| 30 to 34 Years | 512 (79.4%) | 0 (0.0%) |
| 35 to 44 Years | 1,420 (84.7%) | 17 (1.2%) |
| 45 to 54 Years | 1,501 (88.8%) | 17 (1.1%) |
| 55 to 59 Years | 1,013 (88.9%) | 38 (3.8%) |
| 60 to 64 Years | 531 (71.2%) | 0 (0.0%) |
| 65 to 74 Years | 534 (43.7%) | 50 (9.3%) |
| 75 Years and over | 31 (5.4%) | 0 (0.0%) |
| Total | 6,735 (70.0%) | 229 (3.4%) |
Employment Status by Educational Attainment in Dranesville
According to labor force statistics for Dranesville, 85.0% of individuals (5,439) out of the total population between 25 and 64 years of age (6,399) are in the labor force, with 1.5% or 82 of them being unemployed. The group with the highest labor force participation rate are those with the educational attainment of college / associate degree, with 86.4% or 837 individuals in the labor force. Within the labor force, individuals with bachelor's degree or higher education have the highest percentage of unemployment, with 1.7% or 74 of them being unemployed.
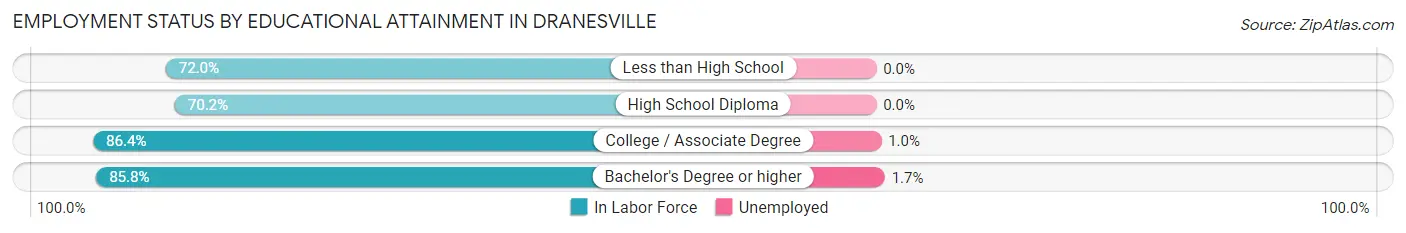
| Educational Attainment | In Labor Force | Unemployed |
| Less than High School | 54 (72.0%) | 0 (0.0%) |
| High School Diploma | 191 (70.2%) | 0 (0.0%) |
| College / Associate Degree | 837 (86.4%) | 10 (1.0%) |
| Bachelor's Degree or higher | 4,361 (85.8%) | 86 (1.7%) |
| Total | 5,439 (85.0%) | 96 (1.5%) |
Employment Occupations by Sex in Dranesville
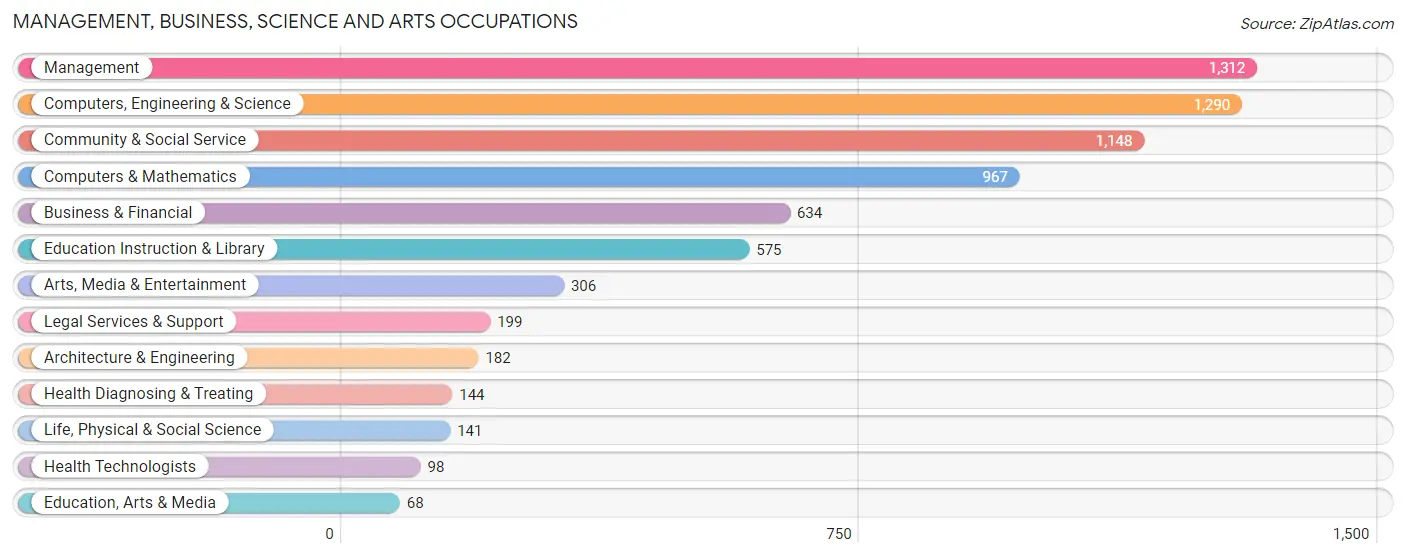
Management, Business, Science and Arts Occupations
The most common Management, Business, Science and Arts occupations in Dranesville are Management (1,312 | 20.2%), Computers, Engineering & Science (1,290 | 19.9%), Community & Social Service (1,148 | 17.7%), Computers & Mathematics (967 | 14.9%), and Business & Financial (634 | 9.8%).
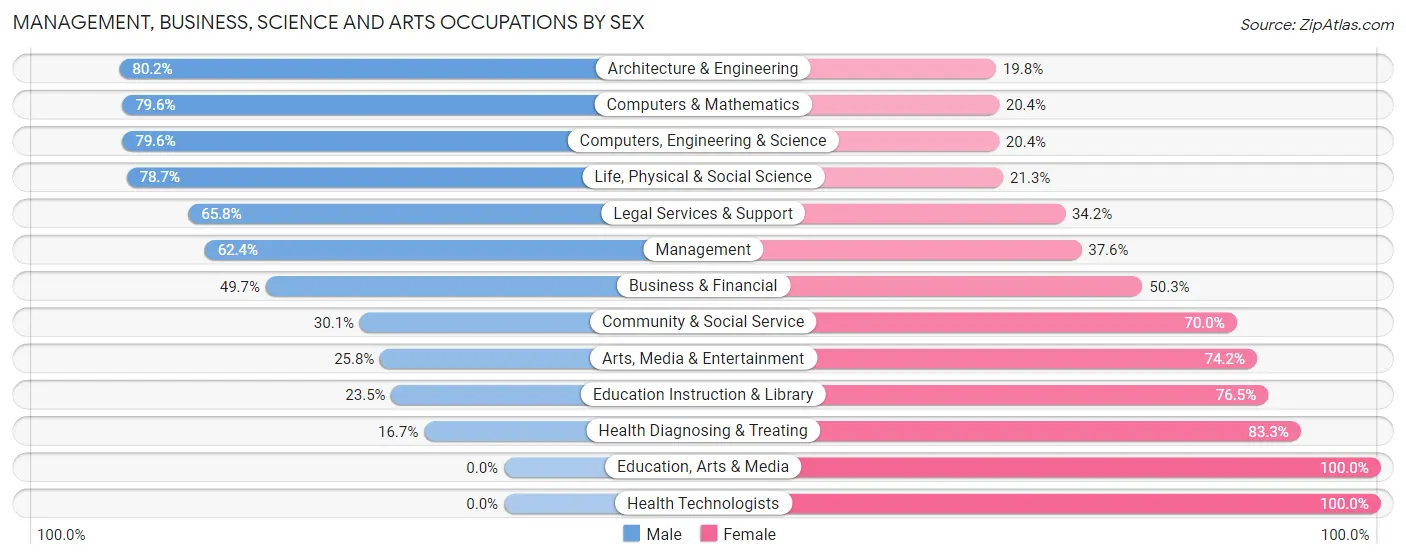
Management, Business, Science and Arts Occupations by Sex
Within the Management, Business, Science and Arts occupations in Dranesville, the most male-oriented occupations are Architecture & Engineering (80.2%), Computers & Mathematics (79.6%), and Computers, Engineering & Science (79.6%), while the most female-oriented occupations are Education, Arts & Media (100.0%), Health Technologists (100.0%), and Health Diagnosing & Treating (83.3%).
| Occupation | Male | Female |
| Management | 819 (62.4%) | 493 (37.6%) |
| Business & Financial | 315 (49.7%) | 319 (50.3%) |
| Computers, Engineering & Science | 1,027 (79.6%) | 263 (20.4%) |
| Computers & Mathematics | 770 (79.6%) | 197 (20.4%) |
| Architecture & Engineering | 146 (80.2%) | 36 (19.8%) |
| Life, Physical & Social Science | 111 (78.7%) | 30 (21.3%) |
| Community & Social Service | 345 (30.0%) | 803 (70.0%) |
| Education, Arts & Media | 0 (0.0%) | 68 (100.0%) |
| Legal Services & Support | 131 (65.8%) | 68 (34.2%) |
| Education Instruction & Library | 135 (23.5%) | 440 (76.5%) |
| Arts, Media & Entertainment | 79 (25.8%) | 227 (74.2%) |
| Health Diagnosing & Treating | 24 (16.7%) | 120 (83.3%) |
| Health Technologists | 0 (0.0%) | 98 (100.0%) |
| Total (Category) | 2,530 (55.9%) | 1,998 (44.1%) |
| Total (Overall) | 3,790 (58.4%) | 2,699 (41.6%) |
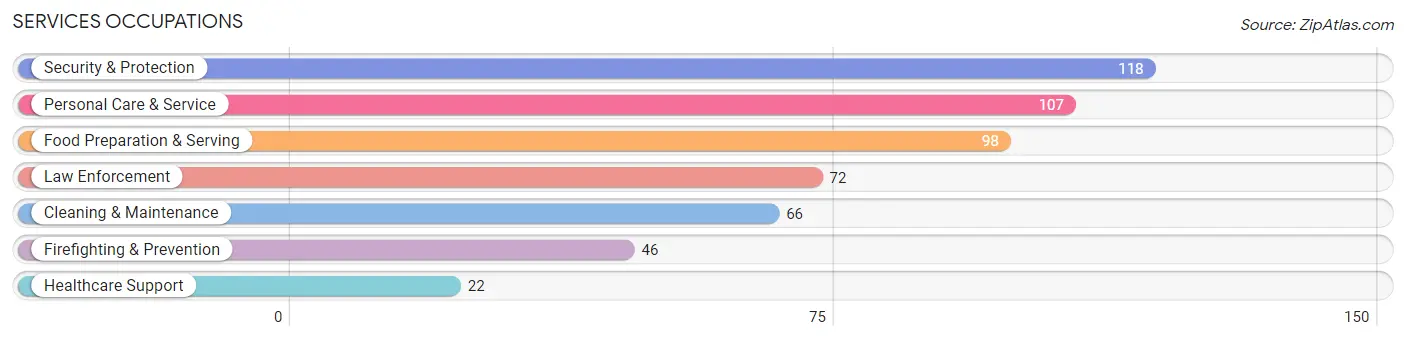
Services Occupations
The most common Services occupations in Dranesville are Security & Protection (118 | 1.8%), Personal Care & Service (107 | 1.7%), Food Preparation & Serving (98 | 1.5%), Law Enforcement (72 | 1.1%), and Cleaning & Maintenance (66 | 1.0%).
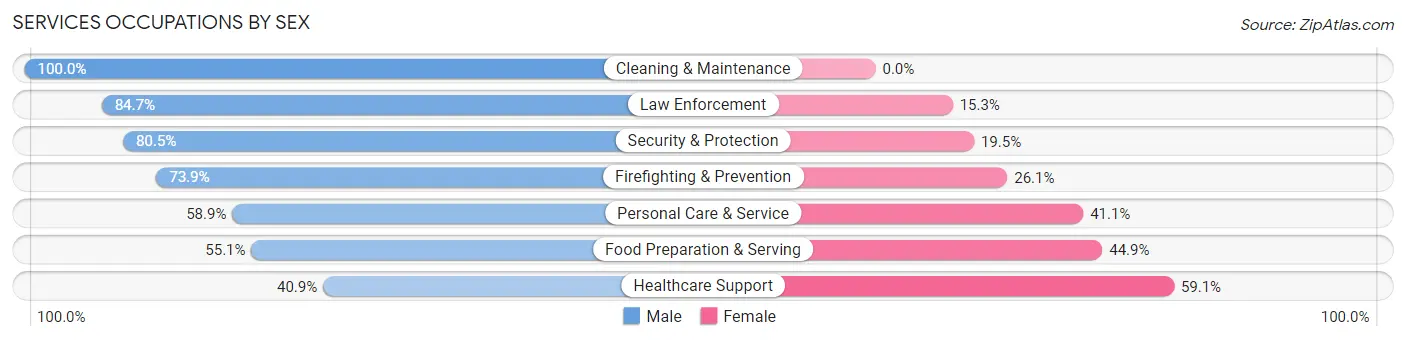
Services Occupations by Sex
Within the Services occupations in Dranesville, the most male-oriented occupations are Cleaning & Maintenance (100.0%), Law Enforcement (84.7%), and Security & Protection (80.5%), while the most female-oriented occupations are Healthcare Support (59.1%), Food Preparation & Serving (44.9%), and Personal Care & Service (41.1%).
| Occupation | Male | Female |
| Healthcare Support | 9 (40.9%) | 13 (59.1%) |
| Security & Protection | 95 (80.5%) | 23 (19.5%) |
| Firefighting & Prevention | 34 (73.9%) | 12 (26.1%) |
| Law Enforcement | 61 (84.7%) | 11 (15.3%) |
| Food Preparation & Serving | 54 (55.1%) | 44 (44.9%) |
| Cleaning & Maintenance | 66 (100.0%) | 0 (0.0%) |
| Personal Care & Service | 63 (58.9%) | 44 (41.1%) |
| Total (Category) | 287 (69.8%) | 124 (30.2%) |
| Total (Overall) | 3,790 (58.4%) | 2,699 (41.6%) |
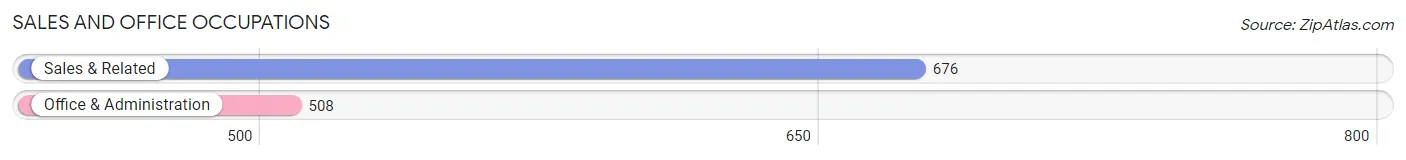
Sales and Office Occupations
The most common Sales and Office occupations in Dranesville are Sales & Related (676 | 10.4%), and Office & Administration (508 | 7.8%).
Sales and Office Occupations by Sex
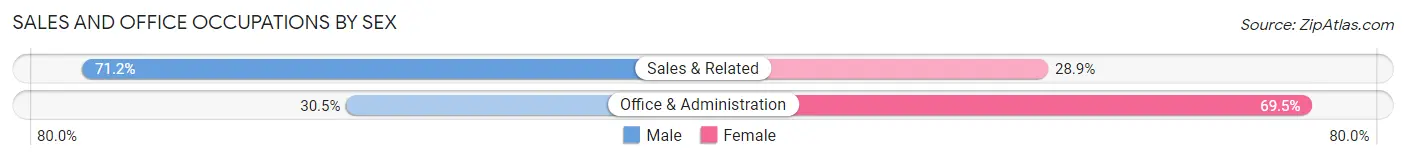
| Occupation | Male | Female |
| Sales & Related | 481 (71.2%) | 195 (28.8%) |
| Office & Administration | 155 (30.5%) | 353 (69.5%) |
| Total (Category) | 636 (53.7%) | 548 (46.3%) |
| Total (Overall) | 3,790 (58.4%) | 2,699 (41.6%) |
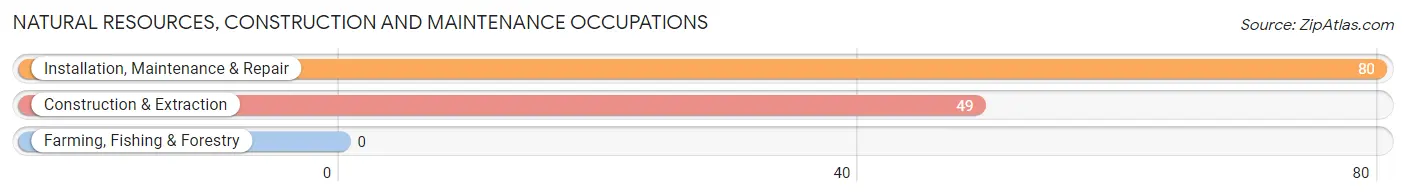
Natural Resources, Construction and Maintenance Occupations
The most common Natural Resources, Construction and Maintenance occupations in Dranesville are Installation, Maintenance & Repair (80 | 1.2%), and Construction & Extraction (49 | 0.8%).
Natural Resources, Construction and Maintenance Occupations by Sex
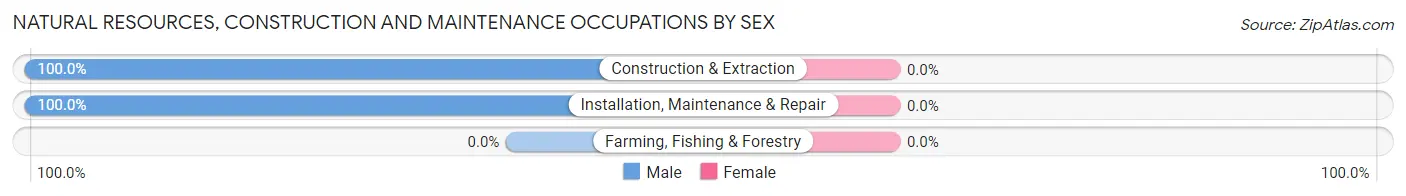
| Occupation | Male | Female |
| Farming, Fishing & Forestry | 0 (0.0%) | 0 (0.0%) |
| Construction & Extraction | 49 (100.0%) | 0 (0.0%) |
| Installation, Maintenance & Repair | 80 (100.0%) | 0 (0.0%) |
| Total (Category) | 129 (100.0%) | 0 (0.0%) |
| Total (Overall) | 3,790 (58.4%) | 2,699 (41.6%) |
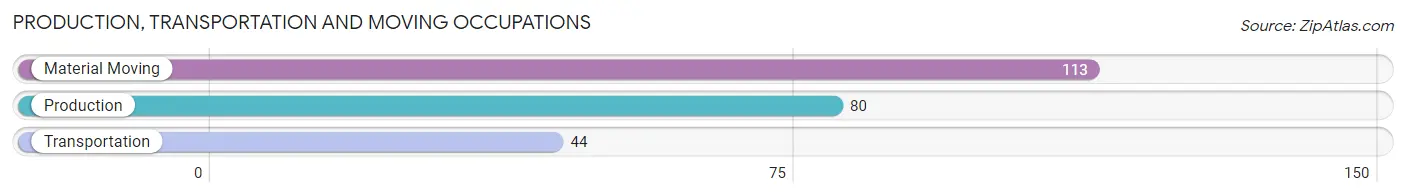
Production, Transportation and Moving Occupations
The most common Production, Transportation and Moving occupations in Dranesville are Material Moving (113 | 1.7%), Production (80 | 1.2%), and Transportation (44 | 0.7%).
Production, Transportation and Moving Occupations by Sex
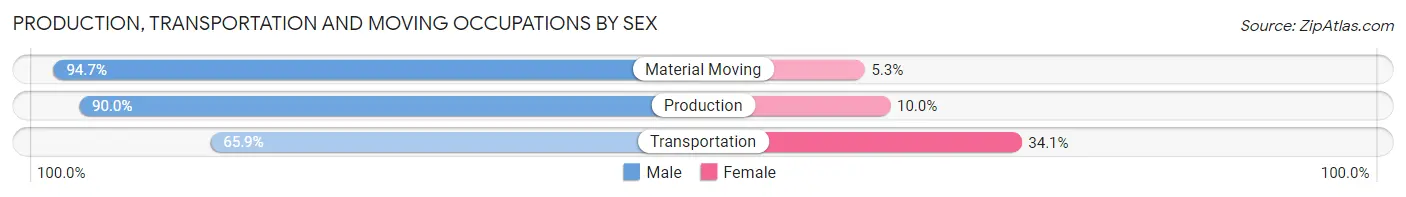
| Occupation | Male | Female |
| Production | 72 (90.0%) | 8 (10.0%) |
| Transportation | 29 (65.9%) | 15 (34.1%) |
| Material Moving | 107 (94.7%) | 6 (5.3%) |
| Total (Category) | 208 (87.8%) | 29 (12.2%) |
| Total (Overall) | 3,790 (58.4%) | 2,699 (41.6%) |
Employment Industries by Sex in Dranesville
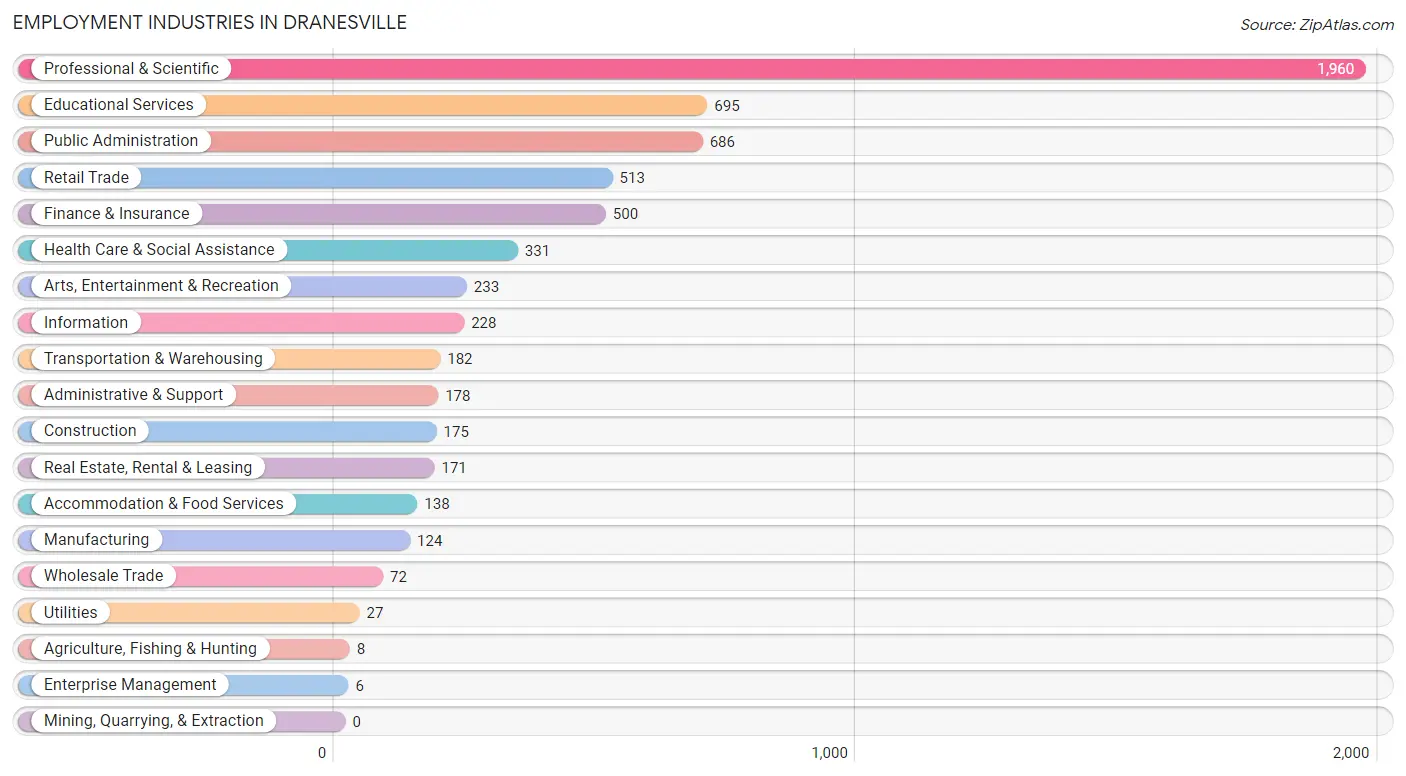
Employment Industries in Dranesville
The major employment industries in Dranesville include Professional & Scientific (1,960 | 30.2%), Educational Services (695 | 10.7%), Public Administration (686 | 10.6%), Retail Trade (513 | 7.9%), and Finance & Insurance (500 | 7.7%).
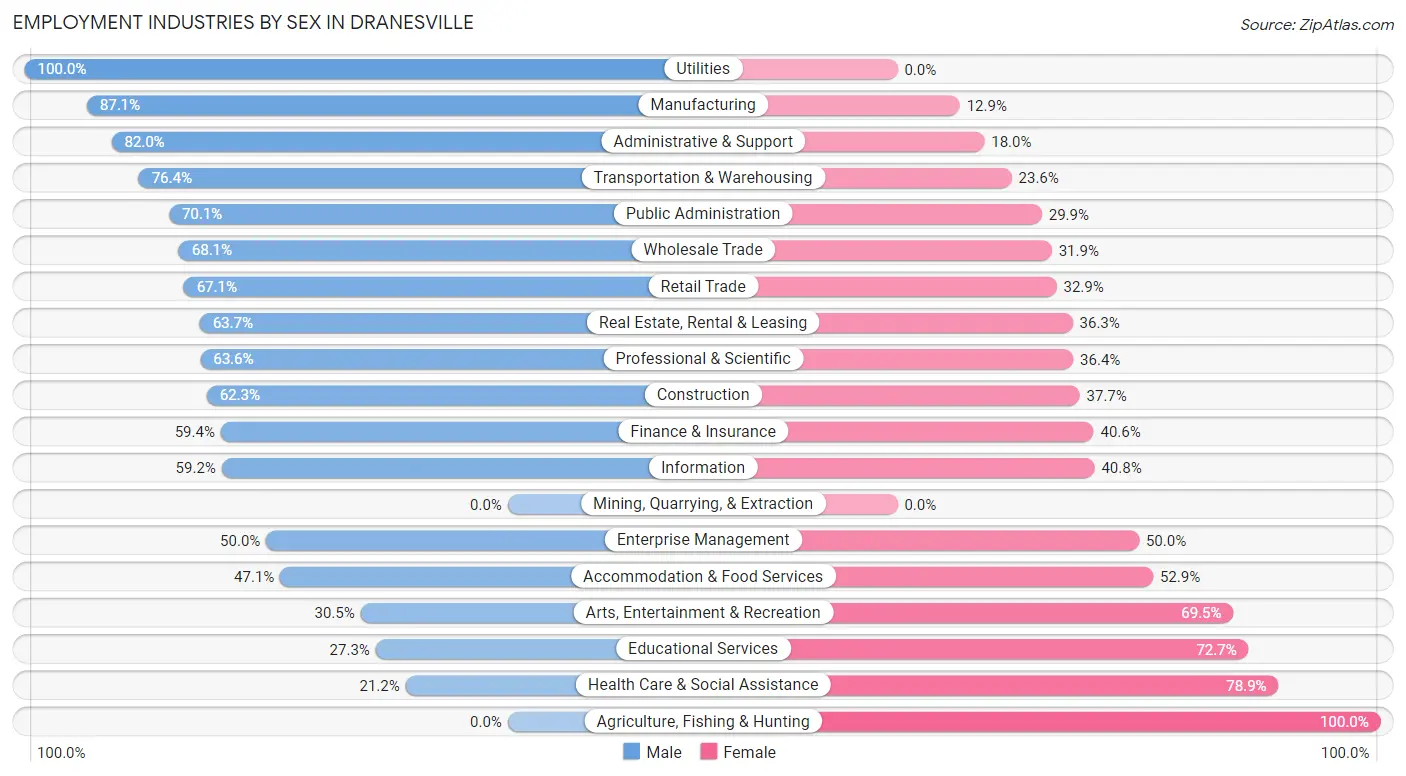
Employment Industries by Sex in Dranesville
The Dranesville industries that see more men than women are Utilities (100.0%), Manufacturing (87.1%), and Administrative & Support (82.0%), whereas the industries that tend to have a higher number of women are Agriculture, Fishing & Hunting (100.0%), Health Care & Social Assistance (78.8%), and Educational Services (72.7%).
| Industry | Male | Female |
| Agriculture, Fishing & Hunting | 0 (0.0%) | 8 (100.0%) |
| Mining, Quarrying, & Extraction | 0 (0.0%) | 0 (0.0%) |
| Construction | 109 (62.3%) | 66 (37.7%) |
| Manufacturing | 108 (87.1%) | 16 (12.9%) |
| Wholesale Trade | 49 (68.1%) | 23 (31.9%) |
| Retail Trade | 344 (67.1%) | 169 (32.9%) |
| Transportation & Warehousing | 139 (76.4%) | 43 (23.6%) |
| Utilities | 27 (100.0%) | 0 (0.0%) |
| Information | 135 (59.2%) | 93 (40.8%) |
| Finance & Insurance | 297 (59.4%) | 203 (40.6%) |
| Real Estate, Rental & Leasing | 109 (63.7%) | 62 (36.3%) |
| Professional & Scientific | 1,247 (63.6%) | 713 (36.4%) |
| Enterprise Management | 3 (50.0%) | 3 (50.0%) |
| Administrative & Support | 146 (82.0%) | 32 (18.0%) |
| Educational Services | 190 (27.3%) | 505 (72.7%) |
| Health Care & Social Assistance | 70 (21.1%) | 261 (78.8%) |
| Arts, Entertainment & Recreation | 71 (30.5%) | 162 (69.5%) |
| Accommodation & Food Services | 65 (47.1%) | 73 (52.9%) |
| Public Administration | 481 (70.1%) | 205 (29.9%) |
| Total | 3,790 (58.4%) | 2,699 (41.6%) |
Education in Dranesville
School Enrollment in Dranesville
The most common levels of schooling among the 3,166 students in Dranesville are high school (749 | 23.7%), elementary school (682 | 21.5%), and middle school (632 | 20.0%).
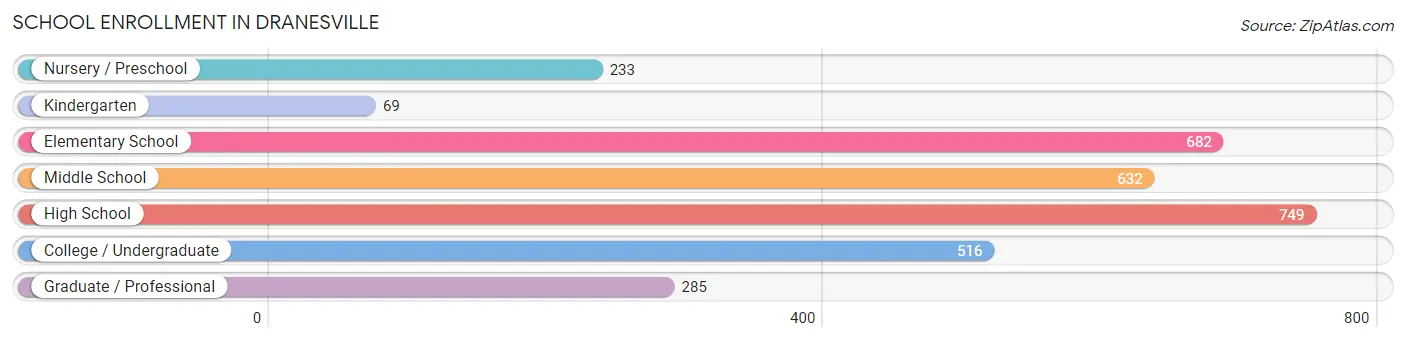
| School Level | # Students | % Students |
| Nursery / Preschool | 233 | 7.4% |
| Kindergarten | 69 | 2.2% |
| Elementary School | 682 | 21.5% |
| Middle School | 632 | 20.0% |
| High School | 749 | 23.7% |
| College / Undergraduate | 516 | 16.3% |
| Graduate / Professional | 285 | 9.0% |
| Total | 3,166 | 100.0% |
School Enrollment by Age by Funding Source in Dranesville
Out of a total of 3,166 students who are enrolled in schools in Dranesville, 766 (24.2%) attend a private institution, while the remaining 2,400 (75.8%) are enrolled in public schools. The age group of 3 to 4 year olds has the highest likelihood of being enrolled in private schools, with 143 (75.7% in the age bracket) enrolled. Conversely, the age group of 25 to 34 year olds has the lowest likelihood of being enrolled in a private school, with 131 (89.1% in the age bracket) attending a public institution.
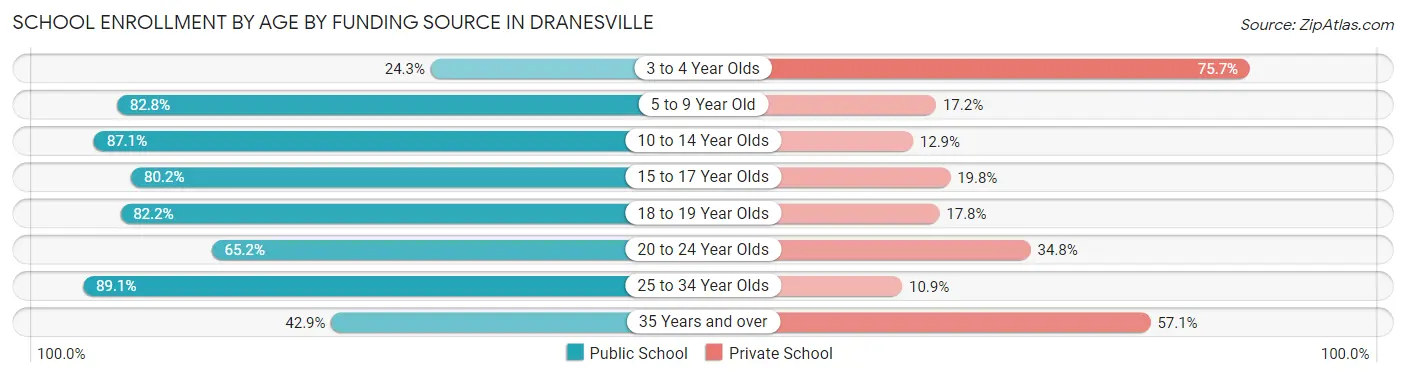
| Age Bracket | Public School | Private School |
| 3 to 4 Year Olds | 46 (24.3%) | 143 (75.7%) |
| 5 to 9 Year Old | 607 (82.8%) | 126 (17.2%) |
| 10 to 14 Year Olds | 730 (87.1%) | 108 (12.9%) |
| 15 to 17 Year Olds | 412 (80.2%) | 102 (19.8%) |
| 18 to 19 Year Olds | 143 (82.2%) | 31 (17.8%) |
| 20 to 24 Year Olds | 249 (65.2%) | 133 (34.8%) |
| 25 to 34 Year Olds | 131 (89.1%) | 16 (10.9%) |
| 35 Years and over | 81 (42.9%) | 108 (57.1%) |
| Total | 2,400 (75.8%) | 766 (24.2%) |
Educational Attainment by Field of Study in Dranesville
Business (1,140 | 16.3%), engineering (903 | 12.9%), social sciences (894 | 12.7%), bio, nature & agricultural (533 | 7.6%), and education (530 | 7.6%) are the most common fields of study among 7,015 individuals in Dranesville who have obtained a bachelor's degree or higher.
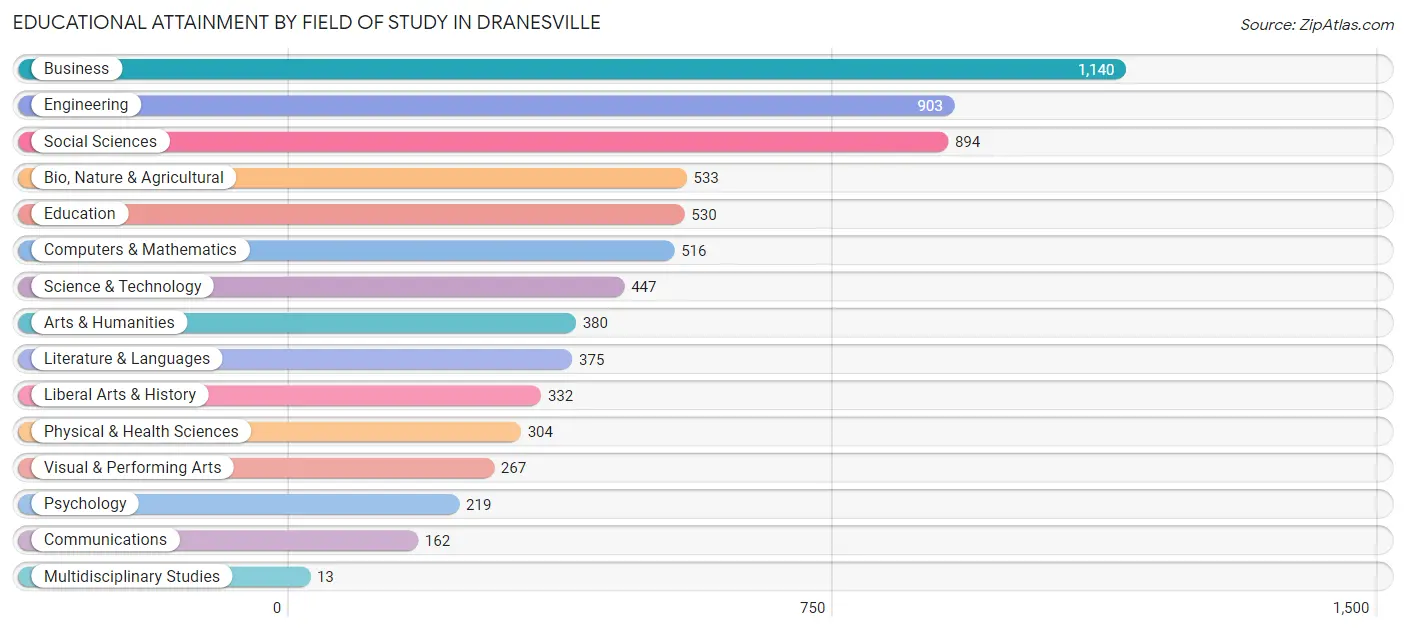
| Field of Study | # Graduates | % Graduates |
| Computers & Mathematics | 516 | 7.4% |
| Bio, Nature & Agricultural | 533 | 7.6% |
| Physical & Health Sciences | 304 | 4.3% |
| Psychology | 219 | 3.1% |
| Social Sciences | 894 | 12.7% |
| Engineering | 903 | 12.9% |
| Multidisciplinary Studies | 13 | 0.2% |
| Science & Technology | 447 | 6.4% |
| Business | 1,140 | 16.3% |
| Education | 530 | 7.6% |
| Literature & Languages | 375 | 5.3% |
| Liberal Arts & History | 332 | 4.7% |
| Visual & Performing Arts | 267 | 3.8% |
| Communications | 162 | 2.3% |
| Arts & Humanities | 380 | 5.4% |
| Total | 7,015 | 100.0% |
Transportation & Commute in Dranesville
Vehicle Availability by Sex in Dranesville
The most prevalent vehicle ownership categories in Dranesville are males with 2 vehicles (1,766, accounting for 46.8%) and females with 2 vehicles (1,233, making up 69.2%).
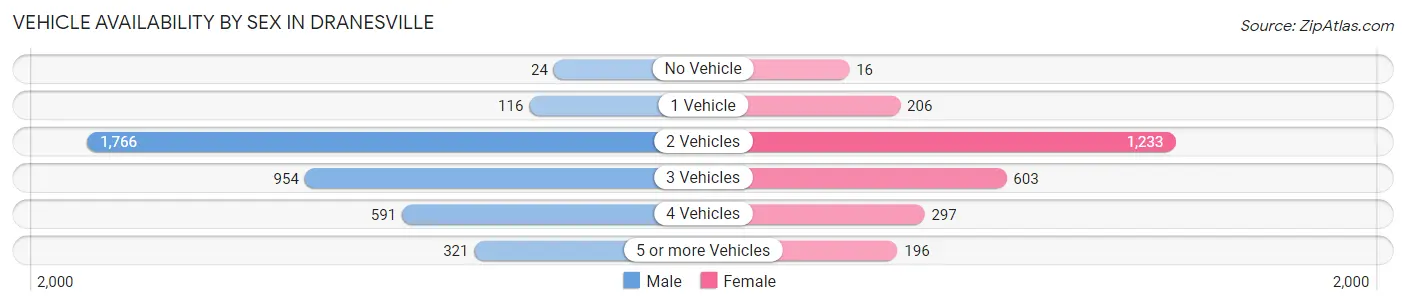
| Vehicles Available | Male | Female |
| No Vehicle | 24 (0.6%) | 16 (0.6%) |
| 1 Vehicle | 116 (3.1%) | 206 (8.1%) |
| 2 Vehicles | 1,766 (46.8%) | 1,233 (48.3%) |
| 3 Vehicles | 954 (25.3%) | 603 (23.6%) |
| 4 Vehicles | 591 (15.7%) | 297 (11.6%) |
| 5 or more Vehicles | 321 (8.5%) | 196 (7.7%) |
| Total | 3,772 (100.0%) | 2,551 (100.0%) |
Commute Time in Dranesville
The most frequently occuring commute durations in Dranesville are 20 to 24 minutes (588 commuters, 13.5%), 30 to 34 minutes (581 commuters, 13.4%), and 45 to 59 minutes (568 commuters, 13.1%).
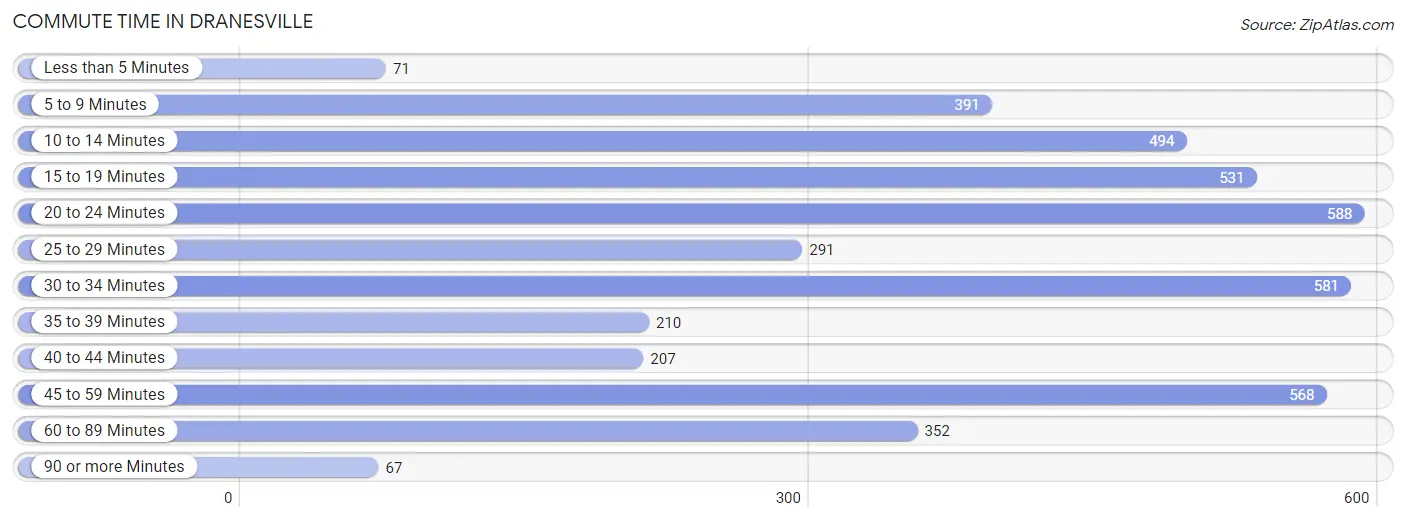
| Commute Time | # Commuters | % Commuters |
| Less than 5 Minutes | 71 | 1.6% |
| 5 to 9 Minutes | 391 | 9.0% |
| 10 to 14 Minutes | 494 | 11.4% |
| 15 to 19 Minutes | 531 | 12.2% |
| 20 to 24 Minutes | 588 | 13.5% |
| 25 to 29 Minutes | 291 | 6.7% |
| 30 to 34 Minutes | 581 | 13.4% |
| 35 to 39 Minutes | 210 | 4.8% |
| 40 to 44 Minutes | 207 | 4.8% |
| 45 to 59 Minutes | 568 | 13.1% |
| 60 to 89 Minutes | 352 | 8.1% |
| 90 or more Minutes | 67 | 1.5% |
Commute Time by Sex in Dranesville
The most common commute times in Dranesville are 20 to 24 minutes (438 commuters, 16.5%) for males and 30 to 34 minutes (221 commuters, 13.0%) for females.
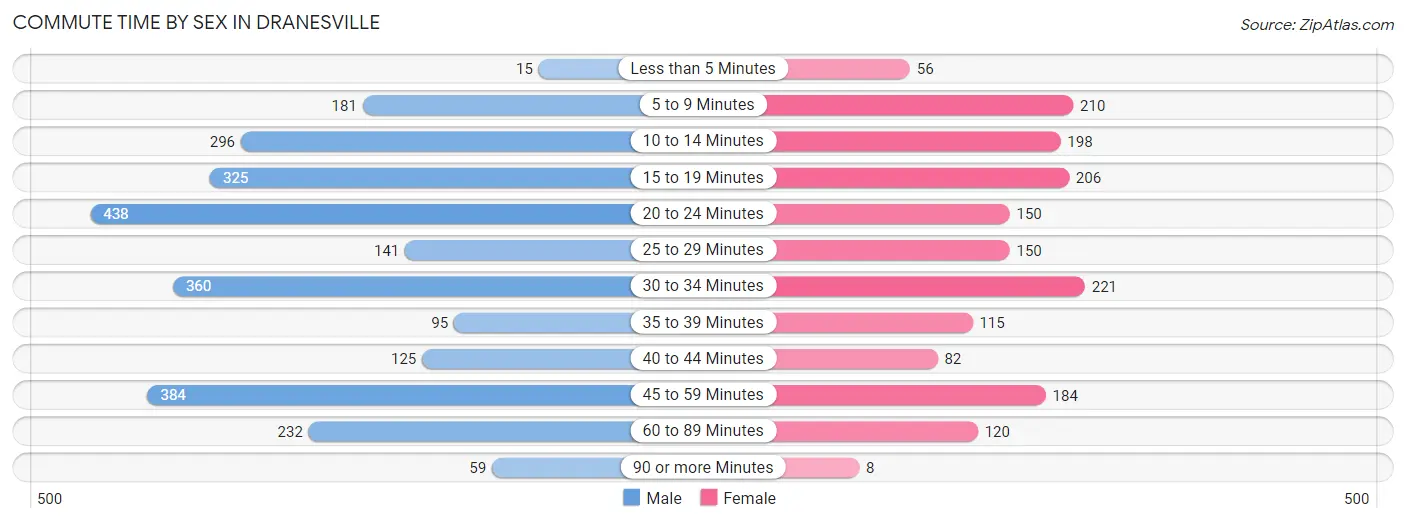
| Commute Time | Male | Female |
| Less than 5 Minutes | 15 (0.6%) | 56 (3.3%) |
| 5 to 9 Minutes | 181 (6.8%) | 210 (12.3%) |
| 10 to 14 Minutes | 296 (11.2%) | 198 (11.7%) |
| 15 to 19 Minutes | 325 (12.3%) | 206 (12.1%) |
| 20 to 24 Minutes | 438 (16.5%) | 150 (8.8%) |
| 25 to 29 Minutes | 141 (5.3%) | 150 (8.8%) |
| 30 to 34 Minutes | 360 (13.6%) | 221 (13.0%) |
| 35 to 39 Minutes | 95 (3.6%) | 115 (6.8%) |
| 40 to 44 Minutes | 125 (4.7%) | 82 (4.8%) |
| 45 to 59 Minutes | 384 (14.5%) | 184 (10.8%) |
| 60 to 89 Minutes | 232 (8.7%) | 120 (7.1%) |
| 90 or more Minutes | 59 (2.2%) | 8 (0.5%) |
Time of Departure to Work by Sex in Dranesville
The most frequent times of departure to work in Dranesville are 8:00 AM to 8:29 AM (513, 19.4%) for males and 8:00 AM to 8:29 AM (416, 24.5%) for females.
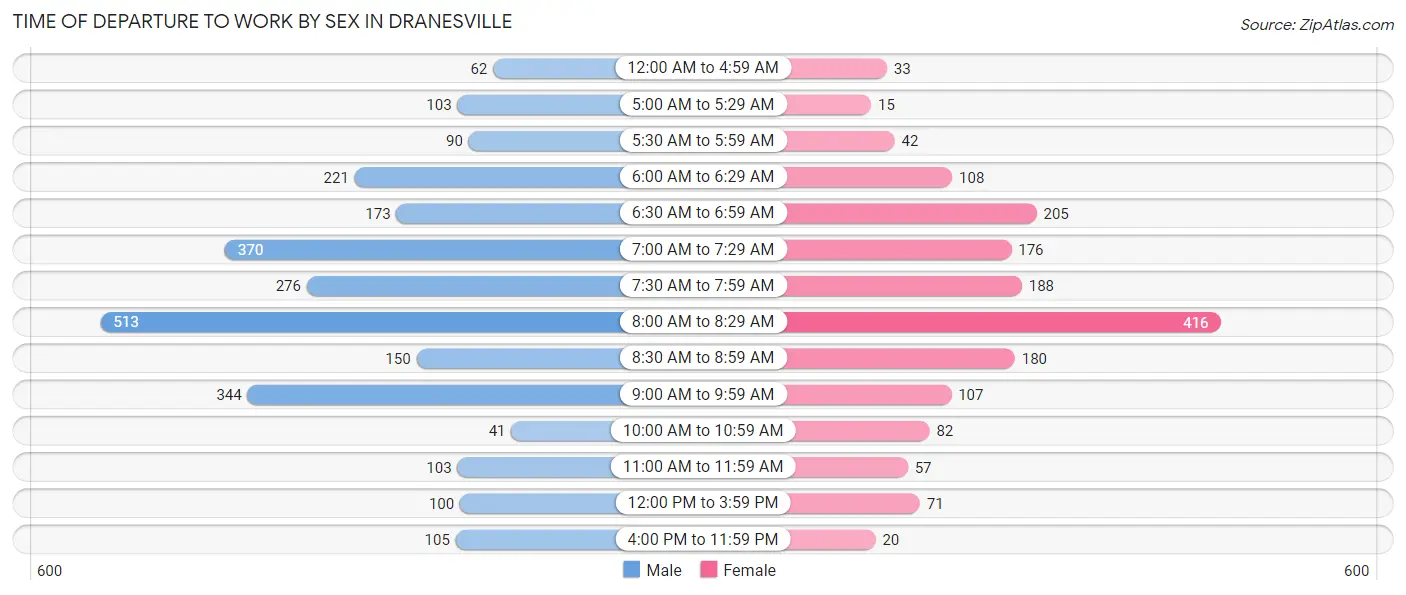
| Time of Departure | Male | Female |
| 12:00 AM to 4:59 AM | 62 (2.3%) | 33 (1.9%) |
| 5:00 AM to 5:29 AM | 103 (3.9%) | 15 (0.9%) |
| 5:30 AM to 5:59 AM | 90 (3.4%) | 42 (2.5%) |
| 6:00 AM to 6:29 AM | 221 (8.3%) | 108 (6.4%) |
| 6:30 AM to 6:59 AM | 173 (6.5%) | 205 (12.1%) |
| 7:00 AM to 7:29 AM | 370 (14.0%) | 176 (10.3%) |
| 7:30 AM to 7:59 AM | 276 (10.4%) | 188 (11.1%) |
| 8:00 AM to 8:29 AM | 513 (19.4%) | 416 (24.5%) |
| 8:30 AM to 8:59 AM | 150 (5.7%) | 180 (10.6%) |
| 9:00 AM to 9:59 AM | 344 (13.0%) | 107 (6.3%) |
| 10:00 AM to 10:59 AM | 41 (1.5%) | 82 (4.8%) |
| 11:00 AM to 11:59 AM | 103 (3.9%) | 57 (3.4%) |
| 12:00 PM to 3:59 PM | 100 (3.8%) | 71 (4.2%) |
| 4:00 PM to 11:59 PM | 105 (4.0%) | 20 (1.2%) |
| Total | 2,651 (100.0%) | 1,700 (100.0%) |
Housing Occupancy in Dranesville
Occupancy by Ownership in Dranesville
Of the total 3,849 dwellings in Dranesville, owner-occupied units account for 3,637 (94.5%), while renter-occupied units make up 212 (5.5%).
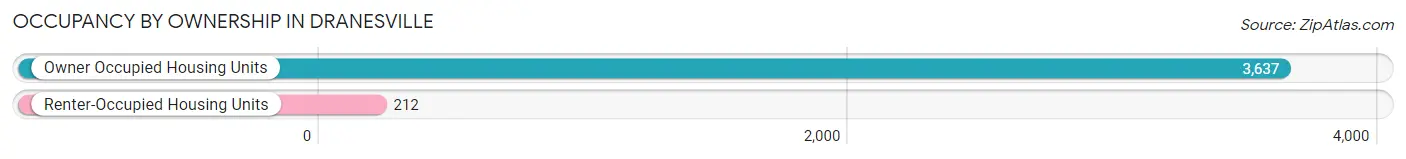
| Occupancy | # Housing Units | % Housing Units |
| Owner Occupied Housing Units | 3,637 | 94.5% |
| Renter-Occupied Housing Units | 212 | 5.5% |
| Total Occupied Housing Units | 3,849 | 100.0% |
Occupancy by Household Size in Dranesville
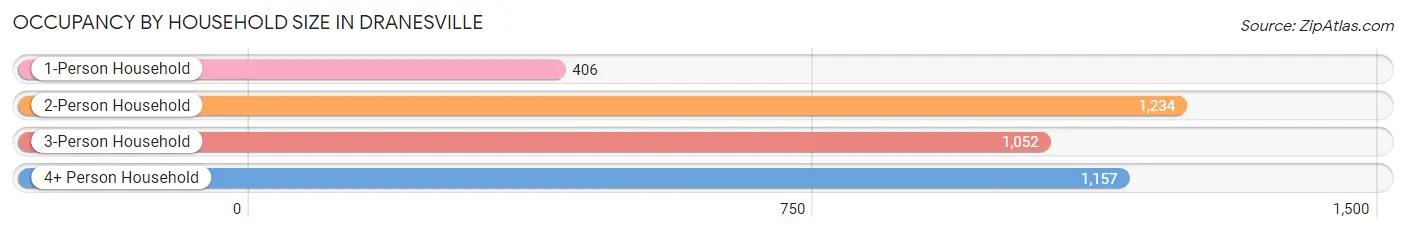
| Household Size | # Housing Units | % Housing Units |
| 1-Person Household | 406 | 10.5% |
| 2-Person Household | 1,234 | 32.1% |
| 3-Person Household | 1,052 | 27.3% |
| 4+ Person Household | 1,157 | 30.1% |
| Total Housing Units | 3,849 | 100.0% |
Occupancy by Ownership by Household Size in Dranesville
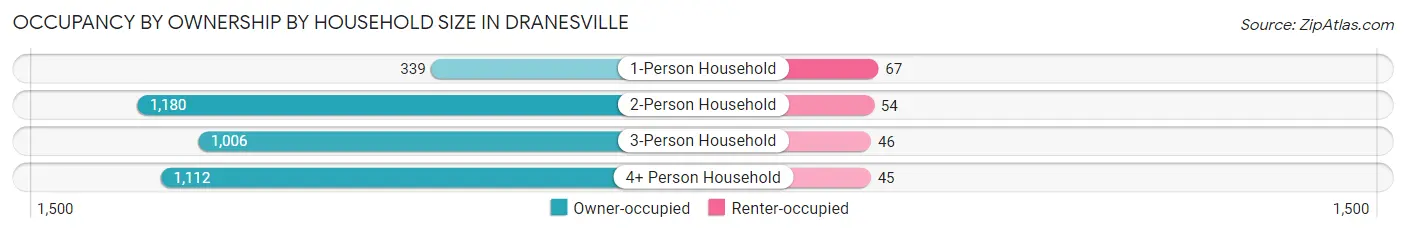
| Household Size | Owner-occupied | Renter-occupied |
| 1-Person Household | 339 (83.5%) | 67 (16.5%) |
| 2-Person Household | 1,180 (95.6%) | 54 (4.4%) |
| 3-Person Household | 1,006 (95.6%) | 46 (4.4%) |
| 4+ Person Household | 1,112 (96.1%) | 45 (3.9%) |
| Total Housing Units | 3,637 (94.5%) | 212 (5.5%) |
Occupancy by Educational Attainment in Dranesville
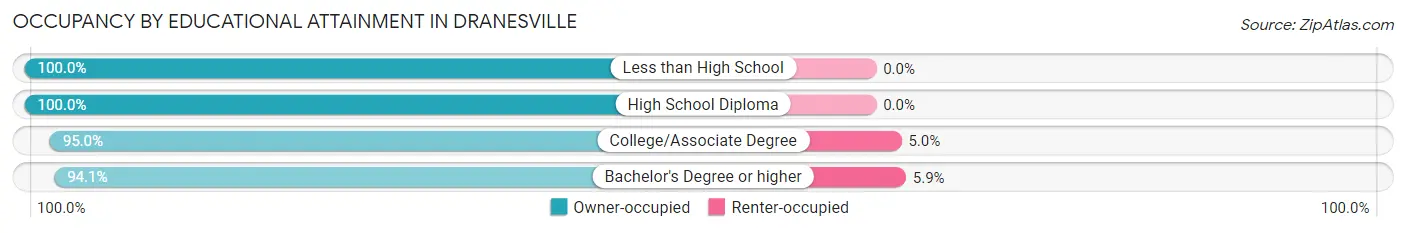
| Household Size | Owner-occupied | Renter-occupied |
| Less than High School | 24 (100.0%) | 0 (0.0%) |
| High School Diploma | 151 (100.0%) | 0 (0.0%) |
| College/Associate Degree | 436 (95.0%) | 23 (5.0%) |
| Bachelor's Degree or higher | 3,026 (94.1%) | 189 (5.9%) |
Occupancy by Age of Householder in Dranesville
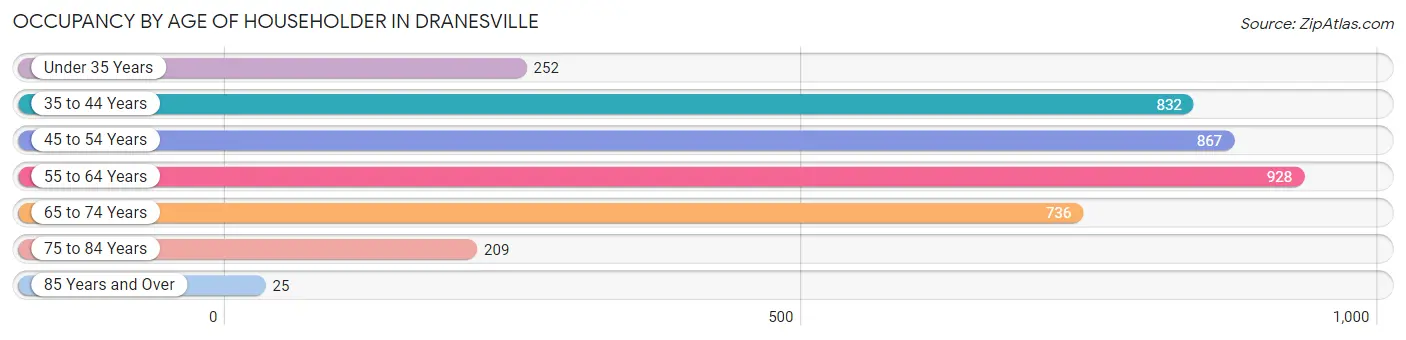
| Age Bracket | # Households | % Households |
| Under 35 Years | 252 | 6.6% |
| 35 to 44 Years | 832 | 21.6% |
| 45 to 54 Years | 867 | 22.5% |
| 55 to 64 Years | 928 | 24.1% |
| 65 to 74 Years | 736 | 19.1% |
| 75 to 84 Years | 209 | 5.4% |
| 85 Years and Over | 25 | 0.6% |
| Total | 3,849 | 100.0% |
Housing Finances in Dranesville
Median Income by Occupancy in Dranesville
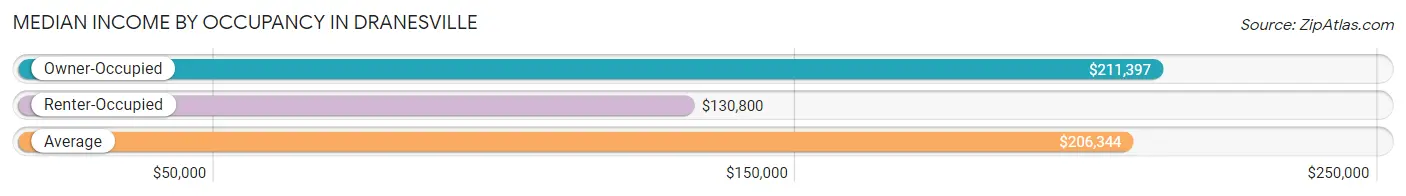
| Occupancy Type | # Households | Median Income |
| Owner-Occupied | 3,637 (94.5%) | $211,397 |
| Renter-Occupied | 212 (5.5%) | $130,800 |
| Average | 3,849 (100.0%) | $206,344 |
Occupancy by Householder Income Bracket in Dranesville
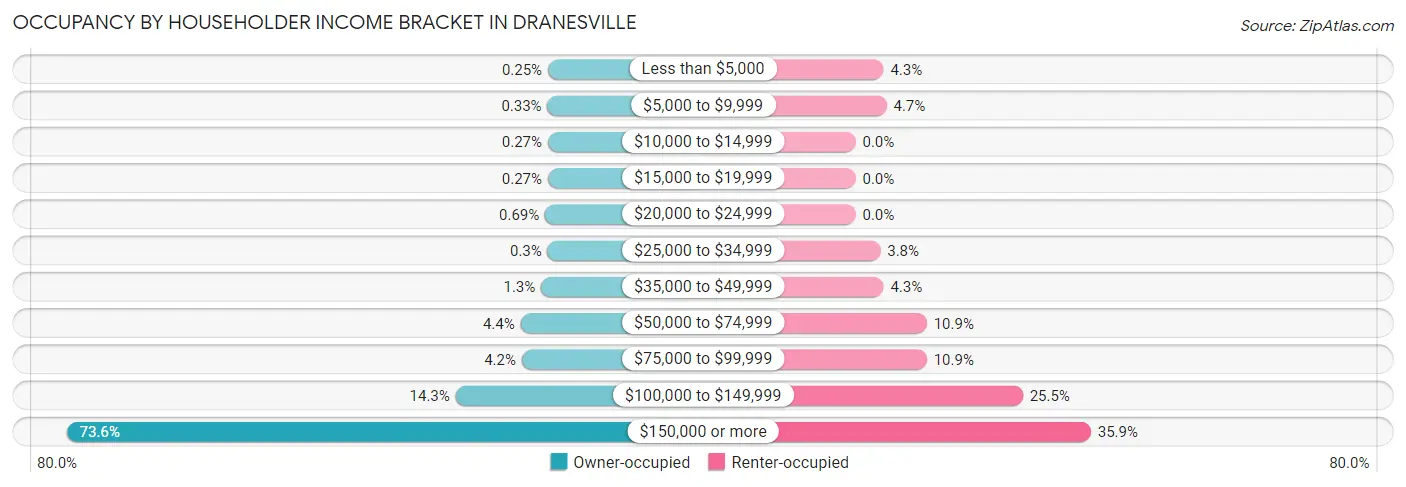
| Income Bracket | Owner-occupied | Renter-occupied |
| Less than $5,000 | 9 (0.3%) | 9 (4.3%) |
| $5,000 to $9,999 | 12 (0.3%) | 10 (4.7%) |
| $10,000 to $14,999 | 10 (0.3%) | 0 (0.0%) |
| $15,000 to $19,999 | 10 (0.3%) | 0 (0.0%) |
| $20,000 to $24,999 | 25 (0.7%) | 0 (0.0%) |
| $25,000 to $34,999 | 11 (0.3%) | 8 (3.8%) |
| $35,000 to $49,999 | 47 (1.3%) | 9 (4.3%) |
| $50,000 to $74,999 | 161 (4.4%) | 23 (10.8%) |
| $75,000 to $99,999 | 154 (4.2%) | 23 (10.8%) |
| $100,000 to $149,999 | 521 (14.3%) | 54 (25.5%) |
| $150,000 or more | 2,677 (73.6%) | 76 (35.8%) |
| Total | 3,637 (100.0%) | 212 (100.0%) |
Monthly Housing Cost Tiers in Dranesville
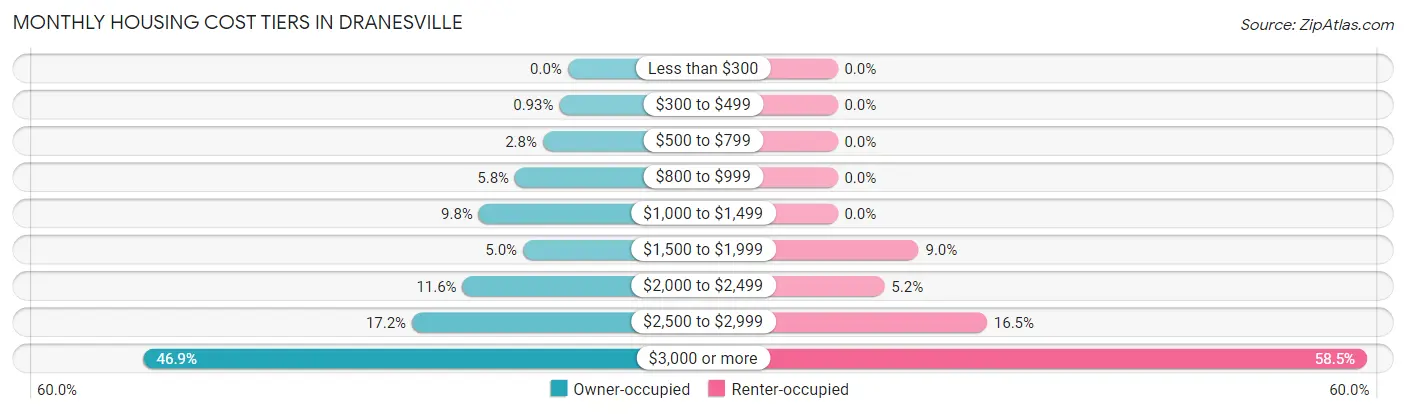
| Monthly Cost | Owner-occupied | Renter-occupied |
| Less than $300 | 0 (0.0%) | 0 (0.0%) |
| $300 to $499 | 34 (0.9%) | 0 (0.0%) |
| $500 to $799 | 100 (2.8%) | 0 (0.0%) |
| $800 to $999 | 212 (5.8%) | 0 (0.0%) |
| $1,000 to $1,499 | 358 (9.8%) | 0 (0.0%) |
| $1,500 to $1,999 | 180 (5.0%) | 19 (9.0%) |
| $2,000 to $2,499 | 423 (11.6%) | 11 (5.2%) |
| $2,500 to $2,999 | 626 (17.2%) | 35 (16.5%) |
| $3,000 or more | 1,704 (46.9%) | 124 (58.5%) |
| Total | 3,637 (100.0%) | 212 (100.0%) |
Physical Housing Characteristics in Dranesville
Housing Structures in Dranesville
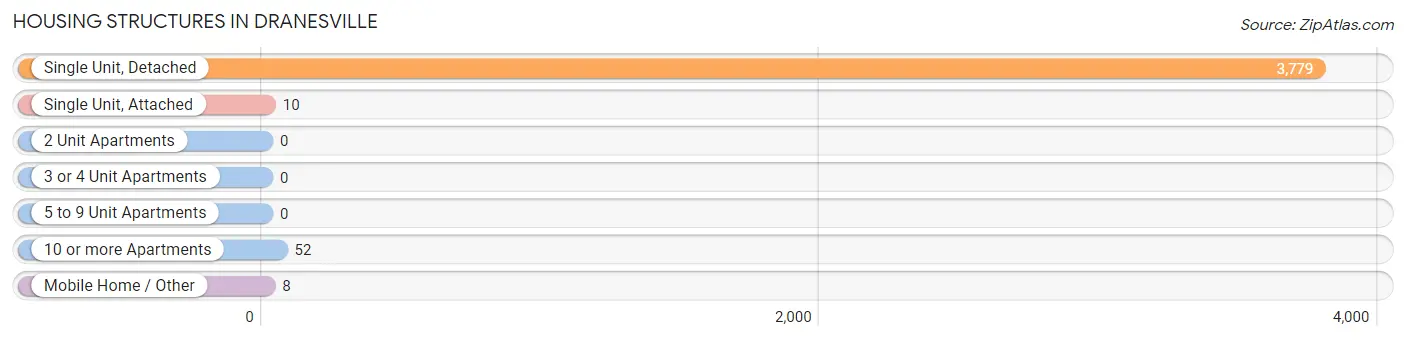
| Structure Type | # Housing Units | % Housing Units |
| Single Unit, Detached | 3,779 | 98.2% |
| Single Unit, Attached | 10 | 0.3% |
| 2 Unit Apartments | 0 | 0.0% |
| 3 or 4 Unit Apartments | 0 | 0.0% |
| 5 to 9 Unit Apartments | 0 | 0.0% |
| 10 or more Apartments | 52 | 1.3% |
| Mobile Home / Other | 8 | 0.2% |
| Total | 3,849 | 100.0% |
Housing Structures by Occupancy in Dranesville
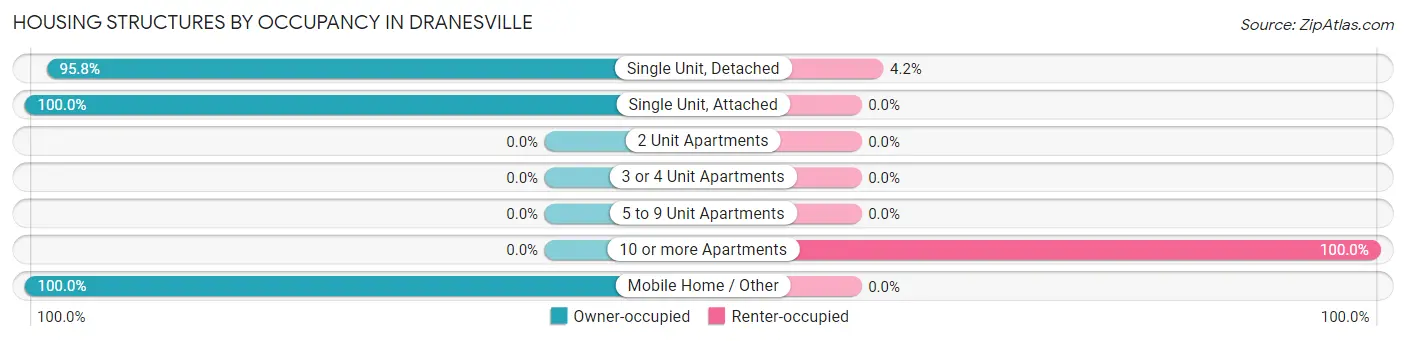
| Structure Type | Owner-occupied | Renter-occupied |
| Single Unit, Detached | 3,619 (95.8%) | 160 (4.2%) |
| Single Unit, Attached | 10 (100.0%) | 0 (0.0%) |
| 2 Unit Apartments | 0 (0.0%) | 0 (0.0%) |
| 3 or 4 Unit Apartments | 0 (0.0%) | 0 (0.0%) |
| 5 to 9 Unit Apartments | 0 (0.0%) | 0 (0.0%) |
| 10 or more Apartments | 0 (0.0%) | 52 (100.0%) |
| Mobile Home / Other | 8 (100.0%) | 0 (0.0%) |
| Total | 3,637 (94.5%) | 212 (5.5%) |
Housing Structures by Number of Rooms in Dranesville
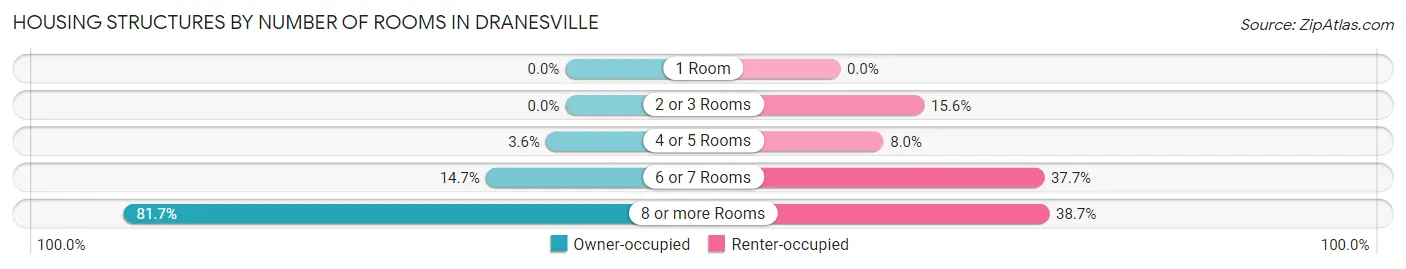
| Number of Rooms | Owner-occupied | Renter-occupied |
| 1 Room | 0 (0.0%) | 0 (0.0%) |
| 2 or 3 Rooms | 0 (0.0%) | 33 (15.6%) |
| 4 or 5 Rooms | 131 (3.6%) | 17 (8.0%) |
| 6 or 7 Rooms | 535 (14.7%) | 80 (37.7%) |
| 8 or more Rooms | 2,971 (81.7%) | 82 (38.7%) |
| Total | 3,637 (100.0%) | 212 (100.0%) |
Housing Structure by Heating Type in Dranesville
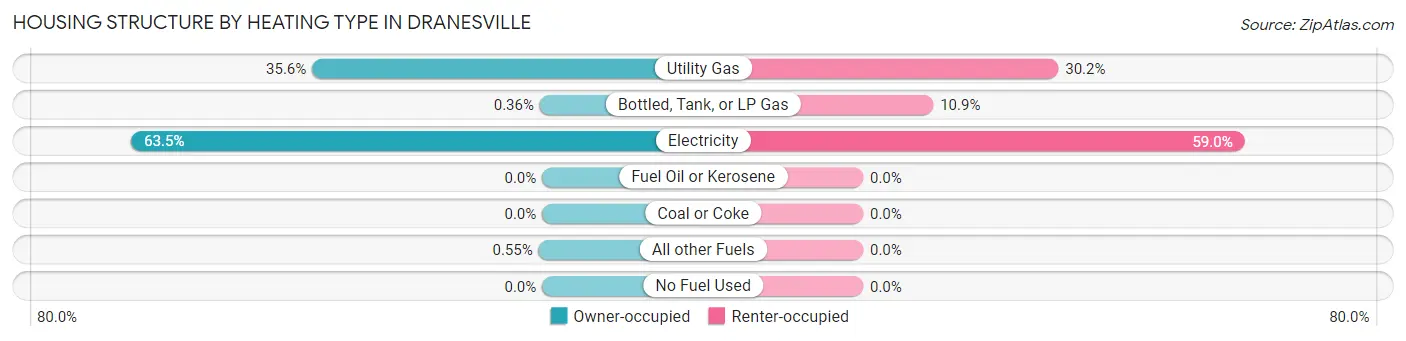
| Heating Type | Owner-occupied | Renter-occupied |
| Utility Gas | 1,293 (35.5%) | 64 (30.2%) |
| Bottled, Tank, or LP Gas | 13 (0.4%) | 23 (10.8%) |
| Electricity | 2,311 (63.5%) | 125 (59.0%) |
| Fuel Oil or Kerosene | 0 (0.0%) | 0 (0.0%) |
| Coal or Coke | 0 (0.0%) | 0 (0.0%) |
| All other Fuels | 20 (0.5%) | 0 (0.0%) |
| No Fuel Used | 0 (0.0%) | 0 (0.0%) |
| Total | 3,637 (100.0%) | 212 (100.0%) |
Household Vehicle Usage in Dranesville
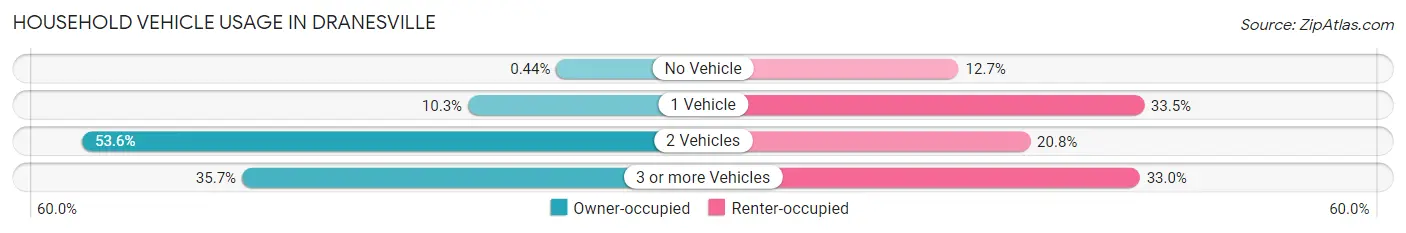
| Vehicles per Household | Owner-occupied | Renter-occupied |
| No Vehicle | 16 (0.4%) | 27 (12.7%) |
| 1 Vehicle | 376 (10.3%) | 71 (33.5%) |
| 2 Vehicles | 1,948 (53.6%) | 44 (20.7%) |
| 3 or more Vehicles | 1,297 (35.7%) | 70 (33.0%) |
| Total | 3,637 (100.0%) | 212 (100.0%) |
Real Estate & Mortgages in Dranesville
Real Estate and Mortgage Overview in Dranesville
| Characteristic | Without Mortgage | With Mortgage |
| Housing Units | 708 | 2,929 |
| Median Property Value | $663,200 | $696,700 |
| Median Household Income | $186,500 | $2,273 |
| Monthly Housing Costs | $1,016 | $1,704 |
| Real Estate Taxes | $7,024 | $16 |
Property Value by Mortgage Status in Dranesville
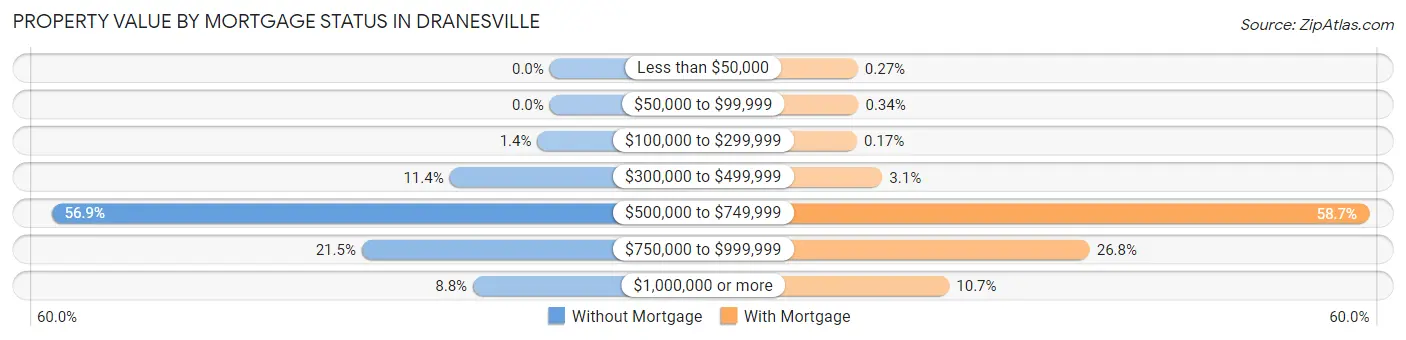
| Property Value | Without Mortgage | With Mortgage |
| Less than $50,000 | 0 (0.0%) | 8 (0.3%) |
| $50,000 to $99,999 | 0 (0.0%) | 10 (0.3%) |
| $100,000 to $299,999 | 10 (1.4%) | 5 (0.2%) |
| $300,000 to $499,999 | 81 (11.4%) | 90 (3.1%) |
| $500,000 to $749,999 | 403 (56.9%) | 1,718 (58.7%) |
| $750,000 to $999,999 | 152 (21.5%) | 784 (26.8%) |
| $1,000,000 or more | 62 (8.8%) | 314 (10.7%) |
| Total | 708 (100.0%) | 2,929 (100.0%) |
Household Income by Mortgage Status in Dranesville
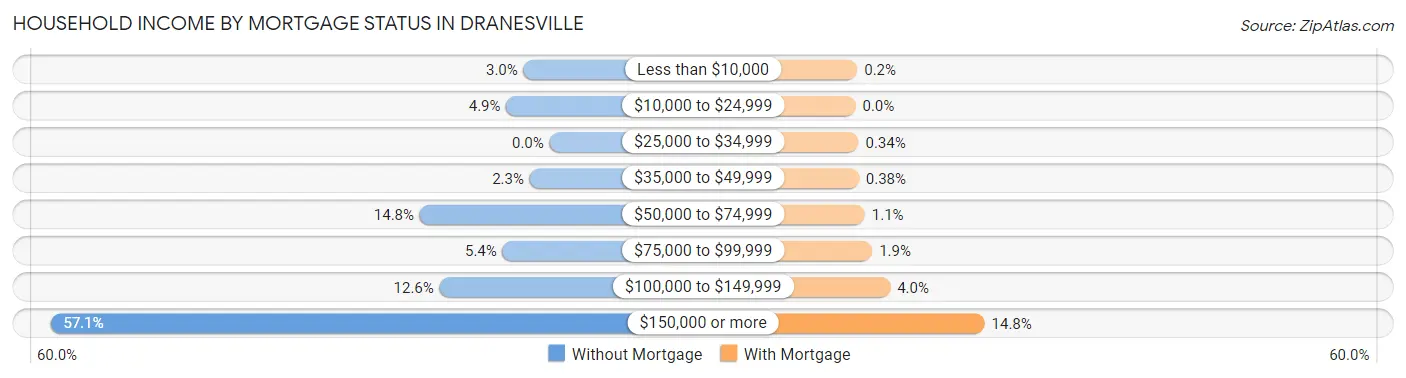
| Household Income | Without Mortgage | With Mortgage |
| Less than $10,000 | 21 (3.0%) | 6 (0.2%) |
| $10,000 to $24,999 | 35 (4.9%) | 0 (0.0%) |
| $25,000 to $34,999 | 0 (0.0%) | 10 (0.3%) |
| $35,000 to $49,999 | 16 (2.3%) | 11 (0.4%) |
| $50,000 to $74,999 | 105 (14.8%) | 31 (1.1%) |
| $75,000 to $99,999 | 38 (5.4%) | 56 (1.9%) |
| $100,000 to $149,999 | 89 (12.6%) | 116 (4.0%) |
| $150,000 or more | 404 (57.1%) | 432 (14.7%) |
| Total | 708 (100.0%) | 2,929 (100.0%) |
Property Value to Household Income Ratio in Dranesville
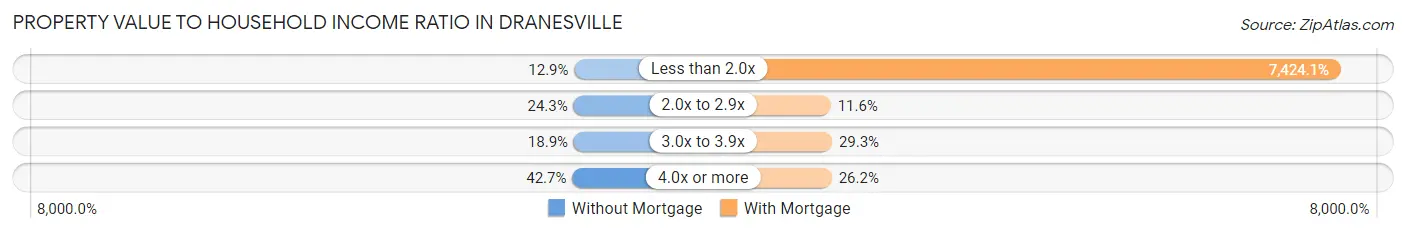
| Value-to-Income Ratio | Without Mortgage | With Mortgage |
| Less than 2.0x | 91 (12.9%) | 217,452 (7,424.1%) |
| 2.0x to 2.9x | 172 (24.3%) | 339 (11.6%) |
| 3.0x to 3.9x | 134 (18.9%) | 858 (29.3%) |
| 4.0x or more | 302 (42.7%) | 768 (26.2%) |
| Total | 708 (100.0%) | 2,929 (100.0%) |
Real Estate Taxes by Mortgage Status in Dranesville
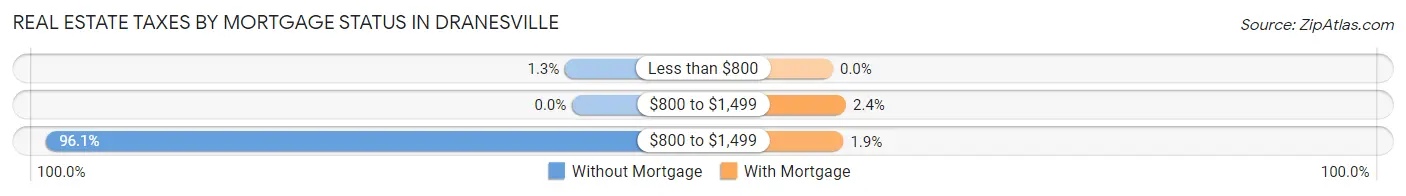
| Property Taxes | Without Mortgage | With Mortgage |
| Less than $800 | 9 (1.3%) | 0 (0.0%) |
| $800 to $1,499 | 0 (0.0%) | 70 (2.4%) |
| $800 to $1,499 | 680 (96.1%) | 56 (1.9%) |
| Total | 708 (100.0%) | 2,929 (100.0%) |
Health & Disability in Dranesville
Health Insurance Coverage by Age in Dranesville
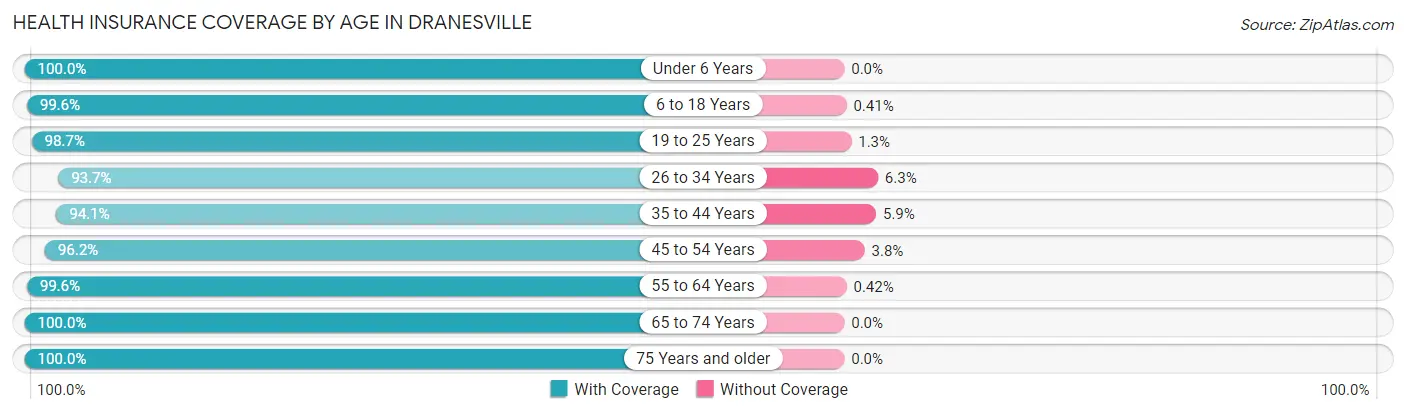
| Age Bracket | With Coverage | Without Coverage |
| Under 6 Years | 843 (100.0%) | 0 (0.0%) |
| 6 to 18 Years | 2,204 (99.6%) | 9 (0.4%) |
| 19 to 25 Years | 984 (98.7%) | 13 (1.3%) |
| 26 to 34 Years | 971 (93.7%) | 65 (6.3%) |
| 35 to 44 Years | 1,572 (94.1%) | 99 (5.9%) |
| 45 to 54 Years | 1,626 (96.2%) | 64 (3.8%) |
| 55 to 64 Years | 1,877 (99.6%) | 8 (0.4%) |
| 65 to 74 Years | 1,223 (100.0%) | 0 (0.0%) |
| 75 Years and older | 578 (100.0%) | 0 (0.0%) |
| Total | 11,878 (97.9%) | 258 (2.1%) |
Health Insurance Coverage by Citizenship Status in Dranesville
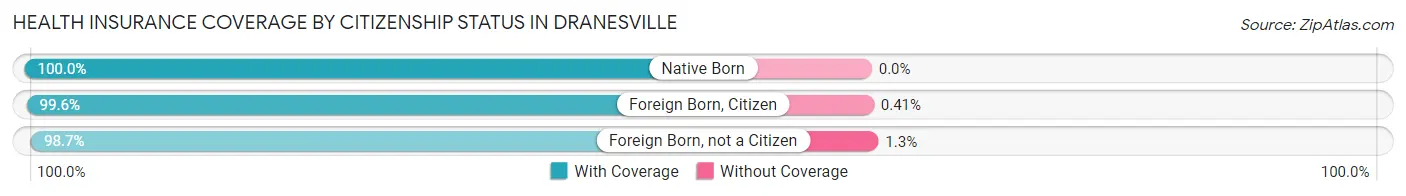
| Citizenship Status | With Coverage | Without Coverage |
| Native Born | 843 (100.0%) | 0 (0.0%) |
| Foreign Born, Citizen | 2,204 (99.6%) | 9 (0.4%) |
| Foreign Born, not a Citizen | 984 (98.7%) | 13 (1.3%) |
Health Insurance Coverage by Household Income in Dranesville
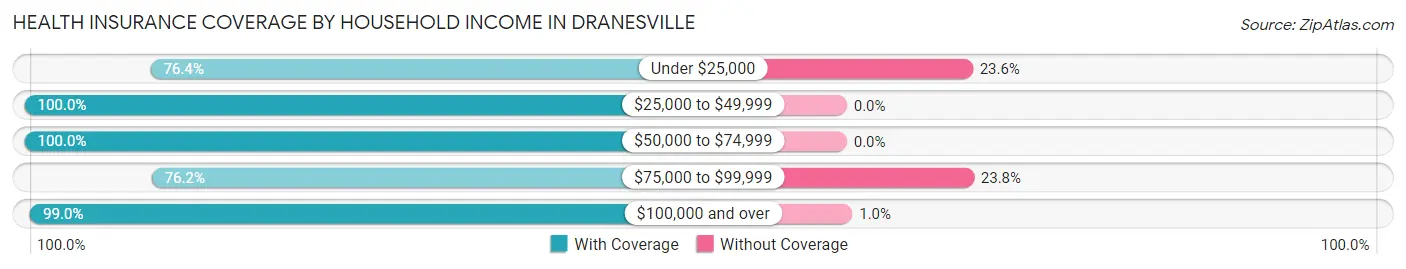
| Household Income | With Coverage | Without Coverage |
| Under $25,000 | 149 (76.4%) | 46 (23.6%) |
| $25,000 to $49,999 | 126 (100.0%) | 0 (0.0%) |
| $50,000 to $74,999 | 386 (100.0%) | 0 (0.0%) |
| $75,000 to $99,999 | 317 (76.2%) | 99 (23.8%) |
| $100,000 and over | 10,900 (99.0%) | 113 (1.0%) |
Public vs Private Health Insurance Coverage by Age in Dranesville
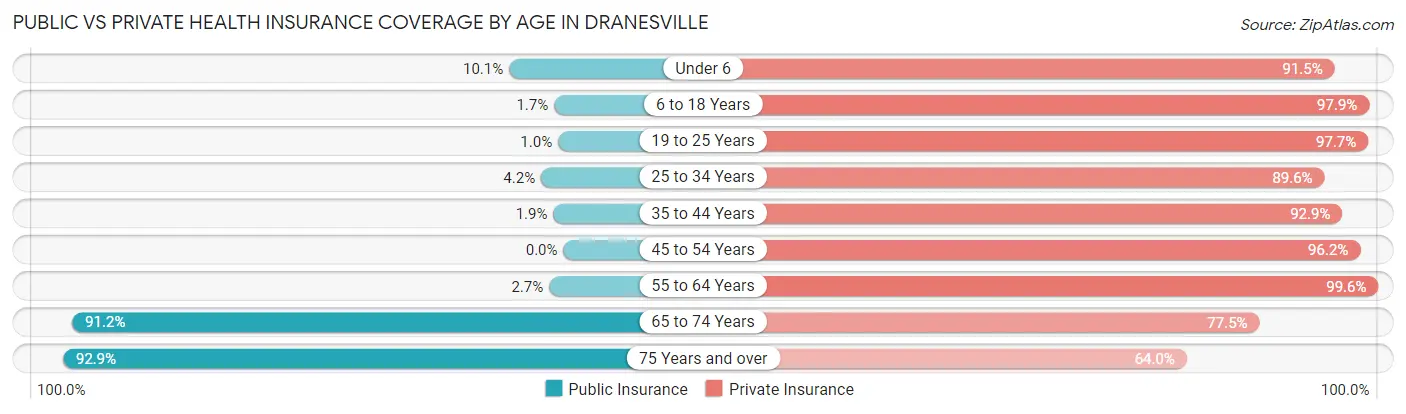
| Age Bracket | Public Insurance | Private Insurance |
| Under 6 | 85 (10.1%) | 771 (91.5%) |
| 6 to 18 Years | 38 (1.7%) | 2,166 (97.9%) |
| 19 to 25 Years | 10 (1.0%) | 974 (97.7%) |
| 25 to 34 Years | 43 (4.2%) | 928 (89.6%) |
| 35 to 44 Years | 31 (1.9%) | 1,552 (92.9%) |
| 45 to 54 Years | 0 (0.0%) | 1,626 (96.2%) |
| 55 to 64 Years | 50 (2.6%) | 1,877 (99.6%) |
| 65 to 74 Years | 1,115 (91.2%) | 948 (77.5%) |
| 75 Years and over | 537 (92.9%) | 370 (64.0%) |
| Total | 1,909 (15.7%) | 11,212 (92.4%) |
Disability Status by Sex by Age in Dranesville
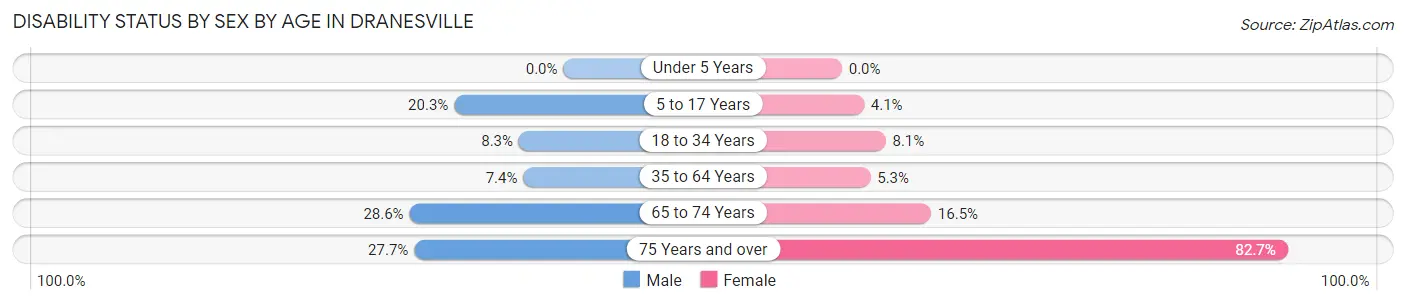
| Age Bracket | Male | Female |
| Under 5 Years | 0 (0.0%) | 0 (0.0%) |
| 5 to 17 Years | 269 (20.3%) | 33 (4.1%) |
| 18 to 34 Years | 112 (8.3%) | 67 (8.1%) |
| 35 to 64 Years | 193 (7.4%) | 140 (5.3%) |
| 65 to 74 Years | 194 (28.6%) | 90 (16.5%) |
| 75 Years and over | 67 (27.7%) | 278 (82.7%) |
Disability Class by Sex by Age in Dranesville
Disability Class: Hearing Difficulty
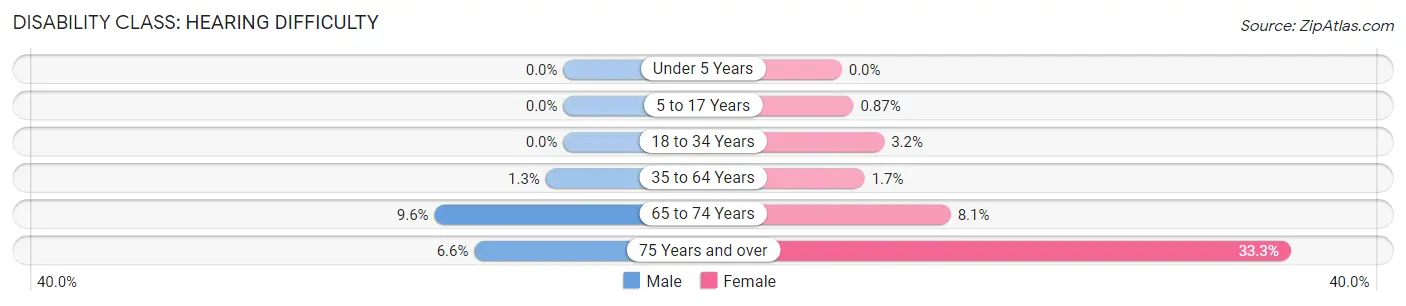
| Age Bracket | Male | Female |
| Under 5 Years | 0 (0.0%) | 0 (0.0%) |
| 5 to 17 Years | 0 (0.0%) | 7 (0.9%) |
| 18 to 34 Years | 0 (0.0%) | 26 (3.2%) |
| 35 to 64 Years | 34 (1.3%) | 45 (1.7%) |
| 65 to 74 Years | 65 (9.6%) | 44 (8.1%) |
| 75 Years and over | 16 (6.6%) | 112 (33.3%) |
Disability Class: Vision Difficulty
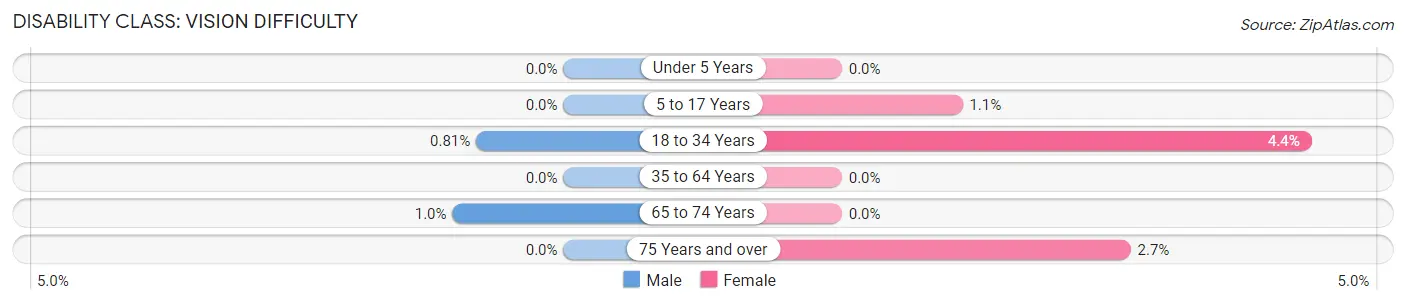
| Age Bracket | Male | Female |
| Under 5 Years | 0 (0.0%) | 0 (0.0%) |
| 5 to 17 Years | 0 (0.0%) | 9 (1.1%) |
| 18 to 34 Years | 11 (0.8%) | 36 (4.4%) |
| 35 to 64 Years | 0 (0.0%) | 0 (0.0%) |
| 65 to 74 Years | 7 (1.0%) | 0 (0.0%) |
| 75 Years and over | 0 (0.0%) | 9 (2.7%) |
Disability Class: Cognitive Difficulty
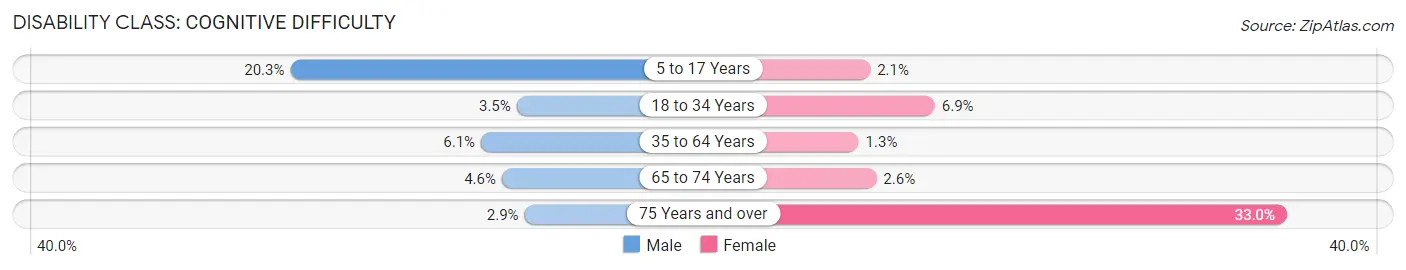
| Age Bracket | Male | Female |
| 5 to 17 Years | 269 (20.3%) | 17 (2.1%) |
| 18 to 34 Years | 47 (3.5%) | 57 (6.9%) |
| 35 to 64 Years | 159 (6.1%) | 33 (1.3%) |
| 65 to 74 Years | 31 (4.6%) | 14 (2.6%) |
| 75 Years and over | 7 (2.9%) | 111 (33.0%) |
Disability Class: Ambulatory Difficulty
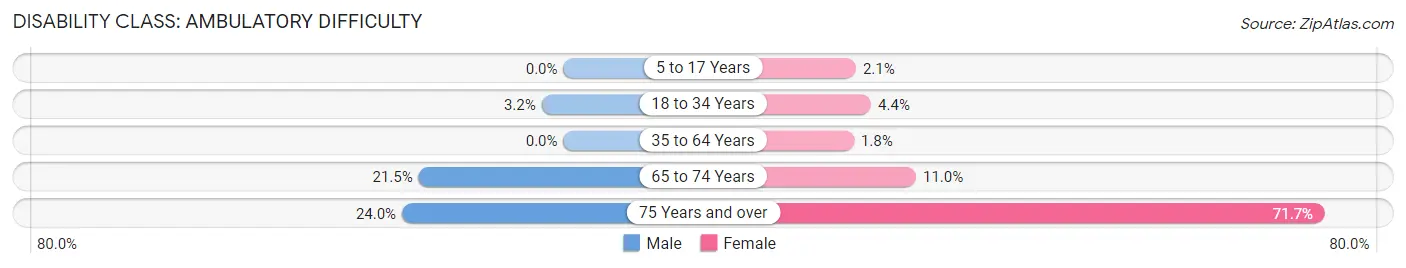
| Age Bracket | Male | Female |
| 5 to 17 Years | 0 (0.0%) | 17 (2.1%) |
| 18 to 34 Years | 44 (3.2%) | 36 (4.4%) |
| 35 to 64 Years | 0 (0.0%) | 48 (1.8%) |
| 65 to 74 Years | 146 (21.5%) | 60 (11.0%) |
| 75 Years and over | 58 (24.0%) | 241 (71.7%) |
Disability Class: Self-Care Difficulty
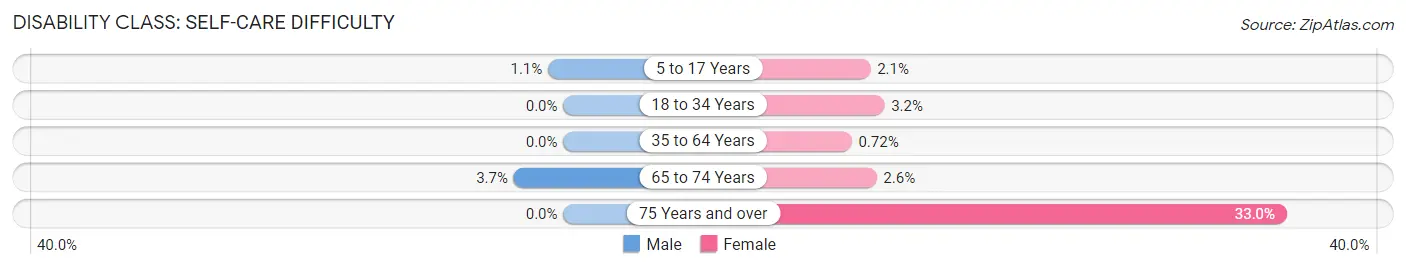
| Age Bracket | Male | Female |
| 5 to 17 Years | 15 (1.1%) | 17 (2.1%) |
| 18 to 34 Years | 0 (0.0%) | 26 (3.2%) |
| 35 to 64 Years | 0 (0.0%) | 19 (0.7%) |
| 65 to 74 Years | 25 (3.7%) | 14 (2.6%) |
| 75 Years and over | 0 (0.0%) | 111 (33.0%) |
Technology Access in Dranesville
Computing Device Access in Dranesville
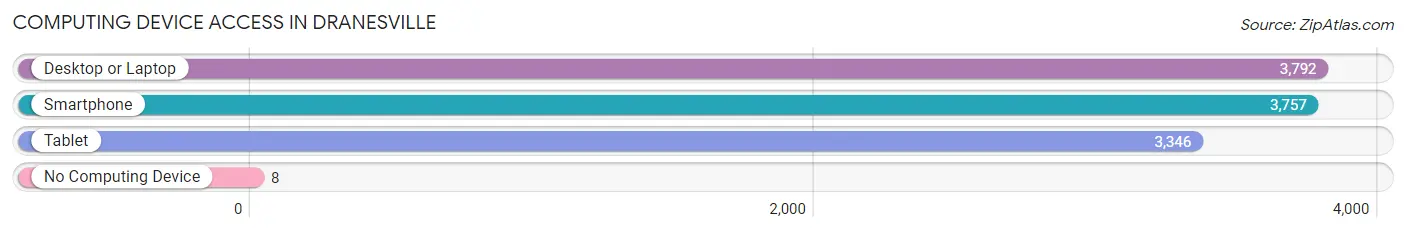
| Device Type | # Households | % Households |
| Desktop or Laptop | 3,792 | 98.5% |
| Smartphone | 3,757 | 97.6% |
| Tablet | 3,346 | 86.9% |
| No Computing Device | 8 | 0.2% |
| Total | 3,849 | 100.0% |
Internet Access in Dranesville
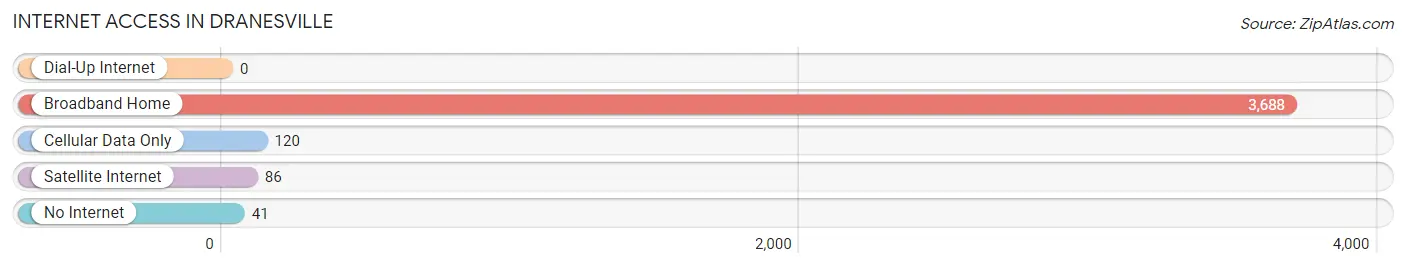
| Internet Type | # Households | % Households |
| Dial-Up Internet | 0 | 0.0% |
| Broadband Home | 3,688 | 95.8% |
| Cellular Data Only | 120 | 3.1% |
| Satellite Internet | 86 | 2.2% |
| No Internet | 41 | 1.1% |
| Total | 3,849 | 100.0% |
Dranesville Summary
Dranesville is a census-designated place (CDP) located in Fairfax County, Virginia. It is situated in the northern part of the county, just south of the Potomac River. The population of Dranesville was 8,945 at the 2010 census.
History
The area now known as Dranesville was first settled in the late 1700s by the Dranes family, who were of English descent. The Dranes family owned a large tract of land in the area, which was eventually divided up and sold off to other settlers. The area was known as Dranesville until the late 1800s, when it was renamed to its current name.
The area was primarily agricultural until the 1950s, when the population began to grow rapidly due to the expansion of the Washington, D.C. metropolitan area. The area was officially designated as a census-designated place in 1980.
Geography
Dranesville is located at 38°58'N 77°10'W (38.967, -77.167). It is situated in the northern part of Fairfax County, just south of the Potomac River. The area is mostly flat, with some rolling hills in the northern part of the CDP.
The CDP has a total area of 8.2 square miles, of which 8.1 square miles is land and 0.1 square miles is water.
Economy
Dranesville is primarily a residential area, with most of its residents commuting to nearby Washington, D.C. for work. The area is home to several large employers, including the National Geospatial-Intelligence Agency, the U.S. Department of Defense, and the U.S. Department of Homeland Security.
Demographics
As of the 2010 census, there were 8,945 people, 3,541 households, and 2,541 families residing in the CDP. The population density was 1,098.7 people per square mile. The racial makeup of the CDP was 79.2% White, 8.3% African American, 0.3% Native American, 6.7% Asian, 0.1% Pacific Islander, 2.3% from other races, and 3.3% from two or more races. Hispanic or Latino of any race were 6.7% of the population.
The median income for a household in the CDP was $107,917, and the median income for a family was $122,917. The per capita income for the CDP was $50,917. About 2.3% of families and 3.3% of the population were below the poverty line, including 4.3% of those under age 18 and 2.3% of those age 65 or over.
Common Questions
What is Per Capita Income in Dranesville?
Per Capita income in Dranesville is $74,325.
What is the Median Family Income in Dranesville?
Median Family Income in Dranesville is $217,019.
What is the Median Household income in Dranesville?
Median Household Income in Dranesville is $206,344.
What is Income or Wage Gap in Dranesville?
Income or Wage Gap in Dranesville is 38.9%.
Women in Dranesville earn 61.1 cents for every dollar earned by a man.
What is Inequality or Gini Index in Dranesville?
Inequality or Gini Index in Dranesville is 0.32.
What is the Total Population of Dranesville?
Total Population of Dranesville is 12,154.
What is the Total Male Population of Dranesville?
Total Male Population of Dranesville is 6,504.
What is the Total Female Population of Dranesville?
Total Female Population of Dranesville is 5,650.
What is the Ratio of Males per 100 Females in Dranesville?
There are 115.12 Males per 100 Females in Dranesville.
What is the Ratio of Females per 100 Males in Dranesville?
There are 86.87 Females per 100 Males in Dranesville.
What is the Median Population Age in Dranesville?
Median Population Age in Dranesville is 40.0 Years.
What is the Average Family Size in Dranesville
Average Family Size in Dranesville is 3.4 People.
What is the Average Household Size in Dranesville
Average Household Size in Dranesville is 3.2 People.
How Large is the Labor Force in Dranesville?
There are 6,735 People in the Labor Forcein in Dranesville.
What is the Percentage of People in the Labor Force in Dranesville?
70.0% of People are in the Labor Force in Dranesville.
What is the Unemployment Rate in Dranesville?
Unemployment Rate in Dranesville is 3.4%.