Colonial Beach, VA Map & Demographics
Colonial Beach Map
Colonial Beach Overview
$36,187
PER CAPITA INCOME
$90,956
AVG FAMILY INCOME
$55,731
AVG HOUSEHOLD INCOME
57.7%
WAGE / INCOME GAP [ % ]
42.3¢/ $1
WAGE / INCOME GAP [ $ ]
0.47
INEQUALITY / GINI INDEX
3,895
TOTAL POPULATION
1,850
MALE POPULATION
2,045
FEMALE POPULATION
90.46
MALES / 100 FEMALES
110.54
FEMALES / 100 MALES
46.9
MEDIAN AGE
3.1
AVG FAMILY SIZE
2.0
AVG HOUSEHOLD SIZE
1,477
LABOR FORCE [ PEOPLE ]
45.8%
PERCENT IN LABOR FORCE
4.1%
UNEMPLOYMENT RATE
Colonial Beach Zip Codes
Colonial Beach Area Codes
Income in Colonial Beach
Income Overview in Colonial Beach
Per Capita Income in Colonial Beach is $36,187, while median incomes of families and households are $90,956 and $55,731 respectively.
| Characteristic | Number | Measure |
| Per Capita Income | 3,895 | $36,187 |
| Median Family Income | 737 | $90,956 |
| Mean Family Income | 737 | $100,660 |
| Median Household Income | 1,865 | $55,731 |
| Mean Household Income | 1,865 | $69,334 |
| Income Deficit | 737 | $0 |
| Wage / Income Gap (%) | 3,895 | 57.70% |
| Wage / Income Gap ($) | 3,895 | 42.30¢ per $1 |
| Gini / Inequality Index | 3,895 | 0.47 |
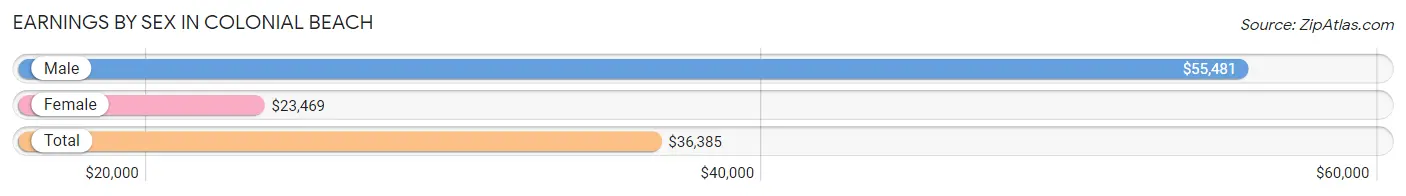
Earnings by Sex in Colonial Beach
Average Earnings in Colonial Beach are $36,385, $55,481 for men and $23,469 for women, a difference of 57.7%.
| Sex | Number | Average Earnings |
| Male | 978 (53.1%) | $55,481 |
| Female | 865 (46.9%) | $23,469 |
| Total | 1,843 (100.0%) | $36,385 |
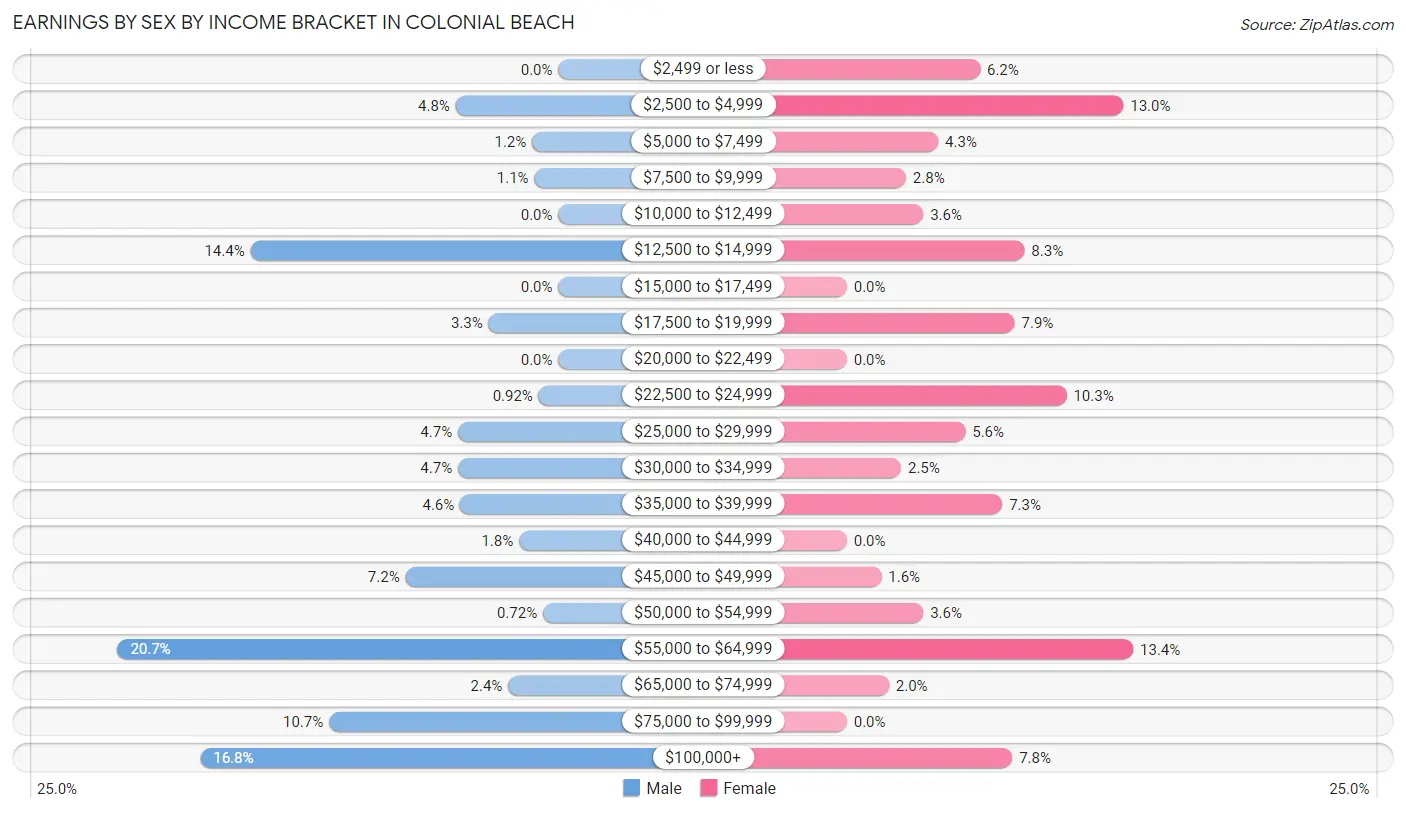
Earnings by Sex by Income Bracket in Colonial Beach
The most common earnings brackets in Colonial Beach are $55,000 to $64,999 for men (202 | 20.6%) and $55,000 to $64,999 for women (116 | 13.4%).
| Income | Male | Female |
| $2,499 or less | 0 (0.0%) | 54 (6.2%) |
| $2,500 to $4,999 | 47 (4.8%) | 112 (13.0%) |
| $5,000 to $7,499 | 12 (1.2%) | 37 (4.3%) |
| $7,500 to $9,999 | 11 (1.1%) | 24 (2.8%) |
| $10,000 to $12,499 | 0 (0.0%) | 31 (3.6%) |
| $12,500 to $14,999 | 141 (14.4%) | 72 (8.3%) |
| $15,000 to $17,499 | 0 (0.0%) | 0 (0.0%) |
| $17,500 to $19,999 | 32 (3.3%) | 68 (7.9%) |
| $20,000 to $22,499 | 0 (0.0%) | 0 (0.0%) |
| $22,500 to $24,999 | 9 (0.9%) | 89 (10.3%) |
| $25,000 to $29,999 | 46 (4.7%) | 48 (5.6%) |
| $30,000 to $34,999 | 46 (4.7%) | 22 (2.5%) |
| $35,000 to $39,999 | 45 (4.6%) | 63 (7.3%) |
| $40,000 to $44,999 | 18 (1.8%) | 0 (0.0%) |
| $45,000 to $49,999 | 70 (7.2%) | 14 (1.6%) |
| $50,000 to $54,999 | 7 (0.7%) | 31 (3.6%) |
| $55,000 to $64,999 | 202 (20.6%) | 116 (13.4%) |
| $65,000 to $74,999 | 23 (2.4%) | 17 (2.0%) |
| $75,000 to $99,999 | 105 (10.7%) | 0 (0.0%) |
| $100,000+ | 164 (16.8%) | 67 (7.7%) |
| Total | 978 (100.0%) | 865 (100.0%) |
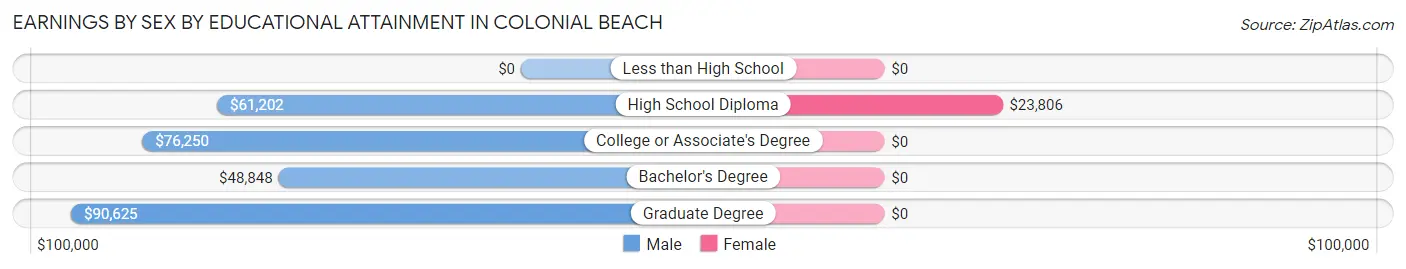
Earnings by Sex by Educational Attainment in Colonial Beach
Average earnings in Colonial Beach are $61,923 for men and $23,989 for women, a difference of 61.3%. Men with an educational attainment of graduate degree enjoy the highest average annual earnings of $90,625, while those with bachelor's degree education earn the least with $48,848. Women with an educational attainment of high school diploma earn the most with the average annual earnings of $23,806, while those with high school diploma education have the smallest earnings of $23,806.
| Educational Attainment | Male Income | Female Income |
| Less than High School | - | - |
| High School Diploma | $61,202 | $23,806 |
| College or Associate's Degree | $76,250 | $0 |
| Bachelor's Degree | $48,848 | $0 |
| Graduate Degree | $90,625 | $0 |
| Total | $61,923 | $23,989 |
Family Income in Colonial Beach
Family Income Brackets in Colonial Beach
According to the Colonial Beach family income data, there are 170 families falling into the $75,000 to $99,999 income range, which is the most common income bracket and makes up 23.1% of all families. Conversely, the $15,000 to $24,999 income bracket is the least frequent group with only 2 families (0.3%) belonging to this category.
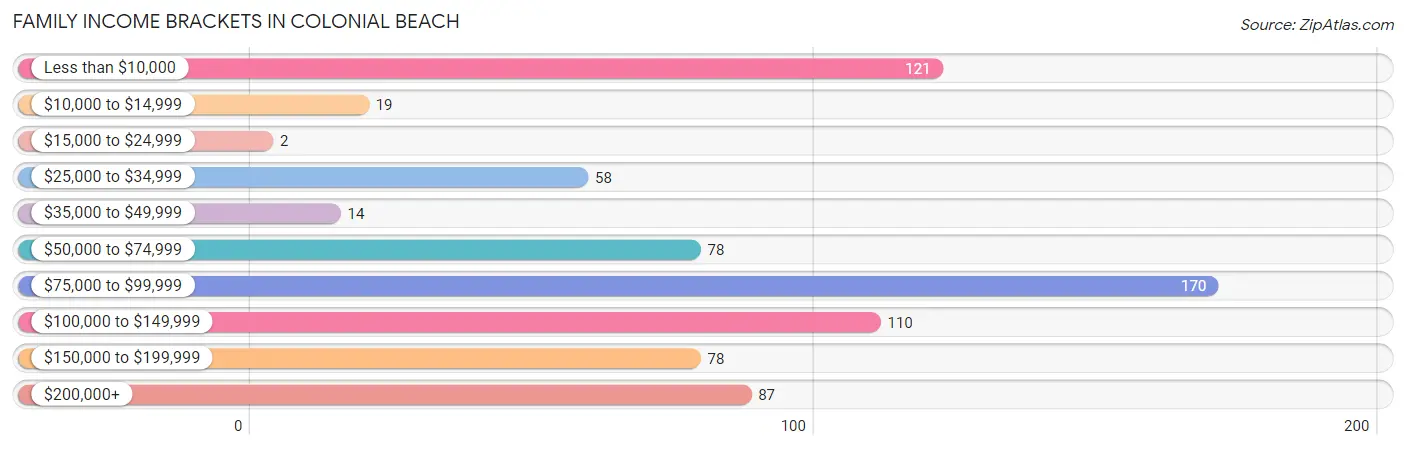
| Income Bracket | # Families | % Families |
| Less than $10,000 | 121 | 16.4% |
| $10,000 to $14,999 | 19 | 2.6% |
| $15,000 to $24,999 | 2 | 0.3% |
| $25,000 to $34,999 | 58 | 7.9% |
| $35,000 to $49,999 | 14 | 1.9% |
| $50,000 to $74,999 | 78 | 10.6% |
| $75,000 to $99,999 | 170 | 23.1% |
| $100,000 to $149,999 | 110 | 14.9% |
| $150,000 to $199,999 | 78 | 10.6% |
| $200,000+ | 87 | 11.8% |
Family Income by Famaliy Size in Colonial Beach
4-person families (95 | 12.9%) account for the highest median family income in Colonial Beach with $162,917 per family, while 2-person families (441 | 59.8%) have the highest median income of $46,625 per family member.
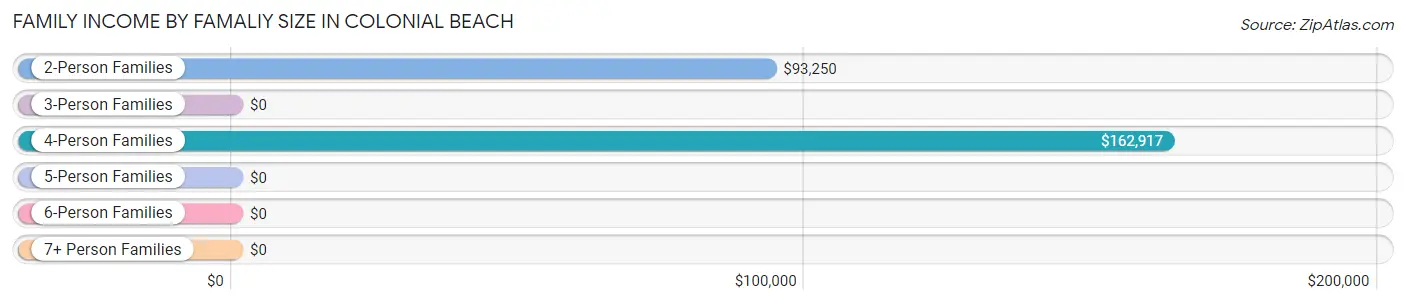
| Income Bracket | # Families | Median Income |
| 2-Person Families | 441 (59.8%) | $93,250 |
| 3-Person Families | 105 (14.2%) | $0 |
| 4-Person Families | 95 (12.9%) | $162,917 |
| 5-Person Families | 56 (7.6%) | $0 |
| 6-Person Families | 40 (5.4%) | $0 |
| 7+ Person Families | 0 (0.0%) | $0 |
| Total | 737 (100.0%) | $90,956 |
Family Income by Number of Earners in Colonial Beach
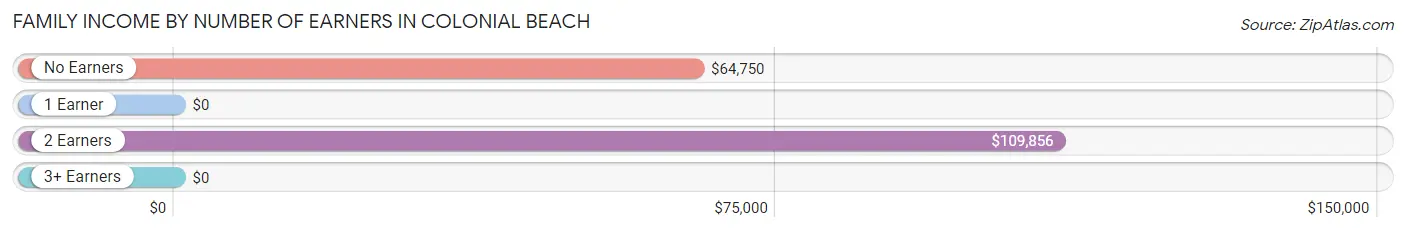
| Number of Earners | # Families | Median Income |
| No Earners | 208 (28.2%) | $64,750 |
| 1 Earner | 231 (31.3%) | $0 |
| 2 Earners | 271 (36.8%) | $109,856 |
| 3+ Earners | 27 (3.7%) | $0 |
| Total | 737 (100.0%) | $90,956 |
Household Income in Colonial Beach
Household Income Brackets in Colonial Beach
With 362 households falling in the category, the $75,000 to $99,999 income range is the most frequent in Colonial Beach, accounting for 19.4% of all households. In contrast, only 86 households (4.6%) fall into the $25,000 to $34,999 income bracket, making it the least populous group.
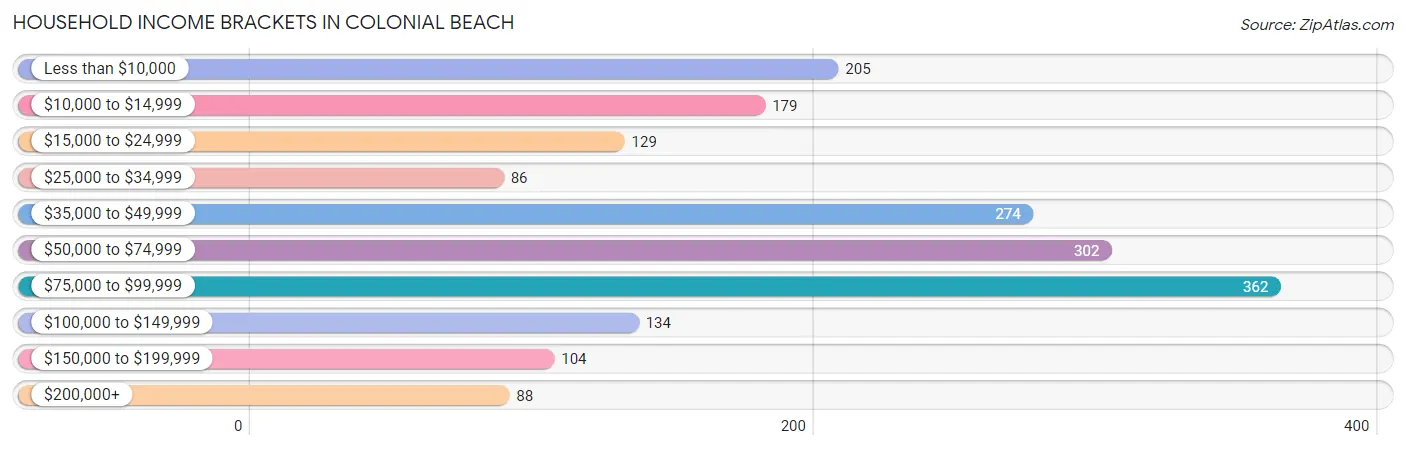
| Income Bracket | # Households | % Households |
| Less than $10,000 | 205 | 11.0% |
| $10,000 to $14,999 | 179 | 9.6% |
| $15,000 to $24,999 | 129 | 6.9% |
| $25,000 to $34,999 | 86 | 4.6% |
| $35,000 to $49,999 | 274 | 14.7% |
| $50,000 to $74,999 | 302 | 16.2% |
| $75,000 to $99,999 | 362 | 19.4% |
| $100,000 to $149,999 | 134 | 7.2% |
| $150,000 to $199,999 | 104 | 5.6% |
| $200,000+ | 88 | 4.7% |
Household Income by Householder Age in Colonial Beach
The median household income in Colonial Beach is $55,731, with the highest median household income of $87,931 found in the 25 to 44 years age bracket for the primary householder. A total of 534 households (28.6%) fall into this category. Meanwhile, the 15 to 24 years age bracket for the primary householder has the lowest median household income of $0, with 13 households (0.7%) in this group.
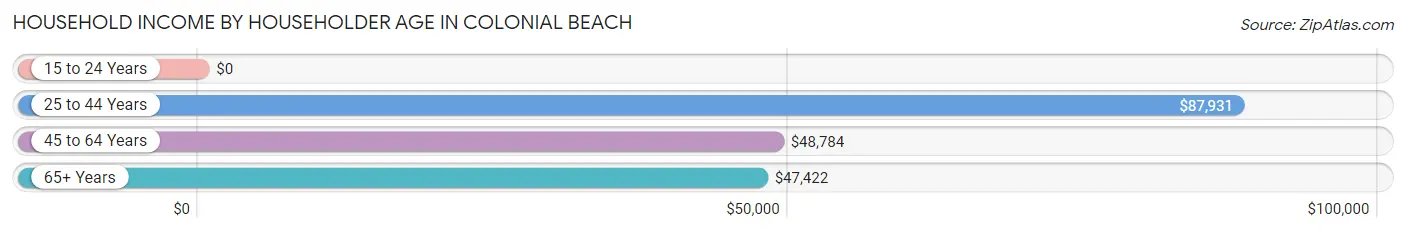
| Income Bracket | # Households | Median Income |
| 15 to 24 Years | 13 (0.7%) | $0 |
| 25 to 44 Years | 534 (28.6%) | $87,931 |
| 45 to 64 Years | 659 (35.3%) | $48,784 |
| 65+ Years | 659 (35.3%) | $47,422 |
| Total | 1,865 (100.0%) | $55,731 |
Poverty in Colonial Beach
Income Below Poverty by Sex and Age in Colonial Beach
With 29.9% poverty level for males and 25.8% for females among the residents of Colonial Beach, under 5 year old males and 6 to 11 year old females are the most vulnerable to poverty, with 9 males (100.0%) and 102 females (100.0%) in their respective age groups living below the poverty level.
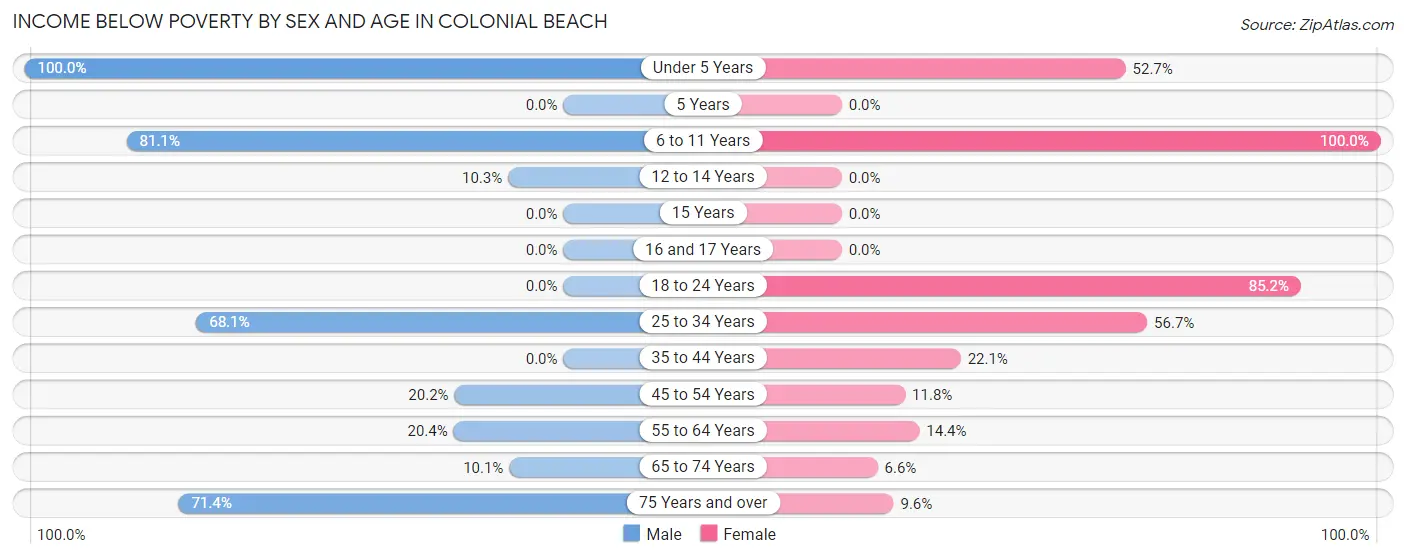
| Age Bracket | Male | Female |
| Under 5 Years | 9 (100.0%) | 59 (52.7%) |
| 5 Years | 0 (0.0%) | 0 (0.0%) |
| 6 to 11 Years | 107 (81.1%) | 102 (100.0%) |
| 12 to 14 Years | 16 (10.3%) | 0 (0.0%) |
| 15 Years | 0 (0.0%) | 0 (0.0%) |
| 16 and 17 Years | 0 (0.0%) | 0 (0.0%) |
| 18 to 24 Years | 0 (0.0%) | 69 (85.2%) |
| 25 to 34 Years | 141 (68.1%) | 106 (56.7%) |
| 35 to 44 Years | 0 (0.0%) | 64 (22.1%) |
| 45 to 54 Years | 36 (20.2%) | 18 (11.8%) |
| 55 to 64 Years | 53 (20.4%) | 54 (14.4%) |
| 65 to 74 Years | 21 (10.1%) | 31 (6.6%) |
| 75 Years and over | 135 (71.4%) | 12 (9.6%) |
| Total | 518 (29.9%) | 515 (25.8%) |
Income Above Poverty by Sex and Age in Colonial Beach
According to the poverty statistics in Colonial Beach, males aged 18 to 24 years and females aged 5 years are the age groups that are most secure financially, with 100.0% of males and 100.0% of females in these age groups living above the poverty line.
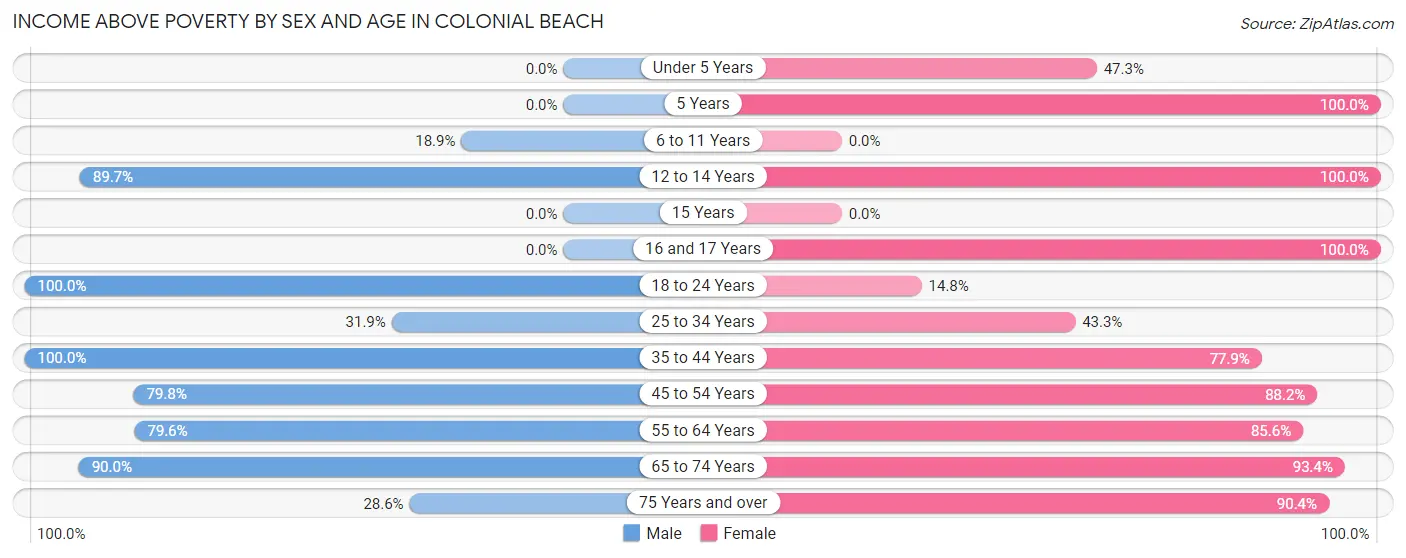
| Age Bracket | Male | Female |
| Under 5 Years | 0 (0.0%) | 53 (47.3%) |
| 5 Years | 0 (0.0%) | 47 (100.0%) |
| 6 to 11 Years | 25 (18.9%) | 0 (0.0%) |
| 12 to 14 Years | 140 (89.7%) | 9 (100.0%) |
| 15 Years | 0 (0.0%) | 0 (0.0%) |
| 16 and 17 Years | 0 (0.0%) | 49 (100.0%) |
| 18 to 24 Years | 82 (100.0%) | 12 (14.8%) |
| 25 to 34 Years | 66 (31.9%) | 81 (43.3%) |
| 35 to 44 Years | 308 (100.0%) | 226 (77.9%) |
| 45 to 54 Years | 142 (79.8%) | 135 (88.2%) |
| 55 to 64 Years | 207 (79.6%) | 321 (85.6%) |
| 65 to 74 Years | 188 (89.9%) | 436 (93.4%) |
| 75 Years and over | 54 (28.6%) | 113 (90.4%) |
| Total | 1,212 (70.1%) | 1,482 (74.2%) |
Income Below Poverty Among Married-Couple Families in Colonial Beach
The poverty statistics for married-couple families in Colonial Beach show that 4.8% or 23 of the total 481 families live below the poverty line. Families with no children have the highest poverty rate of 7.1%, comprising of 23 families. On the other hand, families with 1 or 2 children have the lowest poverty rate of 0.0%, which includes 0 families.
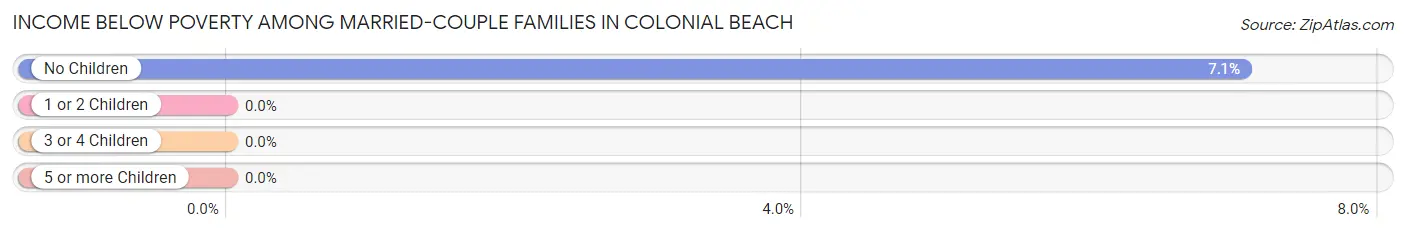
| Children | Above Poverty | Below Poverty |
| No Children | 303 (92.9%) | 23 (7.1%) |
| 1 or 2 Children | 155 (100.0%) | 0 (0.0%) |
| 3 or 4 Children | 0 (0.0%) | 0 (0.0%) |
| 5 or more Children | 0 (0.0%) | 0 (0.0%) |
| Total | 458 (95.2%) | 23 (4.8%) |
Income Below Poverty Among Single-Parent Households in Colonial Beach
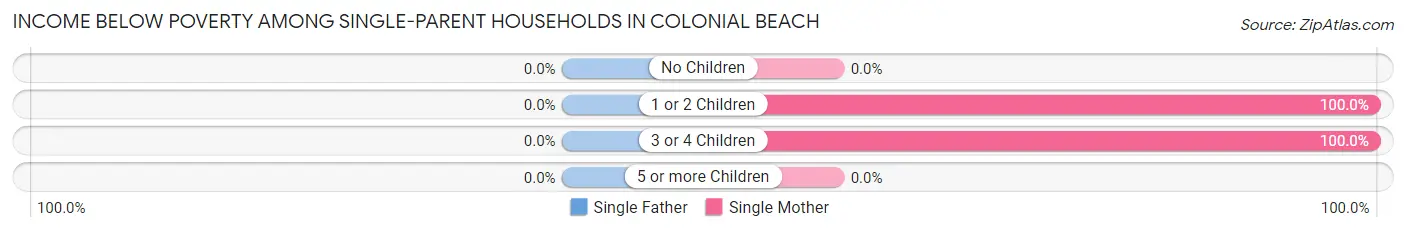
| Children | Single Father | Single Mother |
| No Children | 0 (0.0%) | 0 (0.0%) |
| 1 or 2 Children | 0 (0.0%) | 77 (100.0%) |
| 3 or 4 Children | 0 (0.0%) | 75 (100.0%) |
| 5 or more Children | 0 (0.0%) | 0 (0.0%) |
| Total | 0 (0.0%) | 152 (63.1%) |
Income Below Poverty Among Married-Couple vs Single-Parent Households in Colonial Beach
The poverty data for Colonial Beach shows that 23 of the married-couple family households (4.8%) and 152 of the single-parent households (59.4%) are living below the poverty level. Within the married-couple family households, those with no children have the highest poverty rate, with 23 households (7.1%) falling below the poverty line. Among the single-parent households, those with 3 or 4 children have the highest poverty rate, with 75 household (100.0%) living below poverty.
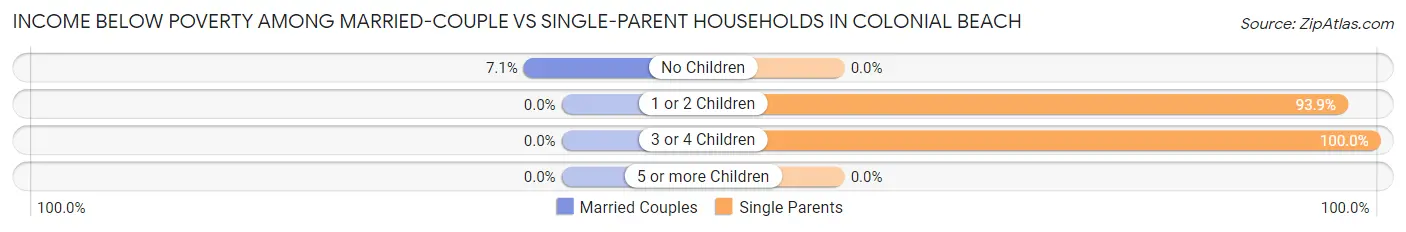
| Children | Married-Couple Families | Single-Parent Households |
| No Children | 23 (7.1%) | 0 (0.0%) |
| 1 or 2 Children | 0 (0.0%) | 77 (93.9%) |
| 3 or 4 Children | 0 (0.0%) | 75 (100.0%) |
| 5 or more Children | 0 (0.0%) | 0 (0.0%) |
| Total | 23 (4.8%) | 152 (59.4%) |
Race in Colonial Beach
The most populous races in Colonial Beach are White / Caucasian (3,176 | 81.5%), Black / African American (351 | 9.0%), and Two or more Races (175 | 4.5%).
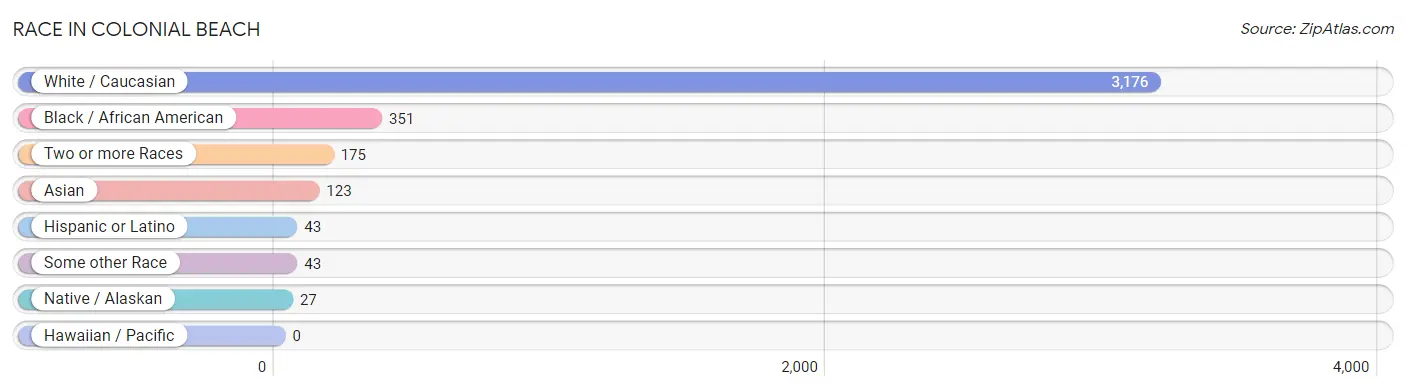
| Race | # Population | % Population |
| Asian | 123 | 3.2% |
| Black / African American | 351 | 9.0% |
| Hawaiian / Pacific | 0 | 0.0% |
| Hispanic or Latino | 43 | 1.1% |
| Native / Alaskan | 27 | 0.7% |
| White / Caucasian | 3,176 | 81.5% |
| Two or more Races | 175 | 4.5% |
| Some other Race | 43 | 1.1% |
| Total | 3,895 | 100.0% |
Ancestry in Colonial Beach
The most populous ancestries reported in Colonial Beach are English (732 | 18.8%), Italian (651 | 16.7%), Irish (553 | 14.2%), American (446 | 11.5%), and German (360 | 9.2%), together accounting for 70.4% of all Colonial Beach residents.
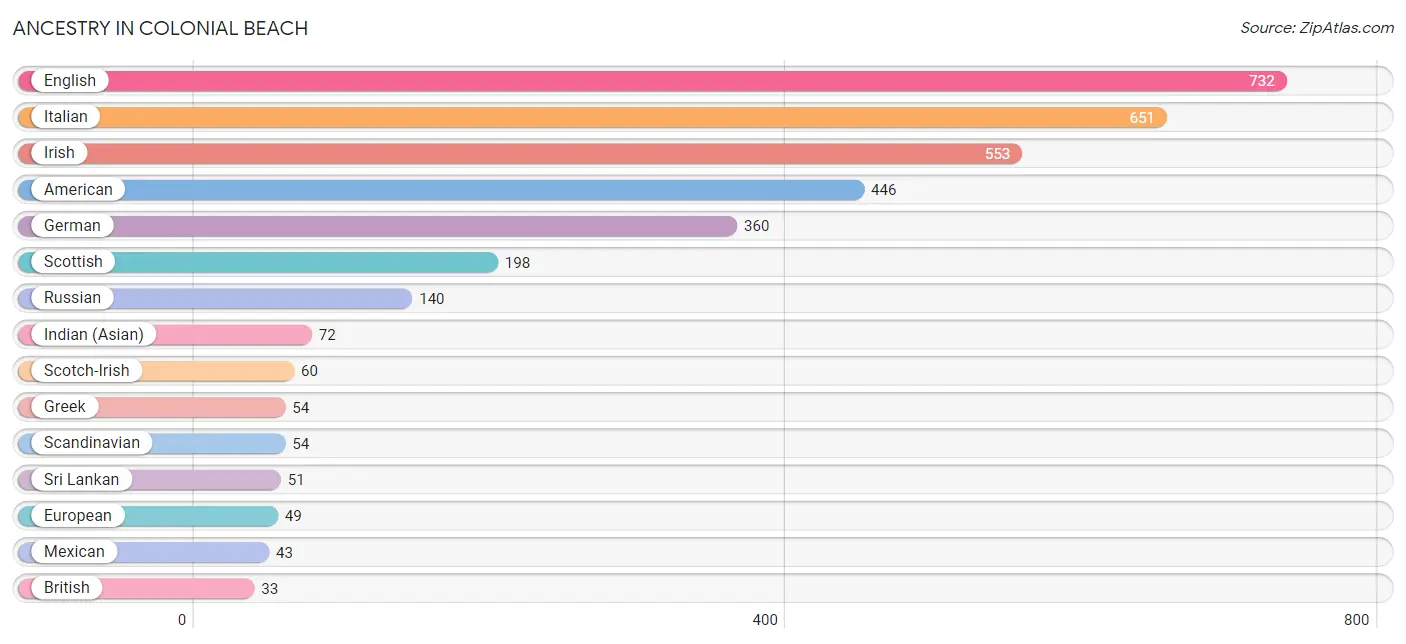
| Ancestry | # Population | % Population |
| American | 446 | 11.5% |
| Arab | 1 | 0.0% |
| Blackfeet | 18 | 0.5% |
| British | 33 | 0.9% |
| Danish | 14 | 0.4% |
| Dutch | 22 | 0.6% |
| English | 732 | 18.8% |
| European | 49 | 1.3% |
| French | 5 | 0.1% |
| French Canadian | 17 | 0.4% |
| German | 360 | 9.2% |
| Greek | 54 | 1.4% |
| Indian (Asian) | 72 | 1.8% |
| Irish | 553 | 14.2% |
| Italian | 651 | 16.7% |
| Mexican | 43 | 1.1% |
| Palestinian | 1 | 0.0% |
| Polish | 17 | 0.4% |
| Potawatomi | 18 | 0.5% |
| Russian | 140 | 3.6% |
| Scandinavian | 54 | 1.4% |
| Scotch-Irish | 60 | 1.5% |
| Scottish | 198 | 5.1% |
| Sri Lankan | 51 | 1.3% |
| Swiss | 31 | 0.8% |
| Welsh | 21 | 0.5% | View All 26 Rows |
Immigrants in Colonial Beach
The most numerous immigrant groups reported in Colonial Beach came from Asia (62 | 1.6%), South Eastern Asia (35 | 0.9%), Vietnam (35 | 0.9%), China (27 | 0.7%), and Eastern Asia (27 | 0.7%), together accounting for 4.8% of all Colonial Beach residents.
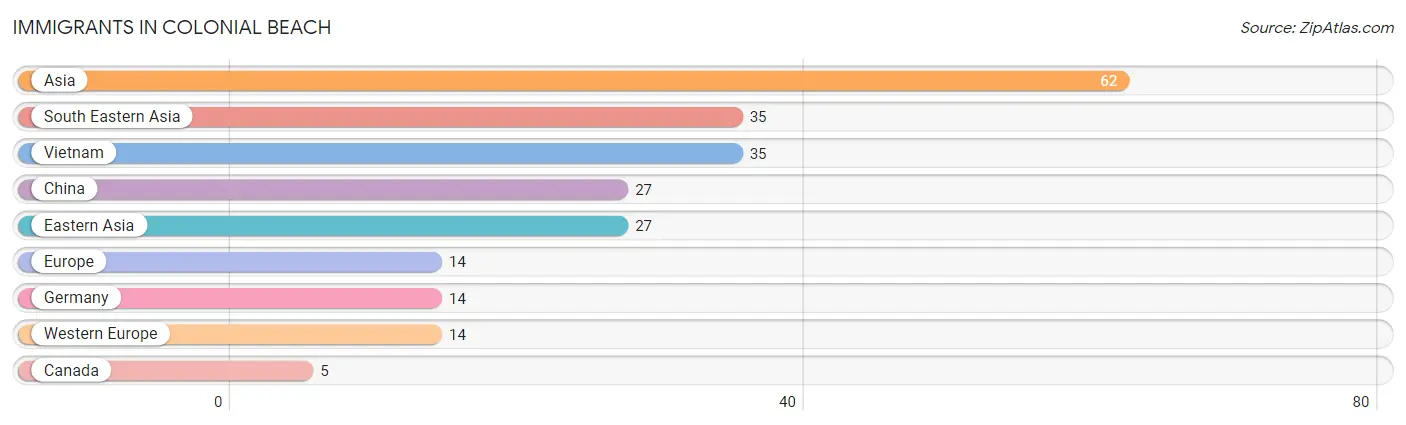
| Immigration Origin | # Population | % Population |
| Asia | 62 | 1.6% |
| Canada | 5 | 0.1% |
| China | 27 | 0.7% |
| Eastern Asia | 27 | 0.7% |
| Europe | 14 | 0.4% |
| Germany | 14 | 0.4% |
| South Eastern Asia | 35 | 0.9% |
| Vietnam | 35 | 0.9% |
| Western Europe | 14 | 0.4% | View All 9 Rows |
Sex and Age in Colonial Beach
Sex and Age in Colonial Beach
The most populous age groups in Colonial Beach are 25 to 29 Years (193 | 10.4%) for men and 70 to 74 Years (322 | 15.8%) for women.
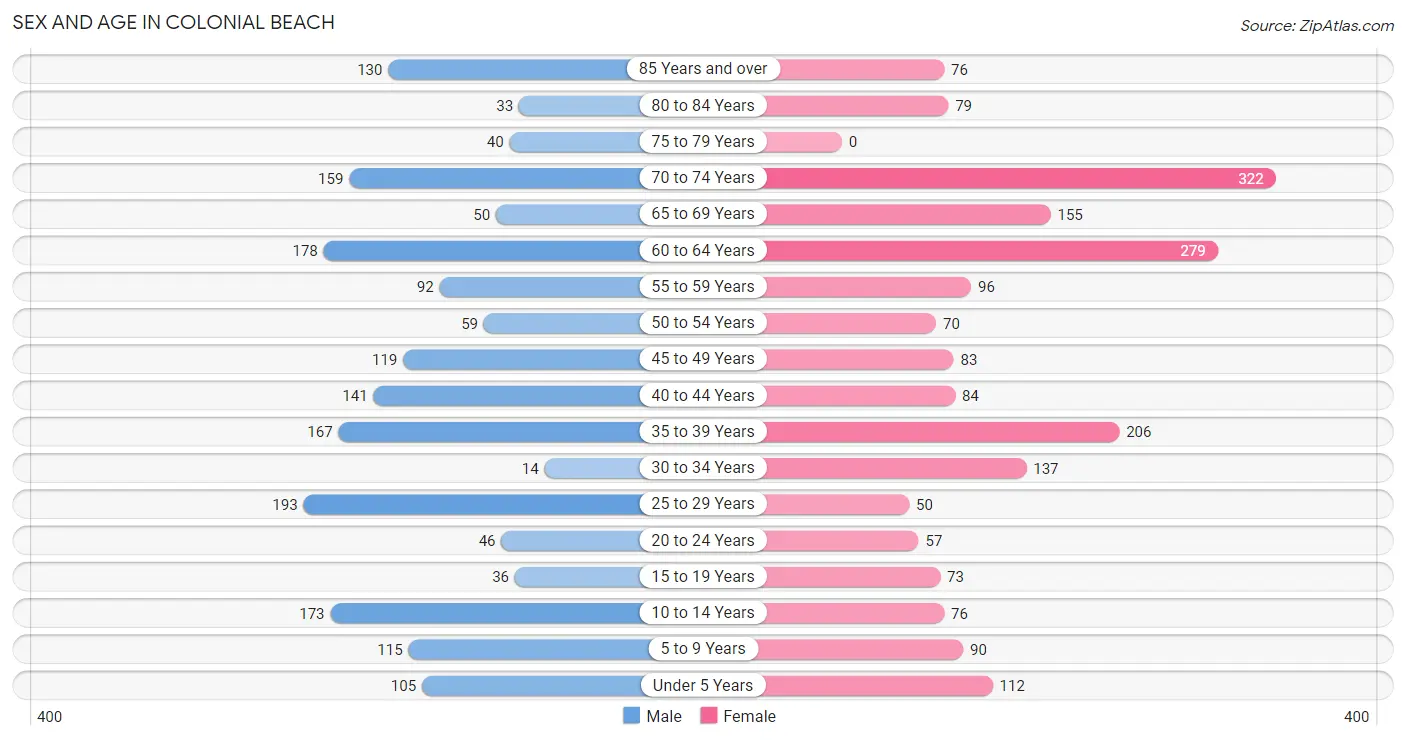
| Age Bracket | Male | Female |
| Under 5 Years | 105 (5.7%) | 112 (5.5%) |
| 5 to 9 Years | 115 (6.2%) | 90 (4.4%) |
| 10 to 14 Years | 173 (9.3%) | 76 (3.7%) |
| 15 to 19 Years | 36 (1.9%) | 73 (3.6%) |
| 20 to 24 Years | 46 (2.5%) | 57 (2.8%) |
| 25 to 29 Years | 193 (10.4%) | 50 (2.4%) |
| 30 to 34 Years | 14 (0.8%) | 137 (6.7%) |
| 35 to 39 Years | 167 (9.0%) | 206 (10.1%) |
| 40 to 44 Years | 141 (7.6%) | 84 (4.1%) |
| 45 to 49 Years | 119 (6.4%) | 83 (4.1%) |
| 50 to 54 Years | 59 (3.2%) | 70 (3.4%) |
| 55 to 59 Years | 92 (5.0%) | 96 (4.7%) |
| 60 to 64 Years | 178 (9.6%) | 279 (13.6%) |
| 65 to 69 Years | 50 (2.7%) | 155 (7.6%) |
| 70 to 74 Years | 159 (8.6%) | 322 (15.8%) |
| 75 to 79 Years | 40 (2.2%) | 0 (0.0%) |
| 80 to 84 Years | 33 (1.8%) | 79 (3.9%) |
| 85 Years and over | 130 (7.0%) | 76 (3.7%) |
| Total | 1,850 (100.0%) | 2,045 (100.0%) |
Families and Households in Colonial Beach
Median Family Size in Colonial Beach
The median family size in Colonial Beach is 3.11 persons per family, with single female/mother families (241 | 32.7%) accounting for the largest median family size of 3.3 persons per family. On the other hand, single male/father families (15 | 2.0%) represent the smallest median family size with 2.27 persons per family.
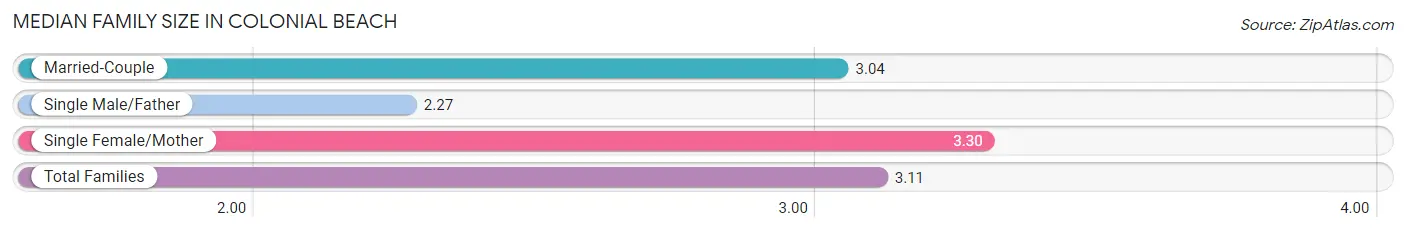
| Family Type | # Families | Family Size |
| Married-Couple | 481 (65.3%) | 3.04 |
| Single Male/Father | 15 (2.0%) | 2.27 |
| Single Female/Mother | 241 (32.7%) | 3.30 |
| Total Families | 737 (100.0%) | 3.11 |
Median Household Size in Colonial Beach
The median household size in Colonial Beach is 2.05 persons per household, with single female/mother households (241 | 12.9%) accounting for the largest median household size of 3.43 persons per household. non-family households (1,128 | 60.5%) represent the smallest median household size with 1.34 persons per household.
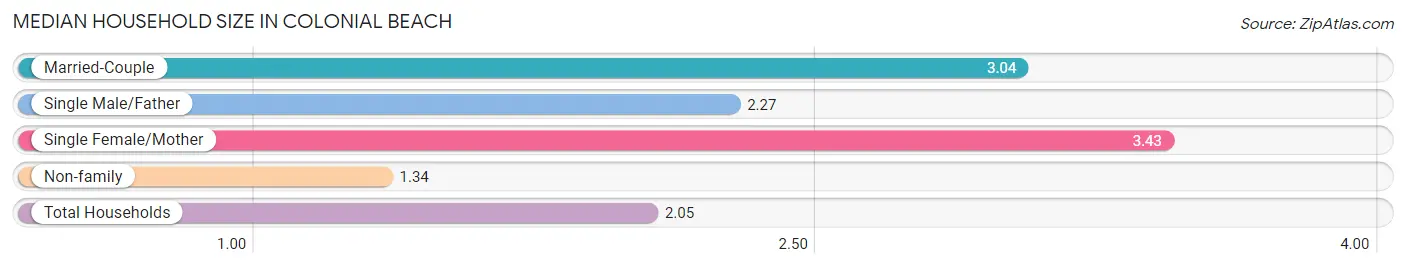
| Household Type | # Households | Household Size |
| Married-Couple | 481 (25.8%) | 3.04 |
| Single Male/Father | 15 (0.8%) | 2.27 |
| Single Female/Mother | 241 (12.9%) | 3.43 |
| Non-family | 1,128 (60.5%) | 1.34 |
| Total Households | 1,865 (100.0%) | 2.05 |
Household Size by Marriage Status in Colonial Beach
Out of a total of 1,865 households in Colonial Beach, 737 (39.5%) are family households, while 1,128 (60.5%) are nonfamily households. The most numerous type of family households are 2-person households, comprising 425, and the most common type of nonfamily households are 1-person households, comprising 909.
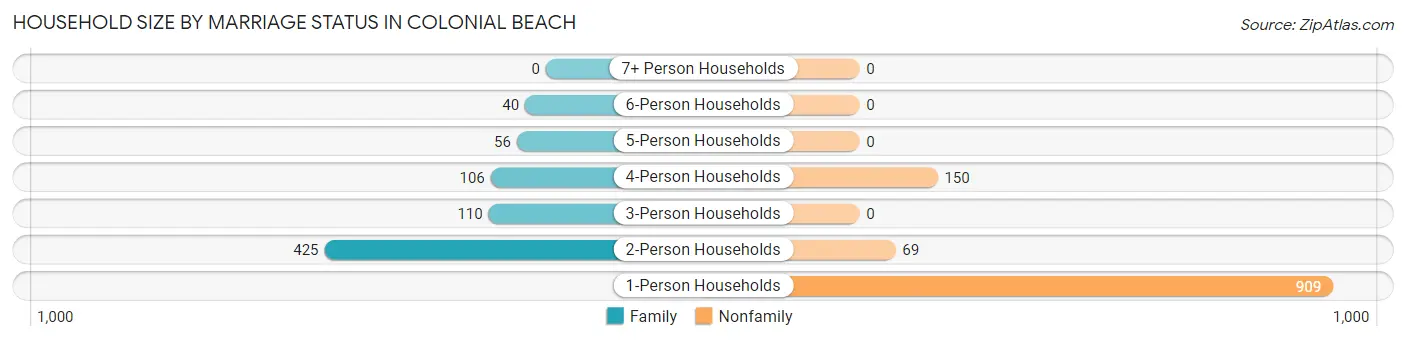
| Household Size | Family Households | Nonfamily Households |
| 1-Person Households | - | 909 (48.7%) |
| 2-Person Households | 425 (22.8%) | 69 (3.7%) |
| 3-Person Households | 110 (5.9%) | 0 (0.0%) |
| 4-Person Households | 106 (5.7%) | 150 (8.0%) |
| 5-Person Households | 56 (3.0%) | 0 (0.0%) |
| 6-Person Households | 40 (2.1%) | 0 (0.0%) |
| 7+ Person Households | 0 (0.0%) | 0 (0.0%) |
| Total | 737 (39.5%) | 1,128 (60.5%) |
Female Fertility in Colonial Beach
Fertility by Age in Colonial Beach
Average fertility rate in Colonial Beach is 97.0 births per 1,000 women. Women in the age bracket of 15 to 19 years have the highest fertility rate with 329.0 births per 1,000 women. Women in the age bracket of 20 to 34 years acount for 64.7% of all women with births.
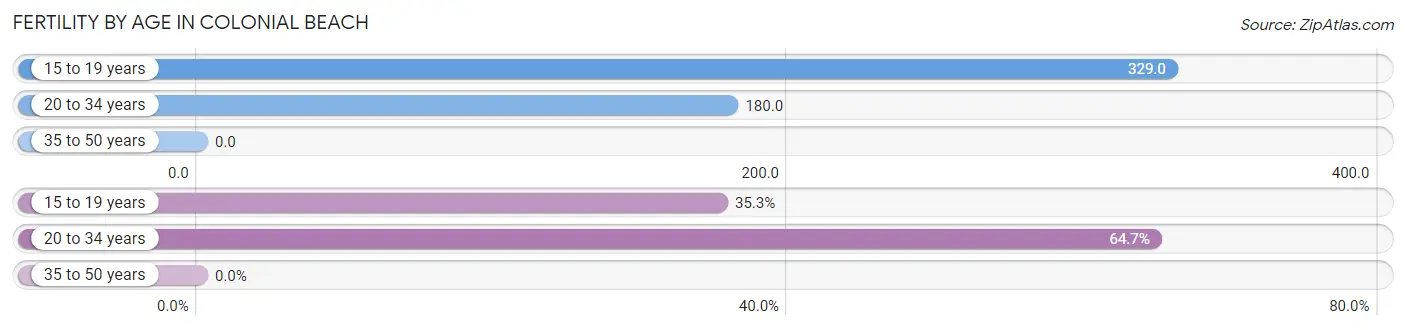
| Age Bracket | Women with Births | Births / 1,000 Women |
| 15 to 19 years | 24 (35.3%) | 329.0 |
| 20 to 34 years | 44 (64.7%) | 180.0 |
| 35 to 50 years | 0 (0.0%) | 0.0 |
| Total | 68 (100.0%) | 97.0 |
Fertility by Age by Marriage Status in Colonial Beach
64.7% of women with births (68) in Colonial Beach are married. The highest percentage of unmarried women with births falls into 15 to 19 years age bracket with 100.0% of them unmarried at the time of birth, while the lowest percentage of unmarried women with births belong to 20 to 34 years age bracket with 0.0% of them unmarried.
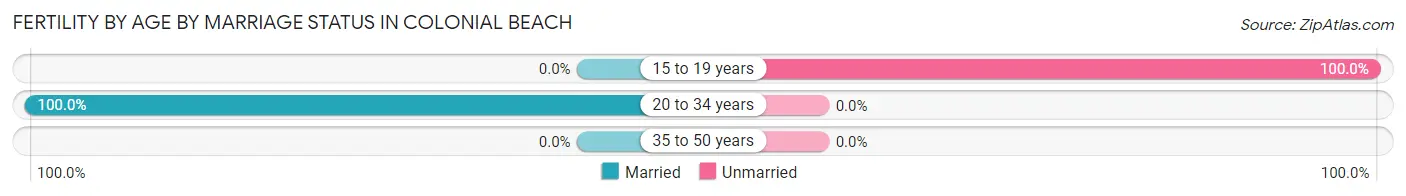
| Age Bracket | Married | Unmarried |
| 15 to 19 years | 0 (0.0%) | 24 (100.0%) |
| 20 to 34 years | 44 (100.0%) | 0 (0.0%) |
| 35 to 50 years | 0 (0.0%) | 0 (0.0%) |
| Total | 44 (64.7%) | 24 (35.3%) |
Fertility by Education in Colonial Beach
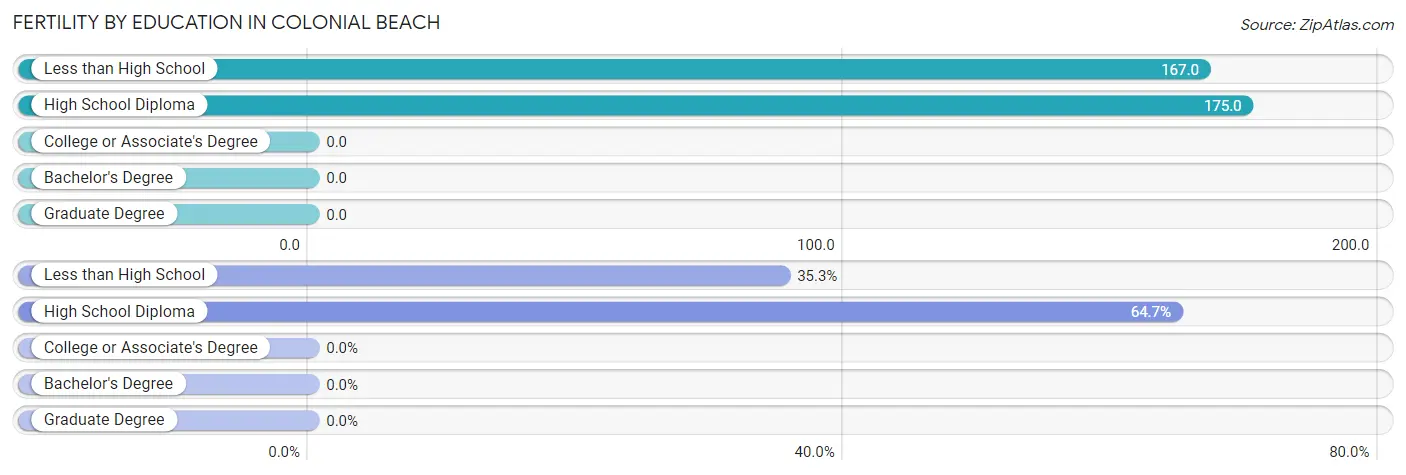
| Educational Attainment | Women with Births | Births / 1,000 Women |
| Less than High School | 24 (35.3%) | 167.0 |
| High School Diploma | 44 (64.7%) | 175.0 |
| College or Associate's Degree | 0 (0.0%) | 0.0 |
| Bachelor's Degree | 0 (0.0%) | 0.0 |
| Graduate Degree | 0 (0.0%) | 0.0 |
| Total | 68 (100.0%) | 97.0 |
Fertility by Education by Marriage Status in Colonial Beach
35.3% of women with births in Colonial Beach are unmarried. Women with the educational attainment of high school diploma are most likely to be married with 100.0% of them married at childbirth, while women with the educational attainment of less than high school are least likely to be married with 100.0% of them unmarried at childbirth.
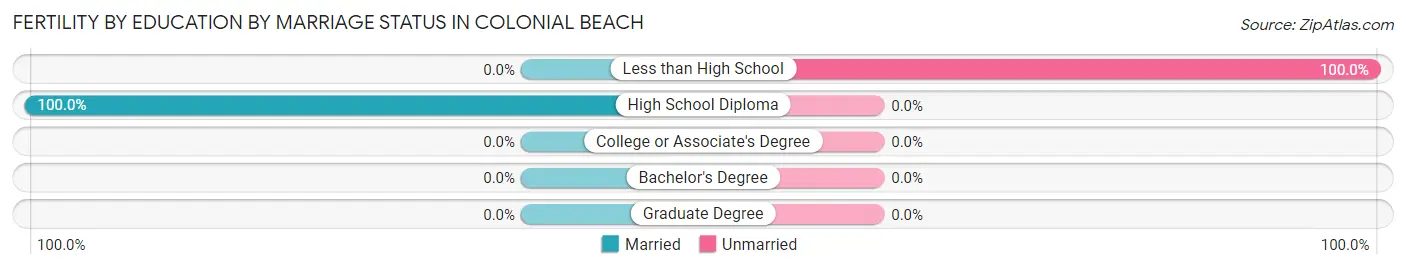
| Educational Attainment | Married | Unmarried |
| Less than High School | 0 (0.0%) | 24 (100.0%) |
| High School Diploma | 44 (100.0%) | 0 (0.0%) |
| College or Associate's Degree | 0 (0.0%) | 0 (0.0%) |
| Bachelor's Degree | 0 (0.0%) | 0 (0.0%) |
| Graduate Degree | 0 (0.0%) | 0 (0.0%) |
| Total | 44 (64.7%) | 24 (35.3%) |
Employment Characteristics in Colonial Beach
Employment by Class of Employer in Colonial Beach
Among the 1,383 employed individuals in Colonial Beach, private company employees (747 | 54.0%), federal government employees (262 | 18.9%), and local government employees (117 | 8.5%) make up the most common classes of employment.
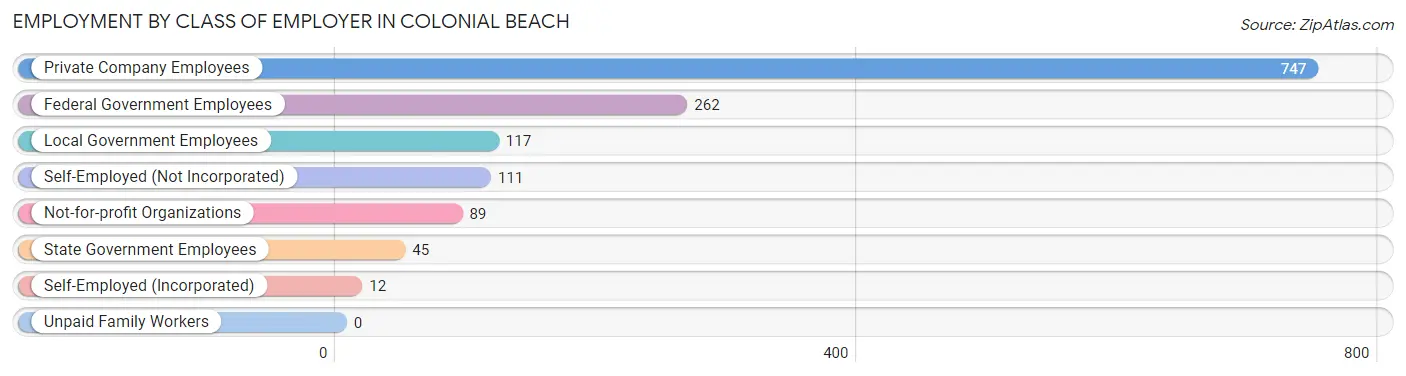
| Employer Class | # Employees | % Employees |
| Private Company Employees | 747 | 54.0% |
| Self-Employed (Incorporated) | 12 | 0.9% |
| Self-Employed (Not Incorporated) | 111 | 8.0% |
| Not-for-profit Organizations | 89 | 6.4% |
| Local Government Employees | 117 | 8.5% |
| State Government Employees | 45 | 3.3% |
| Federal Government Employees | 262 | 18.9% |
| Unpaid Family Workers | 0 | 0.0% |
| Total | 1,383 | 100.0% |
Employment Status by Age in Colonial Beach
According to the labor force statistics for Colonial Beach, out of the total population over 16 years of age (3,224), 45.8% or 1,477 individuals are in the labor force, with 4.1% or 61 of them unemployed. The age group with the highest labor force participation rate is 35 to 44 years, with 84.6% or 506 individuals in the labor force. Within the labor force, the 35 to 44 years age range has the highest percentage of unemployed individuals, with 15.2% or 77 of them being unemployed.
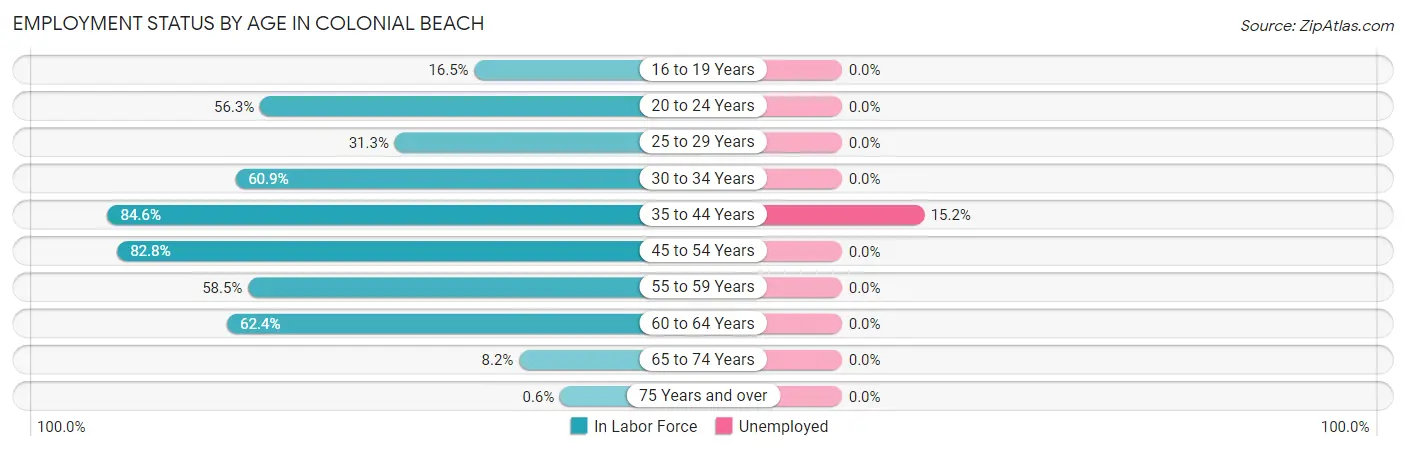
| Age Bracket | In Labor Force | Unemployed |
| 16 to 19 Years | 18 (16.5%) | 0 (0.0%) |
| 20 to 24 Years | 58 (56.3%) | 0 (0.0%) |
| 25 to 29 Years | 76 (31.3%) | 0 (0.0%) |
| 30 to 34 Years | 92 (60.9%) | 0 (0.0%) |
| 35 to 44 Years | 506 (84.6%) | 77 (15.2%) |
| 45 to 54 Years | 274 (82.8%) | 0 (0.0%) |
| 55 to 59 Years | 110 (58.5%) | 0 (0.0%) |
| 60 to 64 Years | 285 (62.4%) | 0 (0.0%) |
| 65 to 74 Years | 56 (8.2%) | 0 (0.0%) |
| 75 Years and over | 2 (0.6%) | 0 (0.0%) |
| Total | 1,477 (45.8%) | 61 (4.1%) |
Employment Status by Educational Attainment in Colonial Beach
According to labor force statistics for Colonial Beach, 68.2% of individuals (1,342) out of the total population between 25 and 64 years of age (1,968) are in the labor force, with 4.5% or 60 of them being unemployed. The group with the highest labor force participation rate are those with the educational attainment of college / associate degree, with 80.4% or 390 individuals in the labor force. Within the labor force, individuals with bachelor's degree or higher education have the highest percentage of unemployment, with 19.1% or 54 of them being unemployed.
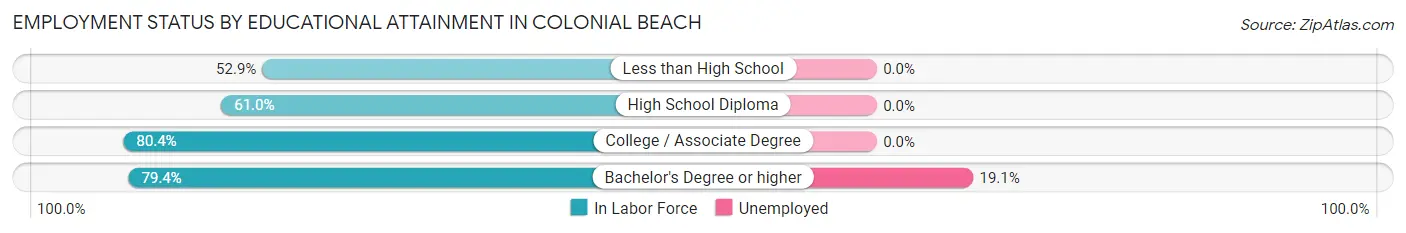
| Educational Attainment | In Labor Force | Unemployed |
| Less than High School | 111 (52.9%) | 0 (0.0%) |
| High School Diploma | 560 (61.0%) | 0 (0.0%) |
| College / Associate Degree | 390 (80.4%) | 0 (0.0%) |
| Bachelor's Degree or higher | 282 (79.4%) | 68 (19.1%) |
| Total | 1,342 (68.2%) | 89 (4.5%) |
Employment Occupations by Sex in Colonial Beach
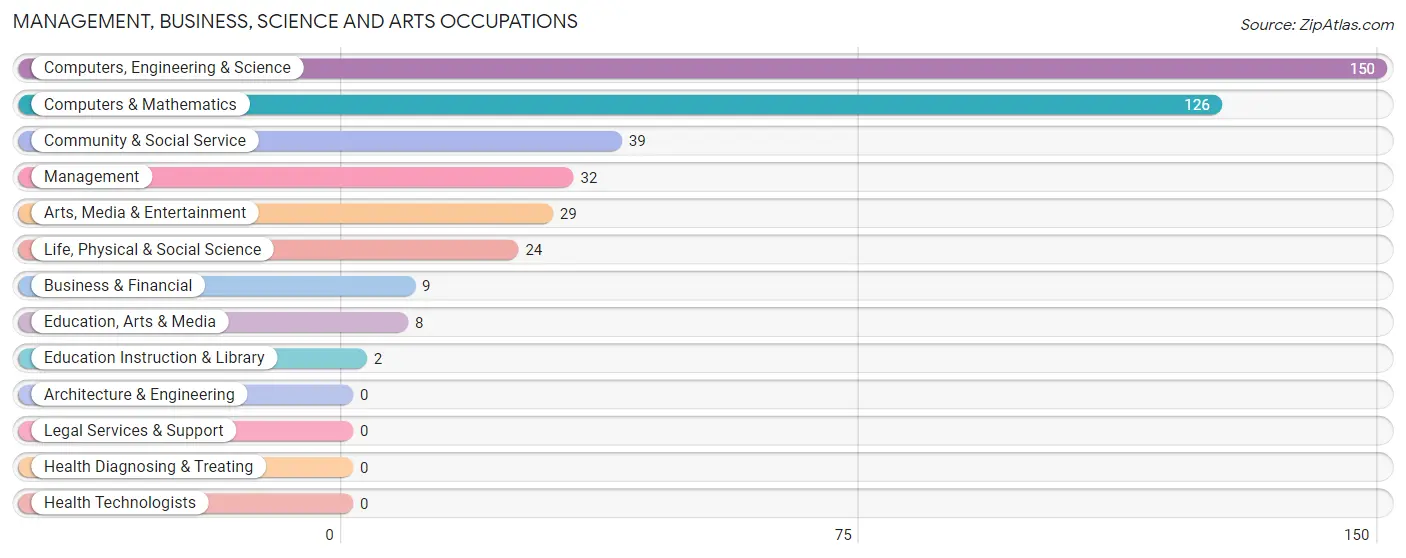
Management, Business, Science and Arts Occupations
The most common Management, Business, Science and Arts occupations in Colonial Beach are Computers, Engineering & Science (150 | 11.8%), Computers & Mathematics (126 | 9.9%), Community & Social Service (39 | 3.1%), Management (32 | 2.5%), and Arts, Media & Entertainment (29 | 2.3%).
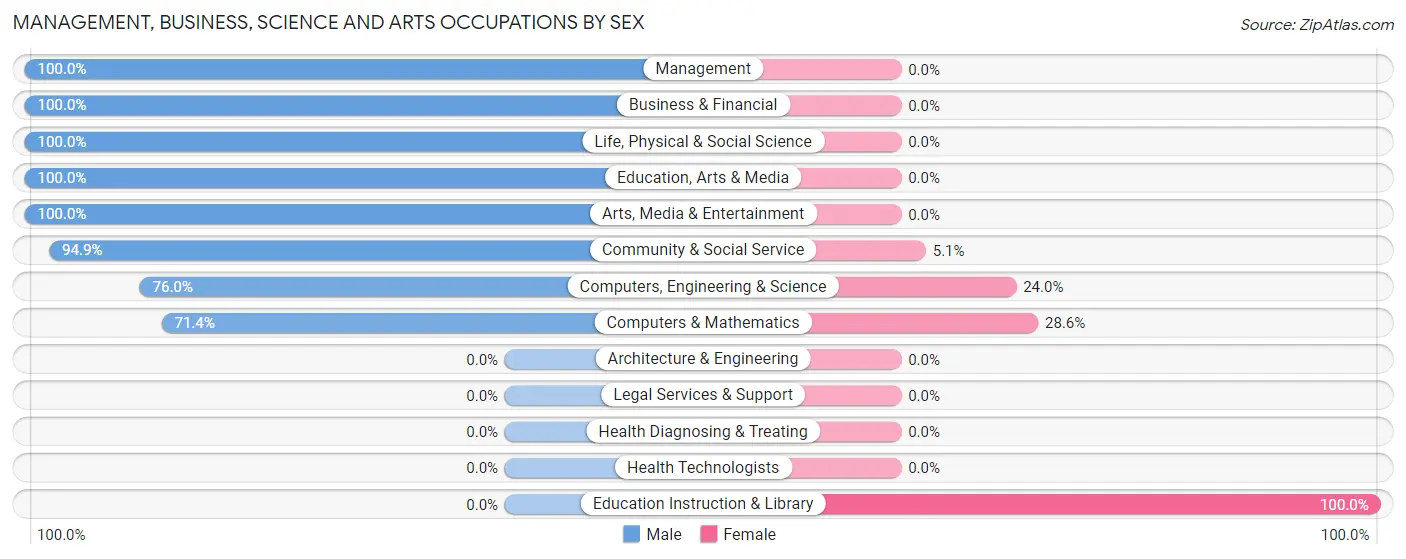
Management, Business, Science and Arts Occupations by Sex
Within the Management, Business, Science and Arts occupations in Colonial Beach, the most male-oriented occupations are Management (100.0%), Business & Financial (100.0%), and Life, Physical & Social Science (100.0%), while the most female-oriented occupations are Education Instruction & Library (100.0%), Computers & Mathematics (28.6%), and Computers, Engineering & Science (24.0%).
| Occupation | Male | Female |
| Management | 32 (100.0%) | 0 (0.0%) |
| Business & Financial | 9 (100.0%) | 0 (0.0%) |
| Computers, Engineering & Science | 114 (76.0%) | 36 (24.0%) |
| Computers & Mathematics | 90 (71.4%) | 36 (28.6%) |
| Architecture & Engineering | 0 (0.0%) | 0 (0.0%) |
| Life, Physical & Social Science | 24 (100.0%) | 0 (0.0%) |
| Community & Social Service | 37 (94.9%) | 2 (5.1%) |
| Education, Arts & Media | 8 (100.0%) | 0 (0.0%) |
| Legal Services & Support | 0 (0.0%) | 0 (0.0%) |
| Education Instruction & Library | 0 (0.0%) | 2 (100.0%) |
| Arts, Media & Entertainment | 29 (100.0%) | 0 (0.0%) |
| Health Diagnosing & Treating | 0 (0.0%) | 0 (0.0%) |
| Health Technologists | 0 (0.0%) | 0 (0.0%) |
| Total (Category) | 192 (83.5%) | 38 (16.5%) |
| Total (Overall) | 579 (45.5%) | 694 (54.5%) |
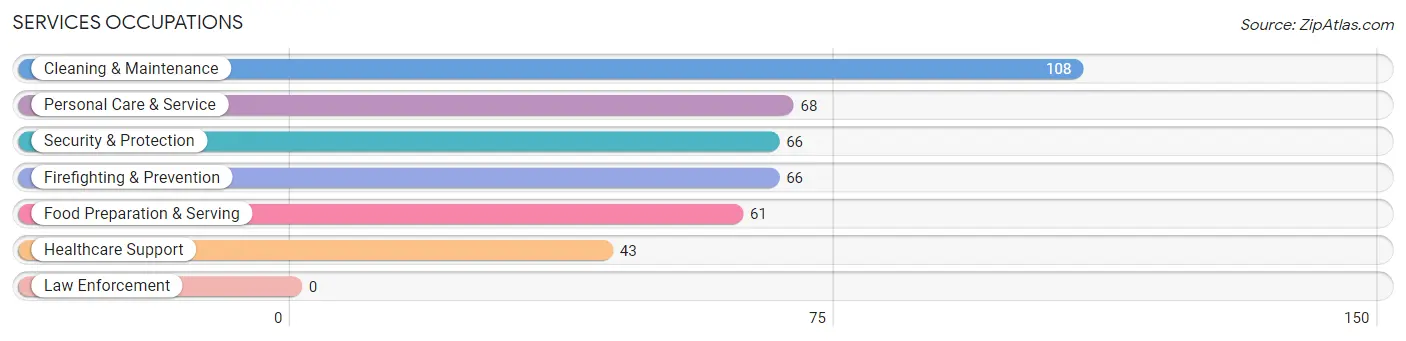
Services Occupations
The most common Services occupations in Colonial Beach are Cleaning & Maintenance (108 | 8.5%), Personal Care & Service (68 | 5.3%), Security & Protection (66 | 5.2%), Firefighting & Prevention (66 | 5.2%), and Food Preparation & Serving (61 | 4.8%).
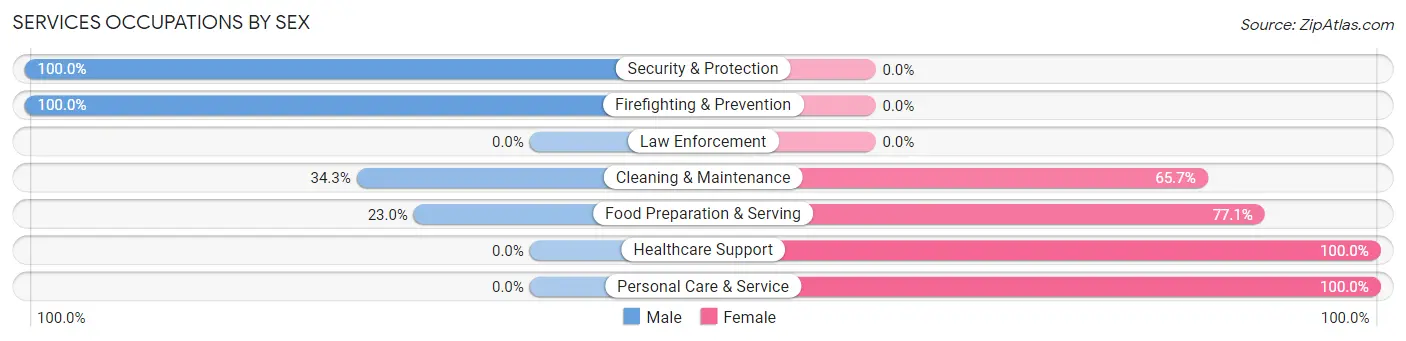
Services Occupations by Sex
Within the Services occupations in Colonial Beach, the most male-oriented occupations are Security & Protection (100.0%), Firefighting & Prevention (100.0%), and Cleaning & Maintenance (34.3%), while the most female-oriented occupations are Healthcare Support (100.0%), Personal Care & Service (100.0%), and Food Preparation & Serving (77.0%).
| Occupation | Male | Female |
| Healthcare Support | 0 (0.0%) | 43 (100.0%) |
| Security & Protection | 66 (100.0%) | 0 (0.0%) |
| Firefighting & Prevention | 66 (100.0%) | 0 (0.0%) |
| Law Enforcement | 0 (0.0%) | 0 (0.0%) |
| Food Preparation & Serving | 14 (23.0%) | 47 (77.0%) |
| Cleaning & Maintenance | 37 (34.3%) | 71 (65.7%) |
| Personal Care & Service | 0 (0.0%) | 68 (100.0%) |
| Total (Category) | 117 (33.8%) | 229 (66.2%) |
| Total (Overall) | 579 (45.5%) | 694 (54.5%) |
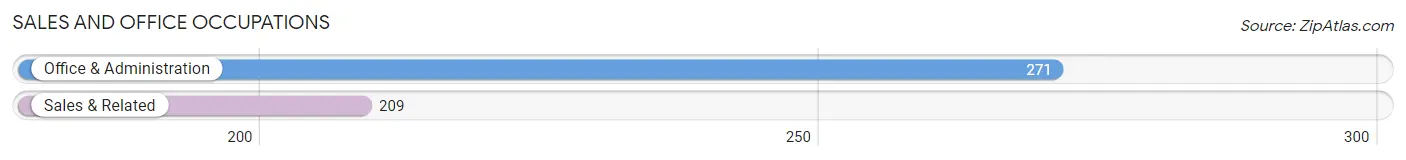
Sales and Office Occupations
The most common Sales and Office occupations in Colonial Beach are Office & Administration (271 | 21.3%), and Sales & Related (209 | 16.4%).
Sales and Office Occupations by Sex
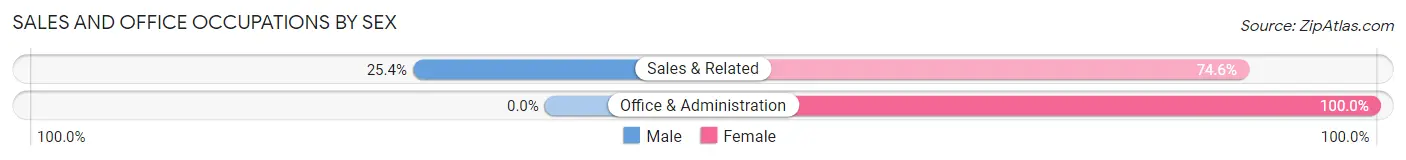
| Occupation | Male | Female |
| Sales & Related | 53 (25.4%) | 156 (74.6%) |
| Office & Administration | 0 (0.0%) | 271 (100.0%) |
| Total (Category) | 53 (11.0%) | 427 (89.0%) |
| Total (Overall) | 579 (45.5%) | 694 (54.5%) |
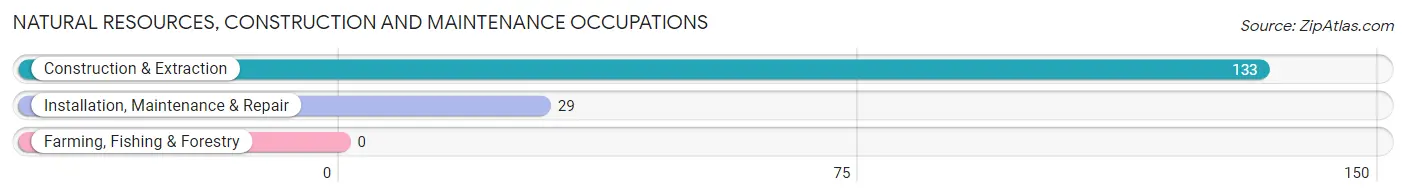
Natural Resources, Construction and Maintenance Occupations
The most common Natural Resources, Construction and Maintenance occupations in Colonial Beach are Construction & Extraction (133 | 10.4%), and Installation, Maintenance & Repair (29 | 2.3%).
Natural Resources, Construction and Maintenance Occupations by Sex
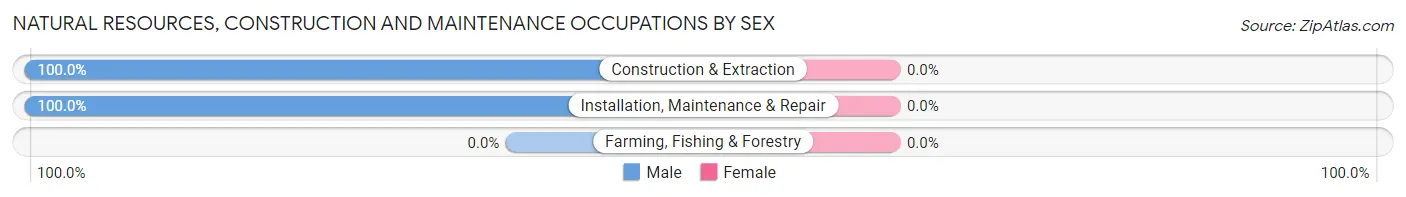
| Occupation | Male | Female |
| Farming, Fishing & Forestry | 0 (0.0%) | 0 (0.0%) |
| Construction & Extraction | 133 (100.0%) | 0 (0.0%) |
| Installation, Maintenance & Repair | 29 (100.0%) | 0 (0.0%) |
| Total (Category) | 162 (100.0%) | 0 (0.0%) |
| Total (Overall) | 579 (45.5%) | 694 (54.5%) |
Production, Transportation and Moving Occupations
The most common Production, Transportation and Moving occupations in Colonial Beach are Transportation (49 | 3.8%), and Material Moving (6 | 0.5%).
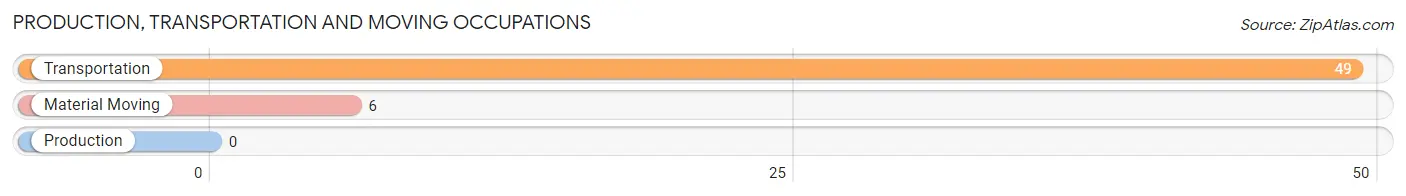
Production, Transportation and Moving Occupations by Sex
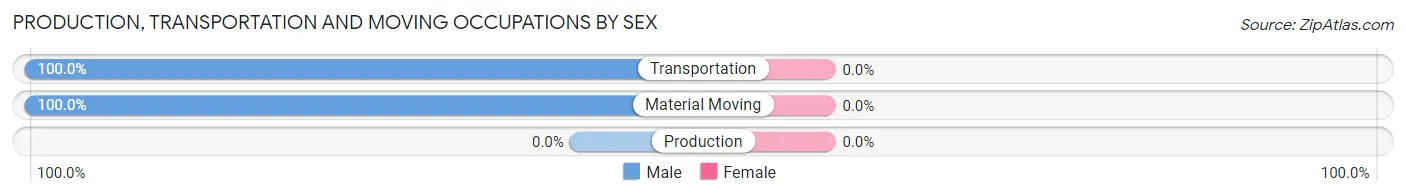
| Occupation | Male | Female |
| Production | 0 (0.0%) | 0 (0.0%) |
| Transportation | 49 (100.0%) | 0 (0.0%) |
| Material Moving | 6 (100.0%) | 0 (0.0%) |
| Total (Category) | 55 (100.0%) | 0 (0.0%) |
| Total (Overall) | 579 (45.5%) | 694 (54.5%) |
Employment Industries by Sex in Colonial Beach
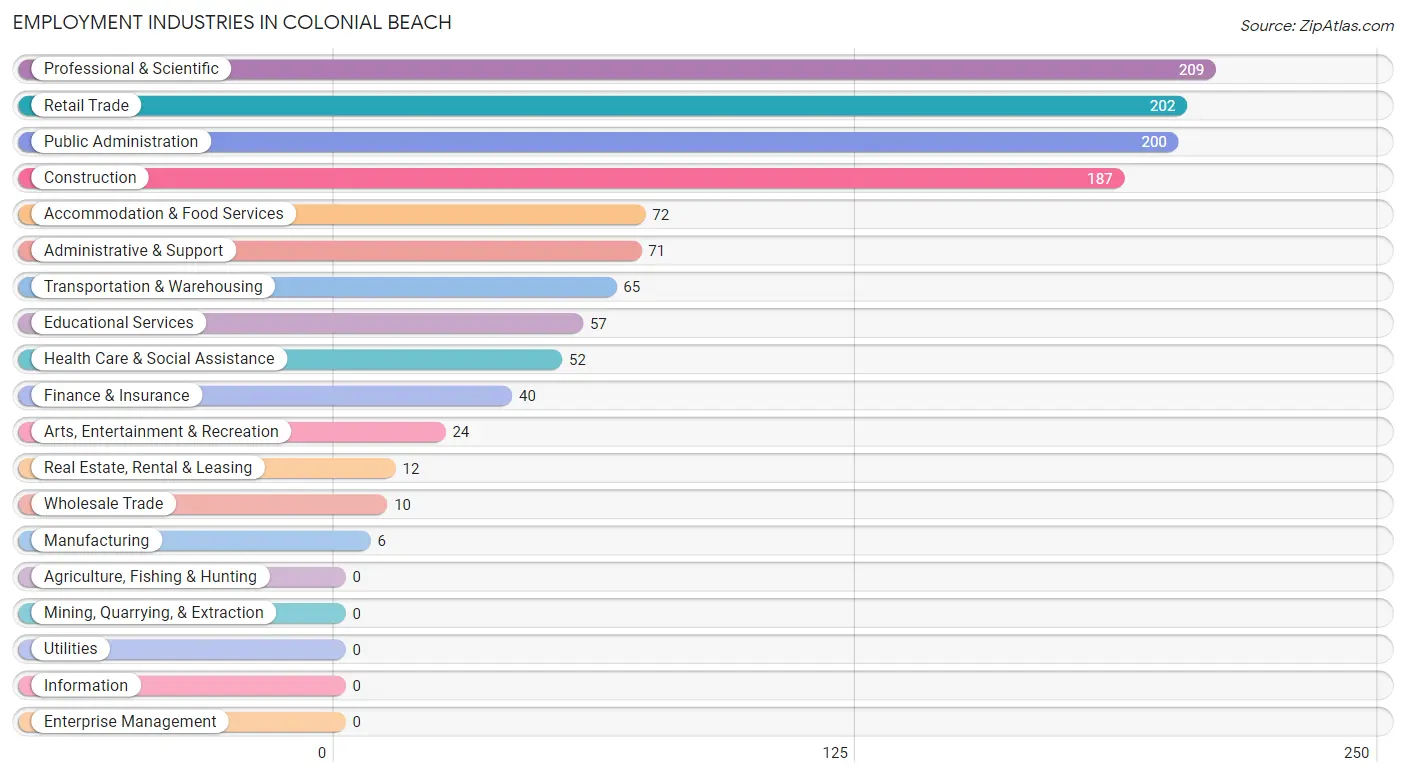
Employment Industries in Colonial Beach
The major employment industries in Colonial Beach include Professional & Scientific (209 | 16.4%), Retail Trade (202 | 15.9%), Public Administration (200 | 15.7%), Construction (187 | 14.7%), and Accommodation & Food Services (72 | 5.7%).
Employment Industries by Sex in Colonial Beach
The Colonial Beach industries that see more men than women are Manufacturing (100.0%), Real Estate, Rental & Leasing (100.0%), and Transportation & Warehousing (75.4%), whereas the industries that tend to have a higher number of women are Wholesale Trade (100.0%), Administrative & Support (100.0%), and Health Care & Social Assistance (100.0%).
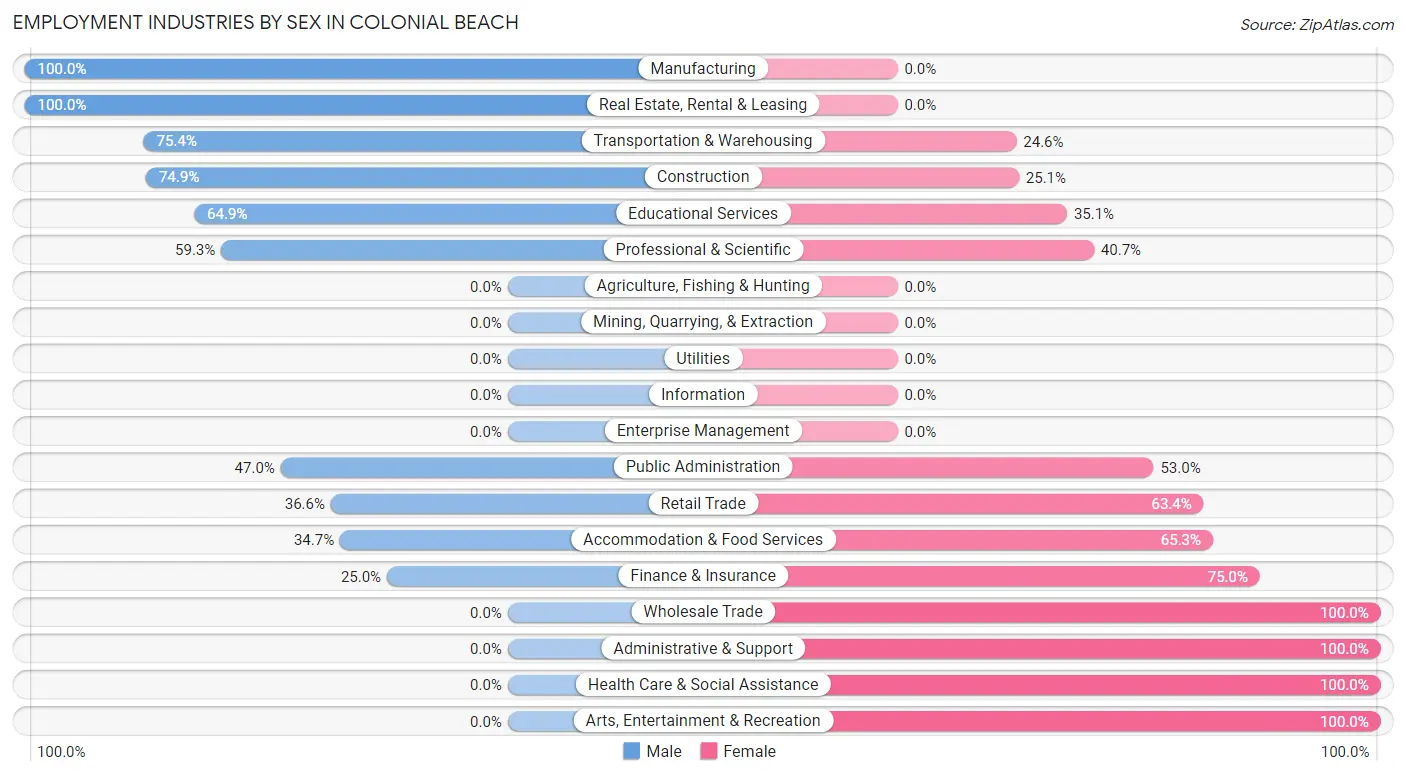
| Industry | Male | Female |
| Agriculture, Fishing & Hunting | 0 (0.0%) | 0 (0.0%) |
| Mining, Quarrying, & Extraction | 0 (0.0%) | 0 (0.0%) |
| Construction | 140 (74.9%) | 47 (25.1%) |
| Manufacturing | 6 (100.0%) | 0 (0.0%) |
| Wholesale Trade | 0 (0.0%) | 10 (100.0%) |
| Retail Trade | 74 (36.6%) | 128 (63.4%) |
| Transportation & Warehousing | 49 (75.4%) | 16 (24.6%) |
| Utilities | 0 (0.0%) | 0 (0.0%) |
| Information | 0 (0.0%) | 0 (0.0%) |
| Finance & Insurance | 10 (25.0%) | 30 (75.0%) |
| Real Estate, Rental & Leasing | 12 (100.0%) | 0 (0.0%) |
| Professional & Scientific | 124 (59.3%) | 85 (40.7%) |
| Enterprise Management | 0 (0.0%) | 0 (0.0%) |
| Administrative & Support | 0 (0.0%) | 71 (100.0%) |
| Educational Services | 37 (64.9%) | 20 (35.1%) |
| Health Care & Social Assistance | 0 (0.0%) | 52 (100.0%) |
| Arts, Entertainment & Recreation | 0 (0.0%) | 24 (100.0%) |
| Accommodation & Food Services | 25 (34.7%) | 47 (65.3%) |
| Public Administration | 94 (47.0%) | 106 (53.0%) |
| Total | 579 (45.5%) | 694 (54.5%) |
Education in Colonial Beach
School Enrollment in Colonial Beach
The most common levels of schooling among the 636 students in Colonial Beach are elementary school (225 | 35.4%), high school (143 | 22.5%), and middle school (112 | 17.6%).
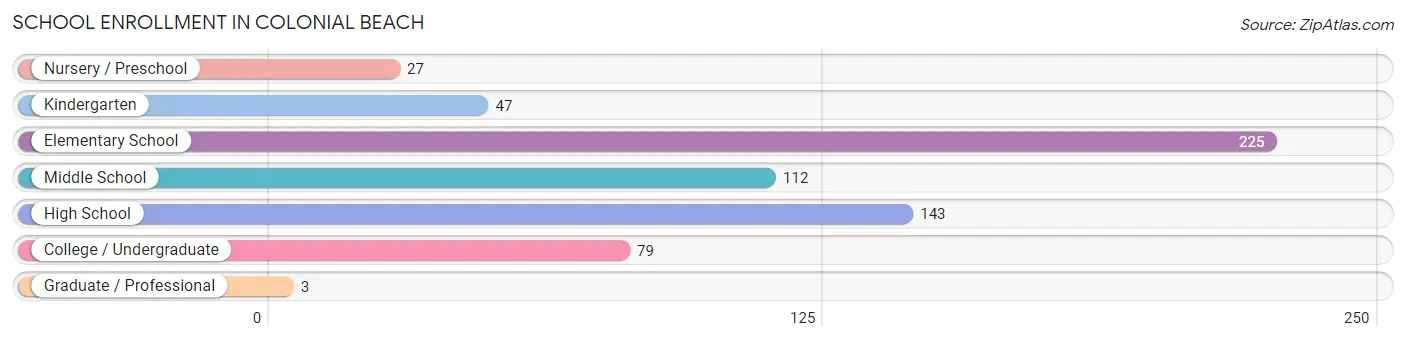
| School Level | # Students | % Students |
| Nursery / Preschool | 27 | 4.3% |
| Kindergarten | 47 | 7.4% |
| Elementary School | 225 | 35.4% |
| Middle School | 112 | 17.6% |
| High School | 143 | 22.5% |
| College / Undergraduate | 79 | 12.4% |
| Graduate / Professional | 3 | 0.5% |
| Total | 636 | 100.0% |
School Enrollment by Age by Funding Source in Colonial Beach
Out of a total of 636 students who are enrolled in schools in Colonial Beach, 16 (2.5%) attend a private institution, while the remaining 620 (97.5%) are enrolled in public schools. The age group of 25 to 34 year olds has the highest likelihood of being enrolled in private schools, with 16 (32.0% in the age bracket) enrolled. Conversely, the age group of 3 to 4 year olds has the lowest likelihood of being enrolled in a private school, with 27 (100.0% in the age bracket) attending a public institution.
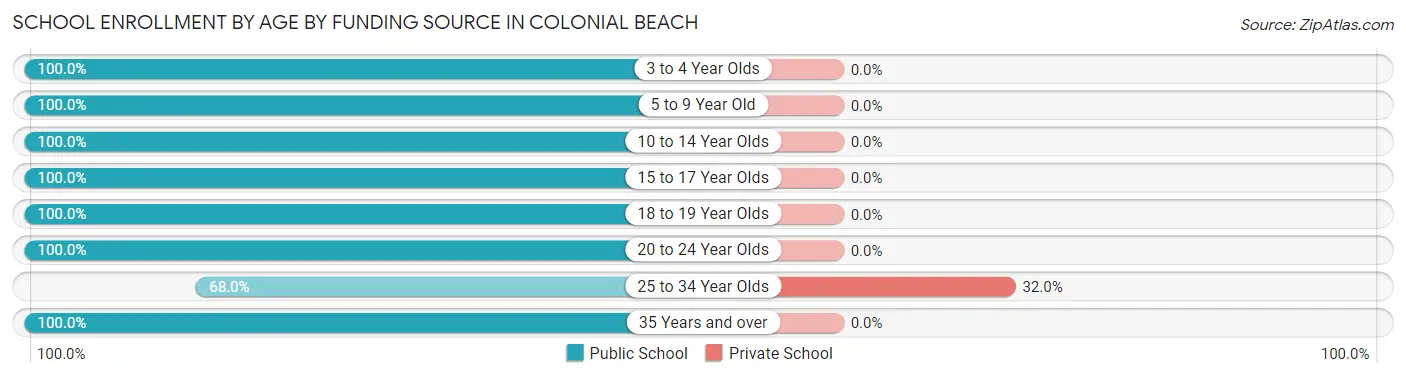
| Age Bracket | Public School | Private School |
| 3 to 4 Year Olds | 27 (100.0%) | 0 (0.0%) |
| 5 to 9 Year Old | 205 (100.0%) | 0 (0.0%) |
| 10 to 14 Year Olds | 249 (100.0%) | 0 (0.0%) |
| 15 to 17 Year Olds | 49 (100.0%) | 0 (0.0%) |
| 18 to 19 Year Olds | 42 (100.0%) | 0 (0.0%) |
| 20 to 24 Year Olds | 1 (100.0%) | 0 (0.0%) |
| 25 to 34 Year Olds | 34 (68.0%) | 16 (32.0%) |
| 35 Years and over | 13 (100.0%) | 0 (0.0%) |
| Total | 620 (97.5%) | 16 (2.5%) |
Educational Attainment by Field of Study in Colonial Beach
Computers & mathematics (127 | 17.9%), arts & humanities (127 | 17.9%), education (111 | 15.7%), science & technology (92 | 13.0%), and business (80 | 11.3%) are the most common fields of study among 709 individuals in Colonial Beach who have obtained a bachelor's degree or higher.
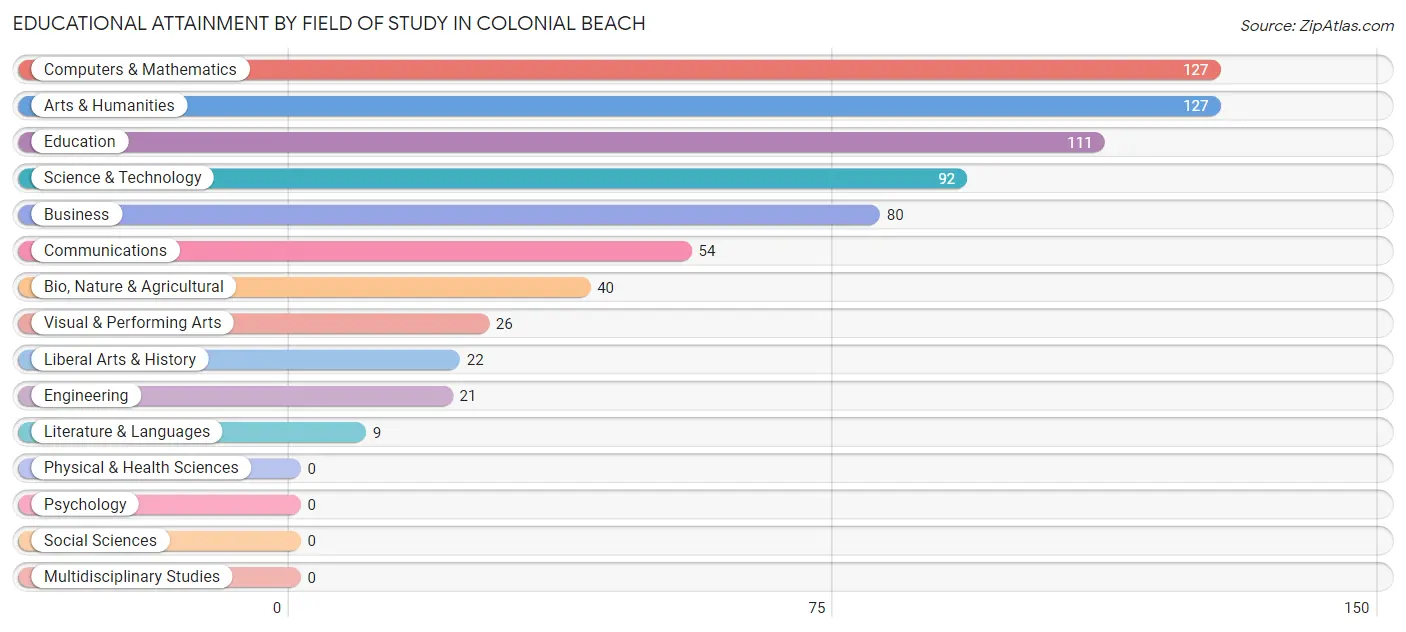
| Field of Study | # Graduates | % Graduates |
| Computers & Mathematics | 127 | 17.9% |
| Bio, Nature & Agricultural | 40 | 5.6% |
| Physical & Health Sciences | 0 | 0.0% |
| Psychology | 0 | 0.0% |
| Social Sciences | 0 | 0.0% |
| Engineering | 21 | 3.0% |
| Multidisciplinary Studies | 0 | 0.0% |
| Science & Technology | 92 | 13.0% |
| Business | 80 | 11.3% |
| Education | 111 | 15.7% |
| Literature & Languages | 9 | 1.3% |
| Liberal Arts & History | 22 | 3.1% |
| Visual & Performing Arts | 26 | 3.7% |
| Communications | 54 | 7.6% |
| Arts & Humanities | 127 | 17.9% |
| Total | 709 | 100.0% |
Transportation & Commute in Colonial Beach
Vehicle Availability by Sex in Colonial Beach
The most prevalent vehicle ownership categories in Colonial Beach are males with 2 vehicles (286, accounting for 39.2%) and females with 2 vehicles (227, making up 43.7%).
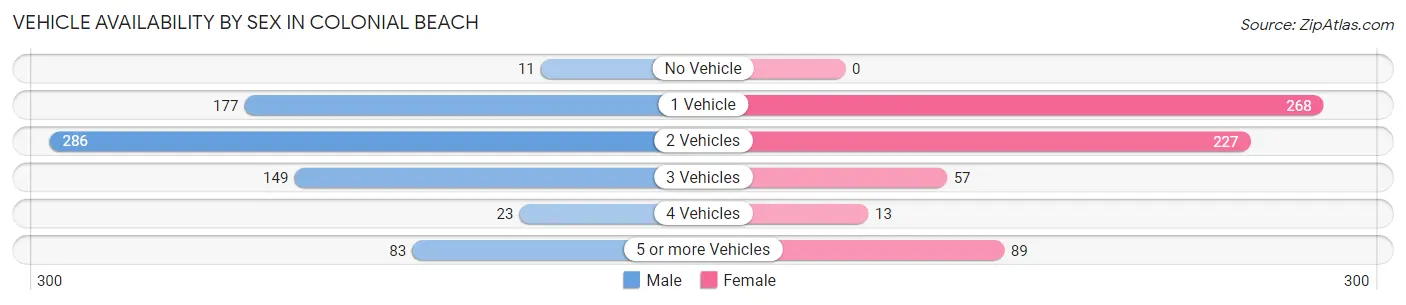
| Vehicles Available | Male | Female |
| No Vehicle | 11 (1.5%) | 0 (0.0%) |
| 1 Vehicle | 177 (24.3%) | 268 (41.0%) |
| 2 Vehicles | 286 (39.2%) | 227 (34.7%) |
| 3 Vehicles | 149 (20.4%) | 57 (8.7%) |
| 4 Vehicles | 23 (3.2%) | 13 (2.0%) |
| 5 or more Vehicles | 83 (11.4%) | 89 (13.6%) |
| Total | 729 (100.0%) | 654 (100.0%) |
Commute Time in Colonial Beach
The most frequently occuring commute durations in Colonial Beach are 45 to 59 minutes (294 commuters, 22.4%), 25 to 29 minutes (209 commuters, 15.9%), and 10 to 14 minutes (154 commuters, 11.7%).
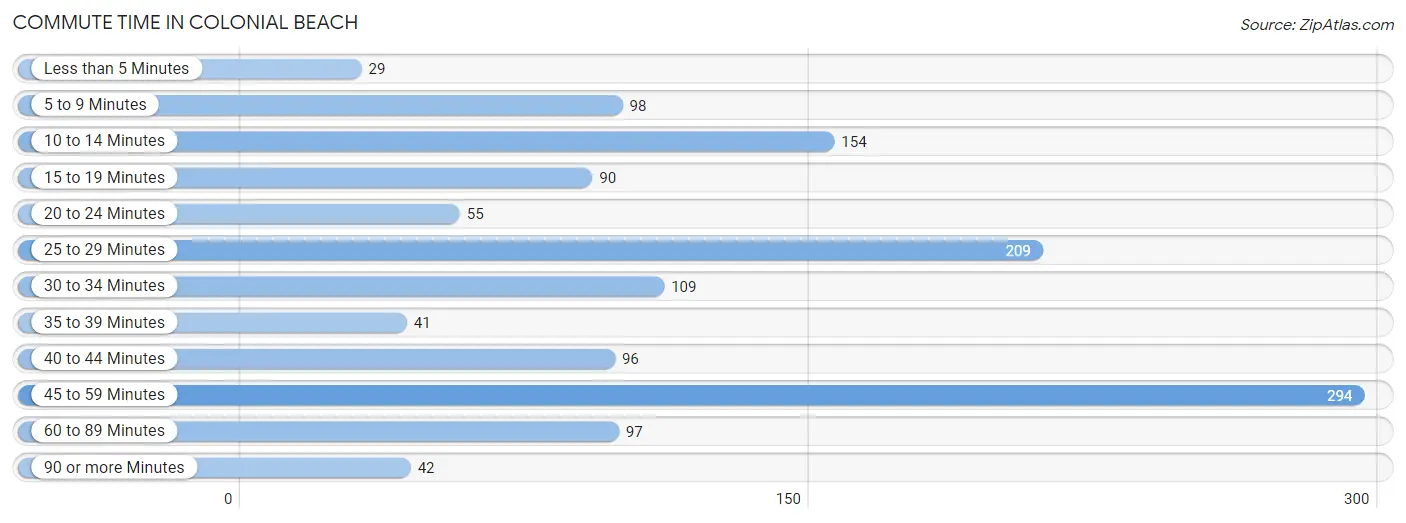
| Commute Time | # Commuters | % Commuters |
| Less than 5 Minutes | 29 | 2.2% |
| 5 to 9 Minutes | 98 | 7.5% |
| 10 to 14 Minutes | 154 | 11.7% |
| 15 to 19 Minutes | 90 | 6.9% |
| 20 to 24 Minutes | 55 | 4.2% |
| 25 to 29 Minutes | 209 | 15.9% |
| 30 to 34 Minutes | 109 | 8.3% |
| 35 to 39 Minutes | 41 | 3.1% |
| 40 to 44 Minutes | 96 | 7.3% |
| 45 to 59 Minutes | 294 | 22.4% |
| 60 to 89 Minutes | 97 | 7.4% |
| 90 or more Minutes | 42 | 3.2% |
Commute Time by Sex in Colonial Beach
The most common commute times in Colonial Beach are 45 to 59 minutes (220 commuters, 31.6%) for males and 25 to 29 minutes (152 commuters, 24.6%) for females.
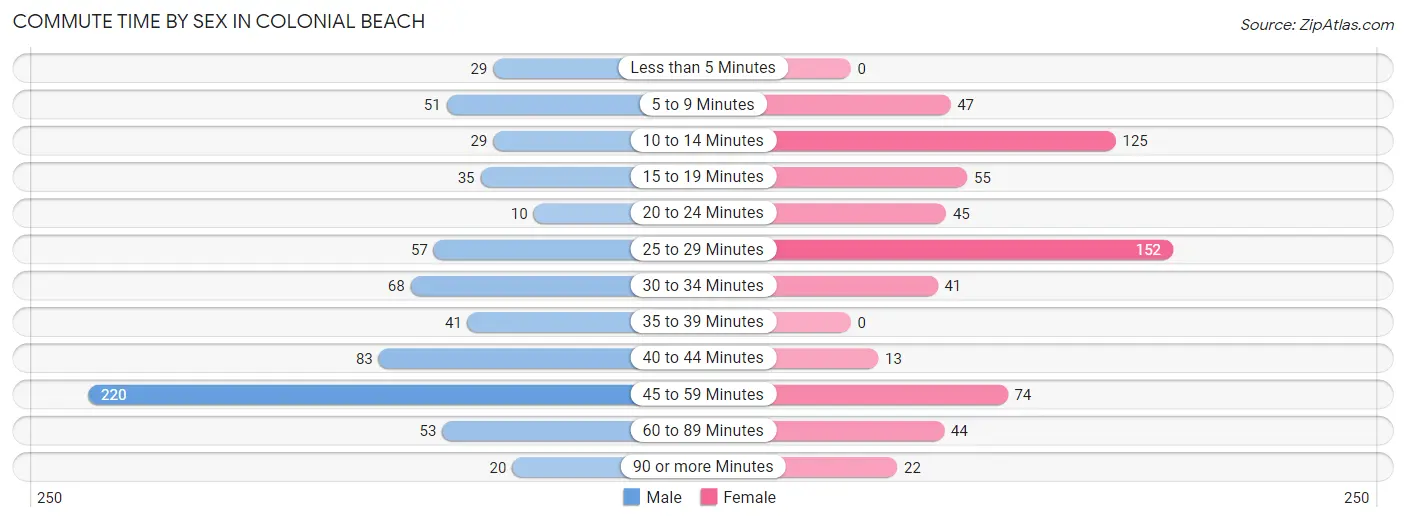
| Commute Time | Male | Female |
| Less than 5 Minutes | 29 (4.2%) | 0 (0.0%) |
| 5 to 9 Minutes | 51 (7.3%) | 47 (7.6%) |
| 10 to 14 Minutes | 29 (4.2%) | 125 (20.2%) |
| 15 to 19 Minutes | 35 (5.0%) | 55 (8.9%) |
| 20 to 24 Minutes | 10 (1.4%) | 45 (7.3%) |
| 25 to 29 Minutes | 57 (8.2%) | 152 (24.6%) |
| 30 to 34 Minutes | 68 (9.8%) | 41 (6.6%) |
| 35 to 39 Minutes | 41 (5.9%) | 0 (0.0%) |
| 40 to 44 Minutes | 83 (11.9%) | 13 (2.1%) |
| 45 to 59 Minutes | 220 (31.6%) | 74 (12.0%) |
| 60 to 89 Minutes | 53 (7.6%) | 44 (7.1%) |
| 90 or more Minutes | 20 (2.9%) | 22 (3.6%) |
Time of Departure to Work by Sex in Colonial Beach
The most frequent times of departure to work in Colonial Beach are 12:00 AM to 4:59 AM (163, 23.4%) for males and 7:00 AM to 7:29 AM (184, 29.8%) for females.
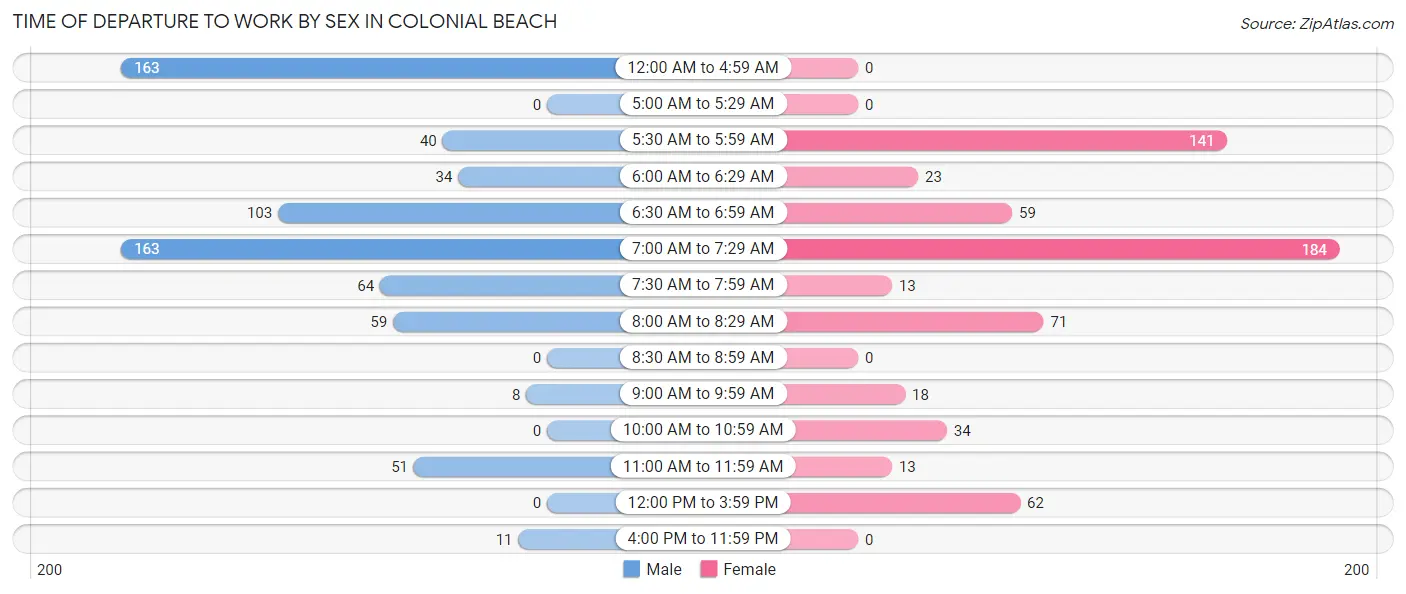
| Time of Departure | Male | Female |
| 12:00 AM to 4:59 AM | 163 (23.4%) | 0 (0.0%) |
| 5:00 AM to 5:29 AM | 0 (0.0%) | 0 (0.0%) |
| 5:30 AM to 5:59 AM | 40 (5.8%) | 141 (22.8%) |
| 6:00 AM to 6:29 AM | 34 (4.9%) | 23 (3.7%) |
| 6:30 AM to 6:59 AM | 103 (14.8%) | 59 (9.6%) |
| 7:00 AM to 7:29 AM | 163 (23.4%) | 184 (29.8%) |
| 7:30 AM to 7:59 AM | 64 (9.2%) | 13 (2.1%) |
| 8:00 AM to 8:29 AM | 59 (8.5%) | 71 (11.5%) |
| 8:30 AM to 8:59 AM | 0 (0.0%) | 0 (0.0%) |
| 9:00 AM to 9:59 AM | 8 (1.1%) | 18 (2.9%) |
| 10:00 AM to 10:59 AM | 0 (0.0%) | 34 (5.5%) |
| 11:00 AM to 11:59 AM | 51 (7.3%) | 13 (2.1%) |
| 12:00 PM to 3:59 PM | 0 (0.0%) | 62 (10.0%) |
| 4:00 PM to 11:59 PM | 11 (1.6%) | 0 (0.0%) |
| Total | 696 (100.0%) | 618 (100.0%) |
Housing Occupancy in Colonial Beach
Occupancy by Ownership in Colonial Beach
Of the total 1,865 dwellings in Colonial Beach, owner-occupied units account for 1,358 (72.8%), while renter-occupied units make up 507 (27.2%).
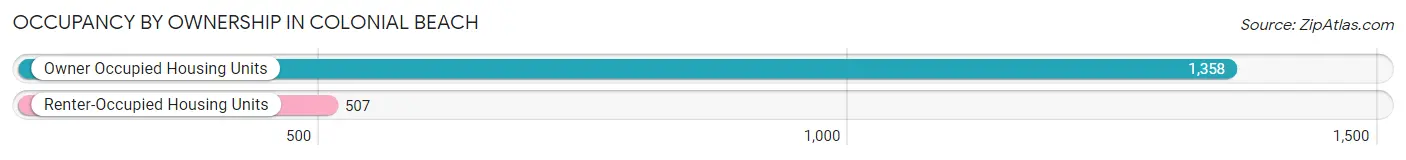
| Occupancy | # Housing Units | % Housing Units |
| Owner Occupied Housing Units | 1,358 | 72.8% |
| Renter-Occupied Housing Units | 507 | 27.2% |
| Total Occupied Housing Units | 1,865 | 100.0% |
Occupancy by Household Size in Colonial Beach
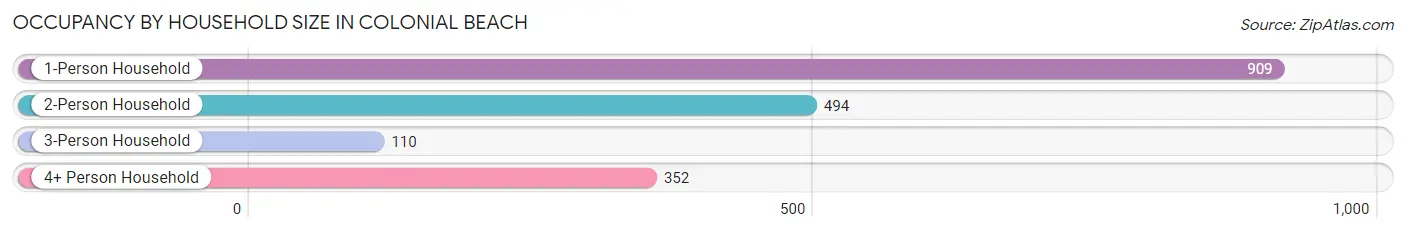
| Household Size | # Housing Units | % Housing Units |
| 1-Person Household | 909 | 48.7% |
| 2-Person Household | 494 | 26.5% |
| 3-Person Household | 110 | 5.9% |
| 4+ Person Household | 352 | 18.9% |
| Total Housing Units | 1,865 | 100.0% |
Occupancy by Ownership by Household Size in Colonial Beach
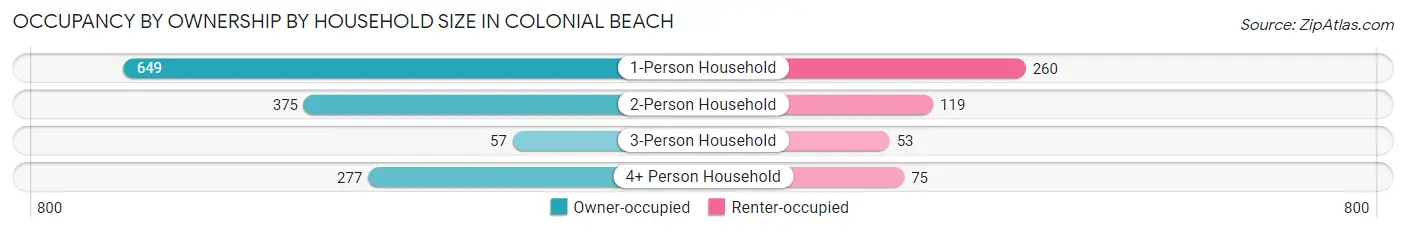
| Household Size | Owner-occupied | Renter-occupied |
| 1-Person Household | 649 (71.4%) | 260 (28.6%) |
| 2-Person Household | 375 (75.9%) | 119 (24.1%) |
| 3-Person Household | 57 (51.8%) | 53 (48.2%) |
| 4+ Person Household | 277 (78.7%) | 75 (21.3%) |
| Total Housing Units | 1,358 (72.8%) | 507 (27.2%) |
Occupancy by Educational Attainment in Colonial Beach
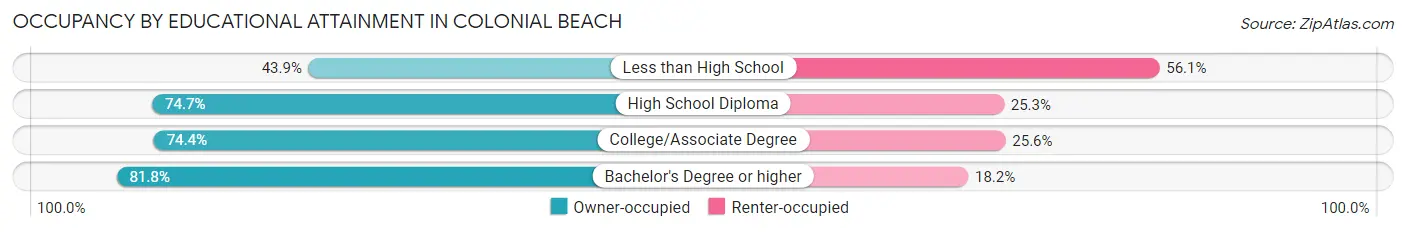
| Household Size | Owner-occupied | Renter-occupied |
| Less than High School | 93 (43.9%) | 119 (56.1%) |
| High School Diploma | 499 (74.7%) | 169 (25.3%) |
| College/Associate Degree | 398 (74.4%) | 137 (25.6%) |
| Bachelor's Degree or higher | 368 (81.8%) | 82 (18.2%) |
Occupancy by Age of Householder in Colonial Beach
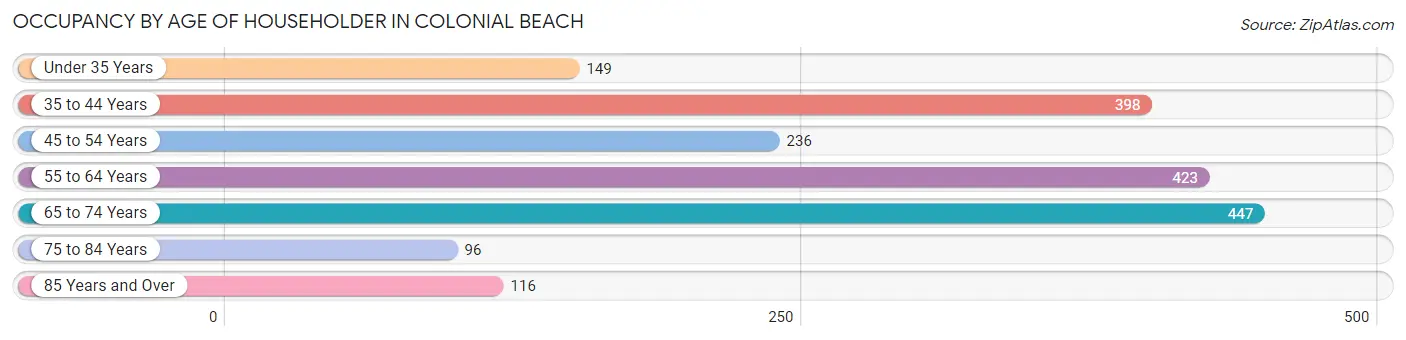
| Age Bracket | # Households | % Households |
| Under 35 Years | 149 | 8.0% |
| 35 to 44 Years | 398 | 21.3% |
| 45 to 54 Years | 236 | 12.7% |
| 55 to 64 Years | 423 | 22.7% |
| 65 to 74 Years | 447 | 24.0% |
| 75 to 84 Years | 96 | 5.1% |
| 85 Years and Over | 116 | 6.2% |
| Total | 1,865 | 100.0% |
Housing Finances in Colonial Beach
Median Income by Occupancy in Colonial Beach
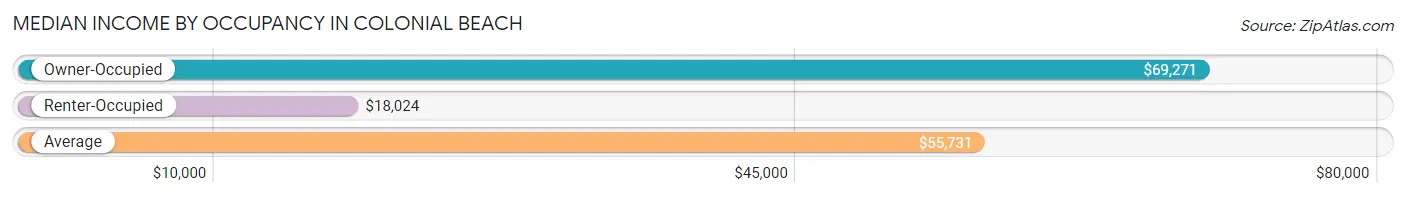
| Occupancy Type | # Households | Median Income |
| Owner-Occupied | 1,358 (72.8%) | $69,271 |
| Renter-Occupied | 507 (27.2%) | $18,024 |
| Average | 1,865 (100.0%) | $55,731 |
Occupancy by Householder Income Bracket in Colonial Beach
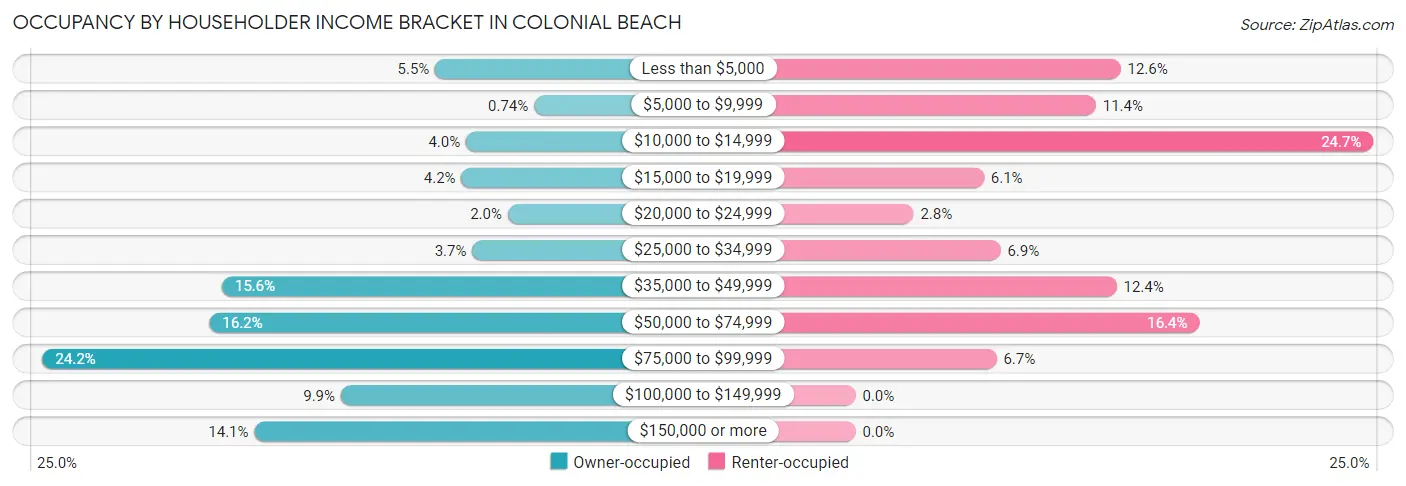
| Income Bracket | Owner-occupied | Renter-occupied |
| Less than $5,000 | 74 (5.4%) | 64 (12.6%) |
| $5,000 to $9,999 | 10 (0.7%) | 58 (11.4%) |
| $10,000 to $14,999 | 54 (4.0%) | 125 (24.6%) |
| $15,000 to $19,999 | 57 (4.2%) | 31 (6.1%) |
| $20,000 to $24,999 | 27 (2.0%) | 14 (2.8%) |
| $25,000 to $34,999 | 50 (3.7%) | 35 (6.9%) |
| $35,000 to $49,999 | 212 (15.6%) | 63 (12.4%) |
| $50,000 to $74,999 | 220 (16.2%) | 83 (16.4%) |
| $75,000 to $99,999 | 328 (24.1%) | 34 (6.7%) |
| $100,000 to $149,999 | 135 (9.9%) | 0 (0.0%) |
| $150,000 or more | 191 (14.1%) | 0 (0.0%) |
| Total | 1,358 (100.0%) | 507 (100.0%) |
Monthly Housing Cost Tiers in Colonial Beach
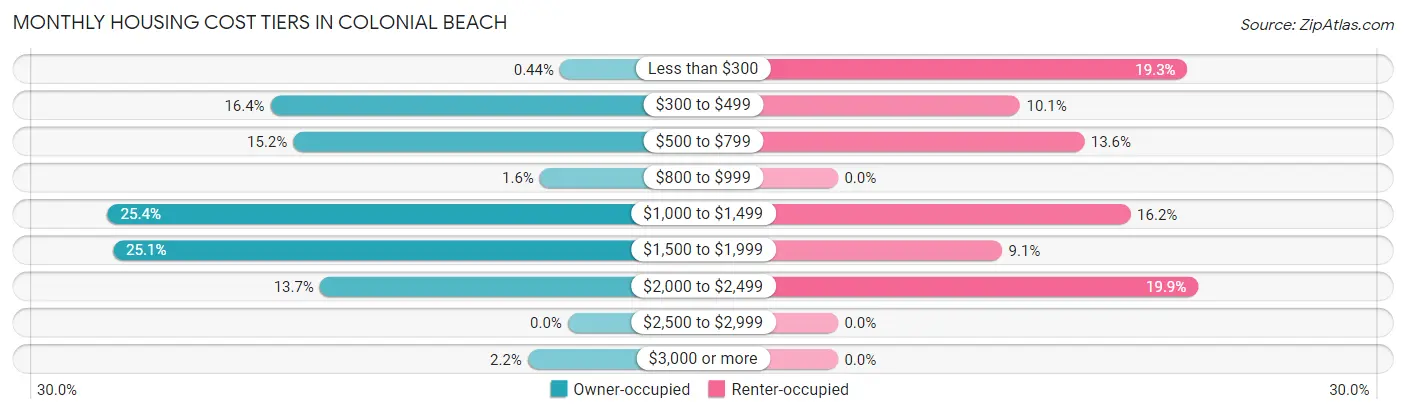
| Monthly Cost | Owner-occupied | Renter-occupied |
| Less than $300 | 6 (0.4%) | 98 (19.3%) |
| $300 to $499 | 223 (16.4%) | 51 (10.1%) |
| $500 to $799 | 206 (15.2%) | 69 (13.6%) |
| $800 to $999 | 21 (1.5%) | 0 (0.0%) |
| $1,000 to $1,499 | 345 (25.4%) | 82 (16.2%) |
| $1,500 to $1,999 | 341 (25.1%) | 46 (9.1%) |
| $2,000 to $2,499 | 186 (13.7%) | 101 (19.9%) |
| $2,500 to $2,999 | 0 (0.0%) | 0 (0.0%) |
| $3,000 or more | 30 (2.2%) | 0 (0.0%) |
| Total | 1,358 (100.0%) | 507 (100.0%) |
Physical Housing Characteristics in Colonial Beach
Housing Structures in Colonial Beach

| Structure Type | # Housing Units | % Housing Units |
| Single Unit, Detached | 1,519 | 81.5% |
| Single Unit, Attached | 136 | 7.3% |
| 2 Unit Apartments | 0 | 0.0% |
| 3 or 4 Unit Apartments | 103 | 5.5% |
| 5 to 9 Unit Apartments | 42 | 2.2% |
| 10 or more Apartments | 54 | 2.9% |
| Mobile Home / Other | 11 | 0.6% |
| Total | 1,865 | 100.0% |
Housing Structures by Occupancy in Colonial Beach
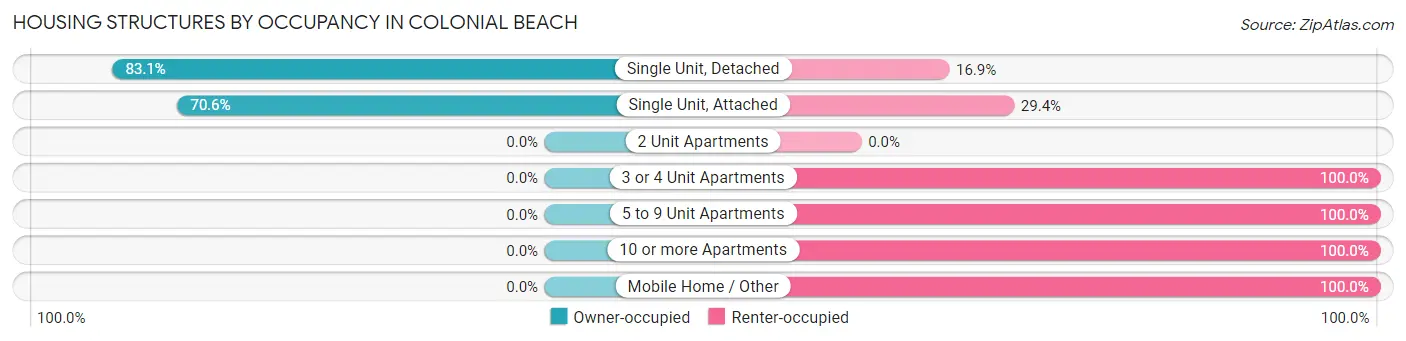
| Structure Type | Owner-occupied | Renter-occupied |
| Single Unit, Detached | 1,262 (83.1%) | 257 (16.9%) |
| Single Unit, Attached | 96 (70.6%) | 40 (29.4%) |
| 2 Unit Apartments | 0 (0.0%) | 0 (0.0%) |
| 3 or 4 Unit Apartments | 0 (0.0%) | 103 (100.0%) |
| 5 to 9 Unit Apartments | 0 (0.0%) | 42 (100.0%) |
| 10 or more Apartments | 0 (0.0%) | 54 (100.0%) |
| Mobile Home / Other | 0 (0.0%) | 11 (100.0%) |
| Total | 1,358 (72.8%) | 507 (27.2%) |
Housing Structures by Number of Rooms in Colonial Beach
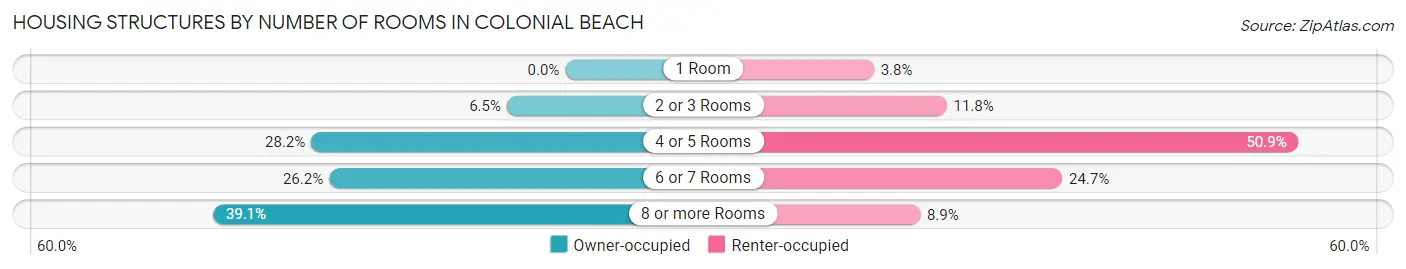
| Number of Rooms | Owner-occupied | Renter-occupied |
| 1 Room | 0 (0.0%) | 19 (3.7%) |
| 2 or 3 Rooms | 88 (6.5%) | 60 (11.8%) |
| 4 or 5 Rooms | 383 (28.2%) | 258 (50.9%) |
| 6 or 7 Rooms | 356 (26.2%) | 125 (24.6%) |
| 8 or more Rooms | 531 (39.1%) | 45 (8.9%) |
| Total | 1,358 (100.0%) | 507 (100.0%) |
Housing Structure by Heating Type in Colonial Beach
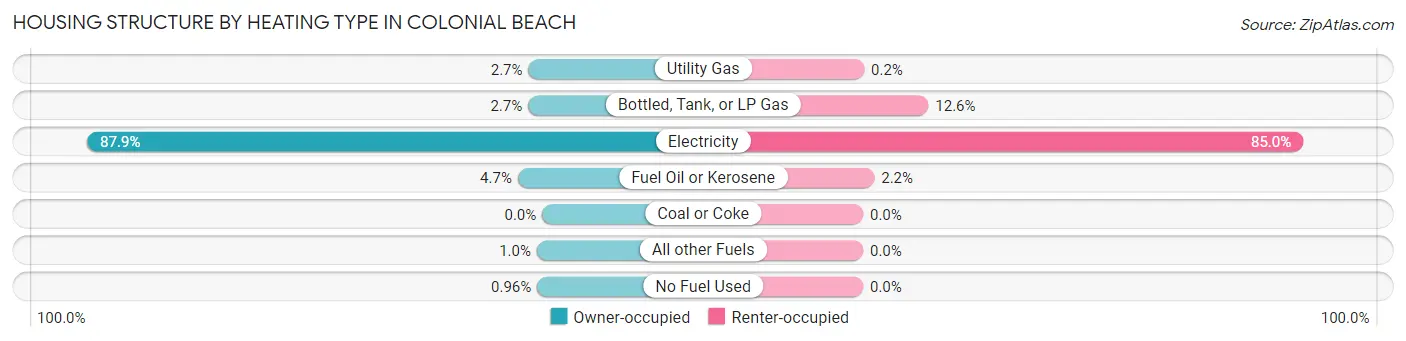
| Heating Type | Owner-occupied | Renter-occupied |
| Utility Gas | 36 (2.6%) | 1 (0.2%) |
| Bottled, Tank, or LP Gas | 37 (2.7%) | 64 (12.6%) |
| Electricity | 1,194 (87.9%) | 431 (85.0%) |
| Fuel Oil or Kerosene | 64 (4.7%) | 11 (2.2%) |
| Coal or Coke | 0 (0.0%) | 0 (0.0%) |
| All other Fuels | 14 (1.0%) | 0 (0.0%) |
| No Fuel Used | 13 (1.0%) | 0 (0.0%) |
| Total | 1,358 (100.0%) | 507 (100.0%) |
Household Vehicle Usage in Colonial Beach
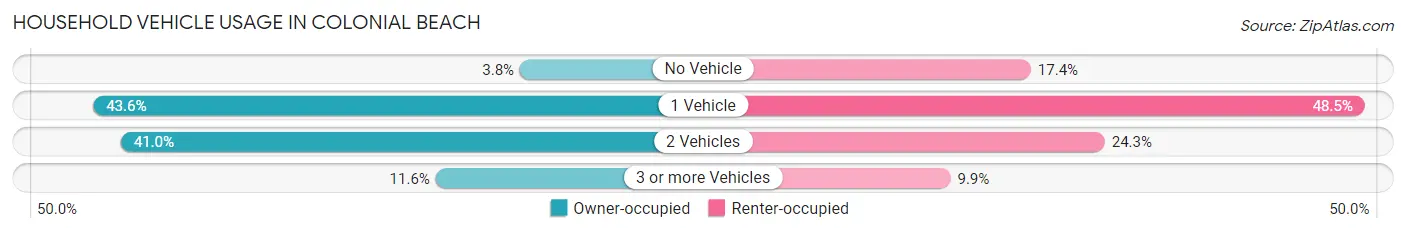
| Vehicles per Household | Owner-occupied | Renter-occupied |
| No Vehicle | 51 (3.8%) | 88 (17.4%) |
| 1 Vehicle | 592 (43.6%) | 246 (48.5%) |
| 2 Vehicles | 557 (41.0%) | 123 (24.3%) |
| 3 or more Vehicles | 158 (11.6%) | 50 (9.9%) |
| Total | 1,358 (100.0%) | 507 (100.0%) |
Real Estate & Mortgages in Colonial Beach
Real Estate and Mortgage Overview in Colonial Beach
| Characteristic | Without Mortgage | With Mortgage |
| Housing Units | 447 | 911 |
| Median Property Value | $215,700 | $245,200 |
| Median Household Income | - | - |
| Monthly Housing Costs | $497 | $30 |
| Real Estate Taxes | $2,491 | $0 |
Property Value by Mortgage Status in Colonial Beach

| Property Value | Without Mortgage | With Mortgage |
| Less than $50,000 | 0 (0.0%) | 21 (2.3%) |
| $50,000 to $99,999 | 43 (9.6%) | 0 (0.0%) |
| $100,000 to $299,999 | 314 (70.3%) | 733 (80.5%) |
| $300,000 to $499,999 | 53 (11.9%) | 108 (11.9%) |
| $500,000 to $749,999 | 25 (5.6%) | 37 (4.1%) |
| $750,000 to $999,999 | 12 (2.7%) | 12 (1.3%) |
| $1,000,000 or more | 0 (0.0%) | 0 (0.0%) |
| Total | 447 (100.0%) | 911 (100.0%) |
Household Income by Mortgage Status in Colonial Beach
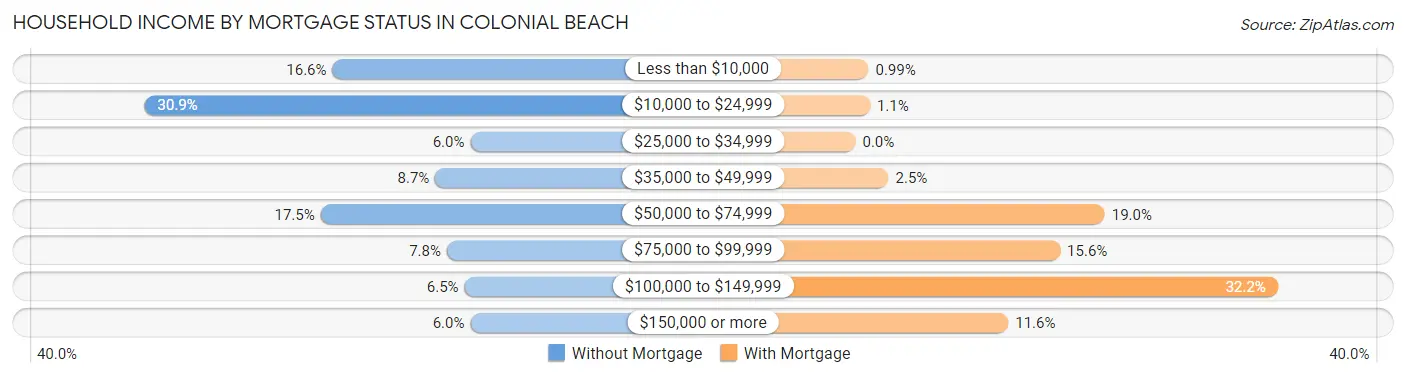
| Household Income | Without Mortgage | With Mortgage |
| Less than $10,000 | 74 (16.6%) | 9 (1.0%) |
| $10,000 to $24,999 | 138 (30.9%) | 10 (1.1%) |
| $25,000 to $34,999 | 27 (6.0%) | 0 (0.0%) |
| $35,000 to $49,999 | 39 (8.7%) | 23 (2.5%) |
| $50,000 to $74,999 | 78 (17.4%) | 173 (19.0%) |
| $75,000 to $99,999 | 35 (7.8%) | 142 (15.6%) |
| $100,000 to $149,999 | 29 (6.5%) | 293 (32.2%) |
| $150,000 or more | 27 (6.0%) | 106 (11.6%) |
| Total | 447 (100.0%) | 911 (100.0%) |
Property Value to Household Income Ratio in Colonial Beach
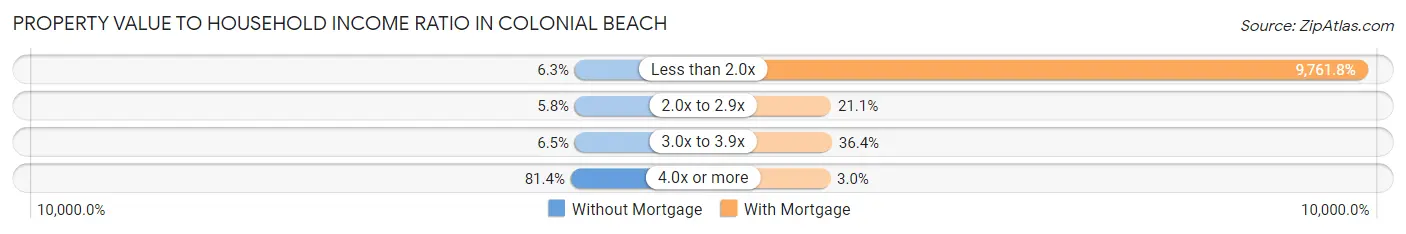
| Value-to-Income Ratio | Without Mortgage | With Mortgage |
| Less than 2.0x | 28 (6.3%) | 88,930 (9,761.8%) |
| 2.0x to 2.9x | 26 (5.8%) | 192 (21.1%) |
| 3.0x to 3.9x | 29 (6.5%) | 332 (36.4%) |
| 4.0x or more | 364 (81.4%) | 27 (3.0%) |
| Total | 447 (100.0%) | 911 (100.0%) |
Real Estate Taxes by Mortgage Status in Colonial Beach
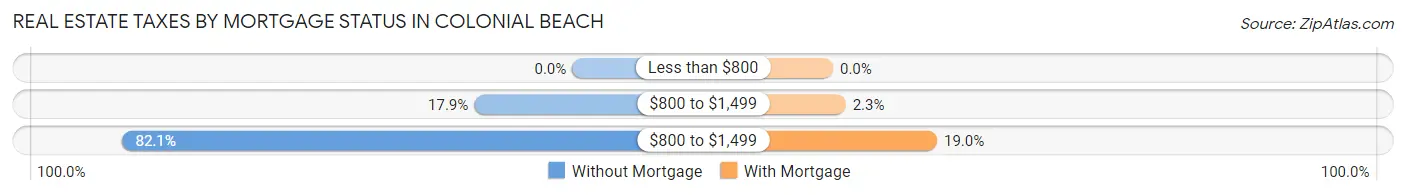
| Property Taxes | Without Mortgage | With Mortgage |
| Less than $800 | 0 (0.0%) | 0 (0.0%) |
| $800 to $1,499 | 80 (17.9%) | 21 (2.3%) |
| $800 to $1,499 | 367 (82.1%) | 173 (19.0%) |
| Total | 447 (100.0%) | 911 (100.0%) |
Health & Disability in Colonial Beach
Health Insurance Coverage by Age in Colonial Beach
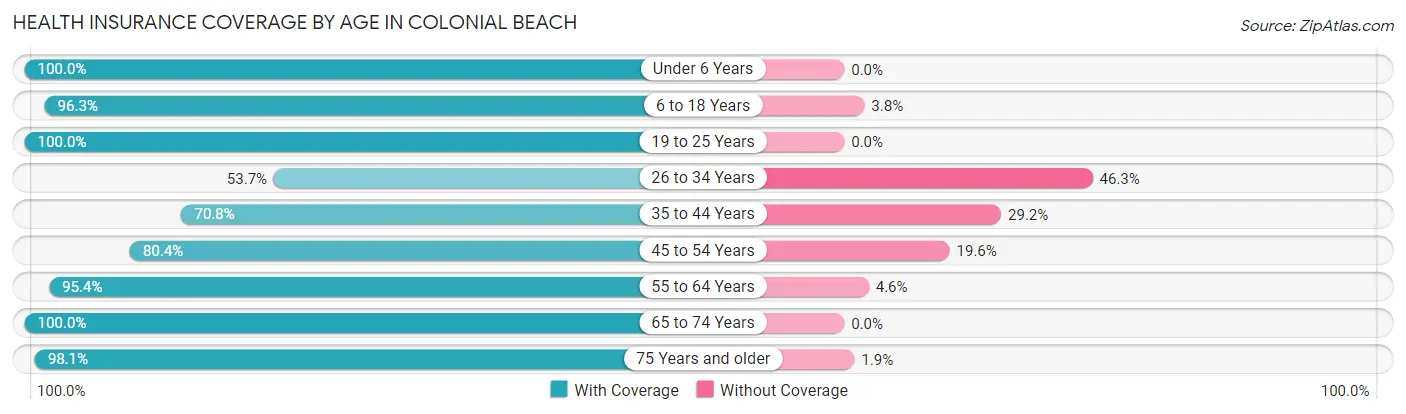
| Age Bracket | With Coverage | Without Coverage |
| Under 6 Years | 264 (100.0%) | 0 (0.0%) |
| 6 to 18 Years | 462 (96.3%) | 18 (3.7%) |
| 19 to 25 Years | 155 (100.0%) | 0 (0.0%) |
| 26 to 34 Years | 203 (53.7%) | 175 (46.3%) |
| 35 to 44 Years | 317 (70.8%) | 131 (29.2%) |
| 45 to 54 Years | 266 (80.4%) | 65 (19.6%) |
| 55 to 64 Years | 606 (95.4%) | 29 (4.6%) |
| 65 to 74 Years | 676 (100.0%) | 0 (0.0%) |
| 75 Years and older | 308 (98.1%) | 6 (1.9%) |
| Total | 3,257 (88.5%) | 424 (11.5%) |
Health Insurance Coverage by Citizenship Status in Colonial Beach
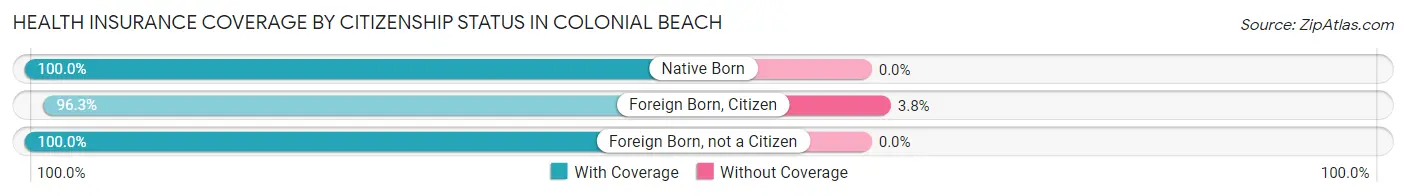
| Citizenship Status | With Coverage | Without Coverage |
| Native Born | 264 (100.0%) | 0 (0.0%) |
| Foreign Born, Citizen | 462 (96.3%) | 18 (3.7%) |
| Foreign Born, not a Citizen | 155 (100.0%) | 0 (0.0%) |
Health Insurance Coverage by Household Income in Colonial Beach
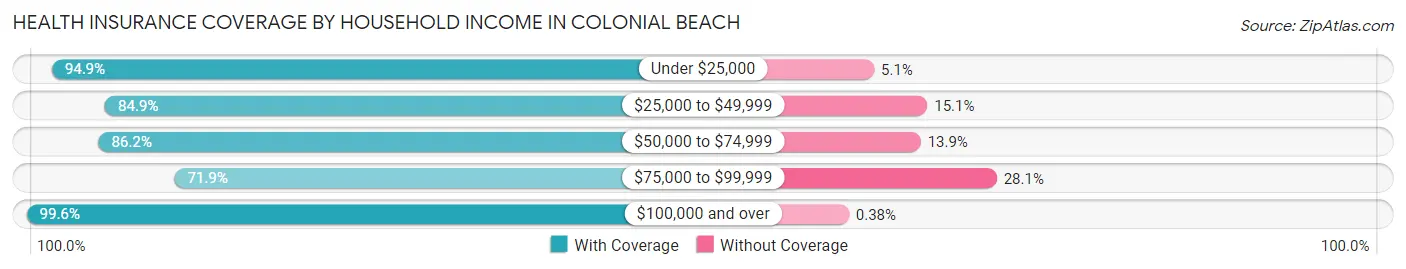
| Household Income | With Coverage | Without Coverage |
| Under $25,000 | 761 (94.9%) | 41 (5.1%) |
| $25,000 to $49,999 | 512 (84.9%) | 91 (15.1%) |
| $50,000 to $74,999 | 336 (86.2%) | 54 (13.9%) |
| $75,000 to $99,999 | 599 (71.9%) | 234 (28.1%) |
| $100,000 and over | 1,049 (99.6%) | 4 (0.4%) |
Public vs Private Health Insurance Coverage by Age in Colonial Beach
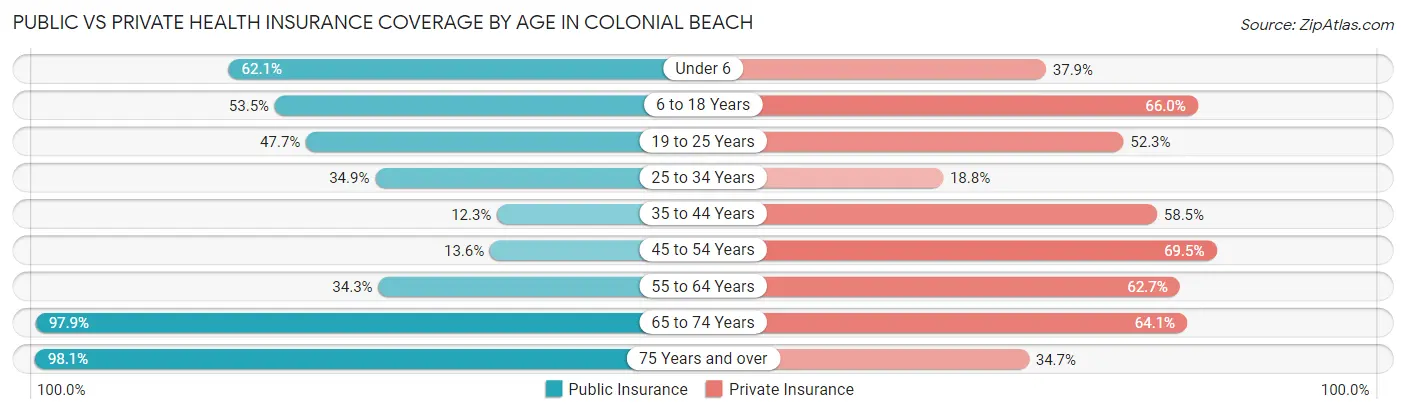
| Age Bracket | Public Insurance | Private Insurance |
| Under 6 | 164 (62.1%) | 100 (37.9%) |
| 6 to 18 Years | 257 (53.5%) | 317 (66.0%) |
| 19 to 25 Years | 74 (47.7%) | 81 (52.3%) |
| 25 to 34 Years | 132 (34.9%) | 71 (18.8%) |
| 35 to 44 Years | 55 (12.3%) | 262 (58.5%) |
| 45 to 54 Years | 45 (13.6%) | 230 (69.5%) |
| 55 to 64 Years | 218 (34.3%) | 398 (62.7%) |
| 65 to 74 Years | 662 (97.9%) | 433 (64.0%) |
| 75 Years and over | 308 (98.1%) | 109 (34.7%) |
| Total | 1,915 (52.0%) | 2,001 (54.4%) |
Disability Status by Sex by Age in Colonial Beach
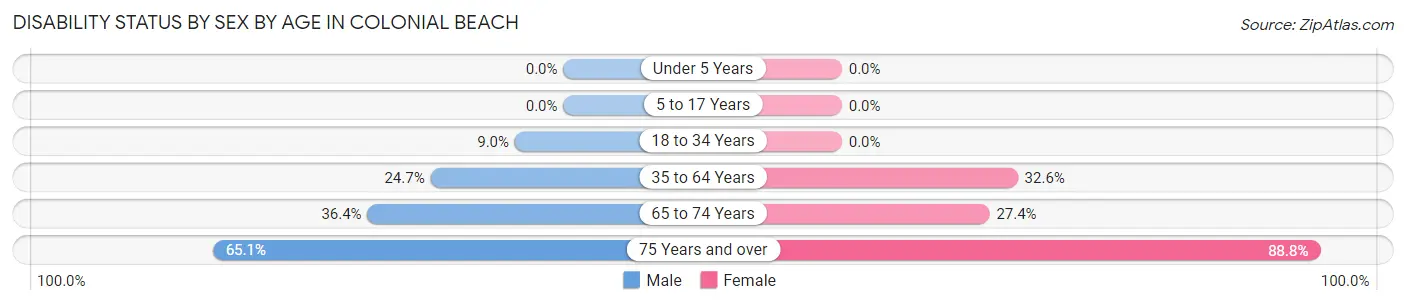
| Age Bracket | Male | Female |
| Under 5 Years | 0 (0.0%) | 0 (0.0%) |
| 5 to 17 Years | 0 (0.0%) | 0 (0.0%) |
| 18 to 34 Years | 26 (9.0%) | 0 (0.0%) |
| 35 to 64 Years | 147 (24.7%) | 267 (32.6%) |
| 65 to 74 Years | 76 (36.4%) | 128 (27.4%) |
| 75 Years and over | 123 (65.1%) | 111 (88.8%) |
Disability Class by Sex by Age in Colonial Beach
Disability Class: Hearing Difficulty
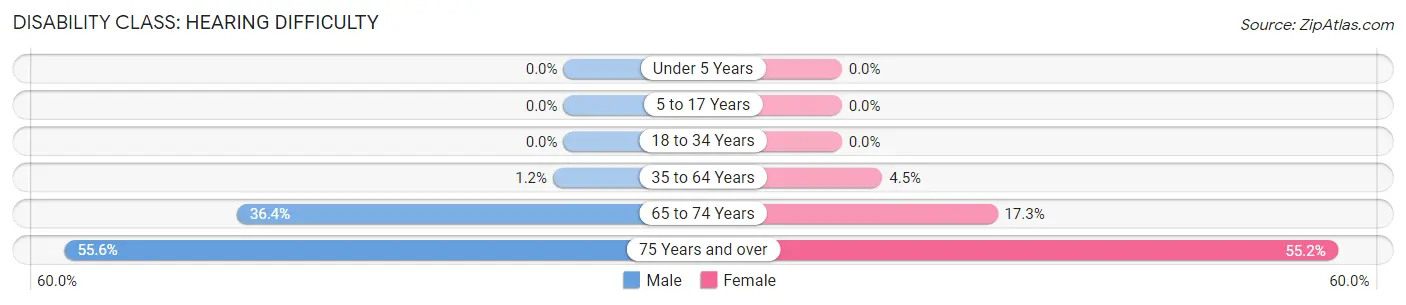
| Age Bracket | Male | Female |
| Under 5 Years | 0 (0.0%) | 0 (0.0%) |
| 5 to 17 Years | 0 (0.0%) | 0 (0.0%) |
| 18 to 34 Years | 0 (0.0%) | 0 (0.0%) |
| 35 to 64 Years | 7 (1.2%) | 37 (4.5%) |
| 65 to 74 Years | 76 (36.4%) | 81 (17.3%) |
| 75 Years and over | 105 (55.6%) | 69 (55.2%) |
Disability Class: Vision Difficulty
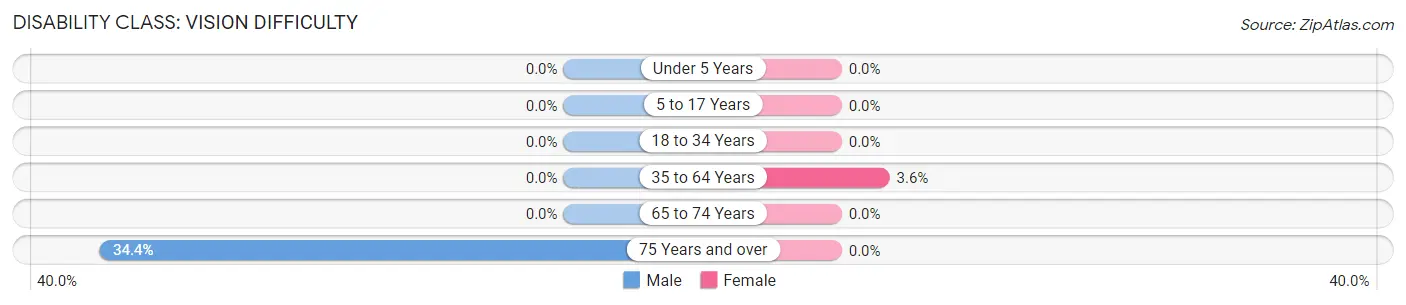
| Age Bracket | Male | Female |
| Under 5 Years | 0 (0.0%) | 0 (0.0%) |
| 5 to 17 Years | 0 (0.0%) | 0 (0.0%) |
| 18 to 34 Years | 0 (0.0%) | 0 (0.0%) |
| 35 to 64 Years | 0 (0.0%) | 29 (3.5%) |
| 65 to 74 Years | 0 (0.0%) | 0 (0.0%) |
| 75 Years and over | 65 (34.4%) | 0 (0.0%) |
Disability Class: Cognitive Difficulty
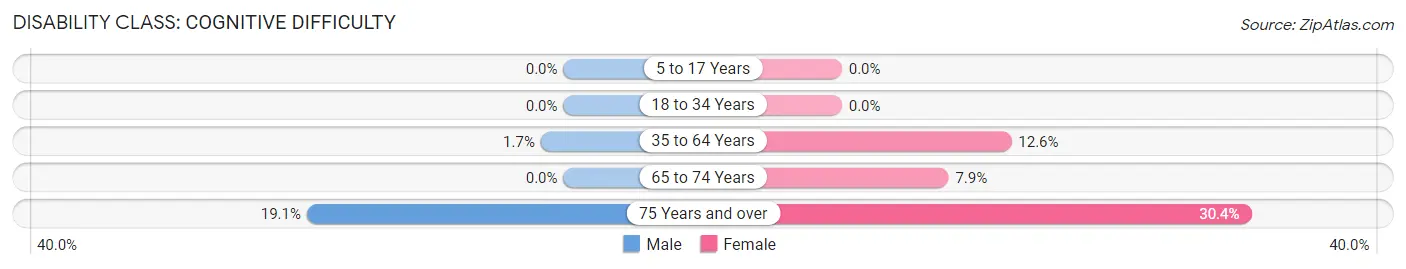
| Age Bracket | Male | Female |
| 5 to 17 Years | 0 (0.0%) | 0 (0.0%) |
| 18 to 34 Years | 0 (0.0%) | 0 (0.0%) |
| 35 to 64 Years | 10 (1.7%) | 103 (12.6%) |
| 65 to 74 Years | 0 (0.0%) | 37 (7.9%) |
| 75 Years and over | 36 (19.1%) | 38 (30.4%) |
Disability Class: Ambulatory Difficulty
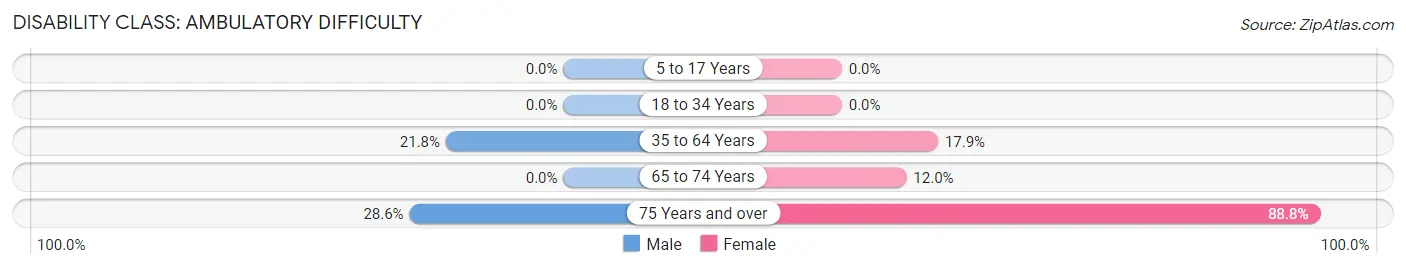
| Age Bracket | Male | Female |
| 5 to 17 Years | 0 (0.0%) | 0 (0.0%) |
| 18 to 34 Years | 0 (0.0%) | 0 (0.0%) |
| 35 to 64 Years | 130 (21.8%) | 146 (17.8%) |
| 65 to 74 Years | 0 (0.0%) | 56 (12.0%) |
| 75 Years and over | 54 (28.6%) | 111 (88.8%) |
Disability Class: Self-Care Difficulty
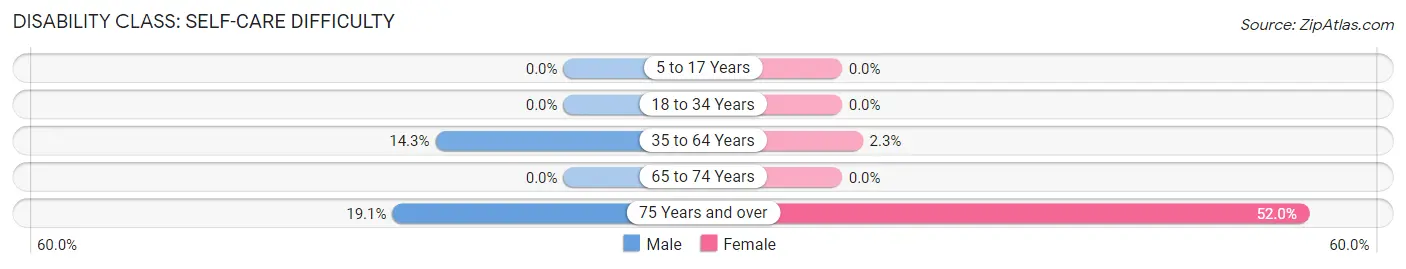
| Age Bracket | Male | Female |
| 5 to 17 Years | 0 (0.0%) | 0 (0.0%) |
| 18 to 34 Years | 0 (0.0%) | 0 (0.0%) |
| 35 to 64 Years | 85 (14.3%) | 19 (2.3%) |
| 65 to 74 Years | 0 (0.0%) | 0 (0.0%) |
| 75 Years and over | 36 (19.1%) | 65 (52.0%) |
Technology Access in Colonial Beach
Computing Device Access in Colonial Beach
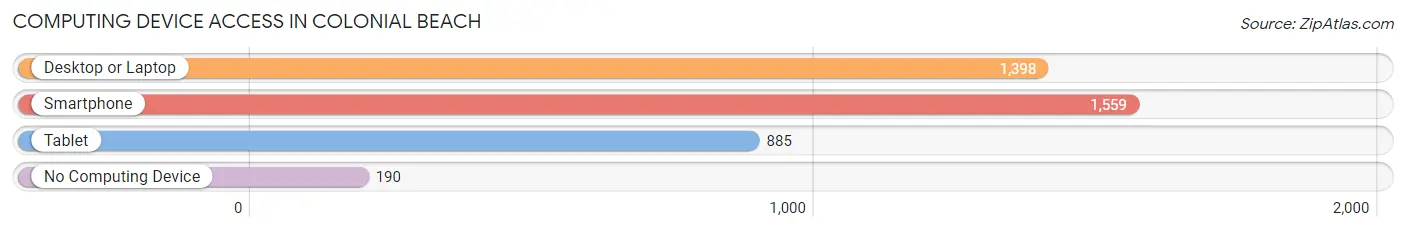
| Device Type | # Households | % Households |
| Desktop or Laptop | 1,398 | 75.0% |
| Smartphone | 1,559 | 83.6% |
| Tablet | 885 | 47.4% |
| No Computing Device | 190 | 10.2% |
| Total | 1,865 | 100.0% |
Internet Access in Colonial Beach
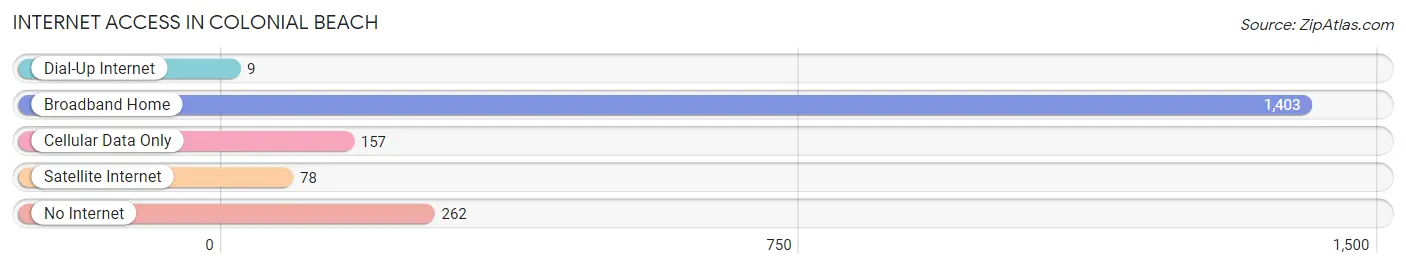
| Internet Type | # Households | % Households |
| Dial-Up Internet | 9 | 0.5% |
| Broadband Home | 1,403 | 75.2% |
| Cellular Data Only | 157 | 8.4% |
| Satellite Internet | 78 | 4.2% |
| No Internet | 262 | 14.1% |
| Total | 1,865 | 100.0% |
Colonial Beach Summary
Colonial Beach, Virginia is a small town located on the Potomac River in Westmoreland County, Virginia. It is situated approximately 70 miles east of Washington, D.C. and is part of the Northern Neck region of Virginia. The town has a population of approximately 3,500 people and is a popular tourist destination due to its proximity to the Potomac River and its many attractions.
History
Colonial Beach was founded in 1650 by English settlers who were looking for a place to settle and establish a trading post. The town was originally known as “The Town of Westmoreland” and was the first English settlement in the Northern Neck region of Virginia. The town was renamed “Colonial Beach” in 1892 to reflect its colonial heritage.
The town was a popular destination for tourists in the late 19th and early 20th centuries. It was known for its beaches, fishing, and other recreational activities. The town was also home to a number of resorts and hotels, including the Colonial Beach Hotel, which was built in 1892 and was one of the first hotels in the area.
The town was also home to a number of prominent figures in American history, including George Washington, who visited the town in 1776. The town was also home to Confederate General Robert E. Lee, who was born in the town in 1807.
Geography
Colonial Beach is located on the Potomac River in Westmoreland County, Virginia. The town is situated approximately 70 miles east of Washington, D.C. and is part of the Northern Neck region of Virginia. The town is bordered by the Potomac River to the north, the Rappahannock River to the east, and the Chesapeake Bay to the south.
The town is located on a peninsula, which is surrounded by the Potomac River on three sides. The town is divided into two sections, the “Old Town” and the “New Town”. The Old Town is located on the northern side of the peninsula and is home to the town’s historic district. The New Town is located on the southern side of the peninsula and is home to the town’s commercial district.
Economy
The economy of Colonial Beach is largely based on tourism. The town is a popular destination for tourists due to its proximity to the Potomac River and its many attractions. The town is home to a number of resorts and hotels, as well as restaurants, shops, and other businesses.
The town is also home to a number of marinas, which provide services to boaters and fishermen. The town is also home to a number of boatyards, which provide services to boat owners.
Demographics
As of the 2010 census, the population of Colonial Beach was 3,543. The racial makeup of the town was 79.3% White, 15.2% African American, 0.3% Native American, 0.7% Asian, 0.1% Pacific Islander, and 4.4% from other races. The median household income in the town was $41,944.
Conclusion
Colonial Beach, Virginia is a small town located on the Potomac River in Westmoreland County, Virginia. It is a popular tourist destination due to its proximity to the Potomac River and its many attractions. The town has a population of approximately 3,500 people and is home to a number of resorts and hotels, as well as restaurants, shops, and other businesses. The economy of the town is largely based on tourism and the town is home to a number of marinas and boatyards. The racial makeup of the town is 79.3% White, 15.2% African American, 0.3% Native American, 0.7% Asian, 0.1% Pacific Islander, and 4.4% from other races. The median household income in the town was $41,944.
Common Questions
What is Per Capita Income in Colonial Beach?
Per Capita income in Colonial Beach is $36,187.
What is the Median Family Income in Colonial Beach?
Median Family Income in Colonial Beach is $90,956.
What is the Median Household income in Colonial Beach?
Median Household Income in Colonial Beach is $55,731.
What is Income or Wage Gap in Colonial Beach?
Income or Wage Gap in Colonial Beach is 57.7%.
Women in Colonial Beach earn 42.3 cents for every dollar earned by a man.
What is Inequality or Gini Index in Colonial Beach?
Inequality or Gini Index in Colonial Beach is 0.47.
What is the Total Population of Colonial Beach?
Total Population of Colonial Beach is 3,895.
What is the Total Male Population of Colonial Beach?
Total Male Population of Colonial Beach is 1,850.
What is the Total Female Population of Colonial Beach?
Total Female Population of Colonial Beach is 2,045.
What is the Ratio of Males per 100 Females in Colonial Beach?
There are 90.46 Males per 100 Females in Colonial Beach.
What is the Ratio of Females per 100 Males in Colonial Beach?
There are 110.54 Females per 100 Males in Colonial Beach.
What is the Median Population Age in Colonial Beach?
Median Population Age in Colonial Beach is 46.9 Years.
What is the Average Family Size in Colonial Beach
Average Family Size in Colonial Beach is 3.1 People.
What is the Average Household Size in Colonial Beach
Average Household Size in Colonial Beach is 2.0 People.
How Large is the Labor Force in Colonial Beach?
There are 1,477 People in the Labor Forcein in Colonial Beach.
What is the Percentage of People in the Labor Force in Colonial Beach?
45.8% of People are in the Labor Force in Colonial Beach.
What is the Unemployment Rate in Colonial Beach?
Unemployment Rate in Colonial Beach is 4.1%.