Zip Codes with the Highest Percentage of Population Employed in Life, Physical & Social Science in Sterling, VA
RELATED REPORTS & OPTIONS
Life, Physical & Social Science
Sterling
Compare Zip Codes
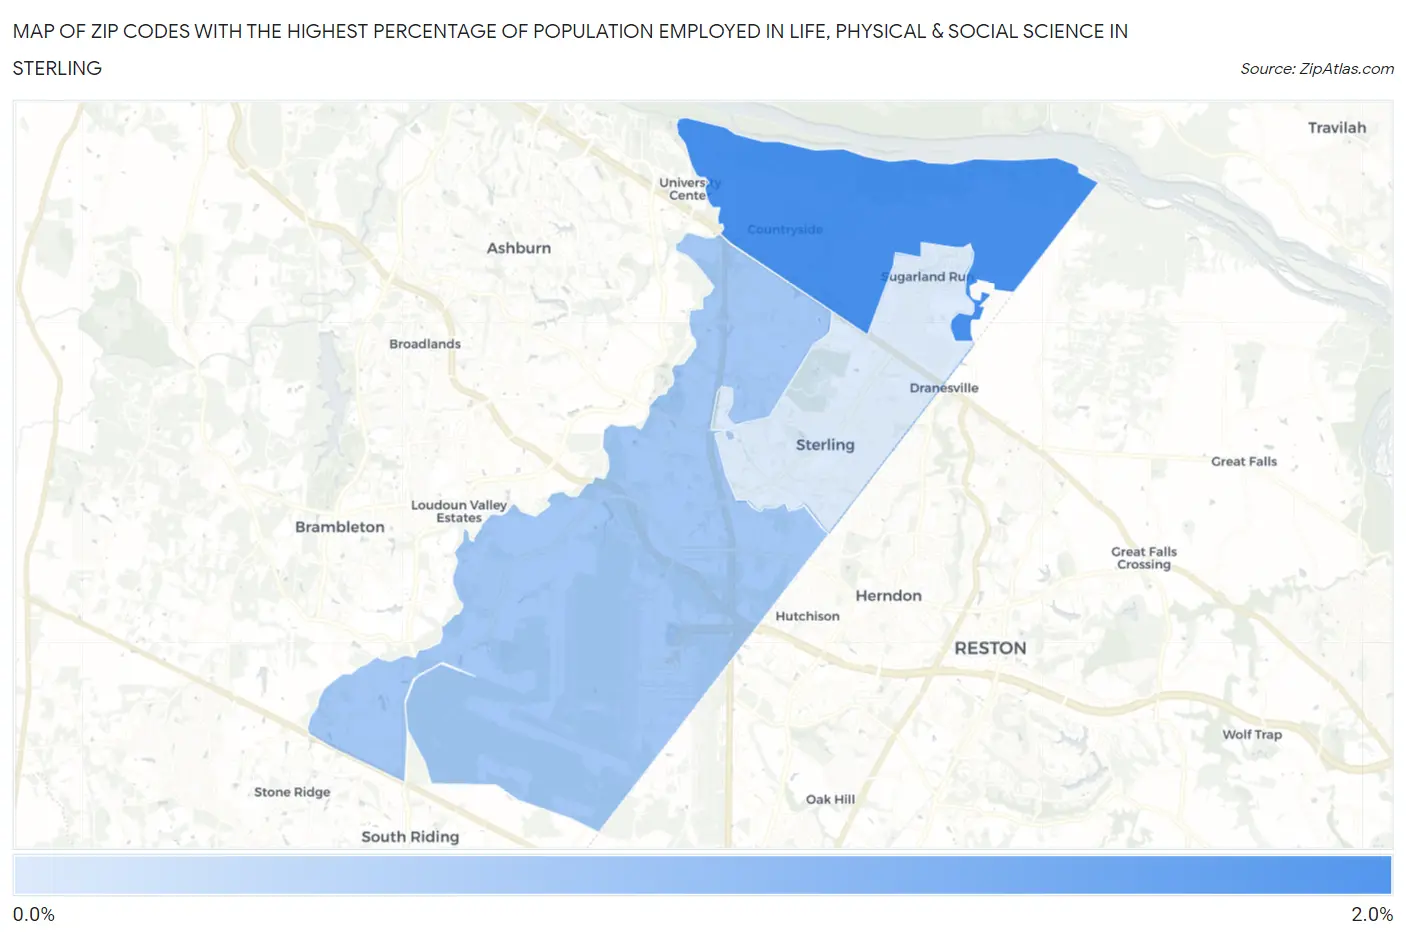
Map of Zip Codes with the Highest Percentage of Population Employed in Life, Physical & Social Science in Sterling
0.91%
1.7%
Zip Codes with the Highest Percentage of Population Employed in Life, Physical & Social Science in Sterling, VA
| Zip Code | % Employed | vs State | vs National | |
| 1. | 20165 | 1.7% | 1.3%(+0.470)#134 | 1.1%(+0.656)#4,522 |
| 2. | 20166 | 1.2% | 1.3%(-0.049)#211 | 1.1%(+0.137)#7,281 |
| 3. | 20164 | 0.91% | 1.3%(-0.371)#283 | 1.1%(-0.185)#9,904 |
1
Common Questions
What are the Top Zip Codes with the Highest Percentage of Population Employed in Life, Physical & Social Science in Sterling, VA?
Top Zip Codes with the Highest Percentage of Population Employed in Life, Physical & Social Science in Sterling, VA are:
What zip code has the Highest Percentage of Population Employed in Life, Physical & Social Science in Sterling, VA?
20165 has the Highest Percentage of Population Employed in Life, Physical & Social Science in Sterling, VA with 1.7%.
What is the Percentage of Population Employed in Life, Physical & Social Science in Sterling, VA?
Percentage of Population Employed in Life, Physical & Social Science in Sterling is 1.1%.
What is the Percentage of Population Employed in Life, Physical & Social Science in Virginia?
Percentage of Population Employed in Life, Physical & Social Science in Virginia is 1.3%.
What is the Percentage of Population Employed in Life, Physical & Social Science in the United States?
Percentage of Population Employed in Life, Physical & Social Science in the United States is 1.1%.