Bridgewater, VA Map & Demographics
Bridgewater Map
Bridgewater Overview
$32,631
PER CAPITA INCOME
$98,566
AVG FAMILY INCOME
$72,051
AVG HOUSEHOLD INCOME
35.4%
WAGE / INCOME GAP [ % ]
64.6¢/ $1
WAGE / INCOME GAP [ $ ]
0.41
INEQUALITY / GINI INDEX
6,575
TOTAL POPULATION
2,886
MALE POPULATION
3,689
FEMALE POPULATION
78.23
MALES / 100 FEMALES
127.82
FEMALES / 100 MALES
32.1
MEDIAN AGE
3.1
AVG FAMILY SIZE
2.2
AVG HOUSEHOLD SIZE
3,377
LABOR FORCE [ PEOPLE ]
61.9%
PERCENT IN LABOR FORCE
6.6%
UNEMPLOYMENT RATE
Bridgewater Zip Codes
Bridgewater Area Codes
Income in Bridgewater
Income Overview in Bridgewater
Per Capita Income in Bridgewater is $32,631, while median incomes of families and households are $98,566 and $72,051 respectively.
| Characteristic | Number | Measure |
| Per Capita Income | 6,575 | $32,631 |
| Median Family Income | 1,207 | $98,566 |
| Mean Family Income | 1,207 | $124,084 |
| Median Household Income | 2,214 | $72,051 |
| Mean Household Income | 2,214 | $89,967 |
| Income Deficit | 1,207 | $0 |
| Wage / Income Gap (%) | 6,575 | 35.41% |
| Wage / Income Gap ($) | 6,575 | 64.59¢ per $1 |
| Gini / Inequality Index | 6,575 | 0.41 |
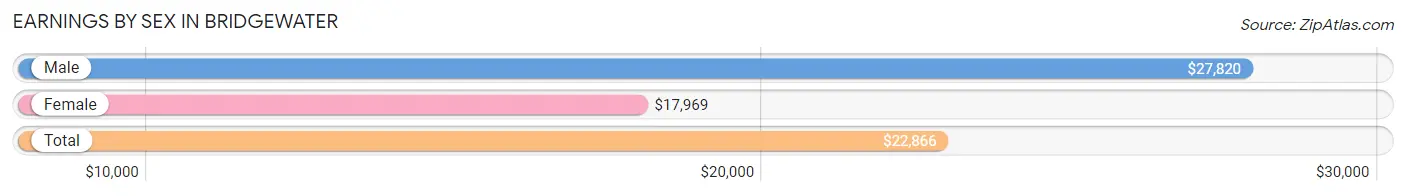
Earnings by Sex in Bridgewater
Average Earnings in Bridgewater are $22,866, $27,820 for men and $17,969 for women, a difference of 35.4%.
| Sex | Number | Average Earnings |
| Male | 1,833 (46.2%) | $27,820 |
| Female | 2,139 (53.8%) | $17,969 |
| Total | 3,972 (100.0%) | $22,866 |
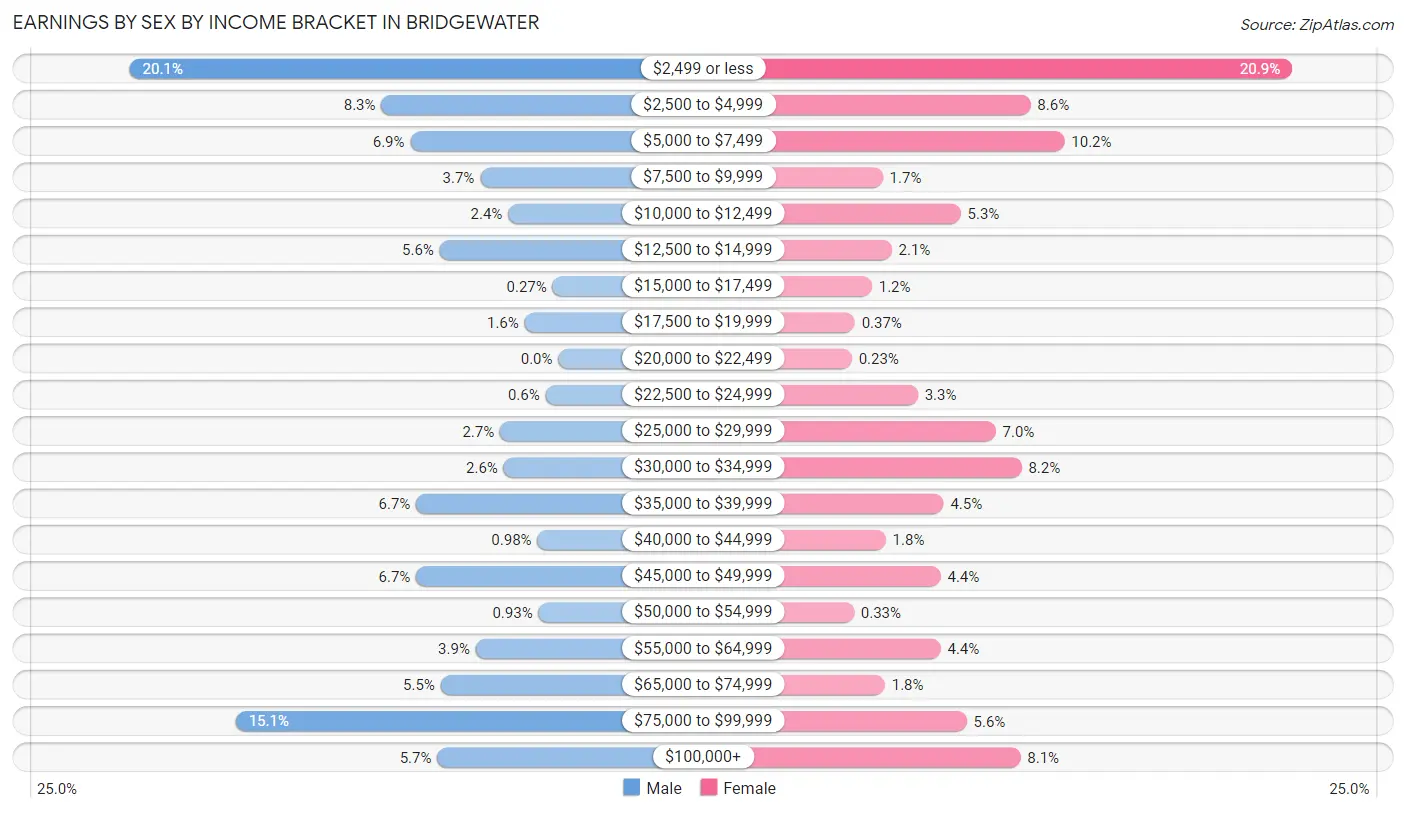
Earnings by Sex by Income Bracket in Bridgewater
The most common earnings brackets in Bridgewater are $2,499 or less for men (368 | 20.1%) and $2,499 or less for women (446 | 20.8%).
| Income | Male | Female |
| $2,499 or less | 368 (20.1%) | 446 (20.8%) |
| $2,500 to $4,999 | 152 (8.3%) | 184 (8.6%) |
| $5,000 to $7,499 | 127 (6.9%) | 218 (10.2%) |
| $7,500 to $9,999 | 67 (3.7%) | 36 (1.7%) |
| $10,000 to $12,499 | 43 (2.4%) | 114 (5.3%) |
| $12,500 to $14,999 | 102 (5.6%) | 45 (2.1%) |
| $15,000 to $17,499 | 5 (0.3%) | 25 (1.2%) |
| $17,500 to $19,999 | 29 (1.6%) | 8 (0.4%) |
| $20,000 to $22,499 | 0 (0.0%) | 5 (0.2%) |
| $22,500 to $24,999 | 11 (0.6%) | 71 (3.3%) |
| $25,000 to $29,999 | 50 (2.7%) | 149 (7.0%) |
| $30,000 to $34,999 | 47 (2.6%) | 175 (8.2%) |
| $35,000 to $39,999 | 122 (6.7%) | 97 (4.5%) |
| $40,000 to $44,999 | 18 (1.0%) | 39 (1.8%) |
| $45,000 to $49,999 | 122 (6.7%) | 94 (4.4%) |
| $50,000 to $54,999 | 17 (0.9%) | 7 (0.3%) |
| $55,000 to $64,999 | 71 (3.9%) | 94 (4.4%) |
| $65,000 to $74,999 | 101 (5.5%) | 38 (1.8%) |
| $75,000 to $99,999 | 277 (15.1%) | 120 (5.6%) |
| $100,000+ | 104 (5.7%) | 174 (8.1%) |
| Total | 1,833 (100.0%) | 2,139 (100.0%) |
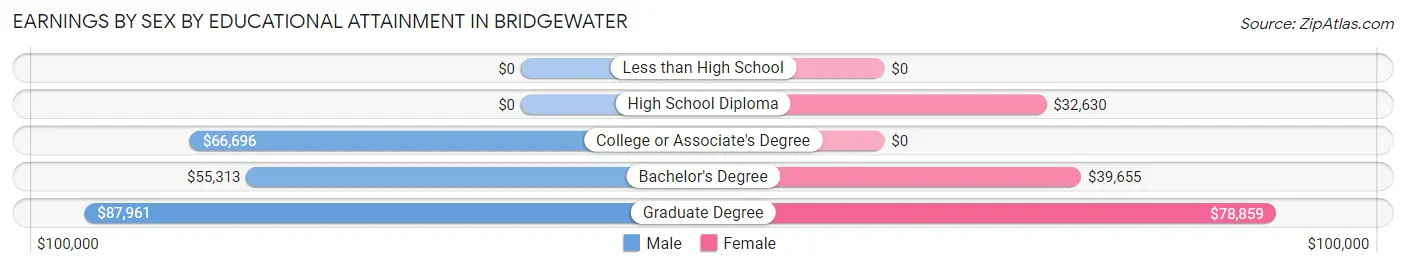
Earnings by Sex by Educational Attainment in Bridgewater
Average earnings in Bridgewater are $47,078 for men and $35,864 for women, a difference of 23.8%. Men with an educational attainment of graduate degree enjoy the highest average annual earnings of $87,961, while those with bachelor's degree education earn the least with $55,313. Women with an educational attainment of graduate degree earn the most with the average annual earnings of $78,859, while those with high school diploma education have the smallest earnings of $32,630.
| Educational Attainment | Male Income | Female Income |
| Less than High School | - | - |
| High School Diploma | - | - |
| College or Associate's Degree | $66,696 | $0 |
| Bachelor's Degree | $55,313 | $39,655 |
| Graduate Degree | $87,961 | $78,859 |
| Total | $47,078 | $35,864 |
Family Income in Bridgewater
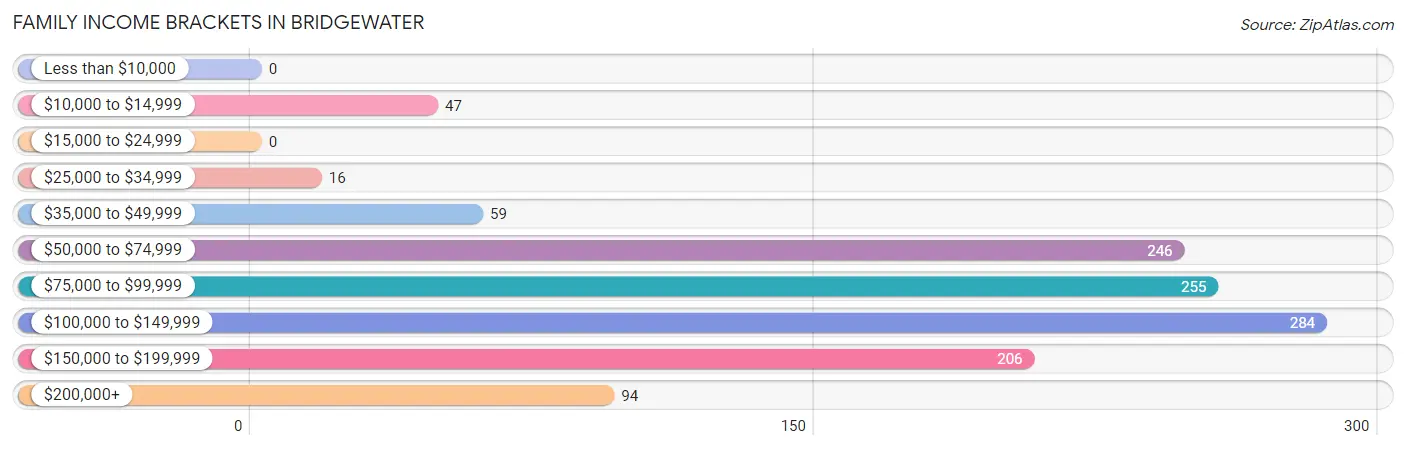
Family Income Brackets in Bridgewater
According to the Bridgewater family income data, there are 284 families falling into the $100,000 to $149,999 income range, which is the most common income bracket and makes up 23.5% of all families.
| Income Bracket | # Families | % Families |
| Less than $10,000 | 0 | 0.0% |
| $10,000 to $14,999 | 47 | 3.9% |
| $15,000 to $24,999 | 0 | 0.0% |
| $25,000 to $34,999 | 16 | 1.3% |
| $35,000 to $49,999 | 59 | 4.9% |
| $50,000 to $74,999 | 246 | 20.4% |
| $75,000 to $99,999 | 255 | 21.1% |
| $100,000 to $149,999 | 284 | 23.5% |
| $150,000 to $199,999 | 206 | 17.1% |
| $200,000+ | 94 | 7.8% |
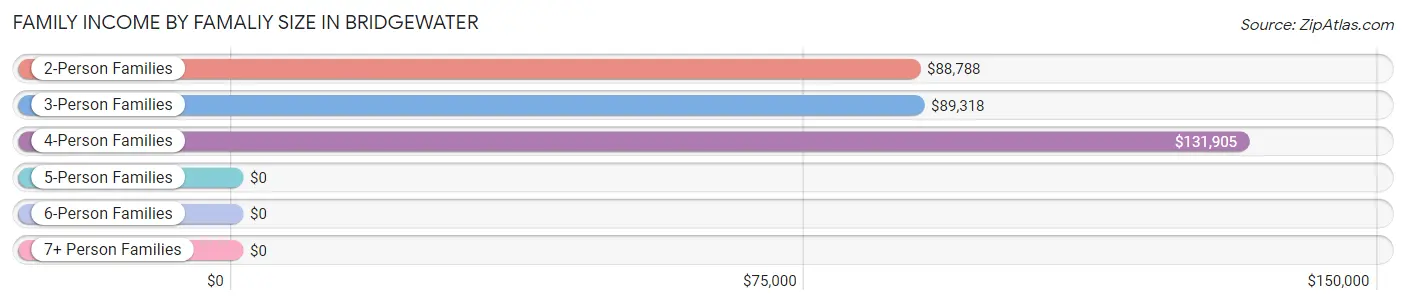
Family Income by Famaliy Size in Bridgewater
4-person families (398 | 33.0%) account for the highest median family income in Bridgewater with $131,905 per family, while 2-person families (428 | 35.5%) have the highest median income of $44,394 per family member.
| Income Bracket | # Families | Median Income |
| 2-Person Families | 428 (35.5%) | $88,788 |
| 3-Person Families | 262 (21.7%) | $89,318 |
| 4-Person Families | 398 (33.0%) | $131,905 |
| 5-Person Families | 91 (7.5%) | $0 |
| 6-Person Families | 28 (2.3%) | $0 |
| 7+ Person Families | 0 (0.0%) | $0 |
| Total | 1,207 (100.0%) | $98,566 |
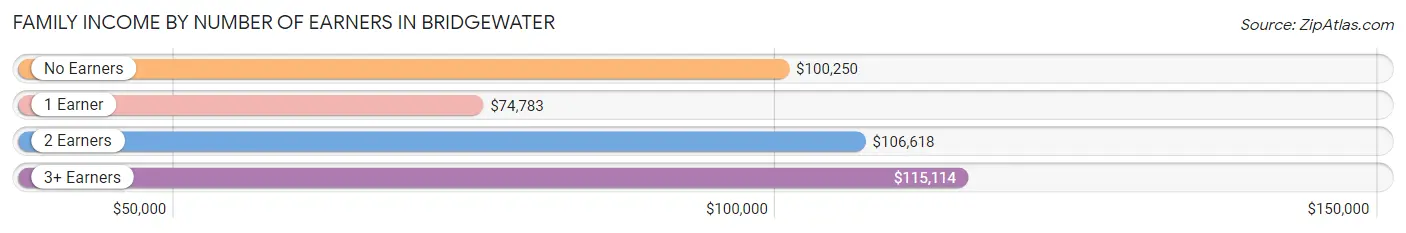
Family Income by Number of Earners in Bridgewater
The median family income in Bridgewater is $98,566, with families comprising 3+ earners (125) having the highest median family income of $115,114, while families with 1 earner (200) have the lowest median family income of $74,783, accounting for 10.4% and 16.6% of families, respectively.
| Number of Earners | # Families | Median Income |
| No Earners | 174 (14.4%) | $100,250 |
| 1 Earner | 200 (16.6%) | $74,783 |
| 2 Earners | 708 (58.7%) | $106,618 |
| 3+ Earners | 125 (10.4%) | $115,114 |
| Total | 1,207 (100.0%) | $98,566 |
Household Income in Bridgewater
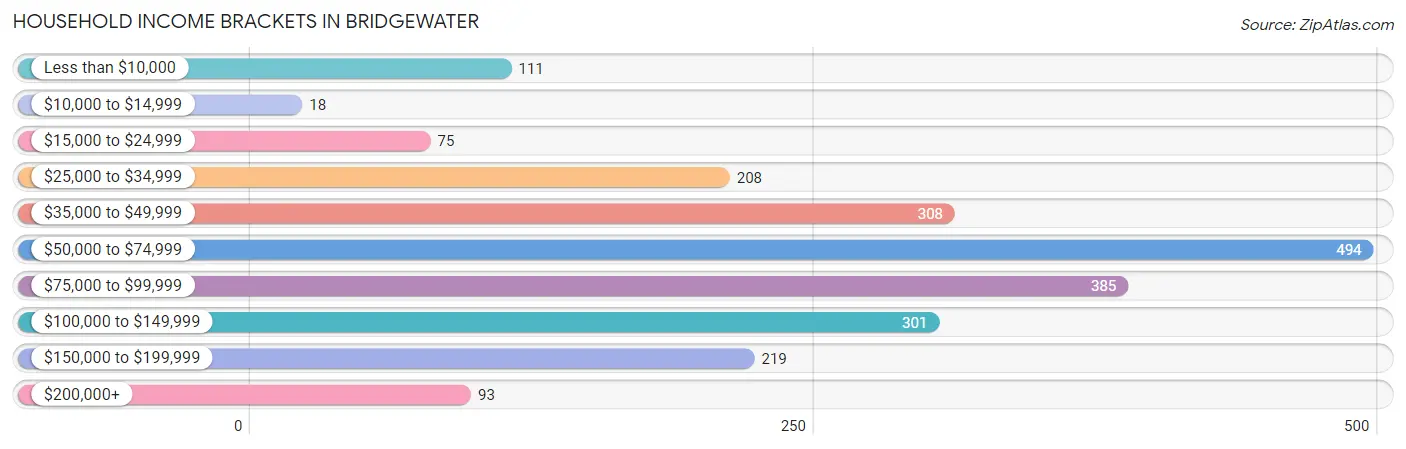
Household Income Brackets in Bridgewater
With 494 households falling in the category, the $50,000 to $74,999 income range is the most frequent in Bridgewater, accounting for 22.3% of all households. In contrast, only 18 households (0.8%) fall into the $10,000 to $14,999 income bracket, making it the least populous group.
| Income Bracket | # Households | % Households |
| Less than $10,000 | 111 | 5.0% |
| $10,000 to $14,999 | 18 | 0.8% |
| $15,000 to $24,999 | 75 | 3.4% |
| $25,000 to $34,999 | 208 | 9.4% |
| $35,000 to $49,999 | 308 | 13.9% |
| $50,000 to $74,999 | 494 | 22.3% |
| $75,000 to $99,999 | 385 | 17.4% |
| $100,000 to $149,999 | 301 | 13.6% |
| $150,000 to $199,999 | 219 | 9.9% |
| $200,000+ | 93 | 4.2% |
Household Income by Householder Age in Bridgewater
The median household income in Bridgewater is $72,051, with the highest median household income of $93,950 found in the 25 to 44 years age bracket for the primary householder. A total of 873 households (39.4%) fall into this category. Meanwhile, the 15 to 24 years age bracket for the primary householder has the lowest median household income of $37,371, with 55 households (2.5%) in this group.
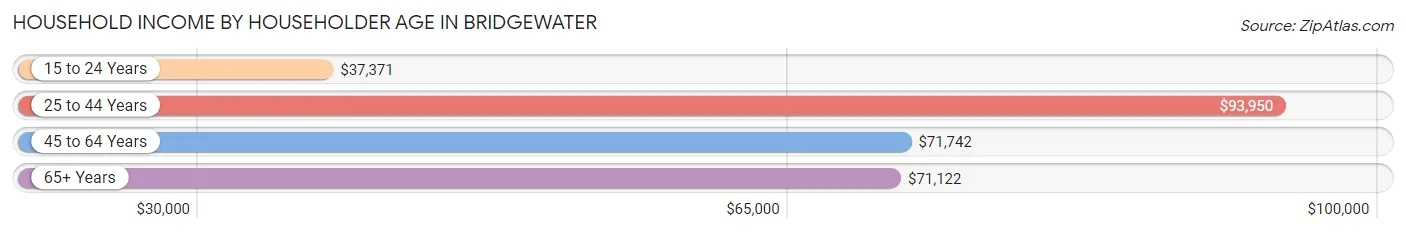
| Income Bracket | # Households | Median Income |
| 15 to 24 Years | 55 (2.5%) | $37,371 |
| 25 to 44 Years | 873 (39.4%) | $93,950 |
| 45 to 64 Years | 500 (22.6%) | $71,742 |
| 65+ Years | 786 (35.5%) | $71,122 |
| Total | 2,214 (100.0%) | $72,051 |
Poverty in Bridgewater
Income Below Poverty by Sex and Age in Bridgewater
With 10.8% poverty level for males and 8.5% for females among the residents of Bridgewater, 16 and 17 year old males and 18 to 24 year old females are the most vulnerable to poverty, with 59 males (100.0%) and 83 females (44.2%) in their respective age groups living below the poverty level.
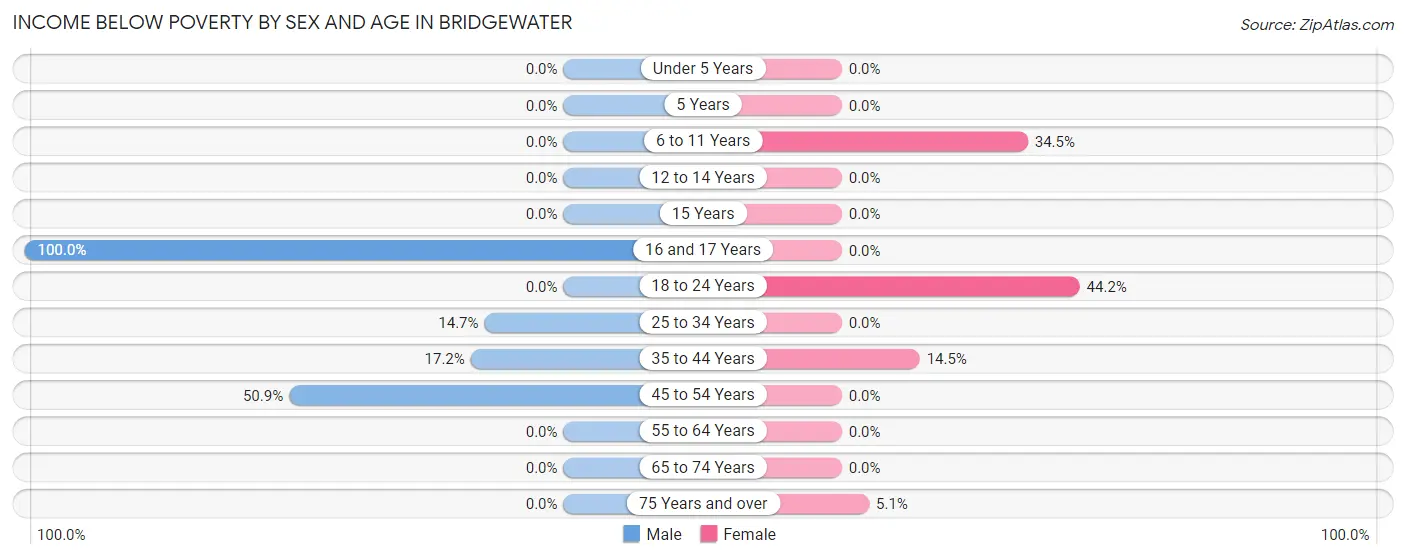
| Age Bracket | Male | Female |
| Under 5 Years | 0 (0.0%) | 0 (0.0%) |
| 5 Years | 0 (0.0%) | 0 (0.0%) |
| 6 to 11 Years | 0 (0.0%) | 87 (34.5%) |
| 12 to 14 Years | 0 (0.0%) | 0 (0.0%) |
| 15 Years | 0 (0.0%) | 0 (0.0%) |
| 16 and 17 Years | 59 (100.0%) | 0 (0.0%) |
| 18 to 24 Years | 0 (0.0%) | 83 (44.2%) |
| 25 to 34 Years | 56 (14.7%) | 0 (0.0%) |
| 35 to 44 Years | 69 (17.2%) | 47 (14.5%) |
| 45 to 54 Years | 55 (50.9%) | 0 (0.0%) |
| 55 to 64 Years | 0 (0.0%) | 0 (0.0%) |
| 65 to 74 Years | 0 (0.0%) | 0 (0.0%) |
| 75 Years and over | 0 (0.0%) | 17 (5.1%) |
| Total | 239 (10.8%) | 234 (8.5%) |
Income Above Poverty by Sex and Age in Bridgewater
According to the poverty statistics in Bridgewater, males aged under 5 years and females aged under 5 years are the age groups that are most secure financially, with 100.0% of males and 100.0% of females in these age groups living above the poverty line.
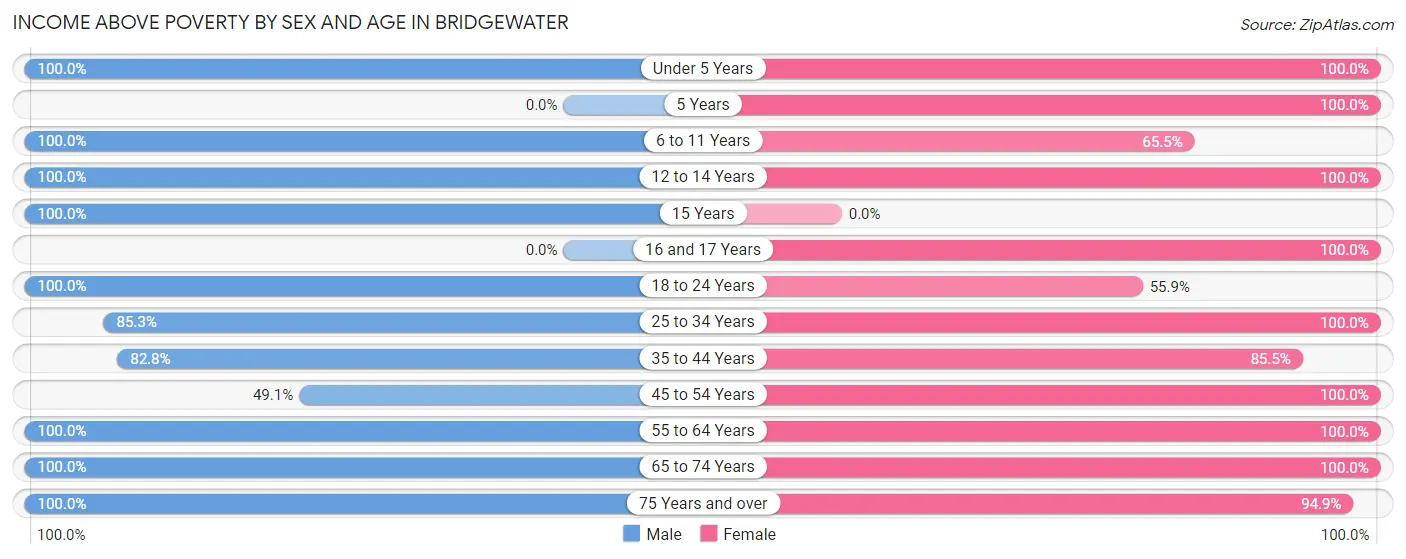
| Age Bracket | Male | Female |
| Under 5 Years | 164 (100.0%) | 189 (100.0%) |
| 5 Years | 0 (0.0%) | 127 (100.0%) |
| 6 to 11 Years | 120 (100.0%) | 165 (65.5%) |
| 12 to 14 Years | 155 (100.0%) | 91 (100.0%) |
| 15 Years | 22 (100.0%) | 0 (0.0%) |
| 16 and 17 Years | 0 (0.0%) | 16 (100.0%) |
| 18 to 24 Years | 71 (100.0%) | 105 (55.8%) |
| 25 to 34 Years | 326 (85.3%) | 441 (100.0%) |
| 35 to 44 Years | 332 (82.8%) | 278 (85.5%) |
| 45 to 54 Years | 53 (49.1%) | 141 (100.0%) |
| 55 to 64 Years | 255 (100.0%) | 324 (100.0%) |
| 65 to 74 Years | 241 (100.0%) | 336 (100.0%) |
| 75 Years and over | 227 (100.0%) | 318 (94.9%) |
| Total | 1,966 (89.2%) | 2,531 (91.5%) |
Income Below Poverty Among Married-Couple Families in Bridgewater
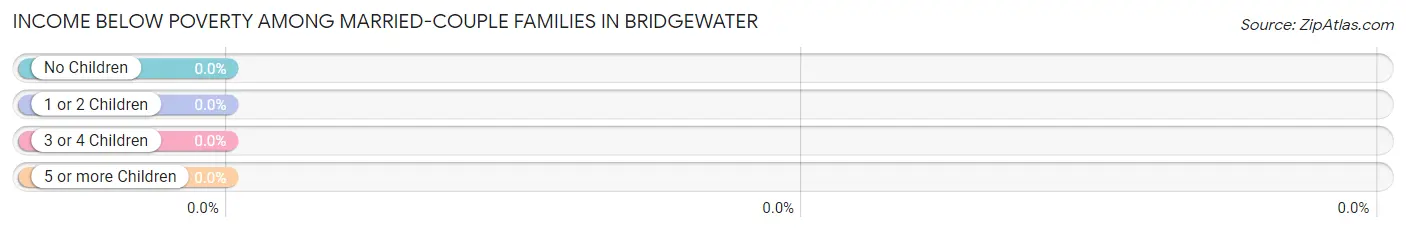
| Children | Above Poverty | Below Poverty |
| No Children | 551 (100.0%) | 0 (0.0%) |
| 1 or 2 Children | 435 (100.0%) | 0 (0.0%) |
| 3 or 4 Children | 119 (100.0%) | 0 (0.0%) |
| 5 or more Children | 0 (0.0%) | 0 (0.0%) |
| Total | 1,105 (100.0%) | 0 (0.0%) |
Income Below Poverty Among Single-Parent Households in Bridgewater
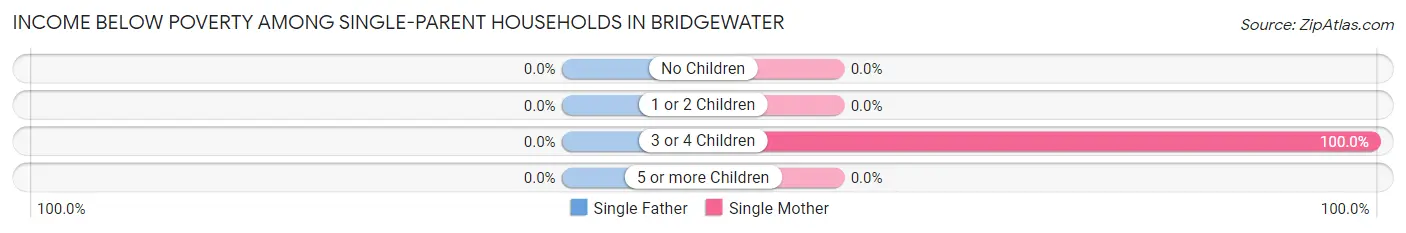
| Children | Single Father | Single Mother |
| No Children | 0 (0.0%) | 0 (0.0%) |
| 1 or 2 Children | 0 (0.0%) | 0 (0.0%) |
| 3 or 4 Children | 0 (0.0%) | 47 (100.0%) |
| 5 or more Children | 0 (0.0%) | 0 (0.0%) |
| Total | 0 (0.0%) | 47 (51.6%) |
Income Below Poverty Among Married-Couple vs Single-Parent Households in Bridgewater
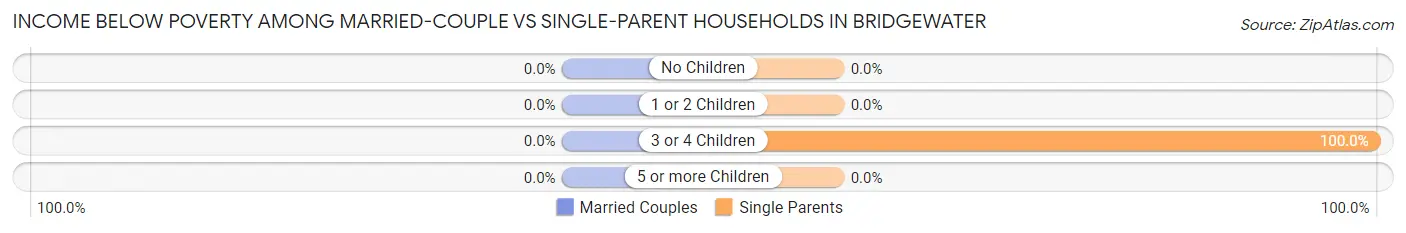
| Children | Married-Couple Families | Single-Parent Households |
| No Children | 0 (0.0%) | 0 (0.0%) |
| 1 or 2 Children | 0 (0.0%) | 0 (0.0%) |
| 3 or 4 Children | 0 (0.0%) | 47 (100.0%) |
| 5 or more Children | 0 (0.0%) | 0 (0.0%) |
| Total | 0 (0.0%) | 47 (46.1%) |
Race in Bridgewater
The most populous races in Bridgewater are White / Caucasian (5,940 | 90.3%), Hispanic or Latino (343 | 5.2%), and Some other Race (271 | 4.1%).
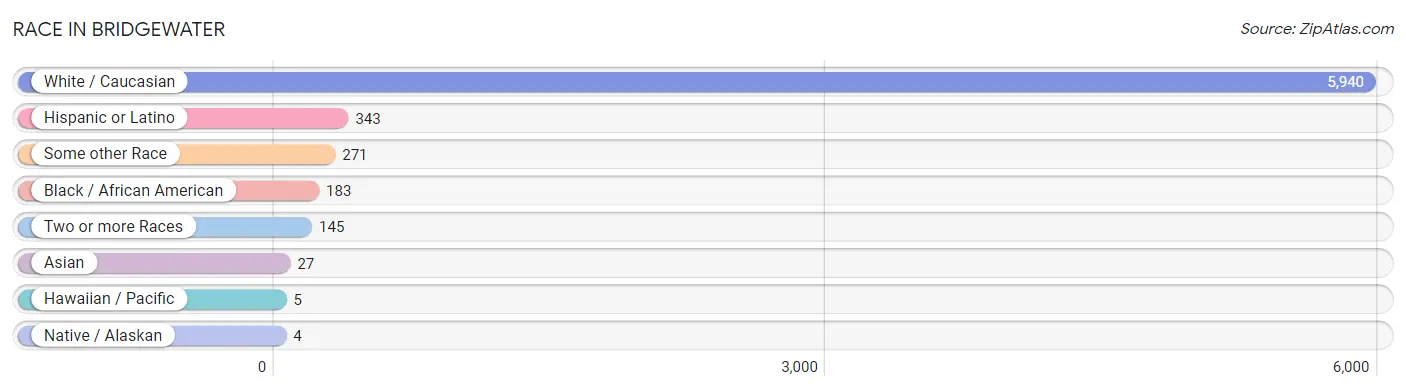
| Race | # Population | % Population |
| Asian | 27 | 0.4% |
| Black / African American | 183 | 2.8% |
| Hawaiian / Pacific | 5 | 0.1% |
| Hispanic or Latino | 343 | 5.2% |
| Native / Alaskan | 4 | 0.1% |
| White / Caucasian | 5,940 | 90.3% |
| Two or more Races | 145 | 2.2% |
| Some other Race | 271 | 4.1% |
| Total | 6,575 | 100.0% |
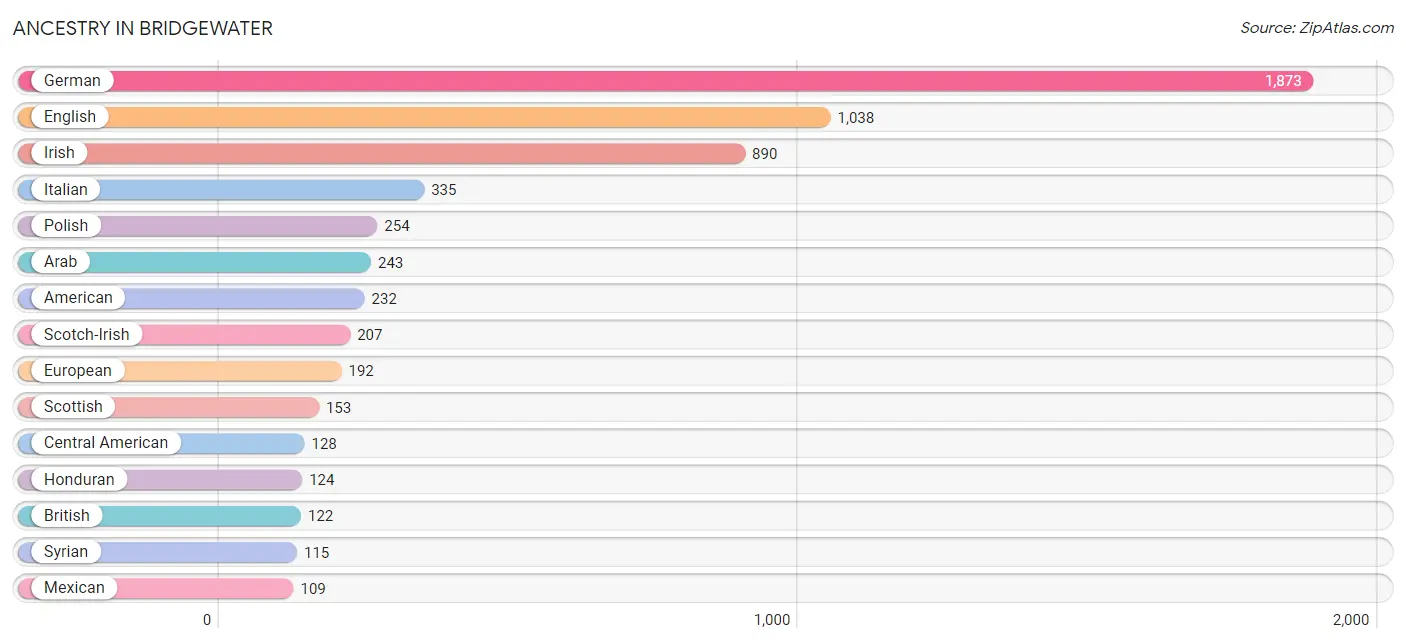
Ancestry in Bridgewater
The most populous ancestries reported in Bridgewater are German (1,873 | 28.5%), English (1,038 | 15.8%), Irish (890 | 13.5%), Italian (335 | 5.1%), and Polish (254 | 3.9%), together accounting for 66.8% of all Bridgewater residents.
| Ancestry | # Population | % Population |
| African | 51 | 0.8% |
| Aleut | 7 | 0.1% |
| American | 232 | 3.5% |
| Arab | 243 | 3.7% |
| Bhutanese | 5 | 0.1% |
| Bolivian | 49 | 0.7% |
| British | 122 | 1.9% |
| British West Indian | 3 | 0.1% |
| Central American | 128 | 1.9% |
| Cherokee | 4 | 0.1% |
| Croatian | 17 | 0.3% |
| Cuban | 22 | 0.3% |
| Czech | 5 | 0.1% |
| Dutch | 25 | 0.4% |
| English | 1,038 | 15.8% |
| European | 192 | 2.9% |
| French | 85 | 1.3% |
| French Canadian | 20 | 0.3% |
| German | 1,873 | 28.5% |
| Honduran | 124 | 1.9% |
| Hungarian | 100 | 1.5% |
| Indian (Asian) | 6 | 0.1% |
| Irish | 890 | 13.5% |
| Italian | 335 | 5.1% |
| Korean | 35 | 0.5% |
| Lebanese | 7 | 0.1% |
| Mexican | 109 | 1.7% |
| Native Hawaiian | 6 | 0.1% |
| Norwegian | 50 | 0.8% |
| Pakistani | 29 | 0.4% |
| Palestinian | 3 | 0.1% |
| Polish | 254 | 3.9% |
| Portuguese | 4 | 0.1% |
| Russian | 92 | 1.4% |
| Salvadoran | 4 | 0.1% |
| Scotch-Irish | 207 | 3.2% |
| Scottish | 153 | 2.3% |
| Slovak | 17 | 0.3% |
| South American | 60 | 0.9% |
| Spaniard | 13 | 0.2% |
| Subsaharan African | 51 | 0.8% |
| Swedish | 34 | 0.5% |
| Swiss | 13 | 0.2% |
| Syrian | 115 | 1.8% |
| Trinidadian and Tobagonian | 4 | 0.1% |
| Uruguayan | 11 | 0.2% |
| Welsh | 39 | 0.6% |
| West Indian | 15 | 0.2% |
| Yugoslavian | 22 | 0.3% | View All 49 Rows |
Immigrants in Bridgewater
The most numerous immigrant groups reported in Bridgewater came from Asia (241 | 3.7%), Western Asia (208 | 3.2%), Europe (191 | 2.9%), Eastern Europe (144 | 2.2%), and Latin America (142 | 2.2%), together accounting for 14.1% of all Bridgewater residents.
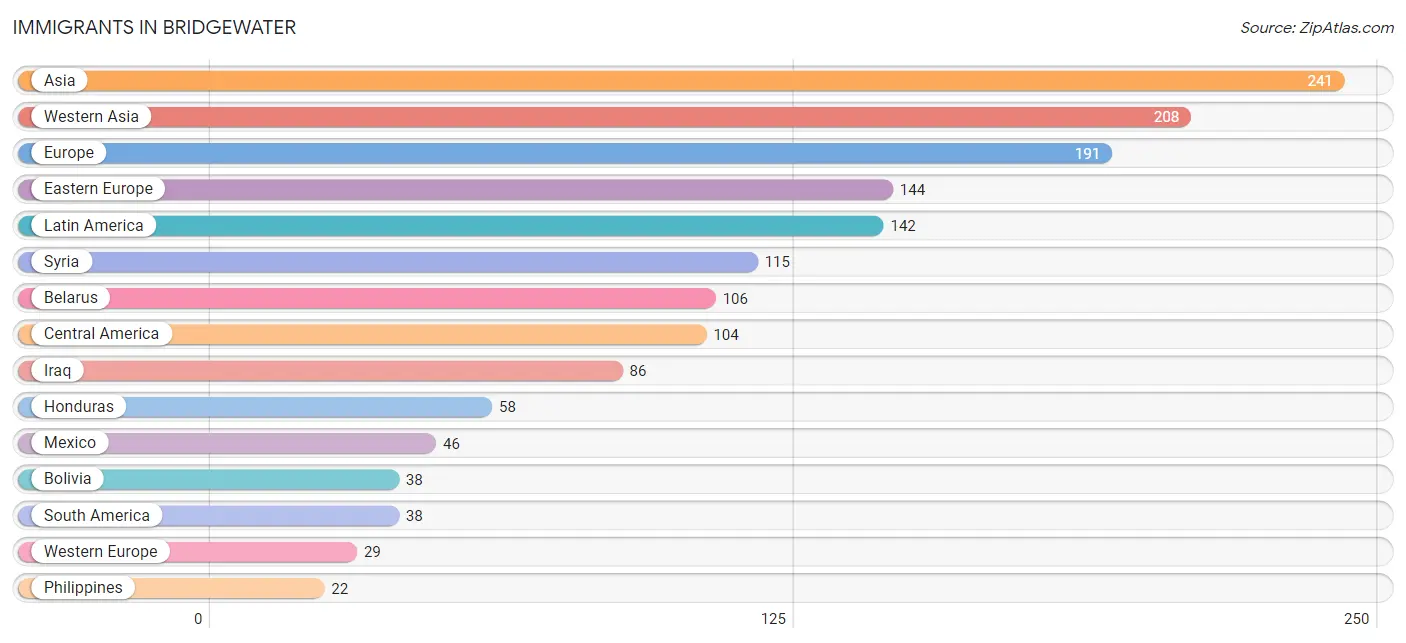
| Immigration Origin | # Population | % Population |
| Asia | 241 | 3.7% |
| Australia | 5 | 0.1% |
| Austria | 15 | 0.2% |
| Belarus | 106 | 1.6% |
| Bolivia | 38 | 0.6% |
| Central America | 104 | 1.6% |
| Eastern Asia | 5 | 0.1% |
| Eastern Europe | 144 | 2.2% |
| Europe | 191 | 2.9% |
| Germany | 14 | 0.2% |
| Honduras | 58 | 0.9% |
| Iraq | 86 | 1.3% |
| Japan | 5 | 0.1% |
| Latin America | 142 | 2.2% |
| Lebanon | 7 | 0.1% |
| Mexico | 46 | 0.7% |
| Micronesia | 5 | 0.1% |
| Northern Europe | 5 | 0.1% |
| Oceania | 19 | 0.3% |
| Philippines | 22 | 0.3% |
| Russia | 16 | 0.2% |
| South America | 38 | 0.6% |
| South Eastern Asia | 22 | 0.3% |
| Southern Europe | 13 | 0.2% |
| Spain | 13 | 0.2% |
| Syria | 115 | 1.8% |
| Western Asia | 208 | 3.2% |
| Western Europe | 29 | 0.4% | View All 28 Rows |
Sex and Age in Bridgewater
Sex and Age in Bridgewater
The most populous age groups in Bridgewater are 20 to 24 Years (452 | 15.7%) for men and 20 to 24 Years (526 | 14.3%) for women.
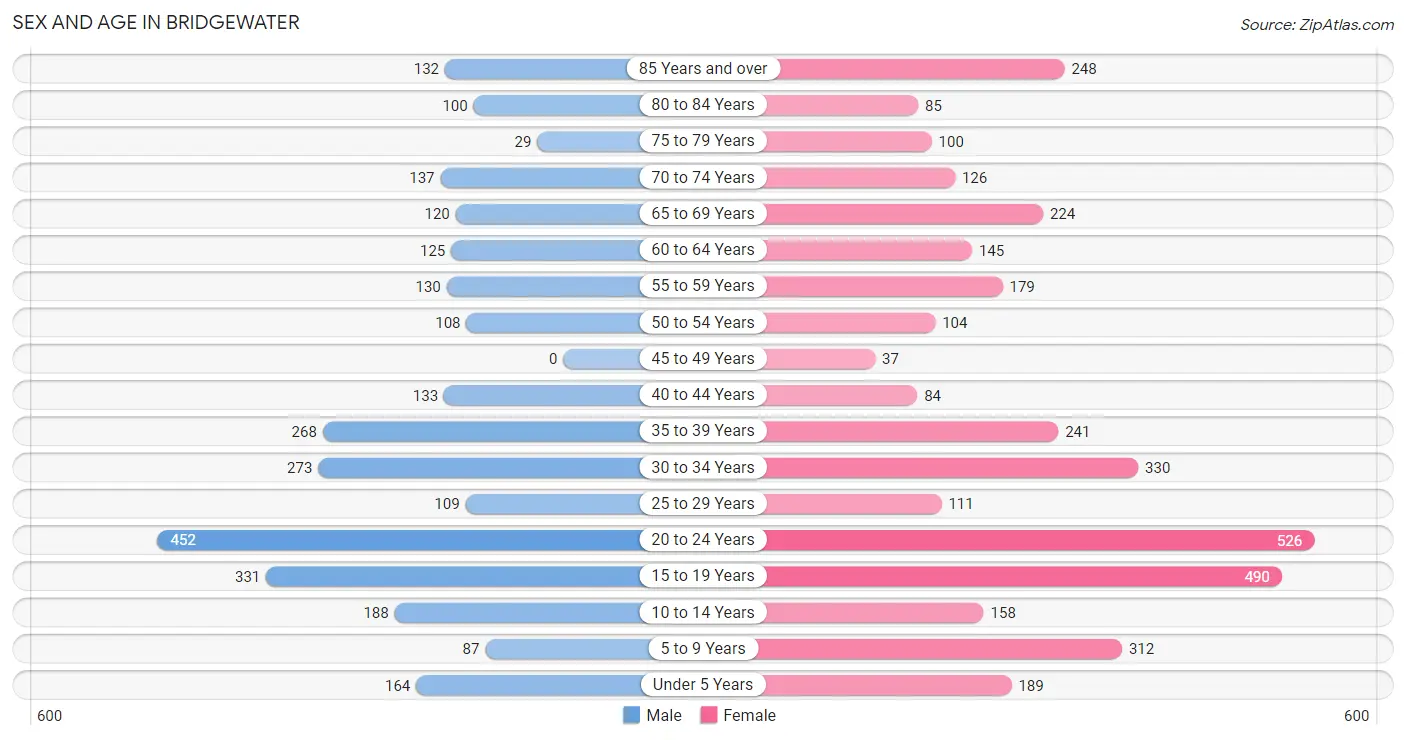
| Age Bracket | Male | Female |
| Under 5 Years | 164 (5.7%) | 189 (5.1%) |
| 5 to 9 Years | 87 (3.0%) | 312 (8.5%) |
| 10 to 14 Years | 188 (6.5%) | 158 (4.3%) |
| 15 to 19 Years | 331 (11.5%) | 490 (13.3%) |
| 20 to 24 Years | 452 (15.7%) | 526 (14.3%) |
| 25 to 29 Years | 109 (3.8%) | 111 (3.0%) |
| 30 to 34 Years | 273 (9.5%) | 330 (8.9%) |
| 35 to 39 Years | 268 (9.3%) | 241 (6.5%) |
| 40 to 44 Years | 133 (4.6%) | 84 (2.3%) |
| 45 to 49 Years | 0 (0.0%) | 37 (1.0%) |
| 50 to 54 Years | 108 (3.7%) | 104 (2.8%) |
| 55 to 59 Years | 130 (4.5%) | 179 (4.9%) |
| 60 to 64 Years | 125 (4.3%) | 145 (3.9%) |
| 65 to 69 Years | 120 (4.2%) | 224 (6.1%) |
| 70 to 74 Years | 137 (4.8%) | 126 (3.4%) |
| 75 to 79 Years | 29 (1.0%) | 100 (2.7%) |
| 80 to 84 Years | 100 (3.5%) | 85 (2.3%) |
| 85 Years and over | 132 (4.6%) | 248 (6.7%) |
| Total | 2,886 (100.0%) | 3,689 (100.0%) |
Families and Households in Bridgewater
Median Family Size in Bridgewater
The median family size in Bridgewater is 3.07 persons per family, with single female/mother families (91 | 7.5%) accounting for the largest median family size of 3.31 persons per family. On the other hand, single male/father families (11 | 0.9%) represent the smallest median family size with 2.27 persons per family.
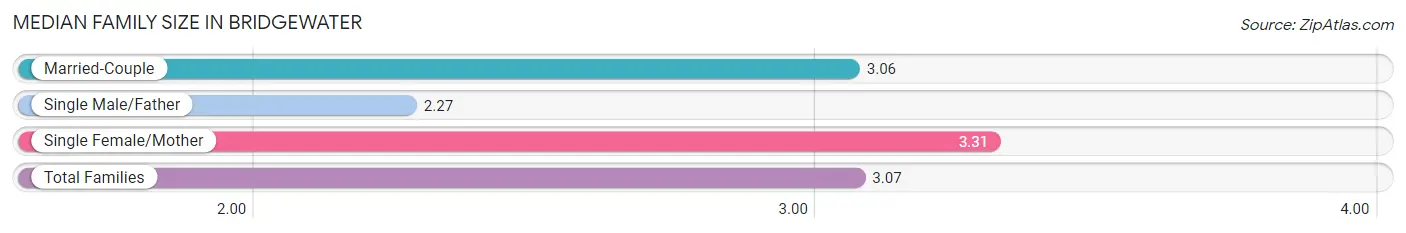
| Family Type | # Families | Family Size |
| Married-Couple | 1,105 (91.5%) | 3.06 |
| Single Male/Father | 11 (0.9%) | 2.27 |
| Single Female/Mother | 91 (7.5%) | 3.31 |
| Total Families | 1,207 (100.0%) | 3.07 |
Median Household Size in Bridgewater
The median household size in Bridgewater is 2.24 persons per household, with single female/mother households (91 | 4.1%) accounting for the largest median household size of 4.08 persons per household. non-family households (1,007 | 45.5%) represent the smallest median household size with 1.18 persons per household.
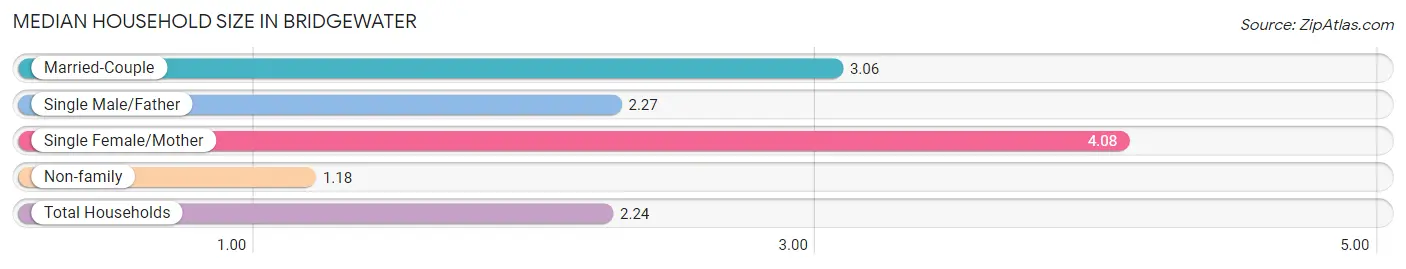
| Household Type | # Households | Household Size |
| Married-Couple | 1,105 (49.9%) | 3.06 |
| Single Male/Father | 11 (0.5%) | 2.27 |
| Single Female/Mother | 91 (4.1%) | 4.08 |
| Non-family | 1,007 (45.5%) | 1.18 |
| Total Households | 2,214 (100.0%) | 2.24 |
Household Size by Marriage Status in Bridgewater
Out of a total of 2,214 households in Bridgewater, 1,207 (54.5%) are family households, while 1,007 (45.5%) are nonfamily households. The most numerous type of family households are 2-person households, comprising 428, and the most common type of nonfamily households are 1-person households, comprising 888.
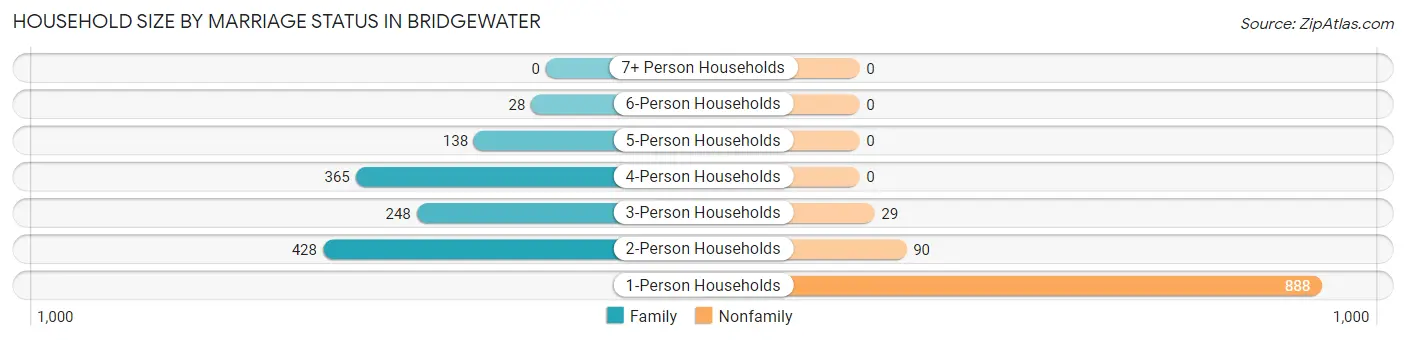
| Household Size | Family Households | Nonfamily Households |
| 1-Person Households | - | 888 (40.1%) |
| 2-Person Households | 428 (19.3%) | 90 (4.1%) |
| 3-Person Households | 248 (11.2%) | 29 (1.3%) |
| 4-Person Households | 365 (16.5%) | 0 (0.0%) |
| 5-Person Households | 138 (6.2%) | 0 (0.0%) |
| 6-Person Households | 28 (1.3%) | 0 (0.0%) |
| 7+ Person Households | 0 (0.0%) | 0 (0.0%) |
| Total | 1,207 (54.5%) | 1,007 (45.5%) |
Female Fertility in Bridgewater
Fertility by Age in Bridgewater
Average fertility rate in Bridgewater is 57.0 births per 1,000 women. Women in the age bracket of 20 to 34 years have the highest fertility rate with 90.0 births per 1,000 women. Women in the age bracket of 20 to 34 years acount for 82.9% of all women with births.
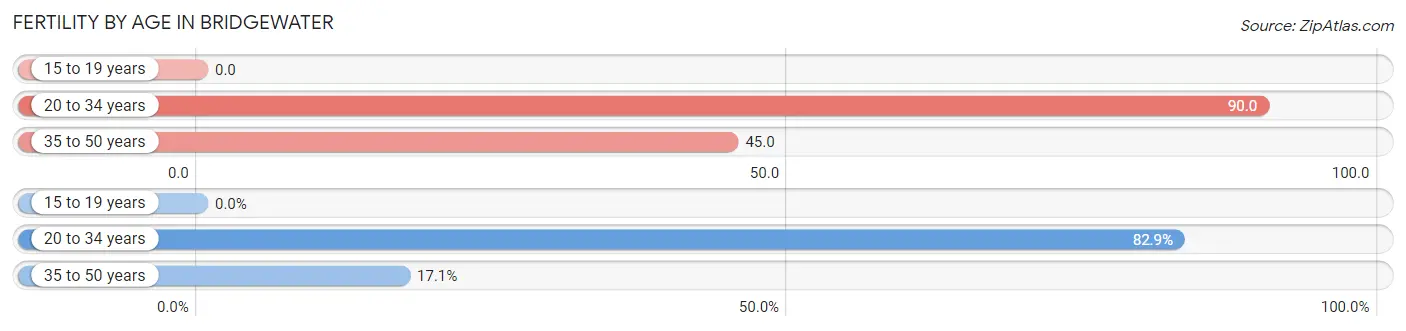
| Age Bracket | Women with Births | Births / 1,000 Women |
| 15 to 19 years | 0 (0.0%) | 0.0 |
| 20 to 34 years | 87 (82.9%) | 90.0 |
| 35 to 50 years | 18 (17.1%) | 45.0 |
| Total | 105 (100.0%) | 57.0 |
Fertility by Age by Marriage Status in Bridgewater
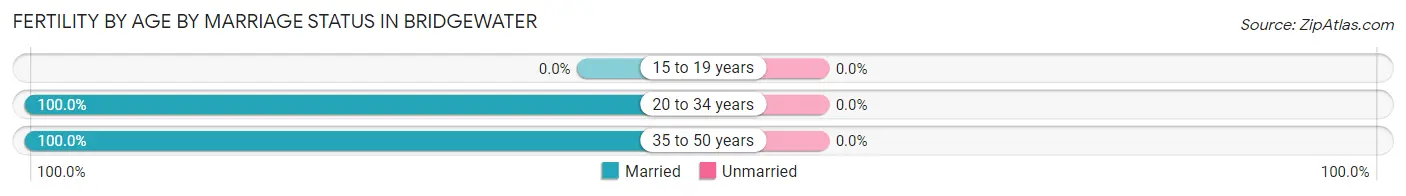
| Age Bracket | Married | Unmarried |
| 15 to 19 years | 0 (0.0%) | 0 (0.0%) |
| 20 to 34 years | 87 (100.0%) | 0 (0.0%) |
| 35 to 50 years | 18 (100.0%) | 0 (0.0%) |
| Total | 105 (100.0%) | 0 (0.0%) |
Fertility by Education in Bridgewater
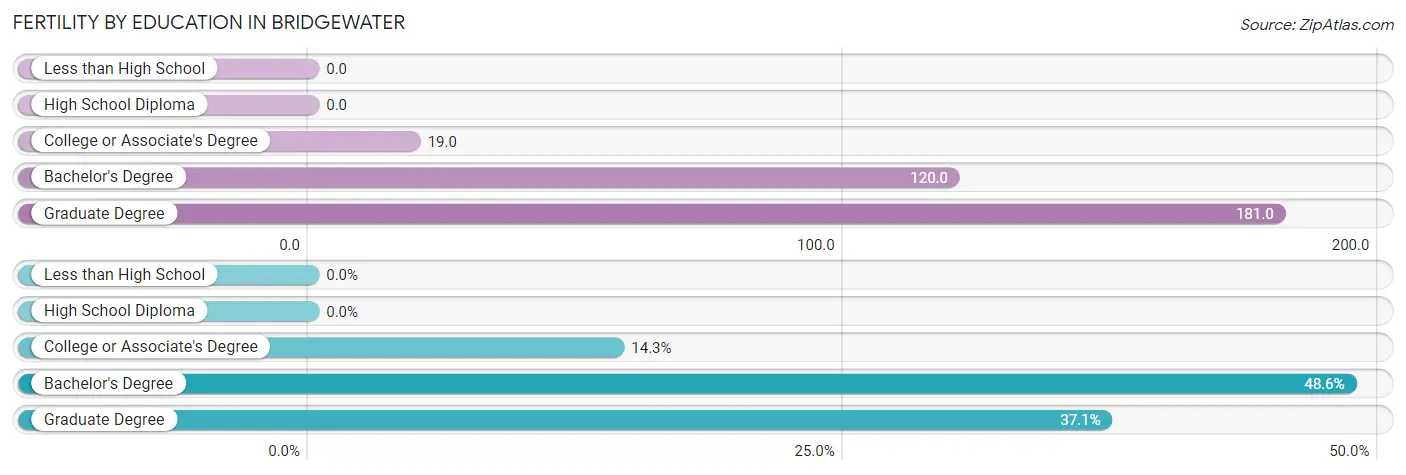
| Educational Attainment | Women with Births | Births / 1,000 Women |
| Less than High School | 0 (0.0%) | 0.0 |
| High School Diploma | 0 (0.0%) | 0.0 |
| College or Associate's Degree | 15 (14.3%) | 19.0 |
| Bachelor's Degree | 51 (48.6%) | 120.0 |
| Graduate Degree | 39 (37.1%) | 181.0 |
| Total | 105 (100.0%) | 57.0 |
Fertility by Education by Marriage Status in Bridgewater
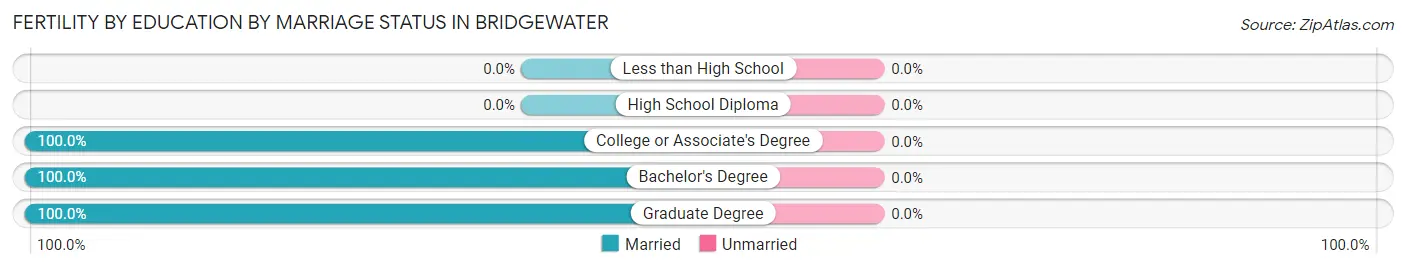
| Educational Attainment | Married | Unmarried |
| Less than High School | 0 (0.0%) | 0 (0.0%) |
| High School Diploma | 0 (0.0%) | 0 (0.0%) |
| College or Associate's Degree | 15 (100.0%) | 0 (0.0%) |
| Bachelor's Degree | 51 (100.0%) | 0 (0.0%) |
| Graduate Degree | 39 (100.0%) | 0 (0.0%) |
| Total | 105 (100.0%) | 0 (0.0%) |
Employment Characteristics in Bridgewater
Employment by Class of Employer in Bridgewater
Among the 2,991 employed individuals in Bridgewater, private company employees (2,039 | 68.2%), not-for-profit organizations (252 | 8.4%), and local government employees (233 | 7.8%) make up the most common classes of employment.
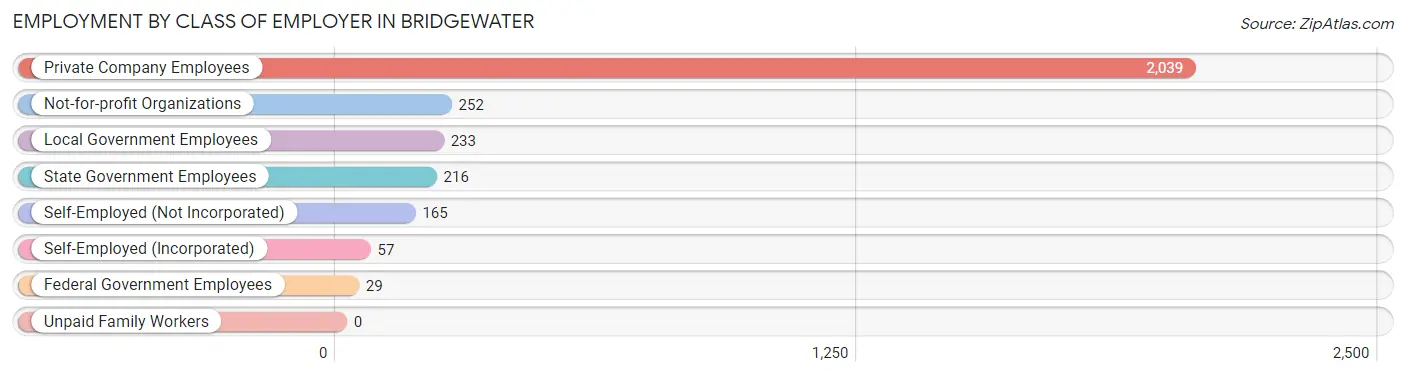
| Employer Class | # Employees | % Employees |
| Private Company Employees | 2,039 | 68.2% |
| Self-Employed (Incorporated) | 57 | 1.9% |
| Self-Employed (Not Incorporated) | 165 | 5.5% |
| Not-for-profit Organizations | 252 | 8.4% |
| Local Government Employees | 233 | 7.8% |
| State Government Employees | 216 | 7.2% |
| Federal Government Employees | 29 | 1.0% |
| Unpaid Family Workers | 0 | 0.0% |
| Total | 2,991 | 100.0% |
Employment Status by Age in Bridgewater
According to the labor force statistics for Bridgewater, out of the total population over 16 years of age (5,455), 61.9% or 3,377 individuals are in the labor force, with 6.6% or 223 of them unemployed. The age group with the highest labor force participation rate is 25 to 29 years, with 92.3% or 203 individuals in the labor force. Within the labor force, the 60 to 64 years age range has the highest percentage of unemployed individuals, with 30.0% or 62 of them being unemployed.
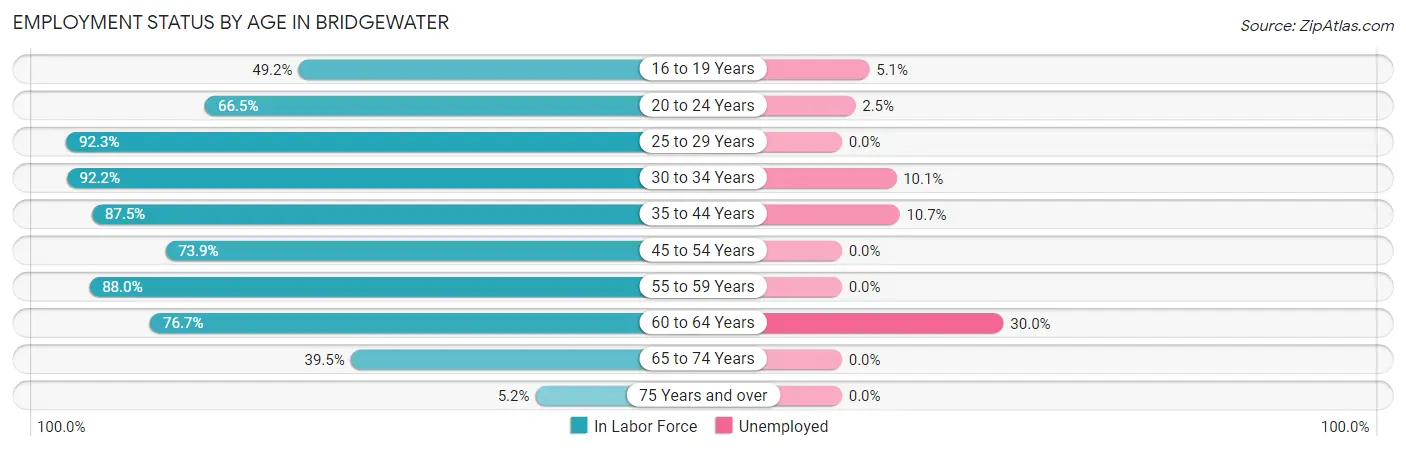
| Age Bracket | In Labor Force | Unemployed |
| 16 to 19 Years | 393 (49.2%) | 20 (5.1%) |
| 20 to 24 Years | 650 (66.5%) | 16 (2.5%) |
| 25 to 29 Years | 203 (92.3%) | 0 (0.0%) |
| 30 to 34 Years | 556 (92.2%) | 56 (10.1%) |
| 35 to 44 Years | 635 (87.5%) | 68 (10.7%) |
| 45 to 54 Years | 184 (73.9%) | 0 (0.0%) |
| 55 to 59 Years | 272 (88.0%) | 0 (0.0%) |
| 60 to 64 Years | 207 (76.7%) | 62 (30.0%) |
| 65 to 74 Years | 240 (39.5%) | 0 (0.0%) |
| 75 Years and over | 36 (5.2%) | 0 (0.0%) |
| Total | 3,377 (61.9%) | 223 (6.6%) |
Employment Status by Educational Attainment in Bridgewater
According to labor force statistics for Bridgewater, 86.5% of individuals (2,056) out of the total population between 25 and 64 years of age (2,377) are in the labor force, with 9.0% or 185 of them being unemployed. The group with the highest labor force participation rate are those with the educational attainment of bachelor's degree or higher, with 91.8% or 1,114 individuals in the labor force. Within the labor force, individuals with college / associate degree education have the highest percentage of unemployment, with 29.8% or 158 of them being unemployed.
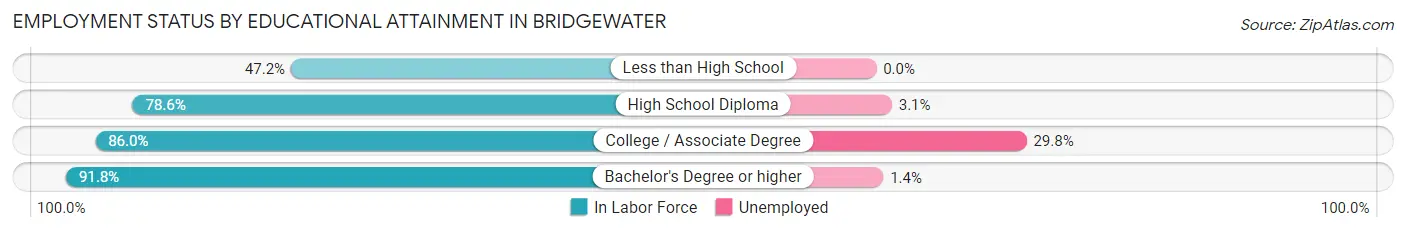
| Educational Attainment | In Labor Force | Unemployed |
| Less than High School | 25 (47.2%) | 0 (0.0%) |
| High School Diploma | 389 (78.6%) | 15 (3.1%) |
| College / Associate Degree | 530 (86.0%) | 184 (29.8%) |
| Bachelor's Degree or higher | 1,114 (91.8%) | 17 (1.4%) |
| Total | 2,056 (86.5%) | 214 (9.0%) |
Employment Occupations by Sex in Bridgewater
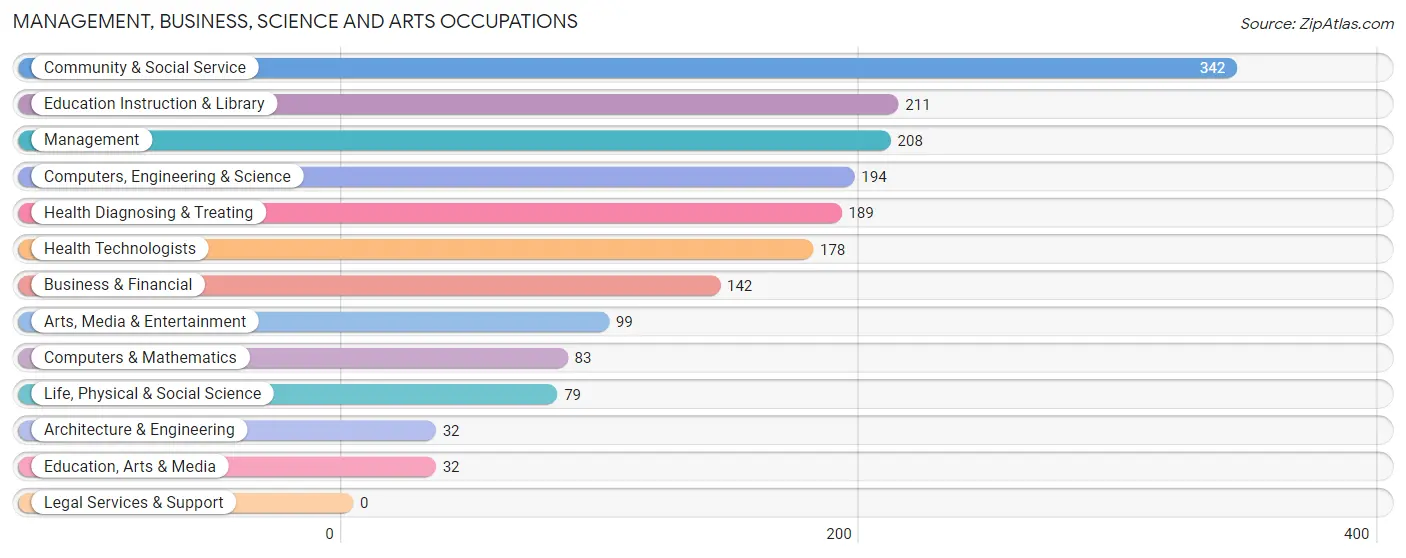
Management, Business, Science and Arts Occupations
The most common Management, Business, Science and Arts occupations in Bridgewater are Community & Social Service (342 | 10.8%), Education Instruction & Library (211 | 6.7%), Management (208 | 6.6%), Computers, Engineering & Science (194 | 6.1%), and Health Diagnosing & Treating (189 | 6.0%).
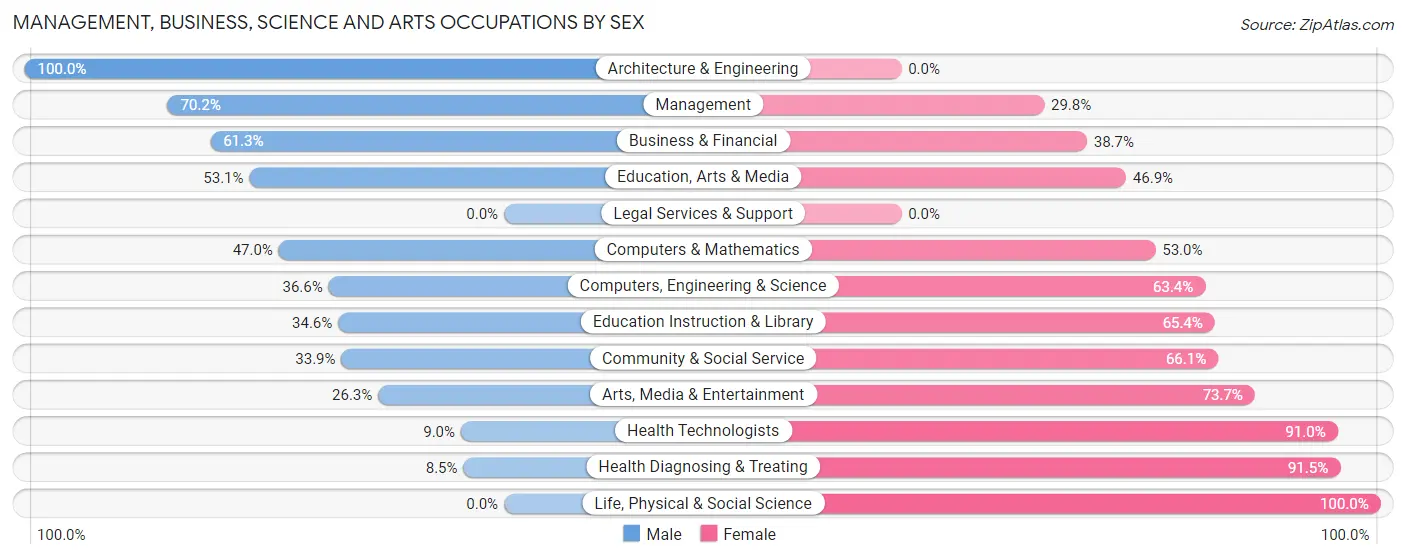
Management, Business, Science and Arts Occupations by Sex
Within the Management, Business, Science and Arts occupations in Bridgewater, the most male-oriented occupations are Architecture & Engineering (100.0%), Management (70.2%), and Business & Financial (61.3%), while the most female-oriented occupations are Life, Physical & Social Science (100.0%), Health Diagnosing & Treating (91.5%), and Health Technologists (91.0%).
| Occupation | Male | Female |
| Management | 146 (70.2%) | 62 (29.8%) |
| Business & Financial | 87 (61.3%) | 55 (38.7%) |
| Computers, Engineering & Science | 71 (36.6%) | 123 (63.4%) |
| Computers & Mathematics | 39 (47.0%) | 44 (53.0%) |
| Architecture & Engineering | 32 (100.0%) | 0 (0.0%) |
| Life, Physical & Social Science | 0 (0.0%) | 79 (100.0%) |
| Community & Social Service | 116 (33.9%) | 226 (66.1%) |
| Education, Arts & Media | 17 (53.1%) | 15 (46.9%) |
| Legal Services & Support | 0 (0.0%) | 0 (0.0%) |
| Education Instruction & Library | 73 (34.6%) | 138 (65.4%) |
| Arts, Media & Entertainment | 26 (26.3%) | 73 (73.7%) |
| Health Diagnosing & Treating | 16 (8.5%) | 173 (91.5%) |
| Health Technologists | 16 (9.0%) | 162 (91.0%) |
| Total (Category) | 436 (40.6%) | 639 (59.4%) |
| Total (Overall) | 1,441 (45.7%) | 1,713 (54.3%) |
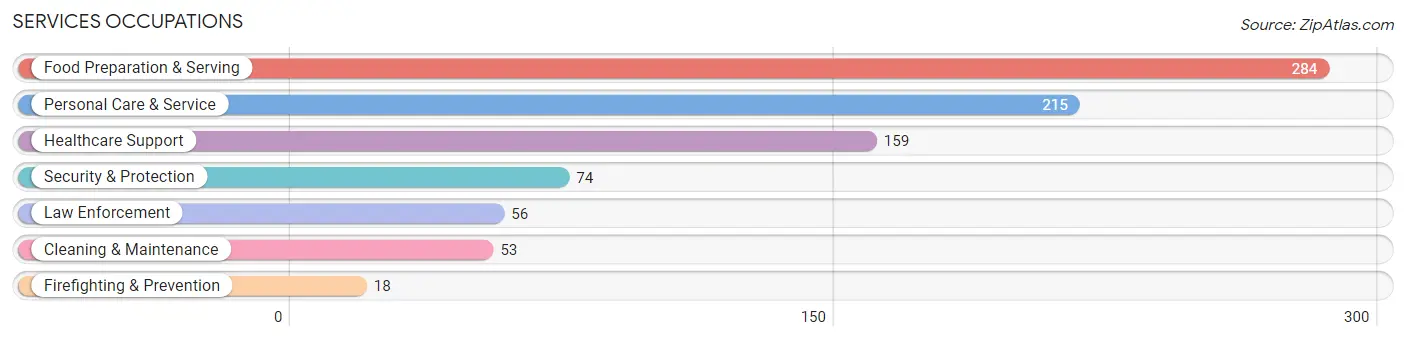
Services Occupations
The most common Services occupations in Bridgewater are Food Preparation & Serving (284 | 9.0%), Personal Care & Service (215 | 6.8%), Healthcare Support (159 | 5.0%), Security & Protection (74 | 2.4%), and Law Enforcement (56 | 1.8%).
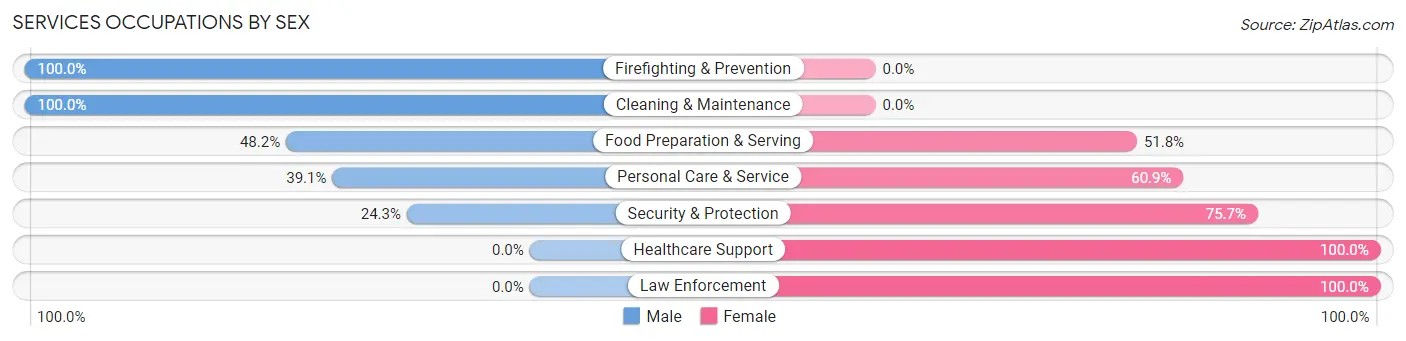
Services Occupations by Sex
Within the Services occupations in Bridgewater, the most male-oriented occupations are Firefighting & Prevention (100.0%), Cleaning & Maintenance (100.0%), and Food Preparation & Serving (48.2%), while the most female-oriented occupations are Healthcare Support (100.0%), Law Enforcement (100.0%), and Security & Protection (75.7%).
| Occupation | Male | Female |
| Healthcare Support | 0 (0.0%) | 159 (100.0%) |
| Security & Protection | 18 (24.3%) | 56 (75.7%) |
| Firefighting & Prevention | 18 (100.0%) | 0 (0.0%) |
| Law Enforcement | 0 (0.0%) | 56 (100.0%) |
| Food Preparation & Serving | 137 (48.2%) | 147 (51.8%) |
| Cleaning & Maintenance | 53 (100.0%) | 0 (0.0%) |
| Personal Care & Service | 84 (39.1%) | 131 (60.9%) |
| Total (Category) | 292 (37.2%) | 493 (62.8%) |
| Total (Overall) | 1,441 (45.7%) | 1,713 (54.3%) |
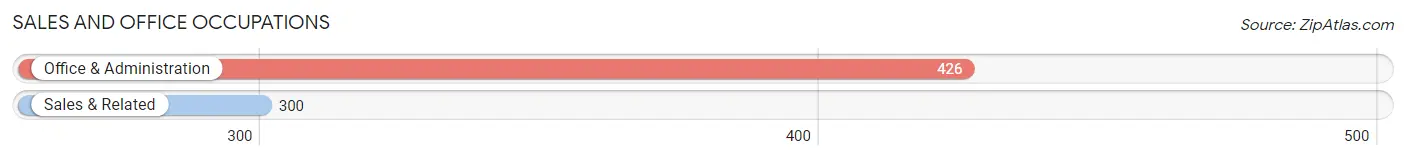
Sales and Office Occupations
The most common Sales and Office occupations in Bridgewater are Office & Administration (426 | 13.5%), and Sales & Related (300 | 9.5%).
Sales and Office Occupations by Sex
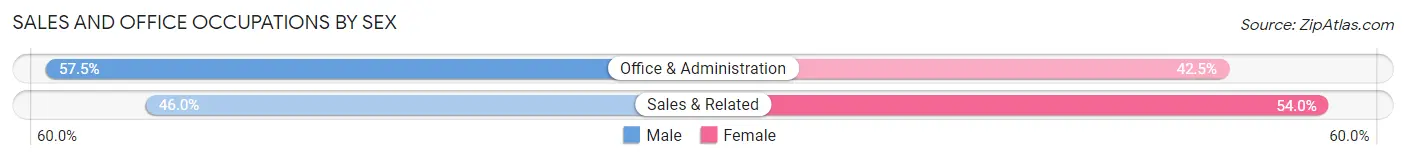
| Occupation | Male | Female |
| Sales & Related | 138 (46.0%) | 162 (54.0%) |
| Office & Administration | 245 (57.5%) | 181 (42.5%) |
| Total (Category) | 383 (52.7%) | 343 (47.2%) |
| Total (Overall) | 1,441 (45.7%) | 1,713 (54.3%) |
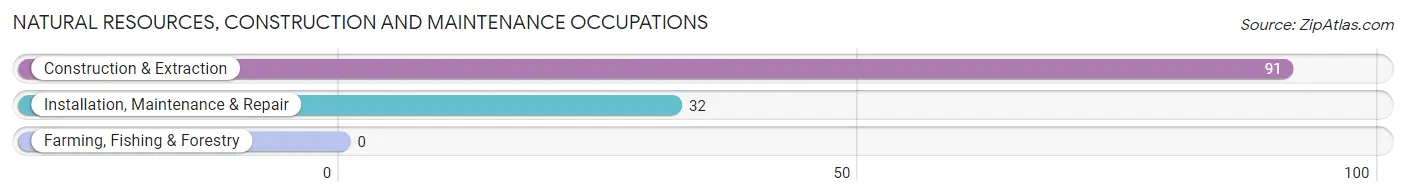
Natural Resources, Construction and Maintenance Occupations
The most common Natural Resources, Construction and Maintenance occupations in Bridgewater are Construction & Extraction (91 | 2.9%), and Installation, Maintenance & Repair (32 | 1.0%).
Natural Resources, Construction and Maintenance Occupations by Sex
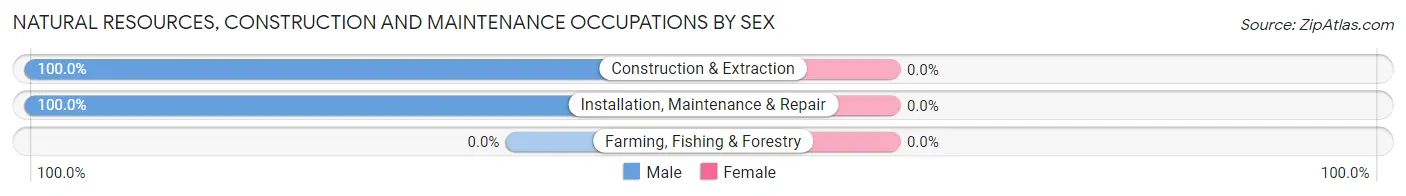
| Occupation | Male | Female |
| Farming, Fishing & Forestry | 0 (0.0%) | 0 (0.0%) |
| Construction & Extraction | 91 (100.0%) | 0 (0.0%) |
| Installation, Maintenance & Repair | 32 (100.0%) | 0 (0.0%) |
| Total (Category) | 123 (100.0%) | 0 (0.0%) |
| Total (Overall) | 1,441 (45.7%) | 1,713 (54.3%) |
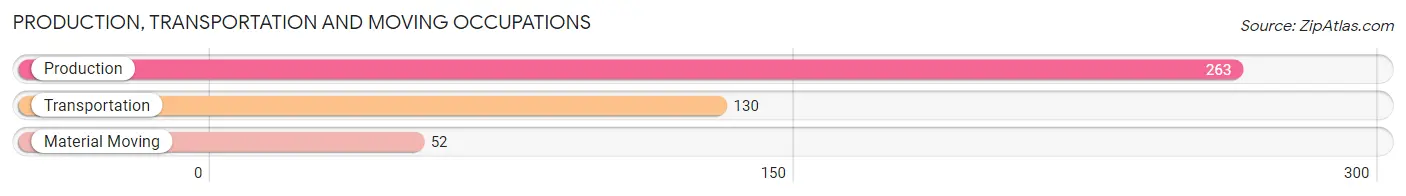
Production, Transportation and Moving Occupations
The most common Production, Transportation and Moving occupations in Bridgewater are Production (263 | 8.3%), Transportation (130 | 4.1%), and Material Moving (52 | 1.7%).
Production, Transportation and Moving Occupations by Sex
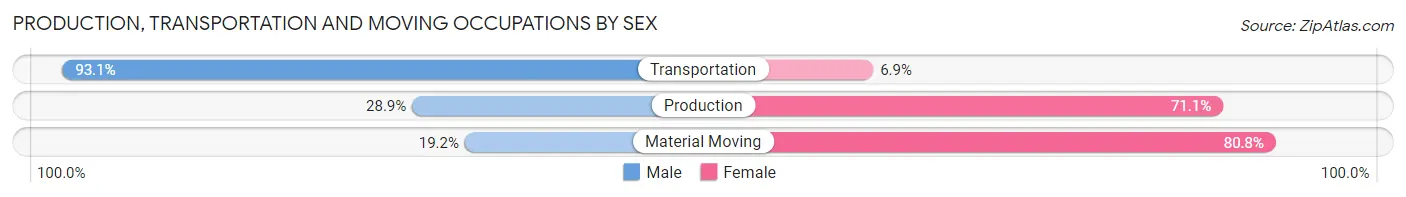
| Occupation | Male | Female |
| Production | 76 (28.9%) | 187 (71.1%) |
| Transportation | 121 (93.1%) | 9 (6.9%) |
| Material Moving | 10 (19.2%) | 42 (80.8%) |
| Total (Category) | 207 (46.5%) | 238 (53.5%) |
| Total (Overall) | 1,441 (45.7%) | 1,713 (54.3%) |
Employment Industries by Sex in Bridgewater
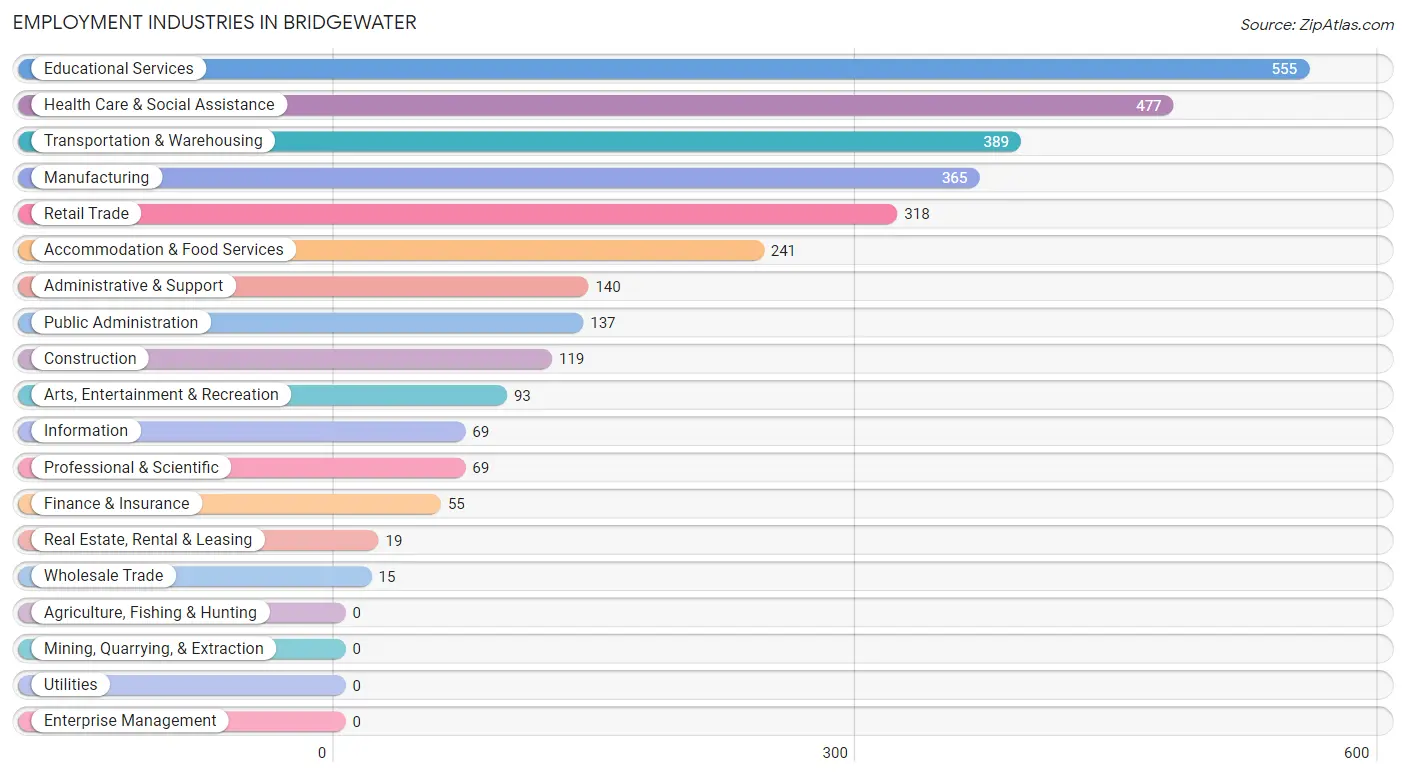
Employment Industries in Bridgewater
The major employment industries in Bridgewater include Educational Services (555 | 17.6%), Health Care & Social Assistance (477 | 15.1%), Transportation & Warehousing (389 | 12.3%), Manufacturing (365 | 11.6%), and Retail Trade (318 | 10.1%).
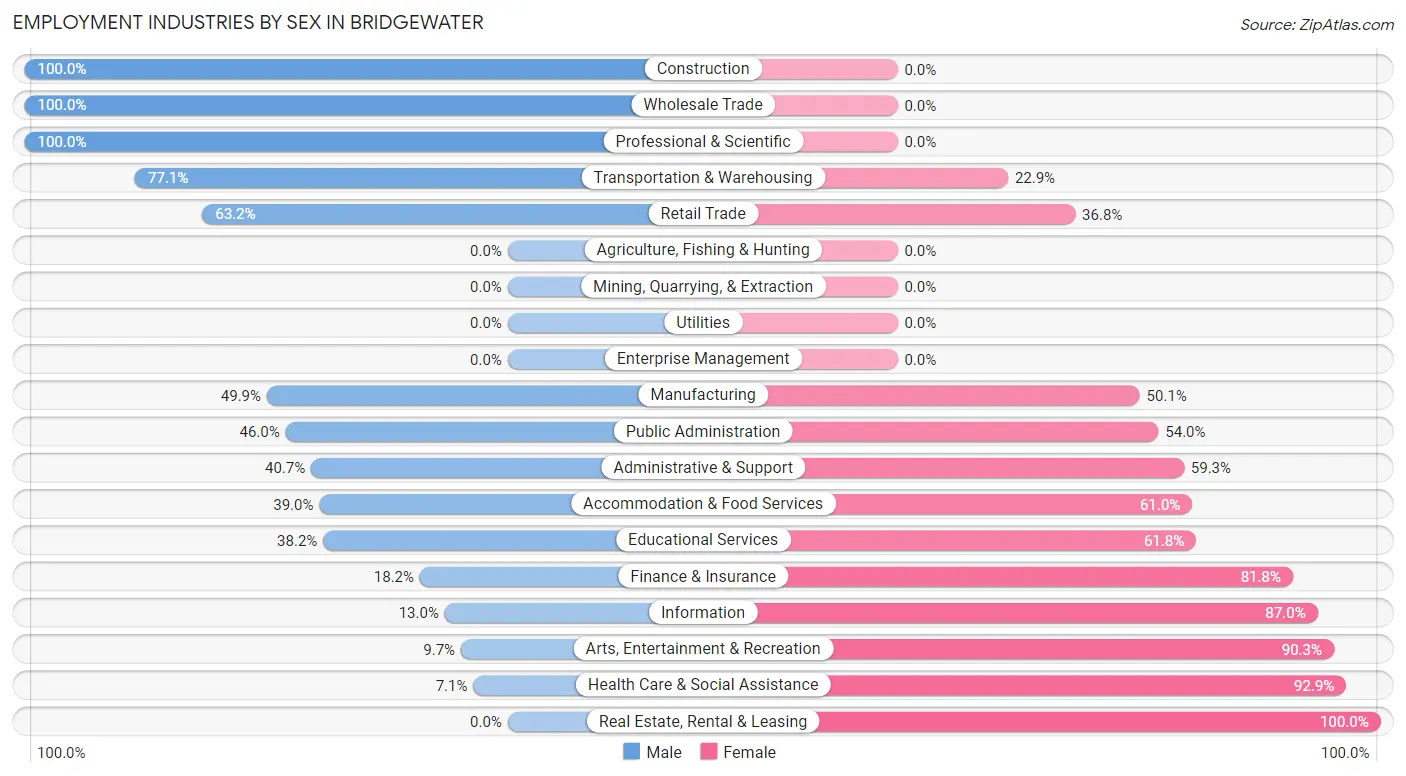
Employment Industries by Sex in Bridgewater
The Bridgewater industries that see more men than women are Construction (100.0%), Wholesale Trade (100.0%), and Professional & Scientific (100.0%), whereas the industries that tend to have a higher number of women are Real Estate, Rental & Leasing (100.0%), Health Care & Social Assistance (92.9%), and Arts, Entertainment & Recreation (90.3%).
| Industry | Male | Female |
| Agriculture, Fishing & Hunting | 0 (0.0%) | 0 (0.0%) |
| Mining, Quarrying, & Extraction | 0 (0.0%) | 0 (0.0%) |
| Construction | 119 (100.0%) | 0 (0.0%) |
| Manufacturing | 182 (49.9%) | 183 (50.1%) |
| Wholesale Trade | 15 (100.0%) | 0 (0.0%) |
| Retail Trade | 201 (63.2%) | 117 (36.8%) |
| Transportation & Warehousing | 300 (77.1%) | 89 (22.9%) |
| Utilities | 0 (0.0%) | 0 (0.0%) |
| Information | 9 (13.0%) | 60 (87.0%) |
| Finance & Insurance | 10 (18.2%) | 45 (81.8%) |
| Real Estate, Rental & Leasing | 0 (0.0%) | 19 (100.0%) |
| Professional & Scientific | 69 (100.0%) | 0 (0.0%) |
| Enterprise Management | 0 (0.0%) | 0 (0.0%) |
| Administrative & Support | 57 (40.7%) | 83 (59.3%) |
| Educational Services | 212 (38.2%) | 343 (61.8%) |
| Health Care & Social Assistance | 34 (7.1%) | 443 (92.9%) |
| Arts, Entertainment & Recreation | 9 (9.7%) | 84 (90.3%) |
| Accommodation & Food Services | 94 (39.0%) | 147 (61.0%) |
| Public Administration | 63 (46.0%) | 74 (54.0%) |
| Total | 1,441 (45.7%) | 1,713 (54.3%) |
Education in Bridgewater
School Enrollment in Bridgewater
The most common levels of schooling among the 2,538 students in Bridgewater are college / undergraduate (1,485 | 58.5%), middle school (319 | 12.6%), and elementary school (290 | 11.4%).
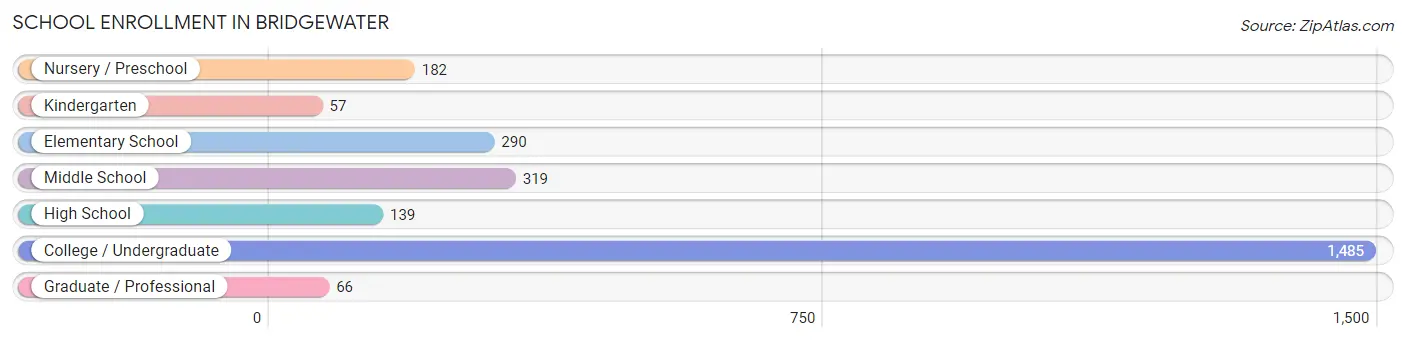
| School Level | # Students | % Students |
| Nursery / Preschool | 182 | 7.2% |
| Kindergarten | 57 | 2.2% |
| Elementary School | 290 | 11.4% |
| Middle School | 319 | 12.6% |
| High School | 139 | 5.5% |
| College / Undergraduate | 1,485 | 58.5% |
| Graduate / Professional | 66 | 2.6% |
| Total | 2,538 | 100.0% |
School Enrollment by Age by Funding Source in Bridgewater
Out of a total of 2,538 students who are enrolled in schools in Bridgewater, 1,670 (65.8%) attend a private institution, while the remaining 868 (34.2%) are enrolled in public schools. The age group of 3 to 4 year olds has the highest likelihood of being enrolled in private schools, with 112 (100.0% in the age bracket) enrolled. Conversely, the age group of 25 to 34 year olds has the lowest likelihood of being enrolled in a private school, with 31 (100.0% in the age bracket) attending a public institution.
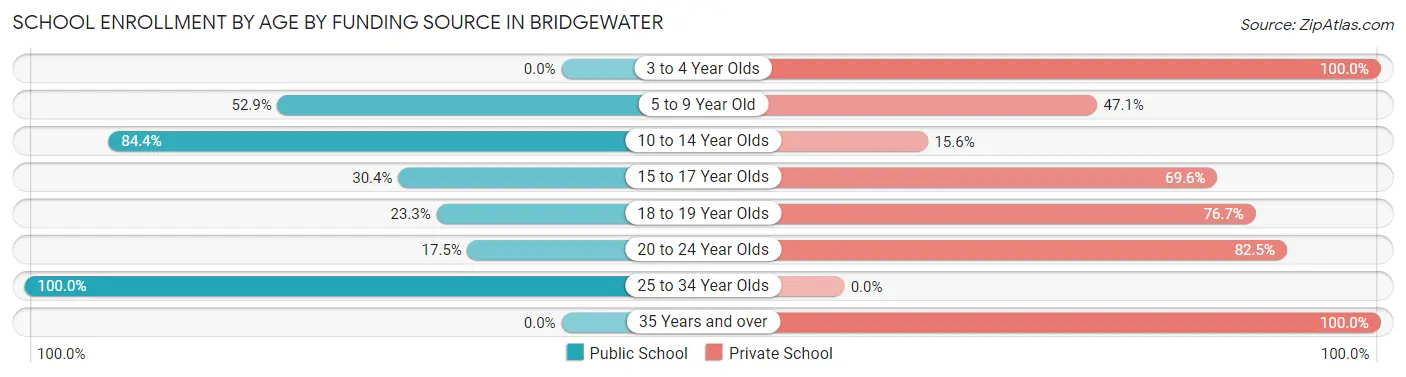
| Age Bracket | Public School | Private School |
| 3 to 4 Year Olds | 0 (0.0%) | 112 (100.0%) |
| 5 to 9 Year Old | 211 (52.9%) | 188 (47.1%) |
| 10 to 14 Year Olds | 292 (84.4%) | 54 (15.6%) |
| 15 to 17 Year Olds | 38 (30.4%) | 87 (69.6%) |
| 18 to 19 Year Olds | 147 (23.3%) | 485 (76.7%) |
| 20 to 24 Year Olds | 150 (17.5%) | 708 (82.5%) |
| 25 to 34 Year Olds | 31 (100.0%) | 0 (0.0%) |
| 35 Years and over | 0 (0.0%) | 35 (100.0%) |
| Total | 868 (34.2%) | 1,670 (65.8%) |
Educational Attainment by Field of Study in Bridgewater
Education (412 | 19.8%), business (309 | 14.8%), science & technology (220 | 10.6%), social sciences (194 | 9.3%), and arts & humanities (178 | 8.6%) are the most common fields of study among 2,081 individuals in Bridgewater who have obtained a bachelor's degree or higher.
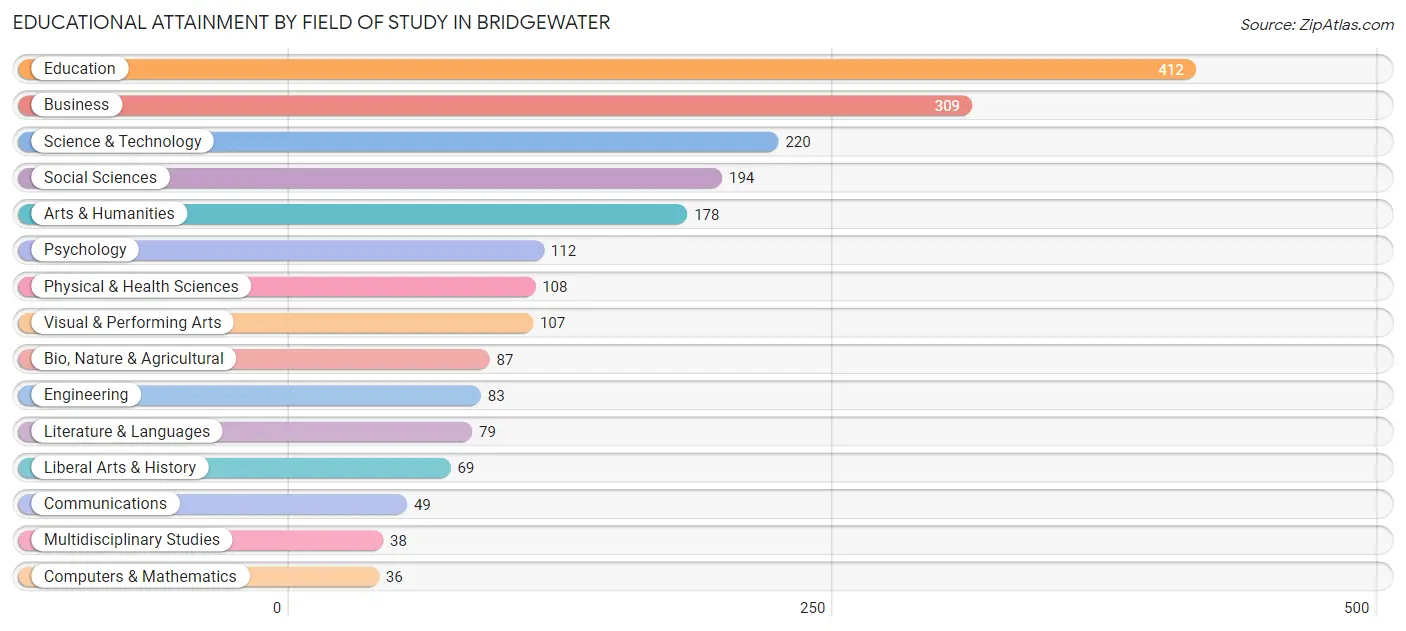
| Field of Study | # Graduates | % Graduates |
| Computers & Mathematics | 36 | 1.7% |
| Bio, Nature & Agricultural | 87 | 4.2% |
| Physical & Health Sciences | 108 | 5.2% |
| Psychology | 112 | 5.4% |
| Social Sciences | 194 | 9.3% |
| Engineering | 83 | 4.0% |
| Multidisciplinary Studies | 38 | 1.8% |
| Science & Technology | 220 | 10.6% |
| Business | 309 | 14.8% |
| Education | 412 | 19.8% |
| Literature & Languages | 79 | 3.8% |
| Liberal Arts & History | 69 | 3.3% |
| Visual & Performing Arts | 107 | 5.1% |
| Communications | 49 | 2.4% |
| Arts & Humanities | 178 | 8.6% |
| Total | 2,081 | 100.0% |
Transportation & Commute in Bridgewater
Vehicle Availability by Sex in Bridgewater
The most prevalent vehicle ownership categories in Bridgewater are males with 2 vehicles (680, accounting for 61.8%) and females with 2 vehicles (572, making up 54.6%).
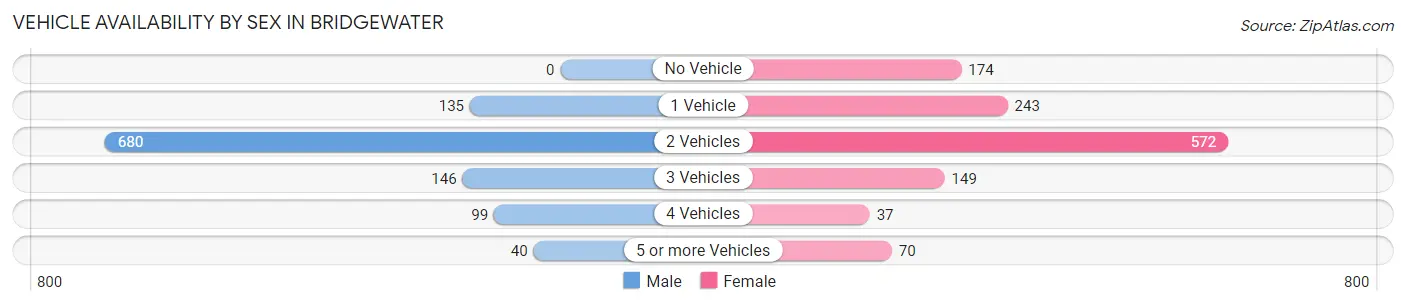
| Vehicles Available | Male | Female |
| No Vehicle | 0 (0.0%) | 174 (14.0%) |
| 1 Vehicle | 135 (12.3%) | 243 (19.5%) |
| 2 Vehicles | 680 (61.8%) | 572 (45.9%) |
| 3 Vehicles | 146 (13.3%) | 149 (12.0%) |
| 4 Vehicles | 99 (9.0%) | 37 (3.0%) |
| 5 or more Vehicles | 40 (3.6%) | 70 (5.6%) |
| Total | 1,100 (100.0%) | 1,245 (100.0%) |
Commute Time in Bridgewater
The most frequently occuring commute durations in Bridgewater are 5 to 9 minutes (729 commuters, 26.9%), 15 to 19 minutes (546 commuters, 20.2%), and 10 to 14 minutes (370 commuters, 13.7%).
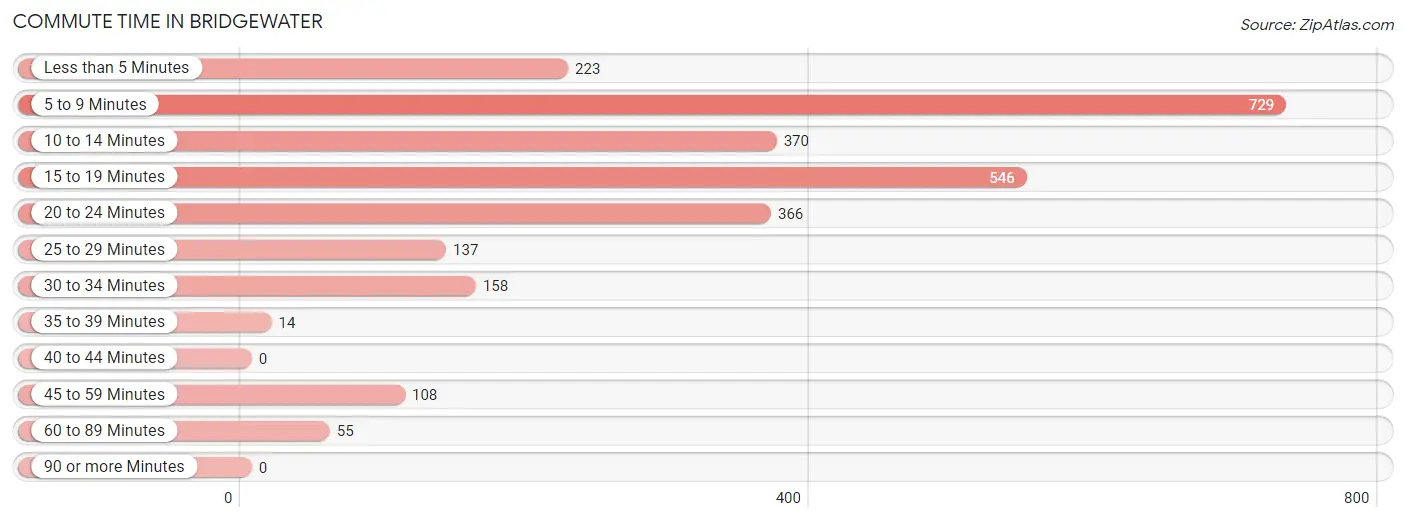
| Commute Time | # Commuters | % Commuters |
| Less than 5 Minutes | 223 | 8.2% |
| 5 to 9 Minutes | 729 | 26.9% |
| 10 to 14 Minutes | 370 | 13.7% |
| 15 to 19 Minutes | 546 | 20.2% |
| 20 to 24 Minutes | 366 | 13.5% |
| 25 to 29 Minutes | 137 | 5.1% |
| 30 to 34 Minutes | 158 | 5.8% |
| 35 to 39 Minutes | 14 | 0.5% |
| 40 to 44 Minutes | 0 | 0.0% |
| 45 to 59 Minutes | 108 | 4.0% |
| 60 to 89 Minutes | 55 | 2.0% |
| 90 or more Minutes | 0 | 0.0% |
Commute Time by Sex in Bridgewater
The most common commute times in Bridgewater are 5 to 9 minutes (274 commuters, 23.1%) for males and 5 to 9 minutes (455 commuters, 29.9%) for females.
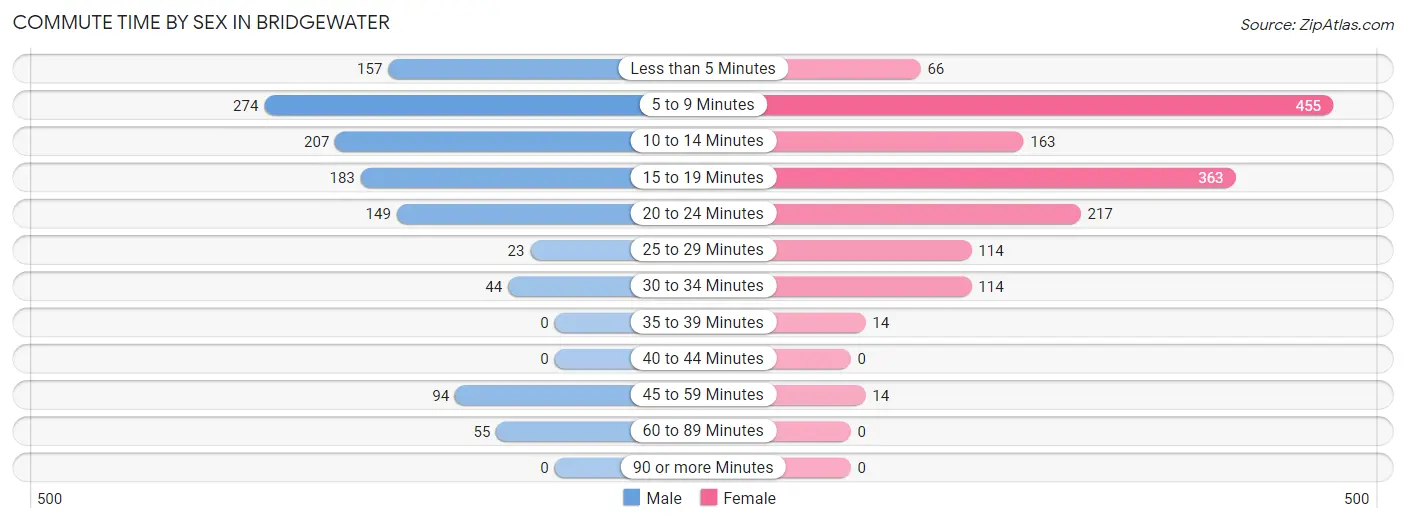
| Commute Time | Male | Female |
| Less than 5 Minutes | 157 (13.2%) | 66 (4.3%) |
| 5 to 9 Minutes | 274 (23.1%) | 455 (29.9%) |
| 10 to 14 Minutes | 207 (17.4%) | 163 (10.7%) |
| 15 to 19 Minutes | 183 (15.4%) | 363 (23.9%) |
| 20 to 24 Minutes | 149 (12.6%) | 217 (14.3%) |
| 25 to 29 Minutes | 23 (1.9%) | 114 (7.5%) |
| 30 to 34 Minutes | 44 (3.7%) | 114 (7.5%) |
| 35 to 39 Minutes | 0 (0.0%) | 14 (0.9%) |
| 40 to 44 Minutes | 0 (0.0%) | 0 (0.0%) |
| 45 to 59 Minutes | 94 (7.9%) | 14 (0.9%) |
| 60 to 89 Minutes | 55 (4.6%) | 0 (0.0%) |
| 90 or more Minutes | 0 (0.0%) | 0 (0.0%) |
Time of Departure to Work by Sex in Bridgewater
The most frequent times of departure to work in Bridgewater are 7:30 AM to 7:59 AM (220, 18.5%) for males and 4:00 PM to 11:59 PM (324, 21.3%) for females.
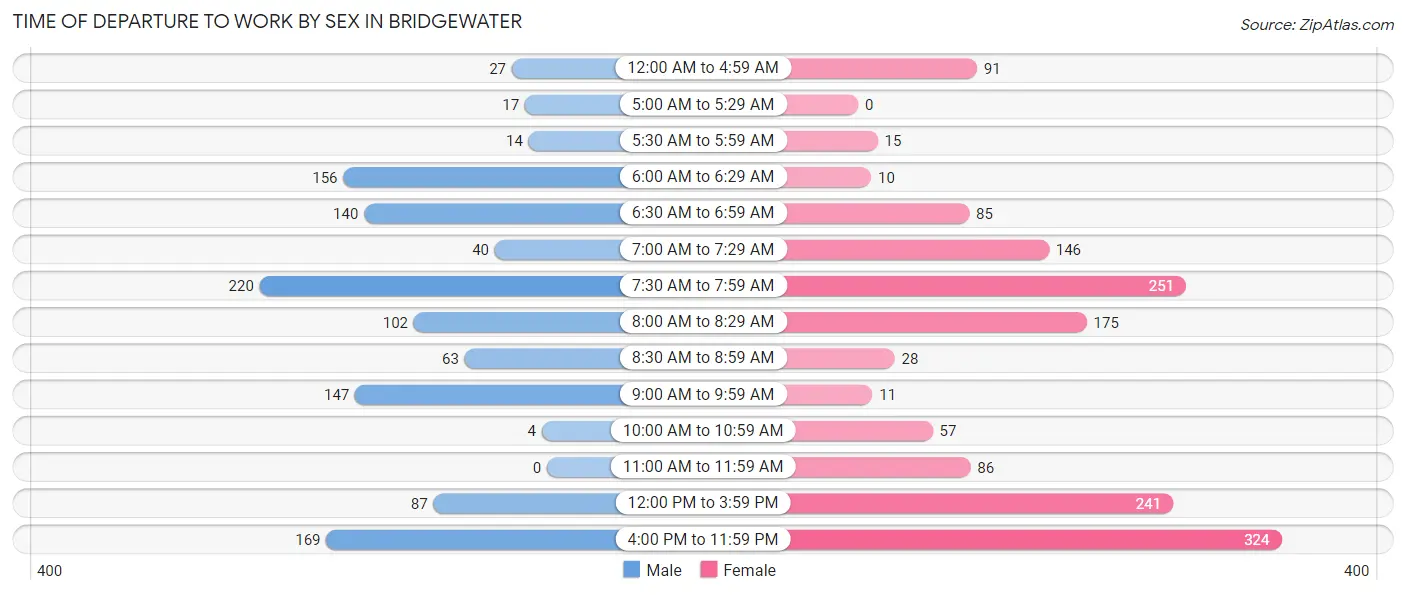
| Time of Departure | Male | Female |
| 12:00 AM to 4:59 AM | 27 (2.3%) | 91 (6.0%) |
| 5:00 AM to 5:29 AM | 17 (1.4%) | 0 (0.0%) |
| 5:30 AM to 5:59 AM | 14 (1.2%) | 15 (1.0%) |
| 6:00 AM to 6:29 AM | 156 (13.2%) | 10 (0.7%) |
| 6:30 AM to 6:59 AM | 140 (11.8%) | 85 (5.6%) |
| 7:00 AM to 7:29 AM | 40 (3.4%) | 146 (9.6%) |
| 7:30 AM to 7:59 AM | 220 (18.5%) | 251 (16.5%) |
| 8:00 AM to 8:29 AM | 102 (8.6%) | 175 (11.5%) |
| 8:30 AM to 8:59 AM | 63 (5.3%) | 28 (1.8%) |
| 9:00 AM to 9:59 AM | 147 (12.4%) | 11 (0.7%) |
| 10:00 AM to 10:59 AM | 4 (0.3%) | 57 (3.7%) |
| 11:00 AM to 11:59 AM | 0 (0.0%) | 86 (5.7%) |
| 12:00 PM to 3:59 PM | 87 (7.3%) | 241 (15.9%) |
| 4:00 PM to 11:59 PM | 169 (14.2%) | 324 (21.3%) |
| Total | 1,186 (100.0%) | 1,520 (100.0%) |
Housing Occupancy in Bridgewater
Occupancy by Ownership in Bridgewater
Of the total 2,214 dwellings in Bridgewater, owner-occupied units account for 1,307 (59.0%), while renter-occupied units make up 907 (41.0%).
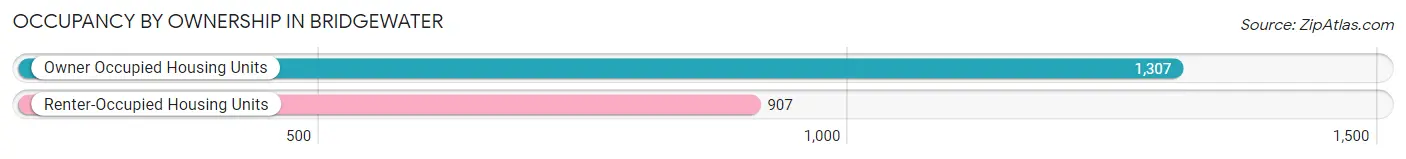
| Occupancy | # Housing Units | % Housing Units |
| Owner Occupied Housing Units | 1,307 | 59.0% |
| Renter-Occupied Housing Units | 907 | 41.0% |
| Total Occupied Housing Units | 2,214 | 100.0% |
Occupancy by Household Size in Bridgewater
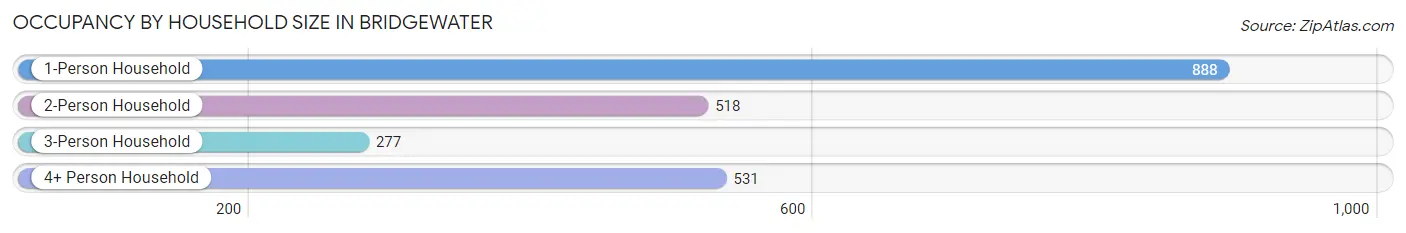
| Household Size | # Housing Units | % Housing Units |
| 1-Person Household | 888 | 40.1% |
| 2-Person Household | 518 | 23.4% |
| 3-Person Household | 277 | 12.5% |
| 4+ Person Household | 531 | 24.0% |
| Total Housing Units | 2,214 | 100.0% |
Occupancy by Ownership by Household Size in Bridgewater
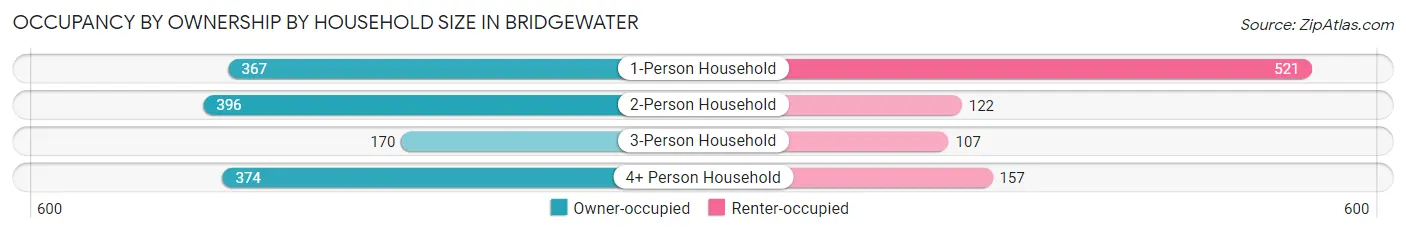
| Household Size | Owner-occupied | Renter-occupied |
| 1-Person Household | 367 (41.3%) | 521 (58.7%) |
| 2-Person Household | 396 (76.4%) | 122 (23.5%) |
| 3-Person Household | 170 (61.4%) | 107 (38.6%) |
| 4+ Person Household | 374 (70.4%) | 157 (29.6%) |
| Total Housing Units | 1,307 (59.0%) | 907 (41.0%) |
Occupancy by Educational Attainment in Bridgewater
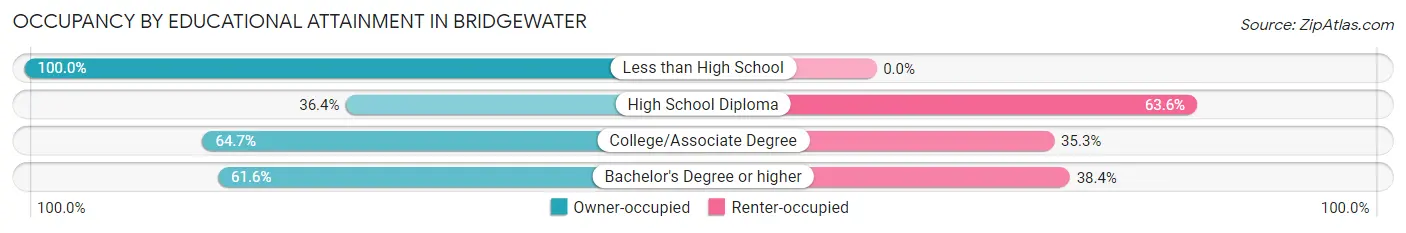
| Household Size | Owner-occupied | Renter-occupied |
| Less than High School | 33 (100.0%) | 0 (0.0%) |
| High School Diploma | 130 (36.4%) | 227 (63.6%) |
| College/Associate Degree | 418 (64.7%) | 228 (35.3%) |
| Bachelor's Degree or higher | 726 (61.6%) | 452 (38.4%) |
Occupancy by Age of Householder in Bridgewater
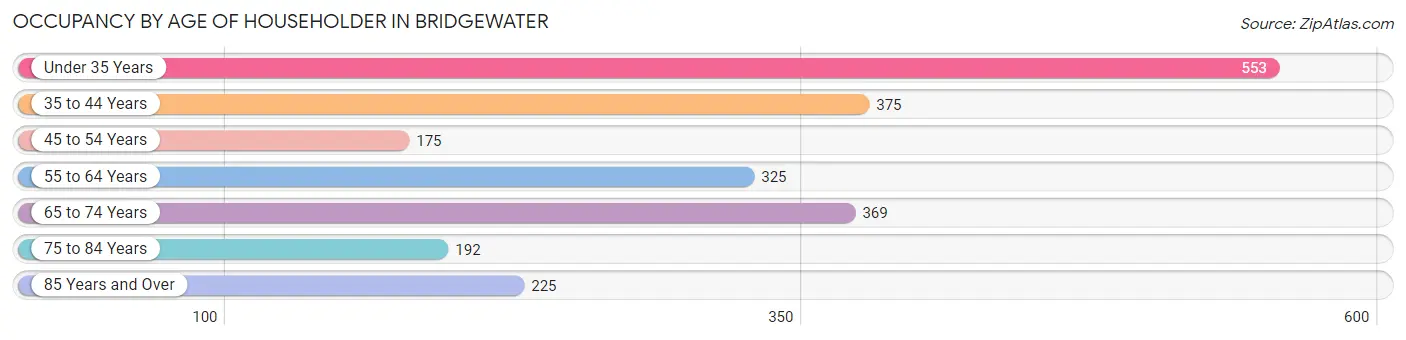
| Age Bracket | # Households | % Households |
| Under 35 Years | 553 | 25.0% |
| 35 to 44 Years | 375 | 16.9% |
| 45 to 54 Years | 175 | 7.9% |
| 55 to 64 Years | 325 | 14.7% |
| 65 to 74 Years | 369 | 16.7% |
| 75 to 84 Years | 192 | 8.7% |
| 85 Years and Over | 225 | 10.2% |
| Total | 2,214 | 100.0% |
Housing Finances in Bridgewater
Median Income by Occupancy in Bridgewater
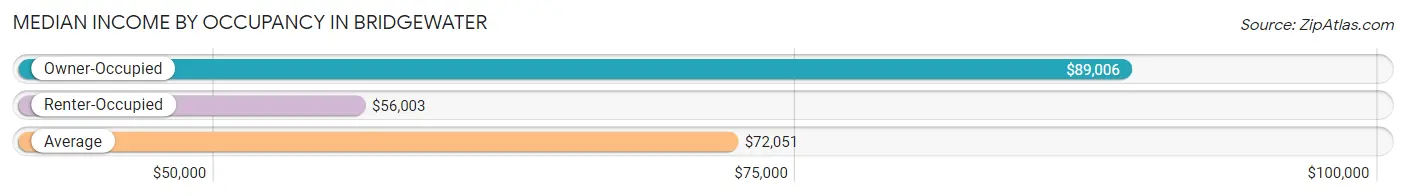
| Occupancy Type | # Households | Median Income |
| Owner-Occupied | 1,307 (59.0%) | $89,006 |
| Renter-Occupied | 907 (41.0%) | $56,003 |
| Average | 2,214 (100.0%) | $72,051 |
Occupancy by Householder Income Bracket in Bridgewater
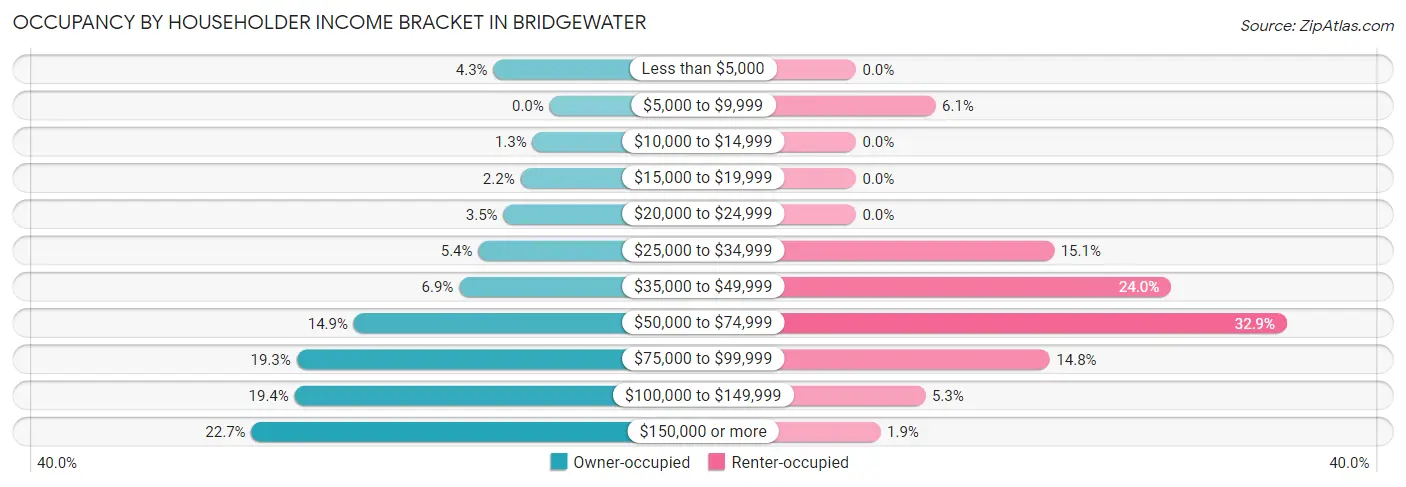
| Income Bracket | Owner-occupied | Renter-occupied |
| Less than $5,000 | 56 (4.3%) | 0 (0.0%) |
| $5,000 to $9,999 | 0 (0.0%) | 55 (6.1%) |
| $10,000 to $14,999 | 17 (1.3%) | 0 (0.0%) |
| $15,000 to $19,999 | 29 (2.2%) | 0 (0.0%) |
| $20,000 to $24,999 | 46 (3.5%) | 0 (0.0%) |
| $25,000 to $34,999 | 71 (5.4%) | 137 (15.1%) |
| $35,000 to $49,999 | 90 (6.9%) | 218 (24.0%) |
| $50,000 to $74,999 | 195 (14.9%) | 298 (32.9%) |
| $75,000 to $99,999 | 252 (19.3%) | 134 (14.8%) |
| $100,000 to $149,999 | 254 (19.4%) | 48 (5.3%) |
| $150,000 or more | 297 (22.7%) | 17 (1.9%) |
| Total | 1,307 (100.0%) | 907 (100.0%) |
Monthly Housing Cost Tiers in Bridgewater
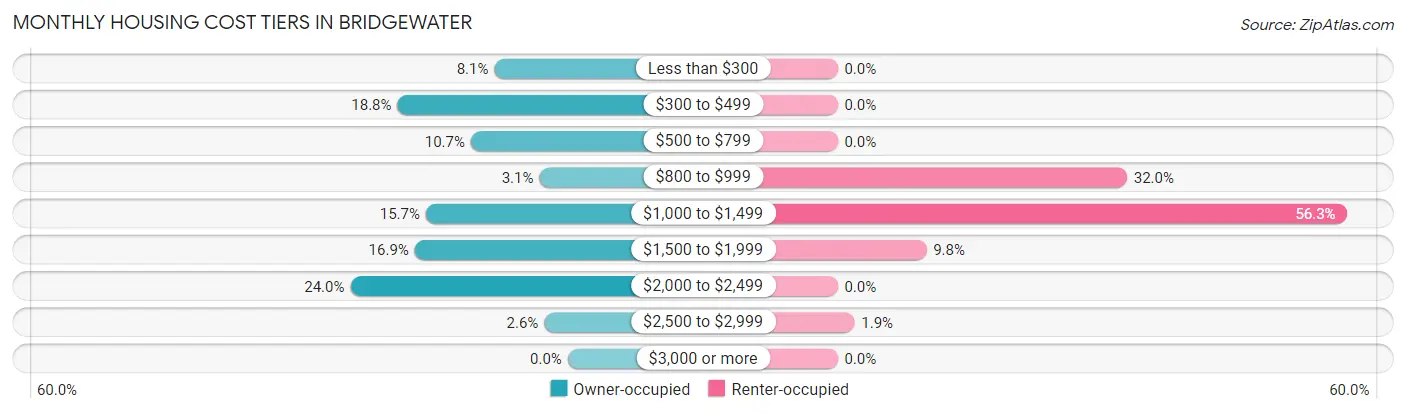
| Monthly Cost | Owner-occupied | Renter-occupied |
| Less than $300 | 106 (8.1%) | 0 (0.0%) |
| $300 to $499 | 246 (18.8%) | 0 (0.0%) |
| $500 to $799 | 140 (10.7%) | 0 (0.0%) |
| $800 to $999 | 41 (3.1%) | 290 (32.0%) |
| $1,000 to $1,499 | 205 (15.7%) | 511 (56.3%) |
| $1,500 to $1,999 | 221 (16.9%) | 89 (9.8%) |
| $2,000 to $2,499 | 314 (24.0%) | 0 (0.0%) |
| $2,500 to $2,999 | 34 (2.6%) | 17 (1.9%) |
| $3,000 or more | 0 (0.0%) | 0 (0.0%) |
| Total | 1,307 (100.0%) | 907 (100.0%) |
Physical Housing Characteristics in Bridgewater
Housing Structures in Bridgewater
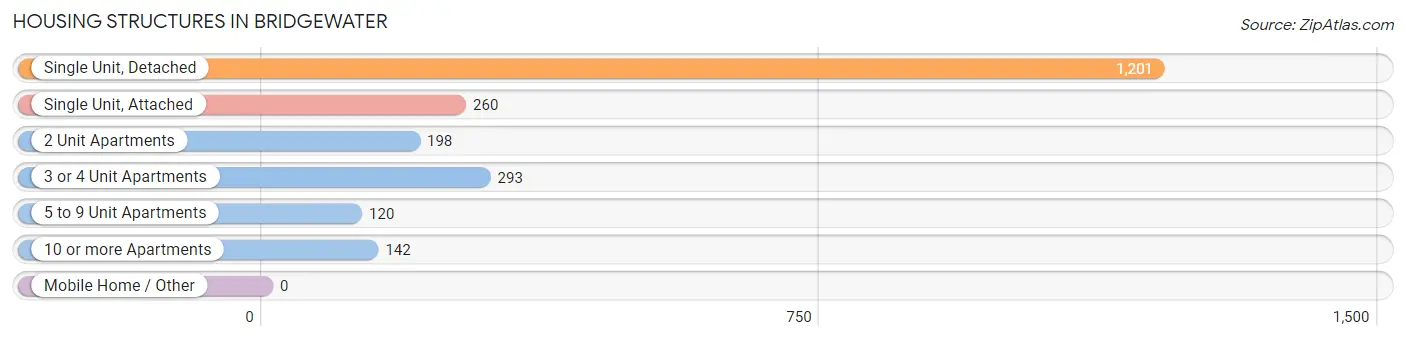
| Structure Type | # Housing Units | % Housing Units |
| Single Unit, Detached | 1,201 | 54.2% |
| Single Unit, Attached | 260 | 11.7% |
| 2 Unit Apartments | 198 | 8.9% |
| 3 or 4 Unit Apartments | 293 | 13.2% |
| 5 to 9 Unit Apartments | 120 | 5.4% |
| 10 or more Apartments | 142 | 6.4% |
| Mobile Home / Other | 0 | 0.0% |
| Total | 2,214 | 100.0% |
Housing Structures by Occupancy in Bridgewater
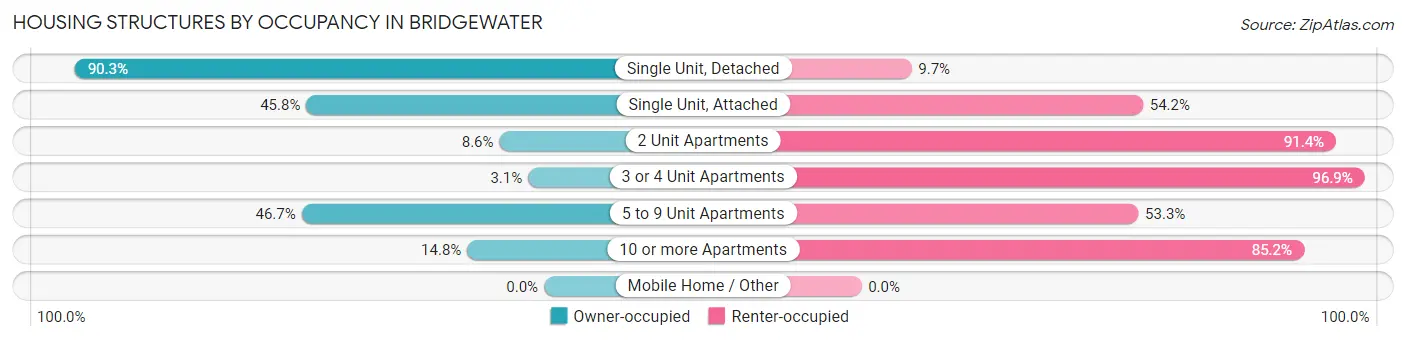
| Structure Type | Owner-occupied | Renter-occupied |
| Single Unit, Detached | 1,085 (90.3%) | 116 (9.7%) |
| Single Unit, Attached | 119 (45.8%) | 141 (54.2%) |
| 2 Unit Apartments | 17 (8.6%) | 181 (91.4%) |
| 3 or 4 Unit Apartments | 9 (3.1%) | 284 (96.9%) |
| 5 to 9 Unit Apartments | 56 (46.7%) | 64 (53.3%) |
| 10 or more Apartments | 21 (14.8%) | 121 (85.2%) |
| Mobile Home / Other | 0 (0.0%) | 0 (0.0%) |
| Total | 1,307 (59.0%) | 907 (41.0%) |
Housing Structures by Number of Rooms in Bridgewater
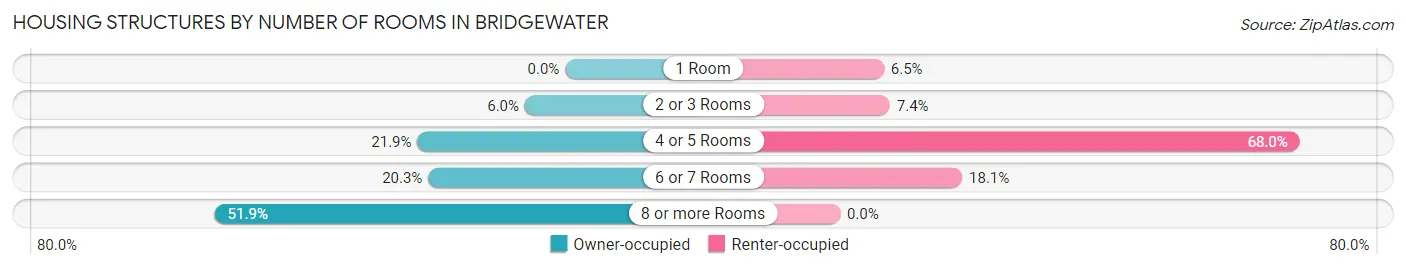
| Number of Rooms | Owner-occupied | Renter-occupied |
| 1 Room | 0 (0.0%) | 59 (6.5%) |
| 2 or 3 Rooms | 78 (6.0%) | 67 (7.4%) |
| 4 or 5 Rooms | 286 (21.9%) | 617 (68.0%) |
| 6 or 7 Rooms | 265 (20.3%) | 164 (18.1%) |
| 8 or more Rooms | 678 (51.9%) | 0 (0.0%) |
| Total | 1,307 (100.0%) | 907 (100.0%) |
Housing Structure by Heating Type in Bridgewater
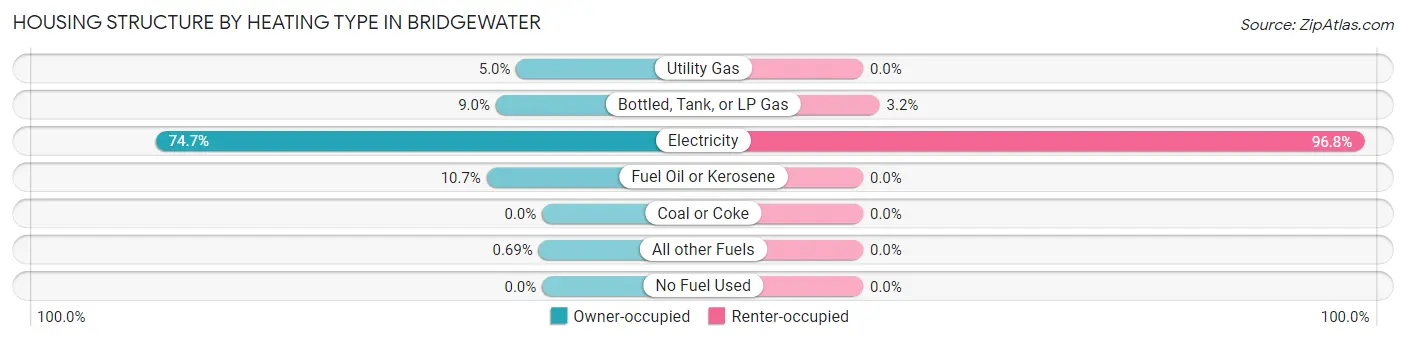
| Heating Type | Owner-occupied | Renter-occupied |
| Utility Gas | 65 (5.0%) | 0 (0.0%) |
| Bottled, Tank, or LP Gas | 117 (8.9%) | 29 (3.2%) |
| Electricity | 976 (74.7%) | 878 (96.8%) |
| Fuel Oil or Kerosene | 140 (10.7%) | 0 (0.0%) |
| Coal or Coke | 0 (0.0%) | 0 (0.0%) |
| All other Fuels | 9 (0.7%) | 0 (0.0%) |
| No Fuel Used | 0 (0.0%) | 0 (0.0%) |
| Total | 1,307 (100.0%) | 907 (100.0%) |
Household Vehicle Usage in Bridgewater
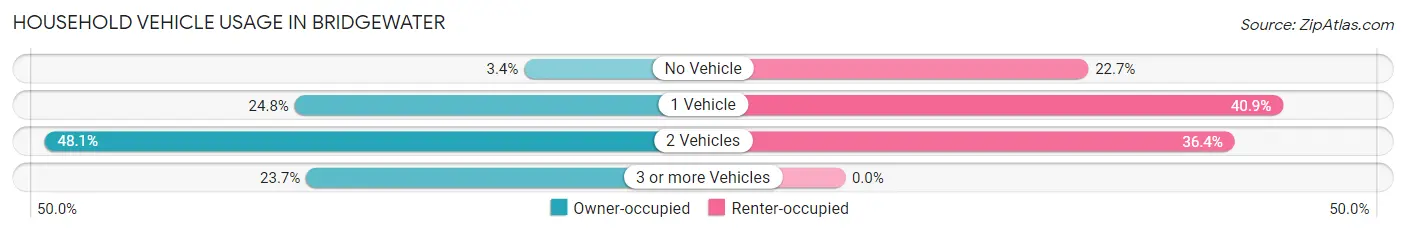
| Vehicles per Household | Owner-occupied | Renter-occupied |
| No Vehicle | 44 (3.4%) | 206 (22.7%) |
| 1 Vehicle | 324 (24.8%) | 371 (40.9%) |
| 2 Vehicles | 629 (48.1%) | 330 (36.4%) |
| 3 or more Vehicles | 310 (23.7%) | 0 (0.0%) |
| Total | 1,307 (100.0%) | 907 (100.0%) |
Real Estate & Mortgages in Bridgewater
Real Estate and Mortgage Overview in Bridgewater
| Characteristic | Without Mortgage | With Mortgage |
| Housing Units | 476 | 831 |
| Median Property Value | $282,000 | $358,700 |
| Median Household Income | $48,750 | $243 |
| Monthly Housing Costs | $450 | $0 |
| Real Estate Taxes | $1,592 | $0 |
Property Value by Mortgage Status in Bridgewater
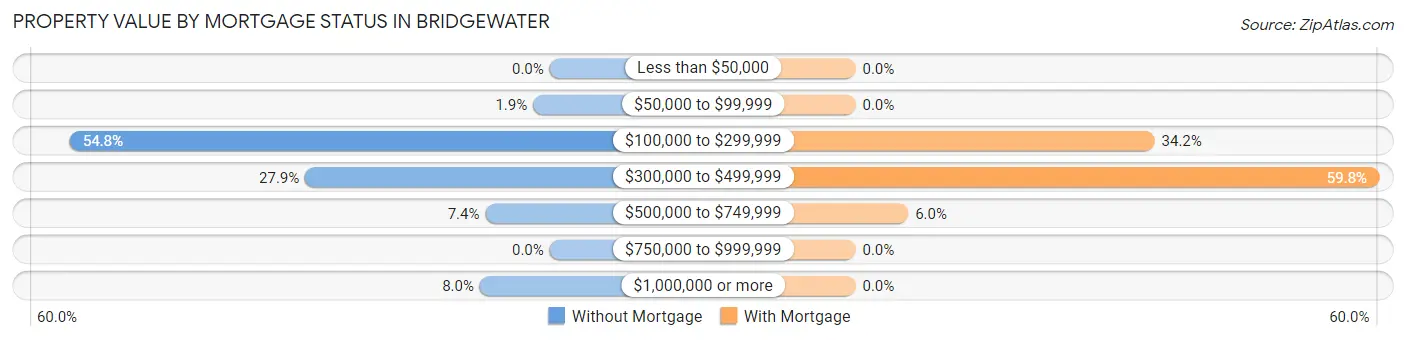
| Property Value | Without Mortgage | With Mortgage |
| Less than $50,000 | 0 (0.0%) | 0 (0.0%) |
| $50,000 to $99,999 | 9 (1.9%) | 0 (0.0%) |
| $100,000 to $299,999 | 261 (54.8%) | 284 (34.2%) |
| $300,000 to $499,999 | 133 (27.9%) | 497 (59.8%) |
| $500,000 to $749,999 | 35 (7.3%) | 50 (6.0%) |
| $750,000 to $999,999 | 0 (0.0%) | 0 (0.0%) |
| $1,000,000 or more | 38 (8.0%) | 0 (0.0%) |
| Total | 476 (100.0%) | 831 (100.0%) |
Household Income by Mortgage Status in Bridgewater
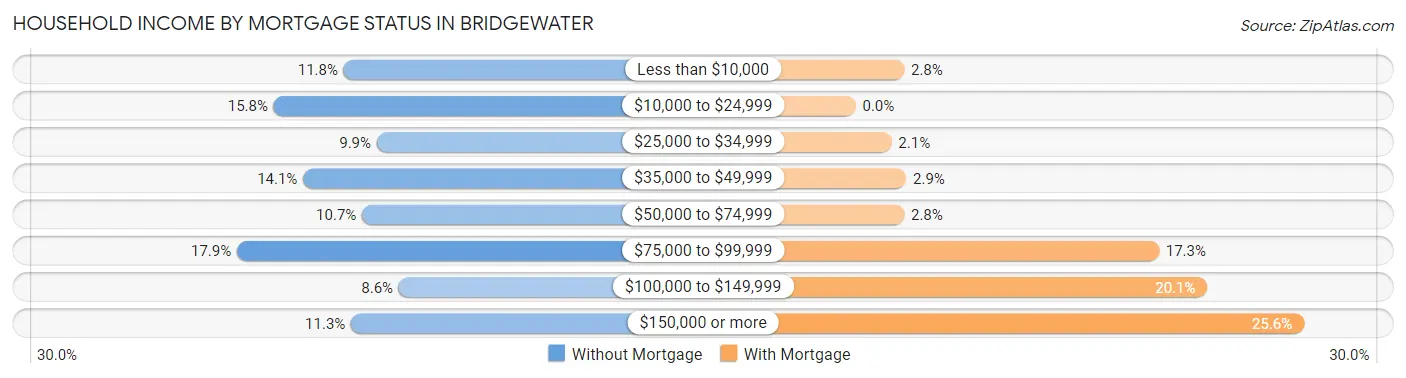
| Household Income | Without Mortgage | With Mortgage |
| Less than $10,000 | 56 (11.8%) | 23 (2.8%) |
| $10,000 to $24,999 | 75 (15.8%) | 0 (0.0%) |
| $25,000 to $34,999 | 47 (9.9%) | 17 (2.1%) |
| $35,000 to $49,999 | 67 (14.1%) | 24 (2.9%) |
| $50,000 to $74,999 | 51 (10.7%) | 23 (2.8%) |
| $75,000 to $99,999 | 85 (17.9%) | 144 (17.3%) |
| $100,000 to $149,999 | 41 (8.6%) | 167 (20.1%) |
| $150,000 or more | 54 (11.3%) | 213 (25.6%) |
| Total | 476 (100.0%) | 831 (100.0%) |
Property Value to Household Income Ratio in Bridgewater
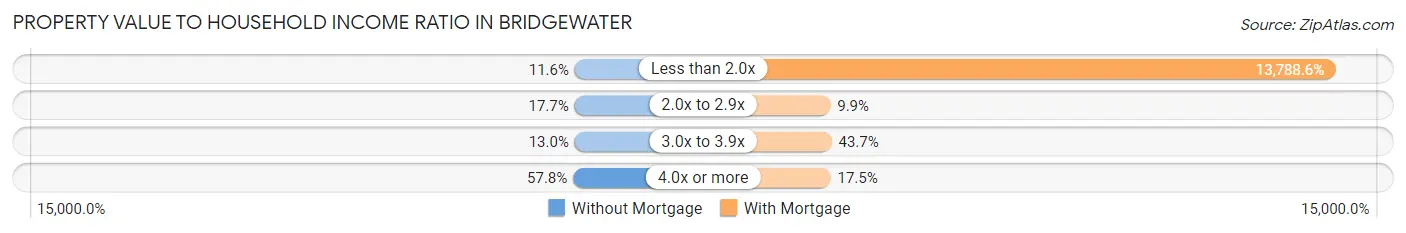
| Value-to-Income Ratio | Without Mortgage | With Mortgage |
| Less than 2.0x | 55 (11.6%) | 114,583 (13,788.6%) |
| 2.0x to 2.9x | 84 (17.6%) | 82 (9.9%) |
| 3.0x to 3.9x | 62 (13.0%) | 363 (43.7%) |
| 4.0x or more | 275 (57.8%) | 145 (17.4%) |
| Total | 476 (100.0%) | 831 (100.0%) |
Real Estate Taxes by Mortgage Status in Bridgewater
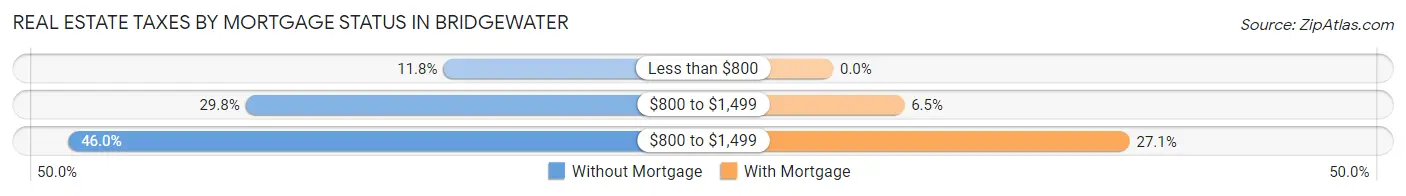
| Property Taxes | Without Mortgage | With Mortgage |
| Less than $800 | 56 (11.8%) | 0 (0.0%) |
| $800 to $1,499 | 142 (29.8%) | 54 (6.5%) |
| $800 to $1,499 | 219 (46.0%) | 225 (27.1%) |
| Total | 476 (100.0%) | 831 (100.0%) |
Health & Disability in Bridgewater
Health Insurance Coverage by Age in Bridgewater
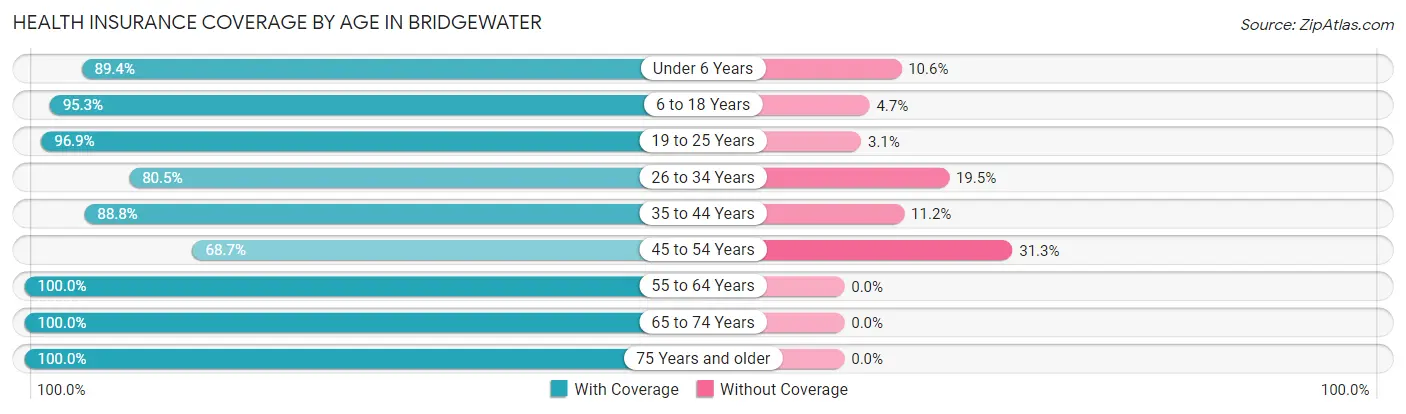
| Age Bracket | With Coverage | Without Coverage |
| Under 6 Years | 429 (89.4%) | 51 (10.6%) |
| 6 to 18 Years | 1,015 (95.3%) | 50 (4.7%) |
| 19 to 25 Years | 1,333 (96.9%) | 43 (3.1%) |
| 26 to 34 Years | 643 (80.5%) | 156 (19.5%) |
| 35 to 44 Years | 645 (88.8%) | 81 (11.2%) |
| 45 to 54 Years | 171 (68.7%) | 78 (31.3%) |
| 55 to 64 Years | 579 (100.0%) | 0 (0.0%) |
| 65 to 74 Years | 577 (100.0%) | 0 (0.0%) |
| 75 Years and older | 562 (100.0%) | 0 (0.0%) |
| Total | 5,954 (92.8%) | 459 (7.2%) |
Health Insurance Coverage by Citizenship Status in Bridgewater
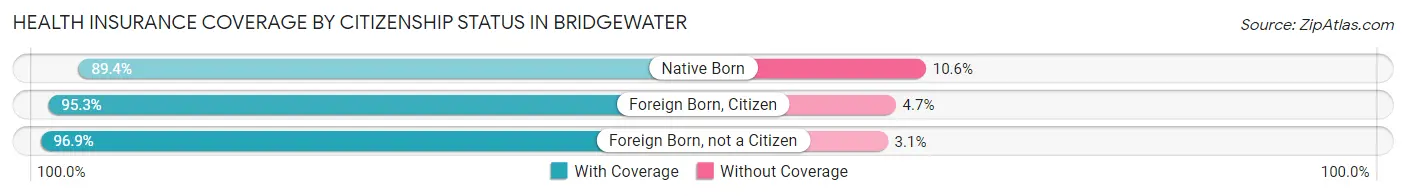
| Citizenship Status | With Coverage | Without Coverage |
| Native Born | 429 (89.4%) | 51 (10.6%) |
| Foreign Born, Citizen | 1,015 (95.3%) | 50 (4.7%) |
| Foreign Born, not a Citizen | 1,333 (96.9%) | 43 (3.1%) |
Health Insurance Coverage by Household Income in Bridgewater
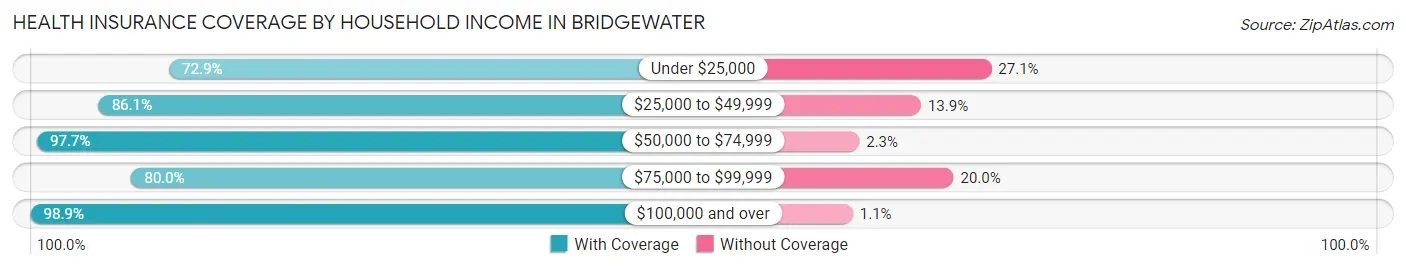
| Household Income | With Coverage | Without Coverage |
| Under $25,000 | 148 (72.9%) | 55 (27.1%) |
| $25,000 to $49,999 | 774 (86.1%) | 125 (13.9%) |
| $50,000 to $74,999 | 959 (97.7%) | 23 (2.3%) |
| $75,000 to $99,999 | 824 (80.0%) | 206 (20.0%) |
| $100,000 and over | 1,835 (98.9%) | 21 (1.1%) |
Public vs Private Health Insurance Coverage by Age in Bridgewater
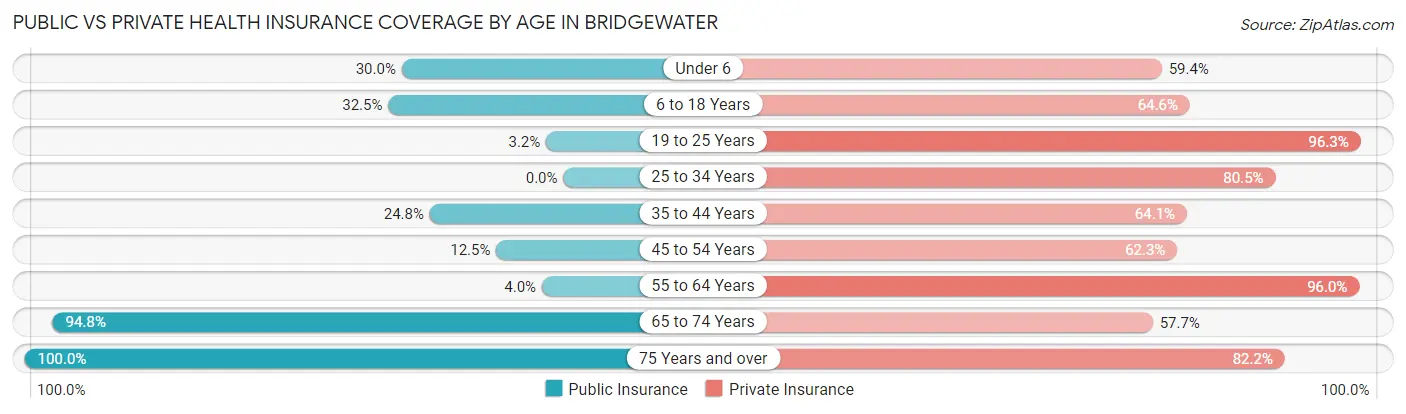
| Age Bracket | Public Insurance | Private Insurance |
| Under 6 | 144 (30.0%) | 285 (59.4%) |
| 6 to 18 Years | 346 (32.5%) | 688 (64.6%) |
| 19 to 25 Years | 44 (3.2%) | 1,325 (96.3%) |
| 25 to 34 Years | 0 (0.0%) | 643 (80.5%) |
| 35 to 44 Years | 180 (24.8%) | 465 (64.0%) |
| 45 to 54 Years | 31 (12.4%) | 155 (62.3%) |
| 55 to 64 Years | 23 (4.0%) | 556 (96.0%) |
| 65 to 74 Years | 547 (94.8%) | 333 (57.7%) |
| 75 Years and over | 562 (100.0%) | 462 (82.2%) |
| Total | 1,877 (29.3%) | 4,912 (76.6%) |
Disability Status by Sex by Age in Bridgewater
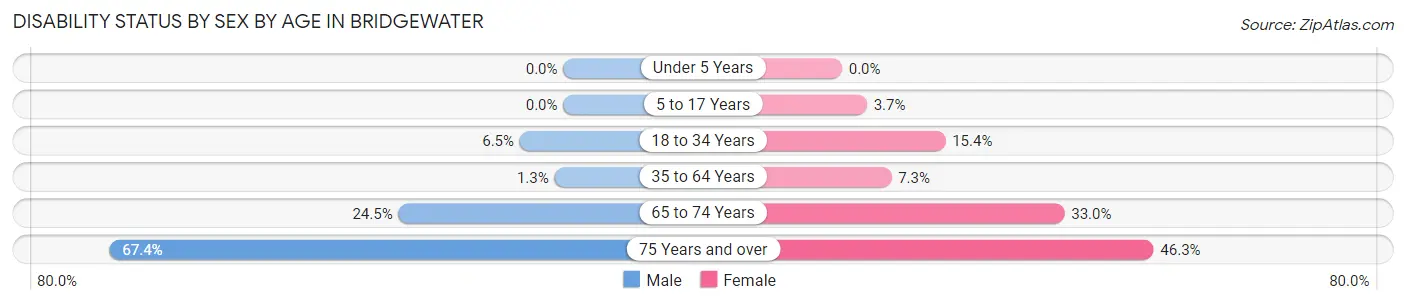
| Age Bracket | Male | Female |
| Under 5 Years | 0 (0.0%) | 0 (0.0%) |
| 5 to 17 Years | 0 (0.0%) | 19 (3.7%) |
| 18 to 34 Years | 70 (6.5%) | 217 (15.4%) |
| 35 to 64 Years | 10 (1.3%) | 58 (7.3%) |
| 65 to 74 Years | 59 (24.5%) | 111 (33.0%) |
| 75 Years and over | 153 (67.4%) | 155 (46.3%) |
Disability Class by Sex by Age in Bridgewater
Disability Class: Hearing Difficulty
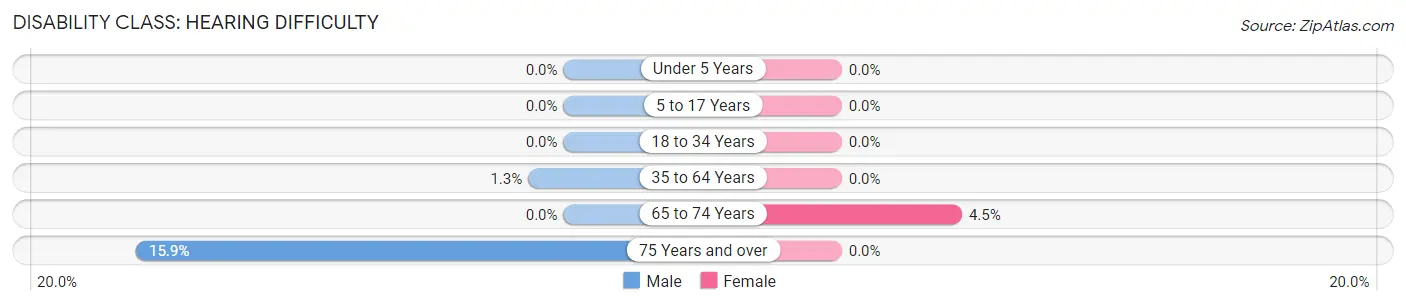
| Age Bracket | Male | Female |
| Under 5 Years | 0 (0.0%) | 0 (0.0%) |
| 5 to 17 Years | 0 (0.0%) | 0 (0.0%) |
| 18 to 34 Years | 0 (0.0%) | 0 (0.0%) |
| 35 to 64 Years | 10 (1.3%) | 0 (0.0%) |
| 65 to 74 Years | 0 (0.0%) | 15 (4.5%) |
| 75 Years and over | 36 (15.9%) | 0 (0.0%) |
Disability Class: Vision Difficulty
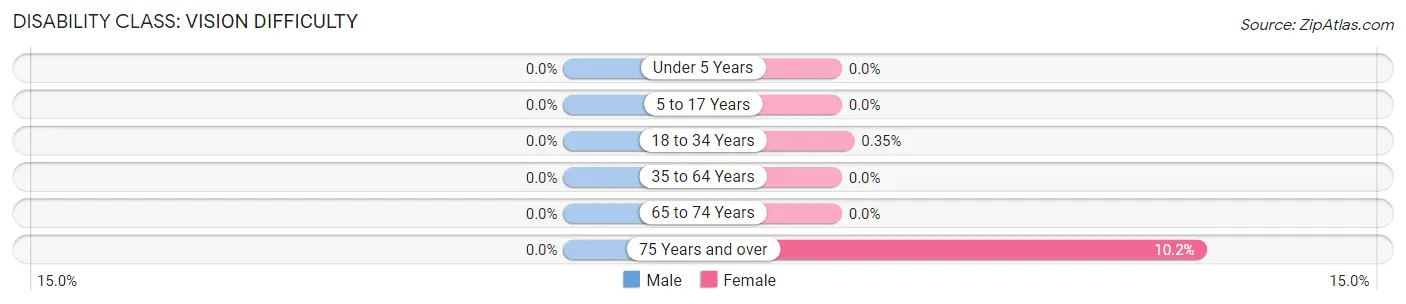
| Age Bracket | Male | Female |
| Under 5 Years | 0 (0.0%) | 0 (0.0%) |
| 5 to 17 Years | 0 (0.0%) | 0 (0.0%) |
| 18 to 34 Years | 0 (0.0%) | 5 (0.4%) |
| 35 to 64 Years | 0 (0.0%) | 0 (0.0%) |
| 65 to 74 Years | 0 (0.0%) | 0 (0.0%) |
| 75 Years and over | 0 (0.0%) | 34 (10.2%) |
Disability Class: Cognitive Difficulty
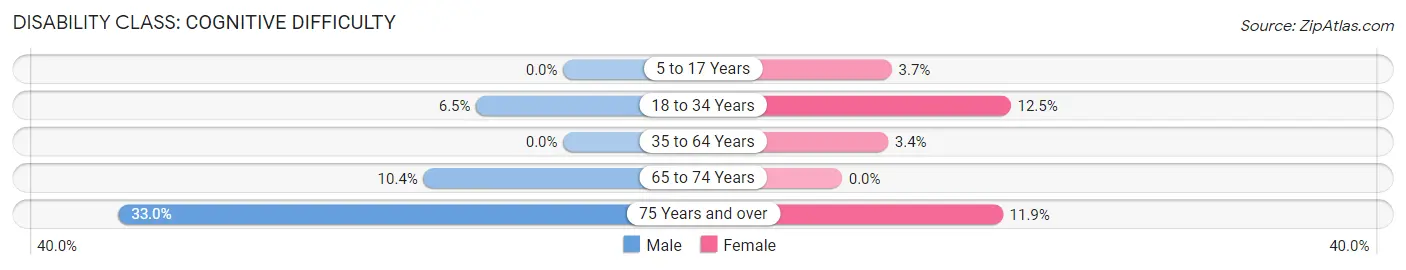
| Age Bracket | Male | Female |
| 5 to 17 Years | 0 (0.0%) | 19 (3.7%) |
| 18 to 34 Years | 70 (6.5%) | 177 (12.5%) |
| 35 to 64 Years | 0 (0.0%) | 27 (3.4%) |
| 65 to 74 Years | 25 (10.4%) | 0 (0.0%) |
| 75 Years and over | 75 (33.0%) | 40 (11.9%) |
Disability Class: Ambulatory Difficulty
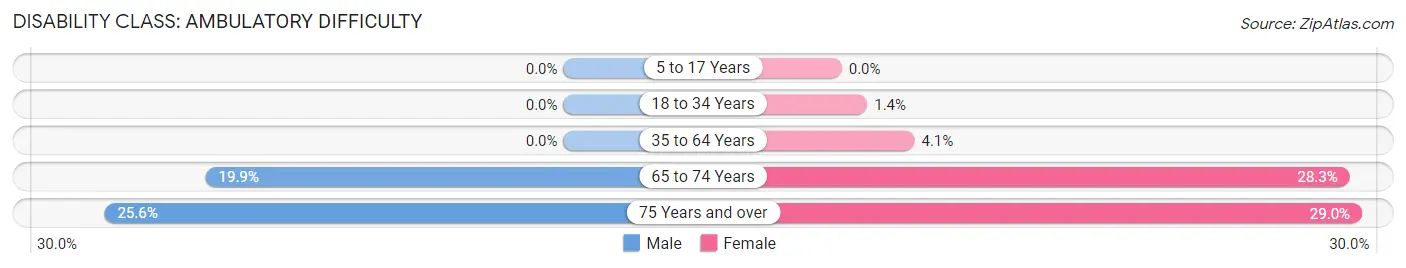
| Age Bracket | Male | Female |
| 5 to 17 Years | 0 (0.0%) | 0 (0.0%) |
| 18 to 34 Years | 0 (0.0%) | 20 (1.4%) |
| 35 to 64 Years | 0 (0.0%) | 32 (4.1%) |
| 65 to 74 Years | 48 (19.9%) | 95 (28.3%) |
| 75 Years and over | 58 (25.6%) | 97 (29.0%) |
Disability Class: Self-Care Difficulty
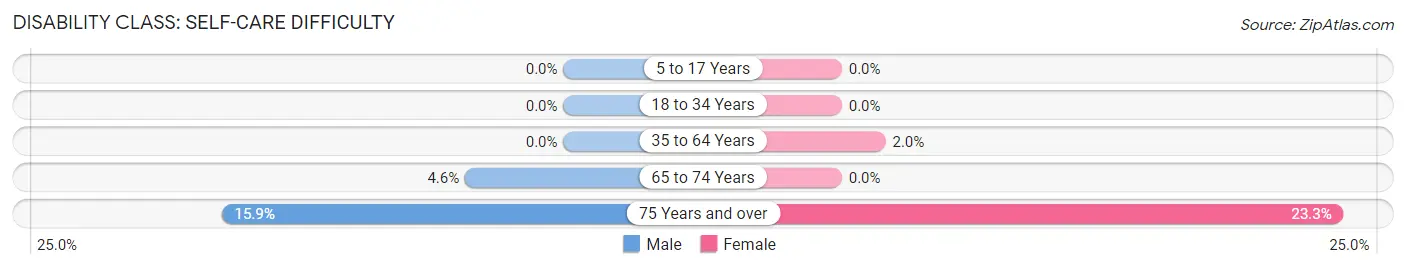
| Age Bracket | Male | Female |
| 5 to 17 Years | 0 (0.0%) | 0 (0.0%) |
| 18 to 34 Years | 0 (0.0%) | 0 (0.0%) |
| 35 to 64 Years | 0 (0.0%) | 16 (2.0%) |
| 65 to 74 Years | 11 (4.6%) | 0 (0.0%) |
| 75 Years and over | 36 (15.9%) | 78 (23.3%) |
Technology Access in Bridgewater
Computing Device Access in Bridgewater
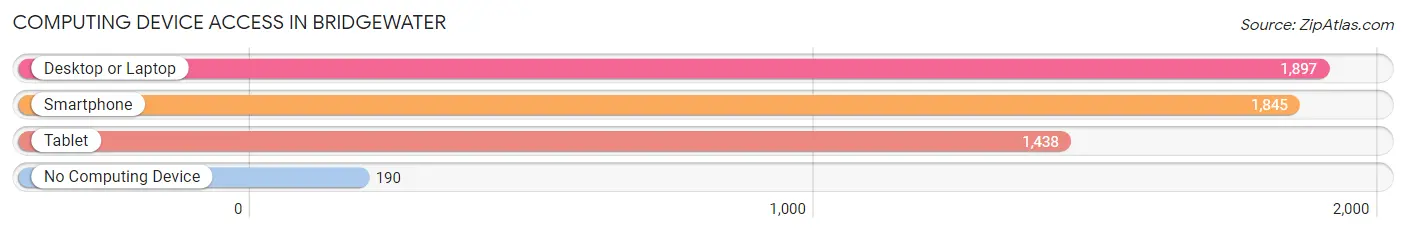
| Device Type | # Households | % Households |
| Desktop or Laptop | 1,897 | 85.7% |
| Smartphone | 1,845 | 83.3% |
| Tablet | 1,438 | 64.9% |
| No Computing Device | 190 | 8.6% |
| Total | 2,214 | 100.0% |
Internet Access in Bridgewater
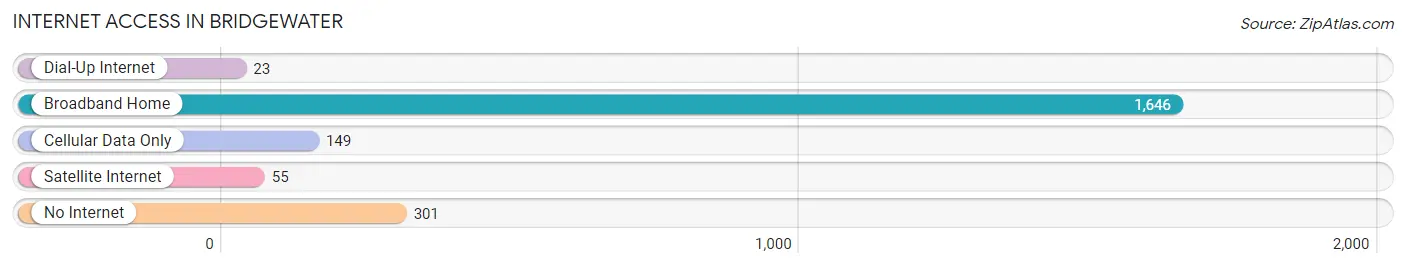
| Internet Type | # Households | % Households |
| Dial-Up Internet | 23 | 1.0% |
| Broadband Home | 1,646 | 74.4% |
| Cellular Data Only | 149 | 6.7% |
| Satellite Internet | 55 | 2.5% |
| No Internet | 301 | 13.6% |
| Total | 2,214 | 100.0% |
Bridgewater Summary
Bridgewater, Virginia is a small town located in Rockingham County, Virginia. It is situated on the banks of the Shenandoah River, and is part of the Harrisonburg Metropolitan Statistical Area. Bridgewater has a population of approximately 5,000 people, and is home to Bridgewater College, a private liberal arts college.
History
Bridgewater was first settled in 1732 by German immigrants, and was originally known as Dunkerstown. The town was renamed Bridgewater in 1820, after the nearby Bridgewater Iron Works. The iron works was established in 1790, and was the first iron works in the Shenandoah Valley. The iron works was a major employer in the area, and provided the town with much of its economic stability.
In the late 19th century, Bridgewater was a major stop on the Valley Turnpike, a major transportation route in the Shenandoah Valley. The turnpike connected the town to Harrisonburg, Staunton, and other nearby towns. The turnpike was a major factor in the growth of Bridgewater, and helped to make it a major commercial center in the area.
Geography
Bridgewater is located in the Shenandoah Valley, in the foothills of the Blue Ridge Mountains. The town is situated on the banks of the Shenandoah River, and is surrounded by rolling hills and farmland. The town is located approximately 25 miles north of Harrisonburg, and is accessible via Interstate 81.
Economy
Bridgewater’s economy is largely based on agriculture and tourism. The town is home to several farms, and is a popular destination for outdoor recreation. Bridgewater is also home to Bridgewater College, a private liberal arts college. The college is a major employer in the area, and provides the town with a steady source of economic activity.
Demographics
As of the 2010 census, Bridgewater had a population of 5,039 people. The racial makeup of the town was 94.3% White, 2.3% African American, 0.4% Native American, 0.7% Asian, 0.1% Pacific Islander, and 1.2% from other races. The median household income in Bridgewater was $41,945, and the median family income was $50,945. The per capita income in Bridgewater was $20,945.
Bridgewater is a small town with a rich history and a vibrant economy. The town is home to a diverse population, and is a popular destination for outdoor recreation. Bridgewater is a great place to live, work, and play, and is a great example of the beauty and charm of small town life.
Common Questions
What is Per Capita Income in Bridgewater?
Per Capita income in Bridgewater is $32,631.
What is the Median Family Income in Bridgewater?
Median Family Income in Bridgewater is $98,566.
What is the Median Household income in Bridgewater?
Median Household Income in Bridgewater is $72,051.
What is Income or Wage Gap in Bridgewater?
Income or Wage Gap in Bridgewater is 35.4%.
Women in Bridgewater earn 64.6 cents for every dollar earned by a man.
What is Inequality or Gini Index in Bridgewater?
Inequality or Gini Index in Bridgewater is 0.41.
What is the Total Population of Bridgewater?
Total Population of Bridgewater is 6,575.
What is the Total Male Population of Bridgewater?
Total Male Population of Bridgewater is 2,886.
What is the Total Female Population of Bridgewater?
Total Female Population of Bridgewater is 3,689.
What is the Ratio of Males per 100 Females in Bridgewater?
There are 78.23 Males per 100 Females in Bridgewater.
What is the Ratio of Females per 100 Males in Bridgewater?
There are 127.82 Females per 100 Males in Bridgewater.
What is the Median Population Age in Bridgewater?
Median Population Age in Bridgewater is 32.1 Years.
What is the Average Family Size in Bridgewater
Average Family Size in Bridgewater is 3.1 People.
What is the Average Household Size in Bridgewater
Average Household Size in Bridgewater is 2.2 People.
How Large is the Labor Force in Bridgewater?
There are 3,377 People in the Labor Forcein in Bridgewater.
What is the Percentage of People in the Labor Force in Bridgewater?
61.9% of People are in the Labor Force in Bridgewater.
What is the Unemployment Rate in Bridgewater?
Unemployment Rate in Bridgewater is 6.6%.