Tysons, VA Map & Demographics
Tysons Map
Tysons Overview
$78,624
PER CAPITA INCOME
$157,611
AVG FAMILY INCOME
$129,468
AVG HOUSEHOLD INCOME
25.8%
WAGE / INCOME GAP [ % ]
74.2¢/ $1
WAGE / INCOME GAP [ $ ]
0.41
INEQUALITY / GINI INDEX
27,617
TOTAL POPULATION
13,826
MALE POPULATION
13,791
FEMALE POPULATION
100.25
MALES / 100 FEMALES
99.75
FEMALES / 100 MALES
36.1
MEDIAN AGE
2.8
AVG FAMILY SIZE
2.0
AVG HOUSEHOLD SIZE
17,878
LABOR FORCE [ PEOPLE ]
76.3%
PERCENT IN LABOR FORCE
5.0%
UNEMPLOYMENT RATE
Income in Tysons
Income Overview in Tysons
Per Capita Income in Tysons is $78,624, while median incomes of families and households are $157,611 and $129,468 respectively.
| Characteristic | Number | Measure |
| Per Capita Income | 27,617 | $78,624 |
| Median Family Income | 6,646 | $157,611 |
| Mean Family Income | 6,646 | $199,107 |
| Median Household Income | 13,494 | $129,468 |
| Mean Household Income | 13,494 | $158,738 |
| Income Deficit | 6,646 | $0 |
| Wage / Income Gap (%) | 27,617 | 25.83% |
| Wage / Income Gap ($) | 27,617 | 74.17¢ per $1 |
| Gini / Inequality Index | 27,617 | 0.41 |
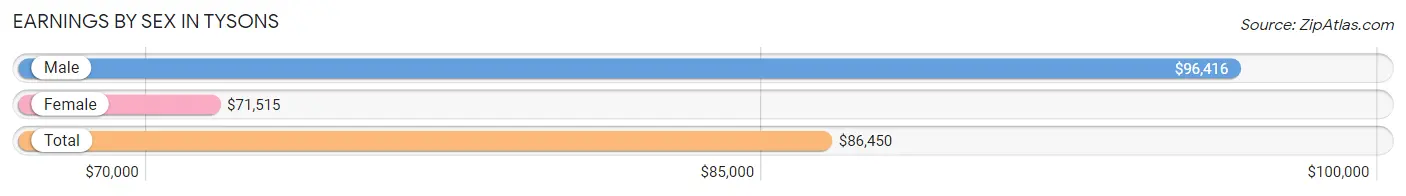
Earnings by Sex in Tysons
Average Earnings in Tysons are $86,450, $96,416 for men and $71,515 for women, a difference of 25.8%.
| Sex | Number | Average Earnings |
| Male | 9,710 (53.3%) | $96,416 |
| Female | 8,503 (46.7%) | $71,515 |
| Total | 18,213 (100.0%) | $86,450 |
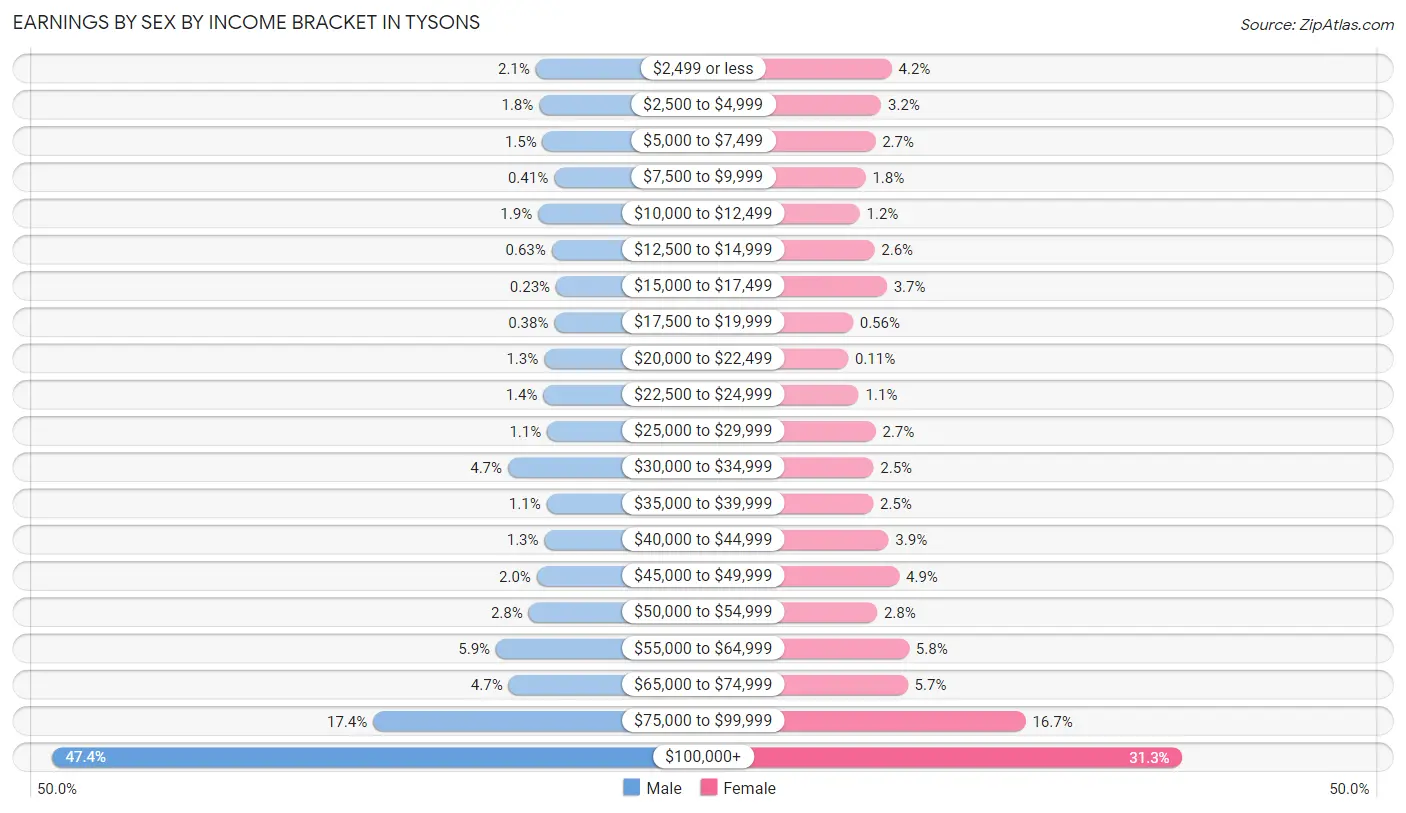
Earnings by Sex by Income Bracket in Tysons
The most common earnings brackets in Tysons are $100,000+ for men (4,600 | 47.4%) and $100,000+ for women (2,665 | 31.3%).
| Income | Male | Female |
| $2,499 or less | 207 (2.1%) | 357 (4.2%) |
| $2,500 to $4,999 | 175 (1.8%) | 273 (3.2%) |
| $5,000 to $7,499 | 144 (1.5%) | 226 (2.7%) |
| $7,500 to $9,999 | 40 (0.4%) | 149 (1.8%) |
| $10,000 to $12,499 | 185 (1.9%) | 102 (1.2%) |
| $12,500 to $14,999 | 61 (0.6%) | 219 (2.6%) |
| $15,000 to $17,499 | 22 (0.2%) | 318 (3.7%) |
| $17,500 to $19,999 | 37 (0.4%) | 48 (0.6%) |
| $20,000 to $22,499 | 130 (1.3%) | 9 (0.1%) |
| $22,500 to $24,999 | 137 (1.4%) | 94 (1.1%) |
| $25,000 to $29,999 | 103 (1.1%) | 229 (2.7%) |
| $30,000 to $34,999 | 459 (4.7%) | 212 (2.5%) |
| $35,000 to $39,999 | 108 (1.1%) | 209 (2.5%) |
| $40,000 to $44,999 | 127 (1.3%) | 332 (3.9%) |
| $45,000 to $49,999 | 197 (2.0%) | 417 (4.9%) |
| $50,000 to $54,999 | 271 (2.8%) | 241 (2.8%) |
| $55,000 to $64,999 | 568 (5.9%) | 495 (5.8%) |
| $65,000 to $74,999 | 453 (4.7%) | 485 (5.7%) |
| $75,000 to $99,999 | 1,686 (17.4%) | 1,423 (16.7%) |
| $100,000+ | 4,600 (47.4%) | 2,665 (31.3%) |
| Total | 9,710 (100.0%) | 8,503 (100.0%) |
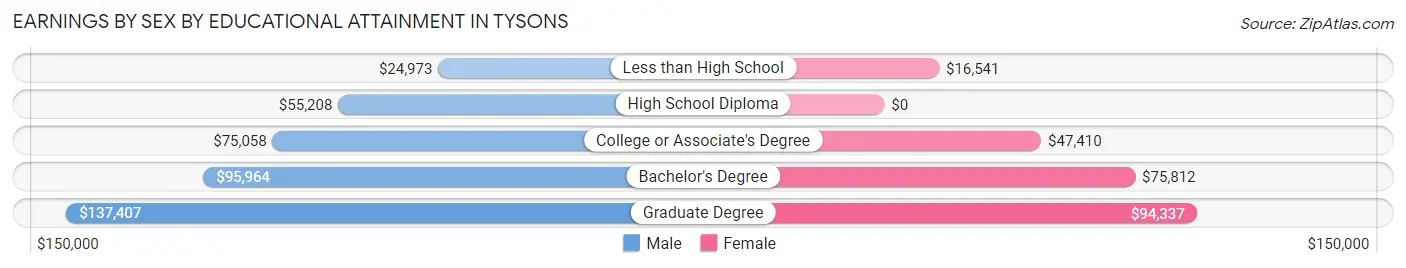
Earnings by Sex by Educational Attainment in Tysons
Average earnings in Tysons are $105,250 for men and $78,630 for women, a difference of 25.3%. Men with an educational attainment of graduate degree enjoy the highest average annual earnings of $137,407, while those with less than high school education earn the least with $24,973. Women with an educational attainment of graduate degree earn the most with the average annual earnings of $94,337, while those with less than high school education have the smallest earnings of $16,541.
| Educational Attainment | Male Income | Female Income |
| Less than High School | $24,973 | $16,541 |
| High School Diploma | $55,208 | $0 |
| College or Associate's Degree | $75,058 | $47,410 |
| Bachelor's Degree | $95,964 | $75,812 |
| Graduate Degree | $137,407 | $94,337 |
| Total | $105,250 | $78,630 |
Family Income in Tysons
Family Income Brackets in Tysons
According to the Tysons family income data, there are 2,479 families falling into the $200,000+ income range, which is the most common income bracket and makes up 37.3% of all families. Conversely, the $10,000 to $14,999 income bracket is the least frequent group with only 47 families (0.7%) belonging to this category.
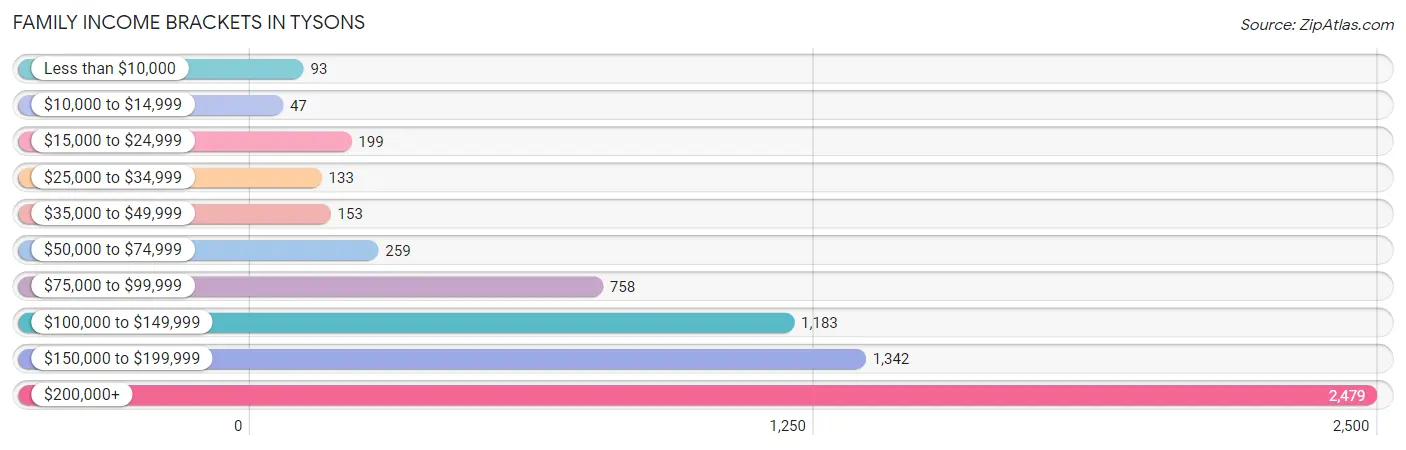
| Income Bracket | # Families | % Families |
| Less than $10,000 | 93 | 1.4% |
| $10,000 to $14,999 | 47 | 0.7% |
| $15,000 to $24,999 | 199 | 3.0% |
| $25,000 to $34,999 | 133 | 2.0% |
| $35,000 to $49,999 | 153 | 2.3% |
| $50,000 to $74,999 | 259 | 3.9% |
| $75,000 to $99,999 | 758 | 11.4% |
| $100,000 to $149,999 | 1,183 | 17.8% |
| $150,000 to $199,999 | 1,342 | 20.2% |
| $200,000+ | 2,479 | 37.3% |
Family Income by Famaliy Size in Tysons
4-person families (1,186 | 17.8%) account for the highest median family income in Tysons with $172,016 per family, while 2-person families (3,266 | 49.1%) have the highest median income of $77,415 per family member.
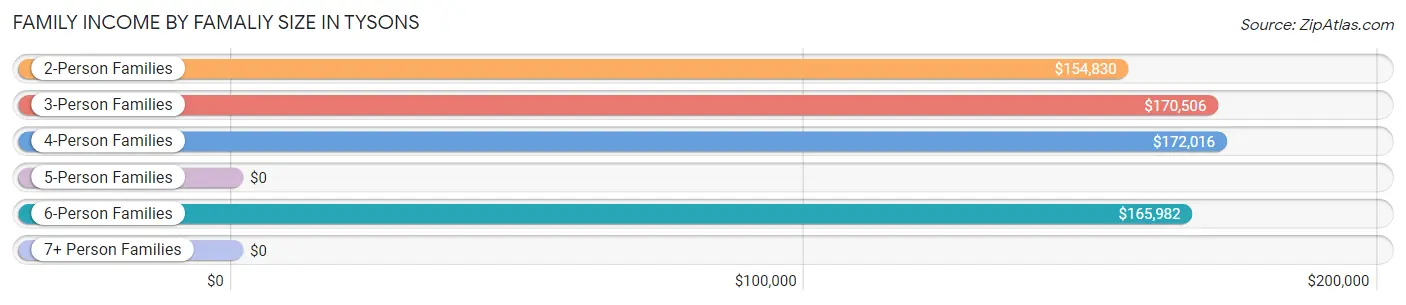
| Income Bracket | # Families | Median Income |
| 2-Person Families | 3,266 (49.1%) | $154,830 |
| 3-Person Families | 1,863 (28.0%) | $170,506 |
| 4-Person Families | 1,186 (17.8%) | $172,016 |
| 5-Person Families | 298 (4.5%) | $0 |
| 6-Person Families | 25 (0.4%) | $165,982 |
| 7+ Person Families | 8 (0.1%) | $0 |
| Total | 6,646 (100.0%) | $157,611 |
Family Income by Number of Earners in Tysons
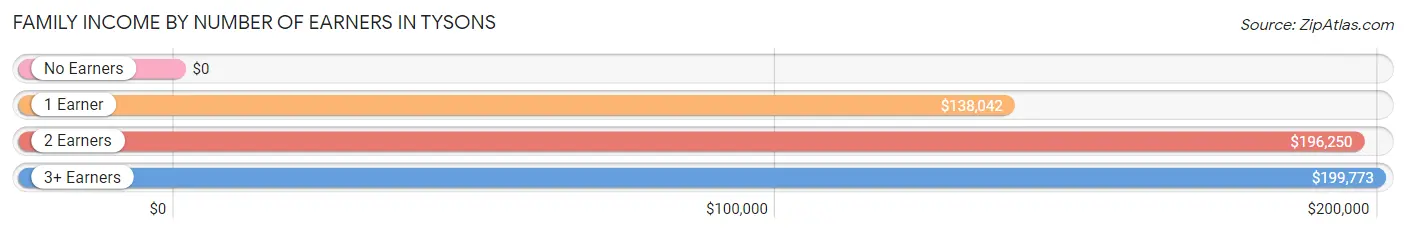
| Number of Earners | # Families | Median Income |
| No Earners | 543 (8.2%) | $0 |
| 1 Earner | 2,245 (33.8%) | $138,042 |
| 2 Earners | 3,412 (51.3%) | $196,250 |
| 3+ Earners | 446 (6.7%) | $199,773 |
| Total | 6,646 (100.0%) | $157,611 |
Household Income in Tysons
Household Income Brackets in Tysons
With 3,495 households falling in the category, the $200,000+ income range is the most frequent in Tysons, accounting for 25.9% of all households. In contrast, only 256 households (1.9%) fall into the $10,000 to $14,999 income bracket, making it the least populous group.
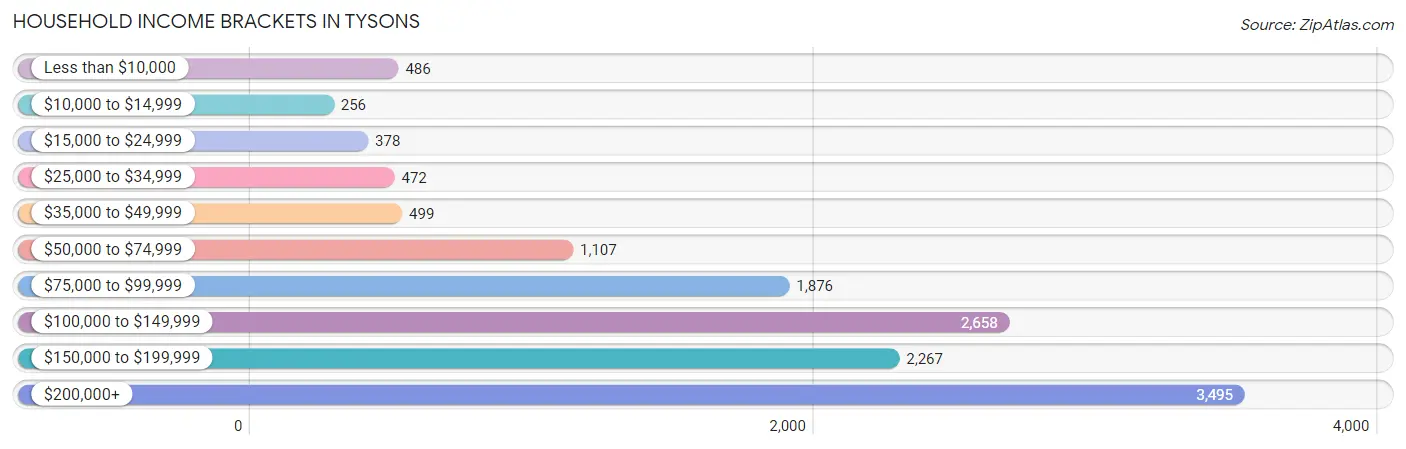
| Income Bracket | # Households | % Households |
| Less than $10,000 | 486 | 3.6% |
| $10,000 to $14,999 | 256 | 1.9% |
| $15,000 to $24,999 | 378 | 2.8% |
| $25,000 to $34,999 | 472 | 3.5% |
| $35,000 to $49,999 | 499 | 3.7% |
| $50,000 to $74,999 | 1,107 | 8.2% |
| $75,000 to $99,999 | 1,876 | 13.9% |
| $100,000 to $149,999 | 2,658 | 19.7% |
| $150,000 to $199,999 | 2,267 | 16.8% |
| $200,000+ | 3,495 | 25.9% |
Household Income by Householder Age in Tysons
The median household income in Tysons is $129,468, with the highest median household income of $152,107 found in the 45 to 64 years age bracket for the primary householder. A total of 4,103 households (30.4%) fall into this category. Meanwhile, the 65+ years age bracket for the primary householder has the lowest median household income of $83,295, with 2,514 households (18.6%) in this group.
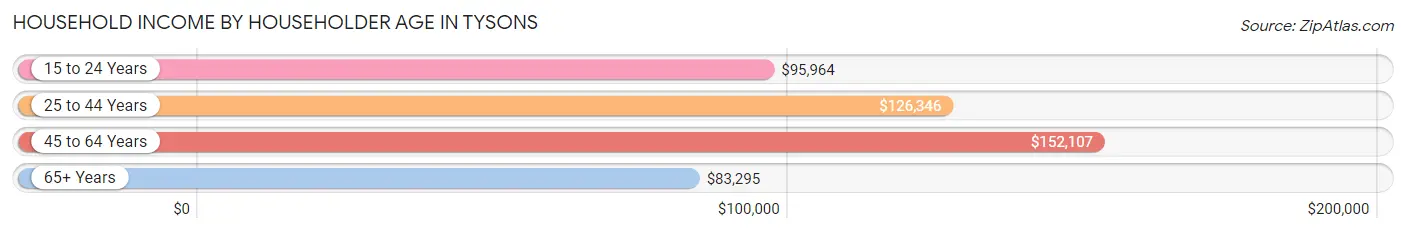
| Income Bracket | # Households | Median Income |
| 15 to 24 Years | 803 (5.9%) | $95,964 |
| 25 to 44 Years | 6,074 (45.0%) | $126,346 |
| 45 to 64 Years | 4,103 (30.4%) | $152,107 |
| 65+ Years | 2,514 (18.6%) | $83,295 |
| Total | 13,494 (100.0%) | $129,468 |
Poverty in Tysons
Income Below Poverty by Sex and Age in Tysons
With 5.3% poverty level for males and 8.3% for females among the residents of Tysons, 5 year old males and 75 year old and over females are the most vulnerable to poverty, with 23 males (20.3%) and 261 females (23.5%) in their respective age groups living below the poverty level.
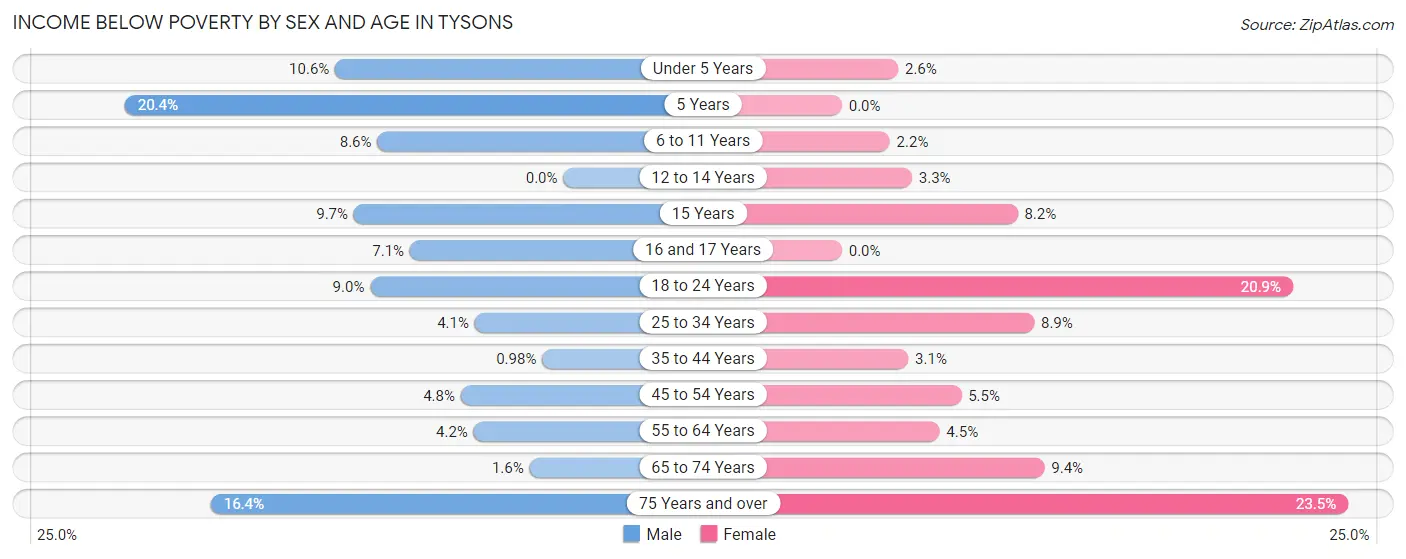
| Age Bracket | Male | Female |
| Under 5 Years | 77 (10.6%) | 13 (2.6%) |
| 5 Years | 23 (20.3%) | 0 (0.0%) |
| 6 to 11 Years | 76 (8.6%) | 16 (2.2%) |
| 12 to 14 Years | 0 (0.0%) | 12 (3.3%) |
| 15 Years | 14 (9.7%) | 11 (8.2%) |
| 16 and 17 Years | 20 (7.1%) | 0 (0.0%) |
| 18 to 24 Years | 121 (9.0%) | 224 (20.9%) |
| 25 to 34 Years | 125 (4.1%) | 271 (8.9%) |
| 35 to 44 Years | 22 (1.0%) | 64 (3.1%) |
| 45 to 54 Years | 82 (4.8%) | 111 (5.5%) |
| 55 to 64 Years | 58 (4.2%) | 64 (4.5%) |
| 65 to 74 Years | 13 (1.6%) | 96 (9.4%) |
| 75 Years and over | 106 (16.4%) | 261 (23.5%) |
| Total | 737 (5.3%) | 1,143 (8.3%) |
Income Above Poverty by Sex and Age in Tysons
According to the poverty statistics in Tysons, males aged 12 to 14 years and females aged 5 years are the age groups that are most secure financially, with 100.0% of males and 100.0% of females in these age groups living above the poverty line.
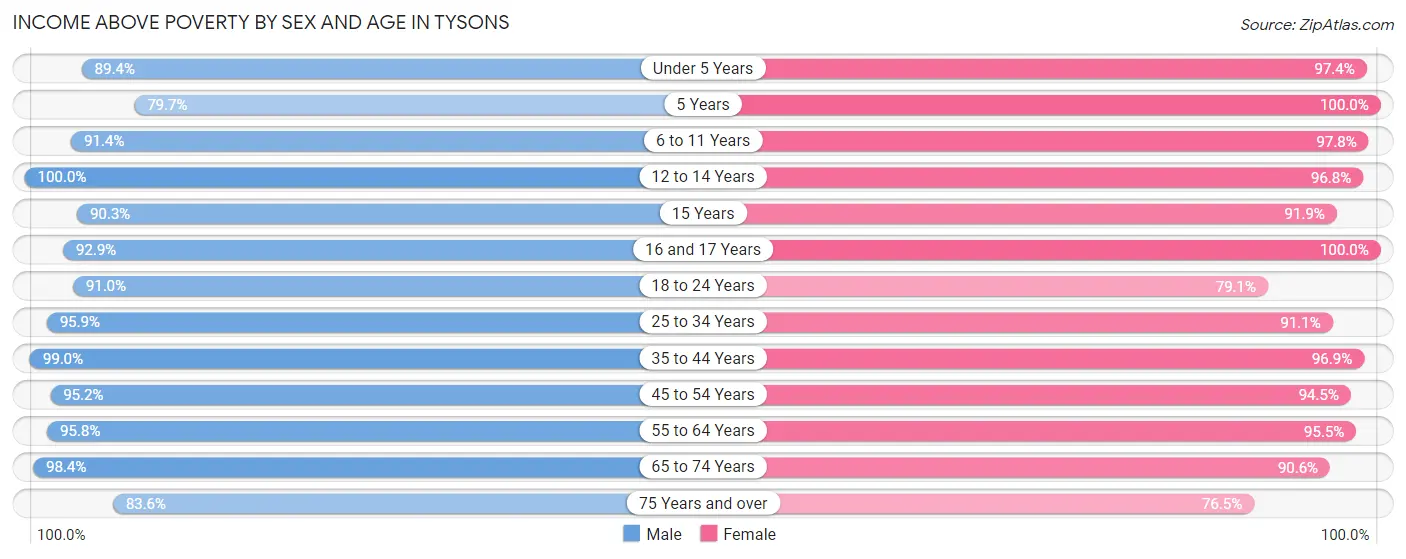
| Age Bracket | Male | Female |
| Under 5 Years | 650 (89.4%) | 485 (97.4%) |
| 5 Years | 90 (79.6%) | 135 (100.0%) |
| 6 to 11 Years | 805 (91.4%) | 706 (97.8%) |
| 12 to 14 Years | 437 (100.0%) | 357 (96.8%) |
| 15 Years | 130 (90.3%) | 124 (91.8%) |
| 16 and 17 Years | 261 (92.9%) | 172 (100.0%) |
| 18 to 24 Years | 1,229 (91.0%) | 846 (79.1%) |
| 25 to 34 Years | 2,919 (95.9%) | 2,768 (91.1%) |
| 35 to 44 Years | 2,223 (99.0%) | 2,012 (96.9%) |
| 45 to 54 Years | 1,642 (95.2%) | 1,892 (94.5%) |
| 55 to 64 Years | 1,336 (95.8%) | 1,350 (95.5%) |
| 65 to 74 Years | 817 (98.4%) | 925 (90.6%) |
| 75 Years and over | 542 (83.6%) | 850 (76.5%) |
| Total | 13,081 (94.7%) | 12,622 (91.7%) |
Income Below Poverty Among Married-Couple Families in Tysons
The poverty statistics for married-couple families in Tysons show that 2.3% or 127 of the total 5,531 families live below the poverty line. Families with 3 or 4 children have the highest poverty rate of 5.0%, comprising of 9 families. On the other hand, families with 1 or 2 children have the lowest poverty rate of 1.8%, which includes 42 families.
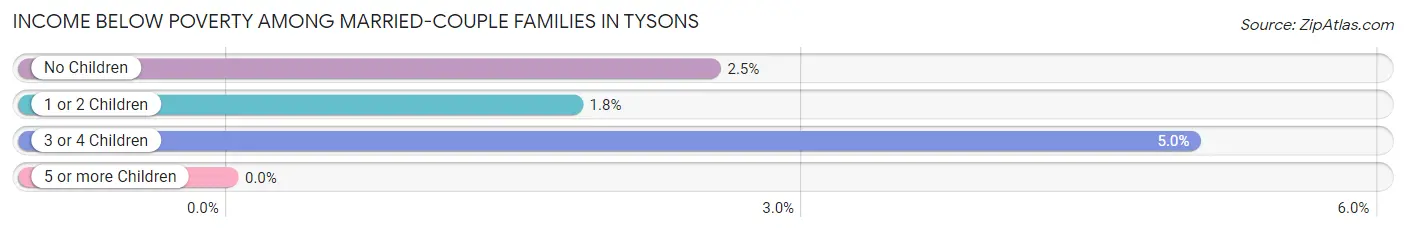
| Children | Above Poverty | Below Poverty |
| No Children | 2,941 (97.5%) | 76 (2.5%) |
| 1 or 2 Children | 2,293 (98.2%) | 42 (1.8%) |
| 3 or 4 Children | 170 (95.0%) | 9 (5.0%) |
| 5 or more Children | 0 (0.0%) | 0 (0.0%) |
| Total | 5,404 (97.7%) | 127 (2.3%) |
Income Below Poverty Among Single-Parent Households in Tysons
According to the poverty data in Tysons, 11.3% or 44 single-father households and 17.1% or 124 single-mother households are living below the poverty line. Among single-father households, those with no children have the highest poverty rate, with 30 households (26.1%) experiencing poverty. Likewise, among single-mother households, those with 1 or 2 children have the highest poverty rate, with 85 households (23.7%) falling below the poverty line.
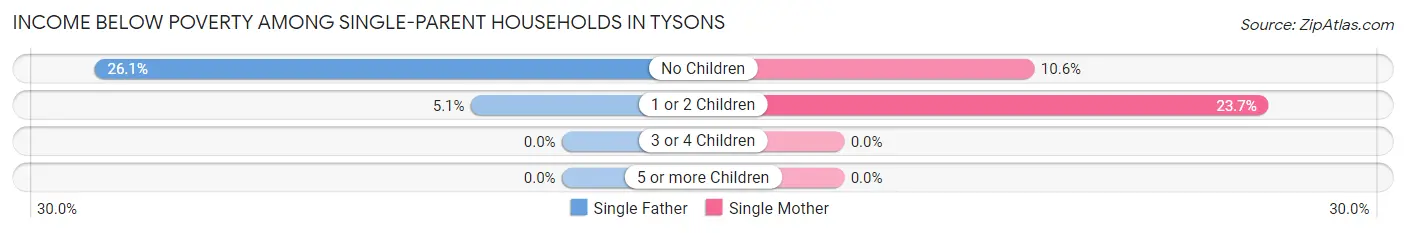
| Children | Single Father | Single Mother |
| No Children | 30 (26.1%) | 39 (10.6%) |
| 1 or 2 Children | 14 (5.1%) | 85 (23.7%) |
| 3 or 4 Children | 0 (0.0%) | 0 (0.0%) |
| 5 or more Children | 0 (0.0%) | 0 (0.0%) |
| Total | 44 (11.3%) | 124 (17.1%) |
Income Below Poverty Among Married-Couple vs Single-Parent Households in Tysons
The poverty data for Tysons shows that 127 of the married-couple family households (2.3%) and 168 of the single-parent households (15.1%) are living below the poverty level. Within the married-couple family households, those with 3 or 4 children have the highest poverty rate, with 9 households (5.0%) falling below the poverty line. Among the single-parent households, those with 1 or 2 children have the highest poverty rate, with 99 household (15.6%) living below poverty.
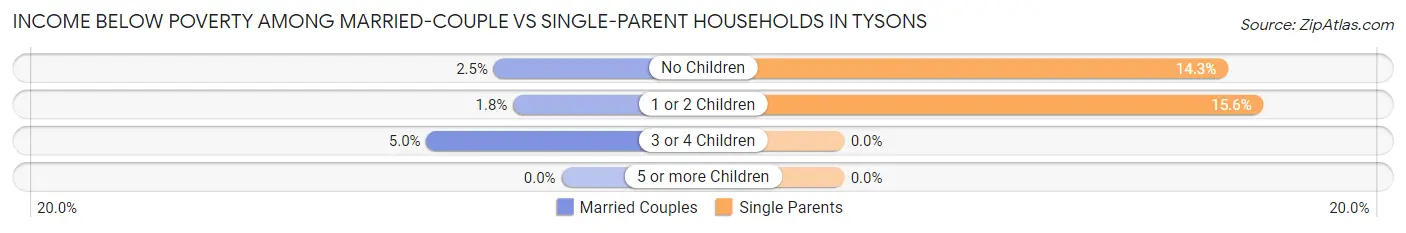
| Children | Married-Couple Families | Single-Parent Households |
| No Children | 76 (2.5%) | 69 (14.3%) |
| 1 or 2 Children | 42 (1.8%) | 99 (15.6%) |
| 3 or 4 Children | 9 (5.0%) | 0 (0.0%) |
| 5 or more Children | 0 (0.0%) | 0 (0.0%) |
| Total | 127 (2.3%) | 168 (15.1%) |
Race in Tysons
The most populous races in Tysons are White / Caucasian (13,416 | 48.6%), Asian (8,261 | 29.9%), and Hispanic or Latino (3,734 | 13.5%).
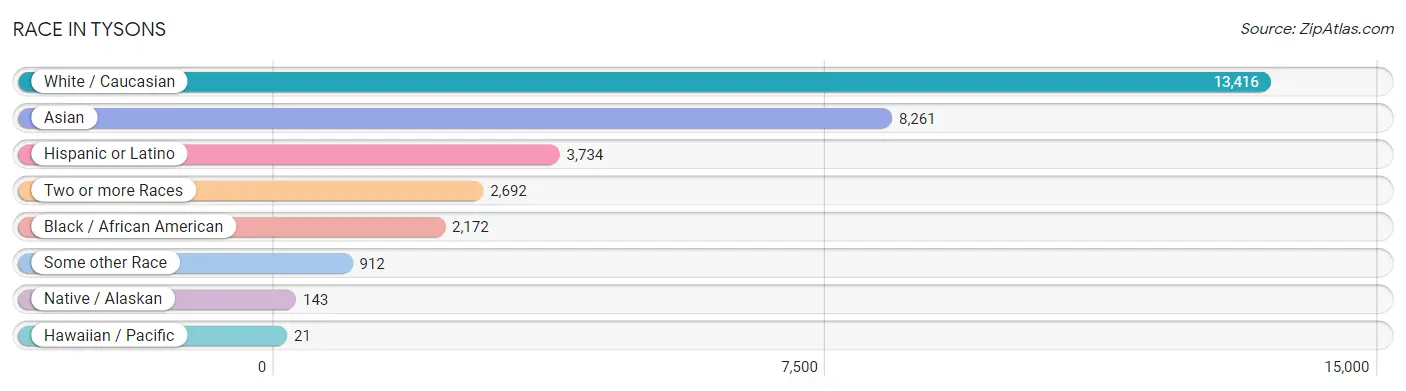
| Race | # Population | % Population |
| Asian | 8,261 | 29.9% |
| Black / African American | 2,172 | 7.9% |
| Hawaiian / Pacific | 21 | 0.1% |
| Hispanic or Latino | 3,734 | 13.5% |
| Native / Alaskan | 143 | 0.5% |
| White / Caucasian | 13,416 | 48.6% |
| Two or more Races | 2,692 | 9.8% |
| Some other Race | 912 | 3.3% |
| Total | 27,617 | 100.0% |
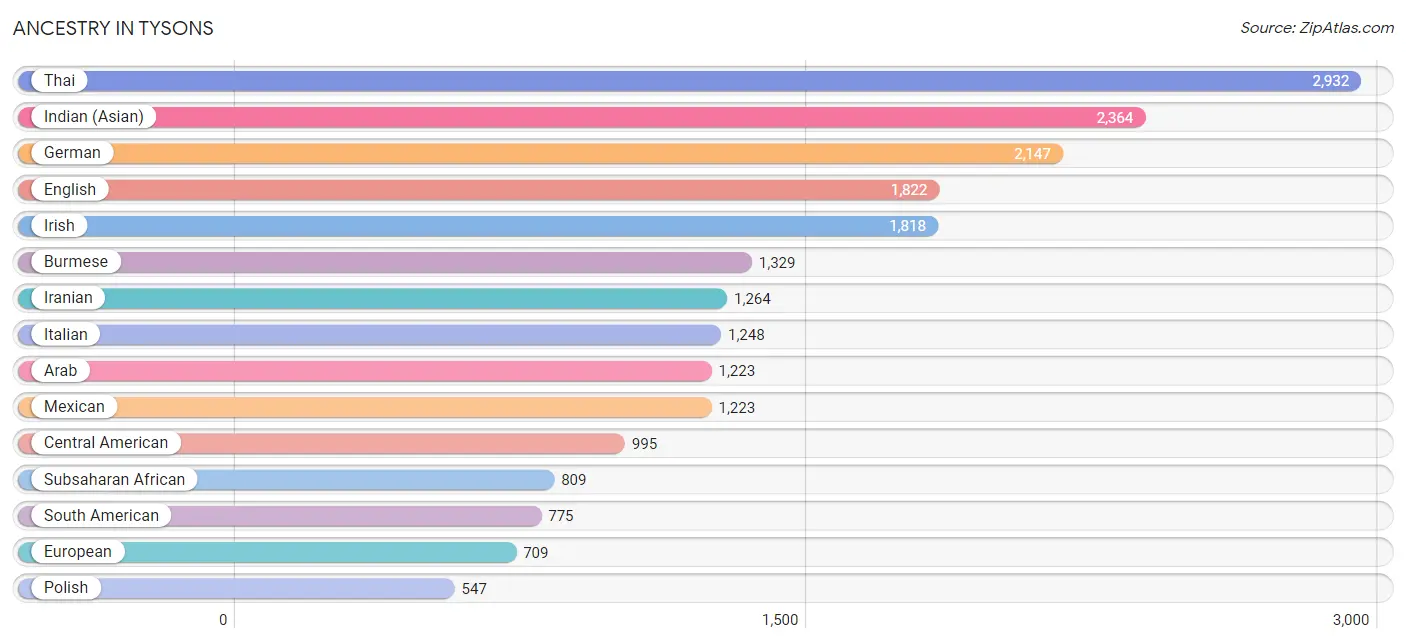
Ancestry in Tysons
The most populous ancestries reported in Tysons are Thai (2,932 | 10.6%), Indian (Asian) (2,364 | 8.6%), German (2,147 | 7.8%), English (1,822 | 6.6%), and Irish (1,818 | 6.6%), together accounting for 40.1% of all Tysons residents.
| Ancestry | # Population | % Population |
| Afghan | 82 | 0.3% |
| African | 1 | 0.0% |
| American | 489 | 1.8% |
| Arab | 1,223 | 4.4% |
| Argentinean | 48 | 0.2% |
| Armenian | 309 | 1.1% |
| Assyrian / Chaldean / Syriac | 6 | 0.0% |
| Australian | 20 | 0.1% |
| Austrian | 167 | 0.6% |
| Belgian | 23 | 0.1% |
| Bhutanese | 287 | 1.0% |
| Bolivian | 9 | 0.0% |
| Brazilian | 61 | 0.2% |
| British | 78 | 0.3% |
| Bulgarian | 46 | 0.2% |
| Burmese | 1,329 | 4.8% |
| Cajun | 37 | 0.1% |
| Canadian | 63 | 0.2% |
| Cape Verdean | 7 | 0.0% |
| Celtic | 8 | 0.0% |
| Central American | 995 | 3.6% |
| Central American Indian | 27 | 0.1% |
| Chilean | 86 | 0.3% |
| Colombian | 200 | 0.7% |
| Costa Rican | 39 | 0.1% |
| Croatian | 100 | 0.4% |
| Cuban | 54 | 0.2% |
| Czech | 72 | 0.3% |
| Czechoslovakian | 10 | 0.0% |
| Danish | 7 | 0.0% |
| Dominican | 55 | 0.2% |
| Dutch | 225 | 0.8% |
| Eastern European | 140 | 0.5% |
| Ecuadorian | 162 | 0.6% |
| Egyptian | 273 | 1.0% |
| English | 1,822 | 6.6% |
| Ethiopian | 220 | 0.8% |
| European | 709 | 2.6% |
| Filipino | 122 | 0.4% |
| Finnish | 10 | 0.0% |
| French | 200 | 0.7% |
| French Canadian | 78 | 0.3% |
| German | 2,147 | 7.8% |
| Greek | 252 | 0.9% |
| Guamanian / Chamorro | 21 | 0.1% |
| Guatemalan | 78 | 0.3% |
| Guyanese | 6 | 0.0% |
| Haitian | 27 | 0.1% |
| Honduran | 31 | 0.1% |
| Hungarian | 54 | 0.2% |
| Icelander | 7 | 0.0% |
| Indian (Asian) | 2,364 | 8.6% |
| Indonesian | 12 | 0.0% |
| Iranian | 1,264 | 4.6% |
| Iraqi | 99 | 0.4% |
| Irish | 1,818 | 6.6% |
| Italian | 1,248 | 4.5% |
| Jamaican | 338 | 1.2% |
| Japanese | 23 | 0.1% |
| Jordanian | 65 | 0.2% |
| Kenyan | 32 | 0.1% |
| Korean | 387 | 1.4% |
| Laotian | 45 | 0.2% |
| Latvian | 36 | 0.1% |
| Lebanese | 115 | 0.4% |
| Lithuanian | 102 | 0.4% |
| Malaysian | 104 | 0.4% |
| Mexican | 1,223 | 4.4% |
| Moroccan | 16 | 0.1% |
| Native Hawaiian | 18 | 0.1% |
| Nicaraguan | 47 | 0.2% |
| Nigerian | 366 | 1.3% |
| Northern European | 22 | 0.1% |
| Norwegian | 152 | 0.5% |
| Pakistani | 158 | 0.6% |
| Palestinian | 331 | 1.2% |
| Panamanian | 312 | 1.1% |
| Paraguayan | 65 | 0.2% |
| Peruvian | 173 | 0.6% |
| Polish | 547 | 2.0% |
| Portuguese | 53 | 0.2% |
| Puerto Rican | 376 | 1.4% |
| Romanian | 35 | 0.1% |
| Russian | 423 | 1.5% |
| Salvadoran | 488 | 1.8% |
| Scandinavian | 25 | 0.1% |
| Scotch-Irish | 95 | 0.3% |
| Scottish | 451 | 1.6% |
| Serbian | 71 | 0.3% |
| Slavic | 3 | 0.0% |
| Slovak | 225 | 0.8% |
| Somali | 70 | 0.3% |
| South African | 21 | 0.1% |
| South American | 775 | 2.8% |
| South American Indian | 28 | 0.1% |
| Spaniard | 103 | 0.4% |
| Spanish | 13 | 0.1% |
| Sri Lankan | 431 | 1.6% |
| Subsaharan African | 809 | 2.9% |
| Sudanese | 53 | 0.2% |
| Swedish | 236 | 0.9% |
| Swiss | 14 | 0.1% |
| Thai | 2,932 | 10.6% |
| Trinidadian and Tobagonian | 41 | 0.2% |
| Turkish | 202 | 0.7% |
| Ukrainian | 94 | 0.3% |
| Uruguayan | 26 | 0.1% |
| Venezuelan | 6 | 0.0% |
| Vietnamese | 34 | 0.1% |
| Welsh | 218 | 0.8% |
| West Indian | 27 | 0.1% |
| Zimbabwean | 39 | 0.1% | View All 112 Rows |
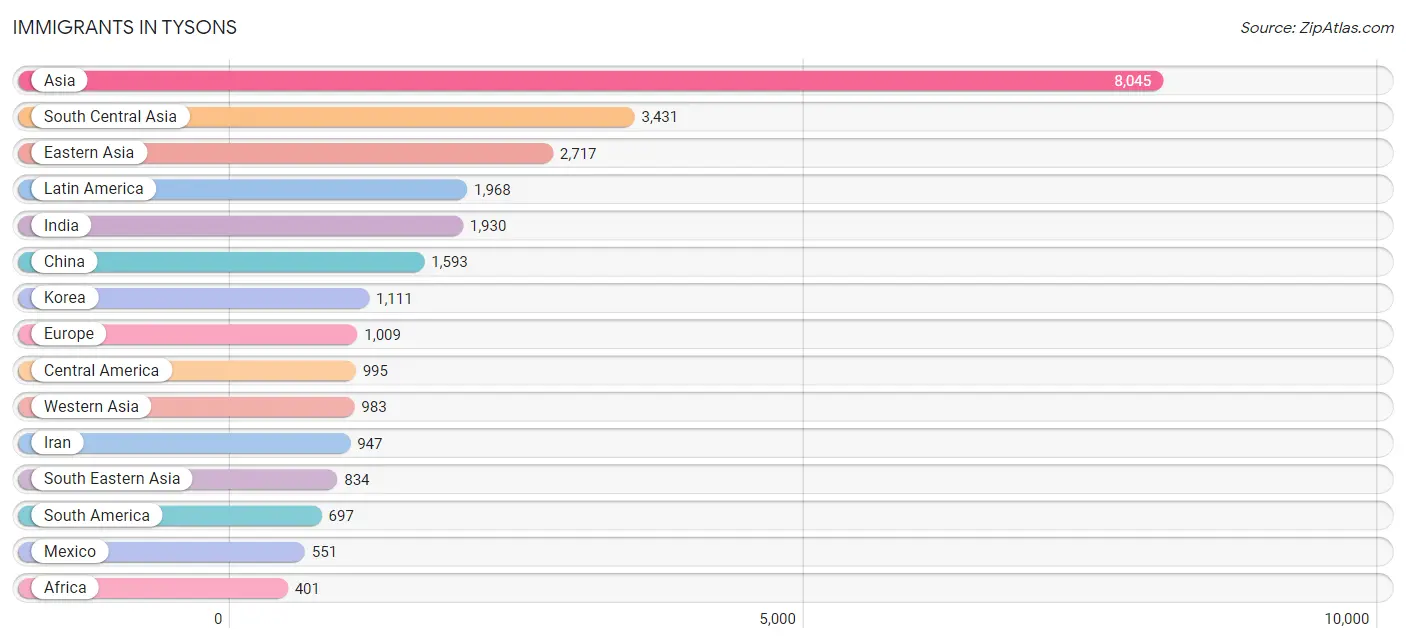
Immigrants in Tysons
The most numerous immigrant groups reported in Tysons came from Asia (8,045 | 29.1%), South Central Asia (3,431 | 12.4%), Eastern Asia (2,717 | 9.8%), Latin America (1,968 | 7.1%), and India (1,930 | 7.0%), together accounting for 65.5% of all Tysons residents.
| Immigration Origin | # Population | % Population |
| Afghanistan | 82 | 0.3% |
| Africa | 401 | 1.5% |
| Argentina | 20 | 0.1% |
| Armenia | 111 | 0.4% |
| Asia | 8,045 | 29.1% |
| Australia | 20 | 0.1% |
| Bangladesh | 68 | 0.3% |
| Barbados | 27 | 0.1% |
| Belarus | 13 | 0.1% |
| Bolivia | 75 | 0.3% |
| Brazil | 35 | 0.1% |
| Cambodia | 8 | 0.0% |
| Canada | 25 | 0.1% |
| Caribbean | 276 | 1.0% |
| Central America | 995 | 3.6% |
| Chile | 108 | 0.4% |
| China | 1,593 | 5.8% |
| Colombia | 141 | 0.5% |
| Croatia | 11 | 0.0% |
| Cuba | 35 | 0.1% |
| Czechoslovakia | 31 | 0.1% |
| Dominican Republic | 16 | 0.1% |
| Eastern Africa | 216 | 0.8% |
| Eastern Asia | 2,717 | 9.8% |
| Eastern Europe | 378 | 1.4% |
| Ecuador | 92 | 0.3% |
| Egypt | 81 | 0.3% |
| El Salvador | 219 | 0.8% |
| England | 118 | 0.4% |
| Eritrea | 56 | 0.2% |
| Ethiopia | 50 | 0.2% |
| Europe | 1,009 | 3.6% |
| France | 8 | 0.0% |
| Germany | 66 | 0.2% |
| Greece | 25 | 0.1% |
| Guatemala | 37 | 0.1% |
| Haiti | 68 | 0.3% |
| Honduras | 31 | 0.1% |
| Hong Kong | 67 | 0.2% |
| India | 1,930 | 7.0% |
| Iran | 947 | 3.4% |
| Iraq | 63 | 0.2% |
| Ireland | 23 | 0.1% |
| Israel | 34 | 0.1% |
| Italy | 207 | 0.7% |
| Jamaica | 89 | 0.3% |
| Japan | 13 | 0.1% |
| Jordan | 30 | 0.1% |
| Kazakhstan | 64 | 0.2% |
| Kenya | 71 | 0.3% |
| Korea | 1,111 | 4.0% |
| Kuwait | 159 | 0.6% |
| Laos | 107 | 0.4% |
| Latin America | 1,968 | 7.1% |
| Latvia | 28 | 0.1% |
| Lebanon | 99 | 0.4% |
| Malaysia | 118 | 0.4% |
| Mexico | 551 | 2.0% |
| Morocco | 33 | 0.1% |
| Nepal | 111 | 0.4% |
| Netherlands | 128 | 0.5% |
| Nicaragua | 30 | 0.1% |
| Nigeria | 18 | 0.1% |
| Northern Africa | 167 | 0.6% |
| Northern Europe | 176 | 0.6% |
| Oceania | 20 | 0.1% |
| Pakistan | 229 | 0.8% |
| Panama | 127 | 0.5% |
| Peru | 138 | 0.5% |
| Philippines | 167 | 0.6% |
| Poland | 94 | 0.3% |
| Portugal | 7 | 0.0% |
| Romania | 19 | 0.1% |
| Russia | 129 | 0.5% |
| Saudi Arabia | 269 | 1.0% |
| Serbia | 7 | 0.0% |
| Singapore | 18 | 0.1% |
| South America | 697 | 2.5% |
| South Central Asia | 3,431 | 12.4% |
| South Eastern Asia | 834 | 3.0% |
| Southern Europe | 253 | 0.9% |
| Spain | 14 | 0.1% |
| Sudan | 53 | 0.2% |
| Taiwan | 205 | 0.7% |
| Thailand | 151 | 0.5% |
| Trinidad and Tobago | 41 | 0.2% |
| Turkey | 210 | 0.8% |
| Ukraine | 11 | 0.0% |
| Uruguay | 52 | 0.2% |
| Venezuela | 6 | 0.0% |
| Vietnam | 253 | 0.9% |
| Western Africa | 18 | 0.1% |
| Western Asia | 983 | 3.6% |
| Western Europe | 202 | 0.7% |
| Zimbabwe | 39 | 0.1% | View All 95 Rows |
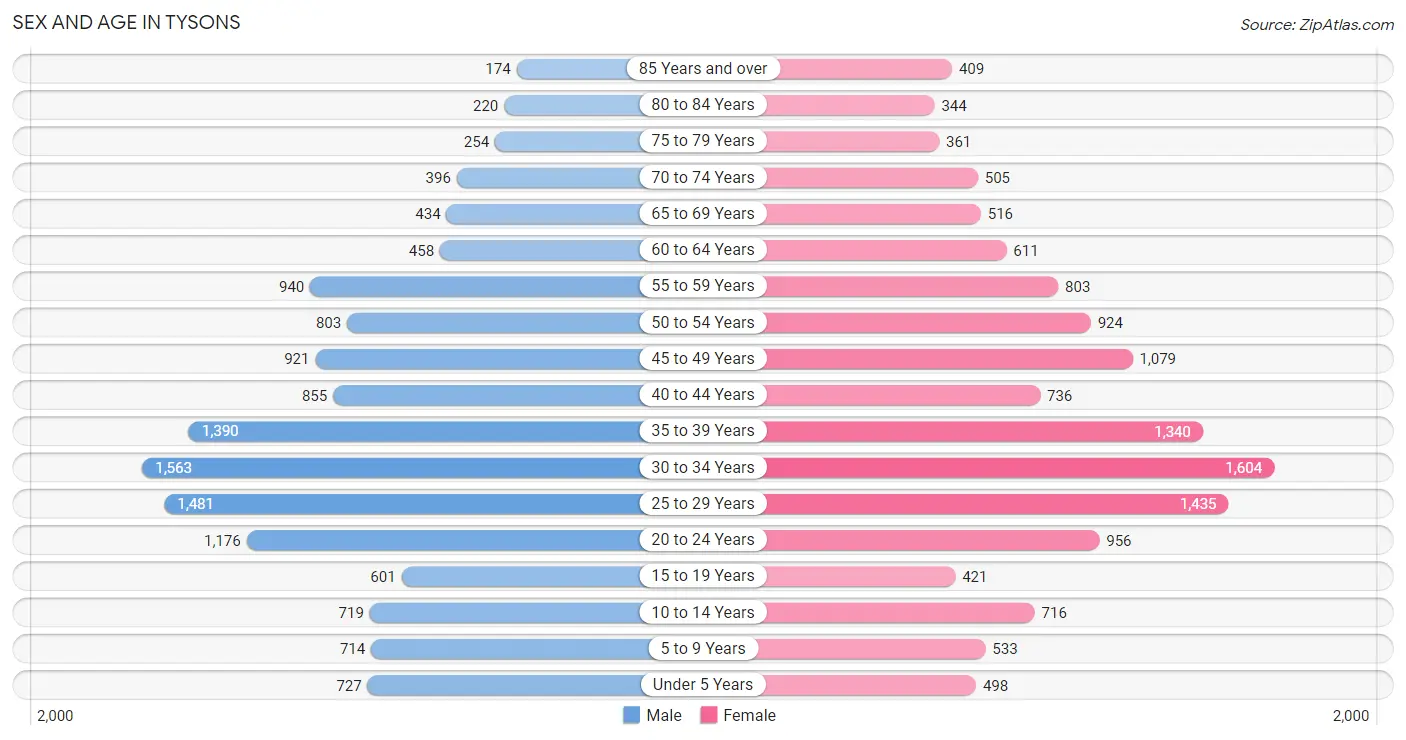
Sex and Age in Tysons
Sex and Age in Tysons
The most populous age groups in Tysons are 30 to 34 Years (1,563 | 11.3%) for men and 30 to 34 Years (1,604 | 11.6%) for women.
| Age Bracket | Male | Female |
| Under 5 Years | 727 (5.3%) | 498 (3.6%) |
| 5 to 9 Years | 714 (5.2%) | 533 (3.9%) |
| 10 to 14 Years | 719 (5.2%) | 716 (5.2%) |
| 15 to 19 Years | 601 (4.3%) | 421 (3.0%) |
| 20 to 24 Years | 1,176 (8.5%) | 956 (6.9%) |
| 25 to 29 Years | 1,481 (10.7%) | 1,435 (10.4%) |
| 30 to 34 Years | 1,563 (11.3%) | 1,604 (11.6%) |
| 35 to 39 Years | 1,390 (10.1%) | 1,340 (9.7%) |
| 40 to 44 Years | 855 (6.2%) | 736 (5.3%) |
| 45 to 49 Years | 921 (6.7%) | 1,079 (7.8%) |
| 50 to 54 Years | 803 (5.8%) | 924 (6.7%) |
| 55 to 59 Years | 940 (6.8%) | 803 (5.8%) |
| 60 to 64 Years | 458 (3.3%) | 611 (4.4%) |
| 65 to 69 Years | 434 (3.1%) | 516 (3.7%) |
| 70 to 74 Years | 396 (2.9%) | 505 (3.7%) |
| 75 to 79 Years | 254 (1.8%) | 361 (2.6%) |
| 80 to 84 Years | 220 (1.6%) | 344 (2.5%) |
| 85 Years and over | 174 (1.3%) | 409 (3.0%) |
| Total | 13,826 (100.0%) | 13,791 (100.0%) |
Families and Households in Tysons
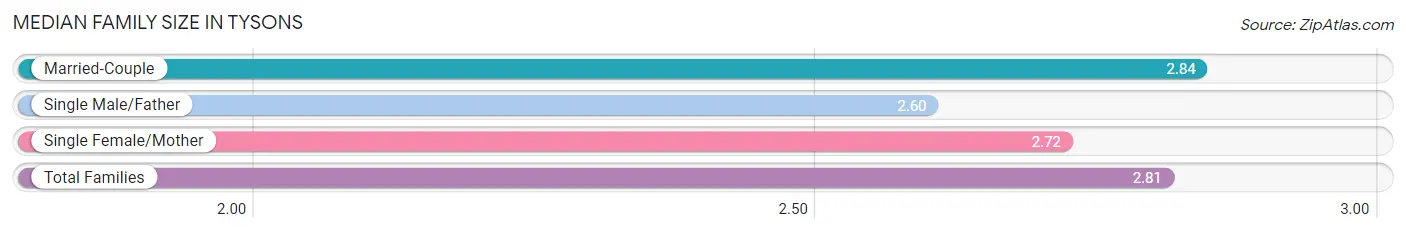
Median Family Size in Tysons
The median family size in Tysons is 2.81 persons per family, with married-couple families (5,531 | 83.2%) accounting for the largest median family size of 2.84 persons per family. On the other hand, single male/father families (390 | 5.9%) represent the smallest median family size with 2.60 persons per family.
| Family Type | # Families | Family Size |
| Married-Couple | 5,531 (83.2%) | 2.84 |
| Single Male/Father | 390 (5.9%) | 2.60 |
| Single Female/Mother | 725 (10.9%) | 2.72 |
| Total Families | 6,646 (100.0%) | 2.81 |
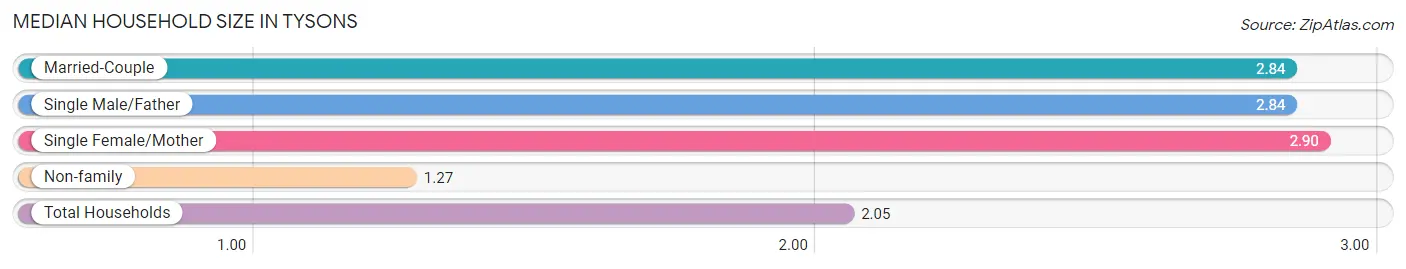
Median Household Size in Tysons
The median household size in Tysons is 2.05 persons per household, with single female/mother households (725 | 5.4%) accounting for the largest median household size of 2.9 persons per household. non-family households (6,848 | 50.7%) represent the smallest median household size with 1.27 persons per household.
| Household Type | # Households | Household Size |
| Married-Couple | 5,531 (41.0%) | 2.84 |
| Single Male/Father | 390 (2.9%) | 2.84 |
| Single Female/Mother | 725 (5.4%) | 2.90 |
| Non-family | 6,848 (50.7%) | 1.27 |
| Total Households | 13,494 (100.0%) | 2.05 |
Household Size by Marriage Status in Tysons
Out of a total of 13,494 households in Tysons, 6,646 (49.2%) are family households, while 6,848 (50.7%) are nonfamily households. The most numerous type of family households are 2-person households, comprising 3,184, and the most common type of nonfamily households are 1-person households, comprising 5,353.
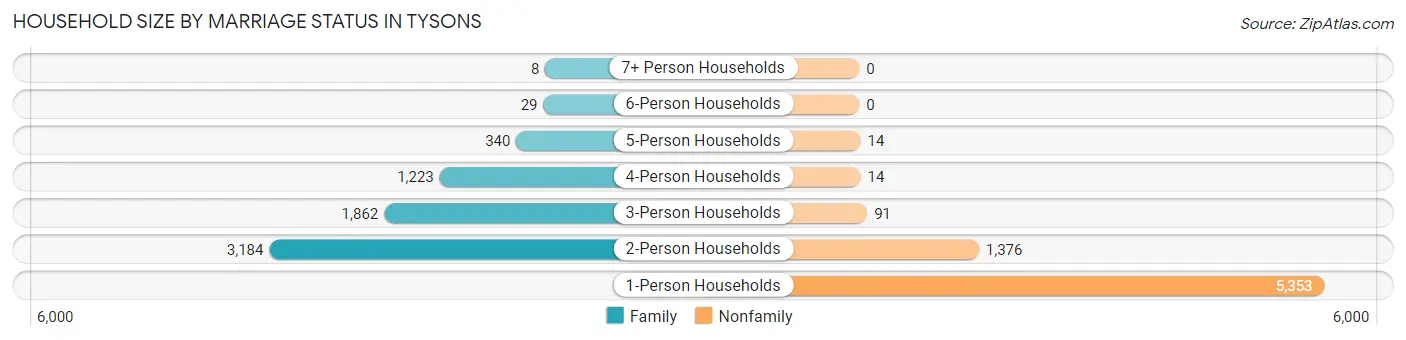
| Household Size | Family Households | Nonfamily Households |
| 1-Person Households | - | 5,353 (39.7%) |
| 2-Person Households | 3,184 (23.6%) | 1,376 (10.2%) |
| 3-Person Households | 1,862 (13.8%) | 91 (0.7%) |
| 4-Person Households | 1,223 (9.1%) | 14 (0.1%) |
| 5-Person Households | 340 (2.5%) | 14 (0.1%) |
| 6-Person Households | 29 (0.2%) | 0 (0.0%) |
| 7+ Person Households | 8 (0.1%) | 0 (0.0%) |
| Total | 6,646 (49.2%) | 6,848 (50.7%) |
Female Fertility in Tysons
Fertility by Age in Tysons
Average fertility rate in Tysons is 66.0 births per 1,000 women. Women in the age bracket of 20 to 34 years have the highest fertility rate with 95.0 births per 1,000 women. Women in the age bracket of 20 to 34 years acount for 74.2% of all women with births.
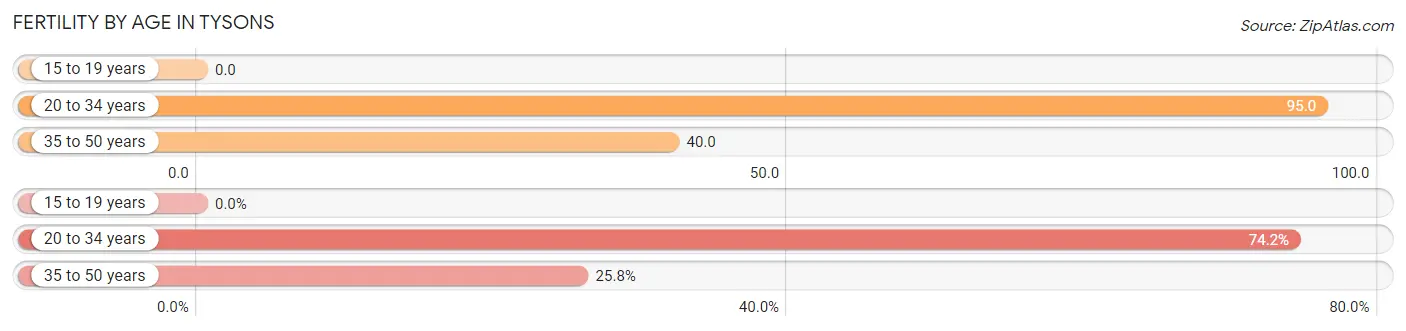
| Age Bracket | Women with Births | Births / 1,000 Women |
| 15 to 19 years | 0 (0.0%) | 0.0 |
| 20 to 34 years | 379 (74.2%) | 95.0 |
| 35 to 50 years | 132 (25.8%) | 40.0 |
| Total | 511 (100.0%) | 66.0 |
Fertility by Age by Marriage Status in Tysons
70.6% of women with births (511) in Tysons are married. The highest percentage of unmarried women with births falls into 20 to 34 years age bracket with 39.6% of them unmarried at the time of birth, while the lowest percentage of unmarried women with births belong to 35 to 50 years age bracket with 0.0% of them unmarried.
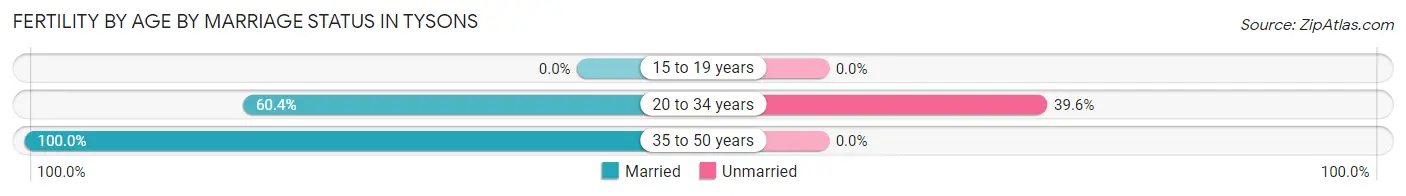
| Age Bracket | Married | Unmarried |
| 15 to 19 years | 0 (0.0%) | 0 (0.0%) |
| 20 to 34 years | 229 (60.4%) | 150 (39.6%) |
| 35 to 50 years | 132 (100.0%) | 0 (0.0%) |
| Total | 361 (70.7%) | 150 (29.3%) |
Fertility by Education in Tysons
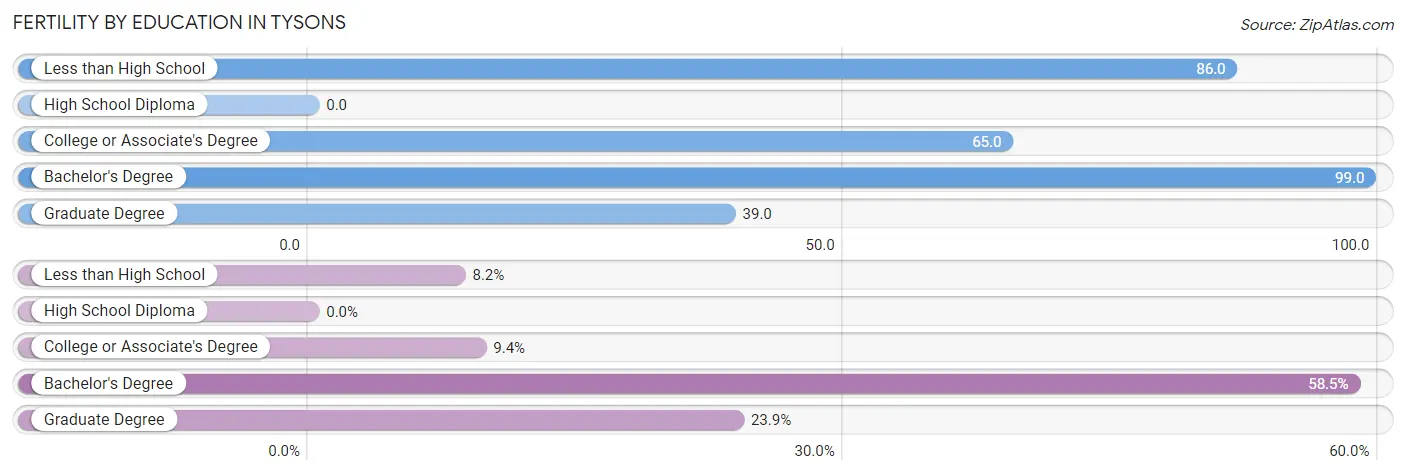
| Educational Attainment | Women with Births | Births / 1,000 Women |
| Less than High School | 42 (8.2%) | 86.0 |
| High School Diploma | 0 (0.0%) | 0.0 |
| College or Associate's Degree | 48 (9.4%) | 65.0 |
| Bachelor's Degree | 299 (58.5%) | 99.0 |
| Graduate Degree | 122 (23.9%) | 39.0 |
| Total | 511 (100.0%) | 66.0 |
Fertility by Education by Marriage Status in Tysons
29.3% of women with births in Tysons are unmarried. Women with the educational attainment of graduate degree are most likely to be married with 100.0% of them married at childbirth, while women with the educational attainment of less than high school are least likely to be married with 100.0% of them unmarried at childbirth.
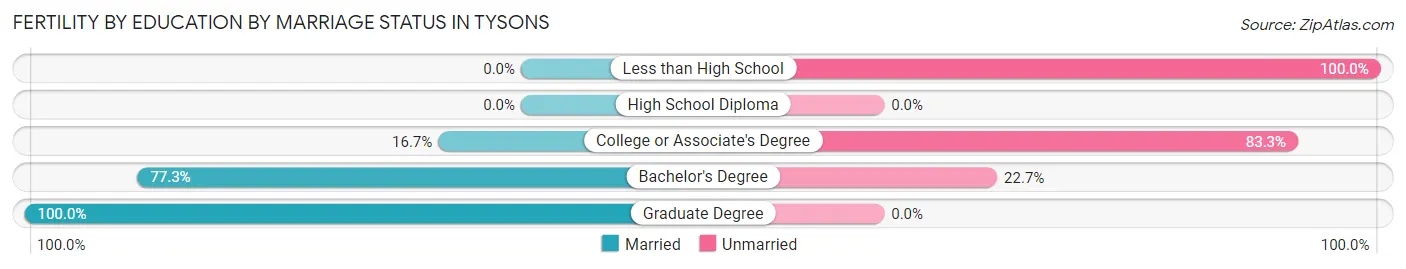
| Educational Attainment | Married | Unmarried |
| Less than High School | 0 (0.0%) | 42 (100.0%) |
| High School Diploma | 0 (0.0%) | 0 (0.0%) |
| College or Associate's Degree | 8 (16.7%) | 40 (83.3%) |
| Bachelor's Degree | 231 (77.3%) | 68 (22.7%) |
| Graduate Degree | 122 (100.0%) | 0 (0.0%) |
| Total | 361 (70.7%) | 150 (29.3%) |
Employment Characteristics in Tysons
Employment by Class of Employer in Tysons
Among the 16,753 employed individuals in Tysons, private company employees (10,925 | 65.2%), federal government employees (2,171 | 13.0%), and not-for-profit organizations (1,734 | 10.3%) make up the most common classes of employment.
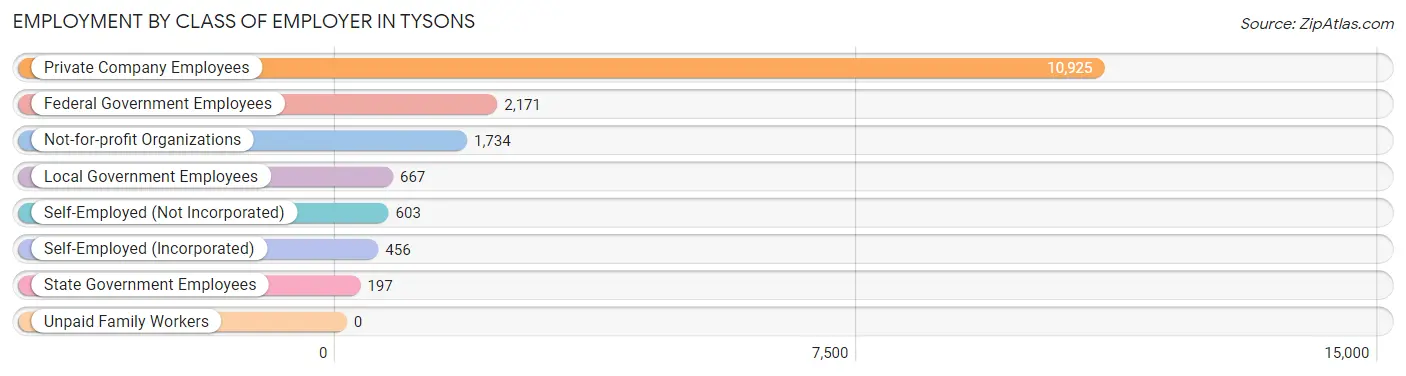
| Employer Class | # Employees | % Employees |
| Private Company Employees | 10,925 | 65.2% |
| Self-Employed (Incorporated) | 456 | 2.7% |
| Self-Employed (Not Incorporated) | 603 | 3.6% |
| Not-for-profit Organizations | 1,734 | 10.3% |
| Local Government Employees | 667 | 4.0% |
| State Government Employees | 197 | 1.2% |
| Federal Government Employees | 2,171 | 13.0% |
| Unpaid Family Workers | 0 | 0.0% |
| Total | 16,753 | 100.0% |
Employment Status by Age in Tysons
According to the labor force statistics for Tysons, out of the total population over 16 years of age (23,431), 76.3% or 17,878 individuals are in the labor force, with 5.0% or 894 of them unemployed. The age group with the highest labor force participation rate is 25 to 29 years, with 92.9% or 2,709 individuals in the labor force. Within the labor force, the 60 to 64 years age range has the highest percentage of unemployed individuals, with 12.8% or 106 of them being unemployed.
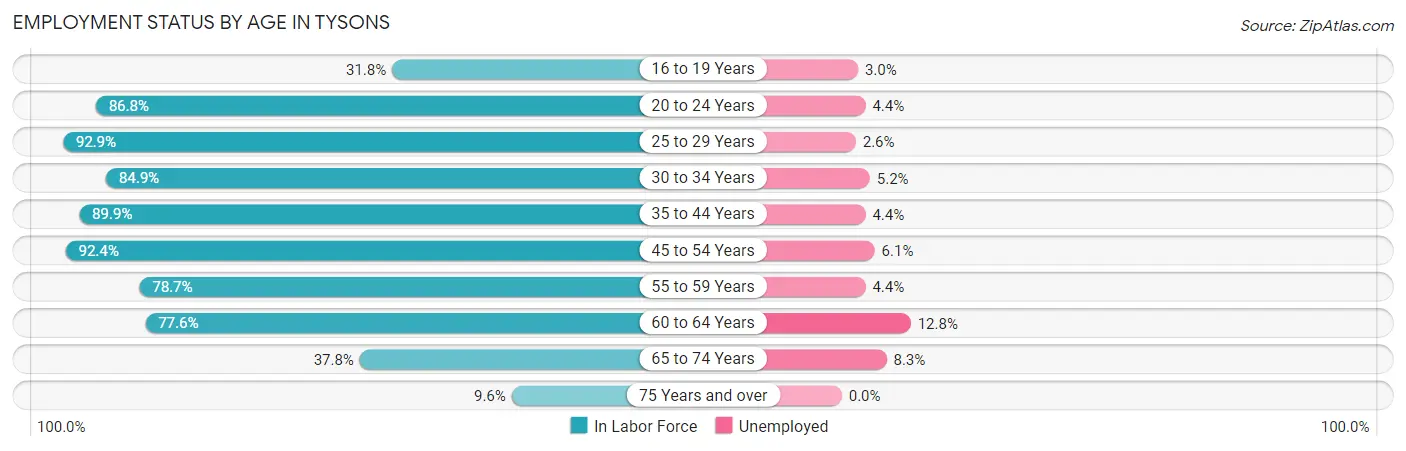
| Age Bracket | In Labor Force | Unemployed |
| 16 to 19 Years | 236 (31.8%) | 7 (3.0%) |
| 20 to 24 Years | 1,851 (86.8%) | 81 (4.4%) |
| 25 to 29 Years | 2,709 (92.9%) | 70 (2.6%) |
| 30 to 34 Years | 2,689 (84.9%) | 140 (5.2%) |
| 35 to 44 Years | 3,885 (89.9%) | 171 (4.4%) |
| 45 to 54 Years | 3,444 (92.4%) | 210 (6.1%) |
| 55 to 59 Years | 1,372 (78.7%) | 60 (4.4%) |
| 60 to 64 Years | 830 (77.6%) | 106 (12.8%) |
| 65 to 74 Years | 700 (37.8%) | 58 (8.3%) |
| 75 Years and over | 169 (9.6%) | 0 (0.0%) |
| Total | 17,878 (76.3%) | 894 (5.0%) |
Employment Status by Educational Attainment in Tysons
According to labor force statistics for Tysons, 88.1% of individuals (14,927) out of the total population between 25 and 64 years of age (16,943) are in the labor force, with 5.1% or 761 of them being unemployed. The group with the highest labor force participation rate are those with the educational attainment of bachelor's degree or higher, with 88.9% or 12,563 individuals in the labor force. Within the labor force, individuals with high school diploma education have the highest percentage of unemployment, with 32.4% or 180 of them being unemployed.
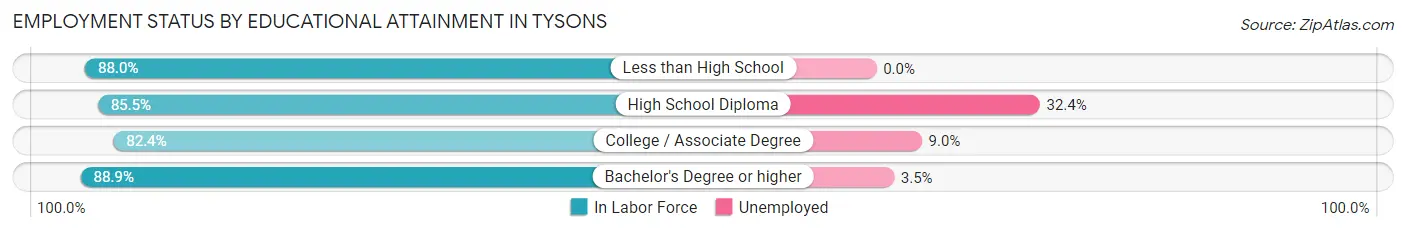
| Educational Attainment | In Labor Force | Unemployed |
| Less than High School | 315 (88.0%) | 0 (0.0%) |
| High School Diploma | 556 (85.5%) | 211 (32.4%) |
| College / Associate Degree | 1,486 (82.4%) | 162 (9.0%) |
| Bachelor's Degree or higher | 12,563 (88.9%) | 495 (3.5%) |
| Total | 14,927 (88.1%) | 864 (5.1%) |
Employment Occupations by Sex in Tysons
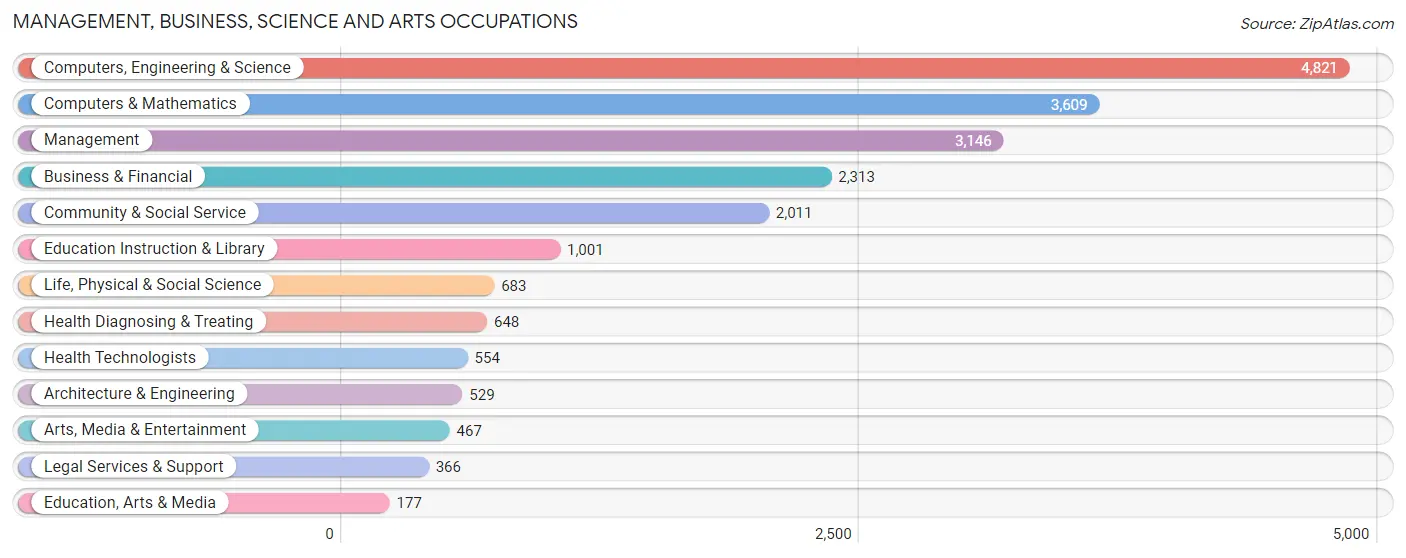
Management, Business, Science and Arts Occupations
The most common Management, Business, Science and Arts occupations in Tysons are Computers, Engineering & Science (4,821 | 28.5%), Computers & Mathematics (3,609 | 21.4%), Management (3,146 | 18.6%), Business & Financial (2,313 | 13.7%), and Community & Social Service (2,011 | 11.9%).
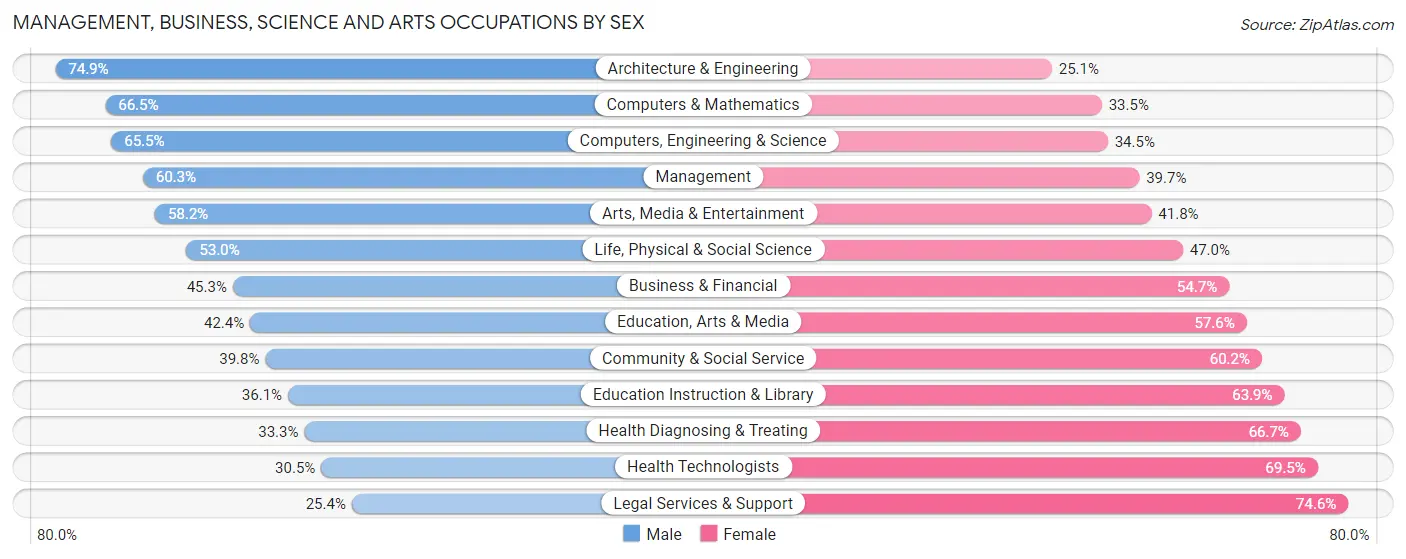
Management, Business, Science and Arts Occupations by Sex
Within the Management, Business, Science and Arts occupations in Tysons, the most male-oriented occupations are Architecture & Engineering (74.9%), Computers & Mathematics (66.5%), and Computers, Engineering & Science (65.5%), while the most female-oriented occupations are Legal Services & Support (74.6%), Health Technologists (69.5%), and Health Diagnosing & Treating (66.7%).
| Occupation | Male | Female |
| Management | 1,896 (60.3%) | 1,250 (39.7%) |
| Business & Financial | 1,047 (45.3%) | 1,266 (54.7%) |
| Computers, Engineering & Science | 3,159 (65.5%) | 1,662 (34.5%) |
| Computers & Mathematics | 2,401 (66.5%) | 1,208 (33.5%) |
| Architecture & Engineering | 396 (74.9%) | 133 (25.1%) |
| Life, Physical & Social Science | 362 (53.0%) | 321 (47.0%) |
| Community & Social Service | 801 (39.8%) | 1,210 (60.2%) |
| Education, Arts & Media | 75 (42.4%) | 102 (57.6%) |
| Legal Services & Support | 93 (25.4%) | 273 (74.6%) |
| Education Instruction & Library | 361 (36.1%) | 640 (63.9%) |
| Arts, Media & Entertainment | 272 (58.2%) | 195 (41.8%) |
| Health Diagnosing & Treating | 216 (33.3%) | 432 (66.7%) |
| Health Technologists | 169 (30.5%) | 385 (69.5%) |
| Total (Category) | 7,119 (55.0%) | 5,820 (45.0%) |
| Total (Overall) | 9,193 (54.4%) | 7,707 (45.6%) |
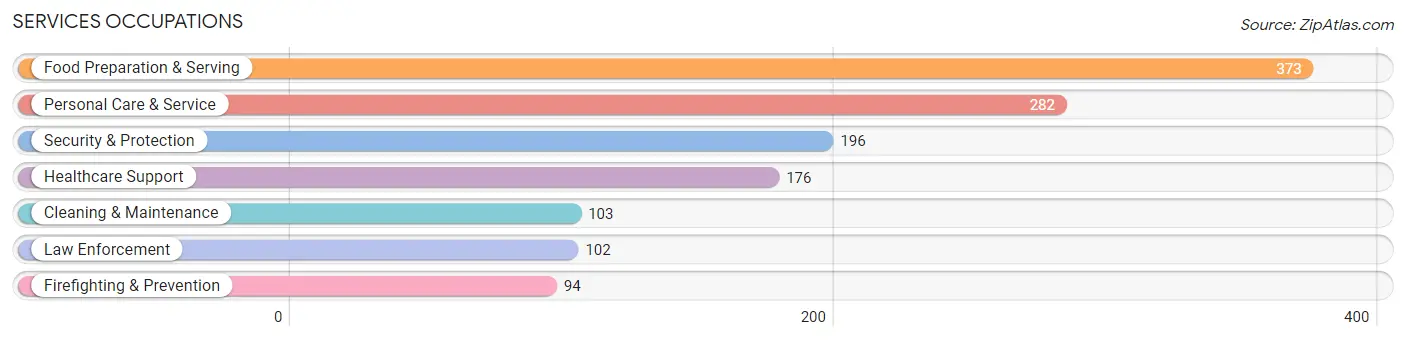
Services Occupations
The most common Services occupations in Tysons are Food Preparation & Serving (373 | 2.2%), Personal Care & Service (282 | 1.7%), Security & Protection (196 | 1.2%), Healthcare Support (176 | 1.0%), and Cleaning & Maintenance (103 | 0.6%).
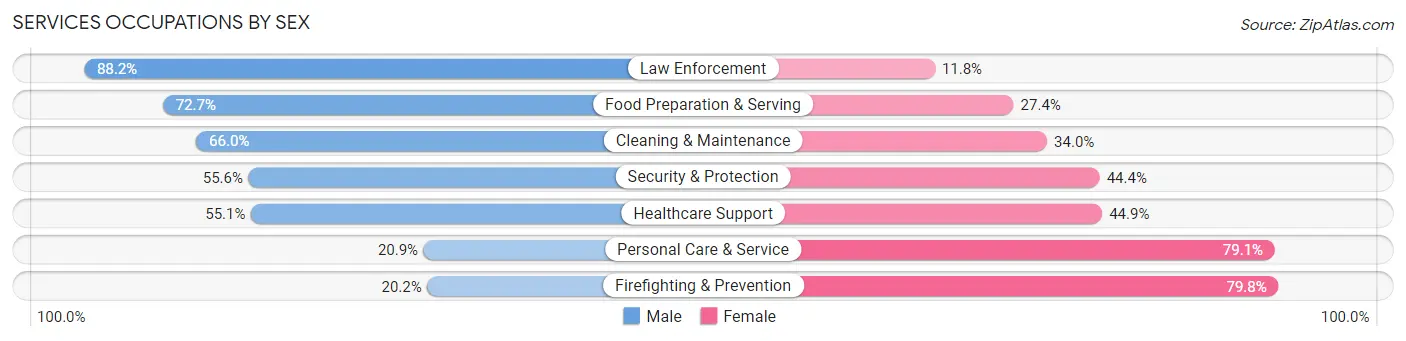
Services Occupations by Sex
Within the Services occupations in Tysons, the most male-oriented occupations are Law Enforcement (88.2%), Food Preparation & Serving (72.7%), and Cleaning & Maintenance (66.0%), while the most female-oriented occupations are Firefighting & Prevention (79.8%), Personal Care & Service (79.1%), and Healthcare Support (44.9%).
| Occupation | Male | Female |
| Healthcare Support | 97 (55.1%) | 79 (44.9%) |
| Security & Protection | 109 (55.6%) | 87 (44.4%) |
| Firefighting & Prevention | 19 (20.2%) | 75 (79.8%) |
| Law Enforcement | 90 (88.2%) | 12 (11.8%) |
| Food Preparation & Serving | 271 (72.7%) | 102 (27.4%) |
| Cleaning & Maintenance | 68 (66.0%) | 35 (34.0%) |
| Personal Care & Service | 59 (20.9%) | 223 (79.1%) |
| Total (Category) | 604 (53.4%) | 526 (46.6%) |
| Total (Overall) | 9,193 (54.4%) | 7,707 (45.6%) |
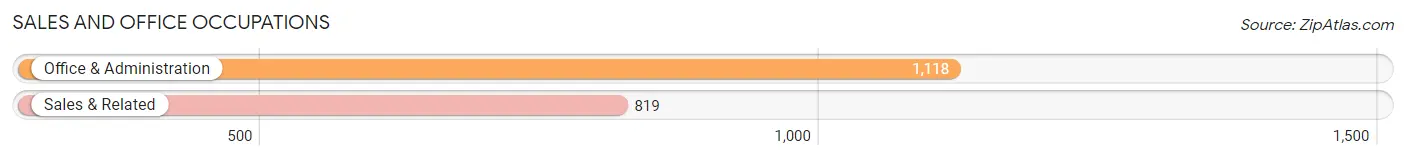
Sales and Office Occupations
The most common Sales and Office occupations in Tysons are Office & Administration (1,118 | 6.6%), and Sales & Related (819 | 4.9%).
Sales and Office Occupations by Sex
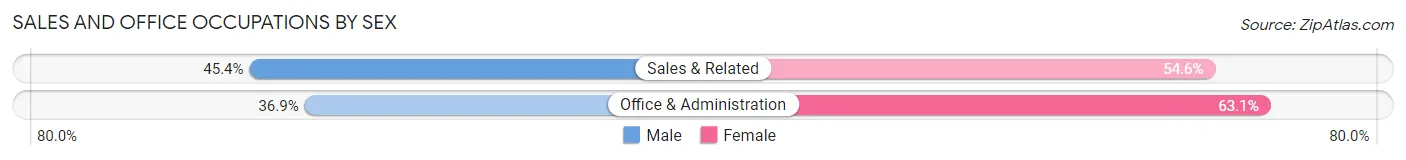
| Occupation | Male | Female |
| Sales & Related | 372 (45.4%) | 447 (54.6%) |
| Office & Administration | 413 (36.9%) | 705 (63.1%) |
| Total (Category) | 785 (40.5%) | 1,152 (59.5%) |
| Total (Overall) | 9,193 (54.4%) | 7,707 (45.6%) |
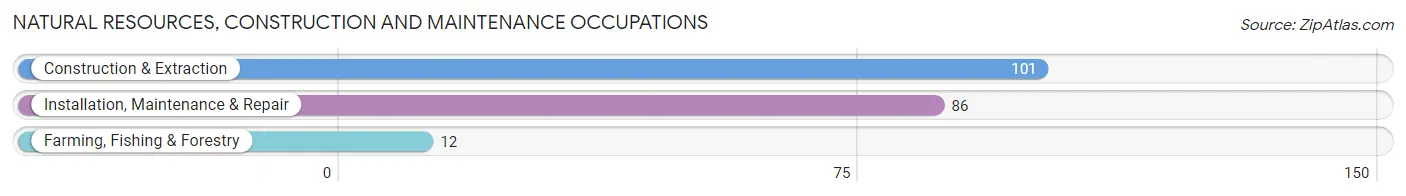
Natural Resources, Construction and Maintenance Occupations
The most common Natural Resources, Construction and Maintenance occupations in Tysons are Construction & Extraction (101 | 0.6%), Installation, Maintenance & Repair (86 | 0.5%), and Farming, Fishing & Forestry (12 | 0.1%).
Natural Resources, Construction and Maintenance Occupations by Sex
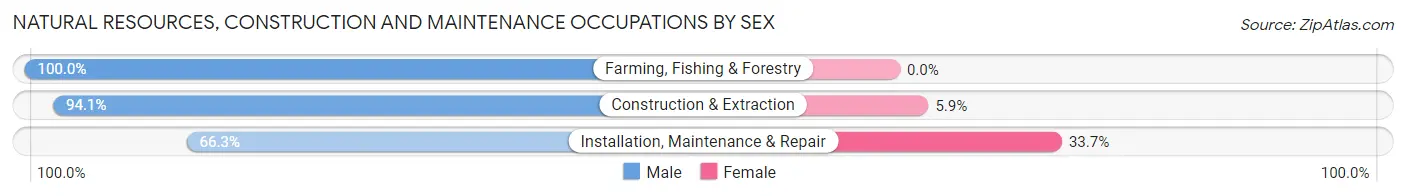
| Occupation | Male | Female |
| Farming, Fishing & Forestry | 12 (100.0%) | 0 (0.0%) |
| Construction & Extraction | 95 (94.1%) | 6 (5.9%) |
| Installation, Maintenance & Repair | 57 (66.3%) | 29 (33.7%) |
| Total (Category) | 164 (82.4%) | 35 (17.6%) |
| Total (Overall) | 9,193 (54.4%) | 7,707 (45.6%) |
Production, Transportation and Moving Occupations
The most common Production, Transportation and Moving occupations in Tysons are Transportation (291 | 1.7%), Material Moving (261 | 1.5%), and Production (143 | 0.9%).
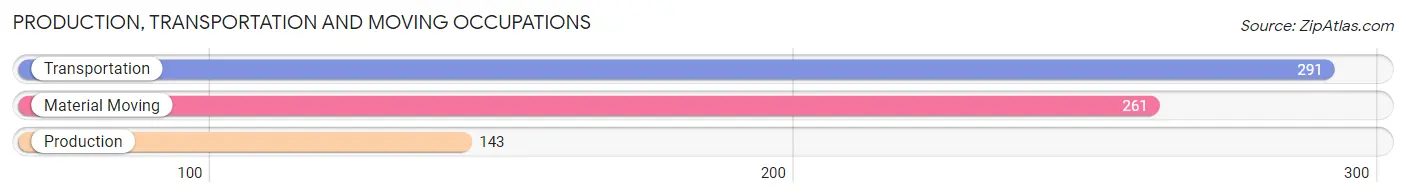
Production, Transportation and Moving Occupations by Sex
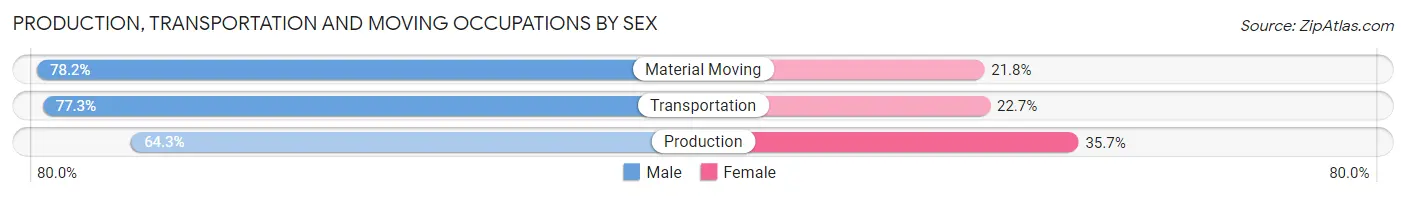
| Occupation | Male | Female |
| Production | 92 (64.3%) | 51 (35.7%) |
| Transportation | 225 (77.3%) | 66 (22.7%) |
| Material Moving | 204 (78.2%) | 57 (21.8%) |
| Total (Category) | 521 (75.0%) | 174 (25.0%) |
| Total (Overall) | 9,193 (54.4%) | 7,707 (45.6%) |
Employment Industries by Sex in Tysons
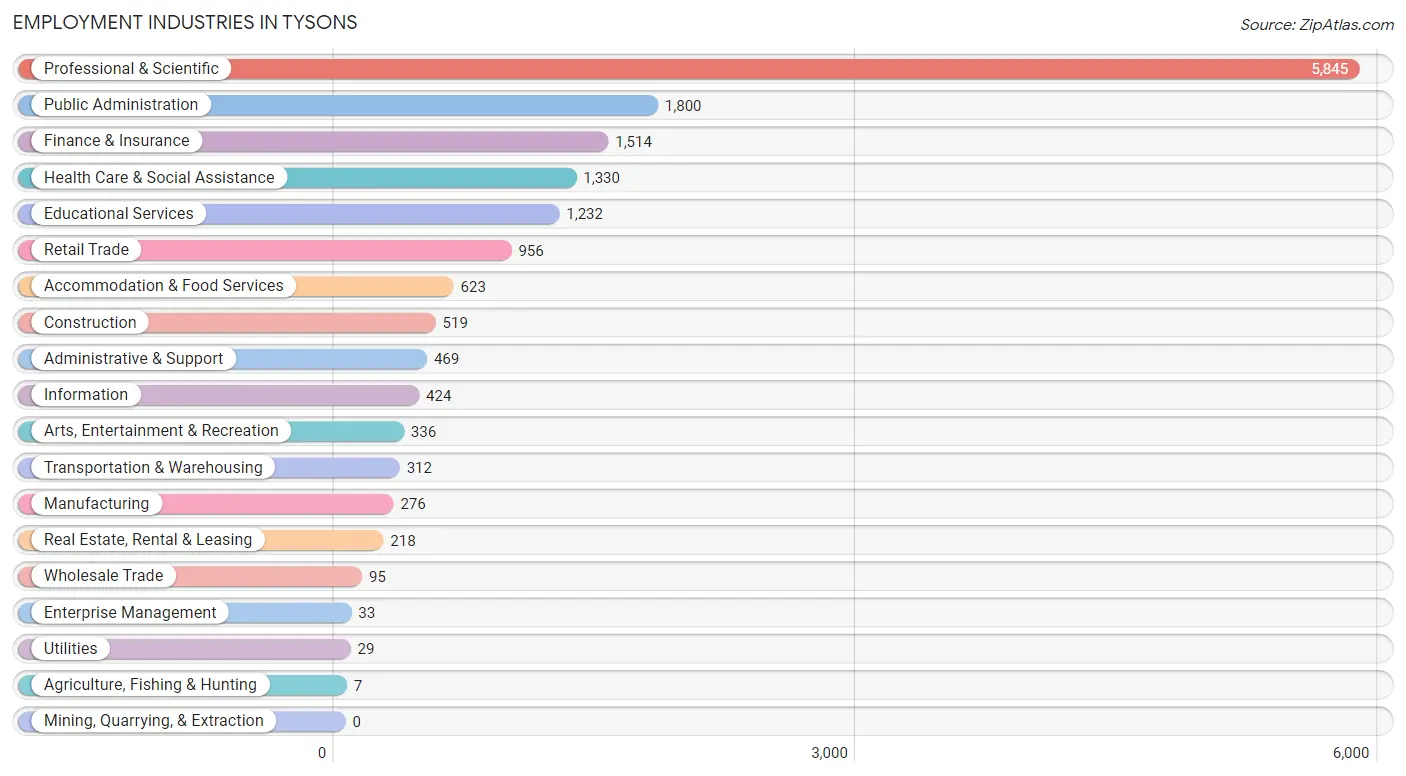
Employment Industries in Tysons
The major employment industries in Tysons include Professional & Scientific (5,845 | 34.6%), Public Administration (1,800 | 10.6%), Finance & Insurance (1,514 | 9.0%), Health Care & Social Assistance (1,330 | 7.9%), and Educational Services (1,232 | 7.3%).
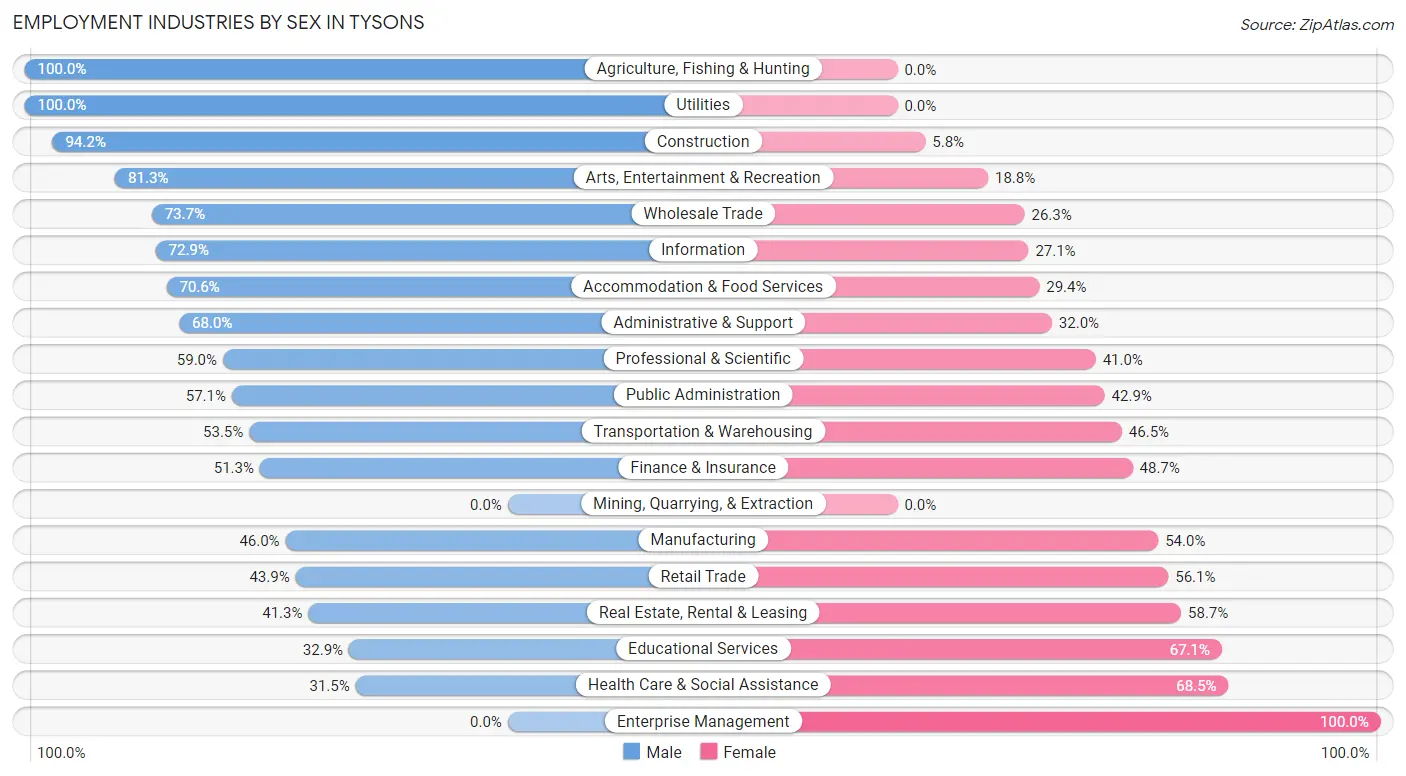
Employment Industries by Sex in Tysons
The Tysons industries that see more men than women are Agriculture, Fishing & Hunting (100.0%), Utilities (100.0%), and Construction (94.2%), whereas the industries that tend to have a higher number of women are Enterprise Management (100.0%), Health Care & Social Assistance (68.5%), and Educational Services (67.1%).
| Industry | Male | Female |
| Agriculture, Fishing & Hunting | 7 (100.0%) | 0 (0.0%) |
| Mining, Quarrying, & Extraction | 0 (0.0%) | 0 (0.0%) |
| Construction | 489 (94.2%) | 30 (5.8%) |
| Manufacturing | 127 (46.0%) | 149 (54.0%) |
| Wholesale Trade | 70 (73.7%) | 25 (26.3%) |
| Retail Trade | 420 (43.9%) | 536 (56.1%) |
| Transportation & Warehousing | 167 (53.5%) | 145 (46.5%) |
| Utilities | 29 (100.0%) | 0 (0.0%) |
| Information | 309 (72.9%) | 115 (27.1%) |
| Finance & Insurance | 777 (51.3%) | 737 (48.7%) |
| Real Estate, Rental & Leasing | 90 (41.3%) | 128 (58.7%) |
| Professional & Scientific | 3,446 (59.0%) | 2,399 (41.0%) |
| Enterprise Management | 0 (0.0%) | 33 (100.0%) |
| Administrative & Support | 319 (68.0%) | 150 (32.0%) |
| Educational Services | 405 (32.9%) | 827 (67.1%) |
| Health Care & Social Assistance | 419 (31.5%) | 911 (68.5%) |
| Arts, Entertainment & Recreation | 273 (81.2%) | 63 (18.8%) |
| Accommodation & Food Services | 440 (70.6%) | 183 (29.4%) |
| Public Administration | 1,028 (57.1%) | 772 (42.9%) |
| Total | 9,193 (54.4%) | 7,707 (45.6%) |
Education in Tysons
School Enrollment in Tysons
The most common levels of schooling among the 5,760 students in Tysons are middle school (1,214 | 21.1%), high school (1,093 | 19.0%), and elementary school (1,011 | 17.5%).
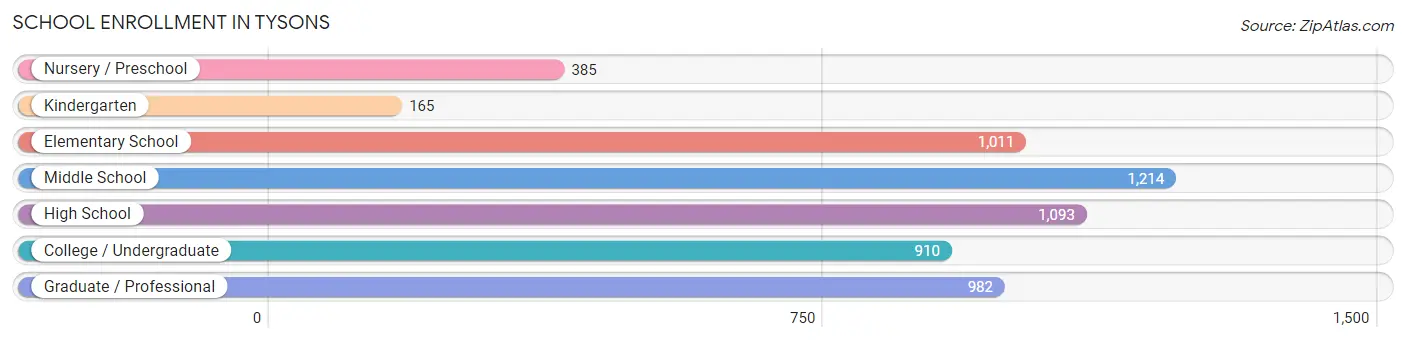
| School Level | # Students | % Students |
| Nursery / Preschool | 385 | 6.7% |
| Kindergarten | 165 | 2.9% |
| Elementary School | 1,011 | 17.5% |
| Middle School | 1,214 | 21.1% |
| High School | 1,093 | 19.0% |
| College / Undergraduate | 910 | 15.8% |
| Graduate / Professional | 982 | 17.1% |
| Total | 5,760 | 100.0% |
School Enrollment by Age by Funding Source in Tysons
Out of a total of 5,760 students who are enrolled in schools in Tysons, 1,440 (25.0%) attend a private institution, while the remaining 4,320 (75.0%) are enrolled in public schools. The age group of 3 to 4 year olds has the highest likelihood of being enrolled in private schools, with 293 (98.0% in the age bracket) enrolled. Conversely, the age group of 15 to 17 year olds has the lowest likelihood of being enrolled in a private school, with 657 (89.6% in the age bracket) attending a public institution.
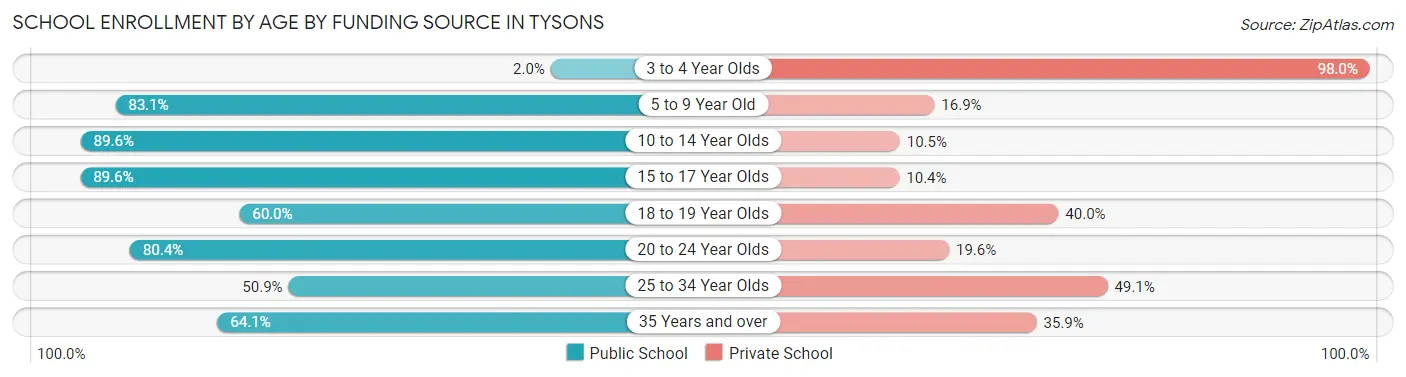
| Age Bracket | Public School | Private School |
| 3 to 4 Year Olds | 6 (2.0%) | 293 (98.0%) |
| 5 to 9 Year Old | 993 (83.1%) | 202 (16.9%) |
| 10 to 14 Year Olds | 1,260 (89.5%) | 147 (10.4%) |
| 15 to 17 Year Olds | 657 (89.6%) | 76 (10.4%) |
| 18 to 19 Year Olds | 153 (60.0%) | 102 (40.0%) |
| 20 to 24 Year Olds | 676 (80.4%) | 165 (19.6%) |
| 25 to 34 Year Olds | 327 (50.9%) | 316 (49.1%) |
| 35 Years and over | 248 (64.1%) | 139 (35.9%) |
| Total | 4,320 (75.0%) | 1,440 (25.0%) |
Educational Attainment by Field of Study in Tysons
Business (3,351 | 18.6%), engineering (2,733 | 15.2%), computers & mathematics (2,496 | 13.8%), social sciences (2,218 | 12.3%), and literature & languages (1,029 | 5.7%) are the most common fields of study among 18,031 individuals in Tysons who have obtained a bachelor's degree or higher.
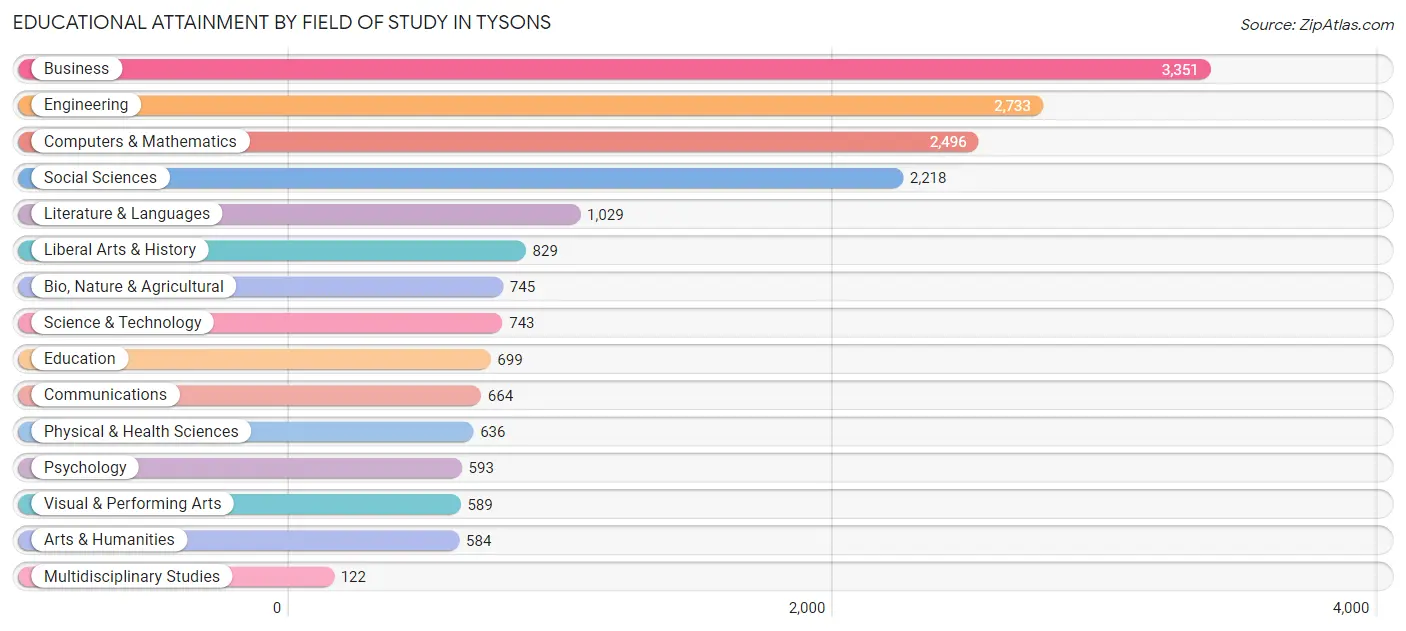
| Field of Study | # Graduates | % Graduates |
| Computers & Mathematics | 2,496 | 13.8% |
| Bio, Nature & Agricultural | 745 | 4.1% |
| Physical & Health Sciences | 636 | 3.5% |
| Psychology | 593 | 3.3% |
| Social Sciences | 2,218 | 12.3% |
| Engineering | 2,733 | 15.2% |
| Multidisciplinary Studies | 122 | 0.7% |
| Science & Technology | 743 | 4.1% |
| Business | 3,351 | 18.6% |
| Education | 699 | 3.9% |
| Literature & Languages | 1,029 | 5.7% |
| Liberal Arts & History | 829 | 4.6% |
| Visual & Performing Arts | 589 | 3.3% |
| Communications | 664 | 3.7% |
| Arts & Humanities | 584 | 3.2% |
| Total | 18,031 | 100.0% |
Transportation & Commute in Tysons
Vehicle Availability by Sex in Tysons
The most prevalent vehicle ownership categories in Tysons are males with 2 vehicles (4,045, accounting for 44.0%) and females with 2 vehicles (3,653, making up 53.6%).
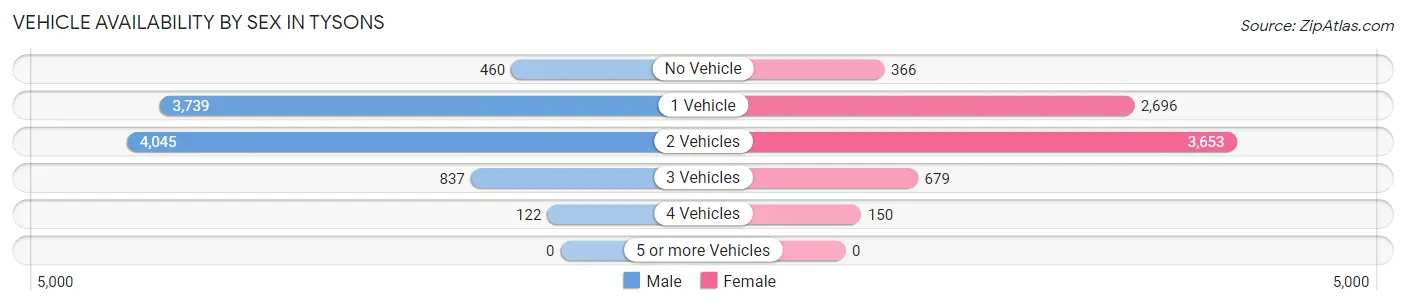
| Vehicles Available | Male | Female |
| No Vehicle | 460 (5.0%) | 366 (4.9%) |
| 1 Vehicle | 3,739 (40.6%) | 2,696 (35.7%) |
| 2 Vehicles | 4,045 (44.0%) | 3,653 (48.4%) |
| 3 Vehicles | 837 (9.1%) | 679 (9.0%) |
| 4 Vehicles | 122 (1.3%) | 150 (2.0%) |
| 5 or more Vehicles | 0 (0.0%) | 0 (0.0%) |
| Total | 9,203 (100.0%) | 7,544 (100.0%) |
Commute Time in Tysons
The most frequently occuring commute durations in Tysons are 30 to 34 minutes (2,164 commuters, 17.6%), 10 to 14 minutes (1,705 commuters, 13.9%), and 15 to 19 minutes (1,556 commuters, 12.7%).
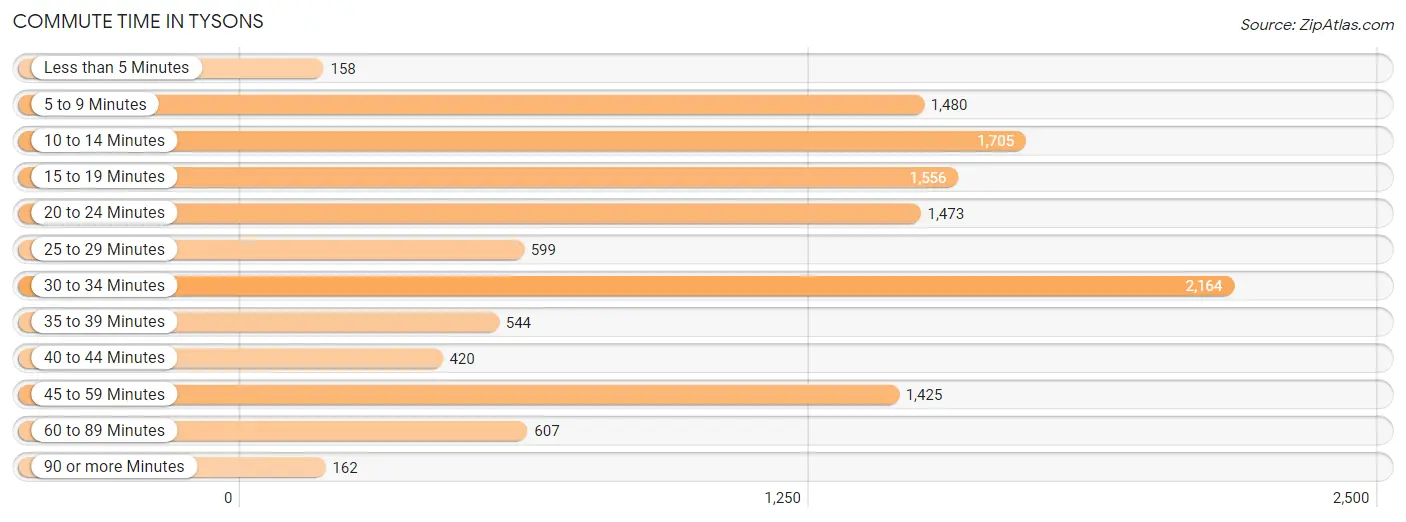
| Commute Time | # Commuters | % Commuters |
| Less than 5 Minutes | 158 | 1.3% |
| 5 to 9 Minutes | 1,480 | 12.0% |
| 10 to 14 Minutes | 1,705 | 13.9% |
| 15 to 19 Minutes | 1,556 | 12.7% |
| 20 to 24 Minutes | 1,473 | 12.0% |
| 25 to 29 Minutes | 599 | 4.9% |
| 30 to 34 Minutes | 2,164 | 17.6% |
| 35 to 39 Minutes | 544 | 4.4% |
| 40 to 44 Minutes | 420 | 3.4% |
| 45 to 59 Minutes | 1,425 | 11.6% |
| 60 to 89 Minutes | 607 | 4.9% |
| 90 or more Minutes | 162 | 1.3% |
Commute Time by Sex in Tysons
The most common commute times in Tysons are 30 to 34 minutes (1,284 commuters, 19.4%) for males and 15 to 19 minutes (906 commuters, 16.0%) for females.
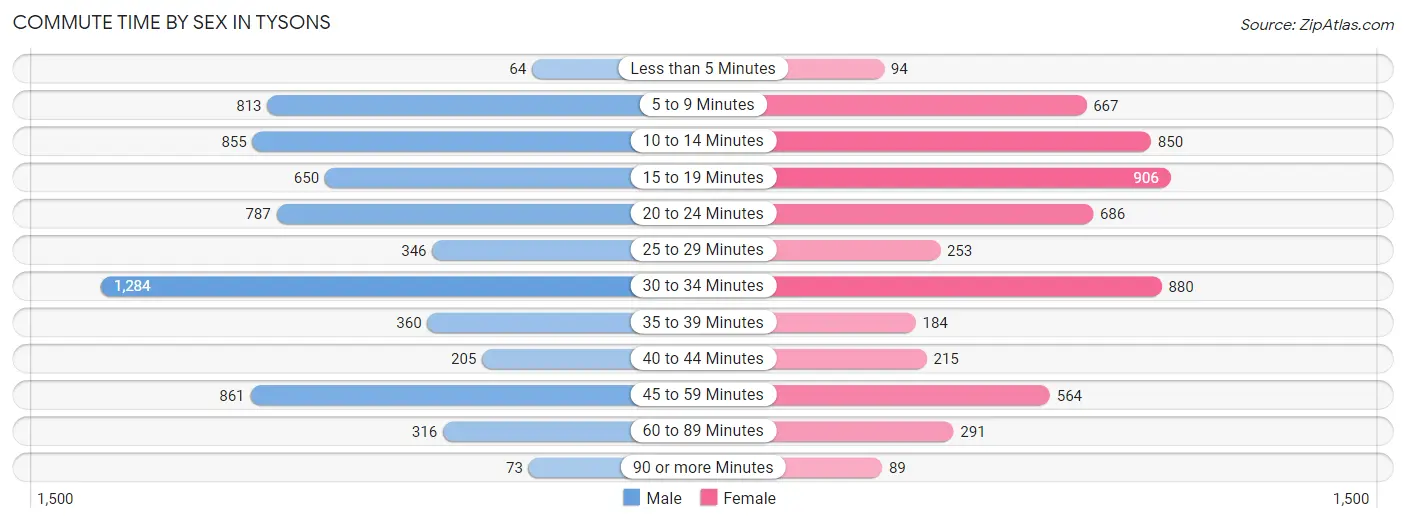
| Commute Time | Male | Female |
| Less than 5 Minutes | 64 (1.0%) | 94 (1.7%) |
| 5 to 9 Minutes | 813 (12.3%) | 667 (11.7%) |
| 10 to 14 Minutes | 855 (12.9%) | 850 (15.0%) |
| 15 to 19 Minutes | 650 (9.8%) | 906 (16.0%) |
| 20 to 24 Minutes | 787 (11.9%) | 686 (12.1%) |
| 25 to 29 Minutes | 346 (5.2%) | 253 (4.5%) |
| 30 to 34 Minutes | 1,284 (19.4%) | 880 (15.5%) |
| 35 to 39 Minutes | 360 (5.4%) | 184 (3.2%) |
| 40 to 44 Minutes | 205 (3.1%) | 215 (3.8%) |
| 45 to 59 Minutes | 861 (13.0%) | 564 (9.9%) |
| 60 to 89 Minutes | 316 (4.8%) | 291 (5.1%) |
| 90 or more Minutes | 73 (1.1%) | 89 (1.6%) |
Time of Departure to Work by Sex in Tysons
The most frequent times of departure to work in Tysons are 9:00 AM to 9:59 AM (1,249, 18.9%) for males and 8:00 AM to 8:29 AM (1,039, 18.3%) for females.
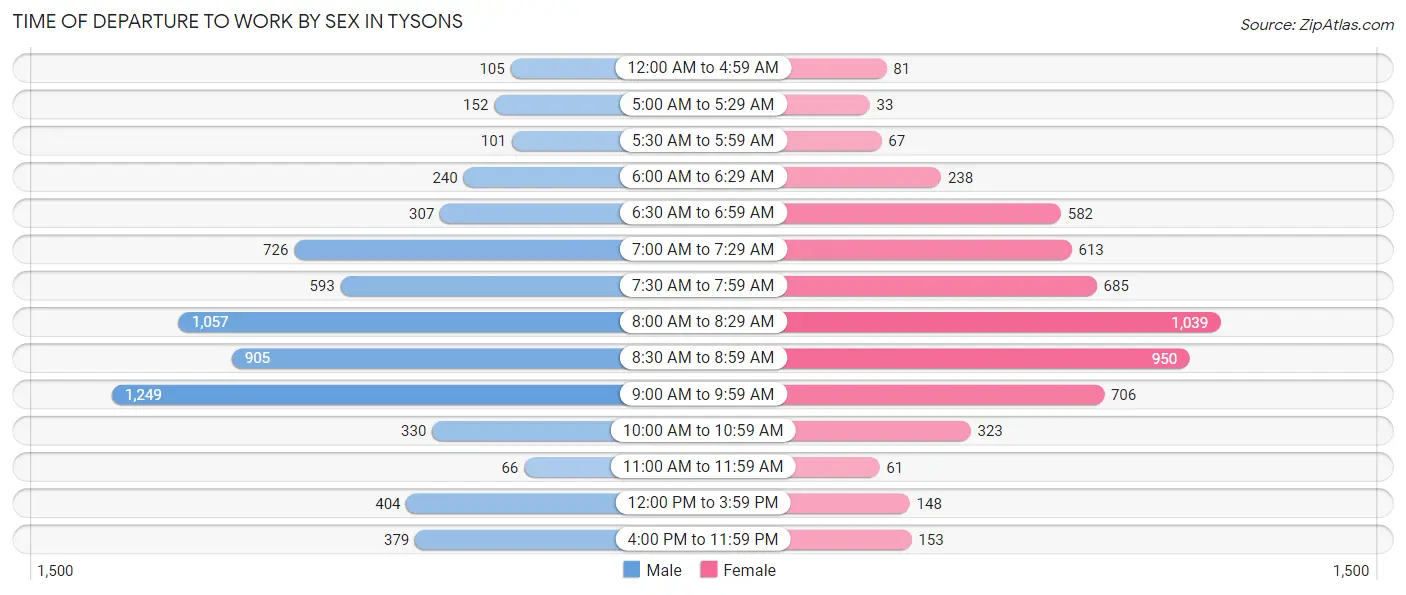
| Time of Departure | Male | Female |
| 12:00 AM to 4:59 AM | 105 (1.6%) | 81 (1.4%) |
| 5:00 AM to 5:29 AM | 152 (2.3%) | 33 (0.6%) |
| 5:30 AM to 5:59 AM | 101 (1.5%) | 67 (1.2%) |
| 6:00 AM to 6:29 AM | 240 (3.6%) | 238 (4.2%) |
| 6:30 AM to 6:59 AM | 307 (4.6%) | 582 (10.2%) |
| 7:00 AM to 7:29 AM | 726 (11.0%) | 613 (10.8%) |
| 7:30 AM to 7:59 AM | 593 (9.0%) | 685 (12.1%) |
| 8:00 AM to 8:29 AM | 1,057 (16.0%) | 1,039 (18.3%) |
| 8:30 AM to 8:59 AM | 905 (13.7%) | 950 (16.7%) |
| 9:00 AM to 9:59 AM | 1,249 (18.9%) | 706 (12.4%) |
| 10:00 AM to 10:59 AM | 330 (5.0%) | 323 (5.7%) |
| 11:00 AM to 11:59 AM | 66 (1.0%) | 61 (1.1%) |
| 12:00 PM to 3:59 PM | 404 (6.1%) | 148 (2.6%) |
| 4:00 PM to 11:59 PM | 379 (5.7%) | 153 (2.7%) |
| Total | 6,614 (100.0%) | 5,679 (100.0%) |
Housing Occupancy in Tysons
Occupancy by Ownership in Tysons
Of the total 13,494 dwellings in Tysons, owner-occupied units account for 4,827 (35.8%), while renter-occupied units make up 8,667 (64.2%).
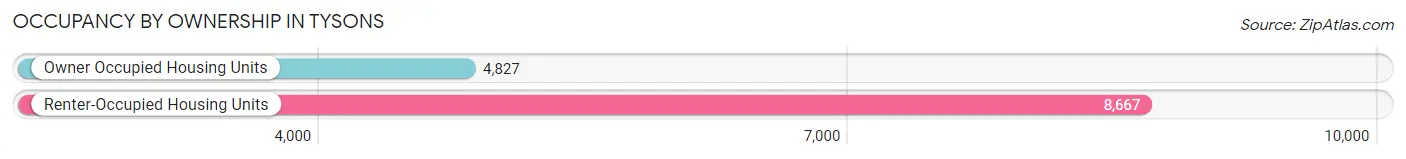
| Occupancy | # Housing Units | % Housing Units |
| Owner Occupied Housing Units | 4,827 | 35.8% |
| Renter-Occupied Housing Units | 8,667 | 64.2% |
| Total Occupied Housing Units | 13,494 | 100.0% |
Occupancy by Household Size in Tysons
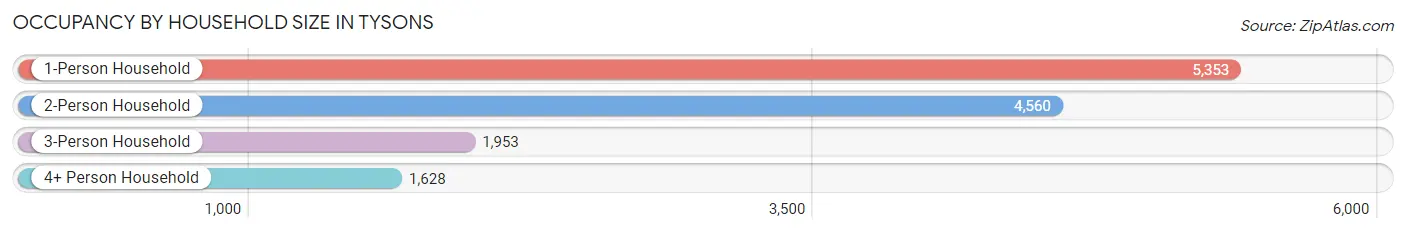
| Household Size | # Housing Units | % Housing Units |
| 1-Person Household | 5,353 | 39.7% |
| 2-Person Household | 4,560 | 33.8% |
| 3-Person Household | 1,953 | 14.5% |
| 4+ Person Household | 1,628 | 12.1% |
| Total Housing Units | 13,494 | 100.0% |
Occupancy by Ownership by Household Size in Tysons
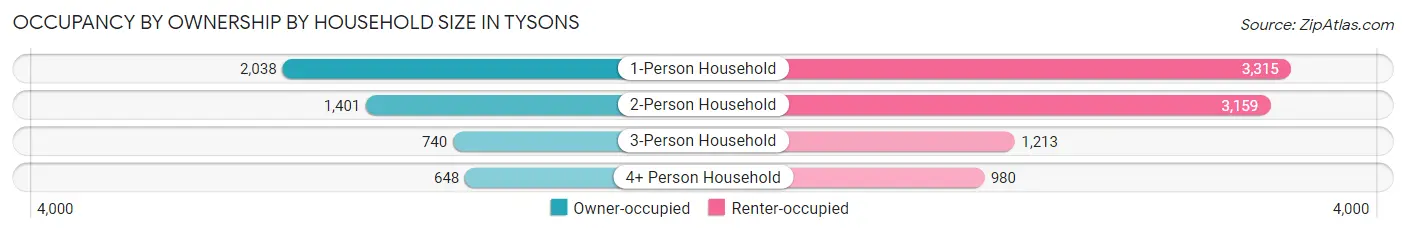
| Household Size | Owner-occupied | Renter-occupied |
| 1-Person Household | 2,038 (38.1%) | 3,315 (61.9%) |
| 2-Person Household | 1,401 (30.7%) | 3,159 (69.3%) |
| 3-Person Household | 740 (37.9%) | 1,213 (62.1%) |
| 4+ Person Household | 648 (39.8%) | 980 (60.2%) |
| Total Housing Units | 4,827 (35.8%) | 8,667 (64.2%) |
Occupancy by Educational Attainment in Tysons
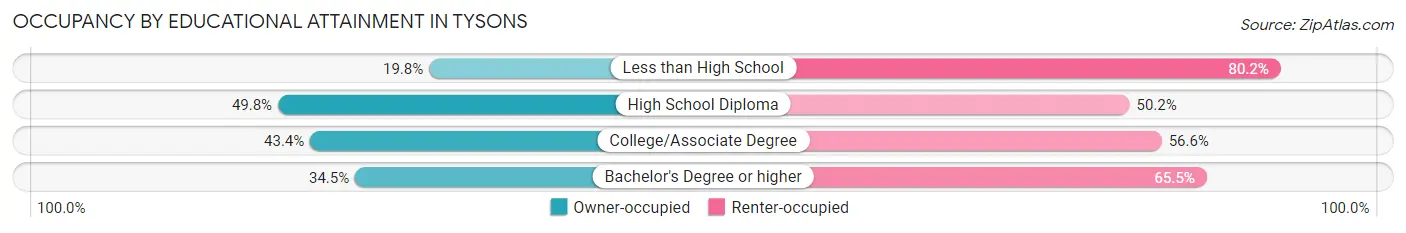
| Household Size | Owner-occupied | Renter-occupied |
| Less than High School | 41 (19.8%) | 166 (80.2%) |
| High School Diploma | 216 (49.8%) | 218 (50.2%) |
| College/Associate Degree | 676 (43.4%) | 882 (56.6%) |
| Bachelor's Degree or higher | 3,894 (34.5%) | 7,401 (65.5%) |
Occupancy by Age of Householder in Tysons
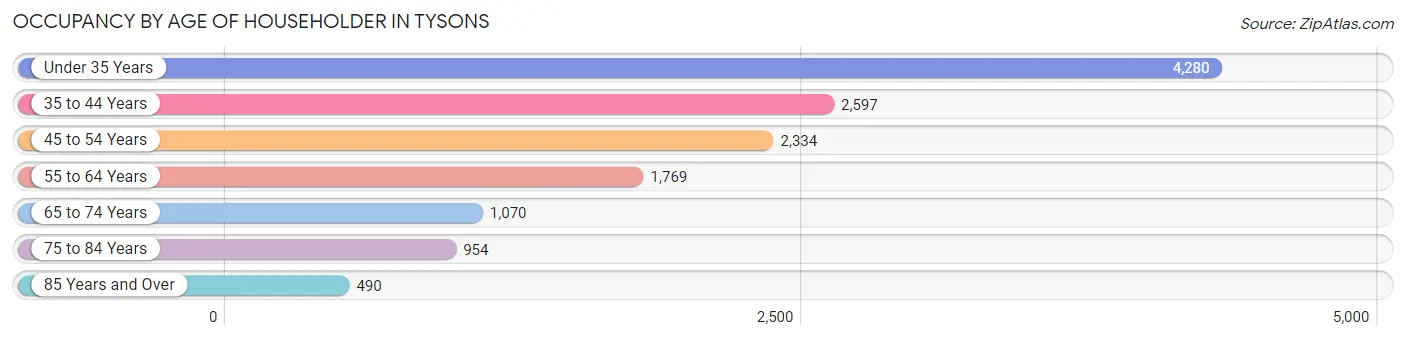
| Age Bracket | # Households | % Households |
| Under 35 Years | 4,280 | 31.7% |
| 35 to 44 Years | 2,597 | 19.3% |
| 45 to 54 Years | 2,334 | 17.3% |
| 55 to 64 Years | 1,769 | 13.1% |
| 65 to 74 Years | 1,070 | 7.9% |
| 75 to 84 Years | 954 | 7.1% |
| 85 Years and Over | 490 | 3.6% |
| Total | 13,494 | 100.0% |
Housing Finances in Tysons
Median Income by Occupancy in Tysons
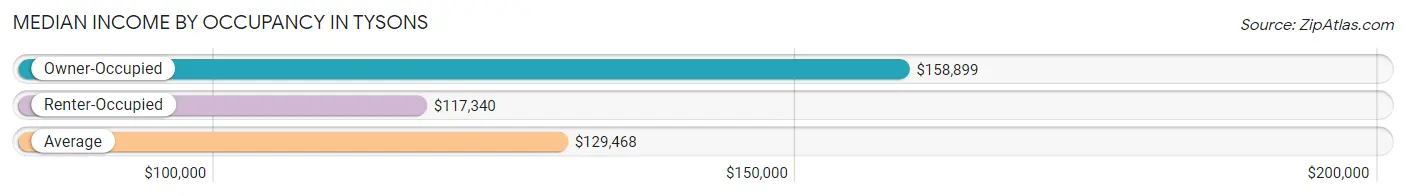
| Occupancy Type | # Households | Median Income |
| Owner-Occupied | 4,827 (35.8%) | $158,899 |
| Renter-Occupied | 8,667 (64.2%) | $117,340 |
| Average | 13,494 (100.0%) | $129,468 |
Occupancy by Householder Income Bracket in Tysons
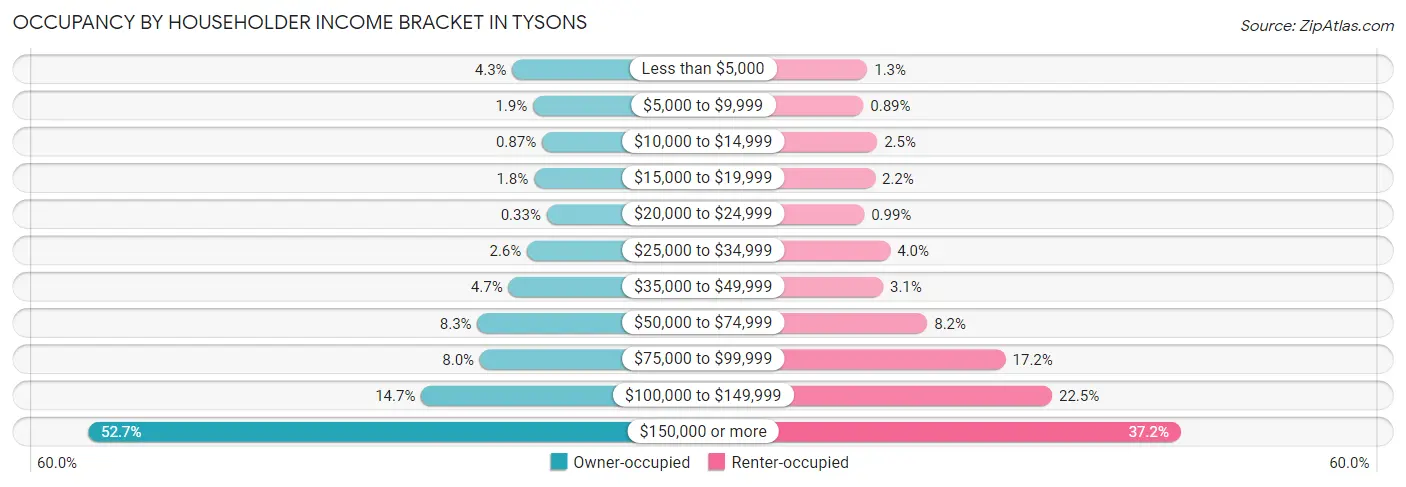
| Income Bracket | Owner-occupied | Renter-occupied |
| Less than $5,000 | 205 (4.3%) | 116 (1.3%) |
| $5,000 to $9,999 | 91 (1.9%) | 77 (0.9%) |
| $10,000 to $14,999 | 42 (0.9%) | 215 (2.5%) |
| $15,000 to $19,999 | 86 (1.8%) | 192 (2.2%) |
| $20,000 to $24,999 | 16 (0.3%) | 86 (1.0%) |
| $25,000 to $34,999 | 124 (2.6%) | 344 (4.0%) |
| $35,000 to $49,999 | 227 (4.7%) | 272 (3.1%) |
| $50,000 to $74,999 | 398 (8.3%) | 711 (8.2%) |
| $75,000 to $99,999 | 384 (8.0%) | 1,486 (17.2%) |
| $100,000 to $149,999 | 708 (14.7%) | 1,947 (22.5%) |
| $150,000 or more | 2,546 (52.7%) | 3,221 (37.2%) |
| Total | 4,827 (100.0%) | 8,667 (100.0%) |
Monthly Housing Cost Tiers in Tysons
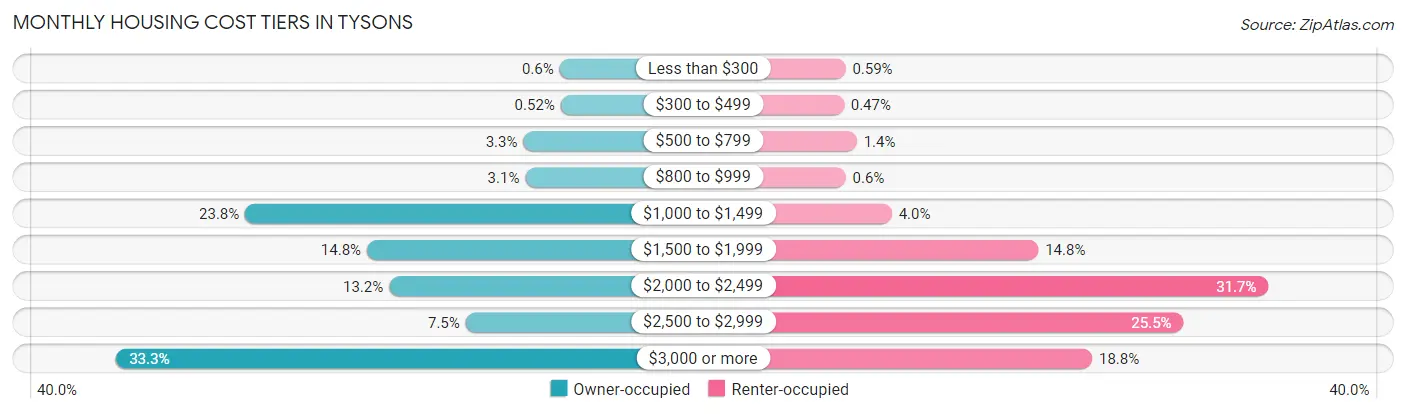
| Monthly Cost | Owner-occupied | Renter-occupied |
| Less than $300 | 29 (0.6%) | 51 (0.6%) |
| $300 to $499 | 25 (0.5%) | 41 (0.5%) |
| $500 to $799 | 158 (3.3%) | 123 (1.4%) |
| $800 to $999 | 151 (3.1%) | 52 (0.6%) |
| $1,000 to $1,499 | 1,147 (23.8%) | 347 (4.0%) |
| $1,500 to $1,999 | 714 (14.8%) | 1,282 (14.8%) |
| $2,000 to $2,499 | 635 (13.2%) | 2,750 (31.7%) |
| $2,500 to $2,999 | 363 (7.5%) | 2,208 (25.5%) |
| $3,000 or more | 1,605 (33.3%) | 1,625 (18.8%) |
| Total | 4,827 (100.0%) | 8,667 (100.0%) |
Physical Housing Characteristics in Tysons
Housing Structures in Tysons
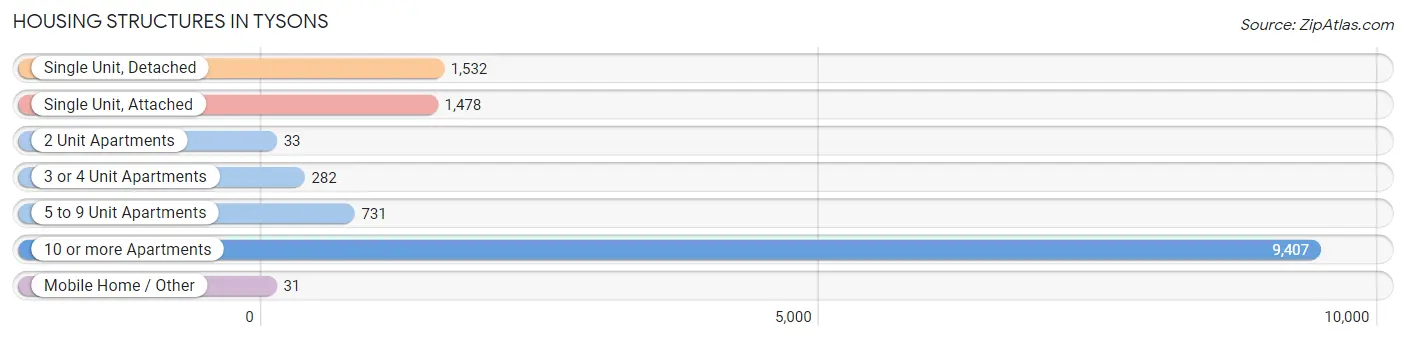
| Structure Type | # Housing Units | % Housing Units |
| Single Unit, Detached | 1,532 | 11.4% |
| Single Unit, Attached | 1,478 | 11.0% |
| 2 Unit Apartments | 33 | 0.2% |
| 3 or 4 Unit Apartments | 282 | 2.1% |
| 5 to 9 Unit Apartments | 731 | 5.4% |
| 10 or more Apartments | 9,407 | 69.7% |
| Mobile Home / Other | 31 | 0.2% |
| Total | 13,494 | 100.0% |
Housing Structures by Occupancy in Tysons
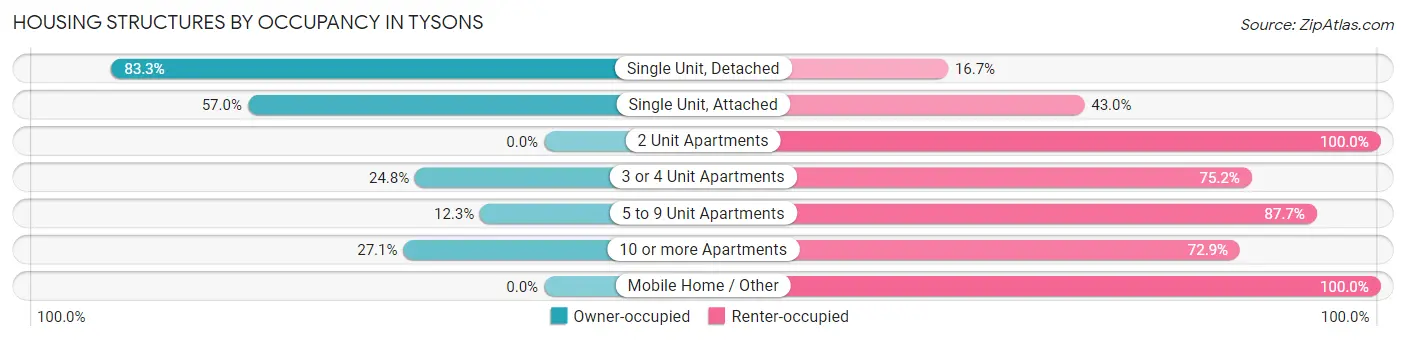
| Structure Type | Owner-occupied | Renter-occupied |
| Single Unit, Detached | 1,276 (83.3%) | 256 (16.7%) |
| Single Unit, Attached | 843 (57.0%) | 635 (43.0%) |
| 2 Unit Apartments | 0 (0.0%) | 33 (100.0%) |
| 3 or 4 Unit Apartments | 70 (24.8%) | 212 (75.2%) |
| 5 to 9 Unit Apartments | 90 (12.3%) | 641 (87.7%) |
| 10 or more Apartments | 2,548 (27.1%) | 6,859 (72.9%) |
| Mobile Home / Other | 0 (0.0%) | 31 (100.0%) |
| Total | 4,827 (35.8%) | 8,667 (64.2%) |
Housing Structures by Number of Rooms in Tysons
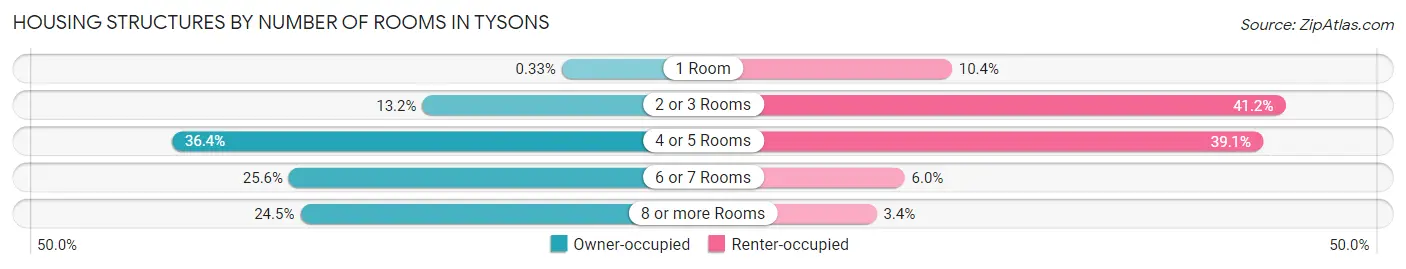
| Number of Rooms | Owner-occupied | Renter-occupied |
| 1 Room | 16 (0.3%) | 897 (10.3%) |
| 2 or 3 Rooms | 638 (13.2%) | 3,569 (41.2%) |
| 4 or 5 Rooms | 1,756 (36.4%) | 3,390 (39.1%) |
| 6 or 7 Rooms | 1,234 (25.6%) | 518 (6.0%) |
| 8 or more Rooms | 1,183 (24.5%) | 293 (3.4%) |
| Total | 4,827 (100.0%) | 8,667 (100.0%) |
Housing Structure by Heating Type in Tysons
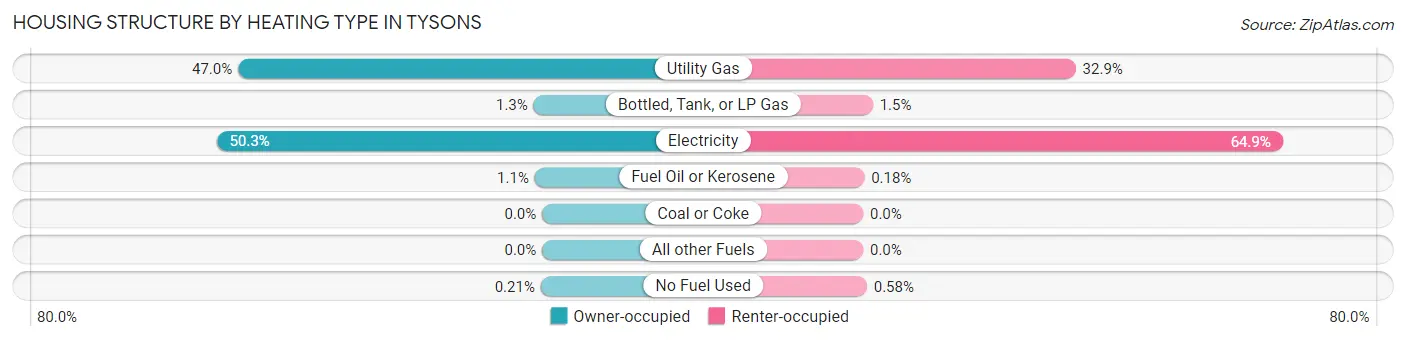
| Heating Type | Owner-occupied | Renter-occupied |
| Utility Gas | 2,269 (47.0%) | 2,849 (32.9%) |
| Bottled, Tank, or LP Gas | 63 (1.3%) | 130 (1.5%) |
| Electricity | 2,430 (50.3%) | 5,622 (64.9%) |
| Fuel Oil or Kerosene | 55 (1.1%) | 16 (0.2%) |
| Coal or Coke | 0 (0.0%) | 0 (0.0%) |
| All other Fuels | 0 (0.0%) | 0 (0.0%) |
| No Fuel Used | 10 (0.2%) | 50 (0.6%) |
| Total | 4,827 (100.0%) | 8,667 (100.0%) |
Household Vehicle Usage in Tysons
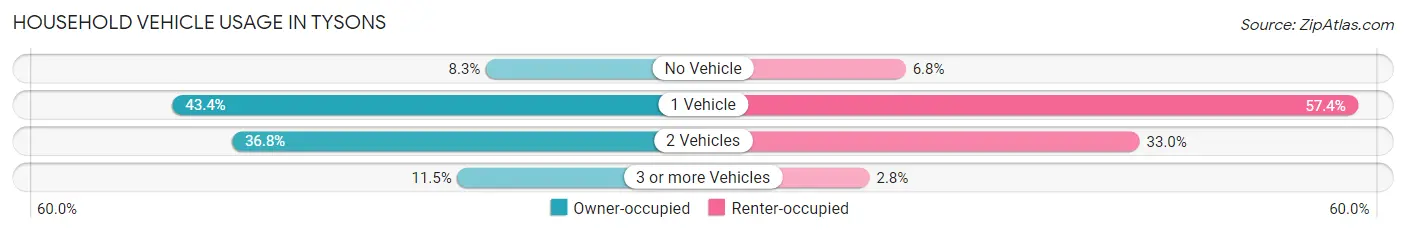
| Vehicles per Household | Owner-occupied | Renter-occupied |
| No Vehicle | 400 (8.3%) | 590 (6.8%) |
| 1 Vehicle | 2,097 (43.4%) | 4,977 (57.4%) |
| 2 Vehicles | 1,775 (36.8%) | 2,861 (33.0%) |
| 3 or more Vehicles | 555 (11.5%) | 239 (2.8%) |
| Total | 4,827 (100.0%) | 8,667 (100.0%) |
Real Estate & Mortgages in Tysons
Real Estate and Mortgage Overview in Tysons
| Characteristic | Without Mortgage | With Mortgage |
| Housing Units | 1,820 | 3,007 |
| Median Property Value | $607,000 | $630,800 |
| Median Household Income | $133,646 | $1,765 |
| Monthly Housing Costs | $1,297 | $1,602 |
| Real Estate Taxes | $7,014 | $65 |
Property Value by Mortgage Status in Tysons
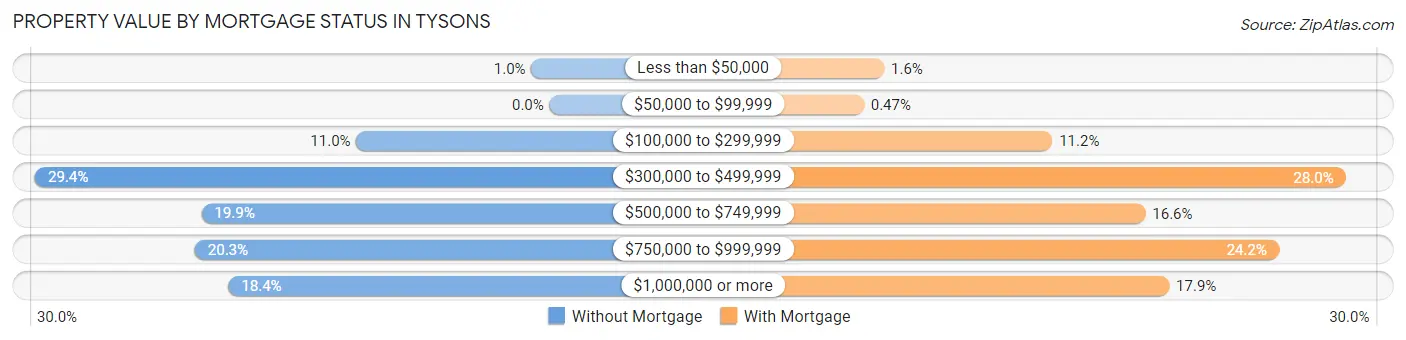
| Property Value | Without Mortgage | With Mortgage |
| Less than $50,000 | 19 (1.0%) | 49 (1.6%) |
| $50,000 to $99,999 | 0 (0.0%) | 14 (0.5%) |
| $100,000 to $299,999 | 201 (11.0%) | 338 (11.2%) |
| $300,000 to $499,999 | 535 (29.4%) | 842 (28.0%) |
| $500,000 to $749,999 | 362 (19.9%) | 498 (16.6%) |
| $750,000 to $999,999 | 369 (20.3%) | 727 (24.2%) |
| $1,000,000 or more | 334 (18.3%) | 539 (17.9%) |
| Total | 1,820 (100.0%) | 3,007 (100.0%) |
Household Income by Mortgage Status in Tysons
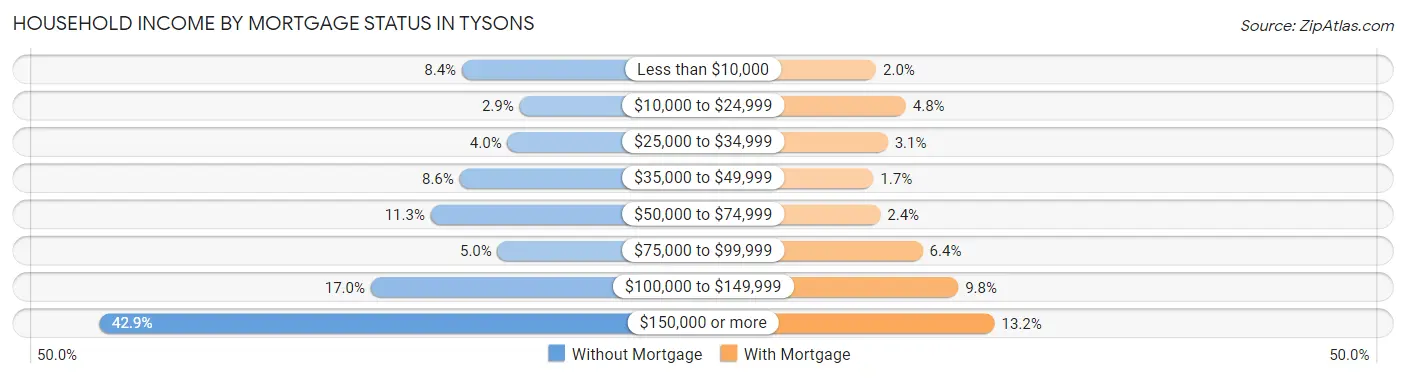
| Household Income | Without Mortgage | With Mortgage |
| Less than $10,000 | 152 (8.4%) | 59 (2.0%) |
| $10,000 to $24,999 | 52 (2.9%) | 144 (4.8%) |
| $25,000 to $34,999 | 73 (4.0%) | 92 (3.1%) |
| $35,000 to $49,999 | 156 (8.6%) | 51 (1.7%) |
| $50,000 to $74,999 | 206 (11.3%) | 71 (2.4%) |
| $75,000 to $99,999 | 90 (5.0%) | 192 (6.4%) |
| $100,000 to $149,999 | 310 (17.0%) | 294 (9.8%) |
| $150,000 or more | 781 (42.9%) | 398 (13.2%) |
| Total | 1,820 (100.0%) | 3,007 (100.0%) |
Property Value to Household Income Ratio in Tysons
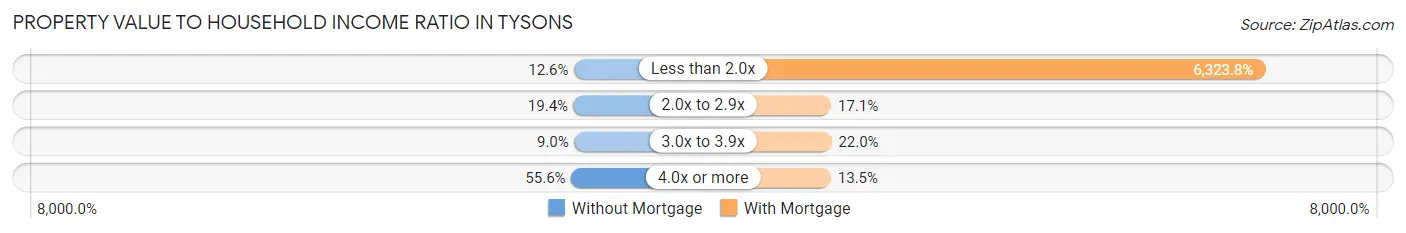
| Value-to-Income Ratio | Without Mortgage | With Mortgage |
| Less than 2.0x | 229 (12.6%) | 190,156 (6,323.8%) |
| 2.0x to 2.9x | 353 (19.4%) | 513 (17.1%) |
| 3.0x to 3.9x | 163 (9.0%) | 661 (22.0%) |
| 4.0x or more | 1,012 (55.6%) | 406 (13.5%) |
| Total | 1,820 (100.0%) | 3,007 (100.0%) |
Real Estate Taxes by Mortgage Status in Tysons
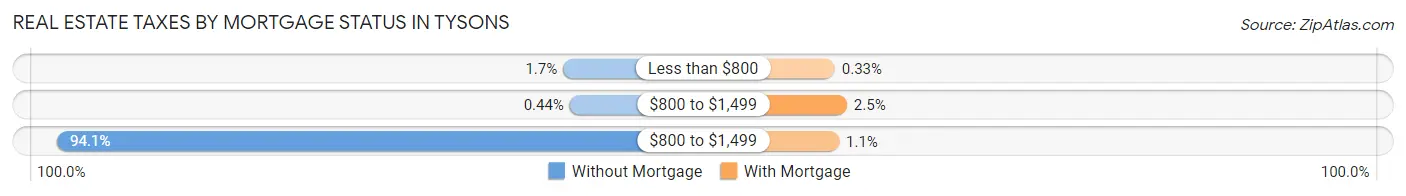
| Property Taxes | Without Mortgage | With Mortgage |
| Less than $800 | 30 (1.7%) | 10 (0.3%) |
| $800 to $1,499 | 8 (0.4%) | 76 (2.5%) |
| $800 to $1,499 | 1,712 (94.1%) | 33 (1.1%) |
| Total | 1,820 (100.0%) | 3,007 (100.0%) |
Health & Disability in Tysons
Health Insurance Coverage by Age in Tysons
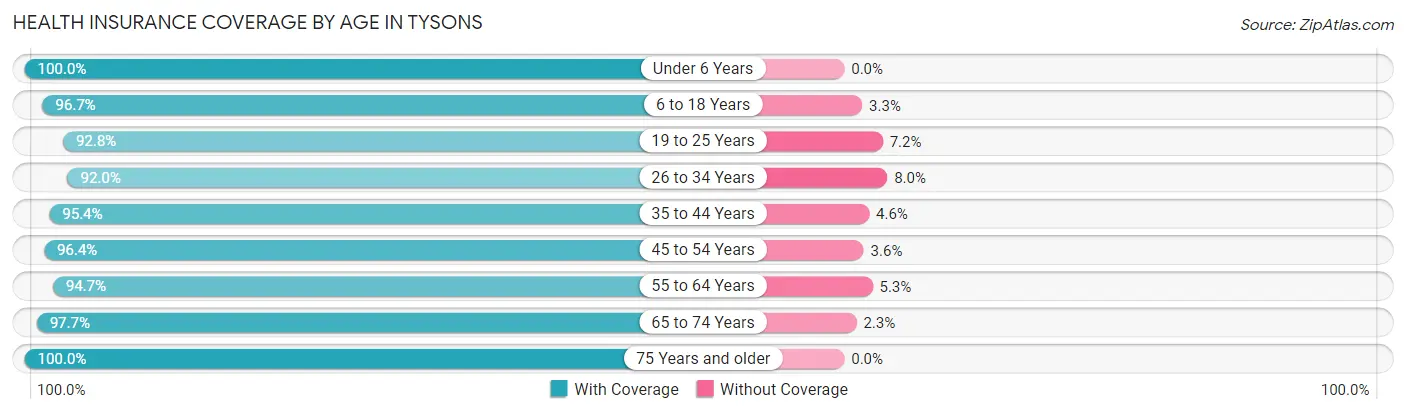
| Age Bracket | With Coverage | Without Coverage |
| Under 6 Years | 1,473 (100.0%) | 0 (0.0%) |
| 6 to 18 Years | 3,252 (96.7%) | 112 (3.3%) |
| 19 to 25 Years | 2,631 (92.8%) | 203 (7.2%) |
| 26 to 34 Years | 5,017 (92.0%) | 437 (8.0%) |
| 35 to 44 Years | 4,068 (95.4%) | 197 (4.6%) |
| 45 to 54 Years | 3,578 (96.4%) | 134 (3.6%) |
| 55 to 64 Years | 2,660 (94.7%) | 148 (5.3%) |
| 65 to 74 Years | 1,809 (97.7%) | 42 (2.3%) |
| 75 Years and older | 1,759 (100.0%) | 0 (0.0%) |
| Total | 26,247 (95.4%) | 1,273 (4.6%) |
Health Insurance Coverage by Citizenship Status in Tysons
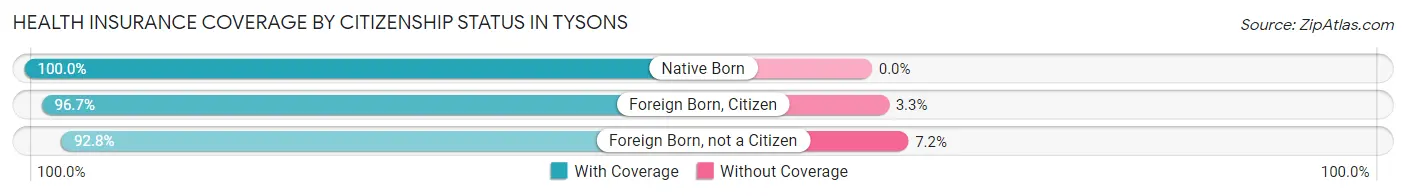
| Citizenship Status | With Coverage | Without Coverage |
| Native Born | 1,473 (100.0%) | 0 (0.0%) |
| Foreign Born, Citizen | 3,252 (96.7%) | 112 (3.3%) |
| Foreign Born, not a Citizen | 2,631 (92.8%) | 203 (7.2%) |
Health Insurance Coverage by Household Income in Tysons
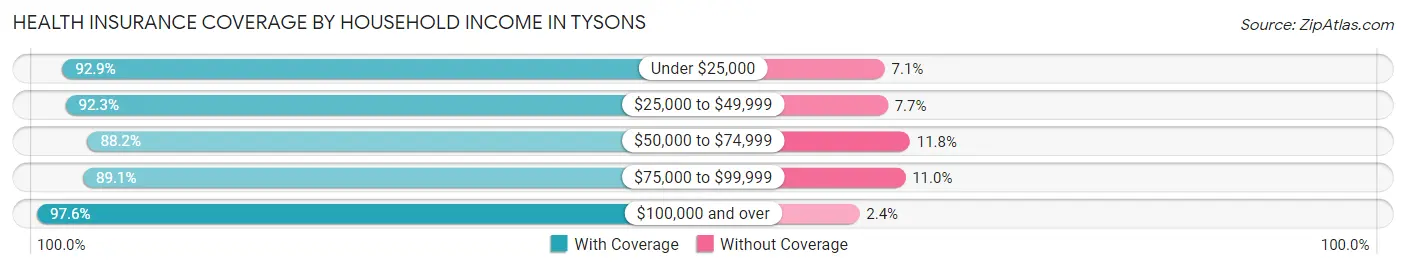
| Household Income | With Coverage | Without Coverage |
| Under $25,000 | 1,469 (92.9%) | 112 (7.1%) |
| $25,000 to $49,999 | 1,408 (92.3%) | 117 (7.7%) |
| $50,000 to $74,999 | 1,568 (88.2%) | 210 (11.8%) |
| $75,000 to $99,999 | 3,082 (89.0%) | 379 (11.0%) |
| $100,000 and over | 18,715 (97.6%) | 453 (2.4%) |
Public vs Private Health Insurance Coverage by Age in Tysons
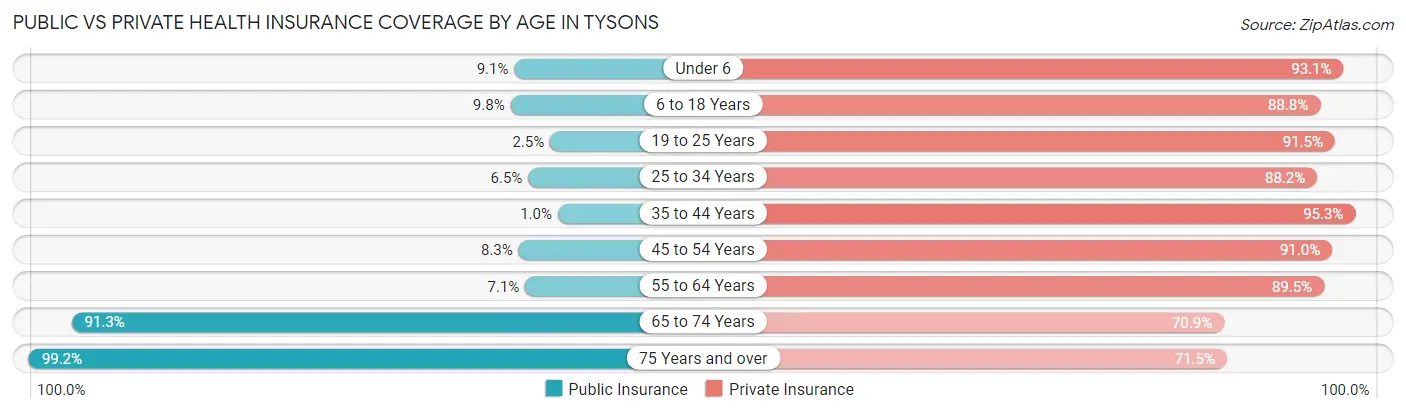
| Age Bracket | Public Insurance | Private Insurance |
| Under 6 | 134 (9.1%) | 1,371 (93.1%) |
| 6 to 18 Years | 330 (9.8%) | 2,986 (88.8%) |
| 19 to 25 Years | 70 (2.5%) | 2,593 (91.5%) |
| 25 to 34 Years | 356 (6.5%) | 4,811 (88.2%) |
| 35 to 44 Years | 44 (1.0%) | 4,064 (95.3%) |
| 45 to 54 Years | 308 (8.3%) | 3,377 (91.0%) |
| 55 to 64 Years | 199 (7.1%) | 2,513 (89.5%) |
| 65 to 74 Years | 1,690 (91.3%) | 1,313 (70.9%) |
| 75 Years and over | 1,745 (99.2%) | 1,257 (71.5%) |
| Total | 4,876 (17.7%) | 24,285 (88.2%) |
Disability Status by Sex by Age in Tysons
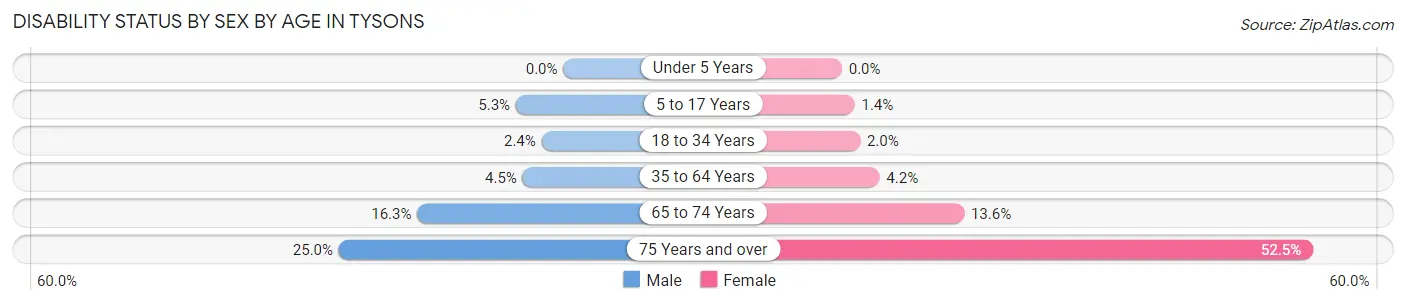
| Age Bracket | Male | Female |
| Under 5 Years | 0 (0.0%) | 0 (0.0%) |
| 5 to 17 Years | 98 (5.3%) | 22 (1.4%) |
| 18 to 34 Years | 106 (2.4%) | 83 (2.0%) |
| 35 to 64 Years | 240 (4.5%) | 230 (4.2%) |
| 65 to 74 Years | 135 (16.3%) | 139 (13.6%) |
| 75 Years and over | 162 (25.0%) | 583 (52.5%) |
Disability Class by Sex by Age in Tysons
Disability Class: Hearing Difficulty
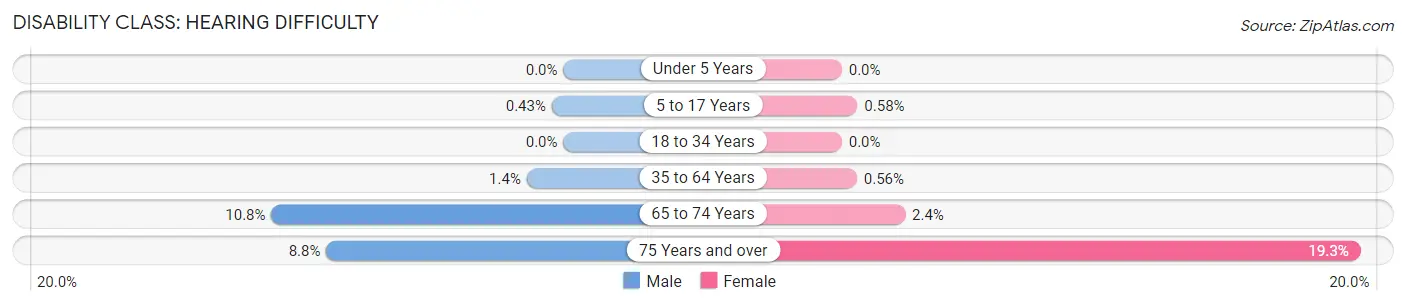
| Age Bracket | Male | Female |
| Under 5 Years | 0 (0.0%) | 0 (0.0%) |
| 5 to 17 Years | 8 (0.4%) | 9 (0.6%) |
| 18 to 34 Years | 0 (0.0%) | 0 (0.0%) |
| 35 to 64 Years | 72 (1.4%) | 31 (0.6%) |
| 65 to 74 Years | 90 (10.8%) | 24 (2.4%) |
| 75 Years and over | 57 (8.8%) | 214 (19.3%) |
Disability Class: Vision Difficulty
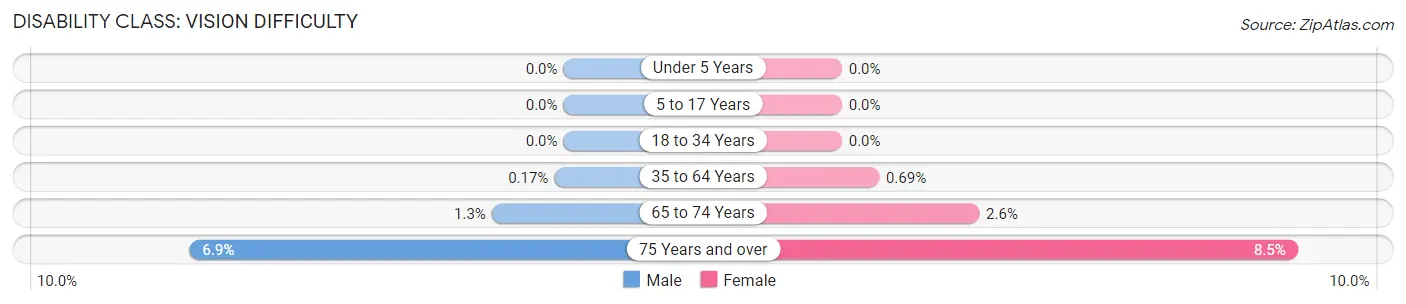
| Age Bracket | Male | Female |
| Under 5 Years | 0 (0.0%) | 0 (0.0%) |
| 5 to 17 Years | 0 (0.0%) | 0 (0.0%) |
| 18 to 34 Years | 0 (0.0%) | 0 (0.0%) |
| 35 to 64 Years | 9 (0.2%) | 38 (0.7%) |
| 65 to 74 Years | 11 (1.3%) | 26 (2.5%) |
| 75 Years and over | 45 (6.9%) | 94 (8.5%) |
Disability Class: Cognitive Difficulty
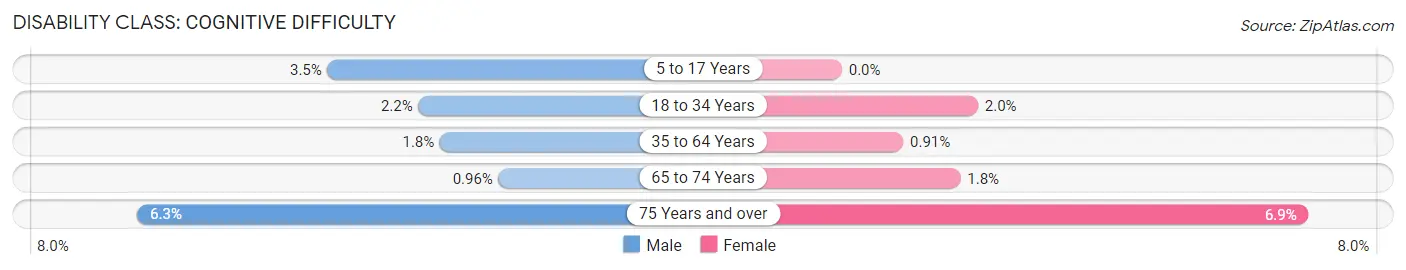
| Age Bracket | Male | Female |
| 5 to 17 Years | 65 (3.5%) | 0 (0.0%) |
| 18 to 34 Years | 94 (2.1%) | 83 (2.0%) |
| 35 to 64 Years | 97 (1.8%) | 50 (0.9%) |
| 65 to 74 Years | 8 (1.0%) | 18 (1.8%) |
| 75 Years and over | 41 (6.3%) | 77 (6.9%) |
Disability Class: Ambulatory Difficulty
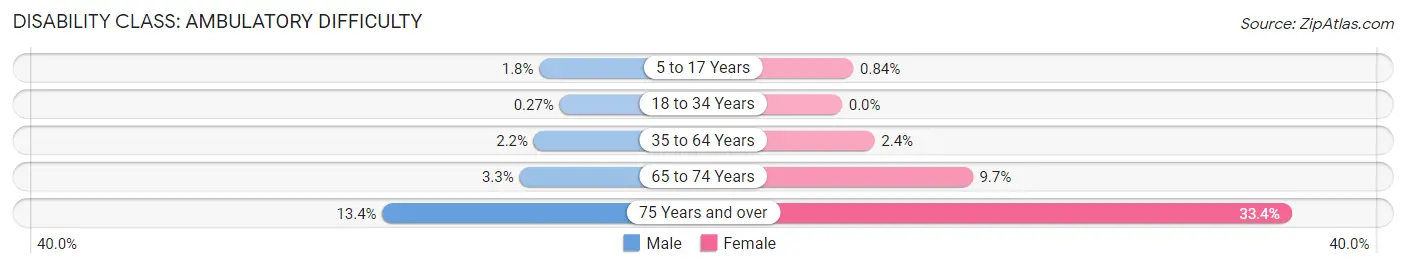
| Age Bracket | Male | Female |
| 5 to 17 Years | 33 (1.8%) | 13 (0.8%) |
| 18 to 34 Years | 12 (0.3%) | 0 (0.0%) |
| 35 to 64 Years | 116 (2.2%) | 133 (2.4%) |
| 65 to 74 Years | 27 (3.3%) | 99 (9.7%) |
| 75 Years and over | 87 (13.4%) | 371 (33.4%) |
Disability Class: Self-Care Difficulty
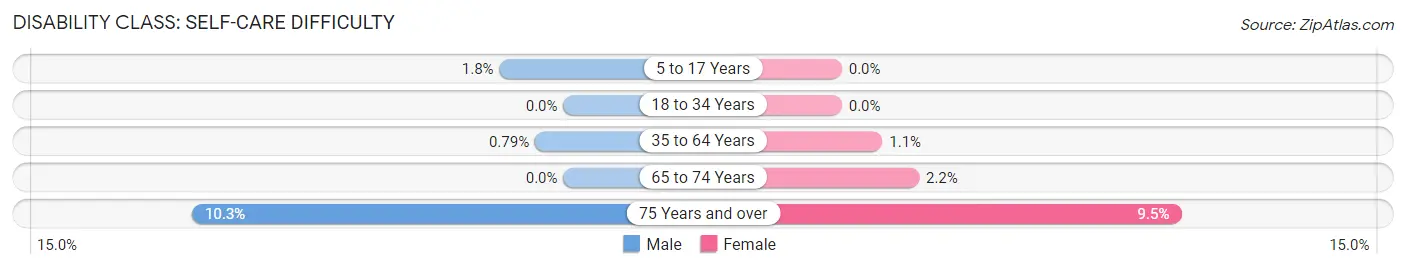
| Age Bracket | Male | Female |
| 5 to 17 Years | 33 (1.8%) | 0 (0.0%) |
| 18 to 34 Years | 0 (0.0%) | 0 (0.0%) |
| 35 to 64 Years | 42 (0.8%) | 62 (1.1%) |
| 65 to 74 Years | 0 (0.0%) | 22 (2.1%) |
| 75 Years and over | 67 (10.3%) | 105 (9.5%) |
Technology Access in Tysons
Computing Device Access in Tysons
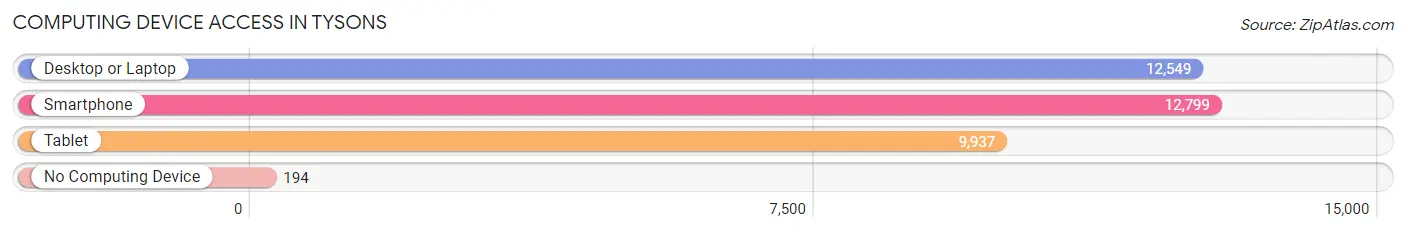
| Device Type | # Households | % Households |
| Desktop or Laptop | 12,549 | 93.0% |
| Smartphone | 12,799 | 94.9% |
| Tablet | 9,937 | 73.6% |
| No Computing Device | 194 | 1.4% |
| Total | 13,494 | 100.0% |
Internet Access in Tysons
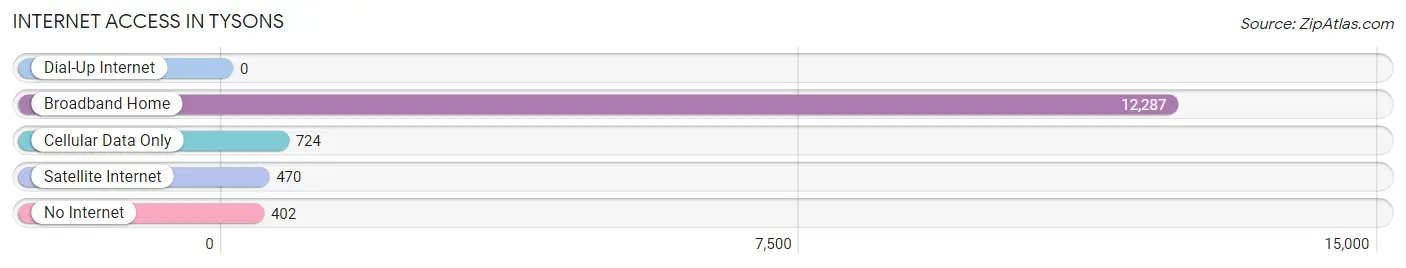
| Internet Type | # Households | % Households |
| Dial-Up Internet | 0 | 0.0% |
| Broadband Home | 12,287 | 91.1% |
| Cellular Data Only | 724 | 5.4% |
| Satellite Internet | 470 | 3.5% |
| No Internet | 402 | 3.0% |
| Total | 13,494 | 100.0% |
Tysons Summary
Tysons, VA is a census-designated place (CDP) located in Fairfax County, Virginia. It is a suburb of Washington, D.C. and is located approximately 12 miles west of the city. The population of Tysons was 22,390 as of the 2010 census.
History
Tysons was originally known as Peach Grove, and was a small rural community until the 1950s. In the 1950s, the area began to experience rapid growth due to the construction of the Dulles Access Road and the Dulles Toll Road. This allowed for easy access to Washington, D.C. and the surrounding suburbs. The area was officially renamed Tysons Corner in 1961, after William Tyson, a local landowner.
In the 1970s, Tysons Corner began to experience rapid growth due to the construction of the Tysons Corner Center, a large shopping mall. This mall was the largest in the Washington, D.C. area and attracted many people to the area. The mall was later expanded and is now the largest shopping mall in the state of Virginia.
In the 1980s, Tysons Corner began to experience further growth due to the construction of several office buildings and high-rise buildings. This growth continued into the 1990s and 2000s, and Tysons Corner is now one of the largest business districts in the Washington, D.C. area.
Geography
Tysons is located in northern Fairfax County, Virginia. It is bordered to the north by the city of Vienna, to the east by the city of Falls Church, to the south by the city of McLean, and to the west by the city of Great Falls.
The area is located in the Piedmont region of Virginia, and is characterized by rolling hills and valleys. The area is drained by the Potomac River and its tributaries, including the Difficult Run and the Accotink Creek.
Economy
Tysons is one of the largest business districts in the Washington, D.C. area. The area is home to many corporate headquarters, including Hilton Worldwide, Capital One, and Booz Allen Hamilton. The area is also home to many government contractors, such as Lockheed Martin and Northrop Grumman.
The area is also home to many shopping centers, including the Tysons Corner Center, which is the largest shopping mall in the state of Virginia. The area is also home to many restaurants, hotels, and entertainment venues.
Demographics
As of the 2010 census, the population of Tysons was 22,390. The racial makeup of the area was 68.3% White, 15.2% Asian, 8.2% African American, and 4.3% Hispanic or Latino. The median household income was $107,817, and the median age was 37.
Tysons is a highly educated area, with over 50% of the population having a bachelor's degree or higher. The area is also home to many foreign-born residents, with over 20% of the population being foreign-born.
Conclusion
Tysons, VA is a census-designated place located in Fairfax County, Virginia. It is a suburb of Washington, D.C. and is located approximately 12 miles west of the city. The area was originally known as Peach Grove, and was a small rural community until the 1950s. In the 1950s, the area began to experience rapid growth due to the construction of the Dulles Access Road and the Dulles Toll Road. This allowed for easy access to Washington, D.C. and the surrounding suburbs. The area is now one of the largest business districts in the Washington, D.C. area, and is home to many corporate headquarters, government contractors, shopping centers, restaurants, hotels, and entertainment venues. The population of Tysons was 22,390 as of the 2010 census, and the racial makeup of the area was 68.3% White, 15.2% Asian, 8.2% African American, and 4.3% Hispanic or Latino. The median household income was $107,817, and the median age was 37. Tysons is a highly educated area, with over 50% of the population having a bachelor's degree or higher. The area is also home to many foreign-born residents, with over 20% of the population being foreign-born.
Common Questions
What is Per Capita Income in Tysons?
Per Capita income in Tysons is $78,624.
What is the Median Family Income in Tysons?
Median Family Income in Tysons is $157,611.
What is the Median Household income in Tysons?
Median Household Income in Tysons is $129,468.
What is Income or Wage Gap in Tysons?
Income or Wage Gap in Tysons is 25.8%.
Women in Tysons earn 74.2 cents for every dollar earned by a man.
What is Inequality or Gini Index in Tysons?
Inequality or Gini Index in Tysons is 0.41.
What is the Total Population of Tysons?
Total Population of Tysons is 27,617.
What is the Total Male Population of Tysons?
Total Male Population of Tysons is 13,826.
What is the Total Female Population of Tysons?
Total Female Population of Tysons is 13,791.
What is the Ratio of Males per 100 Females in Tysons?
There are 100.25 Males per 100 Females in Tysons.
What is the Ratio of Females per 100 Males in Tysons?
There are 99.75 Females per 100 Males in Tysons.
What is the Median Population Age in Tysons?
Median Population Age in Tysons is 36.1 Years.
What is the Average Family Size in Tysons
Average Family Size in Tysons is 2.8 People.
What is the Average Household Size in Tysons
Average Household Size in Tysons is 2.0 People.
How Large is the Labor Force in Tysons?
There are 17,878 People in the Labor Forcein in Tysons.
What is the Percentage of People in the Labor Force in Tysons?
76.3% of People are in the Labor Force in Tysons.
What is the Unemployment Rate in Tysons?
Unemployment Rate in Tysons is 5.0%.