Williamsburg, VA Map & Demographics
Williamsburg Map
Williamsburg Overview
$35,264
PER CAPITA INCOME
$94,184
AVG FAMILY INCOME
$66,815
AVG HOUSEHOLD INCOME
63.7%
WAGE / INCOME GAP [ % ]
36.3¢/ $1
WAGE / INCOME GAP [ $ ]
$8,300
FAMILY INCOME DEFICIT
0.53
INEQUALITY / GINI INDEX
15,486
TOTAL POPULATION
7,277
MALE POPULATION
8,209
FEMALE POPULATION
88.65
MALES / 100 FEMALES
112.81
FEMALES / 100 MALES
24.6
MEDIAN AGE
2.8
AVG FAMILY SIZE
2.2
AVG HOUSEHOLD SIZE
6,968
LABOR FORCE [ PEOPLE ]
49.4%
PERCENT IN LABOR FORCE
6.0%
UNEMPLOYMENT RATE
Williamsburg Area Codes
Income in Williamsburg
Income Overview in Williamsburg
Per Capita Income in Williamsburg is $35,264, while median incomes of families and households are $94,184 and $66,815 respectively.
| Characteristic | Number | Measure |
| Per Capita Income | 15,486 | $35,264 |
| Median Family Income | 2,440 | $94,184 |
| Mean Family Income | 2,440 | $155,947 |
| Median Household Income | 4,882 | $66,815 |
| Mean Household Income | 4,882 | $107,778 |
| Income Deficit | 2,440 | $8,300 |
| Wage / Income Gap (%) | 15,486 | 63.68% |
| Wage / Income Gap ($) | 15,486 | 36.32¢ per $1 |
| Gini / Inequality Index | 15,486 | 0.53 |
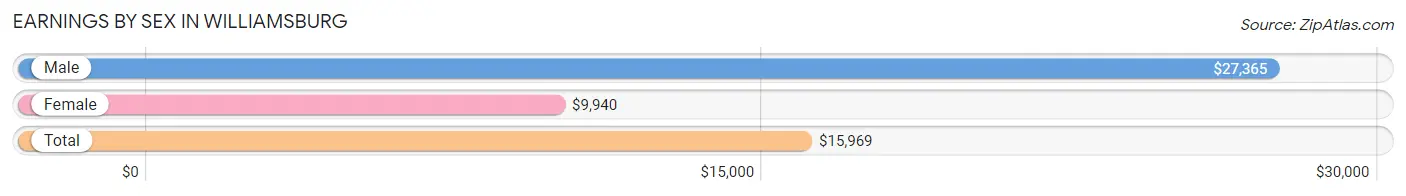
Earnings by Sex in Williamsburg
Average Earnings in Williamsburg are $15,969, $27,365 for men and $9,940 for women, a difference of 63.7%.
| Sex | Number | Average Earnings |
| Male | 4,556 (48.3%) | $27,365 |
| Female | 4,873 (51.7%) | $9,940 |
| Total | 9,429 (100.0%) | $15,969 |
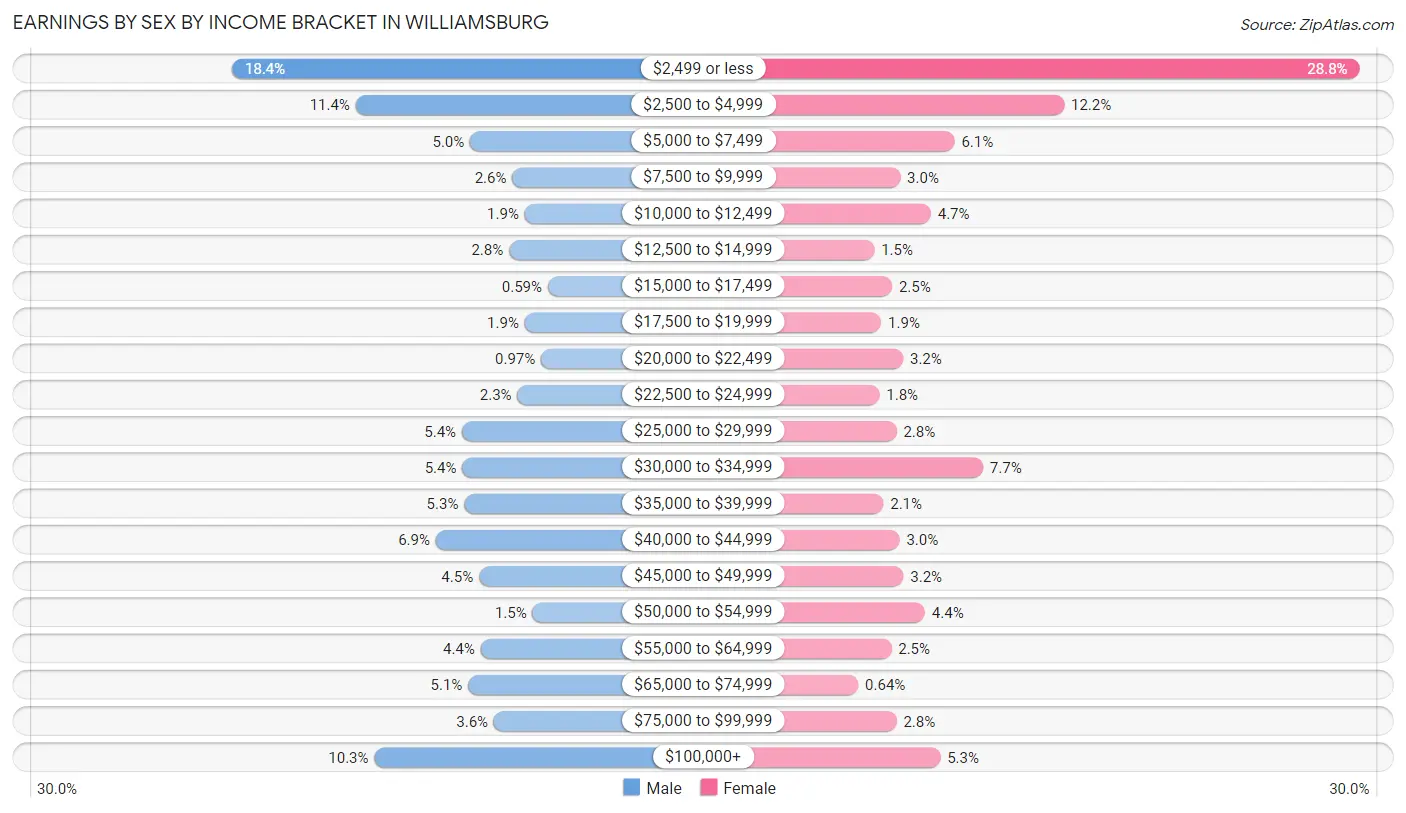
Earnings by Sex by Income Bracket in Williamsburg
The most common earnings brackets in Williamsburg are $2,499 or less for men (836 | 18.3%) and $2,499 or less for women (1,404 | 28.8%).
| Income | Male | Female |
| $2,499 or less | 836 (18.3%) | 1,404 (28.8%) |
| $2,500 to $4,999 | 519 (11.4%) | 595 (12.2%) |
| $5,000 to $7,499 | 226 (5.0%) | 295 (6.0%) |
| $7,500 to $9,999 | 118 (2.6%) | 146 (3.0%) |
| $10,000 to $12,499 | 86 (1.9%) | 230 (4.7%) |
| $12,500 to $14,999 | 126 (2.8%) | 75 (1.5%) |
| $15,000 to $17,499 | 27 (0.6%) | 124 (2.5%) |
| $17,500 to $19,999 | 86 (1.9%) | 94 (1.9%) |
| $20,000 to $22,499 | 44 (1.0%) | 154 (3.2%) |
| $22,500 to $24,999 | 105 (2.3%) | 89 (1.8%) |
| $25,000 to $29,999 | 247 (5.4%) | 136 (2.8%) |
| $30,000 to $34,999 | 246 (5.4%) | 373 (7.6%) |
| $35,000 to $39,999 | 241 (5.3%) | 100 (2.1%) |
| $40,000 to $44,999 | 314 (6.9%) | 144 (3.0%) |
| $45,000 to $49,999 | 203 (4.5%) | 155 (3.2%) |
| $50,000 to $54,999 | 66 (1.5%) | 214 (4.4%) |
| $55,000 to $64,999 | 199 (4.4%) | 122 (2.5%) |
| $65,000 to $74,999 | 231 (5.1%) | 31 (0.6%) |
| $75,000 to $99,999 | 165 (3.6%) | 136 (2.8%) |
| $100,000+ | 471 (10.3%) | 256 (5.2%) |
| Total | 4,556 (100.0%) | 4,873 (100.0%) |
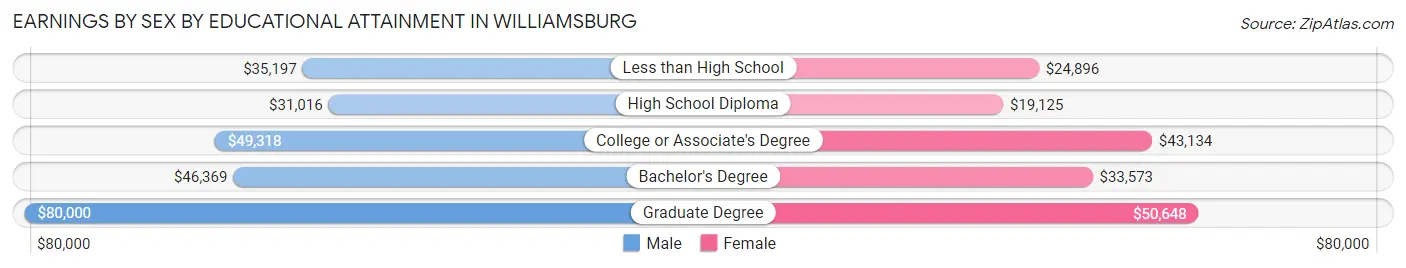
Earnings by Sex by Educational Attainment in Williamsburg
Average earnings in Williamsburg are $45,099 for men and $34,459 for women, a difference of 23.6%. Men with an educational attainment of graduate degree enjoy the highest average annual earnings of $80,000, while those with high school diploma education earn the least with $31,016. Women with an educational attainment of graduate degree earn the most with the average annual earnings of $50,648, while those with high school diploma education have the smallest earnings of $19,125.
| Educational Attainment | Male Income | Female Income |
| Less than High School | $35,197 | $24,896 |
| High School Diploma | $31,016 | $19,125 |
| College or Associate's Degree | $49,318 | $43,134 |
| Bachelor's Degree | $46,369 | $33,573 |
| Graduate Degree | $80,000 | $50,648 |
| Total | $45,099 | $34,459 |
Family Income in Williamsburg
Family Income Brackets in Williamsburg
According to the Williamsburg family income data, there are 439 families falling into the $200,000+ income range, which is the most common income bracket and makes up 18.0% of all families. Conversely, the $10,000 to $14,999 income bracket is the least frequent group with only 10 families (0.4%) belonging to this category.
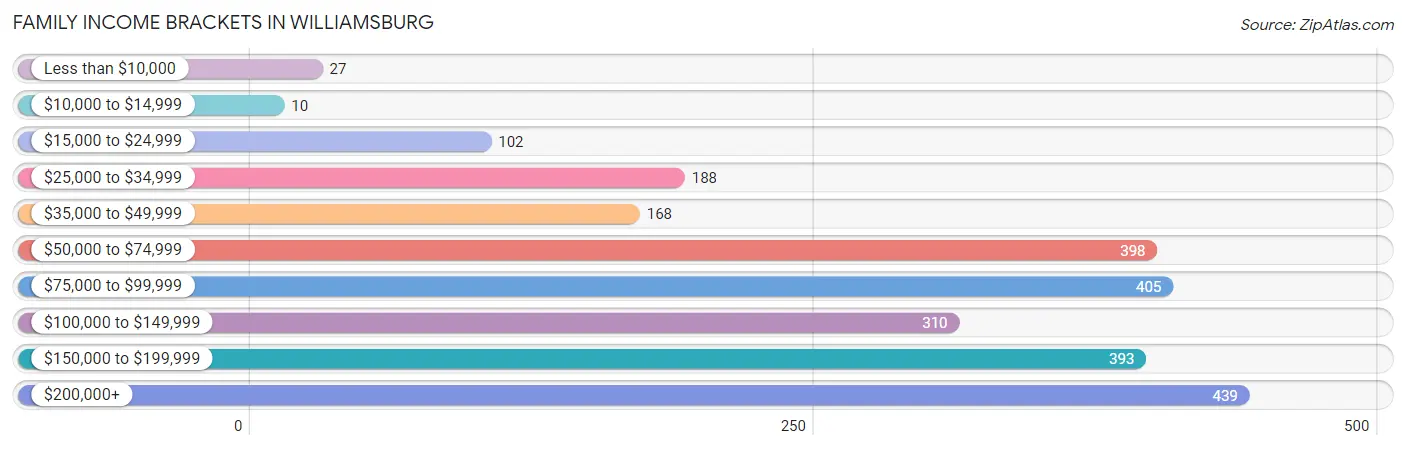
| Income Bracket | # Families | % Families |
| Less than $10,000 | 27 | 1.1% |
| $10,000 to $14,999 | 10 | 0.4% |
| $15,000 to $24,999 | 102 | 4.2% |
| $25,000 to $34,999 | 188 | 7.7% |
| $35,000 to $49,999 | 168 | 6.9% |
| $50,000 to $74,999 | 398 | 16.3% |
| $75,000 to $99,999 | 405 | 16.6% |
| $100,000 to $149,999 | 310 | 12.7% |
| $150,000 to $199,999 | 393 | 16.1% |
| $200,000+ | 439 | 18.0% |
Family Income by Famaliy Size in Williamsburg
3-person families (594 | 24.3%) account for the highest median family income in Williamsburg with $114,083 per family, while 2-person families (1,352 | 55.4%) have the highest median income of $43,668 per family member.
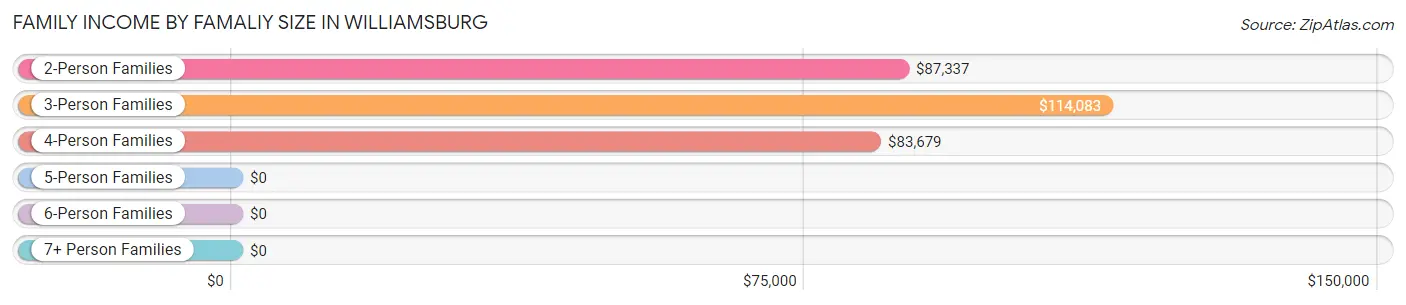
| Income Bracket | # Families | Median Income |
| 2-Person Families | 1,352 (55.4%) | $87,337 |
| 3-Person Families | 594 (24.3%) | $114,083 |
| 4-Person Families | 387 (15.9%) | $83,679 |
| 5-Person Families | 85 (3.5%) | $0 |
| 6-Person Families | 22 (0.9%) | $0 |
| 7+ Person Families | 0 (0.0%) | $0 |
| Total | 2,440 (100.0%) | $94,184 |
Family Income by Number of Earners in Williamsburg
The median family income in Williamsburg is $94,184, with families comprising 3+ earners (304) having the highest median family income of $176,387, while families with 1 earner (754) have the lowest median family income of $57,266, accounting for 12.5% and 30.9% of families, respectively.
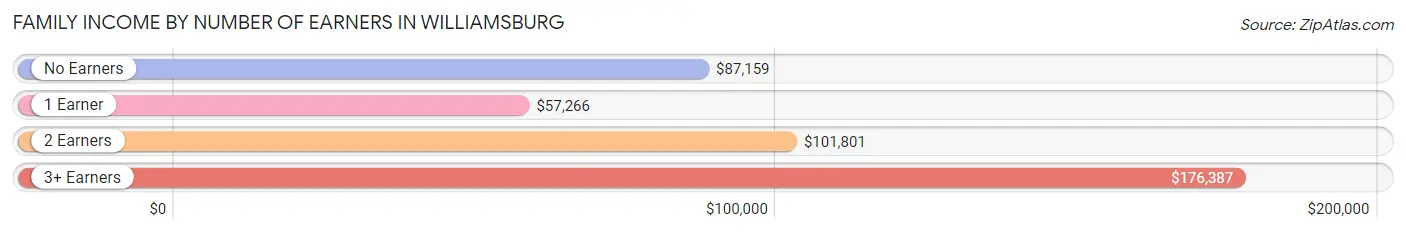
| Number of Earners | # Families | Median Income |
| No Earners | 513 (21.0%) | $87,159 |
| 1 Earner | 754 (30.9%) | $57,266 |
| 2 Earners | 869 (35.6%) | $101,801 |
| 3+ Earners | 304 (12.5%) | $176,387 |
| Total | 2,440 (100.0%) | $94,184 |
Household Income in Williamsburg
Household Income Brackets in Williamsburg
With 835 households falling in the category, the $50,000 to $74,999 income range is the most frequent in Williamsburg, accounting for 17.1% of all households. In contrast, only 63 households (1.3%) fall into the $10,000 to $14,999 income bracket, making it the least populous group.
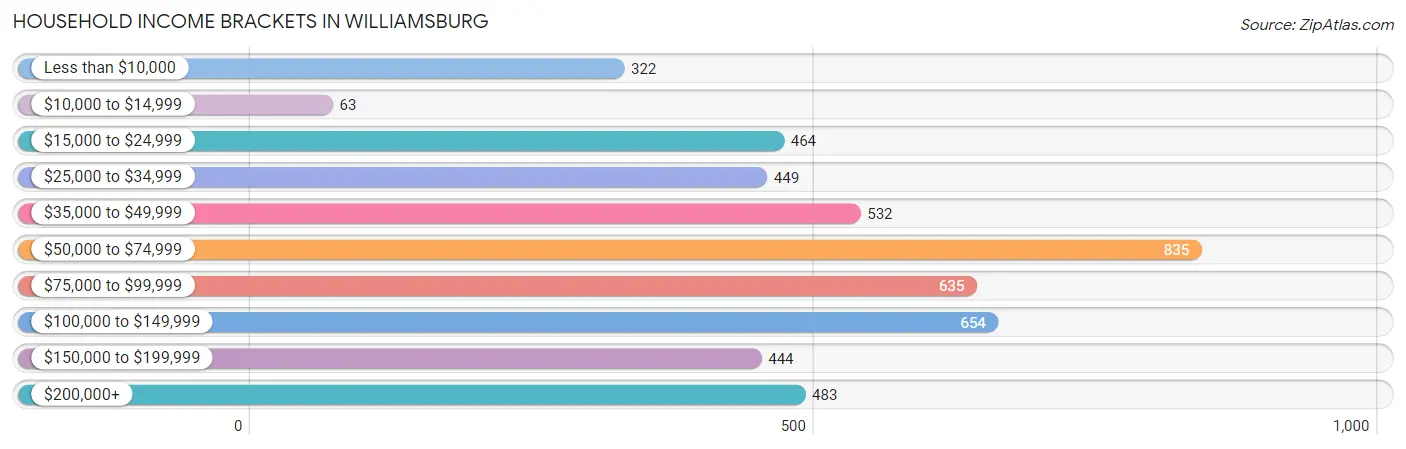
| Income Bracket | # Households | % Households |
| Less than $10,000 | 322 | 6.6% |
| $10,000 to $14,999 | 63 | 1.3% |
| $15,000 to $24,999 | 464 | 9.5% |
| $25,000 to $34,999 | 449 | 9.2% |
| $35,000 to $49,999 | 532 | 10.9% |
| $50,000 to $74,999 | 835 | 17.1% |
| $75,000 to $99,999 | 635 | 13.0% |
| $100,000 to $149,999 | 654 | 13.4% |
| $150,000 to $199,999 | 444 | 9.1% |
| $200,000+ | 483 | 9.9% |
Household Income by Householder Age in Williamsburg
The median household income in Williamsburg is $66,815, with the highest median household income of $93,444 found in the 45 to 64 years age bracket for the primary householder. A total of 1,367 households (28.0%) fall into this category. Meanwhile, the 15 to 24 years age bracket for the primary householder has the lowest median household income of $0, with 489 households (10.0%) in this group.
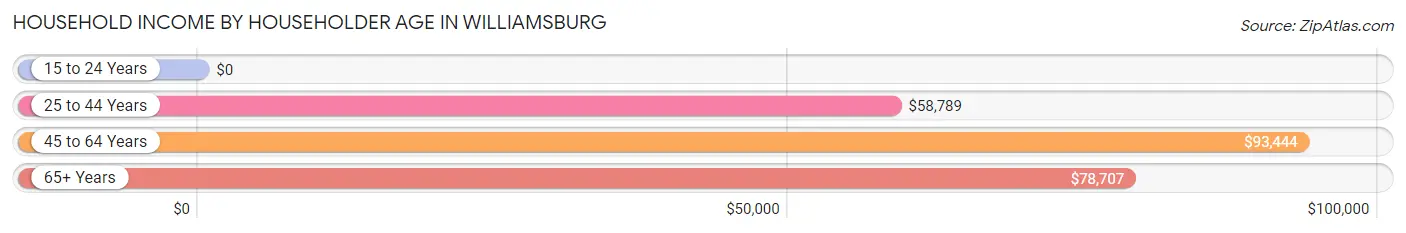
| Income Bracket | # Households | Median Income |
| 15 to 24 Years | 489 (10.0%) | $0 |
| 25 to 44 Years | 1,316 (27.0%) | $58,789 |
| 45 to 64 Years | 1,367 (28.0%) | $93,444 |
| 65+ Years | 1,710 (35.0%) | $78,707 |
| Total | 4,882 (100.0%) | $66,815 |
Poverty in Williamsburg
Income Below Poverty by Sex and Age in Williamsburg
With 13.1% poverty level for males and 14.2% for females among the residents of Williamsburg, 18 to 24 year old males and 18 to 24 year old females are the most vulnerable to poverty, with 457 males (48.2%) and 402 females (57.4%) in their respective age groups living below the poverty level.
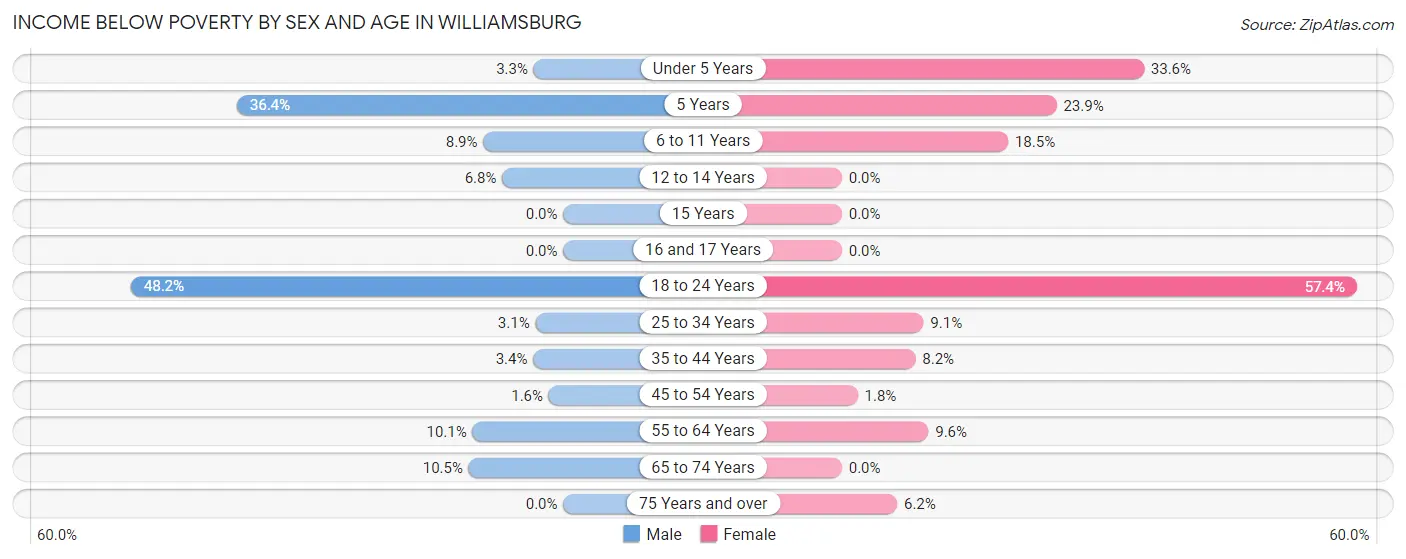
| Age Bracket | Male | Female |
| Under 5 Years | 8 (3.3%) | 36 (33.6%) |
| 5 Years | 20 (36.4%) | 11 (23.9%) |
| 6 to 11 Years | 18 (8.9%) | 62 (18.5%) |
| 12 to 14 Years | 20 (6.8%) | 0 (0.0%) |
| 15 Years | 0 (0.0%) | 0 (0.0%) |
| 16 and 17 Years | 0 (0.0%) | 0 (0.0%) |
| 18 to 24 Years | 457 (48.2%) | 402 (57.4%) |
| 25 to 34 Years | 24 (3.1%) | 65 (9.1%) |
| 35 to 44 Years | 19 (3.4%) | 48 (8.2%) |
| 45 to 54 Years | 6 (1.6%) | 8 (1.8%) |
| 55 to 64 Years | 64 (10.1%) | 76 (9.6%) |
| 65 to 74 Years | 69 (10.5%) | 0 (0.0%) |
| 75 Years and over | 0 (0.0%) | 38 (6.1%) |
| Total | 705 (13.1%) | 746 (14.2%) |
Income Above Poverty by Sex and Age in Williamsburg
According to the poverty statistics in Williamsburg, males aged 15 years and females aged 12 to 14 years are the age groups that are most secure financially, with 100.0% of males and 100.0% of females in these age groups living above the poverty line.
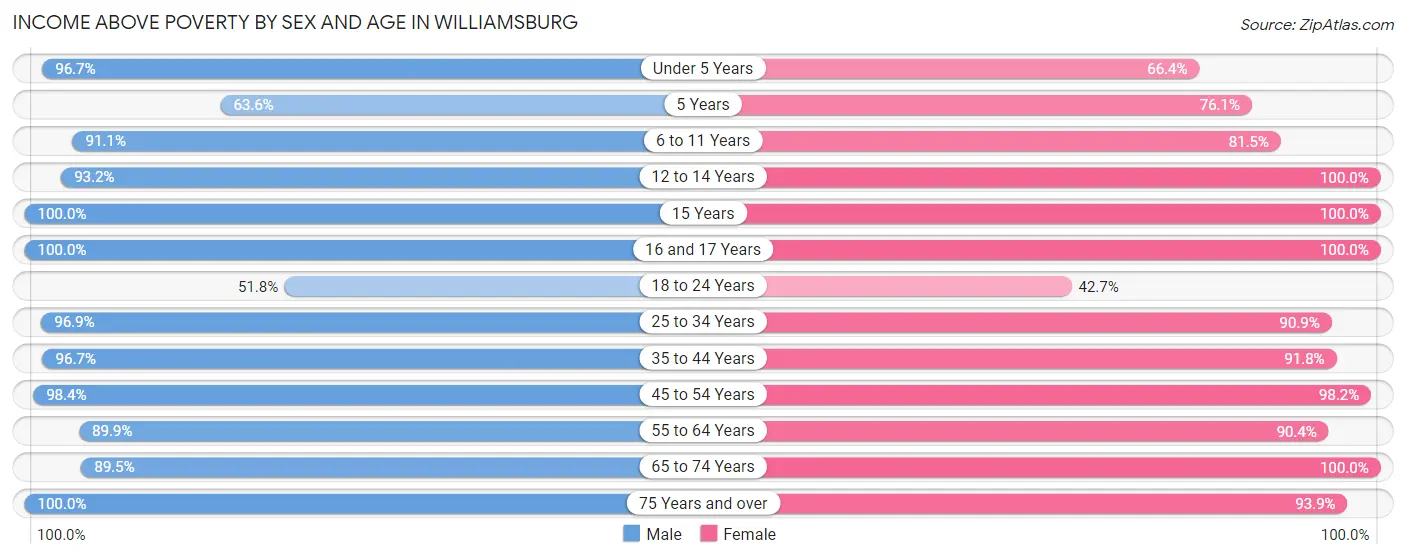
| Age Bracket | Male | Female |
| Under 5 Years | 235 (96.7%) | 71 (66.4%) |
| 5 Years | 35 (63.6%) | 35 (76.1%) |
| 6 to 11 Years | 184 (91.1%) | 273 (81.5%) |
| 12 to 14 Years | 274 (93.2%) | 42 (100.0%) |
| 15 Years | 33 (100.0%) | 23 (100.0%) |
| 16 and 17 Years | 82 (100.0%) | 120 (100.0%) |
| 18 to 24 Years | 492 (51.8%) | 299 (42.6%) |
| 25 to 34 Years | 751 (96.9%) | 650 (90.9%) |
| 35 to 44 Years | 549 (96.7%) | 538 (91.8%) |
| 45 to 54 Years | 366 (98.4%) | 447 (98.2%) |
| 55 to 64 Years | 569 (89.9%) | 713 (90.4%) |
| 65 to 74 Years | 586 (89.5%) | 728 (100.0%) |
| 75 Years and over | 503 (100.0%) | 580 (93.9%) |
| Total | 4,659 (86.9%) | 4,519 (85.8%) |
Income Below Poverty Among Married-Couple Families in Williamsburg
The poverty statistics for married-couple families in Williamsburg show that 2.1% or 40 of the total 1,882 families live below the poverty line. Families with 1 or 2 children have the highest poverty rate of 4.9%, comprising of 22 families. On the other hand, families with 3 or 4 children have the lowest poverty rate of 0.0%, which includes 0 families.
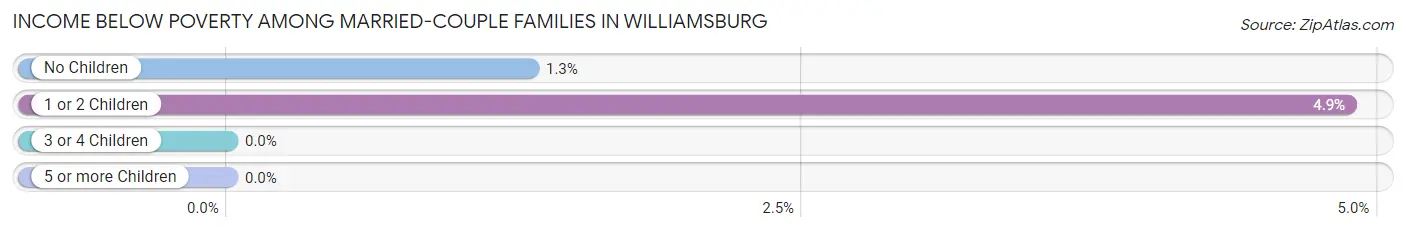
| Children | Above Poverty | Below Poverty |
| No Children | 1,351 (98.7%) | 18 (1.3%) |
| 1 or 2 Children | 430 (95.1%) | 22 (4.9%) |
| 3 or 4 Children | 61 (100.0%) | 0 (0.0%) |
| 5 or more Children | 0 (0.0%) | 0 (0.0%) |
| Total | 1,842 (97.9%) | 40 (2.1%) |
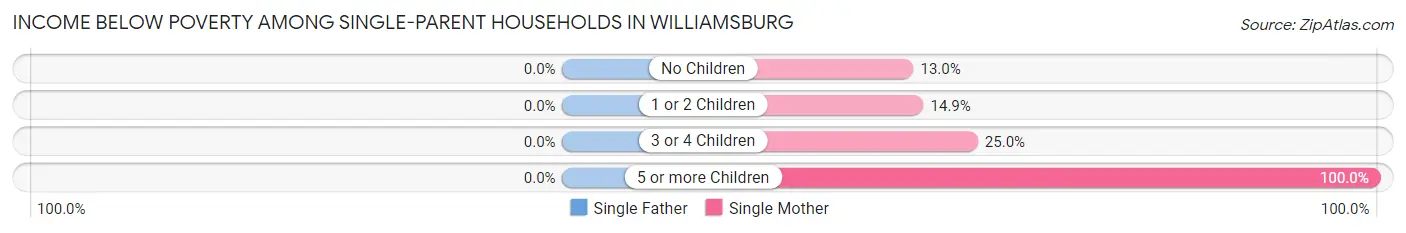
Income Below Poverty Among Single-Parent Households in Williamsburg
| Children | Single Father | Single Mother |
| No Children | 0 (0.0%) | 28 (13.0%) |
| 1 or 2 Children | 0 (0.0%) | 21 (14.9%) |
| 3 or 4 Children | 0 (0.0%) | 24 (25.0%) |
| 5 or more Children | 0 (0.0%) | 5 (100.0%) |
| Total | 0 (0.0%) | 78 (17.1%) |
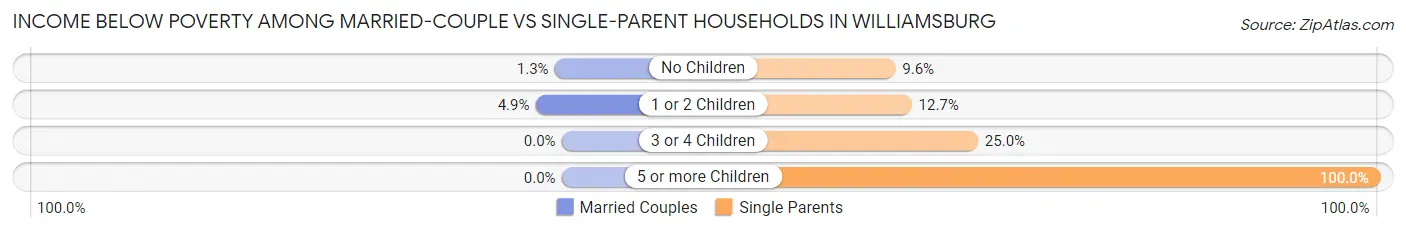
Income Below Poverty Among Married-Couple vs Single-Parent Households in Williamsburg
The poverty data for Williamsburg shows that 40 of the married-couple family households (2.1%) and 78 of the single-parent households (14.0%) are living below the poverty level. Within the married-couple family households, those with 1 or 2 children have the highest poverty rate, with 22 households (4.9%) falling below the poverty line. Among the single-parent households, those with 5 or more children have the highest poverty rate, with 5 household (100.0%) living below poverty.
| Children | Married-Couple Families | Single-Parent Households |
| No Children | 18 (1.3%) | 28 (9.6%) |
| 1 or 2 Children | 22 (4.9%) | 21 (12.7%) |
| 3 or 4 Children | 0 (0.0%) | 24 (25.0%) |
| 5 or more Children | 0 (0.0%) | 5 (100.0%) |
| Total | 40 (2.1%) | 78 (14.0%) |
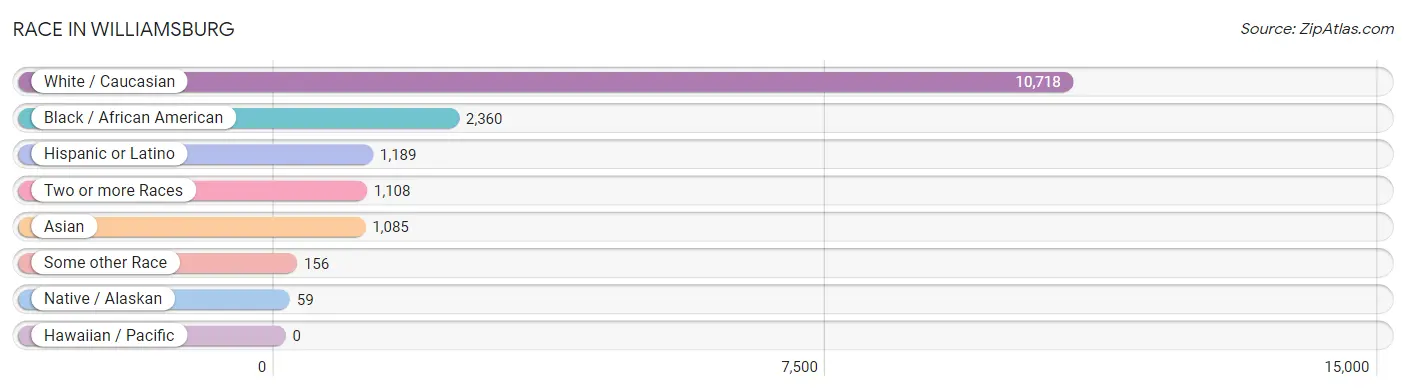
Race in Williamsburg
The most populous races in Williamsburg are White / Caucasian (10,718 | 69.2%), Black / African American (2,360 | 15.2%), and Hispanic or Latino (1,189 | 7.7%).
| Race | # Population | % Population |
| Asian | 1,085 | 7.0% |
| Black / African American | 2,360 | 15.2% |
| Hawaiian / Pacific | 0 | 0.0% |
| Hispanic or Latino | 1,189 | 7.7% |
| Native / Alaskan | 59 | 0.4% |
| White / Caucasian | 10,718 | 69.2% |
| Two or more Races | 1,108 | 7.1% |
| Some other Race | 156 | 1.0% |
| Total | 15,486 | 100.0% |
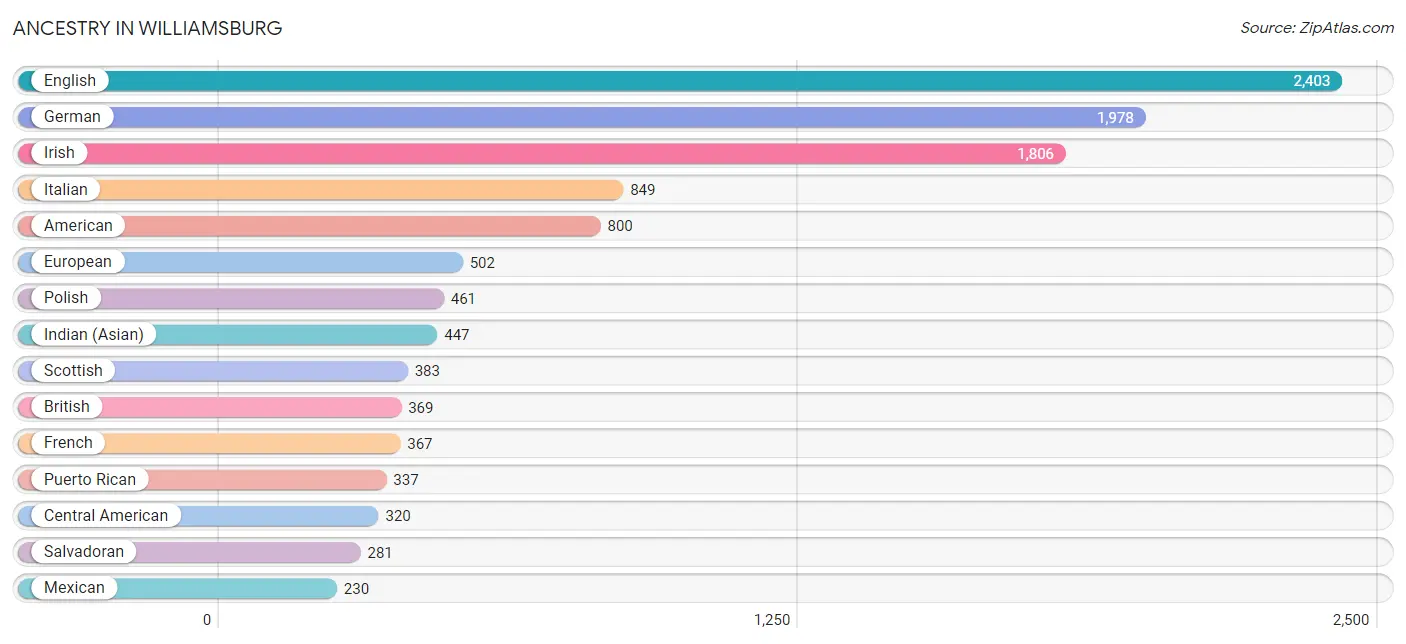
Ancestry in Williamsburg
The most populous ancestries reported in Williamsburg are English (2,403 | 15.5%), German (1,978 | 12.8%), Irish (1,806 | 11.7%), Italian (849 | 5.5%), and American (800 | 5.2%), together accounting for 50.6% of all Williamsburg residents.
| Ancestry | # Population | % Population |
| African | 117 | 0.8% |
| Albanian | 62 | 0.4% |
| Aleut | 13 | 0.1% |
| American | 800 | 5.2% |
| Arab | 213 | 1.4% |
| Argentinean | 15 | 0.1% |
| Australian | 14 | 0.1% |
| Austrian | 4 | 0.0% |
| Bahamian | 21 | 0.1% |
| Belgian | 21 | 0.1% |
| Bhutanese | 86 | 0.6% |
| Blackfeet | 2 | 0.0% |
| Bolivian | 21 | 0.1% |
| Brazilian | 16 | 0.1% |
| British | 369 | 2.4% |
| Bulgarian | 23 | 0.2% |
| Burmese | 161 | 1.0% |
| Canadian | 17 | 0.1% |
| Central American | 320 | 2.1% |
| Central American Indian | 59 | 0.4% |
| Cherokee | 74 | 0.5% |
| Chilean | 34 | 0.2% |
| Colombian | 22 | 0.1% |
| Costa Rican | 4 | 0.0% |
| Croatian | 37 | 0.2% |
| Cuban | 53 | 0.3% |
| Czech | 56 | 0.4% |
| Czechoslovakian | 31 | 0.2% |
| Danish | 78 | 0.5% |
| Dutch | 90 | 0.6% |
| Eastern European | 58 | 0.4% |
| Ecuadorian | 11 | 0.1% |
| English | 2,403 | 15.5% |
| European | 502 | 3.2% |
| Filipino | 42 | 0.3% |
| Finnish | 15 | 0.1% |
| French | 367 | 2.4% |
| French Canadian | 145 | 0.9% |
| German | 1,978 | 12.8% |
| Greek | 45 | 0.3% |
| Honduran | 1 | 0.0% |
| Hungarian | 79 | 0.5% |
| Indian (Asian) | 447 | 2.9% |
| Iranian | 18 | 0.1% |
| Irish | 1,806 | 11.7% |
| Italian | 849 | 5.5% |
| Jamaican | 79 | 0.5% |
| Korean | 85 | 0.5% |
| Laotian | 22 | 0.1% |
| Latvian | 7 | 0.1% |
| Lebanese | 55 | 0.4% |
| Lithuanian | 75 | 0.5% |
| Mexican | 230 | 1.5% |
| Moroccan | 13 | 0.1% |
| New Zealander | 6 | 0.0% |
| Norwegian | 91 | 0.6% |
| Palestinian | 42 | 0.3% |
| Panamanian | 34 | 0.2% |
| Peruvian | 4 | 0.0% |
| Polish | 461 | 3.0% |
| Portuguese | 64 | 0.4% |
| Puerto Rican | 337 | 2.2% |
| Romanian | 78 | 0.5% |
| Russian | 97 | 0.6% |
| Salvadoran | 281 | 1.8% |
| Samoan | 20 | 0.1% |
| Scandinavian | 42 | 0.3% |
| Scotch-Irish | 226 | 1.5% |
| Scottish | 383 | 2.5% |
| Serbian | 41 | 0.3% |
| Slovak | 12 | 0.1% |
| South American | 164 | 1.1% |
| Spaniard | 42 | 0.3% |
| Spanish | 13 | 0.1% |
| Sri Lankan | 109 | 0.7% |
| Subsaharan African | 124 | 0.8% |
| Sudanese | 7 | 0.1% |
| Swedish | 109 | 0.7% |
| Syrian | 13 | 0.1% |
| Thai | 193 | 1.3% |
| Ukrainian | 100 | 0.6% |
| Venezuelan | 57 | 0.4% |
| Welsh | 84 | 0.5% | View All 83 Rows |
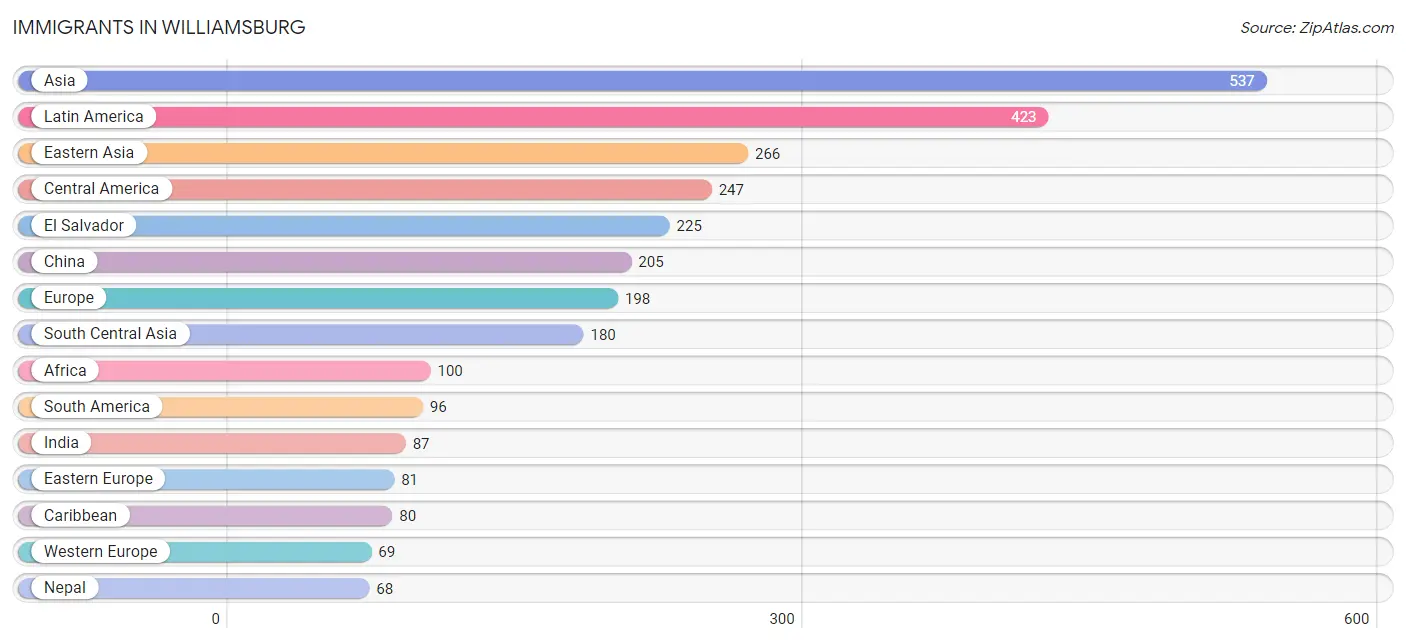
Immigrants in Williamsburg
The most numerous immigrant groups reported in Williamsburg came from Asia (537 | 3.5%), Latin America (423 | 2.7%), Eastern Asia (266 | 1.7%), Central America (247 | 1.6%), and El Salvador (225 | 1.5%), together accounting for 11.0% of all Williamsburg residents.
| Immigration Origin | # Population | % Population |
| Africa | 100 | 0.6% |
| Argentina | 3 | 0.0% |
| Asia | 537 | 3.5% |
| Australia | 32 | 0.2% |
| Bahamas | 21 | 0.1% |
| Belarus | 13 | 0.1% |
| Bolivia | 21 | 0.1% |
| Bosnia and Herzegovina | 20 | 0.1% |
| Brazil | 10 | 0.1% |
| Canada | 17 | 0.1% |
| Caribbean | 80 | 0.5% |
| Central America | 247 | 1.6% |
| China | 205 | 1.3% |
| Denmark | 7 | 0.1% |
| Eastern Africa | 42 | 0.3% |
| Eastern Asia | 266 | 1.7% |
| Eastern Europe | 81 | 0.5% |
| Ecuador | 25 | 0.2% |
| Egypt | 13 | 0.1% |
| El Salvador | 225 | 1.5% |
| Europe | 198 | 1.3% |
| France | 23 | 0.2% |
| Honduras | 1 | 0.0% |
| India | 87 | 0.6% |
| Indonesia | 13 | 0.1% |
| Iran | 25 | 0.2% |
| Italy | 16 | 0.1% |
| Jamaica | 59 | 0.4% |
| Japan | 2 | 0.0% |
| Korea | 59 | 0.4% |
| Latin America | 423 | 2.7% |
| Lebanon | 12 | 0.1% |
| Lithuania | 10 | 0.1% |
| Mexico | 8 | 0.1% |
| Middle Africa | 30 | 0.2% |
| Morocco | 15 | 0.1% |
| Nepal | 68 | 0.4% |
| Netherlands | 35 | 0.2% |
| Northern Africa | 28 | 0.2% |
| Northern Europe | 32 | 0.2% |
| Oceania | 32 | 0.2% |
| Panama | 13 | 0.1% |
| Philippines | 33 | 0.2% |
| Poland | 9 | 0.1% |
| Russia | 1 | 0.0% |
| Serbia | 11 | 0.1% |
| South America | 96 | 0.6% |
| South Central Asia | 180 | 1.2% |
| South Eastern Asia | 67 | 0.4% |
| Southern Europe | 16 | 0.1% |
| Switzerland | 11 | 0.1% |
| Ukraine | 17 | 0.1% |
| Venezuela | 37 | 0.2% |
| Vietnam | 21 | 0.1% |
| Western Asia | 24 | 0.2% |
| Western Europe | 69 | 0.4% |
| Zaire | 30 | 0.2% | View All 57 Rows |
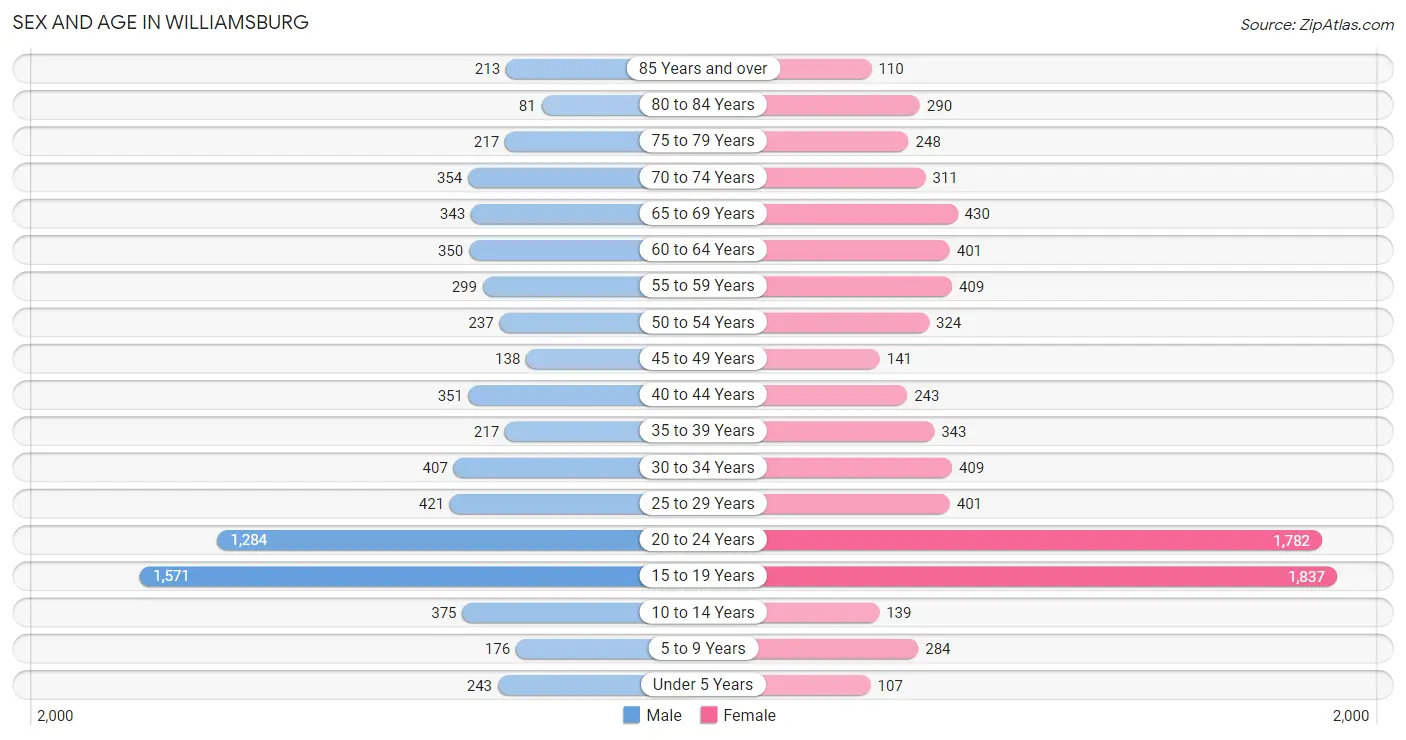
Sex and Age in Williamsburg
Sex and Age in Williamsburg
The most populous age groups in Williamsburg are 15 to 19 Years (1,571 | 21.6%) for men and 15 to 19 Years (1,837 | 22.4%) for women.
| Age Bracket | Male | Female |
| Under 5 Years | 243 (3.3%) | 107 (1.3%) |
| 5 to 9 Years | 176 (2.4%) | 284 (3.5%) |
| 10 to 14 Years | 375 (5.1%) | 139 (1.7%) |
| 15 to 19 Years | 1,571 (21.6%) | 1,837 (22.4%) |
| 20 to 24 Years | 1,284 (17.6%) | 1,782 (21.7%) |
| 25 to 29 Years | 421 (5.8%) | 401 (4.9%) |
| 30 to 34 Years | 407 (5.6%) | 409 (5.0%) |
| 35 to 39 Years | 217 (3.0%) | 343 (4.2%) |
| 40 to 44 Years | 351 (4.8%) | 243 (3.0%) |
| 45 to 49 Years | 138 (1.9%) | 141 (1.7%) |
| 50 to 54 Years | 237 (3.3%) | 324 (4.0%) |
| 55 to 59 Years | 299 (4.1%) | 409 (5.0%) |
| 60 to 64 Years | 350 (4.8%) | 401 (4.9%) |
| 65 to 69 Years | 343 (4.7%) | 430 (5.2%) |
| 70 to 74 Years | 354 (4.9%) | 311 (3.8%) |
| 75 to 79 Years | 217 (3.0%) | 248 (3.0%) |
| 80 to 84 Years | 81 (1.1%) | 290 (3.5%) |
| 85 Years and over | 213 (2.9%) | 110 (1.3%) |
| Total | 7,277 (100.0%) | 8,209 (100.0%) |
Families and Households in Williamsburg
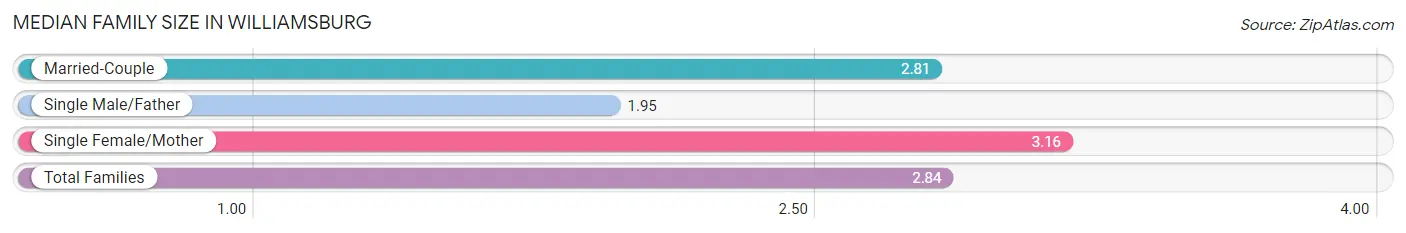
Median Family Size in Williamsburg
The median family size in Williamsburg is 2.84 persons per family, with single female/mother families (457 | 18.7%) accounting for the largest median family size of 3.16 persons per family. On the other hand, single male/father families (101 | 4.1%) represent the smallest median family size with 1.95 persons per family.
| Family Type | # Families | Family Size |
| Married-Couple | 1,882 (77.1%) | 2.81 |
| Single Male/Father | 101 (4.1%) | 1.95 |
| Single Female/Mother | 457 (18.7%) | 3.16 |
| Total Families | 2,440 (100.0%) | 2.84 |
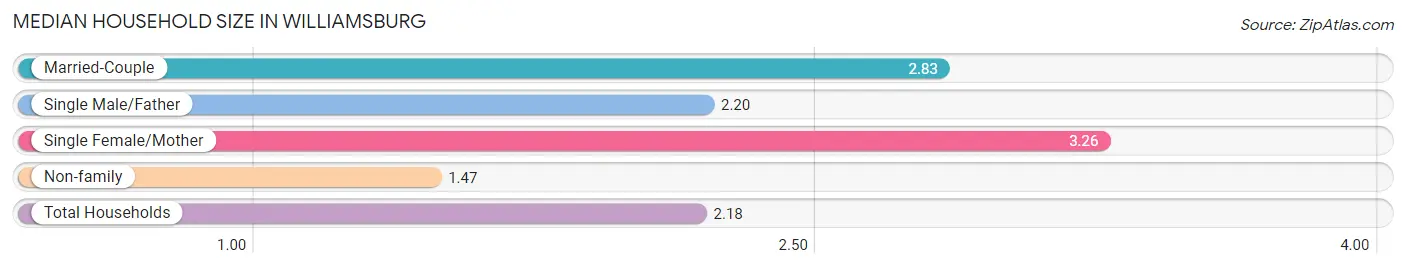
Median Household Size in Williamsburg
The median household size in Williamsburg is 2.18 persons per household, with single female/mother households (457 | 9.4%) accounting for the largest median household size of 3.26 persons per household. non-family households (2,442 | 50.0%) represent the smallest median household size with 1.47 persons per household.
| Household Type | # Households | Household Size |
| Married-Couple | 1,882 (38.6%) | 2.83 |
| Single Male/Father | 101 (2.1%) | 2.20 |
| Single Female/Mother | 457 (9.4%) | 3.26 |
| Non-family | 2,442 (50.0%) | 1.47 |
| Total Households | 4,882 (100.0%) | 2.18 |
Household Size by Marriage Status in Williamsburg
Out of a total of 4,882 households in Williamsburg, 2,440 (50.0%) are family households, while 2,442 (50.0%) are nonfamily households. The most numerous type of family households are 2-person households, comprising 1,231, and the most common type of nonfamily households are 1-person households, comprising 1,860.
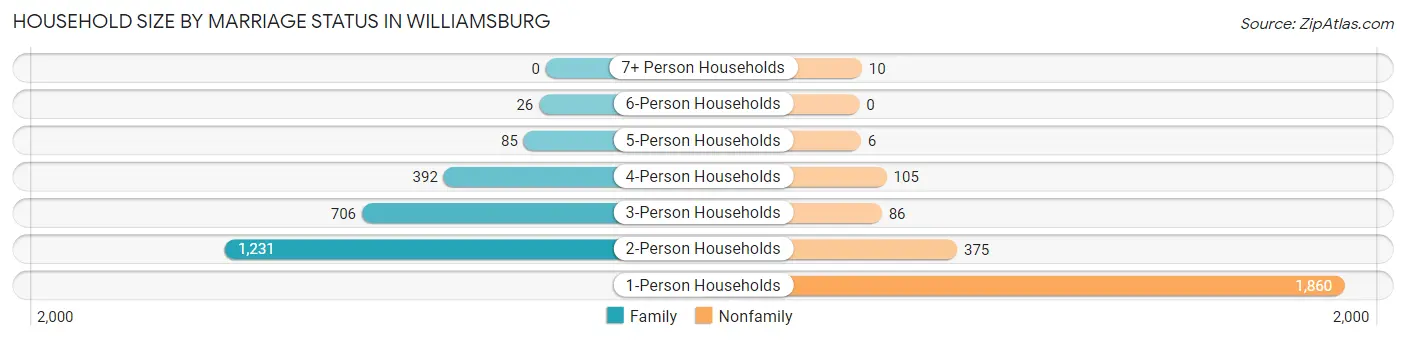
| Household Size | Family Households | Nonfamily Households |
| 1-Person Households | - | 1,860 (38.1%) |
| 2-Person Households | 1,231 (25.2%) | 375 (7.7%) |
| 3-Person Households | 706 (14.5%) | 86 (1.8%) |
| 4-Person Households | 392 (8.0%) | 105 (2.1%) |
| 5-Person Households | 85 (1.7%) | 6 (0.1%) |
| 6-Person Households | 26 (0.5%) | 0 (0.0%) |
| 7+ Person Households | 0 (0.0%) | 10 (0.2%) |
| Total | 2,440 (50.0%) | 2,442 (50.0%) |
Female Fertility in Williamsburg
Fertility by Age in Williamsburg
Average fertility rate in Williamsburg is 20.0 births per 1,000 women. Women in the age bracket of 15 to 19 years have the highest fertility rate with 36.0 births per 1,000 women. Women in the age bracket of 15 to 19 years acount for 63.5% of all women with births.
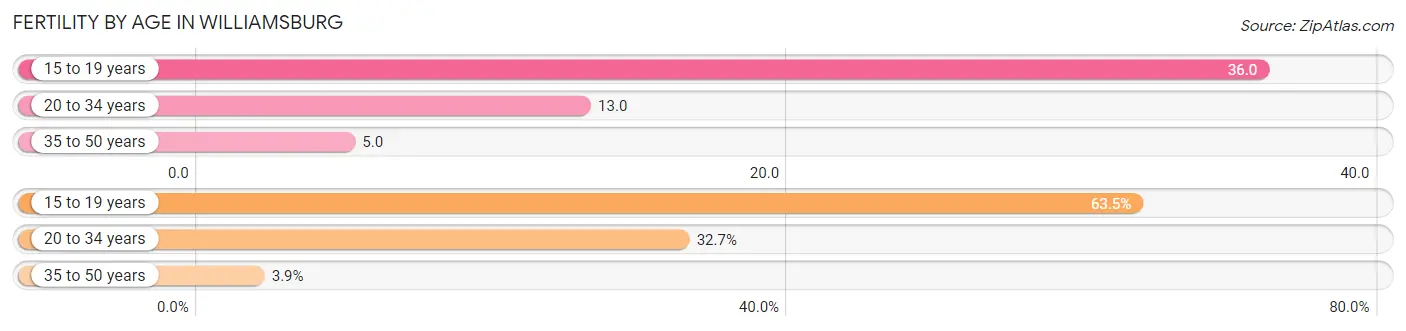
| Age Bracket | Women with Births | Births / 1,000 Women |
| 15 to 19 years | 66 (63.5%) | 36.0 |
| 20 to 34 years | 34 (32.7%) | 13.0 |
| 35 to 50 years | 4 (3.8%) | 5.0 |
| Total | 104 (100.0%) | 20.0 |
Fertility by Age by Marriage Status in Williamsburg
26.9% of women with births (104) in Williamsburg are married. The highest percentage of unmarried women with births falls into 15 to 19 years age bracket with 100.0% of them unmarried at the time of birth, while the lowest percentage of unmarried women with births belong to 20 to 34 years age bracket with 17.6% of them unmarried.
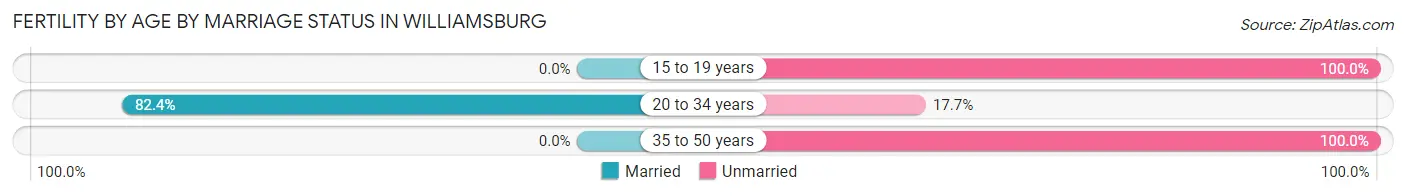
| Age Bracket | Married | Unmarried |
| 15 to 19 years | 0 (0.0%) | 66 (100.0%) |
| 20 to 34 years | 28 (82.4%) | 6 (17.6%) |
| 35 to 50 years | 0 (0.0%) | 4 (100.0%) |
| Total | 28 (26.9%) | 76 (73.1%) |
Fertility by Education in Williamsburg
Average fertility rate in Williamsburg is 20.0 births per 1,000 women. Women with the education attainment of high school diploma have the highest fertility rate of 113.0 births per 1,000 women, while women with the education attainment of college or associate's degree have the lowest fertility at 3.0 births per 1,000 women. Women with the education attainment of high school diploma represent 60.6% of all women with births.
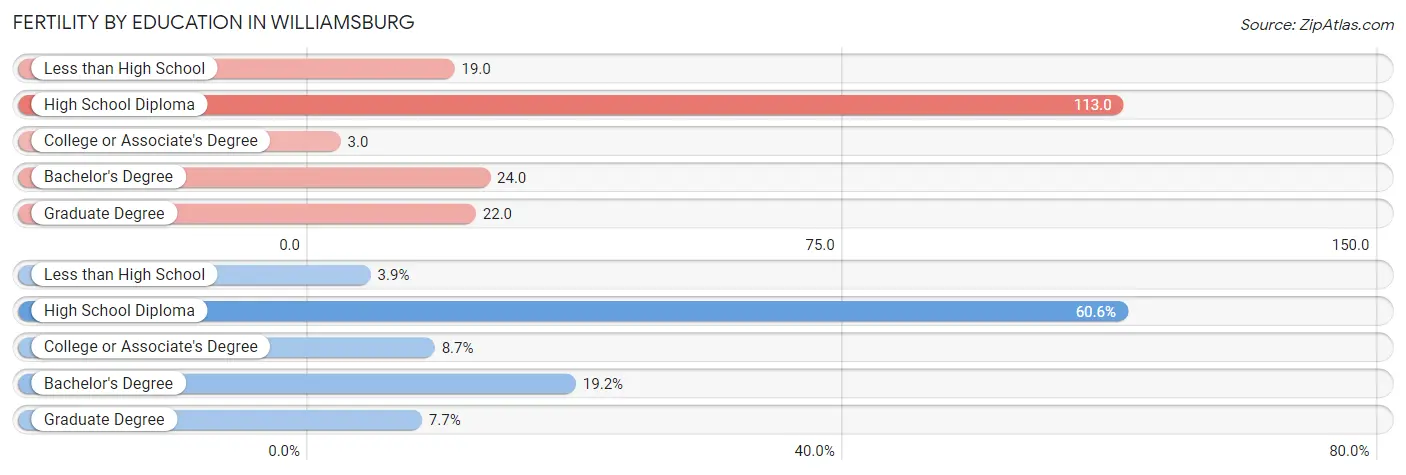
| Educational Attainment | Women with Births | Births / 1,000 Women |
| Less than High School | 4 (3.8%) | 19.0 |
| High School Diploma | 63 (60.6%) | 113.0 |
| College or Associate's Degree | 9 (8.6%) | 3.0 |
| Bachelor's Degree | 20 (19.2%) | 24.0 |
| Graduate Degree | 8 (7.7%) | 22.0 |
| Total | 104 (100.0%) | 20.0 |
Fertility by Education by Marriage Status in Williamsburg
73.1% of women with births in Williamsburg are unmarried. Women with the educational attainment of bachelor's degree are most likely to be married with 100.0% of them married at childbirth, while women with the educational attainment of less than high school are least likely to be married with 100.0% of them unmarried at childbirth.
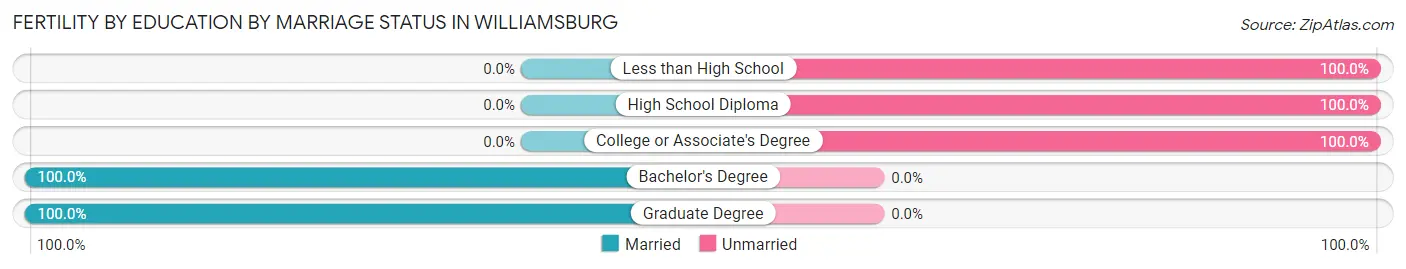
| Educational Attainment | Married | Unmarried |
| Less than High School | 0 (0.0%) | 4 (100.0%) |
| High School Diploma | 0 (0.0%) | 63 (100.0%) |
| College or Associate's Degree | 0 (0.0%) | 9 (100.0%) |
| Bachelor's Degree | 20 (100.0%) | 0 (0.0%) |
| Graduate Degree | 8 (100.0%) | 0 (0.0%) |
| Total | 28 (26.9%) | 76 (73.1%) |
Employment Characteristics in Williamsburg
Employment by Class of Employer in Williamsburg
Among the 6,444 employed individuals in Williamsburg, private company employees (3,890 | 60.4%), state government employees (748 | 11.6%), and not-for-profit organizations (688 | 10.7%) make up the most common classes of employment.
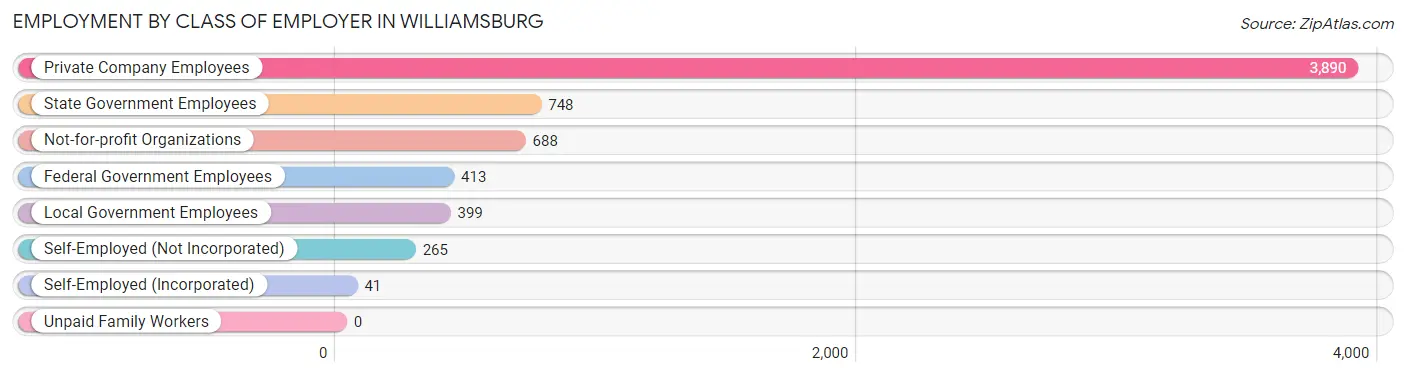
| Employer Class | # Employees | % Employees |
| Private Company Employees | 3,890 | 60.4% |
| Self-Employed (Incorporated) | 41 | 0.6% |
| Self-Employed (Not Incorporated) | 265 | 4.1% |
| Not-for-profit Organizations | 688 | 10.7% |
| Local Government Employees | 399 | 6.2% |
| State Government Employees | 748 | 11.6% |
| Federal Government Employees | 413 | 6.4% |
| Unpaid Family Workers | 0 | 0.0% |
| Total | 6,444 | 100.0% |
Employment Status by Age in Williamsburg
According to the labor force statistics for Williamsburg, out of the total population over 16 years of age (14,106), 49.4% or 6,968 individuals are in the labor force, with 6.0% or 418 of them unemployed. The age group with the highest labor force participation rate is 30 to 34 years, with 94.7% or 773 individuals in the labor force. Within the labor force, the 16 to 19 years age range has the highest percentage of unemployed individuals, with 14.3% or 124 of them being unemployed.
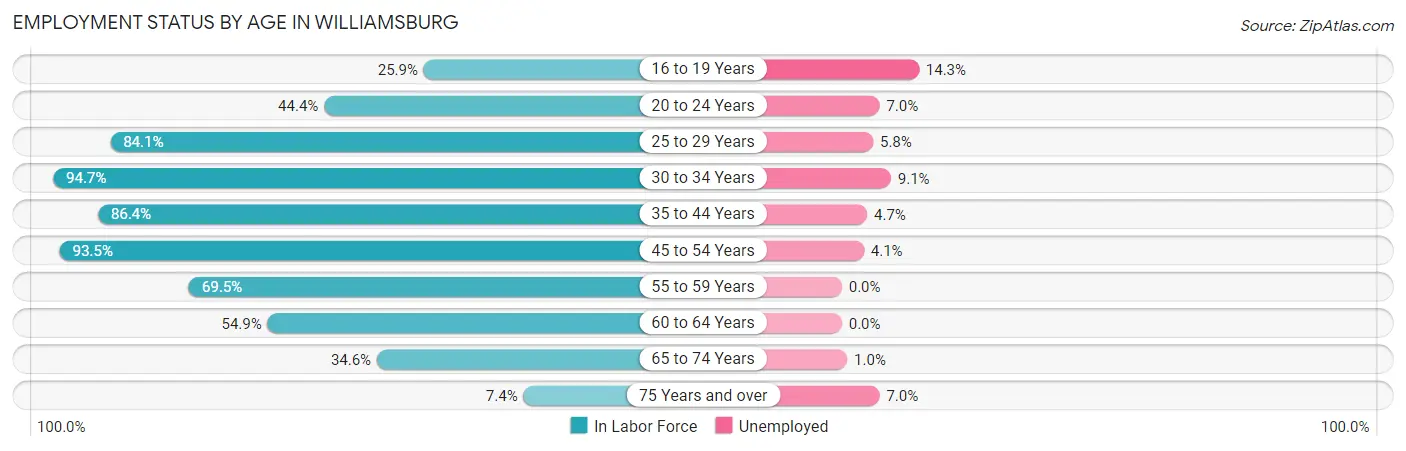
| Age Bracket | In Labor Force | Unemployed |
| 16 to 19 Years | 868 (25.9%) | 124 (14.3%) |
| 20 to 24 Years | 1,361 (44.4%) | 95 (7.0%) |
| 25 to 29 Years | 691 (84.1%) | 40 (5.8%) |
| 30 to 34 Years | 773 (94.7%) | 70 (9.1%) |
| 35 to 44 Years | 997 (86.4%) | 47 (4.7%) |
| 45 to 54 Years | 785 (93.5%) | 32 (4.1%) |
| 55 to 59 Years | 492 (69.5%) | 0 (0.0%) |
| 60 to 64 Years | 412 (54.9%) | 0 (0.0%) |
| 65 to 74 Years | 498 (34.6%) | 5 (1.0%) |
| 75 Years and over | 86 (7.4%) | 6 (7.0%) |
| Total | 6,968 (49.4%) | 418 (6.0%) |
Employment Status by Educational Attainment in Williamsburg
According to labor force statistics for Williamsburg, 81.5% of individuals (4,149) out of the total population between 25 and 64 years of age (5,091) are in the labor force, with 4.5% or 187 of them being unemployed. The group with the highest labor force participation rate are those with the educational attainment of high school diploma, with 85.7% or 766 individuals in the labor force. Within the labor force, individuals with high school diploma education have the highest percentage of unemployment, with 9.0% or 69 of them being unemployed.
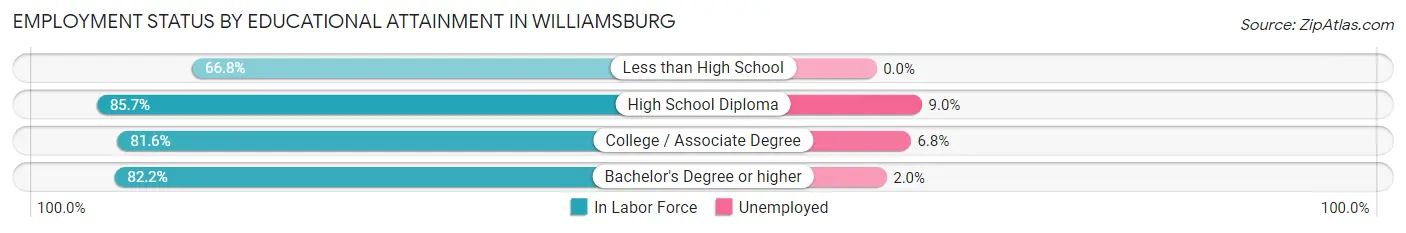
| Educational Attainment | In Labor Force | Unemployed |
| Less than High School | 249 (66.8%) | 0 (0.0%) |
| High School Diploma | 766 (85.7%) | 80 (9.0%) |
| College / Associate Degree | 1,203 (81.6%) | 100 (6.8%) |
| Bachelor's Degree or higher | 1,932 (82.2%) | 47 (2.0%) |
| Total | 4,149 (81.5%) | 229 (4.5%) |
Employment Occupations by Sex in Williamsburg
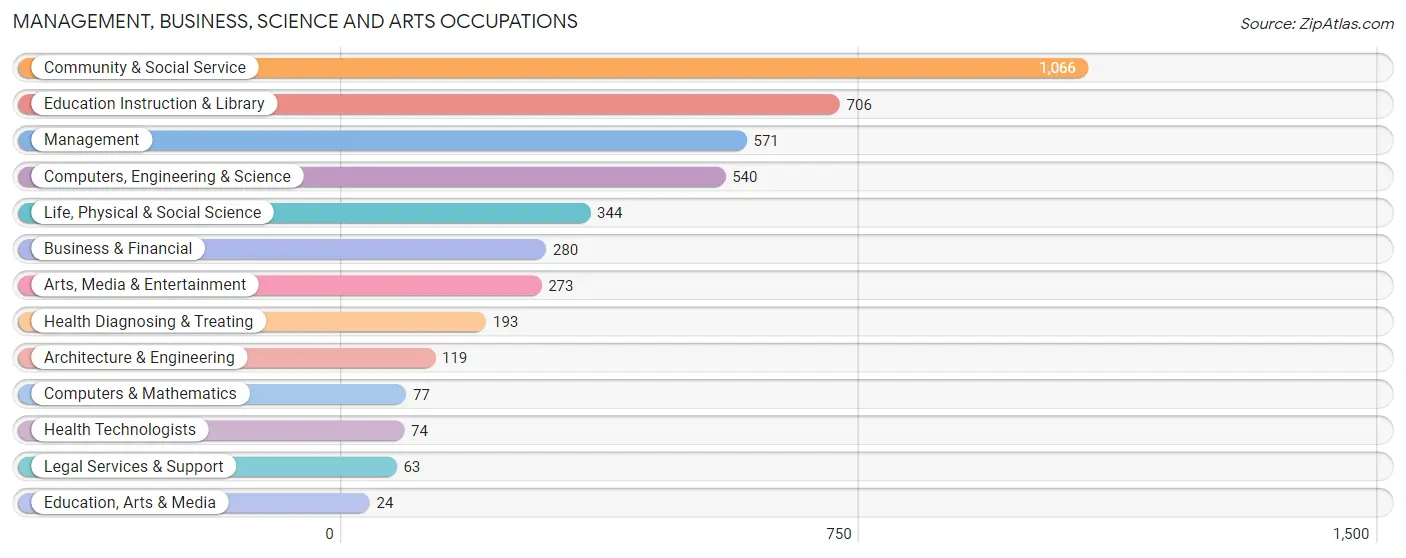
Management, Business, Science and Arts Occupations
The most common Management, Business, Science and Arts occupations in Williamsburg are Community & Social Service (1,066 | 16.6%), Education Instruction & Library (706 | 11.0%), Management (571 | 8.9%), Computers, Engineering & Science (540 | 8.4%), and Life, Physical & Social Science (344 | 5.4%).
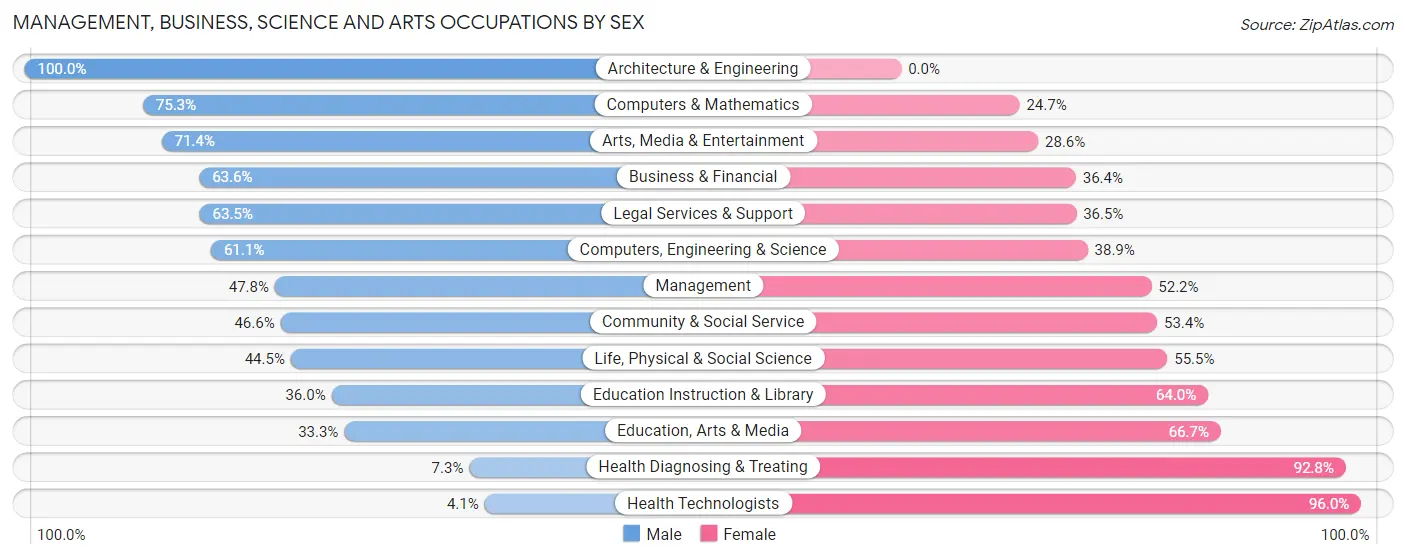
Management, Business, Science and Arts Occupations by Sex
Within the Management, Business, Science and Arts occupations in Williamsburg, the most male-oriented occupations are Architecture & Engineering (100.0%), Computers & Mathematics (75.3%), and Arts, Media & Entertainment (71.4%), while the most female-oriented occupations are Health Technologists (96.0%), Health Diagnosing & Treating (92.7%), and Education, Arts & Media (66.7%).
| Occupation | Male | Female |
| Management | 273 (47.8%) | 298 (52.2%) |
| Business & Financial | 178 (63.6%) | 102 (36.4%) |
| Computers, Engineering & Science | 330 (61.1%) | 210 (38.9%) |
| Computers & Mathematics | 58 (75.3%) | 19 (24.7%) |
| Architecture & Engineering | 119 (100.0%) | 0 (0.0%) |
| Life, Physical & Social Science | 153 (44.5%) | 191 (55.5%) |
| Community & Social Service | 497 (46.6%) | 569 (53.4%) |
| Education, Arts & Media | 8 (33.3%) | 16 (66.7%) |
| Legal Services & Support | 40 (63.5%) | 23 (36.5%) |
| Education Instruction & Library | 254 (36.0%) | 452 (64.0%) |
| Arts, Media & Entertainment | 195 (71.4%) | 78 (28.6%) |
| Health Diagnosing & Treating | 14 (7.2%) | 179 (92.7%) |
| Health Technologists | 3 (4.1%) | 71 (96.0%) |
| Total (Category) | 1,292 (48.7%) | 1,358 (51.2%) |
| Total (Overall) | 3,207 (50.0%) | 3,210 (50.0%) |
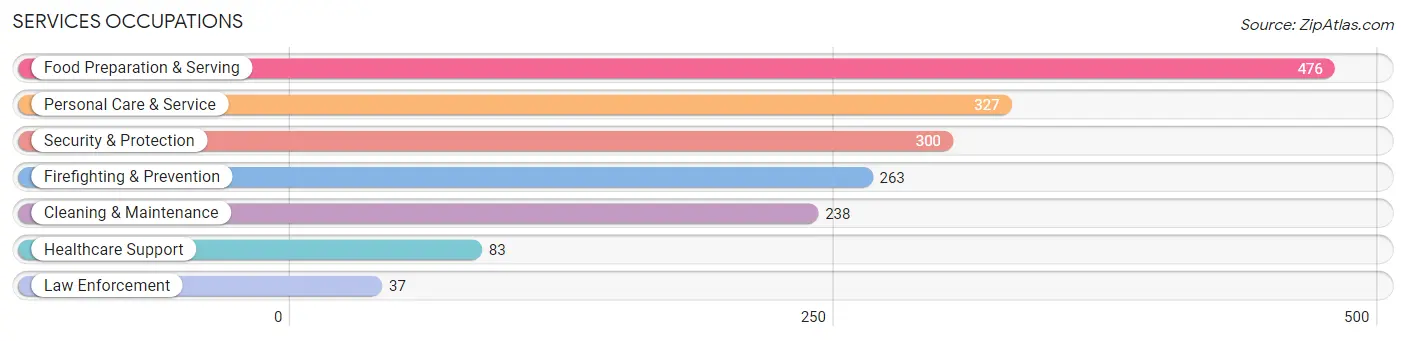
Services Occupations
The most common Services occupations in Williamsburg are Food Preparation & Serving (476 | 7.4%), Personal Care & Service (327 | 5.1%), Security & Protection (300 | 4.7%), Firefighting & Prevention (263 | 4.1%), and Cleaning & Maintenance (238 | 3.7%).
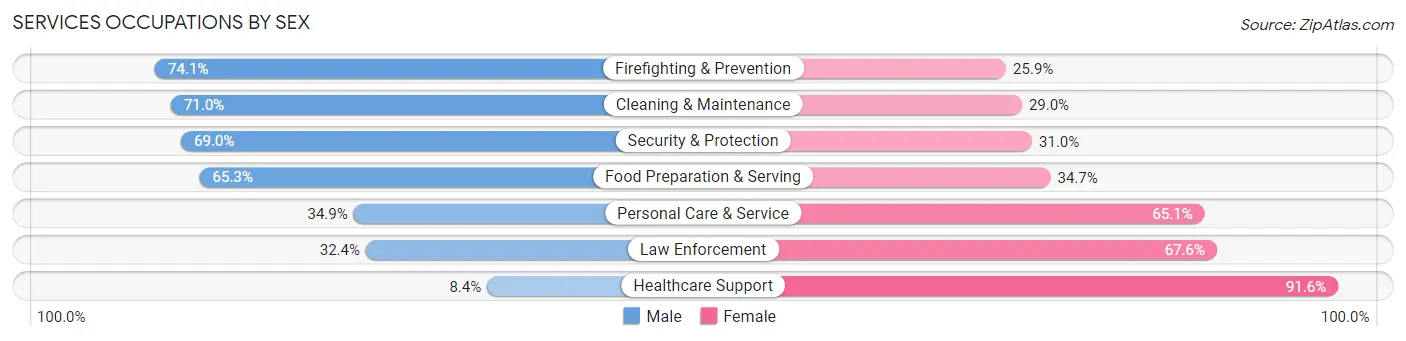
Services Occupations by Sex
Within the Services occupations in Williamsburg, the most male-oriented occupations are Firefighting & Prevention (74.1%), Cleaning & Maintenance (71.0%), and Security & Protection (69.0%), while the most female-oriented occupations are Healthcare Support (91.6%), Law Enforcement (67.6%), and Personal Care & Service (65.1%).
| Occupation | Male | Female |
| Healthcare Support | 7 (8.4%) | 76 (91.6%) |
| Security & Protection | 207 (69.0%) | 93 (31.0%) |
| Firefighting & Prevention | 195 (74.1%) | 68 (25.9%) |
| Law Enforcement | 12 (32.4%) | 25 (67.6%) |
| Food Preparation & Serving | 311 (65.3%) | 165 (34.7%) |
| Cleaning & Maintenance | 169 (71.0%) | 69 (29.0%) |
| Personal Care & Service | 114 (34.9%) | 213 (65.1%) |
| Total (Category) | 808 (56.7%) | 616 (43.3%) |
| Total (Overall) | 3,207 (50.0%) | 3,210 (50.0%) |
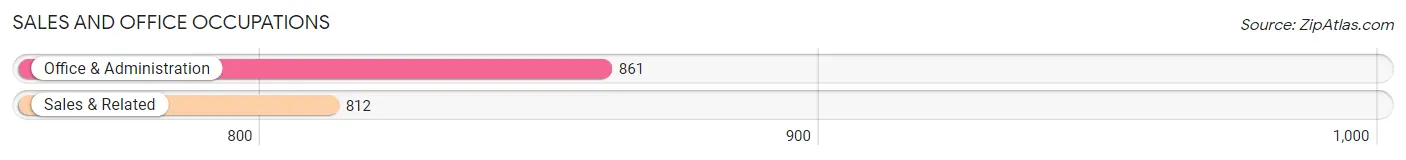
Sales and Office Occupations
The most common Sales and Office occupations in Williamsburg are Office & Administration (861 | 13.4%), and Sales & Related (812 | 12.7%).
Sales and Office Occupations by Sex
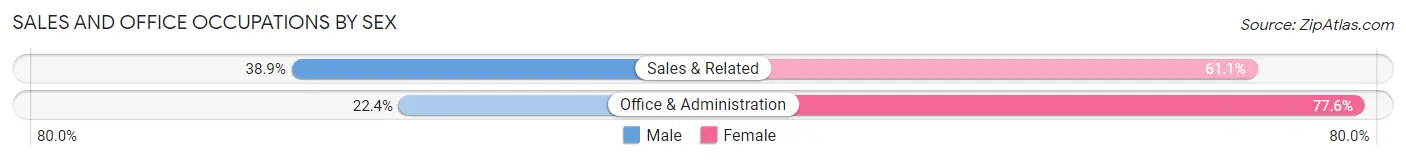
| Occupation | Male | Female |
| Sales & Related | 316 (38.9%) | 496 (61.1%) |
| Office & Administration | 193 (22.4%) | 668 (77.6%) |
| Total (Category) | 509 (30.4%) | 1,164 (69.6%) |
| Total (Overall) | 3,207 (50.0%) | 3,210 (50.0%) |
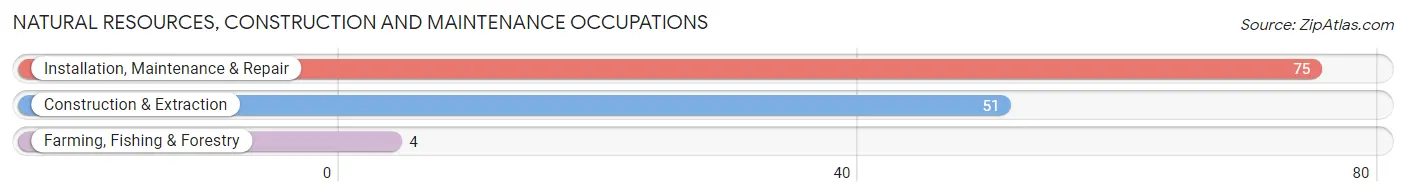
Natural Resources, Construction and Maintenance Occupations
The most common Natural Resources, Construction and Maintenance occupations in Williamsburg are Installation, Maintenance & Repair (75 | 1.2%), Construction & Extraction (51 | 0.8%), and Farming, Fishing & Forestry (4 | 0.1%).
Natural Resources, Construction and Maintenance Occupations by Sex
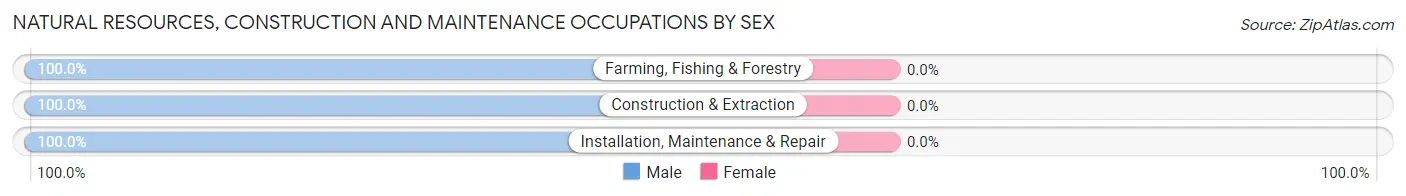
| Occupation | Male | Female |
| Farming, Fishing & Forestry | 4 (100.0%) | 0 (0.0%) |
| Construction & Extraction | 51 (100.0%) | 0 (0.0%) |
| Installation, Maintenance & Repair | 75 (100.0%) | 0 (0.0%) |
| Total (Category) | 130 (100.0%) | 0 (0.0%) |
| Total (Overall) | 3,207 (50.0%) | 3,210 (50.0%) |
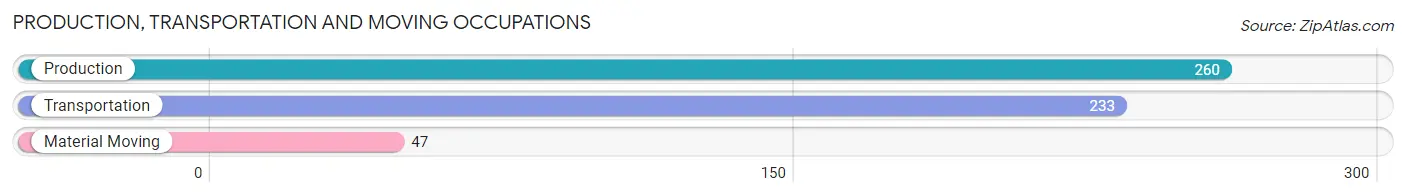
Production, Transportation and Moving Occupations
The most common Production, Transportation and Moving occupations in Williamsburg are Production (260 | 4.1%), Transportation (233 | 3.6%), and Material Moving (47 | 0.7%).
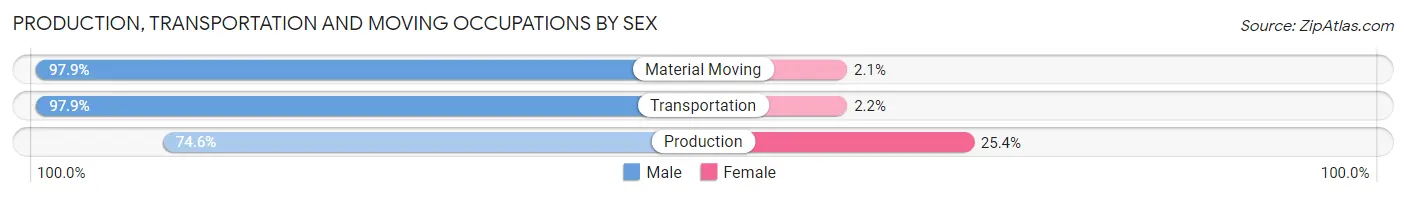
Production, Transportation and Moving Occupations by Sex
| Occupation | Male | Female |
| Production | 194 (74.6%) | 66 (25.4%) |
| Transportation | 228 (97.9%) | 5 (2.1%) |
| Material Moving | 46 (97.9%) | 1 (2.1%) |
| Total (Category) | 468 (86.7%) | 72 (13.3%) |
| Total (Overall) | 3,207 (50.0%) | 3,210 (50.0%) |
Employment Industries by Sex in Williamsburg
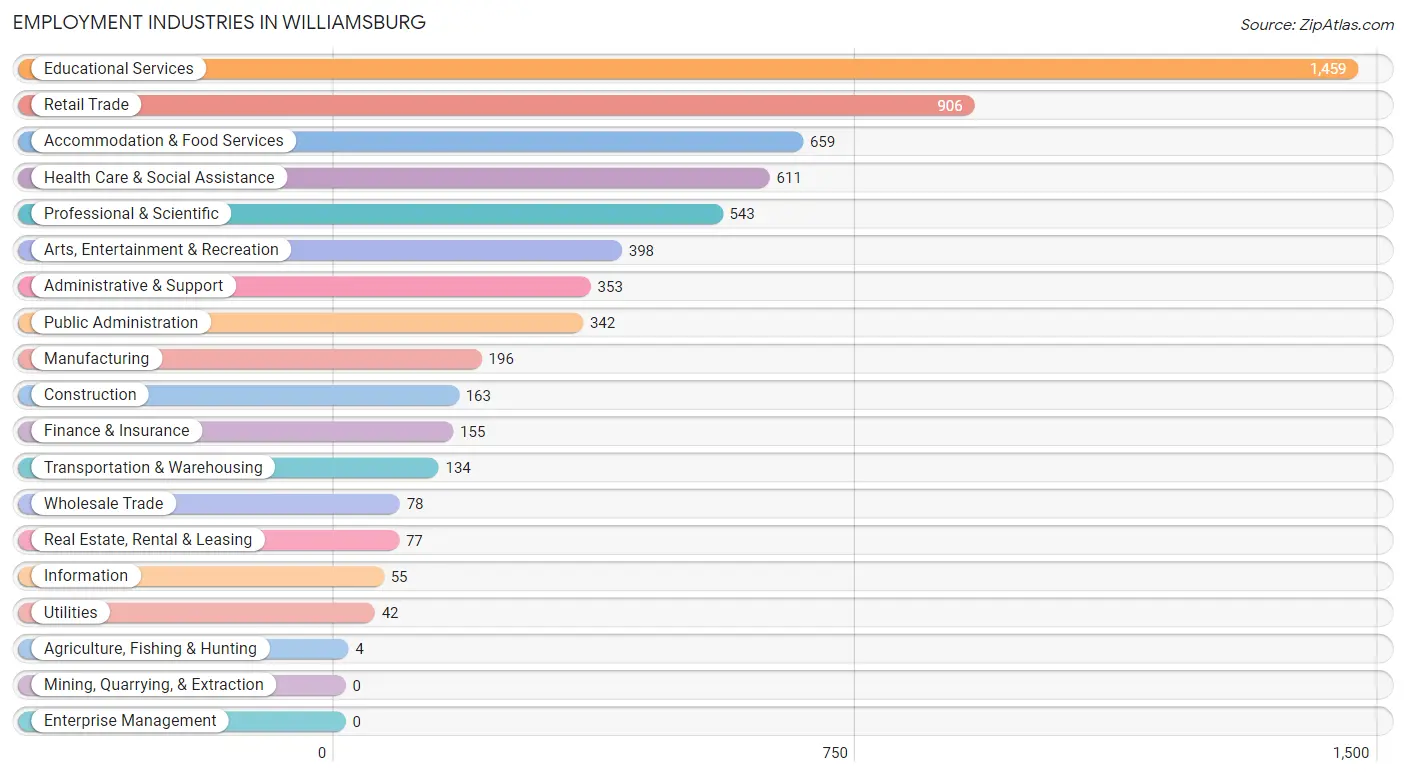
Employment Industries in Williamsburg
The major employment industries in Williamsburg include Educational Services (1,459 | 22.7%), Retail Trade (906 | 14.1%), Accommodation & Food Services (659 | 10.3%), Health Care & Social Assistance (611 | 9.5%), and Professional & Scientific (543 | 8.5%).
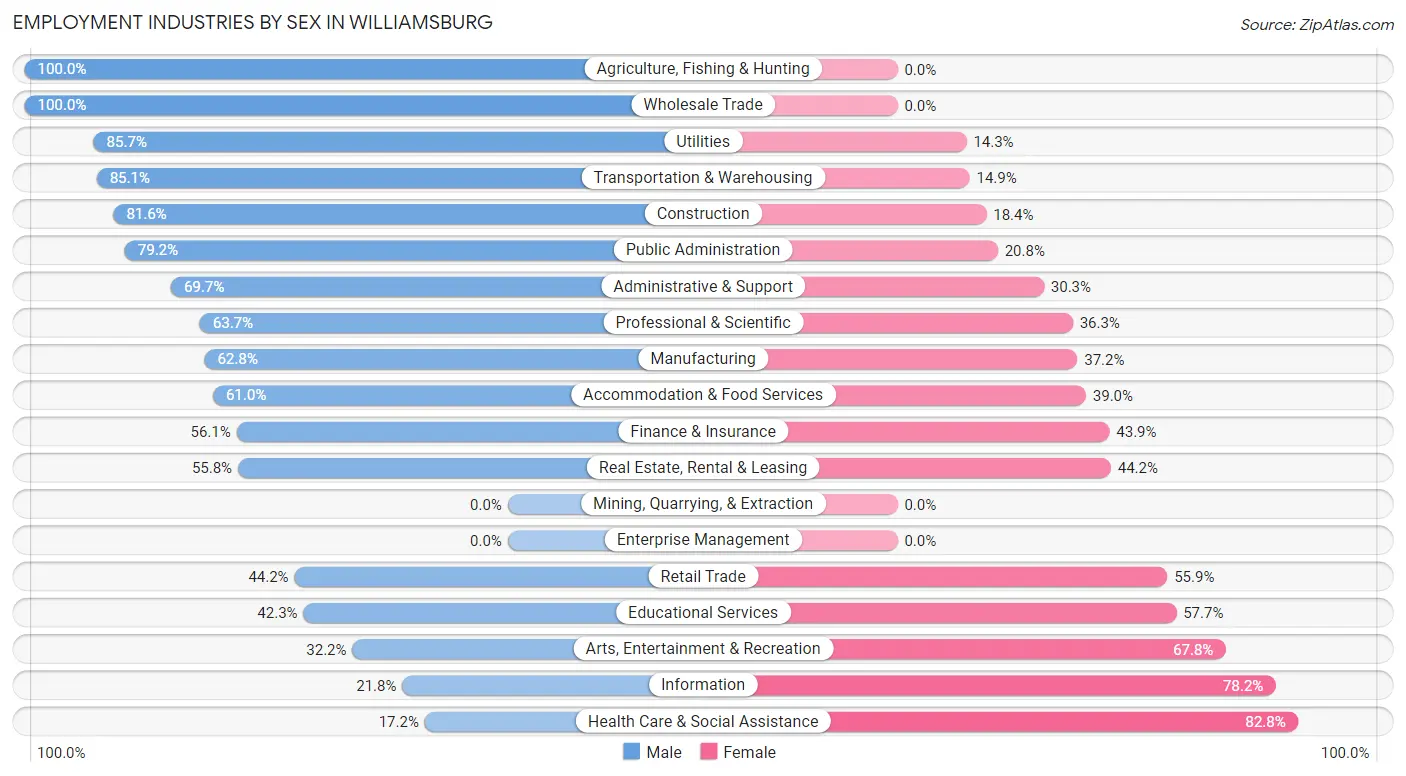
Employment Industries by Sex in Williamsburg
The Williamsburg industries that see more men than women are Agriculture, Fishing & Hunting (100.0%), Wholesale Trade (100.0%), and Utilities (85.7%), whereas the industries that tend to have a higher number of women are Health Care & Social Assistance (82.8%), Information (78.2%), and Arts, Entertainment & Recreation (67.8%).
| Industry | Male | Female |
| Agriculture, Fishing & Hunting | 4 (100.0%) | 0 (0.0%) |
| Mining, Quarrying, & Extraction | 0 (0.0%) | 0 (0.0%) |
| Construction | 133 (81.6%) | 30 (18.4%) |
| Manufacturing | 123 (62.8%) | 73 (37.2%) |
| Wholesale Trade | 78 (100.0%) | 0 (0.0%) |
| Retail Trade | 400 (44.2%) | 506 (55.8%) |
| Transportation & Warehousing | 114 (85.1%) | 20 (14.9%) |
| Utilities | 36 (85.7%) | 6 (14.3%) |
| Information | 12 (21.8%) | 43 (78.2%) |
| Finance & Insurance | 87 (56.1%) | 68 (43.9%) |
| Real Estate, Rental & Leasing | 43 (55.8%) | 34 (44.2%) |
| Professional & Scientific | 346 (63.7%) | 197 (36.3%) |
| Enterprise Management | 0 (0.0%) | 0 (0.0%) |
| Administrative & Support | 246 (69.7%) | 107 (30.3%) |
| Educational Services | 617 (42.3%) | 842 (57.7%) |
| Health Care & Social Assistance | 105 (17.2%) | 506 (82.8%) |
| Arts, Entertainment & Recreation | 128 (32.2%) | 270 (67.8%) |
| Accommodation & Food Services | 402 (61.0%) | 257 (39.0%) |
| Public Administration | 271 (79.2%) | 71 (20.8%) |
| Total | 3,207 (50.0%) | 3,210 (50.0%) |
Education in Williamsburg
School Enrollment in Williamsburg
The most common levels of schooling among the 7,785 students in Williamsburg are college / undergraduate (5,770 | 74.1%), graduate / professional (546 | 7.0%), and middle school (434 | 5.6%).
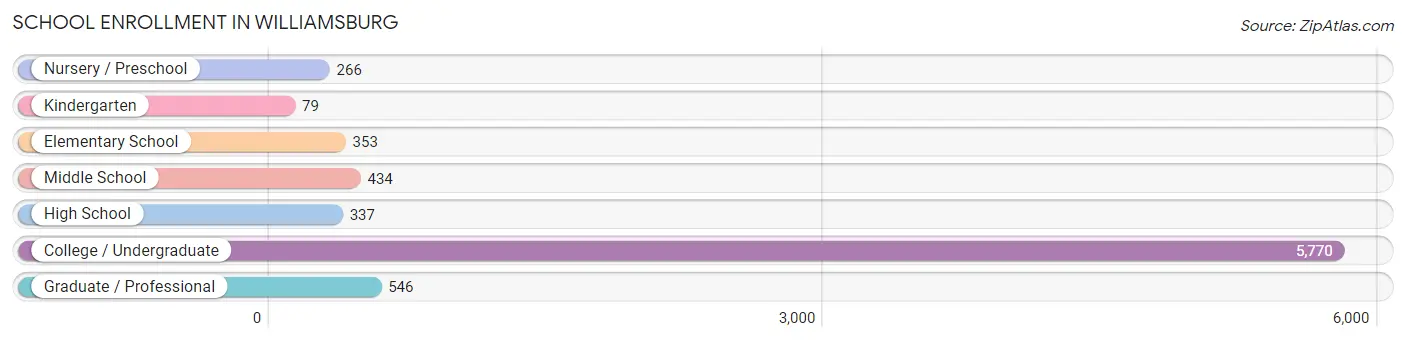
| School Level | # Students | % Students |
| Nursery / Preschool | 266 | 3.4% |
| Kindergarten | 79 | 1.0% |
| Elementary School | 353 | 4.5% |
| Middle School | 434 | 5.6% |
| High School | 337 | 4.3% |
| College / Undergraduate | 5,770 | 74.1% |
| Graduate / Professional | 546 | 7.0% |
| Total | 7,785 | 100.0% |
School Enrollment by Age by Funding Source in Williamsburg
Out of a total of 7,785 students who are enrolled in schools in Williamsburg, 561 (7.2%) attend a private institution, while the remaining 7,224 (92.8%) are enrolled in public schools. The age group of 3 to 4 year olds has the highest likelihood of being enrolled in private schools, with 115 (54.5% in the age bracket) enrolled. Conversely, the age group of 18 to 19 year olds has the lowest likelihood of being enrolled in a private school, with 3,082 (98.6% in the age bracket) attending a public institution.
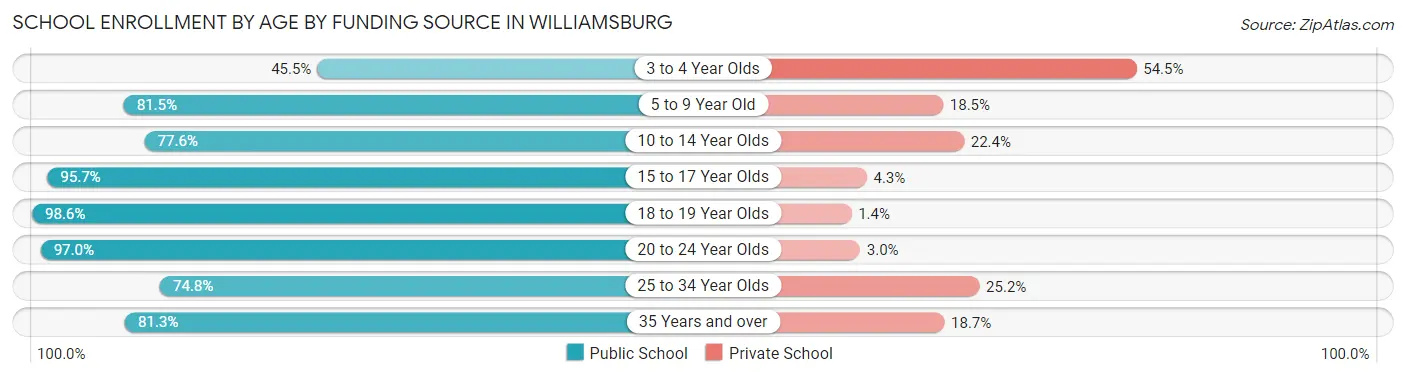
| Age Bracket | Public School | Private School |
| 3 to 4 Year Olds | 96 (45.5%) | 115 (54.5%) |
| 5 to 9 Year Old | 375 (81.5%) | 85 (18.5%) |
| 10 to 14 Year Olds | 399 (77.6%) | 115 (22.4%) |
| 15 to 17 Year Olds | 247 (95.7%) | 11 (4.3%) |
| 18 to 19 Year Olds | 3,082 (98.6%) | 44 (1.4%) |
| 20 to 24 Year Olds | 2,646 (97.0%) | 82 (3.0%) |
| 25 to 34 Year Olds | 237 (74.8%) | 80 (25.2%) |
| 35 Years and over | 139 (81.3%) | 32 (18.7%) |
| Total | 7,224 (92.8%) | 561 (7.2%) |
Educational Attainment by Field of Study in Williamsburg
Business (628 | 14.1%), social sciences (610 | 13.8%), liberal arts & history (531 | 12.0%), literature & languages (416 | 9.4%), and education (384 | 8.6%) are the most common fields of study among 4,437 individuals in Williamsburg who have obtained a bachelor's degree or higher.
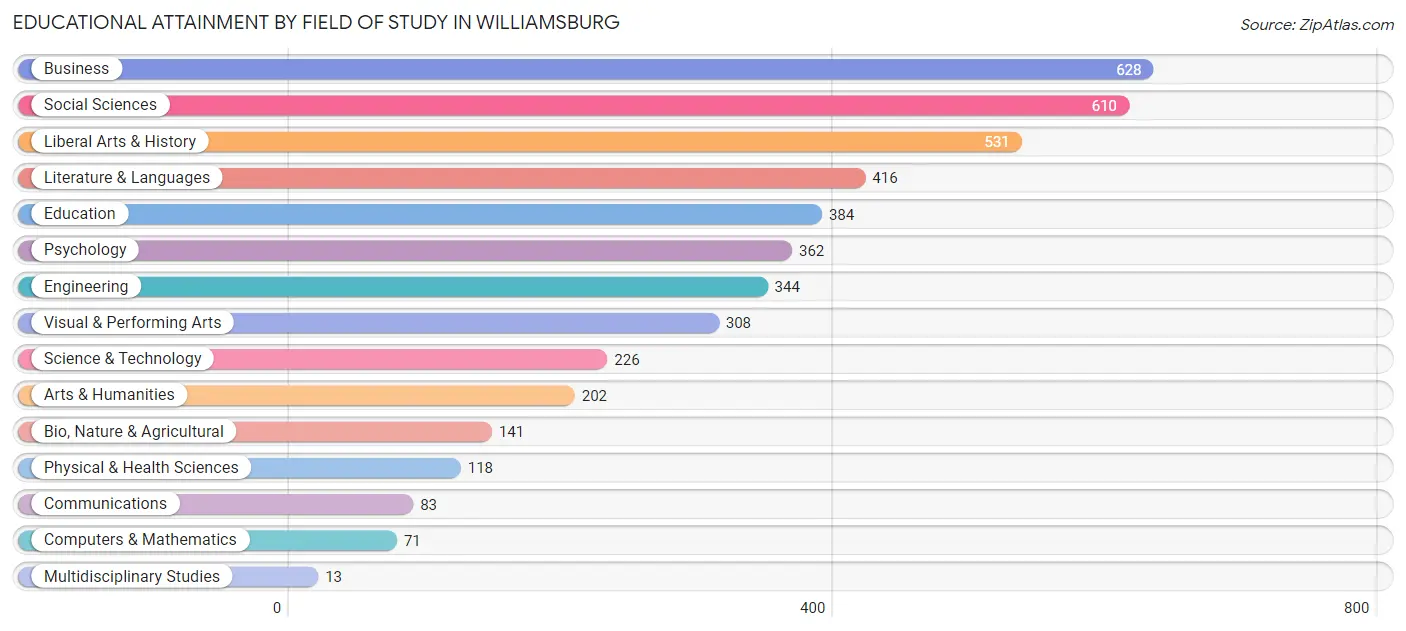
| Field of Study | # Graduates | % Graduates |
| Computers & Mathematics | 71 | 1.6% |
| Bio, Nature & Agricultural | 141 | 3.2% |
| Physical & Health Sciences | 118 | 2.7% |
| Psychology | 362 | 8.2% |
| Social Sciences | 610 | 13.8% |
| Engineering | 344 | 7.7% |
| Multidisciplinary Studies | 13 | 0.3% |
| Science & Technology | 226 | 5.1% |
| Business | 628 | 14.1% |
| Education | 384 | 8.6% |
| Literature & Languages | 416 | 9.4% |
| Liberal Arts & History | 531 | 12.0% |
| Visual & Performing Arts | 308 | 6.9% |
| Communications | 83 | 1.9% |
| Arts & Humanities | 202 | 4.5% |
| Total | 4,437 | 100.0% |
Transportation & Commute in Williamsburg
Vehicle Availability by Sex in Williamsburg
The most prevalent vehicle ownership categories in Williamsburg are males with 2 vehicles (1,108, accounting for 37.9%) and females with 2 vehicles (760, making up 46.8%).
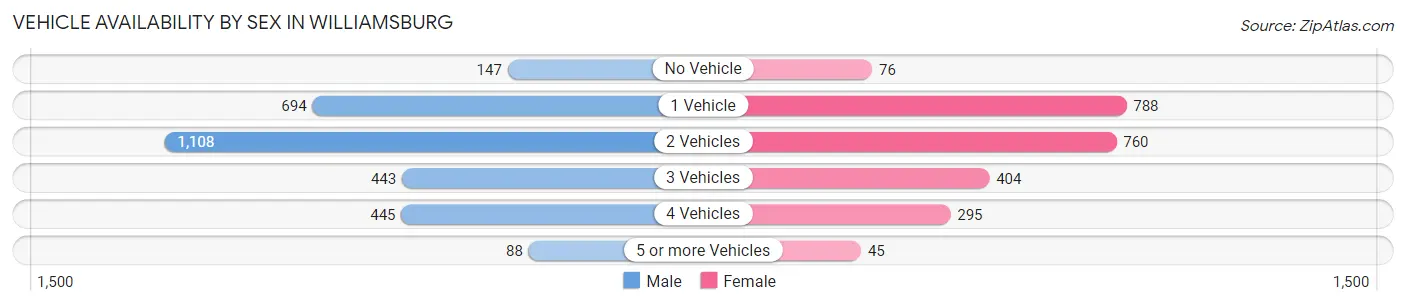
| Vehicles Available | Male | Female |
| No Vehicle | 147 (5.0%) | 76 (3.2%) |
| 1 Vehicle | 694 (23.7%) | 788 (33.3%) |
| 2 Vehicles | 1,108 (37.9%) | 760 (32.1%) |
| 3 Vehicles | 443 (15.1%) | 404 (17.1%) |
| 4 Vehicles | 445 (15.2%) | 295 (12.5%) |
| 5 or more Vehicles | 88 (3.0%) | 45 (1.9%) |
| Total | 2,925 (100.0%) | 2,368 (100.0%) |
Commute Time in Williamsburg
The most frequently occuring commute durations in Williamsburg are 5 to 9 minutes (1,176 commuters, 21.5%), 10 to 14 minutes (1,157 commuters, 21.1%), and 15 to 19 minutes (1,142 commuters, 20.9%).
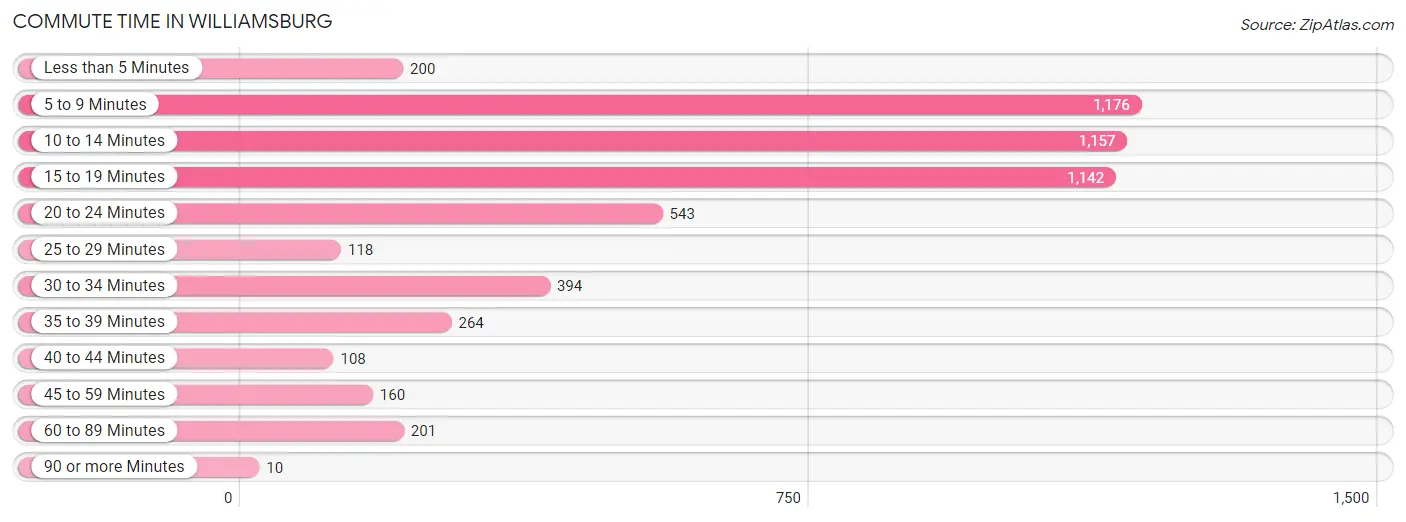
| Commute Time | # Commuters | % Commuters |
| Less than 5 Minutes | 200 | 3.6% |
| 5 to 9 Minutes | 1,176 | 21.5% |
| 10 to 14 Minutes | 1,157 | 21.1% |
| 15 to 19 Minutes | 1,142 | 20.9% |
| 20 to 24 Minutes | 543 | 9.9% |
| 25 to 29 Minutes | 118 | 2.2% |
| 30 to 34 Minutes | 394 | 7.2% |
| 35 to 39 Minutes | 264 | 4.8% |
| 40 to 44 Minutes | 108 | 2.0% |
| 45 to 59 Minutes | 160 | 2.9% |
| 60 to 89 Minutes | 201 | 3.7% |
| 90 or more Minutes | 10 | 0.2% |
Commute Time by Sex in Williamsburg
The most common commute times in Williamsburg are 15 to 19 minutes (586 commuters, 21.6%) for males and 10 to 14 minutes (647 commuters, 23.4%) for females.
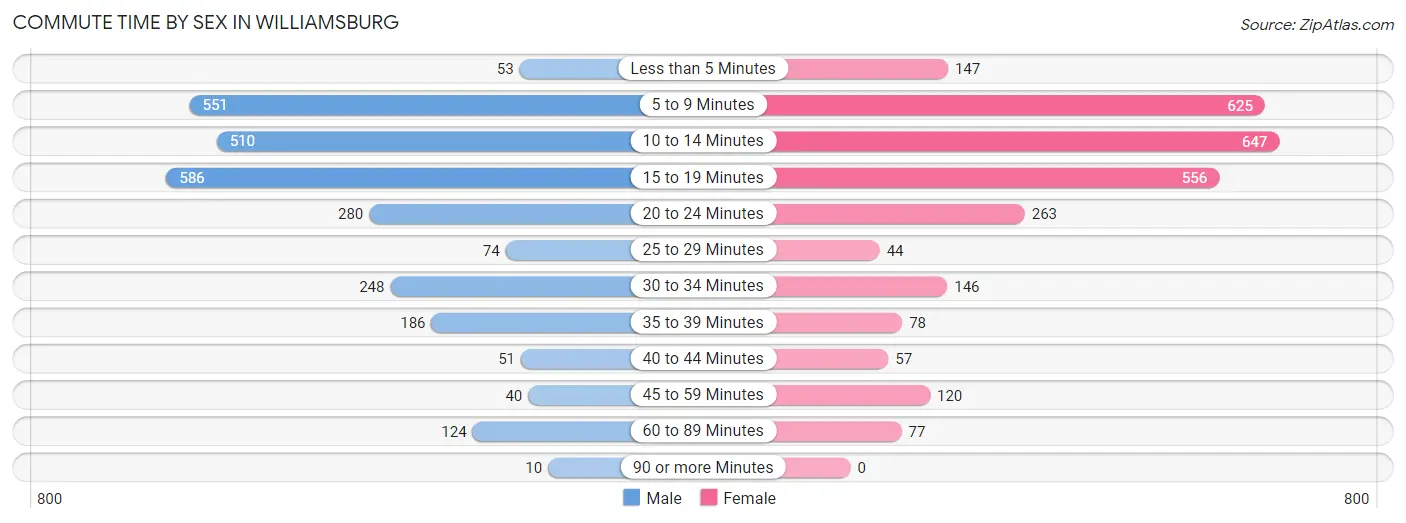
| Commute Time | Male | Female |
| Less than 5 Minutes | 53 (1.9%) | 147 (5.3%) |
| 5 to 9 Minutes | 551 (20.3%) | 625 (22.6%) |
| 10 to 14 Minutes | 510 (18.8%) | 647 (23.4%) |
| 15 to 19 Minutes | 586 (21.6%) | 556 (20.1%) |
| 20 to 24 Minutes | 280 (10.3%) | 263 (9.5%) |
| 25 to 29 Minutes | 74 (2.7%) | 44 (1.6%) |
| 30 to 34 Minutes | 248 (9.1%) | 146 (5.3%) |
| 35 to 39 Minutes | 186 (6.9%) | 78 (2.8%) |
| 40 to 44 Minutes | 51 (1.9%) | 57 (2.1%) |
| 45 to 59 Minutes | 40 (1.5%) | 120 (4.3%) |
| 60 to 89 Minutes | 124 (4.6%) | 77 (2.8%) |
| 90 or more Minutes | 10 (0.4%) | 0 (0.0%) |
Time of Departure to Work by Sex in Williamsburg
The most frequent times of departure to work in Williamsburg are 8:00 AM to 8:29 AM (391, 14.4%) for males and 8:00 AM to 8:29 AM (561, 20.3%) for females.
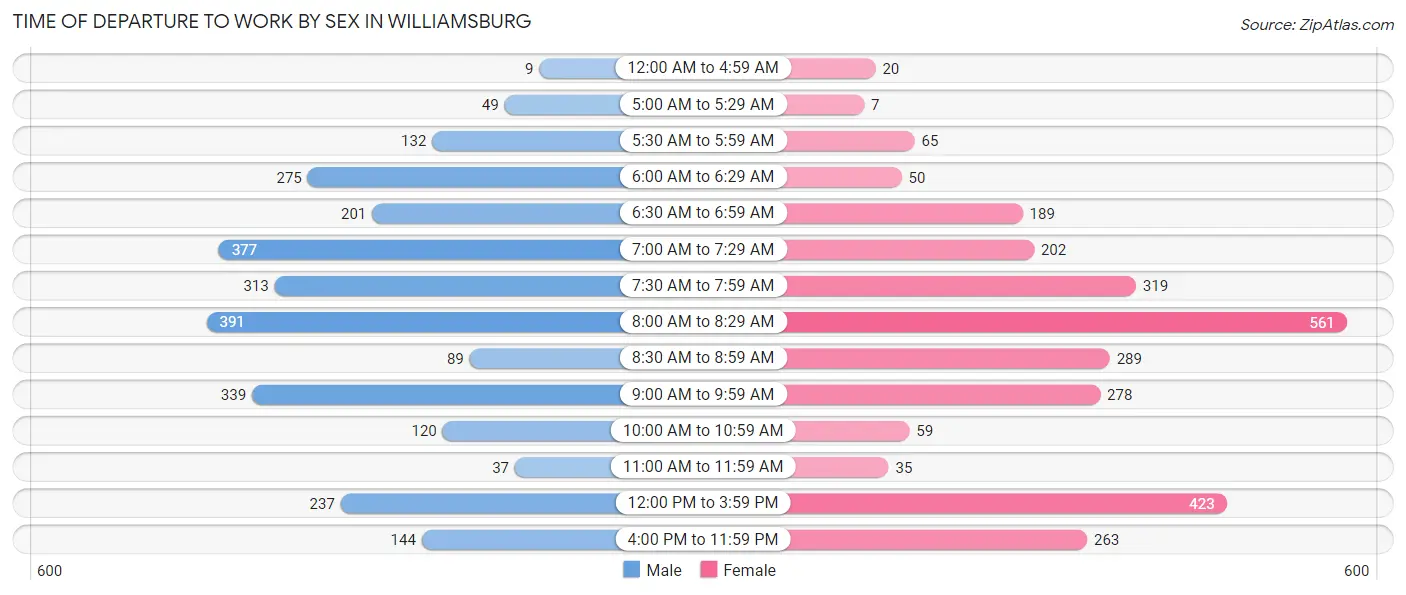
| Time of Departure | Male | Female |
| 12:00 AM to 4:59 AM | 9 (0.3%) | 20 (0.7%) |
| 5:00 AM to 5:29 AM | 49 (1.8%) | 7 (0.3%) |
| 5:30 AM to 5:59 AM | 132 (4.9%) | 65 (2.4%) |
| 6:00 AM to 6:29 AM | 275 (10.1%) | 50 (1.8%) |
| 6:30 AM to 6:59 AM | 201 (7.4%) | 189 (6.9%) |
| 7:00 AM to 7:29 AM | 377 (13.9%) | 202 (7.3%) |
| 7:30 AM to 7:59 AM | 313 (11.5%) | 319 (11.6%) |
| 8:00 AM to 8:29 AM | 391 (14.4%) | 561 (20.3%) |
| 8:30 AM to 8:59 AM | 89 (3.3%) | 289 (10.5%) |
| 9:00 AM to 9:59 AM | 339 (12.5%) | 278 (10.1%) |
| 10:00 AM to 10:59 AM | 120 (4.4%) | 59 (2.1%) |
| 11:00 AM to 11:59 AM | 37 (1.4%) | 35 (1.3%) |
| 12:00 PM to 3:59 PM | 237 (8.7%) | 423 (15.3%) |
| 4:00 PM to 11:59 PM | 144 (5.3%) | 263 (9.5%) |
| Total | 2,713 (100.0%) | 2,760 (100.0%) |
Housing Occupancy in Williamsburg
Occupancy by Ownership in Williamsburg
Of the total 4,882 dwellings in Williamsburg, owner-occupied units account for 2,484 (50.9%), while renter-occupied units make up 2,398 (49.1%).
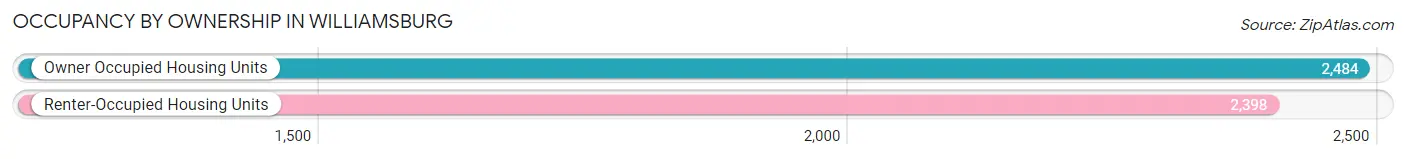
| Occupancy | # Housing Units | % Housing Units |
| Owner Occupied Housing Units | 2,484 | 50.9% |
| Renter-Occupied Housing Units | 2,398 | 49.1% |
| Total Occupied Housing Units | 4,882 | 100.0% |
Occupancy by Household Size in Williamsburg
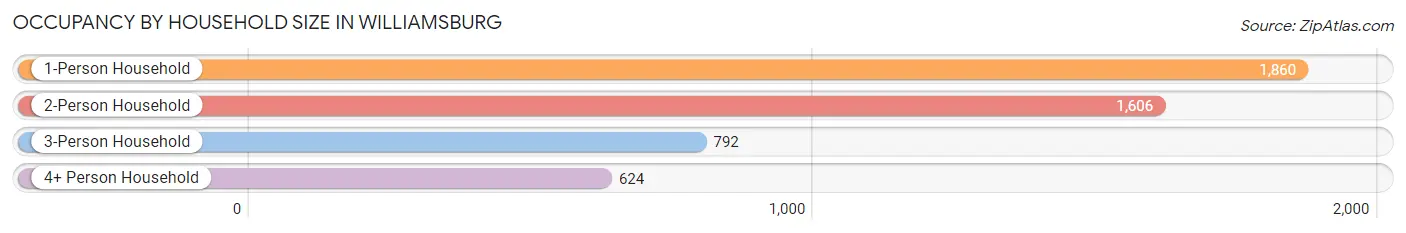
| Household Size | # Housing Units | % Housing Units |
| 1-Person Household | 1,860 | 38.1% |
| 2-Person Household | 1,606 | 32.9% |
| 3-Person Household | 792 | 16.2% |
| 4+ Person Household | 624 | 12.8% |
| Total Housing Units | 4,882 | 100.0% |
Occupancy by Ownership by Household Size in Williamsburg
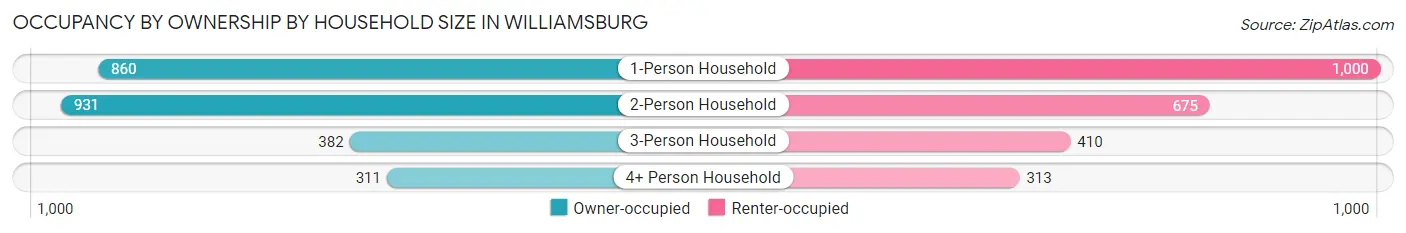
| Household Size | Owner-occupied | Renter-occupied |
| 1-Person Household | 860 (46.2%) | 1,000 (53.8%) |
| 2-Person Household | 931 (58.0%) | 675 (42.0%) |
| 3-Person Household | 382 (48.2%) | 410 (51.8%) |
| 4+ Person Household | 311 (49.8%) | 313 (50.2%) |
| Total Housing Units | 2,484 (50.9%) | 2,398 (49.1%) |
Occupancy by Educational Attainment in Williamsburg
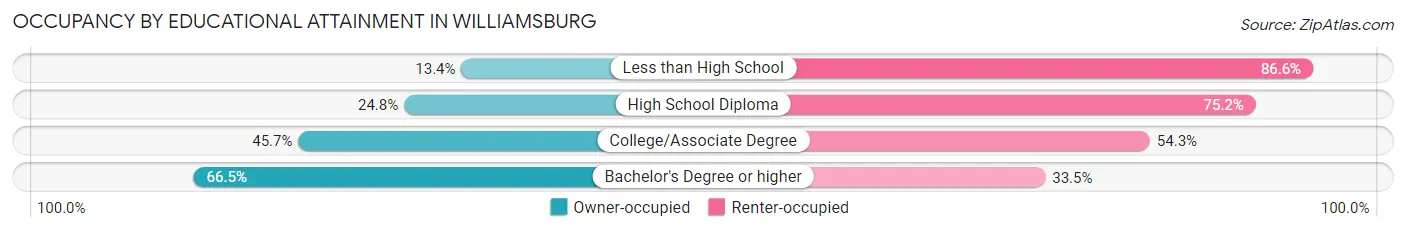
| Household Size | Owner-occupied | Renter-occupied |
| Less than High School | 35 (13.4%) | 226 (86.6%) |
| High School Diploma | 191 (24.8%) | 580 (75.2%) |
| College/Associate Degree | 664 (45.7%) | 788 (54.3%) |
| Bachelor's Degree or higher | 1,594 (66.5%) | 804 (33.5%) |
Occupancy by Age of Householder in Williamsburg
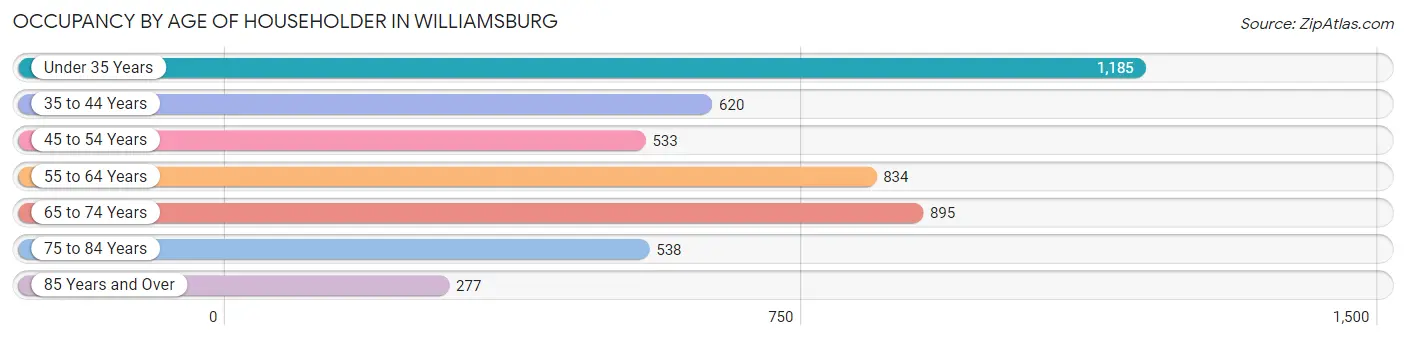
| Age Bracket | # Households | % Households |
| Under 35 Years | 1,185 | 24.3% |
| 35 to 44 Years | 620 | 12.7% |
| 45 to 54 Years | 533 | 10.9% |
| 55 to 64 Years | 834 | 17.1% |
| 65 to 74 Years | 895 | 18.3% |
| 75 to 84 Years | 538 | 11.0% |
| 85 Years and Over | 277 | 5.7% |
| Total | 4,882 | 100.0% |
Housing Finances in Williamsburg
Median Income by Occupancy in Williamsburg
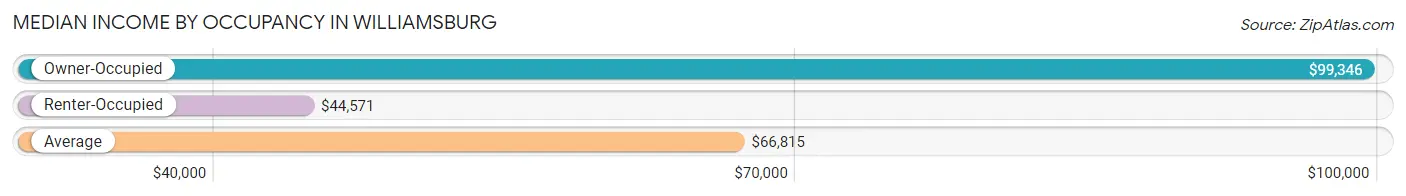
| Occupancy Type | # Households | Median Income |
| Owner-Occupied | 2,484 (50.9%) | $99,346 |
| Renter-Occupied | 2,398 (49.1%) | $44,571 |
| Average | 4,882 (100.0%) | $66,815 |
Occupancy by Householder Income Bracket in Williamsburg
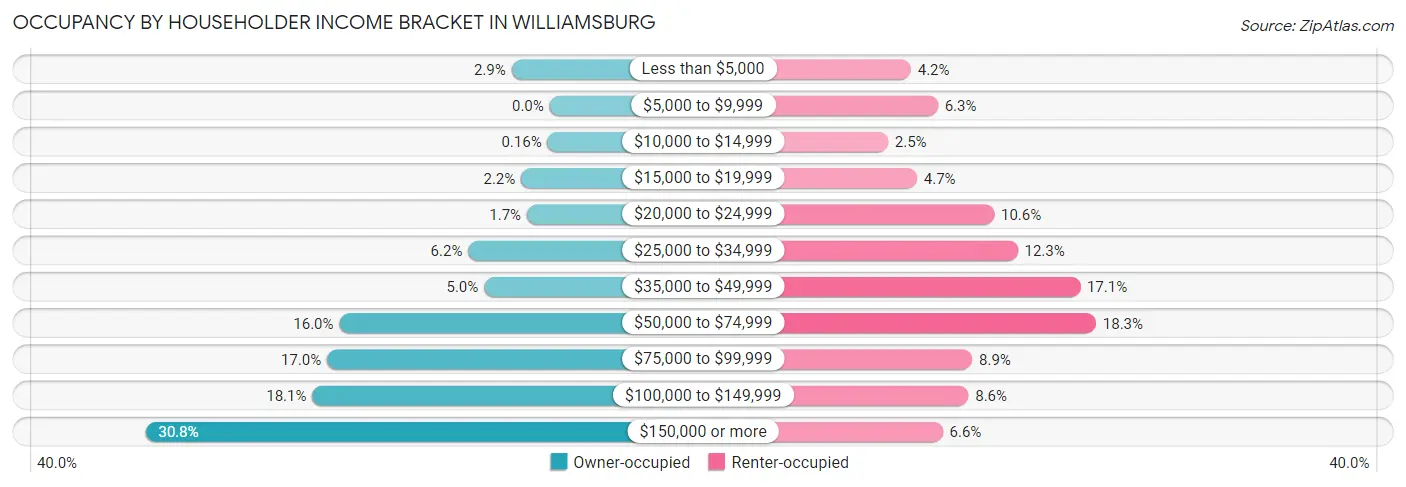
| Income Bracket | Owner-occupied | Renter-occupied |
| Less than $5,000 | 72 (2.9%) | 101 (4.2%) |
| $5,000 to $9,999 | 0 (0.0%) | 150 (6.3%) |
| $10,000 to $14,999 | 4 (0.2%) | 59 (2.5%) |
| $15,000 to $19,999 | 54 (2.2%) | 112 (4.7%) |
| $20,000 to $24,999 | 43 (1.7%) | 253 (10.5%) |
| $25,000 to $34,999 | 154 (6.2%) | 296 (12.3%) |
| $35,000 to $49,999 | 124 (5.0%) | 410 (17.1%) |
| $50,000 to $74,999 | 398 (16.0%) | 439 (18.3%) |
| $75,000 to $99,999 | 421 (17.0%) | 213 (8.9%) |
| $100,000 to $149,999 | 449 (18.1%) | 206 (8.6%) |
| $150,000 or more | 765 (30.8%) | 159 (6.6%) |
| Total | 2,484 (100.0%) | 2,398 (100.0%) |
Monthly Housing Cost Tiers in Williamsburg
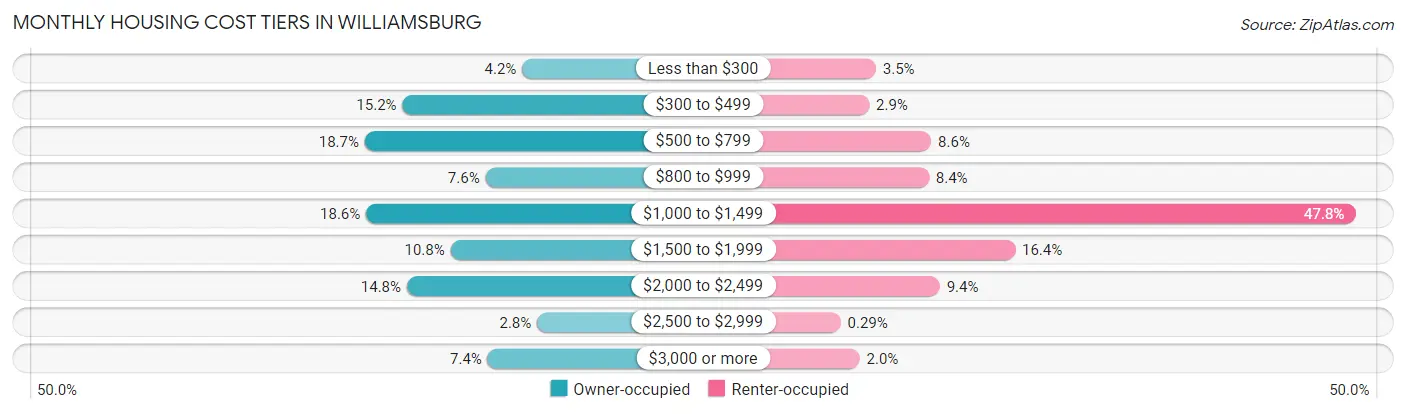
| Monthly Cost | Owner-occupied | Renter-occupied |
| Less than $300 | 104 (4.2%) | 85 (3.5%) |
| $300 to $499 | 378 (15.2%) | 70 (2.9%) |
| $500 to $799 | 464 (18.7%) | 207 (8.6%) |
| $800 to $999 | 188 (7.6%) | 202 (8.4%) |
| $1,000 to $1,499 | 461 (18.6%) | 1,145 (47.7%) |
| $1,500 to $1,999 | 268 (10.8%) | 392 (16.4%) |
| $2,000 to $2,499 | 368 (14.8%) | 226 (9.4%) |
| $2,500 to $2,999 | 70 (2.8%) | 7 (0.3%) |
| $3,000 or more | 183 (7.4%) | 49 (2.0%) |
| Total | 2,484 (100.0%) | 2,398 (100.0%) |
Physical Housing Characteristics in Williamsburg
Housing Structures in Williamsburg
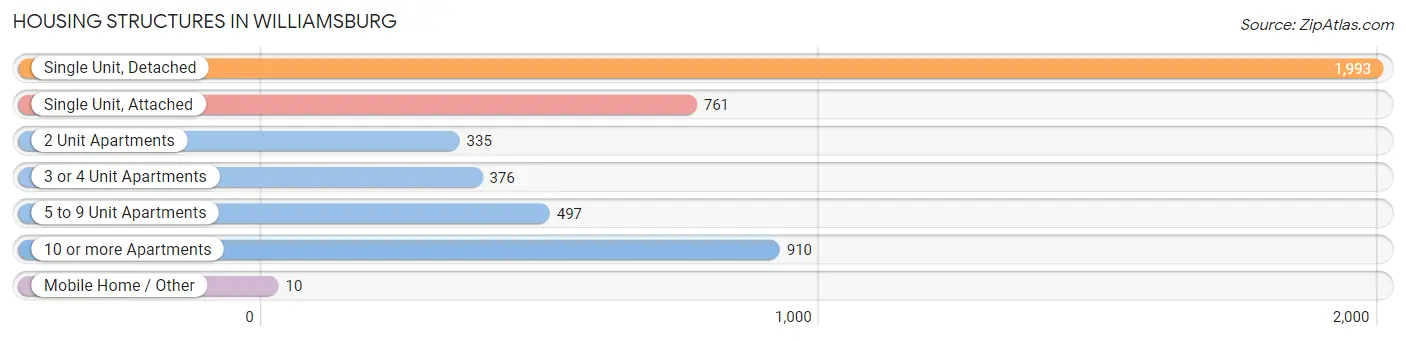
| Structure Type | # Housing Units | % Housing Units |
| Single Unit, Detached | 1,993 | 40.8% |
| Single Unit, Attached | 761 | 15.6% |
| 2 Unit Apartments | 335 | 6.9% |
| 3 or 4 Unit Apartments | 376 | 7.7% |
| 5 to 9 Unit Apartments | 497 | 10.2% |
| 10 or more Apartments | 910 | 18.6% |
| Mobile Home / Other | 10 | 0.2% |
| Total | 4,882 | 100.0% |
Housing Structures by Occupancy in Williamsburg
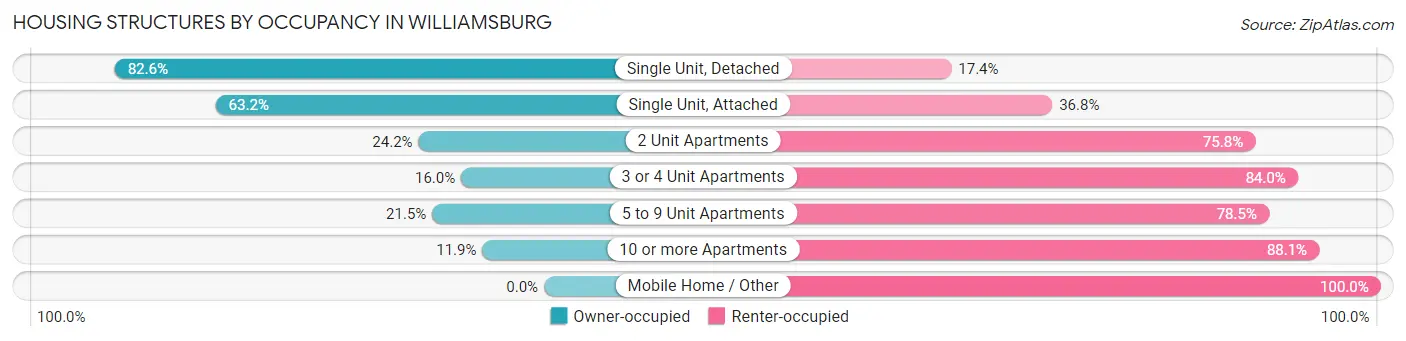
| Structure Type | Owner-occupied | Renter-occupied |
| Single Unit, Detached | 1,647 (82.6%) | 346 (17.4%) |
| Single Unit, Attached | 481 (63.2%) | 280 (36.8%) |
| 2 Unit Apartments | 81 (24.2%) | 254 (75.8%) |
| 3 or 4 Unit Apartments | 60 (16.0%) | 316 (84.0%) |
| 5 to 9 Unit Apartments | 107 (21.5%) | 390 (78.5%) |
| 10 or more Apartments | 108 (11.9%) | 802 (88.1%) |
| Mobile Home / Other | 0 (0.0%) | 10 (100.0%) |
| Total | 2,484 (50.9%) | 2,398 (49.1%) |
Housing Structures by Number of Rooms in Williamsburg
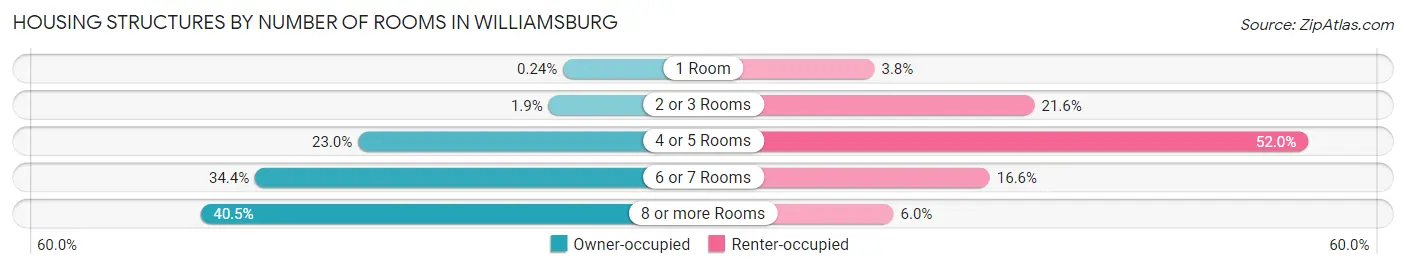
| Number of Rooms | Owner-occupied | Renter-occupied |
| 1 Room | 6 (0.2%) | 92 (3.8%) |
| 2 or 3 Rooms | 46 (1.8%) | 518 (21.6%) |
| 4 or 5 Rooms | 571 (23.0%) | 1,246 (52.0%) |
| 6 or 7 Rooms | 855 (34.4%) | 399 (16.6%) |
| 8 or more Rooms | 1,006 (40.5%) | 143 (6.0%) |
| Total | 2,484 (100.0%) | 2,398 (100.0%) |
Housing Structure by Heating Type in Williamsburg
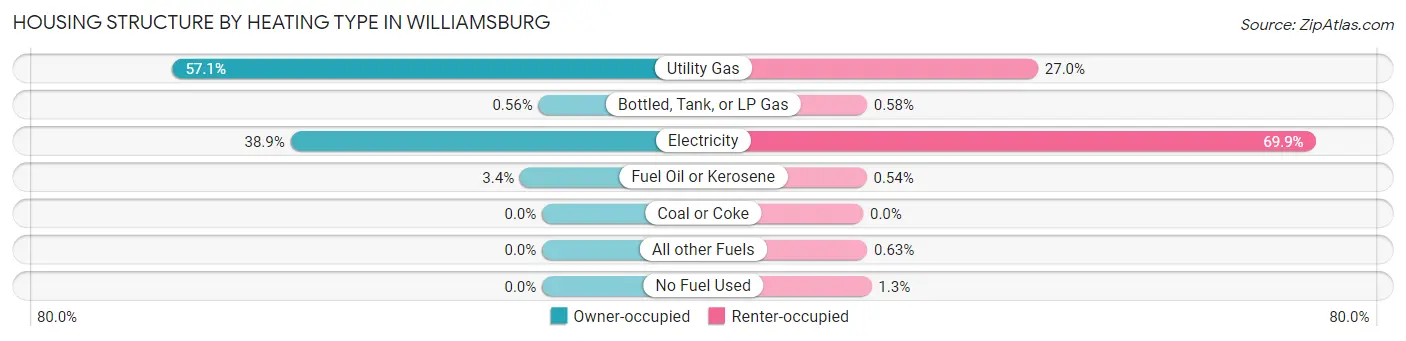
| Heating Type | Owner-occupied | Renter-occupied |
| Utility Gas | 1,419 (57.1%) | 648 (27.0%) |
| Bottled, Tank, or LP Gas | 14 (0.6%) | 14 (0.6%) |
| Electricity | 966 (38.9%) | 1,677 (69.9%) |
| Fuel Oil or Kerosene | 85 (3.4%) | 13 (0.5%) |
| Coal or Coke | 0 (0.0%) | 0 (0.0%) |
| All other Fuels | 0 (0.0%) | 15 (0.6%) |
| No Fuel Used | 0 (0.0%) | 31 (1.3%) |
| Total | 2,484 (100.0%) | 2,398 (100.0%) |
Household Vehicle Usage in Williamsburg
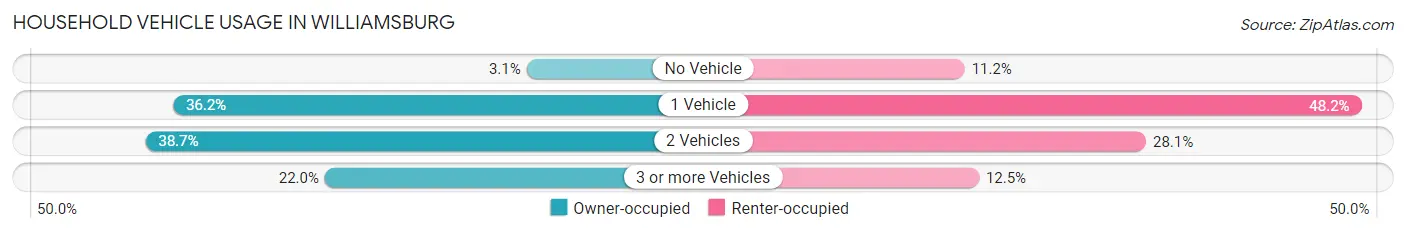
| Vehicles per Household | Owner-occupied | Renter-occupied |
| No Vehicle | 78 (3.1%) | 268 (11.2%) |
| 1 Vehicle | 898 (36.1%) | 1,156 (48.2%) |
| 2 Vehicles | 962 (38.7%) | 674 (28.1%) |
| 3 or more Vehicles | 546 (22.0%) | 300 (12.5%) |
| Total | 2,484 (100.0%) | 2,398 (100.0%) |
Real Estate & Mortgages in Williamsburg
Real Estate and Mortgage Overview in Williamsburg
| Characteristic | Without Mortgage | With Mortgage |
| Housing Units | 1,020 | 1,464 |
| Median Property Value | $366,700 | $400,500 |
| Median Household Income | $97,969 | $585 |
| Monthly Housing Costs | $531 | $183 |
| Real Estate Taxes | $2,301 | $45 |
Property Value by Mortgage Status in Williamsburg
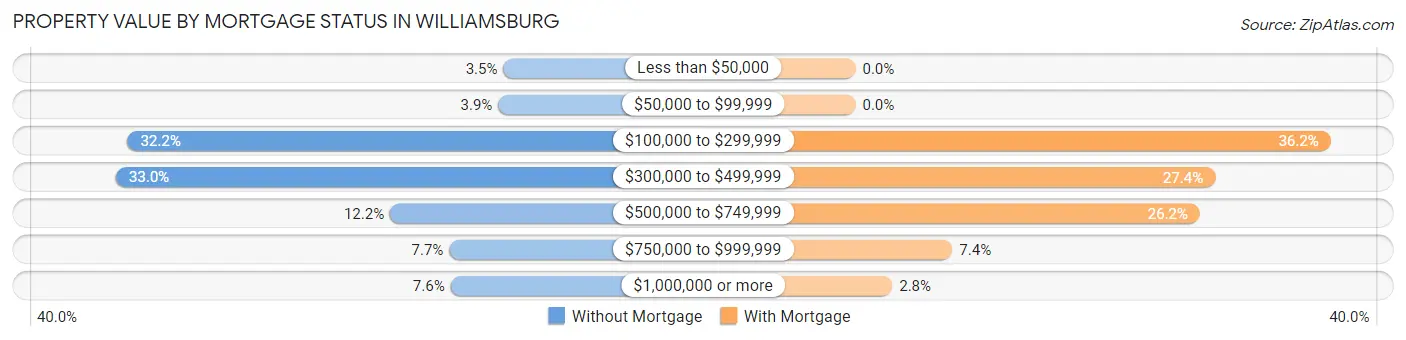
| Property Value | Without Mortgage | With Mortgage |
| Less than $50,000 | 36 (3.5%) | 0 (0.0%) |
| $50,000 to $99,999 | 40 (3.9%) | 0 (0.0%) |
| $100,000 to $299,999 | 328 (32.2%) | 530 (36.2%) |
| $300,000 to $499,999 | 337 (33.0%) | 401 (27.4%) |
| $500,000 to $749,999 | 124 (12.2%) | 384 (26.2%) |
| $750,000 to $999,999 | 78 (7.6%) | 108 (7.4%) |
| $1,000,000 or more | 77 (7.5%) | 41 (2.8%) |
| Total | 1,020 (100.0%) | 1,464 (100.0%) |
Household Income by Mortgage Status in Williamsburg
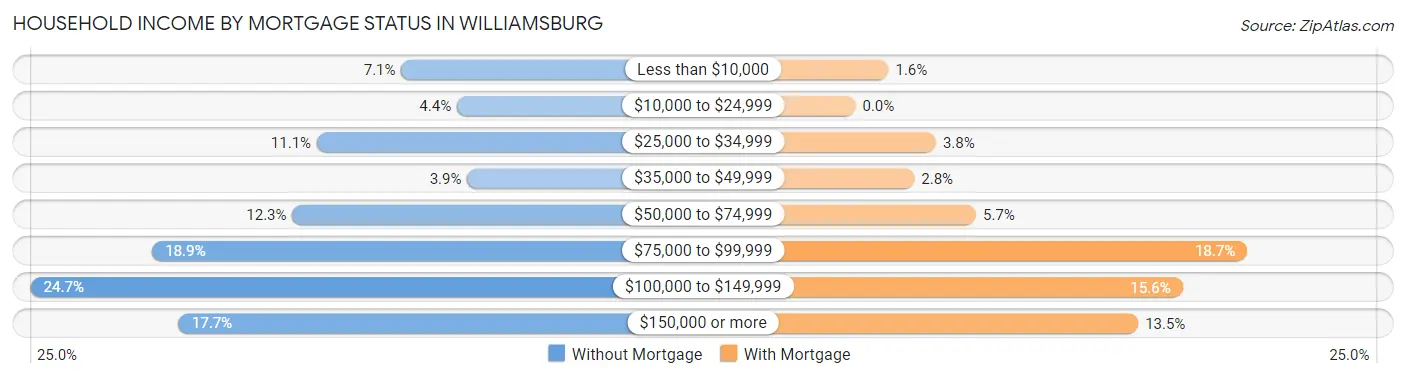
| Household Income | Without Mortgage | With Mortgage |
| Less than $10,000 | 72 (7.1%) | 23 (1.6%) |
| $10,000 to $24,999 | 45 (4.4%) | 0 (0.0%) |
| $25,000 to $34,999 | 113 (11.1%) | 56 (3.8%) |
| $35,000 to $49,999 | 40 (3.9%) | 41 (2.8%) |
| $50,000 to $74,999 | 125 (12.2%) | 84 (5.7%) |
| $75,000 to $99,999 | 193 (18.9%) | 273 (18.6%) |
| $100,000 to $149,999 | 252 (24.7%) | 228 (15.6%) |
| $150,000 or more | 180 (17.6%) | 197 (13.5%) |
| Total | 1,020 (100.0%) | 1,464 (100.0%) |
Property Value to Household Income Ratio in Williamsburg
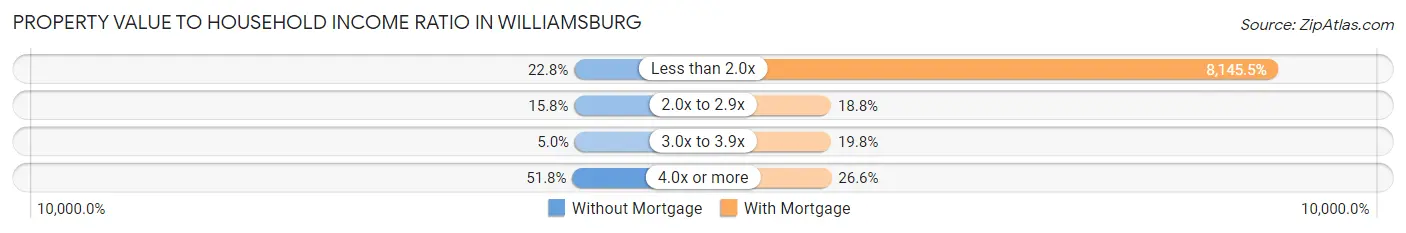
| Value-to-Income Ratio | Without Mortgage | With Mortgage |
| Less than 2.0x | 233 (22.8%) | 119,250 (8,145.5%) |
| 2.0x to 2.9x | 161 (15.8%) | 275 (18.8%) |
| 3.0x to 3.9x | 51 (5.0%) | 290 (19.8%) |
| 4.0x or more | 528 (51.8%) | 389 (26.6%) |
| Total | 1,020 (100.0%) | 1,464 (100.0%) |
Real Estate Taxes by Mortgage Status in Williamsburg
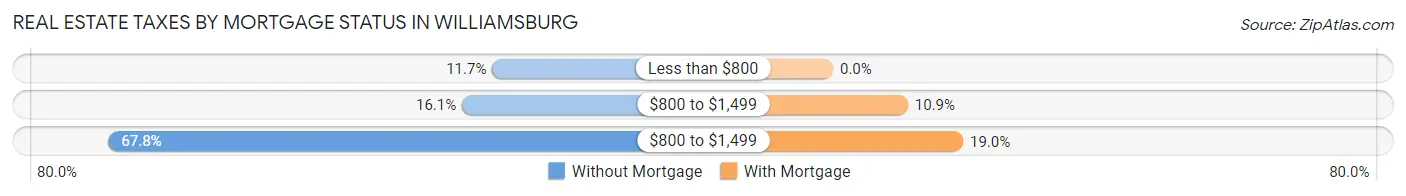
| Property Taxes | Without Mortgage | With Mortgage |
| Less than $800 | 119 (11.7%) | 0 (0.0%) |
| $800 to $1,499 | 164 (16.1%) | 160 (10.9%) |
| $800 to $1,499 | 691 (67.7%) | 278 (19.0%) |
| Total | 1,020 (100.0%) | 1,464 (100.0%) |
Health & Disability in Williamsburg
Health Insurance Coverage by Age in Williamsburg
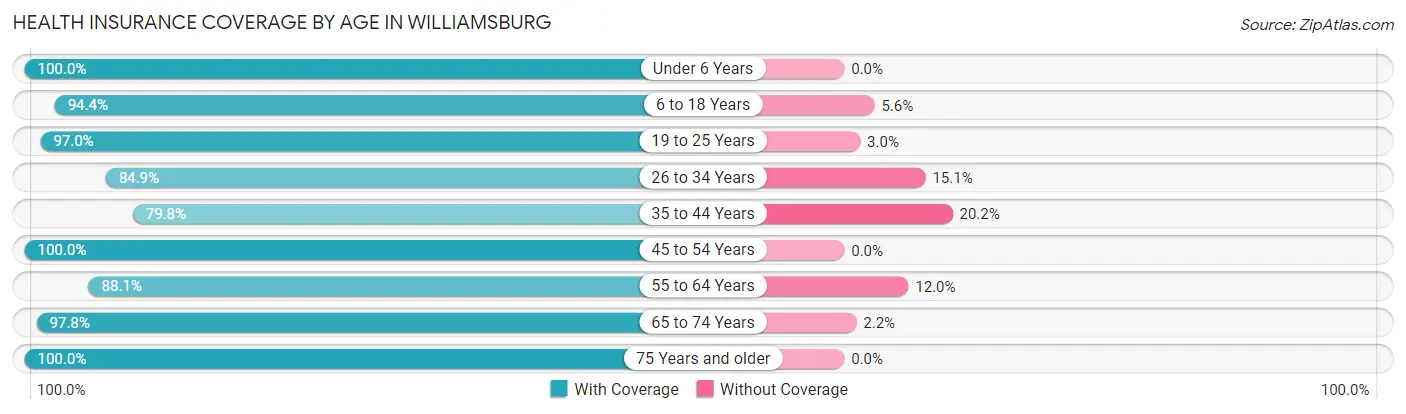
| Age Bracket | With Coverage | Without Coverage |
| Under 6 Years | 451 (100.0%) | 0 (0.0%) |
| 6 to 18 Years | 2,280 (94.4%) | 136 (5.6%) |
| 19 to 25 Years | 5,044 (97.0%) | 154 (3.0%) |
| 26 to 34 Years | 1,059 (84.9%) | 189 (15.1%) |
| 35 to 44 Years | 910 (79.8%) | 230 (20.2%) |
| 45 to 54 Years | 827 (100.0%) | 0 (0.0%) |
| 55 to 64 Years | 1,252 (88.0%) | 170 (11.9%) |
| 65 to 74 Years | 1,352 (97.8%) | 31 (2.2%) |
| 75 Years and older | 1,121 (100.0%) | 0 (0.0%) |
| Total | 14,296 (94.0%) | 910 (6.0%) |
Health Insurance Coverage by Citizenship Status in Williamsburg
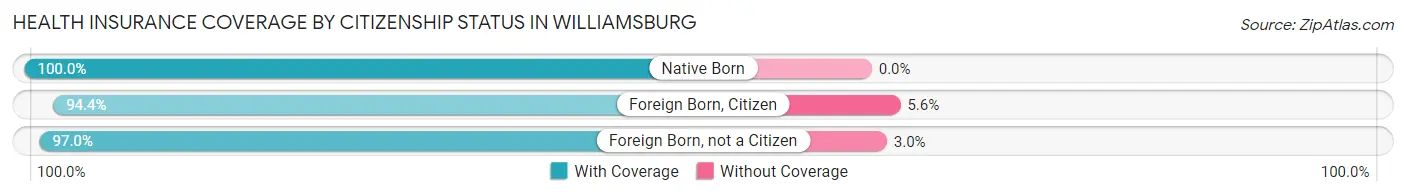
| Citizenship Status | With Coverage | Without Coverage |
| Native Born | 451 (100.0%) | 0 (0.0%) |
| Foreign Born, Citizen | 2,280 (94.4%) | 136 (5.6%) |
| Foreign Born, not a Citizen | 5,044 (97.0%) | 154 (3.0%) |
Health Insurance Coverage by Household Income in Williamsburg
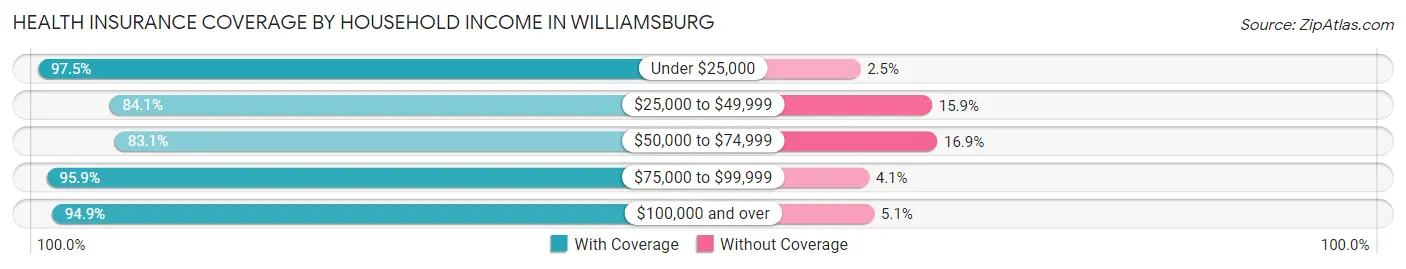
| Household Income | With Coverage | Without Coverage |
| Under $25,000 | 1,359 (97.5%) | 35 (2.5%) |
| $25,000 to $49,999 | 1,690 (84.1%) | 320 (15.9%) |
| $50,000 to $74,999 | 1,346 (83.1%) | 274 (16.9%) |
| $75,000 to $99,999 | 1,418 (95.9%) | 61 (4.1%) |
| $100,000 and over | 3,780 (94.9%) | 204 (5.1%) |
Public vs Private Health Insurance Coverage by Age in Williamsburg
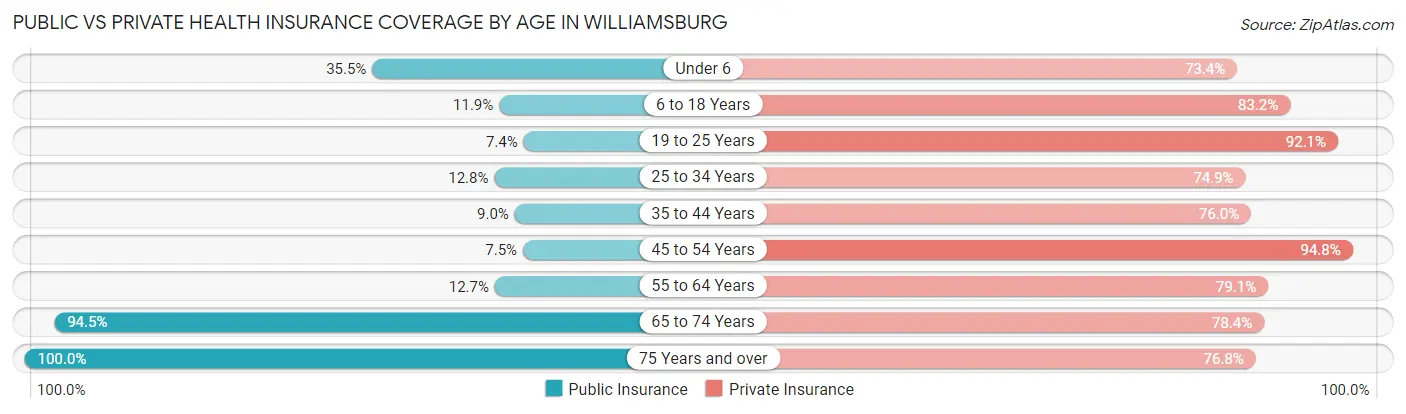
| Age Bracket | Public Insurance | Private Insurance |
| Under 6 | 160 (35.5%) | 331 (73.4%) |
| 6 to 18 Years | 288 (11.9%) | 2,010 (83.2%) |
| 19 to 25 Years | 384 (7.4%) | 4,786 (92.1%) |
| 25 to 34 Years | 160 (12.8%) | 935 (74.9%) |
| 35 to 44 Years | 103 (9.0%) | 866 (76.0%) |
| 45 to 54 Years | 62 (7.5%) | 784 (94.8%) |
| 55 to 64 Years | 181 (12.7%) | 1,125 (79.1%) |
| 65 to 74 Years | 1,307 (94.5%) | 1,084 (78.4%) |
| 75 Years and over | 1,121 (100.0%) | 861 (76.8%) |
| Total | 3,766 (24.8%) | 12,782 (84.1%) |
Disability Status by Sex by Age in Williamsburg
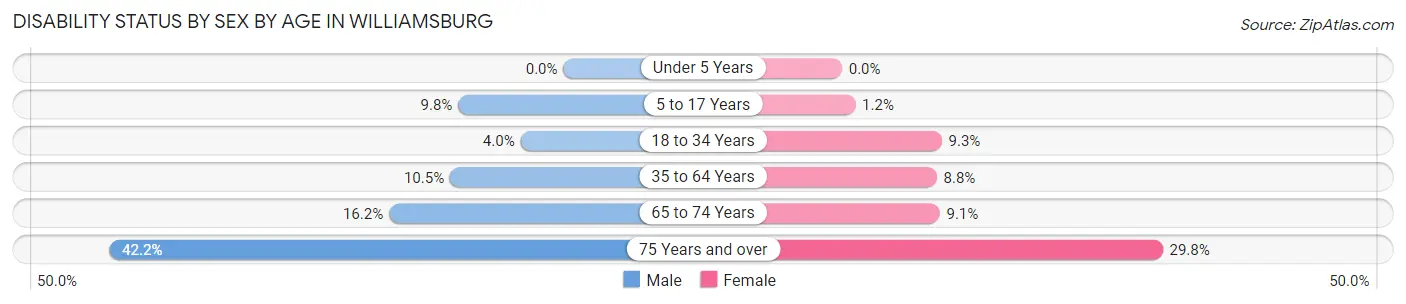
| Age Bracket | Male | Female |
| Under 5 Years | 0 (0.0%) | 0 (0.0%) |
| 5 to 17 Years | 65 (9.8%) | 7 (1.2%) |
| 18 to 34 Years | 137 (4.0%) | 397 (9.3%) |
| 35 to 64 Years | 164 (10.5%) | 161 (8.8%) |
| 65 to 74 Years | 106 (16.2%) | 66 (9.1%) |
| 75 Years and over | 212 (42.1%) | 184 (29.8%) |
Disability Class by Sex by Age in Williamsburg
Disability Class: Hearing Difficulty
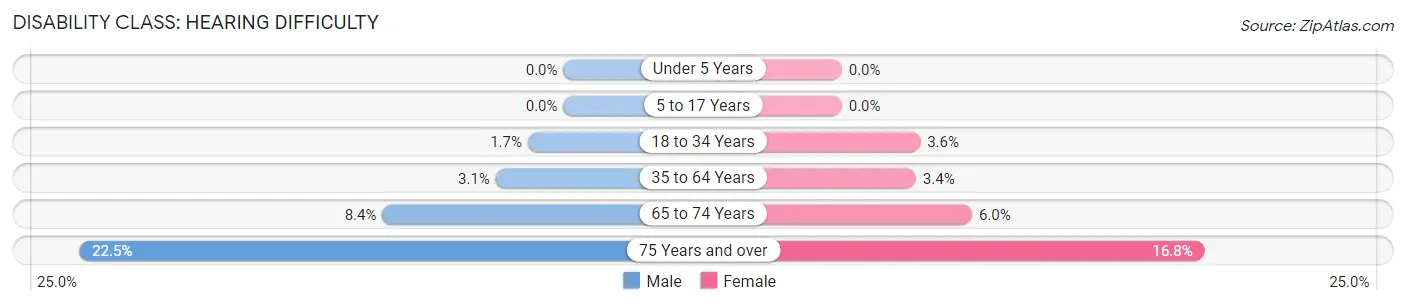
| Age Bracket | Male | Female |
| Under 5 Years | 0 (0.0%) | 0 (0.0%) |
| 5 to 17 Years | 0 (0.0%) | 0 (0.0%) |
| 18 to 34 Years | 57 (1.7%) | 156 (3.6%) |
| 35 to 64 Years | 49 (3.1%) | 63 (3.4%) |
| 65 to 74 Years | 55 (8.4%) | 44 (6.0%) |
| 75 Years and over | 113 (22.5%) | 104 (16.8%) |
Disability Class: Vision Difficulty
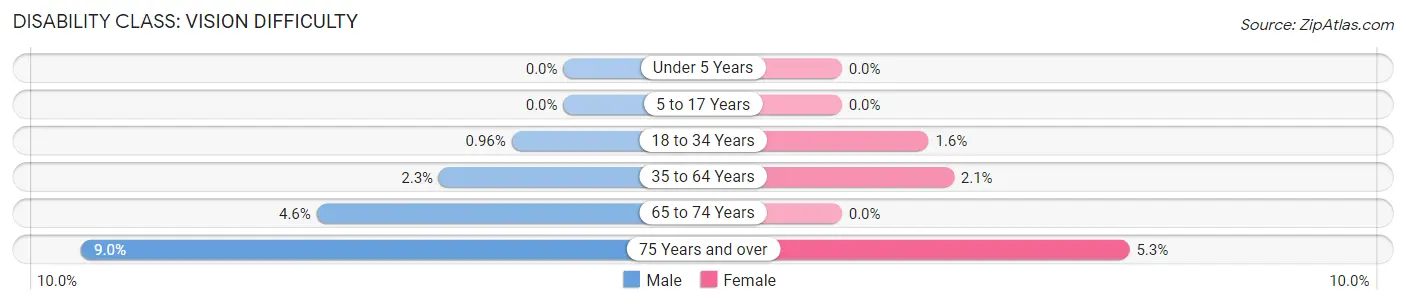
| Age Bracket | Male | Female |
| Under 5 Years | 0 (0.0%) | 0 (0.0%) |
| 5 to 17 Years | 0 (0.0%) | 0 (0.0%) |
| 18 to 34 Years | 33 (1.0%) | 69 (1.6%) |
| 35 to 64 Years | 36 (2.3%) | 38 (2.1%) |
| 65 to 74 Years | 30 (4.6%) | 0 (0.0%) |
| 75 Years and over | 45 (8.9%) | 33 (5.3%) |
Disability Class: Cognitive Difficulty
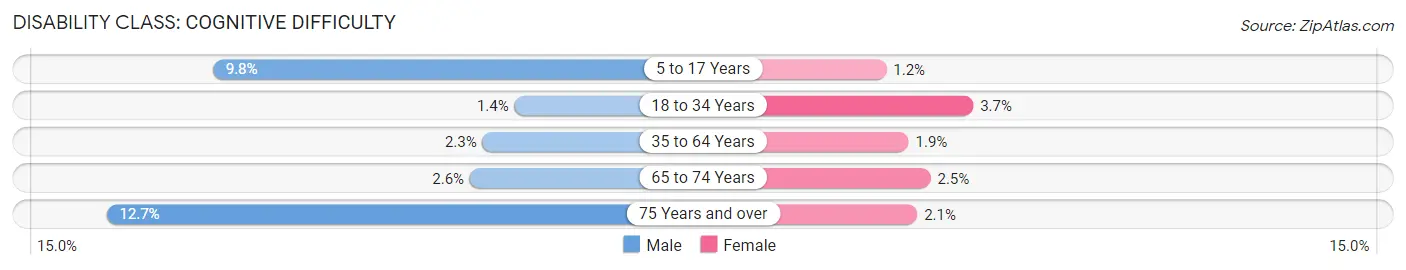
| Age Bracket | Male | Female |
| 5 to 17 Years | 65 (9.8%) | 7 (1.2%) |
| 18 to 34 Years | 47 (1.4%) | 157 (3.7%) |
| 35 to 64 Years | 35 (2.2%) | 34 (1.9%) |
| 65 to 74 Years | 17 (2.6%) | 18 (2.5%) |
| 75 Years and over | 64 (12.7%) | 13 (2.1%) |
Disability Class: Ambulatory Difficulty
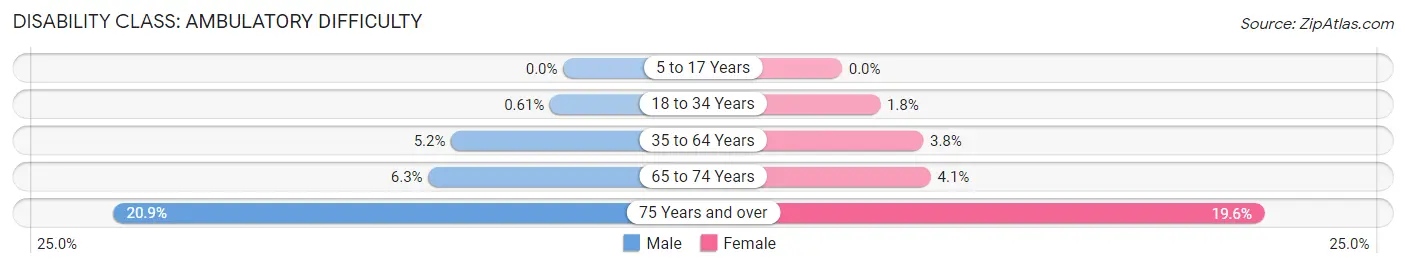
| Age Bracket | Male | Female |
| 5 to 17 Years | 0 (0.0%) | 0 (0.0%) |
| 18 to 34 Years | 21 (0.6%) | 76 (1.8%) |
| 35 to 64 Years | 81 (5.2%) | 69 (3.8%) |
| 65 to 74 Years | 41 (6.3%) | 30 (4.1%) |
| 75 Years and over | 105 (20.9%) | 121 (19.6%) |
Disability Class: Self-Care Difficulty
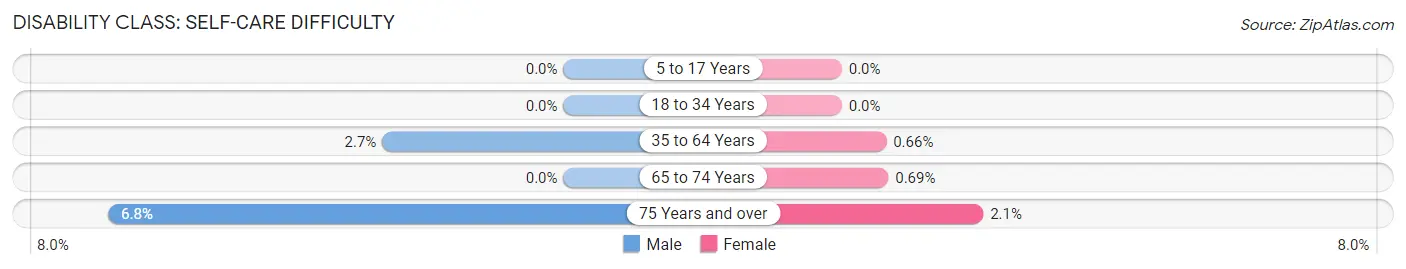
| Age Bracket | Male | Female |
| 5 to 17 Years | 0 (0.0%) | 0 (0.0%) |
| 18 to 34 Years | 0 (0.0%) | 0 (0.0%) |
| 35 to 64 Years | 42 (2.7%) | 12 (0.7%) |
| 65 to 74 Years | 0 (0.0%) | 5 (0.7%) |
| 75 Years and over | 34 (6.8%) | 13 (2.1%) |
Technology Access in Williamsburg
Computing Device Access in Williamsburg
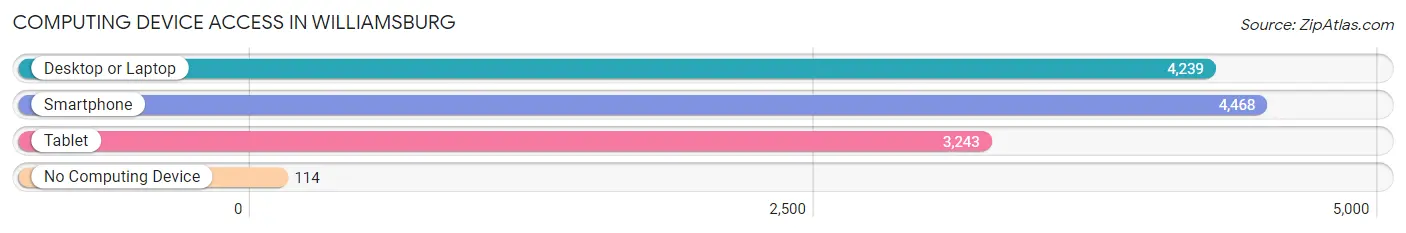
| Device Type | # Households | % Households |
| Desktop or Laptop | 4,239 | 86.8% |
| Smartphone | 4,468 | 91.5% |
| Tablet | 3,243 | 66.4% |
| No Computing Device | 114 | 2.3% |
| Total | 4,882 | 100.0% |
Internet Access in Williamsburg
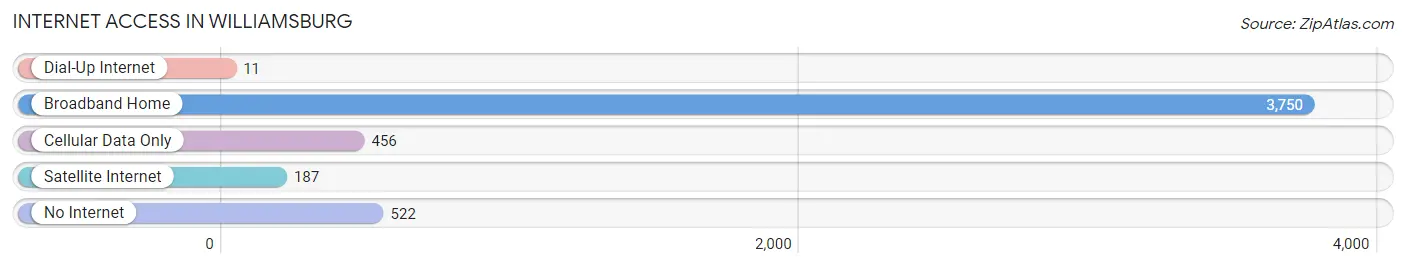
| Internet Type | # Households | % Households |
| Dial-Up Internet | 11 | 0.2% |
| Broadband Home | 3,750 | 76.8% |
| Cellular Data Only | 456 | 9.3% |
| Satellite Internet | 187 | 3.8% |
| No Internet | 522 | 10.7% |
| Total | 4,882 | 100.0% |
Williamsburg Summary
Williamsburg, Virginia is a city located in the Hampton Roads region of the Commonwealth of Virginia. It is the county seat of James City County and is located on the Virginia Peninsula, between the York and James Rivers. The city is home to the College of William & Mary, the second oldest college in the United States, and is a popular tourist destination due to its historical significance.
History
The area that is now Williamsburg was first settled by English colonists in 1633, when the Virginia Company of London established the Jamestown Settlement. The settlement was abandoned in 1699, and the area was largely uninhabited until the mid-1700s, when the city of Williamsburg was founded. The city was named after King William III of England, and was the capital of the Virginia Colony from 1699 to 1780. During this period, Williamsburg was a center of political and social life in the colony, and was home to the House of Burgesses, the first representative legislative assembly in the New World.
The city was also the site of several important events in the American Revolution, including the first reading of the Declaration of Independence in 1776. After the Revolution, Williamsburg declined in importance and was largely forgotten until the early 20th century, when it was rediscovered by preservationists. In 1926, the city was designated a National Historic Landmark, and in the 1950s, the Colonial Williamsburg Foundation was established to restore and preserve the city’s historic buildings and sites. Today, Williamsburg is a popular tourist destination, and is home to a number of museums, galleries, and other attractions.
Geography
Williamsburg is located in the Hampton Roads region of Virginia, on the Virginia Peninsula between the York and James Rivers. The city covers an area of 8.3 square miles, and is bordered by James City County to the north and York County to the south. The city is located approximately 100 miles southeast of Richmond, the state capital, and is part of the Hampton Roads metropolitan area.
The city is situated on a flat coastal plain, and is characterized by rolling hills and wooded areas. The climate is humid subtropical, with hot, humid summers and mild winters. The average annual temperature is around 60°F, and the average annual precipitation is around 45 inches.
Economy
Williamsburg’s economy is largely driven by tourism, with the city’s historic sites and attractions drawing millions of visitors each year. The city is also home to a number of manufacturing and technology companies, as well as a number of government and military installations. The city’s largest employers include the College of William & Mary, Colonial Williamsburg, Busch Gardens, and the United States Department of Defense.
Demographics
As of the 2010 census, Williamsburg had a population of 14,068. The city’s population is predominantly white (83.3%), with African Americans making up 8.7% of the population and Hispanics making up 4.2%. The median household income is $50,945, and the median home value is $269,400. The city’s poverty rate is 11.2%.
Common Questions
What is Per Capita Income in Williamsburg?
Per Capita income in Williamsburg is $35,264.
What is the Median Family Income in Williamsburg?
Median Family Income in Williamsburg is $94,184.
What is the Median Household income in Williamsburg?
Median Household Income in Williamsburg is $66,815.
What is Income or Wage Gap in Williamsburg?
Income or Wage Gap in Williamsburg is 63.7%.
Women in Williamsburg earn 36.3 cents for every dollar earned by a man.
What is Family Income Deficit in Williamsburg?
Family Income Deficit in Williamsburg is $8,300.
Families that are below poverty line in Williamsburg earn $8,300 less on average than the poverty threshold level.
What is Inequality or Gini Index in Williamsburg?
Inequality or Gini Index in Williamsburg is 0.53.
What is the Total Population of Williamsburg?
Total Population of Williamsburg is 15,486.
What is the Total Male Population of Williamsburg?
Total Male Population of Williamsburg is 7,277.
What is the Total Female Population of Williamsburg?
Total Female Population of Williamsburg is 8,209.
What is the Ratio of Males per 100 Females in Williamsburg?
There are 88.65 Males per 100 Females in Williamsburg.
What is the Ratio of Females per 100 Males in Williamsburg?
There are 112.81 Females per 100 Males in Williamsburg.
What is the Median Population Age in Williamsburg?
Median Population Age in Williamsburg is 24.6 Years.
What is the Average Family Size in Williamsburg
Average Family Size in Williamsburg is 2.8 People.
What is the Average Household Size in Williamsburg
Average Household Size in Williamsburg is 2.2 People.
How Large is the Labor Force in Williamsburg?
There are 6,968 People in the Labor Forcein in Williamsburg.
What is the Percentage of People in the Labor Force in Williamsburg?
49.4% of People are in the Labor Force in Williamsburg.
What is the Unemployment Rate in Williamsburg?
Unemployment Rate in Williamsburg is 6.0%.