Pimmit Hills, VA Map & Demographics
Pimmit Hills Map
Pimmit Hills Overview
$59,403
PER CAPITA INCOME
$161,667
AVG FAMILY INCOME
$152,257
AVG HOUSEHOLD INCOME
64.2%
WAGE / INCOME GAP [ % ]
35.8¢/ $1
WAGE / INCOME GAP [ $ ]
0.38
INEQUALITY / GINI INDEX
6,500
TOTAL POPULATION
3,048
MALE POPULATION
3,452
FEMALE POPULATION
88.30
MALES / 100 FEMALES
113.25
FEMALES / 100 MALES
36.5
MEDIAN AGE
3.5
AVG FAMILY SIZE
2.9
AVG HOUSEHOLD SIZE
3,566
LABOR FORCE [ PEOPLE ]
71.0%
PERCENT IN LABOR FORCE
3.3%
UNEMPLOYMENT RATE
Income in Pimmit Hills
Income Overview in Pimmit Hills
Per Capita Income in Pimmit Hills is $59,403, while median incomes of families and households are $161,667 and $152,257 respectively.
| Characteristic | Number | Measure |
| Per Capita Income | 6,500 | $59,403 |
| Median Family Income | 1,506 | $161,667 |
| Mean Family Income | 1,506 | $189,581 |
| Median Household Income | 2,219 | $152,257 |
| Mean Household Income | 2,219 | $172,625 |
| Income Deficit | 1,506 | $0 |
| Wage / Income Gap (%) | 6,500 | 64.25% |
| Wage / Income Gap ($) | 6,500 | 35.75¢ per $1 |
| Gini / Inequality Index | 6,500 | 0.38 |
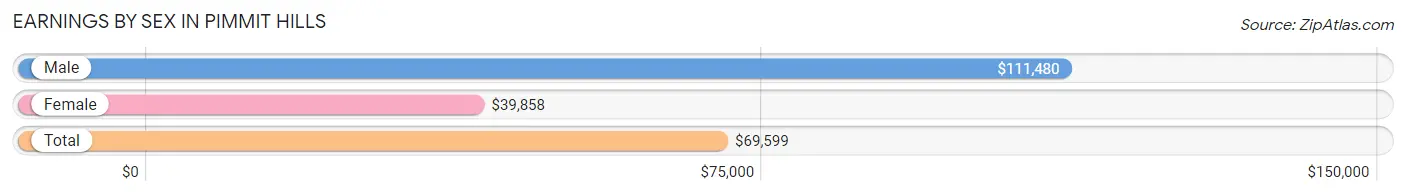
Earnings by Sex in Pimmit Hills
Average Earnings in Pimmit Hills are $69,599, $111,480 for men and $39,858 for women, a difference of 64.2%.
| Sex | Number | Average Earnings |
| Male | 1,864 (50.4%) | $111,480 |
| Female | 1,834 (49.6%) | $39,858 |
| Total | 3,698 (100.0%) | $69,599 |
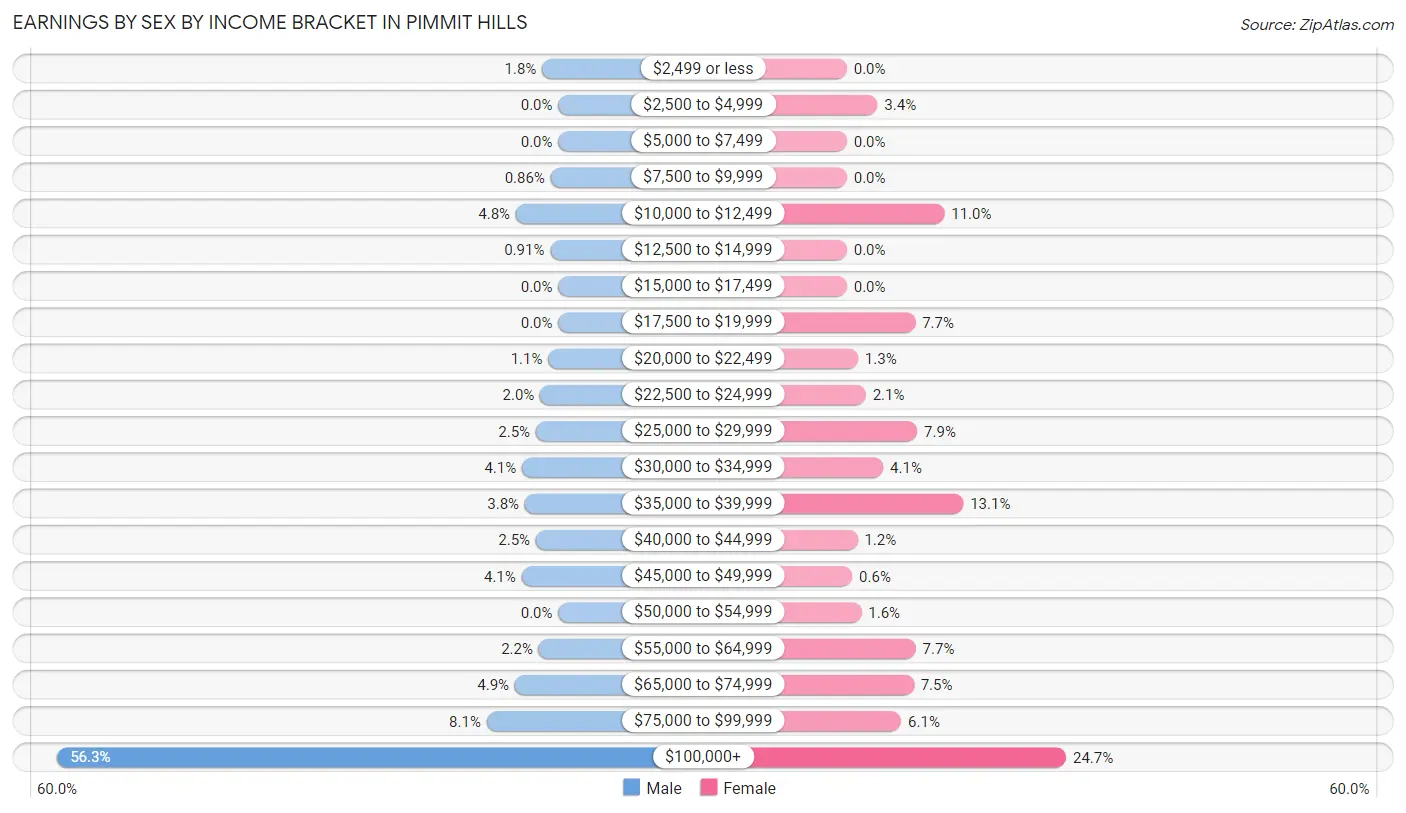
Earnings by Sex by Income Bracket in Pimmit Hills
The most common earnings brackets in Pimmit Hills are $100,000+ for men (1,050 | 56.3%) and $100,000+ for women (452 | 24.6%).
| Income | Male | Female |
| $2,499 or less | 34 (1.8%) | 0 (0.0%) |
| $2,500 to $4,999 | 0 (0.0%) | 63 (3.4%) |
| $5,000 to $7,499 | 0 (0.0%) | 0 (0.0%) |
| $7,500 to $9,999 | 16 (0.9%) | 0 (0.0%) |
| $10,000 to $12,499 | 89 (4.8%) | 201 (11.0%) |
| $12,500 to $14,999 | 17 (0.9%) | 0 (0.0%) |
| $15,000 to $17,499 | 0 (0.0%) | 0 (0.0%) |
| $17,500 to $19,999 | 0 (0.0%) | 141 (7.7%) |
| $20,000 to $22,499 | 21 (1.1%) | 23 (1.3%) |
| $22,500 to $24,999 | 38 (2.0%) | 39 (2.1%) |
| $25,000 to $29,999 | 47 (2.5%) | 145 (7.9%) |
| $30,000 to $34,999 | 76 (4.1%) | 75 (4.1%) |
| $35,000 to $39,999 | 70 (3.8%) | 240 (13.1%) |
| $40,000 to $44,999 | 47 (2.5%) | 22 (1.2%) |
| $45,000 to $49,999 | 77 (4.1%) | 11 (0.6%) |
| $50,000 to $54,999 | 0 (0.0%) | 30 (1.6%) |
| $55,000 to $64,999 | 41 (2.2%) | 142 (7.7%) |
| $65,000 to $74,999 | 91 (4.9%) | 138 (7.5%) |
| $75,000 to $99,999 | 150 (8.1%) | 112 (6.1%) |
| $100,000+ | 1,050 (56.3%) | 452 (24.6%) |
| Total | 1,864 (100.0%) | 1,834 (100.0%) |
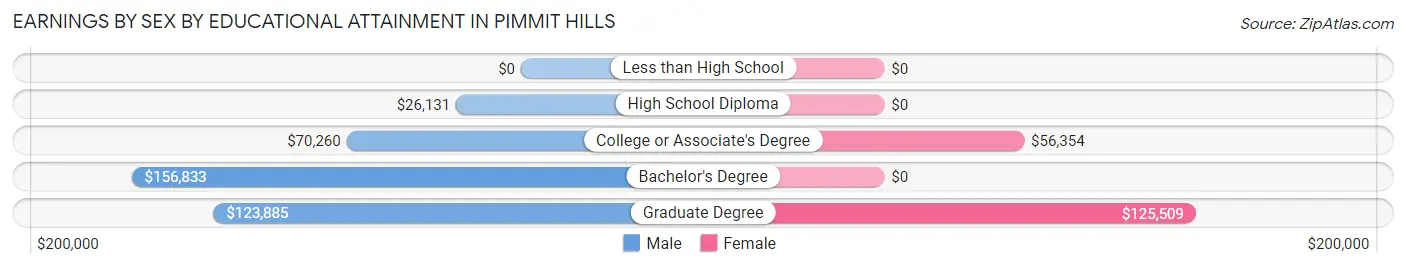
Earnings by Sex by Educational Attainment in Pimmit Hills
Average earnings in Pimmit Hills are $113,733 for men and $58,675 for women, a difference of 48.4%. Men with an educational attainment of bachelor's degree enjoy the highest average annual earnings of $156,833, while those with high school diploma education earn the least with $26,131. Women with an educational attainment of graduate degree earn the most with the average annual earnings of $125,509, while those with college or associate's degree education have the smallest earnings of $56,354.
| Educational Attainment | Male Income | Female Income |
| Less than High School | - | - |
| High School Diploma | $26,131 | $0 |
| College or Associate's Degree | $70,260 | $56,354 |
| Bachelor's Degree | $156,833 | $0 |
| Graduate Degree | $123,885 | $125,509 |
| Total | $113,733 | $58,675 |
Family Income in Pimmit Hills
Family Income Brackets in Pimmit Hills
According to the Pimmit Hills family income data, there are 592 families falling into the $200,000+ income range, which is the most common income bracket and makes up 39.3% of all families.
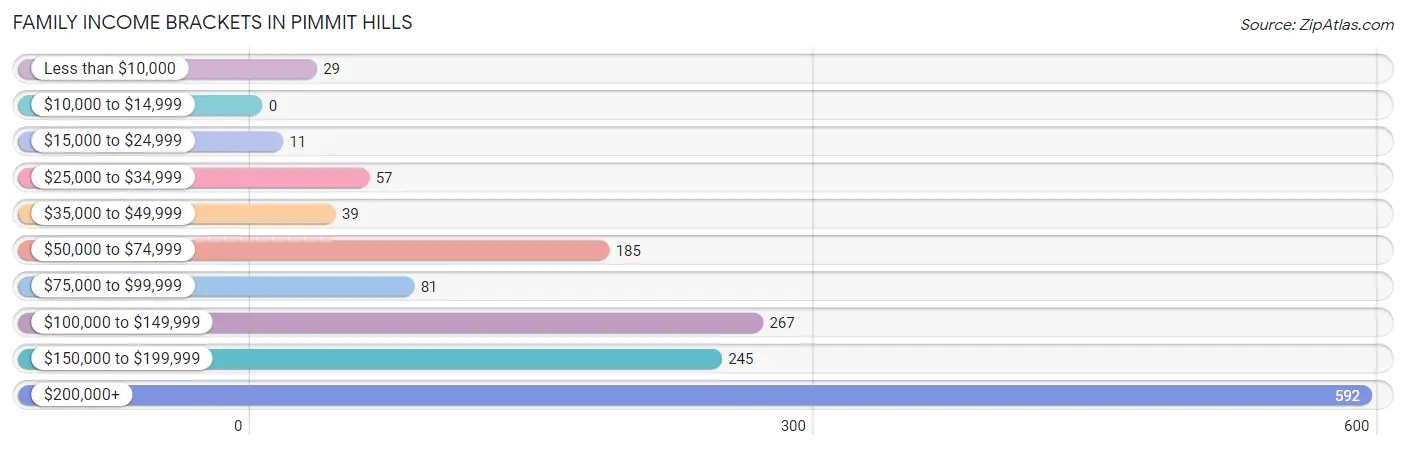
| Income Bracket | # Families | % Families |
| Less than $10,000 | 29 | 1.9% |
| $10,000 to $14,999 | 0 | 0.0% |
| $15,000 to $24,999 | 11 | 0.7% |
| $25,000 to $34,999 | 57 | 3.8% |
| $35,000 to $49,999 | 39 | 2.6% |
| $50,000 to $74,999 | 185 | 12.3% |
| $75,000 to $99,999 | 81 | 5.4% |
| $100,000 to $149,999 | 267 | 17.7% |
| $150,000 to $199,999 | 245 | 16.3% |
| $200,000+ | 592 | 39.3% |
Family Income by Famaliy Size in Pimmit Hills
5-person families (102 | 6.8%) account for the highest median family income in Pimmit Hills with $250,001 per family, while 4-person families (347 | 23.0%) have the highest median income of $60,448 per family member.
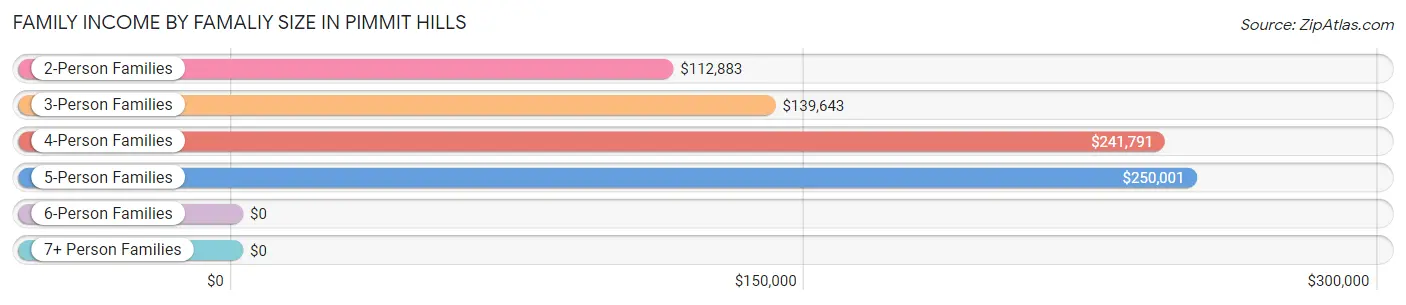
| Income Bracket | # Families | Median Income |
| 2-Person Families | 565 (37.5%) | $112,883 |
| 3-Person Families | 334 (22.2%) | $139,643 |
| 4-Person Families | 347 (23.0%) | $241,791 |
| 5-Person Families | 102 (6.8%) | $250,001 |
| 6-Person Families | 77 (5.1%) | $0 |
| 7+ Person Families | 81 (5.4%) | $0 |
| Total | 1,506 (100.0%) | $161,667 |
Family Income by Number of Earners in Pimmit Hills
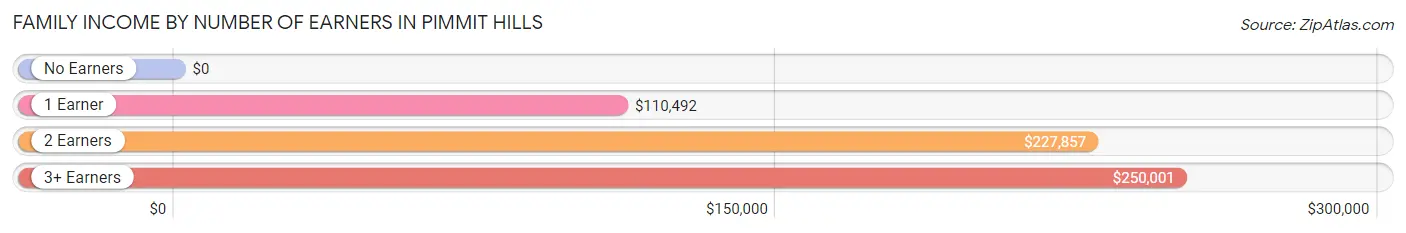
| Number of Earners | # Families | Median Income |
| No Earners | 82 (5.4%) | $0 |
| 1 Earner | 638 (42.4%) | $110,492 |
| 2 Earners | 638 (42.4%) | $227,857 |
| 3+ Earners | 148 (9.8%) | $250,001 |
| Total | 1,506 (100.0%) | $161,667 |
Household Income in Pimmit Hills
Household Income Brackets in Pimmit Hills
With 868 households falling in the category, the $200,000+ income range is the most frequent in Pimmit Hills, accounting for 39.1% of all households. In contrast, only 20 households (0.9%) fall into the $10,000 to $14,999 income bracket, making it the least populous group.
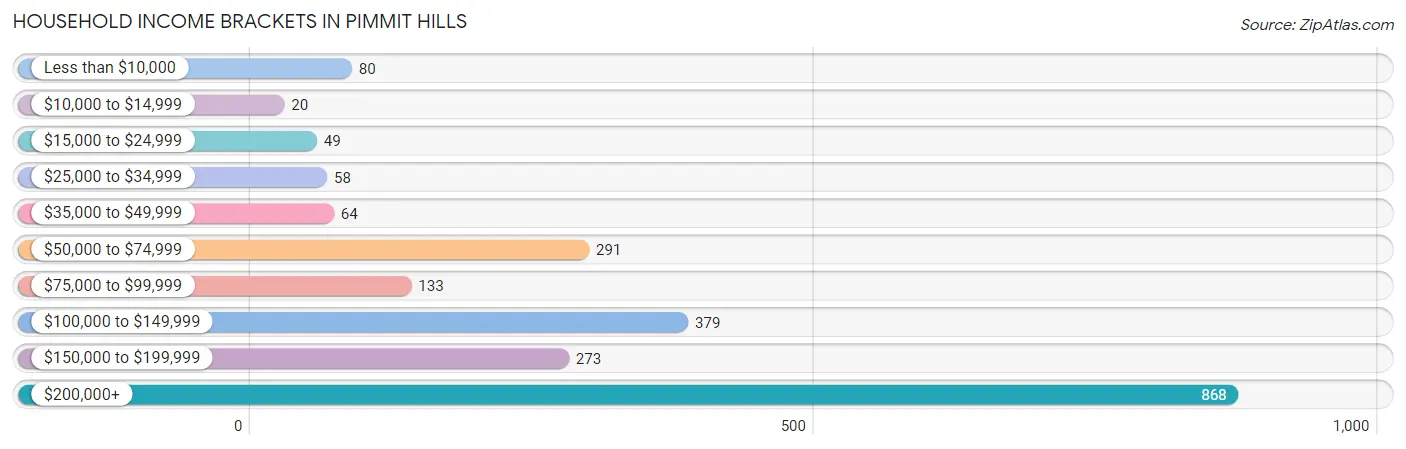
| Income Bracket | # Households | % Households |
| Less than $10,000 | 80 | 3.6% |
| $10,000 to $14,999 | 20 | 0.9% |
| $15,000 to $24,999 | 49 | 2.2% |
| $25,000 to $34,999 | 58 | 2.6% |
| $35,000 to $49,999 | 64 | 2.9% |
| $50,000 to $74,999 | 291 | 13.1% |
| $75,000 to $99,999 | 133 | 6.0% |
| $100,000 to $149,999 | 379 | 17.1% |
| $150,000 to $199,999 | 273 | 12.3% |
| $200,000+ | 868 | 39.1% |
Household Income by Householder Age in Pimmit Hills
The median household income in Pimmit Hills is $152,257, with the highest median household income of $212,696 found in the 25 to 44 years age bracket for the primary householder. A total of 891 households (40.2%) fall into this category.
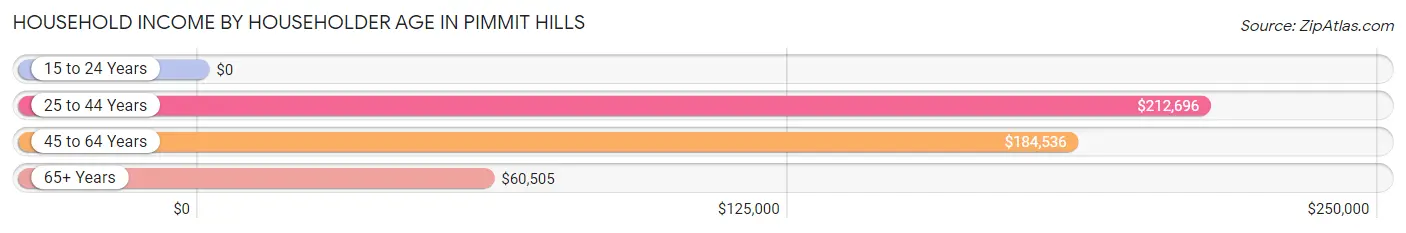
| Income Bracket | # Households | Median Income |
| 15 to 24 Years | 0 (0.0%) | $0 |
| 25 to 44 Years | 891 (40.2%) | $212,696 |
| 45 to 64 Years | 837 (37.7%) | $184,536 |
| 65+ Years | 491 (22.1%) | $60,505 |
| Total | 2,219 (100.0%) | $152,257 |
Poverty in Pimmit Hills
Income Below Poverty by Sex and Age in Pimmit Hills
With 3.0% poverty level for males and 4.0% for females among the residents of Pimmit Hills, 25 to 34 year old males and 75 year old and over females are the most vulnerable to poverty, with 61 males (9.6%) and 72 females (33.2%) in their respective age groups living below the poverty level.
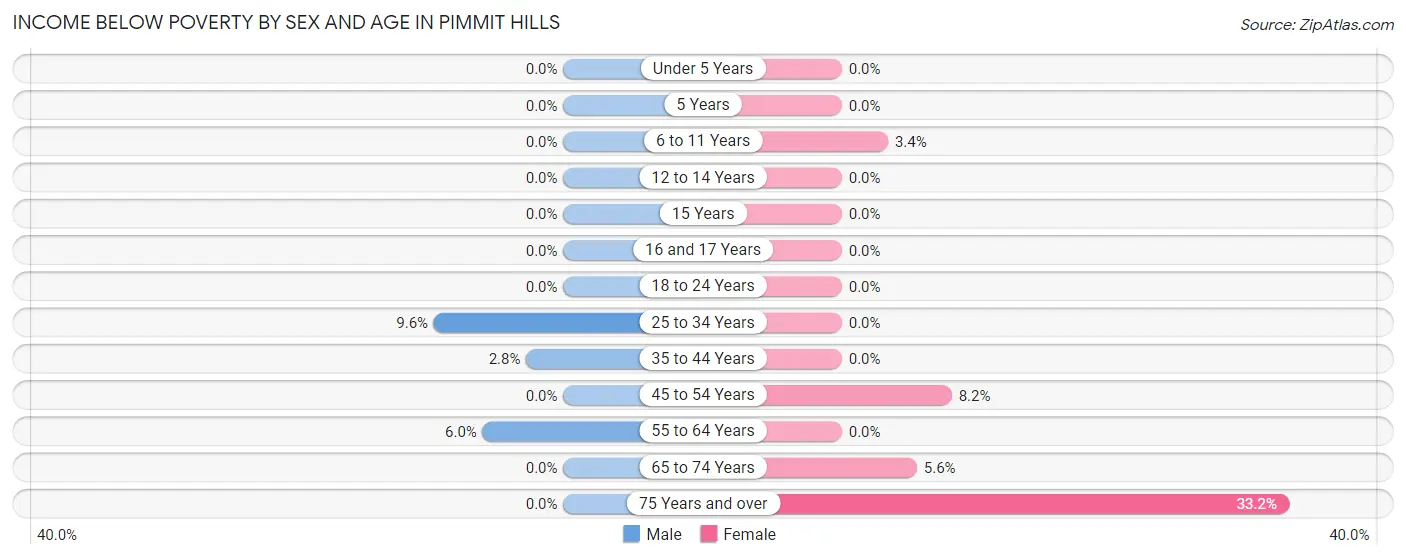
| Age Bracket | Male | Female |
| Under 5 Years | 0 (0.0%) | 0 (0.0%) |
| 5 Years | 0 (0.0%) | 0 (0.0%) |
| 6 to 11 Years | 0 (0.0%) | 11 (3.4%) |
| 12 to 14 Years | 0 (0.0%) | 0 (0.0%) |
| 15 Years | 0 (0.0%) | 0 (0.0%) |
| 16 and 17 Years | 0 (0.0%) | 0 (0.0%) |
| 18 to 24 Years | 0 (0.0%) | 0 (0.0%) |
| 25 to 34 Years | 61 (9.6%) | 0 (0.0%) |
| 35 to 44 Years | 13 (2.8%) | 0 (0.0%) |
| 45 to 54 Years | 0 (0.0%) | 39 (8.2%) |
| 55 to 64 Years | 17 (6.0%) | 0 (0.0%) |
| 65 to 74 Years | 0 (0.0%) | 17 (5.6%) |
| 75 Years and over | 0 (0.0%) | 72 (33.2%) |
| Total | 91 (3.0%) | 139 (4.0%) |
Income Above Poverty by Sex and Age in Pimmit Hills
According to the poverty statistics in Pimmit Hills, males aged under 5 years and females aged under 5 years are the age groups that are most secure financially, with 100.0% of males and 100.0% of females in these age groups living above the poverty line.
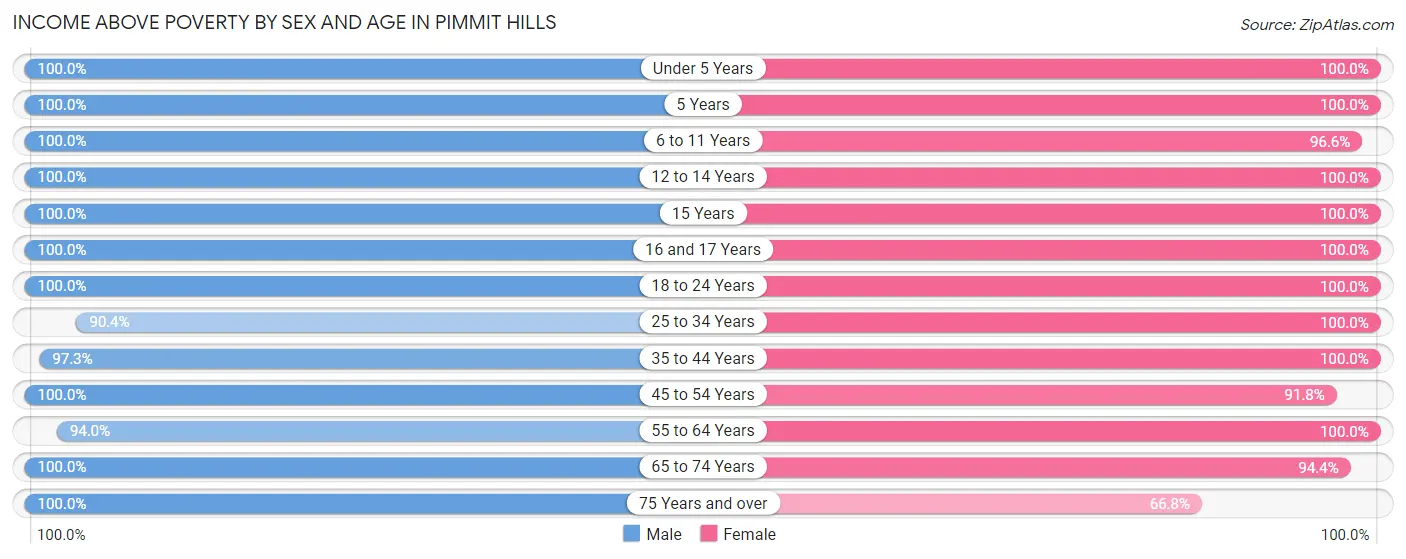
| Age Bracket | Male | Female |
| Under 5 Years | 183 (100.0%) | 310 (100.0%) |
| 5 Years | 17 (100.0%) | 18 (100.0%) |
| 6 to 11 Years | 301 (100.0%) | 310 (96.6%) |
| 12 to 14 Years | 132 (100.0%) | 135 (100.0%) |
| 15 Years | 41 (100.0%) | 20 (100.0%) |
| 16 and 17 Years | 42 (100.0%) | 80 (100.0%) |
| 18 to 24 Years | 152 (100.0%) | 269 (100.0%) |
| 25 to 34 Years | 574 (90.4%) | 464 (100.0%) |
| 35 to 44 Years | 459 (97.3%) | 567 (100.0%) |
| 45 to 54 Years | 468 (100.0%) | 439 (91.8%) |
| 55 to 64 Years | 267 (94.0%) | 268 (100.0%) |
| 65 to 74 Years | 219 (100.0%) | 288 (94.4%) |
| 75 Years and over | 102 (100.0%) | 145 (66.8%) |
| Total | 2,957 (97.0%) | 3,313 (96.0%) |
Income Below Poverty Among Married-Couple Families in Pimmit Hills
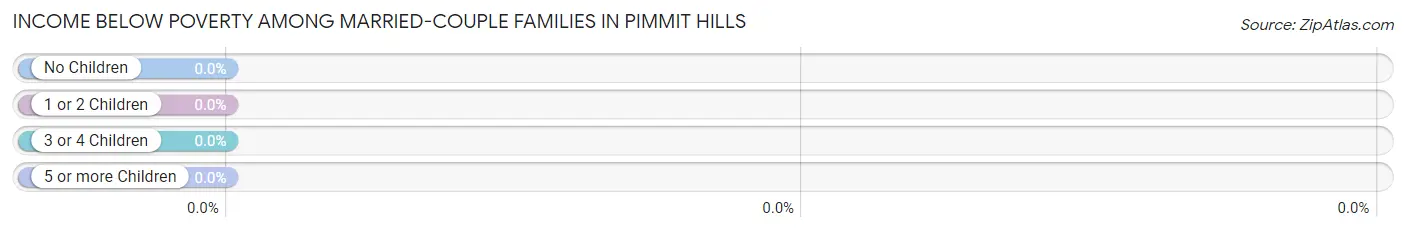
| Children | Above Poverty | Below Poverty |
| No Children | 377 (100.0%) | 0 (0.0%) |
| 1 or 2 Children | 540 (100.0%) | 0 (0.0%) |
| 3 or 4 Children | 175 (100.0%) | 0 (0.0%) |
| 5 or more Children | 0 (0.0%) | 0 (0.0%) |
| Total | 1,092 (100.0%) | 0 (0.0%) |
Income Below Poverty Among Single-Parent Households in Pimmit Hills
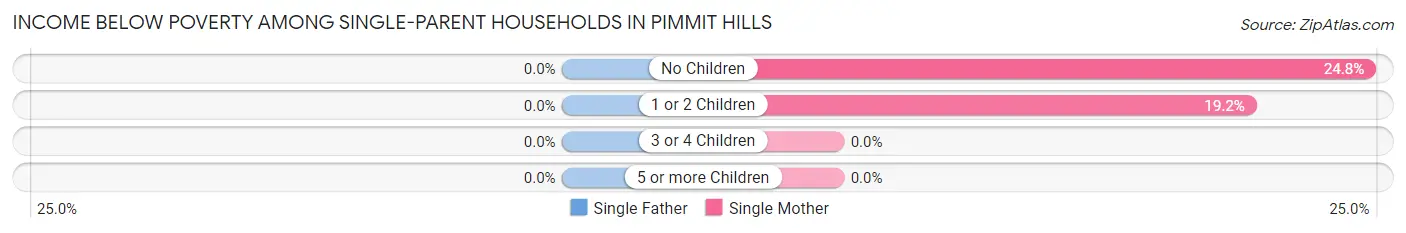
| Children | Single Father | Single Mother |
| No Children | 0 (0.0%) | 29 (24.8%) |
| 1 or 2 Children | 0 (0.0%) | 10 (19.2%) |
| 3 or 4 Children | 0 (0.0%) | 0 (0.0%) |
| 5 or more Children | 0 (0.0%) | 0 (0.0%) |
| Total | 0 (0.0%) | 39 (23.1%) |
Income Below Poverty Among Married-Couple vs Single-Parent Households in Pimmit Hills
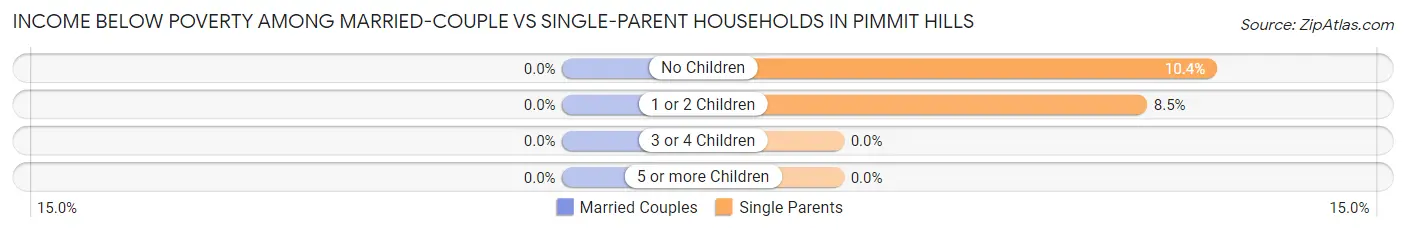
| Children | Married-Couple Families | Single-Parent Households |
| No Children | 0 (0.0%) | 29 (10.4%) |
| 1 or 2 Children | 0 (0.0%) | 10 (8.5%) |
| 3 or 4 Children | 0 (0.0%) | 0 (0.0%) |
| 5 or more Children | 0 (0.0%) | 0 (0.0%) |
| Total | 0 (0.0%) | 39 (9.4%) |
Race in Pimmit Hills
The most populous races in Pimmit Hills are White / Caucasian (2,970 | 45.7%), Asian (2,342 | 36.0%), and Hispanic or Latino (701 | 10.8%).
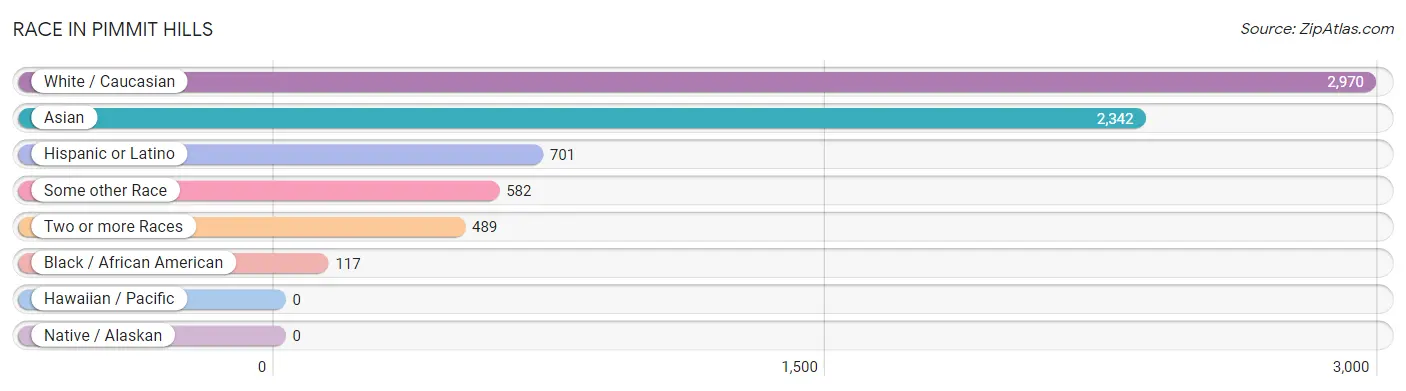
| Race | # Population | % Population |
| Asian | 2,342 | 36.0% |
| Black / African American | 117 | 1.8% |
| Hawaiian / Pacific | 0 | 0.0% |
| Hispanic or Latino | 701 | 10.8% |
| Native / Alaskan | 0 | 0.0% |
| White / Caucasian | 2,970 | 45.7% |
| Two or more Races | 489 | 7.5% |
| Some other Race | 582 | 8.9% |
| Total | 6,500 | 100.0% |
Ancestry in Pimmit Hills
The most populous ancestries reported in Pimmit Hills are Thai (780 | 12.0%), German (730 | 11.2%), Indian (Asian) (604 | 9.3%), English (490 | 7.5%), and South American (461 | 7.1%), together accounting for 47.1% of all Pimmit Hills residents.
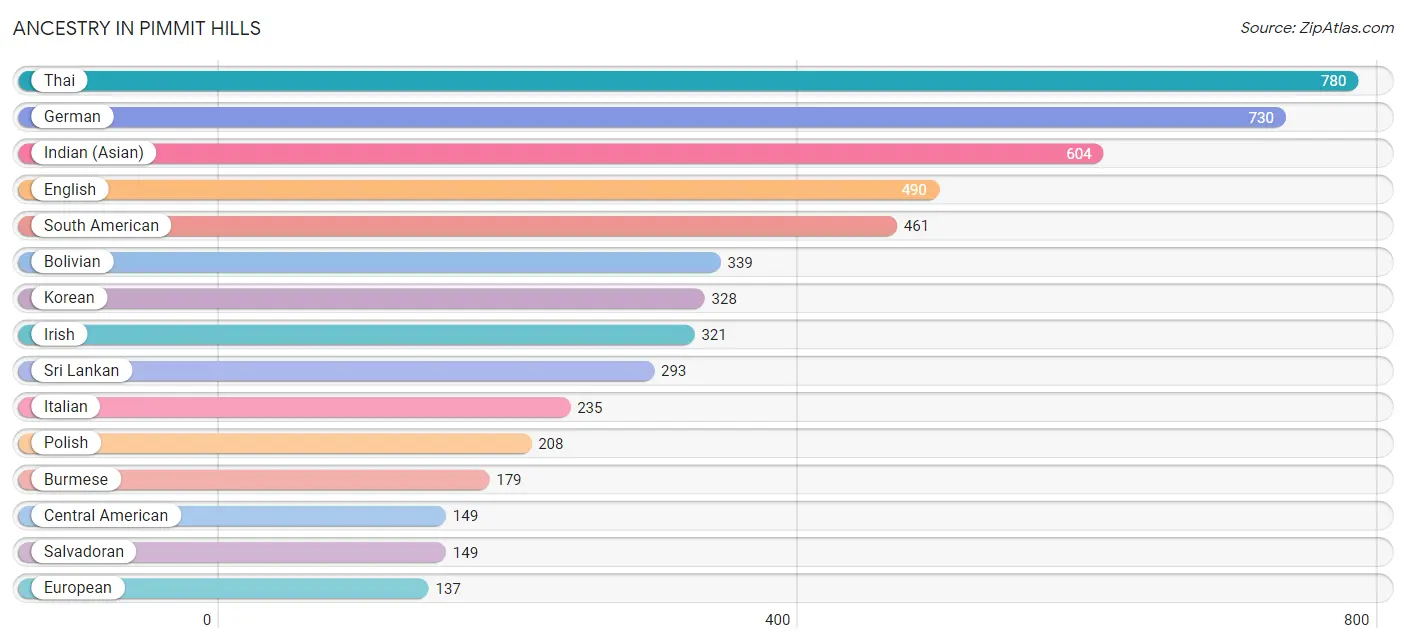
| Ancestry | # Population | % Population |
| African | 41 | 0.6% |
| American | 54 | 0.8% |
| Arab | 55 | 0.9% |
| Armenian | 39 | 0.6% |
| Bhutanese | 17 | 0.3% |
| Bolivian | 339 | 5.2% |
| British | 133 | 2.1% |
| Burmese | 179 | 2.8% |
| Central American | 149 | 2.3% |
| Danish | 15 | 0.2% |
| Eastern European | 42 | 0.6% |
| English | 490 | 7.5% |
| European | 137 | 2.1% |
| Filipino | 68 | 1.1% |
| French | 24 | 0.4% |
| German | 730 | 11.2% |
| Indian (Asian) | 604 | 9.3% |
| Iranian | 34 | 0.5% |
| Irish | 321 | 4.9% |
| Italian | 235 | 3.6% |
| Japanese | 28 | 0.4% |
| Korean | 328 | 5.1% |
| Lithuanian | 5 | 0.1% |
| Macedonian | 35 | 0.5% |
| Mexican | 21 | 0.3% |
| Northern European | 28 | 0.4% |
| Norwegian | 44 | 0.7% |
| Pakistani | 46 | 0.7% |
| Palestinian | 21 | 0.3% |
| Peruvian | 122 | 1.9% |
| Polish | 208 | 3.2% |
| Romanian | 6 | 0.1% |
| Russian | 123 | 1.9% |
| Salvadoran | 149 | 2.3% |
| Scotch-Irish | 124 | 1.9% |
| Scottish | 5 | 0.1% |
| South American | 461 | 7.1% |
| Sri Lankan | 293 | 4.5% |
| Subsaharan African | 41 | 0.6% |
| Swedish | 33 | 0.5% |
| Thai | 780 | 12.0% |
| Ukrainian | 16 | 0.3% |
| Vietnamese | 61 | 0.9% |
| Welsh | 35 | 0.5% | View All 44 Rows |
Immigrants in Pimmit Hills
The most numerous immigrant groups reported in Pimmit Hills came from Asia (1,996 | 30.7%), South Central Asia (842 | 13.0%), India (708 | 10.9%), Eastern Asia (571 | 8.8%), and Latin America (553 | 8.5%), together accounting for 71.8% of all Pimmit Hills residents.
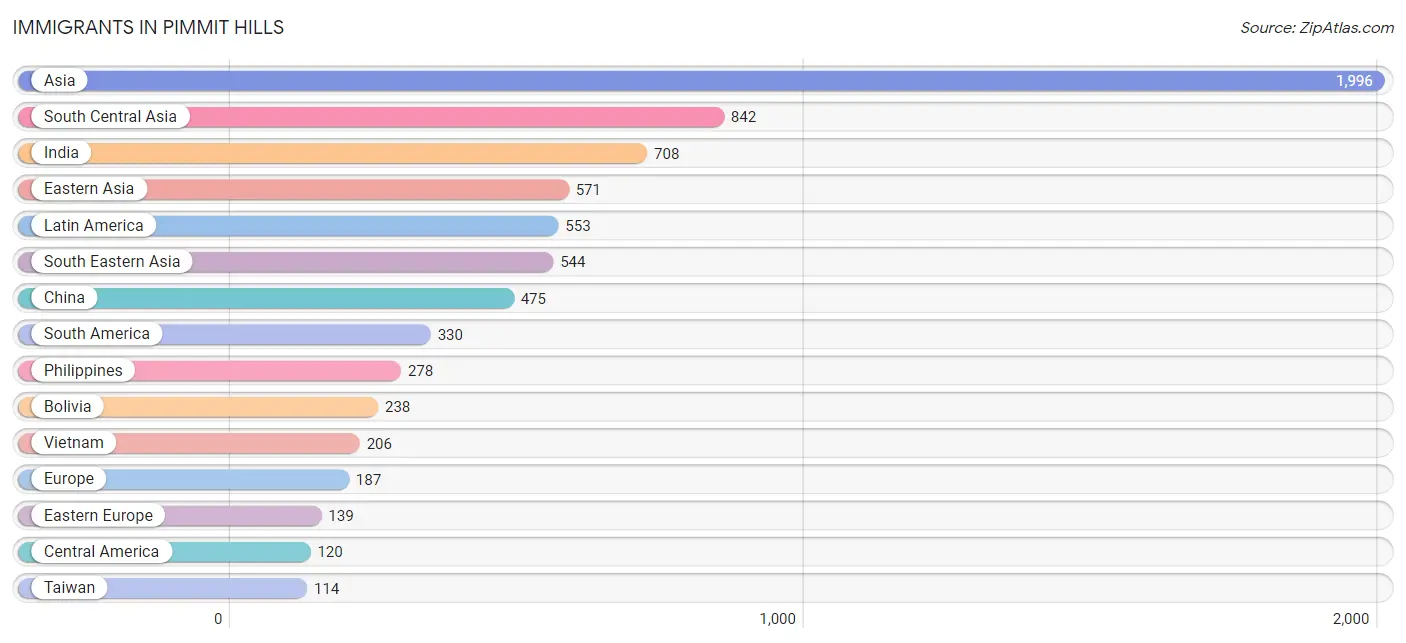
| Immigration Origin | # Population | % Population |
| Africa | 64 | 1.0% |
| Asia | 1,996 | 30.7% |
| Bangladesh | 61 | 0.9% |
| Bolivia | 238 | 3.7% |
| Canada | 13 | 0.2% |
| Caribbean | 103 | 1.6% |
| Central America | 120 | 1.8% |
| China | 475 | 7.3% |
| Denmark | 15 | 0.2% |
| Eastern Africa | 23 | 0.4% |
| Eastern Asia | 571 | 8.8% |
| Eastern Europe | 139 | 2.1% |
| Ecuador | 27 | 0.4% |
| El Salvador | 88 | 1.3% |
| Ethiopia | 23 | 0.4% |
| Europe | 187 | 2.9% |
| Germany | 33 | 0.5% |
| Guatemala | 24 | 0.4% |
| Haiti | 103 | 1.6% |
| India | 708 | 10.9% |
| Iran | 34 | 0.5% |
| Israel | 18 | 0.3% |
| Japan | 17 | 0.3% |
| Korea | 79 | 1.2% |
| Latin America | 553 | 8.5% |
| Lithuania | 5 | 0.1% |
| Mexico | 8 | 0.1% |
| North Macedonia | 17 | 0.3% |
| Northern Europe | 15 | 0.2% |
| Pakistan | 39 | 0.6% |
| Peru | 65 | 1.0% |
| Philippines | 278 | 4.3% |
| Poland | 31 | 0.5% |
| Russia | 10 | 0.2% |
| Sierra Leone | 41 | 0.6% |
| South America | 330 | 5.1% |
| South Central Asia | 842 | 13.0% |
| South Eastern Asia | 544 | 8.4% |
| Taiwan | 114 | 1.8% |
| Thailand | 60 | 0.9% |
| Ukraine | 57 | 0.9% |
| Vietnam | 206 | 3.2% |
| Western Africa | 41 | 0.6% |
| Western Asia | 18 | 0.3% |
| Western Europe | 33 | 0.5% | View All 45 Rows |
Sex and Age in Pimmit Hills
Sex and Age in Pimmit Hills
The most populous age groups in Pimmit Hills are 30 to 34 Years (492 | 16.1%) for men and 35 to 39 Years (376 | 10.9%) for women.
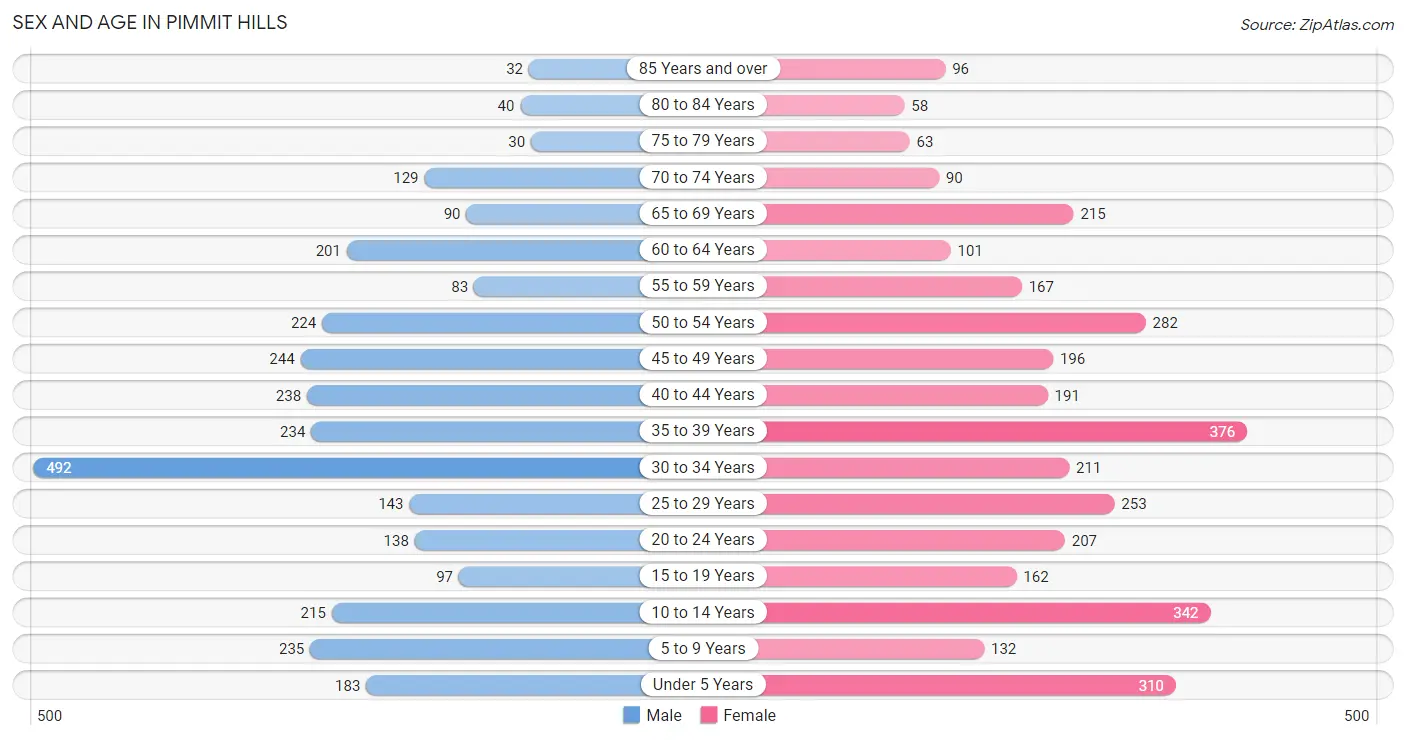
| Age Bracket | Male | Female |
| Under 5 Years | 183 (6.0%) | 310 (9.0%) |
| 5 to 9 Years | 235 (7.7%) | 132 (3.8%) |
| 10 to 14 Years | 215 (7.0%) | 342 (9.9%) |
| 15 to 19 Years | 97 (3.2%) | 162 (4.7%) |
| 20 to 24 Years | 138 (4.5%) | 207 (6.0%) |
| 25 to 29 Years | 143 (4.7%) | 253 (7.3%) |
| 30 to 34 Years | 492 (16.1%) | 211 (6.1%) |
| 35 to 39 Years | 234 (7.7%) | 376 (10.9%) |
| 40 to 44 Years | 238 (7.8%) | 191 (5.5%) |
| 45 to 49 Years | 244 (8.0%) | 196 (5.7%) |
| 50 to 54 Years | 224 (7.3%) | 282 (8.2%) |
| 55 to 59 Years | 83 (2.7%) | 167 (4.8%) |
| 60 to 64 Years | 201 (6.6%) | 101 (2.9%) |
| 65 to 69 Years | 90 (2.9%) | 215 (6.2%) |
| 70 to 74 Years | 129 (4.2%) | 90 (2.6%) |
| 75 to 79 Years | 30 (1.0%) | 63 (1.8%) |
| 80 to 84 Years | 40 (1.3%) | 58 (1.7%) |
| 85 Years and over | 32 (1.1%) | 96 (2.8%) |
| Total | 3,048 (100.0%) | 3,452 (100.0%) |
Families and Households in Pimmit Hills
Median Family Size in Pimmit Hills
The median family size in Pimmit Hills is 3.48 persons per family, with married-couple families (1,092 | 72.5%) accounting for the largest median family size of 3.77 persons per family. On the other hand, single female/mother families (169 | 11.2%) represent the smallest median family size with 2.35 persons per family.
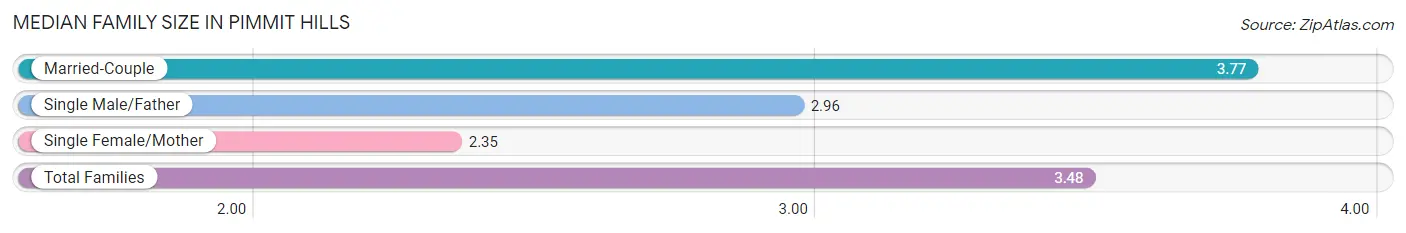
| Family Type | # Families | Family Size |
| Married-Couple | 1,092 (72.5%) | 3.77 |
| Single Male/Father | 245 (16.3%) | 2.96 |
| Single Female/Mother | 169 (11.2%) | 2.35 |
| Total Families | 1,506 (100.0%) | 3.48 |
Median Household Size in Pimmit Hills
The median household size in Pimmit Hills is 2.93 persons per household, with married-couple households (1,092 | 49.2%) accounting for the largest median household size of 3.84 persons per household. non-family households (713 | 32.1%) represent the smallest median household size with 1.53 persons per household.
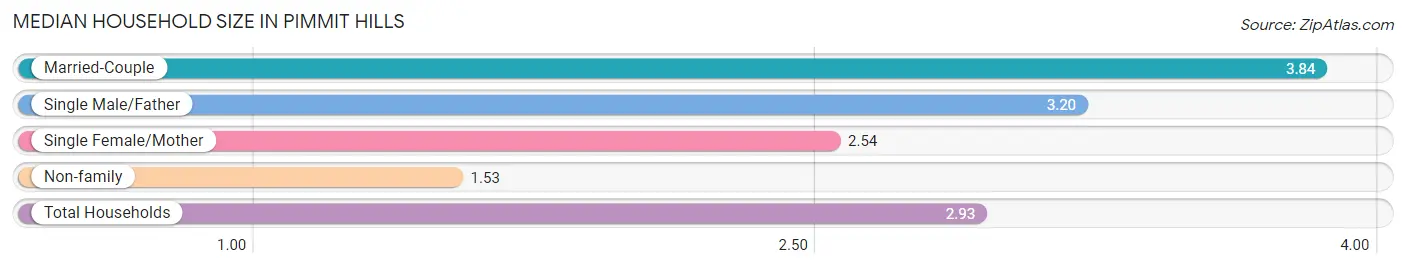
| Household Type | # Households | Household Size |
| Married-Couple | 1,092 (49.2%) | 3.84 |
| Single Male/Father | 245 (11.0%) | 3.20 |
| Single Female/Mother | 169 (7.6%) | 2.54 |
| Non-family | 713 (32.1%) | 1.53 |
| Total Households | 2,219 (100.0%) | 2.93 |
Household Size by Marriage Status in Pimmit Hills
Out of a total of 2,219 households in Pimmit Hills, 1,506 (67.9%) are family households, while 713 (32.1%) are nonfamily households. The most numerous type of family households are 2-person households, comprising 512, and the most common type of nonfamily households are 1-person households, comprising 410.
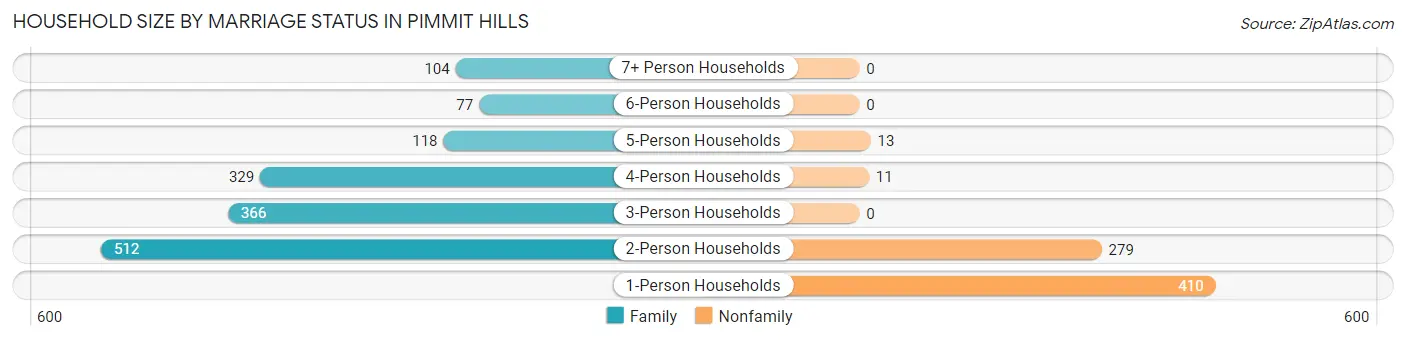
| Household Size | Family Households | Nonfamily Households |
| 1-Person Households | - | 410 (18.5%) |
| 2-Person Households | 512 (23.1%) | 279 (12.6%) |
| 3-Person Households | 366 (16.5%) | 0 (0.0%) |
| 4-Person Households | 329 (14.8%) | 11 (0.5%) |
| 5-Person Households | 118 (5.3%) | 13 (0.6%) |
| 6-Person Households | 77 (3.5%) | 0 (0.0%) |
| 7+ Person Households | 104 (4.7%) | 0 (0.0%) |
| Total | 1,506 (67.9%) | 713 (32.1%) |
Female Fertility in Pimmit Hills
Fertility by Age in Pimmit Hills
Average fertility rate in Pimmit Hills is 20.0 births per 1,000 women. Women in the age bracket of 20 to 34 years have the highest fertility rate with 30.0 births per 1,000 women. Women in the age bracket of 20 to 34 years acount for 58.8% of all women with births.
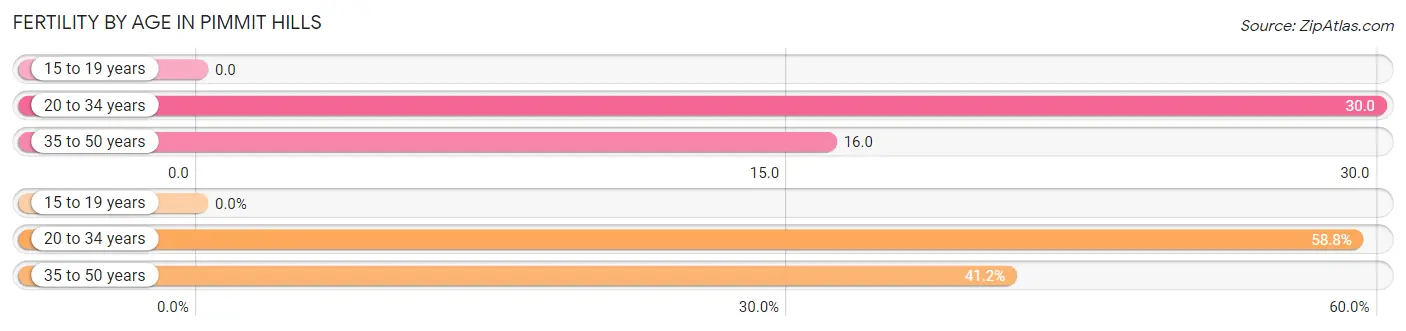
| Age Bracket | Women with Births | Births / 1,000 Women |
| 15 to 19 years | 0 (0.0%) | 0.0 |
| 20 to 34 years | 20 (58.8%) | 30.0 |
| 35 to 50 years | 14 (41.2%) | 16.0 |
| Total | 34 (100.0%) | 20.0 |
Fertility by Age by Marriage Status in Pimmit Hills
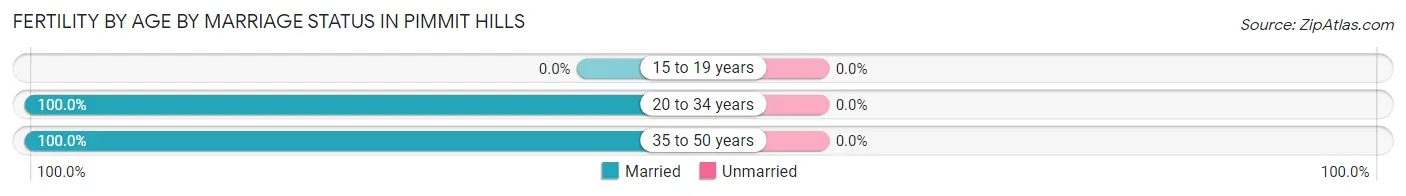
| Age Bracket | Married | Unmarried |
| 15 to 19 years | 0 (0.0%) | 0 (0.0%) |
| 20 to 34 years | 20 (100.0%) | 0 (0.0%) |
| 35 to 50 years | 14 (100.0%) | 0 (0.0%) |
| Total | 34 (100.0%) | 0 (0.0%) |
Fertility by Education in Pimmit Hills
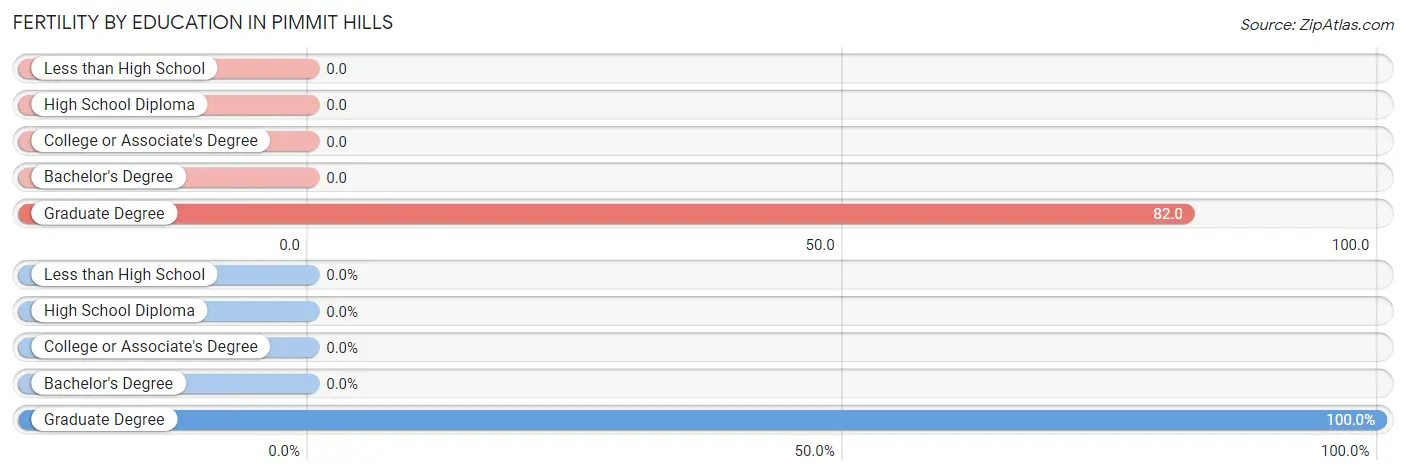
| Educational Attainment | Women with Births | Births / 1,000 Women |
| Less than High School | 0 (0.0%) | 0.0 |
| High School Diploma | 0 (0.0%) | 0.0 |
| College or Associate's Degree | 0 (0.0%) | 0.0 |
| Bachelor's Degree | 0 (0.0%) | 0.0 |
| Graduate Degree | 34 (100.0%) | 82.0 |
| Total | 34 (100.0%) | 20.0 |
Fertility by Education by Marriage Status in Pimmit Hills
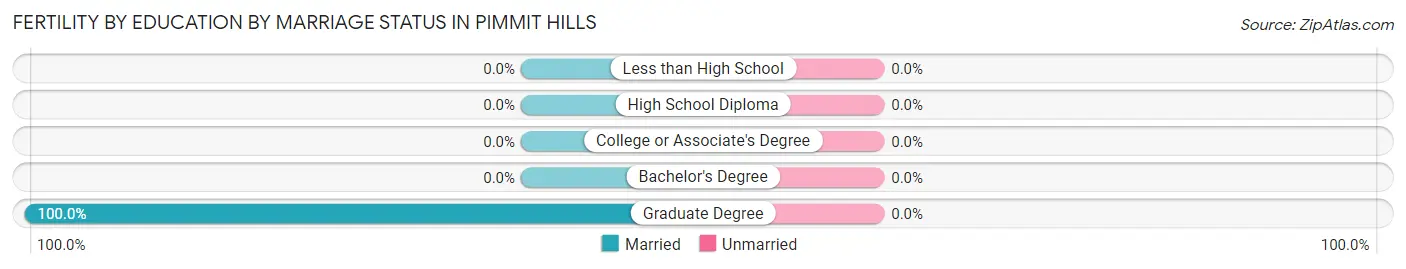
| Educational Attainment | Married | Unmarried |
| Less than High School | 0 (0.0%) | 0 (0.0%) |
| High School Diploma | 0 (0.0%) | 0 (0.0%) |
| College or Associate's Degree | 0 (0.0%) | 0 (0.0%) |
| Bachelor's Degree | 0 (0.0%) | 0 (0.0%) |
| Graduate Degree | 34 (100.0%) | 0 (0.0%) |
| Total | 34 (100.0%) | 0 (0.0%) |
Employment Characteristics in Pimmit Hills
Employment by Class of Employer in Pimmit Hills
Among the 3,386 employed individuals in Pimmit Hills, private company employees (2,142 | 63.3%), not-for-profit organizations (412 | 12.2%), and federal government employees (408 | 12.0%) make up the most common classes of employment.
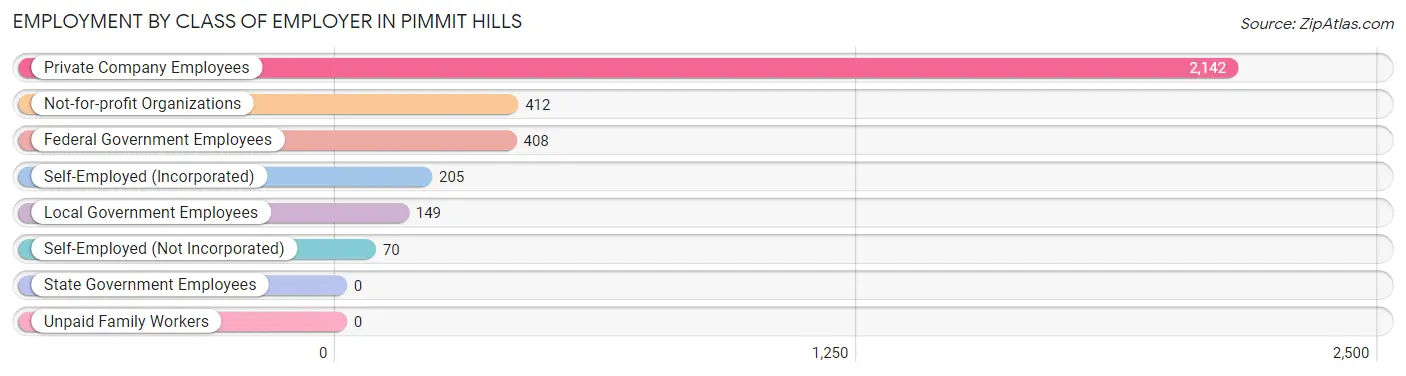
| Employer Class | # Employees | % Employees |
| Private Company Employees | 2,142 | 63.3% |
| Self-Employed (Incorporated) | 205 | 6.0% |
| Self-Employed (Not Incorporated) | 70 | 2.1% |
| Not-for-profit Organizations | 412 | 12.2% |
| Local Government Employees | 149 | 4.4% |
| State Government Employees | 0 | 0.0% |
| Federal Government Employees | 408 | 12.0% |
| Unpaid Family Workers | 0 | 0.0% |
| Total | 3,386 | 100.0% |
Employment Status by Age in Pimmit Hills
According to the labor force statistics for Pimmit Hills, out of the total population over 16 years of age (5,022), 71.0% or 3,566 individuals are in the labor force, with 3.3% or 118 of them unemployed. The age group with the highest labor force participation rate is 20 to 24 years, with 100.0% or 345 individuals in the labor force. Within the labor force, the 60 to 64 years age range has the highest percentage of unemployed individuals, with 13.7% or 31 of them being unemployed.
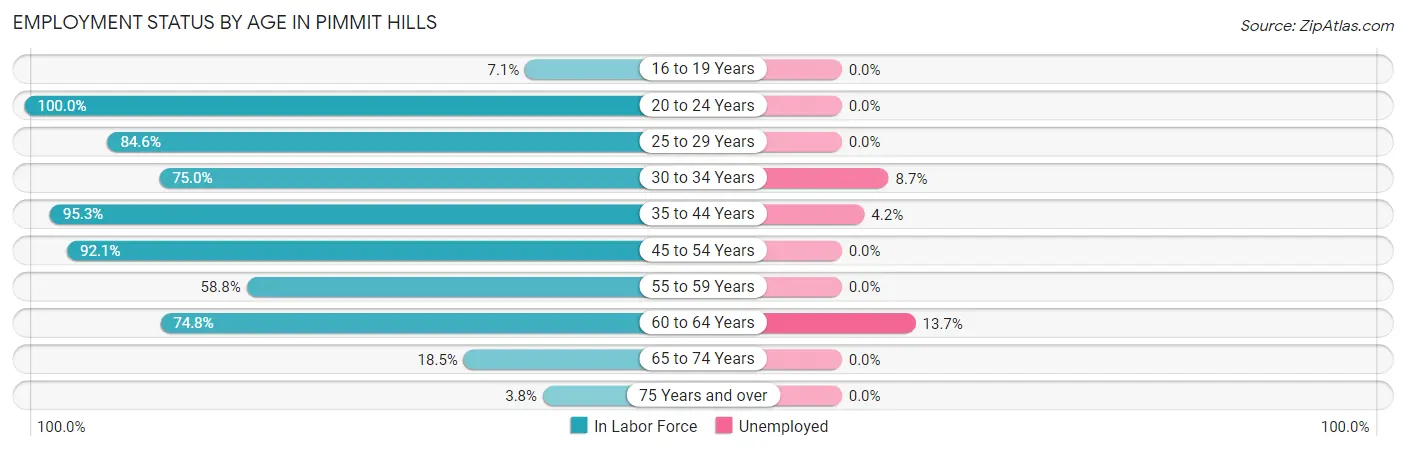
| Age Bracket | In Labor Force | Unemployed |
| 16 to 19 Years | 14 (7.1%) | 0 (0.0%) |
| 20 to 24 Years | 345 (100.0%) | 0 (0.0%) |
| 25 to 29 Years | 335 (84.6%) | 0 (0.0%) |
| 30 to 34 Years | 527 (75.0%) | 46 (8.7%) |
| 35 to 44 Years | 990 (95.3%) | 42 (4.2%) |
| 45 to 54 Years | 871 (92.1%) | 0 (0.0%) |
| 55 to 59 Years | 147 (58.8%) | 0 (0.0%) |
| 60 to 64 Years | 226 (74.8%) | 31 (13.7%) |
| 65 to 74 Years | 97 (18.5%) | 0 (0.0%) |
| 75 Years and over | 12 (3.8%) | 0 (0.0%) |
| Total | 3,566 (71.0%) | 118 (3.3%) |
Employment Status by Educational Attainment in Pimmit Hills
According to labor force statistics for Pimmit Hills, 85.1% of individuals (3,094) out of the total population between 25 and 64 years of age (3,636) are in the labor force, with 3.8% or 118 of them being unemployed. The group with the highest labor force participation rate are those with the educational attainment of bachelor's degree or higher, with 87.7% or 2,471 individuals in the labor force. Within the labor force, individuals with college / associate degree education have the highest percentage of unemployment, with 4.9% or 13 of them being unemployed.
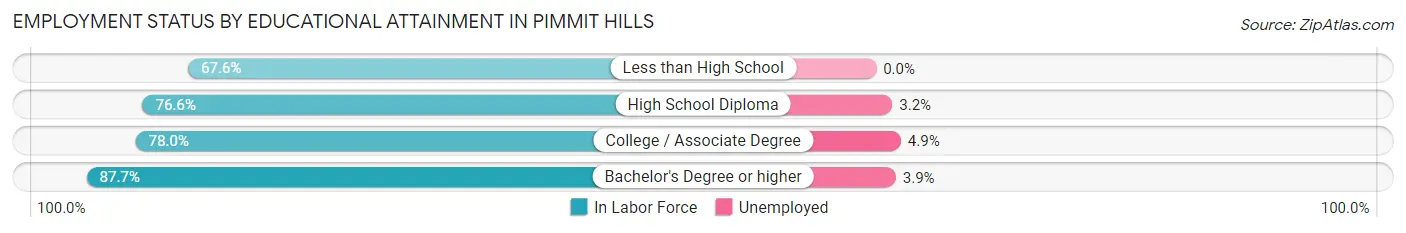
| Educational Attainment | In Labor Force | Unemployed |
| Less than High School | 46 (67.6%) | 0 (0.0%) |
| High School Diploma | 314 (76.6%) | 13 (3.2%) |
| College / Associate Degree | 266 (78.0%) | 17 (4.9%) |
| Bachelor's Degree or higher | 2,471 (87.7%) | 110 (3.9%) |
| Total | 3,094 (85.1%) | 138 (3.8%) |
Employment Occupations by Sex in Pimmit Hills
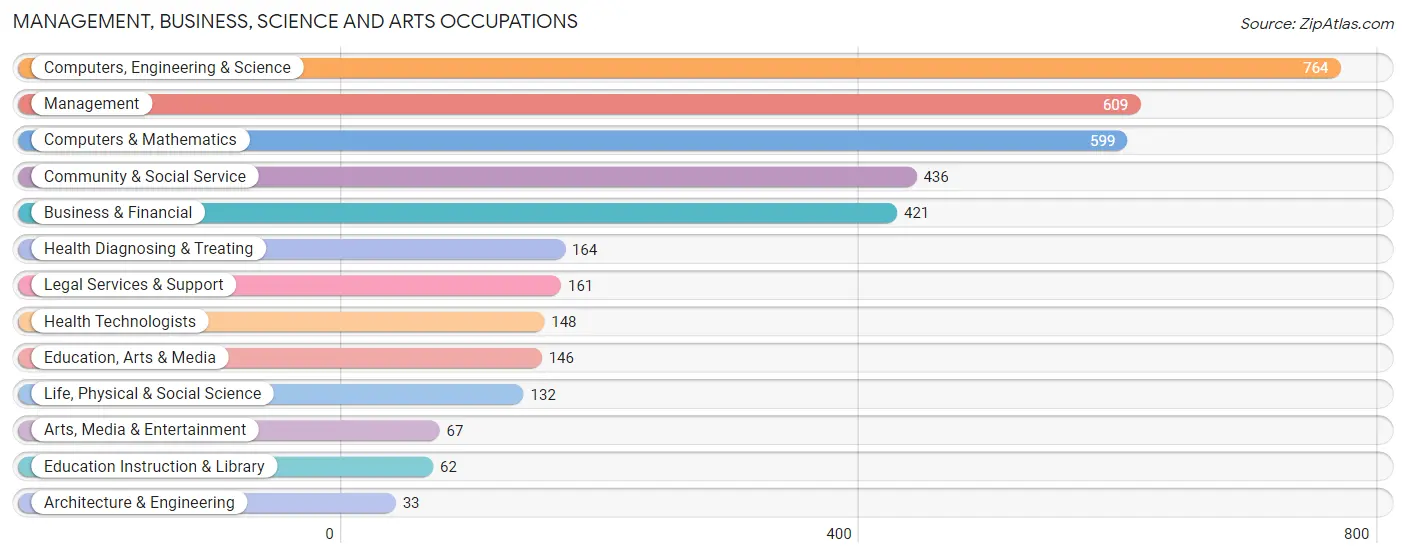
Management, Business, Science and Arts Occupations
The most common Management, Business, Science and Arts occupations in Pimmit Hills are Computers, Engineering & Science (764 | 22.2%), Management (609 | 17.7%), Computers & Mathematics (599 | 17.4%), Community & Social Service (436 | 12.7%), and Business & Financial (421 | 12.2%).
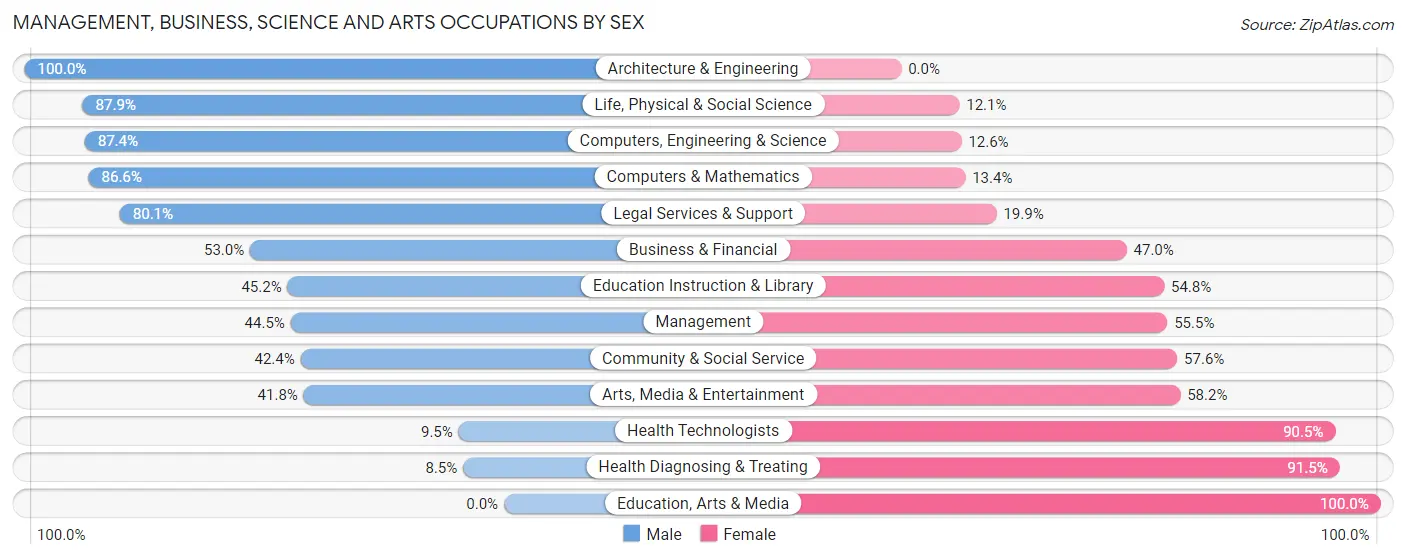
Management, Business, Science and Arts Occupations by Sex
Within the Management, Business, Science and Arts occupations in Pimmit Hills, the most male-oriented occupations are Architecture & Engineering (100.0%), Life, Physical & Social Science (87.9%), and Computers, Engineering & Science (87.4%), while the most female-oriented occupations are Education, Arts & Media (100.0%), Health Diagnosing & Treating (91.5%), and Health Technologists (90.5%).
| Occupation | Male | Female |
| Management | 271 (44.5%) | 338 (55.5%) |
| Business & Financial | 223 (53.0%) | 198 (47.0%) |
| Computers, Engineering & Science | 668 (87.4%) | 96 (12.6%) |
| Computers & Mathematics | 519 (86.6%) | 80 (13.4%) |
| Architecture & Engineering | 33 (100.0%) | 0 (0.0%) |
| Life, Physical & Social Science | 116 (87.9%) | 16 (12.1%) |
| Community & Social Service | 185 (42.4%) | 251 (57.6%) |
| Education, Arts & Media | 0 (0.0%) | 146 (100.0%) |
| Legal Services & Support | 129 (80.1%) | 32 (19.9%) |
| Education Instruction & Library | 28 (45.2%) | 34 (54.8%) |
| Arts, Media & Entertainment | 28 (41.8%) | 39 (58.2%) |
| Health Diagnosing & Treating | 14 (8.5%) | 150 (91.5%) |
| Health Technologists | 14 (9.5%) | 134 (90.5%) |
| Total (Category) | 1,361 (56.9%) | 1,033 (43.1%) |
| Total (Overall) | 1,762 (51.1%) | 1,683 (48.8%) |
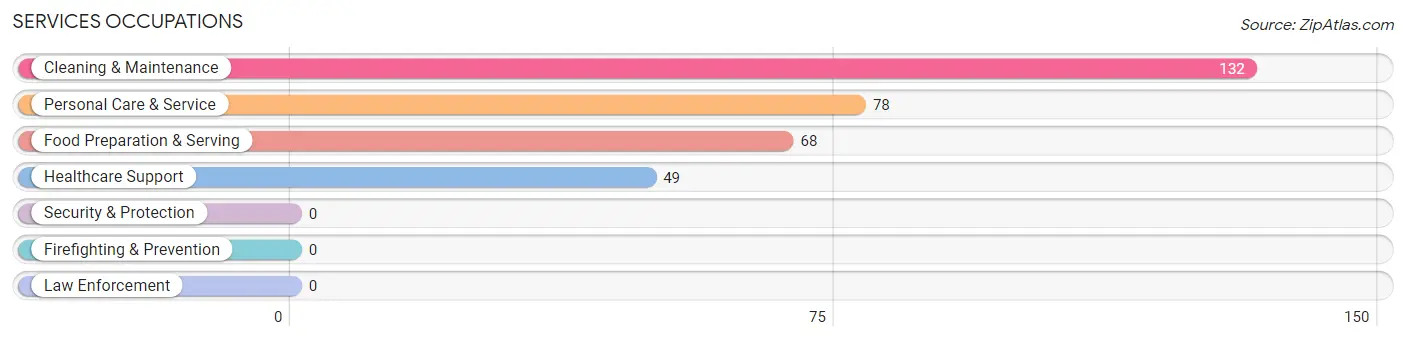
Services Occupations
The most common Services occupations in Pimmit Hills are Cleaning & Maintenance (132 | 3.8%), Personal Care & Service (78 | 2.3%), Food Preparation & Serving (68 | 2.0%), and Healthcare Support (49 | 1.4%).
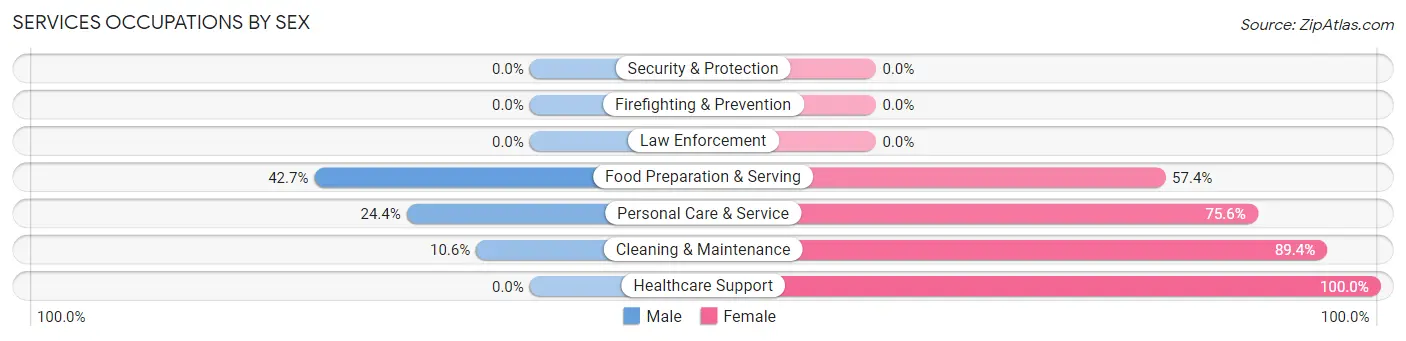
Services Occupations by Sex
Within the Services occupations in Pimmit Hills, the most male-oriented occupations are Food Preparation & Serving (42.6%), Personal Care & Service (24.4%), and Cleaning & Maintenance (10.6%), while the most female-oriented occupations are Healthcare Support (100.0%), Cleaning & Maintenance (89.4%), and Personal Care & Service (75.6%).
| Occupation | Male | Female |
| Healthcare Support | 0 (0.0%) | 49 (100.0%) |
| Security & Protection | 0 (0.0%) | 0 (0.0%) |
| Firefighting & Prevention | 0 (0.0%) | 0 (0.0%) |
| Law Enforcement | 0 (0.0%) | 0 (0.0%) |
| Food Preparation & Serving | 29 (42.6%) | 39 (57.4%) |
| Cleaning & Maintenance | 14 (10.6%) | 118 (89.4%) |
| Personal Care & Service | 19 (24.4%) | 59 (75.6%) |
| Total (Category) | 62 (19.0%) | 265 (81.0%) |
| Total (Overall) | 1,762 (51.1%) | 1,683 (48.8%) |
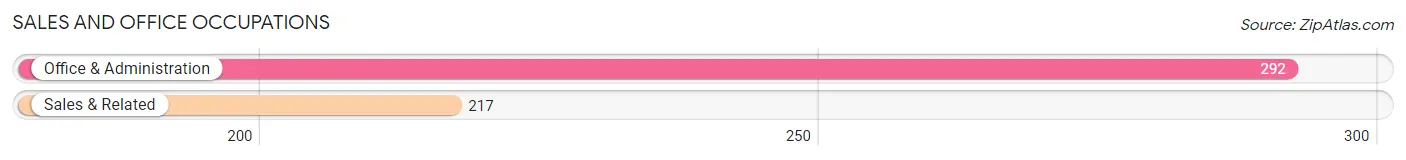
Sales and Office Occupations
The most common Sales and Office occupations in Pimmit Hills are Office & Administration (292 | 8.5%), and Sales & Related (217 | 6.3%).
Sales and Office Occupations by Sex
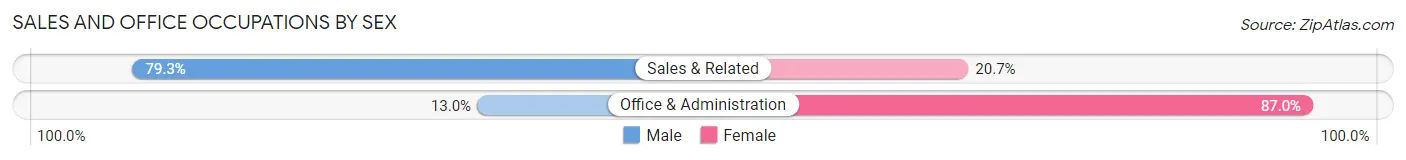
| Occupation | Male | Female |
| Sales & Related | 172 (79.3%) | 45 (20.7%) |
| Office & Administration | 38 (13.0%) | 254 (87.0%) |
| Total (Category) | 210 (41.3%) | 299 (58.7%) |
| Total (Overall) | 1,762 (51.1%) | 1,683 (48.8%) |
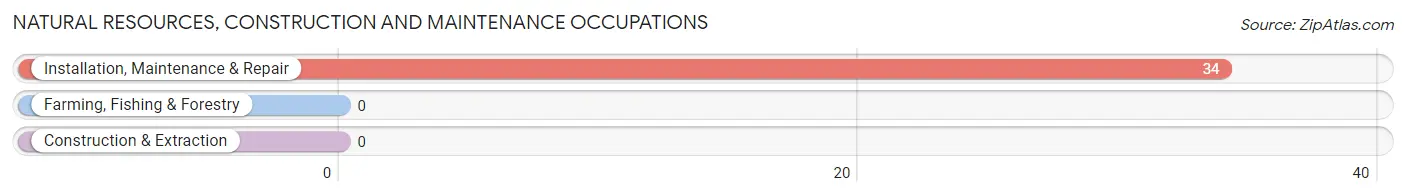
Natural Resources, Construction and Maintenance Occupations
The most common Natural Resources, Construction and Maintenance occupations in Pimmit Hills are , and Installation, Maintenance & Repair (34 | 1.0%).
Natural Resources, Construction and Maintenance Occupations by Sex
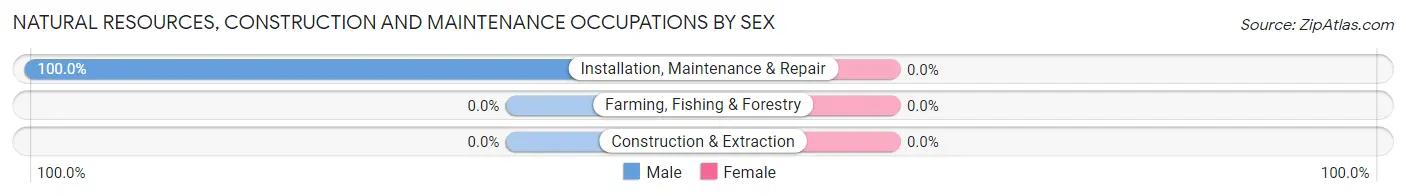
| Occupation | Male | Female |
| Farming, Fishing & Forestry | 0 (0.0%) | 0 (0.0%) |
| Construction & Extraction | 0 (0.0%) | 0 (0.0%) |
| Installation, Maintenance & Repair | 34 (100.0%) | 0 (0.0%) |
| Total (Category) | 34 (100.0%) | 0 (0.0%) |
| Total (Overall) | 1,762 (51.1%) | 1,683 (48.8%) |
Production, Transportation and Moving Occupations
The most common Production, Transportation and Moving occupations in Pimmit Hills are Transportation (93 | 2.7%), and Production (88 | 2.5%).
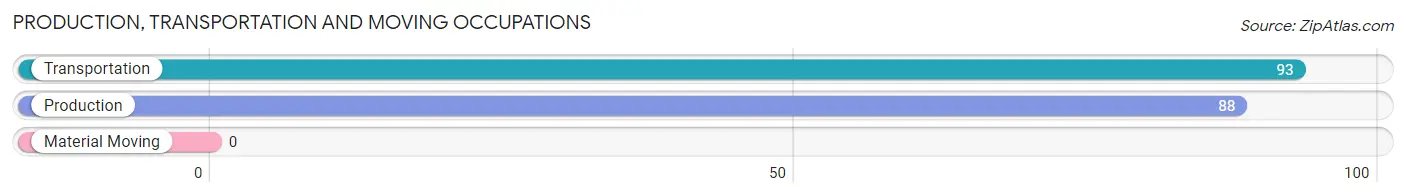
Production, Transportation and Moving Occupations by Sex
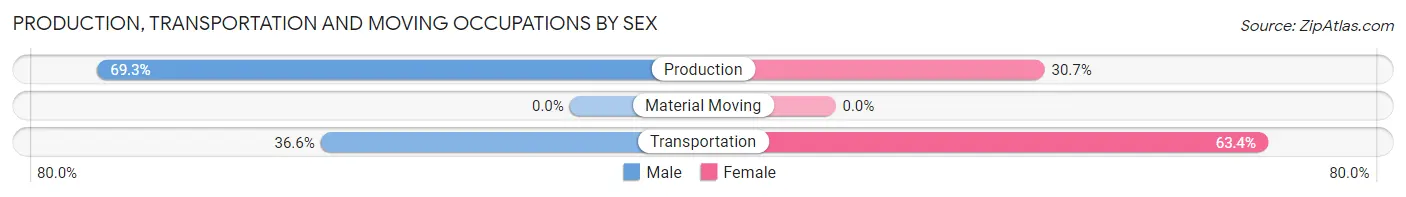
| Occupation | Male | Female |
| Production | 61 (69.3%) | 27 (30.7%) |
| Transportation | 34 (36.6%) | 59 (63.4%) |
| Material Moving | 0 (0.0%) | 0 (0.0%) |
| Total (Category) | 95 (52.5%) | 86 (47.5%) |
| Total (Overall) | 1,762 (51.1%) | 1,683 (48.8%) |
Employment Industries by Sex in Pimmit Hills
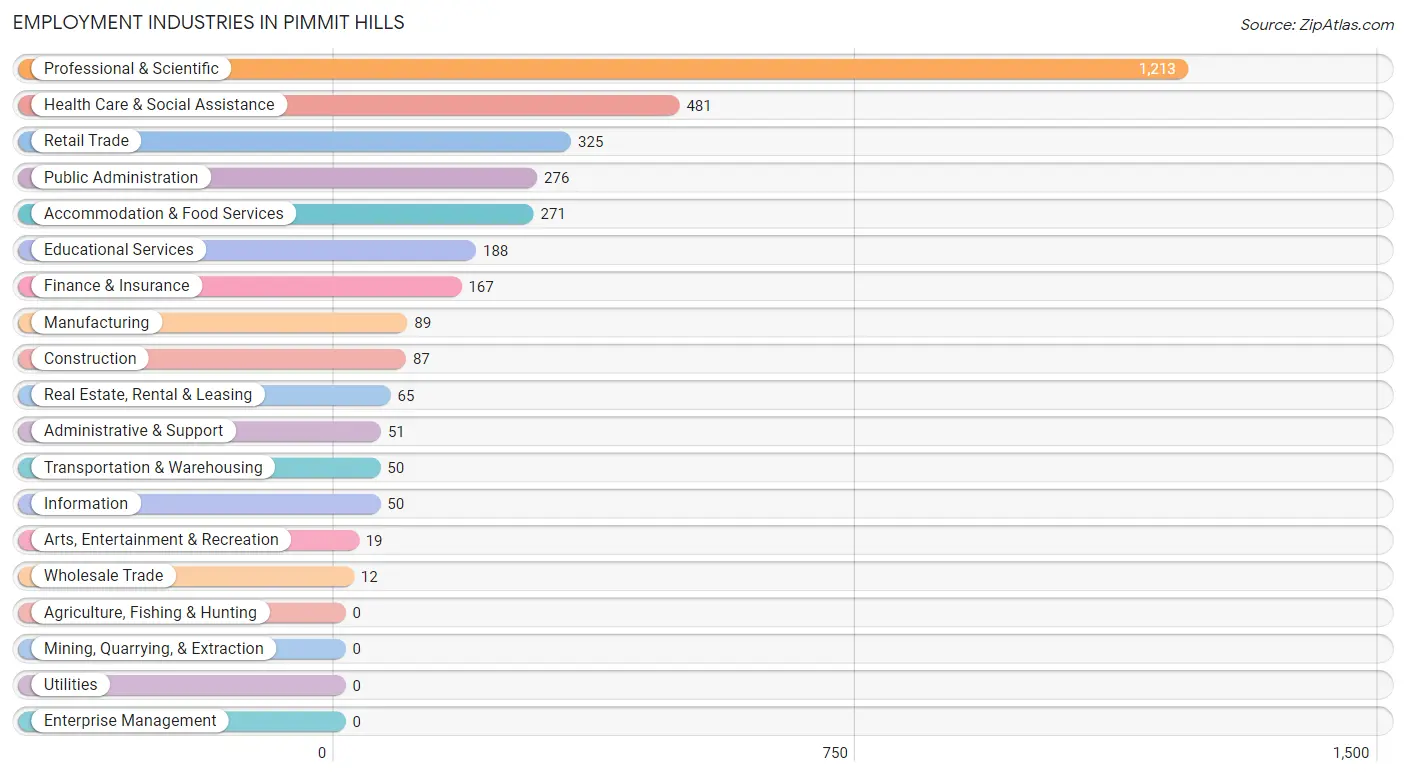
Employment Industries in Pimmit Hills
The major employment industries in Pimmit Hills include Professional & Scientific (1,213 | 35.2%), Health Care & Social Assistance (481 | 14.0%), Retail Trade (325 | 9.4%), Public Administration (276 | 8.0%), and Accommodation & Food Services (271 | 7.9%).
Employment Industries by Sex in Pimmit Hills
The Pimmit Hills industries that see more men than women are Wholesale Trade (100.0%), Arts, Entertainment & Recreation (100.0%), and Construction (75.9%), whereas the industries that tend to have a higher number of women are Real Estate, Rental & Leasing (100.0%), Health Care & Social Assistance (97.1%), and Accommodation & Food Services (60.2%).
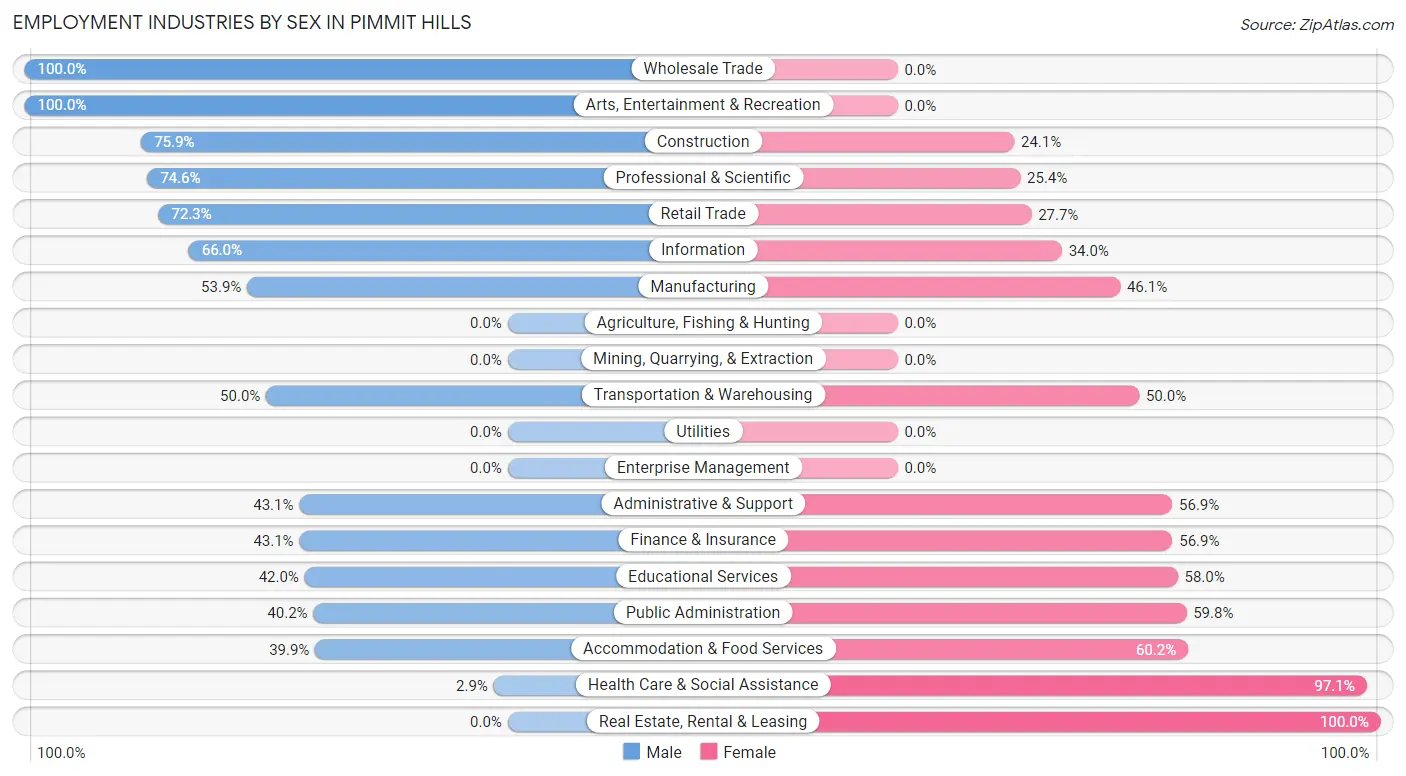
| Industry | Male | Female |
| Agriculture, Fishing & Hunting | 0 (0.0%) | 0 (0.0%) |
| Mining, Quarrying, & Extraction | 0 (0.0%) | 0 (0.0%) |
| Construction | 66 (75.9%) | 21 (24.1%) |
| Manufacturing | 48 (53.9%) | 41 (46.1%) |
| Wholesale Trade | 12 (100.0%) | 0 (0.0%) |
| Retail Trade | 235 (72.3%) | 90 (27.7%) |
| Transportation & Warehousing | 25 (50.0%) | 25 (50.0%) |
| Utilities | 0 (0.0%) | 0 (0.0%) |
| Information | 33 (66.0%) | 17 (34.0%) |
| Finance & Insurance | 72 (43.1%) | 95 (56.9%) |
| Real Estate, Rental & Leasing | 0 (0.0%) | 65 (100.0%) |
| Professional & Scientific | 905 (74.6%) | 308 (25.4%) |
| Enterprise Management | 0 (0.0%) | 0 (0.0%) |
| Administrative & Support | 22 (43.1%) | 29 (56.9%) |
| Educational Services | 79 (42.0%) | 109 (58.0%) |
| Health Care & Social Assistance | 14 (2.9%) | 467 (97.1%) |
| Arts, Entertainment & Recreation | 19 (100.0%) | 0 (0.0%) |
| Accommodation & Food Services | 108 (39.9%) | 163 (60.2%) |
| Public Administration | 111 (40.2%) | 165 (59.8%) |
| Total | 1,762 (51.1%) | 1,683 (48.8%) |
Education in Pimmit Hills
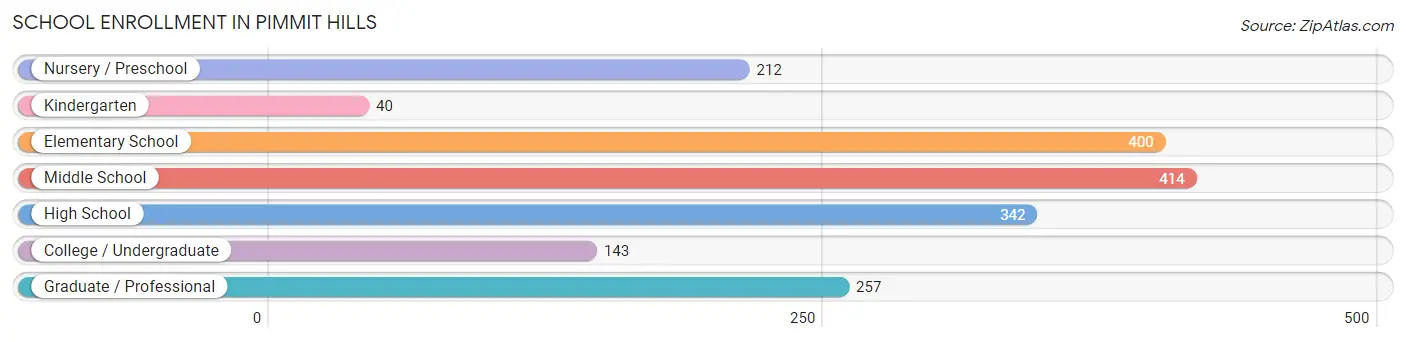
School Enrollment in Pimmit Hills
The most common levels of schooling among the 1,808 students in Pimmit Hills are middle school (414 | 22.9%), elementary school (400 | 22.1%), and high school (342 | 18.9%).
| School Level | # Students | % Students |
| Nursery / Preschool | 212 | 11.7% |
| Kindergarten | 40 | 2.2% |
| Elementary School | 400 | 22.1% |
| Middle School | 414 | 22.9% |
| High School | 342 | 18.9% |
| College / Undergraduate | 143 | 7.9% |
| Graduate / Professional | 257 | 14.2% |
| Total | 1,808 | 100.0% |
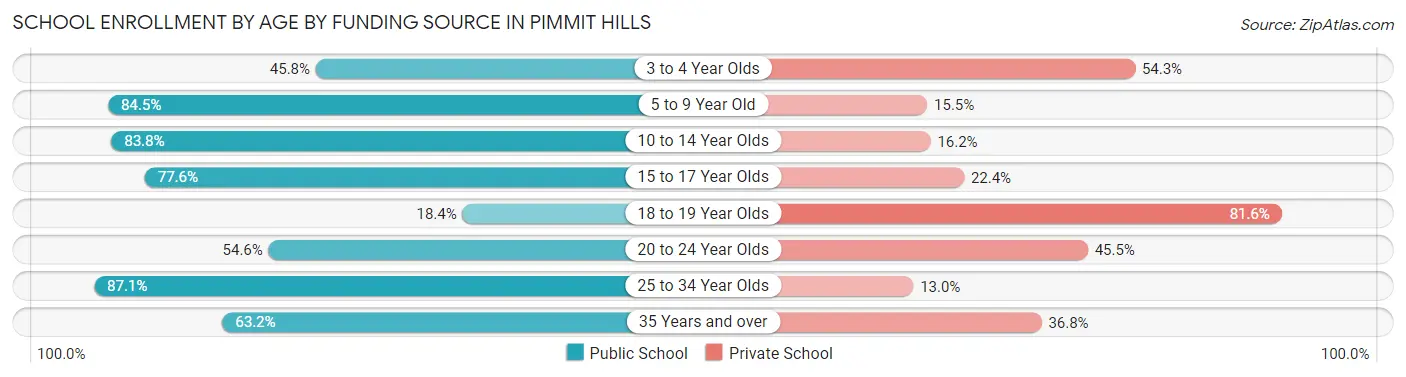
School Enrollment by Age by Funding Source in Pimmit Hills
Out of a total of 1,808 students who are enrolled in schools in Pimmit Hills, 474 (26.2%) attend a private institution, while the remaining 1,334 (73.8%) are enrolled in public schools. The age group of 18 to 19 year olds has the highest likelihood of being enrolled in private schools, with 62 (81.6% in the age bracket) enrolled. Conversely, the age group of 25 to 34 year olds has the lowest likelihood of being enrolled in a private school, with 195 (87.1% in the age bracket) attending a public institution.
| Age Bracket | Public School | Private School |
| 3 to 4 Year Olds | 97 (45.8%) | 115 (54.2%) |
| 5 to 9 Year Old | 299 (84.5%) | 55 (15.5%) |
| 10 to 14 Year Olds | 467 (83.8%) | 90 (16.2%) |
| 15 to 17 Year Olds | 142 (77.6%) | 41 (22.4%) |
| 18 to 19 Year Olds | 14 (18.4%) | 62 (81.6%) |
| 20 to 24 Year Olds | 48 (54.5%) | 40 (45.5%) |
| 25 to 34 Year Olds | 195 (87.1%) | 29 (13.0%) |
| 35 Years and over | 72 (63.2%) | 42 (36.8%) |
| Total | 1,334 (73.8%) | 474 (26.2%) |
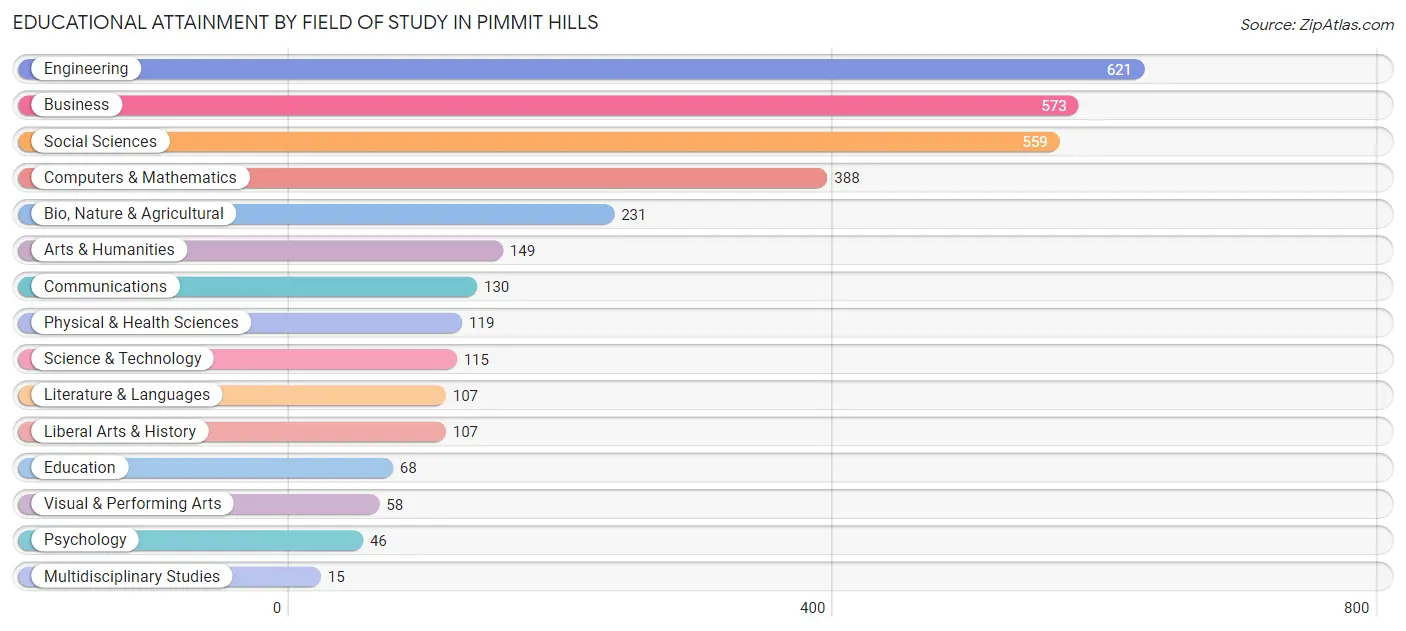
Educational Attainment by Field of Study in Pimmit Hills
Engineering (621 | 18.9%), business (573 | 17.4%), social sciences (559 | 17.0%), computers & mathematics (388 | 11.8%), and bio, nature & agricultural (231 | 7.0%) are the most common fields of study among 3,286 individuals in Pimmit Hills who have obtained a bachelor's degree or higher.
| Field of Study | # Graduates | % Graduates |
| Computers & Mathematics | 388 | 11.8% |
| Bio, Nature & Agricultural | 231 | 7.0% |
| Physical & Health Sciences | 119 | 3.6% |
| Psychology | 46 | 1.4% |
| Social Sciences | 559 | 17.0% |
| Engineering | 621 | 18.9% |
| Multidisciplinary Studies | 15 | 0.5% |
| Science & Technology | 115 | 3.5% |
| Business | 573 | 17.4% |
| Education | 68 | 2.1% |
| Literature & Languages | 107 | 3.3% |
| Liberal Arts & History | 107 | 3.3% |
| Visual & Performing Arts | 58 | 1.8% |
| Communications | 130 | 4.0% |
| Arts & Humanities | 149 | 4.5% |
| Total | 3,286 | 100.0% |
Transportation & Commute in Pimmit Hills
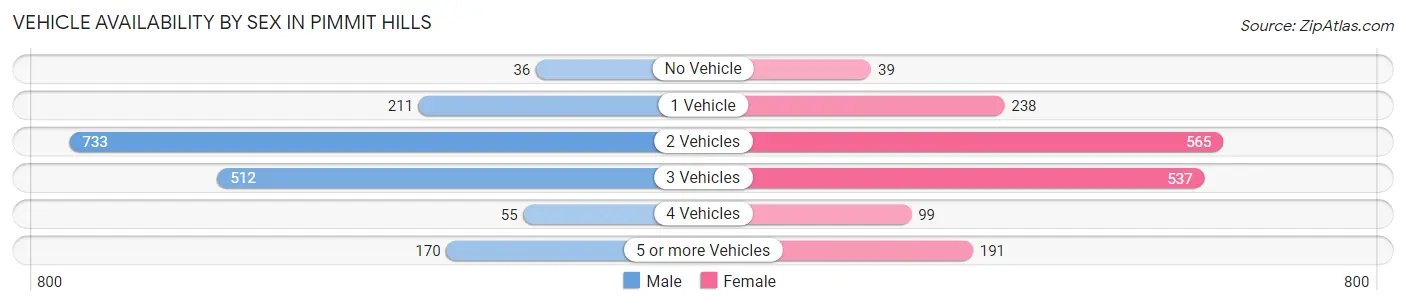
Vehicle Availability by Sex in Pimmit Hills
The most prevalent vehicle ownership categories in Pimmit Hills are males with 2 vehicles (733, accounting for 42.7%) and females with 2 vehicles (565, making up 43.9%).
| Vehicles Available | Male | Female |
| No Vehicle | 36 (2.1%) | 39 (2.3%) |
| 1 Vehicle | 211 (12.3%) | 238 (14.3%) |
| 2 Vehicles | 733 (42.7%) | 565 (33.9%) |
| 3 Vehicles | 512 (29.8%) | 537 (32.2%) |
| 4 Vehicles | 55 (3.2%) | 99 (5.9%) |
| 5 or more Vehicles | 170 (9.9%) | 191 (11.4%) |
| Total | 1,717 (100.0%) | 1,669 (100.0%) |
Commute Time in Pimmit Hills
The most frequently occuring commute durations in Pimmit Hills are 20 to 24 minutes (632 commuters, 25.8%), 30 to 34 minutes (436 commuters, 17.8%), and 45 to 59 minutes (267 commuters, 10.9%).
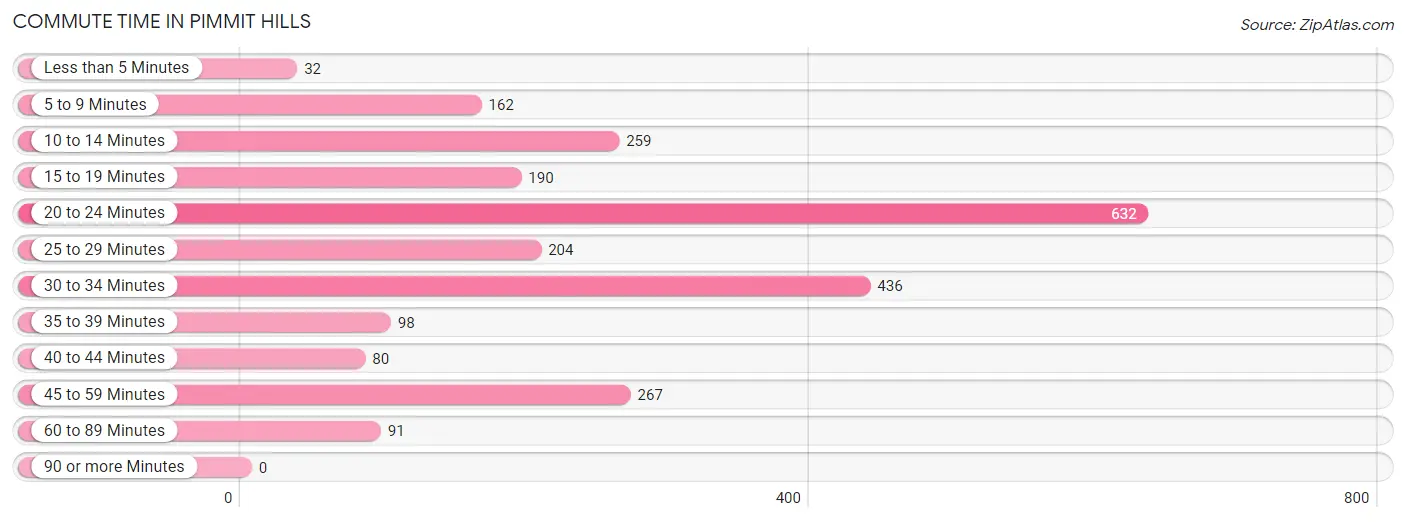
| Commute Time | # Commuters | % Commuters |
| Less than 5 Minutes | 32 | 1.3% |
| 5 to 9 Minutes | 162 | 6.6% |
| 10 to 14 Minutes | 259 | 10.6% |
| 15 to 19 Minutes | 190 | 7.7% |
| 20 to 24 Minutes | 632 | 25.8% |
| 25 to 29 Minutes | 204 | 8.3% |
| 30 to 34 Minutes | 436 | 17.8% |
| 35 to 39 Minutes | 98 | 4.0% |
| 40 to 44 Minutes | 80 | 3.3% |
| 45 to 59 Minutes | 267 | 10.9% |
| 60 to 89 Minutes | 91 | 3.7% |
| 90 or more Minutes | 0 | 0.0% |
Commute Time by Sex in Pimmit Hills
The most common commute times in Pimmit Hills are 30 to 34 minutes (254 commuters, 20.9%) for males and 20 to 24 minutes (417 commuters, 33.7%) for females.
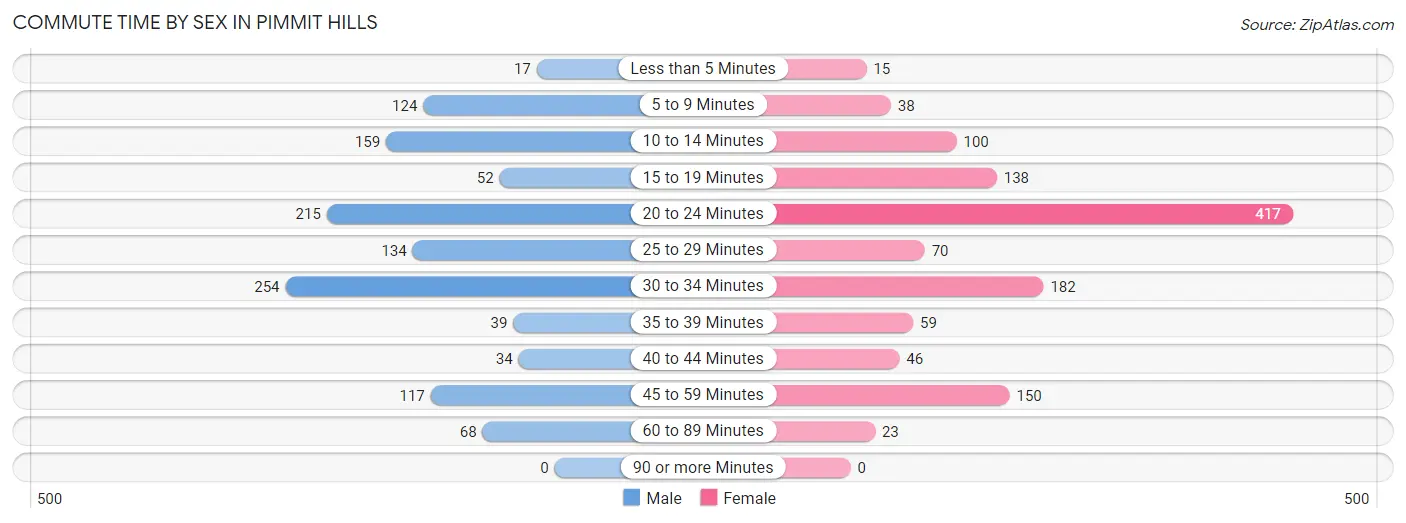
| Commute Time | Male | Female |
| Less than 5 Minutes | 17 (1.4%) | 15 (1.2%) |
| 5 to 9 Minutes | 124 (10.2%) | 38 (3.1%) |
| 10 to 14 Minutes | 159 (13.1%) | 100 (8.1%) |
| 15 to 19 Minutes | 52 (4.3%) | 138 (11.2%) |
| 20 to 24 Minutes | 215 (17.7%) | 417 (33.7%) |
| 25 to 29 Minutes | 134 (11.1%) | 70 (5.7%) |
| 30 to 34 Minutes | 254 (20.9%) | 182 (14.7%) |
| 35 to 39 Minutes | 39 (3.2%) | 59 (4.8%) |
| 40 to 44 Minutes | 34 (2.8%) | 46 (3.7%) |
| 45 to 59 Minutes | 117 (9.7%) | 150 (12.1%) |
| 60 to 89 Minutes | 68 (5.6%) | 23 (1.9%) |
| 90 or more Minutes | 0 (0.0%) | 0 (0.0%) |
Time of Departure to Work by Sex in Pimmit Hills
The most frequent times of departure to work in Pimmit Hills are 7:00 AM to 7:29 AM (257, 21.2%) for males and 8:00 AM to 8:29 AM (265, 21.4%) for females.
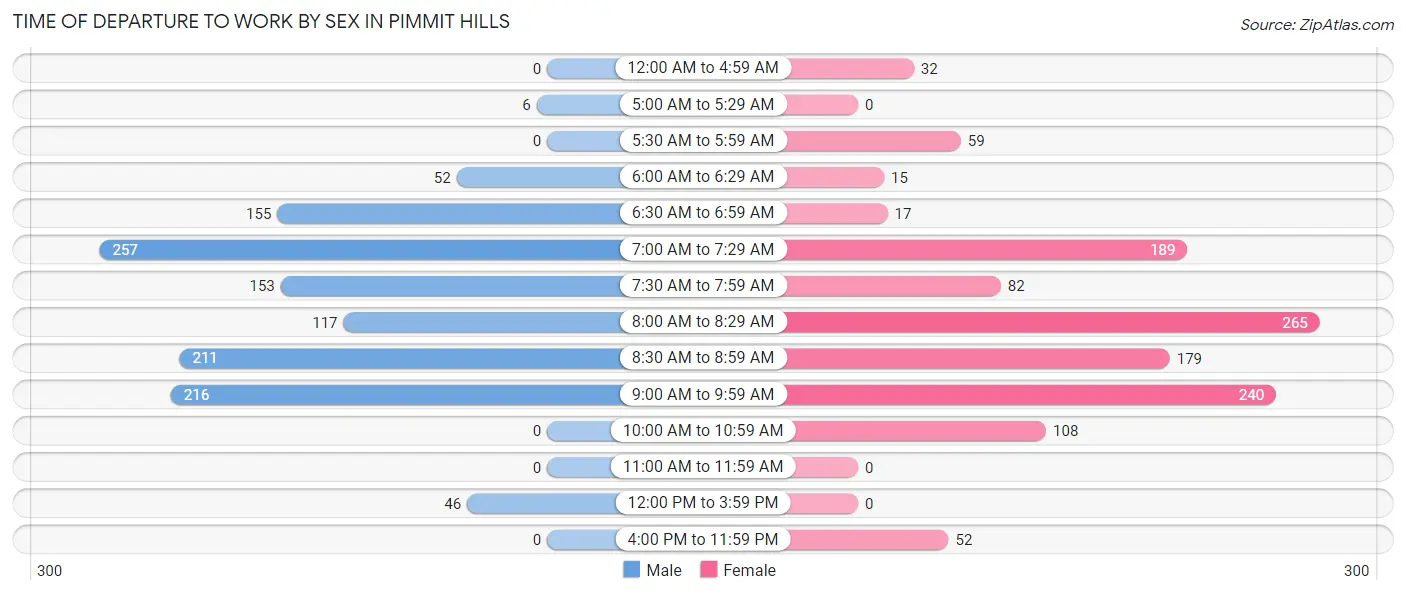
| Time of Departure | Male | Female |
| 12:00 AM to 4:59 AM | 0 (0.0%) | 32 (2.6%) |
| 5:00 AM to 5:29 AM | 6 (0.5%) | 0 (0.0%) |
| 5:30 AM to 5:59 AM | 0 (0.0%) | 59 (4.8%) |
| 6:00 AM to 6:29 AM | 52 (4.3%) | 15 (1.2%) |
| 6:30 AM to 6:59 AM | 155 (12.8%) | 17 (1.4%) |
| 7:00 AM to 7:29 AM | 257 (21.2%) | 189 (15.3%) |
| 7:30 AM to 7:59 AM | 153 (12.6%) | 82 (6.6%) |
| 8:00 AM to 8:29 AM | 117 (9.7%) | 265 (21.4%) |
| 8:30 AM to 8:59 AM | 211 (17.4%) | 179 (14.5%) |
| 9:00 AM to 9:59 AM | 216 (17.8%) | 240 (19.4%) |
| 10:00 AM to 10:59 AM | 0 (0.0%) | 108 (8.7%) |
| 11:00 AM to 11:59 AM | 0 (0.0%) | 0 (0.0%) |
| 12:00 PM to 3:59 PM | 46 (3.8%) | 0 (0.0%) |
| 4:00 PM to 11:59 PM | 0 (0.0%) | 52 (4.2%) |
| Total | 1,213 (100.0%) | 1,238 (100.0%) |
Housing Occupancy in Pimmit Hills
Occupancy by Ownership in Pimmit Hills
Of the total 2,219 dwellings in Pimmit Hills, owner-occupied units account for 1,480 (66.7%), while renter-occupied units make up 739 (33.3%).
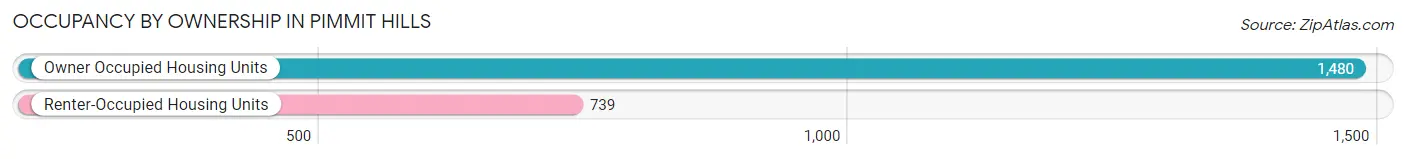
| Occupancy | # Housing Units | % Housing Units |
| Owner Occupied Housing Units | 1,480 | 66.7% |
| Renter-Occupied Housing Units | 739 | 33.3% |
| Total Occupied Housing Units | 2,219 | 100.0% |
Occupancy by Household Size in Pimmit Hills
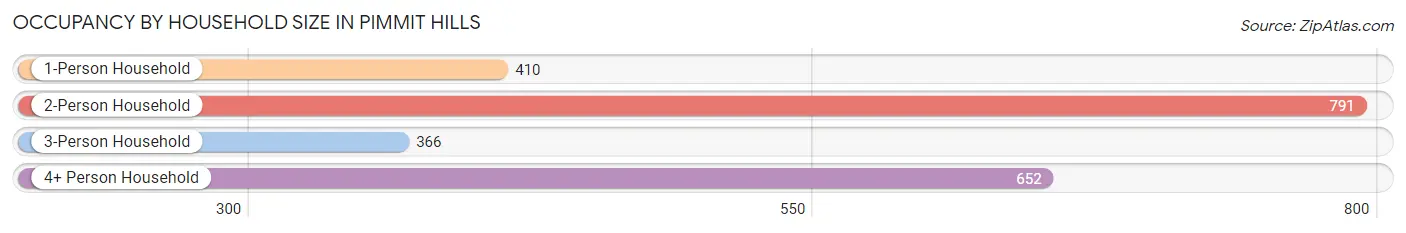
| Household Size | # Housing Units | % Housing Units |
| 1-Person Household | 410 | 18.5% |
| 2-Person Household | 791 | 35.6% |
| 3-Person Household | 366 | 16.5% |
| 4+ Person Household | 652 | 29.4% |
| Total Housing Units | 2,219 | 100.0% |
Occupancy by Ownership by Household Size in Pimmit Hills
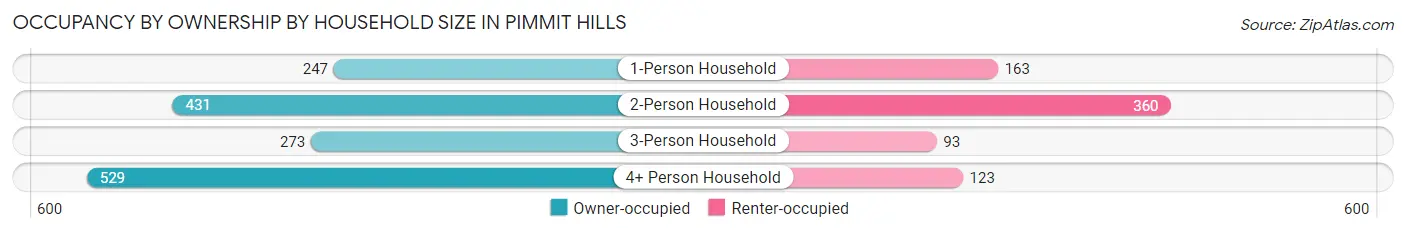
| Household Size | Owner-occupied | Renter-occupied |
| 1-Person Household | 247 (60.2%) | 163 (39.8%) |
| 2-Person Household | 431 (54.5%) | 360 (45.5%) |
| 3-Person Household | 273 (74.6%) | 93 (25.4%) |
| 4+ Person Household | 529 (81.1%) | 123 (18.9%) |
| Total Housing Units | 1,480 (66.7%) | 739 (33.3%) |
Occupancy by Educational Attainment in Pimmit Hills
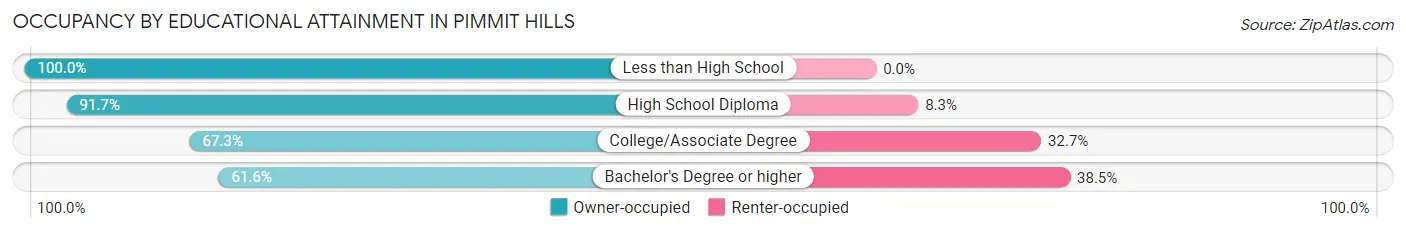
| Household Size | Owner-occupied | Renter-occupied |
| Less than High School | 72 (100.0%) | 0 (0.0%) |
| High School Diploma | 198 (91.7%) | 18 (8.3%) |
| College/Associate Degree | 251 (67.3%) | 122 (32.7%) |
| Bachelor's Degree or higher | 959 (61.6%) | 599 (38.5%) |
Occupancy by Age of Householder in Pimmit Hills
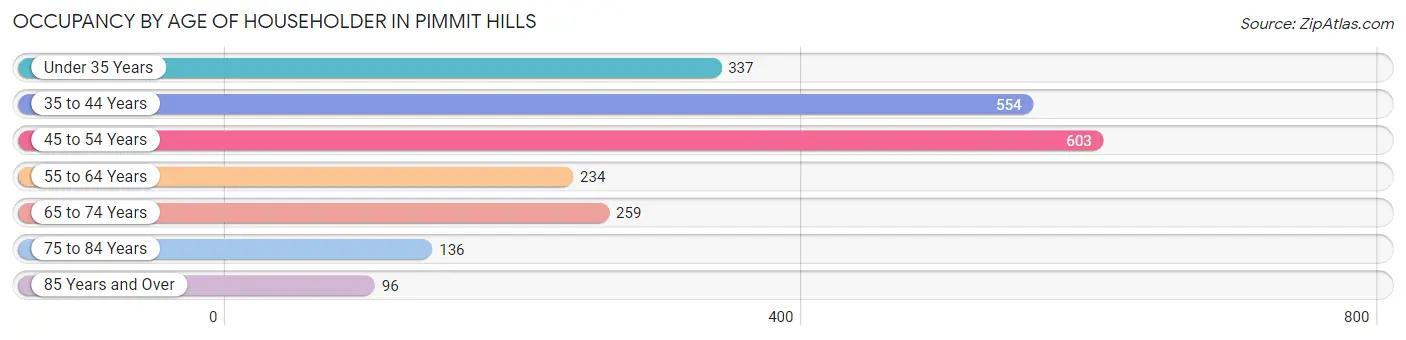
| Age Bracket | # Households | % Households |
| Under 35 Years | 337 | 15.2% |
| 35 to 44 Years | 554 | 25.0% |
| 45 to 54 Years | 603 | 27.2% |
| 55 to 64 Years | 234 | 10.5% |
| 65 to 74 Years | 259 | 11.7% |
| 75 to 84 Years | 136 | 6.1% |
| 85 Years and Over | 96 | 4.3% |
| Total | 2,219 | 100.0% |
Housing Finances in Pimmit Hills
Median Income by Occupancy in Pimmit Hills
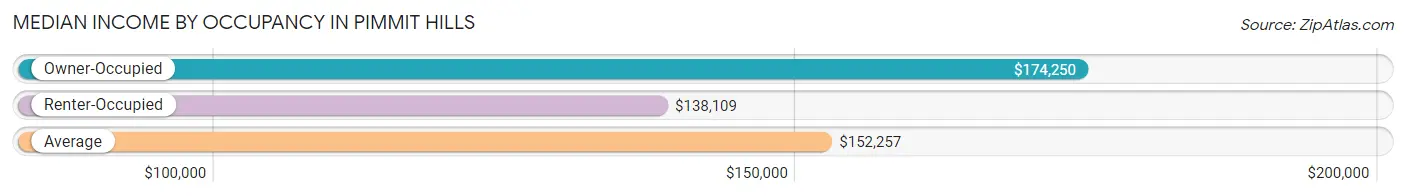
| Occupancy Type | # Households | Median Income |
| Owner-Occupied | 1,480 (66.7%) | $174,250 |
| Renter-Occupied | 739 (33.3%) | $138,109 |
| Average | 2,219 (100.0%) | $152,257 |
Occupancy by Householder Income Bracket in Pimmit Hills
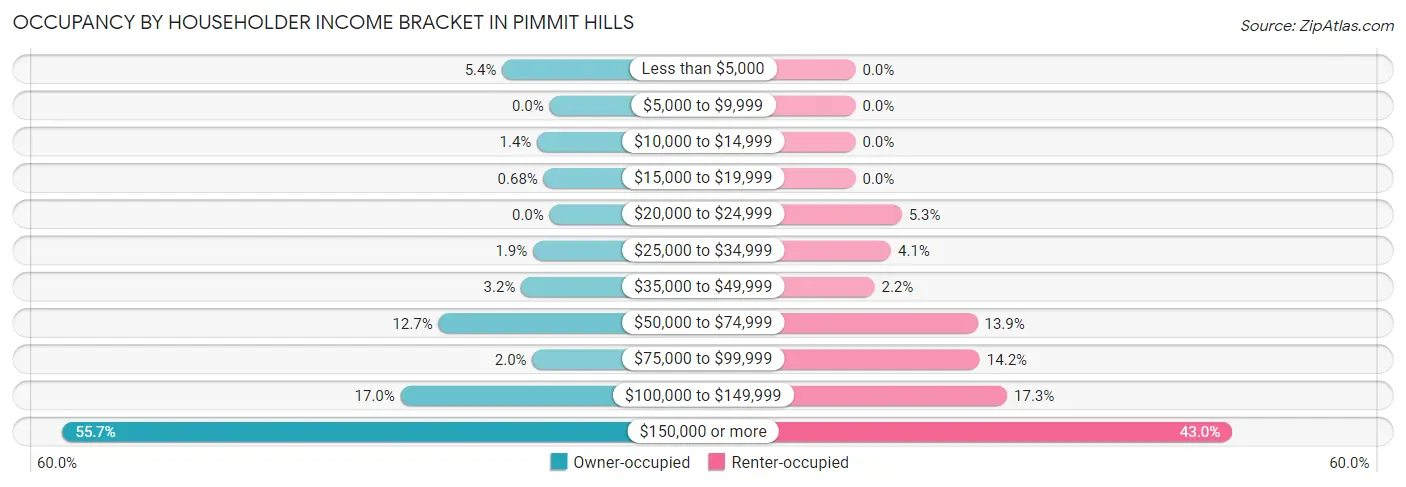
| Income Bracket | Owner-occupied | Renter-occupied |
| Less than $5,000 | 80 (5.4%) | 0 (0.0%) |
| $5,000 to $9,999 | 0 (0.0%) | 0 (0.0%) |
| $10,000 to $14,999 | 21 (1.4%) | 0 (0.0%) |
| $15,000 to $19,999 | 10 (0.7%) | 0 (0.0%) |
| $20,000 to $24,999 | 0 (0.0%) | 39 (5.3%) |
| $25,000 to $34,999 | 28 (1.9%) | 30 (4.1%) |
| $35,000 to $49,999 | 48 (3.2%) | 16 (2.2%) |
| $50,000 to $74,999 | 188 (12.7%) | 103 (13.9%) |
| $75,000 to $99,999 | 29 (2.0%) | 105 (14.2%) |
| $100,000 to $149,999 | 252 (17.0%) | 128 (17.3%) |
| $150,000 or more | 824 (55.7%) | 318 (43.0%) |
| Total | 1,480 (100.0%) | 739 (100.0%) |
Monthly Housing Cost Tiers in Pimmit Hills
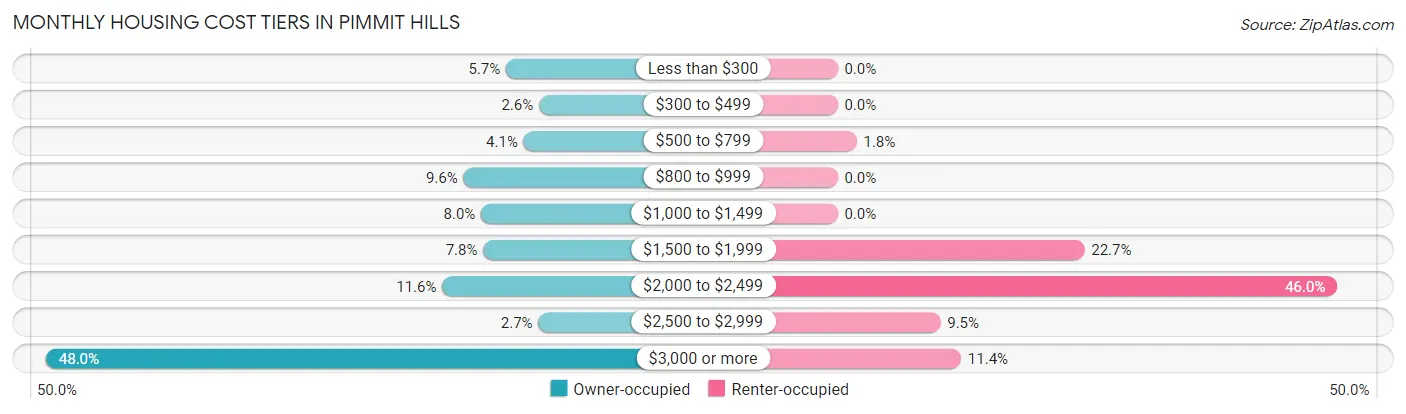
| Monthly Cost | Owner-occupied | Renter-occupied |
| Less than $300 | 84 (5.7%) | 0 (0.0%) |
| $300 to $499 | 39 (2.6%) | 0 (0.0%) |
| $500 to $799 | 60 (4.1%) | 13 (1.8%) |
| $800 to $999 | 142 (9.6%) | 0 (0.0%) |
| $1,000 to $1,499 | 118 (8.0%) | 0 (0.0%) |
| $1,500 to $1,999 | 115 (7.8%) | 168 (22.7%) |
| $2,000 to $2,499 | 171 (11.6%) | 340 (46.0%) |
| $2,500 to $2,999 | 40 (2.7%) | 70 (9.5%) |
| $3,000 or more | 711 (48.0%) | 84 (11.4%) |
| Total | 1,480 (100.0%) | 739 (100.0%) |
Physical Housing Characteristics in Pimmit Hills
Housing Structures in Pimmit Hills
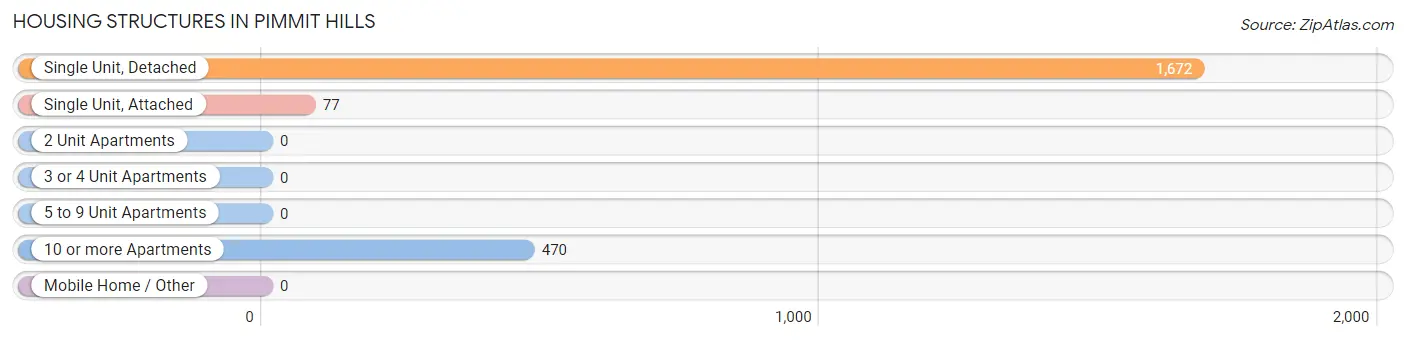
| Structure Type | # Housing Units | % Housing Units |
| Single Unit, Detached | 1,672 | 75.3% |
| Single Unit, Attached | 77 | 3.5% |
| 2 Unit Apartments | 0 | 0.0% |
| 3 or 4 Unit Apartments | 0 | 0.0% |
| 5 to 9 Unit Apartments | 0 | 0.0% |
| 10 or more Apartments | 470 | 21.2% |
| Mobile Home / Other | 0 | 0.0% |
| Total | 2,219 | 100.0% |
Housing Structures by Occupancy in Pimmit Hills
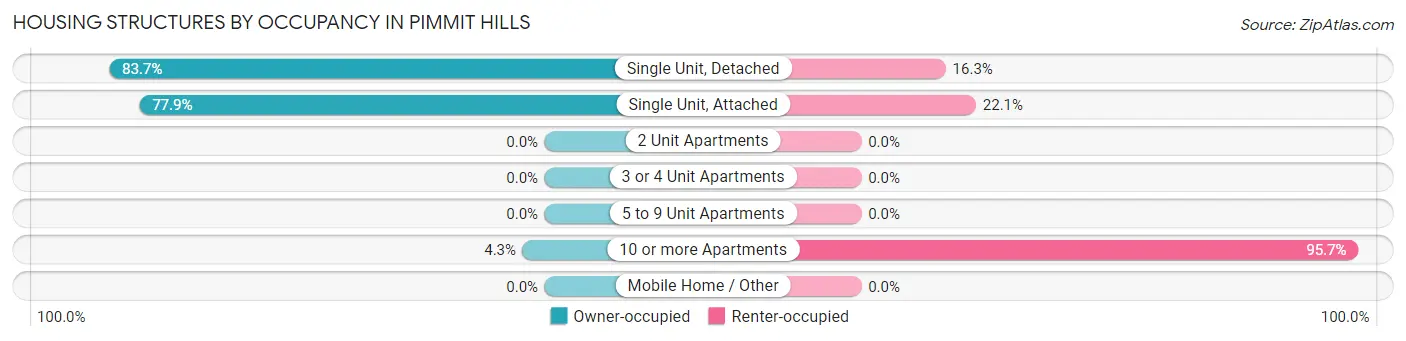
| Structure Type | Owner-occupied | Renter-occupied |
| Single Unit, Detached | 1,400 (83.7%) | 272 (16.3%) |
| Single Unit, Attached | 60 (77.9%) | 17 (22.1%) |
| 2 Unit Apartments | 0 (0.0%) | 0 (0.0%) |
| 3 or 4 Unit Apartments | 0 (0.0%) | 0 (0.0%) |
| 5 to 9 Unit Apartments | 0 (0.0%) | 0 (0.0%) |
| 10 or more Apartments | 20 (4.3%) | 450 (95.7%) |
| Mobile Home / Other | 0 (0.0%) | 0 (0.0%) |
| Total | 1,480 (66.7%) | 739 (33.3%) |
Housing Structures by Number of Rooms in Pimmit Hills
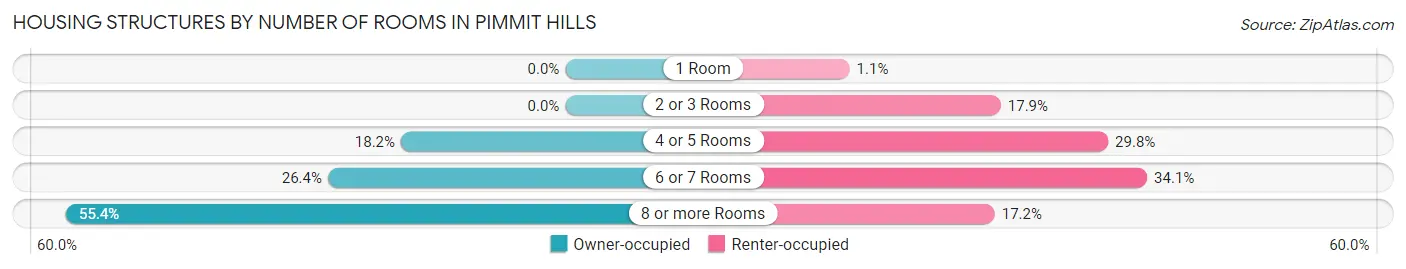
| Number of Rooms | Owner-occupied | Renter-occupied |
| 1 Room | 0 (0.0%) | 8 (1.1%) |
| 2 or 3 Rooms | 0 (0.0%) | 132 (17.9%) |
| 4 or 5 Rooms | 270 (18.2%) | 220 (29.8%) |
| 6 or 7 Rooms | 390 (26.4%) | 252 (34.1%) |
| 8 or more Rooms | 820 (55.4%) | 127 (17.2%) |
| Total | 1,480 (100.0%) | 739 (100.0%) |
Housing Structure by Heating Type in Pimmit Hills
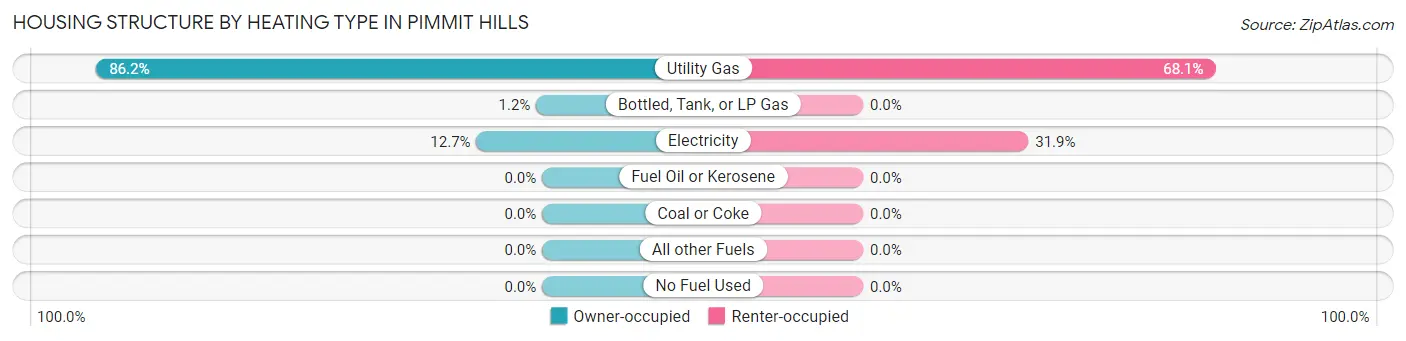
| Heating Type | Owner-occupied | Renter-occupied |
| Utility Gas | 1,275 (86.2%) | 503 (68.1%) |
| Bottled, Tank, or LP Gas | 17 (1.1%) | 0 (0.0%) |
| Electricity | 188 (12.7%) | 236 (31.9%) |
| Fuel Oil or Kerosene | 0 (0.0%) | 0 (0.0%) |
| Coal or Coke | 0 (0.0%) | 0 (0.0%) |
| All other Fuels | 0 (0.0%) | 0 (0.0%) |
| No Fuel Used | 0 (0.0%) | 0 (0.0%) |
| Total | 1,480 (100.0%) | 739 (100.0%) |
Household Vehicle Usage in Pimmit Hills
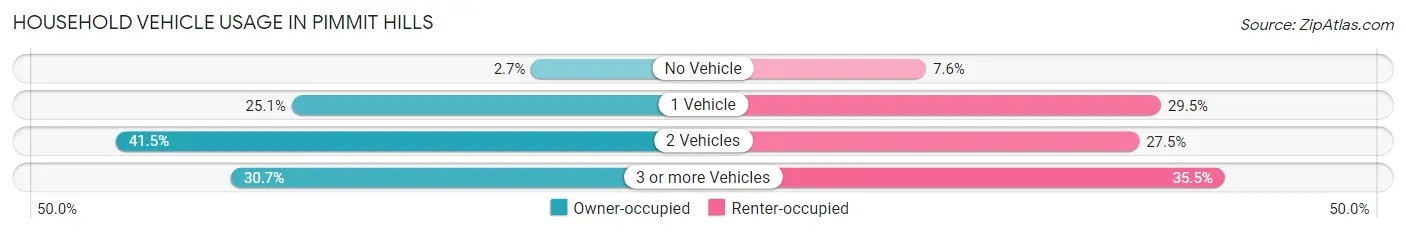
| Vehicles per Household | Owner-occupied | Renter-occupied |
| No Vehicle | 40 (2.7%) | 56 (7.6%) |
| 1 Vehicle | 371 (25.1%) | 218 (29.5%) |
| 2 Vehicles | 614 (41.5%) | 203 (27.5%) |
| 3 or more Vehicles | 455 (30.7%) | 262 (35.4%) |
| Total | 1,480 (100.0%) | 739 (100.0%) |
Real Estate & Mortgages in Pimmit Hills
Real Estate and Mortgage Overview in Pimmit Hills
| Characteristic | Without Mortgage | With Mortgage |
| Housing Units | 481 | 999 |
| Median Property Value | $704,500 | $952,000 |
| Median Household Income | $112,688 | $621 |
| Monthly Housing Costs | $863 | $711 |
| Real Estate Taxes | $7,136 | $0 |
Property Value by Mortgage Status in Pimmit Hills
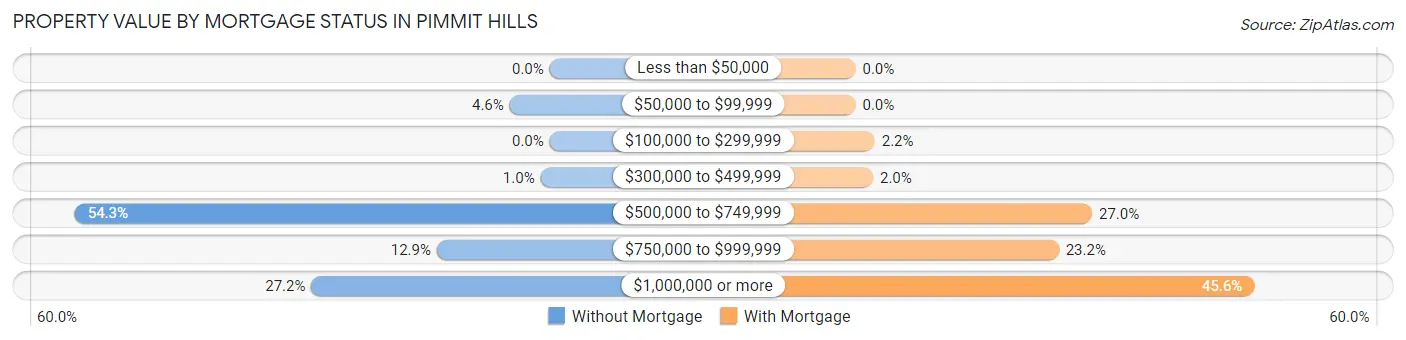
| Property Value | Without Mortgage | With Mortgage |
| Less than $50,000 | 0 (0.0%) | 0 (0.0%) |
| $50,000 to $99,999 | 22 (4.6%) | 0 (0.0%) |
| $100,000 to $299,999 | 0 (0.0%) | 22 (2.2%) |
| $300,000 to $499,999 | 5 (1.0%) | 20 (2.0%) |
| $500,000 to $749,999 | 261 (54.3%) | 270 (27.0%) |
| $750,000 to $999,999 | 62 (12.9%) | 232 (23.2%) |
| $1,000,000 or more | 131 (27.2%) | 455 (45.6%) |
| Total | 481 (100.0%) | 999 (100.0%) |
Household Income by Mortgage Status in Pimmit Hills
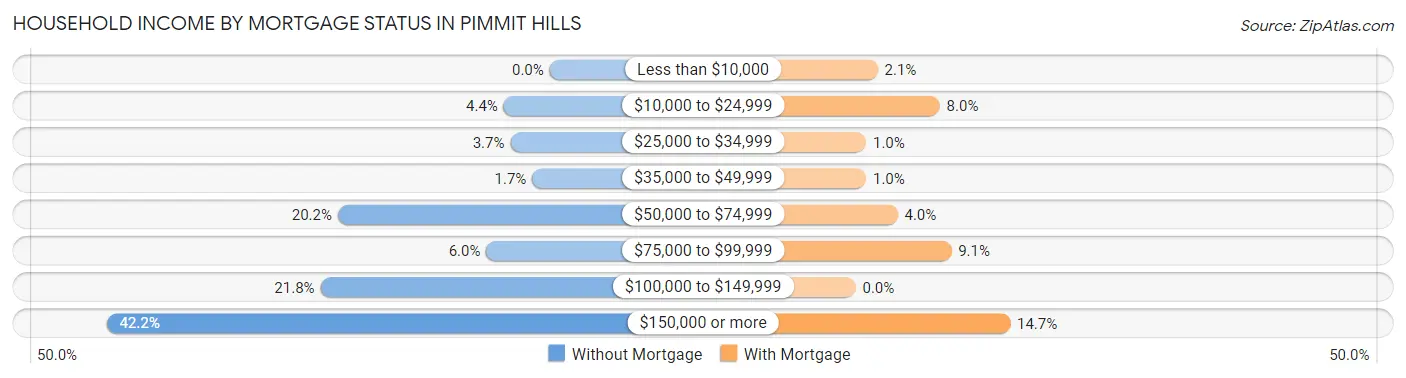
| Household Income | Without Mortgage | With Mortgage |
| Less than $10,000 | 0 (0.0%) | 21 (2.1%) |
| $10,000 to $24,999 | 21 (4.4%) | 80 (8.0%) |
| $25,000 to $34,999 | 18 (3.7%) | 10 (1.0%) |
| $35,000 to $49,999 | 8 (1.7%) | 10 (1.0%) |
| $50,000 to $74,999 | 97 (20.2%) | 40 (4.0%) |
| $75,000 to $99,999 | 29 (6.0%) | 91 (9.1%) |
| $100,000 to $149,999 | 105 (21.8%) | 0 (0.0%) |
| $150,000 or more | 203 (42.2%) | 147 (14.7%) |
| Total | 481 (100.0%) | 999 (100.0%) |
Property Value to Household Income Ratio in Pimmit Hills

| Value-to-Income Ratio | Without Mortgage | With Mortgage |
| Less than 2.0x | 27 (5.6%) | 213,060 (21,327.3%) |
| 2.0x to 2.9x | 32 (6.7%) | 43 (4.3%) |
| 3.0x to 3.9x | 50 (10.4%) | 128 (12.8%) |
| 4.0x or more | 372 (77.3%) | 154 (15.4%) |
| Total | 481 (100.0%) | 999 (100.0%) |
Real Estate Taxes by Mortgage Status in Pimmit Hills
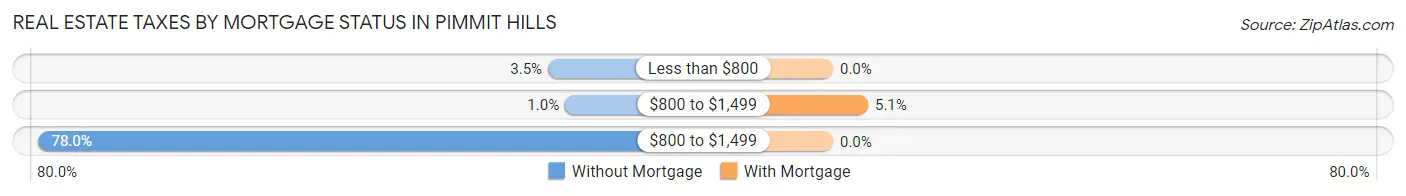
| Property Taxes | Without Mortgage | With Mortgage |
| Less than $800 | 17 (3.5%) | 0 (0.0%) |
| $800 to $1,499 | 5 (1.0%) | 51 (5.1%) |
| $800 to $1,499 | 375 (78.0%) | 0 (0.0%) |
| Total | 481 (100.0%) | 999 (100.0%) |
Health & Disability in Pimmit Hills
Health Insurance Coverage by Age in Pimmit Hills
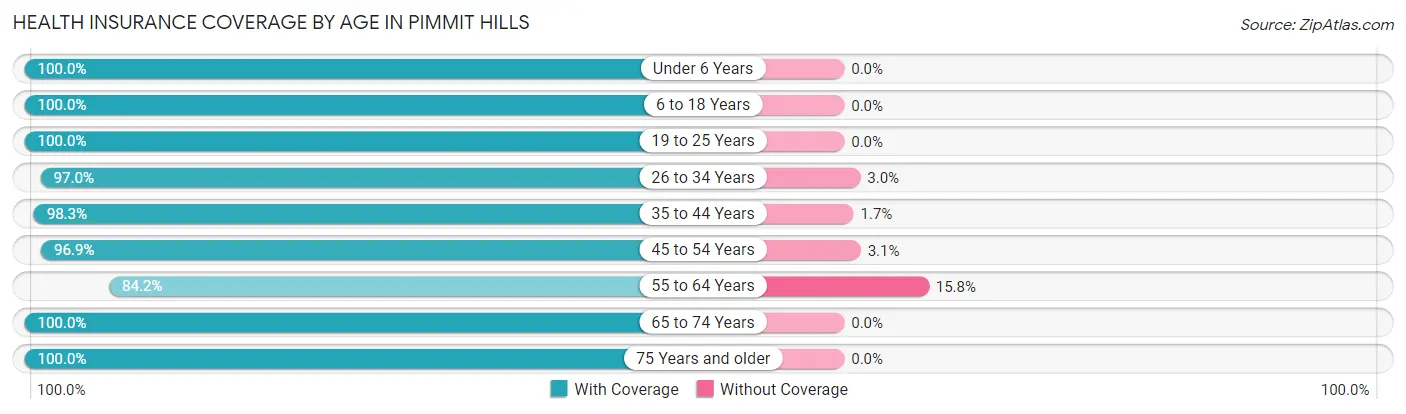
| Age Bracket | With Coverage | Without Coverage |
| Under 6 Years | 528 (100.0%) | 0 (0.0%) |
| 6 to 18 Years | 1,134 (100.0%) | 0 (0.0%) |
| 19 to 25 Years | 424 (100.0%) | 0 (0.0%) |
| 26 to 34 Years | 1,003 (97.0%) | 31 (3.0%) |
| 35 to 44 Years | 1,021 (98.3%) | 18 (1.7%) |
| 45 to 54 Years | 917 (96.9%) | 29 (3.1%) |
| 55 to 64 Years | 465 (84.2%) | 87 (15.8%) |
| 65 to 74 Years | 524 (100.0%) | 0 (0.0%) |
| 75 Years and older | 319 (100.0%) | 0 (0.0%) |
| Total | 6,335 (97.5%) | 165 (2.5%) |
Health Insurance Coverage by Citizenship Status in Pimmit Hills
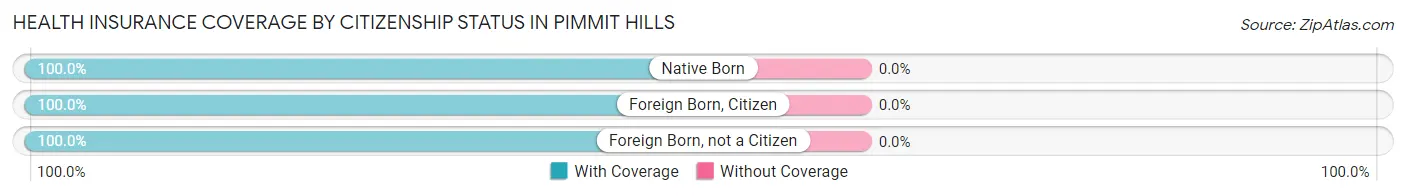
| Citizenship Status | With Coverage | Without Coverage |
| Native Born | 528 (100.0%) | 0 (0.0%) |
| Foreign Born, Citizen | 1,134 (100.0%) | 0 (0.0%) |
| Foreign Born, not a Citizen | 424 (100.0%) | 0 (0.0%) |
Health Insurance Coverage by Household Income in Pimmit Hills
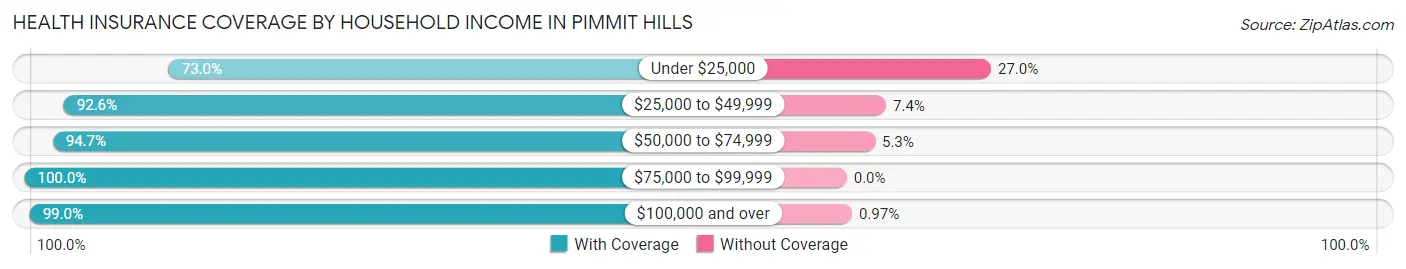
| Household Income | With Coverage | Without Coverage |
| Under $25,000 | 162 (73.0%) | 60 (27.0%) |
| $25,000 to $49,999 | 214 (92.6%) | 17 (7.4%) |
| $50,000 to $74,999 | 698 (94.7%) | 39 (5.3%) |
| $75,000 to $99,999 | 250 (100.0%) | 0 (0.0%) |
| $100,000 and over | 5,011 (99.0%) | 49 (1.0%) |
Public vs Private Health Insurance Coverage by Age in Pimmit Hills
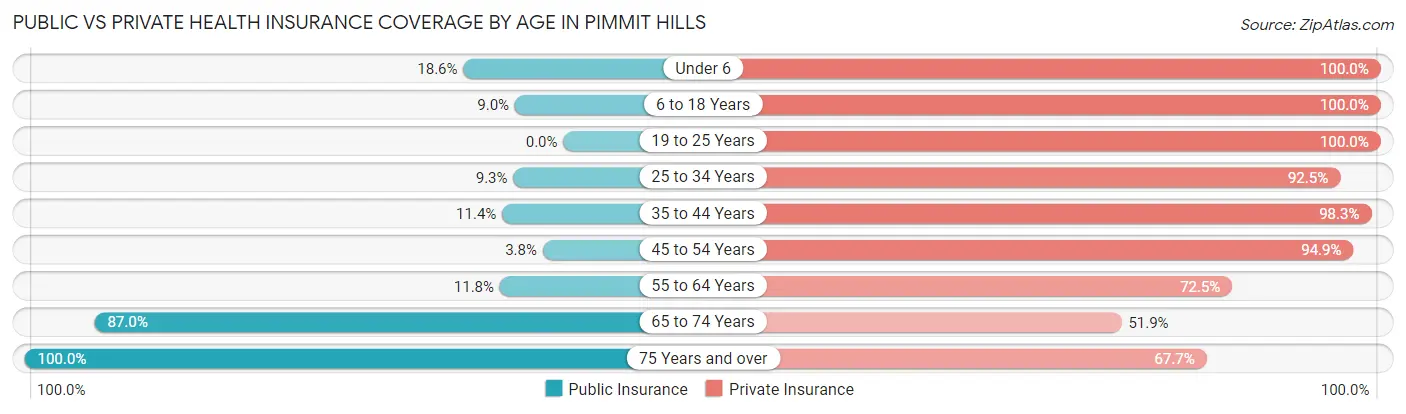
| Age Bracket | Public Insurance | Private Insurance |
| Under 6 | 98 (18.6%) | 528 (100.0%) |
| 6 to 18 Years | 102 (9.0%) | 1,134 (100.0%) |
| 19 to 25 Years | 0 (0.0%) | 424 (100.0%) |
| 25 to 34 Years | 96 (9.3%) | 956 (92.5%) |
| 35 to 44 Years | 118 (11.4%) | 1,021 (98.3%) |
| 45 to 54 Years | 36 (3.8%) | 898 (94.9%) |
| 55 to 64 Years | 65 (11.8%) | 400 (72.5%) |
| 65 to 74 Years | 456 (87.0%) | 272 (51.9%) |
| 75 Years and over | 319 (100.0%) | 216 (67.7%) |
| Total | 1,290 (19.9%) | 5,849 (90.0%) |
Disability Status by Sex by Age in Pimmit Hills
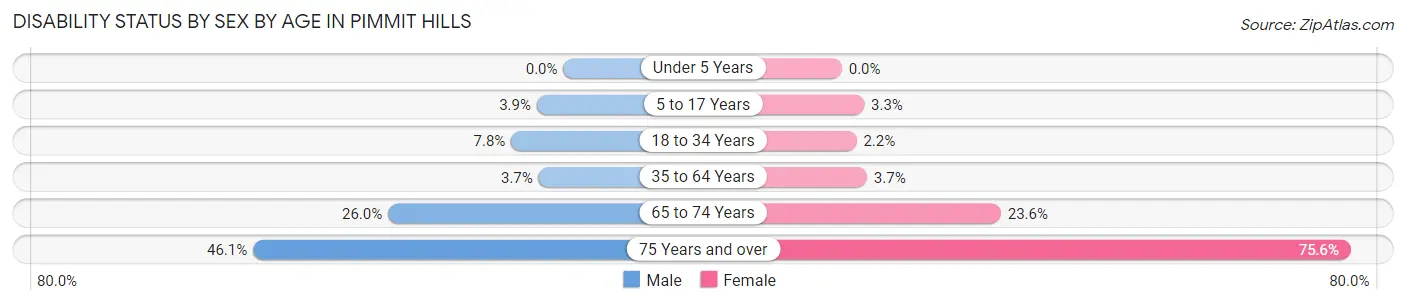
| Age Bracket | Male | Female |
| Under 5 Years | 0 (0.0%) | 0 (0.0%) |
| 5 to 17 Years | 21 (3.9%) | 19 (3.3%) |
| 18 to 34 Years | 61 (7.7%) | 16 (2.2%) |
| 35 to 64 Years | 45 (3.7%) | 49 (3.7%) |
| 65 to 74 Years | 57 (26.0%) | 72 (23.6%) |
| 75 Years and over | 47 (46.1%) | 164 (75.6%) |
Disability Class by Sex by Age in Pimmit Hills
Disability Class: Hearing Difficulty
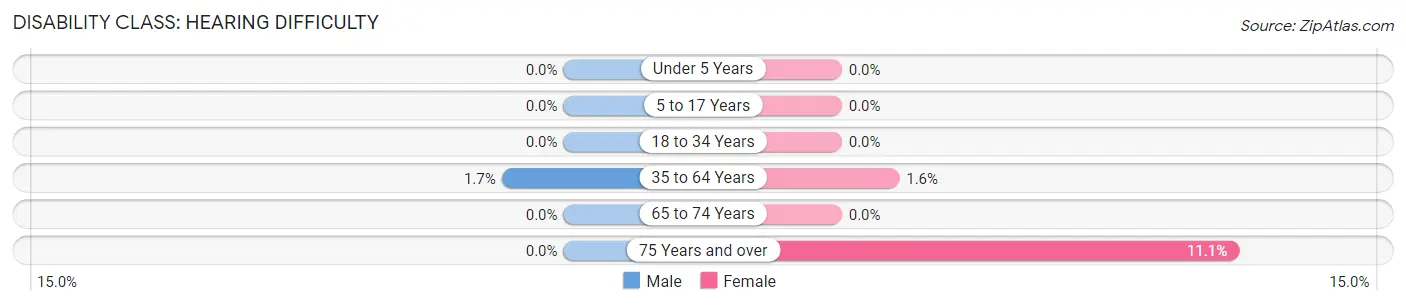
| Age Bracket | Male | Female |
| Under 5 Years | 0 (0.0%) | 0 (0.0%) |
| 5 to 17 Years | 0 (0.0%) | 0 (0.0%) |
| 18 to 34 Years | 0 (0.0%) | 0 (0.0%) |
| 35 to 64 Years | 21 (1.7%) | 21 (1.6%) |
| 65 to 74 Years | 0 (0.0%) | 0 (0.0%) |
| 75 Years and over | 0 (0.0%) | 24 (11.1%) |
Disability Class: Vision Difficulty
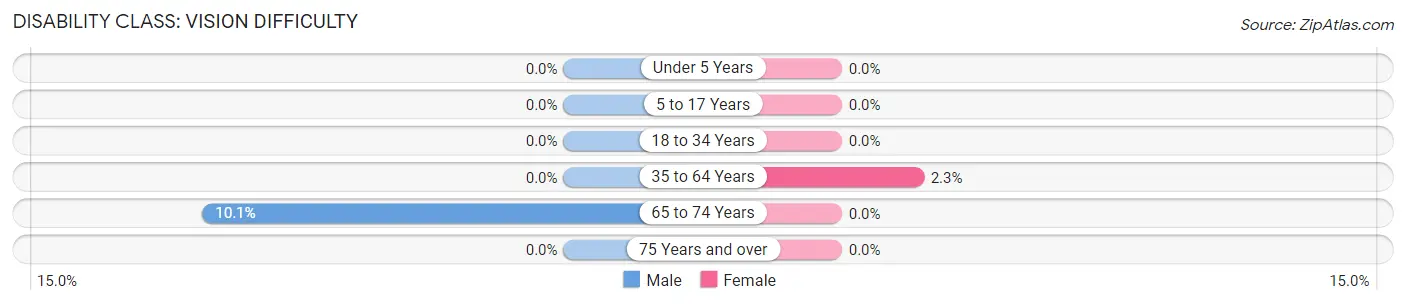
| Age Bracket | Male | Female |
| Under 5 Years | 0 (0.0%) | 0 (0.0%) |
| 5 to 17 Years | 0 (0.0%) | 0 (0.0%) |
| 18 to 34 Years | 0 (0.0%) | 0 (0.0%) |
| 35 to 64 Years | 0 (0.0%) | 30 (2.3%) |
| 65 to 74 Years | 22 (10.1%) | 0 (0.0%) |
| 75 Years and over | 0 (0.0%) | 0 (0.0%) |
Disability Class: Cognitive Difficulty
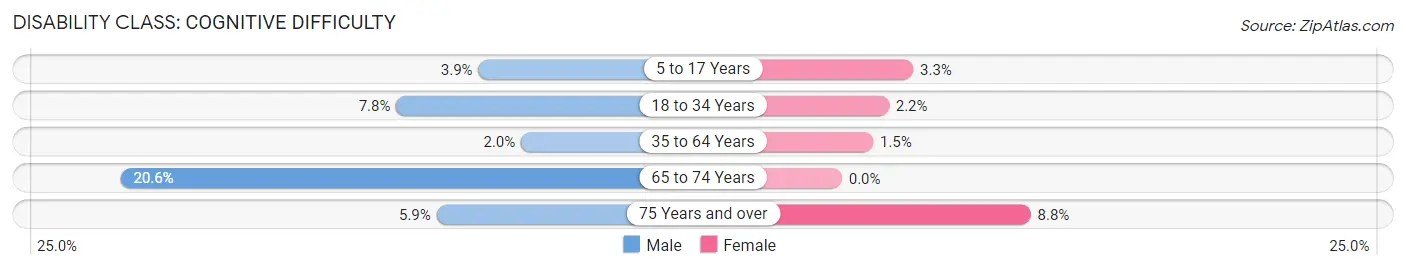
| Age Bracket | Male | Female |
| 5 to 17 Years | 21 (3.9%) | 19 (3.3%) |
| 18 to 34 Years | 61 (7.7%) | 16 (2.2%) |
| 35 to 64 Years | 24 (2.0%) | 19 (1.5%) |
| 65 to 74 Years | 45 (20.5%) | 0 (0.0%) |
| 75 Years and over | 6 (5.9%) | 19 (8.8%) |
Disability Class: Ambulatory Difficulty
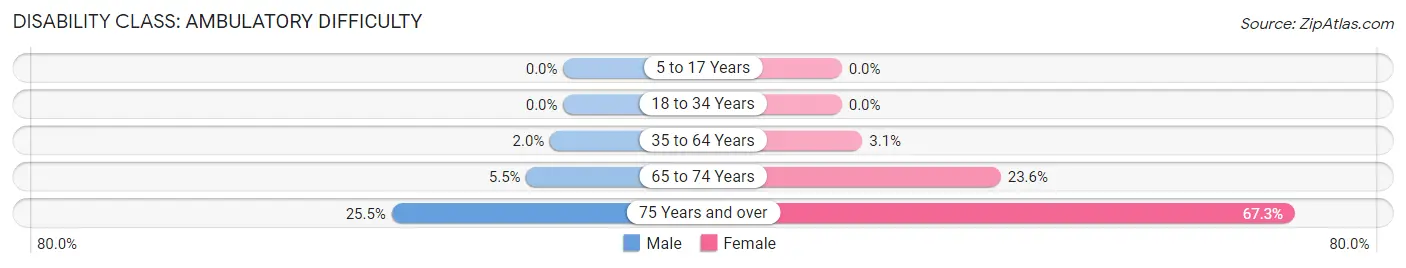
| Age Bracket | Male | Female |
| 5 to 17 Years | 0 (0.0%) | 0 (0.0%) |
| 18 to 34 Years | 0 (0.0%) | 0 (0.0%) |
| 35 to 64 Years | 24 (2.0%) | 40 (3.0%) |
| 65 to 74 Years | 12 (5.5%) | 72 (23.6%) |
| 75 Years and over | 26 (25.5%) | 146 (67.3%) |
Disability Class: Self-Care Difficulty
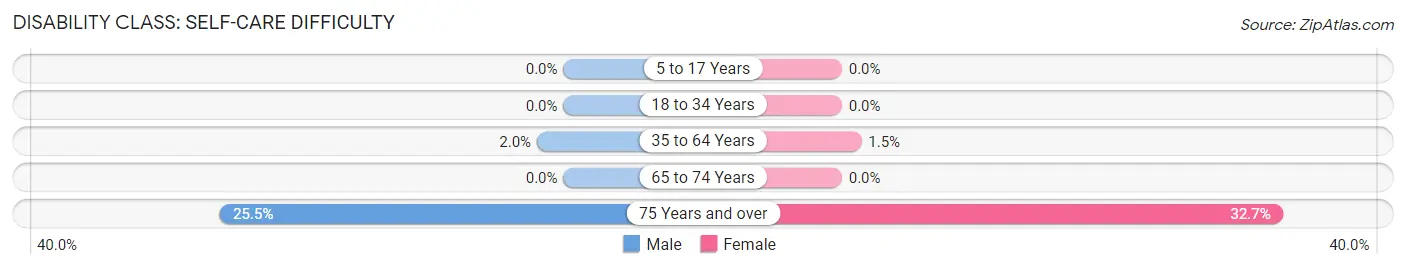
| Age Bracket | Male | Female |
| 5 to 17 Years | 0 (0.0%) | 0 (0.0%) |
| 18 to 34 Years | 0 (0.0%) | 0 (0.0%) |
| 35 to 64 Years | 24 (2.0%) | 19 (1.5%) |
| 65 to 74 Years | 0 (0.0%) | 0 (0.0%) |
| 75 Years and over | 26 (25.5%) | 71 (32.7%) |
Technology Access in Pimmit Hills
Computing Device Access in Pimmit Hills
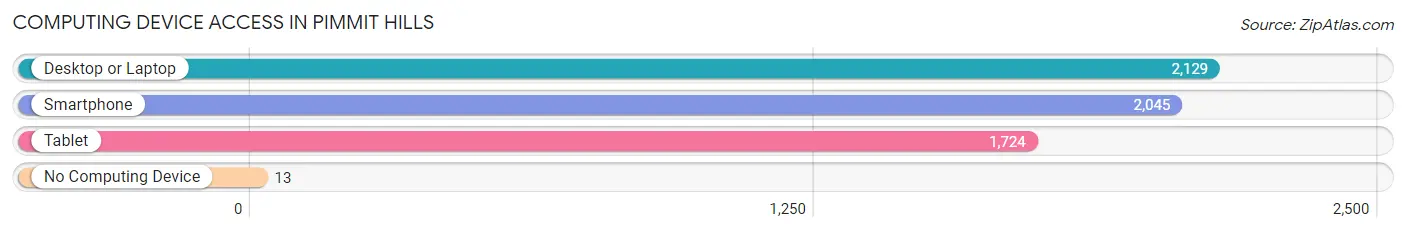
| Device Type | # Households | % Households |
| Desktop or Laptop | 2,129 | 95.9% |
| Smartphone | 2,045 | 92.2% |
| Tablet | 1,724 | 77.7% |
| No Computing Device | 13 | 0.6% |
| Total | 2,219 | 100.0% |
Internet Access in Pimmit Hills
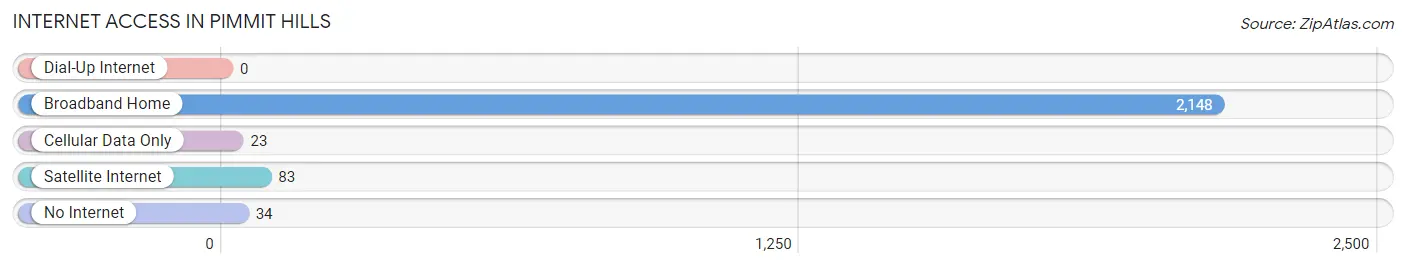
| Internet Type | # Households | % Households |
| Dial-Up Internet | 0 | 0.0% |
| Broadband Home | 2,148 | 96.8% |
| Cellular Data Only | 23 | 1.0% |
| Satellite Internet | 83 | 3.7% |
| No Internet | 34 | 1.5% |
| Total | 2,219 | 100.0% |
Pimmit Hills Summary
Pimmit Hills is a census-designated place (CDP) located in Fairfax County, Virginia. It is situated in the Washington metropolitan area and is part of the Tysons Corner area. The population of Pimmit Hills was 8,845 at the 2010 census.
Geography
Pimmit Hills is located at 38°54'17" North, 77°14'45" West (38.904722, -77.245833). It is bordered by the city of Falls Church to the north, McLean to the east, Tysons Corner to the south, and Idylwood to the west.
The area is mostly residential, with some commercial development along Leesburg Pike (Route 7). The area is served by the West Falls Church Metro station, located just outside the CDP.
History
Pimmit Hills was first settled in the late 1700s by the Pimmit family, who owned a large tract of land in the area. The family built a house on the property, which still stands today. The area remained largely rural until the 1950s, when the construction of the Dulles Access Road and the Washington Metro system spurred development in the area.
The area was officially designated as a CDP in 1980
Economy
Pimmit Hills is home to a variety of businesses, including retail stores, restaurants, and professional services. The area is also home to several corporate offices, including those of Booz Allen Hamilton, Capital One, and Hilton Worldwide.
Demographics
As of the 2010 census, the population of Pimmit Hills was 8,845. The racial makeup of the CDP was 68.3% White, 15.2% Asian, 8.2% African American, and 6.3% Hispanic or Latino. The median household income was $107,945, and the median family income was $118,945.
The area is served by the Fairfax County Public Schools system. The area is home to several schools, including Pimmit Hills Elementary School, Longfellow Middle School, and McLean High School.
Conclusion
Pimmit Hills is a census-designated place located in Fairfax County, Virginia. It is situated in the Washington metropolitan area and is part of the Tysons Corner area. The area is mostly residential, with some commercial development along Leesburg Pike (Route 7). The area was first settled in the late 1700s by the Pimmit family, and was officially designated as a CDP in 1980. The population of Pimmit Hills was 8,845 at the 2010 census, and the median household income was $107,945. The area is served by the Fairfax County Public Schools system, and is home to a variety of businesses.
Common Questions
What is Per Capita Income in Pimmit Hills?
Per Capita income in Pimmit Hills is $59,403.
What is the Median Family Income in Pimmit Hills?
Median Family Income in Pimmit Hills is $161,667.
What is the Median Household income in Pimmit Hills?
Median Household Income in Pimmit Hills is $152,257.
What is Income or Wage Gap in Pimmit Hills?
Income or Wage Gap in Pimmit Hills is 64.2%.
Women in Pimmit Hills earn 35.8 cents for every dollar earned by a man.
What is Inequality or Gini Index in Pimmit Hills?
Inequality or Gini Index in Pimmit Hills is 0.38.
What is the Total Population of Pimmit Hills?
Total Population of Pimmit Hills is 6,500.
What is the Total Male Population of Pimmit Hills?
Total Male Population of Pimmit Hills is 3,048.
What is the Total Female Population of Pimmit Hills?
Total Female Population of Pimmit Hills is 3,452.
What is the Ratio of Males per 100 Females in Pimmit Hills?
There are 88.30 Males per 100 Females in Pimmit Hills.
What is the Ratio of Females per 100 Males in Pimmit Hills?
There are 113.25 Females per 100 Males in Pimmit Hills.
What is the Median Population Age in Pimmit Hills?
Median Population Age in Pimmit Hills is 36.5 Years.
What is the Average Family Size in Pimmit Hills
Average Family Size in Pimmit Hills is 3.5 People.
What is the Average Household Size in Pimmit Hills
Average Household Size in Pimmit Hills is 2.9 People.
How Large is the Labor Force in Pimmit Hills?
There are 3,566 People in the Labor Forcein in Pimmit Hills.
What is the Percentage of People in the Labor Force in Pimmit Hills?
71.0% of People are in the Labor Force in Pimmit Hills.
What is the Unemployment Rate in Pimmit Hills?
Unemployment Rate in Pimmit Hills is 3.3%.