Kingstowne, VA Map & Demographics
Kingstowne Map
Kingstowne Overview
$70,972
PER CAPITA INCOME
$172,865
AVG FAMILY INCOME
$143,577
AVG HOUSEHOLD INCOME
20.4%
WAGE / INCOME GAP [ % ]
79.6¢/ $1
WAGE / INCOME GAP [ $ ]
$9,476
FAMILY INCOME DEFICIT
0.41
INEQUALITY / GINI INDEX
18,228
TOTAL POPULATION
8,521
MALE POPULATION
9,707
FEMALE POPULATION
87.78
MALES / 100 FEMALES
113.92
FEMALES / 100 MALES
39.3
MEDIAN AGE
3.2
AVG FAMILY SIZE
2.5
AVG HOUSEHOLD SIZE
10,494
LABOR FORCE [ PEOPLE ]
72.7%
PERCENT IN LABOR FORCE
3.2%
UNEMPLOYMENT RATE
Kingstowne Area Codes
Income in Kingstowne
Income Overview in Kingstowne
Per Capita Income in Kingstowne is $70,972, while median incomes of families and households are $172,865 and $143,577 respectively.
| Characteristic | Number | Measure |
| Per Capita Income | 18,228 | $70,972 |
| Median Family Income | 4,481 | $172,865 |
| Mean Family Income | 4,481 | $201,466 |
| Median Household Income | 7,387 | $143,577 |
| Mean Household Income | 7,387 | $172,634 |
| Income Deficit | 4,481 | $9,476 |
| Wage / Income Gap (%) | 18,228 | 20.43% |
| Wage / Income Gap ($) | 18,228 | 79.57¢ per $1 |
| Gini / Inequality Index | 18,228 | 0.41 |
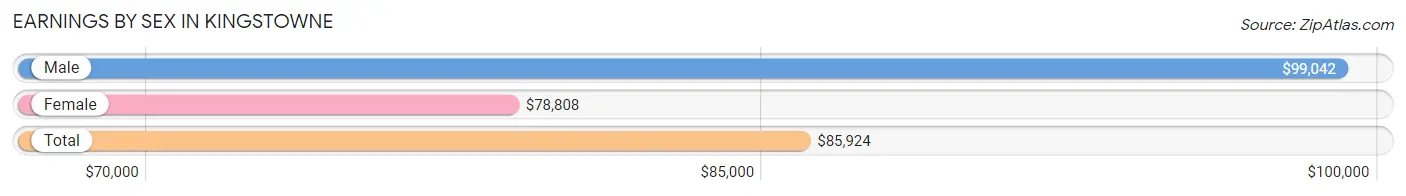
Earnings by Sex in Kingstowne
Average Earnings in Kingstowne are $85,924, $99,042 for men and $78,808 for women, a difference of 20.4%.
| Sex | Number | Average Earnings |
| Male | 5,588 (52.1%) | $99,042 |
| Female | 5,128 (47.8%) | $78,808 |
| Total | 10,716 (100.0%) | $85,924 |
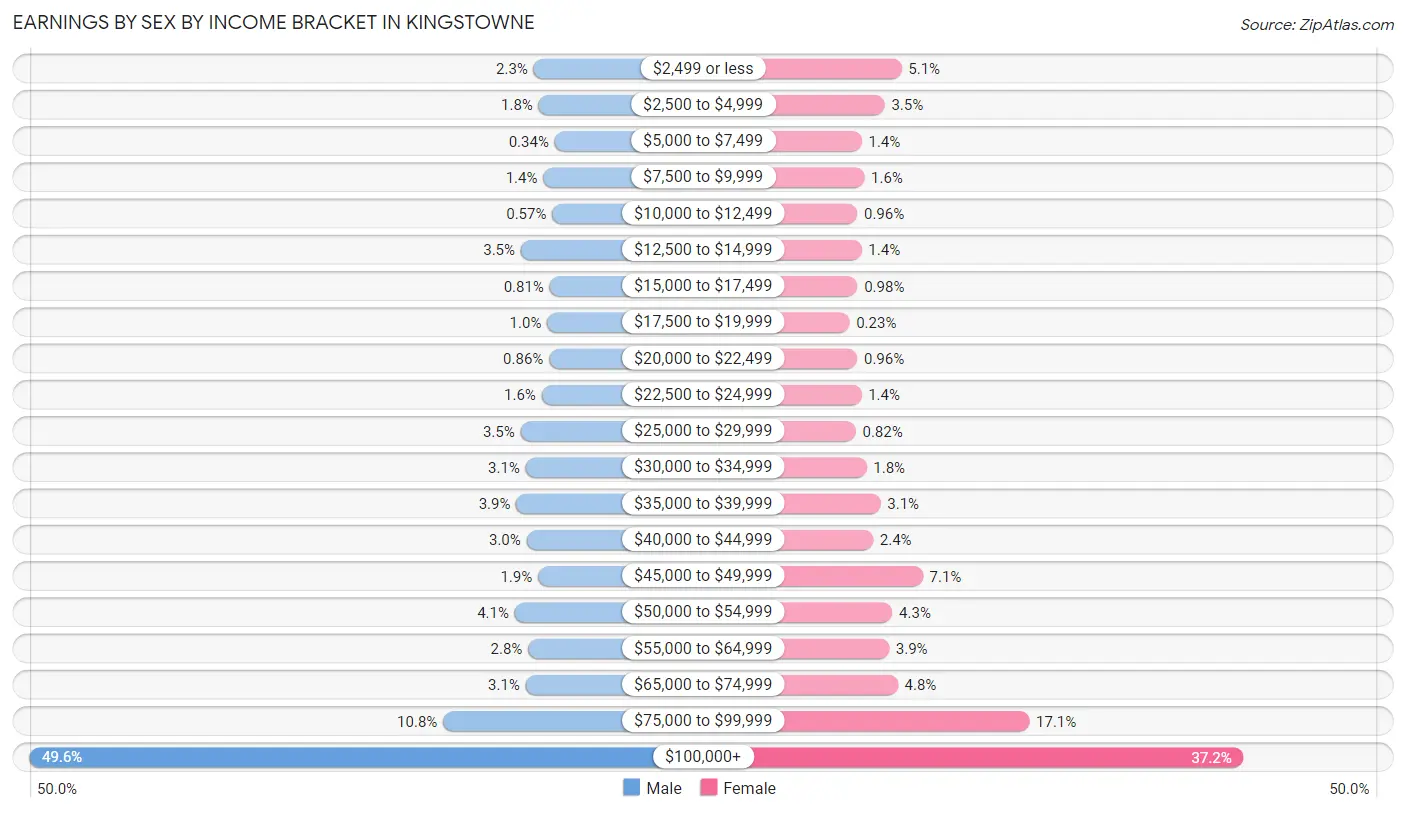
Earnings by Sex by Income Bracket in Kingstowne
The most common earnings brackets in Kingstowne are $100,000+ for men (2,771 | 49.6%) and $100,000+ for women (1,906 | 37.2%).
| Income | Male | Female |
| $2,499 or less | 129 (2.3%) | 262 (5.1%) |
| $2,500 to $4,999 | 103 (1.8%) | 181 (3.5%) |
| $5,000 to $7,499 | 19 (0.3%) | 71 (1.4%) |
| $7,500 to $9,999 | 79 (1.4%) | 83 (1.6%) |
| $10,000 to $12,499 | 32 (0.6%) | 49 (1.0%) |
| $12,500 to $14,999 | 196 (3.5%) | 70 (1.4%) |
| $15,000 to $17,499 | 45 (0.8%) | 50 (1.0%) |
| $17,500 to $19,999 | 58 (1.0%) | 12 (0.2%) |
| $20,000 to $22,499 | 48 (0.9%) | 49 (1.0%) |
| $22,500 to $24,999 | 87 (1.6%) | 69 (1.3%) |
| $25,000 to $29,999 | 198 (3.5%) | 42 (0.8%) |
| $30,000 to $34,999 | 171 (3.1%) | 94 (1.8%) |
| $35,000 to $39,999 | 220 (3.9%) | 161 (3.1%) |
| $40,000 to $44,999 | 166 (3.0%) | 125 (2.4%) |
| $45,000 to $49,999 | 106 (1.9%) | 364 (7.1%) |
| $50,000 to $54,999 | 228 (4.1%) | 218 (4.3%) |
| $55,000 to $64,999 | 158 (2.8%) | 202 (3.9%) |
| $65,000 to $74,999 | 171 (3.1%) | 244 (4.8%) |
| $75,000 to $99,999 | 603 (10.8%) | 876 (17.1%) |
| $100,000+ | 2,771 (49.6%) | 1,906 (37.2%) |
| Total | 5,588 (100.0%) | 5,128 (100.0%) |
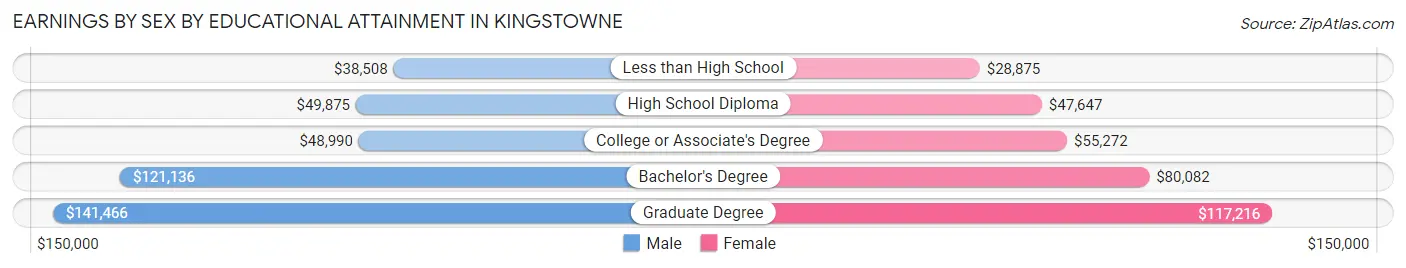
Earnings by Sex by Educational Attainment in Kingstowne
Average earnings in Kingstowne are $107,031 for men and $80,877 for women, a difference of 24.4%. Men with an educational attainment of graduate degree enjoy the highest average annual earnings of $141,466, while those with less than high school education earn the least with $38,508. Women with an educational attainment of graduate degree earn the most with the average annual earnings of $117,216, while those with less than high school education have the smallest earnings of $28,875.
| Educational Attainment | Male Income | Female Income |
| Less than High School | $38,508 | $28,875 |
| High School Diploma | $49,875 | $47,647 |
| College or Associate's Degree | $48,990 | $55,272 |
| Bachelor's Degree | $121,136 | $80,082 |
| Graduate Degree | $141,466 | $117,216 |
| Total | $107,031 | $80,877 |
Family Income in Kingstowne
Family Income Brackets in Kingstowne
According to the Kingstowne family income data, there are 1,945 families falling into the $200,000+ income range, which is the most common income bracket and makes up 43.4% of all families. Conversely, the less than $10,000 income bracket is the least frequent group with only 22 families (0.5%) belonging to this category.
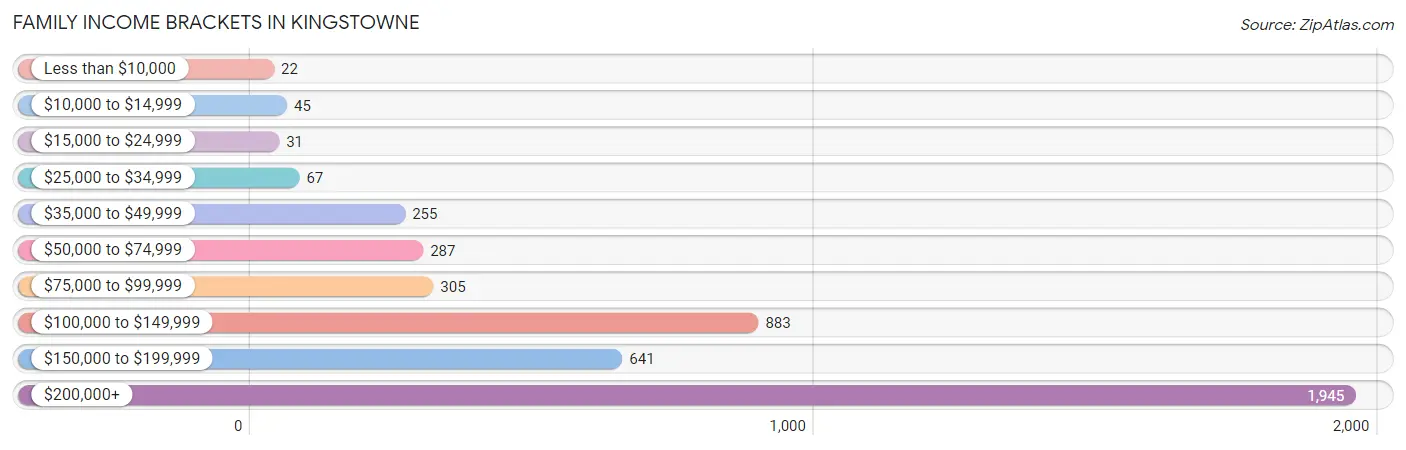
| Income Bracket | # Families | % Families |
| Less than $10,000 | 22 | 0.5% |
| $10,000 to $14,999 | 45 | 1.0% |
| $15,000 to $24,999 | 31 | 0.7% |
| $25,000 to $34,999 | 67 | 1.5% |
| $35,000 to $49,999 | 255 | 5.7% |
| $50,000 to $74,999 | 287 | 6.4% |
| $75,000 to $99,999 | 305 | 6.8% |
| $100,000 to $149,999 | 883 | 19.7% |
| $150,000 to $199,999 | 641 | 14.3% |
| $200,000+ | 1,945 | 43.4% |
Family Income by Famaliy Size in Kingstowne
7+ person families (56 | 1.3%) account for the highest median family income in Kingstowne with $250,001 per family, while 2-person families (1,907 | 42.6%) have the highest median income of $79,055 per family member.
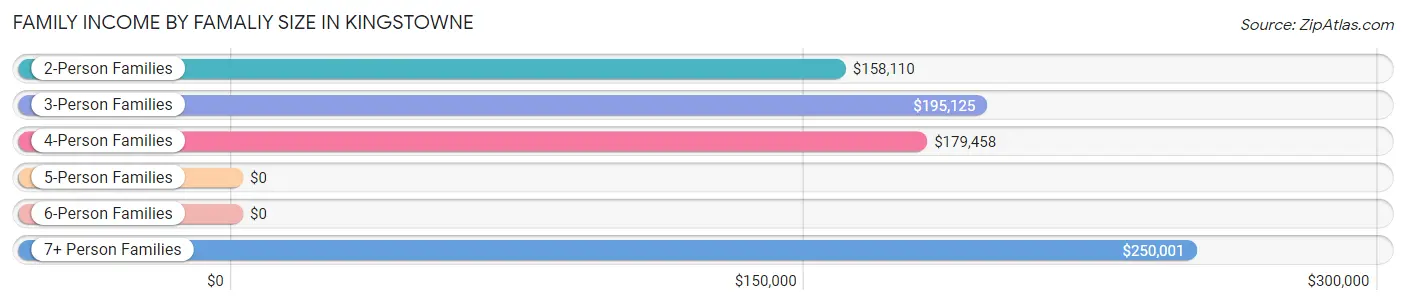
| Income Bracket | # Families | Median Income |
| 2-Person Families | 1,907 (42.6%) | $158,110 |
| 3-Person Families | 1,141 (25.5%) | $195,125 |
| 4-Person Families | 1,000 (22.3%) | $179,458 |
| 5-Person Families | 309 (6.9%) | $0 |
| 6-Person Families | 68 (1.5%) | $0 |
| 7+ Person Families | 56 (1.3%) | $250,001 |
| Total | 4,481 (100.0%) | $172,865 |
Family Income by Number of Earners in Kingstowne
The median family income in Kingstowne is $172,865, with families comprising 3+ earners (590) having the highest median family income of $243,571, while families with 1 earner (1,625) have the lowest median family income of $118,148, accounting for 13.2% and 36.3% of families, respectively.
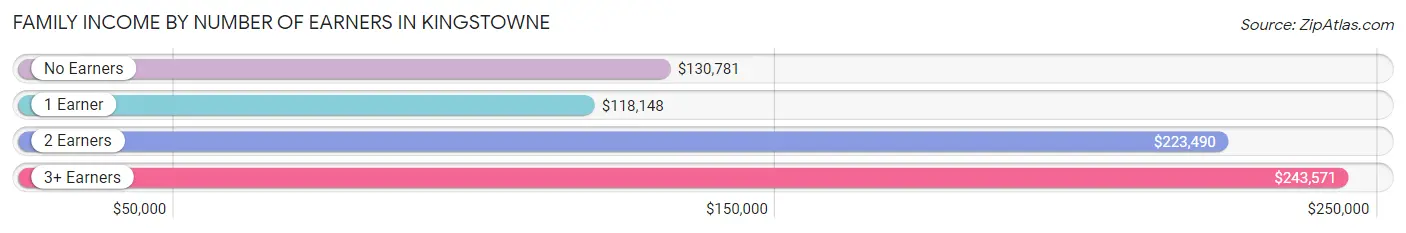
| Number of Earners | # Families | Median Income |
| No Earners | 318 (7.1%) | $130,781 |
| 1 Earner | 1,625 (36.3%) | $118,148 |
| 2 Earners | 1,948 (43.5%) | $223,490 |
| 3+ Earners | 590 (13.2%) | $243,571 |
| Total | 4,481 (100.0%) | $172,865 |
Household Income in Kingstowne
Household Income Brackets in Kingstowne
With 2,497 households falling in the category, the $200,000+ income range is the most frequent in Kingstowne, accounting for 33.8% of all households. In contrast, only 96 households (1.3%) fall into the $10,000 to $14,999 income bracket, making it the least populous group.
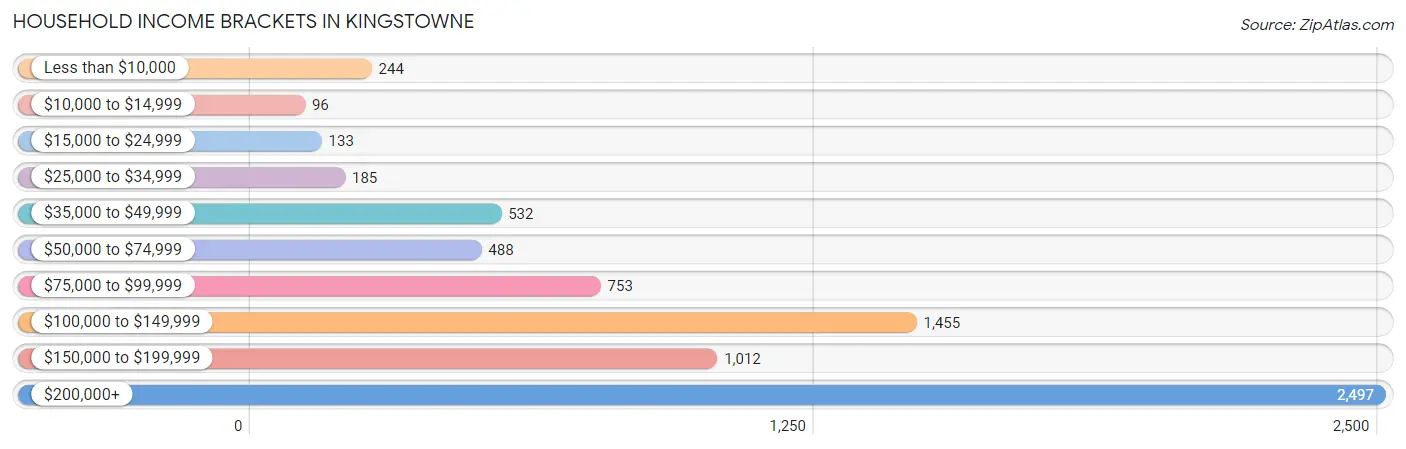
| Income Bracket | # Households | % Households |
| Less than $10,000 | 244 | 3.3% |
| $10,000 to $14,999 | 96 | 1.3% |
| $15,000 to $24,999 | 133 | 1.8% |
| $25,000 to $34,999 | 185 | 2.5% |
| $35,000 to $49,999 | 532 | 7.2% |
| $50,000 to $74,999 | 488 | 6.6% |
| $75,000 to $99,999 | 753 | 10.2% |
| $100,000 to $149,999 | 1,455 | 19.7% |
| $150,000 to $199,999 | 1,012 | 13.7% |
| $200,000+ | 2,497 | 33.8% |
Household Income by Householder Age in Kingstowne
The median household income in Kingstowne is $143,577, with the highest median household income of $172,216 found in the 45 to 64 years age bracket for the primary householder. A total of 2,981 households (40.4%) fall into this category. Meanwhile, the 15 to 24 years age bracket for the primary householder has the lowest median household income of $45,547, with 92 households (1.3%) in this group.
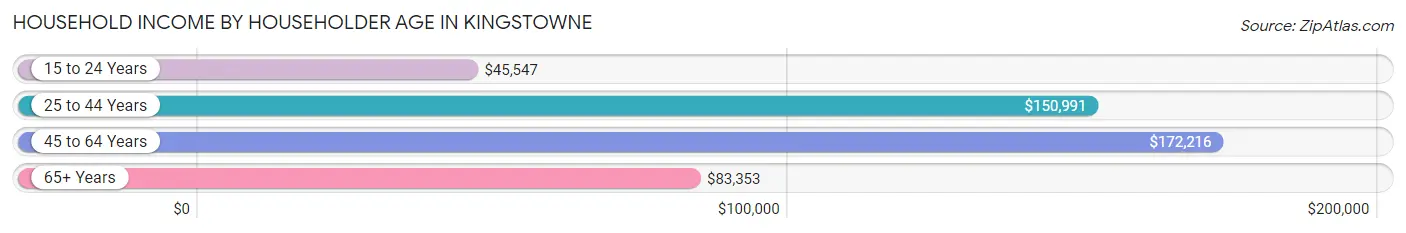
| Income Bracket | # Households | Median Income |
| 15 to 24 Years | 92 (1.3%) | $45,547 |
| 25 to 44 Years | 2,640 (35.7%) | $150,991 |
| 45 to 64 Years | 2,981 (40.4%) | $172,216 |
| 65+ Years | 1,674 (22.7%) | $83,353 |
| Total | 7,387 (100.0%) | $143,577 |
Poverty in Kingstowne
Income Below Poverty by Sex and Age in Kingstowne
With 3.7% poverty level for males and 4.9% for females among the residents of Kingstowne, 5 year old males and 75 year old and over females are the most vulnerable to poverty, with 14 males (16.9%) and 131 females (24.1%) in their respective age groups living below the poverty level.
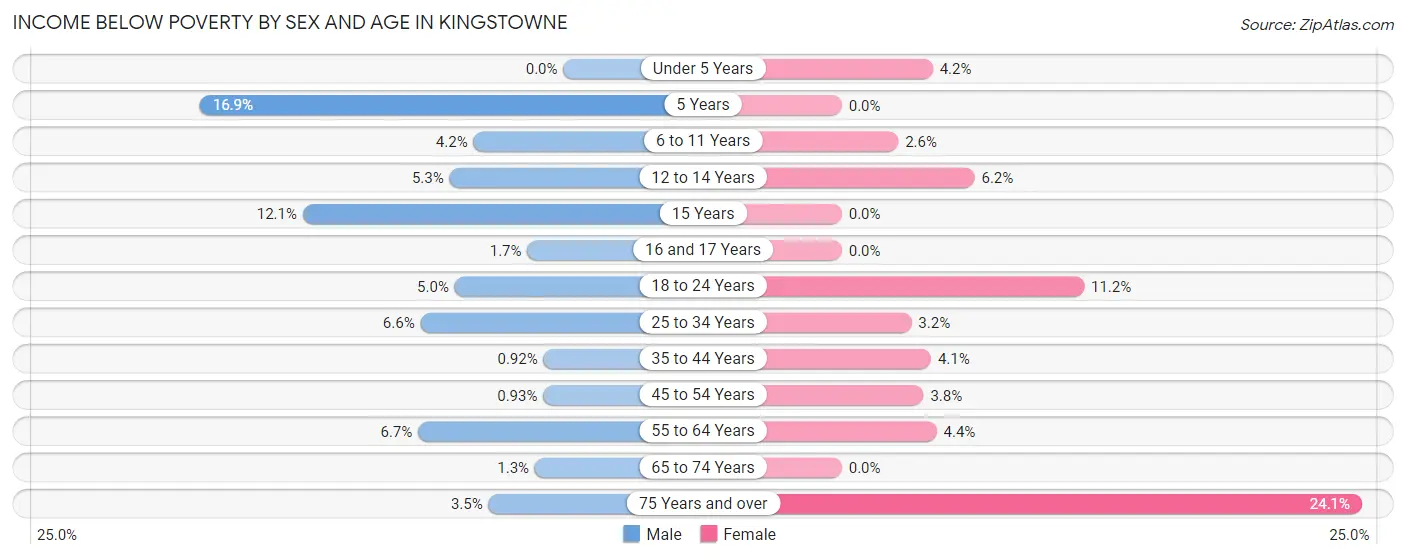
| Age Bracket | Male | Female |
| Under 5 Years | 0 (0.0%) | 29 (4.2%) |
| 5 Years | 14 (16.9%) | 0 (0.0%) |
| 6 to 11 Years | 20 (4.2%) | 20 (2.6%) |
| 12 to 14 Years | 15 (5.3%) | 33 (6.2%) |
| 15 Years | 11 (12.1%) | 0 (0.0%) |
| 16 and 17 Years | 7 (1.7%) | 0 (0.0%) |
| 18 to 24 Years | 27 (5.0%) | 40 (11.2%) |
| 25 to 34 Years | 81 (6.6%) | 46 (3.2%) |
| 35 to 44 Years | 11 (0.9%) | 62 (4.1%) |
| 45 to 54 Years | 10 (0.9%) | 52 (3.8%) |
| 55 to 64 Years | 93 (6.7%) | 60 (4.4%) |
| 65 to 74 Years | 11 (1.3%) | 0 (0.0%) |
| 75 Years and over | 11 (3.5%) | 131 (24.1%) |
| Total | 311 (3.7%) | 473 (4.9%) |
Income Above Poverty by Sex and Age in Kingstowne
According to the poverty statistics in Kingstowne, males aged under 5 years and females aged 5 years are the age groups that are most secure financially, with 100.0% of males and 100.0% of females in these age groups living above the poverty line.
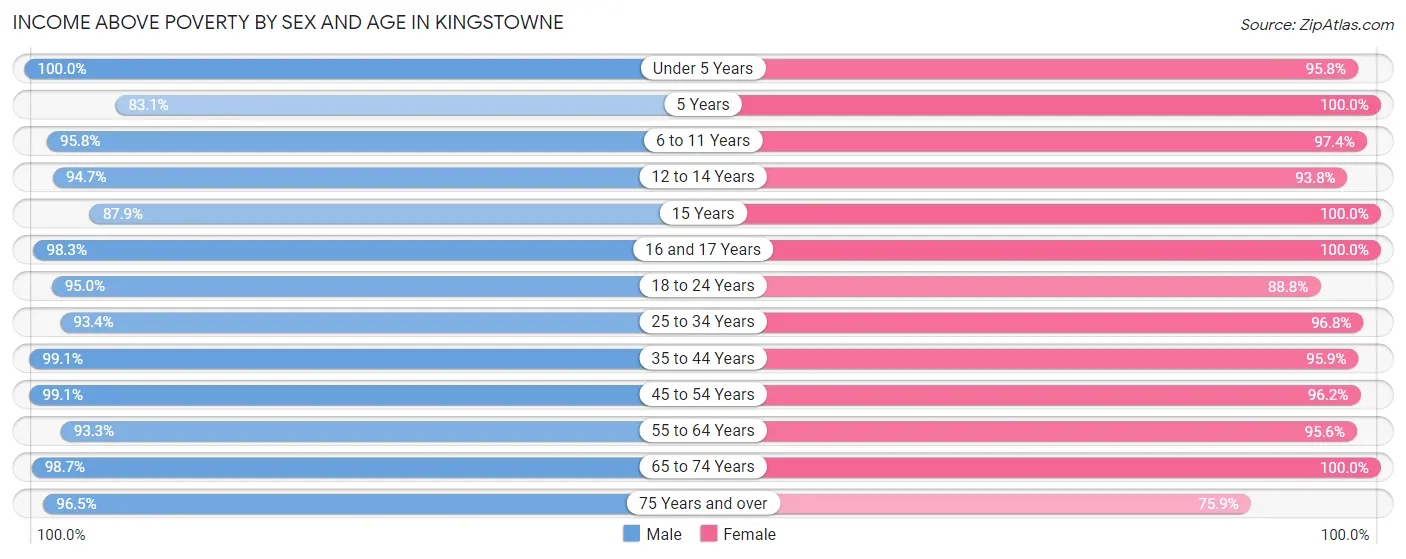
| Age Bracket | Male | Female |
| Under 5 Years | 551 (100.0%) | 659 (95.8%) |
| 5 Years | 69 (83.1%) | 117 (100.0%) |
| 6 to 11 Years | 460 (95.8%) | 742 (97.4%) |
| 12 to 14 Years | 269 (94.7%) | 503 (93.8%) |
| 15 Years | 80 (87.9%) | 93 (100.0%) |
| 16 and 17 Years | 411 (98.3%) | 161 (100.0%) |
| 18 to 24 Years | 509 (95.0%) | 316 (88.8%) |
| 25 to 34 Years | 1,140 (93.4%) | 1,377 (96.8%) |
| 35 to 44 Years | 1,188 (99.1%) | 1,434 (95.9%) |
| 45 to 54 Years | 1,063 (99.1%) | 1,319 (96.2%) |
| 55 to 64 Years | 1,286 (93.3%) | 1,304 (95.6%) |
| 65 to 74 Years | 825 (98.7%) | 742 (100.0%) |
| 75 Years and over | 306 (96.5%) | 412 (75.9%) |
| Total | 8,157 (96.3%) | 9,179 (95.1%) |
Income Below Poverty Among Married-Couple Families in Kingstowne
The poverty statistics for married-couple families in Kingstowne show that 1.0% or 33 of the total 3,410 families live below the poverty line. Families with 3 or 4 children have the highest poverty rate of 4.3%, comprising of 11 families. On the other hand, families with no children have the lowest poverty rate of 0.6%, which includes 11 families.
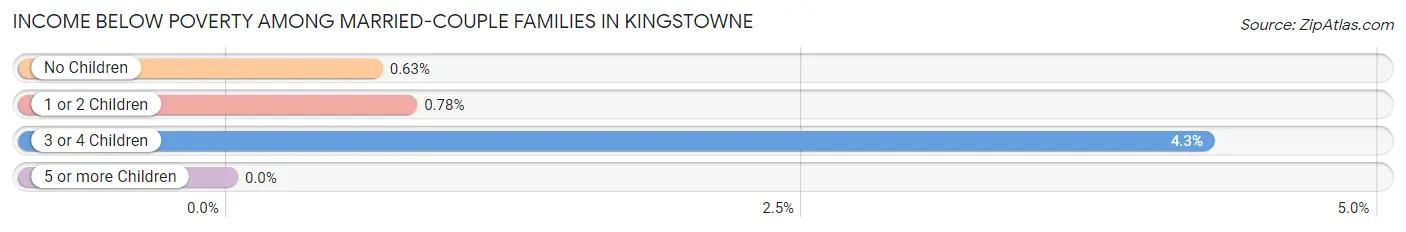
| Children | Above Poverty | Below Poverty |
| No Children | 1,737 (99.4%) | 11 (0.6%) |
| 1 or 2 Children | 1,392 (99.2%) | 11 (0.8%) |
| 3 or 4 Children | 248 (95.8%) | 11 (4.3%) |
| 5 or more Children | 0 (0.0%) | 0 (0.0%) |
| Total | 3,377 (99.0%) | 33 (1.0%) |
Income Below Poverty Among Single-Parent Households in Kingstowne
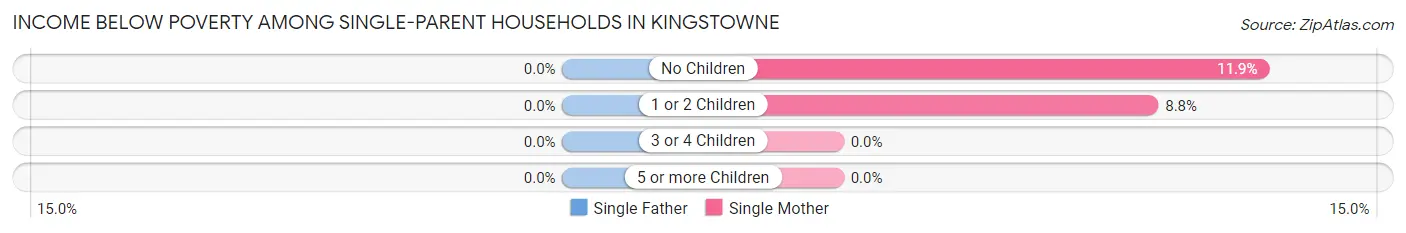
| Children | Single Father | Single Mother |
| No Children | 0 (0.0%) | 34 (11.9%) |
| 1 or 2 Children | 0 (0.0%) | 43 (8.8%) |
| 3 or 4 Children | 0 (0.0%) | 0 (0.0%) |
| 5 or more Children | 0 (0.0%) | 0 (0.0%) |
| Total | 0 (0.0%) | 77 (8.9%) |
Income Below Poverty Among Married-Couple vs Single-Parent Households in Kingstowne
The poverty data for Kingstowne shows that 33 of the married-couple family households (1.0%) and 77 of the single-parent households (7.2%) are living below the poverty level. Within the married-couple family households, those with 3 or 4 children have the highest poverty rate, with 11 households (4.3%) falling below the poverty line. Among the single-parent households, those with no children have the highest poverty rate, with 34 household (9.2%) living below poverty.
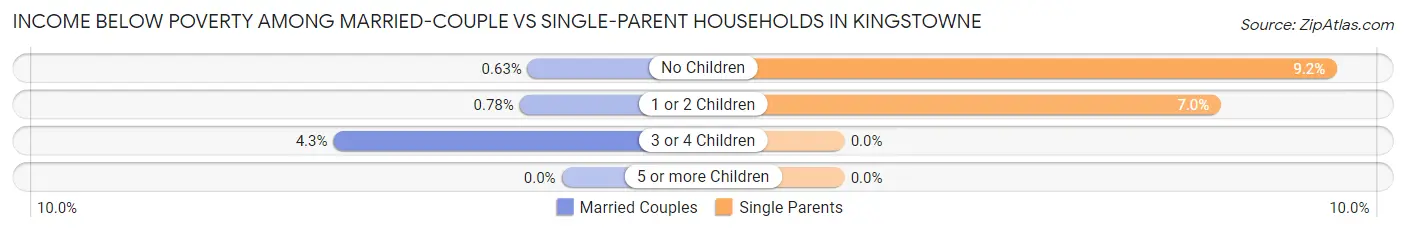
| Children | Married-Couple Families | Single-Parent Households |
| No Children | 11 (0.6%) | 34 (9.2%) |
| 1 or 2 Children | 11 (0.8%) | 43 (7.0%) |
| 3 or 4 Children | 11 (4.3%) | 0 (0.0%) |
| 5 or more Children | 0 (0.0%) | 0 (0.0%) |
| Total | 33 (1.0%) | 77 (7.2%) |
Race in Kingstowne
The most populous races in Kingstowne are White / Caucasian (9,421 | 51.7%), Black / African American (4,557 | 25.0%), and Asian (2,497 | 13.7%).
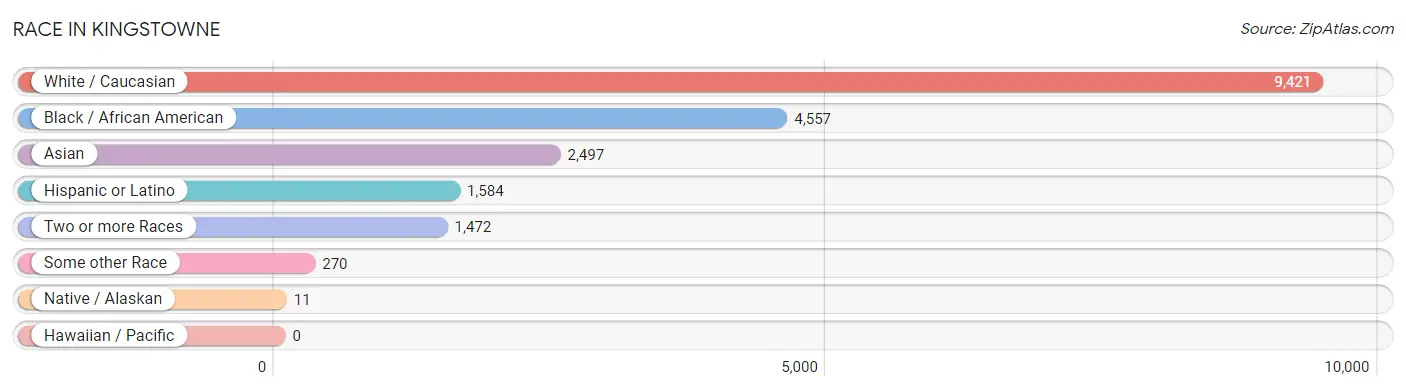
| Race | # Population | % Population |
| Asian | 2,497 | 13.7% |
| Black / African American | 4,557 | 25.0% |
| Hawaiian / Pacific | 0 | 0.0% |
| Hispanic or Latino | 1,584 | 8.7% |
| Native / Alaskan | 11 | 0.1% |
| White / Caucasian | 9,421 | 51.7% |
| Two or more Races | 1,472 | 8.1% |
| Some other Race | 270 | 1.5% |
| Total | 18,228 | 100.0% |
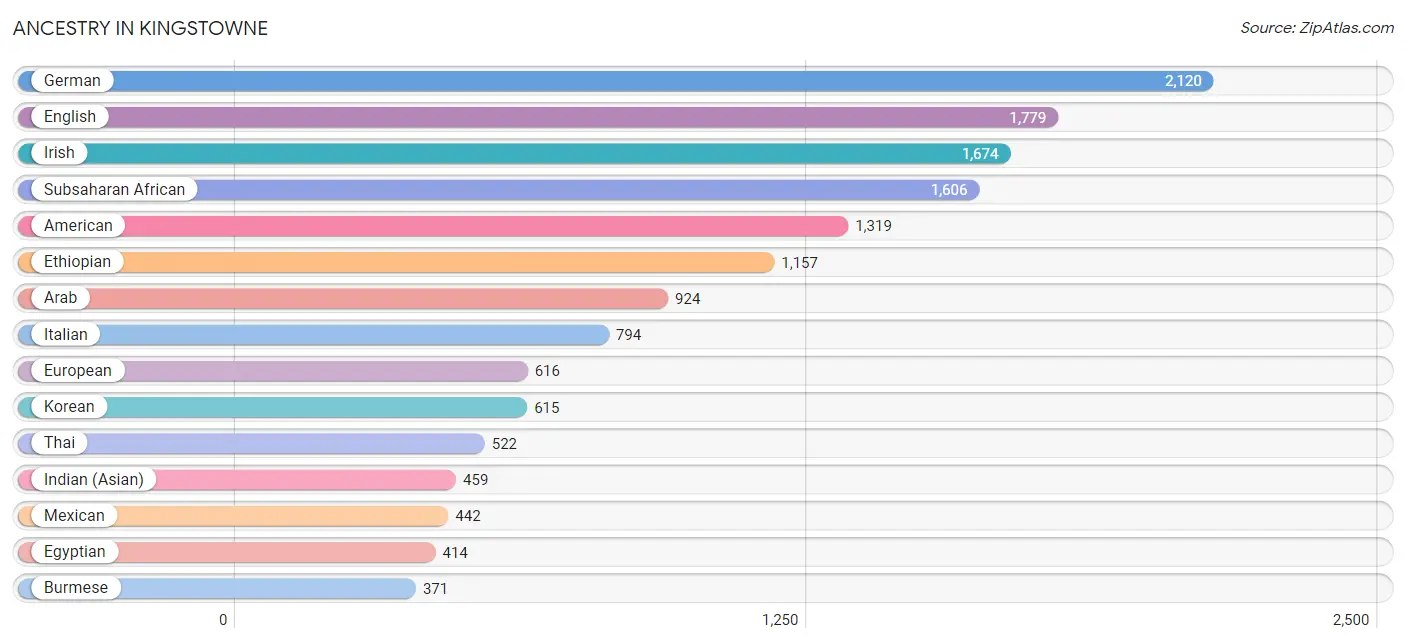
Ancestry in Kingstowne
The most populous ancestries reported in Kingstowne are German (2,120 | 11.6%), English (1,779 | 9.8%), Irish (1,674 | 9.2%), Subsaharan African (1,606 | 8.8%), and American (1,319 | 7.2%), together accounting for 46.6% of all Kingstowne residents.
| Ancestry | # Population | % Population |
| Afghan | 269 | 1.5% |
| African | 300 | 1.7% |
| Albanian | 122 | 0.7% |
| American | 1,319 | 7.2% |
| Arab | 924 | 5.1% |
| Argentinean | 70 | 0.4% |
| Armenian | 13 | 0.1% |
| Austrian | 75 | 0.4% |
| Barbadian | 23 | 0.1% |
| Belizean | 12 | 0.1% |
| Bhutanese | 240 | 1.3% |
| Brazilian | 10 | 0.1% |
| British | 144 | 0.8% |
| Bulgarian | 40 | 0.2% |
| Burmese | 371 | 2.0% |
| Canadian | 77 | 0.4% |
| Cape Verdean | 9 | 0.1% |
| Central American | 327 | 1.8% |
| Central American Indian | 31 | 0.2% |
| Cherokee | 11 | 0.1% |
| Chilean | 26 | 0.1% |
| Chinese | 25 | 0.1% |
| Colombian | 109 | 0.6% |
| Croatian | 41 | 0.2% |
| Cuban | 78 | 0.4% |
| Czech | 130 | 0.7% |
| Czechoslovakian | 128 | 0.7% |
| Danish | 59 | 0.3% |
| Dominican | 8 | 0.0% |
| Dutch | 215 | 1.2% |
| Eastern European | 73 | 0.4% |
| Ecuadorian | 48 | 0.3% |
| Egyptian | 414 | 2.3% |
| English | 1,779 | 9.8% |
| Ethiopian | 1,157 | 6.4% |
| European | 616 | 3.4% |
| Finnish | 8 | 0.0% |
| French | 328 | 1.8% |
| French Canadian | 36 | 0.2% |
| German | 2,120 | 11.6% |
| Ghanaian | 30 | 0.2% |
| Greek | 56 | 0.3% |
| Guatemalan | 144 | 0.8% |
| Haitian | 39 | 0.2% |
| Honduran | 74 | 0.4% |
| Hungarian | 70 | 0.4% |
| Indian (Asian) | 459 | 2.5% |
| Iranian | 41 | 0.2% |
| Iraqi | 74 | 0.4% |
| Irish | 1,674 | 9.2% |
| Israeli | 40 | 0.2% |
| Italian | 794 | 4.4% |
| Jamaican | 59 | 0.3% |
| Korean | 615 | 3.4% |
| Latvian | 11 | 0.1% |
| Lebanese | 82 | 0.4% |
| Lithuanian | 102 | 0.6% |
| Malaysian | 30 | 0.2% |
| Mexican | 442 | 2.4% |
| Moroccan | 257 | 1.4% |
| Native Hawaiian | 8 | 0.0% |
| Nicaraguan | 37 | 0.2% |
| Nigerian | 31 | 0.2% |
| Northern European | 15 | 0.1% |
| Norwegian | 85 | 0.5% |
| Palestinian | 14 | 0.1% |
| Panamanian | 33 | 0.2% |
| Peruvian | 32 | 0.2% |
| Polish | 351 | 1.9% |
| Puerto Rican | 225 | 1.2% |
| Romanian | 40 | 0.2% |
| Russian | 134 | 0.7% |
| Salvadoran | 39 | 0.2% |
| Scandinavian | 17 | 0.1% |
| Scotch-Irish | 244 | 1.3% |
| Scottish | 365 | 2.0% |
| Slavic | 17 | 0.1% |
| Slovak | 72 | 0.4% |
| Slovene | 29 | 0.2% |
| South African | 11 | 0.1% |
| South American | 329 | 1.8% |
| Spanish | 85 | 0.5% |
| Spanish American | 90 | 0.5% |
| Sri Lankan | 145 | 0.8% |
| Subsaharan African | 1,606 | 8.8% |
| Sudanese | 91 | 0.5% |
| Swedish | 113 | 0.6% |
| Swiss | 116 | 0.6% |
| Syrian | 46 | 0.3% |
| Thai | 522 | 2.9% |
| Turkish | 21 | 0.1% |
| Ukrainian | 149 | 0.8% |
| Venezuelan | 44 | 0.2% |
| Vietnamese | 13 | 0.1% |
| Welsh | 69 | 0.4% |
| Yugoslavian | 40 | 0.2% | View All 96 Rows |
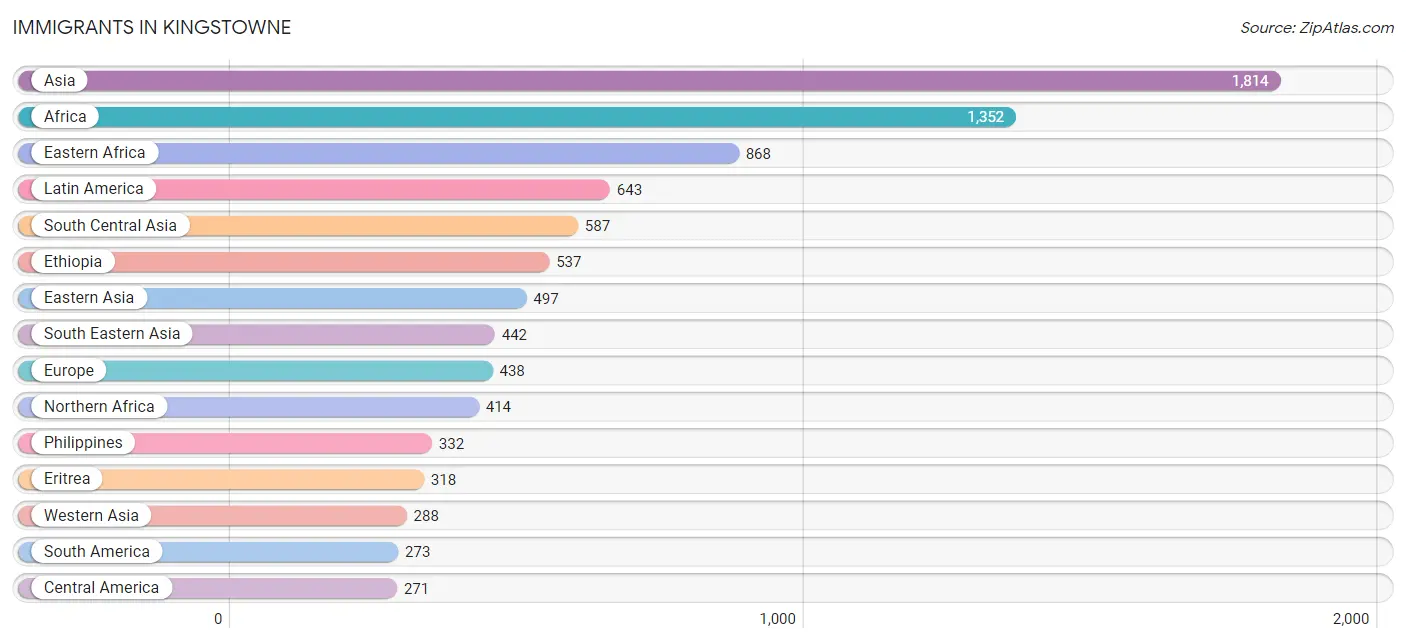
Immigrants in Kingstowne
The most numerous immigrant groups reported in Kingstowne came from Asia (1,814 | 10.0%), Africa (1,352 | 7.4%), Eastern Africa (868 | 4.8%), Latin America (643 | 3.5%), and South Central Asia (587 | 3.2%), together accounting for 28.9% of all Kingstowne residents.
| Immigration Origin | # Population | % Population |
| Afghanistan | 173 | 0.9% |
| Africa | 1,352 | 7.4% |
| Albania | 82 | 0.4% |
| Argentina | 79 | 0.4% |
| Armenia | 6 | 0.0% |
| Asia | 1,814 | 10.0% |
| Bangladesh | 13 | 0.1% |
| Barbados | 13 | 0.1% |
| Bolivia | 53 | 0.3% |
| Bosnia and Herzegovina | 23 | 0.1% |
| Brazil | 9 | 0.1% |
| Bulgaria | 24 | 0.1% |
| Canada | 106 | 0.6% |
| Caribbean | 99 | 0.5% |
| Central America | 271 | 1.5% |
| Chile | 26 | 0.1% |
| China | 231 | 1.3% |
| Colombia | 33 | 0.2% |
| Dominican Republic | 4 | 0.0% |
| Eastern Africa | 868 | 4.8% |
| Eastern Asia | 497 | 2.7% |
| Eastern Europe | 250 | 1.4% |
| Egypt | 182 | 1.0% |
| England | 16 | 0.1% |
| Eritrea | 318 | 1.7% |
| Ethiopia | 537 | 2.9% |
| Europe | 438 | 2.4% |
| France | 7 | 0.0% |
| Germany | 62 | 0.3% |
| Ghana | 70 | 0.4% |
| Greece | 5 | 0.0% |
| Guatemala | 71 | 0.4% |
| Haiti | 52 | 0.3% |
| Honduras | 33 | 0.2% |
| Hong Kong | 18 | 0.1% |
| India | 227 | 1.3% |
| Iraq | 108 | 0.6% |
| Israel | 40 | 0.2% |
| Jamaica | 30 | 0.2% |
| Japan | 86 | 0.5% |
| Kazakhstan | 15 | 0.1% |
| Korea | 180 | 1.0% |
| Laos | 30 | 0.2% |
| Latin America | 643 | 3.5% |
| Lebanon | 34 | 0.2% |
| Mexico | 120 | 0.7% |
| Morocco | 173 | 0.9% |
| Netherlands | 7 | 0.0% |
| Nicaragua | 37 | 0.2% |
| Northern Africa | 414 | 2.3% |
| Northern Europe | 107 | 0.6% |
| Pakistan | 146 | 0.8% |
| Panama | 10 | 0.1% |
| Peru | 48 | 0.3% |
| Philippines | 332 | 1.8% |
| Romania | 40 | 0.2% |
| Russia | 23 | 0.1% |
| Saudi Arabia | 24 | 0.1% |
| Scotland | 10 | 0.1% |
| Singapore | 10 | 0.1% |
| South America | 273 | 1.5% |
| South Central Asia | 587 | 3.2% |
| South Eastern Asia | 442 | 2.4% |
| Southern Europe | 5 | 0.0% |
| Sri Lanka | 13 | 0.1% |
| Sudan | 29 | 0.2% |
| Syria | 40 | 0.2% |
| Turkey | 8 | 0.0% |
| Ukraine | 23 | 0.1% |
| Venezuela | 25 | 0.1% |
| Vietnam | 70 | 0.4% |
| Western Africa | 70 | 0.4% |
| Western Asia | 288 | 1.6% |
| Western Europe | 76 | 0.4% | View All 74 Rows |
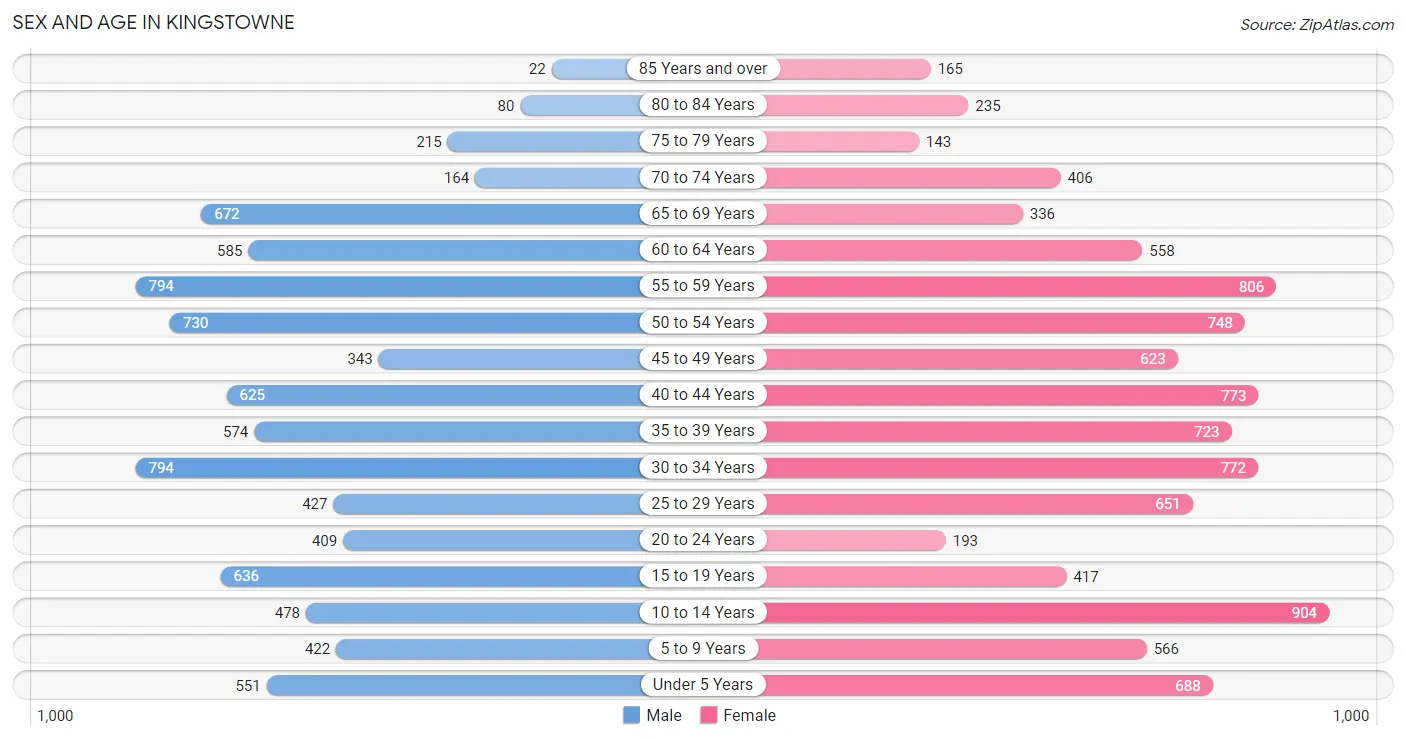
Sex and Age in Kingstowne
Sex and Age in Kingstowne
The most populous age groups in Kingstowne are 30 to 34 Years (794 | 9.3%) for men and 10 to 14 Years (904 | 9.3%) for women.
| Age Bracket | Male | Female |
| Under 5 Years | 551 (6.5%) | 688 (7.1%) |
| 5 to 9 Years | 422 (5.0%) | 566 (5.8%) |
| 10 to 14 Years | 478 (5.6%) | 904 (9.3%) |
| 15 to 19 Years | 636 (7.5%) | 417 (4.3%) |
| 20 to 24 Years | 409 (4.8%) | 193 (2.0%) |
| 25 to 29 Years | 427 (5.0%) | 651 (6.7%) |
| 30 to 34 Years | 794 (9.3%) | 772 (8.0%) |
| 35 to 39 Years | 574 (6.7%) | 723 (7.4%) |
| 40 to 44 Years | 625 (7.3%) | 773 (8.0%) |
| 45 to 49 Years | 343 (4.0%) | 623 (6.4%) |
| 50 to 54 Years | 730 (8.6%) | 748 (7.7%) |
| 55 to 59 Years | 794 (9.3%) | 806 (8.3%) |
| 60 to 64 Years | 585 (6.9%) | 558 (5.8%) |
| 65 to 69 Years | 672 (7.9%) | 336 (3.5%) |
| 70 to 74 Years | 164 (1.9%) | 406 (4.2%) |
| 75 to 79 Years | 215 (2.5%) | 143 (1.5%) |
| 80 to 84 Years | 80 (0.9%) | 235 (2.4%) |
| 85 Years and over | 22 (0.3%) | 165 (1.7%) |
| Total | 8,521 (100.0%) | 9,707 (100.0%) |
Families and Households in Kingstowne
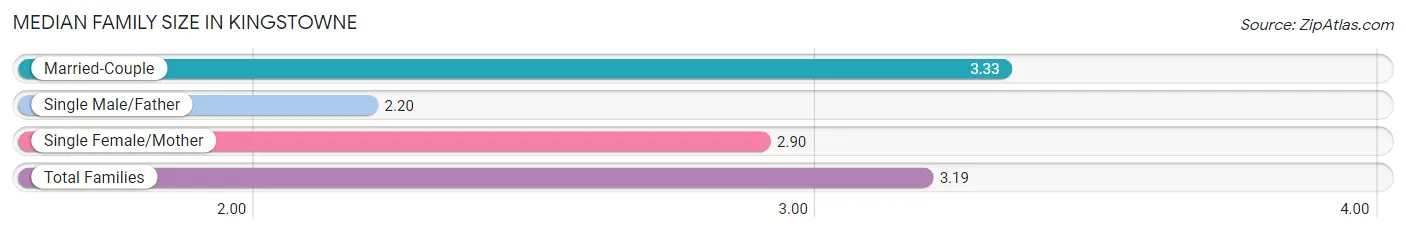
Median Family Size in Kingstowne
The median family size in Kingstowne is 3.19 persons per family, with married-couple families (3,410 | 76.1%) accounting for the largest median family size of 3.33 persons per family. On the other hand, single male/father families (207 | 4.6%) represent the smallest median family size with 2.20 persons per family.
| Family Type | # Families | Family Size |
| Married-Couple | 3,410 (76.1%) | 3.33 |
| Single Male/Father | 207 (4.6%) | 2.20 |
| Single Female/Mother | 864 (19.3%) | 2.90 |
| Total Families | 4,481 (100.0%) | 3.19 |
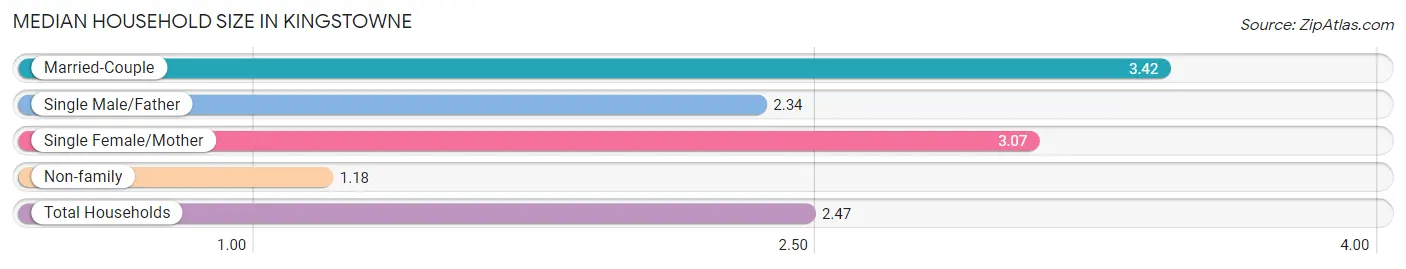
Median Household Size in Kingstowne
The median household size in Kingstowne is 2.47 persons per household, with married-couple households (3,410 | 46.2%) accounting for the largest median household size of 3.42 persons per household. non-family households (2,906 | 39.3%) represent the smallest median household size with 1.18 persons per household.
| Household Type | # Households | Household Size |
| Married-Couple | 3,410 (46.2%) | 3.42 |
| Single Male/Father | 207 (2.8%) | 2.34 |
| Single Female/Mother | 864 (11.7%) | 3.07 |
| Non-family | 2,906 (39.3%) | 1.18 |
| Total Households | 7,387 (100.0%) | 2.47 |
Household Size by Marriage Status in Kingstowne
Out of a total of 7,387 households in Kingstowne, 4,481 (60.7%) are family households, while 2,906 (39.3%) are nonfamily households. The most numerous type of family households are 2-person households, comprising 1,783, and the most common type of nonfamily households are 1-person households, comprising 2,417.
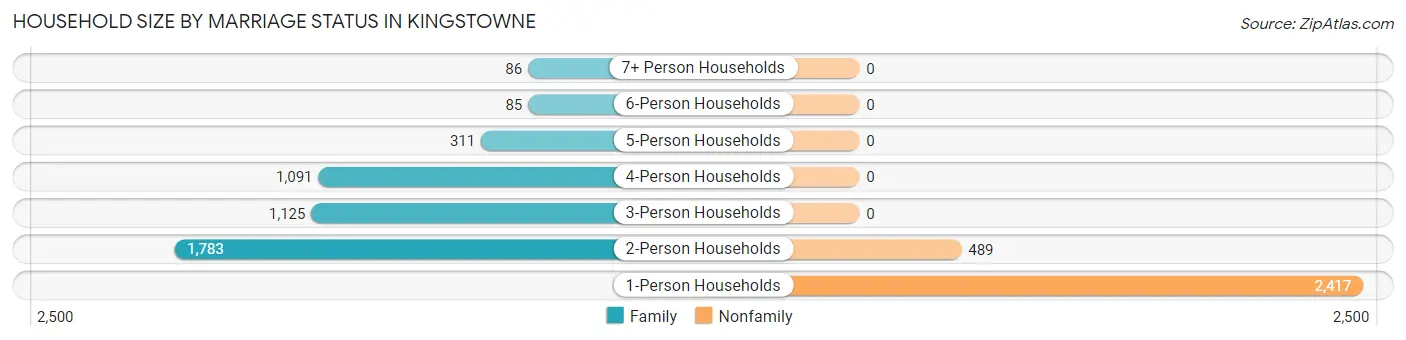
| Household Size | Family Households | Nonfamily Households |
| 1-Person Households | - | 2,417 (32.7%) |
| 2-Person Households | 1,783 (24.1%) | 489 (6.6%) |
| 3-Person Households | 1,125 (15.2%) | 0 (0.0%) |
| 4-Person Households | 1,091 (14.8%) | 0 (0.0%) |
| 5-Person Households | 311 (4.2%) | 0 (0.0%) |
| 6-Person Households | 85 (1.1%) | 0 (0.0%) |
| 7+ Person Households | 86 (1.2%) | 0 (0.0%) |
| Total | 4,481 (60.7%) | 2,906 (39.3%) |
Female Fertility in Kingstowne
Fertility by Age in Kingstowne
Average fertility rate in Kingstowne is 53.0 births per 1,000 women. Women in the age bracket of 20 to 34 years have the highest fertility rate with 76.0 births per 1,000 women. Women in the age bracket of 20 to 34 years acount for 54.4% of all women with births.
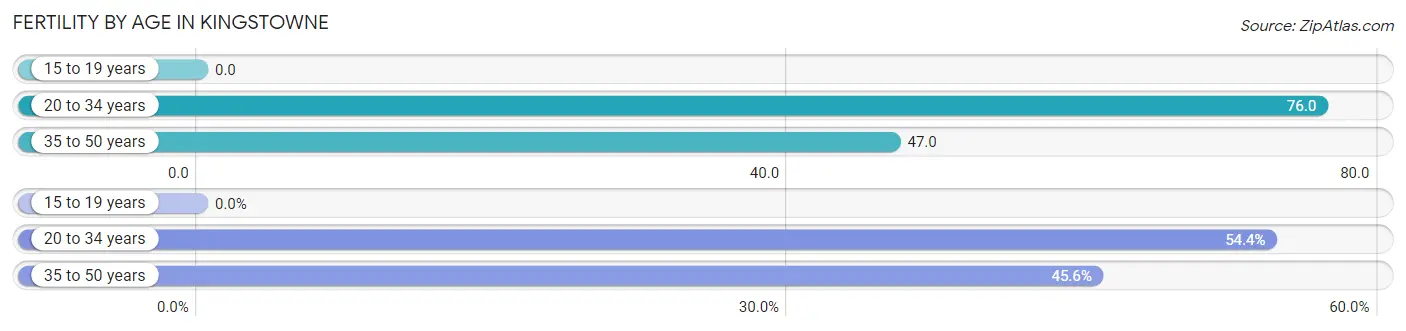
| Age Bracket | Women with Births | Births / 1,000 Women |
| 15 to 19 years | 0 (0.0%) | 0.0 |
| 20 to 34 years | 123 (54.4%) | 76.0 |
| 35 to 50 years | 103 (45.6%) | 47.0 |
| Total | 226 (100.0%) | 53.0 |
Fertility by Age by Marriage Status in Kingstowne
89.8% of women with births (226) in Kingstowne are married. The highest percentage of unmarried women with births falls into 35 to 50 years age bracket with 22.3% of them unmarried at the time of birth, while the lowest percentage of unmarried women with births belong to 20 to 34 years age bracket with 0.0% of them unmarried.
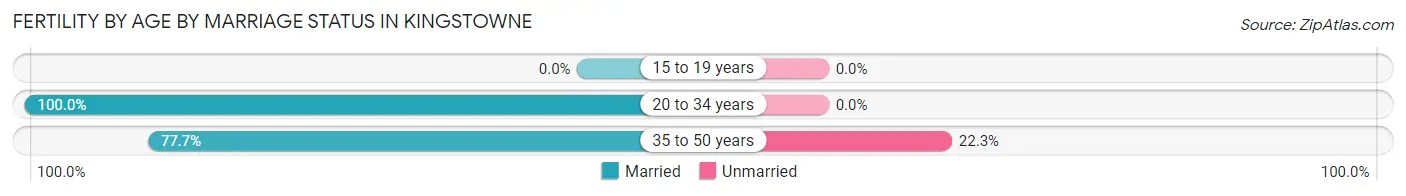
| Age Bracket | Married | Unmarried |
| 15 to 19 years | 0 (0.0%) | 0 (0.0%) |
| 20 to 34 years | 123 (100.0%) | 0 (0.0%) |
| 35 to 50 years | 80 (77.7%) | 23 (22.3%) |
| Total | 203 (89.8%) | 23 (10.2%) |
Fertility by Education in Kingstowne
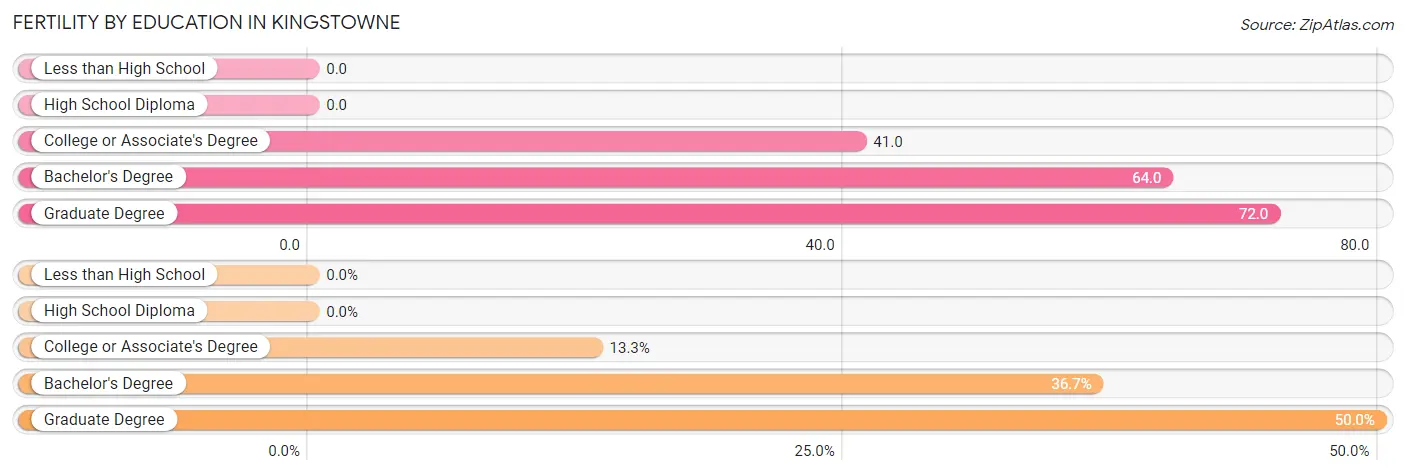
| Educational Attainment | Women with Births | Births / 1,000 Women |
| Less than High School | 0 (0.0%) | 0.0 |
| High School Diploma | 0 (0.0%) | 0.0 |
| College or Associate's Degree | 30 (13.3%) | 41.0 |
| Bachelor's Degree | 83 (36.7%) | 64.0 |
| Graduate Degree | 113 (50.0%) | 72.0 |
| Total | 226 (100.0%) | 53.0 |
Fertility by Education by Marriage Status in Kingstowne
10.2% of women with births in Kingstowne are unmarried. Women with the educational attainment of bachelor's degree are most likely to be married with 100.0% of them married at childbirth, while women with the educational attainment of college or associate's degree are least likely to be married with 76.7% of them unmarried at childbirth.
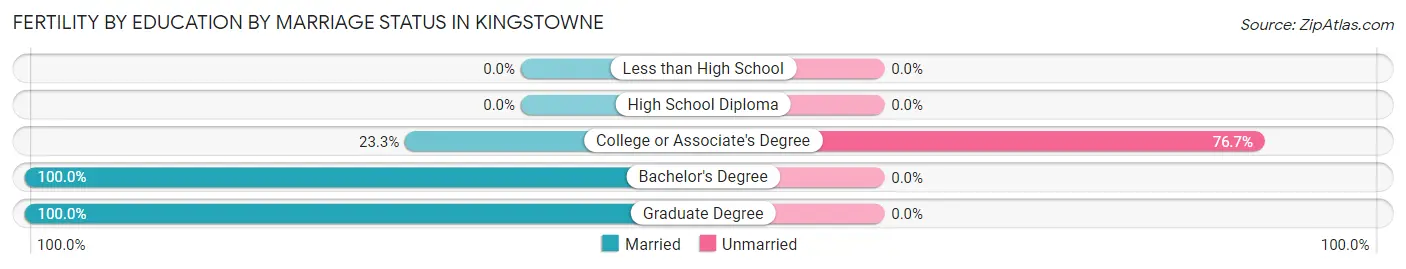
| Educational Attainment | Married | Unmarried |
| Less than High School | 0 (0.0%) | 0 (0.0%) |
| High School Diploma | 0 (0.0%) | 0 (0.0%) |
| College or Associate's Degree | 7 (23.3%) | 23 (76.7%) |
| Bachelor's Degree | 83 (100.0%) | 0 (0.0%) |
| Graduate Degree | 113 (100.0%) | 0 (0.0%) |
| Total | 203 (89.8%) | 23 (10.2%) |
Employment Characteristics in Kingstowne
Employment by Class of Employer in Kingstowne
Among the 10,037 employed individuals in Kingstowne, private company employees (4,388 | 43.7%), federal government employees (3,234 | 32.2%), and not-for-profit organizations (814 | 8.1%) make up the most common classes of employment.
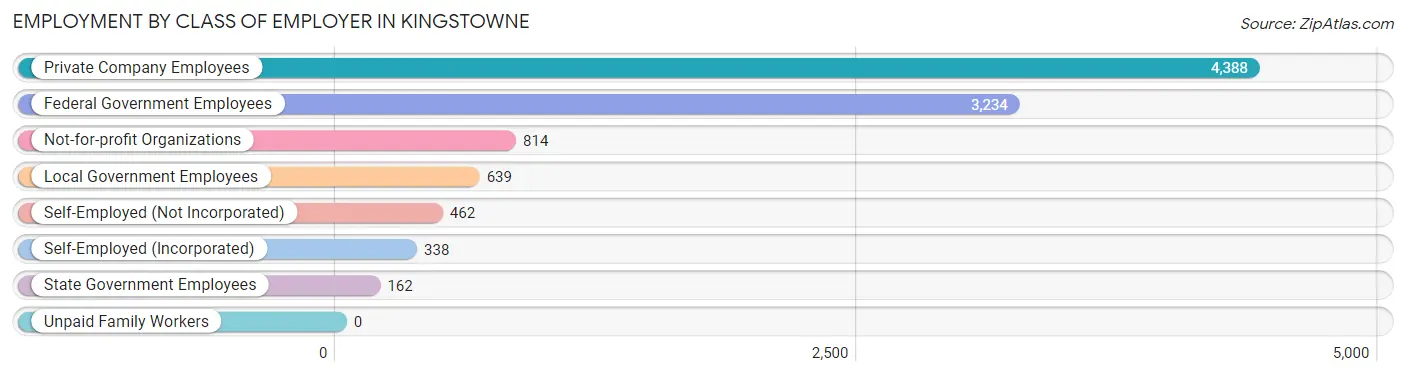
| Employer Class | # Employees | % Employees |
| Private Company Employees | 4,388 | 43.7% |
| Self-Employed (Incorporated) | 338 | 3.4% |
| Self-Employed (Not Incorporated) | 462 | 4.6% |
| Not-for-profit Organizations | 814 | 8.1% |
| Local Government Employees | 639 | 6.4% |
| State Government Employees | 162 | 1.6% |
| Federal Government Employees | 3,234 | 32.2% |
| Unpaid Family Workers | 0 | 0.0% |
| Total | 10,037 | 100.0% |
Employment Status by Age in Kingstowne
According to the labor force statistics for Kingstowne, out of the total population over 16 years of age (14,435), 72.7% or 10,494 individuals are in the labor force, with 3.2% or 336 of them unemployed. The age group with the highest labor force participation rate is 35 to 44 years, with 91.1% or 2,455 individuals in the labor force. Within the labor force, the 20 to 24 years age range has the highest percentage of unemployed individuals, with 17.0% or 78 of them being unemployed.
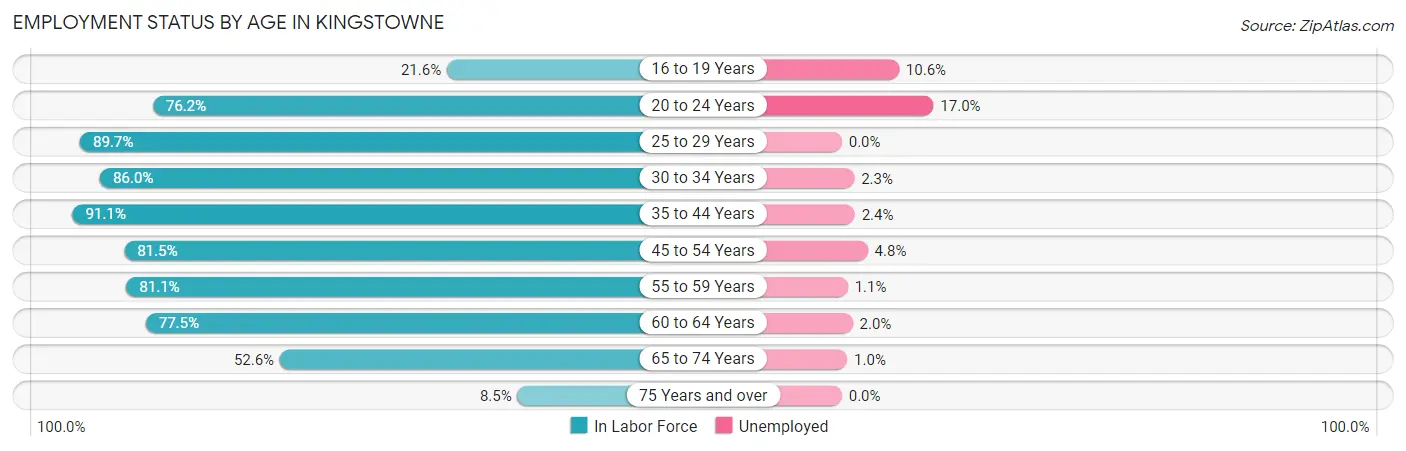
| Age Bracket | In Labor Force | Unemployed |
| 16 to 19 Years | 188 (21.6%) | 20 (10.6%) |
| 20 to 24 Years | 459 (76.2%) | 78 (17.0%) |
| 25 to 29 Years | 967 (89.7%) | 0 (0.0%) |
| 30 to 34 Years | 1,347 (86.0%) | 31 (2.3%) |
| 35 to 44 Years | 2,455 (91.1%) | 59 (2.4%) |
| 45 to 54 Years | 1,992 (81.5%) | 96 (4.8%) |
| 55 to 59 Years | 1,298 (81.1%) | 14 (1.1%) |
| 60 to 64 Years | 886 (77.5%) | 18 (2.0%) |
| 65 to 74 Years | 830 (52.6%) | 8 (1.0%) |
| 75 Years and over | 73 (8.5%) | 0 (0.0%) |
| Total | 10,494 (72.7%) | 336 (3.2%) |
Employment Status by Educational Attainment in Kingstowne
According to labor force statistics for Kingstowne, 85.0% of individuals (8,947) out of the total population between 25 and 64 years of age (10,526) are in the labor force, with 2.5% or 224 of them being unemployed. The group with the highest labor force participation rate are those with the educational attainment of bachelor's degree or higher, with 90.4% or 6,541 individuals in the labor force. Within the labor force, individuals with college / associate degree education have the highest percentage of unemployment, with 7.0% or 114 of them being unemployed.
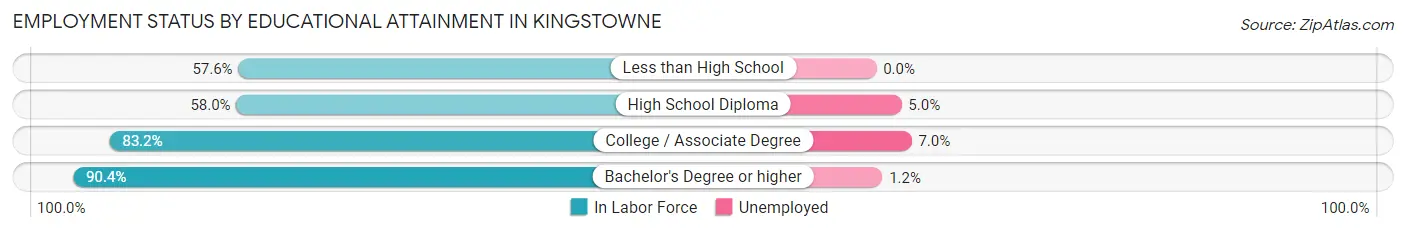
| Educational Attainment | In Labor Force | Unemployed |
| Less than High School | 121 (57.6%) | 0 (0.0%) |
| High School Diploma | 648 (58.0%) | 56 (5.0%) |
| College / Associate Degree | 1,633 (83.2%) | 137 (7.0%) |
| Bachelor's Degree or higher | 6,541 (90.4%) | 87 (1.2%) |
| Total | 8,947 (85.0%) | 263 (2.5%) |
Employment Occupations by Sex in Kingstowne
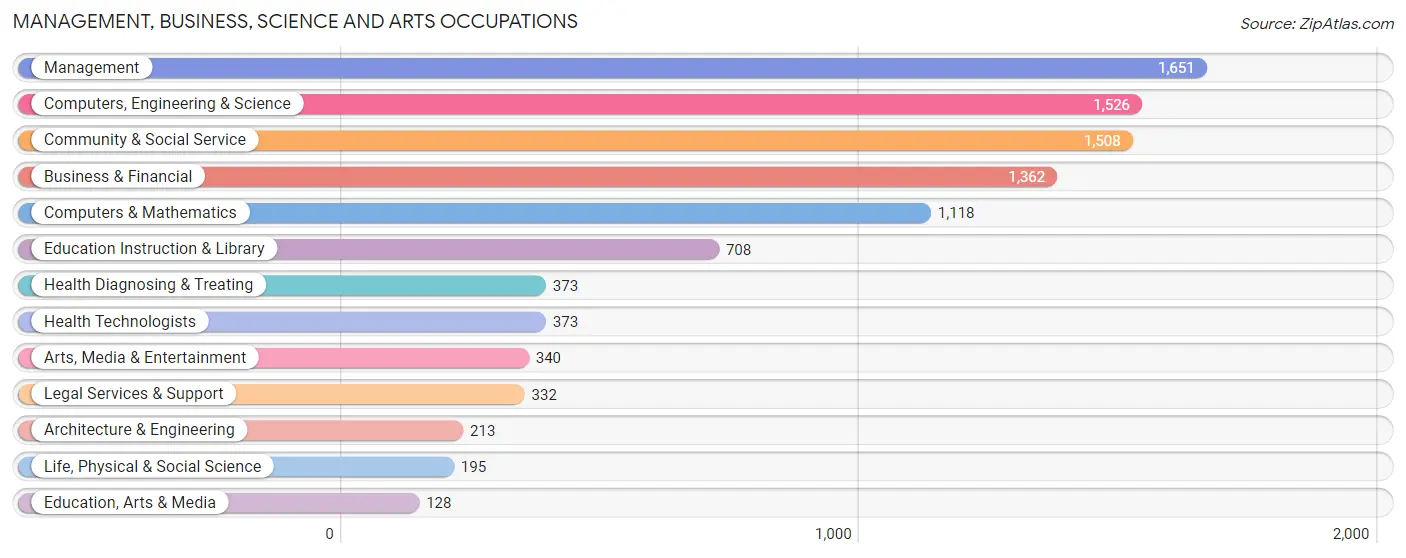
Management, Business, Science and Arts Occupations
The most common Management, Business, Science and Arts occupations in Kingstowne are Management (1,651 | 17.4%), Computers, Engineering & Science (1,526 | 16.1%), Community & Social Service (1,508 | 15.9%), Business & Financial (1,362 | 14.4%), and Computers & Mathematics (1,118 | 11.8%).
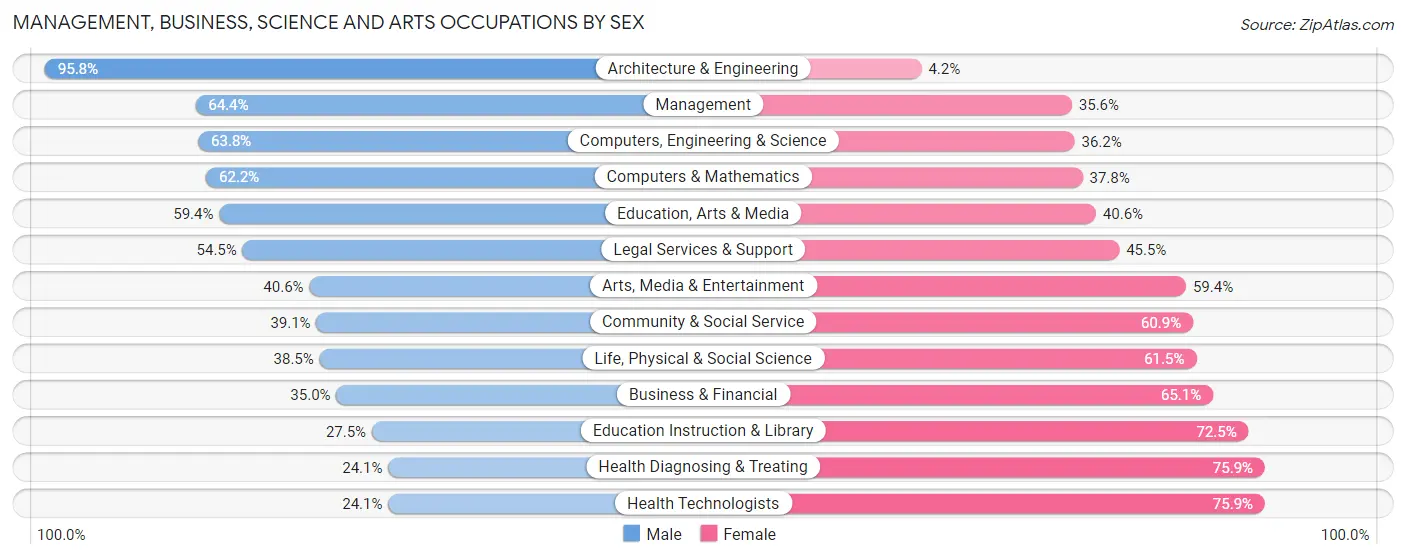
Management, Business, Science and Arts Occupations by Sex
Within the Management, Business, Science and Arts occupations in Kingstowne, the most male-oriented occupations are Architecture & Engineering (95.8%), Management (64.4%), and Computers, Engineering & Science (63.8%), while the most female-oriented occupations are Health Diagnosing & Treating (75.9%), Health Technologists (75.9%), and Education Instruction & Library (72.5%).
| Occupation | Male | Female |
| Management | 1,063 (64.4%) | 588 (35.6%) |
| Business & Financial | 476 (34.9%) | 886 (65.0%) |
| Computers, Engineering & Science | 974 (63.8%) | 552 (36.2%) |
| Computers & Mathematics | 695 (62.2%) | 423 (37.8%) |
| Architecture & Engineering | 204 (95.8%) | 9 (4.2%) |
| Life, Physical & Social Science | 75 (38.5%) | 120 (61.5%) |
| Community & Social Service | 590 (39.1%) | 918 (60.9%) |
| Education, Arts & Media | 76 (59.4%) | 52 (40.6%) |
| Legal Services & Support | 181 (54.5%) | 151 (45.5%) |
| Education Instruction & Library | 195 (27.5%) | 513 (72.5%) |
| Arts, Media & Entertainment | 138 (40.6%) | 202 (59.4%) |
| Health Diagnosing & Treating | 90 (24.1%) | 283 (75.9%) |
| Health Technologists | 90 (24.1%) | 283 (75.9%) |
| Total (Category) | 3,193 (49.7%) | 3,227 (50.3%) |
| Total (Overall) | 4,799 (50.6%) | 4,688 (49.4%) |
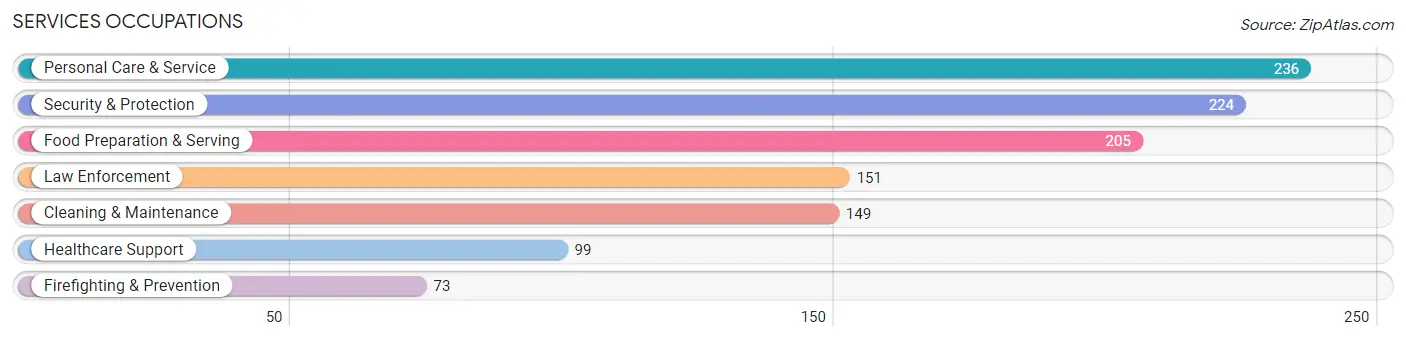
Services Occupations
The most common Services occupations in Kingstowne are Personal Care & Service (236 | 2.5%), Security & Protection (224 | 2.4%), Food Preparation & Serving (205 | 2.2%), Law Enforcement (151 | 1.6%), and Cleaning & Maintenance (149 | 1.6%).
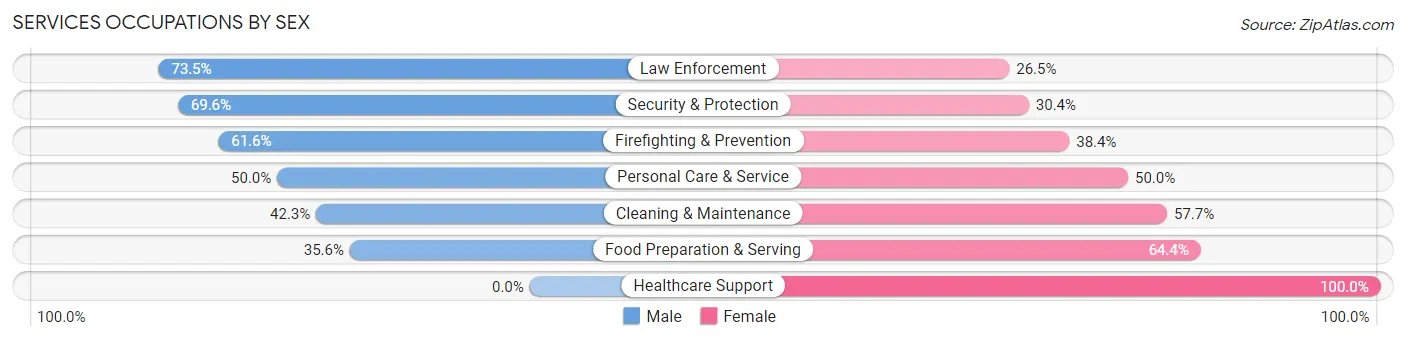
Services Occupations by Sex
Within the Services occupations in Kingstowne, the most male-oriented occupations are Law Enforcement (73.5%), Security & Protection (69.6%), and Firefighting & Prevention (61.6%), while the most female-oriented occupations are Healthcare Support (100.0%), Food Preparation & Serving (64.4%), and Cleaning & Maintenance (57.7%).
| Occupation | Male | Female |
| Healthcare Support | 0 (0.0%) | 99 (100.0%) |
| Security & Protection | 156 (69.6%) | 68 (30.4%) |
| Firefighting & Prevention | 45 (61.6%) | 28 (38.4%) |
| Law Enforcement | 111 (73.5%) | 40 (26.5%) |
| Food Preparation & Serving | 73 (35.6%) | 132 (64.4%) |
| Cleaning & Maintenance | 63 (42.3%) | 86 (57.7%) |
| Personal Care & Service | 118 (50.0%) | 118 (50.0%) |
| Total (Category) | 410 (44.9%) | 503 (55.1%) |
| Total (Overall) | 4,799 (50.6%) | 4,688 (49.4%) |
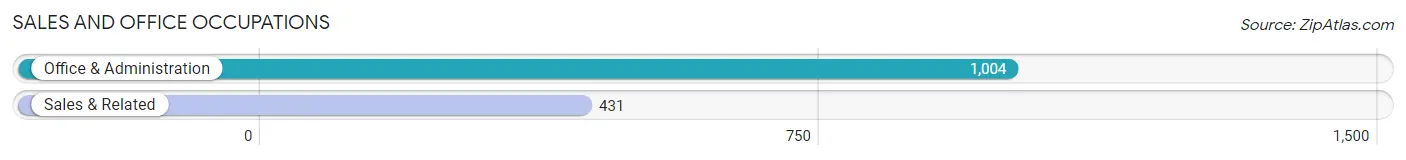
Sales and Office Occupations
The most common Sales and Office occupations in Kingstowne are Office & Administration (1,004 | 10.6%), and Sales & Related (431 | 4.5%).
Sales and Office Occupations by Sex
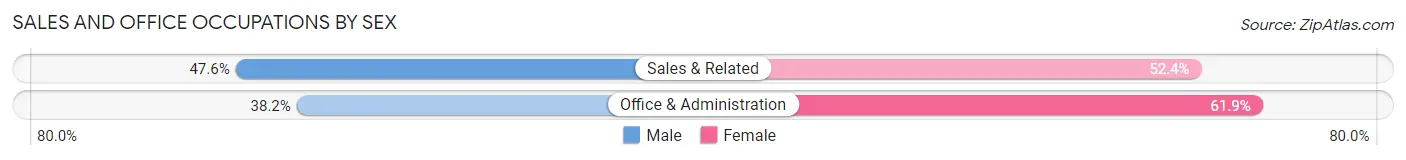
| Occupation | Male | Female |
| Sales & Related | 205 (47.6%) | 226 (52.4%) |
| Office & Administration | 383 (38.2%) | 621 (61.9%) |
| Total (Category) | 588 (41.0%) | 847 (59.0%) |
| Total (Overall) | 4,799 (50.6%) | 4,688 (49.4%) |
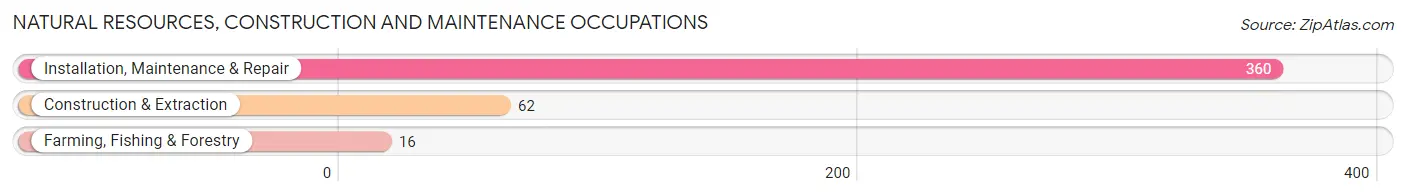
Natural Resources, Construction and Maintenance Occupations
The most common Natural Resources, Construction and Maintenance occupations in Kingstowne are Installation, Maintenance & Repair (360 | 3.8%), Construction & Extraction (62 | 0.6%), and Farming, Fishing & Forestry (16 | 0.2%).
Natural Resources, Construction and Maintenance Occupations by Sex
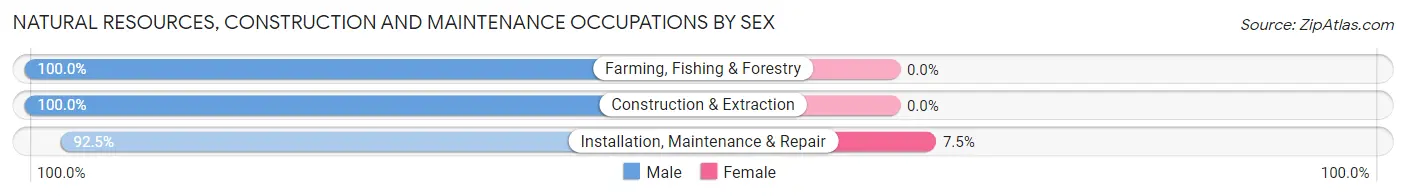
| Occupation | Male | Female |
| Farming, Fishing & Forestry | 16 (100.0%) | 0 (0.0%) |
| Construction & Extraction | 62 (100.0%) | 0 (0.0%) |
| Installation, Maintenance & Repair | 333 (92.5%) | 27 (7.5%) |
| Total (Category) | 411 (93.8%) | 27 (6.2%) |
| Total (Overall) | 4,799 (50.6%) | 4,688 (49.4%) |
Production, Transportation and Moving Occupations
The most common Production, Transportation and Moving occupations in Kingstowne are Transportation (203 | 2.1%), Production (64 | 0.7%), and Material Moving (14 | 0.2%).
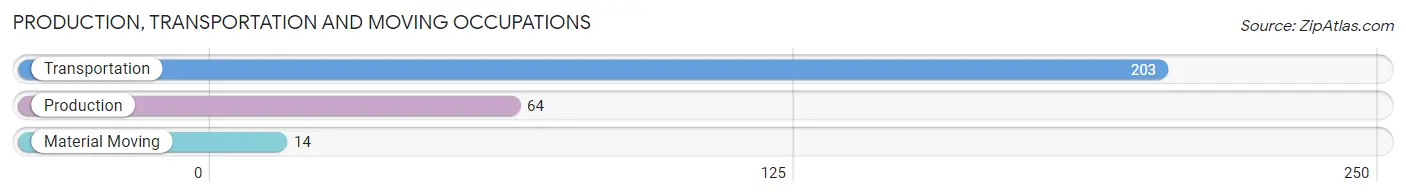
Production, Transportation and Moving Occupations by Sex
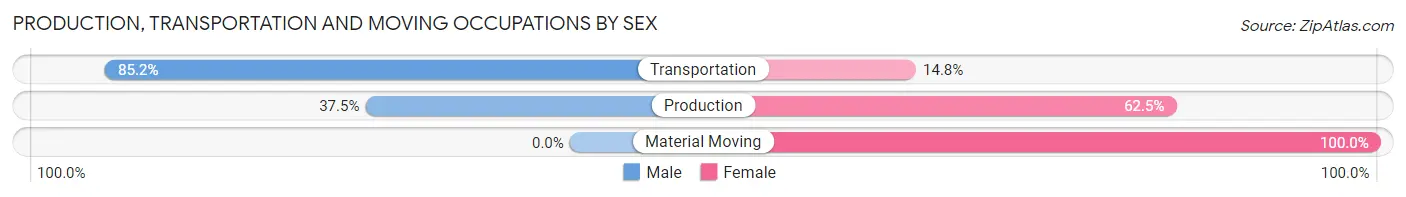
| Occupation | Male | Female |
| Production | 24 (37.5%) | 40 (62.5%) |
| Transportation | 173 (85.2%) | 30 (14.8%) |
| Material Moving | 0 (0.0%) | 14 (100.0%) |
| Total (Category) | 197 (70.1%) | 84 (29.9%) |
| Total (Overall) | 4,799 (50.6%) | 4,688 (49.4%) |
Employment Industries by Sex in Kingstowne
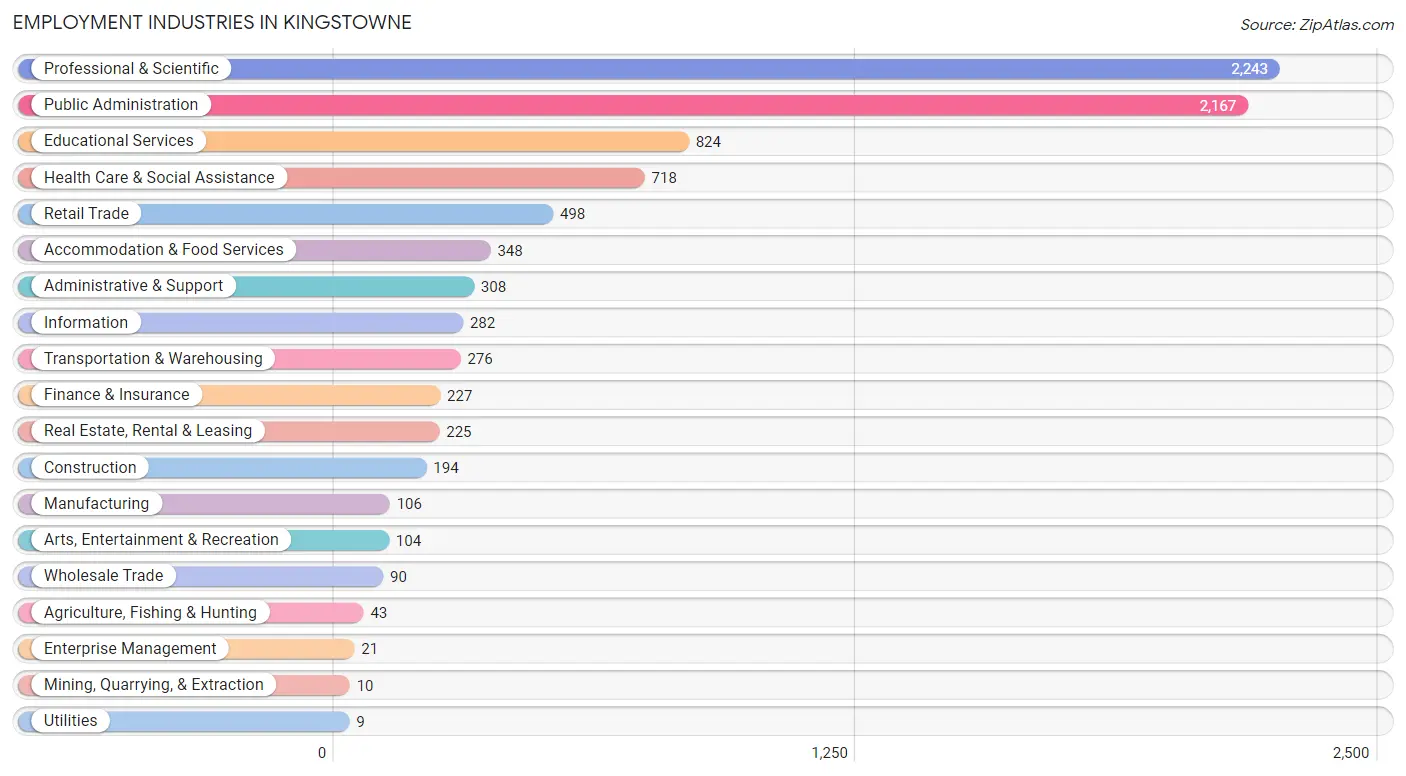
Employment Industries in Kingstowne
The major employment industries in Kingstowne include Professional & Scientific (2,243 | 23.6%), Public Administration (2,167 | 22.8%), Educational Services (824 | 8.7%), Health Care & Social Assistance (718 | 7.6%), and Retail Trade (498 | 5.2%).
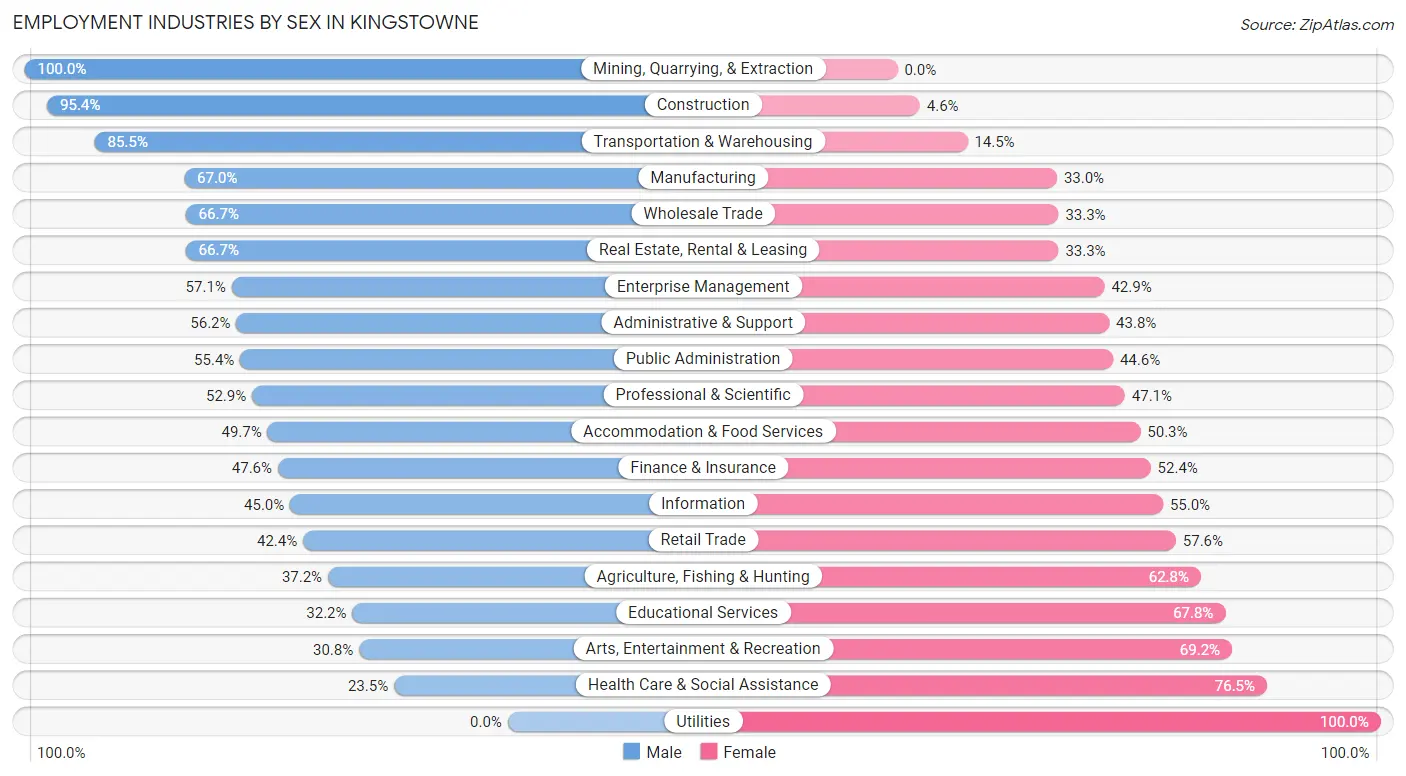
Employment Industries by Sex in Kingstowne
The Kingstowne industries that see more men than women are Mining, Quarrying, & Extraction (100.0%), Construction (95.4%), and Transportation & Warehousing (85.5%), whereas the industries that tend to have a higher number of women are Utilities (100.0%), Health Care & Social Assistance (76.5%), and Arts, Entertainment & Recreation (69.2%).
| Industry | Male | Female |
| Agriculture, Fishing & Hunting | 16 (37.2%) | 27 (62.8%) |
| Mining, Quarrying, & Extraction | 10 (100.0%) | 0 (0.0%) |
| Construction | 185 (95.4%) | 9 (4.6%) |
| Manufacturing | 71 (67.0%) | 35 (33.0%) |
| Wholesale Trade | 60 (66.7%) | 30 (33.3%) |
| Retail Trade | 211 (42.4%) | 287 (57.6%) |
| Transportation & Warehousing | 236 (85.5%) | 40 (14.5%) |
| Utilities | 0 (0.0%) | 9 (100.0%) |
| Information | 127 (45.0%) | 155 (55.0%) |
| Finance & Insurance | 108 (47.6%) | 119 (52.4%) |
| Real Estate, Rental & Leasing | 150 (66.7%) | 75 (33.3%) |
| Professional & Scientific | 1,187 (52.9%) | 1,056 (47.1%) |
| Enterprise Management | 12 (57.1%) | 9 (42.9%) |
| Administrative & Support | 173 (56.2%) | 135 (43.8%) |
| Educational Services | 265 (32.2%) | 559 (67.8%) |
| Health Care & Social Assistance | 169 (23.5%) | 549 (76.5%) |
| Arts, Entertainment & Recreation | 32 (30.8%) | 72 (69.2%) |
| Accommodation & Food Services | 173 (49.7%) | 175 (50.3%) |
| Public Administration | 1,200 (55.4%) | 967 (44.6%) |
| Total | 4,799 (50.6%) | 4,688 (49.4%) |
Education in Kingstowne
School Enrollment in Kingstowne
The most common levels of schooling among the 4,642 students in Kingstowne are middle school (1,222 | 26.3%), high school (967 | 20.8%), and college / undergraduate (766 | 16.5%).
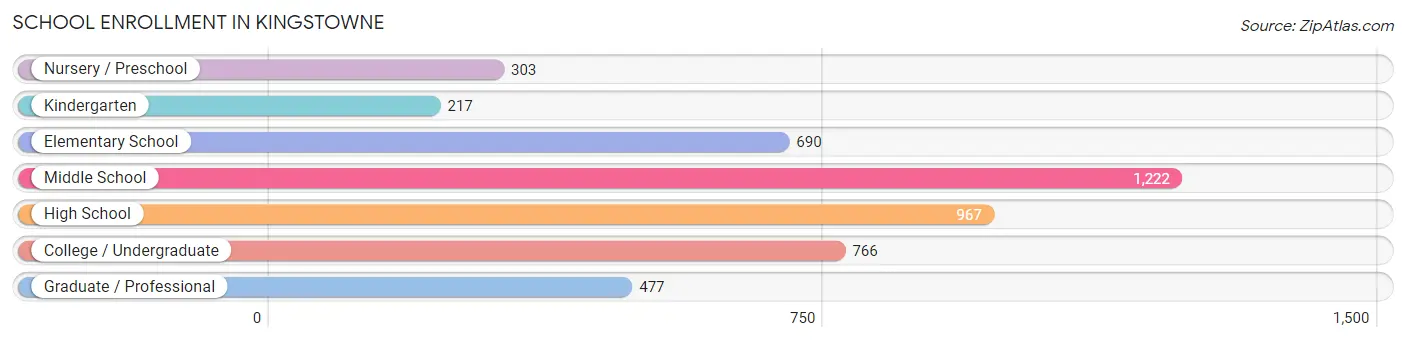
| School Level | # Students | % Students |
| Nursery / Preschool | 303 | 6.5% |
| Kindergarten | 217 | 4.7% |
| Elementary School | 690 | 14.9% |
| Middle School | 1,222 | 26.3% |
| High School | 967 | 20.8% |
| College / Undergraduate | 766 | 16.5% |
| Graduate / Professional | 477 | 10.3% |
| Total | 4,642 | 100.0% |
School Enrollment by Age by Funding Source in Kingstowne
Out of a total of 4,642 students who are enrolled in schools in Kingstowne, 673 (14.5%) attend a private institution, while the remaining 3,969 (85.5%) are enrolled in public schools. The age group of 3 to 4 year olds has the highest likelihood of being enrolled in private schools, with 110 (37.2% in the age bracket) enrolled. Conversely, the age group of 20 to 24 year olds has the lowest likelihood of being enrolled in a private school, with 328 (93.7% in the age bracket) attending a public institution.
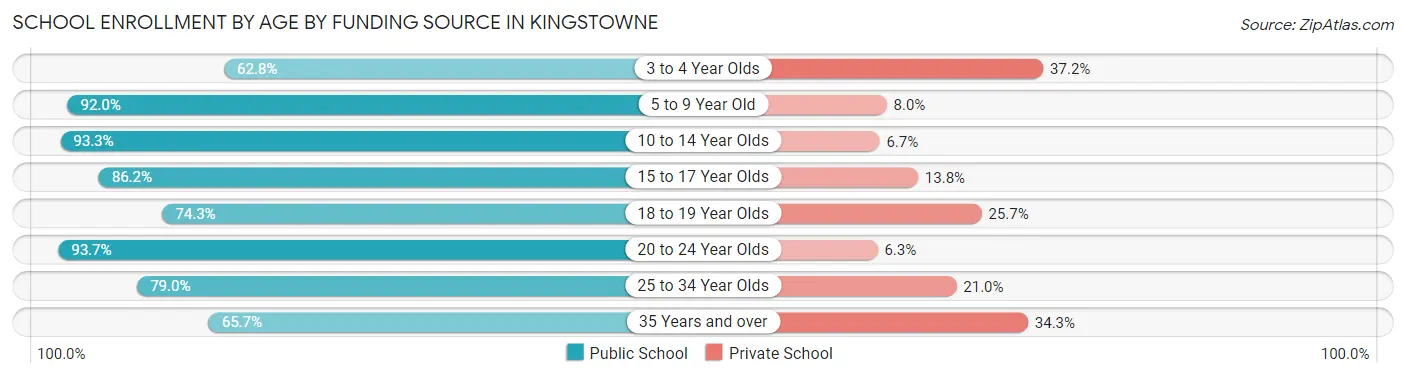
| Age Bracket | Public School | Private School |
| 3 to 4 Year Olds | 186 (62.8%) | 110 (37.2%) |
| 5 to 9 Year Old | 816 (92.0%) | 71 (8.0%) |
| 10 to 14 Year Olds | 1,274 (93.3%) | 91 (6.7%) |
| 15 to 17 Year Olds | 648 (86.2%) | 104 (13.8%) |
| 18 to 19 Year Olds | 191 (74.3%) | 66 (25.7%) |
| 20 to 24 Year Olds | 328 (93.7%) | 22 (6.3%) |
| 25 to 34 Year Olds | 256 (79.0%) | 68 (21.0%) |
| 35 Years and over | 270 (65.7%) | 141 (34.3%) |
| Total | 3,969 (85.5%) | 673 (14.5%) |
Educational Attainment by Field of Study in Kingstowne
Business (1,888 | 20.1%), social sciences (1,351 | 14.4%), engineering (796 | 8.5%), computers & mathematics (753 | 8.0%), and arts & humanities (722 | 7.7%) are the most common fields of study among 9,376 individuals in Kingstowne who have obtained a bachelor's degree or higher.
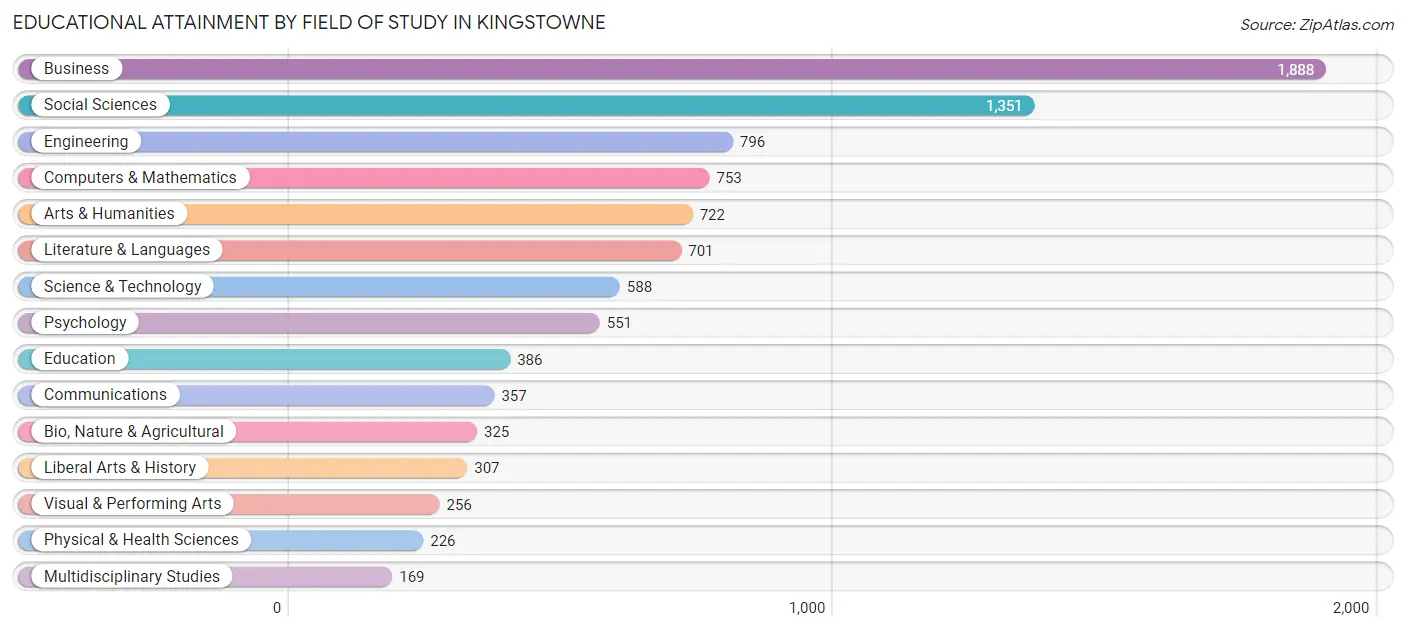
| Field of Study | # Graduates | % Graduates |
| Computers & Mathematics | 753 | 8.0% |
| Bio, Nature & Agricultural | 325 | 3.5% |
| Physical & Health Sciences | 226 | 2.4% |
| Psychology | 551 | 5.9% |
| Social Sciences | 1,351 | 14.4% |
| Engineering | 796 | 8.5% |
| Multidisciplinary Studies | 169 | 1.8% |
| Science & Technology | 588 | 6.3% |
| Business | 1,888 | 20.1% |
| Education | 386 | 4.1% |
| Literature & Languages | 701 | 7.5% |
| Liberal Arts & History | 307 | 3.3% |
| Visual & Performing Arts | 256 | 2.7% |
| Communications | 357 | 3.8% |
| Arts & Humanities | 722 | 7.7% |
| Total | 9,376 | 100.0% |
Transportation & Commute in Kingstowne
Vehicle Availability by Sex in Kingstowne
The most prevalent vehicle ownership categories in Kingstowne are males with 2 vehicles (2,942, accounting for 57.2%) and females with 2 vehicles (2,286, making up 60.2%).
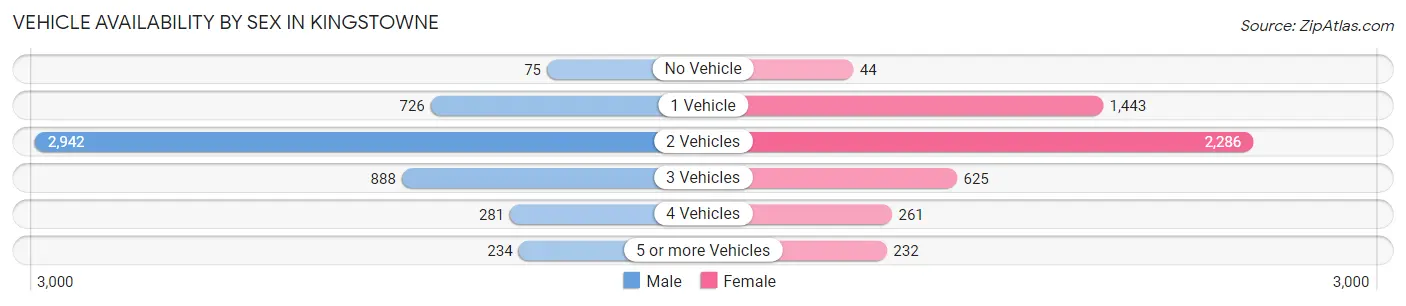
| Vehicles Available | Male | Female |
| No Vehicle | 75 (1.5%) | 44 (0.9%) |
| 1 Vehicle | 726 (14.1%) | 1,443 (29.5%) |
| 2 Vehicles | 2,942 (57.2%) | 2,286 (46.7%) |
| 3 Vehicles | 888 (17.3%) | 625 (12.8%) |
| 4 Vehicles | 281 (5.5%) | 261 (5.3%) |
| 5 or more Vehicles | 234 (4.5%) | 232 (4.7%) |
| Total | 5,146 (100.0%) | 4,891 (100.0%) |
Commute Time in Kingstowne
The most frequently occuring commute durations in Kingstowne are 30 to 34 minutes (1,262 commuters, 16.1%), 60 to 89 minutes (1,077 commuters, 13.7%), and 45 to 59 minutes (946 commuters, 12.1%).
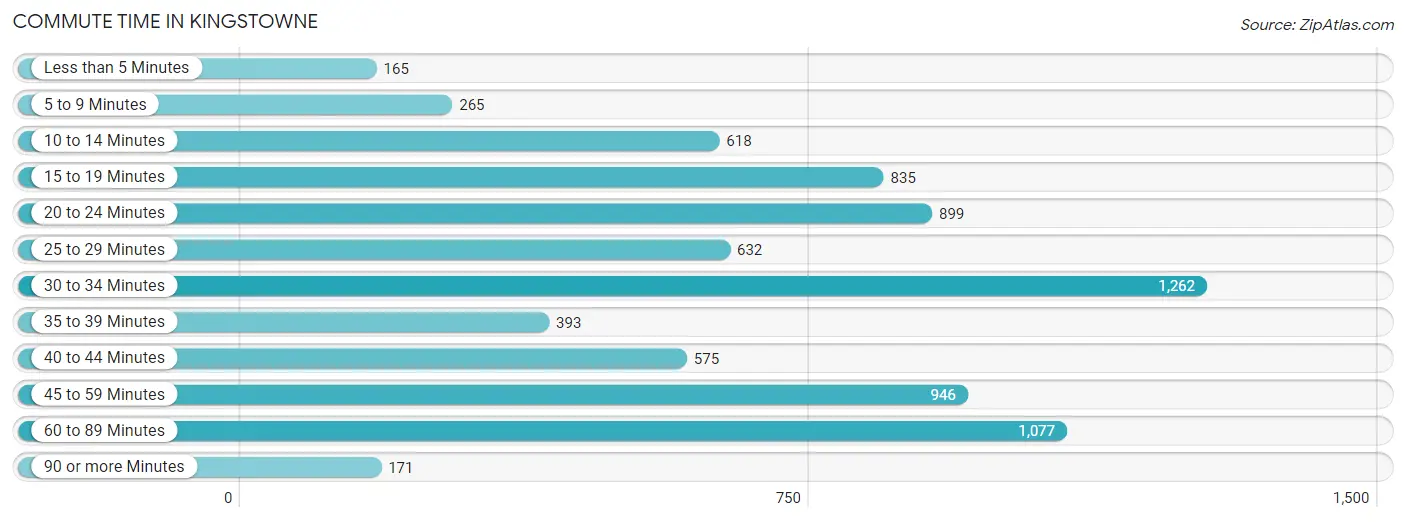
| Commute Time | # Commuters | % Commuters |
| Less than 5 Minutes | 165 | 2.1% |
| 5 to 9 Minutes | 265 | 3.4% |
| 10 to 14 Minutes | 618 | 7.9% |
| 15 to 19 Minutes | 835 | 10.6% |
| 20 to 24 Minutes | 899 | 11.5% |
| 25 to 29 Minutes | 632 | 8.1% |
| 30 to 34 Minutes | 1,262 | 16.1% |
| 35 to 39 Minutes | 393 | 5.0% |
| 40 to 44 Minutes | 575 | 7.3% |
| 45 to 59 Minutes | 946 | 12.1% |
| 60 to 89 Minutes | 1,077 | 13.7% |
| 90 or more Minutes | 171 | 2.2% |
Commute Time by Sex in Kingstowne
The most common commute times in Kingstowne are 60 to 89 minutes (805 commuters, 19.3%) for males and 30 to 34 minutes (712 commuters, 19.5%) for females.
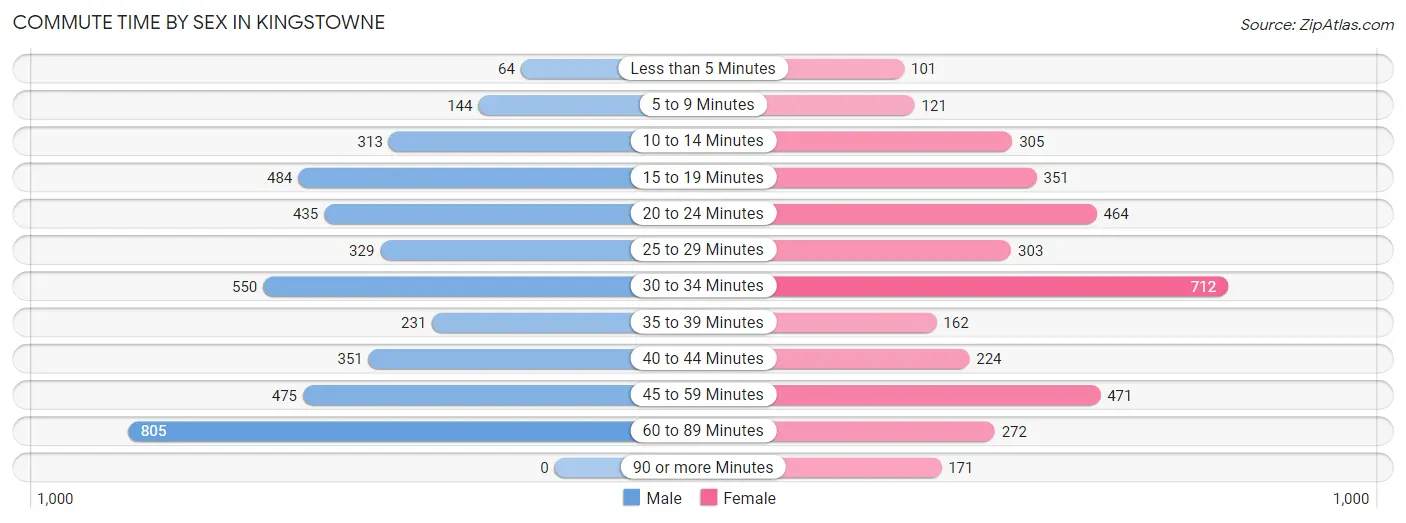
| Commute Time | Male | Female |
| Less than 5 Minutes | 64 (1.5%) | 101 (2.8%) |
| 5 to 9 Minutes | 144 (3.4%) | 121 (3.3%) |
| 10 to 14 Minutes | 313 (7.5%) | 305 (8.3%) |
| 15 to 19 Minutes | 484 (11.6%) | 351 (9.6%) |
| 20 to 24 Minutes | 435 (10.4%) | 464 (12.7%) |
| 25 to 29 Minutes | 329 (7.9%) | 303 (8.3%) |
| 30 to 34 Minutes | 550 (13.2%) | 712 (19.5%) |
| 35 to 39 Minutes | 231 (5.5%) | 162 (4.4%) |
| 40 to 44 Minutes | 351 (8.4%) | 224 (6.1%) |
| 45 to 59 Minutes | 475 (11.4%) | 471 (12.9%) |
| 60 to 89 Minutes | 805 (19.3%) | 272 (7.4%) |
| 90 or more Minutes | 0 (0.0%) | 171 (4.7%) |
Time of Departure to Work by Sex in Kingstowne
The most frequent times of departure to work in Kingstowne are 7:00 AM to 7:29 AM (748, 17.9%) for males and 8:00 AM to 8:29 AM (698, 19.1%) for females.
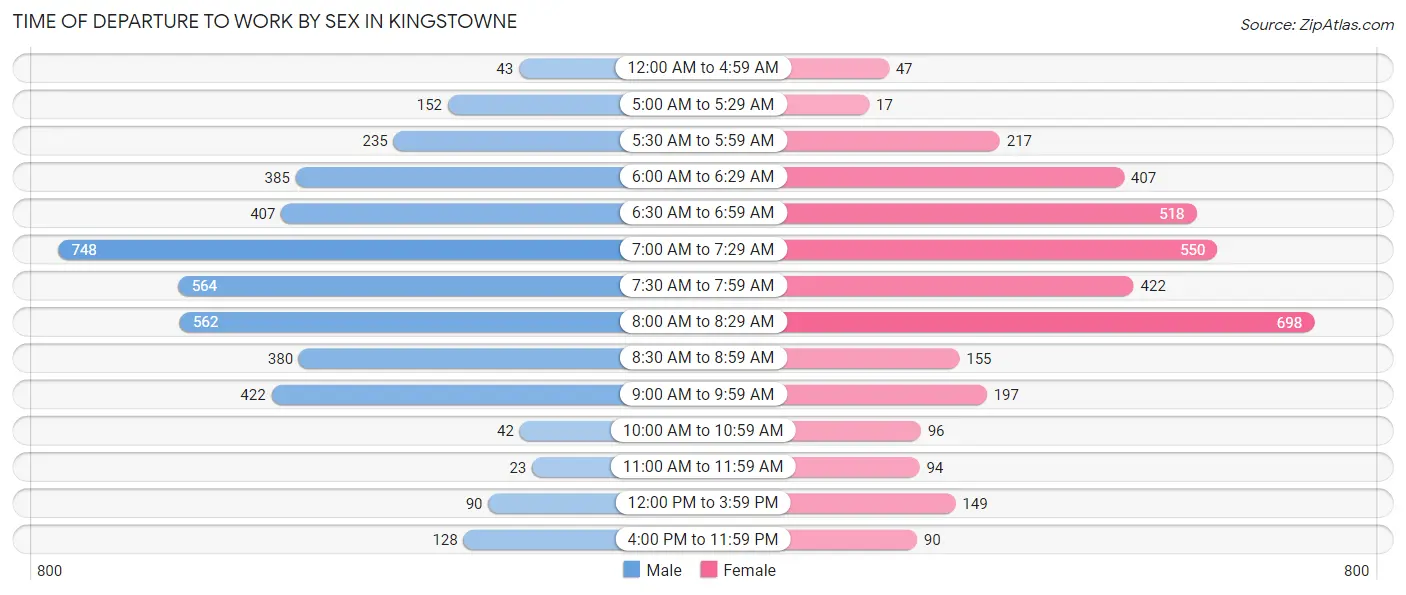
| Time of Departure | Male | Female |
| 12:00 AM to 4:59 AM | 43 (1.0%) | 47 (1.3%) |
| 5:00 AM to 5:29 AM | 152 (3.6%) | 17 (0.5%) |
| 5:30 AM to 5:59 AM | 235 (5.6%) | 217 (5.9%) |
| 6:00 AM to 6:29 AM | 385 (9.2%) | 407 (11.1%) |
| 6:30 AM to 6:59 AM | 407 (9.7%) | 518 (14.2%) |
| 7:00 AM to 7:29 AM | 748 (17.9%) | 550 (15.0%) |
| 7:30 AM to 7:59 AM | 564 (13.5%) | 422 (11.5%) |
| 8:00 AM to 8:29 AM | 562 (13.4%) | 698 (19.1%) |
| 8:30 AM to 8:59 AM | 380 (9.1%) | 155 (4.2%) |
| 9:00 AM to 9:59 AM | 422 (10.1%) | 197 (5.4%) |
| 10:00 AM to 10:59 AM | 42 (1.0%) | 96 (2.6%) |
| 11:00 AM to 11:59 AM | 23 (0.5%) | 94 (2.6%) |
| 12:00 PM to 3:59 PM | 90 (2.1%) | 149 (4.1%) |
| 4:00 PM to 11:59 PM | 128 (3.1%) | 90 (2.5%) |
| Total | 4,181 (100.0%) | 3,657 (100.0%) |
Housing Occupancy in Kingstowne
Occupancy by Ownership in Kingstowne
Of the total 7,387 dwellings in Kingstowne, owner-occupied units account for 5,075 (68.7%), while renter-occupied units make up 2,312 (31.3%).
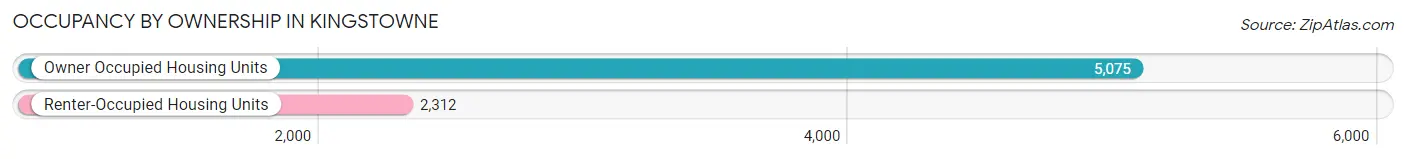
| Occupancy | # Housing Units | % Housing Units |
| Owner Occupied Housing Units | 5,075 | 68.7% |
| Renter-Occupied Housing Units | 2,312 | 31.3% |
| Total Occupied Housing Units | 7,387 | 100.0% |
Occupancy by Household Size in Kingstowne
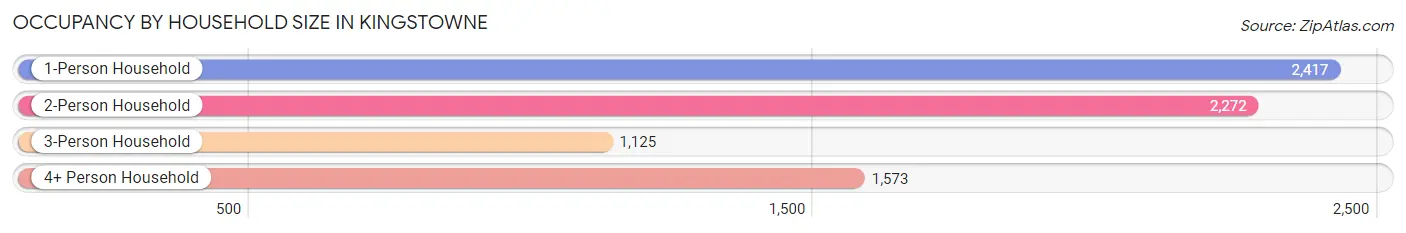
| Household Size | # Housing Units | % Housing Units |
| 1-Person Household | 2,417 | 32.7% |
| 2-Person Household | 2,272 | 30.8% |
| 3-Person Household | 1,125 | 15.2% |
| 4+ Person Household | 1,573 | 21.3% |
| Total Housing Units | 7,387 | 100.0% |
Occupancy by Ownership by Household Size in Kingstowne
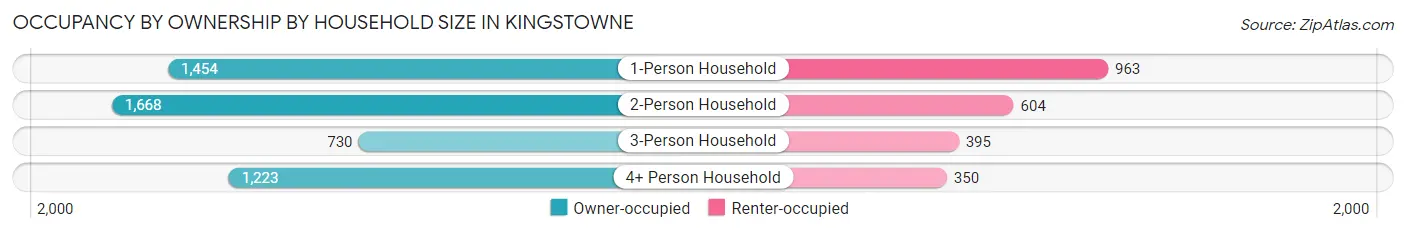
| Household Size | Owner-occupied | Renter-occupied |
| 1-Person Household | 1,454 (60.2%) | 963 (39.8%) |
| 2-Person Household | 1,668 (73.4%) | 604 (26.6%) |
| 3-Person Household | 730 (64.9%) | 395 (35.1%) |
| 4+ Person Household | 1,223 (77.7%) | 350 (22.3%) |
| Total Housing Units | 5,075 (68.7%) | 2,312 (31.3%) |
Occupancy by Educational Attainment in Kingstowne
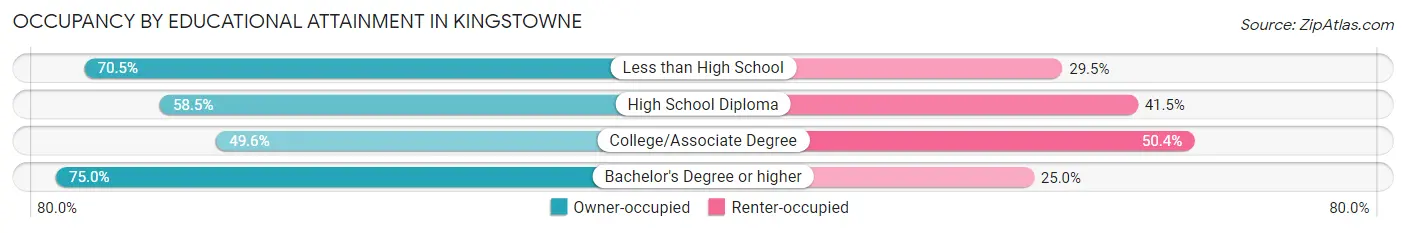
| Household Size | Owner-occupied | Renter-occupied |
| Less than High School | 148 (70.5%) | 62 (29.5%) |
| High School Diploma | 309 (58.5%) | 219 (41.5%) |
| College/Associate Degree | 718 (49.6%) | 730 (50.4%) |
| Bachelor's Degree or higher | 3,900 (75.0%) | 1,301 (25.0%) |
Occupancy by Age of Householder in Kingstowne
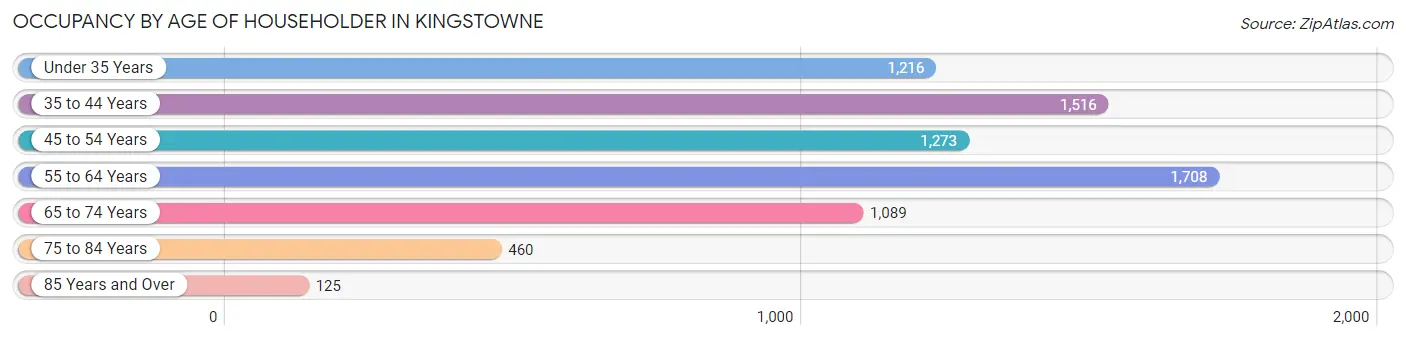
| Age Bracket | # Households | % Households |
| Under 35 Years | 1,216 | 16.5% |
| 35 to 44 Years | 1,516 | 20.5% |
| 45 to 54 Years | 1,273 | 17.2% |
| 55 to 64 Years | 1,708 | 23.1% |
| 65 to 74 Years | 1,089 | 14.7% |
| 75 to 84 Years | 460 | 6.2% |
| 85 Years and Over | 125 | 1.7% |
| Total | 7,387 | 100.0% |
Housing Finances in Kingstowne
Median Income by Occupancy in Kingstowne
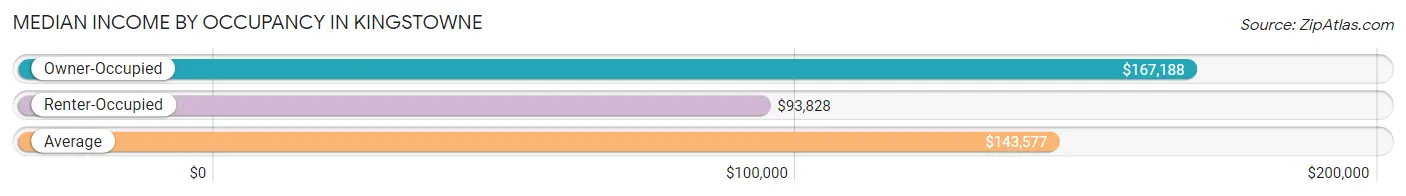
| Occupancy Type | # Households | Median Income |
| Owner-Occupied | 5,075 (68.7%) | $167,188 |
| Renter-Occupied | 2,312 (31.3%) | $93,828 |
| Average | 7,387 (100.0%) | $143,577 |
Occupancy by Householder Income Bracket in Kingstowne
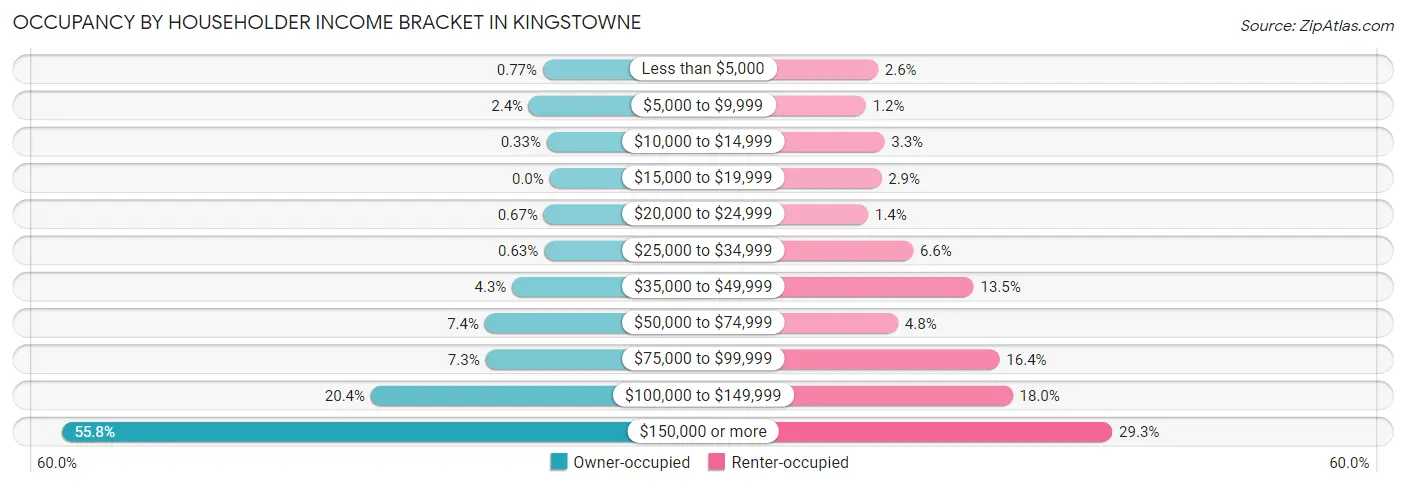
| Income Bracket | Owner-occupied | Renter-occupied |
| Less than $5,000 | 39 (0.8%) | 59 (2.5%) |
| $5,000 to $9,999 | 120 (2.4%) | 27 (1.2%) |
| $10,000 to $14,999 | 17 (0.3%) | 76 (3.3%) |
| $15,000 to $19,999 | 0 (0.0%) | 68 (2.9%) |
| $20,000 to $24,999 | 34 (0.7%) | 33 (1.4%) |
| $25,000 to $34,999 | 32 (0.6%) | 152 (6.6%) |
| $35,000 to $49,999 | 217 (4.3%) | 312 (13.5%) |
| $50,000 to $74,999 | 376 (7.4%) | 112 (4.8%) |
| $75,000 to $99,999 | 372 (7.3%) | 380 (16.4%) |
| $100,000 to $149,999 | 1,037 (20.4%) | 415 (17.9%) |
| $150,000 or more | 2,831 (55.8%) | 678 (29.3%) |
| Total | 5,075 (100.0%) | 2,312 (100.0%) |
Monthly Housing Cost Tiers in Kingstowne
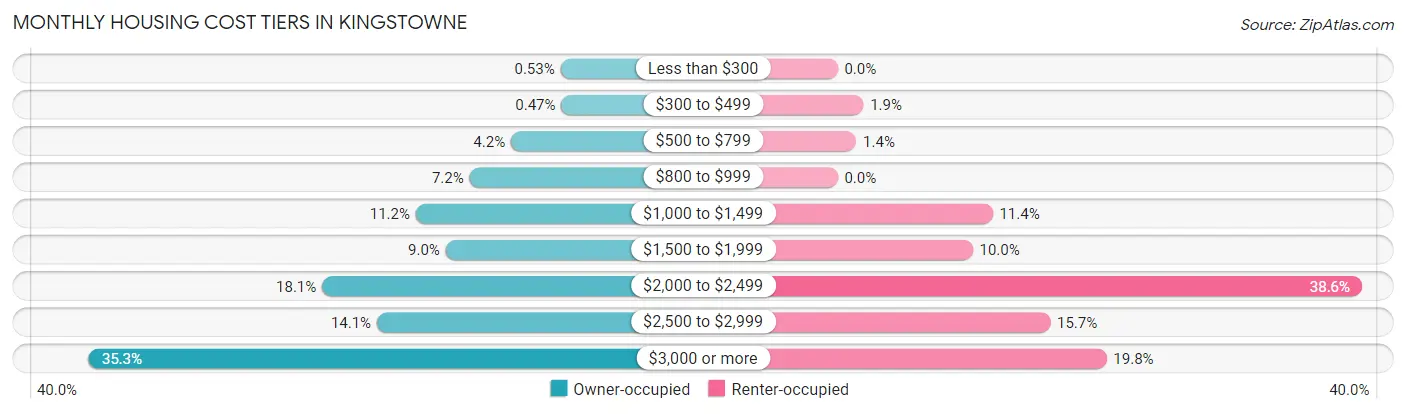
| Monthly Cost | Owner-occupied | Renter-occupied |
| Less than $300 | 27 (0.5%) | 0 (0.0%) |
| $300 to $499 | 24 (0.5%) | 44 (1.9%) |
| $500 to $799 | 212 (4.2%) | 32 (1.4%) |
| $800 to $999 | 367 (7.2%) | 0 (0.0%) |
| $1,000 to $1,499 | 568 (11.2%) | 264 (11.4%) |
| $1,500 to $1,999 | 456 (9.0%) | 230 (10.0%) |
| $2,000 to $2,499 | 918 (18.1%) | 893 (38.6%) |
| $2,500 to $2,999 | 713 (14.1%) | 362 (15.7%) |
| $3,000 or more | 1,790 (35.3%) | 458 (19.8%) |
| Total | 5,075 (100.0%) | 2,312 (100.0%) |
Physical Housing Characteristics in Kingstowne
Housing Structures in Kingstowne
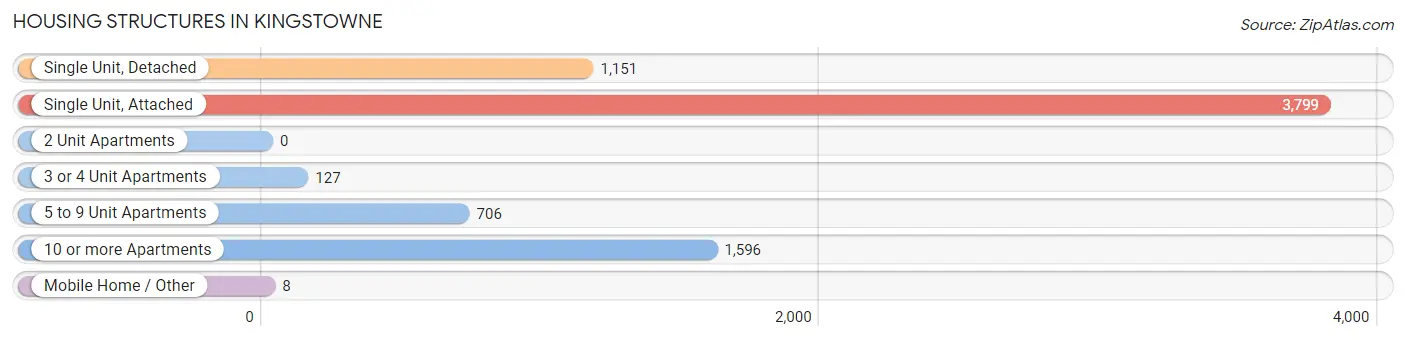
| Structure Type | # Housing Units | % Housing Units |
| Single Unit, Detached | 1,151 | 15.6% |
| Single Unit, Attached | 3,799 | 51.4% |
| 2 Unit Apartments | 0 | 0.0% |
| 3 or 4 Unit Apartments | 127 | 1.7% |
| 5 to 9 Unit Apartments | 706 | 9.6% |
| 10 or more Apartments | 1,596 | 21.6% |
| Mobile Home / Other | 8 | 0.1% |
| Total | 7,387 | 100.0% |
Housing Structures by Occupancy in Kingstowne
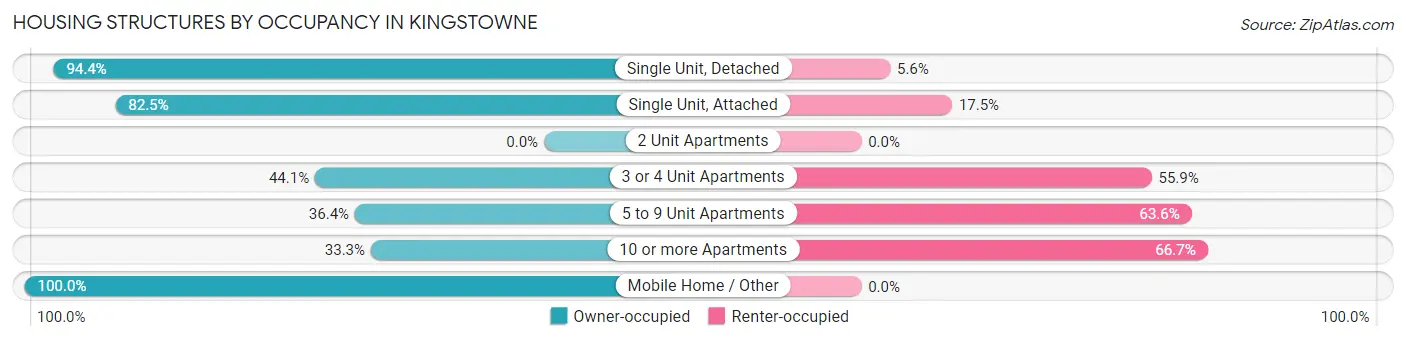
| Structure Type | Owner-occupied | Renter-occupied |
| Single Unit, Detached | 1,087 (94.4%) | 64 (5.6%) |
| Single Unit, Attached | 3,135 (82.5%) | 664 (17.5%) |
| 2 Unit Apartments | 0 (0.0%) | 0 (0.0%) |
| 3 or 4 Unit Apartments | 56 (44.1%) | 71 (55.9%) |
| 5 to 9 Unit Apartments | 257 (36.4%) | 449 (63.6%) |
| 10 or more Apartments | 532 (33.3%) | 1,064 (66.7%) |
| Mobile Home / Other | 8 (100.0%) | 0 (0.0%) |
| Total | 5,075 (68.7%) | 2,312 (31.3%) |
Housing Structures by Number of Rooms in Kingstowne
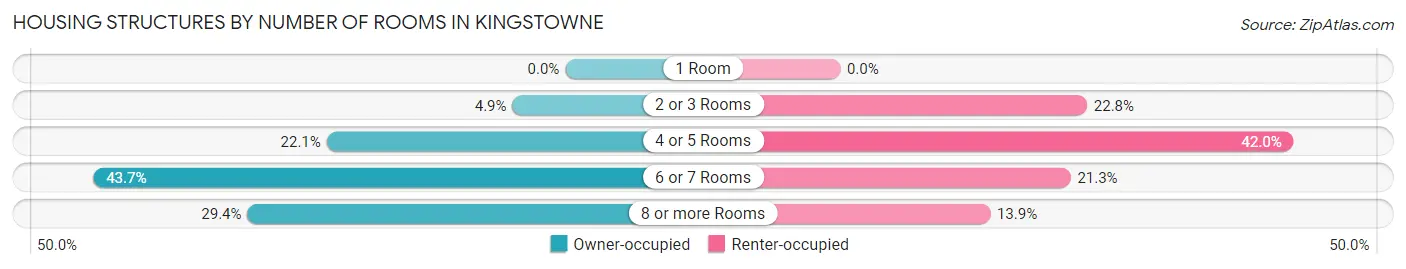
| Number of Rooms | Owner-occupied | Renter-occupied |
| 1 Room | 0 (0.0%) | 0 (0.0%) |
| 2 or 3 Rooms | 248 (4.9%) | 528 (22.8%) |
| 4 or 5 Rooms | 1,120 (22.1%) | 970 (42.0%) |
| 6 or 7 Rooms | 2,215 (43.6%) | 493 (21.3%) |
| 8 or more Rooms | 1,492 (29.4%) | 321 (13.9%) |
| Total | 5,075 (100.0%) | 2,312 (100.0%) |
Housing Structure by Heating Type in Kingstowne
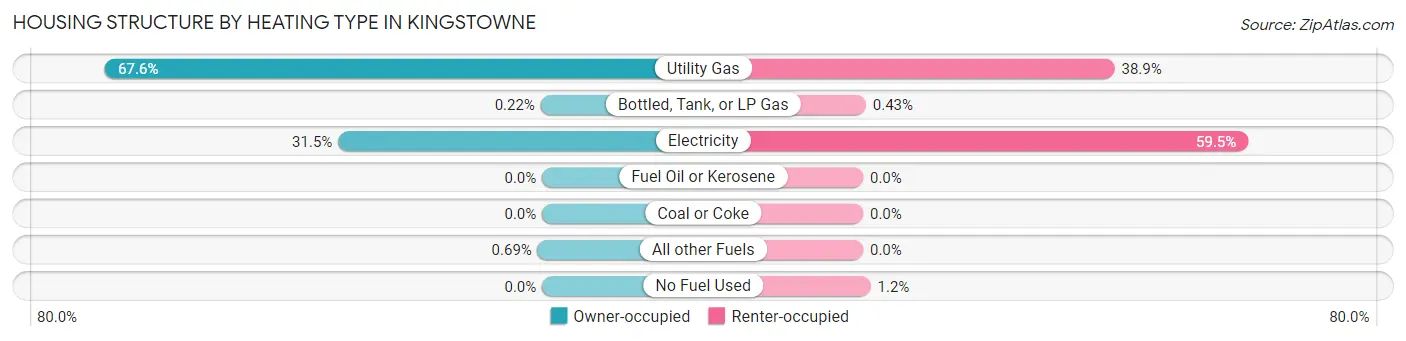
| Heating Type | Owner-occupied | Renter-occupied |
| Utility Gas | 3,429 (67.6%) | 899 (38.9%) |
| Bottled, Tank, or LP Gas | 11 (0.2%) | 10 (0.4%) |
| Electricity | 1,600 (31.5%) | 1,376 (59.5%) |
| Fuel Oil or Kerosene | 0 (0.0%) | 0 (0.0%) |
| Coal or Coke | 0 (0.0%) | 0 (0.0%) |
| All other Fuels | 35 (0.7%) | 0 (0.0%) |
| No Fuel Used | 0 (0.0%) | 27 (1.2%) |
| Total | 5,075 (100.0%) | 2,312 (100.0%) |
Household Vehicle Usage in Kingstowne
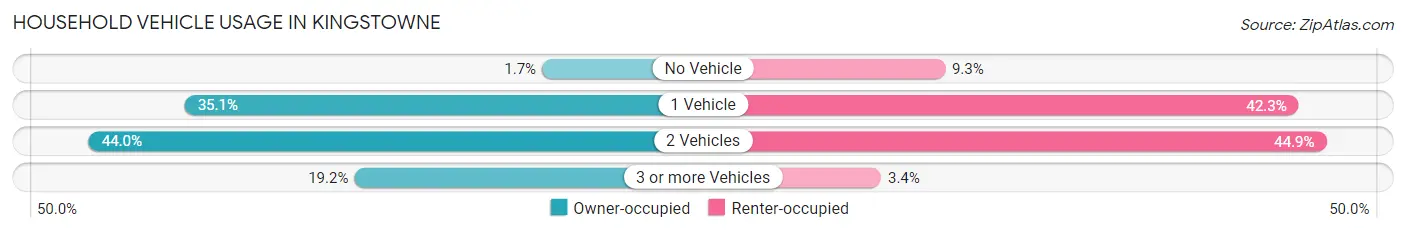
| Vehicles per Household | Owner-occupied | Renter-occupied |
| No Vehicle | 87 (1.7%) | 216 (9.3%) |
| 1 Vehicle | 1,779 (35.0%) | 979 (42.3%) |
| 2 Vehicles | 2,233 (44.0%) | 1,039 (44.9%) |
| 3 or more Vehicles | 976 (19.2%) | 78 (3.4%) |
| Total | 5,075 (100.0%) | 2,312 (100.0%) |
Real Estate & Mortgages in Kingstowne
Real Estate and Mortgage Overview in Kingstowne
| Characteristic | Without Mortgage | With Mortgage |
| Housing Units | 952 | 4,123 |
| Median Property Value | $547,700 | $593,100 |
| Median Household Income | $164,063 | $2,324 |
| Monthly Housing Costs | $942 | $1,790 |
| Real Estate Taxes | $5,732 | $39 |
Property Value by Mortgage Status in Kingstowne
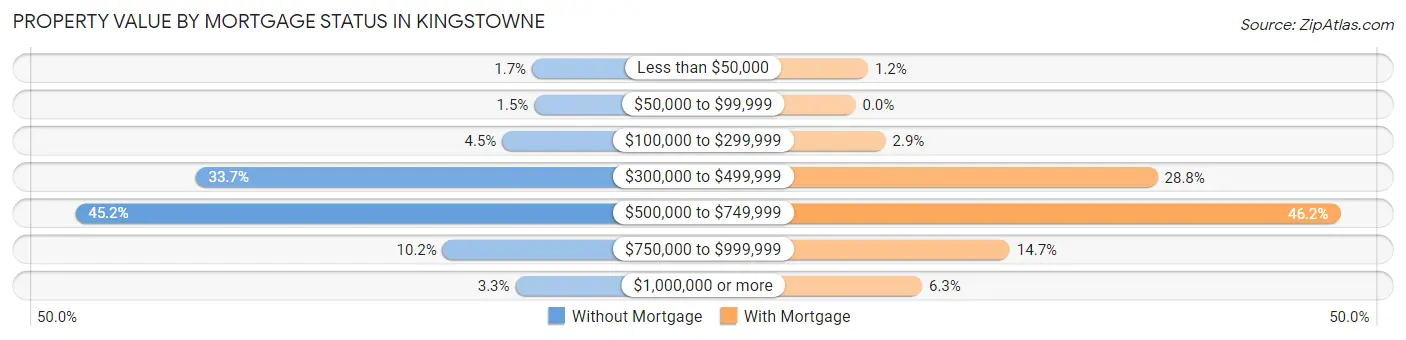
| Property Value | Without Mortgage | With Mortgage |
| Less than $50,000 | 16 (1.7%) | 49 (1.2%) |
| $50,000 to $99,999 | 14 (1.5%) | 0 (0.0%) |
| $100,000 to $299,999 | 43 (4.5%) | 118 (2.9%) |
| $300,000 to $499,999 | 321 (33.7%) | 1,186 (28.8%) |
| $500,000 to $749,999 | 430 (45.2%) | 1,903 (46.2%) |
| $750,000 to $999,999 | 97 (10.2%) | 606 (14.7%) |
| $1,000,000 or more | 31 (3.3%) | 261 (6.3%) |
| Total | 952 (100.0%) | 4,123 (100.0%) |
Household Income by Mortgage Status in Kingstowne
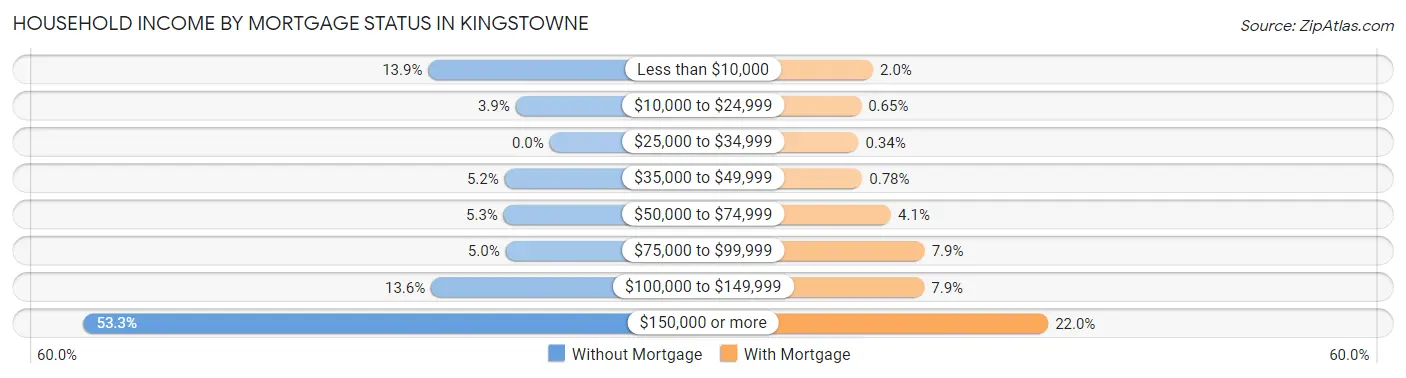
| Household Income | Without Mortgage | With Mortgage |
| Less than $10,000 | 132 (13.9%) | 83 (2.0%) |
| $10,000 to $24,999 | 37 (3.9%) | 27 (0.6%) |
| $25,000 to $34,999 | 0 (0.0%) | 14 (0.3%) |
| $35,000 to $49,999 | 49 (5.1%) | 32 (0.8%) |
| $50,000 to $74,999 | 50 (5.2%) | 168 (4.1%) |
| $75,000 to $99,999 | 48 (5.0%) | 326 (7.9%) |
| $100,000 to $149,999 | 129 (13.6%) | 324 (7.9%) |
| $150,000 or more | 507 (53.3%) | 908 (22.0%) |
| Total | 952 (100.0%) | 4,123 (100.0%) |
Property Value to Household Income Ratio in Kingstowne
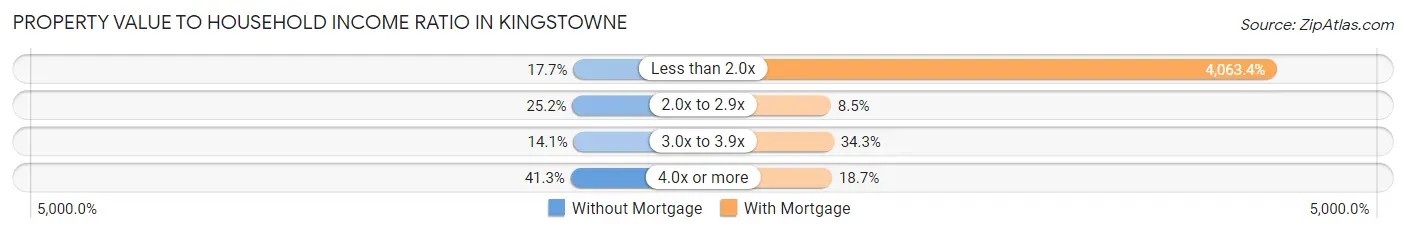
| Value-to-Income Ratio | Without Mortgage | With Mortgage |
| Less than 2.0x | 168 (17.6%) | 167,533 (4,063.4%) |
| 2.0x to 2.9x | 240 (25.2%) | 352 (8.5%) |
| 3.0x to 3.9x | 134 (14.1%) | 1,413 (34.3%) |
| 4.0x or more | 393 (41.3%) | 769 (18.6%) |
| Total | 952 (100.0%) | 4,123 (100.0%) |
Real Estate Taxes by Mortgage Status in Kingstowne
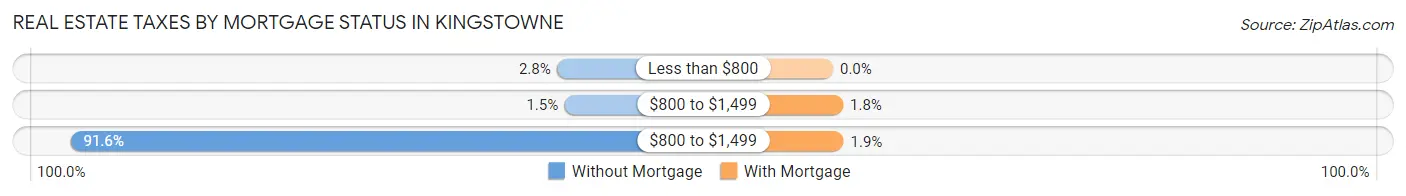
| Property Taxes | Without Mortgage | With Mortgage |
| Less than $800 | 27 (2.8%) | 0 (0.0%) |
| $800 to $1,499 | 14 (1.5%) | 76 (1.8%) |
| $800 to $1,499 | 872 (91.6%) | 79 (1.9%) |
| Total | 952 (100.0%) | 4,123 (100.0%) |
Health & Disability in Kingstowne
Health Insurance Coverage by Age in Kingstowne
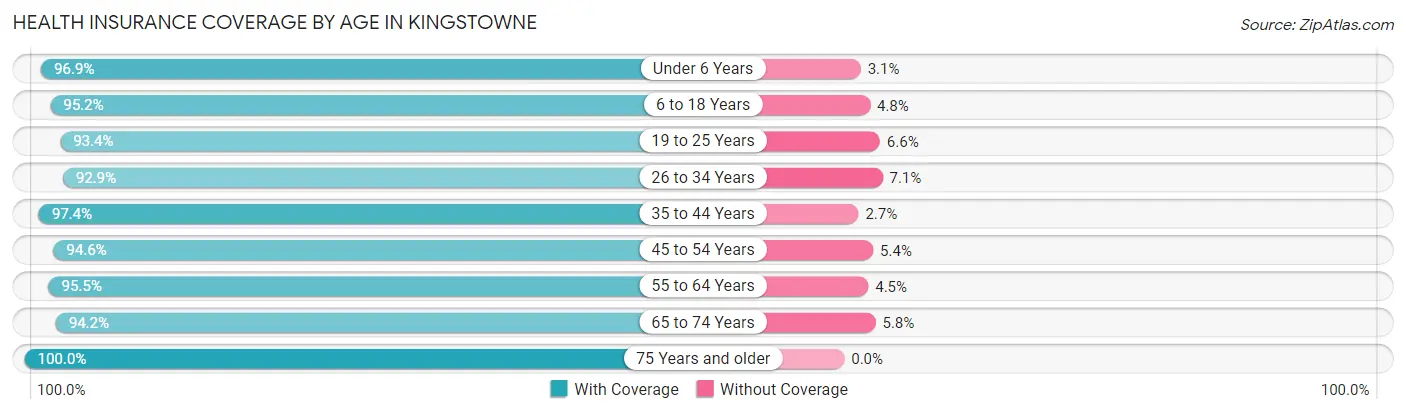
| Age Bracket | With Coverage | Without Coverage |
| Under 6 Years | 1,395 (96.9%) | 44 (3.1%) |
| 6 to 18 Years | 2,935 (95.2%) | 148 (4.8%) |
| 19 to 25 Years | 872 (93.4%) | 62 (6.6%) |
| 26 to 34 Years | 2,019 (92.9%) | 155 (7.1%) |
| 35 to 44 Years | 2,279 (97.4%) | 62 (2.6%) |
| 45 to 54 Years | 2,285 (94.6%) | 130 (5.4%) |
| 55 to 64 Years | 2,586 (95.5%) | 121 (4.5%) |
| 65 to 74 Years | 1,486 (94.2%) | 92 (5.8%) |
| 75 Years and older | 860 (100.0%) | 0 (0.0%) |
| Total | 16,717 (95.4%) | 814 (4.6%) |
Health Insurance Coverage by Citizenship Status in Kingstowne
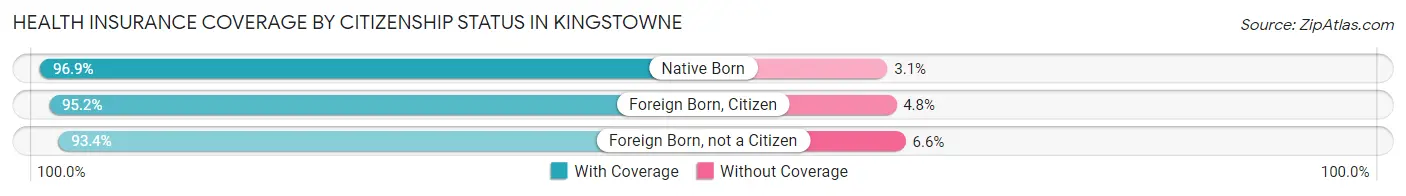
| Citizenship Status | With Coverage | Without Coverage |
| Native Born | 1,395 (96.9%) | 44 (3.1%) |
| Foreign Born, Citizen | 2,935 (95.2%) | 148 (4.8%) |
| Foreign Born, not a Citizen | 872 (93.4%) | 62 (6.6%) |
Health Insurance Coverage by Household Income in Kingstowne
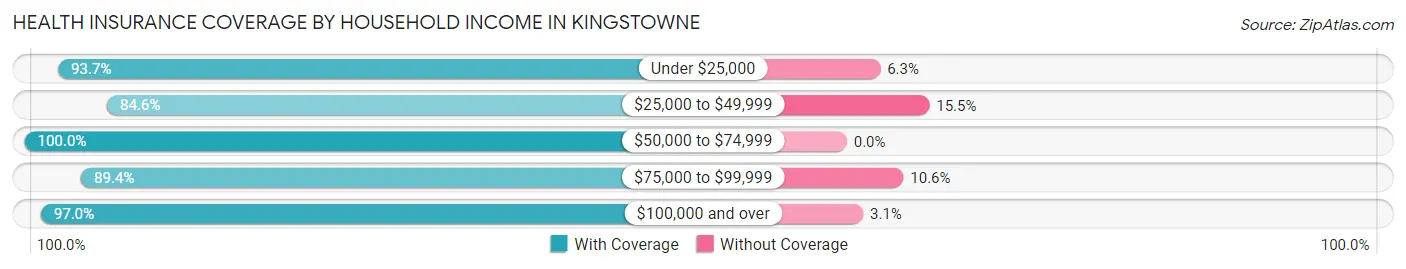
| Household Income | With Coverage | Without Coverage |
| Under $25,000 | 629 (93.7%) | 42 (6.3%) |
| $25,000 to $49,999 | 1,330 (84.6%) | 243 (15.4%) |
| $50,000 to $74,999 | 1,198 (100.0%) | 0 (0.0%) |
| $75,000 to $99,999 | 1,181 (89.4%) | 140 (10.6%) |
| $100,000 and over | 12,379 (97.0%) | 389 (3.0%) |
Public vs Private Health Insurance Coverage by Age in Kingstowne
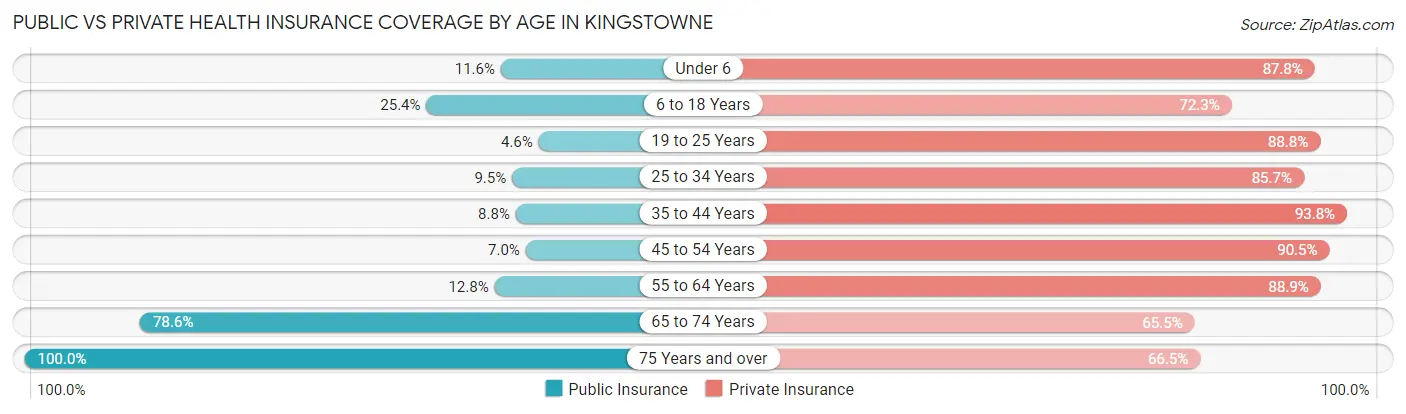
| Age Bracket | Public Insurance | Private Insurance |
| Under 6 | 167 (11.6%) | 1,263 (87.8%) |
| 6 to 18 Years | 784 (25.4%) | 2,230 (72.3%) |
| 19 to 25 Years | 43 (4.6%) | 829 (88.8%) |
| 25 to 34 Years | 207 (9.5%) | 1,864 (85.7%) |
| 35 to 44 Years | 207 (8.8%) | 2,195 (93.8%) |
| 45 to 54 Years | 169 (7.0%) | 2,185 (90.5%) |
| 55 to 64 Years | 346 (12.8%) | 2,406 (88.9%) |
| 65 to 74 Years | 1,240 (78.6%) | 1,033 (65.5%) |
| 75 Years and over | 860 (100.0%) | 572 (66.5%) |
| Total | 4,023 (23.0%) | 14,577 (83.2%) |
Disability Status by Sex by Age in Kingstowne
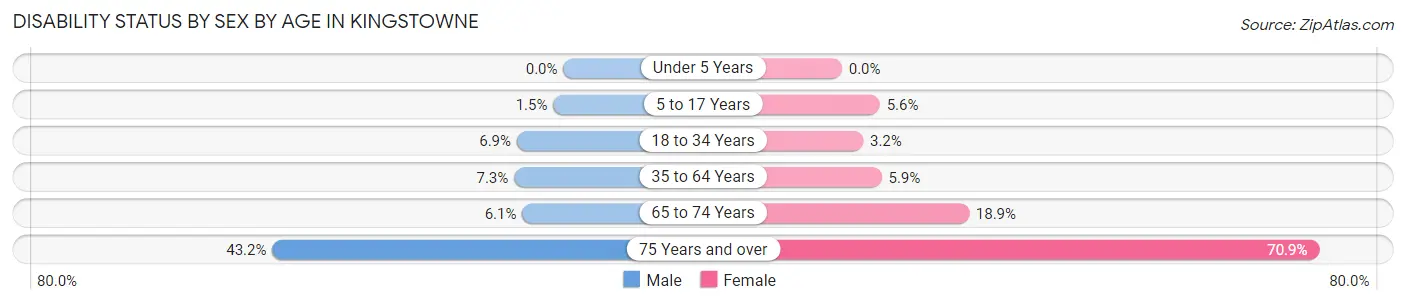
| Age Bracket | Male | Female |
| Under 5 Years | 0 (0.0%) | 0 (0.0%) |
| 5 to 17 Years | 21 (1.5%) | 97 (5.6%) |
| 18 to 34 Years | 111 (6.9%) | 52 (3.2%) |
| 35 to 64 Years | 246 (7.3%) | 242 (5.9%) |
| 65 to 74 Years | 51 (6.1%) | 140 (18.9%) |
| 75 Years and over | 137 (43.2%) | 385 (70.9%) |
Disability Class by Sex by Age in Kingstowne
Disability Class: Hearing Difficulty
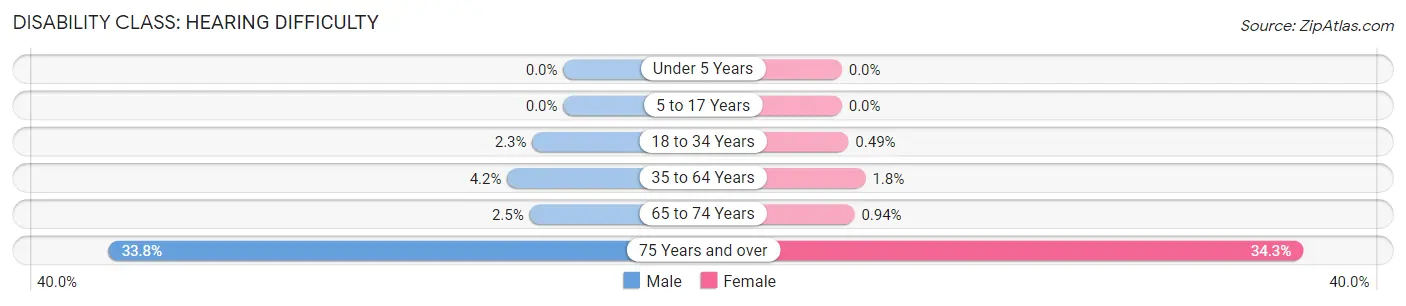
| Age Bracket | Male | Female |
| Under 5 Years | 0 (0.0%) | 0 (0.0%) |
| 5 to 17 Years | 0 (0.0%) | 0 (0.0%) |
| 18 to 34 Years | 37 (2.3%) | 8 (0.5%) |
| 35 to 64 Years | 140 (4.2%) | 72 (1.8%) |
| 65 to 74 Years | 21 (2.5%) | 7 (0.9%) |
| 75 Years and over | 107 (33.8%) | 186 (34.3%) |
Disability Class: Vision Difficulty
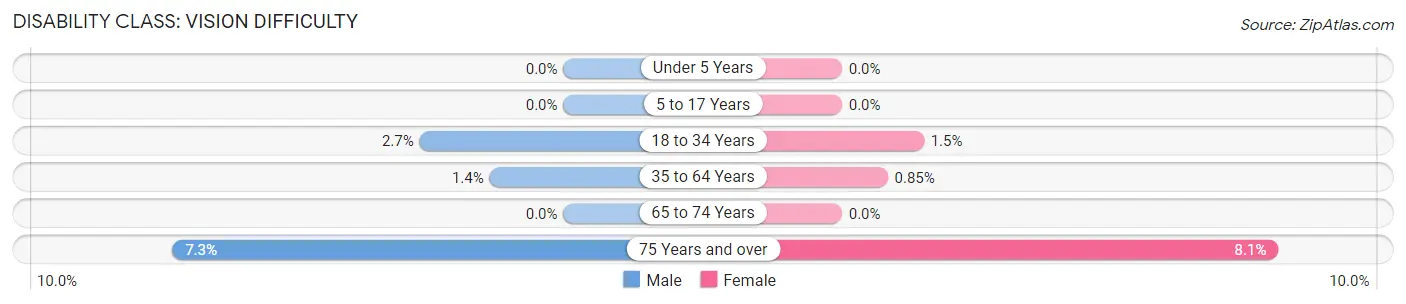
| Age Bracket | Male | Female |
| Under 5 Years | 0 (0.0%) | 0 (0.0%) |
| 5 to 17 Years | 0 (0.0%) | 0 (0.0%) |
| 18 to 34 Years | 43 (2.7%) | 25 (1.5%) |
| 35 to 64 Years | 46 (1.4%) | 35 (0.9%) |
| 65 to 74 Years | 0 (0.0%) | 0 (0.0%) |
| 75 Years and over | 23 (7.3%) | 44 (8.1%) |
Disability Class: Cognitive Difficulty
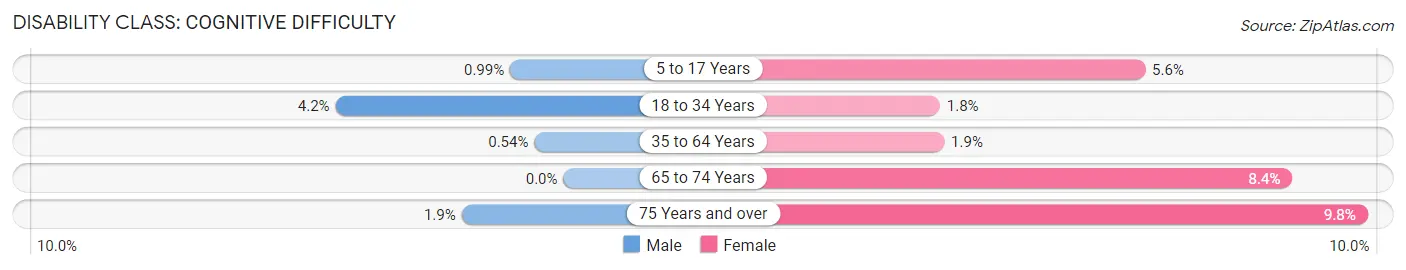
| Age Bracket | Male | Female |
| 5 to 17 Years | 14 (1.0%) | 97 (5.6%) |
| 18 to 34 Years | 68 (4.2%) | 30 (1.8%) |
| 35 to 64 Years | 18 (0.5%) | 78 (1.9%) |
| 65 to 74 Years | 0 (0.0%) | 62 (8.4%) |
| 75 Years and over | 6 (1.9%) | 53 (9.8%) |
Disability Class: Ambulatory Difficulty
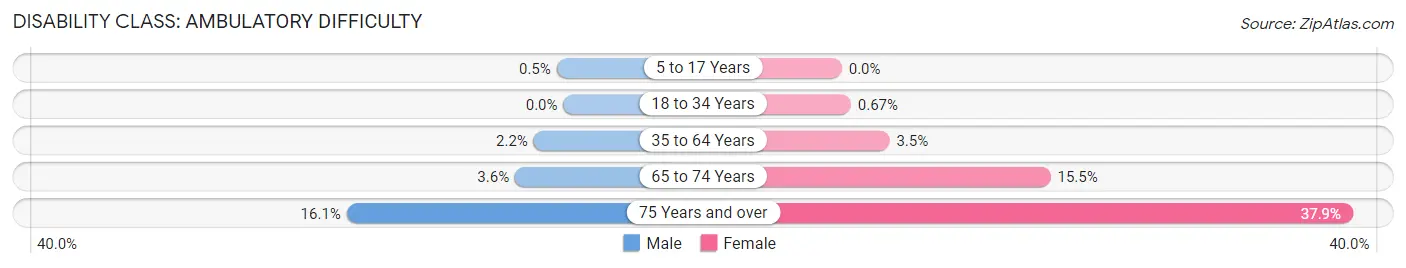
| Age Bracket | Male | Female |
| 5 to 17 Years | 7 (0.5%) | 0 (0.0%) |
| 18 to 34 Years | 0 (0.0%) | 11 (0.7%) |
| 35 to 64 Years | 74 (2.2%) | 145 (3.5%) |
| 65 to 74 Years | 30 (3.6%) | 115 (15.5%) |
| 75 Years and over | 51 (16.1%) | 206 (37.9%) |
Disability Class: Self-Care Difficulty
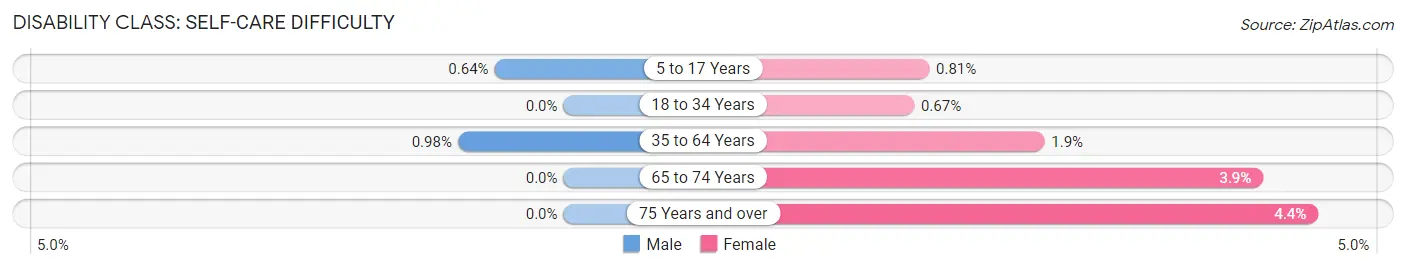
| Age Bracket | Male | Female |
| 5 to 17 Years | 9 (0.6%) | 14 (0.8%) |
| 18 to 34 Years | 0 (0.0%) | 11 (0.7%) |
| 35 to 64 Years | 33 (1.0%) | 77 (1.9%) |
| 65 to 74 Years | 0 (0.0%) | 29 (3.9%) |
| 75 Years and over | 0 (0.0%) | 24 (4.4%) |
Technology Access in Kingstowne
Computing Device Access in Kingstowne
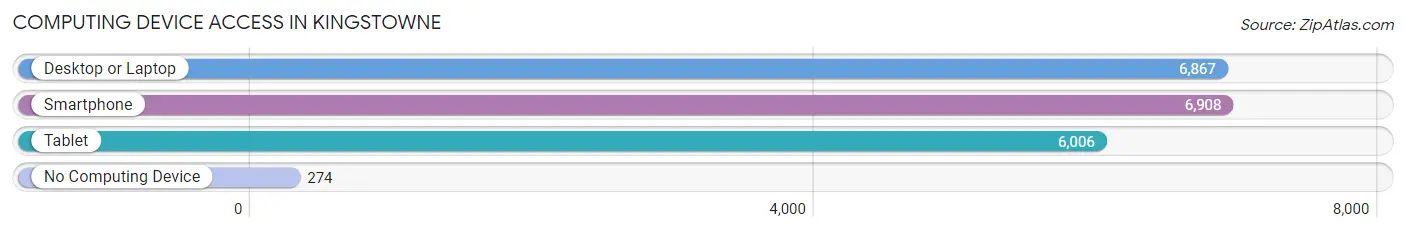
| Device Type | # Households | % Households |
| Desktop or Laptop | 6,867 | 93.0% |
| Smartphone | 6,908 | 93.5% |
| Tablet | 6,006 | 81.3% |
| No Computing Device | 274 | 3.7% |
| Total | 7,387 | 100.0% |
Internet Access in Kingstowne
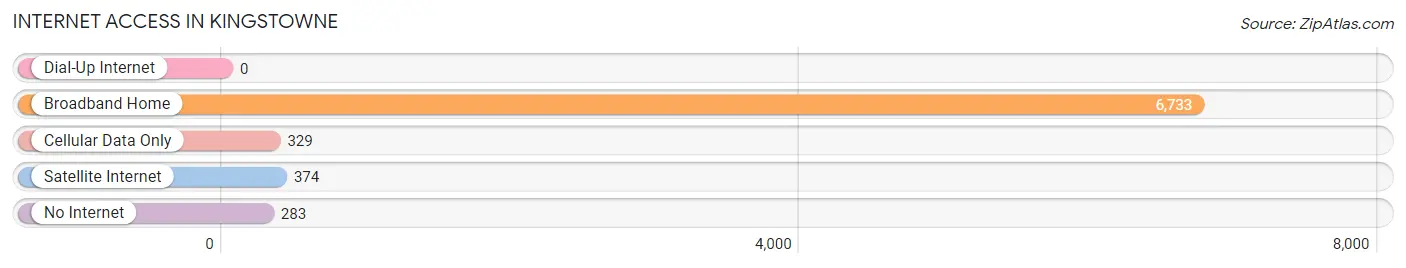
| Internet Type | # Households | % Households |
| Dial-Up Internet | 0 | 0.0% |
| Broadband Home | 6,733 | 91.1% |
| Cellular Data Only | 329 | 4.4% |
| Satellite Internet | 374 | 5.1% |
| No Internet | 283 | 3.8% |
| Total | 7,387 | 100.0% |
Kingstowne Summary
Kingstowne is a census-designated place (CDP) located in Fairfax County, Virginia. It is a suburban community located approximately 15 miles southwest of Washington, D.C. and is part of the Washington metropolitan area. The population of Kingstowne was 22,959 at the 2010 census.
History
The area that is now Kingstowne was originally inhabited by Native Americans, including the Doeg and Piscataway tribes. The area was first settled by Europeans in the late 17th century. The area was part of the original Fairfax County, which was created in 1742.
In the late 19th century, the area was known as the Kingstowne Crossroads, named after the intersection of two major roads, Little River Turnpike and Telegraph Road. The area was largely rural until the late 20th century, when it began to be developed as a suburban community.
Geography
Kingstowne is located at 38°47'17" North, 77°11'45" West (38.7881, -77.1958). It is situated in the southeastern corner of Fairfax County, approximately 15 miles southwest of Washington, D.C.
The CDP has a total area of 5.2 square miles, all of which is land. It is bordered by Franconia to the north, Rose Hill to the east, and Alexandria to the south and west.
Economy
Kingstowne is a primarily residential community, with a few commercial and retail establishments. The largest employers in the area are the federal government, the Fairfax County Public Schools system, and the Fairfax County government.
Demographics
As of the 2010 census, there were 22,959 people, 8,845 households, and 6,072 families residing in the CDP. The population density was 4,400 people per square mile. The racial makeup of the CDP was 68.2% White, 13.3% African American, 0.3% Native American, 11.2% Asian, 0.1% Pacific Islander, 3.7% from other races, and 3.2% from two or more races. Hispanic or Latino of any race were 8.3% of the population.
The median income for a household in the CDP was $93,945, and the median income for a family was $106,945. The per capita income for the CDP was $41,945. About 3.2% of families and 4.7% of the population were below the poverty line, including 5.2% of those under age 18 and 4.2% of those age 65 or over.
Common Questions
What is Per Capita Income in Kingstowne?
Per Capita income in Kingstowne is $70,972.
What is the Median Family Income in Kingstowne?
Median Family Income in Kingstowne is $172,865.
What is the Median Household income in Kingstowne?
Median Household Income in Kingstowne is $143,577.
What is Income or Wage Gap in Kingstowne?
Income or Wage Gap in Kingstowne is 20.4%.
Women in Kingstowne earn 79.6 cents for every dollar earned by a man.
What is Family Income Deficit in Kingstowne?
Family Income Deficit in Kingstowne is $9,476.
Families that are below poverty line in Kingstowne earn $9,476 less on average than the poverty threshold level.
What is Inequality or Gini Index in Kingstowne?
Inequality or Gini Index in Kingstowne is 0.41.
What is the Total Population of Kingstowne?
Total Population of Kingstowne is 18,228.
What is the Total Male Population of Kingstowne?
Total Male Population of Kingstowne is 8,521.
What is the Total Female Population of Kingstowne?
Total Female Population of Kingstowne is 9,707.
What is the Ratio of Males per 100 Females in Kingstowne?
There are 87.78 Males per 100 Females in Kingstowne.
What is the Ratio of Females per 100 Males in Kingstowne?
There are 113.92 Females per 100 Males in Kingstowne.
What is the Median Population Age in Kingstowne?
Median Population Age in Kingstowne is 39.3 Years.
What is the Average Family Size in Kingstowne
Average Family Size in Kingstowne is 3.2 People.
What is the Average Household Size in Kingstowne
Average Household Size in Kingstowne is 2.5 People.
How Large is the Labor Force in Kingstowne?
There are 10,494 People in the Labor Forcein in Kingstowne.
What is the Percentage of People in the Labor Force in Kingstowne?
72.7% of People are in the Labor Force in Kingstowne.
What is the Unemployment Rate in Kingstowne?
Unemployment Rate in Kingstowne is 3.2%.