Fort Belvoir, VA Map & Demographics
Fort Belvoir Map
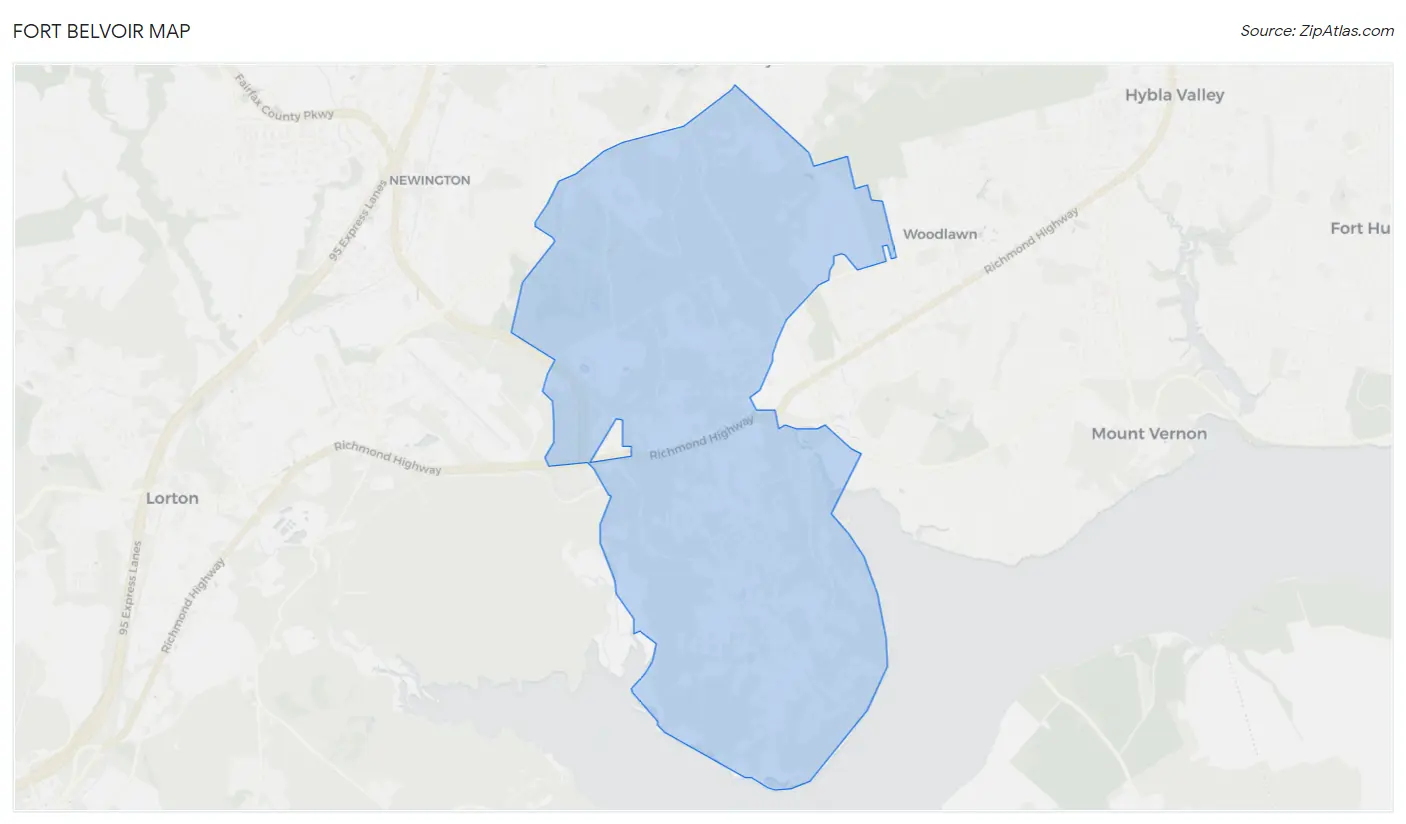
Fort Belvoir Overview
$27,334
PER CAPITA INCOME
$97,101
AVG FAMILY INCOME
$97,290
AVG HOUSEHOLD INCOME
39.6%
WAGE / INCOME GAP [ % ]
60.4¢/ $1
WAGE / INCOME GAP [ $ ]
$11,633
FAMILY INCOME DEFICIT
0.30
INEQUALITY / GINI INDEX
7,815
TOTAL POPULATION
4,202
MALE POPULATION
3,613
FEMALE POPULATION
116.30
MALES / 100 FEMALES
85.98
FEMALES / 100 MALES
19.5
MEDIAN AGE
4.2
AVG FAMILY SIZE
4.1
AVG HOUSEHOLD SIZE
3,101
LABOR FORCE [ PEOPLE ]
73.1%
PERCENT IN LABOR FORCE
5.8%
UNEMPLOYMENT RATE
Fort Belvoir Zip Codes
Income in Fort Belvoir
Income Overview in Fort Belvoir
Per Capita Income in Fort Belvoir is $27,334, while median incomes of families and households are $97,101 and $97,290 respectively.
| Characteristic | Number | Measure |
| Per Capita Income | 7,815 | $27,334 |
| Median Family Income | 1,744 | $97,101 |
| Mean Family Income | 1,744 | $112,244 |
| Median Household Income | 1,810 | $97,290 |
| Mean Household Income | 1,810 | $112,605 |
| Income Deficit | 1,744 | $11,633 |
| Wage / Income Gap (%) | 7,815 | 39.55% |
| Wage / Income Gap ($) | 7,815 | 60.45¢ per $1 |
| Gini / Inequality Index | 7,815 | 0.30 |
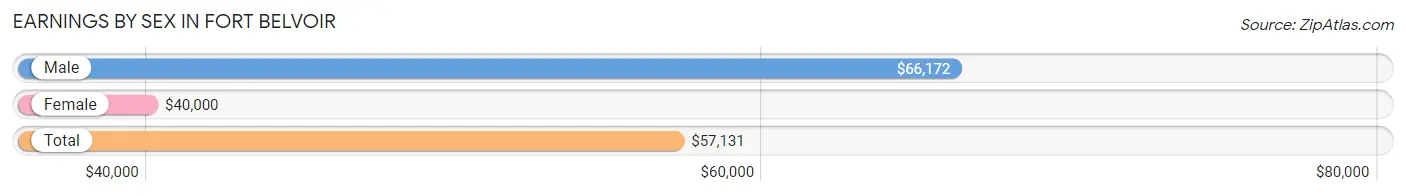
Earnings by Sex in Fort Belvoir
Average Earnings in Fort Belvoir are $57,131, $66,172 for men and $40,000 for women, a difference of 39.6%.
| Sex | Number | Average Earnings |
| Male | 2,070 (63.7%) | $66,172 |
| Female | 1,178 (36.3%) | $40,000 |
| Total | 3,248 (100.0%) | $57,131 |
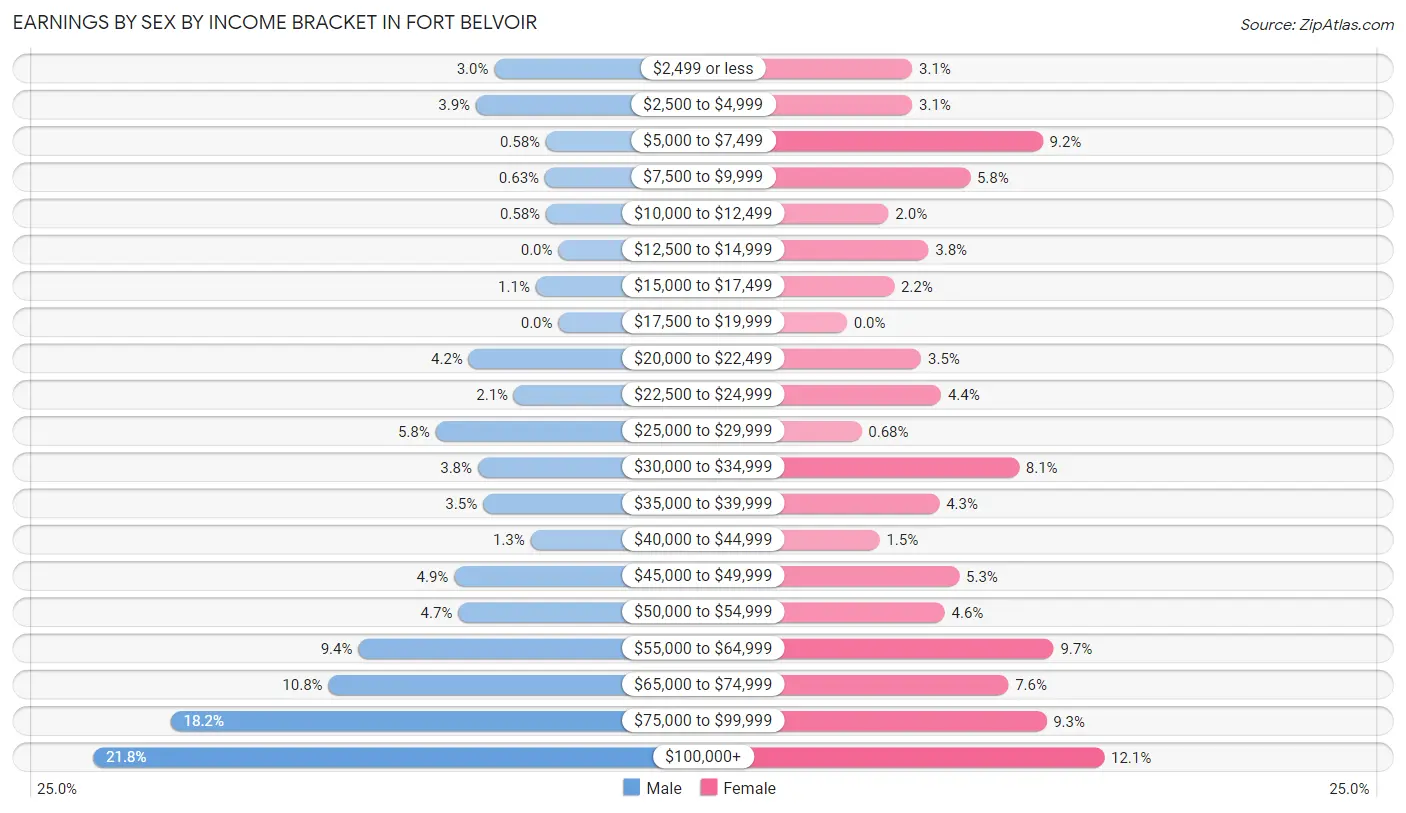
Earnings by Sex by Income Bracket in Fort Belvoir
The most common earnings brackets in Fort Belvoir are $100,000+ for men (451 | 21.8%) and $100,000+ for women (142 | 12.0%).
| Income | Male | Female |
| $2,499 or less | 62 (3.0%) | 36 (3.1%) |
| $2,500 to $4,999 | 80 (3.9%) | 36 (3.1%) |
| $5,000 to $7,499 | 12 (0.6%) | 108 (9.2%) |
| $7,500 to $9,999 | 13 (0.6%) | 68 (5.8%) |
| $10,000 to $12,499 | 12 (0.6%) | 23 (1.9%) |
| $12,500 to $14,999 | 0 (0.0%) | 45 (3.8%) |
| $15,000 to $17,499 | 22 (1.1%) | 26 (2.2%) |
| $17,500 to $19,999 | 0 (0.0%) | 0 (0.0%) |
| $20,000 to $22,499 | 87 (4.2%) | 41 (3.5%) |
| $22,500 to $24,999 | 43 (2.1%) | 52 (4.4%) |
| $25,000 to $29,999 | 119 (5.8%) | 8 (0.7%) |
| $30,000 to $34,999 | 78 (3.8%) | 95 (8.1%) |
| $35,000 to $39,999 | 73 (3.5%) | 51 (4.3%) |
| $40,000 to $44,999 | 27 (1.3%) | 18 (1.5%) |
| $45,000 to $49,999 | 101 (4.9%) | 62 (5.3%) |
| $50,000 to $54,999 | 97 (4.7%) | 54 (4.6%) |
| $55,000 to $64,999 | 194 (9.4%) | 114 (9.7%) |
| $65,000 to $74,999 | 223 (10.8%) | 89 (7.6%) |
| $75,000 to $99,999 | 376 (18.2%) | 110 (9.3%) |
| $100,000+ | 451 (21.8%) | 142 (12.0%) |
| Total | 2,070 (100.0%) | 1,178 (100.0%) |
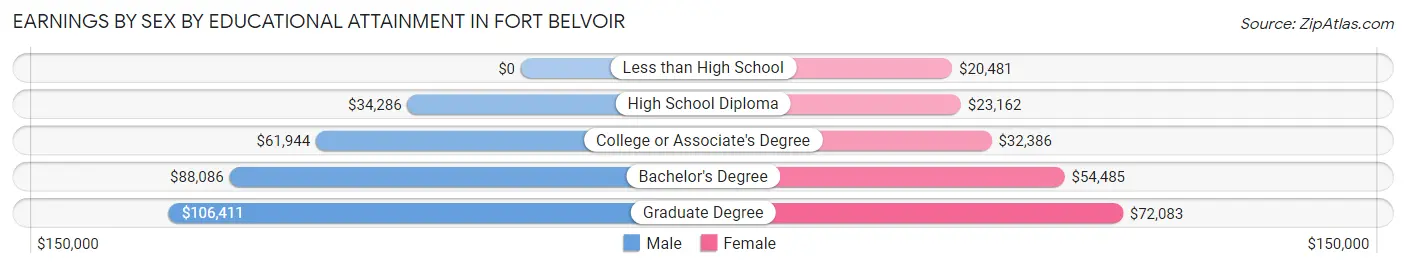
Earnings by Sex by Educational Attainment in Fort Belvoir
Average earnings in Fort Belvoir are $76,157 for men and $49,097 for women, a difference of 35.5%. Men with an educational attainment of graduate degree enjoy the highest average annual earnings of $106,411, while those with high school diploma education earn the least with $34,286. Women with an educational attainment of graduate degree earn the most with the average annual earnings of $72,083, while those with less than high school education have the smallest earnings of $20,481.
| Educational Attainment | Male Income | Female Income |
| Less than High School | - | - |
| High School Diploma | $34,286 | $23,162 |
| College or Associate's Degree | $61,944 | $32,386 |
| Bachelor's Degree | $88,086 | $54,485 |
| Graduate Degree | $106,411 | $72,083 |
| Total | $76,157 | $49,097 |
Family Income in Fort Belvoir
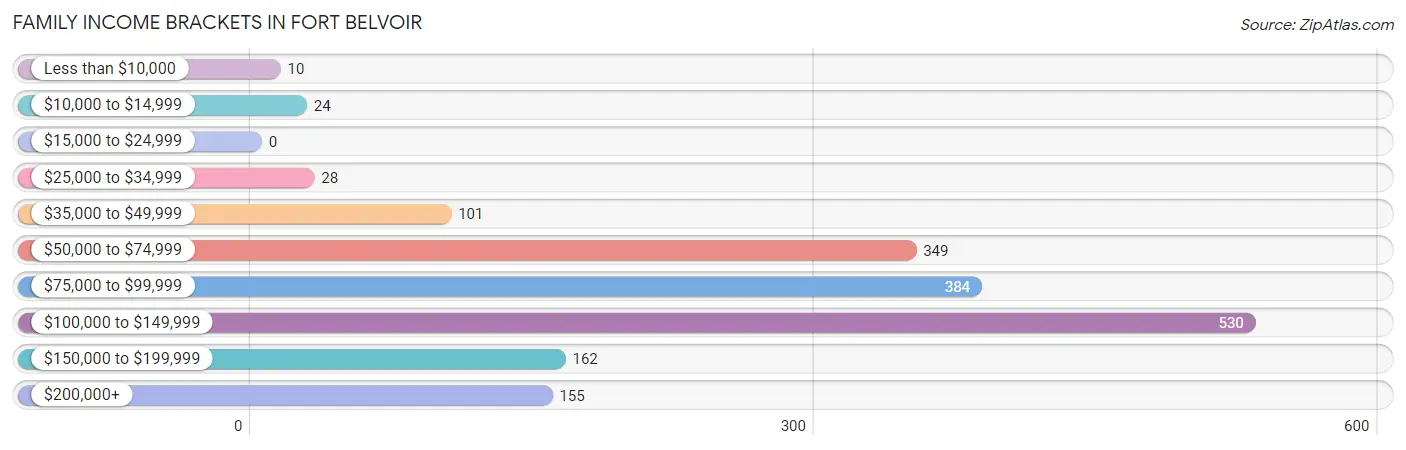
Family Income Brackets in Fort Belvoir
According to the Fort Belvoir family income data, there are 530 families falling into the $100,000 to $149,999 income range, which is the most common income bracket and makes up 30.4% of all families.
| Income Bracket | # Families | % Families |
| Less than $10,000 | 10 | 0.6% |
| $10,000 to $14,999 | 24 | 1.4% |
| $15,000 to $24,999 | 0 | 0.0% |
| $25,000 to $34,999 | 28 | 1.6% |
| $35,000 to $49,999 | 101 | 5.8% |
| $50,000 to $74,999 | 349 | 20.0% |
| $75,000 to $99,999 | 384 | 22.0% |
| $100,000 to $149,999 | 530 | 30.4% |
| $150,000 to $199,999 | 162 | 9.3% |
| $200,000+ | 155 | 8.9% |
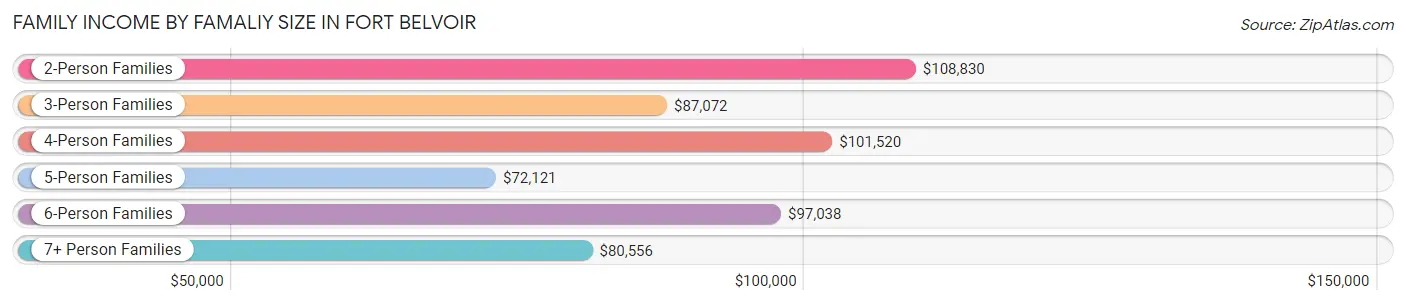
Family Income by Famaliy Size in Fort Belvoir
2-person families (280 | 16.1%) account for the highest median family income in Fort Belvoir with $108,830 per family, while 2-person families (280 | 16.1%) have the highest median income of $54,415 per family member.
| Income Bracket | # Families | Median Income |
| 2-Person Families | 280 (16.1%) | $108,830 |
| 3-Person Families | 277 (15.9%) | $87,072 |
| 4-Person Families | 531 (30.4%) | $101,520 |
| 5-Person Families | 344 (19.7%) | $72,121 |
| 6-Person Families | 258 (14.8%) | $97,038 |
| 7+ Person Families | 54 (3.1%) | $80,556 |
| Total | 1,744 (100.0%) | $97,101 |
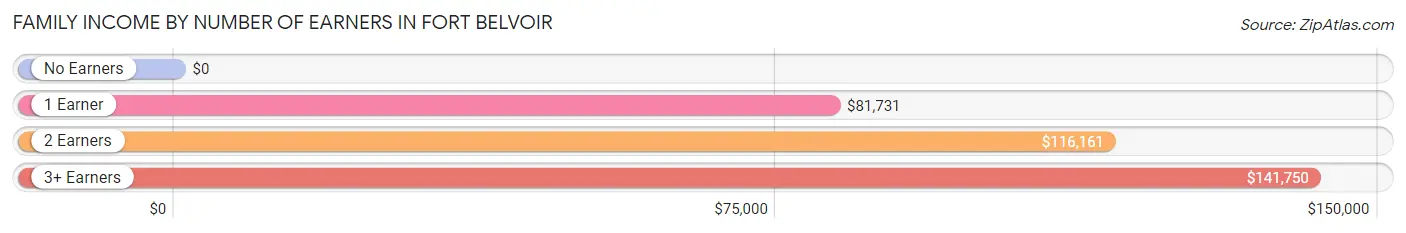
Family Income by Number of Earners in Fort Belvoir
| Number of Earners | # Families | Median Income |
| No Earners | 22 (1.3%) | $0 |
| 1 Earner | 824 (47.2%) | $81,731 |
| 2 Earners | 747 (42.8%) | $116,161 |
| 3+ Earners | 151 (8.7%) | $141,750 |
| Total | 1,744 (100.0%) | $97,101 |
Household Income in Fort Belvoir
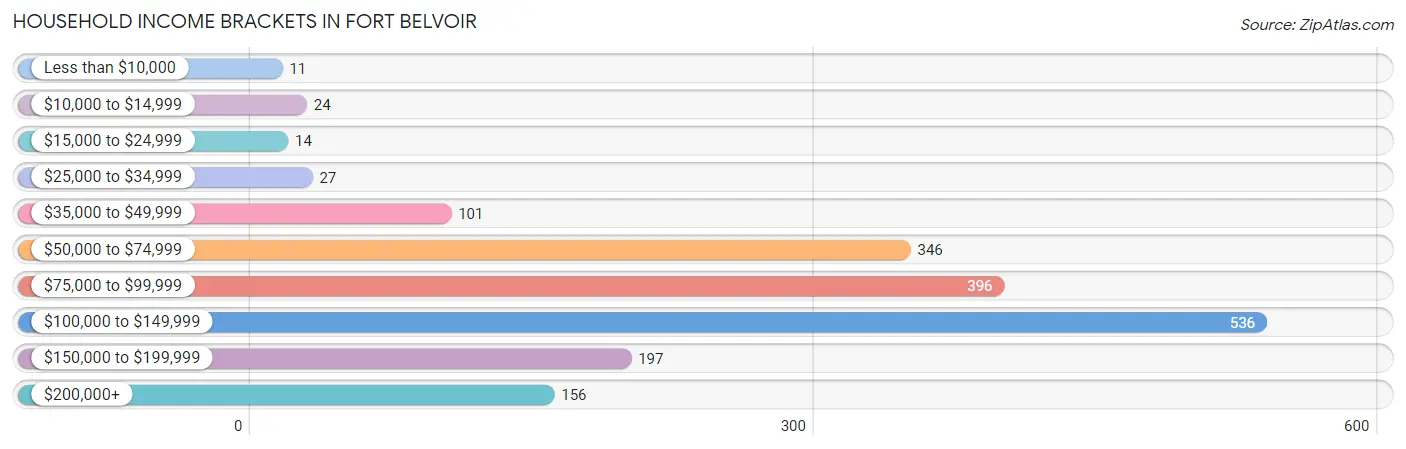
Household Income Brackets in Fort Belvoir
With 536 households falling in the category, the $100,000 to $149,999 income range is the most frequent in Fort Belvoir, accounting for 29.6% of all households. In contrast, only 11 households (0.6%) fall into the less than $10,000 income bracket, making it the least populous group.
| Income Bracket | # Households | % Households |
| Less than $10,000 | 11 | 0.6% |
| $10,000 to $14,999 | 24 | 1.3% |
| $15,000 to $24,999 | 14 | 0.8% |
| $25,000 to $34,999 | 27 | 1.5% |
| $35,000 to $49,999 | 101 | 5.6% |
| $50,000 to $74,999 | 346 | 19.1% |
| $75,000 to $99,999 | 396 | 21.9% |
| $100,000 to $149,999 | 536 | 29.6% |
| $150,000 to $199,999 | 197 | 10.9% |
| $200,000+ | 156 | 8.6% |
Household Income by Householder Age in Fort Belvoir
The median household income in Fort Belvoir is $97,290, with the highest median household income of $118,125 found in the 45 to 64 years age bracket for the primary householder. A total of 294 households (16.2%) fall into this category.
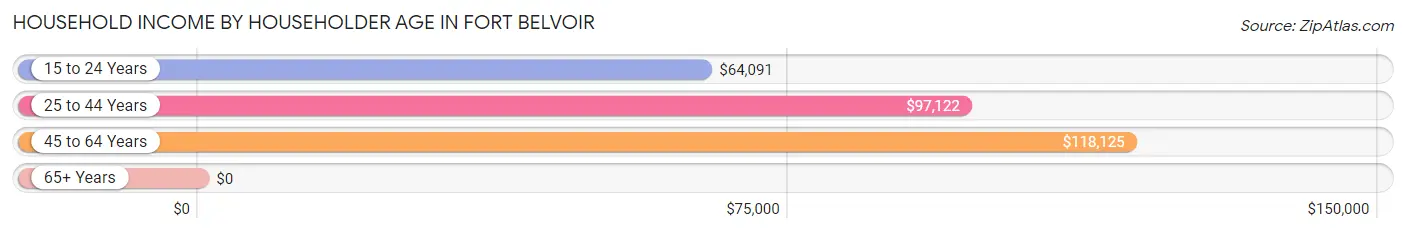
| Income Bracket | # Households | Median Income |
| 15 to 24 Years | 84 (4.6%) | $64,091 |
| 25 to 44 Years | 1,432 (79.1%) | $97,122 |
| 45 to 64 Years | 294 (16.2%) | $118,125 |
| 65+ Years | 0 (0.0%) | $0 |
| Total | 1,810 (100.0%) | $97,290 |
Poverty in Fort Belvoir
Income Below Poverty by Sex and Age in Fort Belvoir
With 4.2% poverty level for males and 5.5% for females among the residents of Fort Belvoir, 55 to 64 year old males and 55 to 64 year old females are the most vulnerable to poverty, with 7 males (9.0%) and 9 females (9.7%) in their respective age groups living below the poverty level.
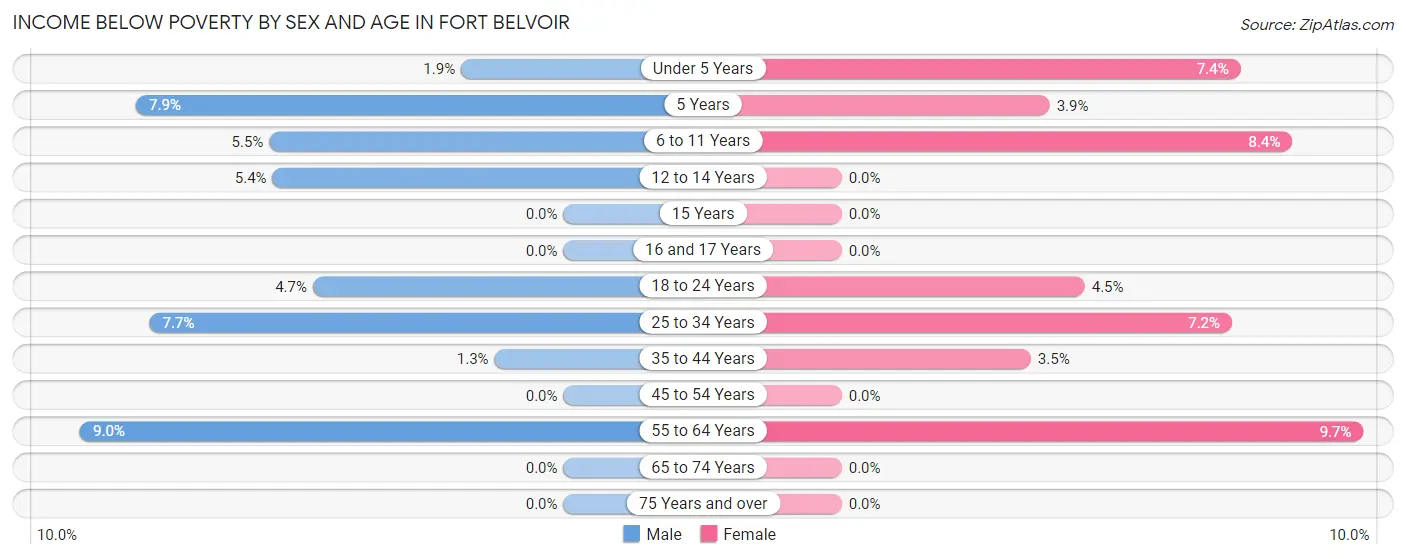
| Age Bracket | Male | Female |
| Under 5 Years | 10 (1.9%) | 35 (7.4%) |
| 5 Years | 23 (7.9%) | 9 (3.9%) |
| 6 to 11 Years | 43 (5.5%) | 60 (8.4%) |
| 12 to 14 Years | 15 (5.4%) | 0 (0.0%) |
| 15 Years | 0 (0.0%) | 0 (0.0%) |
| 16 and 17 Years | 0 (0.0%) | 0 (0.0%) |
| 18 to 24 Years | 8 (4.6%) | 11 (4.5%) |
| 25 to 34 Years | 47 (7.7%) | 50 (7.2%) |
| 35 to 44 Years | 10 (1.3%) | 24 (3.5%) |
| 45 to 54 Years | 0 (0.0%) | 0 (0.0%) |
| 55 to 64 Years | 7 (9.0%) | 9 (9.7%) |
| 65 to 74 Years | 0 (0.0%) | 0 (0.0%) |
| 75 Years and over | 0 (0.0%) | 0 (0.0%) |
| Total | 163 (4.2%) | 198 (5.5%) |
Income Above Poverty by Sex and Age in Fort Belvoir
According to the poverty statistics in Fort Belvoir, males aged 15 years and females aged 12 to 14 years are the age groups that are most secure financially, with 100.0% of males and 100.0% of females in these age groups living above the poverty line.
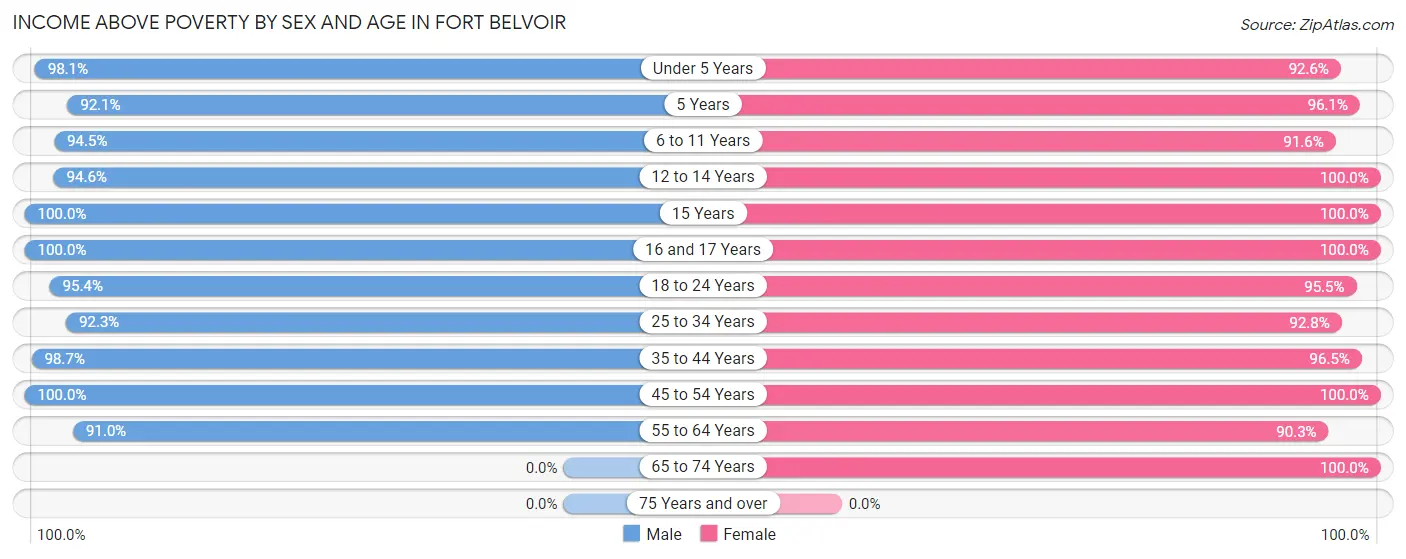
| Age Bracket | Male | Female |
| Under 5 Years | 517 (98.1%) | 438 (92.6%) |
| 5 Years | 267 (92.1%) | 224 (96.1%) |
| 6 to 11 Years | 744 (94.5%) | 658 (91.6%) |
| 12 to 14 Years | 263 (94.6%) | 163 (100.0%) |
| 15 Years | 49 (100.0%) | 55 (100.0%) |
| 16 and 17 Years | 149 (100.0%) | 32 (100.0%) |
| 18 to 24 Years | 164 (95.4%) | 233 (95.5%) |
| 25 to 34 Years | 565 (92.3%) | 641 (92.8%) |
| 35 to 44 Years | 773 (98.7%) | 659 (96.5%) |
| 45 to 54 Years | 193 (100.0%) | 182 (100.0%) |
| 55 to 64 Years | 71 (91.0%) | 84 (90.3%) |
| 65 to 74 Years | 0 (0.0%) | 7 (100.0%) |
| 75 Years and over | 0 (0.0%) | 0 (0.0%) |
| Total | 3,755 (95.8%) | 3,376 (94.5%) |
Income Below Poverty Among Married-Couple Families in Fort Belvoir
The poverty statistics for married-couple families in Fort Belvoir show that 2.4% or 38 of the total 1,568 families live below the poverty line. Families with 5 or more children have the highest poverty rate of 22.7%, comprising of 10 families. On the other hand, families with no children have the lowest poverty rate of 0.0%, which includes 0 families.
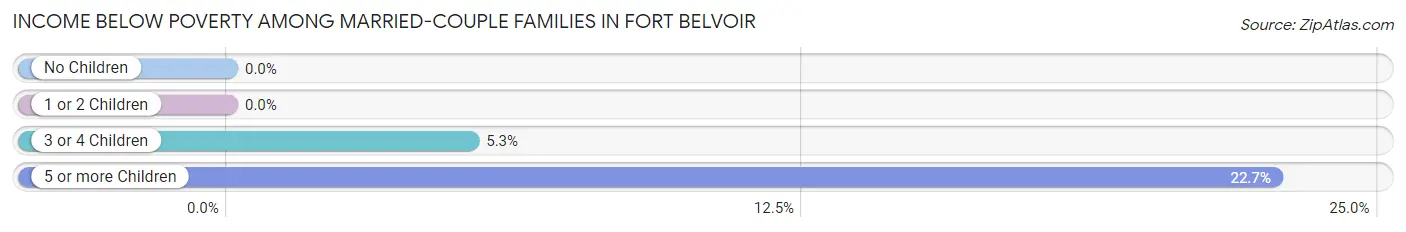
| Children | Above Poverty | Below Poverty |
| No Children | 218 (100.0%) | 0 (0.0%) |
| 1 or 2 Children | 773 (100.0%) | 0 (0.0%) |
| 3 or 4 Children | 505 (94.8%) | 28 (5.2%) |
| 5 or more Children | 34 (77.3%) | 10 (22.7%) |
| Total | 1,530 (97.6%) | 38 (2.4%) |
Income Below Poverty Among Single-Parent Households in Fort Belvoir
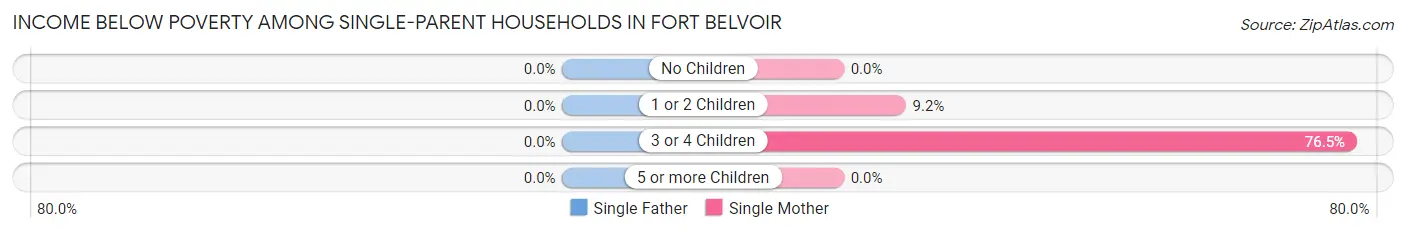
| Children | Single Father | Single Mother |
| No Children | 0 (0.0%) | 0 (0.0%) |
| 1 or 2 Children | 0 (0.0%) | 12 (9.2%) |
| 3 or 4 Children | 0 (0.0%) | 13 (76.5%) |
| 5 or more Children | 0 (0.0%) | 0 (0.0%) |
| Total | 0 (0.0%) | 25 (16.3%) |
Income Below Poverty Among Married-Couple vs Single-Parent Households in Fort Belvoir
The poverty data for Fort Belvoir shows that 38 of the married-couple family households (2.4%) and 25 of the single-parent households (14.2%) are living below the poverty level. Within the married-couple family households, those with 5 or more children have the highest poverty rate, with 10 households (22.7%) falling below the poverty line. Among the single-parent households, those with 3 or 4 children have the highest poverty rate, with 13 household (50.0%) living below poverty.
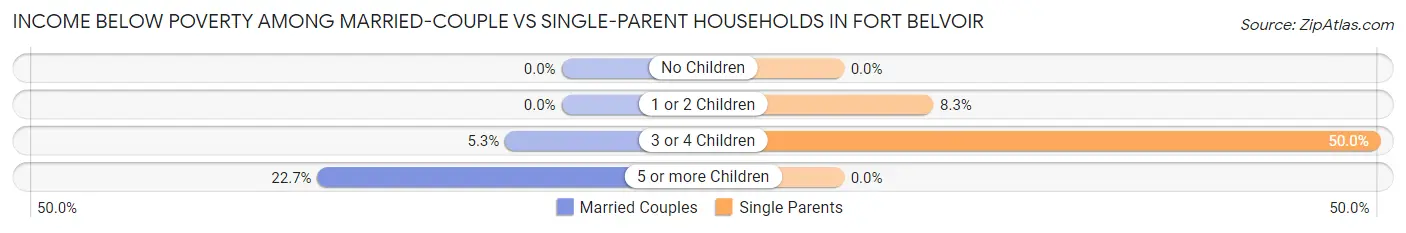
| Children | Married-Couple Families | Single-Parent Households |
| No Children | 0 (0.0%) | 0 (0.0%) |
| 1 or 2 Children | 0 (0.0%) | 12 (8.3%) |
| 3 or 4 Children | 28 (5.2%) | 13 (50.0%) |
| 5 or more Children | 10 (22.7%) | 0 (0.0%) |
| Total | 38 (2.4%) | 25 (14.2%) |
Race in Fort Belvoir
The most populous races in Fort Belvoir are White / Caucasian (4,600 | 58.9%), Black / African American (1,542 | 19.7%), and Two or more Races (1,017 | 13.0%).
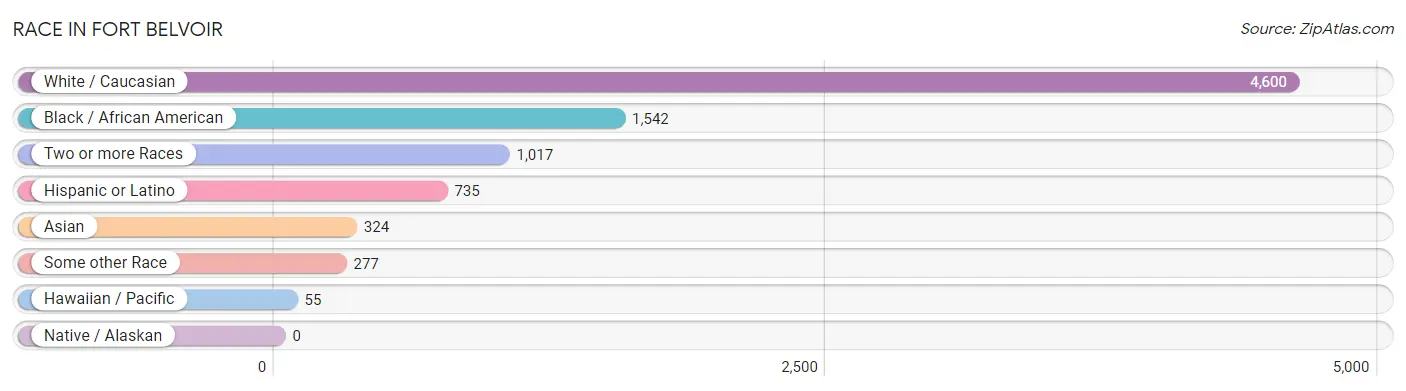
| Race | # Population | % Population |
| Asian | 324 | 4.2% |
| Black / African American | 1,542 | 19.7% |
| Hawaiian / Pacific | 55 | 0.7% |
| Hispanic or Latino | 735 | 9.4% |
| Native / Alaskan | 0 | 0.0% |
| White / Caucasian | 4,600 | 58.9% |
| Two or more Races | 1,017 | 13.0% |
| Some other Race | 277 | 3.5% |
| Total | 7,815 | 100.0% |
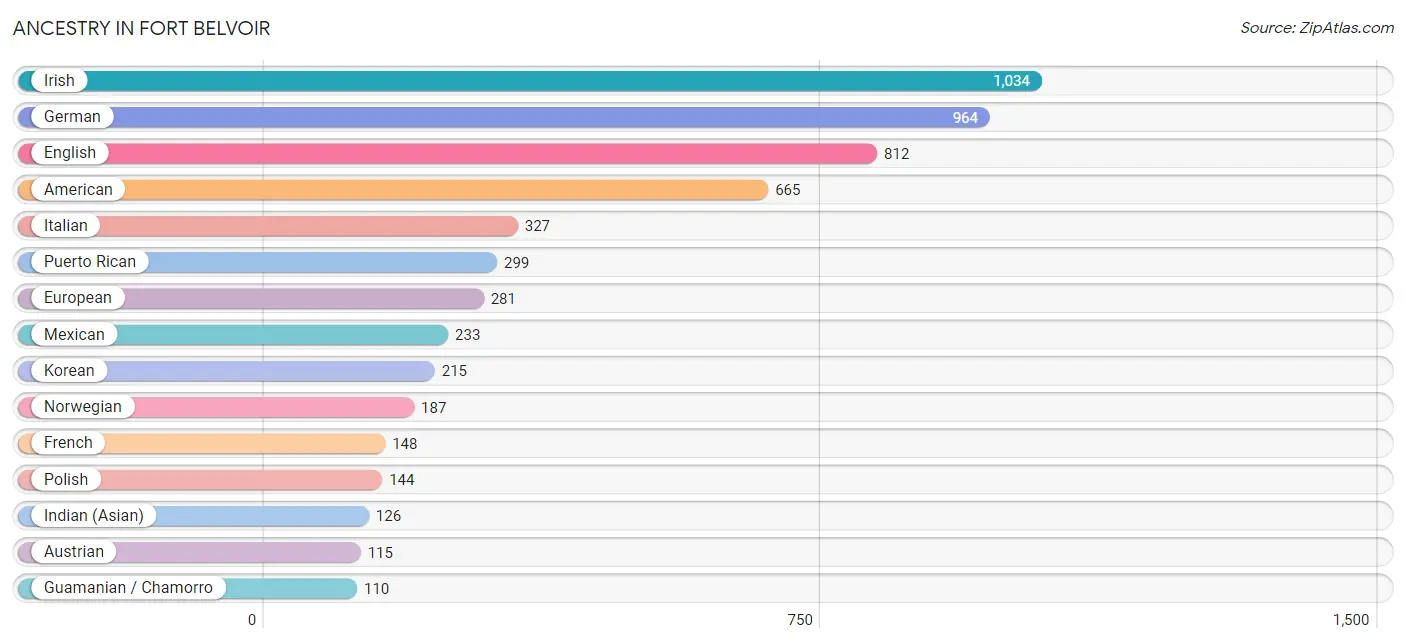
Ancestry in Fort Belvoir
The most populous ancestries reported in Fort Belvoir are Irish (1,034 | 13.2%), German (964 | 12.3%), English (812 | 10.4%), American (665 | 8.5%), and Italian (327 | 4.2%), together accounting for 48.6% of all Fort Belvoir residents.
| Ancestry | # Population | % Population |
| American | 665 | 8.5% |
| Arab | 42 | 0.5% |
| Armenian | 104 | 1.3% |
| Australian | 30 | 0.4% |
| Austrian | 115 | 1.5% |
| Barbadian | 5 | 0.1% |
| Bhutanese | 81 | 1.0% |
| Blackfeet | 8 | 0.1% |
| British | 20 | 0.3% |
| Burmese | 88 | 1.1% |
| Central American | 61 | 0.8% |
| Central American Indian | 51 | 0.6% |
| Cherokee | 11 | 0.1% |
| Costa Rican | 18 | 0.2% |
| Cuban | 47 | 0.6% |
| Czech | 10 | 0.1% |
| Danish | 66 | 0.8% |
| Dominican | 88 | 1.1% |
| Dutch | 17 | 0.2% |
| Eastern European | 6 | 0.1% |
| English | 812 | 10.4% |
| European | 281 | 3.6% |
| Filipino | 39 | 0.5% |
| French | 148 | 1.9% |
| French Canadian | 60 | 0.8% |
| German | 964 | 12.3% |
| Greek | 28 | 0.4% |
| Guamanian / Chamorro | 110 | 1.4% |
| Guatemalan | 6 | 0.1% |
| Honduran | 7 | 0.1% |
| Hungarian | 37 | 0.5% |
| Indian (Asian) | 126 | 1.6% |
| Irish | 1,034 | 13.2% |
| Italian | 327 | 4.2% |
| Korean | 215 | 2.8% |
| Lithuanian | 73 | 0.9% |
| Mexican | 233 | 3.0% |
| Native Hawaiian | 62 | 0.8% |
| Nicaraguan | 30 | 0.4% |
| Northern European | 18 | 0.2% |
| Norwegian | 187 | 2.4% |
| Polish | 144 | 1.8% |
| Portuguese | 13 | 0.2% |
| Puerto Rican | 299 | 3.8% |
| Russian | 10 | 0.1% |
| Samoan | 39 | 0.5% |
| Scandinavian | 12 | 0.2% |
| Scotch-Irish | 46 | 0.6% |
| Scottish | 100 | 1.3% |
| Serbian | 76 | 1.0% |
| Sioux | 10 | 0.1% |
| Slovak | 12 | 0.2% |
| Sri Lankan | 9 | 0.1% |
| Swedish | 34 | 0.4% |
| Swiss | 26 | 0.3% |
| Thai | 18 | 0.2% |
| Tongan | 10 | 0.1% |
| Welsh | 32 | 0.4% | View All 58 Rows |
Immigrants in Fort Belvoir
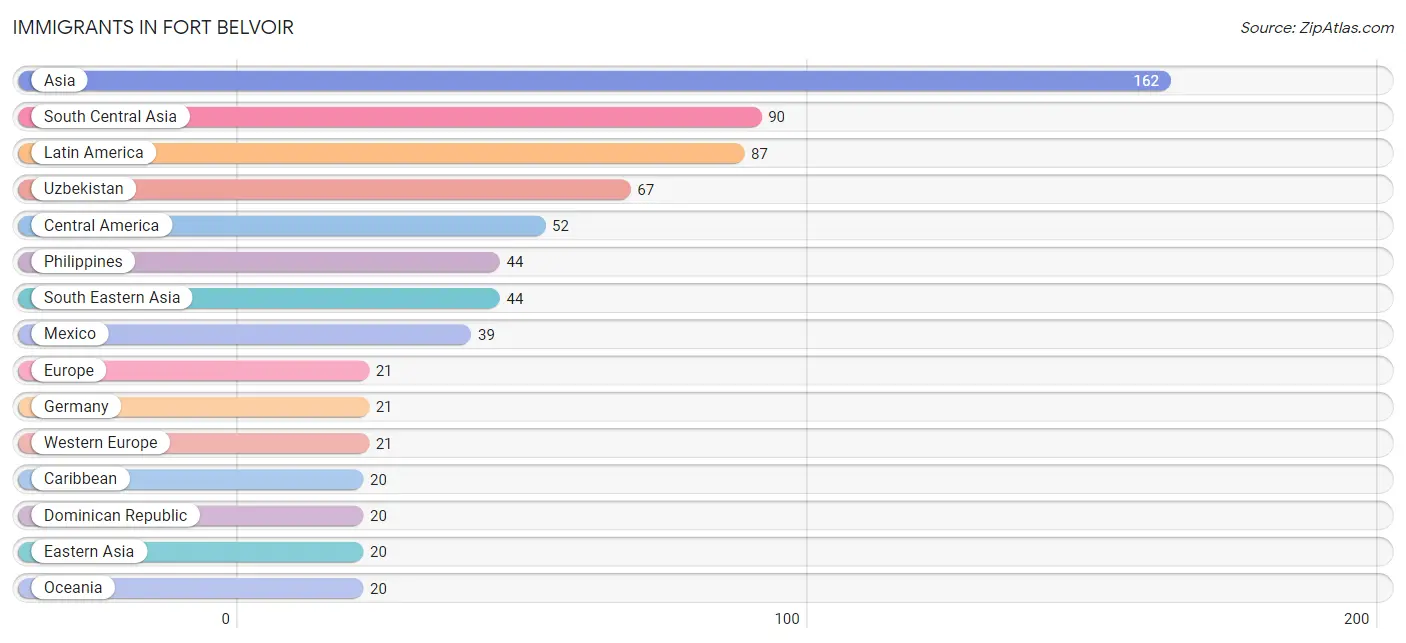
The most numerous immigrant groups reported in Fort Belvoir came from Asia (162 | 2.1%), South Central Asia (90 | 1.1%), Latin America (87 | 1.1%), Uzbekistan (67 | 0.9%), and Central America (52 | 0.7%), together accounting for 5.9% of all Fort Belvoir residents.
| Immigration Origin | # Population | % Population |
| Asia | 162 | 2.1% |
| Australia | 10 | 0.1% |
| Brazil | 15 | 0.2% |
| Caribbean | 20 | 0.3% |
| Central America | 52 | 0.7% |
| China | 11 | 0.1% |
| Dominican Republic | 20 | 0.3% |
| Eastern Asia | 20 | 0.3% |
| Europe | 21 | 0.3% |
| Fiji | 10 | 0.1% |
| Germany | 21 | 0.3% |
| Guatemala | 6 | 0.1% |
| Honduras | 7 | 0.1% |
| India | 10 | 0.1% |
| Korea | 9 | 0.1% |
| Latin America | 87 | 1.1% |
| Mexico | 39 | 0.5% |
| Oceania | 20 | 0.3% |
| Pakistan | 13 | 0.2% |
| Philippines | 44 | 0.6% |
| South America | 15 | 0.2% |
| South Central Asia | 90 | 1.1% |
| South Eastern Asia | 44 | 0.6% |
| Uzbekistan | 67 | 0.9% |
| Western Asia | 8 | 0.1% |
| Western Europe | 21 | 0.3% | View All 26 Rows |
Sex and Age in Fort Belvoir
Sex and Age in Fort Belvoir
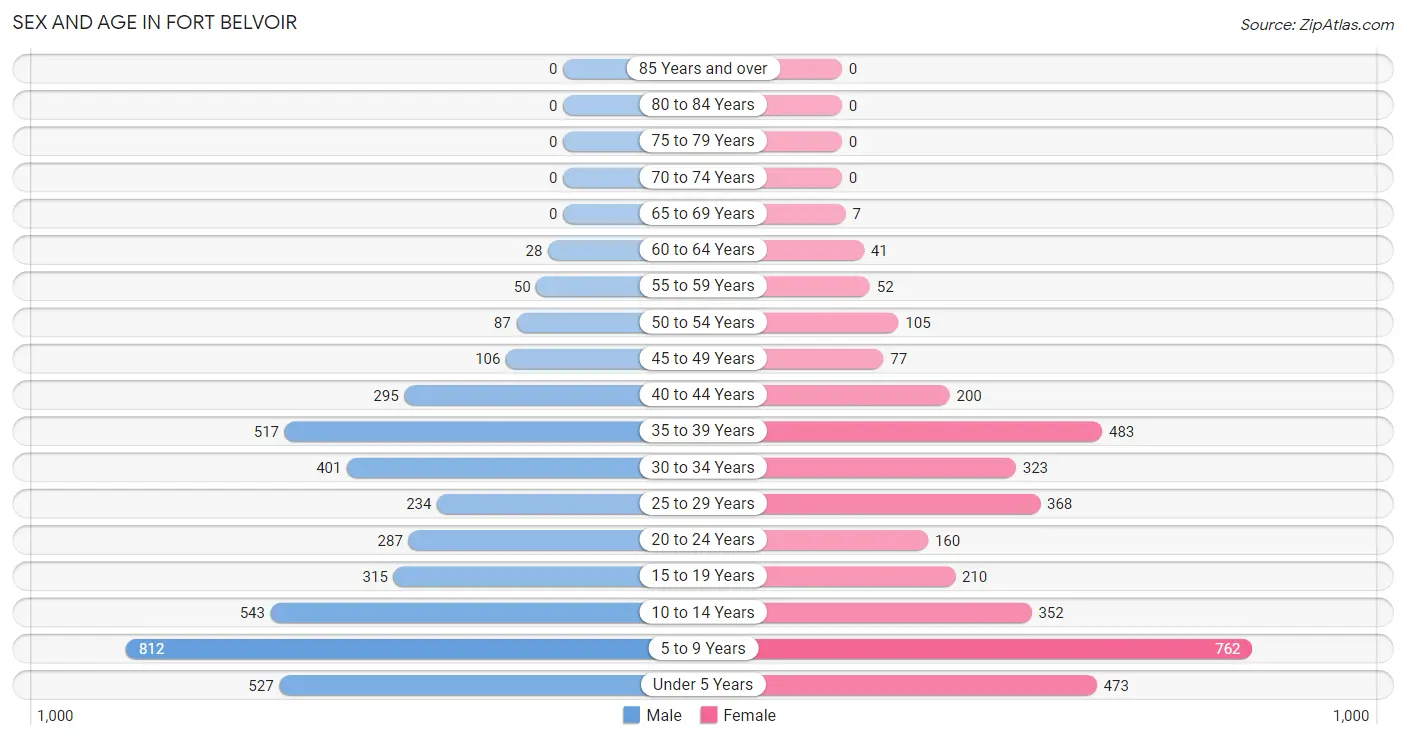
The most populous age groups in Fort Belvoir are 5 to 9 Years (812 | 19.3%) for men and 5 to 9 Years (762 | 21.1%) for women.
| Age Bracket | Male | Female |
| Under 5 Years | 527 (12.5%) | 473 (13.1%) |
| 5 to 9 Years | 812 (19.3%) | 762 (21.1%) |
| 10 to 14 Years | 543 (12.9%) | 352 (9.7%) |
| 15 to 19 Years | 315 (7.5%) | 210 (5.8%) |
| 20 to 24 Years | 287 (6.8%) | 160 (4.4%) |
| 25 to 29 Years | 234 (5.6%) | 368 (10.2%) |
| 30 to 34 Years | 401 (9.5%) | 323 (8.9%) |
| 35 to 39 Years | 517 (12.3%) | 483 (13.4%) |
| 40 to 44 Years | 295 (7.0%) | 200 (5.5%) |
| 45 to 49 Years | 106 (2.5%) | 77 (2.1%) |
| 50 to 54 Years | 87 (2.1%) | 105 (2.9%) |
| 55 to 59 Years | 50 (1.2%) | 52 (1.4%) |
| 60 to 64 Years | 28 (0.7%) | 41 (1.1%) |
| 65 to 69 Years | 0 (0.0%) | 7 (0.2%) |
| 70 to 74 Years | 0 (0.0%) | 0 (0.0%) |
| 75 to 79 Years | 0 (0.0%) | 0 (0.0%) |
| 80 to 84 Years | 0 (0.0%) | 0 (0.0%) |
| 85 Years and over | 0 (0.0%) | 0 (0.0%) |
| Total | 4,202 (100.0%) | 3,613 (100.0%) |
Families and Households in Fort Belvoir
Median Family Size in Fort Belvoir
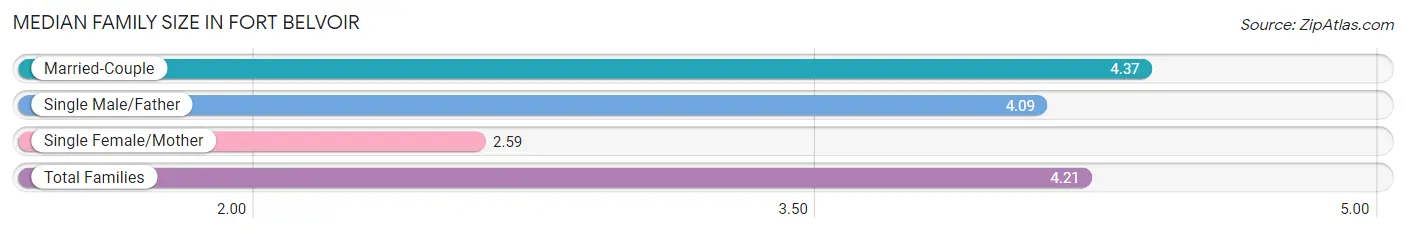
The median family size in Fort Belvoir is 4.21 persons per family, with married-couple families (1,568 | 89.9%) accounting for the largest median family size of 4.37 persons per family. On the other hand, single female/mother families (153 | 8.8%) represent the smallest median family size with 2.59 persons per family.
| Family Type | # Families | Family Size |
| Married-Couple | 1,568 (89.9%) | 4.37 |
| Single Male/Father | 23 (1.3%) | 4.09 |
| Single Female/Mother | 153 (8.8%) | 2.59 |
| Total Families | 1,744 (100.0%) | 4.21 |
Median Household Size in Fort Belvoir
| Household Type | # Households | Household Size |
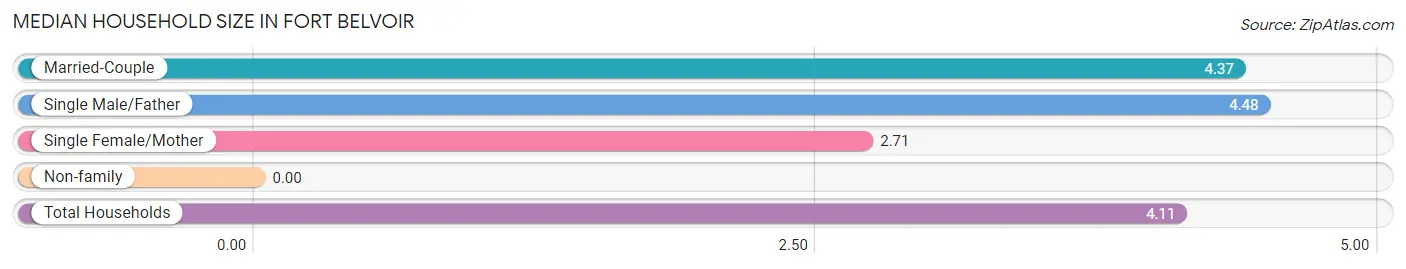
| Married-Couple | 1,568 (86.6%) | 4.37 |
| Single Male/Father | 23 (1.3%) | 4.48 |
| Single Female/Mother | 153 (8.5%) | 2.71 |
| Non-family | 66 (3.6%) | - |
| Total Households | 1,810 (100.0%) | 4.11 |
Household Size by Marriage Status in Fort Belvoir
Out of a total of 1,810 households in Fort Belvoir, 1,744 (96.4%) are family households, while 66 (3.6%) are nonfamily households. The most numerous type of family households are 4-person households, comprising 525, and the most common type of nonfamily households are 1-person households, comprising 66.
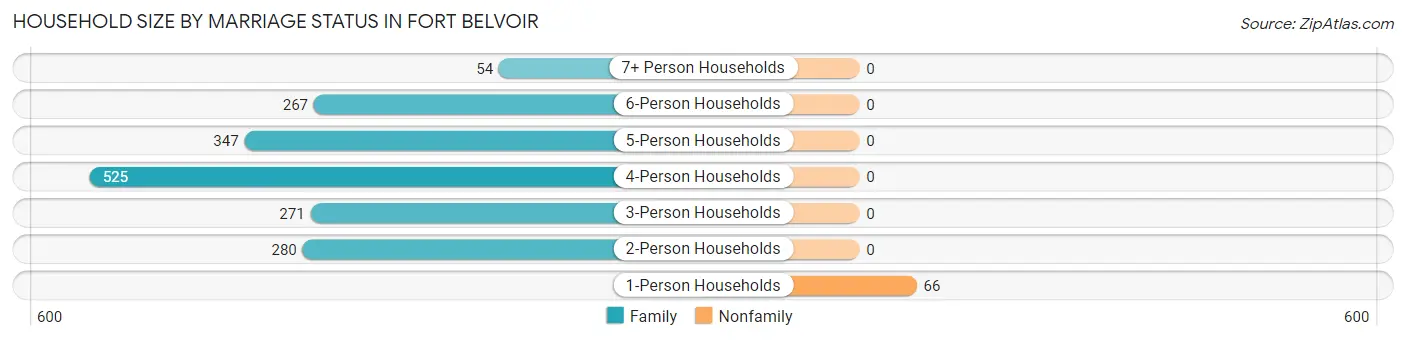
| Household Size | Family Households | Nonfamily Households |
| 1-Person Households | - | 66 (3.6%) |
| 2-Person Households | 280 (15.5%) | 0 (0.0%) |
| 3-Person Households | 271 (15.0%) | 0 (0.0%) |
| 4-Person Households | 525 (29.0%) | 0 (0.0%) |
| 5-Person Households | 347 (19.2%) | 0 (0.0%) |
| 6-Person Households | 267 (14.7%) | 0 (0.0%) |
| 7+ Person Households | 54 (3.0%) | 0 (0.0%) |
| Total | 1,744 (96.4%) | 66 (3.6%) |
Female Fertility in Fort Belvoir
Fertility by Age in Fort Belvoir
Average fertility rate in Fort Belvoir is 115.0 births per 1,000 women. Women in the age bracket of 20 to 34 years have the highest fertility rate with 190.0 births per 1,000 women. Women in the age bracket of 20 to 34 years acount for 77.1% of all women with births.
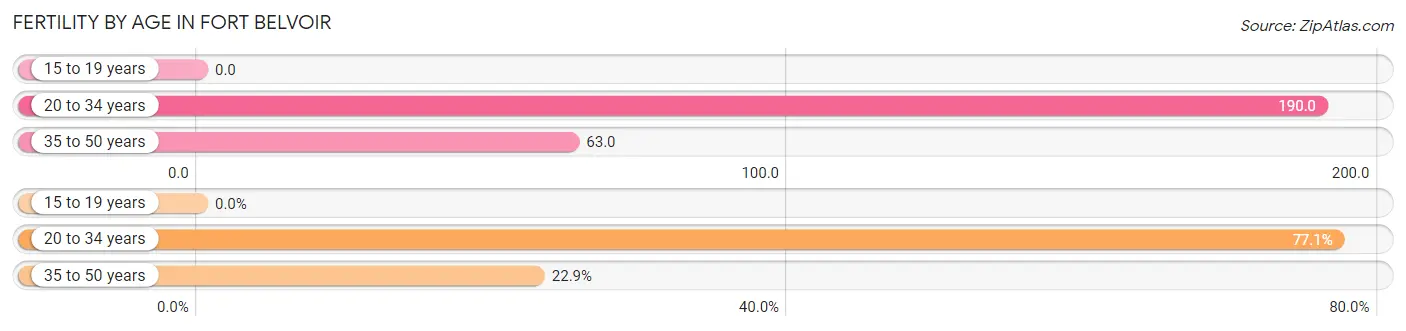
| Age Bracket | Women with Births | Births / 1,000 Women |
| 15 to 19 years | 0 (0.0%) | 0.0 |
| 20 to 34 years | 162 (77.1%) | 190.0 |
| 35 to 50 years | 48 (22.9%) | 63.0 |
| Total | 210 (100.0%) | 115.0 |
Fertility by Age by Marriage Status in Fort Belvoir
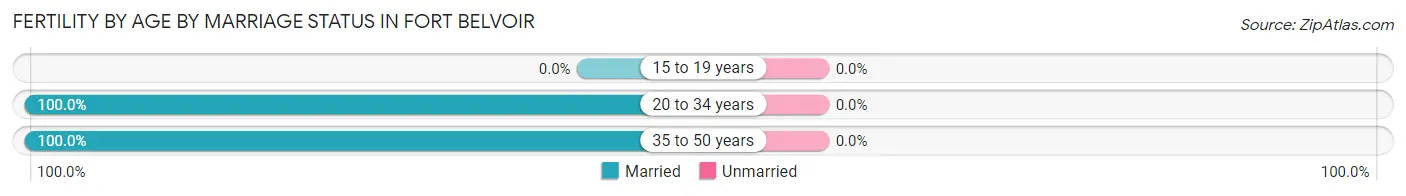
| Age Bracket | Married | Unmarried |
| 15 to 19 years | 0 (0.0%) | 0 (0.0%) |
| 20 to 34 years | 162 (100.0%) | 0 (0.0%) |
| 35 to 50 years | 48 (100.0%) | 0 (0.0%) |
| Total | 210 (100.0%) | 0 (0.0%) |
Fertility by Education in Fort Belvoir
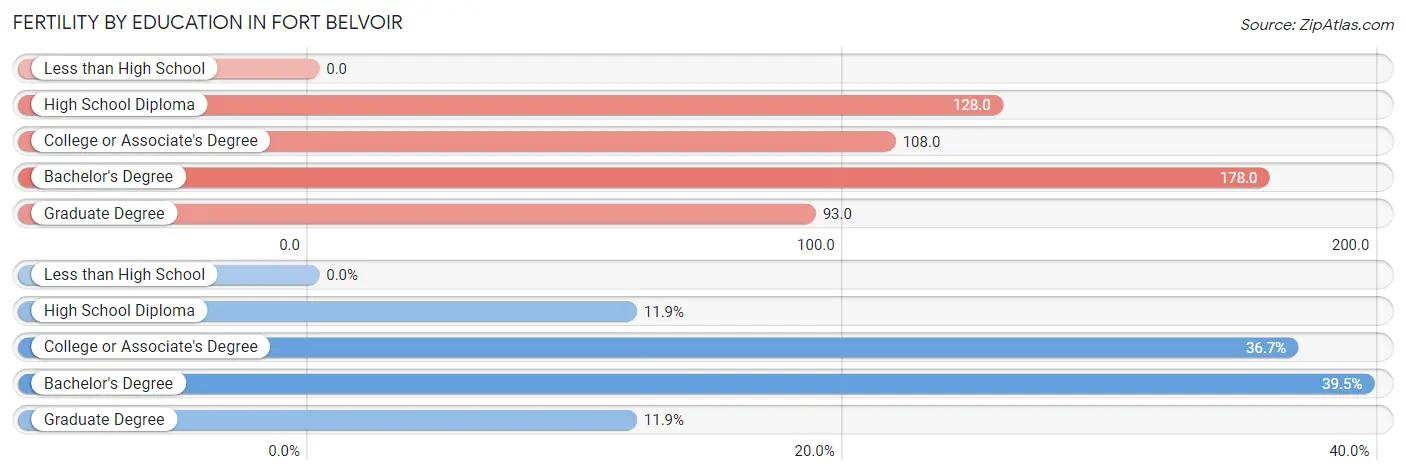
| Educational Attainment | Women with Births | Births / 1,000 Women |
| Less than High School | 0 (0.0%) | 0.0 |
| High School Diploma | 25 (11.9%) | 128.0 |
| College or Associate's Degree | 77 (36.7%) | 108.0 |
| Bachelor's Degree | 83 (39.5%) | 178.0 |
| Graduate Degree | 25 (11.9%) | 93.0 |
| Total | 210 (100.0%) | 115.0 |
Fertility by Education by Marriage Status in Fort Belvoir
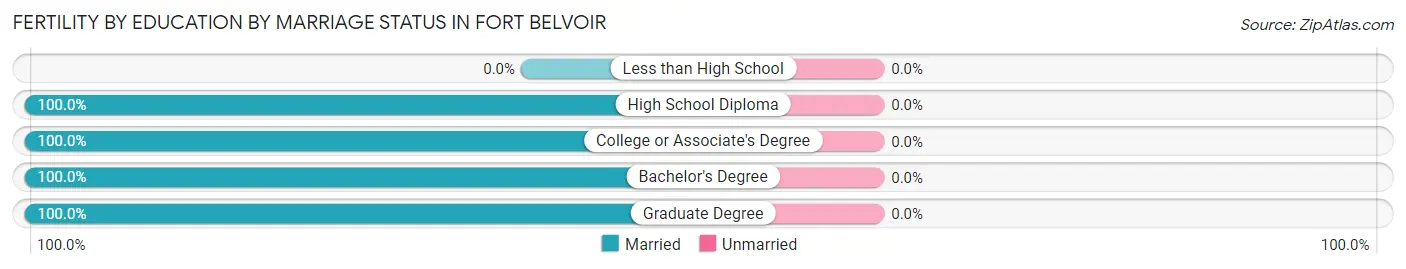
| Educational Attainment | Married | Unmarried |
| Less than High School | 0 (0.0%) | 0 (0.0%) |
| High School Diploma | 25 (100.0%) | 0 (0.0%) |
| College or Associate's Degree | 77 (100.0%) | 0 (0.0%) |
| Bachelor's Degree | 83 (100.0%) | 0 (0.0%) |
| Graduate Degree | 25 (100.0%) | 0 (0.0%) |
| Total | 210 (100.0%) | 0 (0.0%) |
Employment Characteristics in Fort Belvoir
Employment by Class of Employer in Fort Belvoir
Among the 3,031 employed individuals in Fort Belvoir, federal government employees (2,229 | 73.5%), private company employees (524 | 17.3%), and not-for-profit organizations (107 | 3.5%) make up the most common classes of employment.
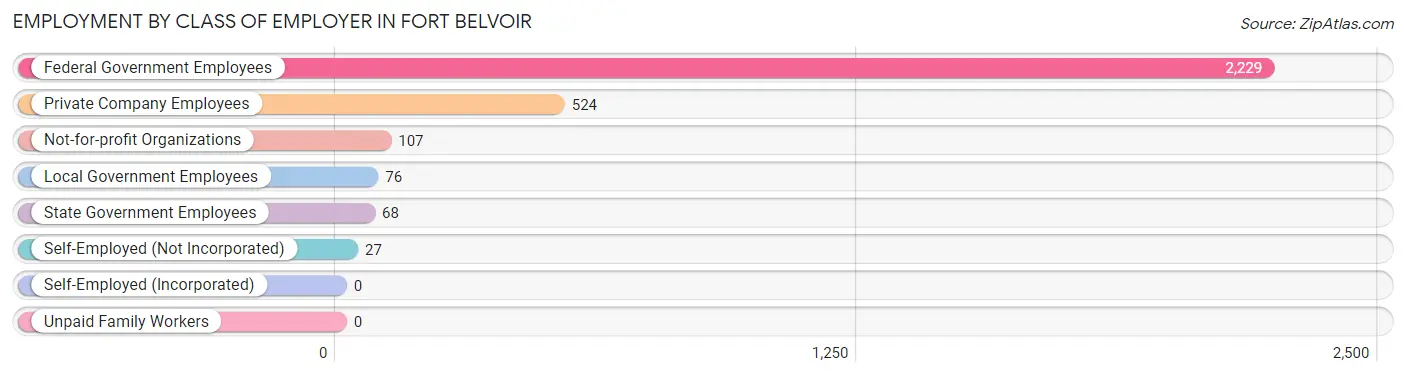
| Employer Class | # Employees | % Employees |
| Private Company Employees | 524 | 17.3% |
| Self-Employed (Incorporated) | 0 | 0.0% |
| Self-Employed (Not Incorporated) | 27 | 0.9% |
| Not-for-profit Organizations | 107 | 3.5% |
| Local Government Employees | 76 | 2.5% |
| State Government Employees | 68 | 2.2% |
| Federal Government Employees | 2,229 | 73.5% |
| Unpaid Family Workers | 0 | 0.0% |
| Total | 3,031 | 100.0% |
Employment Status by Age in Fort Belvoir
According to the labor force statistics for Fort Belvoir, out of the total population over 16 years of age (4,242), 73.1% or 3,101 individuals are in the labor force, with 5.8% or 180 of them unemployed. The age group with the highest labor force participation rate is 45 to 54 years, with 88.3% or 331 individuals in the labor force. Within the labor force, the 25 to 29 years age range has the highest percentage of unemployed individuals, with 27.7% or 104 of them being unemployed.
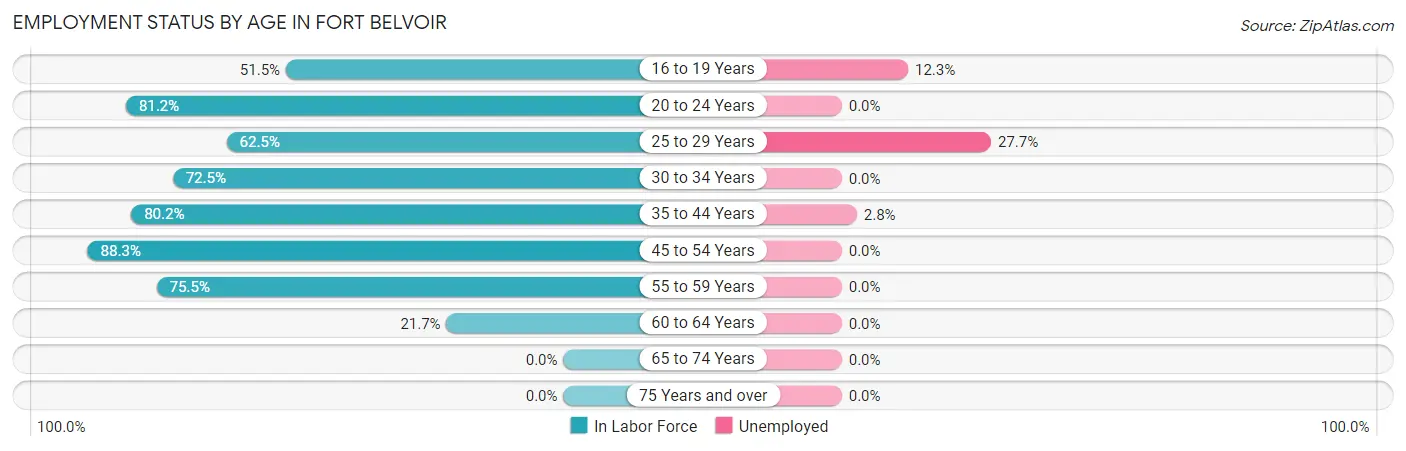
| Age Bracket | In Labor Force | Unemployed |
| 16 to 19 Years | 217 (51.5%) | 27 (12.3%) |
| 20 to 24 Years | 363 (81.2%) | 0 (0.0%) |
| 25 to 29 Years | 376 (62.5%) | 104 (27.7%) |
| 30 to 34 Years | 525 (72.5%) | 0 (0.0%) |
| 35 to 44 Years | 1,199 (80.2%) | 34 (2.8%) |
| 45 to 54 Years | 331 (88.3%) | 0 (0.0%) |
| 55 to 59 Years | 77 (75.5%) | 0 (0.0%) |
| 60 to 64 Years | 15 (21.7%) | 0 (0.0%) |
| 65 to 74 Years | 0 (0.0%) | 0 (0.0%) |
| 75 Years and over | 0 (0.0%) | 0 (0.0%) |
| Total | 3,101 (73.1%) | 180 (5.8%) |
Employment Status by Educational Attainment in Fort Belvoir
According to labor force statistics for Fort Belvoir, 74.9% of individuals (2,522) out of the total population between 25 and 64 years of age (3,367) are in the labor force, with 5.7% or 144 of them being unemployed. The group with the highest labor force participation rate are those with the educational attainment of bachelor's degree or higher, with 80.6% or 1,402 individuals in the labor force. Within the labor force, individuals with college / associate degree education have the highest percentage of unemployment, with 9.9% or 98 of them being unemployed.
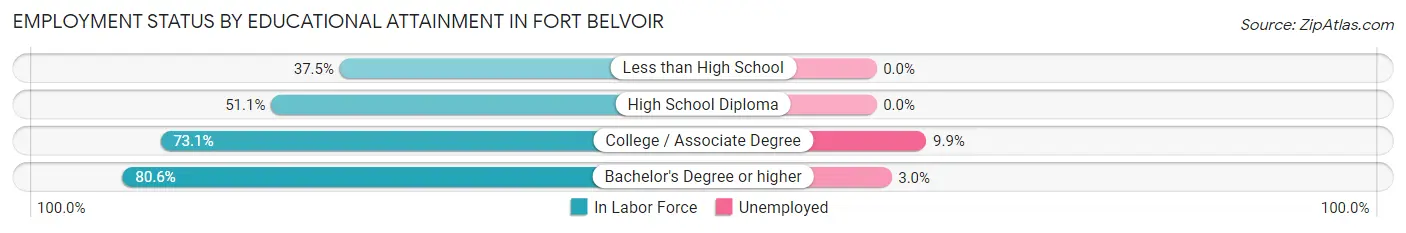
| Educational Attainment | In Labor Force | Unemployed |
| Less than High School | 21 (37.5%) | 0 (0.0%) |
| High School Diploma | 115 (51.1%) | 0 (0.0%) |
| College / Associate Degree | 985 (73.1%) | 133 (9.9%) |
| Bachelor's Degree or higher | 1,402 (80.6%) | 52 (3.0%) |
| Total | 2,522 (74.9%) | 192 (5.7%) |
Employment Occupations by Sex in Fort Belvoir
Management, Business, Science and Arts Occupations
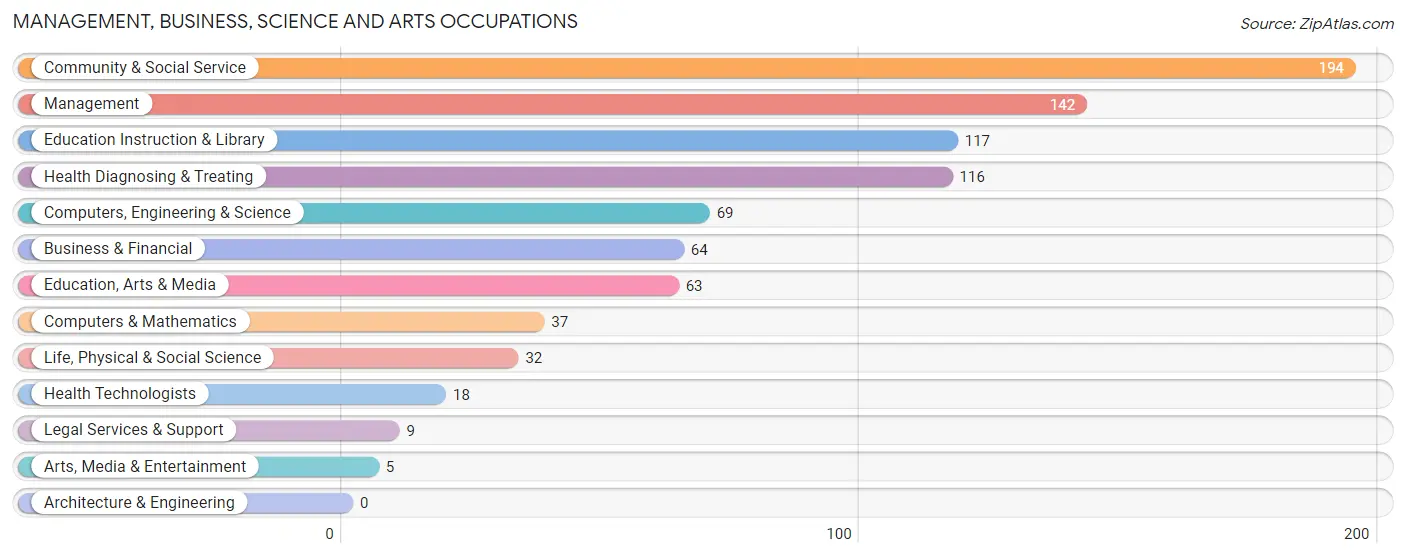
The most common Management, Business, Science and Arts occupations in Fort Belvoir are Community & Social Service (194 | 16.5%), Management (142 | 12.1%), Education Instruction & Library (117 | 10.0%), Health Diagnosing & Treating (116 | 9.9%), and Computers, Engineering & Science (69 | 5.9%).
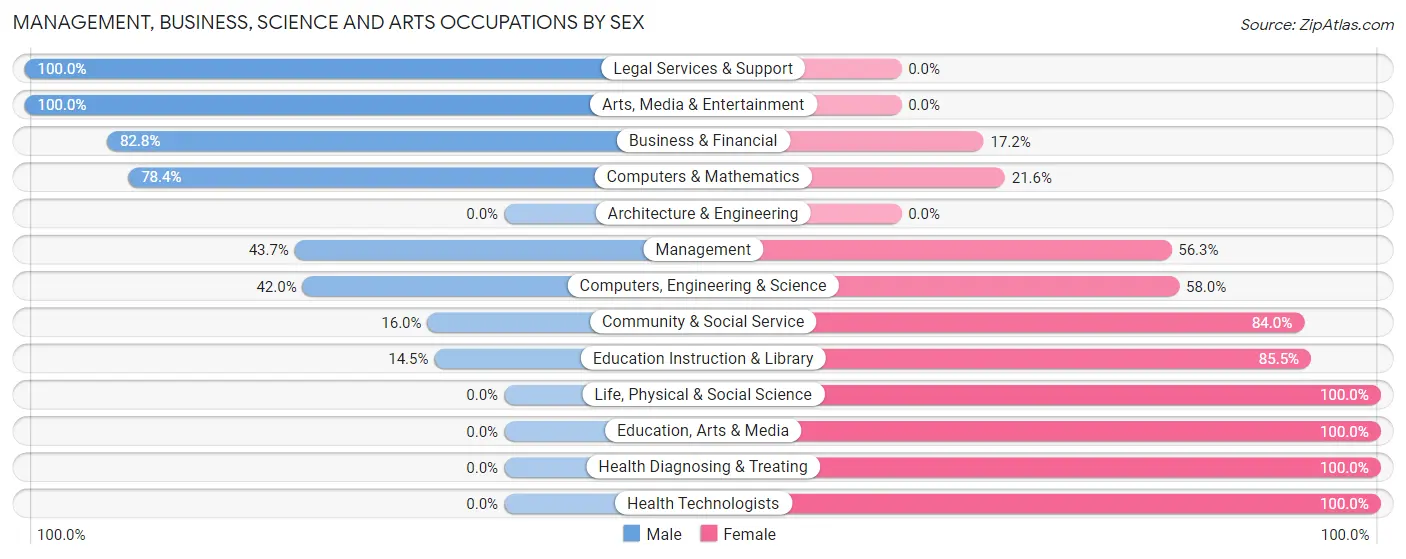
Management, Business, Science and Arts Occupations by Sex
Within the Management, Business, Science and Arts occupations in Fort Belvoir, the most male-oriented occupations are Legal Services & Support (100.0%), Arts, Media & Entertainment (100.0%), and Business & Financial (82.8%), while the most female-oriented occupations are Life, Physical & Social Science (100.0%), Education, Arts & Media (100.0%), and Health Diagnosing & Treating (100.0%).
| Occupation | Male | Female |
| Management | 62 (43.7%) | 80 (56.3%) |
| Business & Financial | 53 (82.8%) | 11 (17.2%) |
| Computers, Engineering & Science | 29 (42.0%) | 40 (58.0%) |
| Computers & Mathematics | 29 (78.4%) | 8 (21.6%) |
| Architecture & Engineering | 0 (0.0%) | 0 (0.0%) |
| Life, Physical & Social Science | 0 (0.0%) | 32 (100.0%) |
| Community & Social Service | 31 (16.0%) | 163 (84.0%) |
| Education, Arts & Media | 0 (0.0%) | 63 (100.0%) |
| Legal Services & Support | 9 (100.0%) | 0 (0.0%) |
| Education Instruction & Library | 17 (14.5%) | 100 (85.5%) |
| Arts, Media & Entertainment | 5 (100.0%) | 0 (0.0%) |
| Health Diagnosing & Treating | 0 (0.0%) | 116 (100.0%) |
| Health Technologists | 0 (0.0%) | 18 (100.0%) |
| Total (Category) | 175 (29.9%) | 410 (70.1%) |
| Total (Overall) | 419 (35.7%) | 755 (64.3%) |
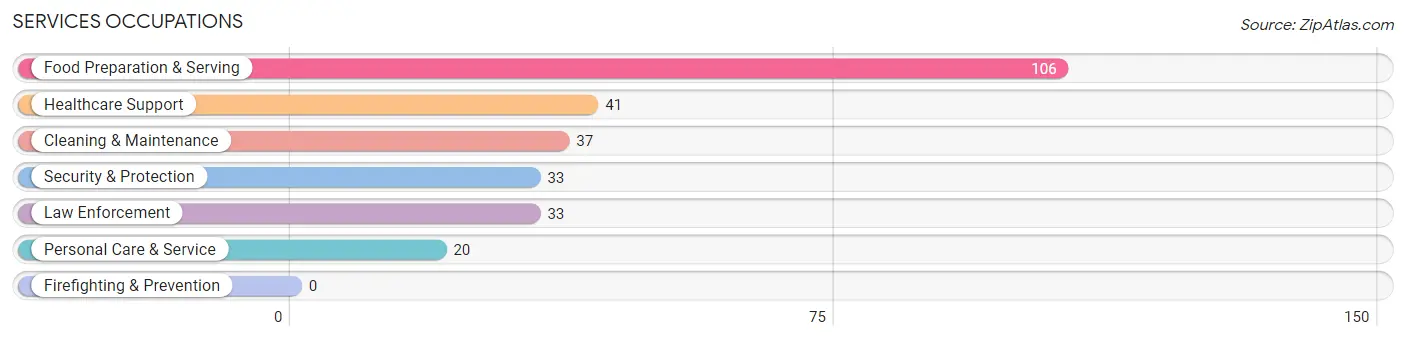
Services Occupations
The most common Services occupations in Fort Belvoir are Food Preparation & Serving (106 | 9.0%), Healthcare Support (41 | 3.5%), Cleaning & Maintenance (37 | 3.2%), Security & Protection (33 | 2.8%), and Law Enforcement (33 | 2.8%).
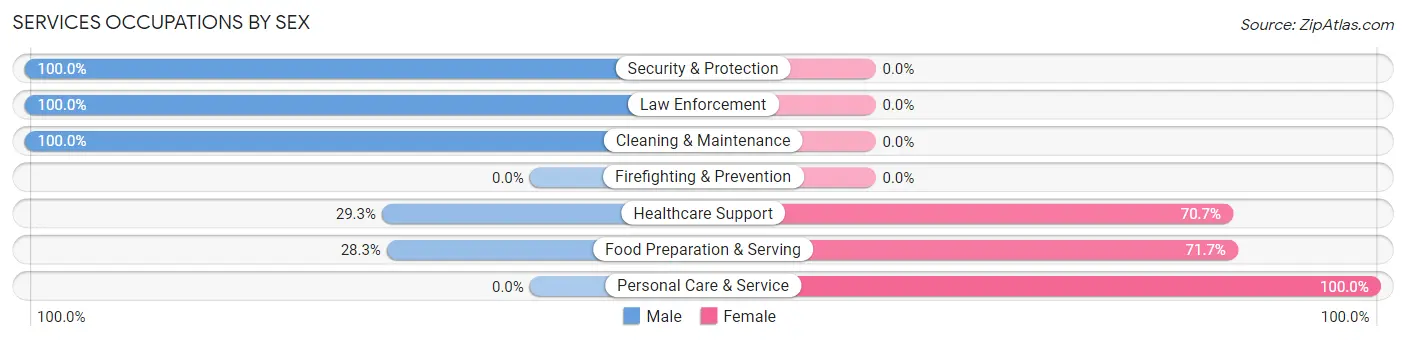
Services Occupations by Sex
Within the Services occupations in Fort Belvoir, the most male-oriented occupations are Security & Protection (100.0%), Law Enforcement (100.0%), and Cleaning & Maintenance (100.0%), while the most female-oriented occupations are Personal Care & Service (100.0%), Food Preparation & Serving (71.7%), and Healthcare Support (70.7%).
| Occupation | Male | Female |
| Healthcare Support | 12 (29.3%) | 29 (70.7%) |
| Security & Protection | 33 (100.0%) | 0 (0.0%) |
| Firefighting & Prevention | 0 (0.0%) | 0 (0.0%) |
| Law Enforcement | 33 (100.0%) | 0 (0.0%) |
| Food Preparation & Serving | 30 (28.3%) | 76 (71.7%) |
| Cleaning & Maintenance | 37 (100.0%) | 0 (0.0%) |
| Personal Care & Service | 0 (0.0%) | 20 (100.0%) |
| Total (Category) | 112 (47.3%) | 125 (52.7%) |
| Total (Overall) | 419 (35.7%) | 755 (64.3%) |
Sales and Office Occupations
The most common Sales and Office occupations in Fort Belvoir are Sales & Related (148 | 12.6%), and Office & Administration (128 | 10.9%).
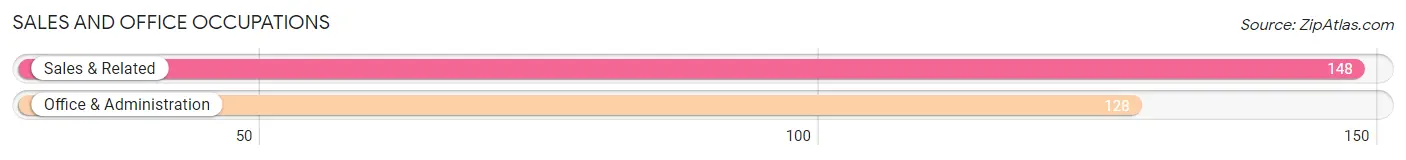
Sales and Office Occupations by Sex
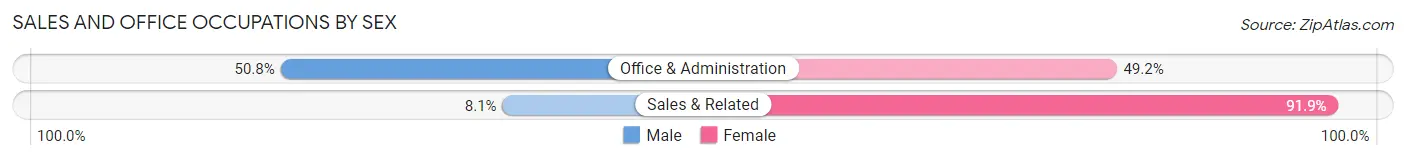
| Occupation | Male | Female |
| Sales & Related | 12 (8.1%) | 136 (91.9%) |
| Office & Administration | 65 (50.8%) | 63 (49.2%) |
| Total (Category) | 77 (27.9%) | 199 (72.1%) |
| Total (Overall) | 419 (35.7%) | 755 (64.3%) |
Natural Resources, Construction and Maintenance Occupations
The most common Natural Resources, Construction and Maintenance occupations in Fort Belvoir are Installation, Maintenance & Repair (28 | 2.4%), Farming, Fishing & Forestry (10 | 0.9%), and Construction & Extraction (1 | 0.1%).
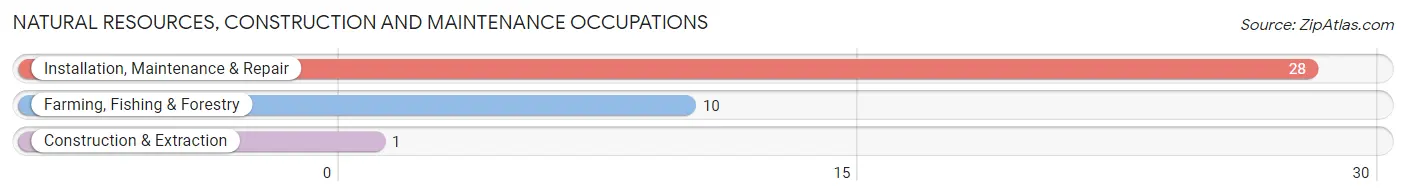
Natural Resources, Construction and Maintenance Occupations by Sex
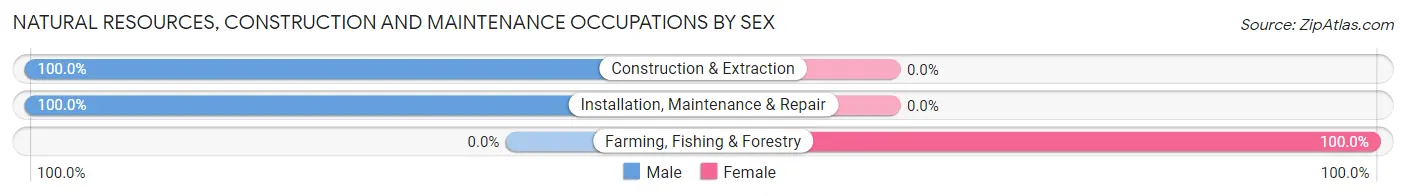
| Occupation | Male | Female |
| Farming, Fishing & Forestry | 0 (0.0%) | 10 (100.0%) |
| Construction & Extraction | 1 (100.0%) | 0 (0.0%) |
| Installation, Maintenance & Repair | 28 (100.0%) | 0 (0.0%) |
| Total (Category) | 29 (74.4%) | 10 (25.6%) |
| Total (Overall) | 419 (35.7%) | 755 (64.3%) |
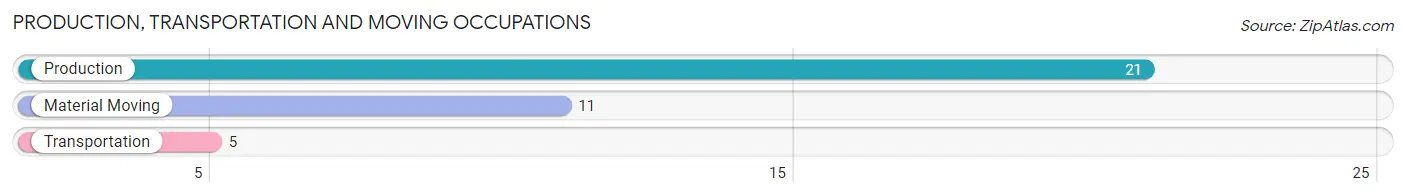
Production, Transportation and Moving Occupations
The most common Production, Transportation and Moving occupations in Fort Belvoir are Production (21 | 1.8%), Material Moving (11 | 0.9%), and Transportation (5 | 0.4%).
Production, Transportation and Moving Occupations by Sex
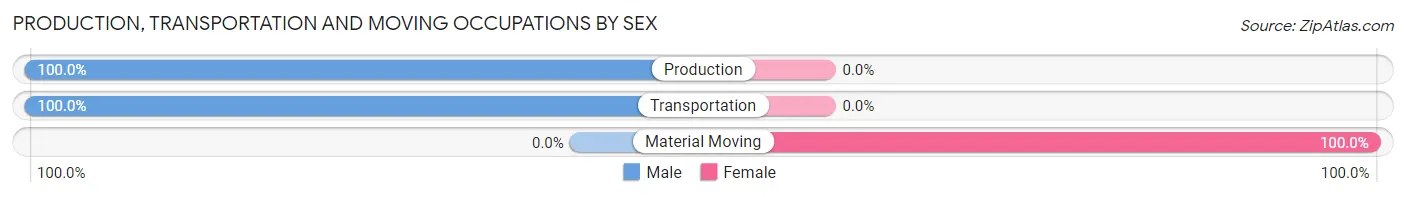
| Occupation | Male | Female |
| Production | 21 (100.0%) | 0 (0.0%) |
| Transportation | 5 (100.0%) | 0 (0.0%) |
| Material Moving | 0 (0.0%) | 11 (100.0%) |
| Total (Category) | 26 (70.3%) | 11 (29.7%) |
| Total (Overall) | 419 (35.7%) | 755 (64.3%) |
Employment Industries by Sex in Fort Belvoir
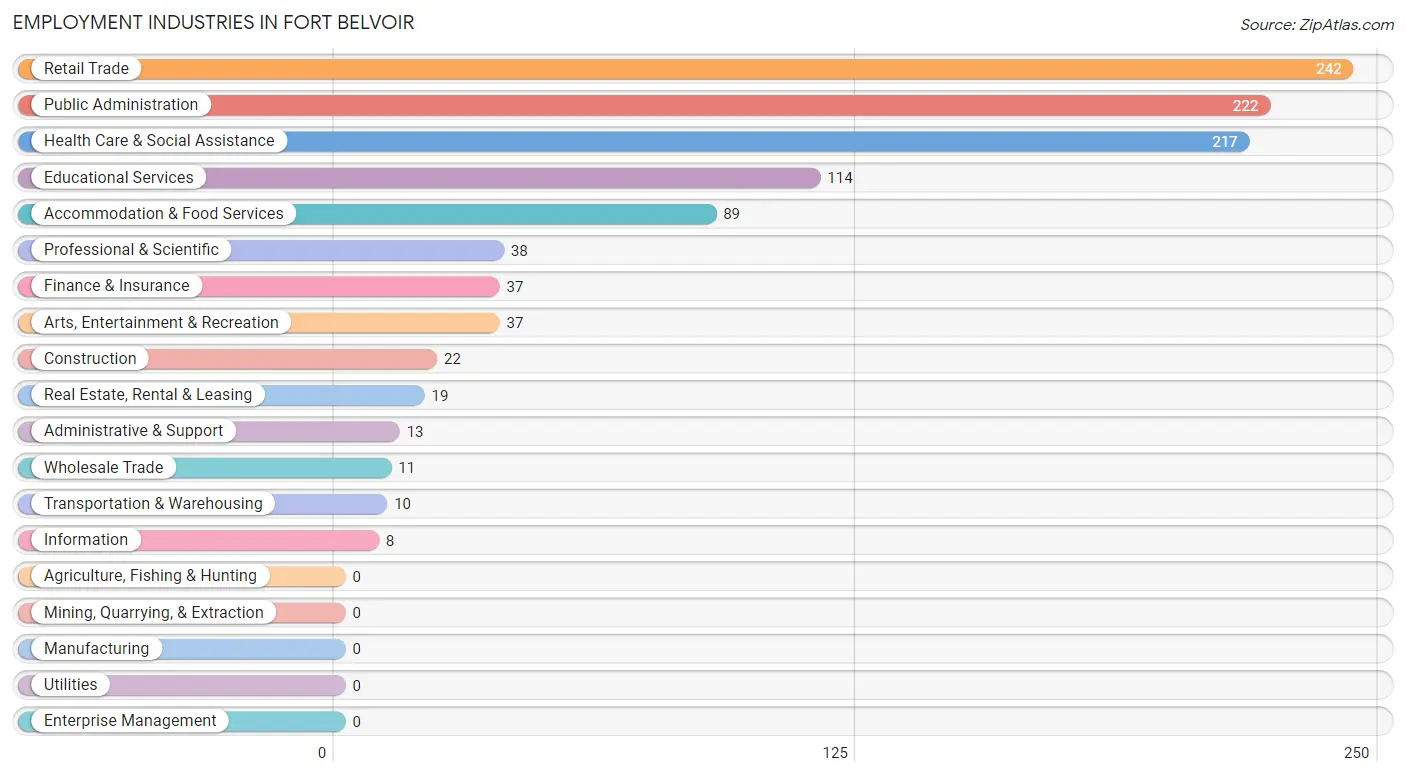
Employment Industries in Fort Belvoir
The major employment industries in Fort Belvoir include Retail Trade (242 | 20.6%), Public Administration (222 | 18.9%), Health Care & Social Assistance (217 | 18.5%), Educational Services (114 | 9.7%), and Accommodation & Food Services (89 | 7.6%).
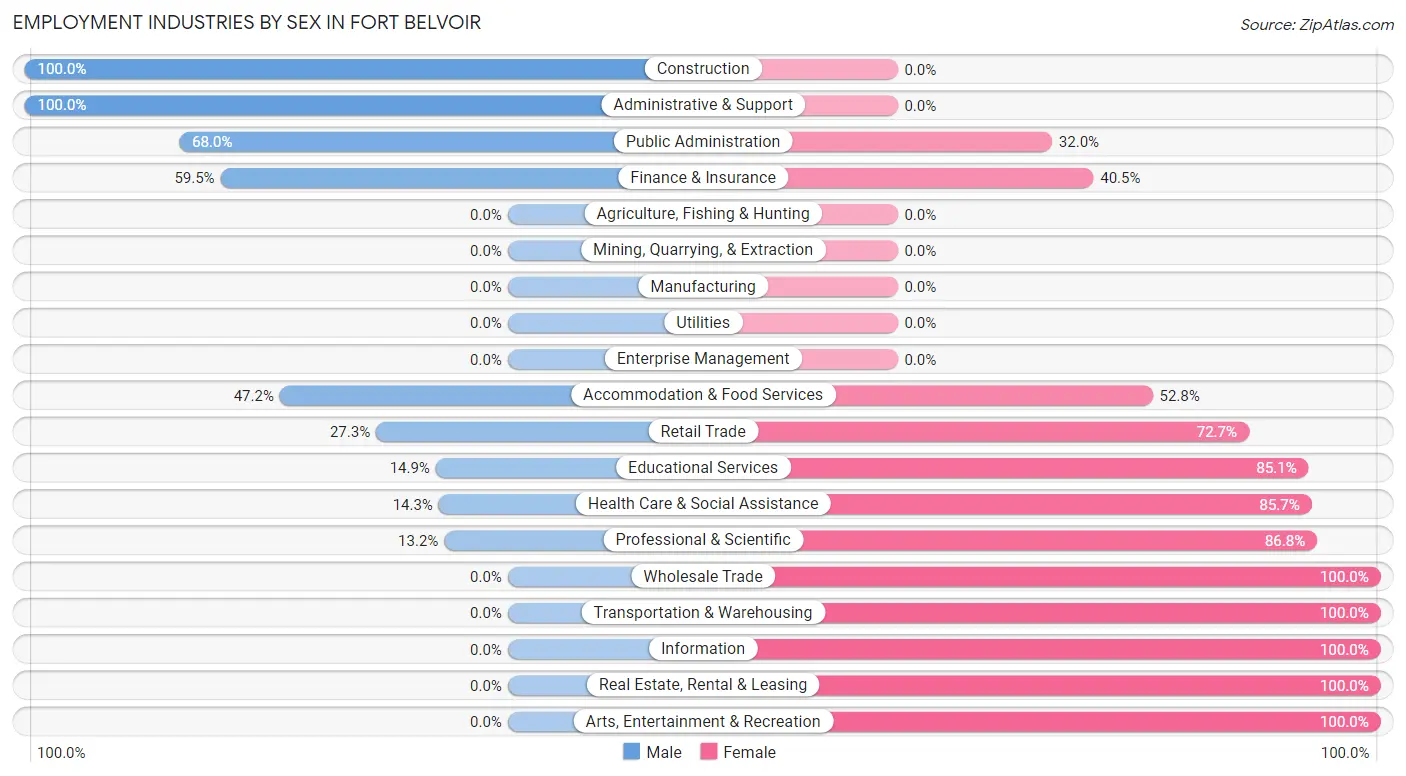
Employment Industries by Sex in Fort Belvoir
The Fort Belvoir industries that see more men than women are Construction (100.0%), Administrative & Support (100.0%), and Public Administration (68.0%), whereas the industries that tend to have a higher number of women are Wholesale Trade (100.0%), Transportation & Warehousing (100.0%), and Information (100.0%).
| Industry | Male | Female |
| Agriculture, Fishing & Hunting | 0 (0.0%) | 0 (0.0%) |
| Mining, Quarrying, & Extraction | 0 (0.0%) | 0 (0.0%) |
| Construction | 22 (100.0%) | 0 (0.0%) |
| Manufacturing | 0 (0.0%) | 0 (0.0%) |
| Wholesale Trade | 0 (0.0%) | 11 (100.0%) |
| Retail Trade | 66 (27.3%) | 176 (72.7%) |
| Transportation & Warehousing | 0 (0.0%) | 10 (100.0%) |
| Utilities | 0 (0.0%) | 0 (0.0%) |
| Information | 0 (0.0%) | 8 (100.0%) |
| Finance & Insurance | 22 (59.5%) | 15 (40.5%) |
| Real Estate, Rental & Leasing | 0 (0.0%) | 19 (100.0%) |
| Professional & Scientific | 5 (13.2%) | 33 (86.8%) |
| Enterprise Management | 0 (0.0%) | 0 (0.0%) |
| Administrative & Support | 13 (100.0%) | 0 (0.0%) |
| Educational Services | 17 (14.9%) | 97 (85.1%) |
| Health Care & Social Assistance | 31 (14.3%) | 186 (85.7%) |
| Arts, Entertainment & Recreation | 0 (0.0%) | 37 (100.0%) |
| Accommodation & Food Services | 42 (47.2%) | 47 (52.8%) |
| Public Administration | 151 (68.0%) | 71 (32.0%) |
| Total | 419 (35.7%) | 755 (64.3%) |
Education in Fort Belvoir
School Enrollment in Fort Belvoir
The most common levels of schooling among the 3,670 students in Fort Belvoir are elementary school (1,065 | 29.0%), middle school (693 | 18.9%), and college / undergraduate (619 | 16.9%).
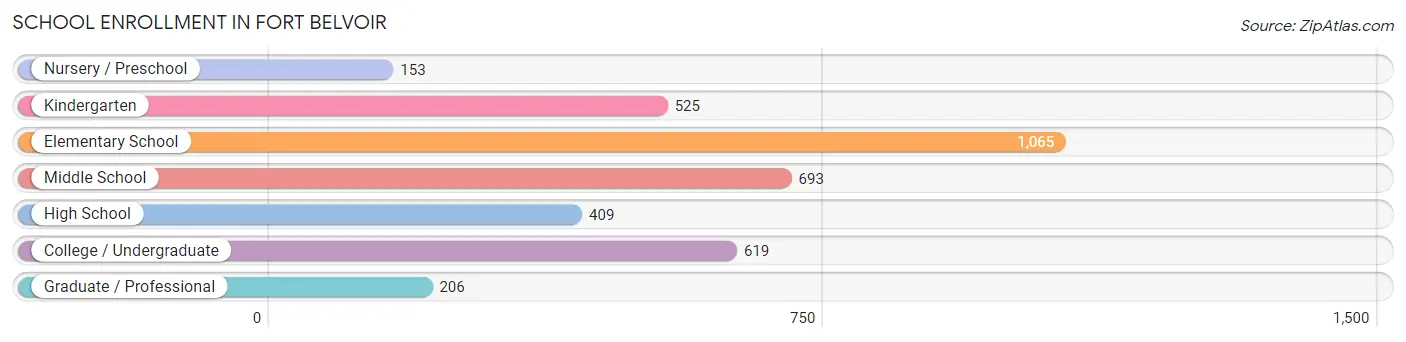
| School Level | # Students | % Students |
| Nursery / Preschool | 153 | 4.2% |
| Kindergarten | 525 | 14.3% |
| Elementary School | 1,065 | 29.0% |
| Middle School | 693 | 18.9% |
| High School | 409 | 11.1% |
| College / Undergraduate | 619 | 16.9% |
| Graduate / Professional | 206 | 5.6% |
| Total | 3,670 | 100.0% |
School Enrollment by Age by Funding Source in Fort Belvoir
Out of a total of 3,670 students who are enrolled in schools in Fort Belvoir, 862 (23.5%) attend a private institution, while the remaining 2,808 (76.5%) are enrolled in public schools. The age group of 3 to 4 year olds has the highest likelihood of being enrolled in private schools, with 79 (68.1% in the age bracket) enrolled. Conversely, the age group of 15 to 17 year olds has the lowest likelihood of being enrolled in a private school, with 251 (88.1% in the age bracket) attending a public institution.
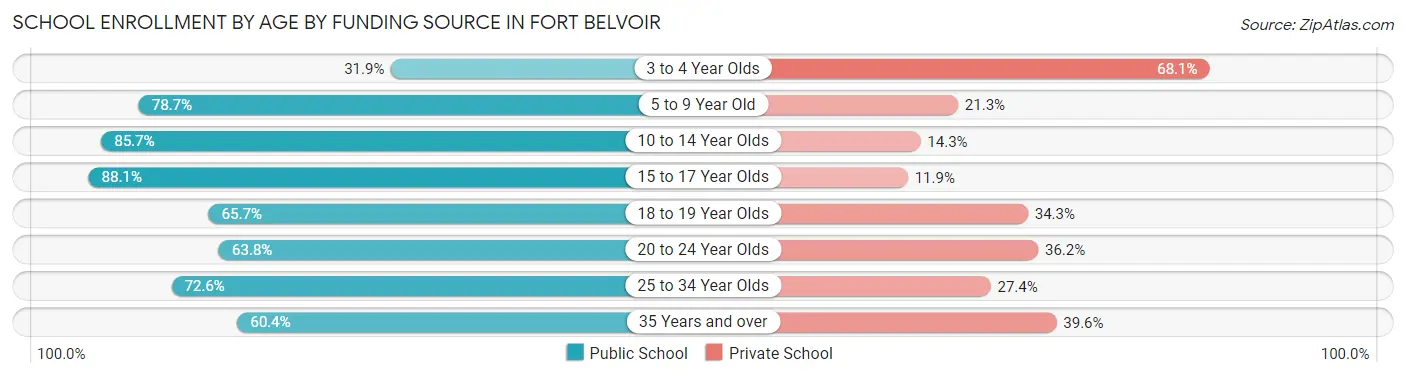
| Age Bracket | Public School | Private School |
| 3 to 4 Year Olds | 37 (31.9%) | 79 (68.1%) |
| 5 to 9 Year Old | 1,184 (78.7%) | 320 (21.3%) |
| 10 to 14 Year Olds | 738 (85.7%) | 123 (14.3%) |
| 15 to 17 Year Olds | 251 (88.1%) | 34 (11.9%) |
| 18 to 19 Year Olds | 69 (65.7%) | 36 (34.3%) |
| 20 to 24 Year Olds | 104 (63.8%) | 59 (36.2%) |
| 25 to 34 Year Olds | 231 (72.6%) | 87 (27.4%) |
| 35 Years and over | 192 (60.4%) | 126 (39.6%) |
| Total | 2,808 (76.5%) | 862 (23.5%) |
Educational Attainment by Field of Study in Fort Belvoir
Business (377 | 20.8%), science & technology (232 | 12.8%), arts & humanities (204 | 11.3%), psychology (165 | 9.1%), and education (130 | 7.2%) are the most common fields of study among 1,810 individuals in Fort Belvoir who have obtained a bachelor's degree or higher.
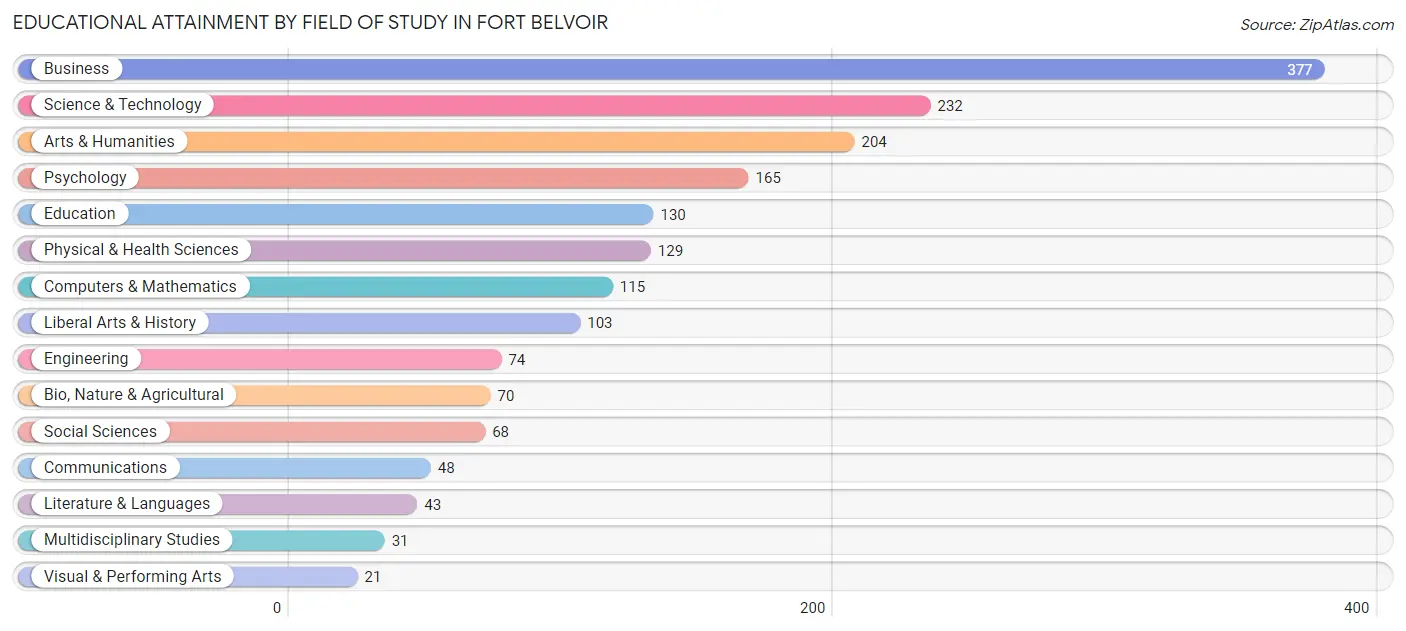
| Field of Study | # Graduates | % Graduates |
| Computers & Mathematics | 115 | 6.4% |
| Bio, Nature & Agricultural | 70 | 3.9% |
| Physical & Health Sciences | 129 | 7.1% |
| Psychology | 165 | 9.1% |
| Social Sciences | 68 | 3.8% |
| Engineering | 74 | 4.1% |
| Multidisciplinary Studies | 31 | 1.7% |
| Science & Technology | 232 | 12.8% |
| Business | 377 | 20.8% |
| Education | 130 | 7.2% |
| Literature & Languages | 43 | 2.4% |
| Liberal Arts & History | 103 | 5.7% |
| Visual & Performing Arts | 21 | 1.2% |
| Communications | 48 | 2.6% |
| Arts & Humanities | 204 | 11.3% |
| Total | 1,810 | 100.0% |
Transportation & Commute in Fort Belvoir
Vehicle Availability by Sex in Fort Belvoir
The most prevalent vehicle ownership categories in Fort Belvoir are males with 2 vehicles (1,279, accounting for 76.9%) and females with 2 vehicles (667, making up 124.3%).
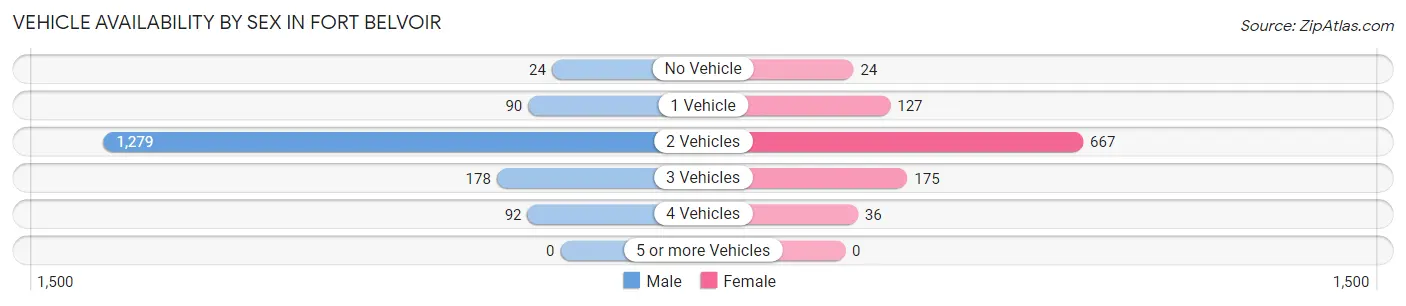
| Vehicles Available | Male | Female |
| No Vehicle | 24 (1.4%) | 24 (2.3%) |
| 1 Vehicle | 90 (5.4%) | 127 (12.3%) |
| 2 Vehicles | 1,279 (76.9%) | 667 (64.8%) |
| 3 Vehicles | 178 (10.7%) | 175 (17.0%) |
| 4 Vehicles | 92 (5.5%) | 36 (3.5%) |
| 5 or more Vehicles | 0 (0.0%) | 0 (0.0%) |
| Total | 1,663 (100.0%) | 1,029 (100.0%) |
Commute Time in Fort Belvoir
The most frequently occuring commute durations in Fort Belvoir are 10 to 14 minutes (560 commuters, 19.8%), 5 to 9 minutes (458 commuters, 16.2%), and 45 to 59 minutes (364 commuters, 12.9%).
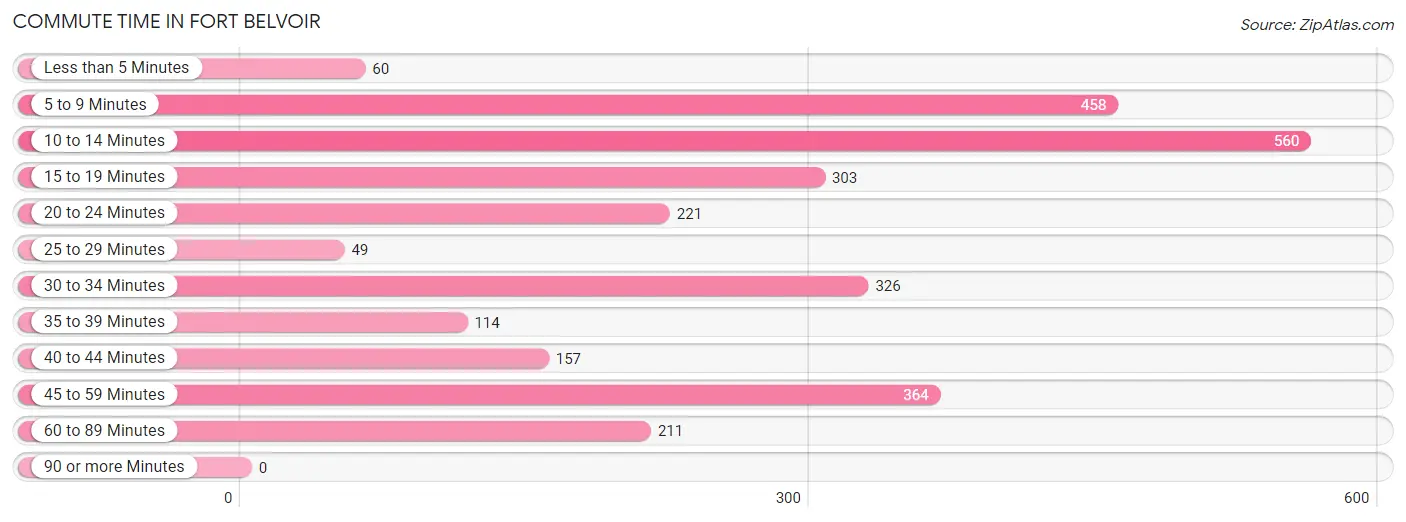
| Commute Time | # Commuters | % Commuters |
| Less than 5 Minutes | 60 | 2.1% |
| 5 to 9 Minutes | 458 | 16.2% |
| 10 to 14 Minutes | 560 | 19.8% |
| 15 to 19 Minutes | 303 | 10.7% |
| 20 to 24 Minutes | 221 | 7.8% |
| 25 to 29 Minutes | 49 | 1.7% |
| 30 to 34 Minutes | 326 | 11.6% |
| 35 to 39 Minutes | 114 | 4.0% |
| 40 to 44 Minutes | 157 | 5.6% |
| 45 to 59 Minutes | 364 | 12.9% |
| 60 to 89 Minutes | 211 | 7.5% |
| 90 or more Minutes | 0 | 0.0% |
Commute Time by Sex in Fort Belvoir
The most common commute times in Fort Belvoir are 10 to 14 minutes (340 commuters, 18.6%) for males and 10 to 14 minutes (220 commuters, 22.2%) for females.
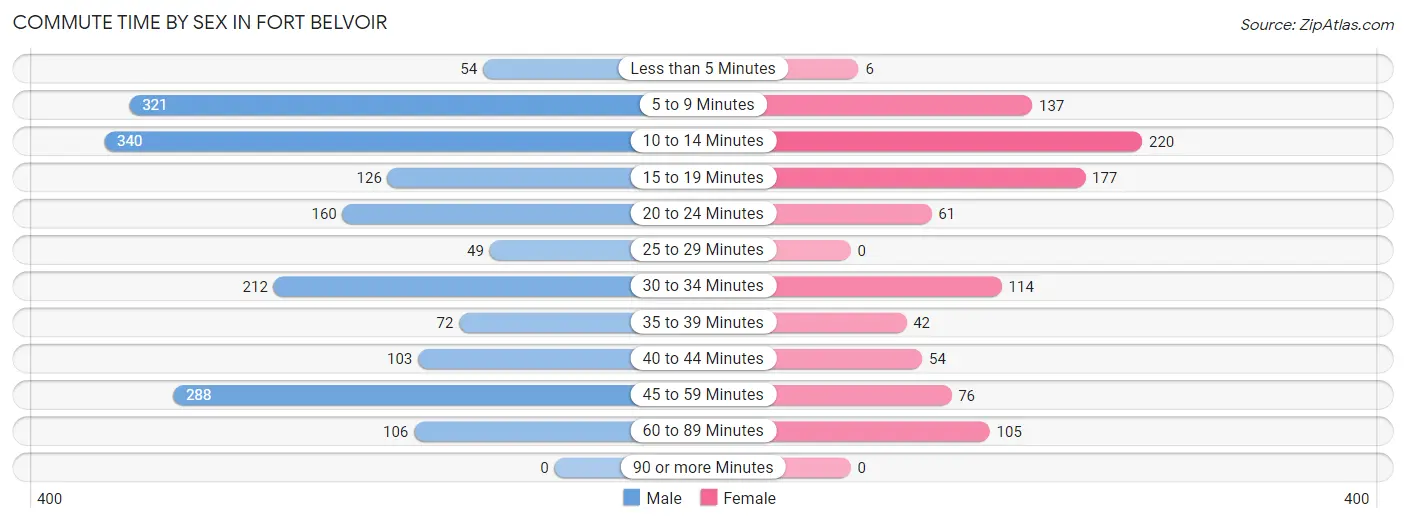
| Commute Time | Male | Female |
| Less than 5 Minutes | 54 (2.9%) | 6 (0.6%) |
| 5 to 9 Minutes | 321 (17.5%) | 137 (13.8%) |
| 10 to 14 Minutes | 340 (18.6%) | 220 (22.2%) |
| 15 to 19 Minutes | 126 (6.9%) | 177 (17.8%) |
| 20 to 24 Minutes | 160 (8.7%) | 61 (6.1%) |
| 25 to 29 Minutes | 49 (2.7%) | 0 (0.0%) |
| 30 to 34 Minutes | 212 (11.6%) | 114 (11.5%) |
| 35 to 39 Minutes | 72 (3.9%) | 42 (4.2%) |
| 40 to 44 Minutes | 103 (5.6%) | 54 (5.4%) |
| 45 to 59 Minutes | 288 (15.7%) | 76 (7.7%) |
| 60 to 89 Minutes | 106 (5.8%) | 105 (10.6%) |
| 90 or more Minutes | 0 (0.0%) | 0 (0.0%) |
Time of Departure to Work by Sex in Fort Belvoir
The most frequent times of departure to work in Fort Belvoir are 6:30 AM to 6:59 AM (312, 17.0%) for males and 8:00 AM to 8:29 AM (197, 19.9%) for females.
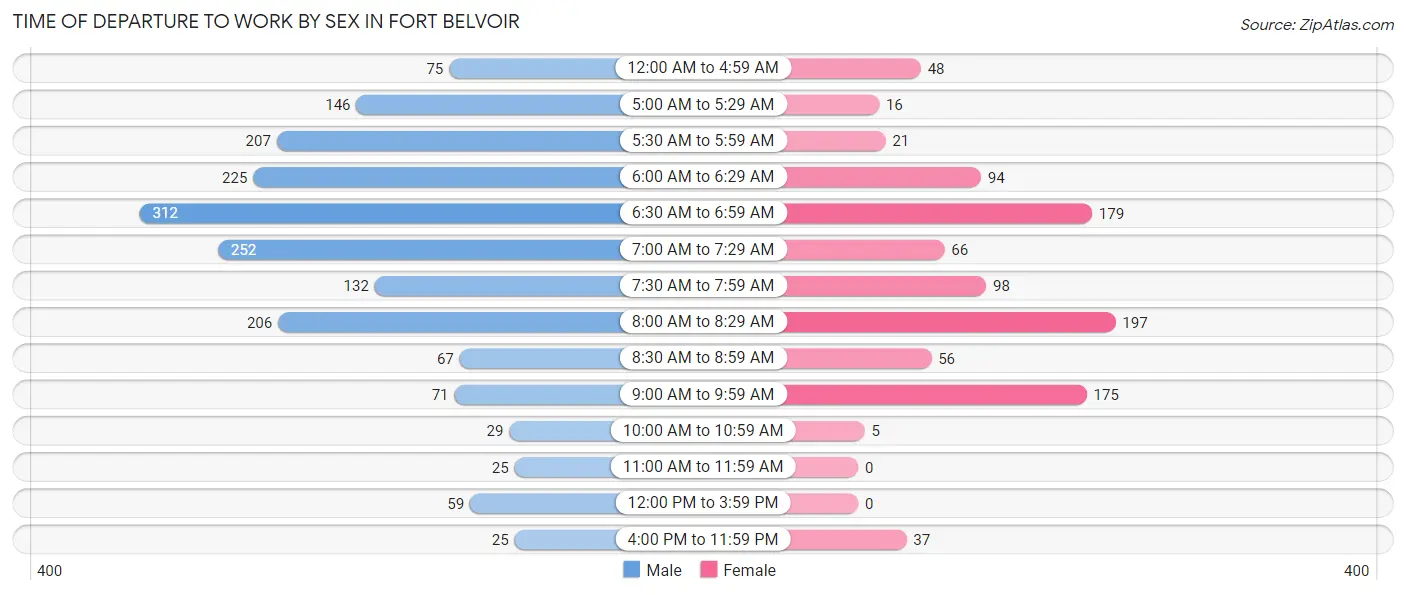
| Time of Departure | Male | Female |
| 12:00 AM to 4:59 AM | 75 (4.1%) | 48 (4.8%) |
| 5:00 AM to 5:29 AM | 146 (8.0%) | 16 (1.6%) |
| 5:30 AM to 5:59 AM | 207 (11.3%) | 21 (2.1%) |
| 6:00 AM to 6:29 AM | 225 (12.3%) | 94 (9.5%) |
| 6:30 AM to 6:59 AM | 312 (17.0%) | 179 (18.0%) |
| 7:00 AM to 7:29 AM | 252 (13.8%) | 66 (6.7%) |
| 7:30 AM to 7:59 AM | 132 (7.2%) | 98 (9.9%) |
| 8:00 AM to 8:29 AM | 206 (11.3%) | 197 (19.9%) |
| 8:30 AM to 8:59 AM | 67 (3.7%) | 56 (5.7%) |
| 9:00 AM to 9:59 AM | 71 (3.9%) | 175 (17.6%) |
| 10:00 AM to 10:59 AM | 29 (1.6%) | 5 (0.5%) |
| 11:00 AM to 11:59 AM | 25 (1.4%) | 0 (0.0%) |
| 12:00 PM to 3:59 PM | 59 (3.2%) | 0 (0.0%) |
| 4:00 PM to 11:59 PM | 25 (1.4%) | 37 (3.7%) |
| Total | 1,831 (100.0%) | 992 (100.0%) |
Housing Occupancy in Fort Belvoir
Occupancy by Ownership in Fort Belvoir
Of the total 1,810 dwellings in Fort Belvoir, owner-occupied units account for 41 (2.3%), while renter-occupied units make up 1,769 (97.7%).
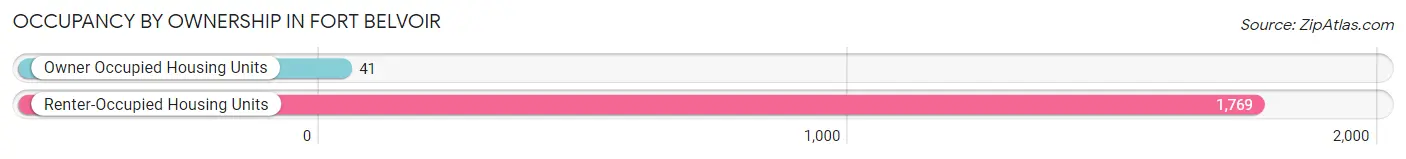
| Occupancy | # Housing Units | % Housing Units |
| Owner Occupied Housing Units | 41 | 2.3% |
| Renter-Occupied Housing Units | 1,769 | 97.7% |
| Total Occupied Housing Units | 1,810 | 100.0% |
Occupancy by Household Size in Fort Belvoir
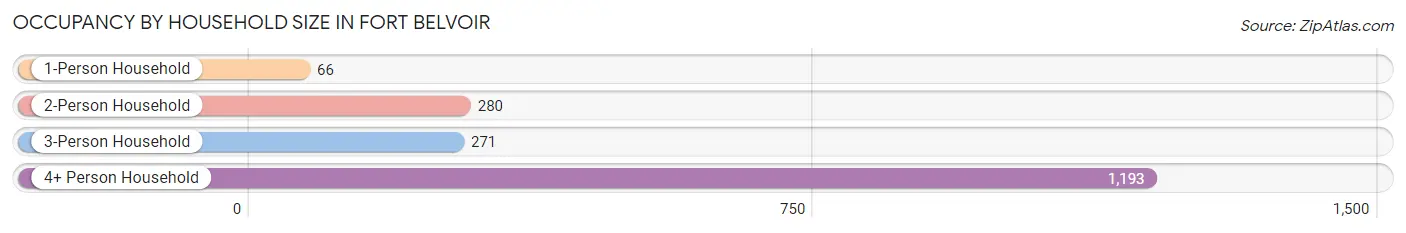
| Household Size | # Housing Units | % Housing Units |
| 1-Person Household | 66 | 3.6% |
| 2-Person Household | 280 | 15.5% |
| 3-Person Household | 271 | 15.0% |
| 4+ Person Household | 1,193 | 65.9% |
| Total Housing Units | 1,810 | 100.0% |
Occupancy by Ownership by Household Size in Fort Belvoir
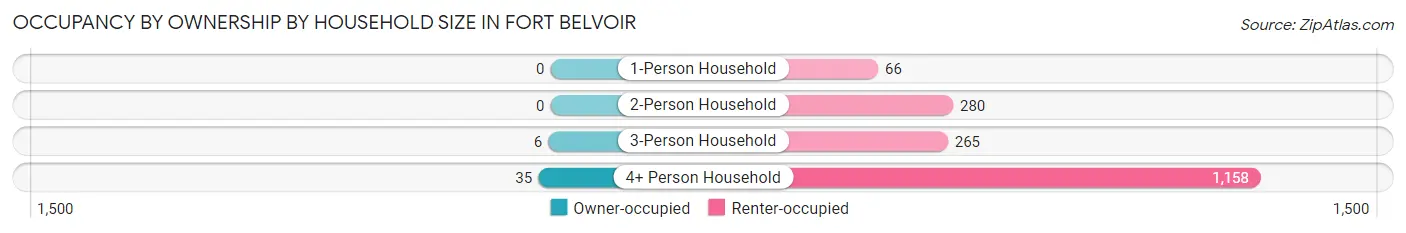
| Household Size | Owner-occupied | Renter-occupied |
| 1-Person Household | 0 (0.0%) | 66 (100.0%) |
| 2-Person Household | 0 (0.0%) | 280 (100.0%) |
| 3-Person Household | 6 (2.2%) | 265 (97.8%) |
| 4+ Person Household | 35 (2.9%) | 1,158 (97.1%) |
| Total Housing Units | 41 (2.3%) | 1,769 (97.7%) |
Occupancy by Educational Attainment in Fort Belvoir
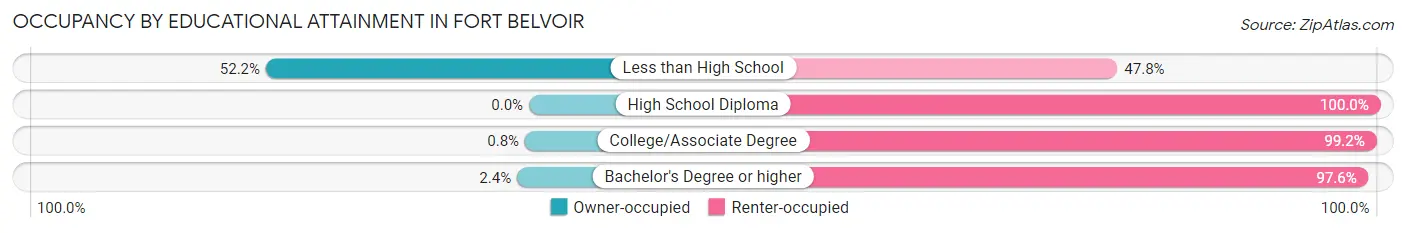
| Household Size | Owner-occupied | Renter-occupied |
| Less than High School | 12 (52.2%) | 11 (47.8%) |
| High School Diploma | 0 (0.0%) | 72 (100.0%) |
| College/Associate Degree | 6 (0.8%) | 743 (99.2%) |
| Bachelor's Degree or higher | 23 (2.4%) | 943 (97.6%) |
Occupancy by Age of Householder in Fort Belvoir
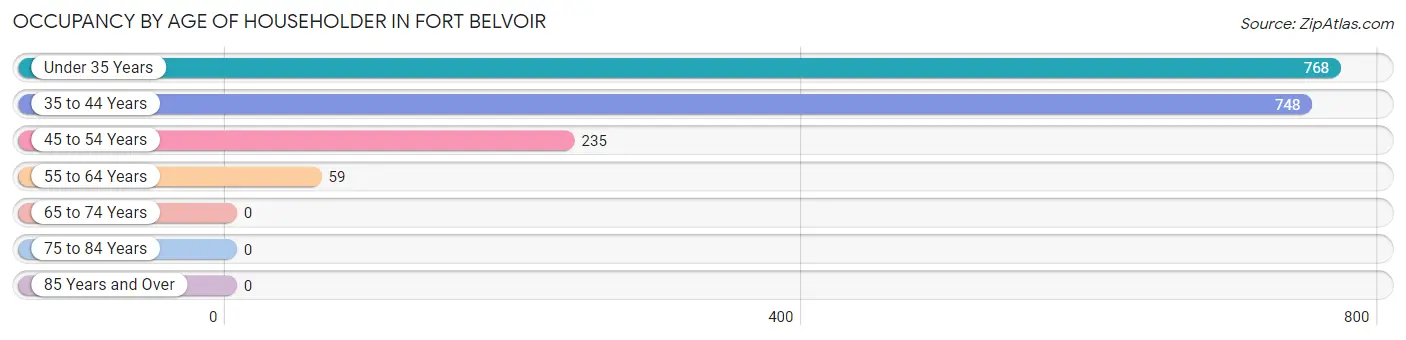
| Age Bracket | # Households | % Households |
| Under 35 Years | 768 | 42.4% |
| 35 to 44 Years | 748 | 41.3% |
| 45 to 54 Years | 235 | 13.0% |
| 55 to 64 Years | 59 | 3.3% |
| 65 to 74 Years | 0 | 0.0% |
| 75 to 84 Years | 0 | 0.0% |
| 85 Years and Over | 0 | 0.0% |
| Total | 1,810 | 100.0% |
Housing Finances in Fort Belvoir
Median Income by Occupancy in Fort Belvoir
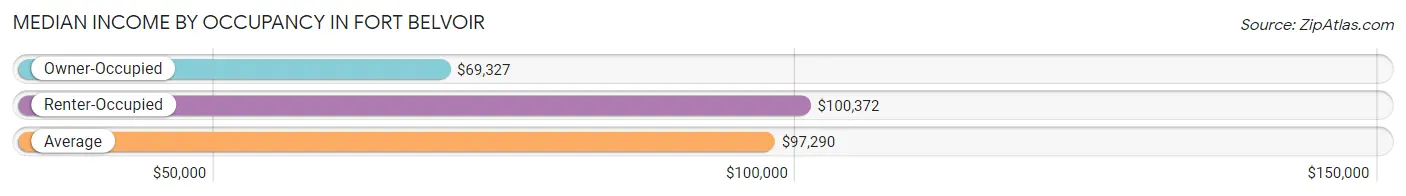
| Occupancy Type | # Households | Median Income |
| Owner-Occupied | 41 (2.3%) | $69,327 |
| Renter-Occupied | 1,769 (97.7%) | $100,372 |
| Average | 1,810 (100.0%) | $97,290 |
Occupancy by Householder Income Bracket in Fort Belvoir
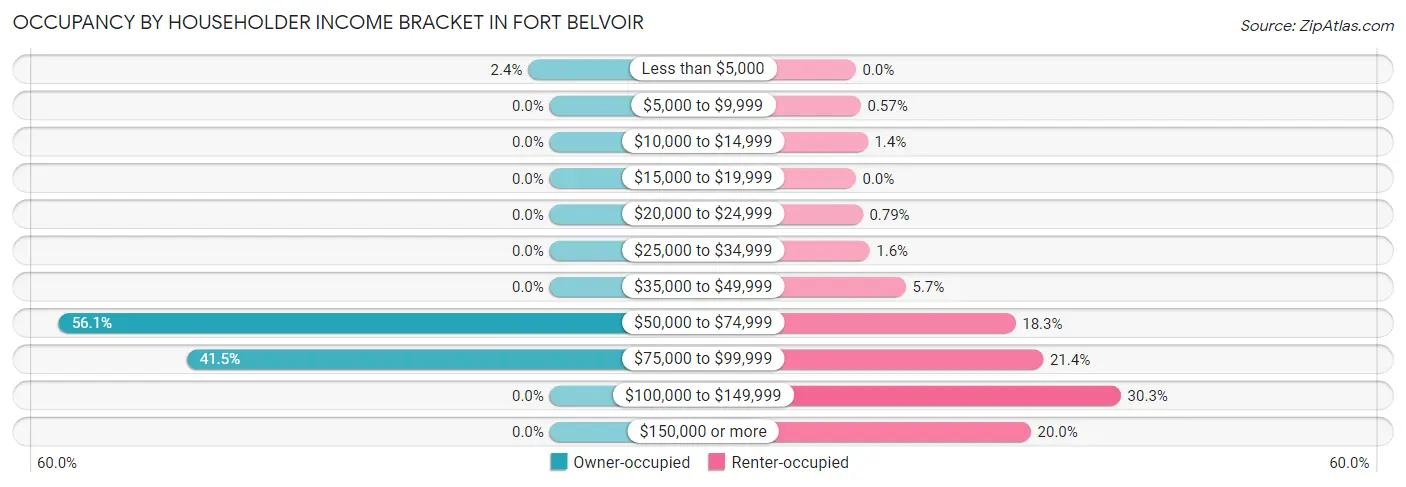
| Income Bracket | Owner-occupied | Renter-occupied |
| Less than $5,000 | 1 (2.4%) | 0 (0.0%) |
| $5,000 to $9,999 | 0 (0.0%) | 10 (0.6%) |
| $10,000 to $14,999 | 0 (0.0%) | 24 (1.4%) |
| $15,000 to $19,999 | 0 (0.0%) | 0 (0.0%) |
| $20,000 to $24,999 | 0 (0.0%) | 14 (0.8%) |
| $25,000 to $34,999 | 0 (0.0%) | 28 (1.6%) |
| $35,000 to $49,999 | 0 (0.0%) | 101 (5.7%) |
| $50,000 to $74,999 | 23 (56.1%) | 323 (18.3%) |
| $75,000 to $99,999 | 17 (41.5%) | 379 (21.4%) |
| $100,000 to $149,999 | 0 (0.0%) | 536 (30.3%) |
| $150,000 or more | 0 (0.0%) | 354 (20.0%) |
| Total | 41 (100.0%) | 1,769 (100.0%) |
Monthly Housing Cost Tiers in Fort Belvoir
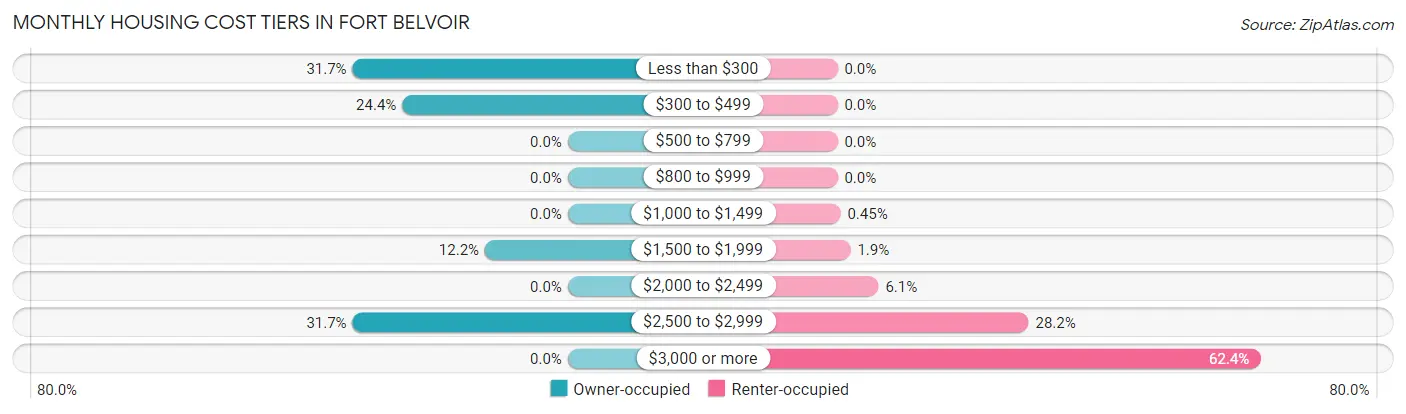
| Monthly Cost | Owner-occupied | Renter-occupied |
| Less than $300 | 13 (31.7%) | 0 (0.0%) |
| $300 to $499 | 10 (24.4%) | 0 (0.0%) |
| $500 to $799 | 0 (0.0%) | 0 (0.0%) |
| $800 to $999 | 0 (0.0%) | 0 (0.0%) |
| $1,000 to $1,499 | 0 (0.0%) | 8 (0.4%) |
| $1,500 to $1,999 | 5 (12.2%) | 34 (1.9%) |
| $2,000 to $2,499 | 0 (0.0%) | 107 (6.0%) |
| $2,500 to $2,999 | 13 (31.7%) | 498 (28.1%) |
| $3,000 or more | 0 (0.0%) | 1,104 (62.4%) |
| Total | 41 (100.0%) | 1,769 (100.0%) |
Physical Housing Characteristics in Fort Belvoir
Housing Structures in Fort Belvoir
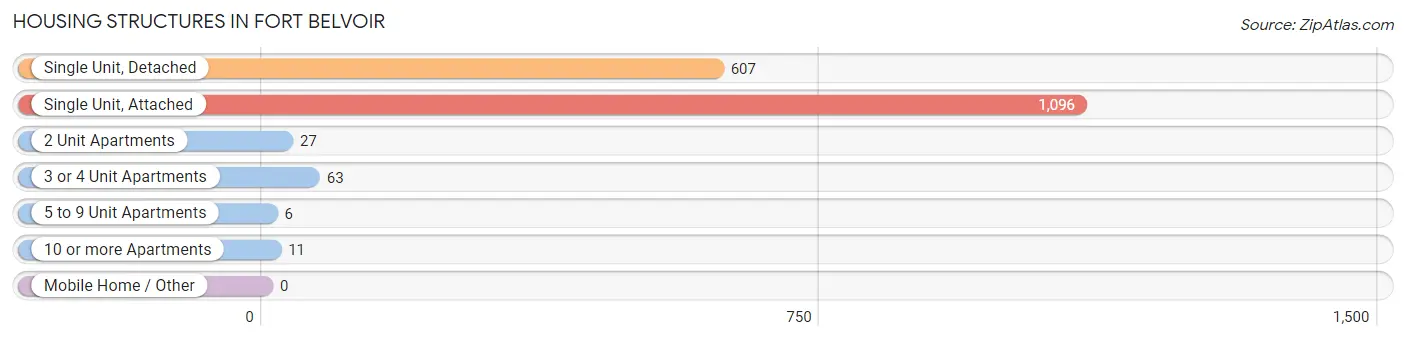
| Structure Type | # Housing Units | % Housing Units |
| Single Unit, Detached | 607 | 33.5% |
| Single Unit, Attached | 1,096 | 60.6% |
| 2 Unit Apartments | 27 | 1.5% |
| 3 or 4 Unit Apartments | 63 | 3.5% |
| 5 to 9 Unit Apartments | 6 | 0.3% |
| 10 or more Apartments | 11 | 0.6% |
| Mobile Home / Other | 0 | 0.0% |
| Total | 1,810 | 100.0% |
Housing Structures by Occupancy in Fort Belvoir
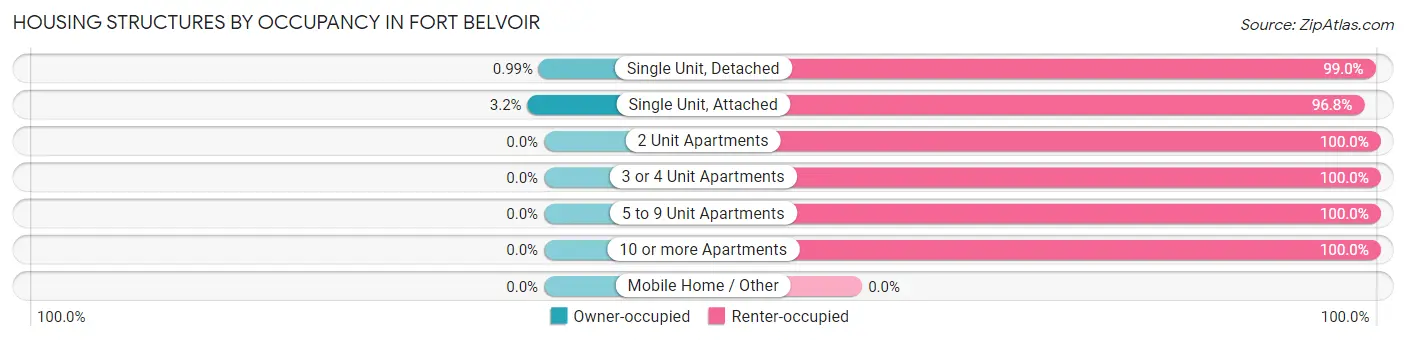
| Structure Type | Owner-occupied | Renter-occupied |
| Single Unit, Detached | 6 (1.0%) | 601 (99.0%) |
| Single Unit, Attached | 35 (3.2%) | 1,061 (96.8%) |
| 2 Unit Apartments | 0 (0.0%) | 27 (100.0%) |
| 3 or 4 Unit Apartments | 0 (0.0%) | 63 (100.0%) |
| 5 to 9 Unit Apartments | 0 (0.0%) | 6 (100.0%) |
| 10 or more Apartments | 0 (0.0%) | 11 (100.0%) |
| Mobile Home / Other | 0 (0.0%) | 0 (0.0%) |
| Total | 41 (2.3%) | 1,769 (97.7%) |
Housing Structures by Number of Rooms in Fort Belvoir
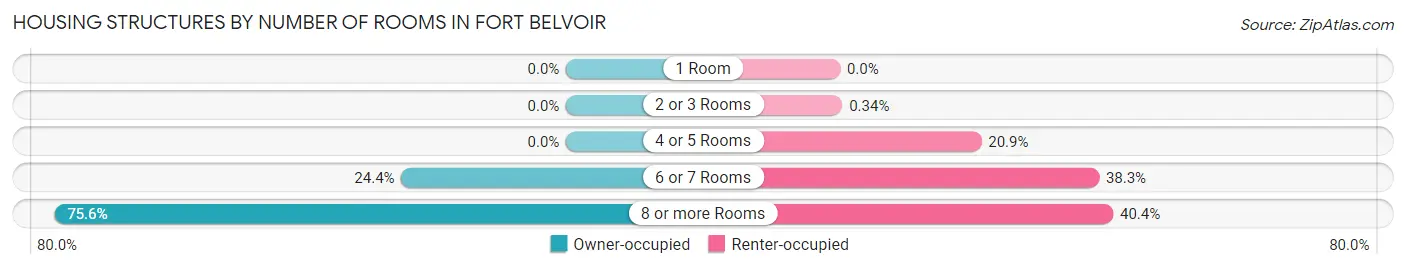
| Number of Rooms | Owner-occupied | Renter-occupied |
| 1 Room | 0 (0.0%) | 0 (0.0%) |
| 2 or 3 Rooms | 0 (0.0%) | 6 (0.3%) |
| 4 or 5 Rooms | 0 (0.0%) | 370 (20.9%) |
| 6 or 7 Rooms | 10 (24.4%) | 678 (38.3%) |
| 8 or more Rooms | 31 (75.6%) | 715 (40.4%) |
| Total | 41 (100.0%) | 1,769 (100.0%) |
Housing Structure by Heating Type in Fort Belvoir
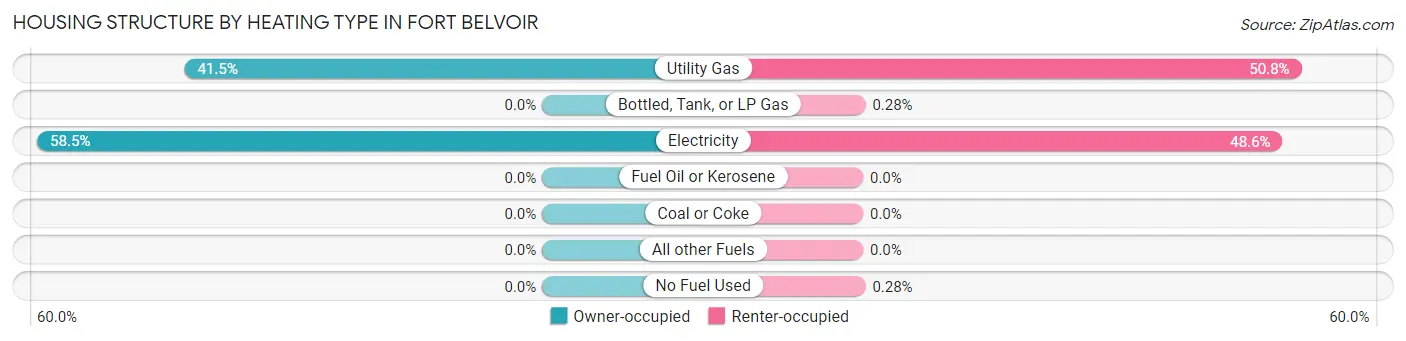
| Heating Type | Owner-occupied | Renter-occupied |
| Utility Gas | 17 (41.5%) | 899 (50.8%) |
| Bottled, Tank, or LP Gas | 0 (0.0%) | 5 (0.3%) |
| Electricity | 24 (58.5%) | 860 (48.6%) |
| Fuel Oil or Kerosene | 0 (0.0%) | 0 (0.0%) |
| Coal or Coke | 0 (0.0%) | 0 (0.0%) |
| All other Fuels | 0 (0.0%) | 0 (0.0%) |
| No Fuel Used | 0 (0.0%) | 5 (0.3%) |
| Total | 41 (100.0%) | 1,769 (100.0%) |
Household Vehicle Usage in Fort Belvoir
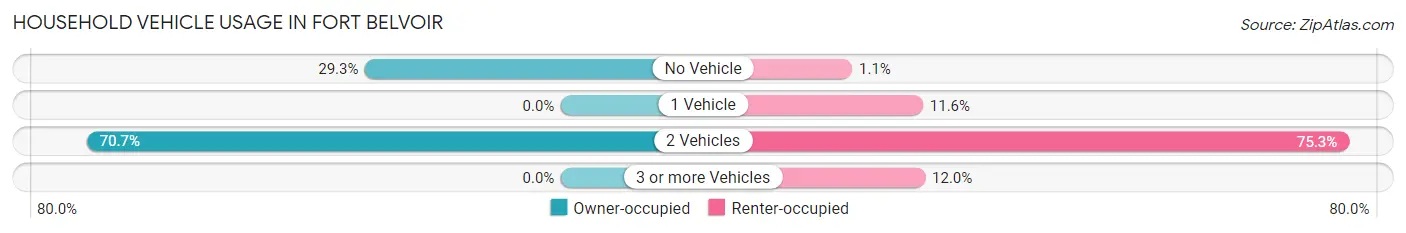
| Vehicles per Household | Owner-occupied | Renter-occupied |
| No Vehicle | 12 (29.3%) | 19 (1.1%) |
| 1 Vehicle | 0 (0.0%) | 206 (11.6%) |
| 2 Vehicles | 29 (70.7%) | 1,332 (75.3%) |
| 3 or more Vehicles | 0 (0.0%) | 212 (12.0%) |
| Total | 41 (100.0%) | 1,769 (100.0%) |
Real Estate & Mortgages in Fort Belvoir
Real Estate and Mortgage Overview in Fort Belvoir
| Characteristic | Without Mortgage | With Mortgage |
| Housing Units | 23 | 18 |
| Median Property Value | - | - |
| Median Household Income | - | - |
| Monthly Housing Costs | - | - |
| Real Estate Taxes | - | - |
Property Value by Mortgage Status in Fort Belvoir
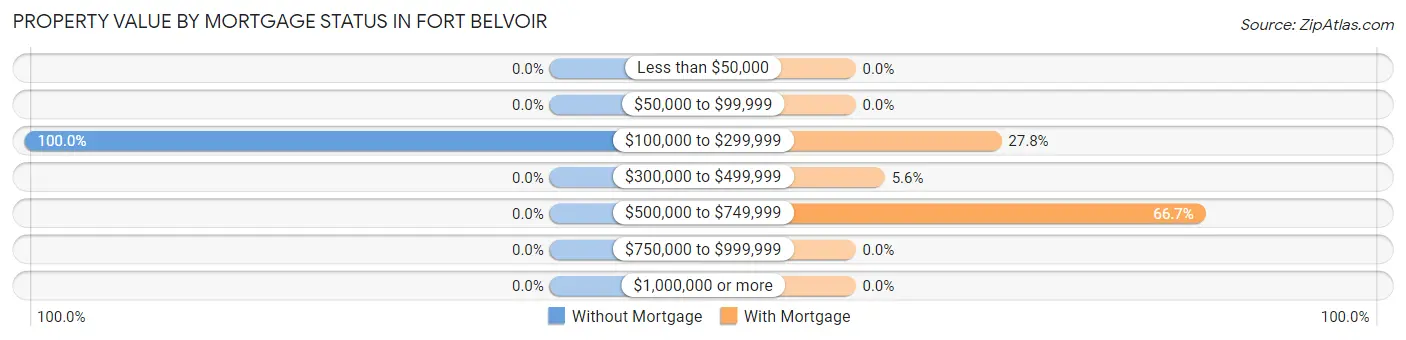
| Property Value | Without Mortgage | With Mortgage |
| Less than $50,000 | 0 (0.0%) | 0 (0.0%) |
| $50,000 to $99,999 | 0 (0.0%) | 0 (0.0%) |
| $100,000 to $299,999 | 23 (100.0%) | 5 (27.8%) |
| $300,000 to $499,999 | 0 (0.0%) | 1 (5.6%) |
| $500,000 to $749,999 | 0 (0.0%) | 12 (66.7%) |
| $750,000 to $999,999 | 0 (0.0%) | 0 (0.0%) |
| $1,000,000 or more | 0 (0.0%) | 0 (0.0%) |
| Total | 23 (100.0%) | 18 (100.0%) |
Household Income by Mortgage Status in Fort Belvoir
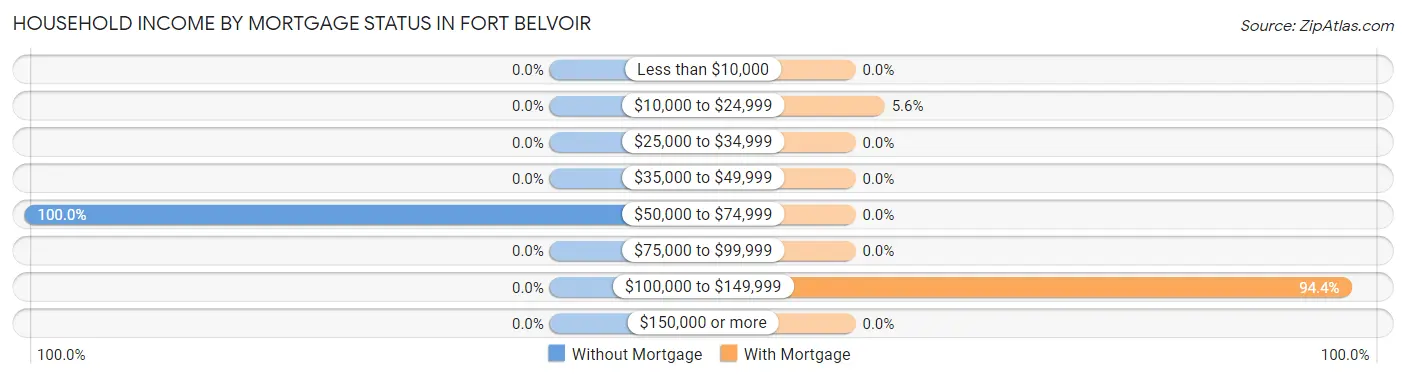
| Household Income | Without Mortgage | With Mortgage |
| Less than $10,000 | 0 (0.0%) | 0 (0.0%) |
| $10,000 to $24,999 | 0 (0.0%) | 1 (5.6%) |
| $25,000 to $34,999 | 0 (0.0%) | 0 (0.0%) |
| $35,000 to $49,999 | 0 (0.0%) | 0 (0.0%) |
| $50,000 to $74,999 | 23 (100.0%) | 0 (0.0%) |
| $75,000 to $99,999 | 0 (0.0%) | 0 (0.0%) |
| $100,000 to $149,999 | 0 (0.0%) | 17 (94.4%) |
| $150,000 or more | 0 (0.0%) | 0 (0.0%) |
| Total | 23 (100.0%) | 18 (100.0%) |
Property Value to Household Income Ratio in Fort Belvoir
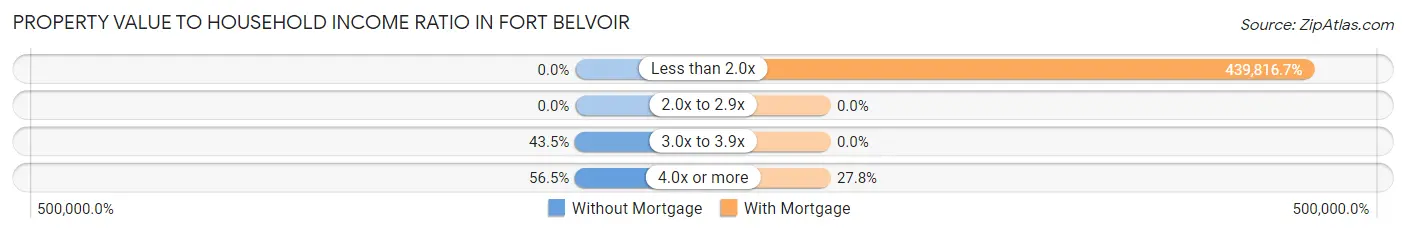
| Value-to-Income Ratio | Without Mortgage | With Mortgage |
| Less than 2.0x | 0 (0.0%) | 79,167 (439,816.7%) |
| 2.0x to 2.9x | 0 (0.0%) | 0 (0.0%) |
| 3.0x to 3.9x | 10 (43.5%) | 0 (0.0%) |
| 4.0x or more | 13 (56.5%) | 5 (27.8%) |
| Total | 23 (100.0%) | 18 (100.0%) |
Real Estate Taxes by Mortgage Status in Fort Belvoir
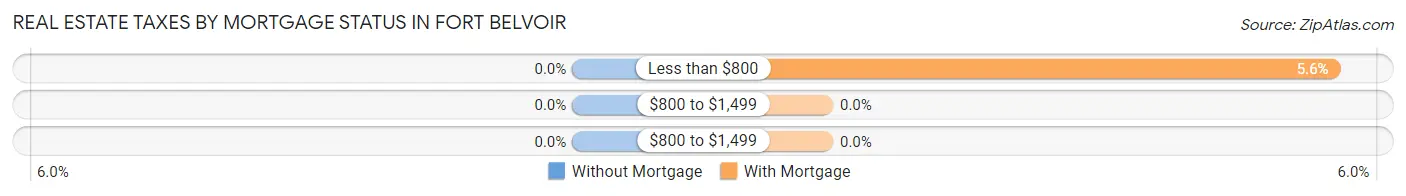
| Property Taxes | Without Mortgage | With Mortgage |
| Less than $800 | 0 (0.0%) | 1 (5.6%) |
| $800 to $1,499 | 0 (0.0%) | 0 (0.0%) |
| $800 to $1,499 | 0 (0.0%) | 0 (0.0%) |
| Total | 23 (100.0%) | 18 (100.0%) |
Health & Disability in Fort Belvoir
Health Insurance Coverage by Age in Fort Belvoir
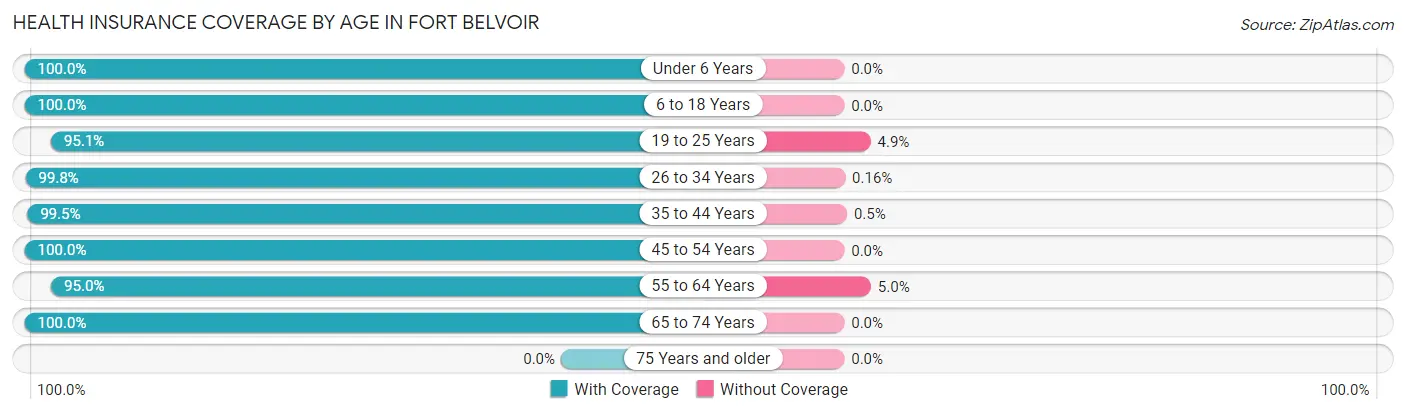
| Age Bracket | With Coverage | Without Coverage |
| Under 6 Years | 1,523 (100.0%) | 0 (0.0%) |
| 6 to 18 Years | 2,300 (100.0%) | 0 (0.0%) |
| 19 to 25 Years | 368 (95.1%) | 19 (4.9%) |
| 26 to 34 Years | 638 (99.8%) | 1 (0.2%) |
| 35 to 44 Years | 789 (99.5%) | 4 (0.5%) |
| 45 to 54 Years | 111 (100.0%) | 0 (0.0%) |
| 55 to 64 Years | 115 (95.0%) | 6 (5.0%) |
| 65 to 74 Years | 7 (100.0%) | 0 (0.0%) |
| 75 Years and older | 0 (0.0%) | 0 (0.0%) |
| Total | 5,851 (99.5%) | 30 (0.5%) |
Health Insurance Coverage by Citizenship Status in Fort Belvoir
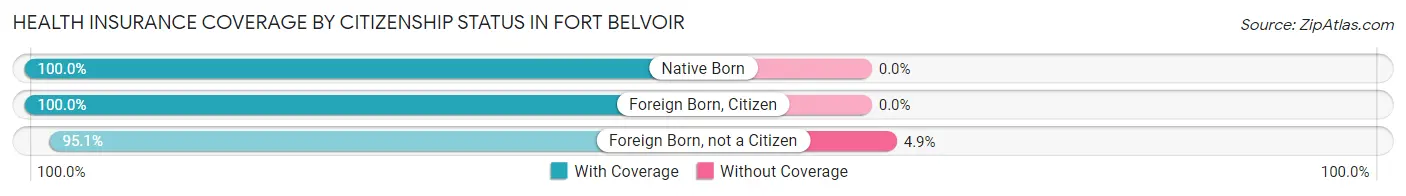
| Citizenship Status | With Coverage | Without Coverage |
| Native Born | 1,523 (100.0%) | 0 (0.0%) |
| Foreign Born, Citizen | 2,300 (100.0%) | 0 (0.0%) |
| Foreign Born, not a Citizen | 368 (95.1%) | 19 (4.9%) |
Health Insurance Coverage by Household Income in Fort Belvoir
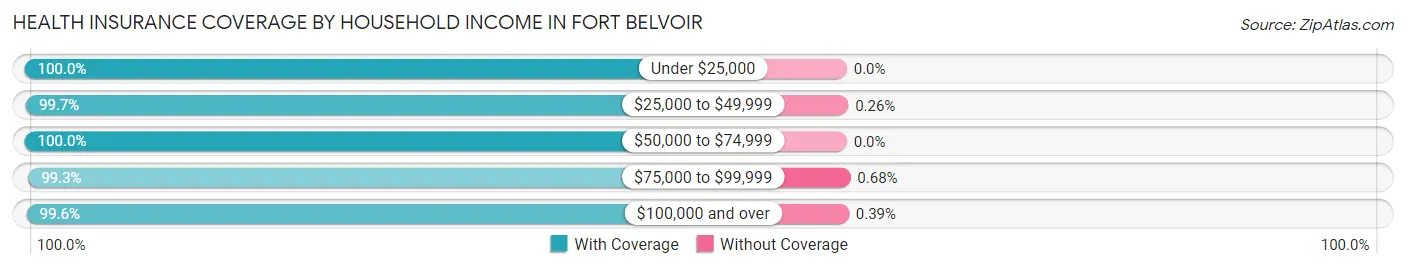
| Household Income | With Coverage | Without Coverage |
| Under $25,000 | 147 (100.0%) | 0 (0.0%) |
| $25,000 to $49,999 | 385 (99.7%) | 1 (0.3%) |
| $50,000 to $74,999 | 1,101 (100.0%) | 0 (0.0%) |
| $75,000 to $99,999 | 1,604 (99.3%) | 11 (0.7%) |
| $100,000 and over | 2,570 (99.6%) | 10 (0.4%) |
Public vs Private Health Insurance Coverage by Age in Fort Belvoir
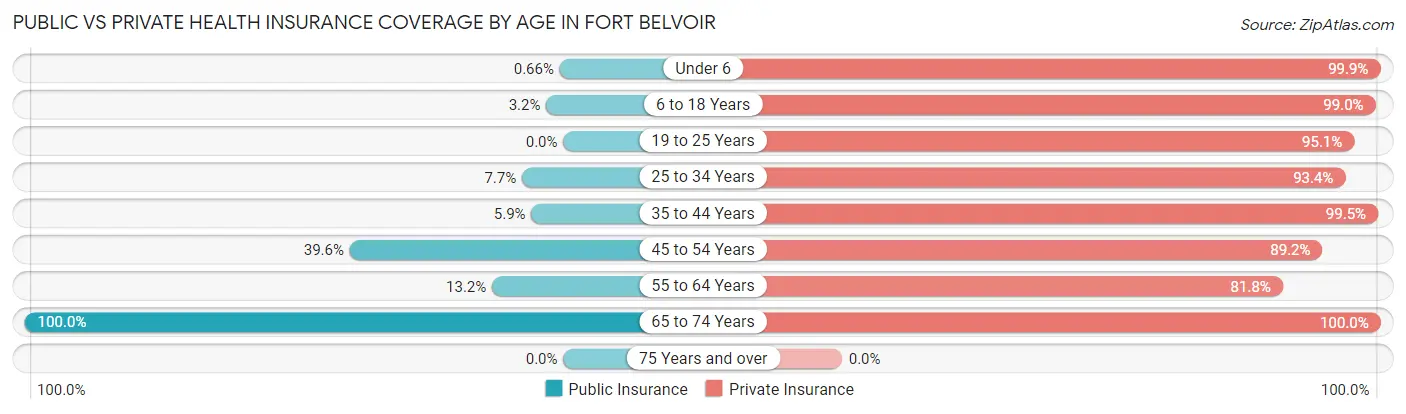
| Age Bracket | Public Insurance | Private Insurance |
| Under 6 | 10 (0.7%) | 1,522 (99.9%) |
| 6 to 18 Years | 73 (3.2%) | 2,278 (99.0%) |
| 19 to 25 Years | 0 (0.0%) | 368 (95.1%) |
| 25 to 34 Years | 49 (7.7%) | 597 (93.4%) |
| 35 to 44 Years | 47 (5.9%) | 789 (99.5%) |
| 45 to 54 Years | 44 (39.6%) | 99 (89.2%) |
| 55 to 64 Years | 16 (13.2%) | 99 (81.8%) |
| 65 to 74 Years | 7 (100.0%) | 7 (100.0%) |
| 75 Years and over | 0 (0.0%) | 0 (0.0%) |
| Total | 246 (4.2%) | 5,759 (97.9%) |
Disability Status by Sex by Age in Fort Belvoir
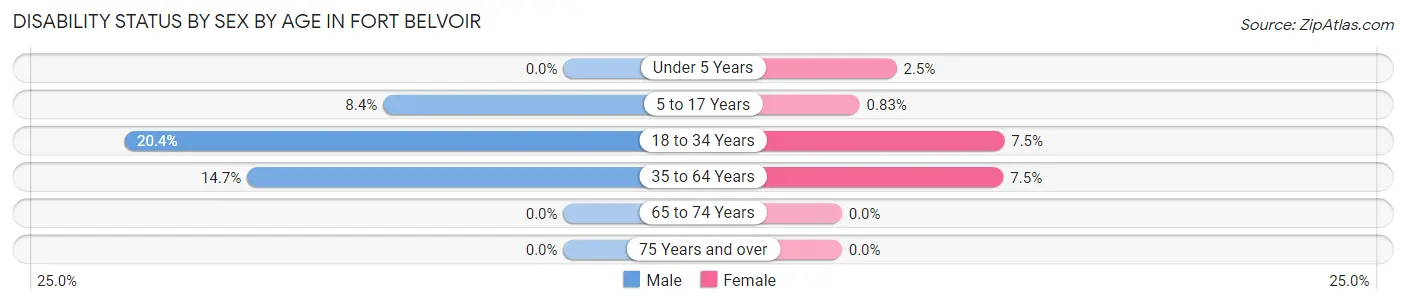
| Age Bracket | Male | Female |
| Under 5 Years | 0 (0.0%) | 12 (2.5%) |
| 5 to 17 Years | 130 (8.4%) | 10 (0.8%) |
| 18 to 34 Years | 53 (20.4%) | 63 (7.5%) |
| 35 to 64 Years | 37 (14.7%) | 58 (7.5%) |
| 65 to 74 Years | 0 (0.0%) | 0 (0.0%) |
| 75 Years and over | 0 (0.0%) | 0 (0.0%) |
Disability Class by Sex by Age in Fort Belvoir
Disability Class: Hearing Difficulty
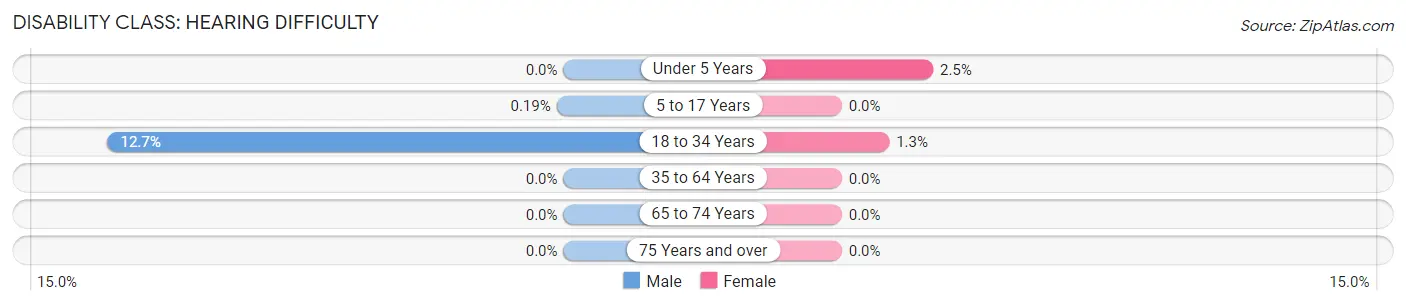
| Age Bracket | Male | Female |
| Under 5 Years | 0 (0.0%) | 12 (2.5%) |
| 5 to 17 Years | 3 (0.2%) | 0 (0.0%) |
| 18 to 34 Years | 33 (12.7%) | 11 (1.3%) |
| 35 to 64 Years | 0 (0.0%) | 0 (0.0%) |
| 65 to 74 Years | 0 (0.0%) | 0 (0.0%) |
| 75 Years and over | 0 (0.0%) | 0 (0.0%) |
Disability Class: Vision Difficulty
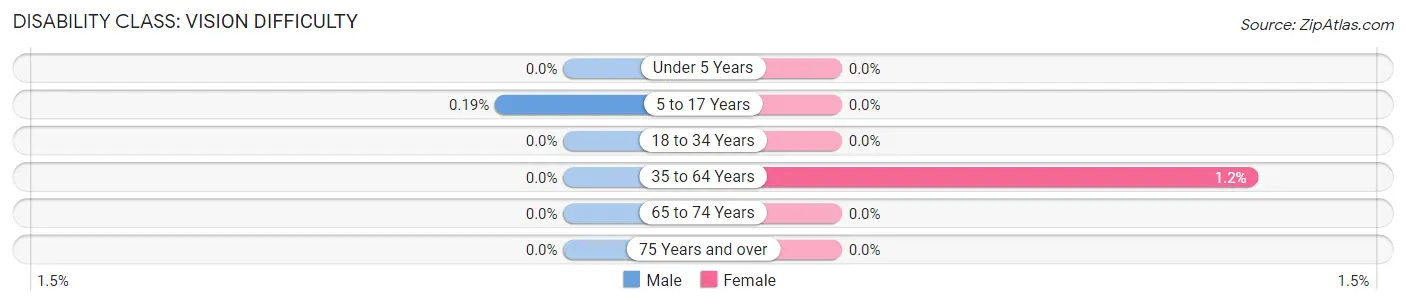
| Age Bracket | Male | Female |
| Under 5 Years | 0 (0.0%) | 0 (0.0%) |
| 5 to 17 Years | 3 (0.2%) | 0 (0.0%) |
| 18 to 34 Years | 0 (0.0%) | 0 (0.0%) |
| 35 to 64 Years | 0 (0.0%) | 9 (1.2%) |
| 65 to 74 Years | 0 (0.0%) | 0 (0.0%) |
| 75 Years and over | 0 (0.0%) | 0 (0.0%) |
Disability Class: Cognitive Difficulty
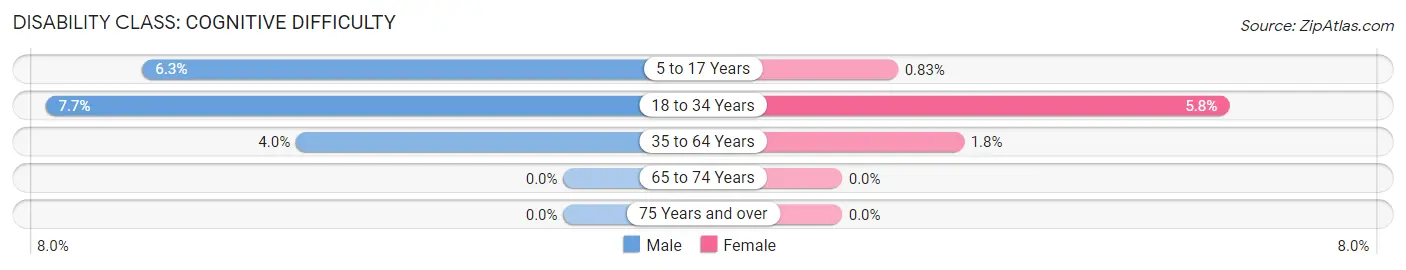
| Age Bracket | Male | Female |
| 5 to 17 Years | 97 (6.2%) | 10 (0.8%) |
| 18 to 34 Years | 20 (7.7%) | 48 (5.8%) |
| 35 to 64 Years | 10 (4.0%) | 14 (1.8%) |
| 65 to 74 Years | 0 (0.0%) | 0 (0.0%) |
| 75 Years and over | 0 (0.0%) | 0 (0.0%) |
Disability Class: Ambulatory Difficulty
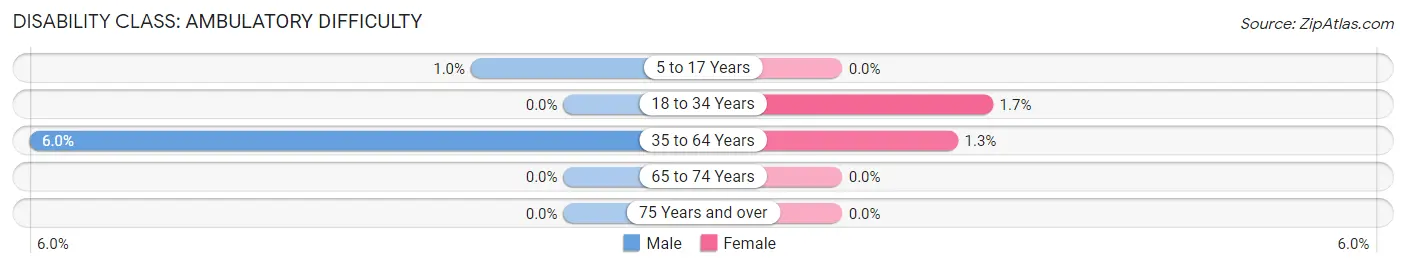
| Age Bracket | Male | Female |
| 5 to 17 Years | 16 (1.0%) | 0 (0.0%) |
| 18 to 34 Years | 0 (0.0%) | 14 (1.7%) |
| 35 to 64 Years | 15 (5.9%) | 10 (1.3%) |
| 65 to 74 Years | 0 (0.0%) | 0 (0.0%) |
| 75 Years and over | 0 (0.0%) | 0 (0.0%) |
Disability Class: Self-Care Difficulty
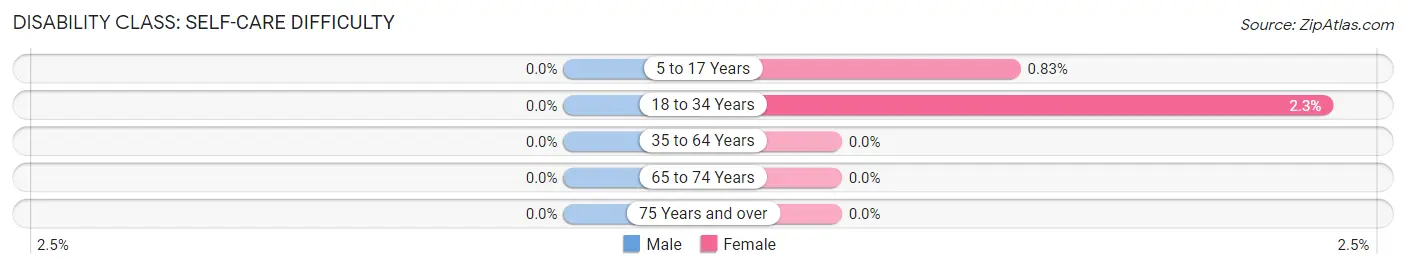
| Age Bracket | Male | Female |
| 5 to 17 Years | 0 (0.0%) | 10 (0.8%) |
| 18 to 34 Years | 0 (0.0%) | 19 (2.3%) |
| 35 to 64 Years | 0 (0.0%) | 0 (0.0%) |
| 65 to 74 Years | 0 (0.0%) | 0 (0.0%) |
| 75 Years and over | 0 (0.0%) | 0 (0.0%) |
Technology Access in Fort Belvoir
Computing Device Access in Fort Belvoir
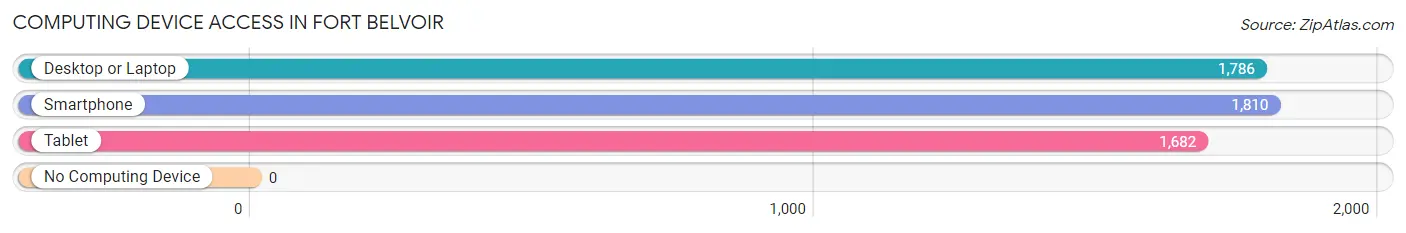
| Device Type | # Households | % Households |
| Desktop or Laptop | 1,786 | 98.7% |
| Smartphone | 1,810 | 100.0% |
| Tablet | 1,682 | 92.9% |
| No Computing Device | 0 | 0.0% |
| Total | 1,810 | 100.0% |
Internet Access in Fort Belvoir
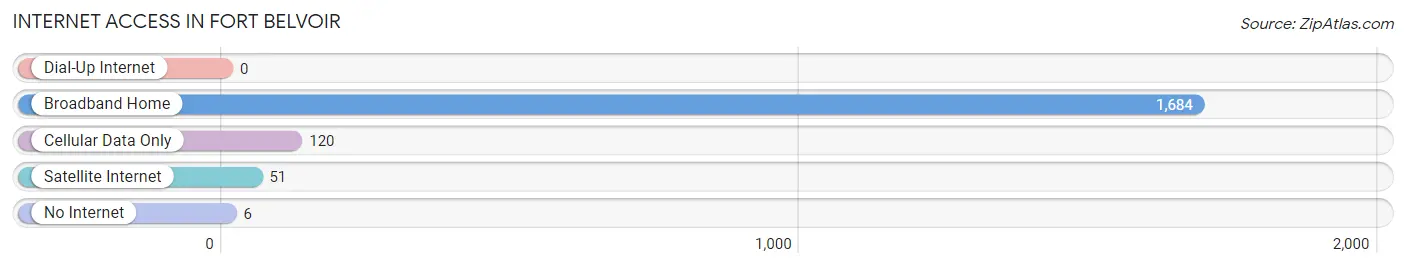
| Internet Type | # Households | % Households |
| Dial-Up Internet | 0 | 0.0% |
| Broadband Home | 1,684 | 93.0% |
| Cellular Data Only | 120 | 6.6% |
| Satellite Internet | 51 | 2.8% |
| No Internet | 6 | 0.3% |
| Total | 1,810 | 100.0% |
Fort Belvoir Summary
Fort Belvoir is a United States Army installation located in Fairfax County, Virginia, just south of Washington, D.C. It is the largest employer in Fairfax County and is home to a variety of military and civilian personnel. The base has a rich history, diverse geography, and a vibrant economy. This paper will explore the history, geography, economy, and demographics of Fort Belvoir in 2000 words.
History
Fort Belvoir has a long and storied history. The land on which the base is located was originally part of the estate of George Washington’s brother, John Augustine Washington. In 1791, the land was purchased by the United States government and used as a military training ground. During the Civil War, the land was used as a Confederate camp and was the site of several battles. After the war, the land was returned to the Washington family and was used as a dairy farm.
In 1905, the land was purchased by the United States government and was used as a training ground for the Army Corps of Engineers. In 1917, the base was officially established as Camp A.A. Humphreys, named after Union General Andrew A. Humphreys. During World War I, the base was used as a training ground for the Army’s Chemical Warfare Service. In the 1920s, the base was renamed Fort Belvoir, after the nearby Belvoir Manor.
During World War II, the base was used as a training ground for the Army’s Chemical Corps and the Army Air Forces. After the war, the base was used as a training ground for the Army’s Signal Corps and the Army Security Agency. In the 1950s, the base was used as a training ground for the Army’s Intelligence and Security Command. In the 1960s, the base was used as a training ground for the Army’s Special Forces.
In the 1970s, the base was used as a training ground for the Army’s Military Police Corps and the Army’s Military Intelligence Corps. In the 1980s, the base was used as a training ground for the Army’s Civil Affairs and Psychological Operations Command. In the 1990s, the base was used as a training ground for the Army’s Special Operations Command.
Today, Fort Belvoir is home to a variety of military and civilian personnel. The base is home to the Army’s Intelligence and Security Command, the Army’s Military Police Corps, the Army’s Civil Affairs and Psychological Operations Command, the Army’s Special Operations Command, and the Army’s Signal Corps. The base is also home to a variety of other military and civilian personnel, including the Defense Logistics Agency, the Defense Threat Reduction Agency, and the Defense Information Systems Agency.
Geography
Fort Belvoir is located in Fairfax County, Virginia, just south of Washington, D.C. The base is situated on the banks of the Potomac River and is surrounded by a variety of natural features, including forests, wetlands, and meadows. The base is also home to a variety of wildlife, including deer, foxes, and a variety of birds.
The base is divided into two main sections: the Main Post and the South Post. The Main Post is home to a variety of military and civilian personnel, as well as a variety of facilities, including the Army’s Intelligence and Security Command, the Army’s Military Police Corps, the Army’s Civil Affairs and Psychological Operations Command, the Army’s Special Operations Command, and the Army’s Signal Corps. The South Post is home to a variety of military and civilian personnel, as well as a variety of facilities, including the Defense Logistics Agency, the Defense Threat Reduction Agency, and the Defense Information Systems Agency.
Economy
Fort Belvoir is a major economic driver in Fairfax County. The base is the largest employer in the county, with more than 25,000 military and civilian personnel. The base also has a significant economic impact on the local economy, with an estimated annual economic impact of more than $2 billion.
The base is home to a variety of businesses, including retail stores, restaurants, and hotels. The base also has a variety of recreational facilities, including a golf course, a bowling alley, and a movie theater. The base also has a variety of educational and training facilities, including the Army’s Intelligence and Security Command, the Army’s Military Police Corps, the Army’s Civil Affairs and Psychological Operations Command, the Army’s Special Operations Command, and the Army’s Signal Corps.
Demographics
Fort Belvoir is home to a diverse population of military and civilian personnel. The base is home to a variety of ethnic and racial groups, including African Americans, Hispanics, Asians, and Native Americans. The base is also home to a variety of religious groups, including Christians, Jews, Muslims, and Buddhists.
The base is also home to a variety of age groups, with the majority of personnel being between the ages of 18 and 34. The base is also home to a variety of educational backgrounds, with the majority of personnel having at least a high school diploma. The base is also home to a variety of income levels, with the majority of personnel earning between $25,000 and $75,000 per year.
Conclusion
Fort Belvoir is a United States Army installation located in Fairfax County, Virginia, just south of Washington, D.C. The base has a rich history, diverse geography, and a vibrant economy. The base is home to a variety of military and civilian personnel, with a variety of ethnic and racial backgrounds, religious affiliations, age groups, educational backgrounds, and income levels. The base is the largest employer in Fairfax County and has an estimated annual economic impact of more than $2 billion.
Common Questions
What is Per Capita Income in Fort Belvoir?
Per Capita income in Fort Belvoir is $27,334.
What is the Median Family Income in Fort Belvoir?
Median Family Income in Fort Belvoir is $97,101.
What is the Median Household income in Fort Belvoir?
Median Household Income in Fort Belvoir is $97,290.
What is Income or Wage Gap in Fort Belvoir?
Income or Wage Gap in Fort Belvoir is 39.6%.
Women in Fort Belvoir earn 60.4 cents for every dollar earned by a man.
What is Family Income Deficit in Fort Belvoir?
Family Income Deficit in Fort Belvoir is $11,633.
Families that are below poverty line in Fort Belvoir earn $11,633 less on average than the poverty threshold level.
What is Inequality or Gini Index in Fort Belvoir?
Inequality or Gini Index in Fort Belvoir is 0.30.
What is the Total Population of Fort Belvoir?
Total Population of Fort Belvoir is 7,815.
What is the Total Male Population of Fort Belvoir?
Total Male Population of Fort Belvoir is 4,202.
What is the Total Female Population of Fort Belvoir?
Total Female Population of Fort Belvoir is 3,613.
What is the Ratio of Males per 100 Females in Fort Belvoir?
There are 116.30 Males per 100 Females in Fort Belvoir.
What is the Ratio of Females per 100 Males in Fort Belvoir?
There are 85.98 Females per 100 Males in Fort Belvoir.
What is the Median Population Age in Fort Belvoir?
Median Population Age in Fort Belvoir is 19.5 Years.
What is the Average Family Size in Fort Belvoir
Average Family Size in Fort Belvoir is 4.2 People.
What is the Average Household Size in Fort Belvoir
Average Household Size in Fort Belvoir is 4.1 People.
How Large is the Labor Force in Fort Belvoir?
There are 3,101 People in the Labor Forcein in Fort Belvoir.
What is the Percentage of People in the Labor Force in Fort Belvoir?
73.1% of People are in the Labor Force in Fort Belvoir.
What is the Unemployment Rate in Fort Belvoir?
Unemployment Rate in Fort Belvoir is 5.8%.