Lansdowne, VA Map & Demographics
Lansdowne Map
Lansdowne Overview
$74,459
PER CAPITA INCOME
$210,227
AVG FAMILY INCOME
$160,127
AVG HOUSEHOLD INCOME
35.4%
WAGE / INCOME GAP [ % ]
64.6¢/ $1
WAGE / INCOME GAP [ $ ]
$15,902
FAMILY INCOME DEFICIT
0.45
INEQUALITY / GINI INDEX
12,840
TOTAL POPULATION
6,008
MALE POPULATION
6,832
FEMALE POPULATION
87.94
MALES / 100 FEMALES
113.72
FEMALES / 100 MALES
42.4
MEDIAN AGE
3.2
AVG FAMILY SIZE
2.7
AVG HOUSEHOLD SIZE
6,742
LABOR FORCE [ PEOPLE ]
65.0%
PERCENT IN LABOR FORCE
1.3%
UNEMPLOYMENT RATE
Income in Lansdowne
Income Overview in Lansdowne
Per Capita Income in Lansdowne is $74,459, while median incomes of families and households are $210,227 and $160,127 respectively.
| Characteristic | Number | Measure |
| Per Capita Income | 12,840 | $74,459 |
| Median Family Income | 3,372 | $210,227 |
| Mean Family Income | 3,372 | $244,940 |
| Median Household Income | 4,601 | $160,127 |
| Mean Household Income | 4,601 | $205,399 |
| Income Deficit | 3,372 | $15,902 |
| Wage / Income Gap (%) | 12,840 | 35.42% |
| Wage / Income Gap ($) | 12,840 | 64.58¢ per $1 |
| Gini / Inequality Index | 12,840 | 0.45 |
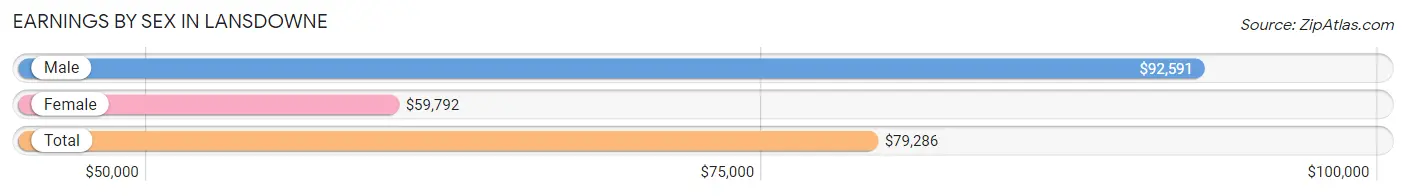
Earnings by Sex in Lansdowne
Average Earnings in Lansdowne are $79,286, $92,591 for men and $59,792 for women, a difference of 35.4%.
| Sex | Number | Average Earnings |
| Male | 3,769 (53.0%) | $92,591 |
| Female | 3,345 (47.0%) | $59,792 |
| Total | 7,114 (100.0%) | $79,286 |
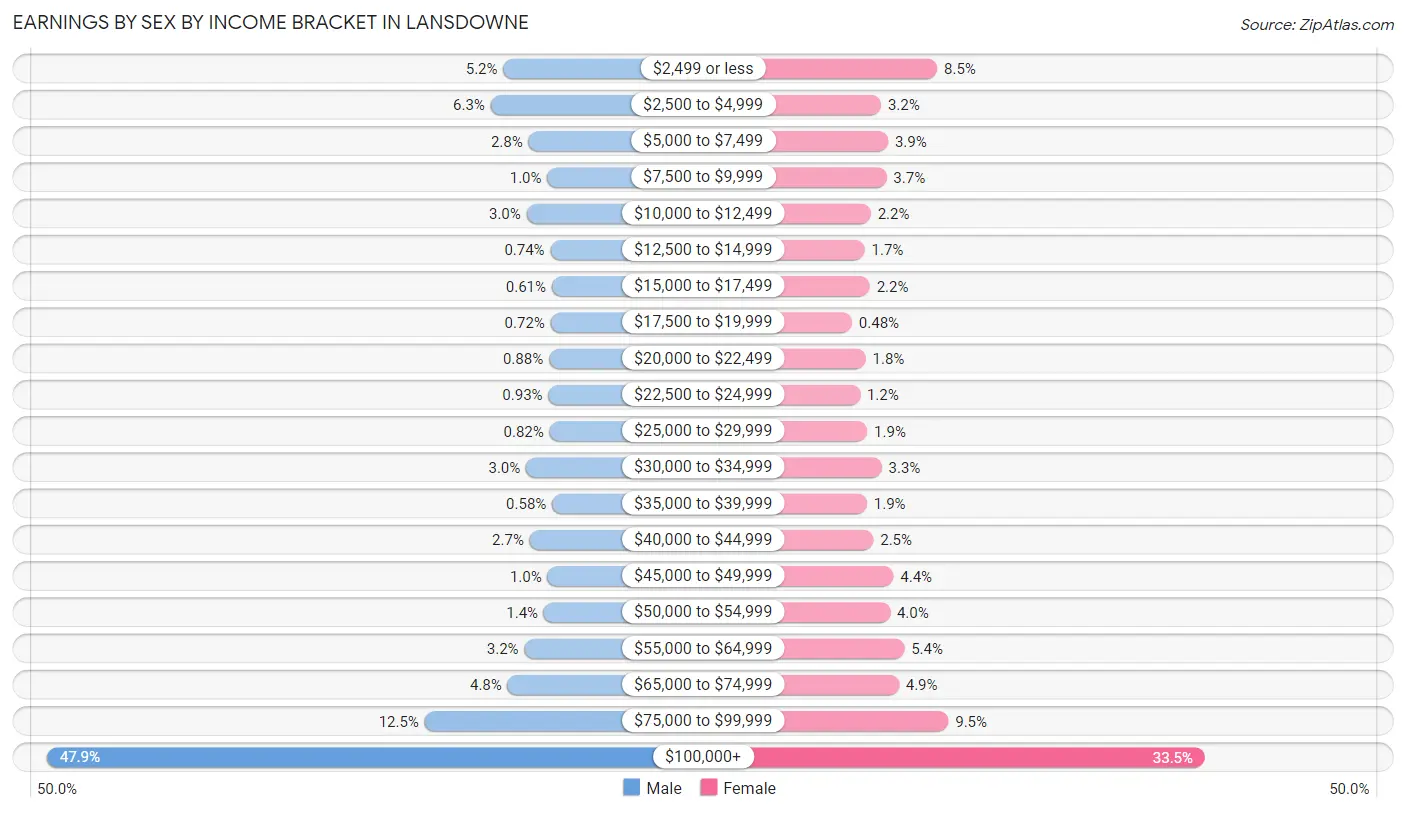
Earnings by Sex by Income Bracket in Lansdowne
The most common earnings brackets in Lansdowne are $100,000+ for men (1,806 | 47.9%) and $100,000+ for women (1,122 | 33.5%).
| Income | Male | Female |
| $2,499 or less | 194 (5.1%) | 283 (8.5%) |
| $2,500 to $4,999 | 239 (6.3%) | 107 (3.2%) |
| $5,000 to $7,499 | 105 (2.8%) | 129 (3.9%) |
| $7,500 to $9,999 | 39 (1.0%) | 124 (3.7%) |
| $10,000 to $12,499 | 112 (3.0%) | 75 (2.2%) |
| $12,500 to $14,999 | 28 (0.7%) | 56 (1.7%) |
| $15,000 to $17,499 | 23 (0.6%) | 72 (2.1%) |
| $17,500 to $19,999 | 27 (0.7%) | 16 (0.5%) |
| $20,000 to $22,499 | 33 (0.9%) | 59 (1.8%) |
| $22,500 to $24,999 | 35 (0.9%) | 41 (1.2%) |
| $25,000 to $29,999 | 31 (0.8%) | 64 (1.9%) |
| $30,000 to $34,999 | 114 (3.0%) | 109 (3.3%) |
| $35,000 to $39,999 | 22 (0.6%) | 63 (1.9%) |
| $40,000 to $44,999 | 101 (2.7%) | 83 (2.5%) |
| $45,000 to $49,999 | 38 (1.0%) | 146 (4.4%) |
| $50,000 to $54,999 | 51 (1.3%) | 135 (4.0%) |
| $55,000 to $64,999 | 120 (3.2%) | 180 (5.4%) |
| $65,000 to $74,999 | 179 (4.8%) | 163 (4.9%) |
| $75,000 to $99,999 | 472 (12.5%) | 318 (9.5%) |
| $100,000+ | 1,806 (47.9%) | 1,122 (33.5%) |
| Total | 3,769 (100.0%) | 3,345 (100.0%) |
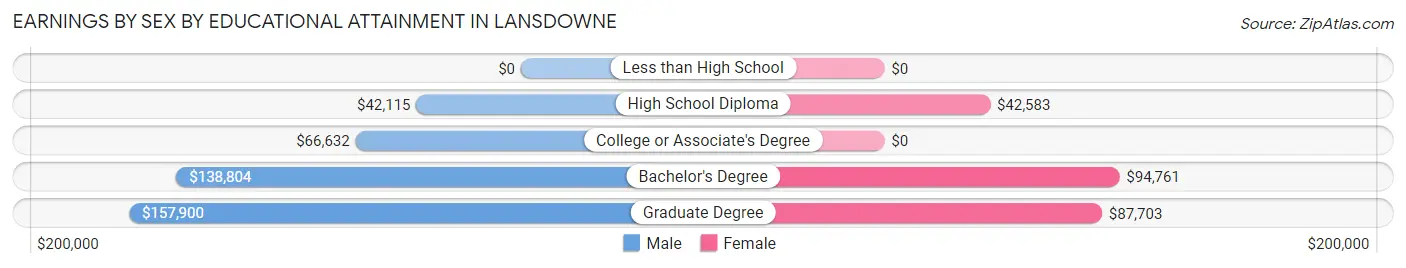
Earnings by Sex by Educational Attainment in Lansdowne
Average earnings in Lansdowne are $114,534 for men and $78,412 for women, a difference of 31.5%. Men with an educational attainment of graduate degree enjoy the highest average annual earnings of $157,900, while those with high school diploma education earn the least with $42,115. Women with an educational attainment of bachelor's degree earn the most with the average annual earnings of $94,761, while those with high school diploma education have the smallest earnings of $42,583.
| Educational Attainment | Male Income | Female Income |
| Less than High School | - | - |
| High School Diploma | $42,115 | $42,583 |
| College or Associate's Degree | $66,632 | $0 |
| Bachelor's Degree | $138,804 | $94,761 |
| Graduate Degree | $157,900 | $87,703 |
| Total | $114,534 | $78,412 |
Family Income in Lansdowne
Family Income Brackets in Lansdowne
According to the Lansdowne family income data, there are 1,740 families falling into the $200,000+ income range, which is the most common income bracket and makes up 51.6% of all families. Conversely, the $15,000 to $24,999 income bracket is the least frequent group with only 13 families (0.4%) belonging to this category.
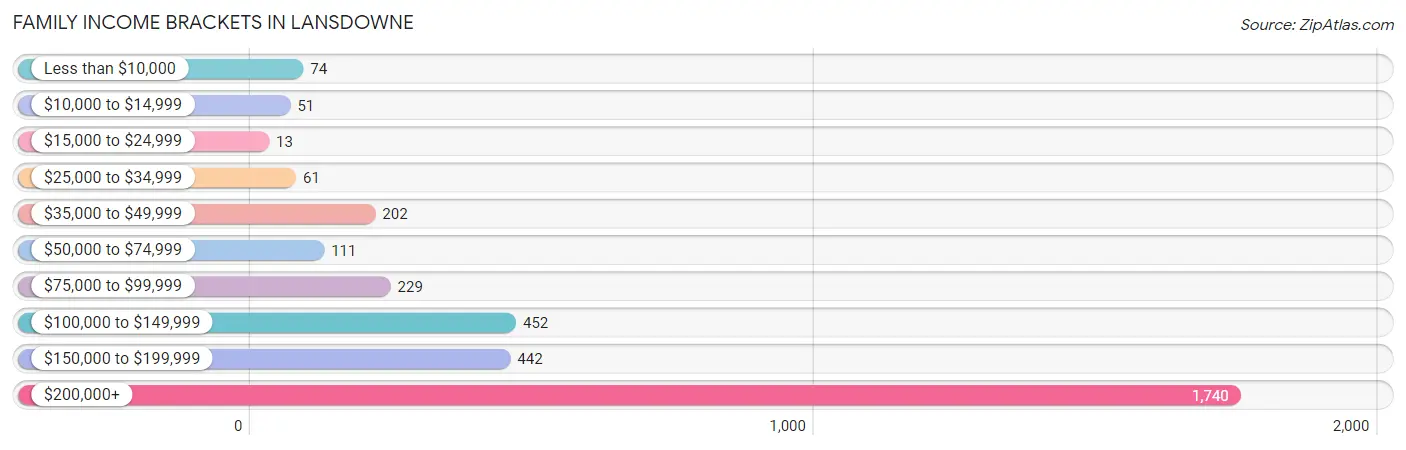
| Income Bracket | # Families | % Families |
| Less than $10,000 | 74 | 2.2% |
| $10,000 to $14,999 | 51 | 1.5% |
| $15,000 to $24,999 | 13 | 0.4% |
| $25,000 to $34,999 | 61 | 1.8% |
| $35,000 to $49,999 | 202 | 6.0% |
| $50,000 to $74,999 | 111 | 3.3% |
| $75,000 to $99,999 | 229 | 6.8% |
| $100,000 to $149,999 | 452 | 13.4% |
| $150,000 to $199,999 | 442 | 13.1% |
| $200,000+ | 1,740 | 51.6% |
Family Income by Famaliy Size in Lansdowne
4-person families (970 | 28.8%) account for the highest median family income in Lansdowne with $250,001 per family, while 2-person families (1,327 | 39.4%) have the highest median income of $74,766 per family member.
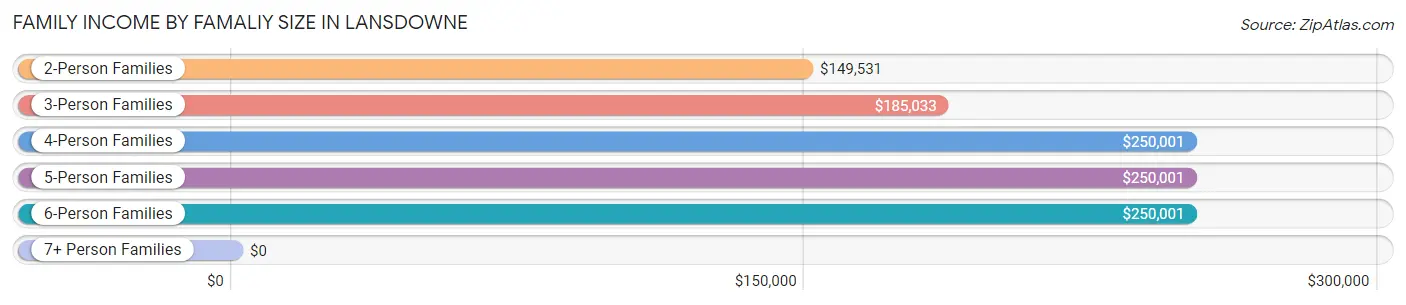
| Income Bracket | # Families | Median Income |
| 2-Person Families | 1,327 (39.4%) | $149,531 |
| 3-Person Families | 707 (21.0%) | $185,033 |
| 4-Person Families | 970 (28.8%) | $250,001 |
| 5-Person Families | 265 (7.9%) | $250,001 |
| 6-Person Families | 93 (2.8%) | $250,001 |
| 7+ Person Families | 10 (0.3%) | $0 |
| Total | 3,372 (100.0%) | $210,227 |
Family Income by Number of Earners in Lansdowne
The median family income in Lansdowne is $210,227, with families comprising 3+ earners (575) having the highest median family income of $250,001, while families with no earners (433) have the lowest median family income of $91,103, accounting for 17.1% and 12.8% of families, respectively.
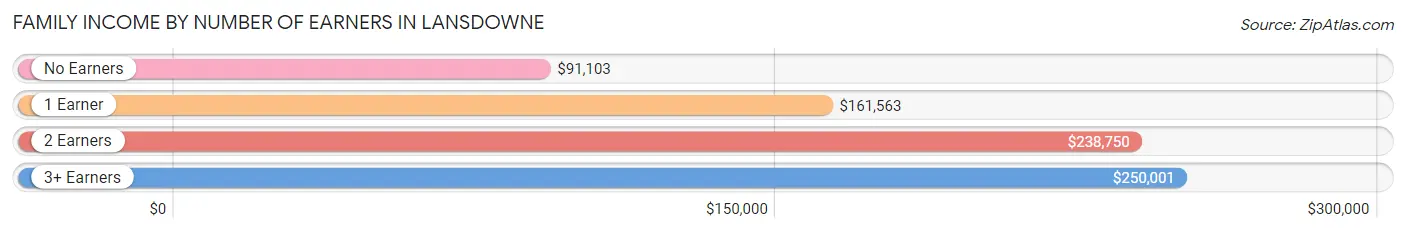
| Number of Earners | # Families | Median Income |
| No Earners | 433 (12.8%) | $91,103 |
| 1 Earner | 929 (27.6%) | $161,563 |
| 2 Earners | 1,435 (42.6%) | $238,750 |
| 3+ Earners | 575 (17.1%) | $250,001 |
| Total | 3,372 (100.0%) | $210,227 |
Household Income in Lansdowne
Household Income Brackets in Lansdowne
With 1,822 households falling in the category, the $200,000+ income range is the most frequent in Lansdowne, accounting for 39.6% of all households. In contrast, only 51 households (1.1%) fall into the $10,000 to $14,999 income bracket, making it the least populous group.
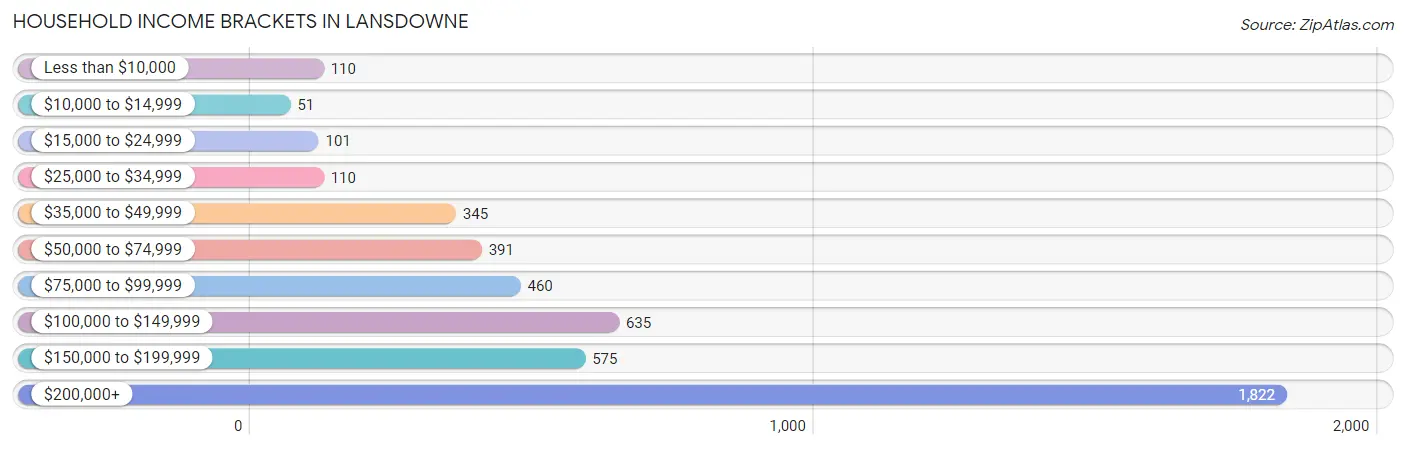
| Income Bracket | # Households | % Households |
| Less than $10,000 | 110 | 2.4% |
| $10,000 to $14,999 | 51 | 1.1% |
| $15,000 to $24,999 | 101 | 2.2% |
| $25,000 to $34,999 | 110 | 2.4% |
| $35,000 to $49,999 | 345 | 7.5% |
| $50,000 to $74,999 | 391 | 8.5% |
| $75,000 to $99,999 | 460 | 10.0% |
| $100,000 to $149,999 | 635 | 13.8% |
| $150,000 to $199,999 | 575 | 12.5% |
| $200,000+ | 1,822 | 39.6% |
Household Income by Householder Age in Lansdowne
The median household income in Lansdowne is $160,127, with the highest median household income of $226,379 found in the 45 to 64 years age bracket for the primary householder. A total of 2,100 households (45.6%) fall into this category. Meanwhile, the 15 to 24 years age bracket for the primary householder has the lowest median household income of $0, with 26 households (0.6%) in this group.
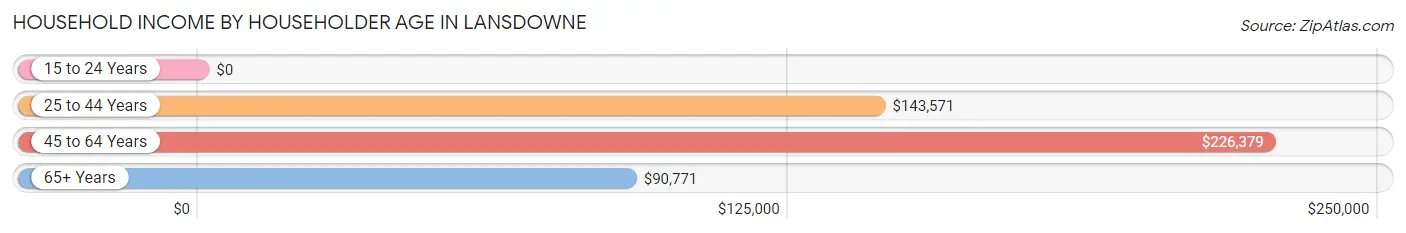
| Income Bracket | # Households | Median Income |
| 15 to 24 Years | 26 (0.6%) | $0 |
| 25 to 44 Years | 1,226 (26.7%) | $143,571 |
| 45 to 64 Years | 2,100 (45.6%) | $226,379 |
| 65+ Years | 1,249 (27.2%) | $90,771 |
| Total | 4,601 (100.0%) | $160,127 |
Poverty in Lansdowne
Income Below Poverty by Sex and Age in Lansdowne
With 5.1% poverty level for males and 5.6% for females among the residents of Lansdowne, 18 to 24 year old males and 18 to 24 year old females are the most vulnerable to poverty, with 94 males (15.1%) and 105 females (18.9%) in their respective age groups living below the poverty level.
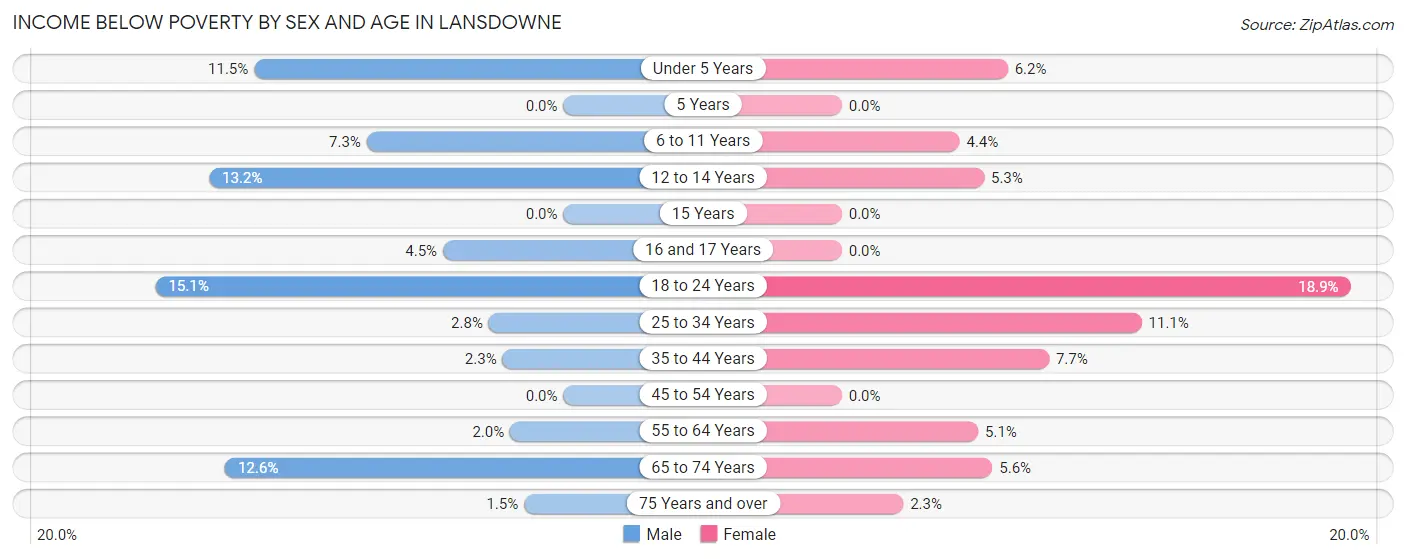
| Age Bracket | Male | Female |
| Under 5 Years | 24 (11.5%) | 22 (6.2%) |
| 5 Years | 0 (0.0%) | 0 (0.0%) |
| 6 to 11 Years | 30 (7.3%) | 21 (4.4%) |
| 12 to 14 Years | 38 (13.2%) | 18 (5.3%) |
| 15 Years | 0 (0.0%) | 0 (0.0%) |
| 16 and 17 Years | 16 (4.5%) | 0 (0.0%) |
| 18 to 24 Years | 94 (15.1%) | 105 (18.9%) |
| 25 to 34 Years | 18 (2.8%) | 76 (11.1%) |
| 35 to 44 Years | 12 (2.3%) | 60 (7.7%) |
| 45 to 54 Years | 0 (0.0%) | 0 (0.0%) |
| 55 to 64 Years | 15 (2.0%) | 37 (5.1%) |
| 65 to 74 Years | 49 (12.6%) | 26 (5.6%) |
| 75 Years and over | 7 (1.5%) | 20 (2.3%) |
| Total | 303 (5.1%) | 385 (5.6%) |
Income Above Poverty by Sex and Age in Lansdowne
According to the poverty statistics in Lansdowne, males aged 5 years and females aged 5 years are the age groups that are most secure financially, with 100.0% of males and 100.0% of females in these age groups living above the poverty line.
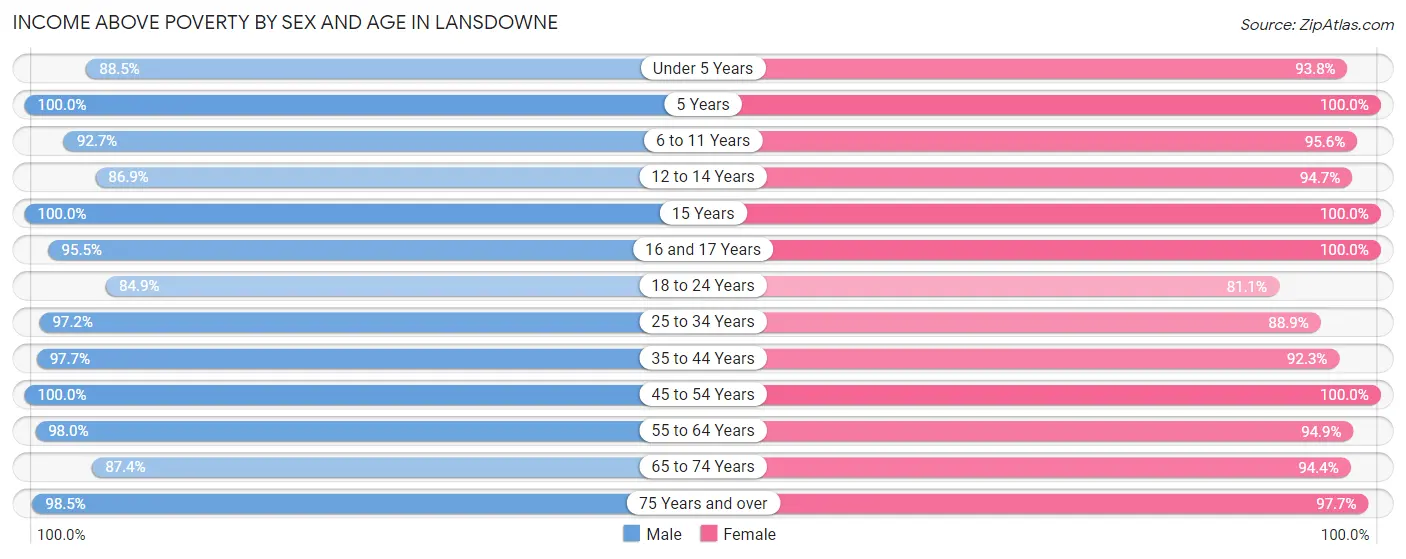
| Age Bracket | Male | Female |
| Under 5 Years | 185 (88.5%) | 335 (93.8%) |
| 5 Years | 19 (100.0%) | 27 (100.0%) |
| 6 to 11 Years | 381 (92.7%) | 460 (95.6%) |
| 12 to 14 Years | 251 (86.9%) | 323 (94.7%) |
| 15 Years | 138 (100.0%) | 196 (100.0%) |
| 16 and 17 Years | 342 (95.5%) | 141 (100.0%) |
| 18 to 24 Years | 527 (84.9%) | 451 (81.1%) |
| 25 to 34 Years | 632 (97.2%) | 607 (88.9%) |
| 35 to 44 Years | 520 (97.7%) | 720 (92.3%) |
| 45 to 54 Years | 1,128 (100.0%) | 1,185 (100.0%) |
| 55 to 64 Years | 744 (98.0%) | 694 (94.9%) |
| 65 to 74 Years | 341 (87.4%) | 439 (94.4%) |
| 75 Years and over | 471 (98.5%) | 858 (97.7%) |
| Total | 5,679 (94.9%) | 6,436 (94.4%) |
Income Below Poverty Among Married-Couple Families in Lansdowne
The poverty statistics for married-couple families in Lansdowne show that 1.5% or 43 of the total 2,838 families live below the poverty line. Families with 3 or 4 children have the highest poverty rate of 5.4%, comprising of 12 families. On the other hand, families with 1 or 2 children have the lowest poverty rate of 0.0%, which includes 0 families.
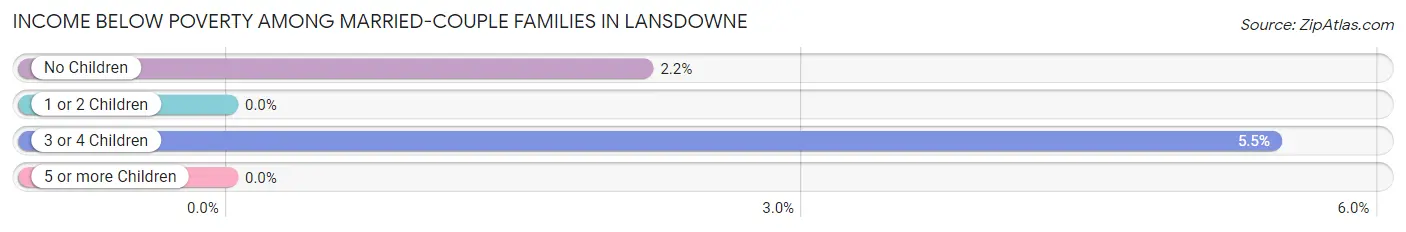
| Children | Above Poverty | Below Poverty |
| No Children | 1,398 (97.8%) | 31 (2.2%) |
| 1 or 2 Children | 1,189 (100.0%) | 0 (0.0%) |
| 3 or 4 Children | 208 (94.6%) | 12 (5.4%) |
| 5 or more Children | 0 (0.0%) | 0 (0.0%) |
| Total | 2,795 (98.5%) | 43 (1.5%) |
Income Below Poverty Among Single-Parent Households in Lansdowne
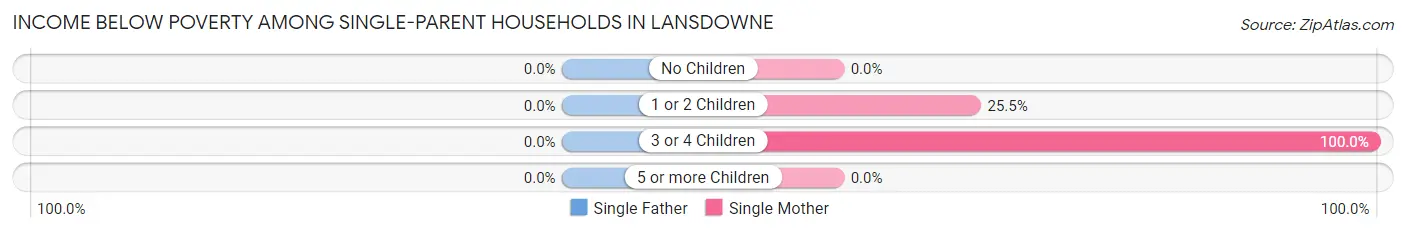
| Children | Single Father | Single Mother |
| No Children | 0 (0.0%) | 0 (0.0%) |
| 1 or 2 Children | 0 (0.0%) | 52 (25.5%) |
| 3 or 4 Children | 0 (0.0%) | 27 (100.0%) |
| 5 or more Children | 0 (0.0%) | 0 (0.0%) |
| Total | 0 (0.0%) | 79 (21.1%) |
Income Below Poverty Among Married-Couple vs Single-Parent Households in Lansdowne
The poverty data for Lansdowne shows that 43 of the married-couple family households (1.5%) and 79 of the single-parent households (14.8%) are living below the poverty level. Within the married-couple family households, those with 3 or 4 children have the highest poverty rate, with 12 households (5.4%) falling below the poverty line. Among the single-parent households, those with 3 or 4 children have the highest poverty rate, with 27 household (65.8%) living below poverty.
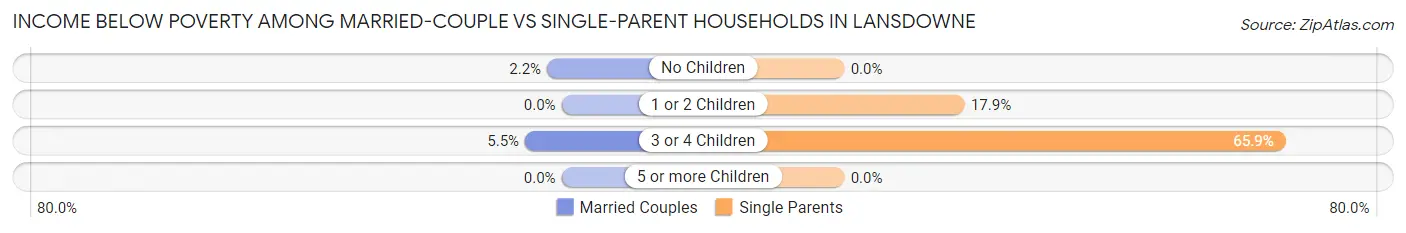
| Children | Married-Couple Families | Single-Parent Households |
| No Children | 31 (2.2%) | 0 (0.0%) |
| 1 or 2 Children | 0 (0.0%) | 52 (17.9%) |
| 3 or 4 Children | 12 (5.4%) | 27 (65.8%) |
| 5 or more Children | 0 (0.0%) | 0 (0.0%) |
| Total | 43 (1.5%) | 79 (14.8%) |
Race in Lansdowne
The most populous races in Lansdowne are White / Caucasian (8,547 | 66.6%), Asian (1,997 | 15.5%), and Black / African American (1,299 | 10.1%).
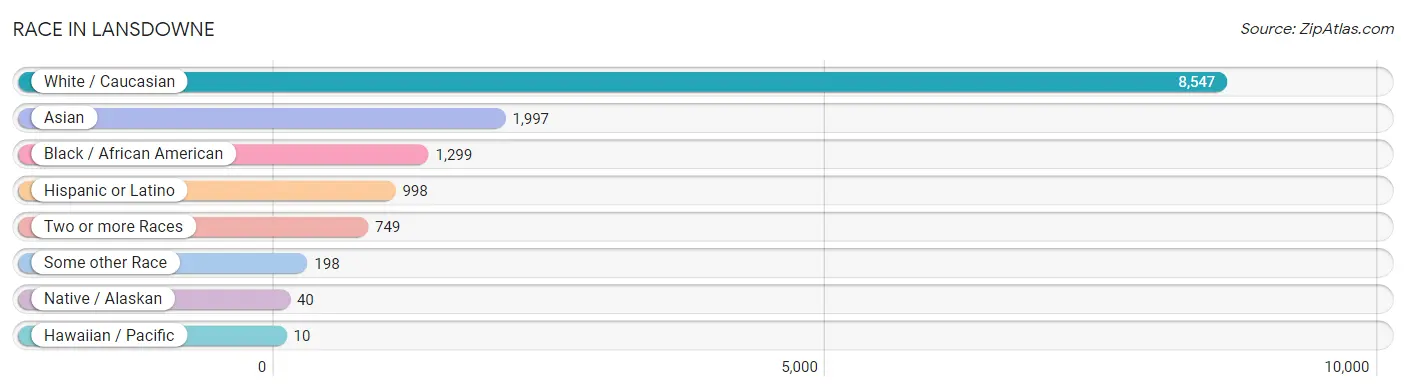
| Race | # Population | % Population |
| Asian | 1,997 | 15.5% |
| Black / African American | 1,299 | 10.1% |
| Hawaiian / Pacific | 10 | 0.1% |
| Hispanic or Latino | 998 | 7.8% |
| Native / Alaskan | 40 | 0.3% |
| White / Caucasian | 8,547 | 66.6% |
| Two or more Races | 749 | 5.8% |
| Some other Race | 198 | 1.5% |
| Total | 12,840 | 100.0% |
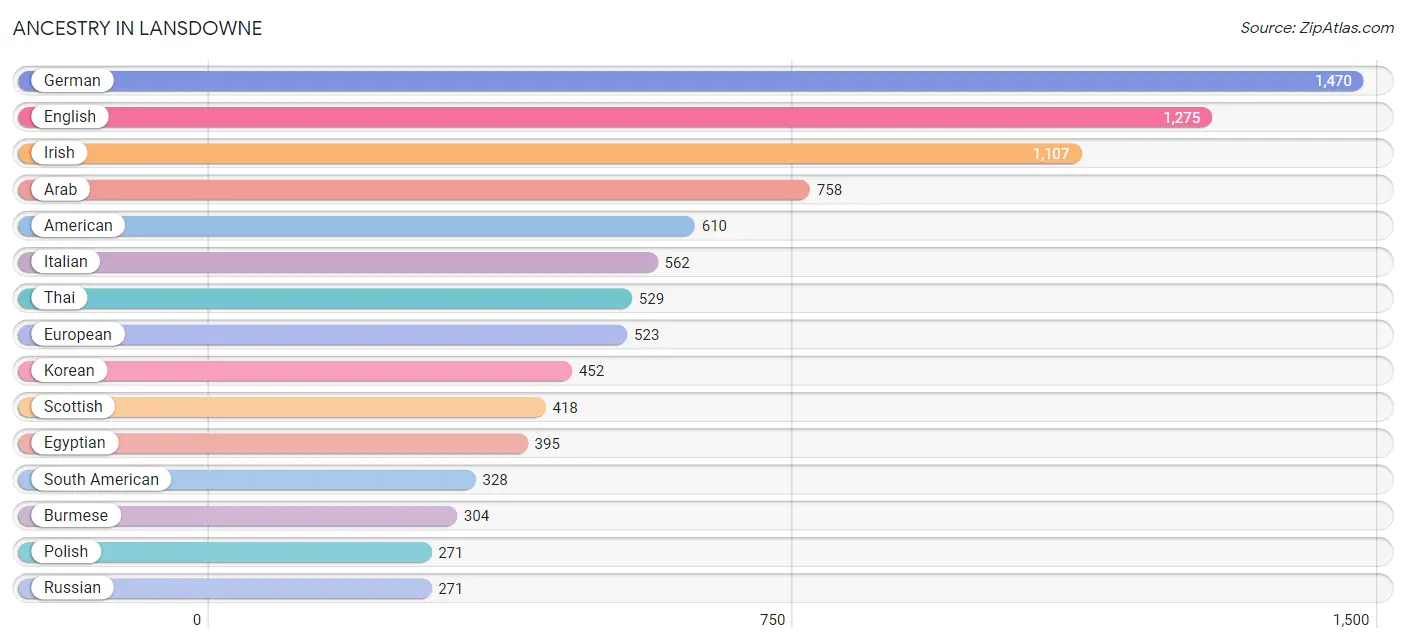
Ancestry in Lansdowne
The most populous ancestries reported in Lansdowne are German (1,470 | 11.5%), English (1,275 | 9.9%), Irish (1,107 | 8.6%), Arab (758 | 5.9%), and American (610 | 4.8%), together accounting for 40.6% of all Lansdowne residents.
| Ancestry | # Population | % Population |
| Afghan | 16 | 0.1% |
| African | 76 | 0.6% |
| Albanian | 2 | 0.0% |
| American | 610 | 4.8% |
| Apache | 12 | 0.1% |
| Arab | 758 | 5.9% |
| Argentinean | 10 | 0.1% |
| Australian | 24 | 0.2% |
| Austrian | 44 | 0.3% |
| Bhutanese | 52 | 0.4% |
| Bolivian | 55 | 0.4% |
| Brazilian | 63 | 0.5% |
| British | 131 | 1.0% |
| Burmese | 304 | 2.4% |
| Cambodian | 30 | 0.2% |
| Canadian | 21 | 0.2% |
| Central American | 133 | 1.0% |
| Cherokee | 27 | 0.2% |
| Chickasaw | 9 | 0.1% |
| Colombian | 116 | 0.9% |
| Croatian | 25 | 0.2% |
| Cuban | 78 | 0.6% |
| Czech | 11 | 0.1% |
| Danish | 59 | 0.5% |
| Delaware | 5 | 0.0% |
| Dutch | 67 | 0.5% |
| Eastern European | 80 | 0.6% |
| Egyptian | 395 | 3.1% |
| English | 1,275 | 9.9% |
| Ethiopian | 9 | 0.1% |
| European | 523 | 4.1% |
| Filipino | 31 | 0.2% |
| Finnish | 41 | 0.3% |
| French | 178 | 1.4% |
| French Canadian | 20 | 0.2% |
| German | 1,470 | 11.5% |
| Greek | 101 | 0.8% |
| Guatemalan | 23 | 0.2% |
| Hungarian | 42 | 0.3% |
| Indian (Asian) | 251 | 1.9% |
| Iranian | 153 | 1.2% |
| Iraqi | 25 | 0.2% |
| Irish | 1,107 | 8.6% |
| Iroquois | 17 | 0.1% |
| Italian | 562 | 4.4% |
| Jamaican | 31 | 0.2% |
| Korean | 452 | 3.5% |
| Laotian | 32 | 0.3% |
| Lebanese | 269 | 2.1% |
| Lithuanian | 51 | 0.4% |
| Mexican | 189 | 1.5% |
| Mexican American Indian | 4 | 0.0% |
| Mongolian | 9 | 0.1% |
| Norwegian | 129 | 1.0% |
| Palestinian | 7 | 0.1% |
| Peruvian | 110 | 0.9% |
| Polish | 271 | 2.1% |
| Portuguese | 9 | 0.1% |
| Puerto Rican | 228 | 1.8% |
| Romanian | 16 | 0.1% |
| Russian | 271 | 2.1% |
| Salvadoran | 110 | 0.9% |
| Samoan | 2 | 0.0% |
| Scandinavian | 12 | 0.1% |
| Scotch-Irish | 100 | 0.8% |
| Scottish | 418 | 3.3% |
| Slavic | 32 | 0.3% |
| Slovak | 36 | 0.3% |
| Slovene | 12 | 0.1% |
| South American | 328 | 2.5% |
| Spanish | 9 | 0.1% |
| Sri Lankan | 152 | 1.2% |
| Subsaharan African | 85 | 0.7% |
| Swedish | 121 | 0.9% |
| Swiss | 20 | 0.2% |
| Syrian | 48 | 0.4% |
| Thai | 529 | 4.1% |
| Turkish | 8 | 0.1% |
| Ukrainian | 49 | 0.4% |
| Venezuelan | 37 | 0.3% |
| Welsh | 109 | 0.9% |
| Yugoslavian | 38 | 0.3% | View All 82 Rows |
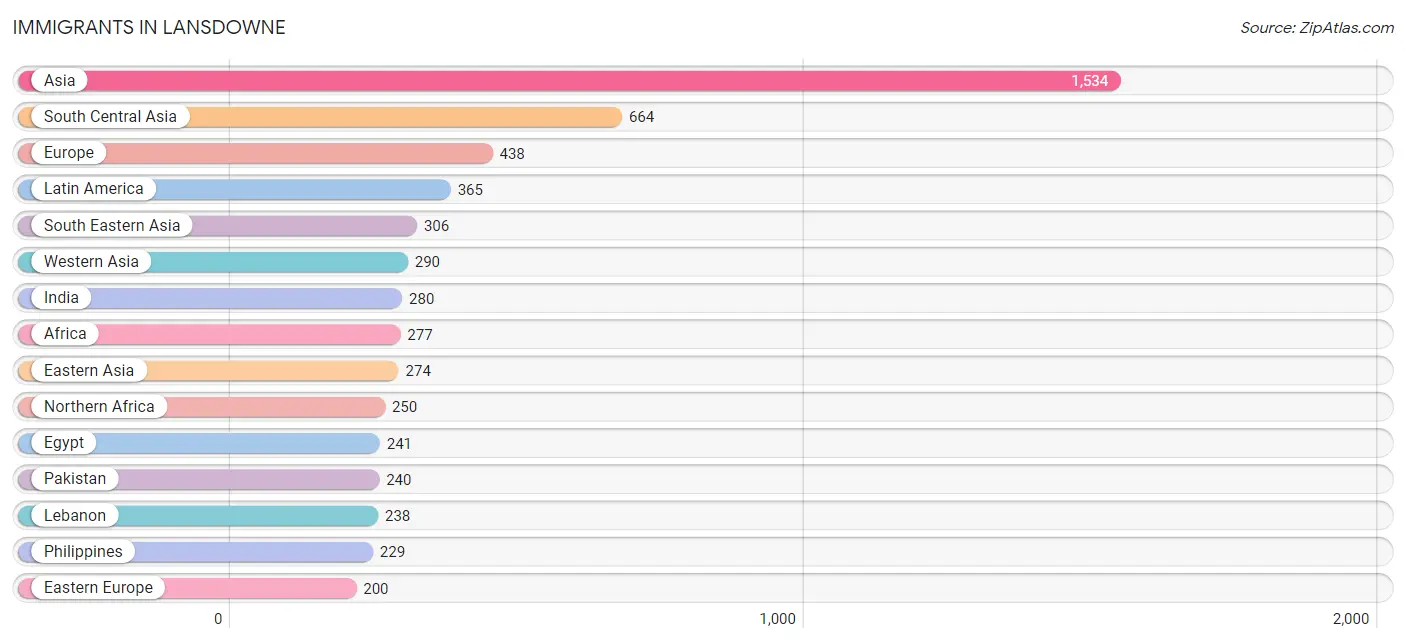
Immigrants in Lansdowne
The most numerous immigrant groups reported in Lansdowne came from Asia (1,534 | 11.9%), South Central Asia (664 | 5.2%), Europe (438 | 3.4%), Latin America (365 | 2.8%), and South Eastern Asia (306 | 2.4%), together accounting for 25.8% of all Lansdowne residents.
| Immigration Origin | # Population | % Population |
| Afghanistan | 8 | 0.1% |
| Africa | 277 | 2.2% |
| Albania | 2 | 0.0% |
| Asia | 1,534 | 11.9% |
| Australia | 18 | 0.1% |
| Bolivia | 48 | 0.4% |
| Bosnia and Herzegovina | 38 | 0.3% |
| Brazil | 60 | 0.5% |
| Canada | 53 | 0.4% |
| Caribbean | 93 | 0.7% |
| Central America | 80 | 0.6% |
| China | 113 | 0.9% |
| Colombia | 27 | 0.2% |
| Cuba | 36 | 0.3% |
| Dominican Republic | 26 | 0.2% |
| Eastern Africa | 17 | 0.1% |
| Eastern Asia | 274 | 2.1% |
| Eastern Europe | 200 | 1.6% |
| Egypt | 241 | 1.9% |
| El Salvador | 9 | 0.1% |
| England | 48 | 0.4% |
| Ethiopia | 9 | 0.1% |
| Europe | 438 | 3.4% |
| France | 17 | 0.1% |
| Germany | 52 | 0.4% |
| Greece | 9 | 0.1% |
| Guatemala | 23 | 0.2% |
| Hungary | 7 | 0.1% |
| India | 280 | 2.2% |
| Iran | 127 | 1.0% |
| Iraq | 12 | 0.1% |
| Ireland | 93 | 0.7% |
| Italy | 19 | 0.2% |
| Jamaica | 31 | 0.2% |
| Japan | 10 | 0.1% |
| Korea | 151 | 1.2% |
| Laos | 9 | 0.1% |
| Latin America | 365 | 2.8% |
| Lebanon | 238 | 1.8% |
| Liberia | 10 | 0.1% |
| Mexico | 48 | 0.4% |
| Moldova | 16 | 0.1% |
| Northern Africa | 250 | 1.9% |
| Northern Europe | 141 | 1.1% |
| Oceania | 18 | 0.1% |
| Pakistan | 240 | 1.9% |
| Peru | 57 | 0.4% |
| Philippines | 229 | 1.8% |
| Russia | 137 | 1.1% |
| South America | 192 | 1.5% |
| South Central Asia | 664 | 5.2% |
| South Eastern Asia | 306 | 2.4% |
| Southern Europe | 28 | 0.2% |
| Sri Lanka | 9 | 0.1% |
| Syria | 32 | 0.3% |
| Taiwan | 31 | 0.2% |
| Turkey | 8 | 0.1% |
| Uganda | 8 | 0.1% |
| Vietnam | 68 | 0.5% |
| Western Africa | 10 | 0.1% |
| Western Asia | 290 | 2.3% |
| Western Europe | 69 | 0.5% | View All 62 Rows |
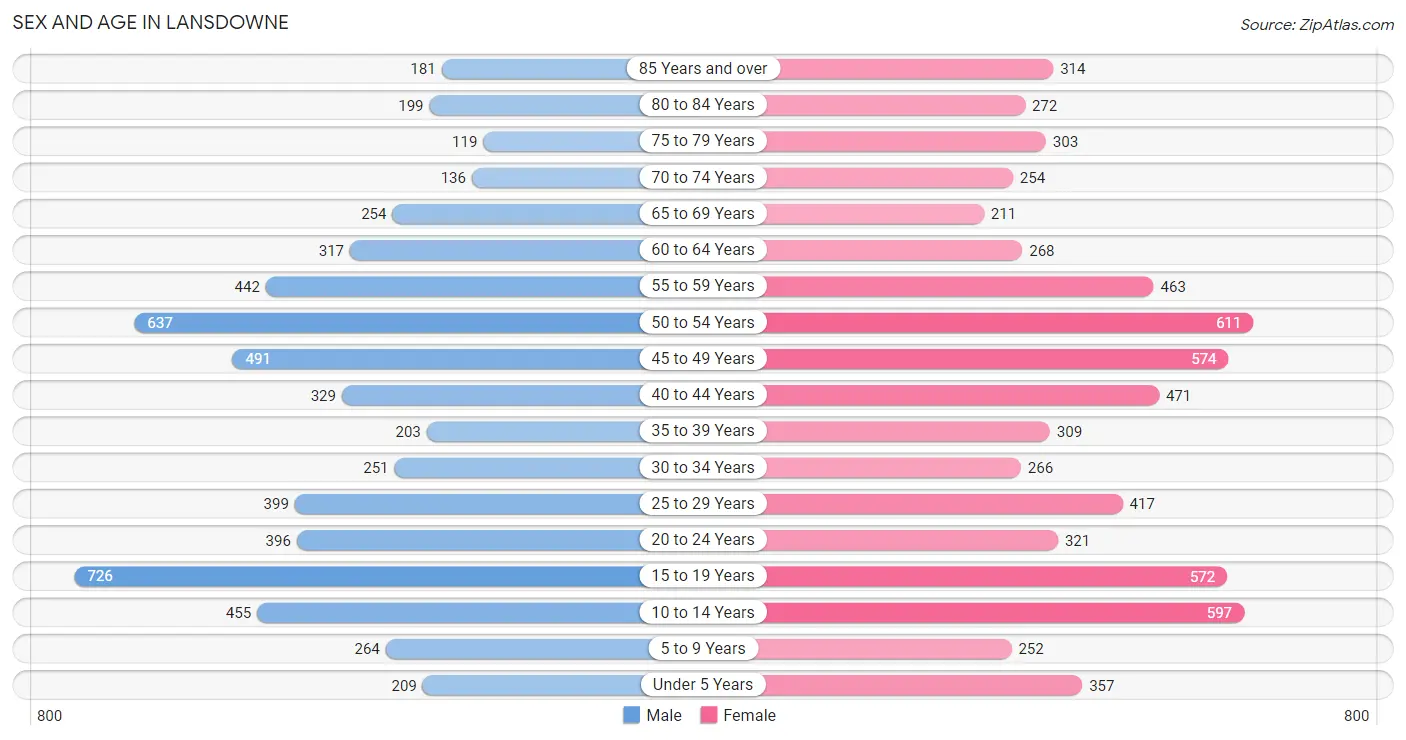
Sex and Age in Lansdowne
Sex and Age in Lansdowne
The most populous age groups in Lansdowne are 15 to 19 Years (726 | 12.1%) for men and 50 to 54 Years (611 | 8.9%) for women.
| Age Bracket | Male | Female |
| Under 5 Years | 209 (3.5%) | 357 (5.2%) |
| 5 to 9 Years | 264 (4.4%) | 252 (3.7%) |
| 10 to 14 Years | 455 (7.6%) | 597 (8.7%) |
| 15 to 19 Years | 726 (12.1%) | 572 (8.4%) |
| 20 to 24 Years | 396 (6.6%) | 321 (4.7%) |
| 25 to 29 Years | 399 (6.6%) | 417 (6.1%) |
| 30 to 34 Years | 251 (4.2%) | 266 (3.9%) |
| 35 to 39 Years | 203 (3.4%) | 309 (4.5%) |
| 40 to 44 Years | 329 (5.5%) | 471 (6.9%) |
| 45 to 49 Years | 491 (8.2%) | 574 (8.4%) |
| 50 to 54 Years | 637 (10.6%) | 611 (8.9%) |
| 55 to 59 Years | 442 (7.4%) | 463 (6.8%) |
| 60 to 64 Years | 317 (5.3%) | 268 (3.9%) |
| 65 to 69 Years | 254 (4.2%) | 211 (3.1%) |
| 70 to 74 Years | 136 (2.3%) | 254 (3.7%) |
| 75 to 79 Years | 119 (2.0%) | 303 (4.4%) |
| 80 to 84 Years | 199 (3.3%) | 272 (4.0%) |
| 85 Years and over | 181 (3.0%) | 314 (4.6%) |
| Total | 6,008 (100.0%) | 6,832 (100.0%) |
Families and Households in Lansdowne
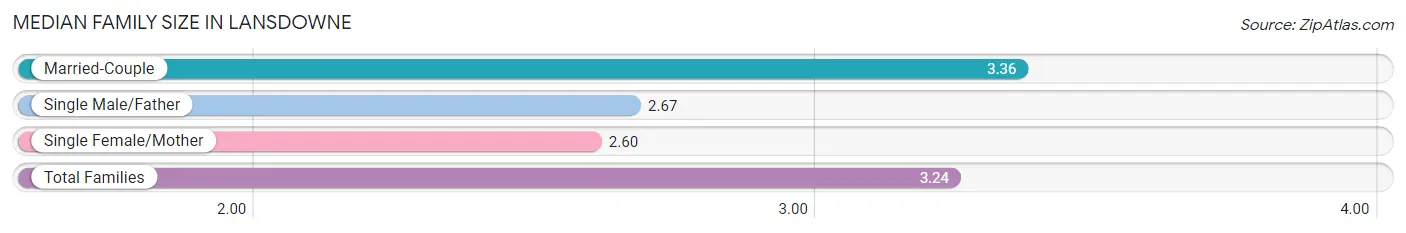
Median Family Size in Lansdowne
The median family size in Lansdowne is 3.24 persons per family, with married-couple families (2,838 | 84.2%) accounting for the largest median family size of 3.36 persons per family. On the other hand, single female/mother families (375 | 11.1%) represent the smallest median family size with 2.60 persons per family.
| Family Type | # Families | Family Size |
| Married-Couple | 2,838 (84.2%) | 3.36 |
| Single Male/Father | 159 (4.7%) | 2.67 |
| Single Female/Mother | 375 (11.1%) | 2.60 |
| Total Families | 3,372 (100.0%) | 3.24 |
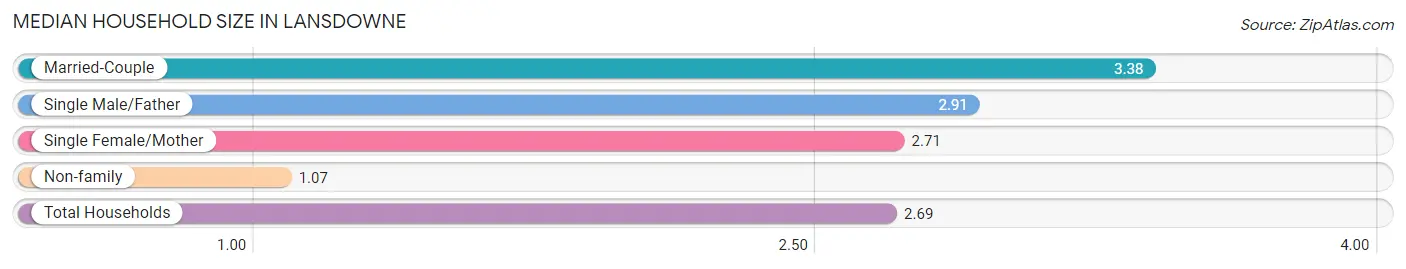
Median Household Size in Lansdowne
The median household size in Lansdowne is 2.69 persons per household, with married-couple households (2,838 | 61.7%) accounting for the largest median household size of 3.38 persons per household. non-family households (1,229 | 26.7%) represent the smallest median household size with 1.07 persons per household.
| Household Type | # Households | Household Size |
| Married-Couple | 2,838 (61.7%) | 3.38 |
| Single Male/Father | 159 (3.5%) | 2.91 |
| Single Female/Mother | 375 (8.2%) | 2.71 |
| Non-family | 1,229 (26.7%) | 1.07 |
| Total Households | 4,601 (100.0%) | 2.69 |
Household Size by Marriage Status in Lansdowne
Out of a total of 4,601 households in Lansdowne, 3,372 (73.3%) are family households, while 1,229 (26.7%) are nonfamily households. The most numerous type of family households are 2-person households, comprising 1,262, and the most common type of nonfamily households are 1-person households, comprising 1,144.
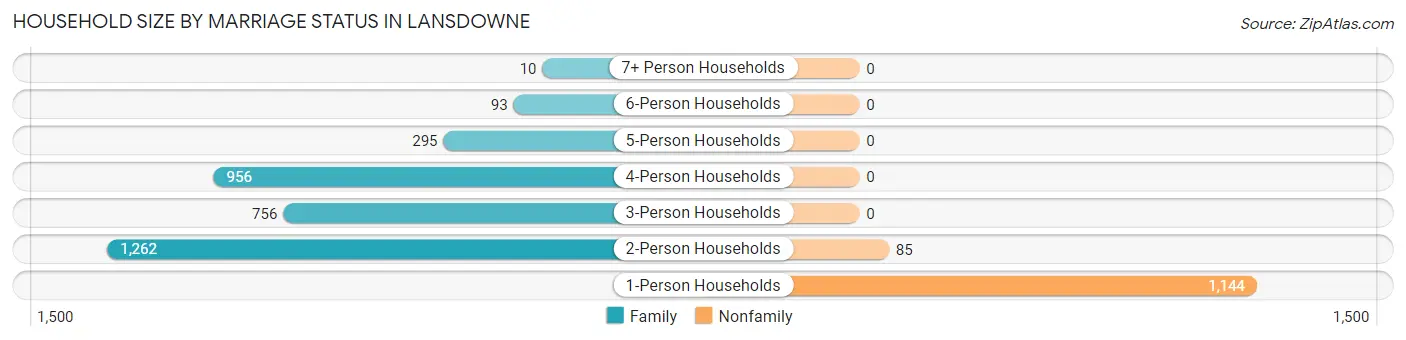
| Household Size | Family Households | Nonfamily Households |
| 1-Person Households | - | 1,144 (24.9%) |
| 2-Person Households | 1,262 (27.4%) | 85 (1.8%) |
| 3-Person Households | 756 (16.4%) | 0 (0.0%) |
| 4-Person Households | 956 (20.8%) | 0 (0.0%) |
| 5-Person Households | 295 (6.4%) | 0 (0.0%) |
| 6-Person Households | 93 (2.0%) | 0 (0.0%) |
| 7+ Person Households | 10 (0.2%) | 0 (0.0%) |
| Total | 3,372 (73.3%) | 1,229 (26.7%) |
Female Fertility in Lansdowne
Fertility by Age in Lansdowne
Average fertility rate in Lansdowne is 56.0 births per 1,000 women. Women in the age bracket of 20 to 34 years have the highest fertility rate with 115.0 births per 1,000 women. Women in the age bracket of 20 to 34 years acount for 66.5% of all women with births.
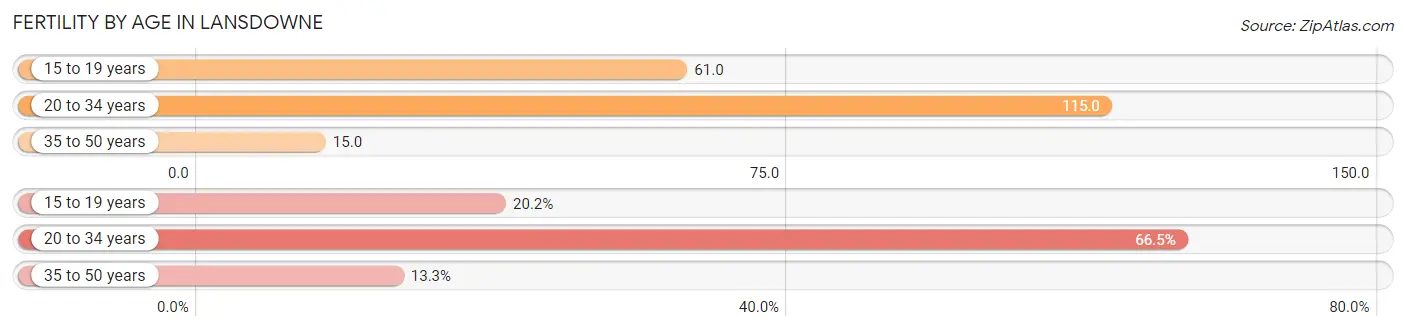
| Age Bracket | Women with Births | Births / 1,000 Women |
| 15 to 19 years | 35 (20.2%) | 61.0 |
| 20 to 34 years | 115 (66.5%) | 115.0 |
| 35 to 50 years | 23 (13.3%) | 15.0 |
| Total | 173 (100.0%) | 56.0 |
Fertility by Age by Marriage Status in Lansdowne
79.8% of women with births (173) in Lansdowne are married. The highest percentage of unmarried women with births falls into 15 to 19 years age bracket with 100.0% of them unmarried at the time of birth, while the lowest percentage of unmarried women with births belong to 20 to 34 years age bracket with 0.0% of them unmarried.
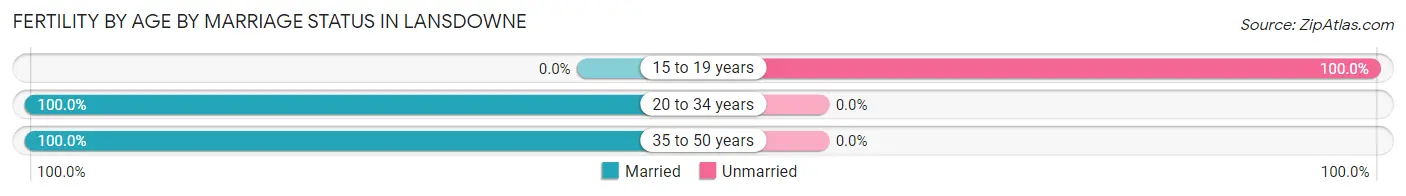
| Age Bracket | Married | Unmarried |
| 15 to 19 years | 0 (0.0%) | 35 (100.0%) |
| 20 to 34 years | 115 (100.0%) | 0 (0.0%) |
| 35 to 50 years | 23 (100.0%) | 0 (0.0%) |
| Total | 138 (79.8%) | 35 (20.2%) |
Fertility by Education in Lansdowne
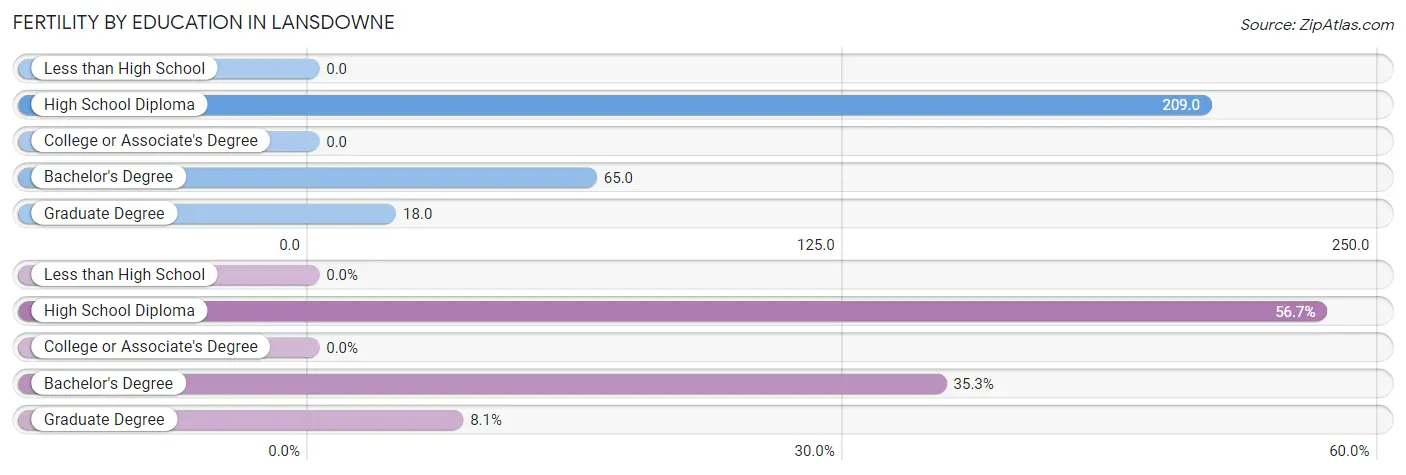
| Educational Attainment | Women with Births | Births / 1,000 Women |
| Less than High School | 0 (0.0%) | 0.0 |
| High School Diploma | 98 (56.7%) | 209.0 |
| College or Associate's Degree | 0 (0.0%) | 0.0 |
| Bachelor's Degree | 61 (35.3%) | 65.0 |
| Graduate Degree | 14 (8.1%) | 18.0 |
| Total | 173 (100.0%) | 56.0 |
Fertility by Education by Marriage Status in Lansdowne
20.2% of women with births in Lansdowne are unmarried. Women with the educational attainment of bachelor's degree are most likely to be married with 100.0% of them married at childbirth, while women with the educational attainment of high school diploma are least likely to be married with 35.7% of them unmarried at childbirth.
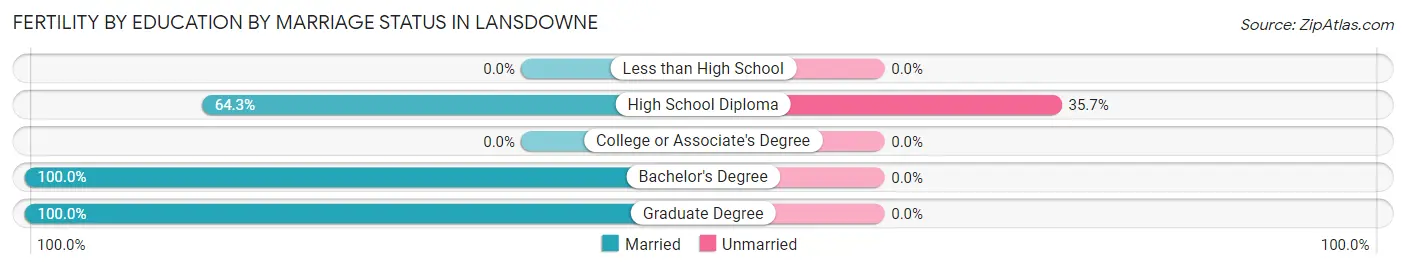
| Educational Attainment | Married | Unmarried |
| Less than High School | 0 (0.0%) | 0 (0.0%) |
| High School Diploma | 63 (64.3%) | 35 (35.7%) |
| College or Associate's Degree | 0 (0.0%) | 0 (0.0%) |
| Bachelor's Degree | 61 (100.0%) | 0 (0.0%) |
| Graduate Degree | 14 (100.0%) | 0 (0.0%) |
| Total | 138 (79.8%) | 35 (20.2%) |
Employment Characteristics in Lansdowne
Employment by Class of Employer in Lansdowne
Among the 6,499 employed individuals in Lansdowne, private company employees (3,970 | 61.1%), not-for-profit organizations (742 | 11.4%), and federal government employees (546 | 8.4%) make up the most common classes of employment.
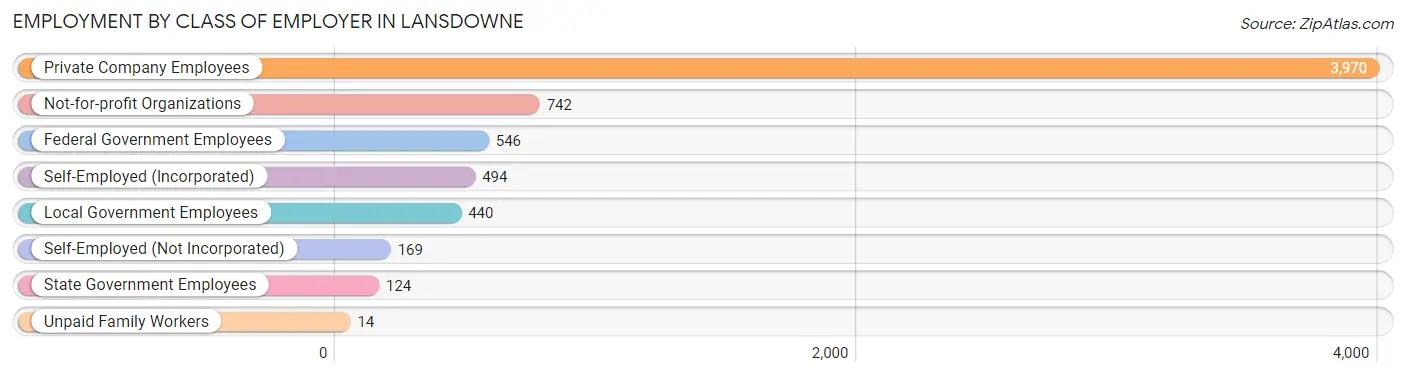
| Employer Class | # Employees | % Employees |
| Private Company Employees | 3,970 | 61.1% |
| Self-Employed (Incorporated) | 494 | 7.6% |
| Self-Employed (Not Incorporated) | 169 | 2.6% |
| Not-for-profit Organizations | 742 | 11.4% |
| Local Government Employees | 440 | 6.8% |
| State Government Employees | 124 | 1.9% |
| Federal Government Employees | 546 | 8.4% |
| Unpaid Family Workers | 14 | 0.2% |
| Total | 6,499 | 100.0% |
Employment Status by Age in Lansdowne
According to the labor force statistics for Lansdowne, out of the total population over 16 years of age (10,372), 65.0% or 6,742 individuals are in the labor force, with 1.3% or 88 of them unemployed. The age group with the highest labor force participation rate is 45 to 54 years, with 92.1% or 2,130 individuals in the labor force. Within the labor force, the 75 years and over age range has the highest percentage of unemployed individuals, with 10.0% or 6 of them being unemployed.
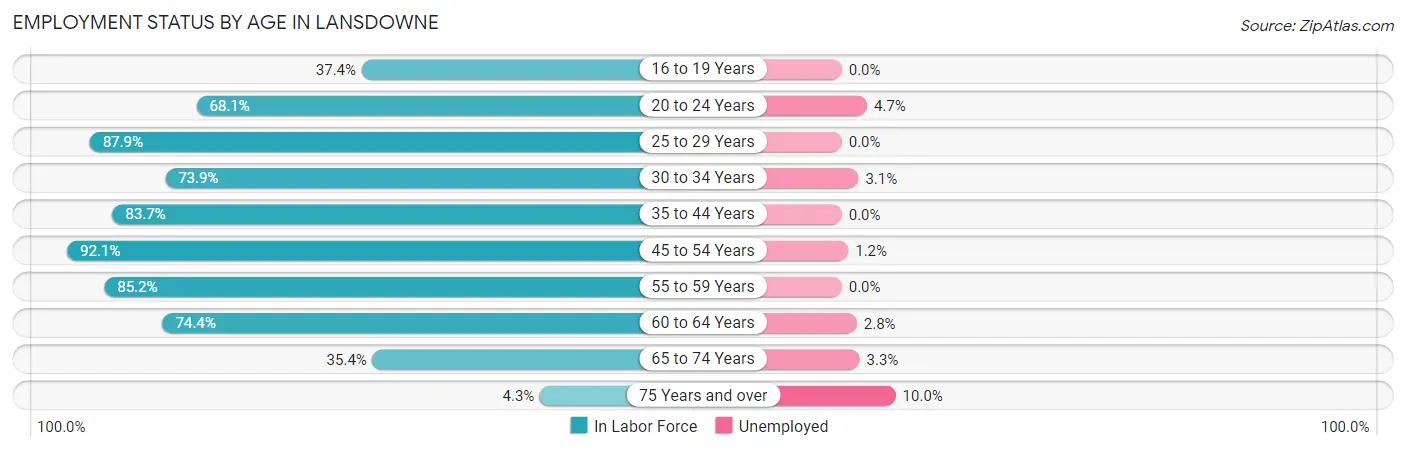
| Age Bracket | In Labor Force | Unemployed |
| 16 to 19 Years | 361 (37.4%) | 0 (0.0%) |
| 20 to 24 Years | 488 (68.1%) | 23 (4.7%) |
| 25 to 29 Years | 717 (87.9%) | 0 (0.0%) |
| 30 to 34 Years | 382 (73.9%) | 12 (3.1%) |
| 35 to 44 Years | 1,098 (83.7%) | 0 (0.0%) |
| 45 to 54 Years | 2,130 (92.1%) | 26 (1.2%) |
| 55 to 59 Years | 771 (85.2%) | 0 (0.0%) |
| 60 to 64 Years | 435 (74.4%) | 12 (2.8%) |
| 65 to 74 Years | 303 (35.4%) | 10 (3.3%) |
| 75 Years and over | 60 (4.3%) | 6 (10.0%) |
| Total | 6,742 (65.0%) | 88 (1.3%) |
Employment Status by Educational Attainment in Lansdowne
According to labor force statistics for Lansdowne, 85.8% of individuals (5,532) out of the total population between 25 and 64 years of age (6,448) are in the labor force, with 0.9% or 50 of them being unemployed. The group with the highest labor force participation rate are those with the educational attainment of bachelor's degree or higher, with 89.4% or 3,983 individuals in the labor force. Within the labor force, individuals with high school diploma education have the highest percentage of unemployment, with 3.3% or 12 of them being unemployed.
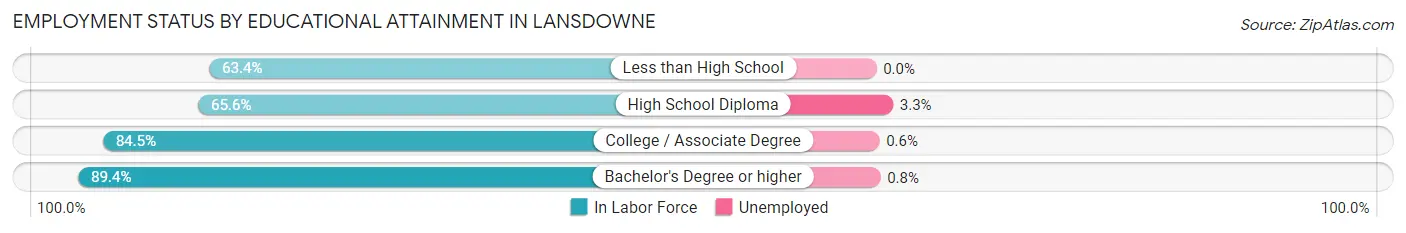
| Educational Attainment | In Labor Force | Unemployed |
| Less than High School | 85 (63.4%) | 0 (0.0%) |
| High School Diploma | 359 (65.6%) | 18 (3.3%) |
| College / Associate Degree | 1,109 (84.5%) | 8 (0.6%) |
| Bachelor's Degree or higher | 3,983 (89.4%) | 36 (0.8%) |
| Total | 5,532 (85.8%) | 58 (0.9%) |
Employment Occupations by Sex in Lansdowne
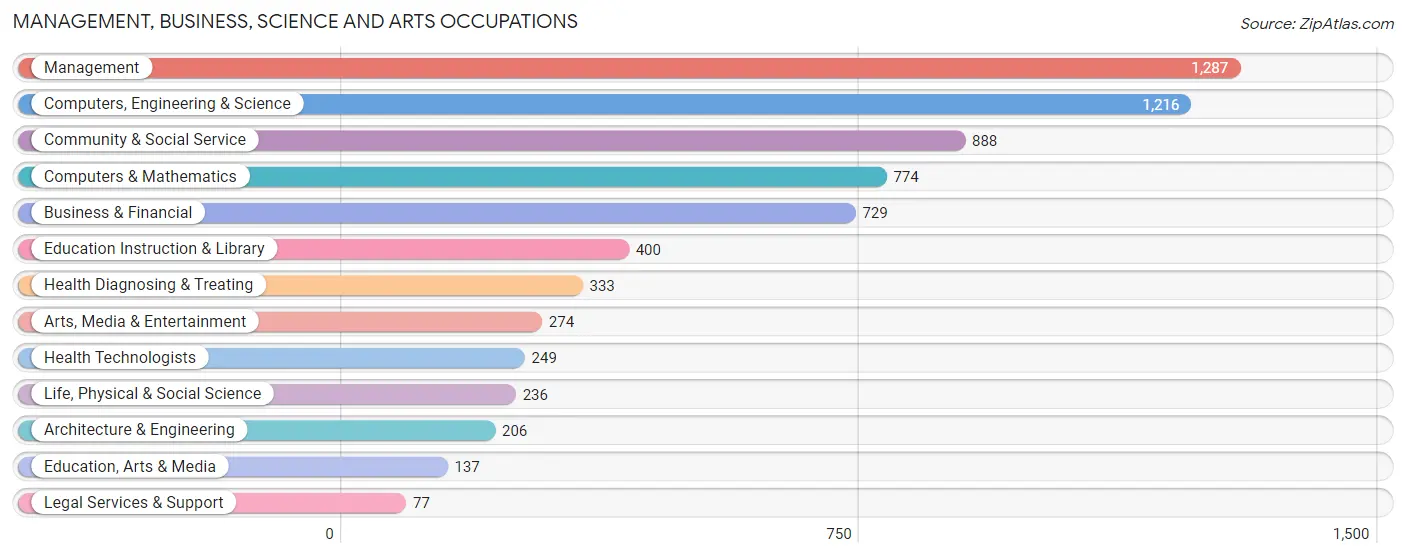
Management, Business, Science and Arts Occupations
The most common Management, Business, Science and Arts occupations in Lansdowne are Management (1,287 | 19.5%), Computers, Engineering & Science (1,216 | 18.4%), Community & Social Service (888 | 13.4%), Computers & Mathematics (774 | 11.7%), and Business & Financial (729 | 11.0%).
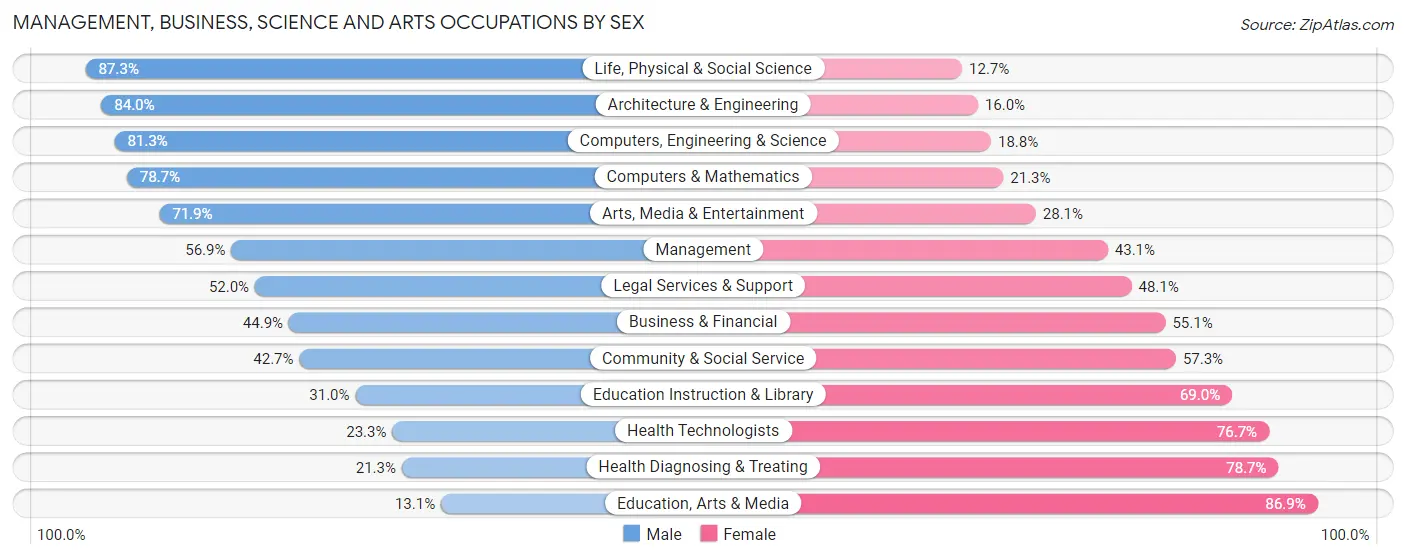
Management, Business, Science and Arts Occupations by Sex
Within the Management, Business, Science and Arts occupations in Lansdowne, the most male-oriented occupations are Life, Physical & Social Science (87.3%), Architecture & Engineering (84.0%), and Computers, Engineering & Science (81.2%), while the most female-oriented occupations are Education, Arts & Media (86.9%), Health Diagnosing & Treating (78.7%), and Health Technologists (76.7%).
| Occupation | Male | Female |
| Management | 732 (56.9%) | 555 (43.1%) |
| Business & Financial | 327 (44.9%) | 402 (55.1%) |
| Computers, Engineering & Science | 988 (81.2%) | 228 (18.8%) |
| Computers & Mathematics | 609 (78.7%) | 165 (21.3%) |
| Architecture & Engineering | 173 (84.0%) | 33 (16.0%) |
| Life, Physical & Social Science | 206 (87.3%) | 30 (12.7%) |
| Community & Social Service | 379 (42.7%) | 509 (57.3%) |
| Education, Arts & Media | 18 (13.1%) | 119 (86.9%) |
| Legal Services & Support | 40 (51.9%) | 37 (48.0%) |
| Education Instruction & Library | 124 (31.0%) | 276 (69.0%) |
| Arts, Media & Entertainment | 197 (71.9%) | 77 (28.1%) |
| Health Diagnosing & Treating | 71 (21.3%) | 262 (78.7%) |
| Health Technologists | 58 (23.3%) | 191 (76.7%) |
| Total (Category) | 2,497 (56.1%) | 1,956 (43.9%) |
| Total (Overall) | 3,494 (52.8%) | 3,117 (47.1%) |
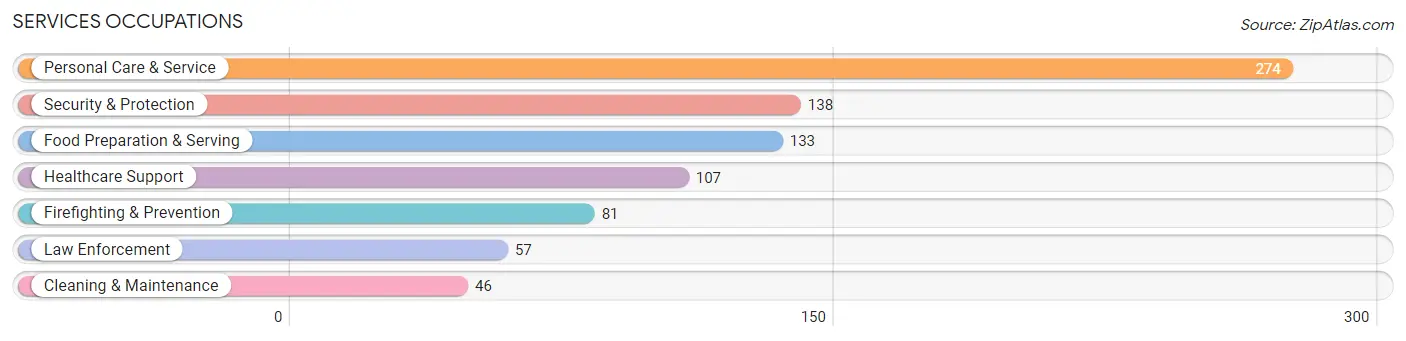
Services Occupations
The most common Services occupations in Lansdowne are Personal Care & Service (274 | 4.1%), Security & Protection (138 | 2.1%), Food Preparation & Serving (133 | 2.0%), Healthcare Support (107 | 1.6%), and Firefighting & Prevention (81 | 1.2%).
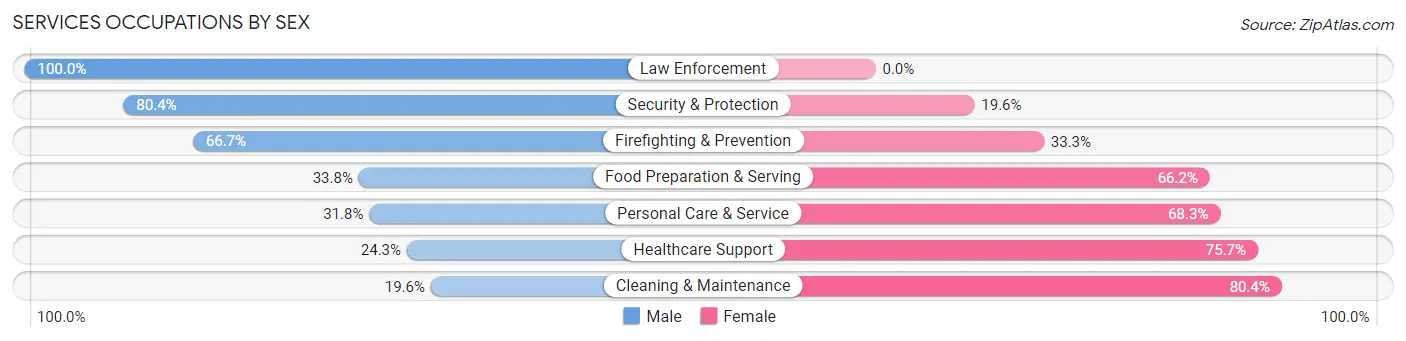
Services Occupations by Sex
Within the Services occupations in Lansdowne, the most male-oriented occupations are Law Enforcement (100.0%), Security & Protection (80.4%), and Firefighting & Prevention (66.7%), while the most female-oriented occupations are Cleaning & Maintenance (80.4%), Healthcare Support (75.7%), and Personal Care & Service (68.2%).
| Occupation | Male | Female |
| Healthcare Support | 26 (24.3%) | 81 (75.7%) |
| Security & Protection | 111 (80.4%) | 27 (19.6%) |
| Firefighting & Prevention | 54 (66.7%) | 27 (33.3%) |
| Law Enforcement | 57 (100.0%) | 0 (0.0%) |
| Food Preparation & Serving | 45 (33.8%) | 88 (66.2%) |
| Cleaning & Maintenance | 9 (19.6%) | 37 (80.4%) |
| Personal Care & Service | 87 (31.8%) | 187 (68.2%) |
| Total (Category) | 278 (39.8%) | 420 (60.2%) |
| Total (Overall) | 3,494 (52.8%) | 3,117 (47.1%) |
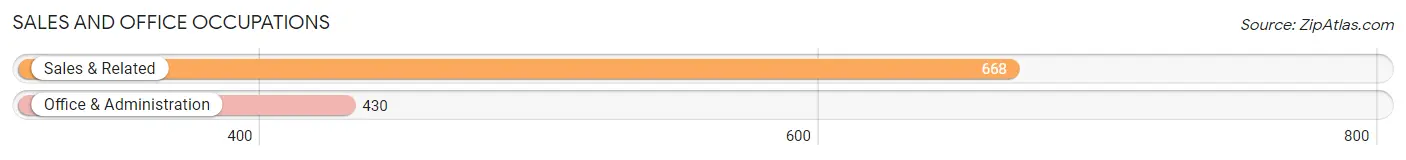
Sales and Office Occupations
The most common Sales and Office occupations in Lansdowne are Sales & Related (668 | 10.1%), and Office & Administration (430 | 6.5%).
Sales and Office Occupations by Sex
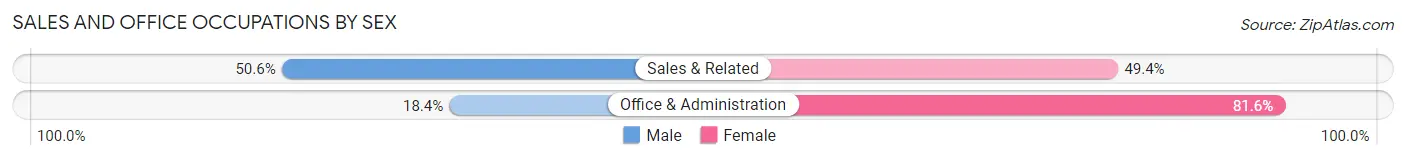
| Occupation | Male | Female |
| Sales & Related | 338 (50.6%) | 330 (49.4%) |
| Office & Administration | 79 (18.4%) | 351 (81.6%) |
| Total (Category) | 417 (38.0%) | 681 (62.0%) |
| Total (Overall) | 3,494 (52.8%) | 3,117 (47.1%) |
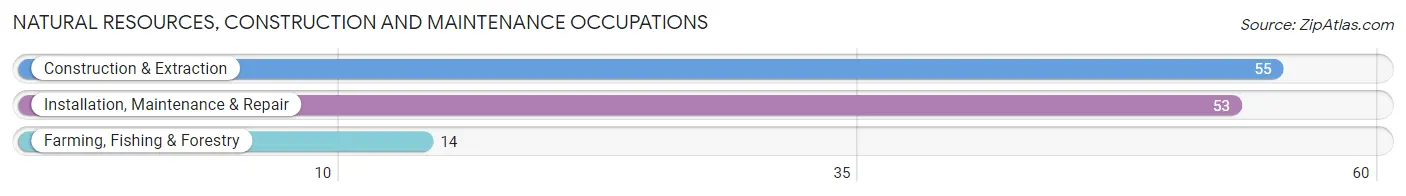
Natural Resources, Construction and Maintenance Occupations
The most common Natural Resources, Construction and Maintenance occupations in Lansdowne are Construction & Extraction (55 | 0.8%), Installation, Maintenance & Repair (53 | 0.8%), and Farming, Fishing & Forestry (14 | 0.2%).
Natural Resources, Construction and Maintenance Occupations by Sex
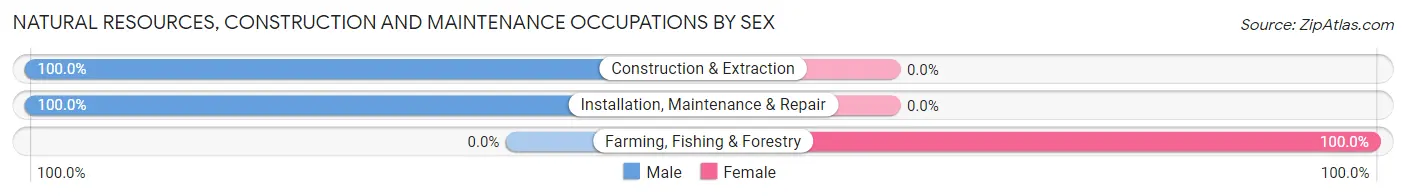
| Occupation | Male | Female |
| Farming, Fishing & Forestry | 0 (0.0%) | 14 (100.0%) |
| Construction & Extraction | 55 (100.0%) | 0 (0.0%) |
| Installation, Maintenance & Repair | 53 (100.0%) | 0 (0.0%) |
| Total (Category) | 108 (88.5%) | 14 (11.5%) |
| Total (Overall) | 3,494 (52.8%) | 3,117 (47.1%) |
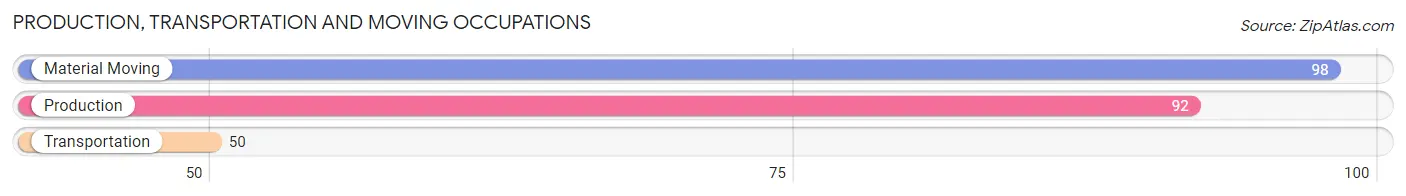
Production, Transportation and Moving Occupations
The most common Production, Transportation and Moving occupations in Lansdowne are Material Moving (98 | 1.5%), Production (92 | 1.4%), and Transportation (50 | 0.8%).
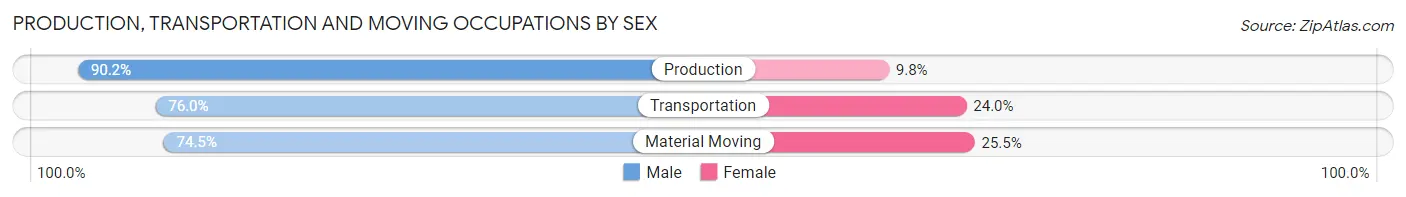
Production, Transportation and Moving Occupations by Sex
| Occupation | Male | Female |
| Production | 83 (90.2%) | 9 (9.8%) |
| Transportation | 38 (76.0%) | 12 (24.0%) |
| Material Moving | 73 (74.5%) | 25 (25.5%) |
| Total (Category) | 194 (80.8%) | 46 (19.2%) |
| Total (Overall) | 3,494 (52.8%) | 3,117 (47.1%) |
Employment Industries by Sex in Lansdowne
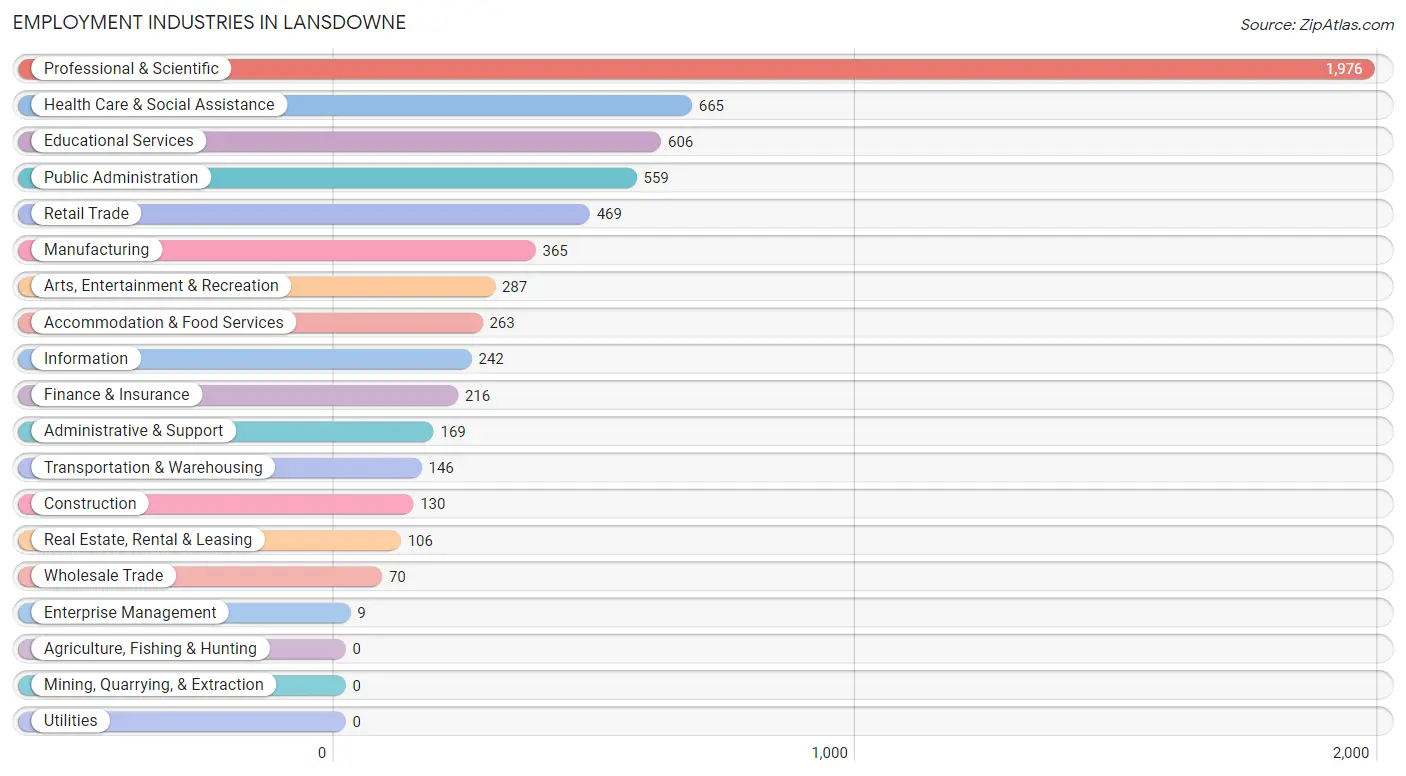
Employment Industries in Lansdowne
The major employment industries in Lansdowne include Professional & Scientific (1,976 | 29.9%), Health Care & Social Assistance (665 | 10.1%), Educational Services (606 | 9.2%), Public Administration (559 | 8.5%), and Retail Trade (469 | 7.1%).
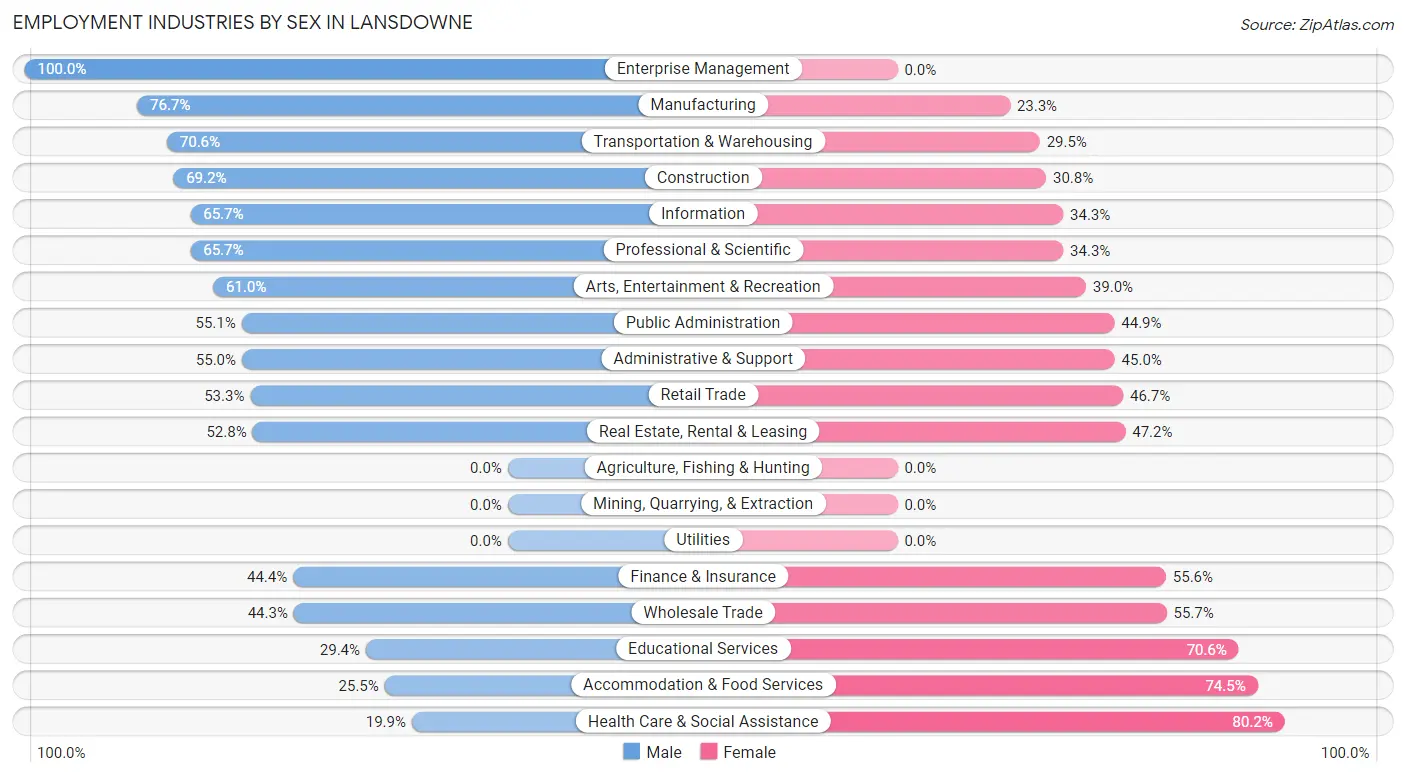
Employment Industries by Sex in Lansdowne
The Lansdowne industries that see more men than women are Enterprise Management (100.0%), Manufacturing (76.7%), and Transportation & Warehousing (70.6%), whereas the industries that tend to have a higher number of women are Health Care & Social Assistance (80.1%), Accommodation & Food Services (74.5%), and Educational Services (70.6%).
| Industry | Male | Female |
| Agriculture, Fishing & Hunting | 0 (0.0%) | 0 (0.0%) |
| Mining, Quarrying, & Extraction | 0 (0.0%) | 0 (0.0%) |
| Construction | 90 (69.2%) | 40 (30.8%) |
| Manufacturing | 280 (76.7%) | 85 (23.3%) |
| Wholesale Trade | 31 (44.3%) | 39 (55.7%) |
| Retail Trade | 250 (53.3%) | 219 (46.7%) |
| Transportation & Warehousing | 103 (70.6%) | 43 (29.4%) |
| Utilities | 0 (0.0%) | 0 (0.0%) |
| Information | 159 (65.7%) | 83 (34.3%) |
| Finance & Insurance | 96 (44.4%) | 120 (55.6%) |
| Real Estate, Rental & Leasing | 56 (52.8%) | 50 (47.2%) |
| Professional & Scientific | 1,298 (65.7%) | 678 (34.3%) |
| Enterprise Management | 9 (100.0%) | 0 (0.0%) |
| Administrative & Support | 93 (55.0%) | 76 (45.0%) |
| Educational Services | 178 (29.4%) | 428 (70.6%) |
| Health Care & Social Assistance | 132 (19.9%) | 533 (80.1%) |
| Arts, Entertainment & Recreation | 175 (61.0%) | 112 (39.0%) |
| Accommodation & Food Services | 67 (25.5%) | 196 (74.5%) |
| Public Administration | 308 (55.1%) | 251 (44.9%) |
| Total | 3,494 (52.8%) | 3,117 (47.1%) |
Education in Lansdowne
School Enrollment in Lansdowne
The most common levels of schooling among the 3,500 students in Lansdowne are high school (1,172 | 33.5%), middle school (811 | 23.2%), and college / undergraduate (654 | 18.7%).
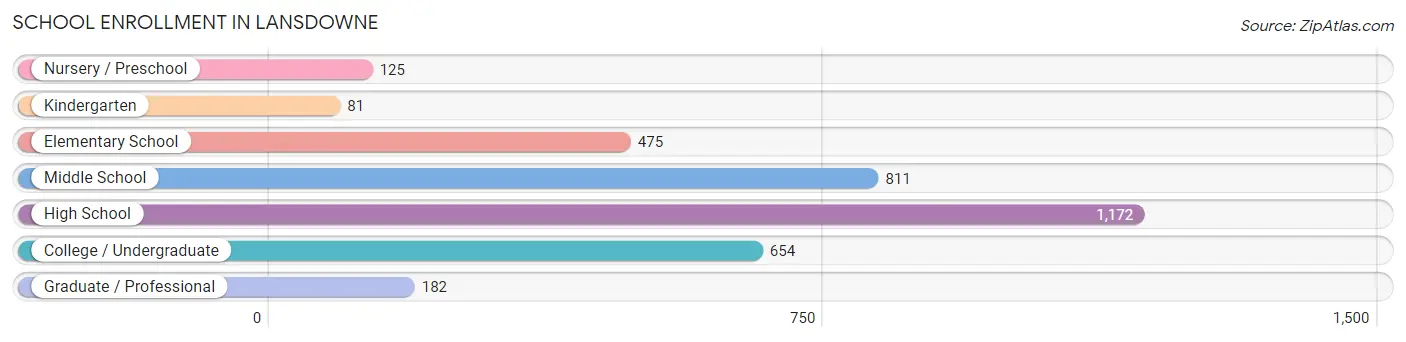
| School Level | # Students | % Students |
| Nursery / Preschool | 125 | 3.6% |
| Kindergarten | 81 | 2.3% |
| Elementary School | 475 | 13.6% |
| Middle School | 811 | 23.2% |
| High School | 1,172 | 33.5% |
| College / Undergraduate | 654 | 18.7% |
| Graduate / Professional | 182 | 5.2% |
| Total | 3,500 | 100.0% |
School Enrollment by Age by Funding Source in Lansdowne
Out of a total of 3,500 students who are enrolled in schools in Lansdowne, 690 (19.7%) attend a private institution, while the remaining 2,810 (80.3%) are enrolled in public schools. The age group of 3 to 4 year olds has the highest likelihood of being enrolled in private schools, with 76 (75.2% in the age bracket) enrolled. Conversely, the age group of 25 to 34 year olds has the lowest likelihood of being enrolled in a private school, with 84 (91.3% in the age bracket) attending a public institution.
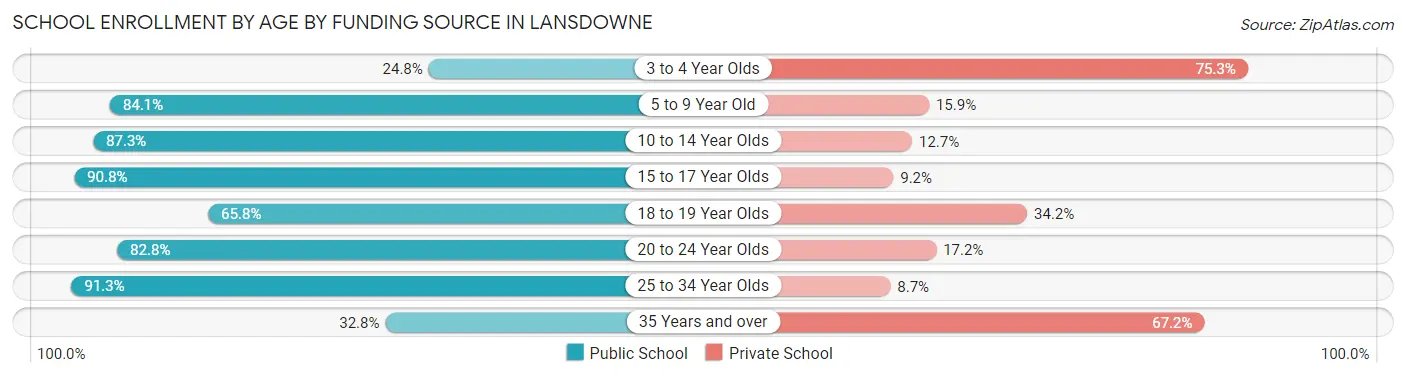
| Age Bracket | Public School | Private School |
| 3 to 4 Year Olds | 25 (24.7%) | 76 (75.2%) |
| 5 to 9 Year Old | 434 (84.1%) | 82 (15.9%) |
| 10 to 14 Year Olds | 918 (87.3%) | 134 (12.7%) |
| 15 to 17 Year Olds | 756 (90.8%) | 77 (9.2%) |
| 18 to 19 Year Olds | 235 (65.8%) | 122 (34.2%) |
| 20 to 24 Year Olds | 293 (82.8%) | 61 (17.2%) |
| 25 to 34 Year Olds | 84 (91.3%) | 8 (8.7%) |
| 35 Years and over | 64 (32.8%) | 131 (67.2%) |
| Total | 2,810 (80.3%) | 690 (19.7%) |
Educational Attainment by Field of Study in Lansdowne
Business (1,080 | 17.8%), social sciences (778 | 12.8%), engineering (768 | 12.7%), science & technology (469 | 7.7%), and education (415 | 6.9%) are the most common fields of study among 6,062 individuals in Lansdowne who have obtained a bachelor's degree or higher.
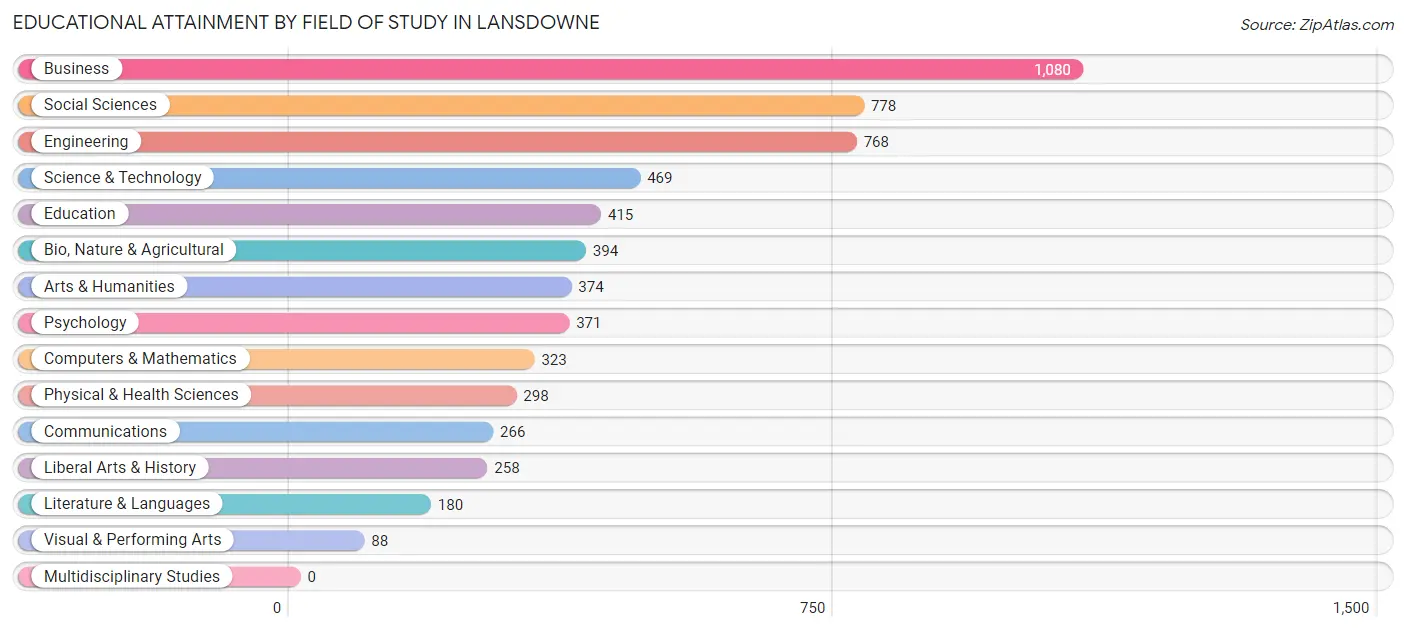
| Field of Study | # Graduates | % Graduates |
| Computers & Mathematics | 323 | 5.3% |
| Bio, Nature & Agricultural | 394 | 6.5% |
| Physical & Health Sciences | 298 | 4.9% |
| Psychology | 371 | 6.1% |
| Social Sciences | 778 | 12.8% |
| Engineering | 768 | 12.7% |
| Multidisciplinary Studies | 0 | 0.0% |
| Science & Technology | 469 | 7.7% |
| Business | 1,080 | 17.8% |
| Education | 415 | 6.9% |
| Literature & Languages | 180 | 3.0% |
| Liberal Arts & History | 258 | 4.3% |
| Visual & Performing Arts | 88 | 1.5% |
| Communications | 266 | 4.4% |
| Arts & Humanities | 374 | 6.2% |
| Total | 6,062 | 100.0% |
Transportation & Commute in Lansdowne
Vehicle Availability by Sex in Lansdowne
The most prevalent vehicle ownership categories in Lansdowne are males with 2 vehicles (1,393, accounting for 42.2%) and females with 2 vehicles (1,305, making up 46.8%).
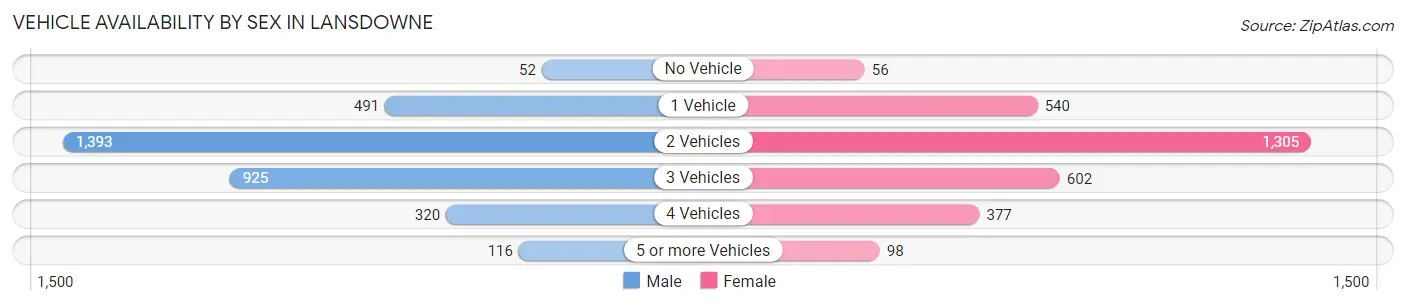
| Vehicles Available | Male | Female |
| No Vehicle | 52 (1.6%) | 56 (1.9%) |
| 1 Vehicle | 491 (14.9%) | 540 (18.1%) |
| 2 Vehicles | 1,393 (42.2%) | 1,305 (43.8%) |
| 3 Vehicles | 925 (28.1%) | 602 (20.2%) |
| 4 Vehicles | 320 (9.7%) | 377 (12.7%) |
| 5 or more Vehicles | 116 (3.5%) | 98 (3.3%) |
| Total | 3,297 (100.0%) | 2,978 (100.0%) |
Commute Time in Lansdowne
The most frequently occuring commute durations in Lansdowne are 15 to 19 minutes (751 commuters, 15.0%), 30 to 34 minutes (593 commuters, 11.8%), and 45 to 59 minutes (580 commuters, 11.6%).
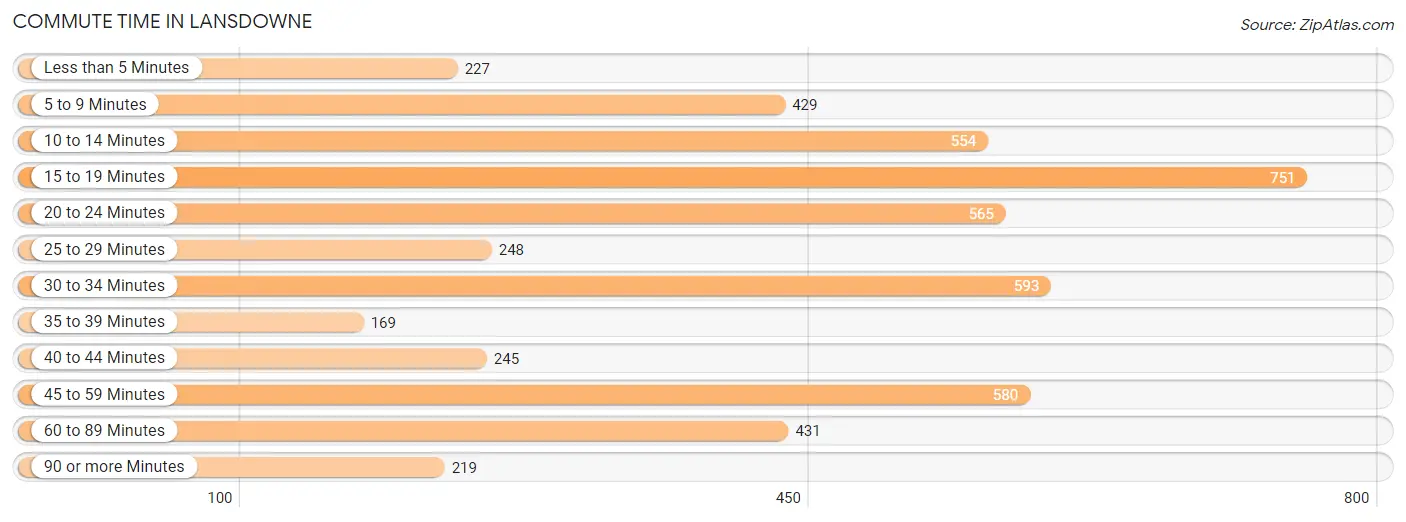
| Commute Time | # Commuters | % Commuters |
| Less than 5 Minutes | 227 | 4.5% |
| 5 to 9 Minutes | 429 | 8.6% |
| 10 to 14 Minutes | 554 | 11.1% |
| 15 to 19 Minutes | 751 | 15.0% |
| 20 to 24 Minutes | 565 | 11.3% |
| 25 to 29 Minutes | 248 | 5.0% |
| 30 to 34 Minutes | 593 | 11.8% |
| 35 to 39 Minutes | 169 | 3.4% |
| 40 to 44 Minutes | 245 | 4.9% |
| 45 to 59 Minutes | 580 | 11.6% |
| 60 to 89 Minutes | 431 | 8.6% |
| 90 or more Minutes | 219 | 4.4% |
Commute Time by Sex in Lansdowne
The most common commute times in Lansdowne are 45 to 59 minutes (420 commuters, 15.7%) for males and 30 to 34 minutes (365 commuters, 15.6%) for females.
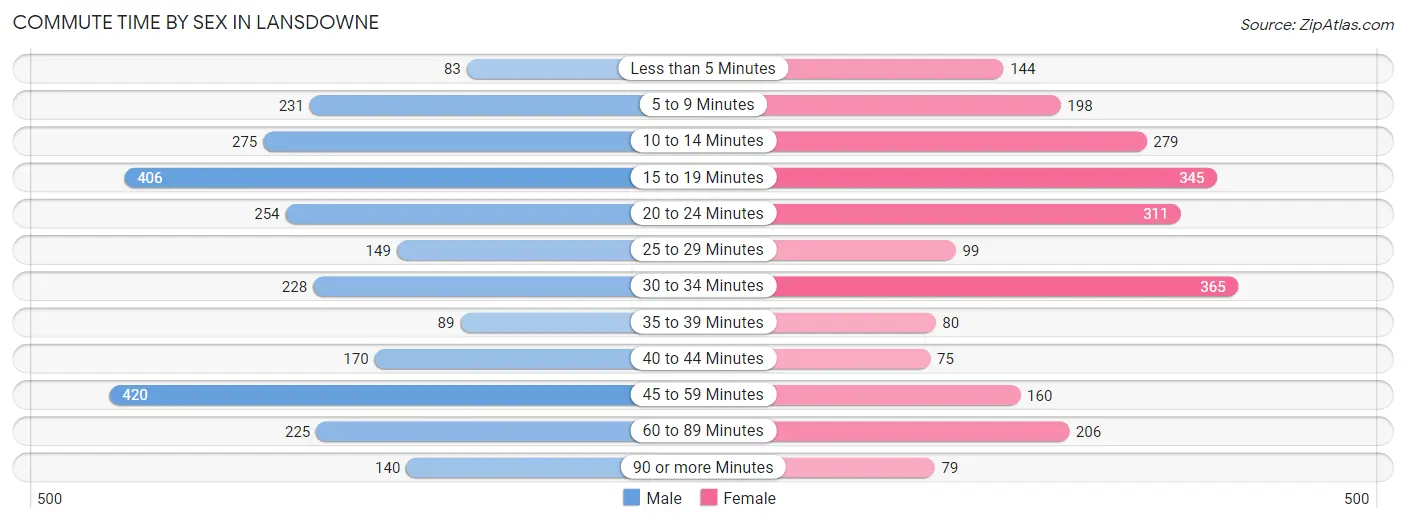
| Commute Time | Male | Female |
| Less than 5 Minutes | 83 (3.1%) | 144 (6.1%) |
| 5 to 9 Minutes | 231 (8.6%) | 198 (8.5%) |
| 10 to 14 Minutes | 275 (10.3%) | 279 (11.9%) |
| 15 to 19 Minutes | 406 (15.2%) | 345 (14.7%) |
| 20 to 24 Minutes | 254 (9.5%) | 311 (13.3%) |
| 25 to 29 Minutes | 149 (5.6%) | 99 (4.2%) |
| 30 to 34 Minutes | 228 (8.5%) | 365 (15.6%) |
| 35 to 39 Minutes | 89 (3.3%) | 80 (3.4%) |
| 40 to 44 Minutes | 170 (6.4%) | 75 (3.2%) |
| 45 to 59 Minutes | 420 (15.7%) | 160 (6.8%) |
| 60 to 89 Minutes | 225 (8.4%) | 206 (8.8%) |
| 90 or more Minutes | 140 (5.2%) | 79 (3.4%) |
Time of Departure to Work by Sex in Lansdowne
The most frequent times of departure to work in Lansdowne are 8:00 AM to 8:29 AM (433, 16.2%) for males and 9:00 AM to 9:59 AM (389, 16.6%) for females.
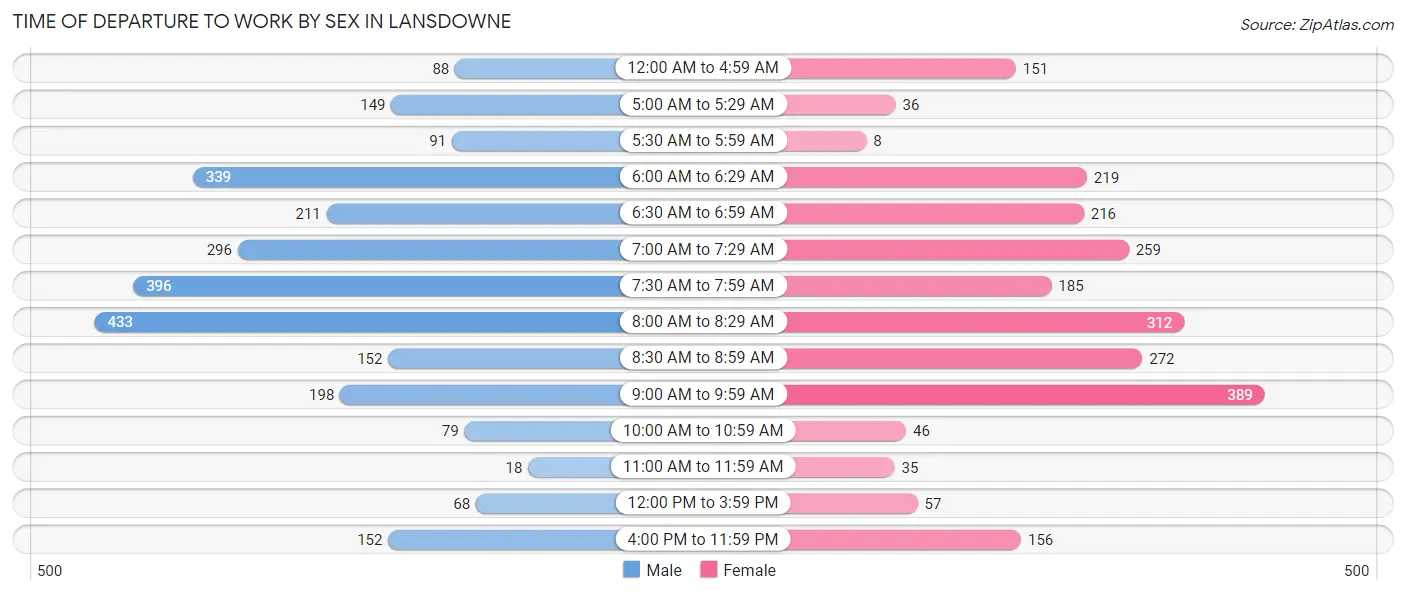
| Time of Departure | Male | Female |
| 12:00 AM to 4:59 AM | 88 (3.3%) | 151 (6.5%) |
| 5:00 AM to 5:29 AM | 149 (5.6%) | 36 (1.5%) |
| 5:30 AM to 5:59 AM | 91 (3.4%) | 8 (0.3%) |
| 6:00 AM to 6:29 AM | 339 (12.7%) | 219 (9.3%) |
| 6:30 AM to 6:59 AM | 211 (7.9%) | 216 (9.2%) |
| 7:00 AM to 7:29 AM | 296 (11.1%) | 259 (11.1%) |
| 7:30 AM to 7:59 AM | 396 (14.8%) | 185 (7.9%) |
| 8:00 AM to 8:29 AM | 433 (16.2%) | 312 (13.3%) |
| 8:30 AM to 8:59 AM | 152 (5.7%) | 272 (11.6%) |
| 9:00 AM to 9:59 AM | 198 (7.4%) | 389 (16.6%) |
| 10:00 AM to 10:59 AM | 79 (3.0%) | 46 (2.0%) |
| 11:00 AM to 11:59 AM | 18 (0.7%) | 35 (1.5%) |
| 12:00 PM to 3:59 PM | 68 (2.5%) | 57 (2.4%) |
| 4:00 PM to 11:59 PM | 152 (5.7%) | 156 (6.7%) |
| Total | 2,670 (100.0%) | 2,341 (100.0%) |
Housing Occupancy in Lansdowne
Occupancy by Ownership in Lansdowne
Of the total 4,601 dwellings in Lansdowne, owner-occupied units account for 3,385 (73.6%), while renter-occupied units make up 1,216 (26.4%).
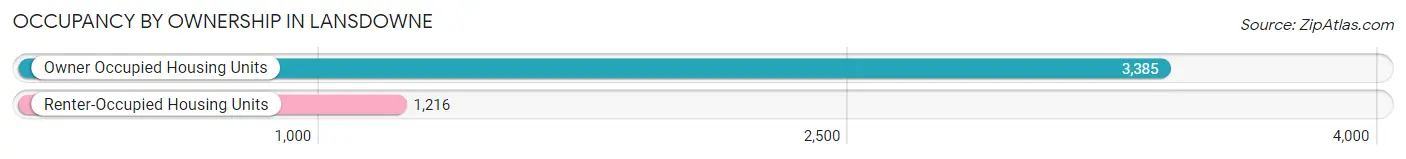
| Occupancy | # Housing Units | % Housing Units |
| Owner Occupied Housing Units | 3,385 | 73.6% |
| Renter-Occupied Housing Units | 1,216 | 26.4% |
| Total Occupied Housing Units | 4,601 | 100.0% |
Occupancy by Household Size in Lansdowne
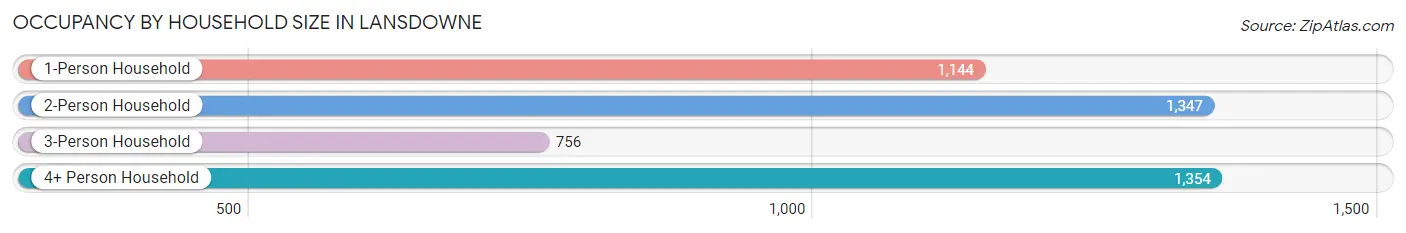
| Household Size | # Housing Units | % Housing Units |
| 1-Person Household | 1,144 | 24.9% |
| 2-Person Household | 1,347 | 29.3% |
| 3-Person Household | 756 | 16.4% |
| 4+ Person Household | 1,354 | 29.4% |
| Total Housing Units | 4,601 | 100.0% |
Occupancy by Ownership by Household Size in Lansdowne
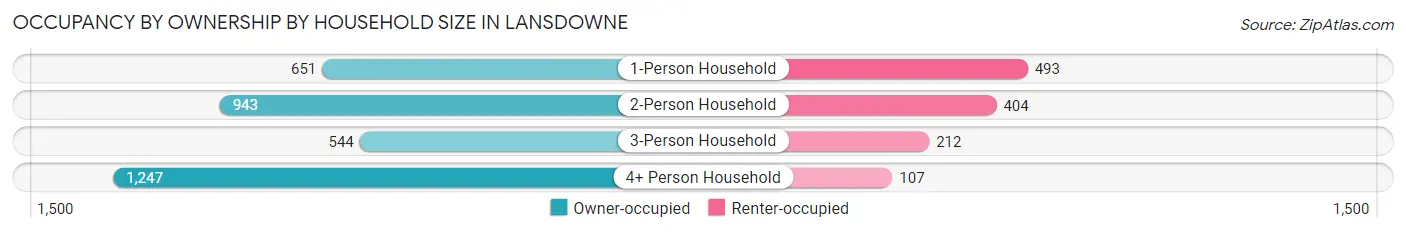
| Household Size | Owner-occupied | Renter-occupied |
| 1-Person Household | 651 (56.9%) | 493 (43.1%) |
| 2-Person Household | 943 (70.0%) | 404 (30.0%) |
| 3-Person Household | 544 (72.0%) | 212 (28.0%) |
| 4+ Person Household | 1,247 (92.1%) | 107 (7.9%) |
| Total Housing Units | 3,385 (73.6%) | 1,216 (26.4%) |
Occupancy by Educational Attainment in Lansdowne
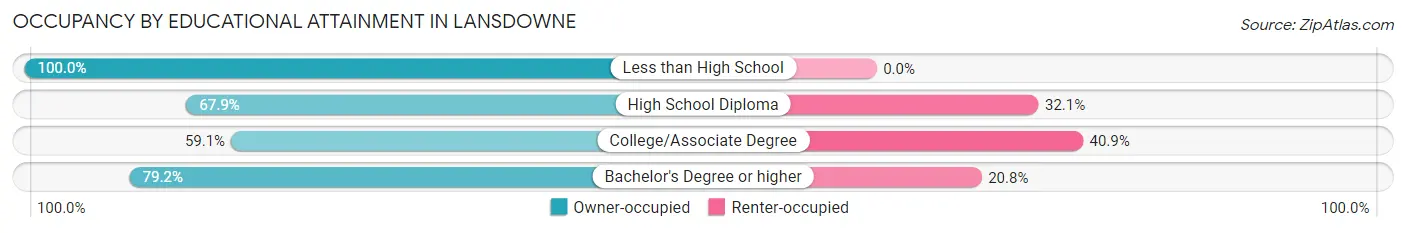
| Household Size | Owner-occupied | Renter-occupied |
| Less than High School | 11 (100.0%) | 0 (0.0%) |
| High School Diploma | 182 (67.9%) | 86 (32.1%) |
| College/Associate Degree | 676 (59.1%) | 468 (40.9%) |
| Bachelor's Degree or higher | 2,516 (79.2%) | 662 (20.8%) |
Occupancy by Age of Householder in Lansdowne
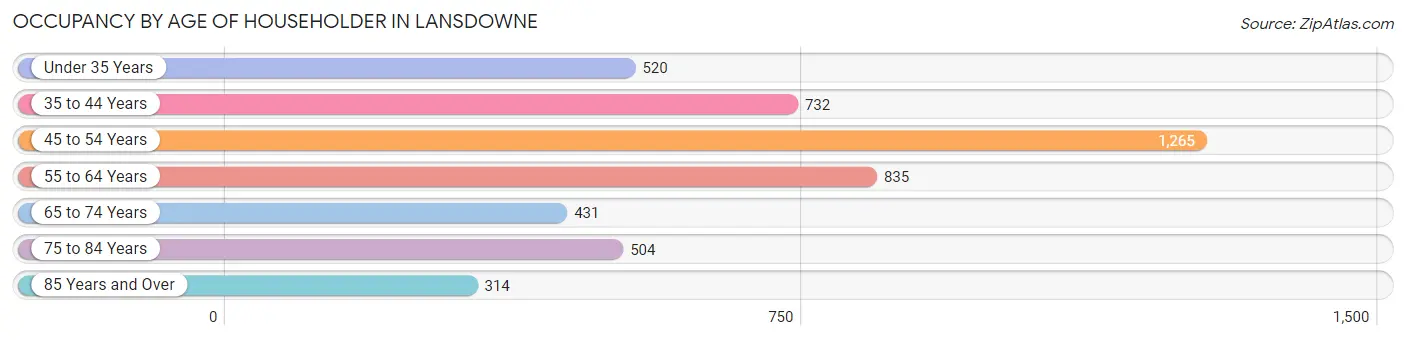
| Age Bracket | # Households | % Households |
| Under 35 Years | 520 | 11.3% |
| 35 to 44 Years | 732 | 15.9% |
| 45 to 54 Years | 1,265 | 27.5% |
| 55 to 64 Years | 835 | 18.1% |
| 65 to 74 Years | 431 | 9.4% |
| 75 to 84 Years | 504 | 11.0% |
| 85 Years and Over | 314 | 6.8% |
| Total | 4,601 | 100.0% |
Housing Finances in Lansdowne
Median Income by Occupancy in Lansdowne
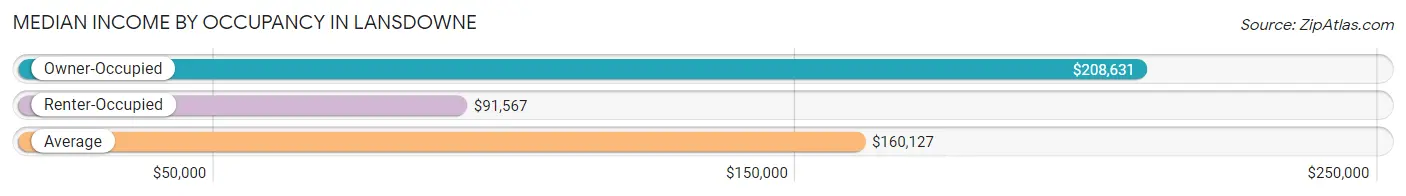
| Occupancy Type | # Households | Median Income |
| Owner-Occupied | 3,385 (73.6%) | $208,631 |
| Renter-Occupied | 1,216 (26.4%) | $91,567 |
| Average | 4,601 (100.0%) | $160,127 |
Occupancy by Householder Income Bracket in Lansdowne
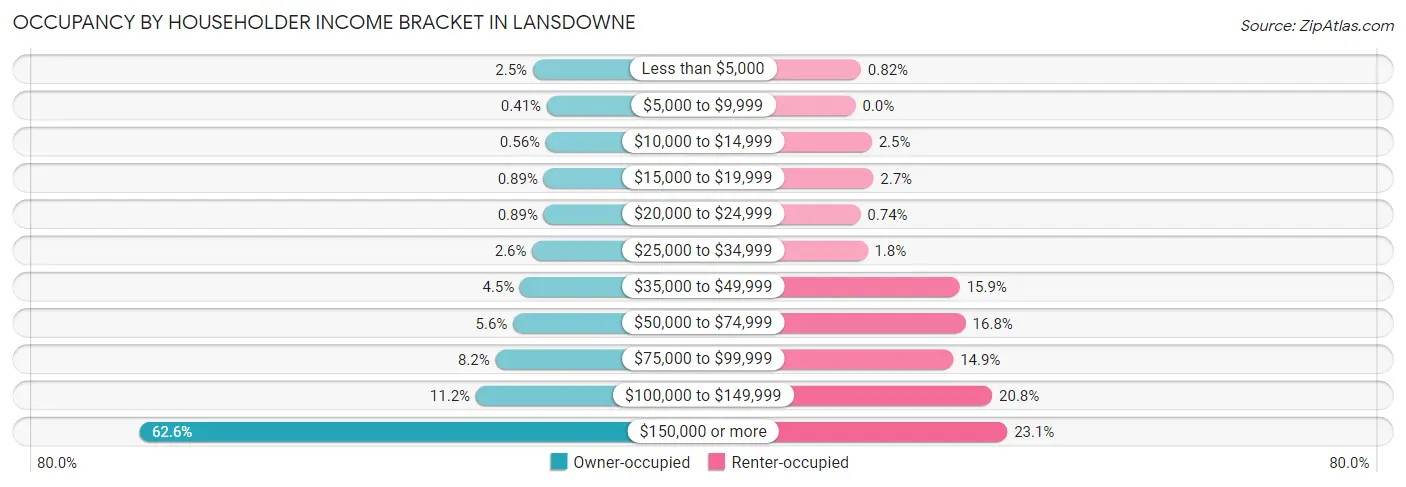
| Income Bracket | Owner-occupied | Renter-occupied |
| Less than $5,000 | 86 (2.5%) | 10 (0.8%) |
| $5,000 to $9,999 | 14 (0.4%) | 0 (0.0%) |
| $10,000 to $14,999 | 19 (0.6%) | 30 (2.5%) |
| $15,000 to $19,999 | 30 (0.9%) | 33 (2.7%) |
| $20,000 to $24,999 | 30 (0.9%) | 9 (0.7%) |
| $25,000 to $34,999 | 89 (2.6%) | 22 (1.8%) |
| $35,000 to $49,999 | 152 (4.5%) | 193 (15.9%) |
| $50,000 to $74,999 | 188 (5.6%) | 204 (16.8%) |
| $75,000 to $99,999 | 279 (8.2%) | 181 (14.9%) |
| $100,000 to $149,999 | 380 (11.2%) | 253 (20.8%) |
| $150,000 or more | 2,118 (62.6%) | 281 (23.1%) |
| Total | 3,385 (100.0%) | 1,216 (100.0%) |
Monthly Housing Cost Tiers in Lansdowne
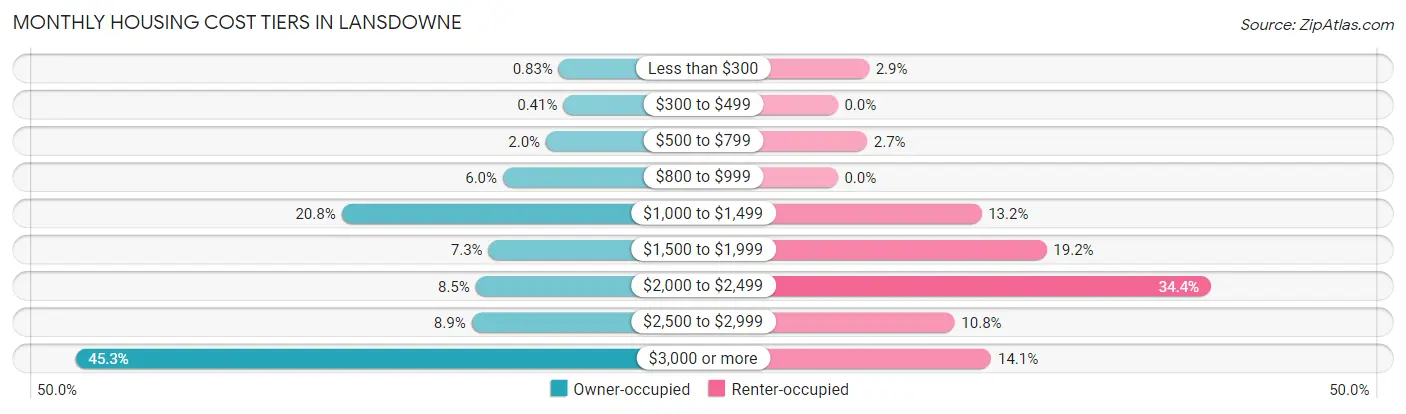
| Monthly Cost | Owner-occupied | Renter-occupied |
| Less than $300 | 28 (0.8%) | 35 (2.9%) |
| $300 to $499 | 14 (0.4%) | 0 (0.0%) |
| $500 to $799 | 68 (2.0%) | 33 (2.7%) |
| $800 to $999 | 202 (6.0%) | 0 (0.0%) |
| $1,000 to $1,499 | 705 (20.8%) | 161 (13.2%) |
| $1,500 to $1,999 | 247 (7.3%) | 234 (19.2%) |
| $2,000 to $2,499 | 287 (8.5%) | 418 (34.4%) |
| $2,500 to $2,999 | 300 (8.9%) | 131 (10.8%) |
| $3,000 or more | 1,534 (45.3%) | 172 (14.1%) |
| Total | 3,385 (100.0%) | 1,216 (100.0%) |
Physical Housing Characteristics in Lansdowne
Housing Structures in Lansdowne
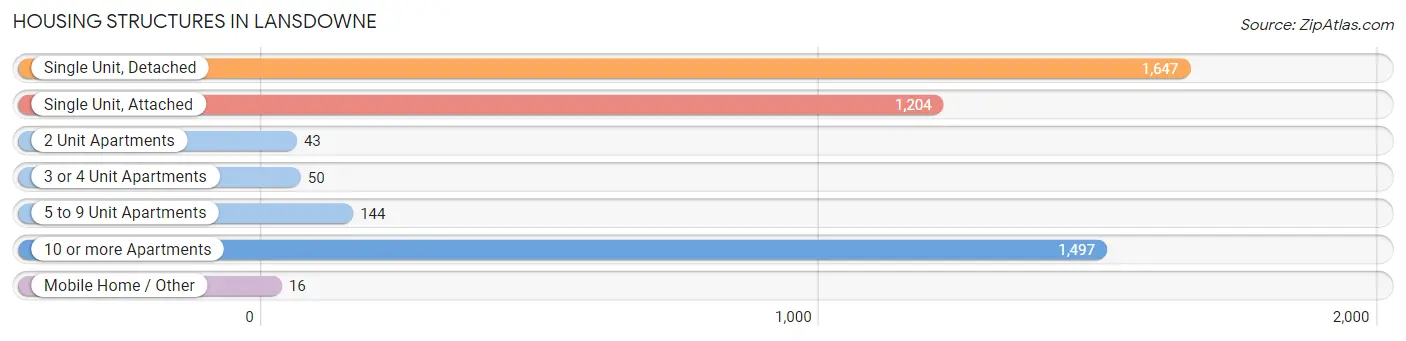
| Structure Type | # Housing Units | % Housing Units |
| Single Unit, Detached | 1,647 | 35.8% |
| Single Unit, Attached | 1,204 | 26.2% |
| 2 Unit Apartments | 43 | 0.9% |
| 3 or 4 Unit Apartments | 50 | 1.1% |
| 5 to 9 Unit Apartments | 144 | 3.1% |
| 10 or more Apartments | 1,497 | 32.5% |
| Mobile Home / Other | 16 | 0.4% |
| Total | 4,601 | 100.0% |
Housing Structures by Occupancy in Lansdowne
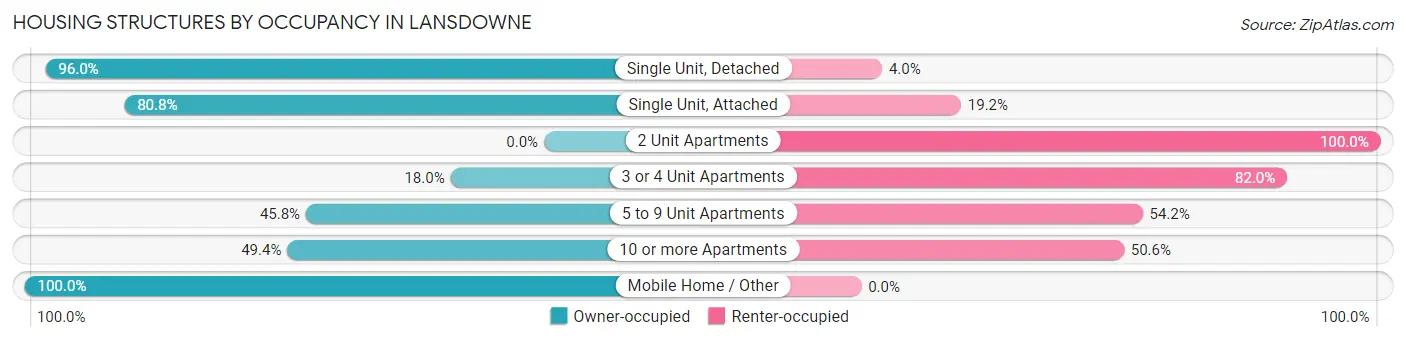
| Structure Type | Owner-occupied | Renter-occupied |
| Single Unit, Detached | 1,581 (96.0%) | 66 (4.0%) |
| Single Unit, Attached | 973 (80.8%) | 231 (19.2%) |
| 2 Unit Apartments | 0 (0.0%) | 43 (100.0%) |
| 3 or 4 Unit Apartments | 9 (18.0%) | 41 (82.0%) |
| 5 to 9 Unit Apartments | 66 (45.8%) | 78 (54.2%) |
| 10 or more Apartments | 740 (49.4%) | 757 (50.6%) |
| Mobile Home / Other | 16 (100.0%) | 0 (0.0%) |
| Total | 3,385 (73.6%) | 1,216 (26.4%) |
Housing Structures by Number of Rooms in Lansdowne
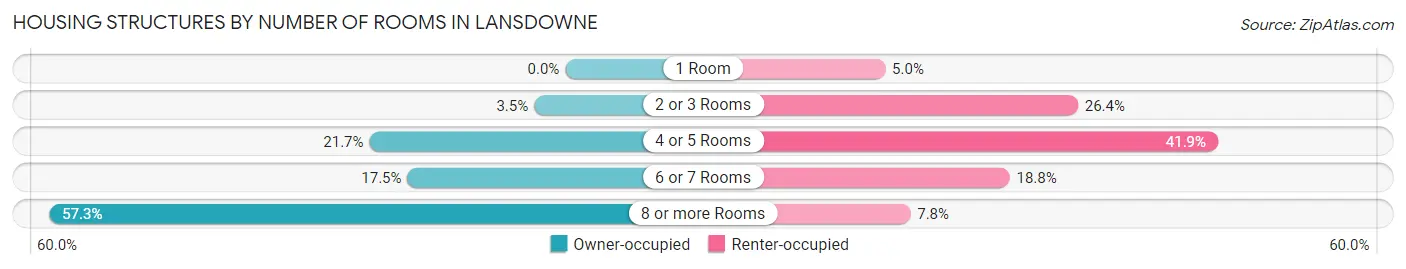
| Number of Rooms | Owner-occupied | Renter-occupied |
| 1 Room | 0 (0.0%) | 61 (5.0%) |
| 2 or 3 Rooms | 117 (3.5%) | 321 (26.4%) |
| 4 or 5 Rooms | 736 (21.7%) | 510 (41.9%) |
| 6 or 7 Rooms | 593 (17.5%) | 229 (18.8%) |
| 8 or more Rooms | 1,939 (57.3%) | 95 (7.8%) |
| Total | 3,385 (100.0%) | 1,216 (100.0%) |
Housing Structure by Heating Type in Lansdowne
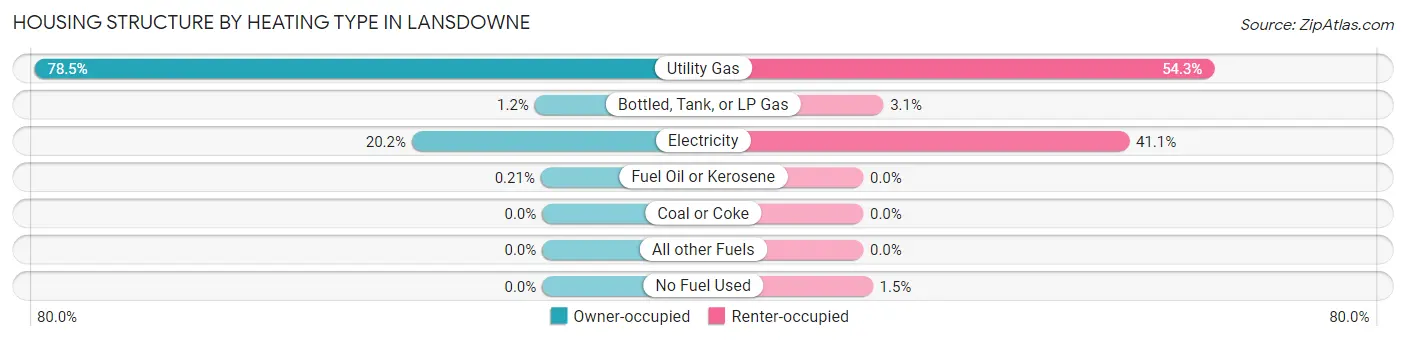
| Heating Type | Owner-occupied | Renter-occupied |
| Utility Gas | 2,657 (78.5%) | 660 (54.3%) |
| Bottled, Tank, or LP Gas | 39 (1.1%) | 38 (3.1%) |
| Electricity | 682 (20.2%) | 500 (41.1%) |
| Fuel Oil or Kerosene | 7 (0.2%) | 0 (0.0%) |
| Coal or Coke | 0 (0.0%) | 0 (0.0%) |
| All other Fuels | 0 (0.0%) | 0 (0.0%) |
| No Fuel Used | 0 (0.0%) | 18 (1.5%) |
| Total | 3,385 (100.0%) | 1,216 (100.0%) |
Household Vehicle Usage in Lansdowne
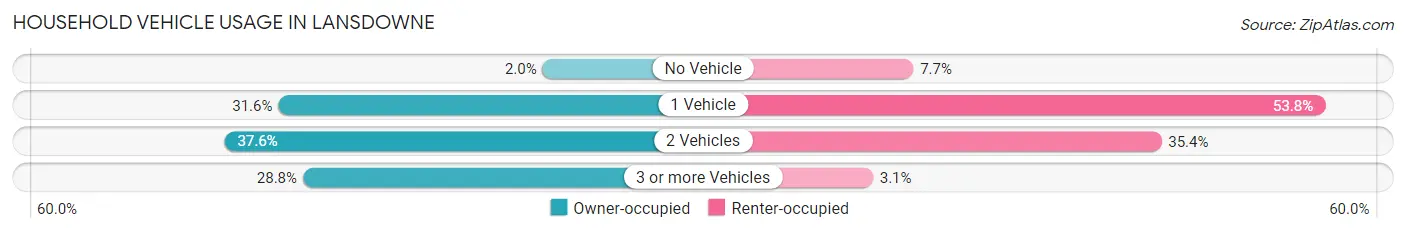
| Vehicles per Household | Owner-occupied | Renter-occupied |
| No Vehicle | 67 (2.0%) | 93 (7.6%) |
| 1 Vehicle | 1,069 (31.6%) | 654 (53.8%) |
| 2 Vehicles | 1,273 (37.6%) | 431 (35.4%) |
| 3 or more Vehicles | 976 (28.8%) | 38 (3.1%) |
| Total | 3,385 (100.0%) | 1,216 (100.0%) |
Real Estate & Mortgages in Lansdowne
Real Estate and Mortgage Overview in Lansdowne
| Characteristic | Without Mortgage | With Mortgage |
| Housing Units | 935 | 2,450 |
| Median Property Value | $441,400 | $793,500 |
| Median Household Income | $106,875 | $1,734 |
| Monthly Housing Costs | $1,146 | $1,534 |
| Real Estate Taxes | $4,203 | $25 |
Property Value by Mortgage Status in Lansdowne
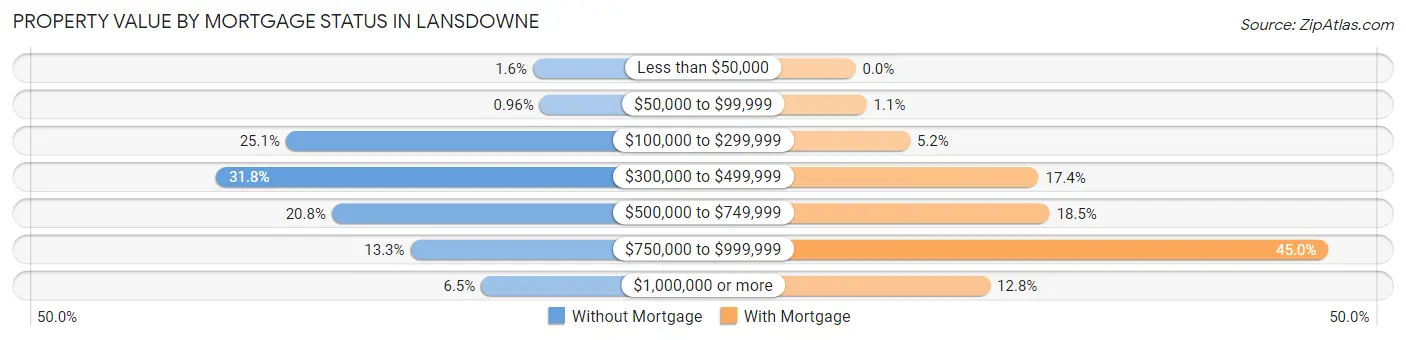
| Property Value | Without Mortgage | With Mortgage |
| Less than $50,000 | 15 (1.6%) | 0 (0.0%) |
| $50,000 to $99,999 | 9 (1.0%) | 26 (1.1%) |
| $100,000 to $299,999 | 235 (25.1%) | 127 (5.2%) |
| $300,000 to $499,999 | 297 (31.8%) | 427 (17.4%) |
| $500,000 to $749,999 | 194 (20.7%) | 453 (18.5%) |
| $750,000 to $999,999 | 124 (13.3%) | 1,103 (45.0%) |
| $1,000,000 or more | 61 (6.5%) | 314 (12.8%) |
| Total | 935 (100.0%) | 2,450 (100.0%) |
Household Income by Mortgage Status in Lansdowne
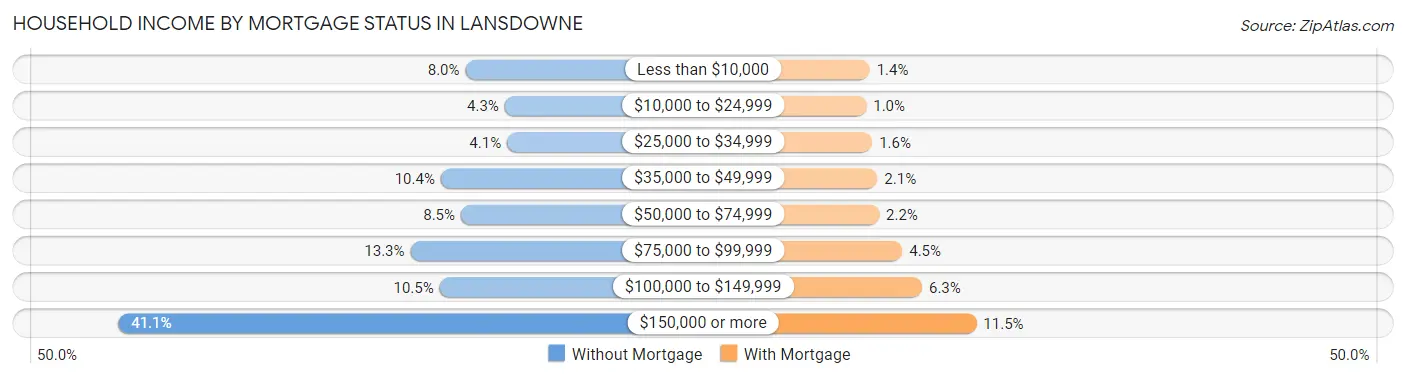
| Household Income | Without Mortgage | With Mortgage |
| Less than $10,000 | 75 (8.0%) | 33 (1.3%) |
| $10,000 to $24,999 | 40 (4.3%) | 25 (1.0%) |
| $25,000 to $34,999 | 38 (4.1%) | 39 (1.6%) |
| $35,000 to $49,999 | 97 (10.4%) | 51 (2.1%) |
| $50,000 to $74,999 | 79 (8.5%) | 55 (2.2%) |
| $75,000 to $99,999 | 124 (13.3%) | 109 (4.4%) |
| $100,000 to $149,999 | 98 (10.5%) | 155 (6.3%) |
| $150,000 or more | 384 (41.1%) | 282 (11.5%) |
| Total | 935 (100.0%) | 2,450 (100.0%) |
Property Value to Household Income Ratio in Lansdowne
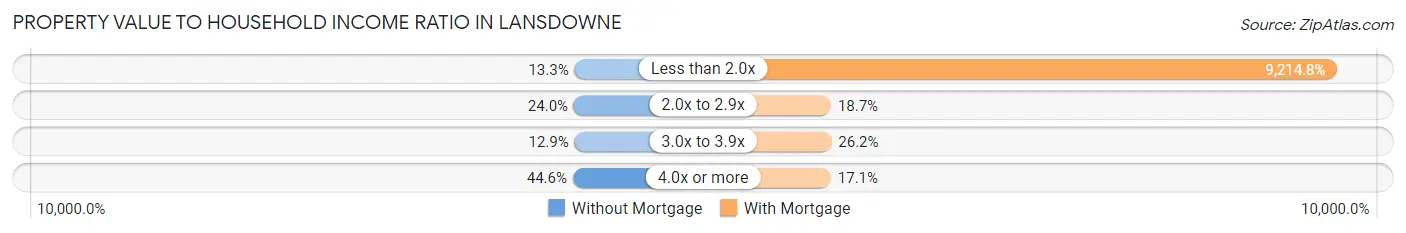
| Value-to-Income Ratio | Without Mortgage | With Mortgage |
| Less than 2.0x | 124 (13.3%) | 225,763 (9,214.8%) |
| 2.0x to 2.9x | 224 (24.0%) | 458 (18.7%) |
| 3.0x to 3.9x | 121 (12.9%) | 642 (26.2%) |
| 4.0x or more | 417 (44.6%) | 420 (17.1%) |
| Total | 935 (100.0%) | 2,450 (100.0%) |
Real Estate Taxes by Mortgage Status in Lansdowne
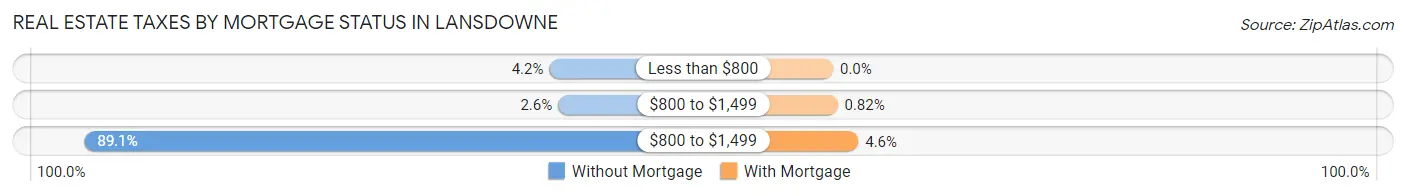
| Property Taxes | Without Mortgage | With Mortgage |
| Less than $800 | 39 (4.2%) | 0 (0.0%) |
| $800 to $1,499 | 24 (2.6%) | 20 (0.8%) |
| $800 to $1,499 | 833 (89.1%) | 113 (4.6%) |
| Total | 935 (100.0%) | 2,450 (100.0%) |
Health & Disability in Lansdowne
Health Insurance Coverage by Age in Lansdowne
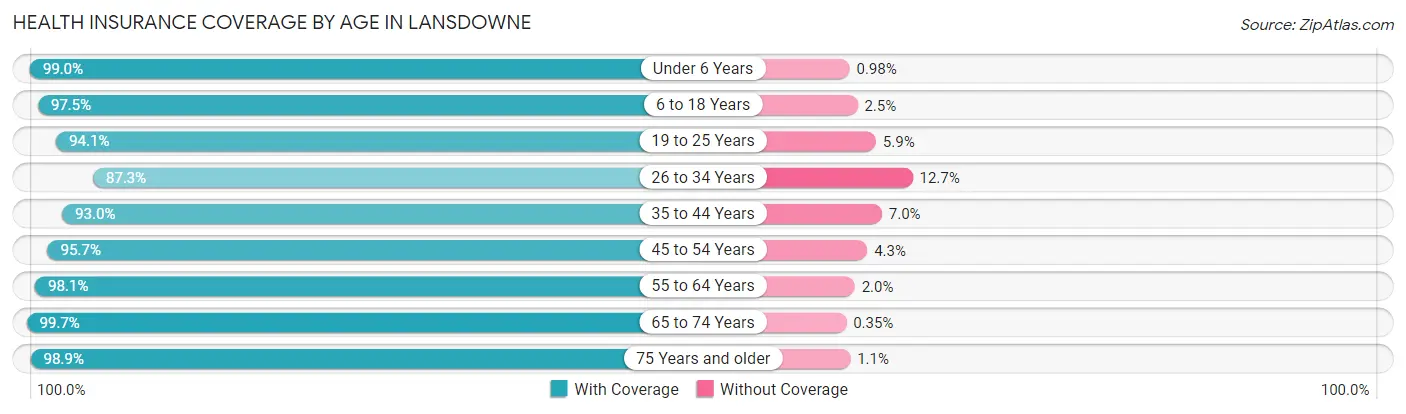
| Age Bracket | With Coverage | Without Coverage |
| Under 6 Years | 606 (99.0%) | 6 (1.0%) |
| 6 to 18 Years | 2,496 (97.5%) | 63 (2.5%) |
| 19 to 25 Years | 991 (94.1%) | 62 (5.9%) |
| 26 to 34 Years | 1,069 (87.3%) | 156 (12.7%) |
| 35 to 44 Years | 1,208 (93.0%) | 91 (7.0%) |
| 45 to 54 Years | 2,214 (95.7%) | 99 (4.3%) |
| 55 to 64 Years | 1,461 (98.1%) | 29 (1.9%) |
| 65 to 74 Years | 852 (99.7%) | 3 (0.4%) |
| 75 Years and older | 1,341 (98.9%) | 15 (1.1%) |
| Total | 12,238 (95.9%) | 524 (4.1%) |
Health Insurance Coverage by Citizenship Status in Lansdowne
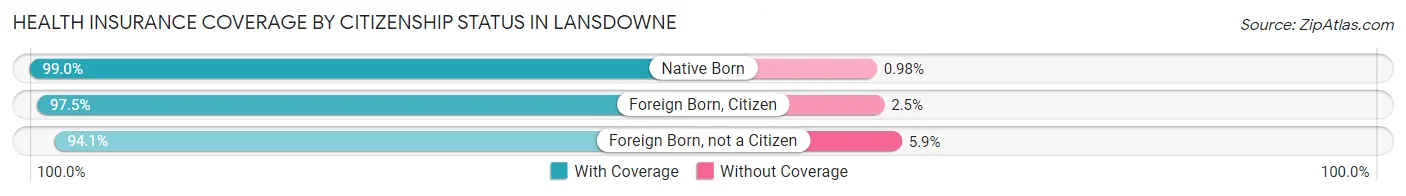
| Citizenship Status | With Coverage | Without Coverage |
| Native Born | 606 (99.0%) | 6 (1.0%) |
| Foreign Born, Citizen | 2,496 (97.5%) | 63 (2.5%) |
| Foreign Born, not a Citizen | 991 (94.1%) | 62 (5.9%) |
Health Insurance Coverage by Household Income in Lansdowne
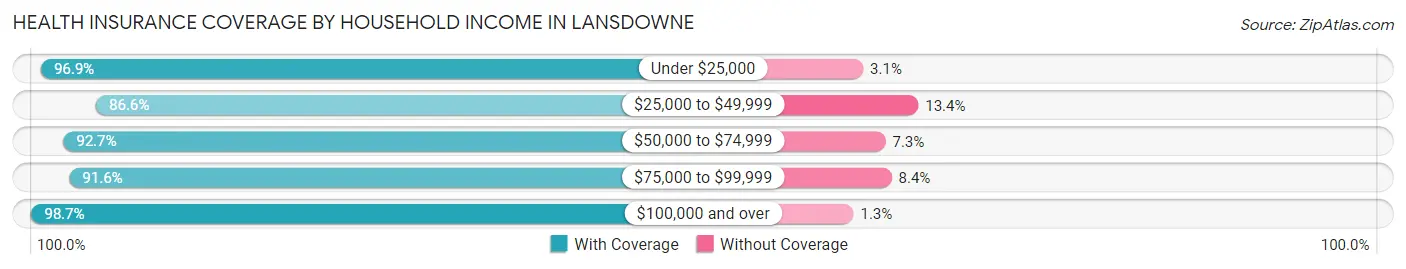
| Household Income | With Coverage | Without Coverage |
| Under $25,000 | 474 (96.9%) | 15 (3.1%) |
| $25,000 to $49,999 | 808 (86.6%) | 125 (13.4%) |
| $50,000 to $74,999 | 524 (92.7%) | 41 (7.3%) |
| $75,000 to $99,999 | 851 (91.6%) | 78 (8.4%) |
| $100,000 and over | 9,314 (98.7%) | 119 (1.3%) |
Public vs Private Health Insurance Coverage by Age in Lansdowne
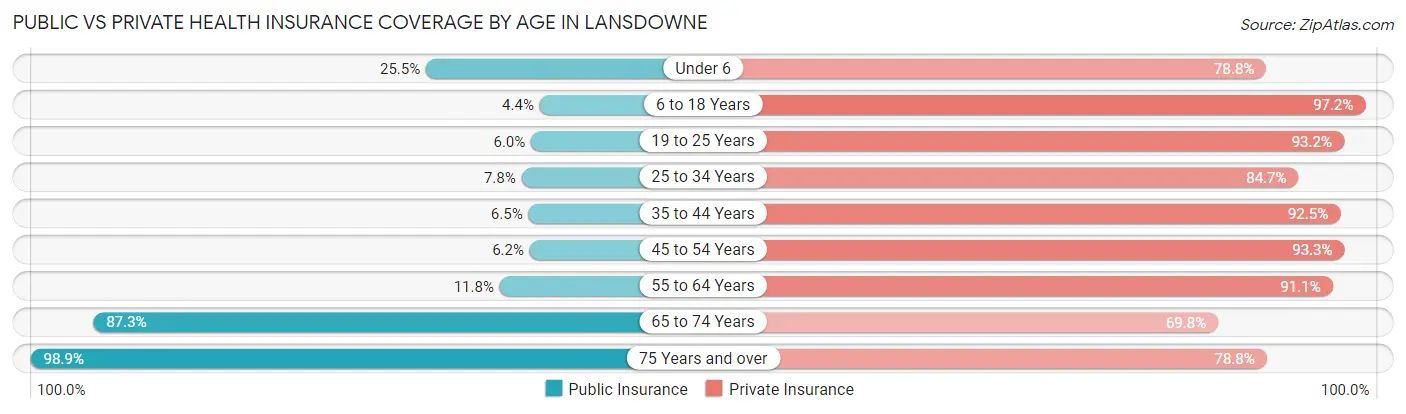
| Age Bracket | Public Insurance | Private Insurance |
| Under 6 | 156 (25.5%) | 482 (78.8%) |
| 6 to 18 Years | 112 (4.4%) | 2,486 (97.2%) |
| 19 to 25 Years | 63 (6.0%) | 981 (93.2%) |
| 25 to 34 Years | 95 (7.8%) | 1,038 (84.7%) |
| 35 to 44 Years | 84 (6.5%) | 1,201 (92.5%) |
| 45 to 54 Years | 144 (6.2%) | 2,157 (93.3%) |
| 55 to 64 Years | 176 (11.8%) | 1,357 (91.1%) |
| 65 to 74 Years | 746 (87.3%) | 597 (69.8%) |
| 75 Years and over | 1,341 (98.9%) | 1,069 (78.8%) |
| Total | 2,917 (22.9%) | 11,368 (89.1%) |
Disability Status by Sex by Age in Lansdowne
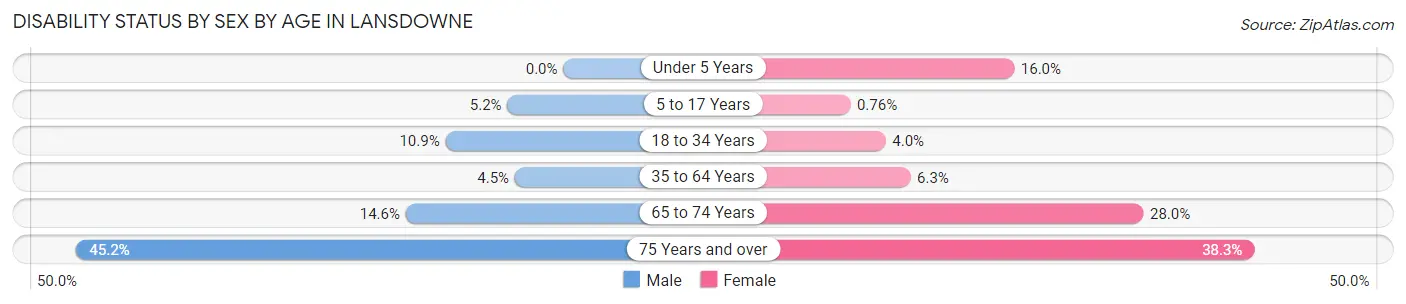
| Age Bracket | Male | Female |
| Under 5 Years | 0 (0.0%) | 57 (16.0%) |
| 5 to 17 Years | 63 (5.2%) | 9 (0.8%) |
| 18 to 34 Years | 136 (10.9%) | 50 (4.0%) |
| 35 to 64 Years | 108 (4.5%) | 171 (6.3%) |
| 65 to 74 Years | 57 (14.6%) | 130 (28.0%) |
| 75 Years and over | 216 (45.2%) | 336 (38.3%) |
Disability Class by Sex by Age in Lansdowne
Disability Class: Hearing Difficulty
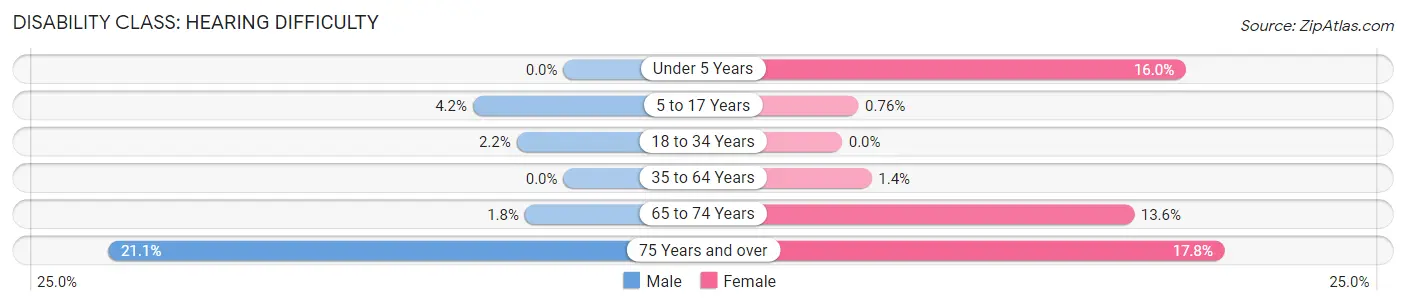
| Age Bracket | Male | Female |
| Under 5 Years | 0 (0.0%) | 57 (16.0%) |
| 5 to 17 Years | 51 (4.2%) | 9 (0.8%) |
| 18 to 34 Years | 27 (2.2%) | 0 (0.0%) |
| 35 to 64 Years | 0 (0.0%) | 37 (1.4%) |
| 65 to 74 Years | 7 (1.8%) | 63 (13.6%) |
| 75 Years and over | 101 (21.1%) | 156 (17.8%) |
Disability Class: Vision Difficulty
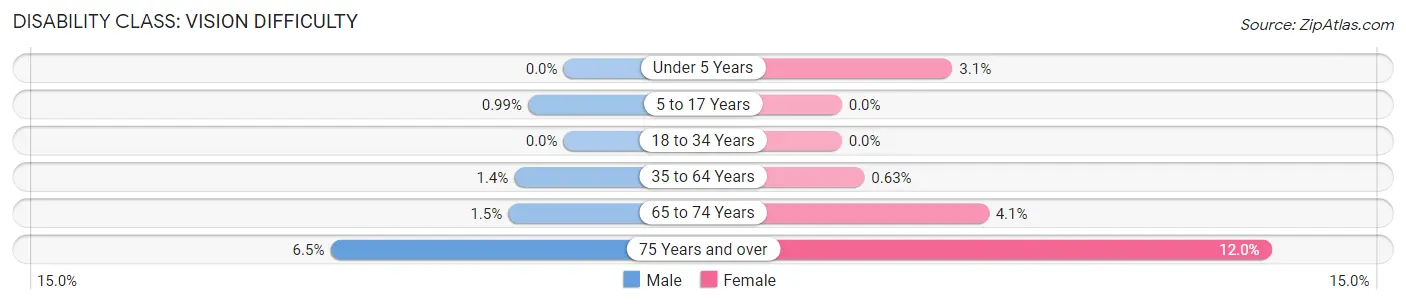
| Age Bracket | Male | Female |
| Under 5 Years | 0 (0.0%) | 11 (3.1%) |
| 5 to 17 Years | 12 (1.0%) | 0 (0.0%) |
| 18 to 34 Years | 0 (0.0%) | 0 (0.0%) |
| 35 to 64 Years | 33 (1.4%) | 17 (0.6%) |
| 65 to 74 Years | 6 (1.5%) | 19 (4.1%) |
| 75 Years and over | 31 (6.5%) | 105 (12.0%) |
Disability Class: Cognitive Difficulty
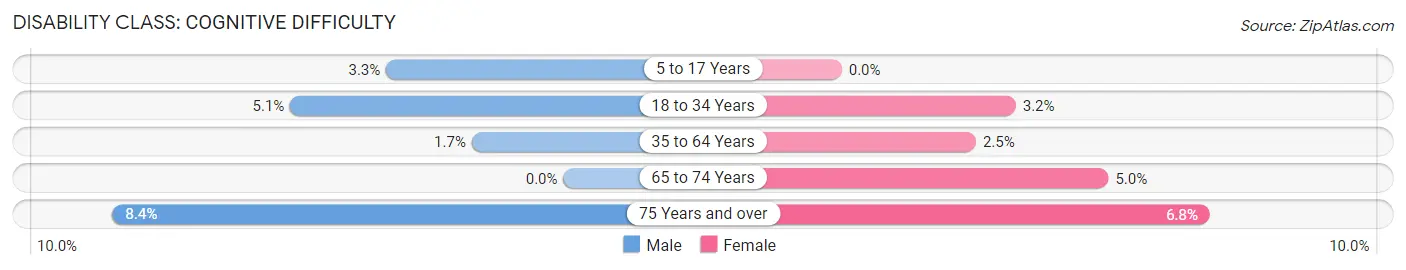
| Age Bracket | Male | Female |
| 5 to 17 Years | 40 (3.3%) | 0 (0.0%) |
| 18 to 34 Years | 63 (5.1%) | 40 (3.2%) |
| 35 to 64 Years | 41 (1.7%) | 67 (2.5%) |
| 65 to 74 Years | 0 (0.0%) | 23 (5.0%) |
| 75 Years and over | 40 (8.4%) | 60 (6.8%) |
Disability Class: Ambulatory Difficulty
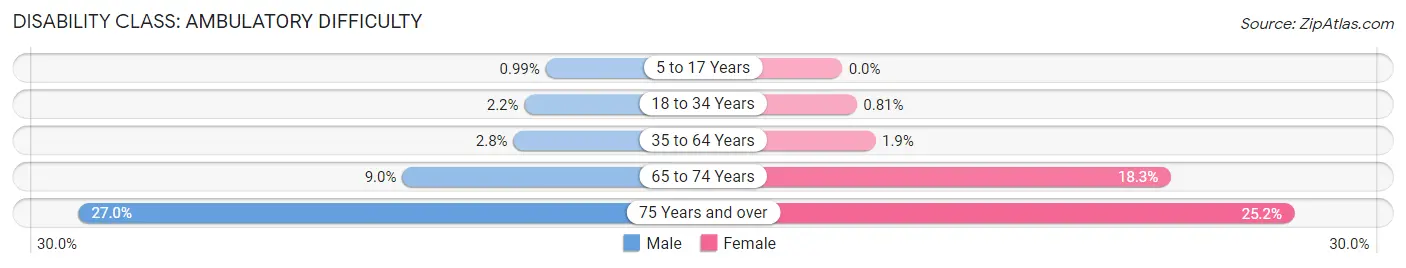
| Age Bracket | Male | Female |
| 5 to 17 Years | 12 (1.0%) | 0 (0.0%) |
| 18 to 34 Years | 27 (2.2%) | 10 (0.8%) |
| 35 to 64 Years | 67 (2.8%) | 50 (1.8%) |
| 65 to 74 Years | 35 (9.0%) | 85 (18.3%) |
| 75 Years and over | 129 (27.0%) | 221 (25.2%) |
Disability Class: Self-Care Difficulty
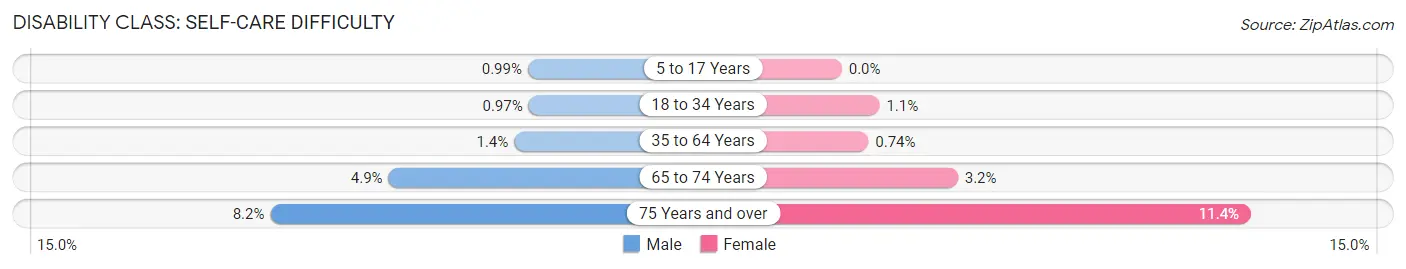
| Age Bracket | Male | Female |
| 5 to 17 Years | 12 (1.0%) | 0 (0.0%) |
| 18 to 34 Years | 12 (1.0%) | 13 (1.1%) |
| 35 to 64 Years | 33 (1.4%) | 20 (0.7%) |
| 65 to 74 Years | 19 (4.9%) | 15 (3.2%) |
| 75 Years and over | 39 (8.2%) | 100 (11.4%) |
Technology Access in Lansdowne
Computing Device Access in Lansdowne
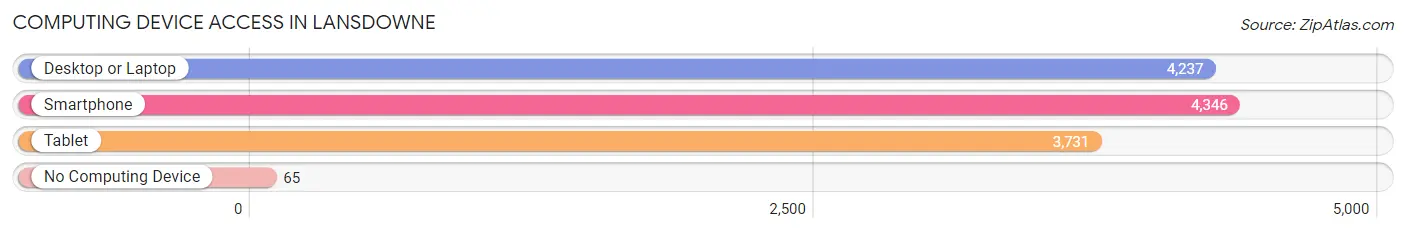
| Device Type | # Households | % Households |
| Desktop or Laptop | 4,237 | 92.1% |
| Smartphone | 4,346 | 94.5% |
| Tablet | 3,731 | 81.1% |
| No Computing Device | 65 | 1.4% |
| Total | 4,601 | 100.0% |
Internet Access in Lansdowne
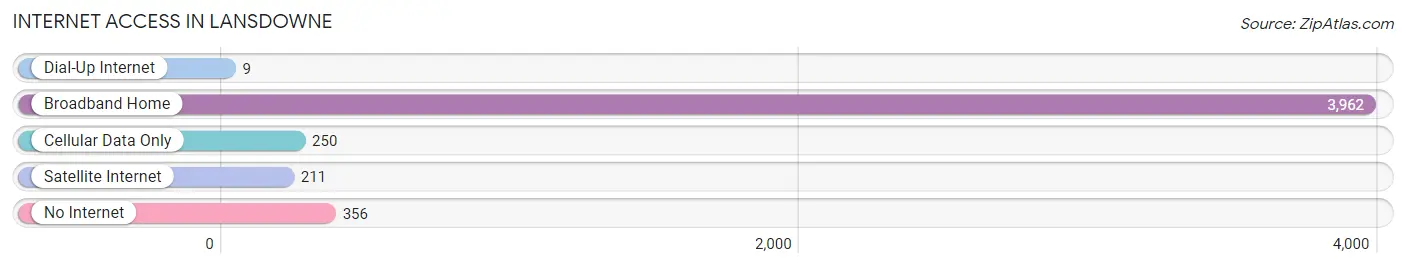
| Internet Type | # Households | % Households |
| Dial-Up Internet | 9 | 0.2% |
| Broadband Home | 3,962 | 86.1% |
| Cellular Data Only | 250 | 5.4% |
| Satellite Internet | 211 | 4.6% |
| No Internet | 356 | 7.7% |
| Total | 4,601 | 100.0% |
Lansdowne Summary
Lansdowne is a census-designated place (CDP) located in Loudoun County, Virginia. It is situated in the Washington metropolitan area and is part of the Dulles Technology Corridor. The population of Lansdowne was 8,409 at the 2010 census.
History
Lansdowne was first settled in the late 1700s by the Lansdowne family, who were of English descent. The family owned a large tract of land in the area, which was eventually divided up and sold off. The area was known as Lansdowne Station until the early 1900s, when it was renamed Lansdowne.
In the early 1900s, the area was primarily agricultural, with many farms and orchards. The area was also home to a number of small businesses, including a general store, a blacksmith shop, and a post office.
In the 1950s, the area began to experience rapid growth as the Washington metropolitan area expanded. The population of Lansdowne increased from 1,000 in 1950 to 8,409 in 2010.
Geography
Lansdowne is located in Loudoun County, Virginia, in the Washington metropolitan area. It is situated in the Dulles Technology Corridor, which is home to many high-tech companies.
The CDP has a total area of 4.3 square miles, all of which is land. The terrain is mostly flat, with some rolling hills.
Economy
Lansdowne is home to a number of high-tech companies, including Oracle, Verizon, and Northrop Grumman. The area is also home to a number of retail stores, restaurants, and other businesses.
The median household income in Lansdowne is $112,917, which is significantly higher than the national median of $53,482. The unemployment rate in Lansdowne is 3.2%, which is lower than the national average of 5.2%.
Demographics
As of the 2010 census, the population of Lansdowne was 8,409. The racial makeup of the CDP was 73.3% White, 11.2% Asian, 8.2% African American, and 5.3% Hispanic or Latino.
The median age in Lansdowne is 37.3, which is slightly lower than the national median of 37.7. The median household income is $112,917, which is significantly higher than the national median of $53,482.
Conclusion
Lansdowne is a census-designated place located in Loudoun County, Virginia. It is situated in the Washington metropolitan area and is part of the Dulles Technology Corridor. The population of Lansdowne was 8,409 at the 2010 census. The area was first settled in the late 1700s by the Lansdowne family, and has since experienced rapid growth due to its proximity to the Washington metropolitan area. The economy of Lansdowne is largely driven by high-tech companies, and the median household income is significantly higher than the national median. The population of Lansdowne is diverse, with 73.3% White, 11.2% Asian, 8.2% African American, and 5.3% Hispanic or Latino.
Common Questions
What is Per Capita Income in Lansdowne?
Per Capita income in Lansdowne is $74,459.
What is the Median Family Income in Lansdowne?
Median Family Income in Lansdowne is $210,227.
What is the Median Household income in Lansdowne?
Median Household Income in Lansdowne is $160,127.
What is Income or Wage Gap in Lansdowne?
Income or Wage Gap in Lansdowne is 35.4%.
Women in Lansdowne earn 64.6 cents for every dollar earned by a man.
What is Family Income Deficit in Lansdowne?
Family Income Deficit in Lansdowne is $15,902.
Families that are below poverty line in Lansdowne earn $15,902 less on average than the poverty threshold level.
What is Inequality or Gini Index in Lansdowne?
Inequality or Gini Index in Lansdowne is 0.45.
What is the Total Population of Lansdowne?
Total Population of Lansdowne is 12,840.
What is the Total Male Population of Lansdowne?
Total Male Population of Lansdowne is 6,008.
What is the Total Female Population of Lansdowne?
Total Female Population of Lansdowne is 6,832.
What is the Ratio of Males per 100 Females in Lansdowne?
There are 87.94 Males per 100 Females in Lansdowne.
What is the Ratio of Females per 100 Males in Lansdowne?
There are 113.72 Females per 100 Males in Lansdowne.
What is the Median Population Age in Lansdowne?
Median Population Age in Lansdowne is 42.4 Years.
What is the Average Family Size in Lansdowne
Average Family Size in Lansdowne is 3.2 People.
What is the Average Household Size in Lansdowne
Average Household Size in Lansdowne is 2.7 People.
How Large is the Labor Force in Lansdowne?
There are 6,742 People in the Labor Forcein in Lansdowne.
What is the Percentage of People in the Labor Force in Lansdowne?
65.0% of People are in the Labor Force in Lansdowne.
What is the Unemployment Rate in Lansdowne?
Unemployment Rate in Lansdowne is 1.3%.