Bon Air, VA Map & Demographics
Bon Air Map
Bon Air Overview
$44,795
PER CAPITA INCOME
$121,127
AVG FAMILY INCOME
$95,881
AVG HOUSEHOLD INCOME
13.3%
WAGE / INCOME GAP [ % ]
86.7¢/ $1
WAGE / INCOME GAP [ $ ]
0.37
INEQUALITY / GINI INDEX
17,452
TOTAL POPULATION
8,350
MALE POPULATION
9,102
FEMALE POPULATION
91.74
MALES / 100 FEMALES
109.01
FEMALES / 100 MALES
42.2
MEDIAN AGE
3.1
AVG FAMILY SIZE
2.4
AVG HOUSEHOLD SIZE
9,821
LABOR FORCE [ PEOPLE ]
68.9%
PERCENT IN LABOR FORCE
4.4%
UNEMPLOYMENT RATE
Bon Air Area Codes
Income in Bon Air
Income Overview in Bon Air
Per Capita Income in Bon Air is $44,795, while median incomes of families and households are $121,127 and $95,881 respectively.
| Characteristic | Number | Measure |
| Per Capita Income | 17,452 | $44,795 |
| Median Family Income | 4,472 | $121,127 |
| Mean Family Income | 4,472 | $130,585 |
| Median Household Income | 7,024 | $95,881 |
| Mean Household Income | 7,024 | $111,749 |
| Income Deficit | 4,472 | $0 |
| Wage / Income Gap (%) | 17,452 | 13.35% |
| Wage / Income Gap ($) | 17,452 | 86.65¢ per $1 |
| Gini / Inequality Index | 17,452 | 0.37 |
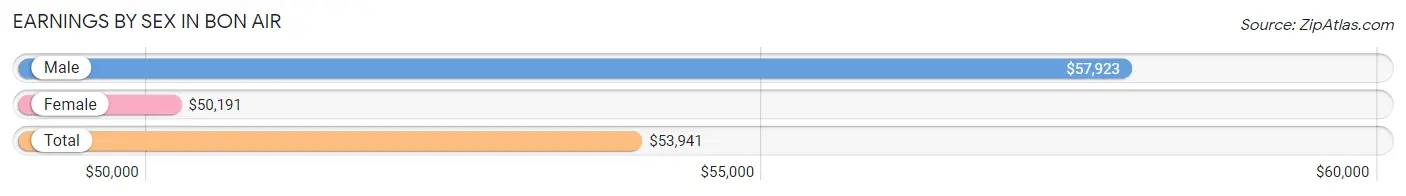
Earnings by Sex in Bon Air
Average Earnings in Bon Air are $53,941, $57,923 for men and $50,191 for women, a difference of 13.4%.
| Sex | Number | Average Earnings |
| Male | 5,124 (50.9%) | $57,923 |
| Female | 4,942 (49.1%) | $50,191 |
| Total | 10,066 (100.0%) | $53,941 |
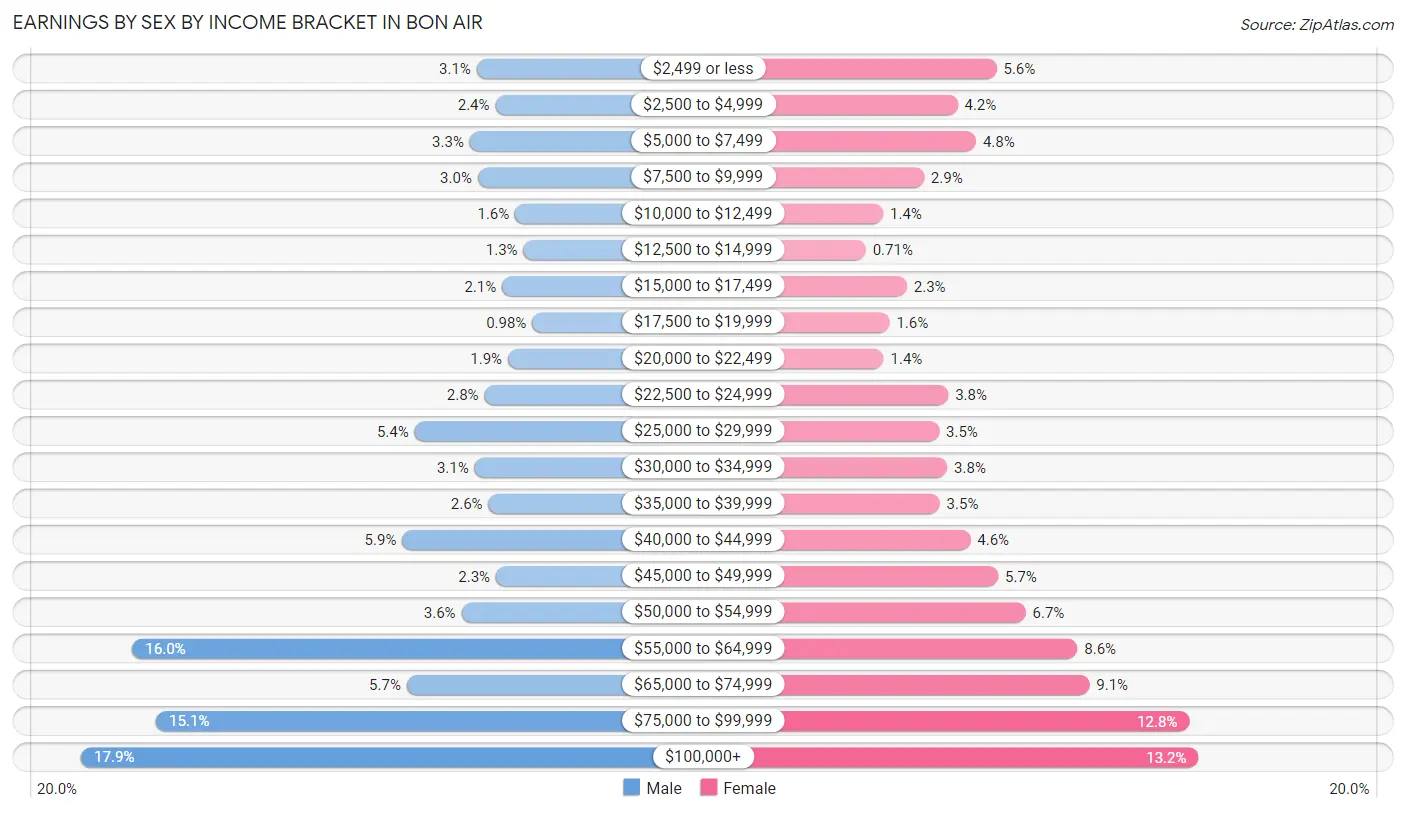
Earnings by Sex by Income Bracket in Bon Air
The most common earnings brackets in Bon Air are $100,000+ for men (916 | 17.9%) and $100,000+ for women (651 | 13.2%).
| Income | Male | Female |
| $2,499 or less | 157 (3.1%) | 277 (5.6%) |
| $2,500 to $4,999 | 121 (2.4%) | 205 (4.2%) |
| $5,000 to $7,499 | 170 (3.3%) | 239 (4.8%) |
| $7,500 to $9,999 | 155 (3.0%) | 143 (2.9%) |
| $10,000 to $12,499 | 83 (1.6%) | 67 (1.4%) |
| $12,500 to $14,999 | 67 (1.3%) | 35 (0.7%) |
| $15,000 to $17,499 | 108 (2.1%) | 111 (2.2%) |
| $17,500 to $19,999 | 50 (1.0%) | 79 (1.6%) |
| $20,000 to $22,499 | 97 (1.9%) | 68 (1.4%) |
| $22,500 to $24,999 | 142 (2.8%) | 188 (3.8%) |
| $25,000 to $29,999 | 276 (5.4%) | 171 (3.5%) |
| $30,000 to $34,999 | 161 (3.1%) | 186 (3.8%) |
| $35,000 to $39,999 | 134 (2.6%) | 172 (3.5%) |
| $40,000 to $44,999 | 300 (5.9%) | 229 (4.6%) |
| $45,000 to $49,999 | 120 (2.3%) | 280 (5.7%) |
| $50,000 to $54,999 | 186 (3.6%) | 331 (6.7%) |
| $55,000 to $64,999 | 818 (16.0%) | 427 (8.6%) |
| $65,000 to $74,999 | 291 (5.7%) | 449 (9.1%) |
| $75,000 to $99,999 | 772 (15.1%) | 634 (12.8%) |
| $100,000+ | 916 (17.9%) | 651 (13.2%) |
| Total | 5,124 (100.0%) | 4,942 (100.0%) |
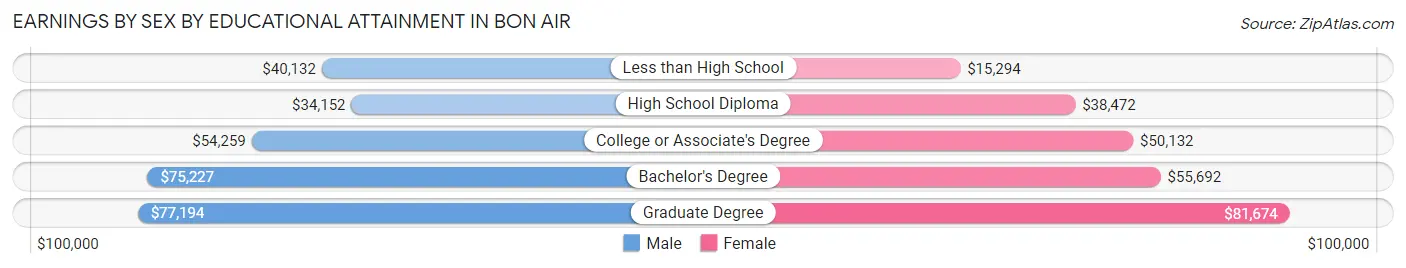
Earnings by Sex by Educational Attainment in Bon Air
Average earnings in Bon Air are $60,029 for men and $55,180 for women, a difference of 8.1%. Men with an educational attainment of graduate degree enjoy the highest average annual earnings of $77,194, while those with high school diploma education earn the least with $34,152. Women with an educational attainment of graduate degree earn the most with the average annual earnings of $81,674, while those with less than high school education have the smallest earnings of $15,294.
| Educational Attainment | Male Income | Female Income |
| Less than High School | $40,132 | $15,294 |
| High School Diploma | $34,152 | $38,472 |
| College or Associate's Degree | $54,259 | $50,132 |
| Bachelor's Degree | $75,227 | $55,692 |
| Graduate Degree | $77,194 | $81,674 |
| Total | $60,029 | $55,180 |
Family Income in Bon Air
Family Income Brackets in Bon Air
According to the Bon Air family income data, there are 1,391 families falling into the $100,000 to $149,999 income range, which is the most common income bracket and makes up 31.1% of all families. Conversely, the $15,000 to $24,999 income bracket is the least frequent group with only 27 families (0.6%) belonging to this category.
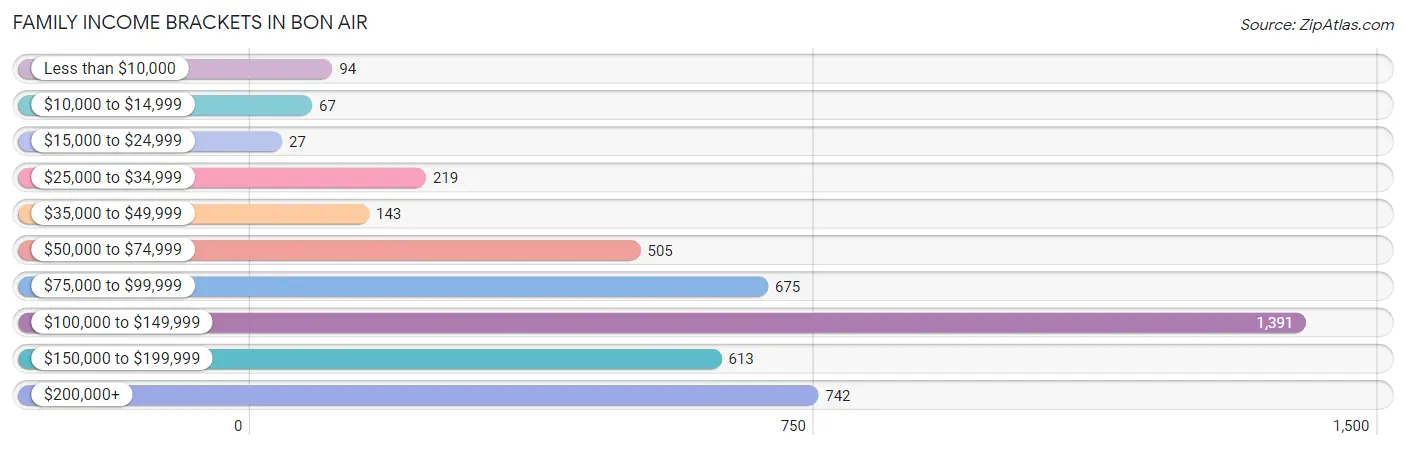
| Income Bracket | # Families | % Families |
| Less than $10,000 | 94 | 2.1% |
| $10,000 to $14,999 | 67 | 1.5% |
| $15,000 to $24,999 | 27 | 0.6% |
| $25,000 to $34,999 | 219 | 4.9% |
| $35,000 to $49,999 | 143 | 3.2% |
| $50,000 to $74,999 | 505 | 11.3% |
| $75,000 to $99,999 | 675 | 15.1% |
| $100,000 to $149,999 | 1,391 | 31.1% |
| $150,000 to $199,999 | 613 | 13.7% |
| $200,000+ | 742 | 16.6% |
Family Income by Famaliy Size in Bon Air
4-person families (931 | 20.8%) account for the highest median family income in Bon Air with $153,594 per family, while 2-person families (1,795 | 40.1%) have the highest median income of $51,648 per family member.
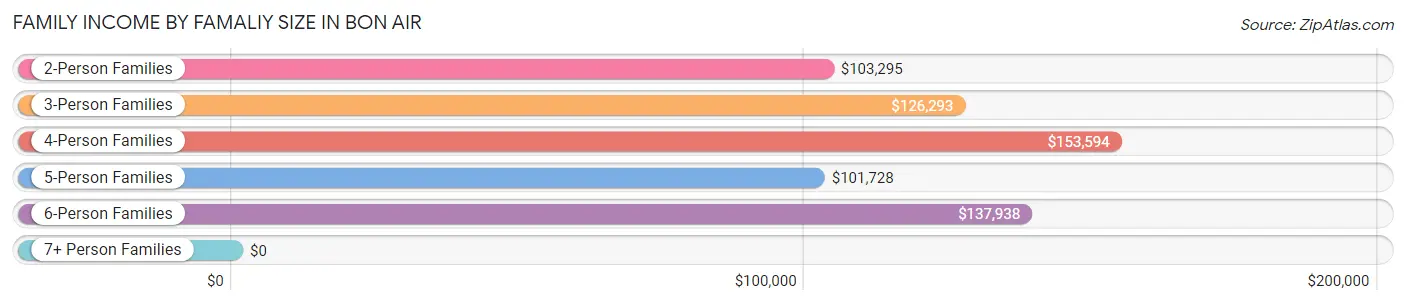
| Income Bracket | # Families | Median Income |
| 2-Person Families | 1,795 (40.1%) | $103,295 |
| 3-Person Families | 1,216 (27.2%) | $126,293 |
| 4-Person Families | 931 (20.8%) | $153,594 |
| 5-Person Families | 335 (7.5%) | $101,728 |
| 6-Person Families | 140 (3.1%) | $137,938 |
| 7+ Person Families | 55 (1.2%) | $0 |
| Total | 4,472 (100.0%) | $121,127 |
Family Income by Number of Earners in Bon Air
The median family income in Bon Air is $121,127, with families comprising 3+ earners (730) having the highest median family income of $152,818, while families with no earners (485) have the lowest median family income of $60,221, accounting for 16.3% and 10.8% of families, respectively.
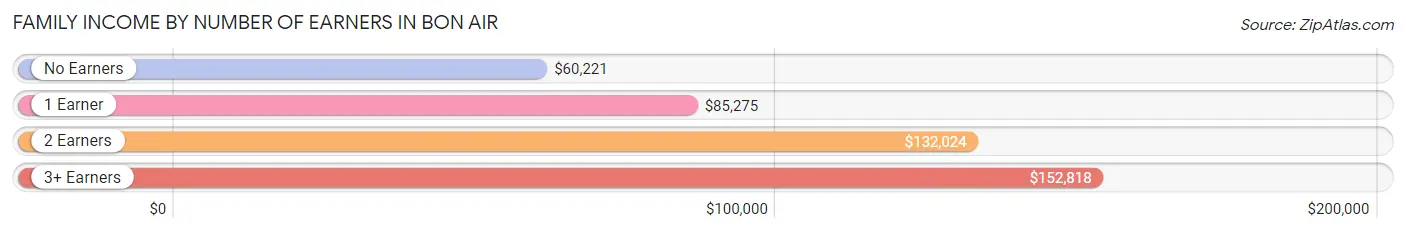
| Number of Earners | # Families | Median Income |
| No Earners | 485 (10.8%) | $60,221 |
| 1 Earner | 1,155 (25.8%) | $85,275 |
| 2 Earners | 2,102 (47.0%) | $132,024 |
| 3+ Earners | 730 (16.3%) | $152,818 |
| Total | 4,472 (100.0%) | $121,127 |
Household Income in Bon Air
Household Income Brackets in Bon Air
With 1,573 households falling in the category, the $100,000 to $149,999 income range is the most frequent in Bon Air, accounting for 22.4% of all households. In contrast, only 49 households (0.7%) fall into the $10,000 to $14,999 income bracket, making it the least populous group.
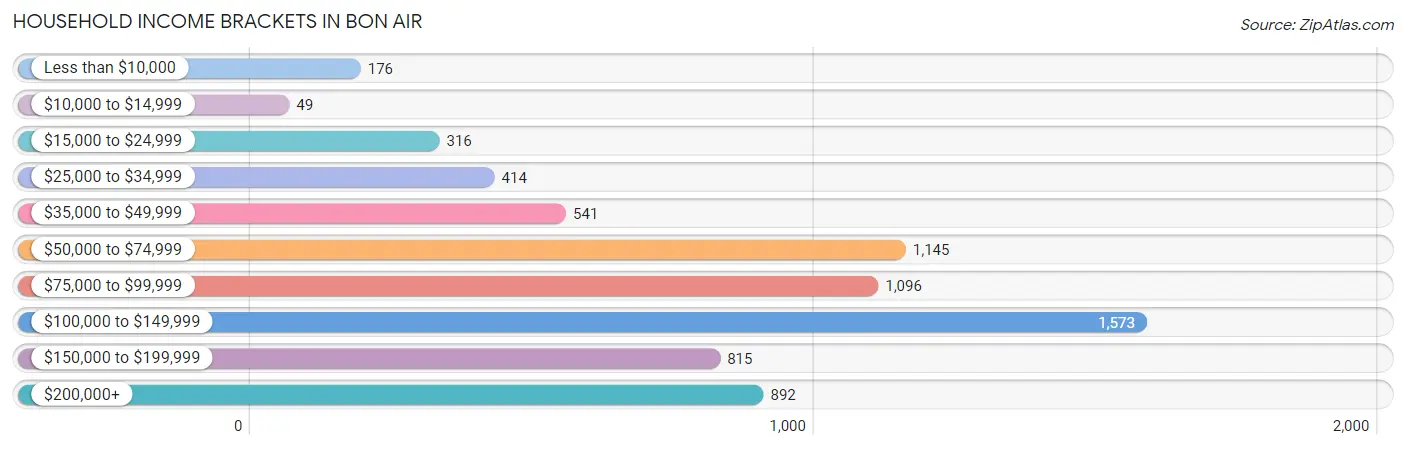
| Income Bracket | # Households | % Households |
| Less than $10,000 | 176 | 2.5% |
| $10,000 to $14,999 | 49 | 0.7% |
| $15,000 to $24,999 | 316 | 4.5% |
| $25,000 to $34,999 | 414 | 5.9% |
| $35,000 to $49,999 | 541 | 7.7% |
| $50,000 to $74,999 | 1,145 | 16.3% |
| $75,000 to $99,999 | 1,096 | 15.6% |
| $100,000 to $149,999 | 1,573 | 22.4% |
| $150,000 to $199,999 | 815 | 11.6% |
| $200,000+ | 892 | 12.7% |
Household Income by Householder Age in Bon Air
The median household income in Bon Air is $95,881, with the highest median household income of $115,451 found in the 25 to 44 years age bracket for the primary householder. A total of 2,207 households (31.4%) fall into this category. Meanwhile, the 15 to 24 years age bracket for the primary householder has the lowest median household income of $0, with 87 households (1.2%) in this group.
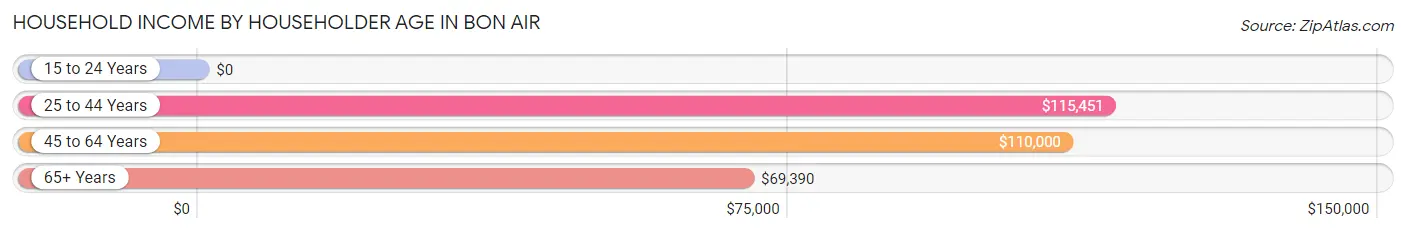
| Income Bracket | # Households | Median Income |
| 15 to 24 Years | 87 (1.2%) | $0 |
| 25 to 44 Years | 2,207 (31.4%) | $115,451 |
| 45 to 64 Years | 2,614 (37.2%) | $110,000 |
| 65+ Years | 2,116 (30.1%) | $69,390 |
| Total | 7,024 (100.0%) | $95,881 |
Poverty in Bon Air
Income Below Poverty by Sex and Age in Bon Air
With 4.5% poverty level for males and 6.3% for females among the residents of Bon Air, 16 and 17 year old males and 12 to 14 year old females are the most vulnerable to poverty, with 67 males (24.0%) and 136 females (33.3%) in their respective age groups living below the poverty level.
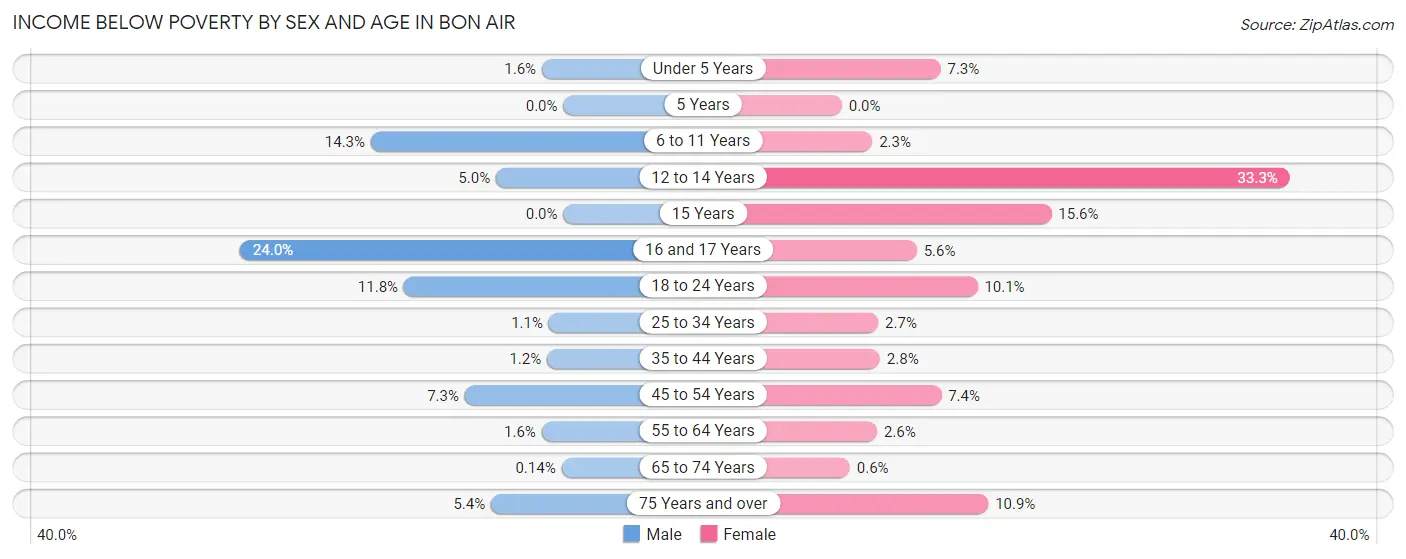
| Age Bracket | Male | Female |
| Under 5 Years | 6 (1.6%) | 33 (7.3%) |
| 5 Years | 0 (0.0%) | 0 (0.0%) |
| 6 to 11 Years | 67 (14.3%) | 13 (2.3%) |
| 12 to 14 Years | 15 (5.0%) | 136 (33.3%) |
| 15 Years | 0 (0.0%) | 14 (15.6%) |
| 16 and 17 Years | 67 (24.0%) | 11 (5.6%) |
| 18 to 24 Years | 61 (11.8%) | 72 (10.1%) |
| 25 to 34 Years | 11 (1.1%) | 25 (2.7%) |
| 35 to 44 Years | 16 (1.2%) | 38 (2.8%) |
| 45 to 54 Years | 75 (7.3%) | 94 (7.4%) |
| 55 to 64 Years | 19 (1.6%) | 27 (2.6%) |
| 65 to 74 Years | 1 (0.1%) | 6 (0.6%) |
| 75 Years and over | 30 (5.4%) | 91 (10.9%) |
| Total | 368 (4.5%) | 560 (6.3%) |
Income Above Poverty by Sex and Age in Bon Air
According to the poverty statistics in Bon Air, males aged 5 years and females aged 5 years are the age groups that are most secure financially, with 100.0% of males and 100.0% of females in these age groups living above the poverty line.
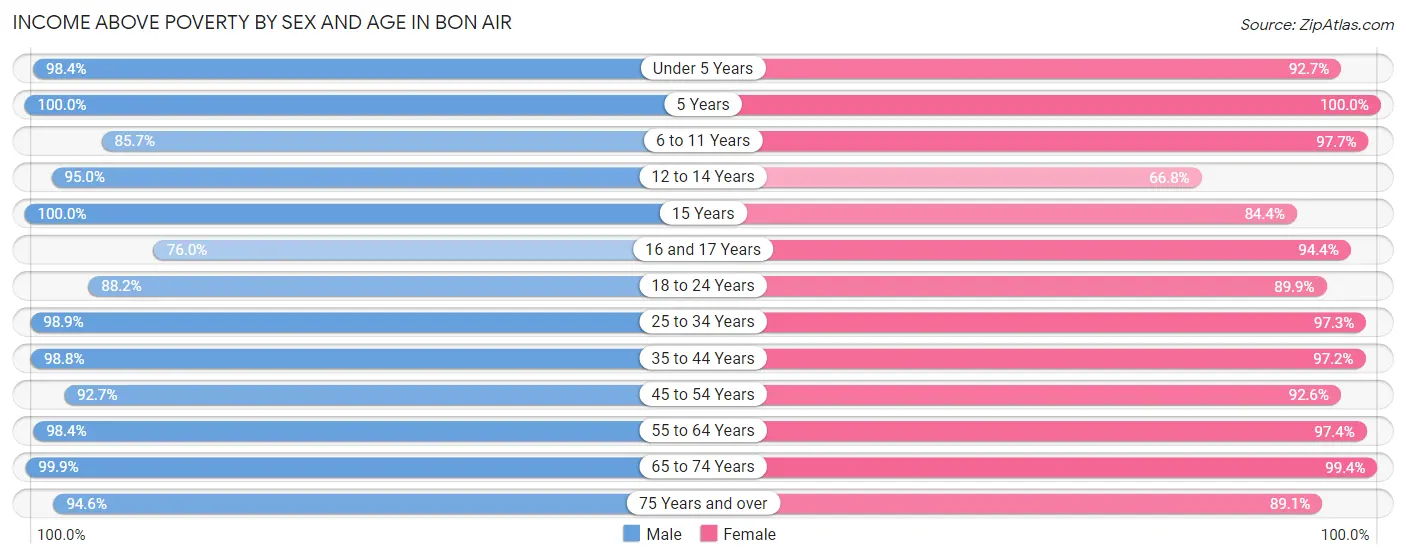
| Age Bracket | Male | Female |
| Under 5 Years | 371 (98.4%) | 417 (92.7%) |
| 5 Years | 191 (100.0%) | 55 (100.0%) |
| 6 to 11 Years | 402 (85.7%) | 563 (97.7%) |
| 12 to 14 Years | 285 (95.0%) | 273 (66.7%) |
| 15 Years | 162 (100.0%) | 76 (84.4%) |
| 16 and 17 Years | 212 (76.0%) | 187 (94.4%) |
| 18 to 24 Years | 454 (88.2%) | 643 (89.9%) |
| 25 to 34 Years | 1,005 (98.9%) | 900 (97.3%) |
| 35 to 44 Years | 1,309 (98.8%) | 1,304 (97.2%) |
| 45 to 54 Years | 949 (92.7%) | 1,179 (92.6%) |
| 55 to 64 Years | 1,158 (98.4%) | 1,006 (97.4%) |
| 65 to 74 Years | 708 (99.9%) | 996 (99.4%) |
| 75 Years and over | 529 (94.6%) | 746 (89.1%) |
| Total | 7,735 (95.5%) | 8,345 (93.7%) |
Income Below Poverty Among Married-Couple Families in Bon Air
The poverty statistics for married-couple families in Bon Air show that 1.5% or 56 of the total 3,618 families live below the poverty line. Families with 1 or 2 children have the highest poverty rate of 3.4%, comprising of 43 families. On the other hand, families with 3 or 4 children have the lowest poverty rate of 0.0%, which includes 0 families.
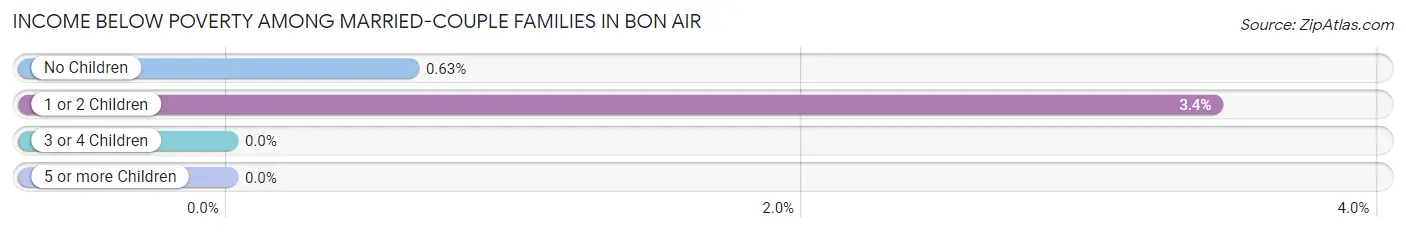
| Children | Above Poverty | Below Poverty |
| No Children | 2,051 (99.4%) | 13 (0.6%) |
| 1 or 2 Children | 1,210 (96.6%) | 43 (3.4%) |
| 3 or 4 Children | 301 (100.0%) | 0 (0.0%) |
| 5 or more Children | 0 (0.0%) | 0 (0.0%) |
| Total | 3,562 (98.5%) | 56 (1.5%) |
Income Below Poverty Among Single-Parent Households in Bon Air
According to the poverty data in Bon Air, 32.1% or 83 single-father households and 8.4% or 50 single-mother households are living below the poverty line. Among single-father households, those with 1 or 2 children have the highest poverty rate, with 83 households (41.5%) experiencing poverty. Likewise, among single-mother households, those with 3 or 4 children have the highest poverty rate, with 50 households (100.0%) falling below the poverty line.
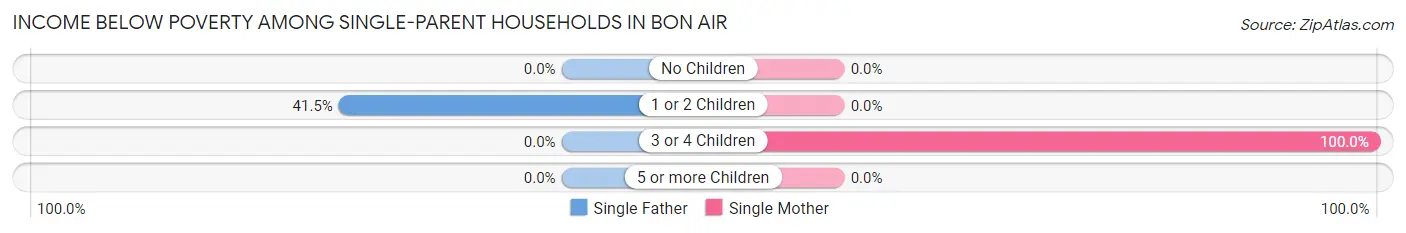
| Children | Single Father | Single Mother |
| No Children | 0 (0.0%) | 0 (0.0%) |
| 1 or 2 Children | 83 (41.5%) | 0 (0.0%) |
| 3 or 4 Children | 0 (0.0%) | 50 (100.0%) |
| 5 or more Children | 0 (0.0%) | 0 (0.0%) |
| Total | 83 (32.1%) | 50 (8.4%) |
Income Below Poverty Among Married-Couple vs Single-Parent Households in Bon Air
The poverty data for Bon Air shows that 56 of the married-couple family households (1.5%) and 133 of the single-parent households (15.6%) are living below the poverty level. Within the married-couple family households, those with 1 or 2 children have the highest poverty rate, with 43 households (3.4%) falling below the poverty line. Among the single-parent households, those with 3 or 4 children have the highest poverty rate, with 50 household (100.0%) living below poverty.
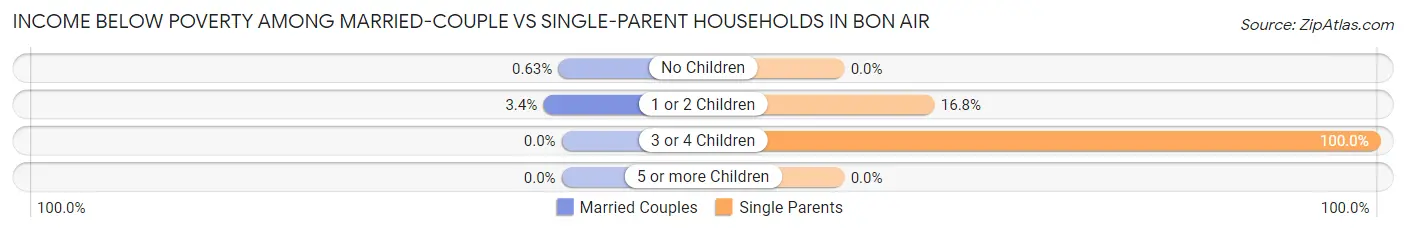
| Children | Married-Couple Families | Single-Parent Households |
| No Children | 13 (0.6%) | 0 (0.0%) |
| 1 or 2 Children | 43 (3.4%) | 83 (16.8%) |
| 3 or 4 Children | 0 (0.0%) | 50 (100.0%) |
| 5 or more Children | 0 (0.0%) | 0 (0.0%) |
| Total | 56 (1.5%) | 133 (15.6%) |
Race in Bon Air
The most populous races in Bon Air are White / Caucasian (13,159 | 75.4%), Black / African American (2,498 | 14.3%), and Hispanic or Latino (1,366 | 7.8%).
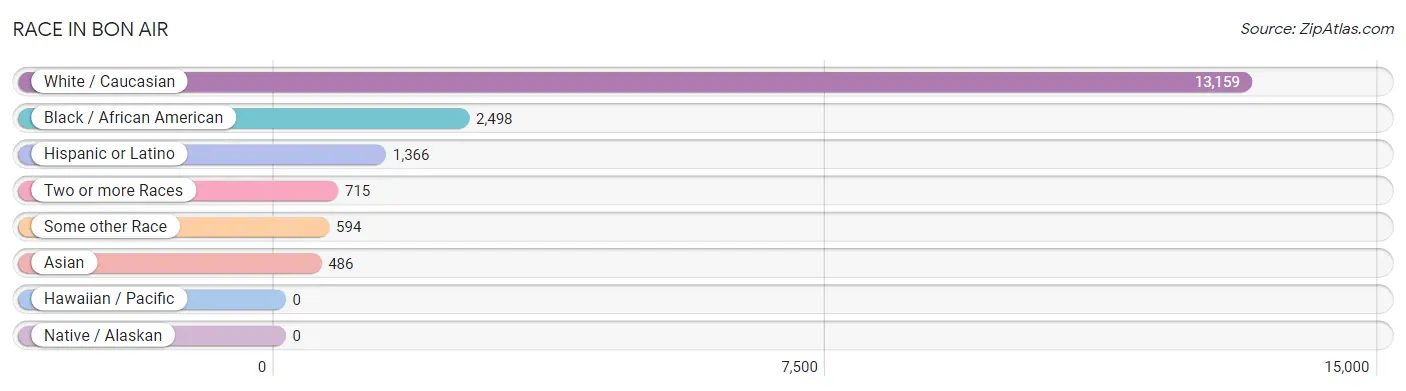
| Race | # Population | % Population |
| Asian | 486 | 2.8% |
| Black / African American | 2,498 | 14.3% |
| Hawaiian / Pacific | 0 | 0.0% |
| Hispanic or Latino | 1,366 | 7.8% |
| Native / Alaskan | 0 | 0.0% |
| White / Caucasian | 13,159 | 75.4% |
| Two or more Races | 715 | 4.1% |
| Some other Race | 594 | 3.4% |
| Total | 17,452 | 100.0% |
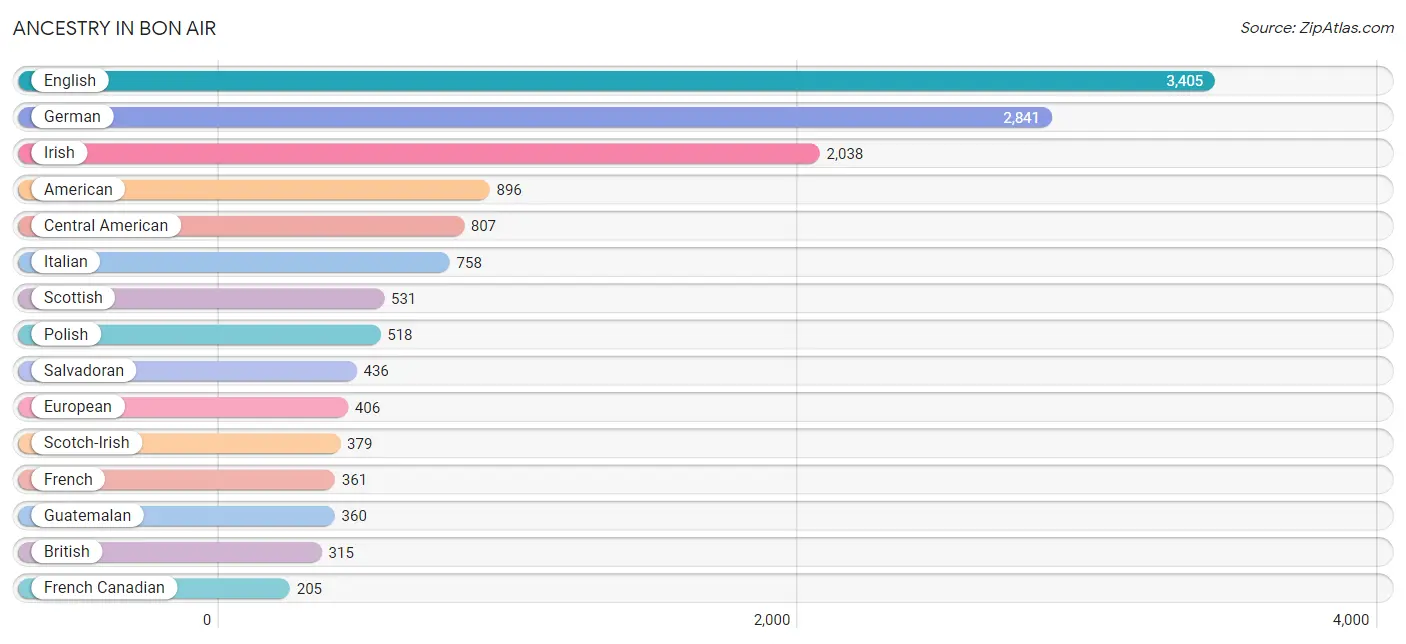
Ancestry in Bon Air
The most populous ancestries reported in Bon Air are English (3,405 | 19.5%), German (2,841 | 16.3%), Irish (2,038 | 11.7%), American (896 | 5.1%), and Central American (807 | 4.6%), together accounting for 57.2% of all Bon Air residents.
| Ancestry | # Population | % Population |
| African | 44 | 0.3% |
| American | 896 | 5.1% |
| Arab | 54 | 0.3% |
| Australian | 14 | 0.1% |
| Austrian | 53 | 0.3% |
| Bhutanese | 14 | 0.1% |
| British | 315 | 1.8% |
| British West Indian | 35 | 0.2% |
| Burmese | 39 | 0.2% |
| Canadian | 140 | 0.8% |
| Cape Verdean | 13 | 0.1% |
| Central American | 807 | 4.6% |
| Central American Indian | 7 | 0.0% |
| Cherokee | 26 | 0.2% |
| Chilean | 6 | 0.0% |
| Choctaw | 7 | 0.0% |
| Colombian | 11 | 0.1% |
| Cuban | 121 | 0.7% |
| Czech | 175 | 1.0% |
| Czechoslovakian | 18 | 0.1% |
| Danish | 87 | 0.5% |
| Dutch | 128 | 0.7% |
| Eastern European | 109 | 0.6% |
| English | 3,405 | 19.5% |
| European | 406 | 2.3% |
| Filipino | 10 | 0.1% |
| French | 361 | 2.1% |
| French Canadian | 205 | 1.2% |
| German | 2,841 | 16.3% |
| Greek | 12 | 0.1% |
| Guatemalan | 360 | 2.1% |
| Hungarian | 18 | 0.1% |
| Indian (Asian) | 205 | 1.2% |
| Irish | 2,038 | 11.7% |
| Israeli | 15 | 0.1% |
| Italian | 758 | 4.3% |
| Jamaican | 33 | 0.2% |
| Japanese | 46 | 0.3% |
| Jordanian | 6 | 0.0% |
| Korean | 142 | 0.8% |
| Lithuanian | 27 | 0.2% |
| Mexican | 194 | 1.1% |
| Nicaraguan | 11 | 0.1% |
| Northern European | 6 | 0.0% |
| Norwegian | 94 | 0.5% |
| Pakistani | 27 | 0.2% |
| Peruvian | 17 | 0.1% |
| Polish | 518 | 3.0% |
| Portuguese | 41 | 0.2% |
| Puerto Rican | 106 | 0.6% |
| Russian | 13 | 0.1% |
| Salvadoran | 436 | 2.5% |
| Scandinavian | 5 | 0.0% |
| Scotch-Irish | 379 | 2.2% |
| Scottish | 531 | 3.0% |
| Slovak | 86 | 0.5% |
| South American | 42 | 0.2% |
| Spaniard | 30 | 0.2% |
| Spanish | 18 | 0.1% |
| Sri Lankan | 81 | 0.5% |
| Subsaharan African | 112 | 0.6% |
| Swedish | 145 | 0.8% |
| Swiss | 99 | 0.6% |
| Thai | 105 | 0.6% |
| Ugandan | 45 | 0.3% |
| Ukrainian | 180 | 1.0% |
| Uruguayan | 8 | 0.1% |
| Welsh | 137 | 0.8% | View All 68 Rows |
Immigrants in Bon Air
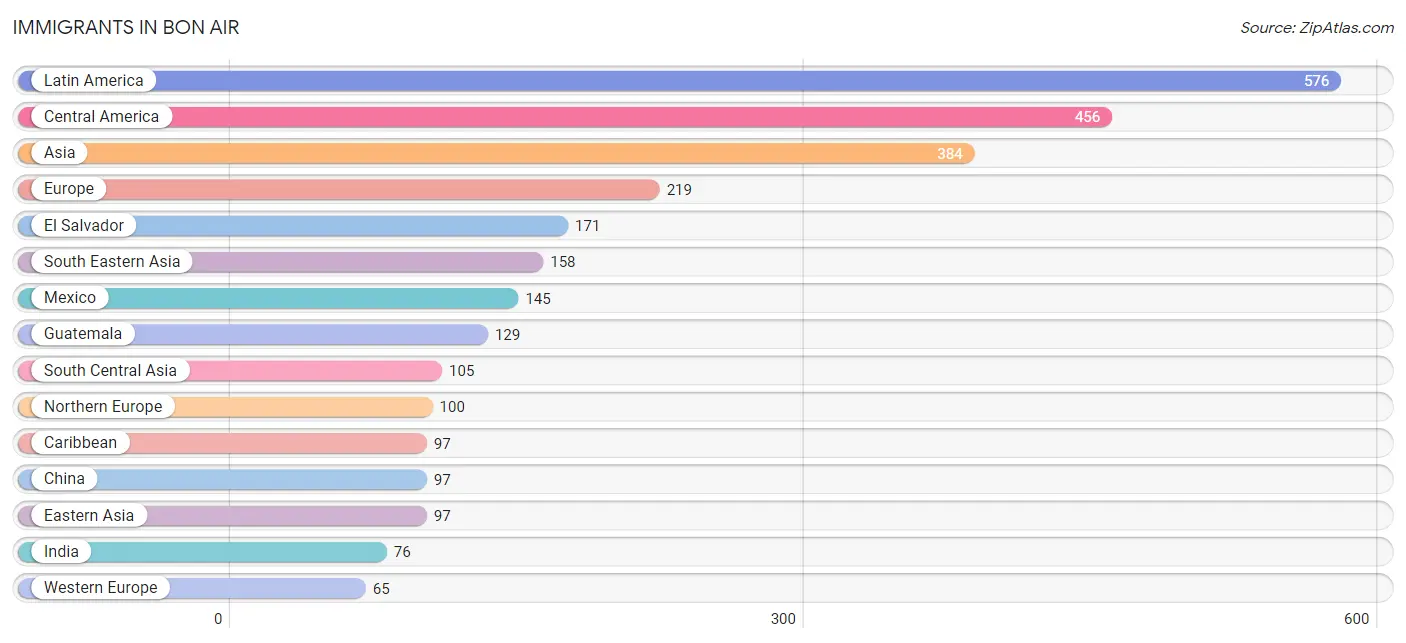
The most numerous immigrant groups reported in Bon Air came from Latin America (576 | 3.3%), Central America (456 | 2.6%), Asia (384 | 2.2%), Europe (219 | 1.3%), and El Salvador (171 | 1.0%), together accounting for 10.3% of all Bon Air residents.
| Immigration Origin | # Population | % Population |
| Africa | 31 | 0.2% |
| Asia | 384 | 2.2% |
| Australia | 11 | 0.1% |
| Brazil | 6 | 0.0% |
| Cambodia | 31 | 0.2% |
| Canada | 10 | 0.1% |
| Caribbean | 97 | 0.6% |
| Central America | 456 | 2.6% |
| China | 97 | 0.6% |
| Cuba | 36 | 0.2% |
| Czechoslovakia | 9 | 0.1% |
| Eastern Africa | 31 | 0.2% |
| Eastern Asia | 97 | 0.6% |
| Eastern Europe | 41 | 0.2% |
| El Salvador | 171 | 1.0% |
| England | 23 | 0.1% |
| Europe | 219 | 1.3% |
| France | 9 | 0.1% |
| Germany | 56 | 0.3% |
| Guatemala | 129 | 0.7% |
| India | 76 | 0.4% |
| Ireland | 6 | 0.0% |
| Italy | 13 | 0.1% |
| Jamaica | 26 | 0.2% |
| Jordan | 6 | 0.0% |
| Latin America | 576 | 3.3% |
| Lebanon | 18 | 0.1% |
| Mexico | 145 | 0.8% |
| Nicaragua | 11 | 0.1% |
| Northern Europe | 100 | 0.6% |
| Oceania | 11 | 0.1% |
| Pakistan | 6 | 0.0% |
| Peru | 17 | 0.1% |
| Philippines | 47 | 0.3% |
| Poland | 19 | 0.1% |
| Russia | 4 | 0.0% |
| Scotland | 14 | 0.1% |
| South America | 23 | 0.1% |
| South Central Asia | 105 | 0.6% |
| South Eastern Asia | 158 | 0.9% |
| Southern Europe | 13 | 0.1% |
| St. Vincent and the Grenadines | 35 | 0.2% |
| Sweden | 11 | 0.1% |
| Taiwan | 30 | 0.2% |
| Thailand | 40 | 0.2% |
| Uganda | 31 | 0.2% |
| Ukraine | 9 | 0.1% |
| Uzbekistan | 23 | 0.1% |
| Vietnam | 40 | 0.2% |
| Western Asia | 24 | 0.1% |
| Western Europe | 65 | 0.4% | View All 51 Rows |
Sex and Age in Bon Air
Sex and Age in Bon Air
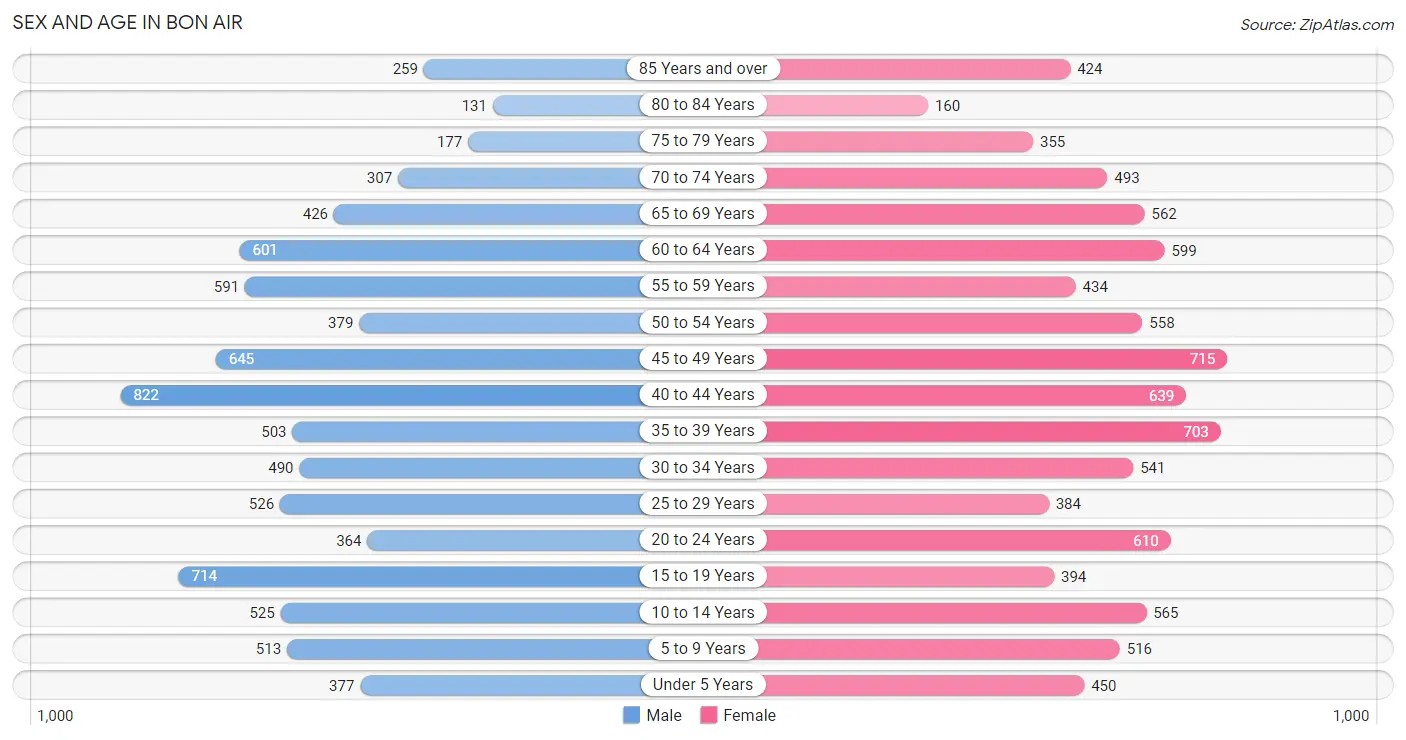
The most populous age groups in Bon Air are 40 to 44 Years (822 | 9.8%) for men and 45 to 49 Years (715 | 7.9%) for women.
| Age Bracket | Male | Female |
| Under 5 Years | 377 (4.5%) | 450 (4.9%) |
| 5 to 9 Years | 513 (6.1%) | 516 (5.7%) |
| 10 to 14 Years | 525 (6.3%) | 565 (6.2%) |
| 15 to 19 Years | 714 (8.6%) | 394 (4.3%) |
| 20 to 24 Years | 364 (4.4%) | 610 (6.7%) |
| 25 to 29 Years | 526 (6.3%) | 384 (4.2%) |
| 30 to 34 Years | 490 (5.9%) | 541 (5.9%) |
| 35 to 39 Years | 503 (6.0%) | 703 (7.7%) |
| 40 to 44 Years | 822 (9.8%) | 639 (7.0%) |
| 45 to 49 Years | 645 (7.7%) | 715 (7.9%) |
| 50 to 54 Years | 379 (4.5%) | 558 (6.1%) |
| 55 to 59 Years | 591 (7.1%) | 434 (4.8%) |
| 60 to 64 Years | 601 (7.2%) | 599 (6.6%) |
| 65 to 69 Years | 426 (5.1%) | 562 (6.2%) |
| 70 to 74 Years | 307 (3.7%) | 493 (5.4%) |
| 75 to 79 Years | 177 (2.1%) | 355 (3.9%) |
| 80 to 84 Years | 131 (1.6%) | 160 (1.8%) |
| 85 Years and over | 259 (3.1%) | 424 (4.7%) |
| Total | 8,350 (100.0%) | 9,102 (100.0%) |
Families and Households in Bon Air
Median Family Size in Bon Air
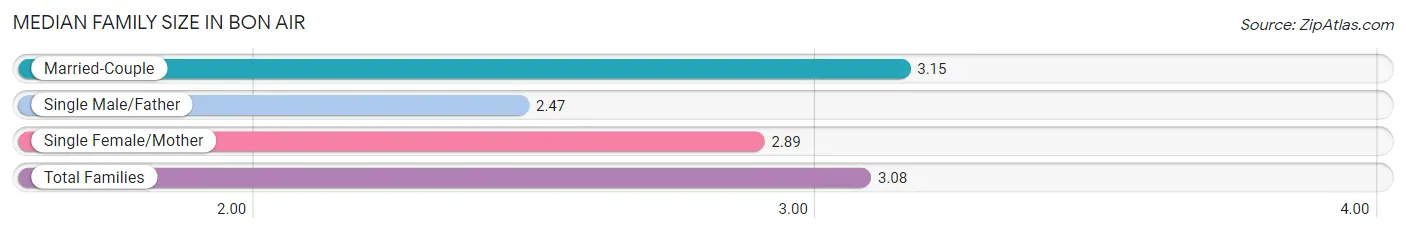
The median family size in Bon Air is 3.08 persons per family, with married-couple families (3,618 | 80.9%) accounting for the largest median family size of 3.15 persons per family. On the other hand, single male/father families (259 | 5.8%) represent the smallest median family size with 2.47 persons per family.
| Family Type | # Families | Family Size |
| Married-Couple | 3,618 (80.9%) | 3.15 |
| Single Male/Father | 259 (5.8%) | 2.47 |
| Single Female/Mother | 595 (13.3%) | 2.89 |
| Total Families | 4,472 (100.0%) | 3.08 |
Median Household Size in Bon Air
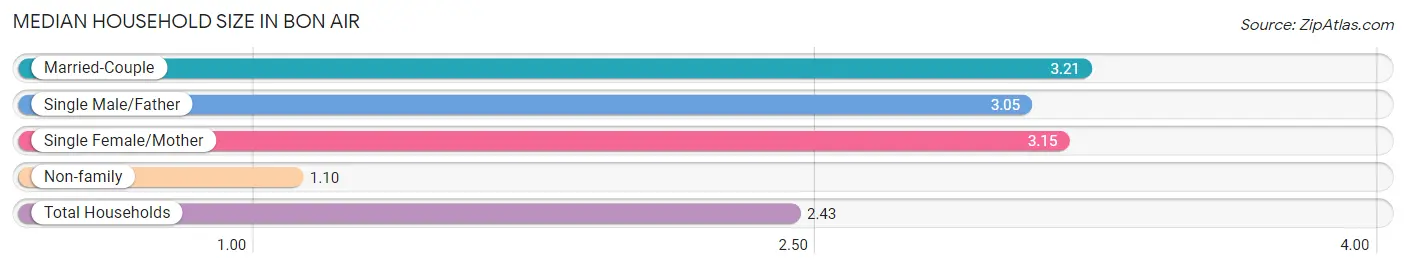
The median household size in Bon Air is 2.43 persons per household, with married-couple households (3,618 | 51.5%) accounting for the largest median household size of 3.21 persons per household. non-family households (2,552 | 36.3%) represent the smallest median household size with 1.10 persons per household.
| Household Type | # Households | Household Size |
| Married-Couple | 3,618 (51.5%) | 3.21 |
| Single Male/Father | 259 (3.7%) | 3.05 |
| Single Female/Mother | 595 (8.5%) | 3.15 |
| Non-family | 2,552 (36.3%) | 1.10 |
| Total Households | 7,024 (100.0%) | 2.43 |
Household Size by Marriage Status in Bon Air
Out of a total of 7,024 households in Bon Air, 4,472 (63.7%) are family households, while 2,552 (36.3%) are nonfamily households. The most numerous type of family households are 2-person households, comprising 1,626, and the most common type of nonfamily households are 1-person households, comprising 2,344.
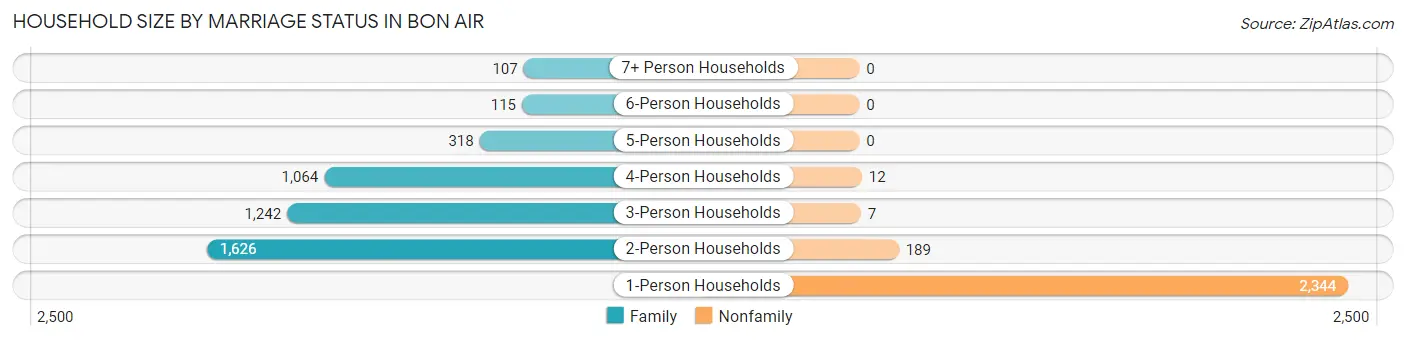
| Household Size | Family Households | Nonfamily Households |
| 1-Person Households | - | 2,344 (33.4%) |
| 2-Person Households | 1,626 (23.2%) | 189 (2.7%) |
| 3-Person Households | 1,242 (17.7%) | 7 (0.1%) |
| 4-Person Households | 1,064 (15.1%) | 12 (0.2%) |
| 5-Person Households | 318 (4.5%) | 0 (0.0%) |
| 6-Person Households | 115 (1.6%) | 0 (0.0%) |
| 7+ Person Households | 107 (1.5%) | 0 (0.0%) |
| Total | 4,472 (63.7%) | 2,552 (36.3%) |
Female Fertility in Bon Air
Fertility by Age in Bon Air
Average fertility rate in Bon Air is 43.0 births per 1,000 women. Women in the age bracket of 20 to 34 years have the highest fertility rate with 100.0 births per 1,000 women. Women in the age bracket of 20 to 34 years acount for 87.5% of all women with births.
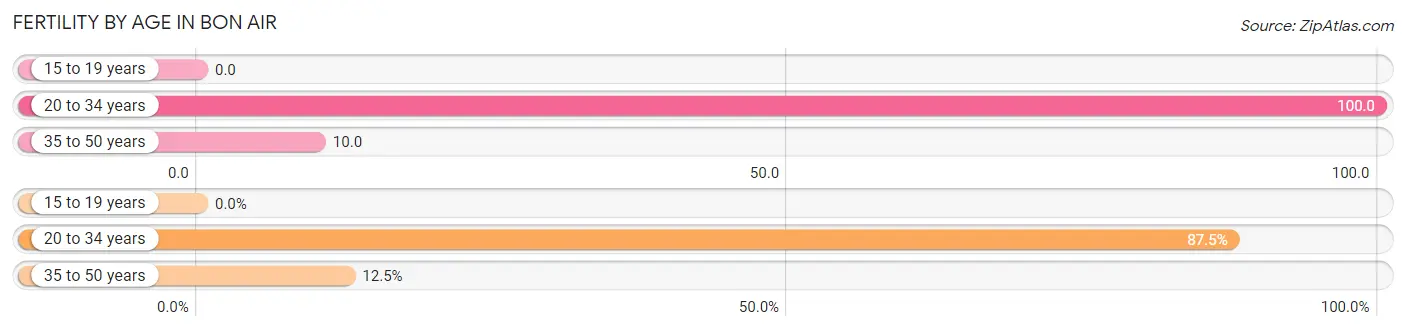
| Age Bracket | Women with Births | Births / 1,000 Women |
| 15 to 19 years | 0 (0.0%) | 0.0 |
| 20 to 34 years | 154 (87.5%) | 100.0 |
| 35 to 50 years | 22 (12.5%) | 10.0 |
| Total | 176 (100.0%) | 43.0 |
Fertility by Age by Marriage Status in Bon Air
60.2% of women with births (176) in Bon Air are married. The highest percentage of unmarried women with births falls into 20 to 34 years age bracket with 45.5% of them unmarried at the time of birth, while the lowest percentage of unmarried women with births belong to 35 to 50 years age bracket with 0.0% of them unmarried.
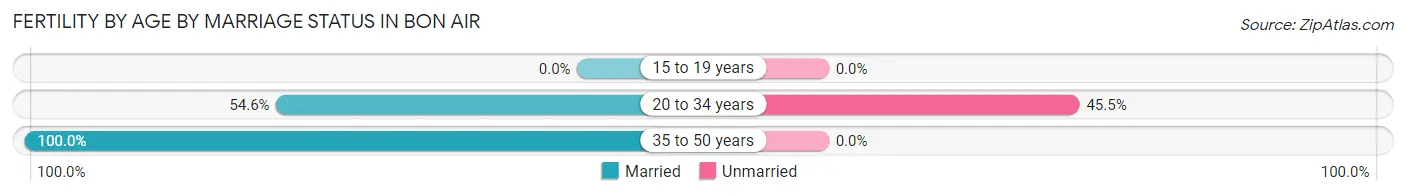
| Age Bracket | Married | Unmarried |
| 15 to 19 years | 0 (0.0%) | 0 (0.0%) |
| 20 to 34 years | 84 (54.5%) | 70 (45.5%) |
| 35 to 50 years | 22 (100.0%) | 0 (0.0%) |
| Total | 106 (60.2%) | 70 (39.8%) |
Fertility by Education in Bon Air
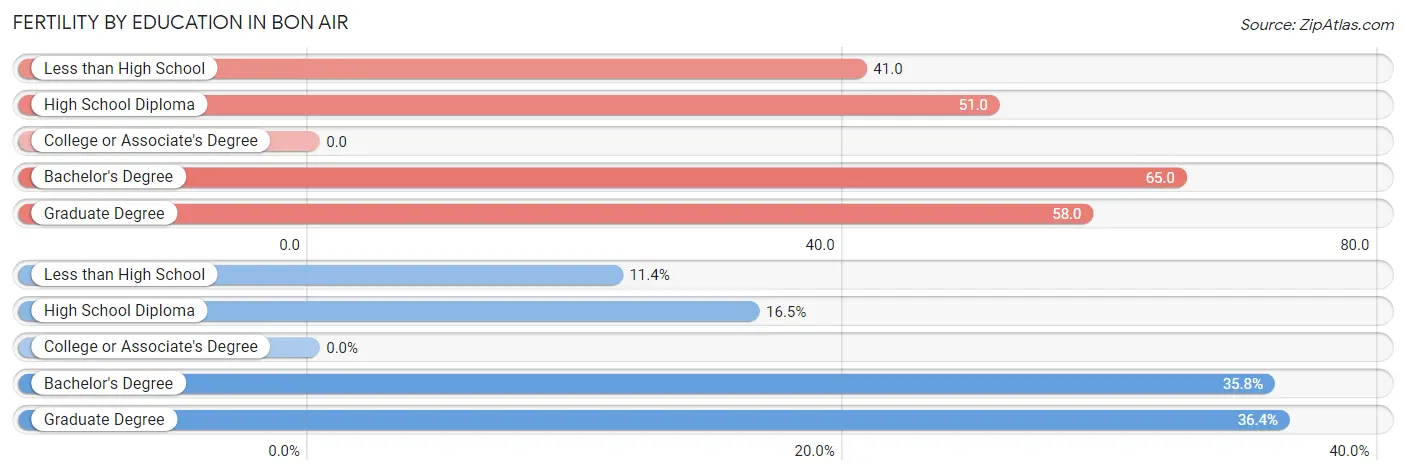
| Educational Attainment | Women with Births | Births / 1,000 Women |
| Less than High School | 20 (11.4%) | 41.0 |
| High School Diploma | 29 (16.5%) | 51.0 |
| College or Associate's Degree | 0 (0.0%) | 0.0 |
| Bachelor's Degree | 63 (35.8%) | 65.0 |
| Graduate Degree | 64 (36.4%) | 58.0 |
| Total | 176 (100.0%) | 43.0 |
Fertility by Education by Marriage Status in Bon Air
39.8% of women with births in Bon Air are unmarried. Women with the educational attainment of graduate degree are most likely to be married with 100.0% of them married at childbirth, while women with the educational attainment of less than high school are least likely to be married with 100.0% of them unmarried at childbirth.
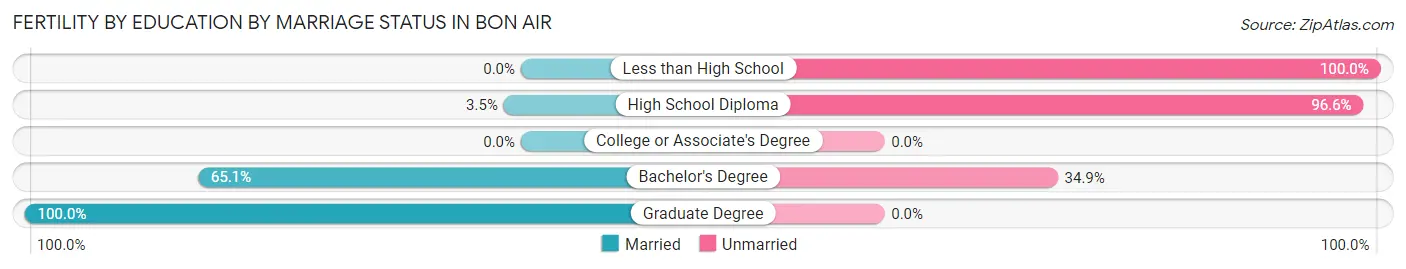
| Educational Attainment | Married | Unmarried |
| Less than High School | 0 (0.0%) | 20 (100.0%) |
| High School Diploma | 1 (3.5%) | 28 (96.6%) |
| College or Associate's Degree | 0 (0.0%) | 0 (0.0%) |
| Bachelor's Degree | 41 (65.1%) | 22 (34.9%) |
| Graduate Degree | 64 (100.0%) | 0 (0.0%) |
| Total | 106 (60.2%) | 70 (39.8%) |
Employment Characteristics in Bon Air
Employment by Class of Employer in Bon Air
Among the 9,291 employed individuals in Bon Air, private company employees (5,510 | 59.3%), not-for-profit organizations (901 | 9.7%), and state government employees (864 | 9.3%) make up the most common classes of employment.
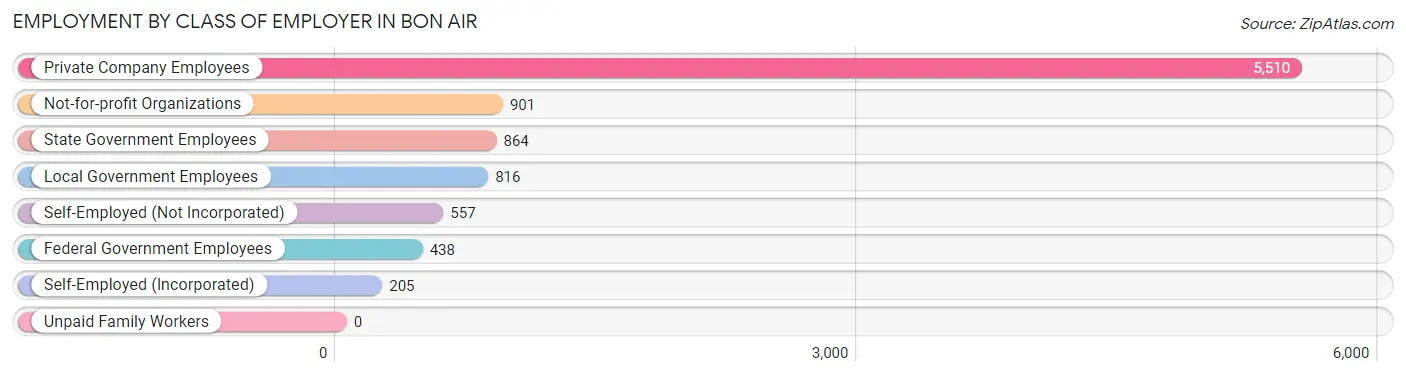
| Employer Class | # Employees | % Employees |
| Private Company Employees | 5,510 | 59.3% |
| Self-Employed (Incorporated) | 205 | 2.2% |
| Self-Employed (Not Incorporated) | 557 | 6.0% |
| Not-for-profit Organizations | 901 | 9.7% |
| Local Government Employees | 816 | 8.8% |
| State Government Employees | 864 | 9.3% |
| Federal Government Employees | 438 | 4.7% |
| Unpaid Family Workers | 0 | 0.0% |
| Total | 9,291 | 100.0% |
Employment Status by Age in Bon Air
According to the labor force statistics for Bon Air, out of the total population over 16 years of age (14,254), 68.9% or 9,821 individuals are in the labor force, with 4.4% or 432 of them unemployed. The age group with the highest labor force participation rate is 25 to 29 years, with 93.0% or 846 individuals in the labor force. Within the labor force, the 16 to 19 years age range has the highest percentage of unemployed individuals, with 35.8% or 135 of them being unemployed.
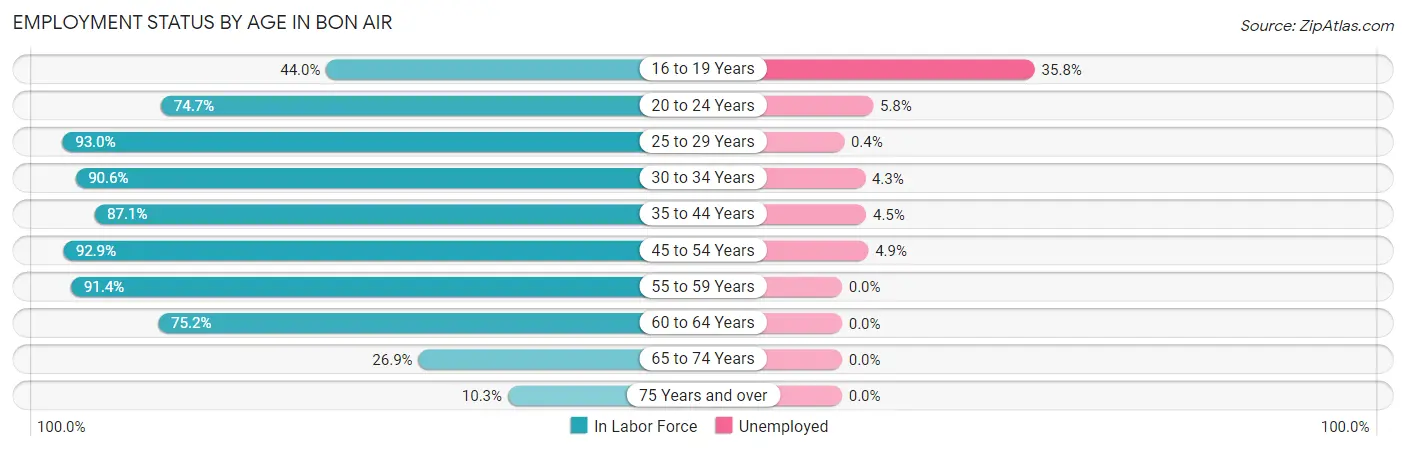
| Age Bracket | In Labor Force | Unemployed |
| 16 to 19 Years | 377 (44.0%) | 135 (35.8%) |
| 20 to 24 Years | 728 (74.7%) | 42 (5.8%) |
| 25 to 29 Years | 846 (93.0%) | 3 (0.4%) |
| 30 to 34 Years | 934 (90.6%) | 40 (4.3%) |
| 35 to 44 Years | 2,323 (87.1%) | 105 (4.5%) |
| 45 to 54 Years | 2,134 (92.9%) | 105 (4.9%) |
| 55 to 59 Years | 937 (91.4%) | 0 (0.0%) |
| 60 to 64 Years | 902 (75.2%) | 0 (0.0%) |
| 65 to 74 Years | 481 (26.9%) | 0 (0.0%) |
| 75 Years and over | 155 (10.3%) | 0 (0.0%) |
| Total | 9,821 (68.9%) | 432 (4.4%) |
Employment Status by Educational Attainment in Bon Air
According to labor force statistics for Bon Air, 88.4% of individuals (8,071) out of the total population between 25 and 64 years of age (9,130) are in the labor force, with 3.1% or 250 of them being unemployed. The group with the highest labor force participation rate are those with the educational attainment of bachelor's degree or higher, with 92.4% or 4,628 individuals in the labor force. Within the labor force, individuals with high school diploma education have the highest percentage of unemployment, with 11.7% or 102 of them being unemployed.
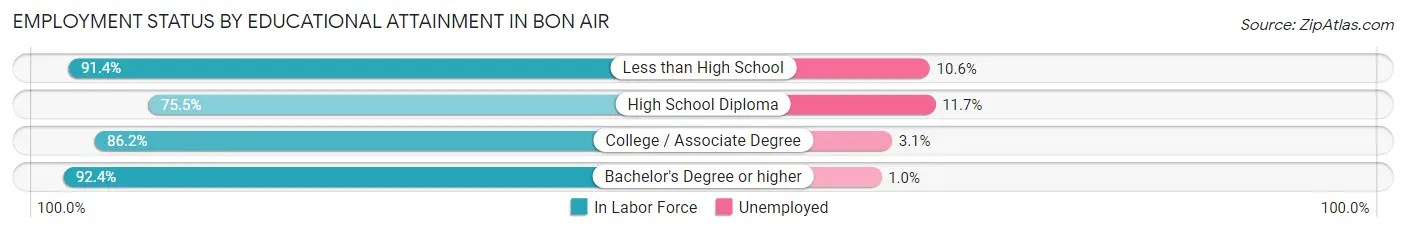
| Educational Attainment | In Labor Force | Unemployed |
| Less than High School | 339 (91.4%) | 39 (10.6%) |
| High School Diploma | 873 (75.5%) | 135 (11.7%) |
| College / Associate Degree | 2,236 (86.2%) | 80 (3.1%) |
| Bachelor's Degree or higher | 4,628 (92.4%) | 50 (1.0%) |
| Total | 8,071 (88.4%) | 283 (3.1%) |
Employment Occupations by Sex in Bon Air
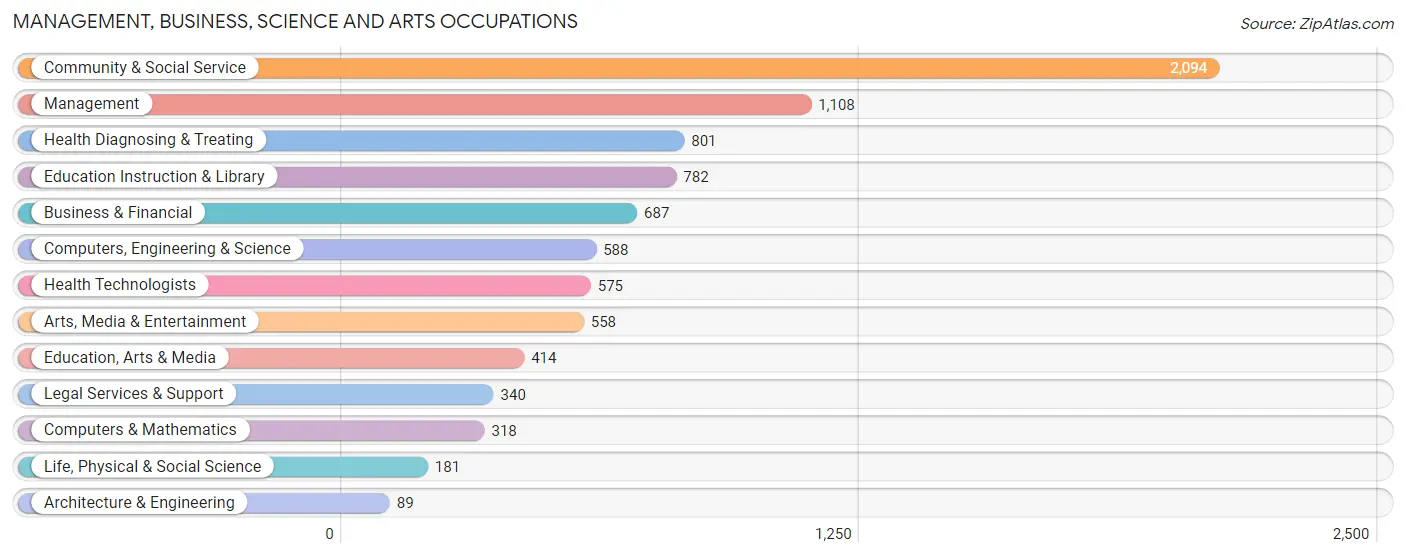
Management, Business, Science and Arts Occupations
The most common Management, Business, Science and Arts occupations in Bon Air are Community & Social Service (2,094 | 22.4%), Management (1,108 | 11.8%), Health Diagnosing & Treating (801 | 8.6%), Education Instruction & Library (782 | 8.4%), and Business & Financial (687 | 7.3%).
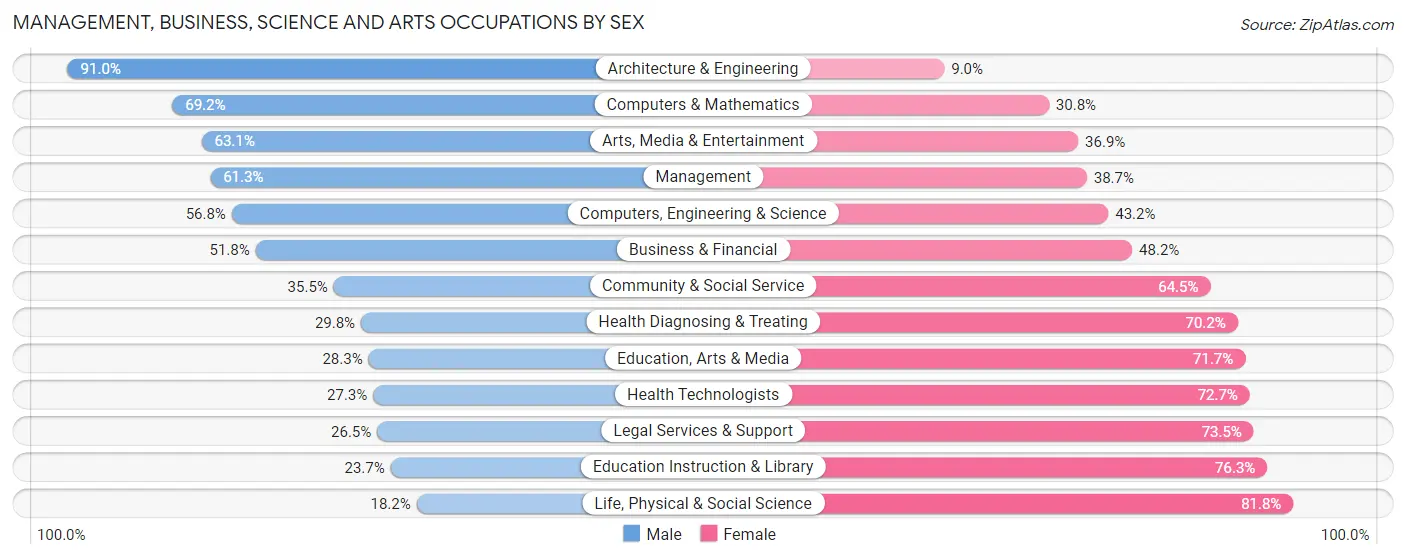
Management, Business, Science and Arts Occupations by Sex
Within the Management, Business, Science and Arts occupations in Bon Air, the most male-oriented occupations are Architecture & Engineering (91.0%), Computers & Mathematics (69.2%), and Arts, Media & Entertainment (63.1%), while the most female-oriented occupations are Life, Physical & Social Science (81.8%), Education Instruction & Library (76.3%), and Legal Services & Support (73.5%).
| Occupation | Male | Female |
| Management | 679 (61.3%) | 429 (38.7%) |
| Business & Financial | 356 (51.8%) | 331 (48.2%) |
| Computers, Engineering & Science | 334 (56.8%) | 254 (43.2%) |
| Computers & Mathematics | 220 (69.2%) | 98 (30.8%) |
| Architecture & Engineering | 81 (91.0%) | 8 (9.0%) |
| Life, Physical & Social Science | 33 (18.2%) | 148 (81.8%) |
| Community & Social Service | 744 (35.5%) | 1,350 (64.5%) |
| Education, Arts & Media | 117 (28.3%) | 297 (71.7%) |
| Legal Services & Support | 90 (26.5%) | 250 (73.5%) |
| Education Instruction & Library | 185 (23.7%) | 597 (76.3%) |
| Arts, Media & Entertainment | 352 (63.1%) | 206 (36.9%) |
| Health Diagnosing & Treating | 239 (29.8%) | 562 (70.2%) |
| Health Technologists | 157 (27.3%) | 418 (72.7%) |
| Total (Category) | 2,352 (44.6%) | 2,926 (55.4%) |
| Total (Overall) | 4,721 (50.4%) | 4,639 (49.6%) |
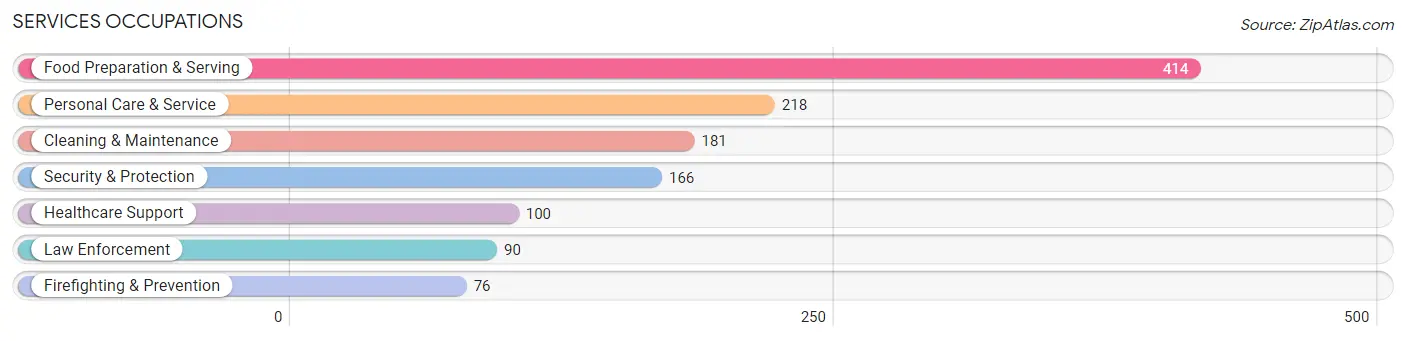
Services Occupations
The most common Services occupations in Bon Air are Food Preparation & Serving (414 | 4.4%), Personal Care & Service (218 | 2.3%), Cleaning & Maintenance (181 | 1.9%), Security & Protection (166 | 1.8%), and Healthcare Support (100 | 1.1%).
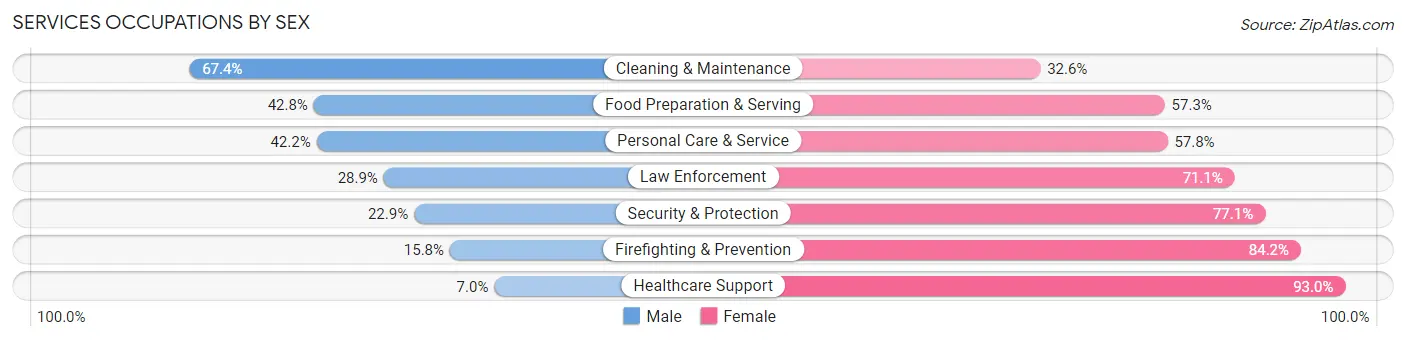
Services Occupations by Sex
Within the Services occupations in Bon Air, the most male-oriented occupations are Cleaning & Maintenance (67.4%), Food Preparation & Serving (42.7%), and Personal Care & Service (42.2%), while the most female-oriented occupations are Healthcare Support (93.0%), Firefighting & Prevention (84.2%), and Security & Protection (77.1%).
| Occupation | Male | Female |
| Healthcare Support | 7 (7.0%) | 93 (93.0%) |
| Security & Protection | 38 (22.9%) | 128 (77.1%) |
| Firefighting & Prevention | 12 (15.8%) | 64 (84.2%) |
| Law Enforcement | 26 (28.9%) | 64 (71.1%) |
| Food Preparation & Serving | 177 (42.7%) | 237 (57.3%) |
| Cleaning & Maintenance | 122 (67.4%) | 59 (32.6%) |
| Personal Care & Service | 92 (42.2%) | 126 (57.8%) |
| Total (Category) | 436 (40.4%) | 643 (59.6%) |
| Total (Overall) | 4,721 (50.4%) | 4,639 (49.6%) |
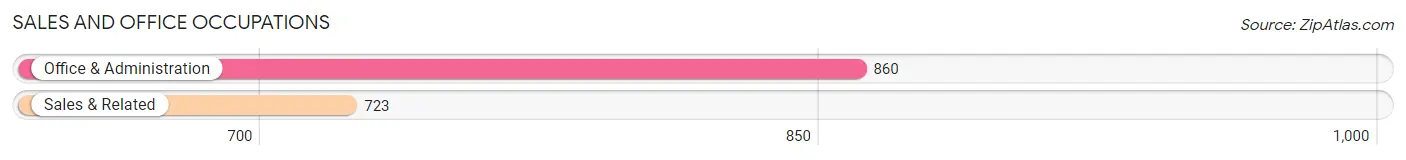
Sales and Office Occupations
The most common Sales and Office occupations in Bon Air are Office & Administration (860 | 9.2%), and Sales & Related (723 | 7.7%).
Sales and Office Occupations by Sex
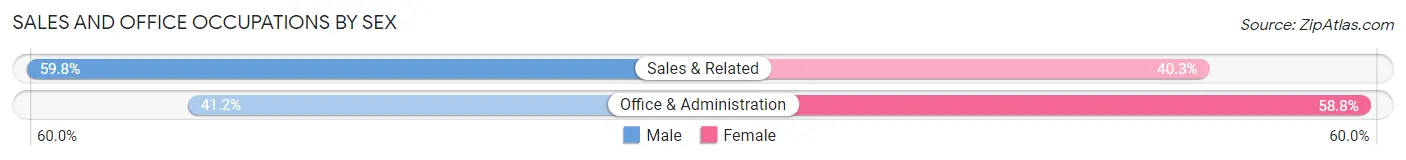
| Occupation | Male | Female |
| Sales & Related | 432 (59.8%) | 291 (40.3%) |
| Office & Administration | 354 (41.2%) | 506 (58.8%) |
| Total (Category) | 786 (49.6%) | 797 (50.3%) |
| Total (Overall) | 4,721 (50.4%) | 4,639 (49.6%) |
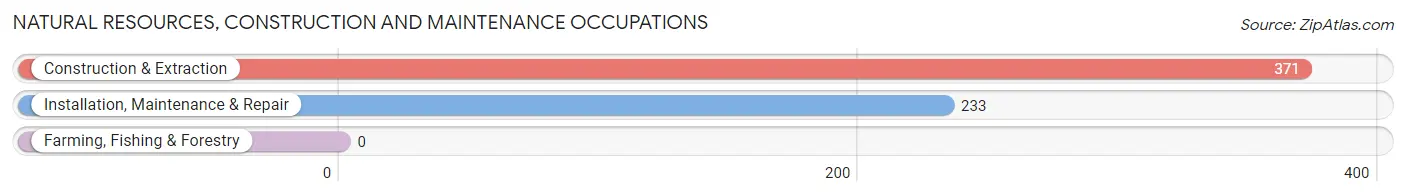
Natural Resources, Construction and Maintenance Occupations
The most common Natural Resources, Construction and Maintenance occupations in Bon Air are Construction & Extraction (371 | 4.0%), and Installation, Maintenance & Repair (233 | 2.5%).
Natural Resources, Construction and Maintenance Occupations by Sex
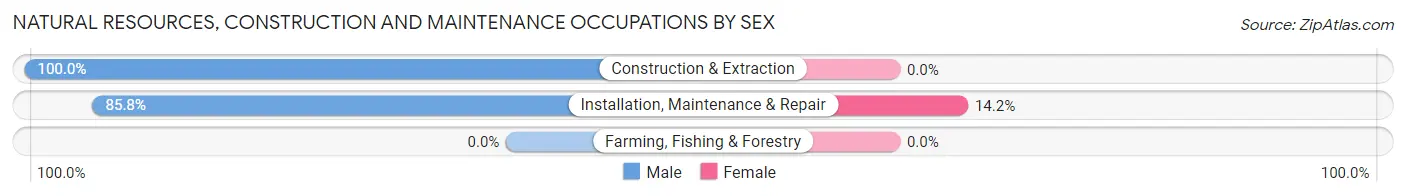
| Occupation | Male | Female |
| Farming, Fishing & Forestry | 0 (0.0%) | 0 (0.0%) |
| Construction & Extraction | 371 (100.0%) | 0 (0.0%) |
| Installation, Maintenance & Repair | 200 (85.8%) | 33 (14.2%) |
| Total (Category) | 571 (94.5%) | 33 (5.5%) |
| Total (Overall) | 4,721 (50.4%) | 4,639 (49.6%) |
Production, Transportation and Moving Occupations
The most common Production, Transportation and Moving occupations in Bon Air are Transportation (340 | 3.6%), Production (292 | 3.1%), and Material Moving (184 | 2.0%).
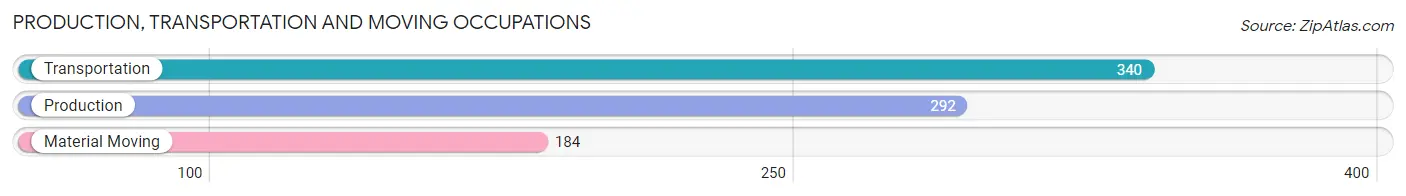
Production, Transportation and Moving Occupations by Sex
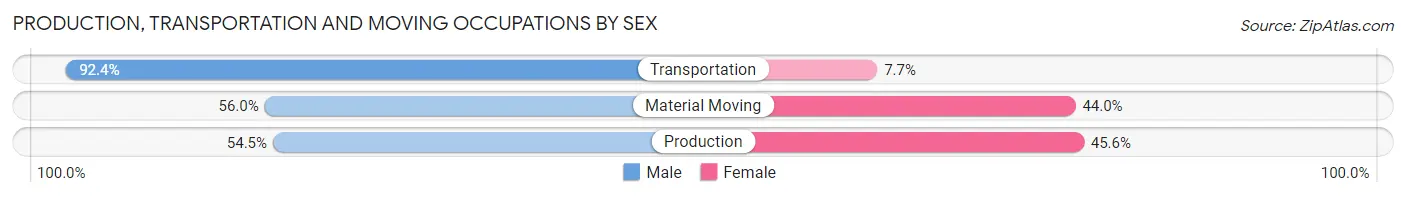
| Occupation | Male | Female |
| Production | 159 (54.4%) | 133 (45.6%) |
| Transportation | 314 (92.3%) | 26 (7.6%) |
| Material Moving | 103 (56.0%) | 81 (44.0%) |
| Total (Category) | 576 (70.6%) | 240 (29.4%) |
| Total (Overall) | 4,721 (50.4%) | 4,639 (49.6%) |
Employment Industries by Sex in Bon Air
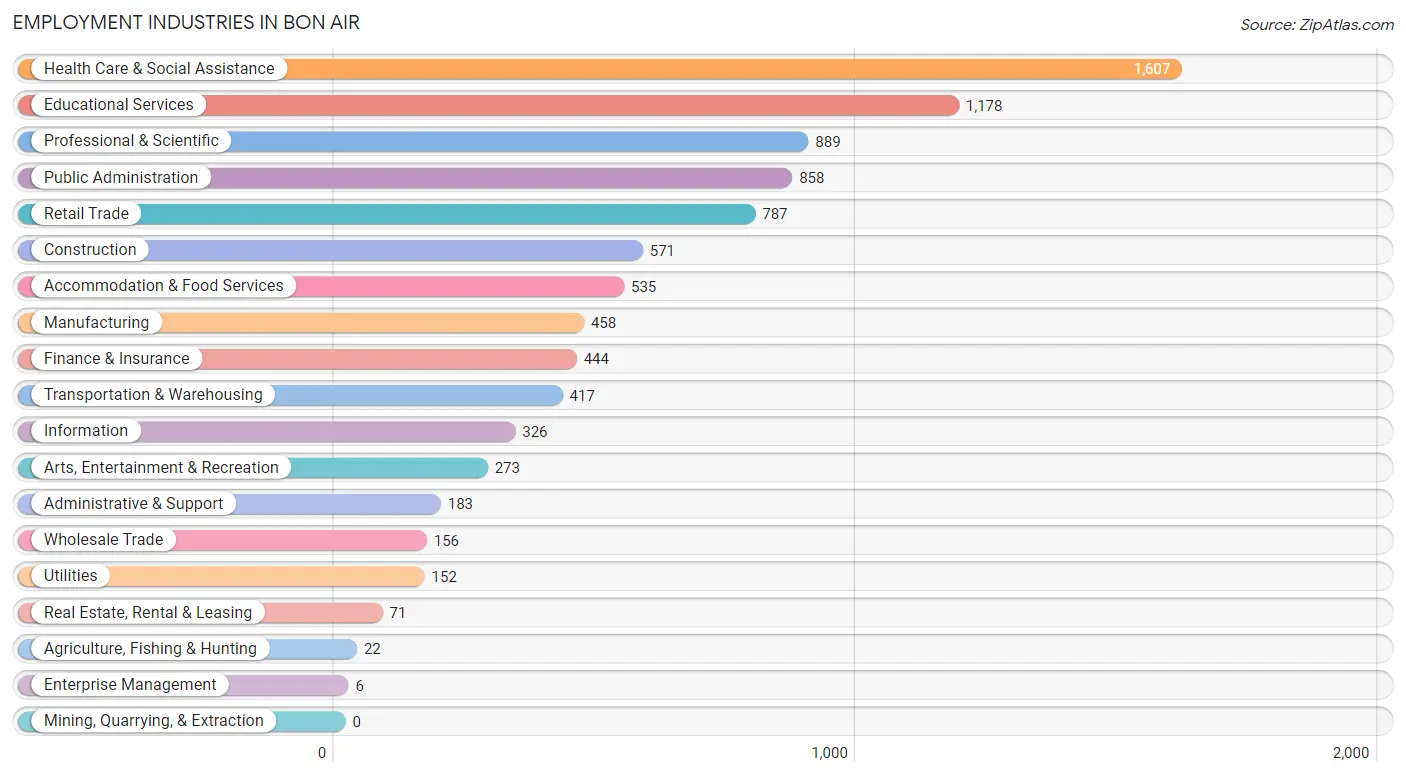
Employment Industries in Bon Air
The major employment industries in Bon Air include Health Care & Social Assistance (1,607 | 17.2%), Educational Services (1,178 | 12.6%), Professional & Scientific (889 | 9.5%), Public Administration (858 | 9.2%), and Retail Trade (787 | 8.4%).
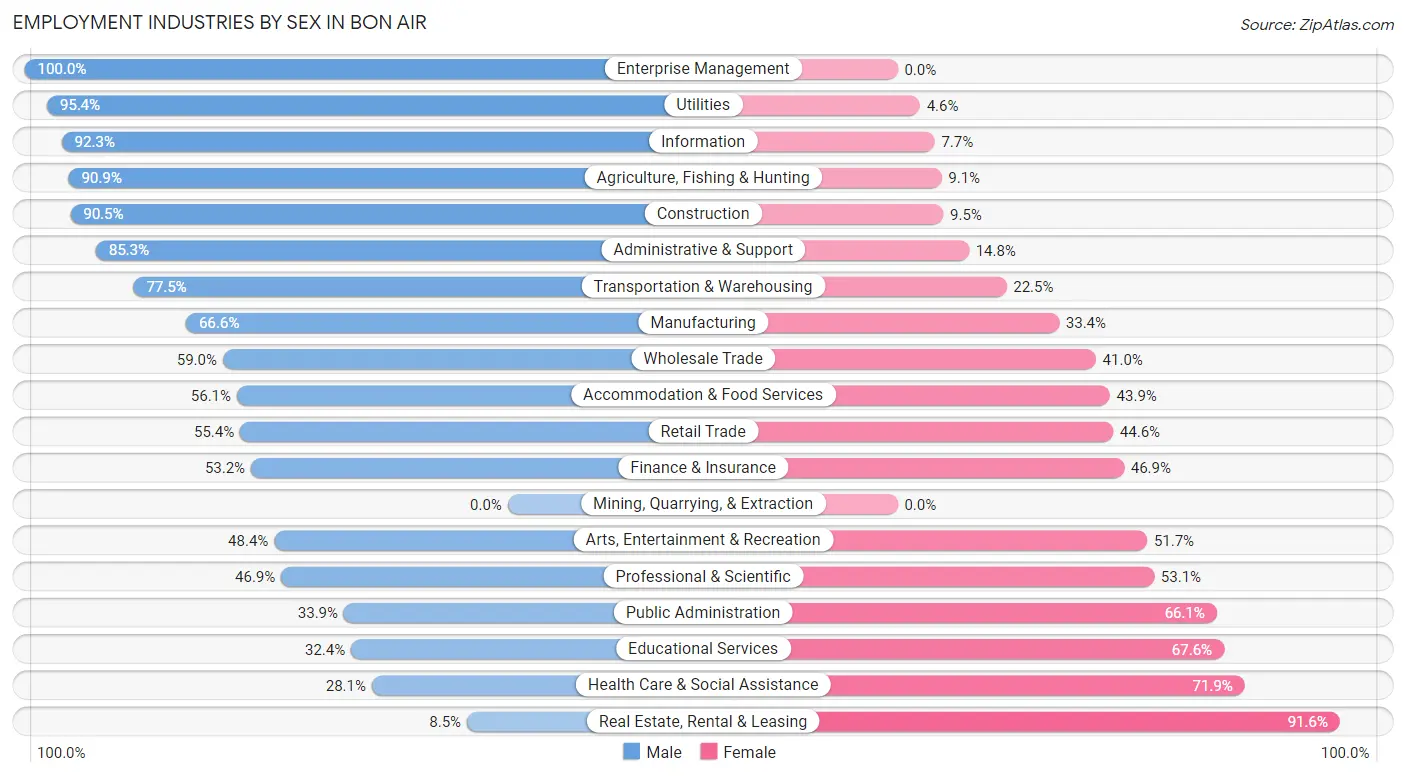
Employment Industries by Sex in Bon Air
The Bon Air industries that see more men than women are Enterprise Management (100.0%), Utilities (95.4%), and Information (92.3%), whereas the industries that tend to have a higher number of women are Real Estate, Rental & Leasing (91.5%), Health Care & Social Assistance (71.9%), and Educational Services (67.6%).
| Industry | Male | Female |
| Agriculture, Fishing & Hunting | 20 (90.9%) | 2 (9.1%) |
| Mining, Quarrying, & Extraction | 0 (0.0%) | 0 (0.0%) |
| Construction | 517 (90.5%) | 54 (9.5%) |
| Manufacturing | 305 (66.6%) | 153 (33.4%) |
| Wholesale Trade | 92 (59.0%) | 64 (41.0%) |
| Retail Trade | 436 (55.4%) | 351 (44.6%) |
| Transportation & Warehousing | 323 (77.5%) | 94 (22.5%) |
| Utilities | 145 (95.4%) | 7 (4.6%) |
| Information | 301 (92.3%) | 25 (7.7%) |
| Finance & Insurance | 236 (53.1%) | 208 (46.9%) |
| Real Estate, Rental & Leasing | 6 (8.5%) | 65 (91.5%) |
| Professional & Scientific | 417 (46.9%) | 472 (53.1%) |
| Enterprise Management | 6 (100.0%) | 0 (0.0%) |
| Administrative & Support | 156 (85.3%) | 27 (14.7%) |
| Educational Services | 382 (32.4%) | 796 (67.6%) |
| Health Care & Social Assistance | 452 (28.1%) | 1,155 (71.9%) |
| Arts, Entertainment & Recreation | 132 (48.3%) | 141 (51.6%) |
| Accommodation & Food Services | 300 (56.1%) | 235 (43.9%) |
| Public Administration | 291 (33.9%) | 567 (66.1%) |
| Total | 4,721 (50.4%) | 4,639 (49.6%) |
Education in Bon Air
School Enrollment in Bon Air
The most common levels of schooling among the 4,235 students in Bon Air are middle school (953 | 22.5%), high school (907 | 21.4%), and college / undergraduate (801 | 18.9%).
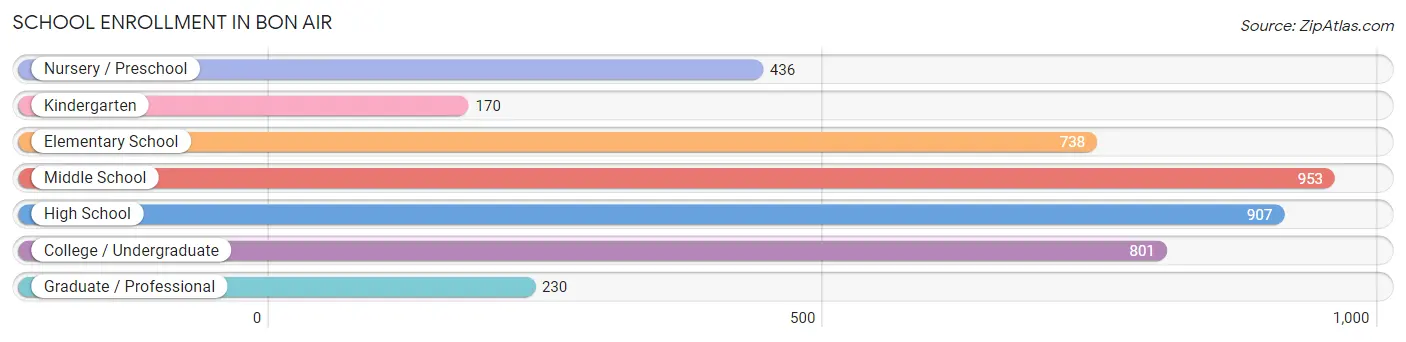
| School Level | # Students | % Students |
| Nursery / Preschool | 436 | 10.3% |
| Kindergarten | 170 | 4.0% |
| Elementary School | 738 | 17.4% |
| Middle School | 953 | 22.5% |
| High School | 907 | 21.4% |
| College / Undergraduate | 801 | 18.9% |
| Graduate / Professional | 230 | 5.4% |
| Total | 4,235 | 100.0% |
School Enrollment by Age by Funding Source in Bon Air
Out of a total of 4,235 students who are enrolled in schools in Bon Air, 1,097 (25.9%) attend a private institution, while the remaining 3,138 (74.1%) are enrolled in public schools. The age group of 3 to 4 year olds has the highest likelihood of being enrolled in private schools, with 244 (84.4% in the age bracket) enrolled. Conversely, the age group of 15 to 17 year olds has the lowest likelihood of being enrolled in a private school, with 640 (87.9% in the age bracket) attending a public institution.
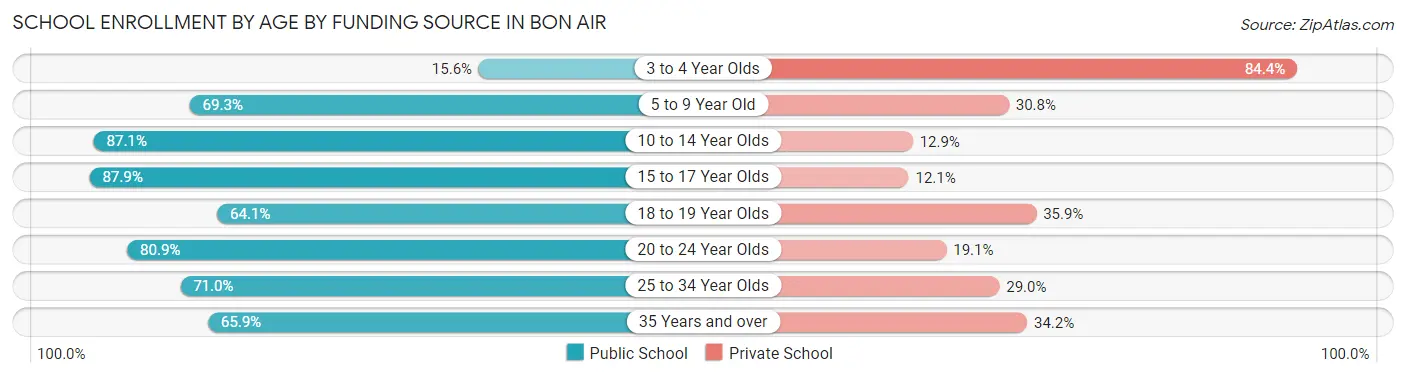
| Age Bracket | Public School | Private School |
| 3 to 4 Year Olds | 45 (15.6%) | 244 (84.4%) |
| 5 to 9 Year Old | 671 (69.3%) | 298 (30.7%) |
| 10 to 14 Year Olds | 935 (87.1%) | 138 (12.9%) |
| 15 to 17 Year Olds | 640 (87.9%) | 88 (12.1%) |
| 18 to 19 Year Olds | 195 (64.1%) | 109 (35.9%) |
| 20 to 24 Year Olds | 347 (80.9%) | 82 (19.1%) |
| 25 to 34 Year Olds | 169 (71.0%) | 69 (29.0%) |
| 35 Years and over | 135 (65.8%) | 70 (34.2%) |
| Total | 3,138 (74.1%) | 1,097 (25.9%) |
Educational Attainment by Field of Study in Bon Air
Business (915 | 11.8%), social sciences (848 | 11.0%), education (751 | 9.7%), science & technology (713 | 9.2%), and visual & performing arts (618 | 8.0%) are the most common fields of study among 7,733 individuals in Bon Air who have obtained a bachelor's degree or higher.
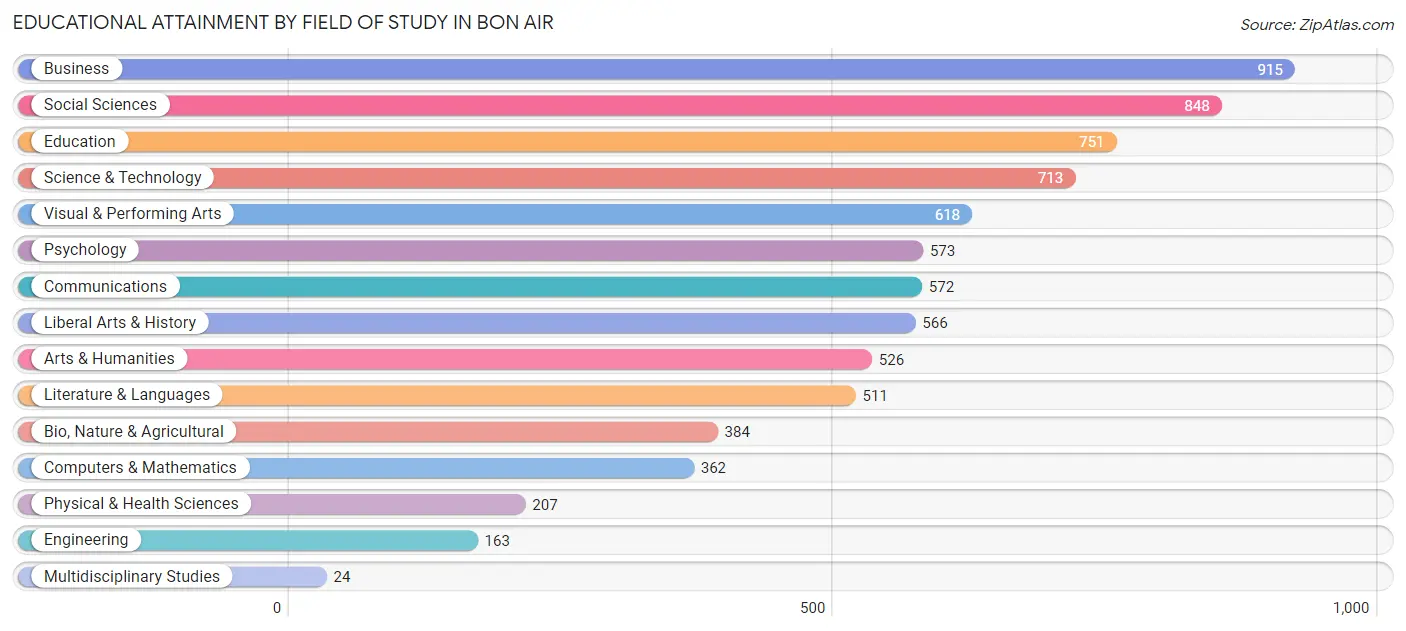
| Field of Study | # Graduates | % Graduates |
| Computers & Mathematics | 362 | 4.7% |
| Bio, Nature & Agricultural | 384 | 5.0% |
| Physical & Health Sciences | 207 | 2.7% |
| Psychology | 573 | 7.4% |
| Social Sciences | 848 | 11.0% |
| Engineering | 163 | 2.1% |
| Multidisciplinary Studies | 24 | 0.3% |
| Science & Technology | 713 | 9.2% |
| Business | 915 | 11.8% |
| Education | 751 | 9.7% |
| Literature & Languages | 511 | 6.6% |
| Liberal Arts & History | 566 | 7.3% |
| Visual & Performing Arts | 618 | 8.0% |
| Communications | 572 | 7.4% |
| Arts & Humanities | 526 | 6.8% |
| Total | 7,733 | 100.0% |
Transportation & Commute in Bon Air
Vehicle Availability by Sex in Bon Air
The most prevalent vehicle ownership categories in Bon Air are males with 2 vehicles (2,117, accounting for 45.0%) and females with 2 vehicles (1,907, making up 46.1%).
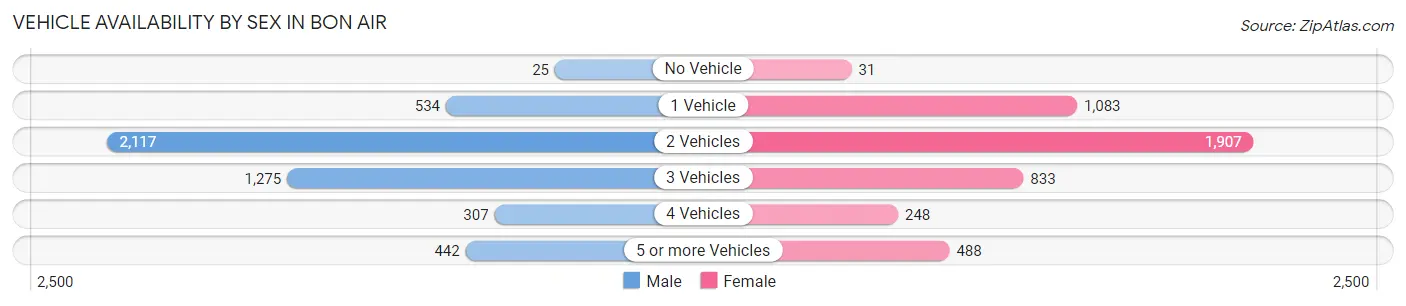
| Vehicles Available | Male | Female |
| No Vehicle | 25 (0.5%) | 31 (0.7%) |
| 1 Vehicle | 534 (11.4%) | 1,083 (23.6%) |
| 2 Vehicles | 2,117 (45.0%) | 1,907 (41.5%) |
| 3 Vehicles | 1,275 (27.1%) | 833 (18.1%) |
| 4 Vehicles | 307 (6.5%) | 248 (5.4%) |
| 5 or more Vehicles | 442 (9.4%) | 488 (10.6%) |
| Total | 4,700 (100.0%) | 4,590 (100.0%) |
Commute Time in Bon Air
The most frequently occuring commute durations in Bon Air are 20 to 24 minutes (2,231 commuters, 28.0%), 15 to 19 minutes (1,128 commuters, 14.2%), and 30 to 34 minutes (1,102 commuters, 13.9%).
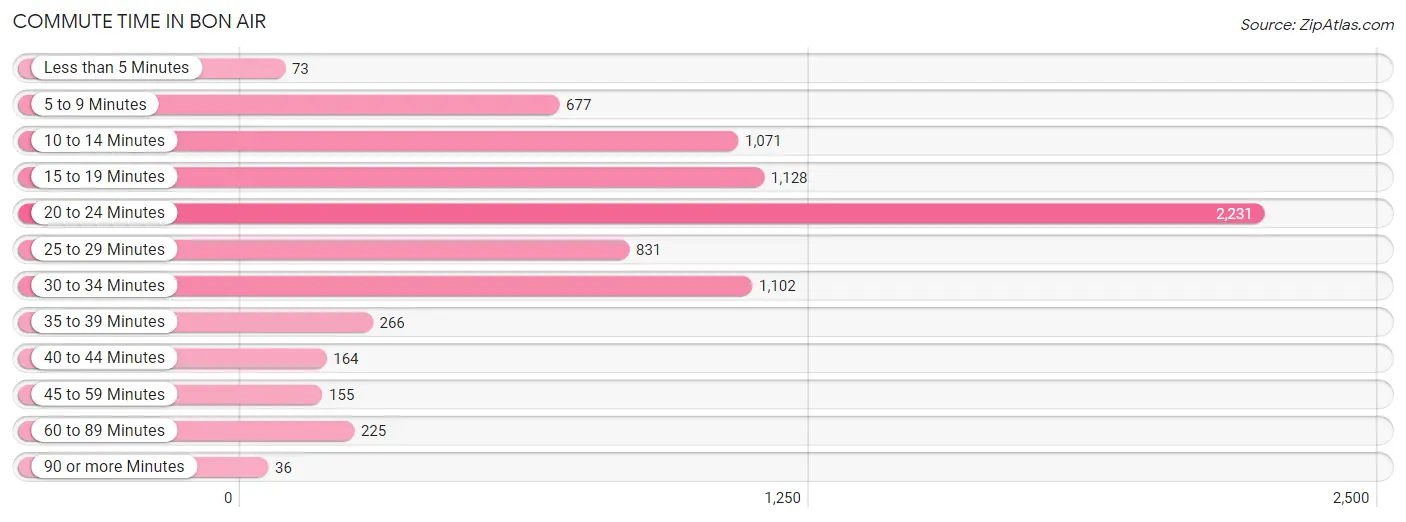
| Commute Time | # Commuters | % Commuters |
| Less than 5 Minutes | 73 | 0.9% |
| 5 to 9 Minutes | 677 | 8.5% |
| 10 to 14 Minutes | 1,071 | 13.5% |
| 15 to 19 Minutes | 1,128 | 14.2% |
| 20 to 24 Minutes | 2,231 | 28.0% |
| 25 to 29 Minutes | 831 | 10.4% |
| 30 to 34 Minutes | 1,102 | 13.9% |
| 35 to 39 Minutes | 266 | 3.3% |
| 40 to 44 Minutes | 164 | 2.1% |
| 45 to 59 Minutes | 155 | 1.9% |
| 60 to 89 Minutes | 225 | 2.8% |
| 90 or more Minutes | 36 | 0.4% |
Commute Time by Sex in Bon Air
The most common commute times in Bon Air are 20 to 24 minutes (977 commuters, 23.8%) for males and 20 to 24 minutes (1,254 commuters, 32.5%) for females.
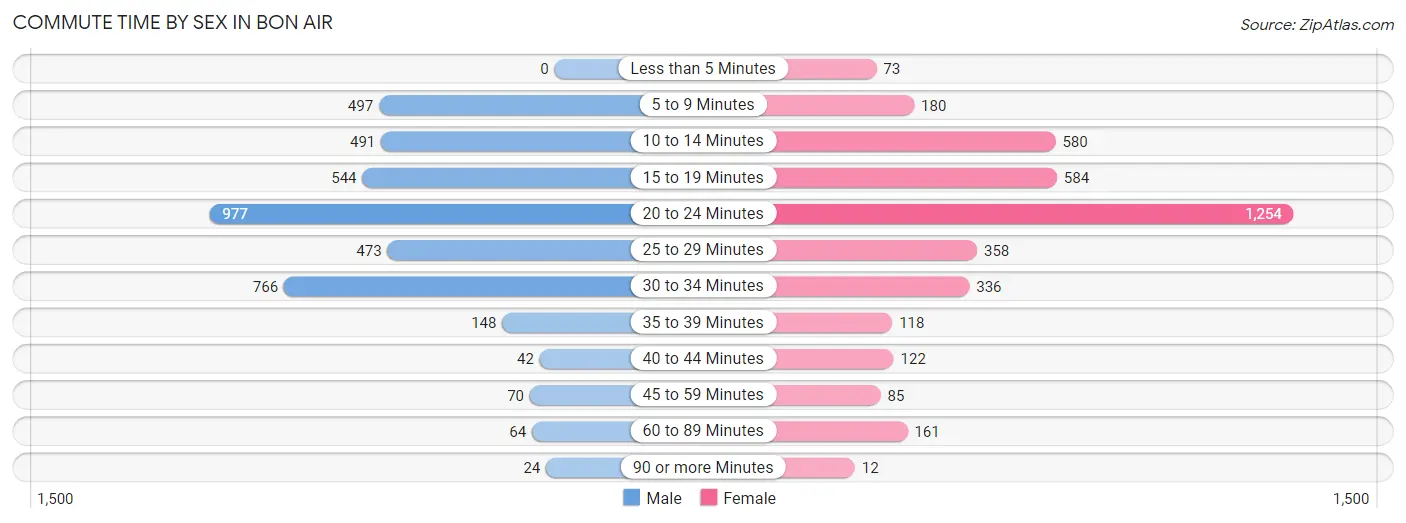
| Commute Time | Male | Female |
| Less than 5 Minutes | 0 (0.0%) | 73 (1.9%) |
| 5 to 9 Minutes | 497 (12.1%) | 180 (4.7%) |
| 10 to 14 Minutes | 491 (12.0%) | 580 (15.0%) |
| 15 to 19 Minutes | 544 (13.3%) | 584 (15.1%) |
| 20 to 24 Minutes | 977 (23.8%) | 1,254 (32.5%) |
| 25 to 29 Minutes | 473 (11.6%) | 358 (9.3%) |
| 30 to 34 Minutes | 766 (18.7%) | 336 (8.7%) |
| 35 to 39 Minutes | 148 (3.6%) | 118 (3.0%) |
| 40 to 44 Minutes | 42 (1.0%) | 122 (3.2%) |
| 45 to 59 Minutes | 70 (1.7%) | 85 (2.2%) |
| 60 to 89 Minutes | 64 (1.6%) | 161 (4.2%) |
| 90 or more Minutes | 24 (0.6%) | 12 (0.3%) |
Time of Departure to Work by Sex in Bon Air
The most frequent times of departure to work in Bon Air are 7:30 AM to 7:59 AM (722, 17.6%) for males and 7:00 AM to 7:29 AM (888, 23.0%) for females.
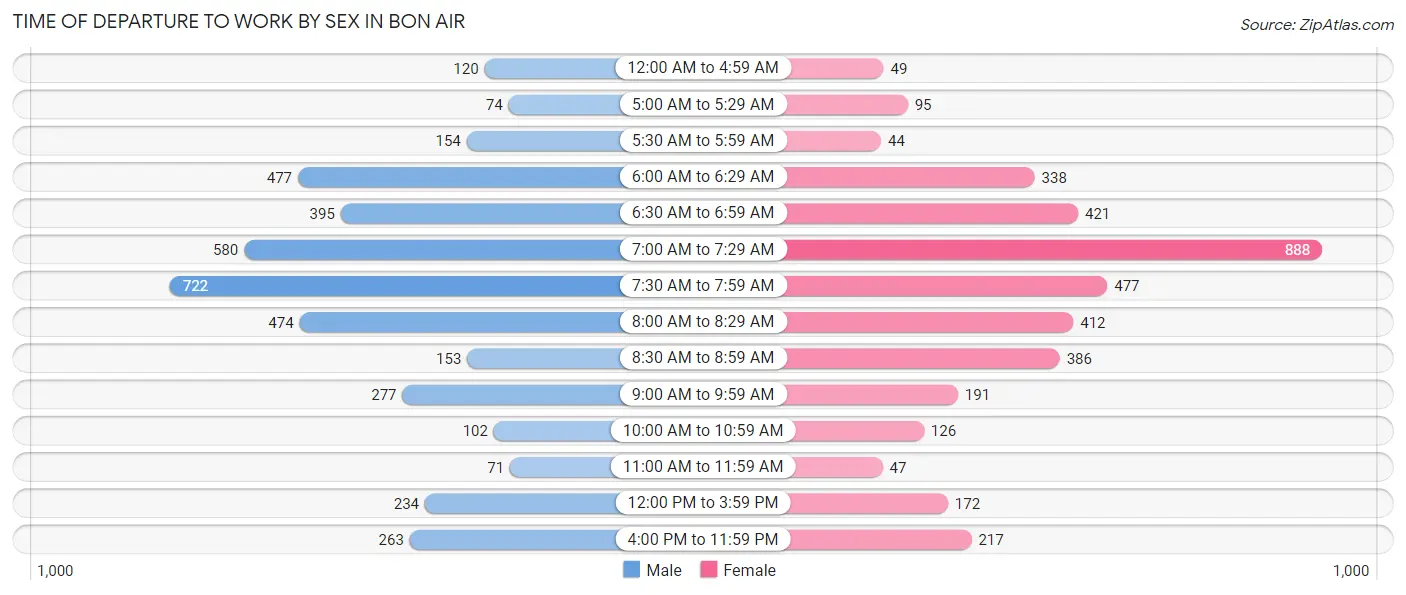
| Time of Departure | Male | Female |
| 12:00 AM to 4:59 AM | 120 (2.9%) | 49 (1.3%) |
| 5:00 AM to 5:29 AM | 74 (1.8%) | 95 (2.5%) |
| 5:30 AM to 5:59 AM | 154 (3.8%) | 44 (1.1%) |
| 6:00 AM to 6:29 AM | 477 (11.7%) | 338 (8.7%) |
| 6:30 AM to 6:59 AM | 395 (9.6%) | 421 (10.9%) |
| 7:00 AM to 7:29 AM | 580 (14.2%) | 888 (23.0%) |
| 7:30 AM to 7:59 AM | 722 (17.6%) | 477 (12.3%) |
| 8:00 AM to 8:29 AM | 474 (11.6%) | 412 (10.7%) |
| 8:30 AM to 8:59 AM | 153 (3.7%) | 386 (10.0%) |
| 9:00 AM to 9:59 AM | 277 (6.8%) | 191 (4.9%) |
| 10:00 AM to 10:59 AM | 102 (2.5%) | 126 (3.3%) |
| 11:00 AM to 11:59 AM | 71 (1.7%) | 47 (1.2%) |
| 12:00 PM to 3:59 PM | 234 (5.7%) | 172 (4.4%) |
| 4:00 PM to 11:59 PM | 263 (6.4%) | 217 (5.6%) |
| Total | 4,096 (100.0%) | 3,863 (100.0%) |
Housing Occupancy in Bon Air
Occupancy by Ownership in Bon Air
Of the total 7,024 dwellings in Bon Air, owner-occupied units account for 5,075 (72.3%), while renter-occupied units make up 1,949 (27.8%).
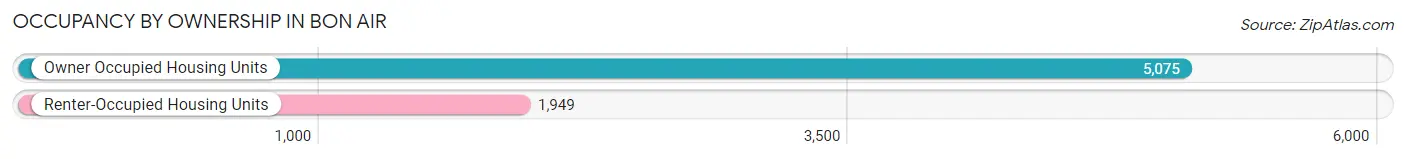
| Occupancy | # Housing Units | % Housing Units |
| Owner Occupied Housing Units | 5,075 | 72.3% |
| Renter-Occupied Housing Units | 1,949 | 27.8% |
| Total Occupied Housing Units | 7,024 | 100.0% |
Occupancy by Household Size in Bon Air
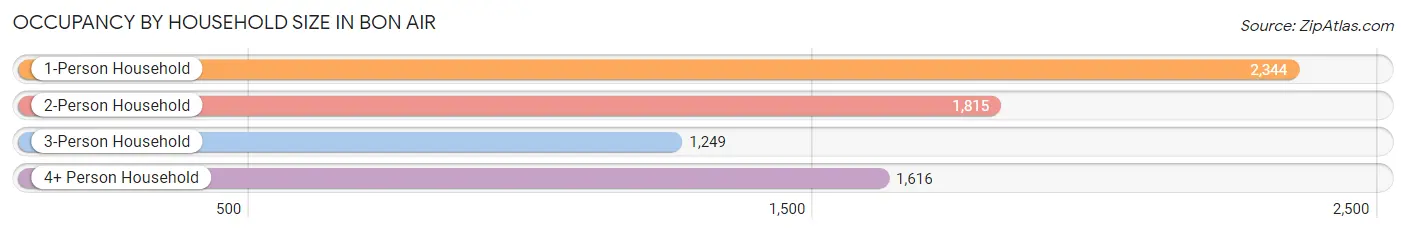
| Household Size | # Housing Units | % Housing Units |
| 1-Person Household | 2,344 | 33.4% |
| 2-Person Household | 1,815 | 25.8% |
| 3-Person Household | 1,249 | 17.8% |
| 4+ Person Household | 1,616 | 23.0% |
| Total Housing Units | 7,024 | 100.0% |
Occupancy by Ownership by Household Size in Bon Air
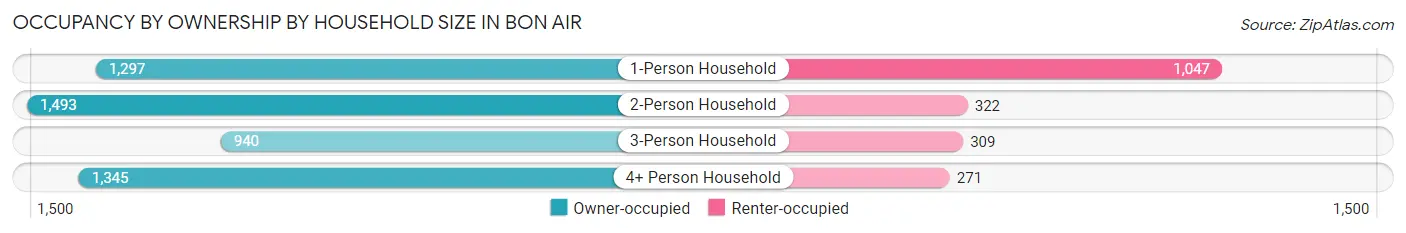
| Household Size | Owner-occupied | Renter-occupied |
| 1-Person Household | 1,297 (55.3%) | 1,047 (44.7%) |
| 2-Person Household | 1,493 (82.3%) | 322 (17.7%) |
| 3-Person Household | 940 (75.3%) | 309 (24.7%) |
| 4+ Person Household | 1,345 (83.2%) | 271 (16.8%) |
| Total Housing Units | 5,075 (72.3%) | 1,949 (27.8%) |
Occupancy by Educational Attainment in Bon Air
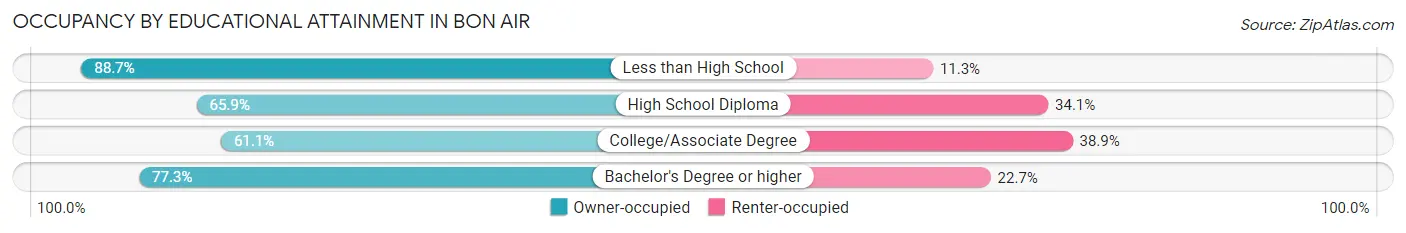
| Household Size | Owner-occupied | Renter-occupied |
| Less than High School | 260 (88.7%) | 33 (11.3%) |
| High School Diploma | 526 (65.9%) | 272 (34.1%) |
| College/Associate Degree | 1,118 (61.1%) | 713 (38.9%) |
| Bachelor's Degree or higher | 3,171 (77.3%) | 931 (22.7%) |
Occupancy by Age of Householder in Bon Air
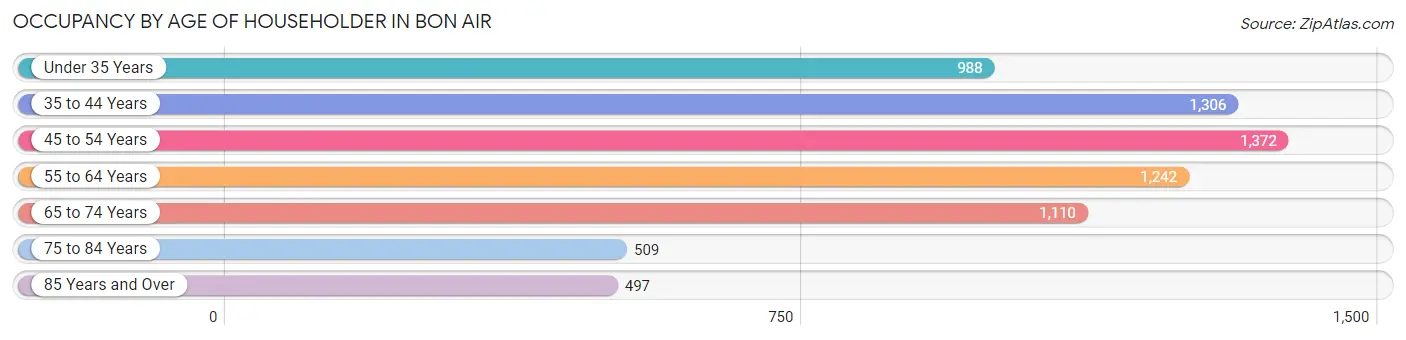
| Age Bracket | # Households | % Households |
| Under 35 Years | 988 | 14.1% |
| 35 to 44 Years | 1,306 | 18.6% |
| 45 to 54 Years | 1,372 | 19.5% |
| 55 to 64 Years | 1,242 | 17.7% |
| 65 to 74 Years | 1,110 | 15.8% |
| 75 to 84 Years | 509 | 7.2% |
| 85 Years and Over | 497 | 7.1% |
| Total | 7,024 | 100.0% |
Housing Finances in Bon Air
Median Income by Occupancy in Bon Air
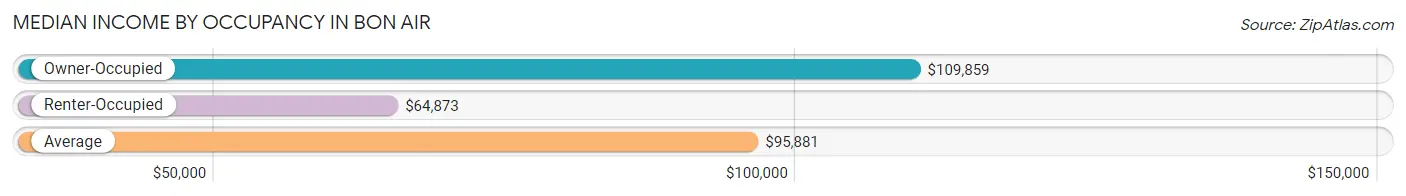
| Occupancy Type | # Households | Median Income |
| Owner-Occupied | 5,075 (72.3%) | $109,859 |
| Renter-Occupied | 1,949 (27.8%) | $64,873 |
| Average | 7,024 (100.0%) | $95,881 |
Occupancy by Householder Income Bracket in Bon Air
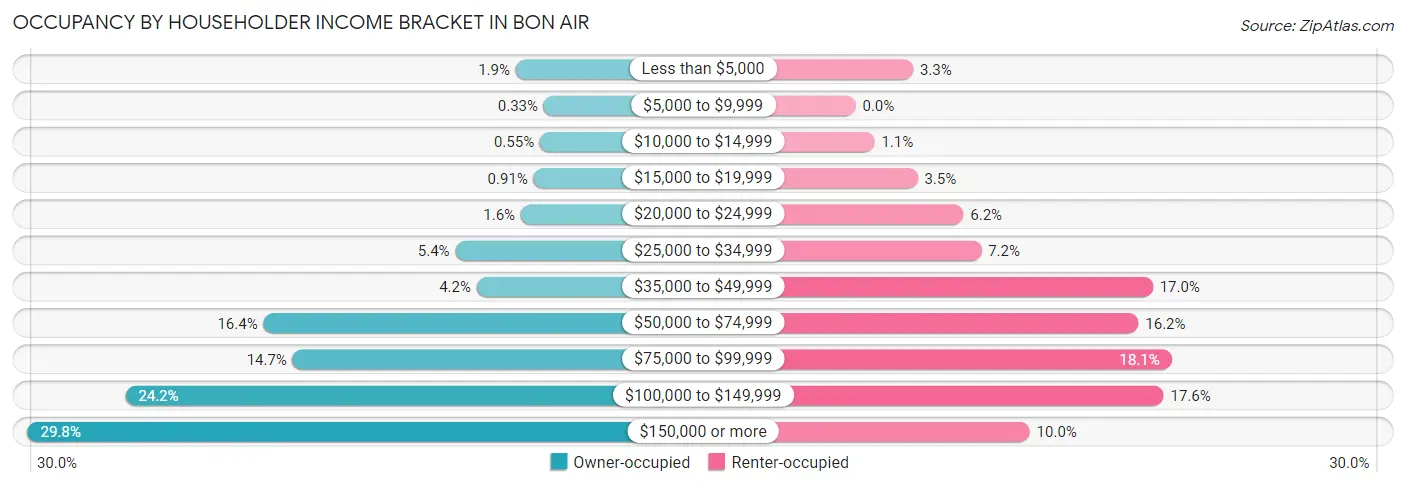
| Income Bracket | Owner-occupied | Renter-occupied |
| Less than $5,000 | 98 (1.9%) | 64 (3.3%) |
| $5,000 to $9,999 | 17 (0.3%) | 0 (0.0%) |
| $10,000 to $14,999 | 28 (0.5%) | 21 (1.1%) |
| $15,000 to $19,999 | 46 (0.9%) | 69 (3.5%) |
| $20,000 to $24,999 | 83 (1.6%) | 120 (6.2%) |
| $25,000 to $34,999 | 273 (5.4%) | 140 (7.2%) |
| $35,000 to $49,999 | 211 (4.2%) | 331 (17.0%) |
| $50,000 to $74,999 | 830 (16.4%) | 315 (16.2%) |
| $75,000 to $99,999 | 745 (14.7%) | 352 (18.1%) |
| $100,000 to $149,999 | 1,230 (24.2%) | 343 (17.6%) |
| $150,000 or more | 1,514 (29.8%) | 194 (10.0%) |
| Total | 5,075 (100.0%) | 1,949 (100.0%) |
Monthly Housing Cost Tiers in Bon Air
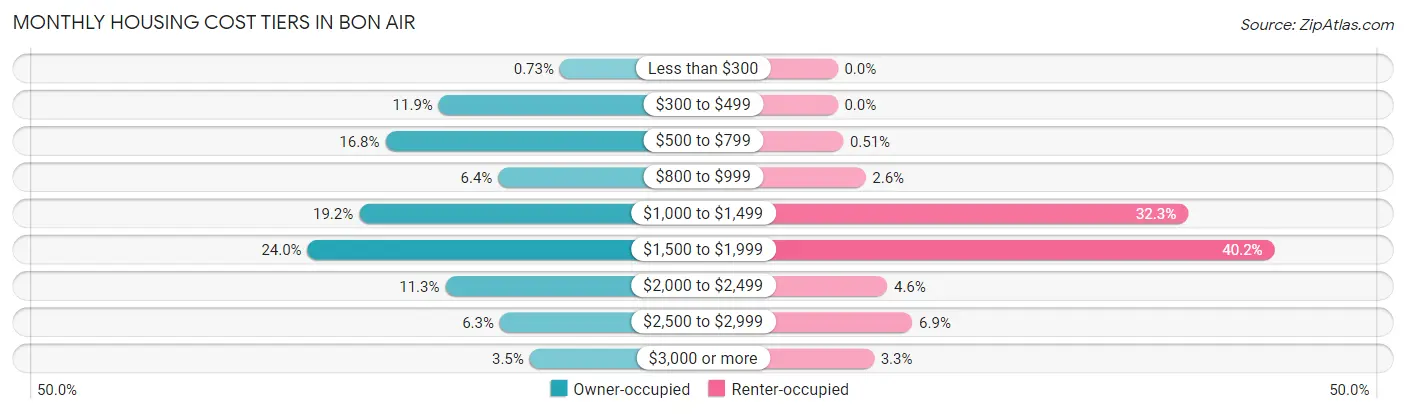
| Monthly Cost | Owner-occupied | Renter-occupied |
| Less than $300 | 37 (0.7%) | 0 (0.0%) |
| $300 to $499 | 603 (11.9%) | 0 (0.0%) |
| $500 to $799 | 852 (16.8%) | 10 (0.5%) |
| $800 to $999 | 325 (6.4%) | 50 (2.6%) |
| $1,000 to $1,499 | 975 (19.2%) | 629 (32.3%) |
| $1,500 to $1,999 | 1,216 (24.0%) | 784 (40.2%) |
| $2,000 to $2,499 | 572 (11.3%) | 89 (4.6%) |
| $2,500 to $2,999 | 317 (6.2%) | 134 (6.9%) |
| $3,000 or more | 178 (3.5%) | 65 (3.3%) |
| Total | 5,075 (100.0%) | 1,949 (100.0%) |
Physical Housing Characteristics in Bon Air
Housing Structures in Bon Air
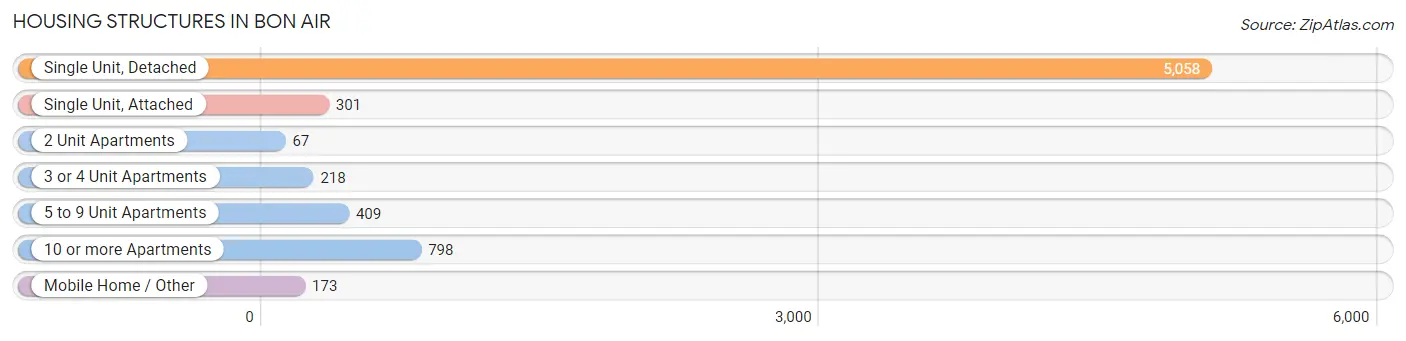
| Structure Type | # Housing Units | % Housing Units |
| Single Unit, Detached | 5,058 | 72.0% |
| Single Unit, Attached | 301 | 4.3% |
| 2 Unit Apartments | 67 | 0.9% |
| 3 or 4 Unit Apartments | 218 | 3.1% |
| 5 to 9 Unit Apartments | 409 | 5.8% |
| 10 or more Apartments | 798 | 11.4% |
| Mobile Home / Other | 173 | 2.5% |
| Total | 7,024 | 100.0% |
Housing Structures by Occupancy in Bon Air
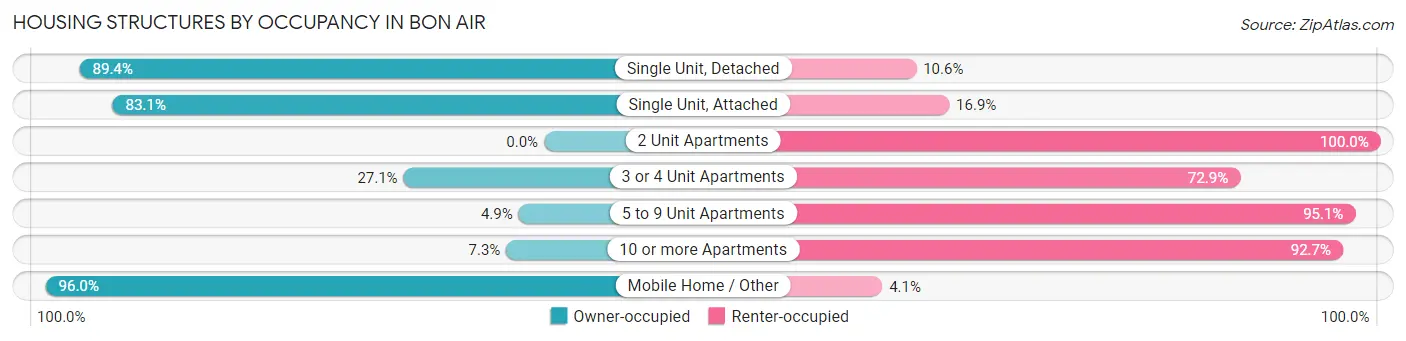
| Structure Type | Owner-occupied | Renter-occupied |
| Single Unit, Detached | 4,522 (89.4%) | 536 (10.6%) |
| Single Unit, Attached | 250 (83.1%) | 51 (16.9%) |
| 2 Unit Apartments | 0 (0.0%) | 67 (100.0%) |
| 3 or 4 Unit Apartments | 59 (27.1%) | 159 (72.9%) |
| 5 to 9 Unit Apartments | 20 (4.9%) | 389 (95.1%) |
| 10 or more Apartments | 58 (7.3%) | 740 (92.7%) |
| Mobile Home / Other | 166 (96.0%) | 7 (4.1%) |
| Total | 5,075 (72.3%) | 1,949 (27.8%) |
Housing Structures by Number of Rooms in Bon Air
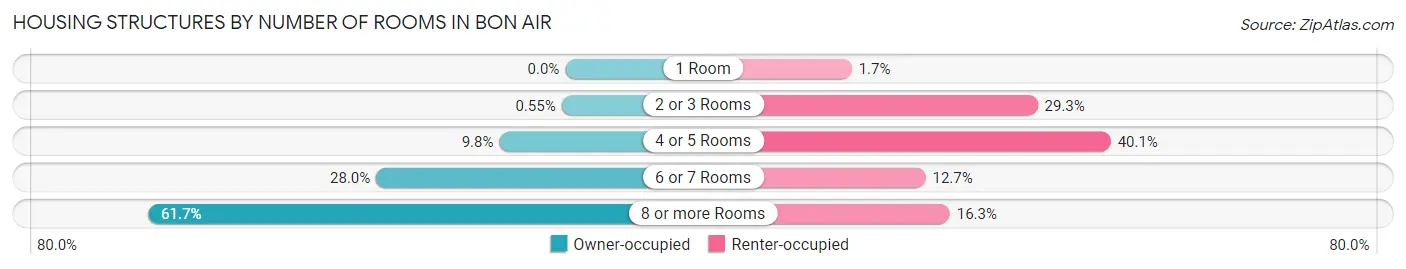
| Number of Rooms | Owner-occupied | Renter-occupied |
| 1 Room | 0 (0.0%) | 34 (1.7%) |
| 2 or 3 Rooms | 28 (0.5%) | 570 (29.2%) |
| 4 or 5 Rooms | 495 (9.8%) | 781 (40.1%) |
| 6 or 7 Rooms | 1,420 (28.0%) | 247 (12.7%) |
| 8 or more Rooms | 3,132 (61.7%) | 317 (16.3%) |
| Total | 5,075 (100.0%) | 1,949 (100.0%) |
Housing Structure by Heating Type in Bon Air
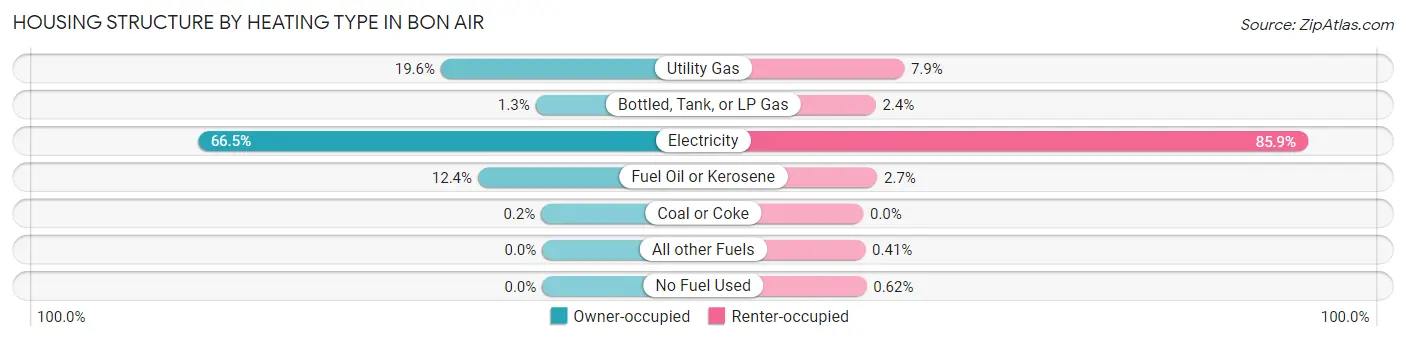
| Heating Type | Owner-occupied | Renter-occupied |
| Utility Gas | 993 (19.6%) | 154 (7.9%) |
| Bottled, Tank, or LP Gas | 65 (1.3%) | 47 (2.4%) |
| Electricity | 3,377 (66.5%) | 1,675 (85.9%) |
| Fuel Oil or Kerosene | 630 (12.4%) | 53 (2.7%) |
| Coal or Coke | 10 (0.2%) | 0 (0.0%) |
| All other Fuels | 0 (0.0%) | 8 (0.4%) |
| No Fuel Used | 0 (0.0%) | 12 (0.6%) |
| Total | 5,075 (100.0%) | 1,949 (100.0%) |
Household Vehicle Usage in Bon Air
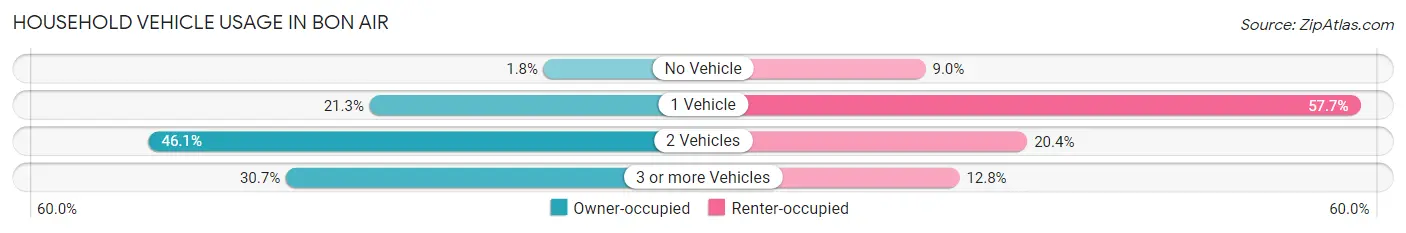
| Vehicles per Household | Owner-occupied | Renter-occupied |
| No Vehicle | 93 (1.8%) | 176 (9.0%) |
| 1 Vehicle | 1,083 (21.3%) | 1,125 (57.7%) |
| 2 Vehicles | 2,340 (46.1%) | 398 (20.4%) |
| 3 or more Vehicles | 1,559 (30.7%) | 250 (12.8%) |
| Total | 5,075 (100.0%) | 1,949 (100.0%) |
Real Estate & Mortgages in Bon Air
Real Estate and Mortgage Overview in Bon Air
| Characteristic | Without Mortgage | With Mortgage |
| Housing Units | 1,564 | 3,511 |
| Median Property Value | $280,100 | $299,500 |
| Median Household Income | $76,419 | $1,251 |
| Monthly Housing Costs | $562 | $165 |
| Real Estate Taxes | $2,460 | $85 |
Property Value by Mortgage Status in Bon Air
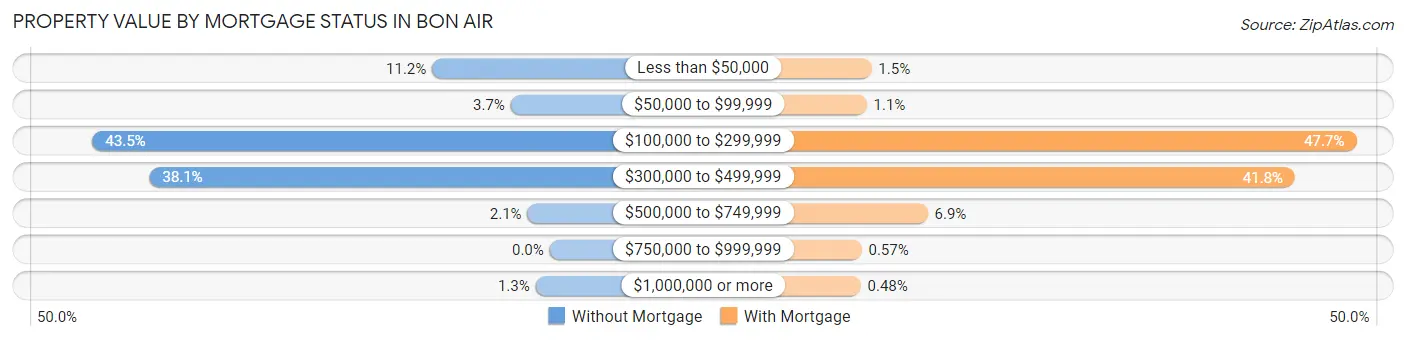
| Property Value | Without Mortgage | With Mortgage |
| Less than $50,000 | 175 (11.2%) | 53 (1.5%) |
| $50,000 to $99,999 | 58 (3.7%) | 37 (1.1%) |
| $100,000 to $299,999 | 681 (43.5%) | 1,674 (47.7%) |
| $300,000 to $499,999 | 596 (38.1%) | 1,469 (41.8%) |
| $500,000 to $749,999 | 33 (2.1%) | 241 (6.9%) |
| $750,000 to $999,999 | 0 (0.0%) | 20 (0.6%) |
| $1,000,000 or more | 21 (1.3%) | 17 (0.5%) |
| Total | 1,564 (100.0%) | 3,511 (100.0%) |
Household Income by Mortgage Status in Bon Air
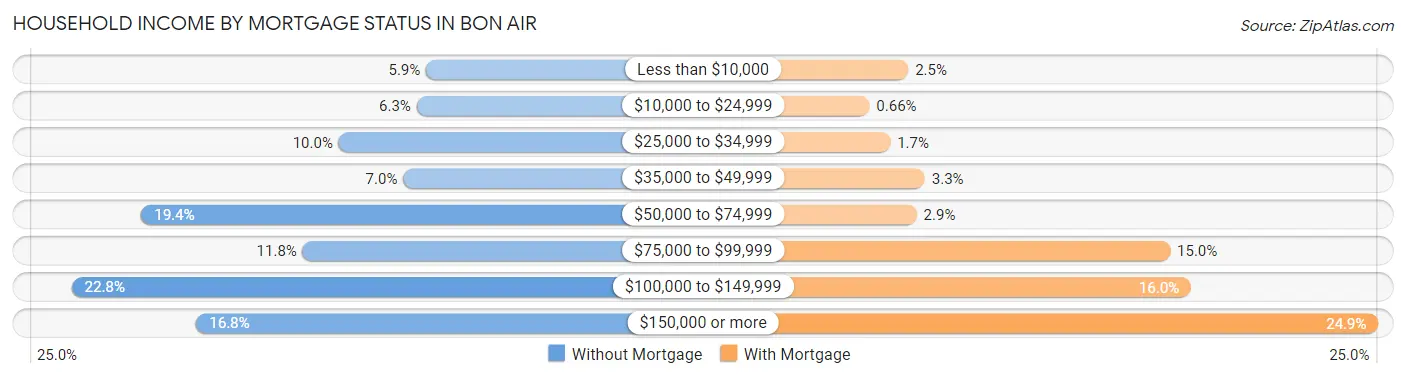
| Household Income | Without Mortgage | With Mortgage |
| Less than $10,000 | 92 (5.9%) | 88 (2.5%) |
| $10,000 to $24,999 | 99 (6.3%) | 23 (0.7%) |
| $25,000 to $34,999 | 157 (10.0%) | 58 (1.7%) |
| $35,000 to $49,999 | 109 (7.0%) | 116 (3.3%) |
| $50,000 to $74,999 | 304 (19.4%) | 102 (2.9%) |
| $75,000 to $99,999 | 184 (11.8%) | 526 (15.0%) |
| $100,000 to $149,999 | 356 (22.8%) | 561 (16.0%) |
| $150,000 or more | 263 (16.8%) | 874 (24.9%) |
| Total | 1,564 (100.0%) | 3,511 (100.0%) |
Property Value to Household Income Ratio in Bon Air
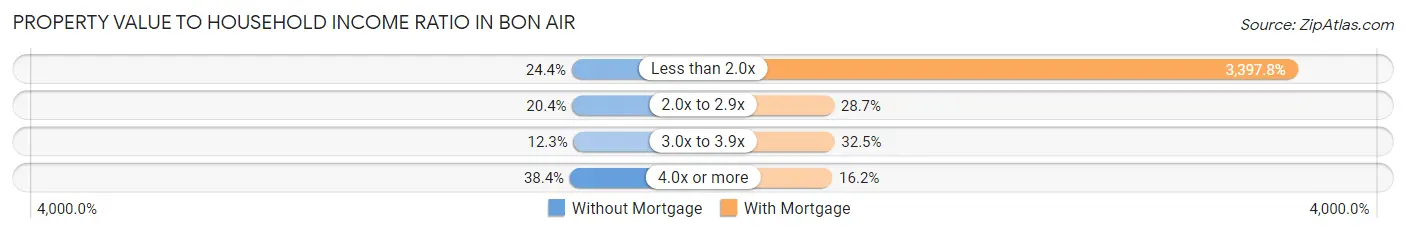
| Value-to-Income Ratio | Without Mortgage | With Mortgage |
| Less than 2.0x | 381 (24.4%) | 119,297 (3,397.8%) |
| 2.0x to 2.9x | 319 (20.4%) | 1,007 (28.7%) |
| 3.0x to 3.9x | 193 (12.3%) | 1,140 (32.5%) |
| 4.0x or more | 600 (38.4%) | 567 (16.2%) |
| Total | 1,564 (100.0%) | 3,511 (100.0%) |
Real Estate Taxes by Mortgage Status in Bon Air
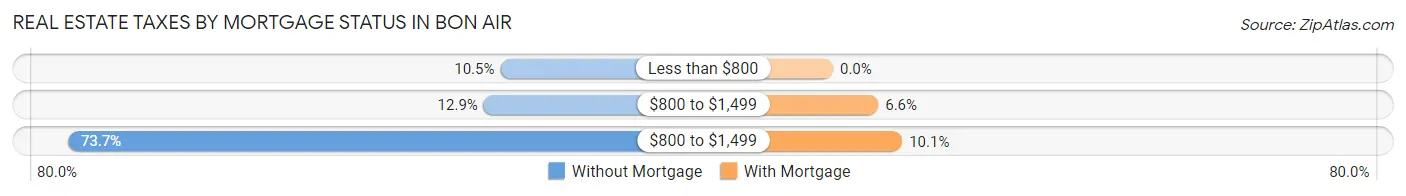
| Property Taxes | Without Mortgage | With Mortgage |
| Less than $800 | 164 (10.5%) | 0 (0.0%) |
| $800 to $1,499 | 202 (12.9%) | 232 (6.6%) |
| $800 to $1,499 | 1,152 (73.7%) | 355 (10.1%) |
| Total | 1,564 (100.0%) | 3,511 (100.0%) |
Health & Disability in Bon Air
Health Insurance Coverage by Age in Bon Air
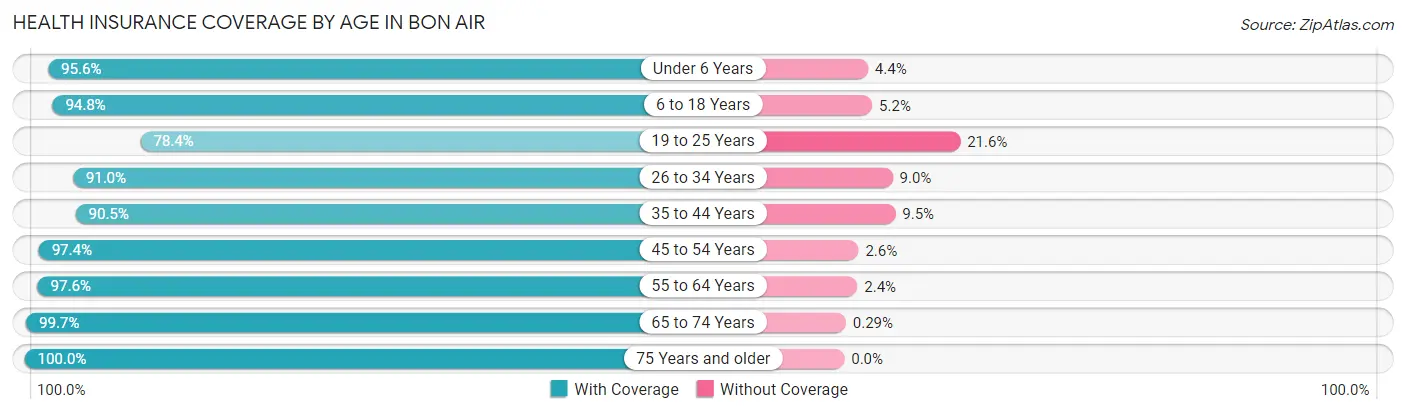
| Age Bracket | With Coverage | Without Coverage |
| Under 6 Years | 1,064 (95.6%) | 49 (4.4%) |
| 6 to 18 Years | 2,496 (94.8%) | 137 (5.2%) |
| 19 to 25 Years | 994 (78.4%) | 274 (21.6%) |
| 26 to 34 Years | 1,637 (91.0%) | 162 (9.0%) |
| 35 to 44 Years | 2,413 (90.5%) | 254 (9.5%) |
| 45 to 54 Years | 2,215 (97.4%) | 60 (2.6%) |
| 55 to 64 Years | 2,156 (97.6%) | 54 (2.4%) |
| 65 to 74 Years | 1,706 (99.7%) | 5 (0.3%) |
| 75 Years and older | 1,396 (100.0%) | 0 (0.0%) |
| Total | 16,077 (94.2%) | 995 (5.8%) |
Health Insurance Coverage by Citizenship Status in Bon Air
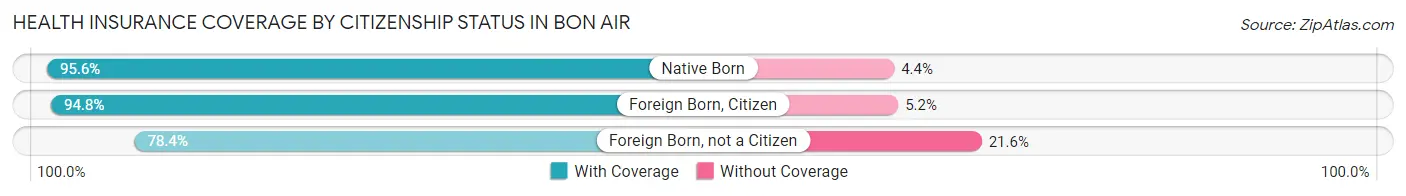
| Citizenship Status | With Coverage | Without Coverage |
| Native Born | 1,064 (95.6%) | 49 (4.4%) |
| Foreign Born, Citizen | 2,496 (94.8%) | 137 (5.2%) |
| Foreign Born, not a Citizen | 994 (78.4%) | 274 (21.6%) |
Health Insurance Coverage by Household Income in Bon Air
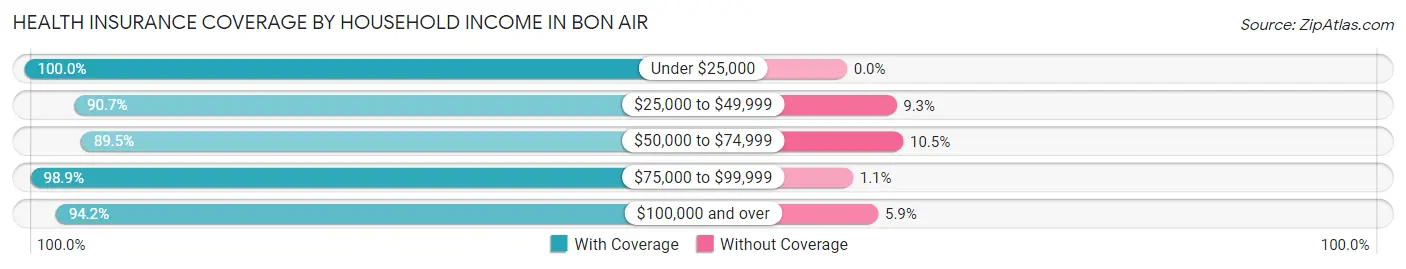
| Household Income | With Coverage | Without Coverage |
| Under $25,000 | 894 (100.0%) | 0 (0.0%) |
| $25,000 to $49,999 | 1,389 (90.7%) | 142 (9.3%) |
| $50,000 to $74,999 | 2,157 (89.5%) | 254 (10.5%) |
| $75,000 to $99,999 | 2,461 (98.9%) | 28 (1.1%) |
| $100,000 and over | 9,153 (94.2%) | 569 (5.9%) |
Public vs Private Health Insurance Coverage by Age in Bon Air
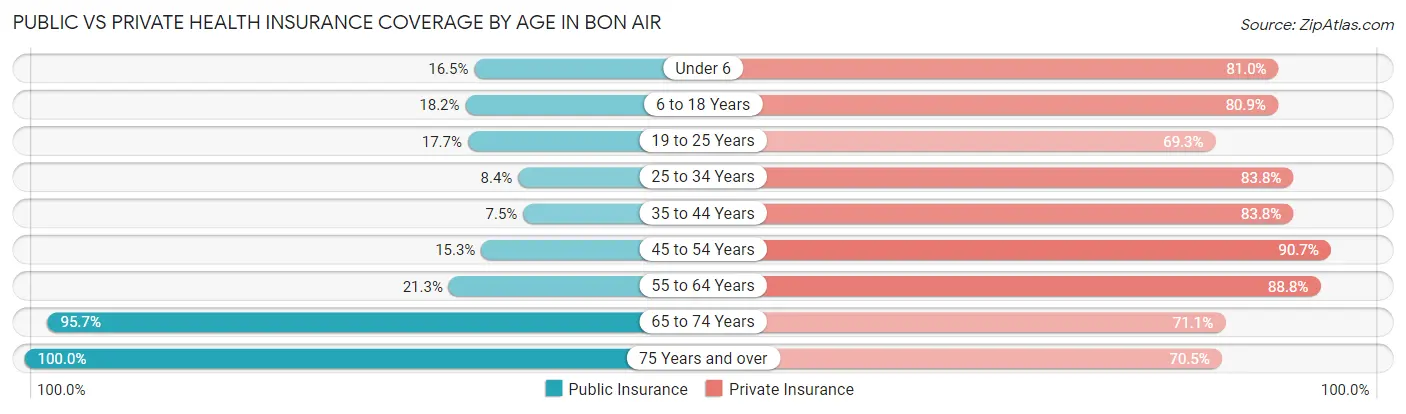
| Age Bracket | Public Insurance | Private Insurance |
| Under 6 | 184 (16.5%) | 902 (81.0%) |
| 6 to 18 Years | 479 (18.2%) | 2,130 (80.9%) |
| 19 to 25 Years | 225 (17.7%) | 879 (69.3%) |
| 25 to 34 Years | 151 (8.4%) | 1,507 (83.8%) |
| 35 to 44 Years | 199 (7.5%) | 2,234 (83.8%) |
| 45 to 54 Years | 347 (15.2%) | 2,064 (90.7%) |
| 55 to 64 Years | 470 (21.3%) | 1,962 (88.8%) |
| 65 to 74 Years | 1,638 (95.7%) | 1,217 (71.1%) |
| 75 Years and over | 1,396 (100.0%) | 984 (70.5%) |
| Total | 5,089 (29.8%) | 13,879 (81.3%) |
Disability Status by Sex by Age in Bon Air
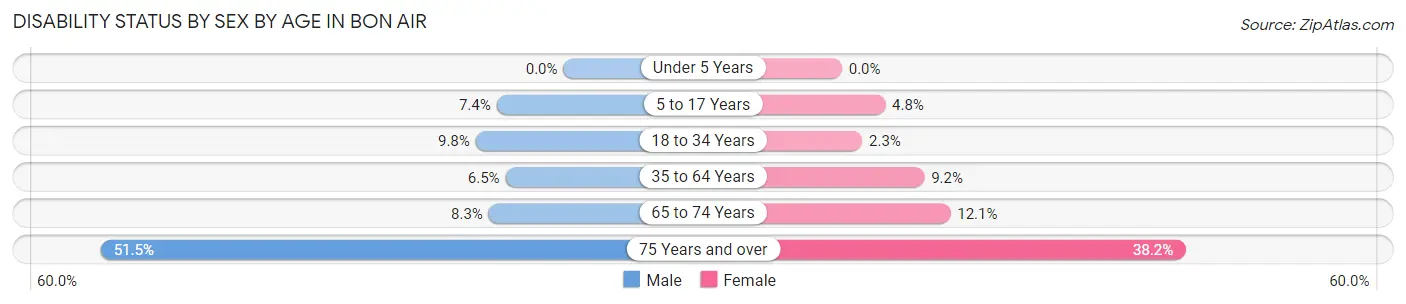
| Age Bracket | Male | Female |
| Under 5 Years | 0 (0.0%) | 0 (0.0%) |
| 5 to 17 Years | 108 (7.4%) | 66 (4.8%) |
| 18 to 34 Years | 149 (9.8%) | 37 (2.3%) |
| 35 to 64 Years | 226 (6.5%) | 335 (9.2%) |
| 65 to 74 Years | 59 (8.3%) | 121 (12.1%) |
| 75 Years and over | 288 (51.5%) | 320 (38.2%) |
Disability Class by Sex by Age in Bon Air
Disability Class: Hearing Difficulty
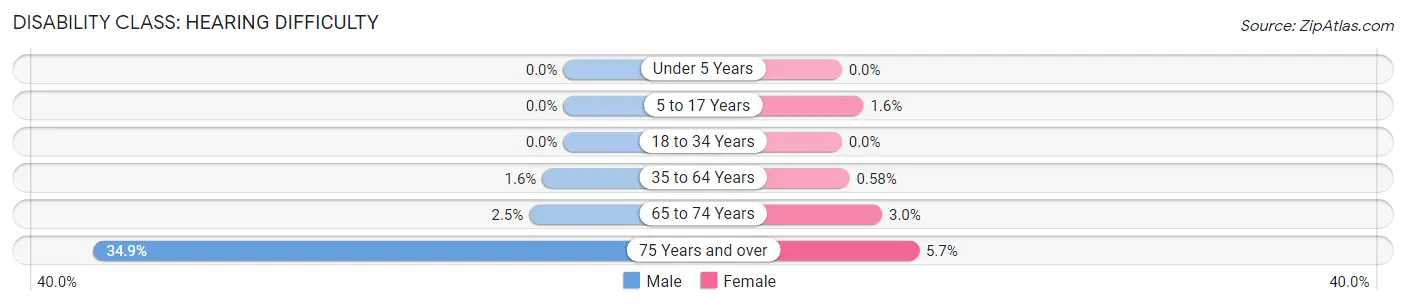
| Age Bracket | Male | Female |
| Under 5 Years | 0 (0.0%) | 0 (0.0%) |
| 5 to 17 Years | 0 (0.0%) | 22 (1.6%) |
| 18 to 34 Years | 0 (0.0%) | 0 (0.0%) |
| 35 to 64 Years | 55 (1.6%) | 21 (0.6%) |
| 65 to 74 Years | 18 (2.5%) | 30 (3.0%) |
| 75 Years and over | 195 (34.9%) | 48 (5.7%) |
Disability Class: Vision Difficulty
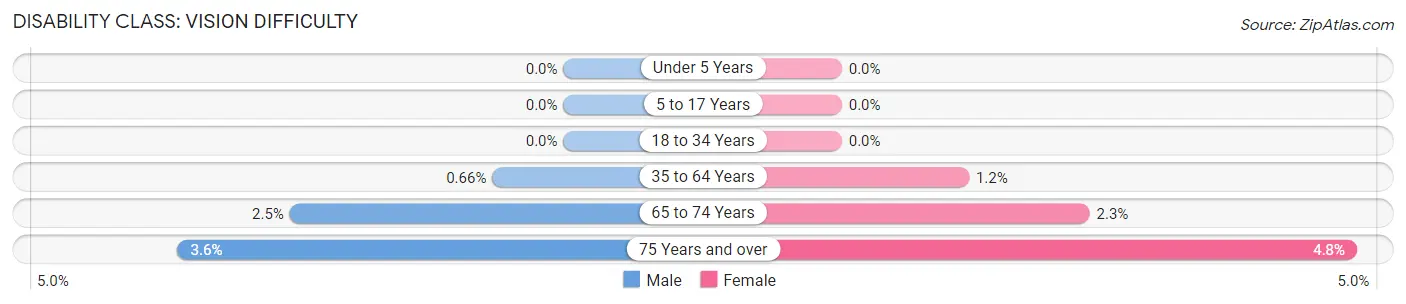
| Age Bracket | Male | Female |
| Under 5 Years | 0 (0.0%) | 0 (0.0%) |
| 5 to 17 Years | 0 (0.0%) | 0 (0.0%) |
| 18 to 34 Years | 0 (0.0%) | 0 (0.0%) |
| 35 to 64 Years | 23 (0.7%) | 43 (1.2%) |
| 65 to 74 Years | 18 (2.5%) | 23 (2.3%) |
| 75 Years and over | 20 (3.6%) | 40 (4.8%) |
Disability Class: Cognitive Difficulty
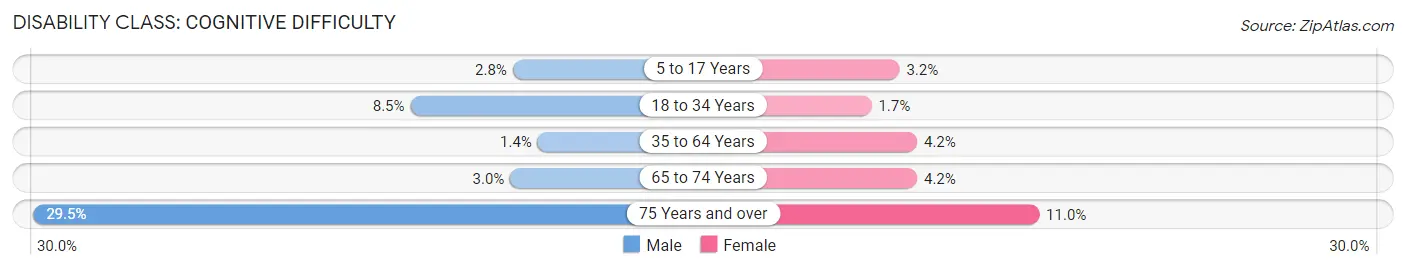
| Age Bracket | Male | Female |
| 5 to 17 Years | 41 (2.8%) | 44 (3.2%) |
| 18 to 34 Years | 130 (8.5%) | 27 (1.7%) |
| 35 to 64 Years | 50 (1.4%) | 153 (4.2%) |
| 65 to 74 Years | 21 (3.0%) | 42 (4.2%) |
| 75 Years and over | 165 (29.5%) | 92 (11.0%) |
Disability Class: Ambulatory Difficulty
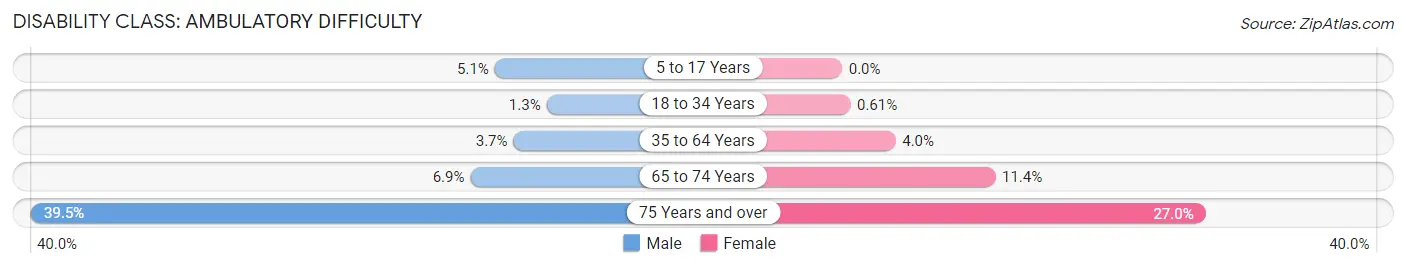
| Age Bracket | Male | Female |
| 5 to 17 Years | 74 (5.1%) | 0 (0.0%) |
| 18 to 34 Years | 19 (1.3%) | 10 (0.6%) |
| 35 to 64 Years | 130 (3.7%) | 145 (4.0%) |
| 65 to 74 Years | 49 (6.9%) | 114 (11.4%) |
| 75 Years and over | 221 (39.5%) | 226 (27.0%) |
Disability Class: Self-Care Difficulty
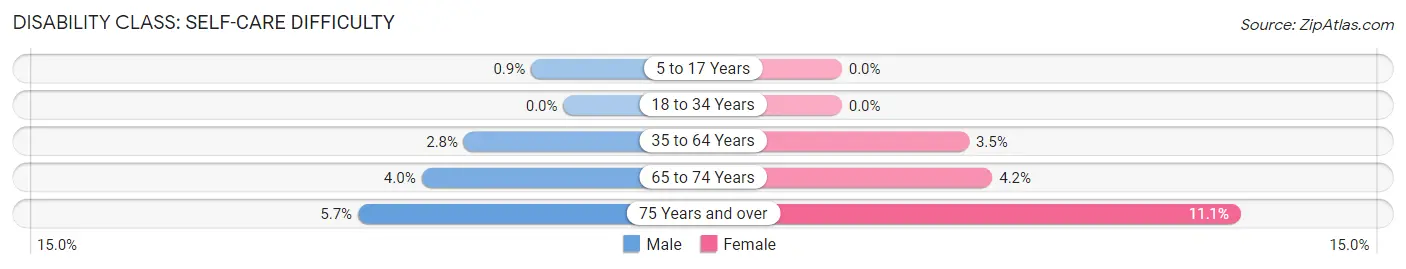
| Age Bracket | Male | Female |
| 5 to 17 Years | 13 (0.9%) | 0 (0.0%) |
| 18 to 34 Years | 0 (0.0%) | 0 (0.0%) |
| 35 to 64 Years | 97 (2.8%) | 129 (3.5%) |
| 65 to 74 Years | 28 (4.0%) | 42 (4.2%) |
| 75 Years and over | 32 (5.7%) | 93 (11.1%) |
Technology Access in Bon Air
Computing Device Access in Bon Air
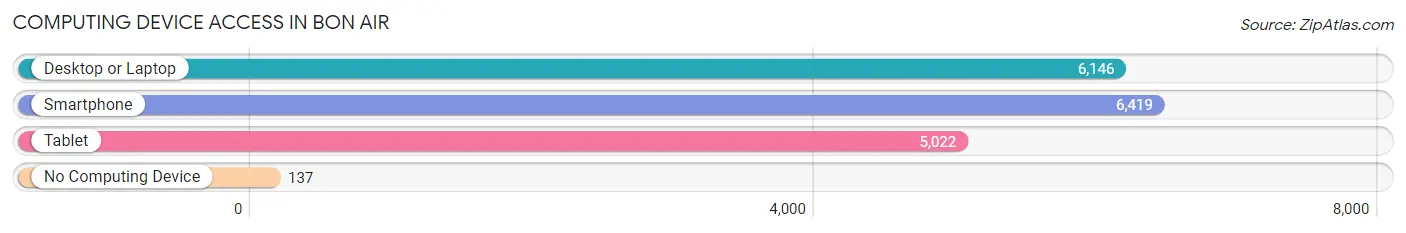
| Device Type | # Households | % Households |
| Desktop or Laptop | 6,146 | 87.5% |
| Smartphone | 6,419 | 91.4% |
| Tablet | 5,022 | 71.5% |
| No Computing Device | 137 | 1.9% |
| Total | 7,024 | 100.0% |
Internet Access in Bon Air
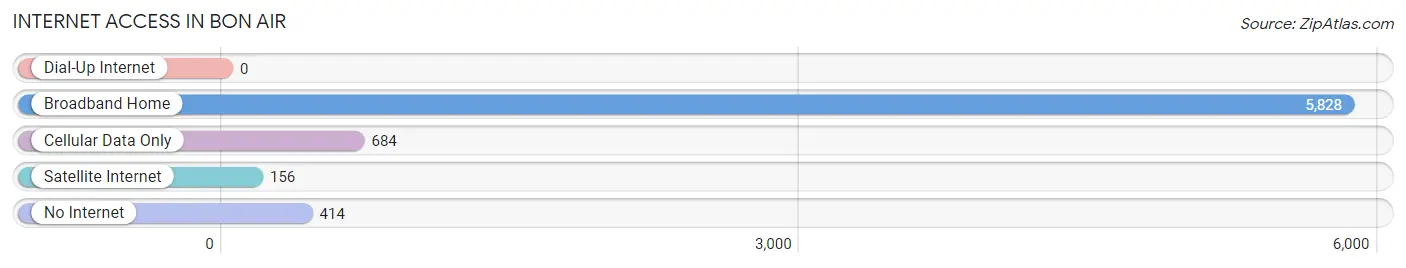
| Internet Type | # Households | % Households |
| Dial-Up Internet | 0 | 0.0% |
| Broadband Home | 5,828 | 83.0% |
| Cellular Data Only | 684 | 9.7% |
| Satellite Internet | 156 | 2.2% |
| No Internet | 414 | 5.9% |
| Total | 7,024 | 100.0% |
Bon Air Summary
History
The area now known as Bon Air, Virginia was first settled in the early 19th century by a small group of farmers. The area was originally known as "Bon Aire" and was named after the French phrase meaning "good air". The area was largely rural until the late 19th century when the Richmond and Danville Railroad was built through the area. This allowed for the development of a small village, which was incorporated as the Town of Bon Air in 1891.
The town grew slowly over the next few decades, but experienced a period of rapid growth in the early 20th century. This growth was largely due to the development of the nearby Richmond-Petersburg Turnpike, which allowed for easy access to the city of Richmond. The town also benefited from the development of the Richmond-Washington Airline, which provided air service to the area.
The town continued to grow throughout the 20th century, and by the year 2000, it had a population of over 10,000 people. The town has since continued to grow, and as of 2019, it has a population of over 12,000 people.
Geography
Bon Air is located in the central part of the state of Virginia, in the Richmond metropolitan area. The town is situated in the Piedmont region of the state, and is bordered by the cities of Richmond and Petersburg to the north, and the counties of Chesterfield and Henrico to the south. The town is located on the banks of the James River, and is approximately 10 miles from downtown Richmond.
The town has a total area of 4.2 square miles, of which 0.2 square miles is water. The terrain of the town is mostly flat, with some rolling hills in the northern part of the town. The town is located in a humid subtropical climate zone, and experiences hot, humid summers and mild winters.
Economy
Bon Air is a primarily residential community, and the majority of its economy is based on the service industry. The town is home to a variety of retail stores, restaurants, and other businesses. The town is also home to a number of corporate offices, including those of Capital One, Dominion Energy, and Genworth Financial.
The town is also home to a number of manufacturing companies, including the Bon Air Manufacturing Company, which produces a variety of products, including furniture, mattresses, and bedding. The town is also home to a number of medical facilities, including Bon Air Medical Center and Bon Air Surgery Center.
Demographics
As of the 2010 census, the population of Bon Air was 10,845. The racial makeup of the town was 79.3% White, 14.2% African American, 0.4% Native American, 2.2% Asian, 0.1% Pacific Islander, 1.7% from other races, and 2.1% from two or more races. Hispanic or Latino of any race were 4.2% of the population.
The median household income in Bon Air was $63,945, and the median family income was $76,945. The per capita income for the town was $30,945. About 5.3% of families and 7.2% of the population were below the poverty line, including 8.3% of those under age 18 and 5.2% of those age 65 or over.
Common Questions
What is Per Capita Income in Bon Air?
Per Capita income in Bon Air is $44,795.
What is the Median Family Income in Bon Air?
Median Family Income in Bon Air is $121,127.
What is the Median Household income in Bon Air?
Median Household Income in Bon Air is $95,881.
What is Income or Wage Gap in Bon Air?
Income or Wage Gap in Bon Air is 13.3%.
Women in Bon Air earn 86.7 cents for every dollar earned by a man.
What is Inequality or Gini Index in Bon Air?
Inequality or Gini Index in Bon Air is 0.37.
What is the Total Population of Bon Air?
Total Population of Bon Air is 17,452.
What is the Total Male Population of Bon Air?
Total Male Population of Bon Air is 8,350.
What is the Total Female Population of Bon Air?
Total Female Population of Bon Air is 9,102.
What is the Ratio of Males per 100 Females in Bon Air?
There are 91.74 Males per 100 Females in Bon Air.
What is the Ratio of Females per 100 Males in Bon Air?
There are 109.01 Females per 100 Males in Bon Air.
What is the Median Population Age in Bon Air?
Median Population Age in Bon Air is 42.2 Years.
What is the Average Family Size in Bon Air
Average Family Size in Bon Air is 3.1 People.
What is the Average Household Size in Bon Air
Average Household Size in Bon Air is 2.4 People.
How Large is the Labor Force in Bon Air?
There are 9,821 People in the Labor Forcein in Bon Air.
What is the Percentage of People in the Labor Force in Bon Air?
68.9% of People are in the Labor Force in Bon Air.
What is the Unemployment Rate in Bon Air?
Unemployment Rate in Bon Air is 4.4%.