Franconia, VA Map & Demographics
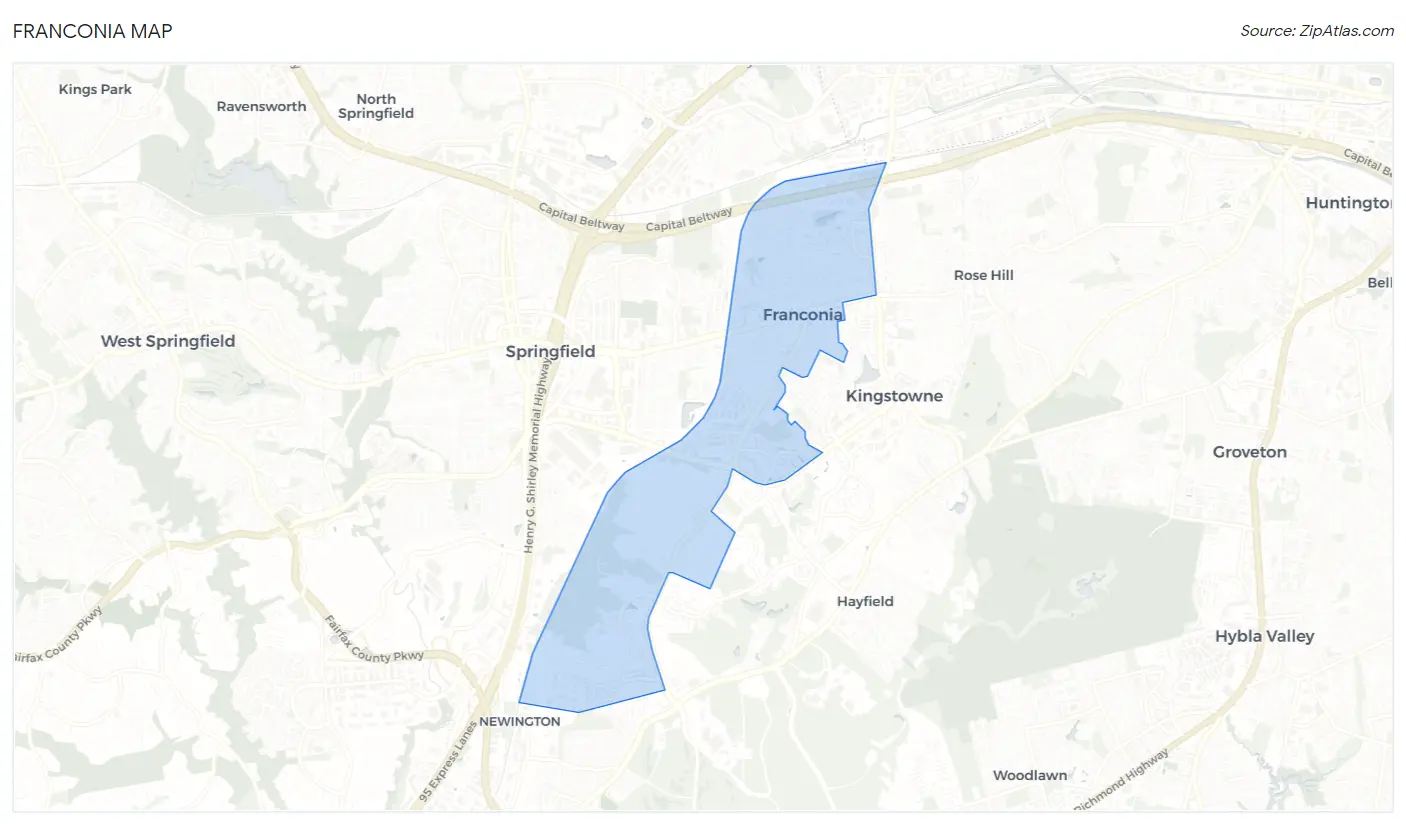
Franconia Map
Franconia Overview
$71,861
PER CAPITA INCOME
$172,264
AVG FAMILY INCOME
$143,322
AVG HOUSEHOLD INCOME
14.2%
WAGE / INCOME GAP [ % ]
85.8¢/ $1
WAGE / INCOME GAP [ $ ]
0.35
INEQUALITY / GINI INDEX
17,906
TOTAL POPULATION
9,051
MALE POPULATION
8,855
FEMALE POPULATION
102.21
MALES / 100 FEMALES
97.83
FEMALES / 100 MALES
40.4
MEDIAN AGE
3.1
AVG FAMILY SIZE
2.4
AVG HOUSEHOLD SIZE
11,849
LABOR FORCE [ PEOPLE ]
78.3%
PERCENT IN LABOR FORCE
2.7%
UNEMPLOYMENT RATE
Franconia Area Codes
Income in Franconia
Income Overview in Franconia
Per Capita Income in Franconia is $71,861, while median incomes of families and households are $172,264 and $143,322 respectively.
| Characteristic | Number | Measure |
| Per Capita Income | 17,906 | $71,861 |
| Median Family Income | 4,499 | $172,264 |
| Mean Family Income | 4,499 | $189,520 |
| Median Household Income | 7,456 | $143,322 |
| Mean Household Income | 7,456 | $169,141 |
| Income Deficit | 4,499 | $0 |
| Wage / Income Gap (%) | 17,906 | 14.22% |
| Wage / Income Gap ($) | 17,906 | 85.78¢ per $1 |
| Gini / Inequality Index | 17,906 | 0.35 |
Earnings by Sex in Franconia
Average Earnings in Franconia are $81,420, $90,875 for men and $77,953 for women, a difference of 14.2%.
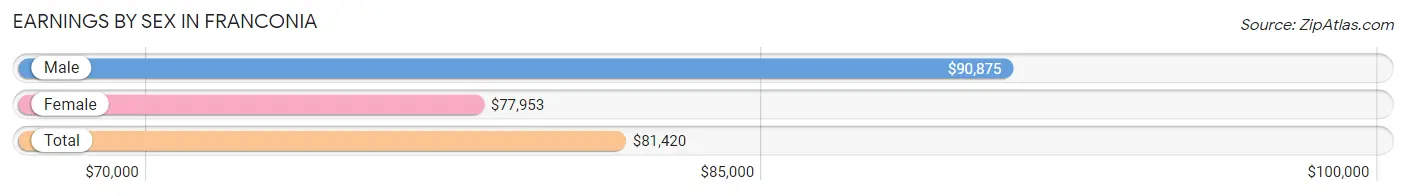
| Sex | Number | Average Earnings |
| Male | 6,215 (51.0%) | $90,875 |
| Female | 5,968 (49.0%) | $77,953 |
| Total | 12,183 (100.0%) | $81,420 |
Earnings by Sex by Income Bracket in Franconia
The most common earnings brackets in Franconia are $100,000+ for men (2,869 | 46.2%) and $100,000+ for women (2,304 | 38.6%).
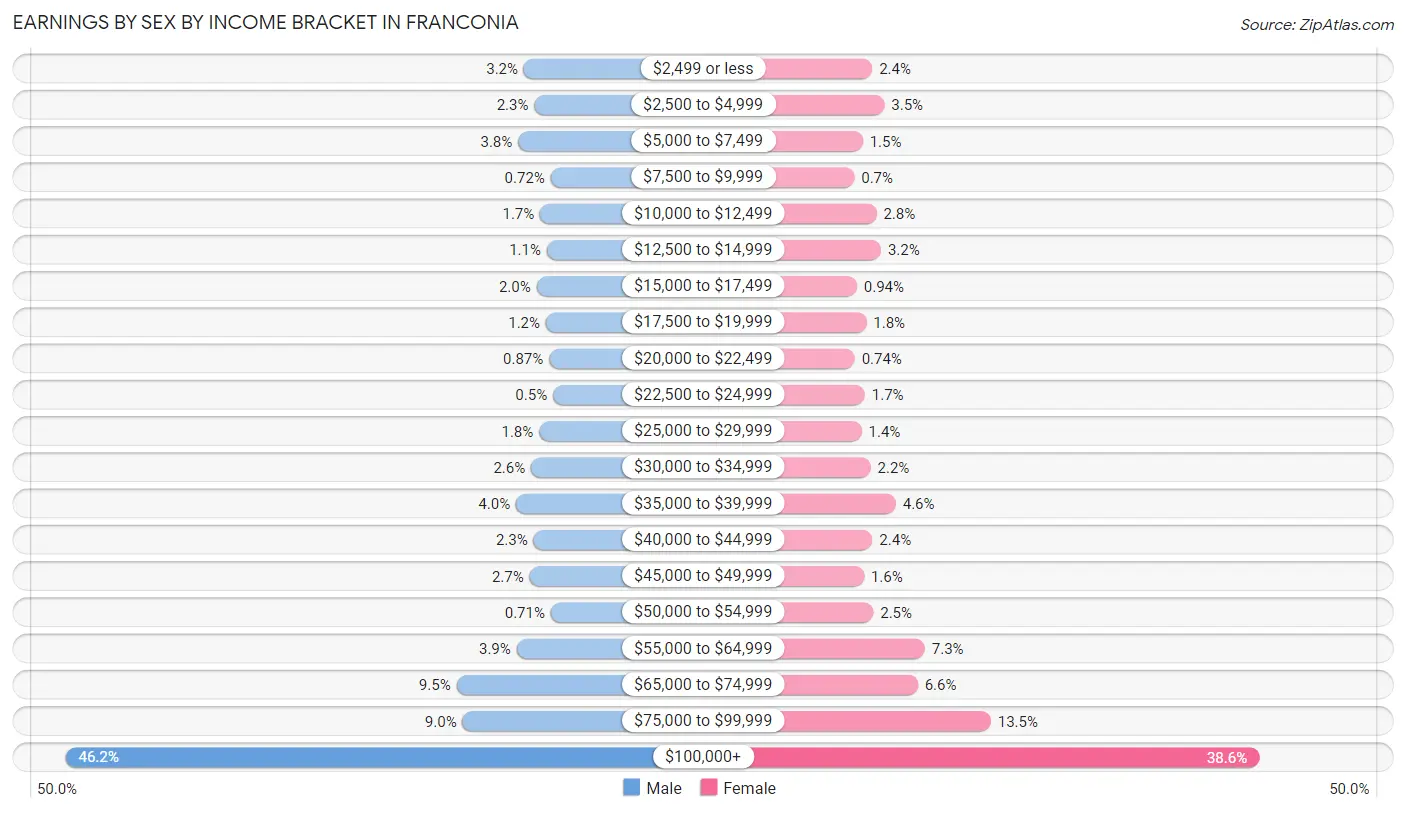
| Income | Male | Female |
| $2,499 or less | 201 (3.2%) | 142 (2.4%) |
| $2,500 to $4,999 | 140 (2.2%) | 210 (3.5%) |
| $5,000 to $7,499 | 234 (3.8%) | 89 (1.5%) |
| $7,500 to $9,999 | 45 (0.7%) | 42 (0.7%) |
| $10,000 to $12,499 | 106 (1.7%) | 166 (2.8%) |
| $12,500 to $14,999 | 67 (1.1%) | 191 (3.2%) |
| $15,000 to $17,499 | 127 (2.0%) | 56 (0.9%) |
| $17,500 to $19,999 | 73 (1.2%) | 109 (1.8%) |
| $20,000 to $22,499 | 54 (0.9%) | 44 (0.7%) |
| $22,500 to $24,999 | 31 (0.5%) | 101 (1.7%) |
| $25,000 to $29,999 | 112 (1.8%) | 83 (1.4%) |
| $30,000 to $34,999 | 159 (2.6%) | 133 (2.2%) |
| $35,000 to $39,999 | 247 (4.0%) | 274 (4.6%) |
| $40,000 to $44,999 | 144 (2.3%) | 143 (2.4%) |
| $45,000 to $49,999 | 168 (2.7%) | 96 (1.6%) |
| $50,000 to $54,999 | 44 (0.7%) | 148 (2.5%) |
| $55,000 to $64,999 | 243 (3.9%) | 436 (7.3%) |
| $65,000 to $74,999 | 593 (9.5%) | 396 (6.6%) |
| $75,000 to $99,999 | 558 (9.0%) | 805 (13.5%) |
| $100,000+ | 2,869 (46.2%) | 2,304 (38.6%) |
| Total | 6,215 (100.0%) | 5,968 (100.0%) |
Earnings by Sex by Educational Attainment in Franconia
Average earnings in Franconia are $101,014 for men and $82,373 for women, a difference of 18.4%. Men with an educational attainment of graduate degree enjoy the highest average annual earnings of $135,756, while those with less than high school education earn the least with $35,368. Women with an educational attainment of graduate degree earn the most with the average annual earnings of $114,849, while those with less than high school education have the smallest earnings of $24,779.
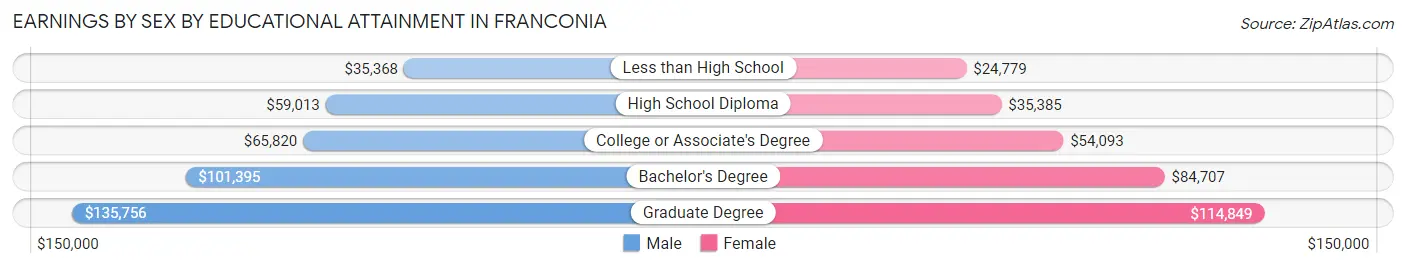
| Educational Attainment | Male Income | Female Income |
| Less than High School | $35,368 | $24,779 |
| High School Diploma | $59,013 | $35,385 |
| College or Associate's Degree | $65,820 | $54,093 |
| Bachelor's Degree | $101,395 | $84,707 |
| Graduate Degree | $135,756 | $114,849 |
| Total | $101,014 | $82,373 |
Family Income in Franconia
Family Income Brackets in Franconia
According to the Franconia family income data, there are 1,732 families falling into the $200,000+ income range, which is the most common income bracket and makes up 38.5% of all families. Conversely, the $15,000 to $24,999 income bracket is the least frequent group with only 27 families (0.6%) belonging to this category.
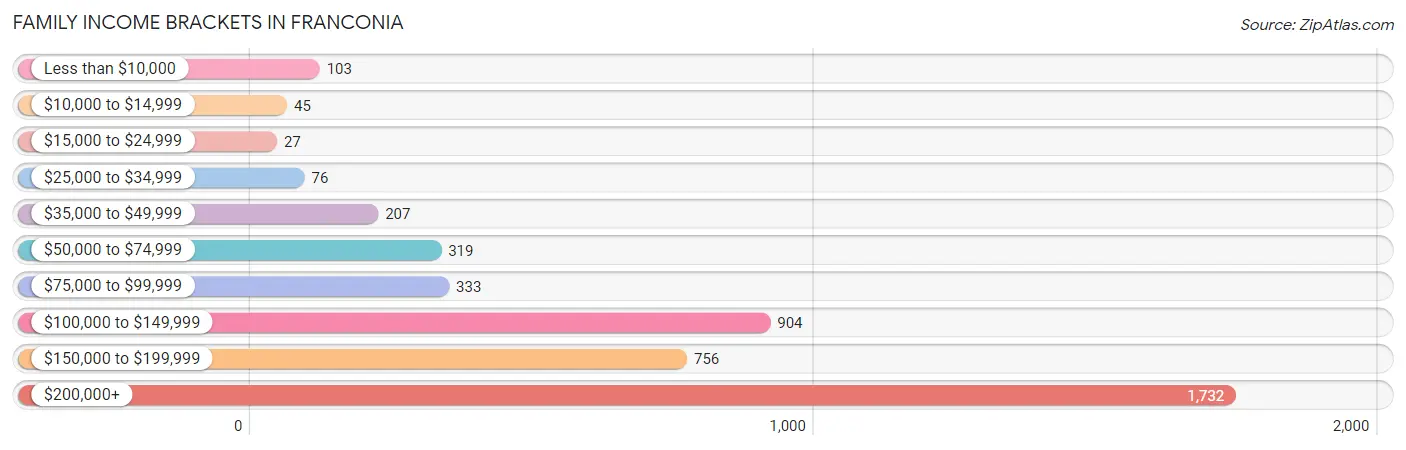
| Income Bracket | # Families | % Families |
| Less than $10,000 | 103 | 2.3% |
| $10,000 to $14,999 | 45 | 1.0% |
| $15,000 to $24,999 | 27 | 0.6% |
| $25,000 to $34,999 | 76 | 1.7% |
| $35,000 to $49,999 | 207 | 4.6% |
| $50,000 to $74,999 | 319 | 7.1% |
| $75,000 to $99,999 | 333 | 7.4% |
| $100,000 to $149,999 | 904 | 20.1% |
| $150,000 to $199,999 | 756 | 16.8% |
| $200,000+ | 1,732 | 38.5% |
Family Income by Famaliy Size in Franconia
6-person families (78 | 1.7%) account for the highest median family income in Franconia with $207,778 per family, while 2-person families (2,014 | 44.8%) have the highest median income of $75,336 per family member.
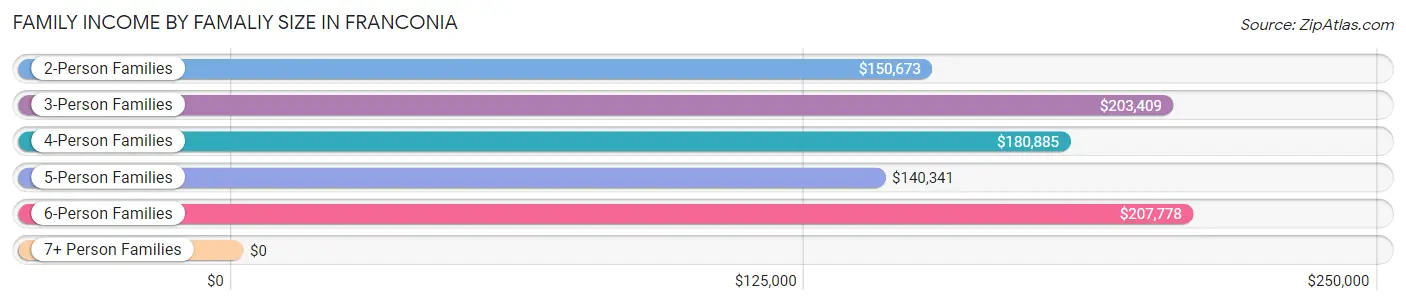
| Income Bracket | # Families | Median Income |
| 2-Person Families | 2,014 (44.8%) | $150,673 |
| 3-Person Families | 1,366 (30.4%) | $203,409 |
| 4-Person Families | 749 (16.7%) | $180,885 |
| 5-Person Families | 285 (6.3%) | $140,341 |
| 6-Person Families | 78 (1.7%) | $207,778 |
| 7+ Person Families | 7 (0.2%) | $0 |
| Total | 4,499 (100.0%) | $172,264 |
Family Income by Number of Earners in Franconia
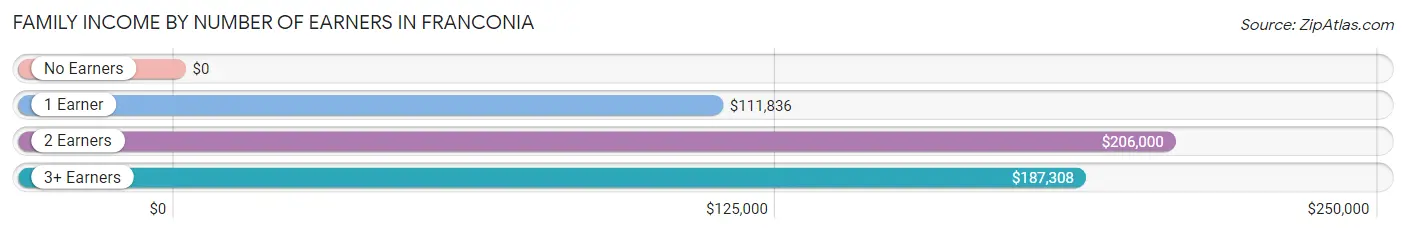
| Number of Earners | # Families | Median Income |
| No Earners | 148 (3.3%) | $0 |
| 1 Earner | 1,315 (29.2%) | $111,836 |
| 2 Earners | 2,446 (54.4%) | $206,000 |
| 3+ Earners | 590 (13.1%) | $187,308 |
| Total | 4,499 (100.0%) | $172,264 |
Household Income in Franconia
Household Income Brackets in Franconia
With 2,207 households falling in the category, the $200,000+ income range is the most frequent in Franconia, accounting for 29.6% of all households. In contrast, only 22 households (0.3%) fall into the $10,000 to $14,999 income bracket, making it the least populous group.
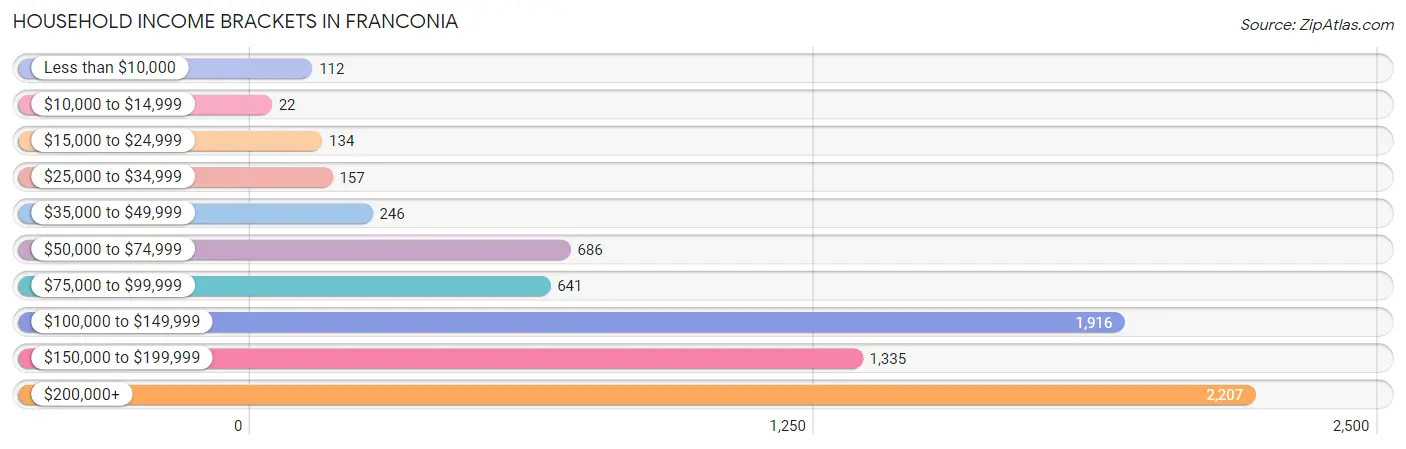
| Income Bracket | # Households | % Households |
| Less than $10,000 | 112 | 1.5% |
| $10,000 to $14,999 | 22 | 0.3% |
| $15,000 to $24,999 | 134 | 1.8% |
| $25,000 to $34,999 | 157 | 2.1% |
| $35,000 to $49,999 | 246 | 3.3% |
| $50,000 to $74,999 | 686 | 9.2% |
| $75,000 to $99,999 | 641 | 8.6% |
| $100,000 to $149,999 | 1,916 | 25.7% |
| $150,000 to $199,999 | 1,335 | 17.9% |
| $200,000+ | 2,207 | 29.6% |
Household Income by Householder Age in Franconia
The median household income in Franconia is $143,322, with the highest median household income of $169,464 found in the 45 to 64 years age bracket for the primary householder. A total of 3,176 households (42.6%) fall into this category. Meanwhile, the 15 to 24 years age bracket for the primary householder has the lowest median household income of $98,929, with 30 households (0.4%) in this group.
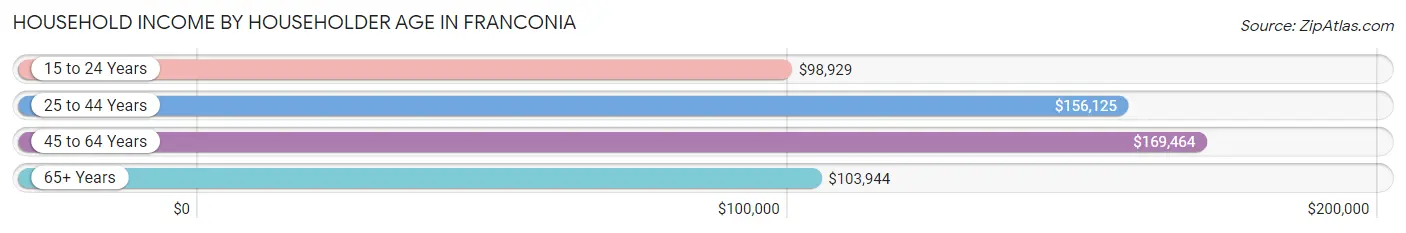
| Income Bracket | # Households | Median Income |
| 15 to 24 Years | 30 (0.4%) | $98,929 |
| 25 to 44 Years | 2,832 (38.0%) | $156,125 |
| 45 to 64 Years | 3,176 (42.6%) | $169,464 |
| 65+ Years | 1,418 (19.0%) | $103,944 |
| Total | 7,456 (100.0%) | $143,322 |
Poverty in Franconia
Income Below Poverty by Sex and Age in Franconia
With 3.7% poverty level for males and 4.3% for females among the residents of Franconia, 15 year old males and 12 to 14 year old females are the most vulnerable to poverty, with 59 males (40.4%) and 41 females (16.3%) in their respective age groups living below the poverty level.
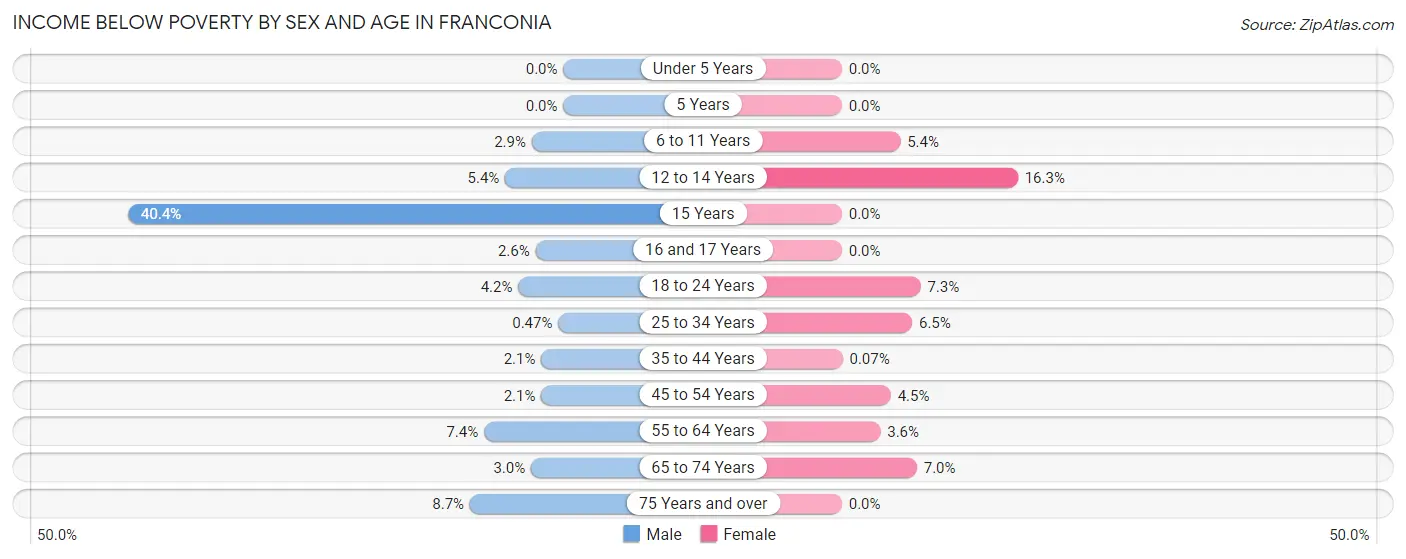
| Age Bracket | Male | Female |
| Under 5 Years | 0 (0.0%) | 0 (0.0%) |
| 5 Years | 0 (0.0%) | 0 (0.0%) |
| 6 to 11 Years | 15 (2.9%) | 29 (5.4%) |
| 12 to 14 Years | 15 (5.4%) | 41 (16.3%) |
| 15 Years | 59 (40.4%) | 0 (0.0%) |
| 16 and 17 Years | 7 (2.6%) | 0 (0.0%) |
| 18 to 24 Years | 23 (4.2%) | 40 (7.3%) |
| 25 to 34 Years | 7 (0.5%) | 86 (6.5%) |
| 35 to 44 Years | 32 (2.1%) | 1 (0.1%) |
| 45 to 54 Years | 25 (2.1%) | 65 (4.5%) |
| 55 to 64 Years | 102 (7.4%) | 46 (3.6%) |
| 65 to 74 Years | 24 (3.0%) | 71 (7.0%) |
| 75 Years and over | 28 (8.7%) | 0 (0.0%) |
| Total | 337 (3.7%) | 379 (4.3%) |
Income Above Poverty by Sex and Age in Franconia
According to the poverty statistics in Franconia, males aged under 5 years and females aged under 5 years are the age groups that are most secure financially, with 100.0% of males and 100.0% of females in these age groups living above the poverty line.
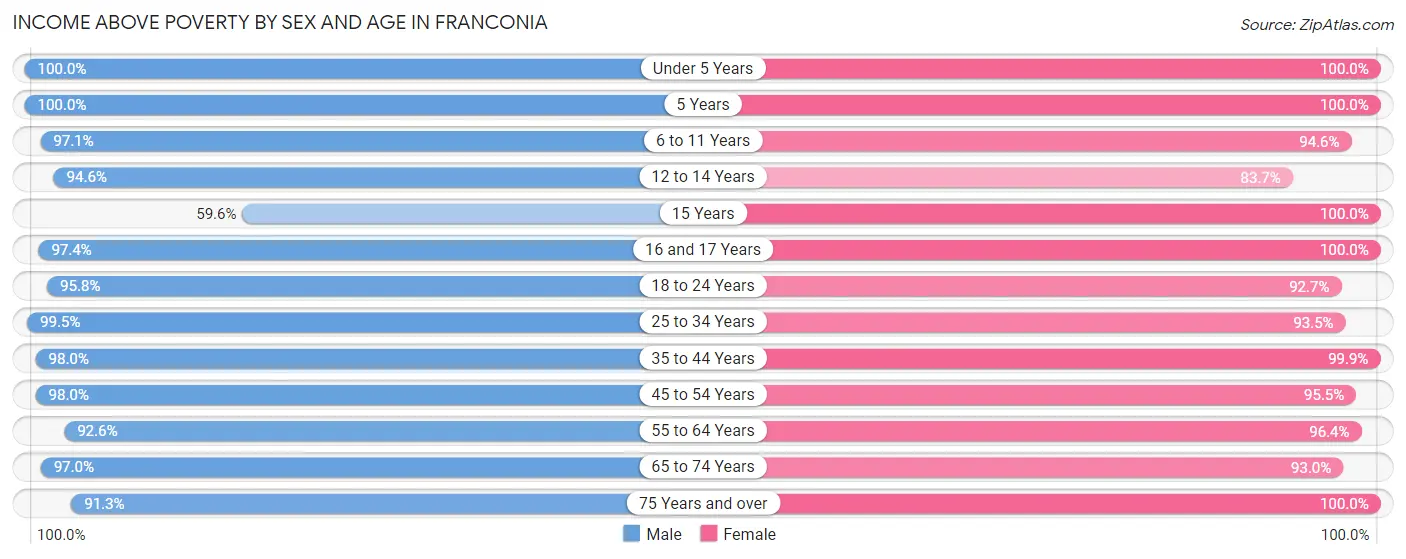
| Age Bracket | Male | Female |
| Under 5 Years | 443 (100.0%) | 355 (100.0%) |
| 5 Years | 80 (100.0%) | 119 (100.0%) |
| 6 to 11 Years | 497 (97.1%) | 506 (94.6%) |
| 12 to 14 Years | 263 (94.6%) | 210 (83.7%) |
| 15 Years | 87 (59.6%) | 54 (100.0%) |
| 16 and 17 Years | 264 (97.4%) | 139 (100.0%) |
| 18 to 24 Years | 527 (95.8%) | 508 (92.7%) |
| 25 to 34 Years | 1,472 (99.5%) | 1,233 (93.5%) |
| 35 to 44 Years | 1,529 (98.0%) | 1,484 (99.9%) |
| 45 to 54 Years | 1,197 (98.0%) | 1,366 (95.5%) |
| 55 to 64 Years | 1,283 (92.6%) | 1,244 (96.4%) |
| 65 to 74 Years | 777 (97.0%) | 949 (93.0%) |
| 75 Years and over | 295 (91.3%) | 309 (100.0%) |
| Total | 8,714 (96.3%) | 8,476 (95.7%) |
Income Below Poverty Among Married-Couple Families in Franconia
The poverty statistics for married-couple families in Franconia show that 3.1% or 115 of the total 3,674 families live below the poverty line. Families with 1 or 2 children have the highest poverty rate of 3.6%, comprising of 54 families. On the other hand, families with 3 or 4 children have the lowest poverty rate of 0.0%, which includes 0 families.
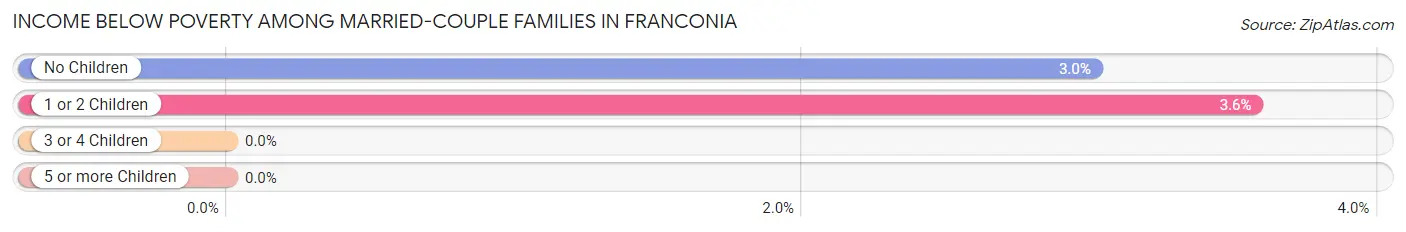
| Children | Above Poverty | Below Poverty |
| No Children | 1,966 (97.0%) | 61 (3.0%) |
| 1 or 2 Children | 1,459 (96.4%) | 54 (3.6%) |
| 3 or 4 Children | 134 (100.0%) | 0 (0.0%) |
| 5 or more Children | 0 (0.0%) | 0 (0.0%) |
| Total | 3,559 (96.9%) | 115 (3.1%) |
Income Below Poverty Among Single-Parent Households in Franconia
According to the poverty data in Franconia, 8.6% or 32 single-father households and 6.6% or 30 single-mother households are living below the poverty line. Among single-father households, those with 1 or 2 children have the highest poverty rate, with 32 households (27.8%) experiencing poverty. Likewise, among single-mother households, those with 3 or 4 children have the highest poverty rate, with 21 households (100.0%) falling below the poverty line.
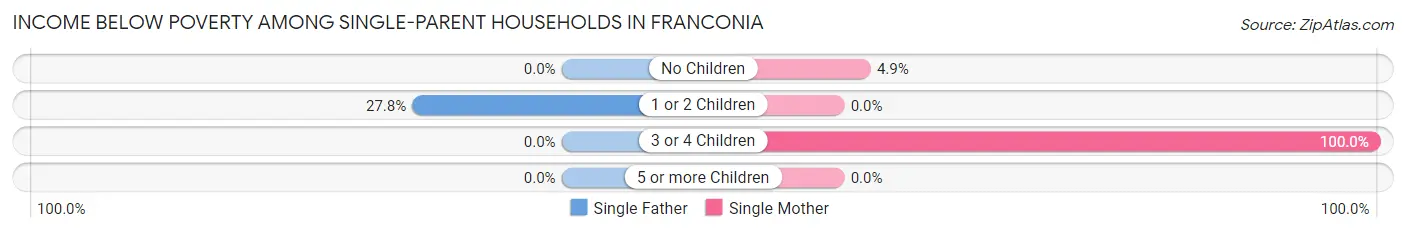
| Children | Single Father | Single Mother |
| No Children | 0 (0.0%) | 9 (4.9%) |
| 1 or 2 Children | 32 (27.8%) | 0 (0.0%) |
| 3 or 4 Children | 0 (0.0%) | 21 (100.0%) |
| 5 or more Children | 0 (0.0%) | 0 (0.0%) |
| Total | 32 (8.6%) | 30 (6.6%) |
Income Below Poverty Among Married-Couple vs Single-Parent Households in Franconia
The poverty data for Franconia shows that 115 of the married-couple family households (3.1%) and 62 of the single-parent households (7.5%) are living below the poverty level. Within the married-couple family households, those with 1 or 2 children have the highest poverty rate, with 54 households (3.6%) falling below the poverty line. Among the single-parent households, those with 3 or 4 children have the highest poverty rate, with 21 household (100.0%) living below poverty.
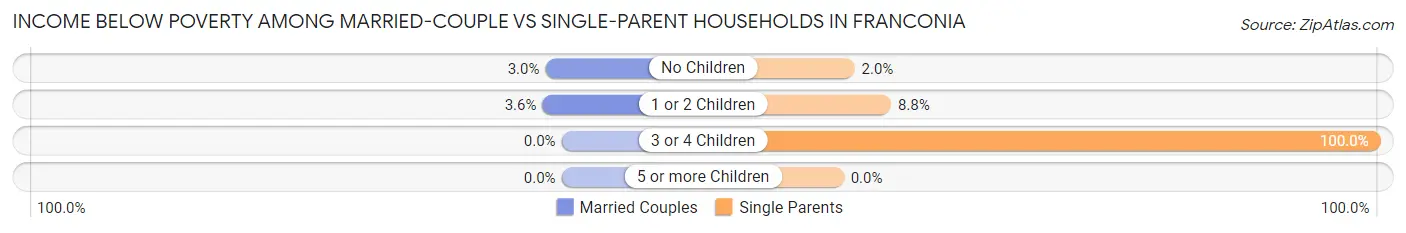
| Children | Married-Couple Families | Single-Parent Households |
| No Children | 61 (3.0%) | 9 (2.0%) |
| 1 or 2 Children | 54 (3.6%) | 32 (8.8%) |
| 3 or 4 Children | 0 (0.0%) | 21 (100.0%) |
| 5 or more Children | 0 (0.0%) | 0 (0.0%) |
| Total | 115 (3.1%) | 62 (7.5%) |
Race in Franconia
The most populous races in Franconia are White / Caucasian (8,443 | 47.1%), Black / African American (4,170 | 23.3%), and Asian (3,589 | 20.0%).
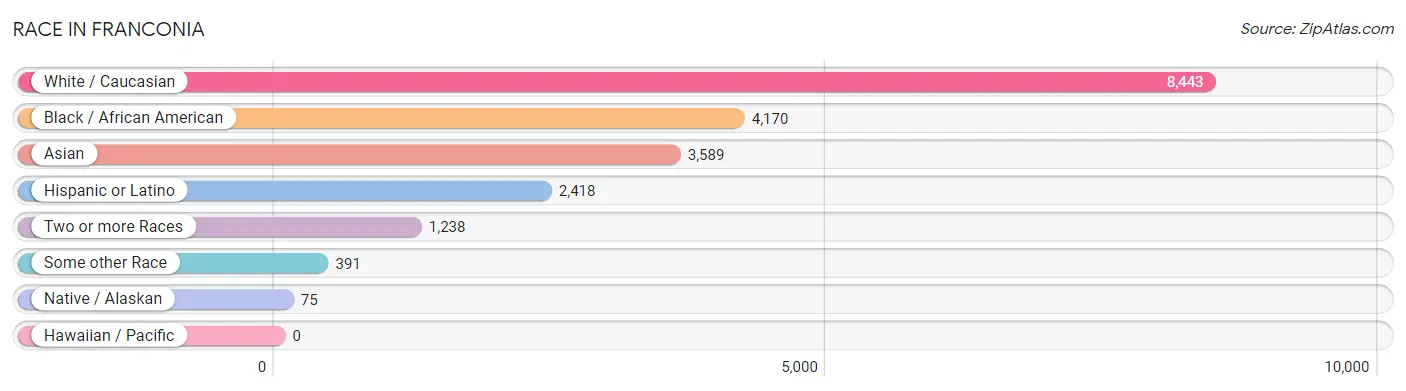
| Race | # Population | % Population |
| Asian | 3,589 | 20.0% |
| Black / African American | 4,170 | 23.3% |
| Hawaiian / Pacific | 0 | 0.0% |
| Hispanic or Latino | 2,418 | 13.5% |
| Native / Alaskan | 75 | 0.4% |
| White / Caucasian | 8,443 | 47.1% |
| Two or more Races | 1,238 | 6.9% |
| Some other Race | 391 | 2.2% |
| Total | 17,906 | 100.0% |
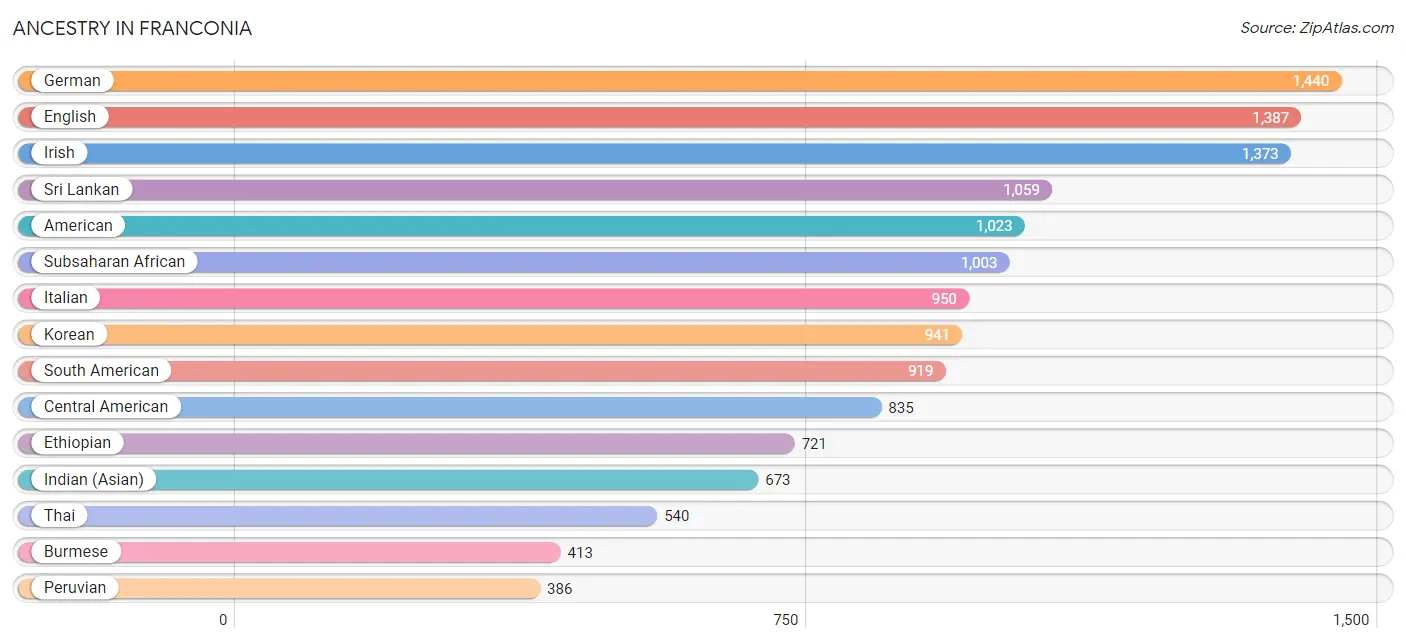
Ancestry in Franconia
The most populous ancestries reported in Franconia are German (1,440 | 8.0%), English (1,387 | 7.7%), Irish (1,373 | 7.7%), Sri Lankan (1,059 | 5.9%), and American (1,023 | 5.7%), together accounting for 35.1% of all Franconia residents.
| Ancestry | # Population | % Population |
| Afghan | 46 | 0.3% |
| African | 319 | 1.8% |
| Albanian | 17 | 0.1% |
| American | 1,023 | 5.7% |
| Arab | 367 | 2.1% |
| Argentinean | 50 | 0.3% |
| Armenian | 7 | 0.0% |
| Austrian | 27 | 0.2% |
| Barbadian | 38 | 0.2% |
| Belgian | 8 | 0.0% |
| Bhutanese | 78 | 0.4% |
| Bolivian | 91 | 0.5% |
| Brazilian | 9 | 0.1% |
| British | 186 | 1.0% |
| Burmese | 413 | 2.3% |
| Canadian | 12 | 0.1% |
| Central American | 835 | 4.7% |
| Central American Indian | 54 | 0.3% |
| Choctaw | 18 | 0.1% |
| Colombian | 73 | 0.4% |
| Costa Rican | 17 | 0.1% |
| Croatian | 16 | 0.1% |
| Cuban | 74 | 0.4% |
| Czech | 48 | 0.3% |
| Czechoslovakian | 82 | 0.5% |
| Danish | 52 | 0.3% |
| Dominican | 47 | 0.3% |
| Dutch | 177 | 1.0% |
| Eastern European | 34 | 0.2% |
| Ecuadorian | 219 | 1.2% |
| English | 1,387 | 7.7% |
| Estonian | 10 | 0.1% |
| Ethiopian | 721 | 4.0% |
| European | 344 | 1.9% |
| French | 343 | 1.9% |
| French Canadian | 41 | 0.2% |
| German | 1,440 | 8.0% |
| Ghanaian | 7 | 0.0% |
| Greek | 117 | 0.6% |
| Guatemalan | 235 | 1.3% |
| Honduran | 43 | 0.2% |
| Hungarian | 71 | 0.4% |
| Indian (Asian) | 673 | 3.8% |
| Iranian | 303 | 1.7% |
| Iraqi | 66 | 0.4% |
| Irish | 1,373 | 7.7% |
| Italian | 950 | 5.3% |
| Jamaican | 140 | 0.8% |
| Korean | 941 | 5.3% |
| Lebanese | 95 | 0.5% |
| Lithuanian | 18 | 0.1% |
| Luxembourger | 10 | 0.1% |
| Malaysian | 22 | 0.1% |
| Mexican | 220 | 1.2% |
| Nicaraguan | 141 | 0.8% |
| Nigerian | 5 | 0.0% |
| Northern European | 62 | 0.4% |
| Norwegian | 59 | 0.3% |
| Pakistani | 159 | 0.9% |
| Panamanian | 84 | 0.5% |
| Peruvian | 386 | 2.2% |
| Polish | 368 | 2.1% |
| Portuguese | 66 | 0.4% |
| Puerto Rican | 162 | 0.9% |
| Romanian | 38 | 0.2% |
| Russian | 203 | 1.1% |
| Salvadoran | 315 | 1.8% |
| Scandinavian | 19 | 0.1% |
| Scotch-Irish | 62 | 0.4% |
| Scottish | 207 | 1.2% |
| Serbian | 29 | 0.2% |
| Slovak | 45 | 0.3% |
| Slovene | 21 | 0.1% |
| South African | 22 | 0.1% |
| South American | 919 | 5.1% |
| South American Indian | 83 | 0.5% |
| Spaniard | 85 | 0.5% |
| Spanish | 6 | 0.0% |
| Sri Lankan | 1,059 | 5.9% |
| Subsaharan African | 1,003 | 5.6% |
| Sudanese | 28 | 0.2% |
| Swedish | 200 | 1.1% |
| Swiss | 4 | 0.0% |
| Thai | 540 | 3.0% |
| Turkish | 46 | 0.3% |
| Ukrainian | 87 | 0.5% |
| Uruguayan | 66 | 0.4% |
| Venezuelan | 34 | 0.2% |
| Welsh | 113 | 0.6% |
| West Indian | 11 | 0.1% |
| Yugoslavian | 31 | 0.2% |
| Zimbabwean | 6 | 0.0% | View All 92 Rows |
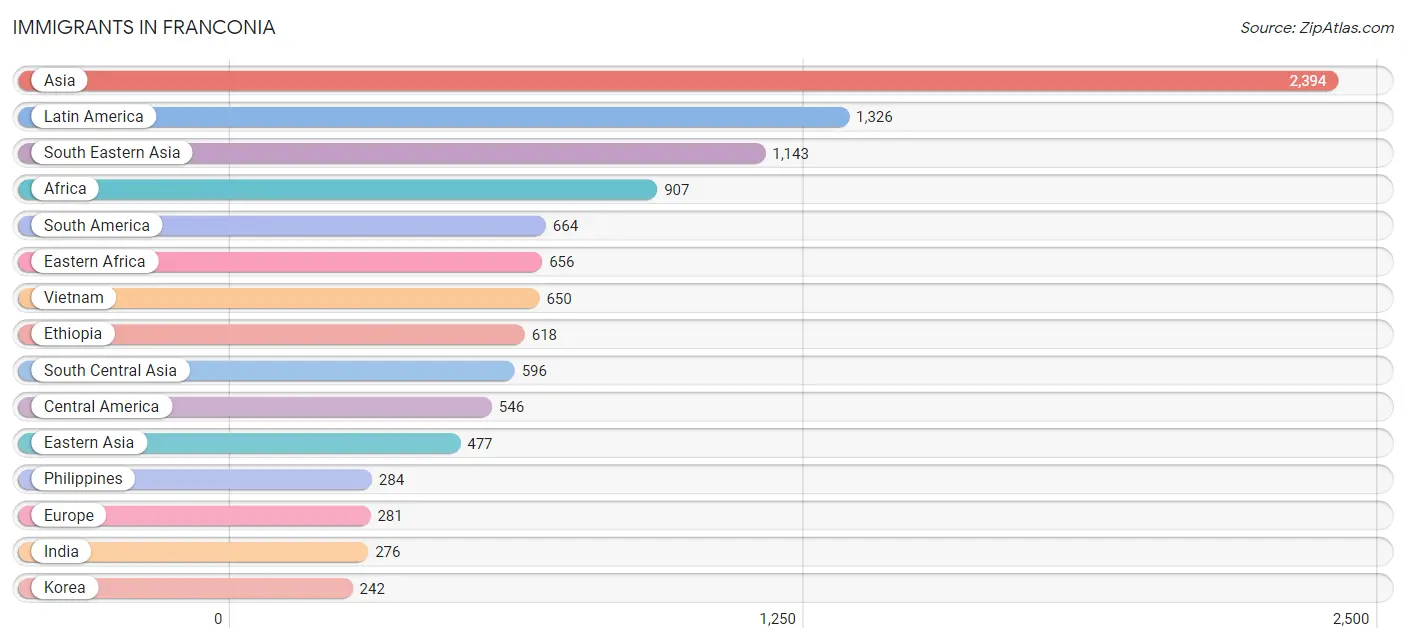
Immigrants in Franconia
The most numerous immigrant groups reported in Franconia came from Asia (2,394 | 13.4%), Latin America (1,326 | 7.4%), South Eastern Asia (1,143 | 6.4%), Africa (907 | 5.1%), and South America (664 | 3.7%), together accounting for 35.9% of all Franconia residents.
| Immigration Origin | # Population | % Population |
| Afghanistan | 64 | 0.4% |
| Africa | 907 | 5.1% |
| Albania | 17 | 0.1% |
| Argentina | 65 | 0.4% |
| Asia | 2,394 | 13.4% |
| Bolivia | 49 | 0.3% |
| Bosnia and Herzegovina | 30 | 0.2% |
| Brazil | 4 | 0.0% |
| Cambodia | 10 | 0.1% |
| Caribbean | 116 | 0.6% |
| Central America | 546 | 3.0% |
| Chile | 53 | 0.3% |
| China | 210 | 1.2% |
| Colombia | 37 | 0.2% |
| Costa Rica | 17 | 0.1% |
| Cuba | 40 | 0.2% |
| Dominican Republic | 3 | 0.0% |
| Eastern Africa | 656 | 3.7% |
| Eastern Asia | 477 | 2.7% |
| Eastern Europe | 109 | 0.6% |
| Ecuador | 123 | 0.7% |
| Egypt | 34 | 0.2% |
| El Salvador | 123 | 0.7% |
| England | 54 | 0.3% |
| Eritrea | 22 | 0.1% |
| Ethiopia | 618 | 3.5% |
| Europe | 281 | 1.6% |
| France | 39 | 0.2% |
| Germany | 45 | 0.3% |
| Ghana | 42 | 0.2% |
| Greece | 30 | 0.2% |
| Guatemala | 196 | 1.1% |
| Guyana | 21 | 0.1% |
| Honduras | 39 | 0.2% |
| India | 276 | 1.5% |
| Iran | 134 | 0.7% |
| Iraq | 72 | 0.4% |
| Jamaica | 73 | 0.4% |
| Japan | 25 | 0.1% |
| Korea | 242 | 1.3% |
| Kuwait | 20 | 0.1% |
| Laos | 30 | 0.2% |
| Latin America | 1,326 | 7.4% |
| Lebanon | 51 | 0.3% |
| Mexico | 29 | 0.2% |
| Middle Africa | 11 | 0.1% |
| Morocco | 8 | 0.0% |
| Nicaragua | 110 | 0.6% |
| Nigeria | 5 | 0.0% |
| Northern Africa | 118 | 0.7% |
| Northern Europe | 54 | 0.3% |
| Pakistan | 122 | 0.7% |
| Panama | 32 | 0.2% |
| Peru | 168 | 0.9% |
| Philippines | 284 | 1.6% |
| Poland | 16 | 0.1% |
| Russia | 26 | 0.2% |
| Singapore | 17 | 0.1% |
| South Africa | 31 | 0.2% |
| South America | 664 | 3.7% |
| South Central Asia | 596 | 3.3% |
| South Eastern Asia | 1,143 | 6.4% |
| Southern Europe | 30 | 0.2% |
| Switzerland | 4 | 0.0% |
| Taiwan | 63 | 0.4% |
| Thailand | 142 | 0.8% |
| Turkey | 25 | 0.1% |
| Ukraine | 20 | 0.1% |
| Uruguay | 12 | 0.1% |
| Venezuela | 5 | 0.0% |
| Vietnam | 650 | 3.6% |
| Western Africa | 52 | 0.3% |
| Western Asia | 178 | 1.0% |
| Western Europe | 88 | 0.5% |
| Zaire | 11 | 0.1% |
| Zimbabwe | 16 | 0.1% | View All 76 Rows |
Sex and Age in Franconia
Sex and Age in Franconia
The most populous age groups in Franconia are 35 to 39 Years (817 | 9.0%) for men and 35 to 39 Years (899 | 10.2%) for women.
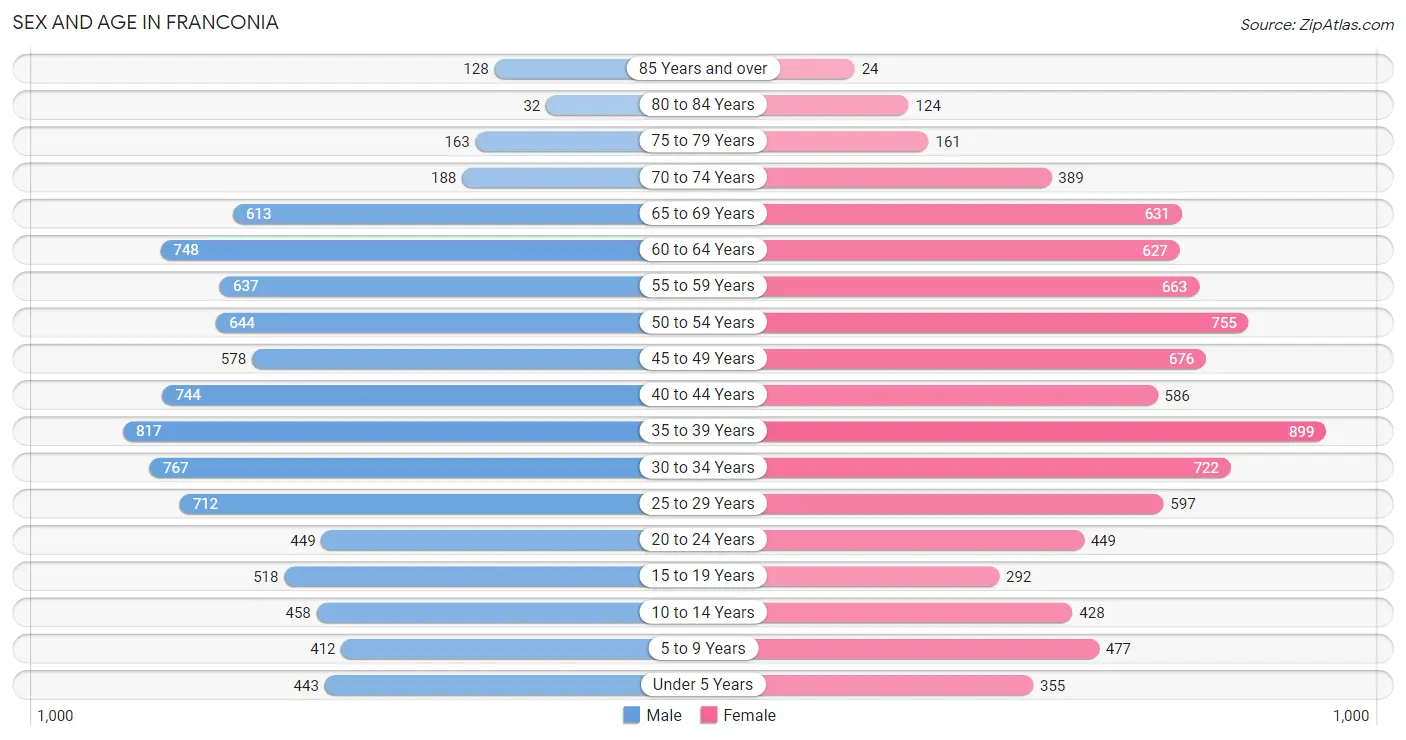
| Age Bracket | Male | Female |
| Under 5 Years | 443 (4.9%) | 355 (4.0%) |
| 5 to 9 Years | 412 (4.5%) | 477 (5.4%) |
| 10 to 14 Years | 458 (5.1%) | 428 (4.8%) |
| 15 to 19 Years | 518 (5.7%) | 292 (3.3%) |
| 20 to 24 Years | 449 (5.0%) | 449 (5.1%) |
| 25 to 29 Years | 712 (7.9%) | 597 (6.7%) |
| 30 to 34 Years | 767 (8.5%) | 722 (8.2%) |
| 35 to 39 Years | 817 (9.0%) | 899 (10.2%) |
| 40 to 44 Years | 744 (8.2%) | 586 (6.6%) |
| 45 to 49 Years | 578 (6.4%) | 676 (7.6%) |
| 50 to 54 Years | 644 (7.1%) | 755 (8.5%) |
| 55 to 59 Years | 637 (7.0%) | 663 (7.5%) |
| 60 to 64 Years | 748 (8.3%) | 627 (7.1%) |
| 65 to 69 Years | 613 (6.8%) | 631 (7.1%) |
| 70 to 74 Years | 188 (2.1%) | 389 (4.4%) |
| 75 to 79 Years | 163 (1.8%) | 161 (1.8%) |
| 80 to 84 Years | 32 (0.4%) | 124 (1.4%) |
| 85 Years and over | 128 (1.4%) | 24 (0.3%) |
| Total | 9,051 (100.0%) | 8,855 (100.0%) |
Families and Households in Franconia
Median Family Size in Franconia
The median family size in Franconia is 3.06 persons per family, with single female/mother families (453 | 10.1%) accounting for the largest median family size of 3.39 persons per family. On the other hand, single male/father families (372 | 8.3%) represent the smallest median family size with 2.36 persons per family.
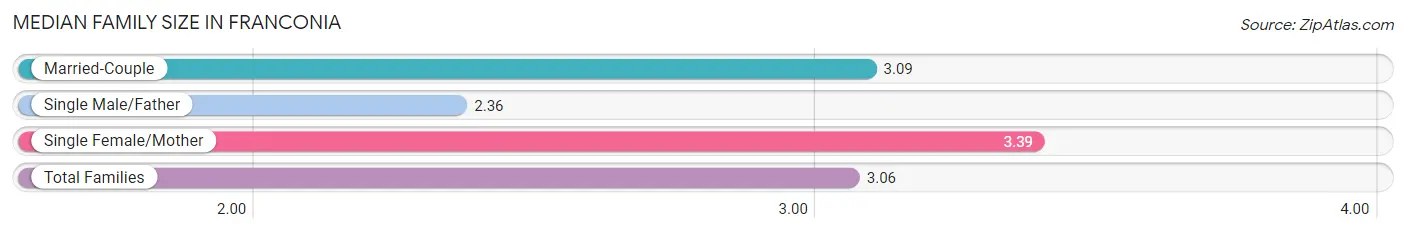
| Family Type | # Families | Family Size |
| Married-Couple | 3,674 (81.7%) | 3.09 |
| Single Male/Father | 372 (8.3%) | 2.36 |
| Single Female/Mother | 453 (10.1%) | 3.39 |
| Total Families | 4,499 (100.0%) | 3.06 |
Median Household Size in Franconia
The median household size in Franconia is 2.40 persons per household, with single female/mother households (453 | 6.1%) accounting for the largest median household size of 3.6 persons per household. non-family households (2,957 | 39.7%) represent the smallest median household size with 1.25 persons per household.
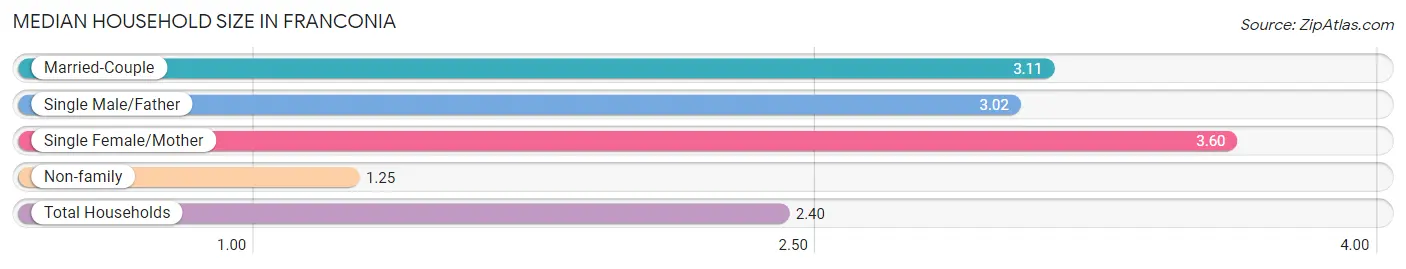
| Household Type | # Households | Household Size |
| Married-Couple | 3,674 (49.3%) | 3.11 |
| Single Male/Father | 372 (5.0%) | 3.02 |
| Single Female/Mother | 453 (6.1%) | 3.60 |
| Non-family | 2,957 (39.7%) | 1.25 |
| Total Households | 7,456 (100.0%) | 2.40 |
Household Size by Marriage Status in Franconia
Out of a total of 7,456 households in Franconia, 4,499 (60.3%) are family households, while 2,957 (39.7%) are nonfamily households. The most numerous type of family households are 2-person households, comprising 1,781, and the most common type of nonfamily households are 1-person households, comprising 2,272.
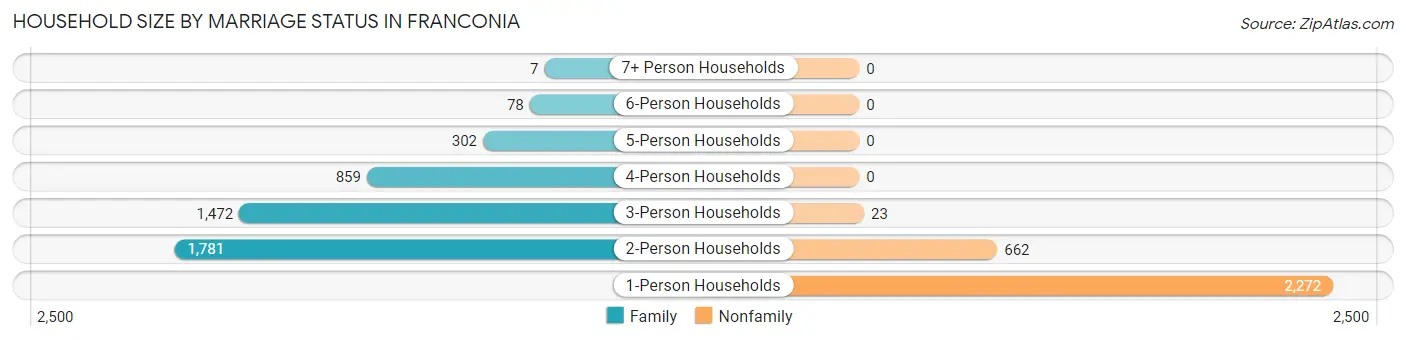
| Household Size | Family Households | Nonfamily Households |
| 1-Person Households | - | 2,272 (30.5%) |
| 2-Person Households | 1,781 (23.9%) | 662 (8.9%) |
| 3-Person Households | 1,472 (19.7%) | 23 (0.3%) |
| 4-Person Households | 859 (11.5%) | 0 (0.0%) |
| 5-Person Households | 302 (4.1%) | 0 (0.0%) |
| 6-Person Households | 78 (1.1%) | 0 (0.0%) |
| 7+ Person Households | 7 (0.1%) | 0 (0.0%) |
| Total | 4,499 (60.3%) | 2,957 (39.7%) |
Female Fertility in Franconia
Fertility by Age in Franconia
Average fertility rate in Franconia is 35.0 births per 1,000 women. Women in the age bracket of 20 to 34 years have the highest fertility rate with 55.0 births per 1,000 women. Women in the age bracket of 20 to 34 years acount for 62.2% of all women with births.
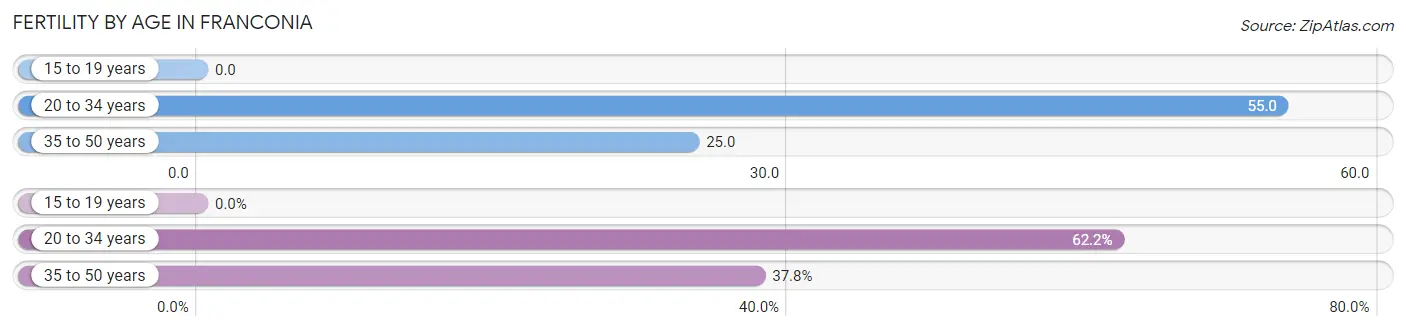
| Age Bracket | Women with Births | Births / 1,000 Women |
| 15 to 19 years | 0 (0.0%) | 0.0 |
| 20 to 34 years | 97 (62.2%) | 55.0 |
| 35 to 50 years | 59 (37.8%) | 25.0 |
| Total | 156 (100.0%) | 35.0 |
Fertility by Age by Marriage Status in Franconia
85.9% of women with births (156) in Franconia are married. The highest percentage of unmarried women with births falls into 35 to 50 years age bracket with 17.0% of them unmarried at the time of birth, while the lowest percentage of unmarried women with births belong to 20 to 34 years age bracket with 12.4% of them unmarried.
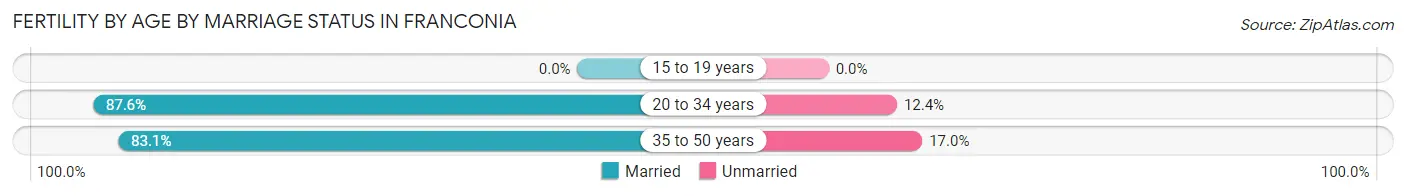
| Age Bracket | Married | Unmarried |
| 15 to 19 years | 0 (0.0%) | 0 (0.0%) |
| 20 to 34 years | 85 (87.6%) | 12 (12.4%) |
| 35 to 50 years | 49 (83.1%) | 10 (17.0%) |
| Total | 134 (85.9%) | 22 (14.1%) |
Fertility by Education in Franconia
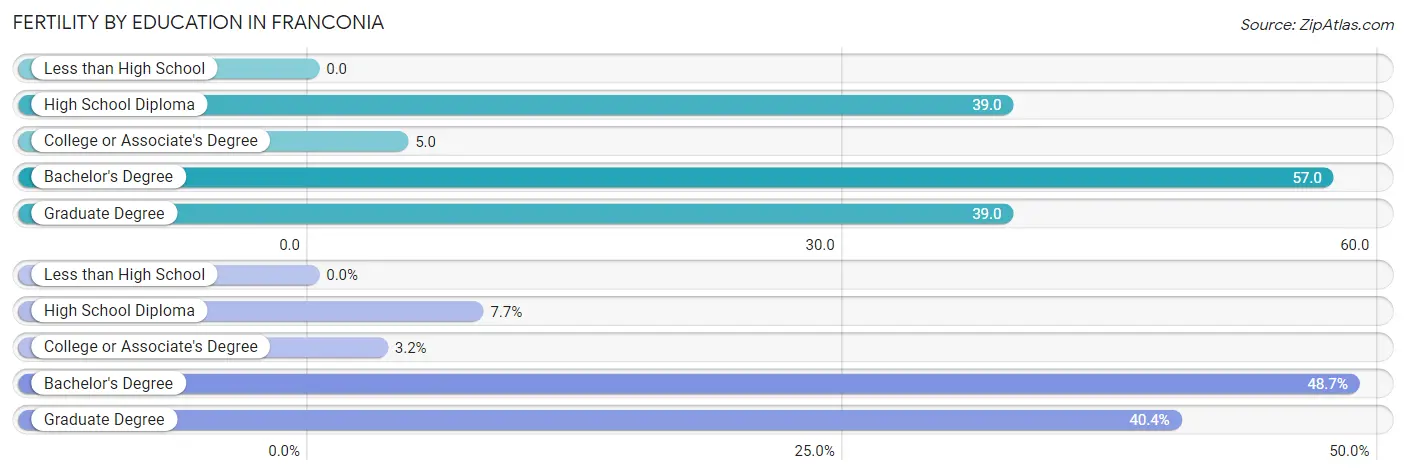
| Educational Attainment | Women with Births | Births / 1,000 Women |
| Less than High School | 0 (0.0%) | 0.0 |
| High School Diploma | 12 (7.7%) | 39.0 |
| College or Associate's Degree | 5 (3.2%) | 5.0 |
| Bachelor's Degree | 76 (48.7%) | 57.0 |
| Graduate Degree | 63 (40.4%) | 39.0 |
| Total | 156 (100.0%) | 35.0 |
Fertility by Education by Marriage Status in Franconia
14.1% of women with births in Franconia are unmarried. Women with the educational attainment of college or associate's degree are most likely to be married with 100.0% of them married at childbirth, while women with the educational attainment of high school diploma are least likely to be married with 100.0% of them unmarried at childbirth.
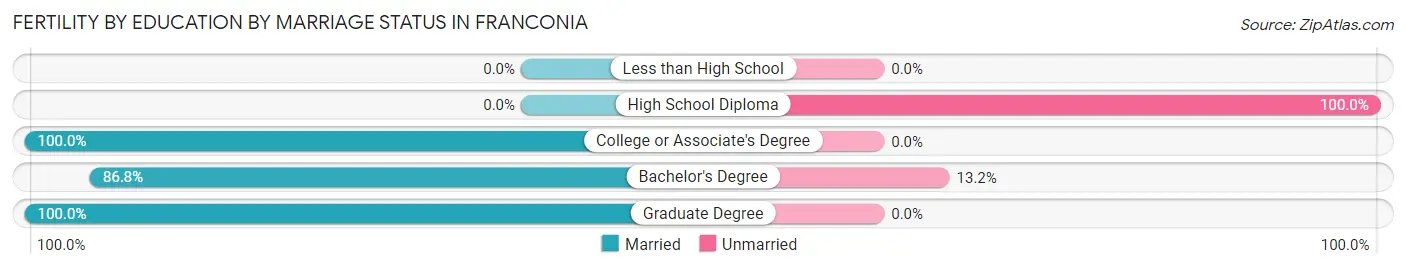
| Educational Attainment | Married | Unmarried |
| Less than High School | 0 (0.0%) | 0 (0.0%) |
| High School Diploma | 0 (0.0%) | 12 (100.0%) |
| College or Associate's Degree | 5 (100.0%) | 0 (0.0%) |
| Bachelor's Degree | 66 (86.8%) | 10 (13.2%) |
| Graduate Degree | 63 (100.0%) | 0 (0.0%) |
| Total | 134 (85.9%) | 22 (14.1%) |
Employment Characteristics in Franconia
Employment by Class of Employer in Franconia
Among the 11,406 employed individuals in Franconia, private company employees (5,636 | 49.4%), federal government employees (3,339 | 29.3%), and not-for-profit organizations (1,145 | 10.0%) make up the most common classes of employment.
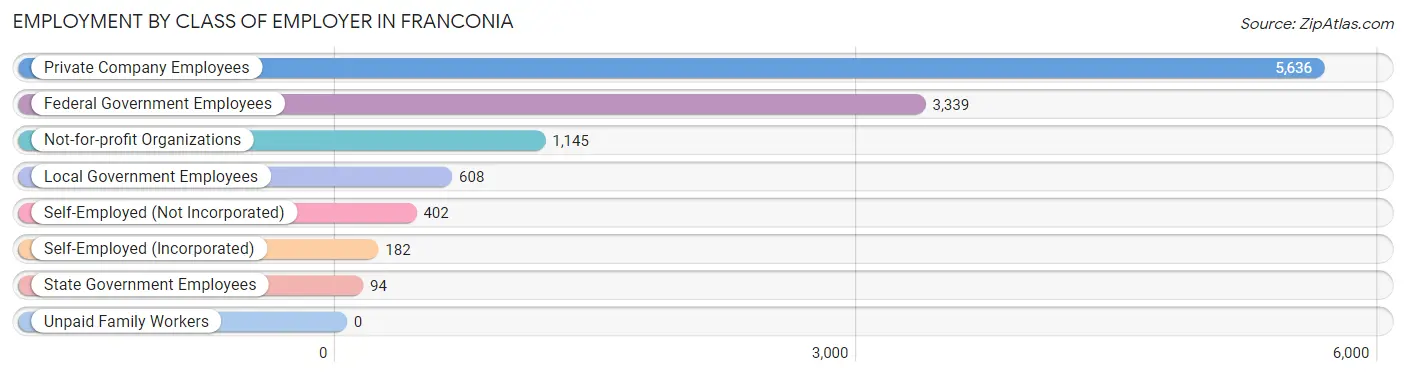
| Employer Class | # Employees | % Employees |
| Private Company Employees | 5,636 | 49.4% |
| Self-Employed (Incorporated) | 182 | 1.6% |
| Self-Employed (Not Incorporated) | 402 | 3.5% |
| Not-for-profit Organizations | 1,145 | 10.0% |
| Local Government Employees | 608 | 5.3% |
| State Government Employees | 94 | 0.8% |
| Federal Government Employees | 3,339 | 29.3% |
| Unpaid Family Workers | 0 | 0.0% |
| Total | 11,406 | 100.0% |
Employment Status by Age in Franconia
According to the labor force statistics for Franconia, out of the total population over 16 years of age (15,133), 78.3% or 11,849 individuals are in the labor force, with 2.7% or 320 of them unemployed. The age group with the highest labor force participation rate is 25 to 29 years, with 96.7% or 1,266 individuals in the labor force. Within the labor force, the 16 to 19 years age range has the highest percentage of unemployed individuals, with 26.2% or 50 of them being unemployed.
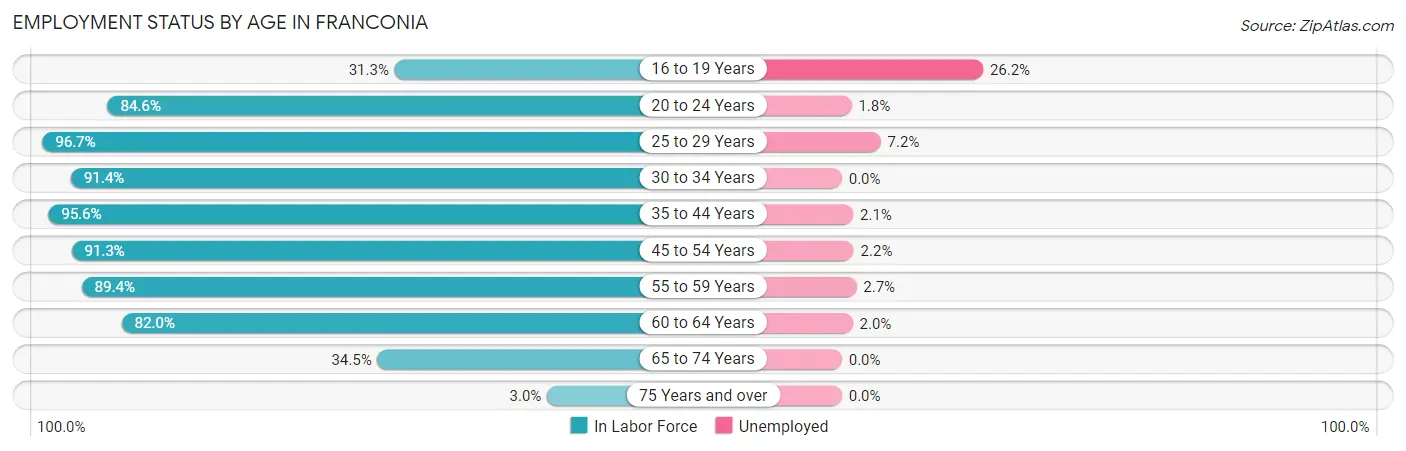
| Age Bracket | In Labor Force | Unemployed |
| 16 to 19 Years | 191 (31.3%) | 50 (26.2%) |
| 20 to 24 Years | 760 (84.6%) | 14 (1.8%) |
| 25 to 29 Years | 1,266 (96.7%) | 91 (7.2%) |
| 30 to 34 Years | 1,361 (91.4%) | 0 (0.0%) |
| 35 to 44 Years | 2,912 (95.6%) | 61 (2.1%) |
| 45 to 54 Years | 2,422 (91.3%) | 53 (2.2%) |
| 55 to 59 Years | 1,162 (89.4%) | 31 (2.7%) |
| 60 to 64 Years | 1,128 (82.0%) | 23 (2.0%) |
| 65 to 74 Years | 628 (34.5%) | 0 (0.0%) |
| 75 Years and over | 19 (3.0%) | 0 (0.0%) |
| Total | 11,849 (78.3%) | 320 (2.7%) |
Employment Status by Educational Attainment in Franconia
According to labor force statistics for Franconia, 91.7% of individuals (10,245) out of the total population between 25 and 64 years of age (11,172) are in the labor force, with 2.5% or 256 of them being unemployed. The group with the highest labor force participation rate are those with the educational attainment of bachelor's degree or higher, with 93.4% or 7,332 individuals in the labor force. Within the labor force, individuals with high school diploma education have the highest percentage of unemployment, with 8.3% or 67 of them being unemployed.
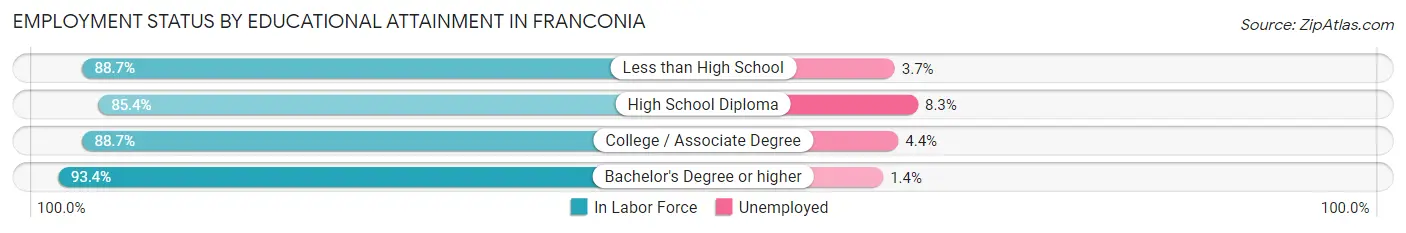
| Educational Attainment | In Labor Force | Unemployed |
| Less than High School | 456 (88.7%) | 19 (3.7%) |
| High School Diploma | 804 (85.4%) | 78 (8.3%) |
| College / Associate Degree | 1,655 (88.7%) | 82 (4.4%) |
| Bachelor's Degree or higher | 7,332 (93.4%) | 110 (1.4%) |
| Total | 10,245 (91.7%) | 279 (2.5%) |
Employment Occupations by Sex in Franconia
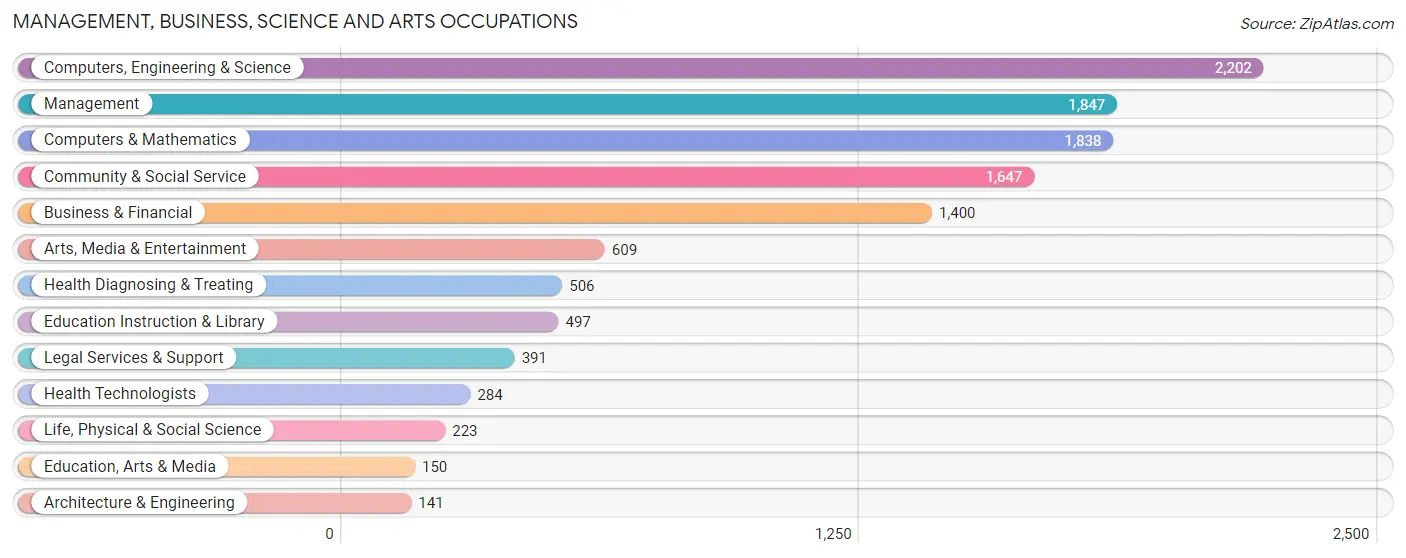
Management, Business, Science and Arts Occupations
The most common Management, Business, Science and Arts occupations in Franconia are Computers, Engineering & Science (2,202 | 19.8%), Management (1,847 | 16.6%), Computers & Mathematics (1,838 | 16.6%), Community & Social Service (1,647 | 14.8%), and Business & Financial (1,400 | 12.6%).
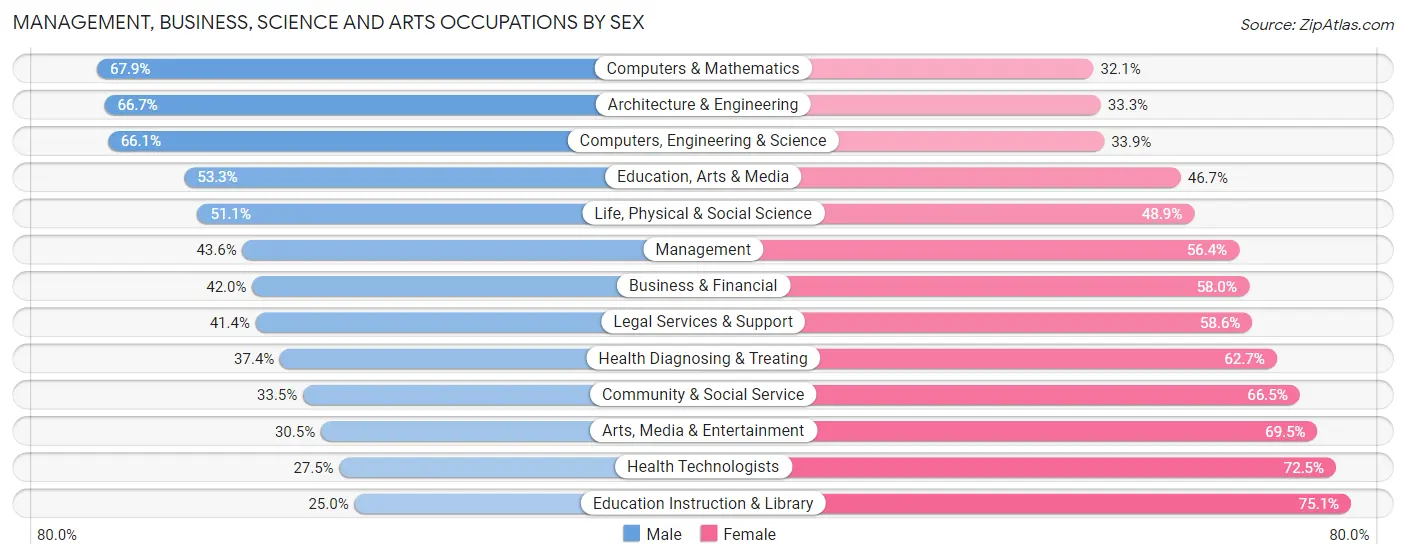
Management, Business, Science and Arts Occupations by Sex
Within the Management, Business, Science and Arts occupations in Franconia, the most male-oriented occupations are Computers & Mathematics (67.9%), Architecture & Engineering (66.7%), and Computers, Engineering & Science (66.1%), while the most female-oriented occupations are Education Instruction & Library (75.0%), Health Technologists (72.5%), and Arts, Media & Entertainment (69.5%).
| Occupation | Male | Female |
| Management | 806 (43.6%) | 1,041 (56.4%) |
| Business & Financial | 588 (42.0%) | 812 (58.0%) |
| Computers, Engineering & Science | 1,456 (66.1%) | 746 (33.9%) |
| Computers & Mathematics | 1,248 (67.9%) | 590 (32.1%) |
| Architecture & Engineering | 94 (66.7%) | 47 (33.3%) |
| Life, Physical & Social Science | 114 (51.1%) | 109 (48.9%) |
| Community & Social Service | 552 (33.5%) | 1,095 (66.5%) |
| Education, Arts & Media | 80 (53.3%) | 70 (46.7%) |
| Legal Services & Support | 162 (41.4%) | 229 (58.6%) |
| Education Instruction & Library | 124 (24.9%) | 373 (75.0%) |
| Arts, Media & Entertainment | 186 (30.5%) | 423 (69.5%) |
| Health Diagnosing & Treating | 189 (37.3%) | 317 (62.6%) |
| Health Technologists | 78 (27.5%) | 206 (72.5%) |
| Total (Category) | 3,591 (47.2%) | 4,011 (52.8%) |
| Total (Overall) | 5,464 (49.2%) | 5,639 (50.8%) |
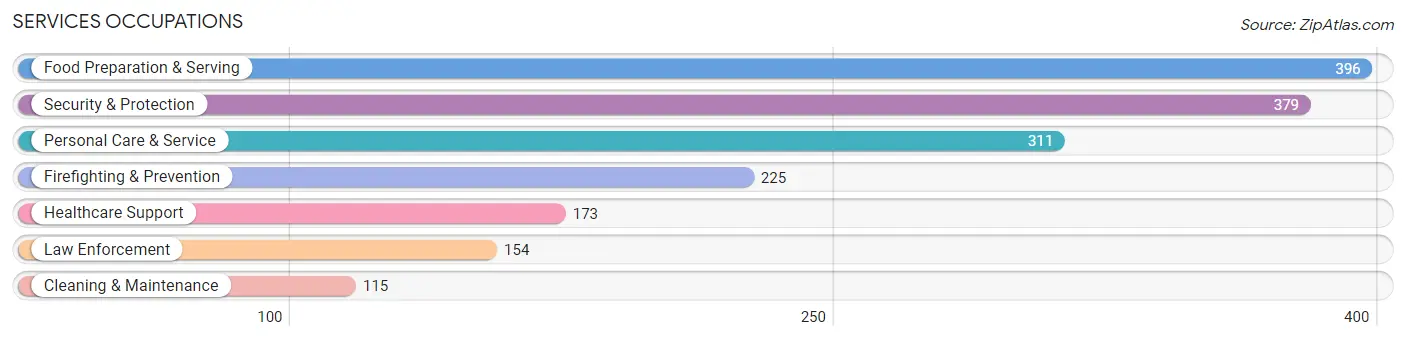
Services Occupations
The most common Services occupations in Franconia are Food Preparation & Serving (396 | 3.6%), Security & Protection (379 | 3.4%), Personal Care & Service (311 | 2.8%), Firefighting & Prevention (225 | 2.0%), and Healthcare Support (173 | 1.6%).
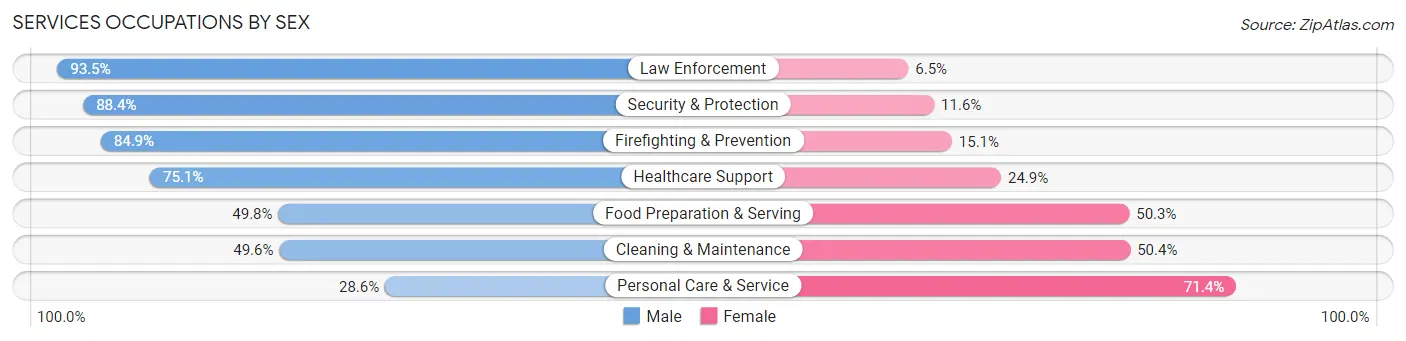
Services Occupations by Sex
Within the Services occupations in Franconia, the most male-oriented occupations are Law Enforcement (93.5%), Security & Protection (88.4%), and Firefighting & Prevention (84.9%), while the most female-oriented occupations are Personal Care & Service (71.4%), Cleaning & Maintenance (50.4%), and Food Preparation & Serving (50.2%).
| Occupation | Male | Female |
| Healthcare Support | 130 (75.1%) | 43 (24.9%) |
| Security & Protection | 335 (88.4%) | 44 (11.6%) |
| Firefighting & Prevention | 191 (84.9%) | 34 (15.1%) |
| Law Enforcement | 144 (93.5%) | 10 (6.5%) |
| Food Preparation & Serving | 197 (49.7%) | 199 (50.2%) |
| Cleaning & Maintenance | 57 (49.6%) | 58 (50.4%) |
| Personal Care & Service | 89 (28.6%) | 222 (71.4%) |
| Total (Category) | 808 (58.8%) | 566 (41.2%) |
| Total (Overall) | 5,464 (49.2%) | 5,639 (50.8%) |
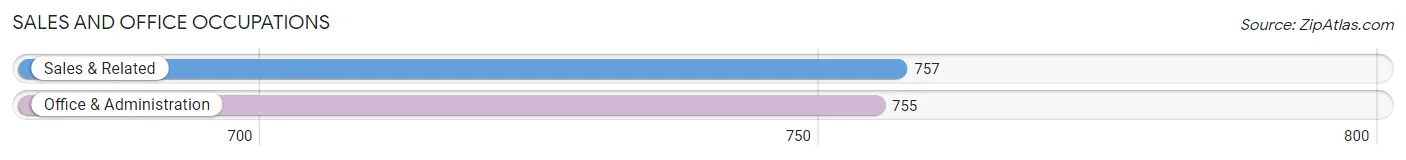
Sales and Office Occupations
The most common Sales and Office occupations in Franconia are Sales & Related (757 | 6.8%), and Office & Administration (755 | 6.8%).
Sales and Office Occupations by Sex
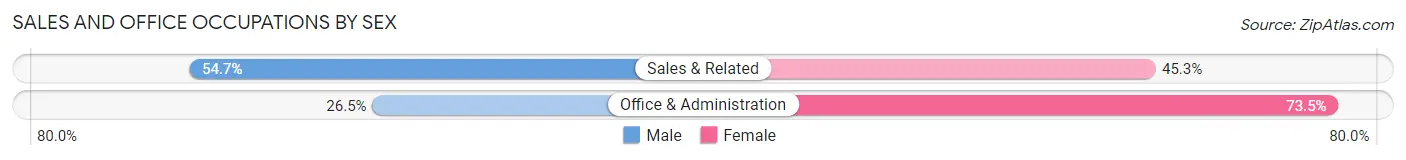
| Occupation | Male | Female |
| Sales & Related | 414 (54.7%) | 343 (45.3%) |
| Office & Administration | 200 (26.5%) | 555 (73.5%) |
| Total (Category) | 614 (40.6%) | 898 (59.4%) |
| Total (Overall) | 5,464 (49.2%) | 5,639 (50.8%) |
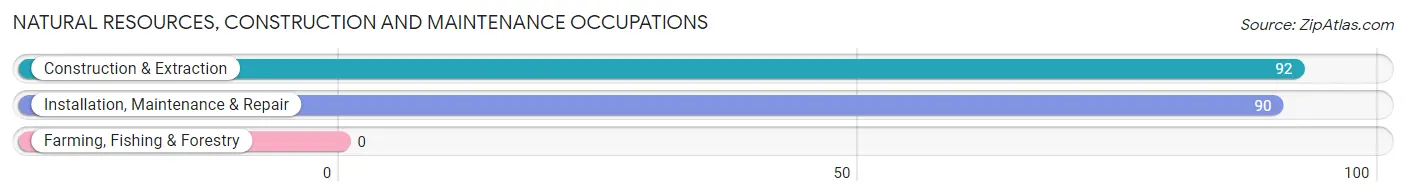
Natural Resources, Construction and Maintenance Occupations
The most common Natural Resources, Construction and Maintenance occupations in Franconia are Construction & Extraction (92 | 0.8%), and Installation, Maintenance & Repair (90 | 0.8%).
Natural Resources, Construction and Maintenance Occupations by Sex
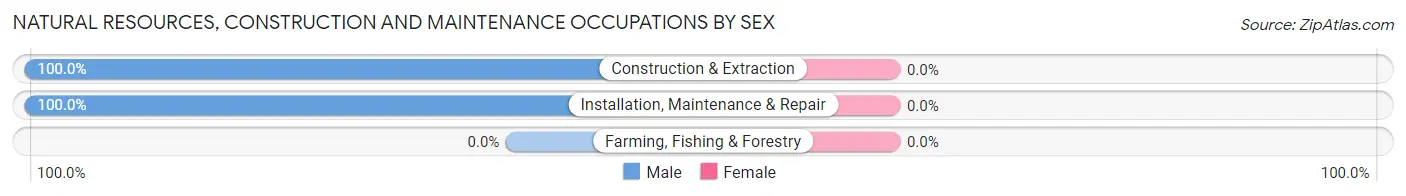
| Occupation | Male | Female |
| Farming, Fishing & Forestry | 0 (0.0%) | 0 (0.0%) |
| Construction & Extraction | 92 (100.0%) | 0 (0.0%) |
| Installation, Maintenance & Repair | 90 (100.0%) | 0 (0.0%) |
| Total (Category) | 182 (100.0%) | 0 (0.0%) |
| Total (Overall) | 5,464 (49.2%) | 5,639 (50.8%) |
Production, Transportation and Moving Occupations
The most common Production, Transportation and Moving occupations in Franconia are Transportation (184 | 1.7%), Production (178 | 1.6%), and Material Moving (71 | 0.6%).
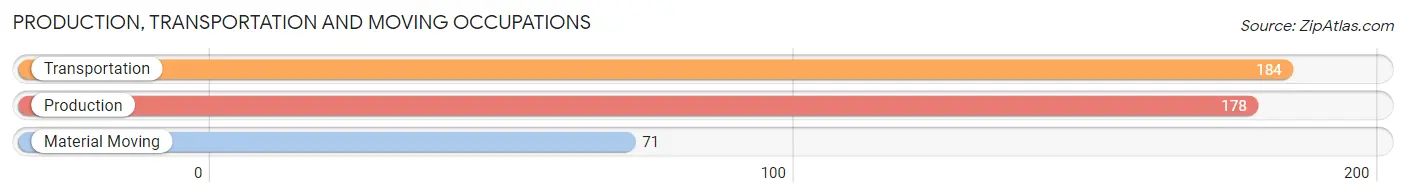
Production, Transportation and Moving Occupations by Sex
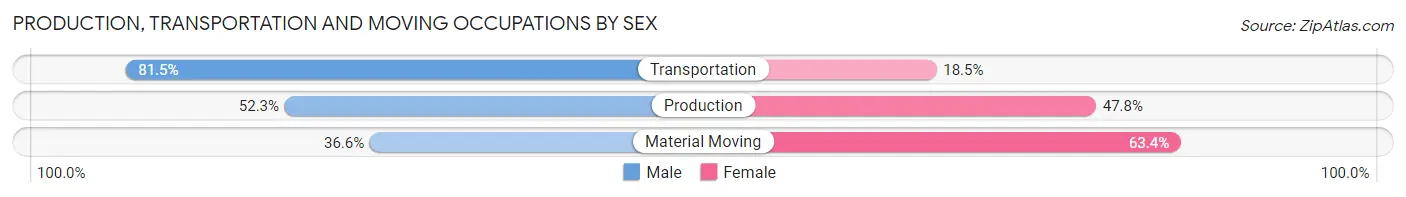
| Occupation | Male | Female |
| Production | 93 (52.2%) | 85 (47.7%) |
| Transportation | 150 (81.5%) | 34 (18.5%) |
| Material Moving | 26 (36.6%) | 45 (63.4%) |
| Total (Category) | 269 (62.1%) | 164 (37.9%) |
| Total (Overall) | 5,464 (49.2%) | 5,639 (50.8%) |
Employment Industries by Sex in Franconia
Employment Industries in Franconia
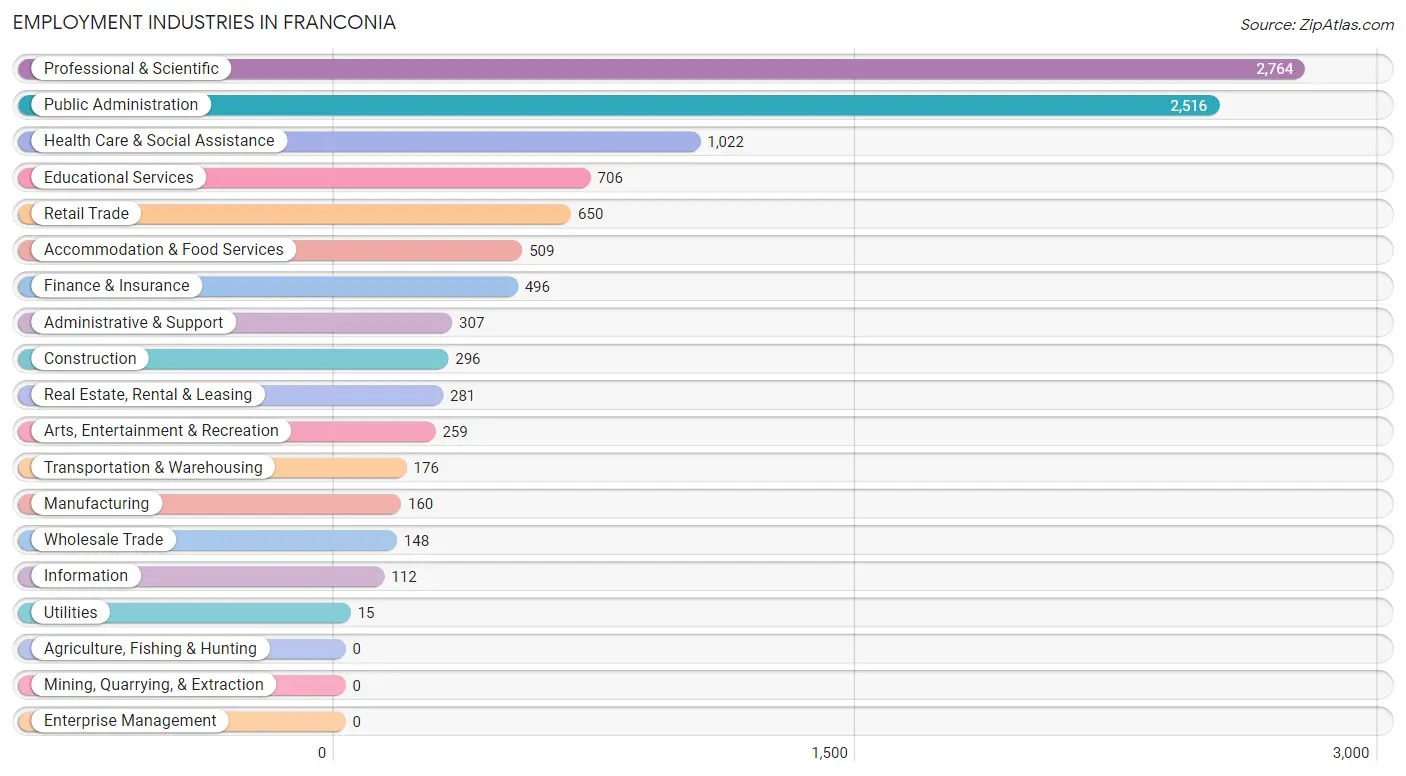
The major employment industries in Franconia include Professional & Scientific (2,764 | 24.9%), Public Administration (2,516 | 22.7%), Health Care & Social Assistance (1,022 | 9.2%), Educational Services (706 | 6.4%), and Retail Trade (650 | 5.9%).
Employment Industries by Sex in Franconia
The Franconia industries that see more men than women are Utilities (100.0%), Real Estate, Rental & Leasing (79.4%), and Wholesale Trade (66.9%), whereas the industries that tend to have a higher number of women are Educational Services (68.3%), Manufacturing (67.5%), and Health Care & Social Assistance (65.9%).
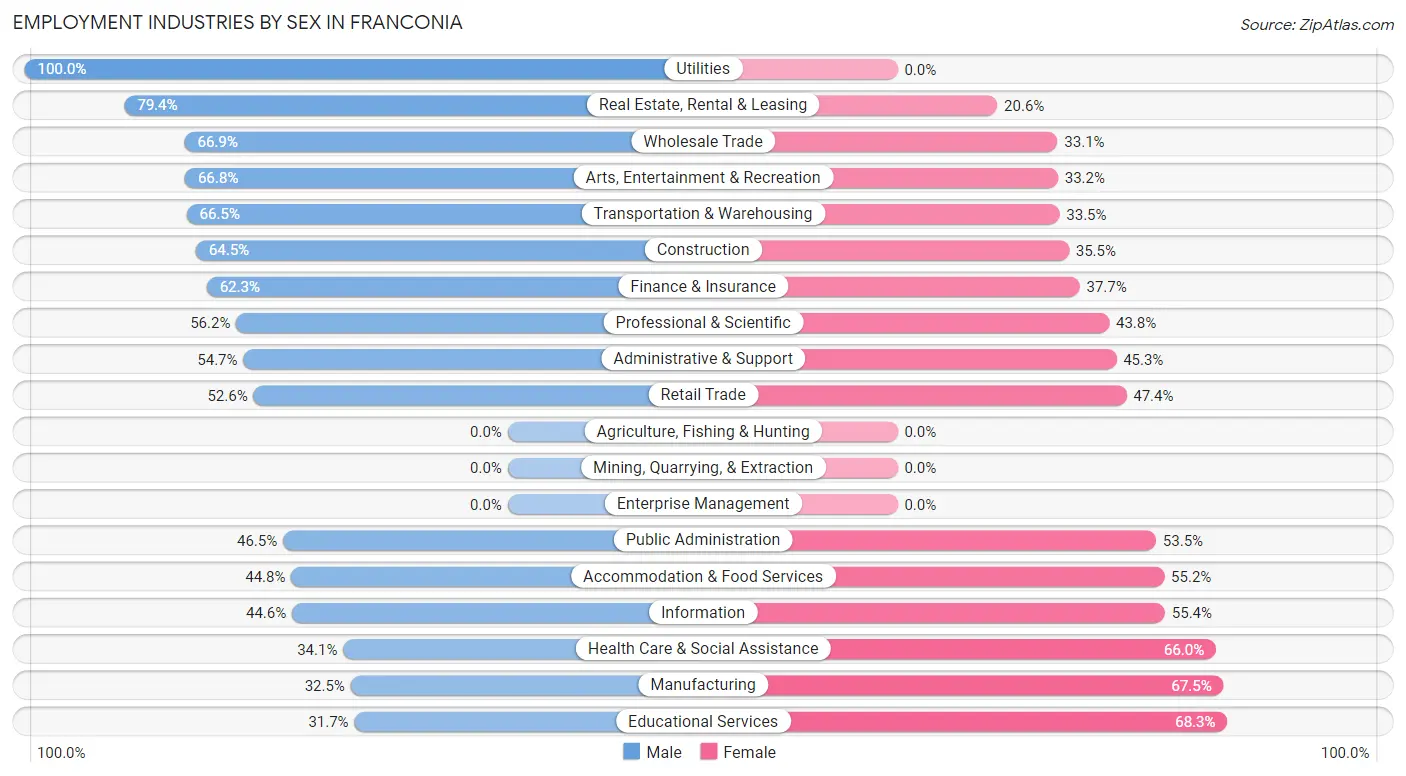
| Industry | Male | Female |
| Agriculture, Fishing & Hunting | 0 (0.0%) | 0 (0.0%) |
| Mining, Quarrying, & Extraction | 0 (0.0%) | 0 (0.0%) |
| Construction | 191 (64.5%) | 105 (35.5%) |
| Manufacturing | 52 (32.5%) | 108 (67.5%) |
| Wholesale Trade | 99 (66.9%) | 49 (33.1%) |
| Retail Trade | 342 (52.6%) | 308 (47.4%) |
| Transportation & Warehousing | 117 (66.5%) | 59 (33.5%) |
| Utilities | 15 (100.0%) | 0 (0.0%) |
| Information | 50 (44.6%) | 62 (55.4%) |
| Finance & Insurance | 309 (62.3%) | 187 (37.7%) |
| Real Estate, Rental & Leasing | 223 (79.4%) | 58 (20.6%) |
| Professional & Scientific | 1,553 (56.2%) | 1,211 (43.8%) |
| Enterprise Management | 0 (0.0%) | 0 (0.0%) |
| Administrative & Support | 168 (54.7%) | 139 (45.3%) |
| Educational Services | 224 (31.7%) | 482 (68.3%) |
| Health Care & Social Assistance | 348 (34.1%) | 674 (65.9%) |
| Arts, Entertainment & Recreation | 173 (66.8%) | 86 (33.2%) |
| Accommodation & Food Services | 228 (44.8%) | 281 (55.2%) |
| Public Administration | 1,170 (46.5%) | 1,346 (53.5%) |
| Total | 5,464 (49.2%) | 5,639 (50.8%) |
Education in Franconia
School Enrollment in Franconia
The most common levels of schooling among the 3,985 students in Franconia are college / undergraduate (1,029 | 25.8%), middle school (720 | 18.1%), and elementary school (686 | 17.2%).
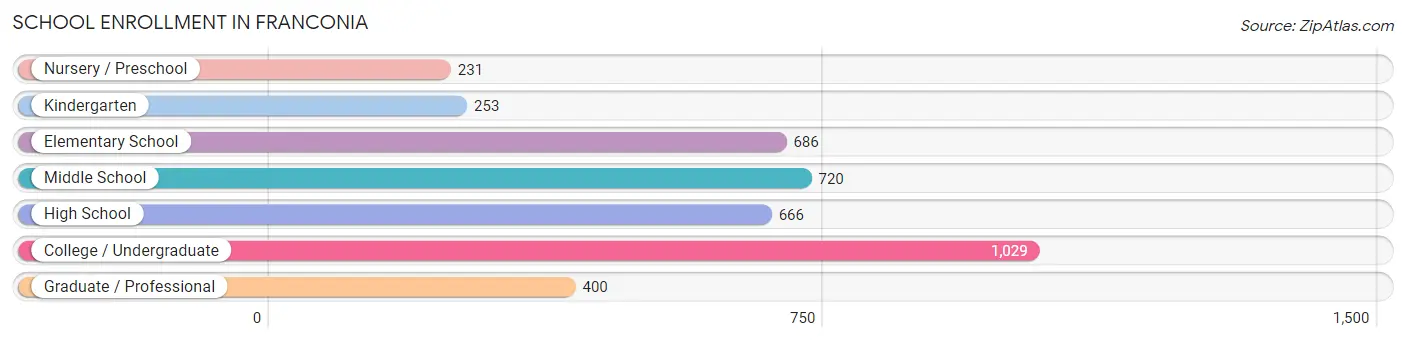
| School Level | # Students | % Students |
| Nursery / Preschool | 231 | 5.8% |
| Kindergarten | 253 | 6.4% |
| Elementary School | 686 | 17.2% |
| Middle School | 720 | 18.1% |
| High School | 666 | 16.7% |
| College / Undergraduate | 1,029 | 25.8% |
| Graduate / Professional | 400 | 10.0% |
| Total | 3,985 | 100.0% |
School Enrollment by Age by Funding Source in Franconia
Out of a total of 3,985 students who are enrolled in schools in Franconia, 944 (23.7%) attend a private institution, while the remaining 3,041 (76.3%) are enrolled in public schools. The age group of 3 to 4 year olds has the highest likelihood of being enrolled in private schools, with 138 (83.1% in the age bracket) enrolled. Conversely, the age group of 18 to 19 year olds has the lowest likelihood of being enrolled in a private school, with 178 (95.2% in the age bracket) attending a public institution.
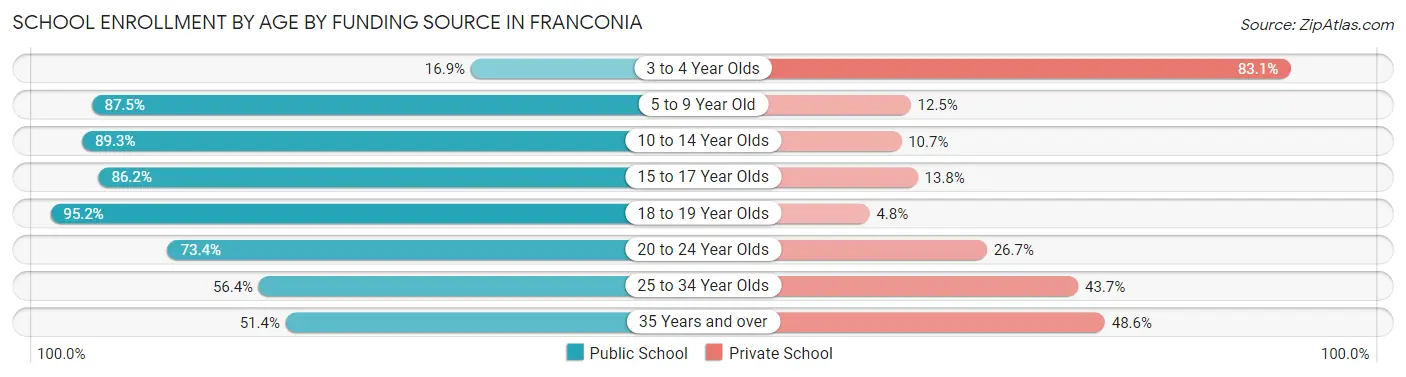
| Age Bracket | Public School | Private School |
| 3 to 4 Year Olds | 28 (16.9%) | 138 (83.1%) |
| 5 to 9 Year Old | 758 (87.5%) | 108 (12.5%) |
| 10 to 14 Year Olds | 791 (89.3%) | 95 (10.7%) |
| 15 to 17 Year Olds | 526 (86.2%) | 84 (13.8%) |
| 18 to 19 Year Olds | 178 (95.2%) | 9 (4.8%) |
| 20 to 24 Year Olds | 278 (73.4%) | 101 (26.7%) |
| 25 to 34 Year Olds | 253 (56.4%) | 196 (43.6%) |
| 35 Years and over | 227 (51.4%) | 215 (48.6%) |
| Total | 3,041 (76.3%) | 944 (23.7%) |
Educational Attainment by Field of Study in Franconia
Business (1,982 | 20.3%), social sciences (1,351 | 13.8%), computers & mathematics (1,054 | 10.8%), engineering (749 | 7.6%), and psychology (603 | 6.2%) are the most common fields of study among 9,790 individuals in Franconia who have obtained a bachelor's degree or higher.
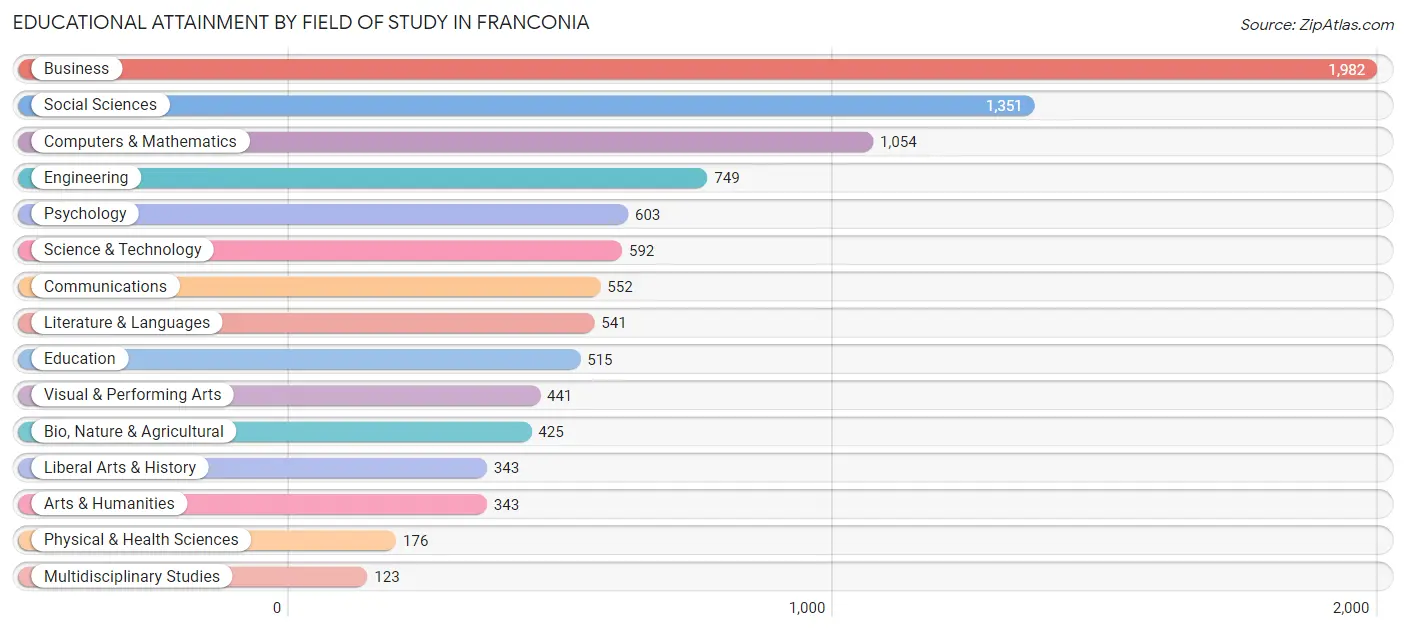
| Field of Study | # Graduates | % Graduates |
| Computers & Mathematics | 1,054 | 10.8% |
| Bio, Nature & Agricultural | 425 | 4.3% |
| Physical & Health Sciences | 176 | 1.8% |
| Psychology | 603 | 6.2% |
| Social Sciences | 1,351 | 13.8% |
| Engineering | 749 | 7.6% |
| Multidisciplinary Studies | 123 | 1.3% |
| Science & Technology | 592 | 6.0% |
| Business | 1,982 | 20.3% |
| Education | 515 | 5.3% |
| Literature & Languages | 541 | 5.5% |
| Liberal Arts & History | 343 | 3.5% |
| Visual & Performing Arts | 441 | 4.5% |
| Communications | 552 | 5.6% |
| Arts & Humanities | 343 | 3.5% |
| Total | 9,790 | 100.0% |
Transportation & Commute in Franconia
Vehicle Availability by Sex in Franconia
The most prevalent vehicle ownership categories in Franconia are males with 2 vehicles (2,822, accounting for 48.9%) and females with 2 vehicles (2,750, making up 50.1%).
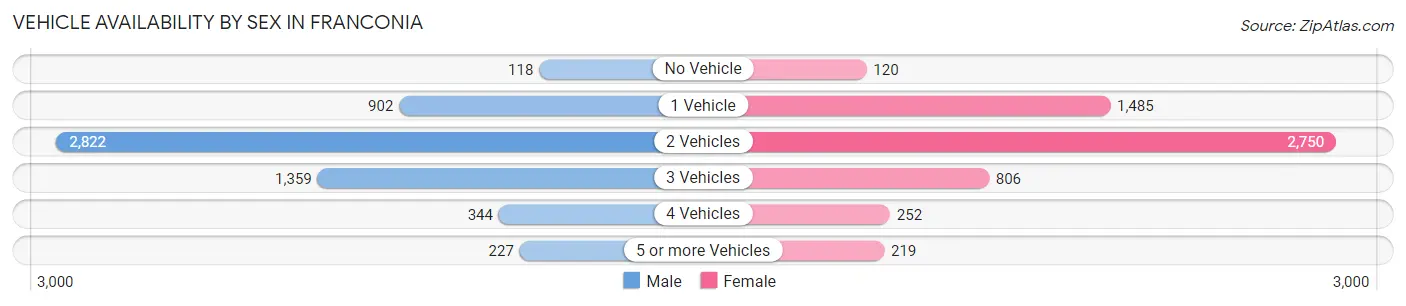
| Vehicles Available | Male | Female |
| No Vehicle | 118 (2.0%) | 120 (2.1%) |
| 1 Vehicle | 902 (15.6%) | 1,485 (26.4%) |
| 2 Vehicles | 2,822 (48.9%) | 2,750 (48.8%) |
| 3 Vehicles | 1,359 (23.5%) | 806 (14.3%) |
| 4 Vehicles | 344 (6.0%) | 252 (4.5%) |
| 5 or more Vehicles | 227 (3.9%) | 219 (3.9%) |
| Total | 5,772 (100.0%) | 5,632 (100.0%) |
Commute Time in Franconia
The most frequently occuring commute durations in Franconia are 30 to 34 minutes (1,533 commuters, 19.4%), 45 to 59 minutes (1,207 commuters, 15.3%), and 20 to 24 minutes (1,059 commuters, 13.4%).
| Commute Time | # Commuters | % Commuters |
| Less than 5 Minutes | 85 | 1.1% |
| 5 to 9 Minutes | 102 | 1.3% |
| 10 to 14 Minutes | 650 | 8.2% |
| 15 to 19 Minutes | 617 | 7.8% |
| 20 to 24 Minutes | 1,059 | 13.4% |
| 25 to 29 Minutes | 427 | 5.4% |
| 30 to 34 Minutes | 1,533 | 19.4% |
| 35 to 39 Minutes | 504 | 6.4% |
| 40 to 44 Minutes | 754 | 9.5% |
| 45 to 59 Minutes | 1,207 | 15.3% |
| 60 to 89 Minutes | 791 | 10.0% |
| 90 or more Minutes | 174 | 2.2% |
Commute Time by Sex in Franconia
The most common commute times in Franconia are 30 to 34 minutes (778 commuters, 19.4%) for males and 30 to 34 minutes (755 commuters, 19.4%) for females.
| Commute Time | Male | Female |
| Less than 5 Minutes | 17 (0.4%) | 68 (1.8%) |
| 5 to 9 Minutes | 5 (0.1%) | 97 (2.5%) |
| 10 to 14 Minutes | 295 (7.3%) | 355 (9.1%) |
| 15 to 19 Minutes | 265 (6.6%) | 352 (9.0%) |
| 20 to 24 Minutes | 527 (13.1%) | 532 (13.7%) |
| 25 to 29 Minutes | 245 (6.1%) | 182 (4.7%) |
| 30 to 34 Minutes | 778 (19.4%) | 755 (19.4%) |
| 35 to 39 Minutes | 395 (9.9%) | 109 (2.8%) |
| 40 to 44 Minutes | 420 (10.5%) | 334 (8.6%) |
| 45 to 59 Minutes | 624 (15.5%) | 583 (15.0%) |
| 60 to 89 Minutes | 335 (8.4%) | 456 (11.7%) |
| 90 or more Minutes | 106 (2.6%) | 68 (1.8%) |
Time of Departure to Work by Sex in Franconia
The most frequent times of departure to work in Franconia are 6:30 AM to 6:59 AM (746, 18.6%) for males and 7:00 AM to 7:29 AM (698, 17.9%) for females.
| Time of Departure | Male | Female |
| 12:00 AM to 4:59 AM | 35 (0.9%) | 46 (1.2%) |
| 5:00 AM to 5:29 AM | 223 (5.6%) | 158 (4.1%) |
| 5:30 AM to 5:59 AM | 158 (3.9%) | 121 (3.1%) |
| 6:00 AM to 6:29 AM | 434 (10.8%) | 303 (7.8%) |
| 6:30 AM to 6:59 AM | 746 (18.6%) | 253 (6.5%) |
| 7:00 AM to 7:29 AM | 613 (15.3%) | 698 (17.9%) |
| 7:30 AM to 7:59 AM | 322 (8.0%) | 678 (17.4%) |
| 8:00 AM to 8:29 AM | 525 (13.1%) | 584 (15.0%) |
| 8:30 AM to 8:59 AM | 179 (4.5%) | 238 (6.1%) |
| 9:00 AM to 9:59 AM | 232 (5.8%) | 432 (11.1%) |
| 10:00 AM to 10:59 AM | 130 (3.2%) | 166 (4.3%) |
| 11:00 AM to 11:59 AM | 73 (1.8%) | 58 (1.5%) |
| 12:00 PM to 3:59 PM | 177 (4.4%) | 103 (2.6%) |
| 4:00 PM to 11:59 PM | 165 (4.1%) | 53 (1.4%) |
| Total | 4,012 (100.0%) | 3,891 (100.0%) |
Housing Occupancy in Franconia
Occupancy by Ownership in Franconia
Of the total 7,456 dwellings in Franconia, owner-occupied units account for 5,643 (75.7%), while renter-occupied units make up 1,813 (24.3%).
| Occupancy | # Housing Units | % Housing Units |
| Owner Occupied Housing Units | 5,643 | 75.7% |
| Renter-Occupied Housing Units | 1,813 | 24.3% |
| Total Occupied Housing Units | 7,456 | 100.0% |
Occupancy by Household Size in Franconia
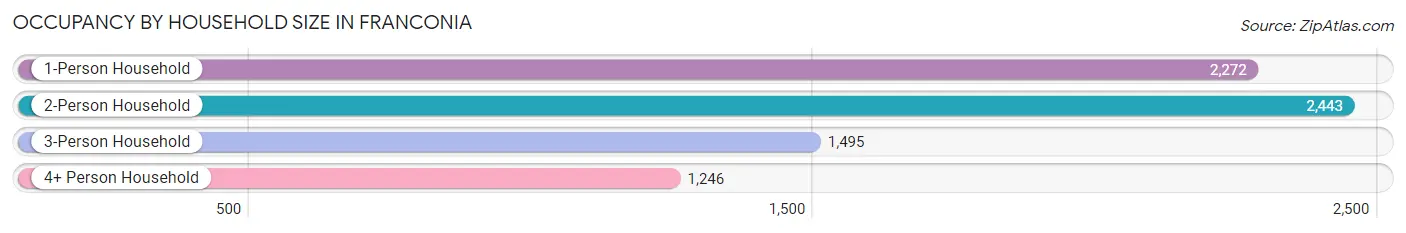
| Household Size | # Housing Units | % Housing Units |
| 1-Person Household | 2,272 | 30.5% |
| 2-Person Household | 2,443 | 32.8% |
| 3-Person Household | 1,495 | 20.1% |
| 4+ Person Household | 1,246 | 16.7% |
| Total Housing Units | 7,456 | 100.0% |
Occupancy by Ownership by Household Size in Franconia
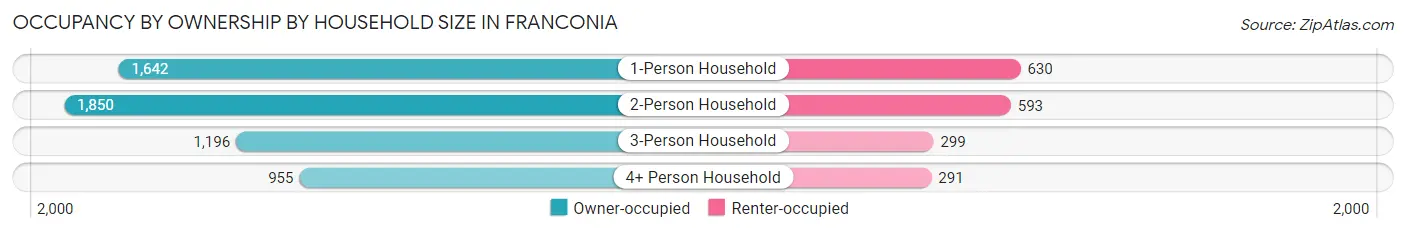
| Household Size | Owner-occupied | Renter-occupied |
| 1-Person Household | 1,642 (72.3%) | 630 (27.7%) |
| 2-Person Household | 1,850 (75.7%) | 593 (24.3%) |
| 3-Person Household | 1,196 (80.0%) | 299 (20.0%) |
| 4+ Person Household | 955 (76.6%) | 291 (23.4%) |
| Total Housing Units | 5,643 (75.7%) | 1,813 (24.3%) |
Occupancy by Educational Attainment in Franconia
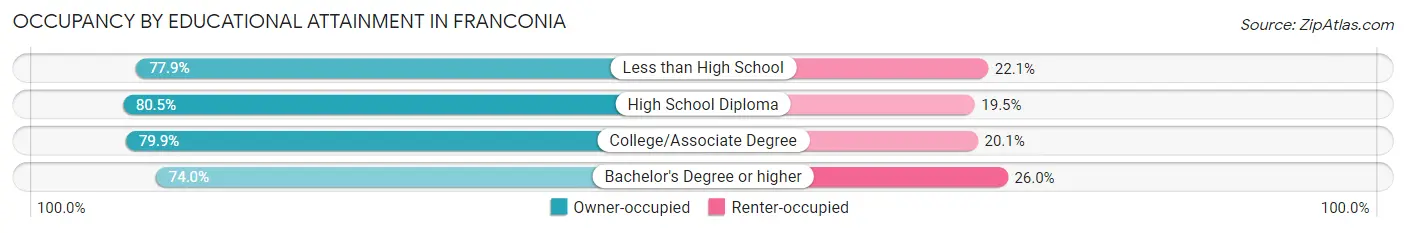
| Household Size | Owner-occupied | Renter-occupied |
| Less than High School | 211 (77.9%) | 60 (22.1%) |
| High School Diploma | 455 (80.5%) | 110 (19.5%) |
| College/Associate Degree | 1,078 (79.9%) | 271 (20.1%) |
| Bachelor's Degree or higher | 3,899 (74.0%) | 1,372 (26.0%) |
Occupancy by Age of Householder in Franconia
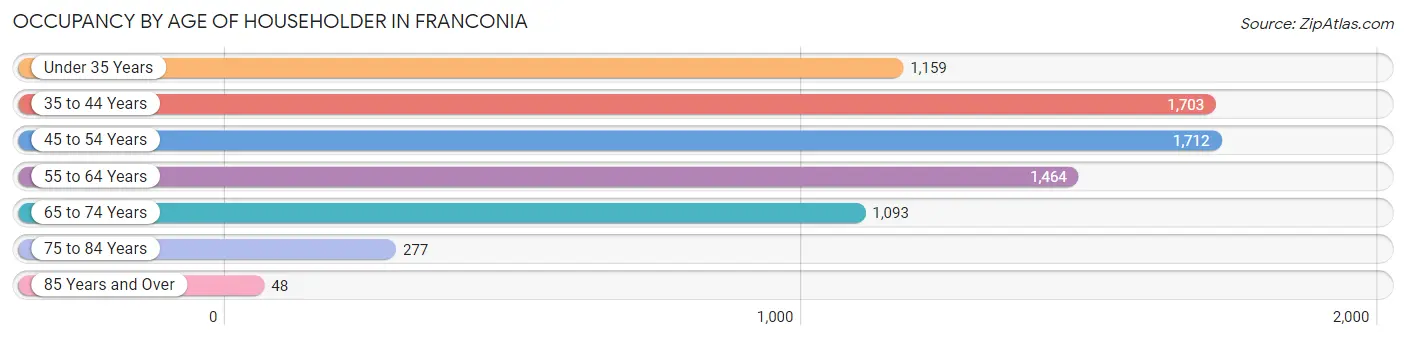
| Age Bracket | # Households | % Households |
| Under 35 Years | 1,159 | 15.5% |
| 35 to 44 Years | 1,703 | 22.8% |
| 45 to 54 Years | 1,712 | 23.0% |
| 55 to 64 Years | 1,464 | 19.6% |
| 65 to 74 Years | 1,093 | 14.7% |
| 75 to 84 Years | 277 | 3.7% |
| 85 Years and Over | 48 | 0.6% |
| Total | 7,456 | 100.0% |
Housing Finances in Franconia
Median Income by Occupancy in Franconia
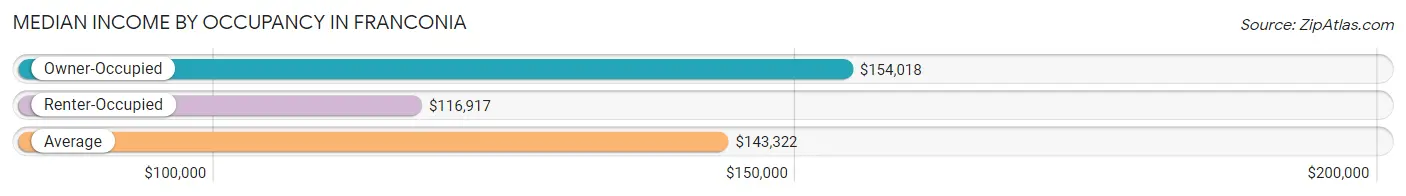
| Occupancy Type | # Households | Median Income |
| Owner-Occupied | 5,643 (75.7%) | $154,018 |
| Renter-Occupied | 1,813 (24.3%) | $116,917 |
| Average | 7,456 (100.0%) | $143,322 |
Occupancy by Householder Income Bracket in Franconia
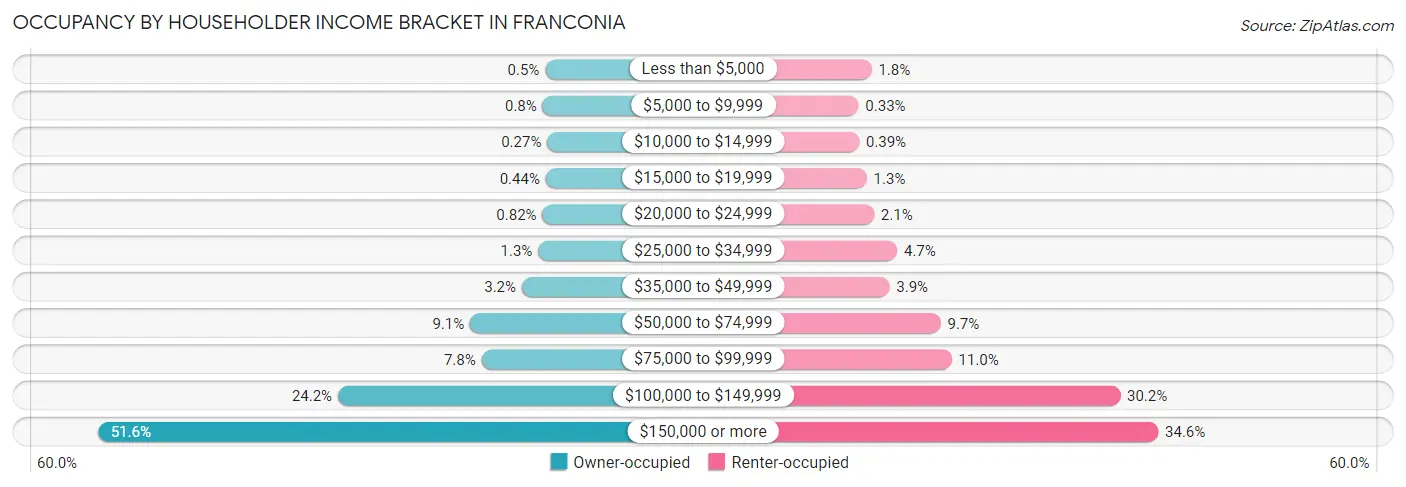
| Income Bracket | Owner-occupied | Renter-occupied |
| Less than $5,000 | 28 (0.5%) | 33 (1.8%) |
| $5,000 to $9,999 | 45 (0.8%) | 6 (0.3%) |
| $10,000 to $14,999 | 15 (0.3%) | 7 (0.4%) |
| $15,000 to $19,999 | 25 (0.4%) | 23 (1.3%) |
| $20,000 to $24,999 | 46 (0.8%) | 38 (2.1%) |
| $25,000 to $34,999 | 74 (1.3%) | 86 (4.7%) |
| $35,000 to $49,999 | 179 (3.2%) | 70 (3.9%) |
| $50,000 to $74,999 | 513 (9.1%) | 176 (9.7%) |
| $75,000 to $99,999 | 439 (7.8%) | 199 (11.0%) |
| $100,000 to $149,999 | 1,365 (24.2%) | 548 (30.2%) |
| $150,000 or more | 2,914 (51.6%) | 627 (34.6%) |
| Total | 5,643 (100.0%) | 1,813 (100.0%) |
Monthly Housing Cost Tiers in Franconia
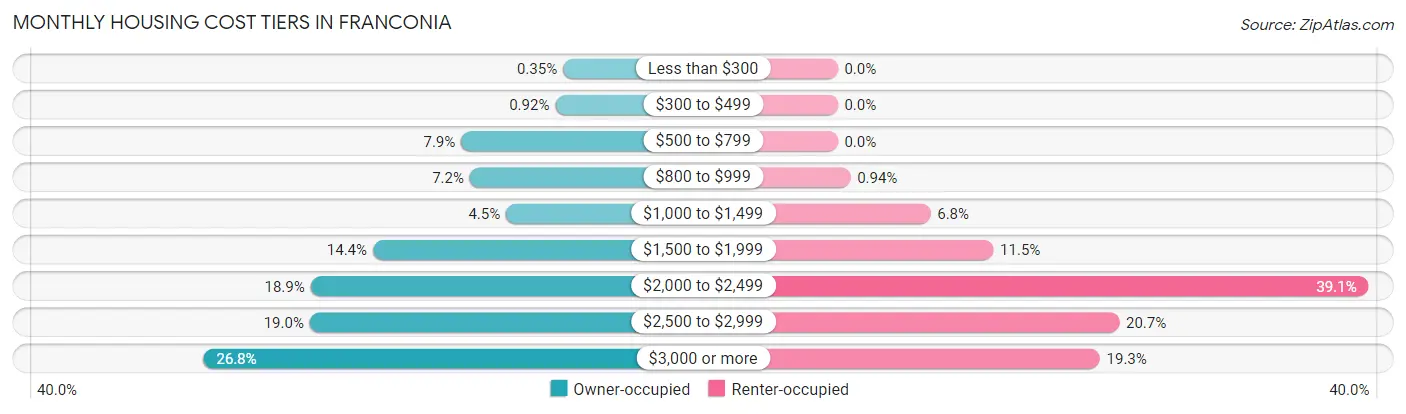
| Monthly Cost | Owner-occupied | Renter-occupied |
| Less than $300 | 20 (0.4%) | 0 (0.0%) |
| $300 to $499 | 52 (0.9%) | 0 (0.0%) |
| $500 to $799 | 443 (7.9%) | 0 (0.0%) |
| $800 to $999 | 407 (7.2%) | 17 (0.9%) |
| $1,000 to $1,499 | 256 (4.5%) | 124 (6.8%) |
| $1,500 to $1,999 | 810 (14.3%) | 208 (11.5%) |
| $2,000 to $2,499 | 1,069 (18.9%) | 709 (39.1%) |
| $2,500 to $2,999 | 1,072 (19.0%) | 376 (20.7%) |
| $3,000 or more | 1,514 (26.8%) | 350 (19.3%) |
| Total | 5,643 (100.0%) | 1,813 (100.0%) |
Physical Housing Characteristics in Franconia
Housing Structures in Franconia
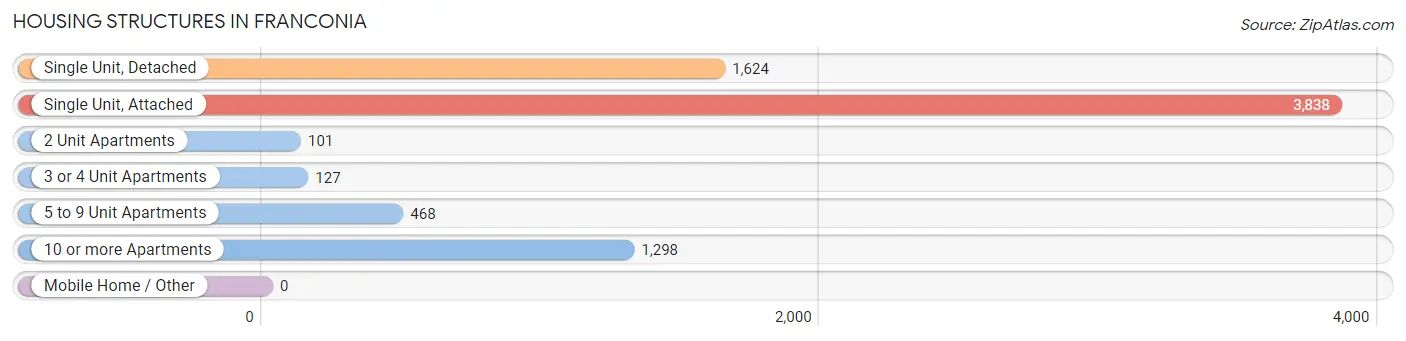
| Structure Type | # Housing Units | % Housing Units |
| Single Unit, Detached | 1,624 | 21.8% |
| Single Unit, Attached | 3,838 | 51.5% |
| 2 Unit Apartments | 101 | 1.3% |
| 3 or 4 Unit Apartments | 127 | 1.7% |
| 5 to 9 Unit Apartments | 468 | 6.3% |
| 10 or more Apartments | 1,298 | 17.4% |
| Mobile Home / Other | 0 | 0.0% |
| Total | 7,456 | 100.0% |
Housing Structures by Occupancy in Franconia
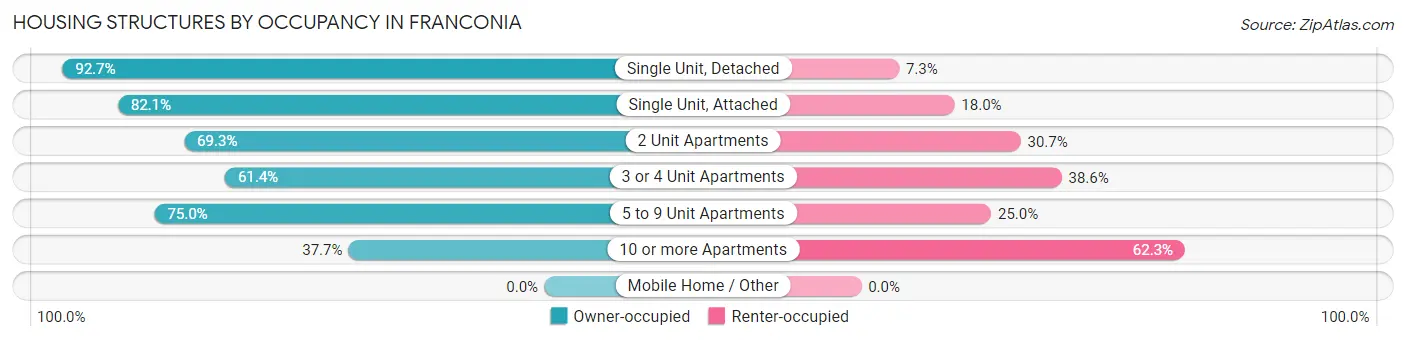
| Structure Type | Owner-occupied | Renter-occupied |
| Single Unit, Detached | 1,506 (92.7%) | 118 (7.3%) |
| Single Unit, Attached | 3,149 (82.1%) | 689 (17.9%) |
| 2 Unit Apartments | 70 (69.3%) | 31 (30.7%) |
| 3 or 4 Unit Apartments | 78 (61.4%) | 49 (38.6%) |
| 5 to 9 Unit Apartments | 351 (75.0%) | 117 (25.0%) |
| 10 or more Apartments | 489 (37.7%) | 809 (62.3%) |
| Mobile Home / Other | 0 (0.0%) | 0 (0.0%) |
| Total | 5,643 (75.7%) | 1,813 (24.3%) |
Housing Structures by Number of Rooms in Franconia
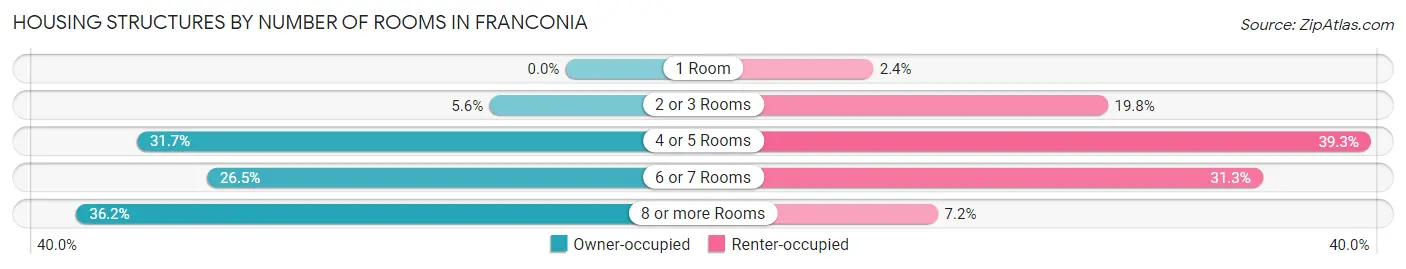
| Number of Rooms | Owner-occupied | Renter-occupied |
| 1 Room | 0 (0.0%) | 44 (2.4%) |
| 2 or 3 Rooms | 318 (5.6%) | 359 (19.8%) |
| 4 or 5 Rooms | 1,788 (31.7%) | 712 (39.3%) |
| 6 or 7 Rooms | 1,496 (26.5%) | 567 (31.3%) |
| 8 or more Rooms | 2,041 (36.2%) | 131 (7.2%) |
| Total | 5,643 (100.0%) | 1,813 (100.0%) |
Housing Structure by Heating Type in Franconia
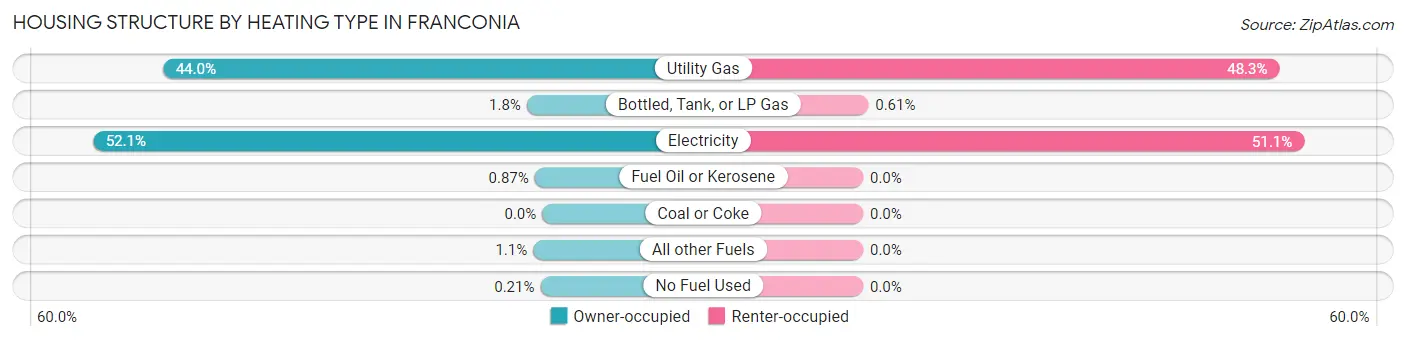
| Heating Type | Owner-occupied | Renter-occupied |
| Utility Gas | 2,482 (44.0%) | 875 (48.3%) |
| Bottled, Tank, or LP Gas | 101 (1.8%) | 11 (0.6%) |
| Electricity | 2,940 (52.1%) | 927 (51.1%) |
| Fuel Oil or Kerosene | 49 (0.9%) | 0 (0.0%) |
| Coal or Coke | 0 (0.0%) | 0 (0.0%) |
| All other Fuels | 59 (1.1%) | 0 (0.0%) |
| No Fuel Used | 12 (0.2%) | 0 (0.0%) |
| Total | 5,643 (100.0%) | 1,813 (100.0%) |
Household Vehicle Usage in Franconia
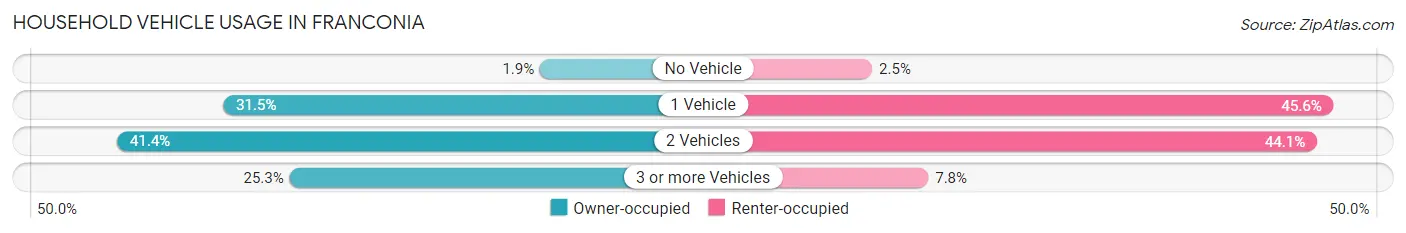
| Vehicles per Household | Owner-occupied | Renter-occupied |
| No Vehicle | 106 (1.9%) | 46 (2.5%) |
| 1 Vehicle | 1,776 (31.5%) | 827 (45.6%) |
| 2 Vehicles | 2,335 (41.4%) | 799 (44.1%) |
| 3 or more Vehicles | 1,426 (25.3%) | 141 (7.8%) |
| Total | 5,643 (100.0%) | 1,813 (100.0%) |
Real Estate & Mortgages in Franconia
Real Estate and Mortgage Overview in Franconia
| Characteristic | Without Mortgage | With Mortgage |
| Housing Units | 1,180 | 4,463 |
| Median Property Value | $497,100 | $510,500 |
| Median Household Income | $107,625 | $2,611 |
| Monthly Housing Costs | $836 | $1,514 |
| Real Estate Taxes | $5,038 | $62 |
Property Value by Mortgage Status in Franconia

| Property Value | Without Mortgage | With Mortgage |
| Less than $50,000 | 11 (0.9%) | 12 (0.3%) |
| $50,000 to $99,999 | 0 (0.0%) | 0 (0.0%) |
| $100,000 to $299,999 | 24 (2.0%) | 212 (4.8%) |
| $300,000 to $499,999 | 560 (47.5%) | 1,935 (43.4%) |
| $500,000 to $749,999 | 390 (33.1%) | 1,722 (38.6%) |
| $750,000 to $999,999 | 51 (4.3%) | 462 (10.3%) |
| $1,000,000 or more | 144 (12.2%) | 120 (2.7%) |
| Total | 1,180 (100.0%) | 4,463 (100.0%) |
Household Income by Mortgage Status in Franconia
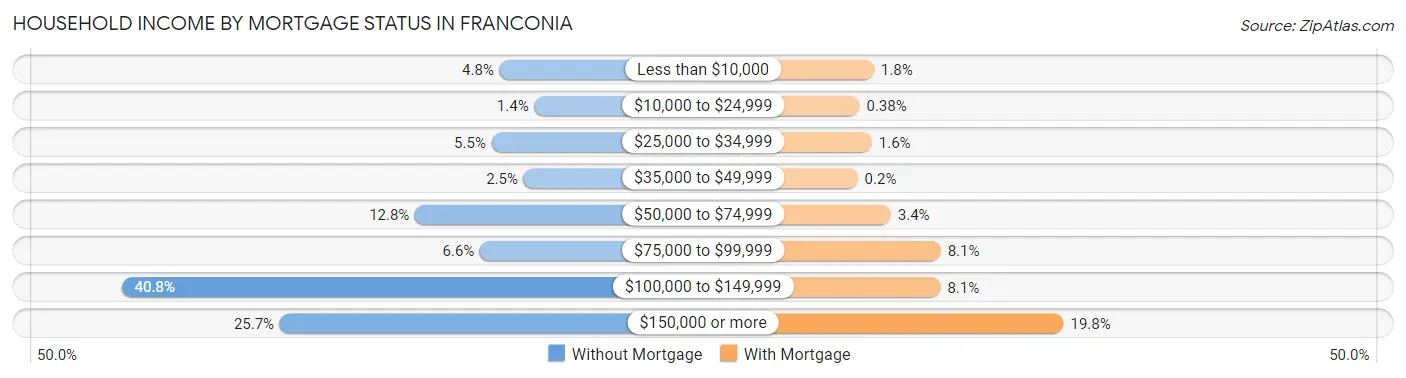
| Household Income | Without Mortgage | With Mortgage |
| Less than $10,000 | 56 (4.8%) | 78 (1.8%) |
| $10,000 to $24,999 | 17 (1.4%) | 17 (0.4%) |
| $25,000 to $34,999 | 65 (5.5%) | 69 (1.5%) |
| $35,000 to $49,999 | 29 (2.5%) | 9 (0.2%) |
| $50,000 to $74,999 | 151 (12.8%) | 150 (3.4%) |
| $75,000 to $99,999 | 78 (6.6%) | 362 (8.1%) |
| $100,000 to $149,999 | 481 (40.8%) | 361 (8.1%) |
| $150,000 or more | 303 (25.7%) | 884 (19.8%) |
| Total | 1,180 (100.0%) | 4,463 (100.0%) |
Property Value to Household Income Ratio in Franconia
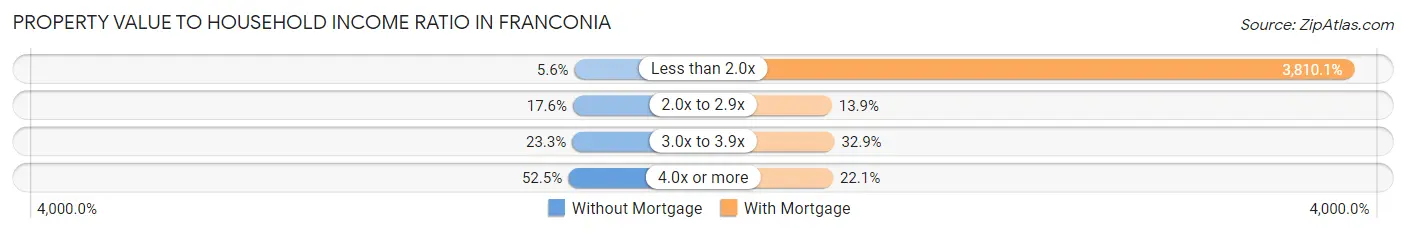
| Value-to-Income Ratio | Without Mortgage | With Mortgage |
| Less than 2.0x | 66 (5.6%) | 170,043 (3,810.1%) |
| 2.0x to 2.9x | 208 (17.6%) | 618 (13.9%) |
| 3.0x to 3.9x | 275 (23.3%) | 1,466 (32.9%) |
| 4.0x or more | 620 (52.5%) | 988 (22.1%) |
| Total | 1,180 (100.0%) | 4,463 (100.0%) |
Real Estate Taxes by Mortgage Status in Franconia
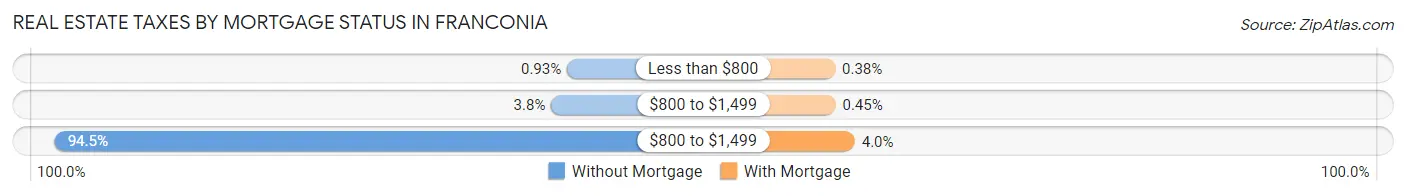
| Property Taxes | Without Mortgage | With Mortgage |
| Less than $800 | 11 (0.9%) | 17 (0.4%) |
| $800 to $1,499 | 45 (3.8%) | 20 (0.4%) |
| $800 to $1,499 | 1,115 (94.5%) | 177 (4.0%) |
| Total | 1,180 (100.0%) | 4,463 (100.0%) |
Health & Disability in Franconia
Health Insurance Coverage by Age in Franconia
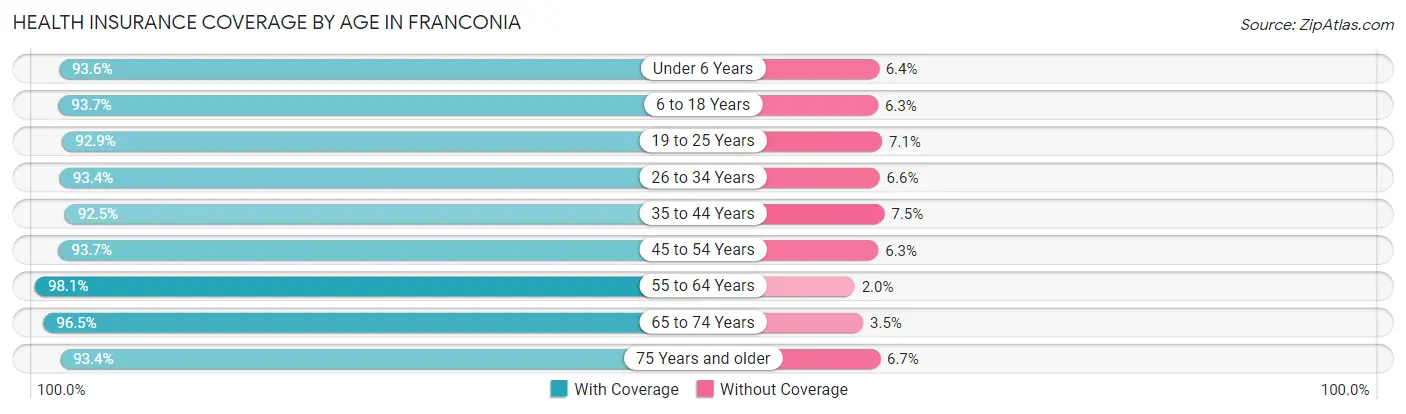
| Age Bracket | With Coverage | Without Coverage |
| Under 6 Years | 933 (93.6%) | 64 (6.4%) |
| 6 to 18 Years | 2,138 (93.7%) | 144 (6.3%) |
| 19 to 25 Years | 1,080 (92.9%) | 82 (7.1%) |
| 26 to 34 Years | 2,283 (93.4%) | 161 (6.6%) |
| 35 to 44 Years | 2,646 (92.5%) | 215 (7.5%) |
| 45 to 54 Years | 2,439 (93.7%) | 165 (6.3%) |
| 55 to 64 Years | 2,617 (98.1%) | 52 (1.9%) |
| 65 to 74 Years | 1,757 (96.5%) | 64 (3.5%) |
| 75 Years and older | 590 (93.3%) | 42 (6.7%) |
| Total | 16,483 (94.3%) | 989 (5.7%) |
Health Insurance Coverage by Citizenship Status in Franconia
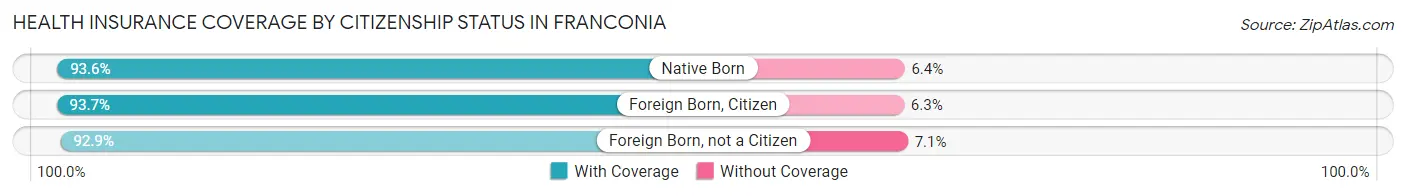
| Citizenship Status | With Coverage | Without Coverage |
| Native Born | 933 (93.6%) | 64 (6.4%) |
| Foreign Born, Citizen | 2,138 (93.7%) | 144 (6.3%) |
| Foreign Born, not a Citizen | 1,080 (92.9%) | 82 (7.1%) |
Health Insurance Coverage by Household Income in Franconia
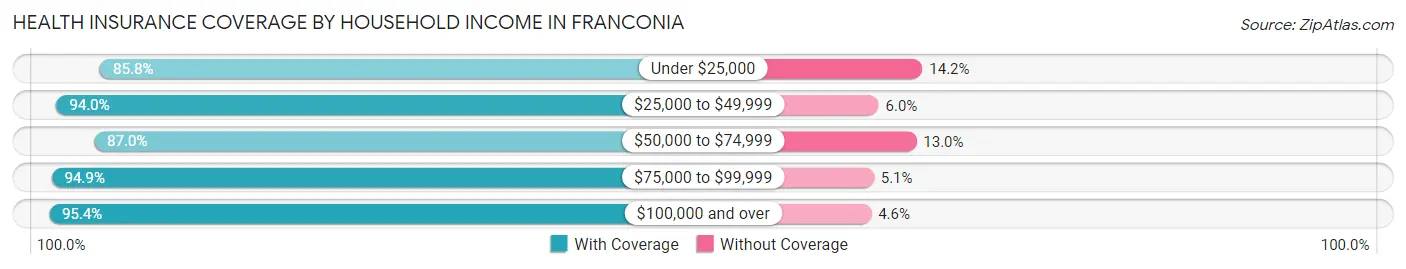
| Household Income | With Coverage | Without Coverage |
| Under $25,000 | 503 (85.8%) | 83 (14.2%) |
| $25,000 to $49,999 | 837 (94.0%) | 53 (6.0%) |
| $50,000 to $74,999 | 1,161 (87.0%) | 174 (13.0%) |
| $75,000 to $99,999 | 1,313 (94.9%) | 70 (5.1%) |
| $100,000 and over | 12,663 (95.4%) | 606 (4.6%) |
Public vs Private Health Insurance Coverage by Age in Franconia
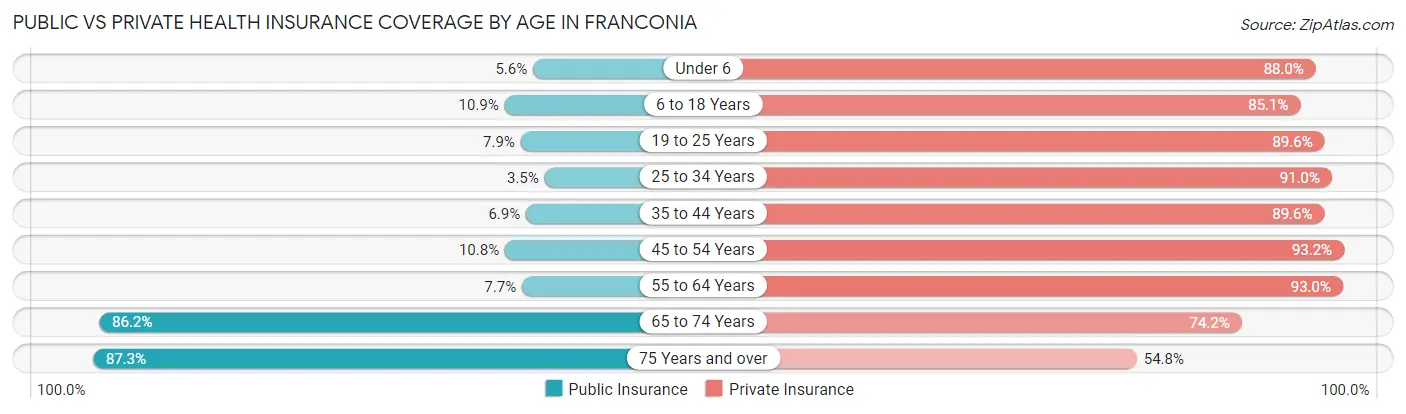
| Age Bracket | Public Insurance | Private Insurance |
| Under 6 | 56 (5.6%) | 877 (88.0%) |
| 6 to 18 Years | 249 (10.9%) | 1,942 (85.1%) |
| 19 to 25 Years | 92 (7.9%) | 1,041 (89.6%) |
| 25 to 34 Years | 85 (3.5%) | 2,223 (91.0%) |
| 35 to 44 Years | 198 (6.9%) | 2,562 (89.5%) |
| 45 to 54 Years | 282 (10.8%) | 2,427 (93.2%) |
| 55 to 64 Years | 205 (7.7%) | 2,482 (93.0%) |
| 65 to 74 Years | 1,569 (86.2%) | 1,351 (74.2%) |
| 75 Years and over | 552 (87.3%) | 346 (54.7%) |
| Total | 3,288 (18.8%) | 15,251 (87.3%) |
Disability Status by Sex by Age in Franconia
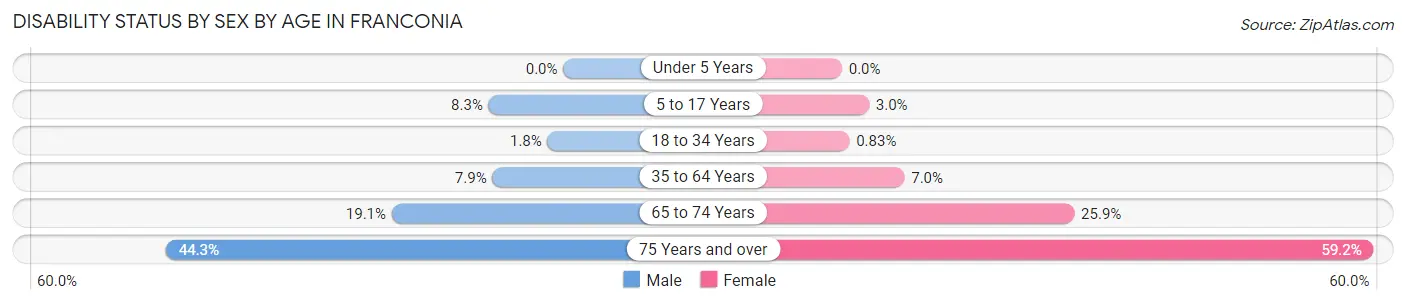
| Age Bracket | Male | Female |
| Under 5 Years | 0 (0.0%) | 0 (0.0%) |
| 5 to 17 Years | 107 (8.3%) | 33 (3.0%) |
| 18 to 34 Years | 33 (1.8%) | 15 (0.8%) |
| 35 to 64 Years | 313 (7.9%) | 290 (7.0%) |
| 65 to 74 Years | 153 (19.1%) | 264 (25.9%) |
| 75 Years and over | 143 (44.3%) | 183 (59.2%) |
Disability Class by Sex by Age in Franconia
Disability Class: Hearing Difficulty
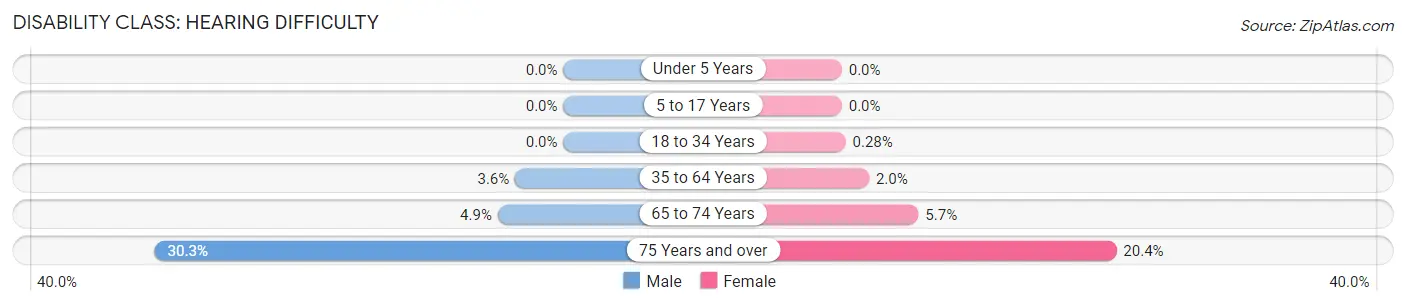
| Age Bracket | Male | Female |
| Under 5 Years | 0 (0.0%) | 0 (0.0%) |
| 5 to 17 Years | 0 (0.0%) | 0 (0.0%) |
| 18 to 34 Years | 0 (0.0%) | 5 (0.3%) |
| 35 to 64 Years | 142 (3.6%) | 84 (2.0%) |
| 65 to 74 Years | 39 (4.9%) | 58 (5.7%) |
| 75 Years and over | 98 (30.3%) | 63 (20.4%) |
Disability Class: Vision Difficulty
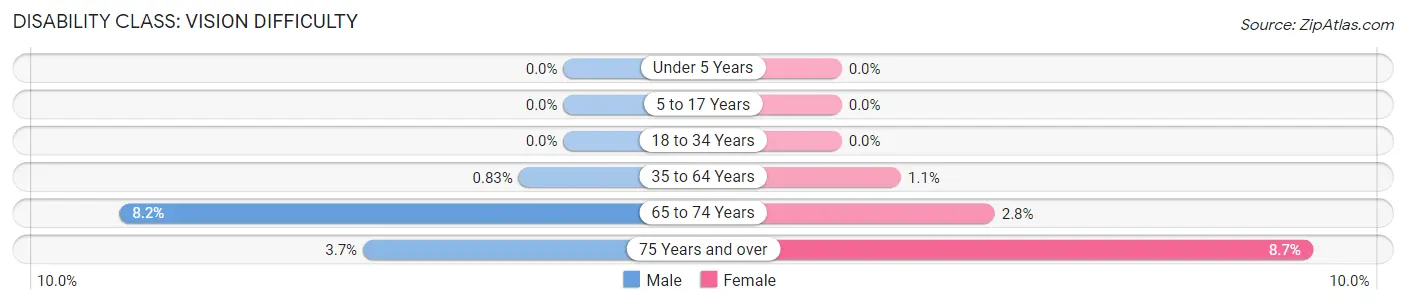
| Age Bracket | Male | Female |
| Under 5 Years | 0 (0.0%) | 0 (0.0%) |
| 5 to 17 Years | 0 (0.0%) | 0 (0.0%) |
| 18 to 34 Years | 0 (0.0%) | 0 (0.0%) |
| 35 to 64 Years | 33 (0.8%) | 46 (1.1%) |
| 65 to 74 Years | 66 (8.2%) | 29 (2.8%) |
| 75 Years and over | 12 (3.7%) | 27 (8.7%) |
Disability Class: Cognitive Difficulty
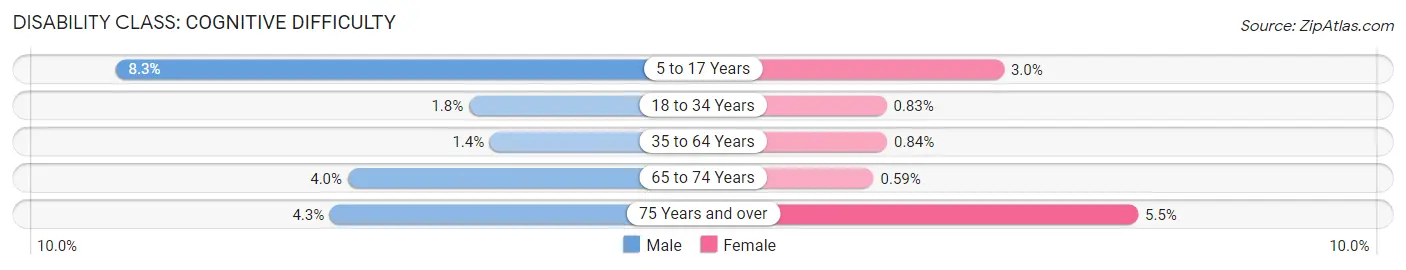
| Age Bracket | Male | Female |
| 5 to 17 Years | 107 (8.3%) | 33 (3.0%) |
| 18 to 34 Years | 33 (1.8%) | 15 (0.8%) |
| 35 to 64 Years | 54 (1.4%) | 35 (0.8%) |
| 65 to 74 Years | 32 (4.0%) | 6 (0.6%) |
| 75 Years and over | 14 (4.3%) | 17 (5.5%) |
Disability Class: Ambulatory Difficulty
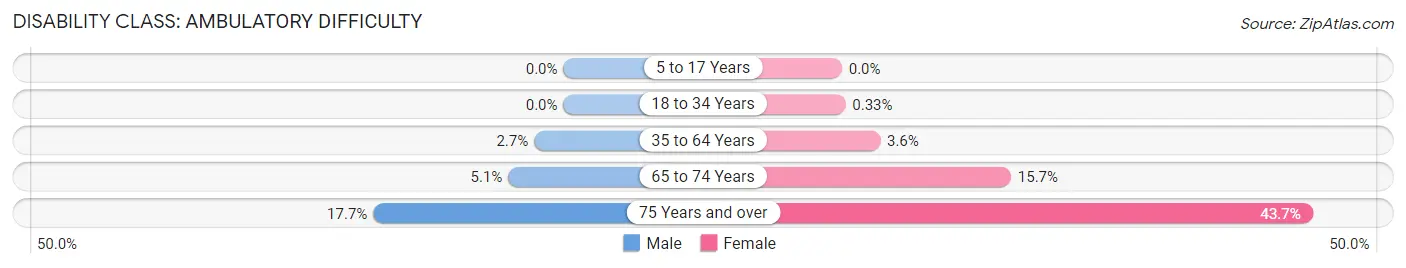
| Age Bracket | Male | Female |
| 5 to 17 Years | 0 (0.0%) | 0 (0.0%) |
| 18 to 34 Years | 0 (0.0%) | 6 (0.3%) |
| 35 to 64 Years | 108 (2.7%) | 148 (3.5%) |
| 65 to 74 Years | 41 (5.1%) | 160 (15.7%) |
| 75 Years and over | 57 (17.6%) | 135 (43.7%) |
Disability Class: Self-Care Difficulty
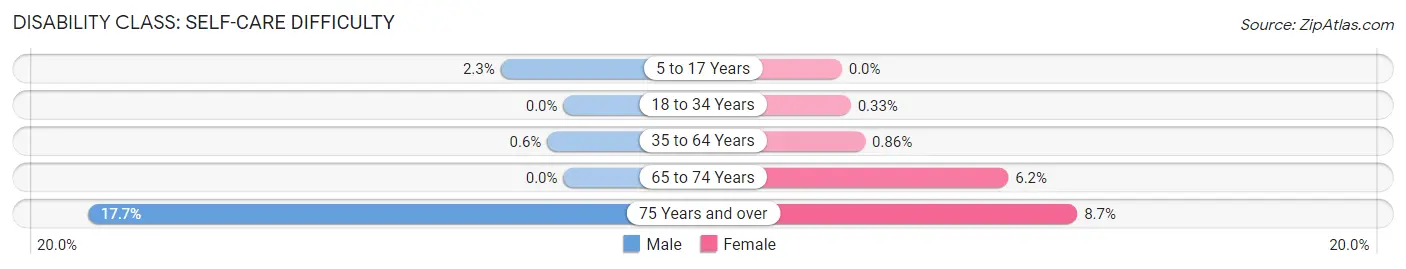
| Age Bracket | Male | Female |
| 5 to 17 Years | 30 (2.3%) | 0 (0.0%) |
| 18 to 34 Years | 0 (0.0%) | 6 (0.3%) |
| 35 to 64 Years | 24 (0.6%) | 36 (0.9%) |
| 65 to 74 Years | 0 (0.0%) | 63 (6.2%) |
| 75 Years and over | 57 (17.6%) | 27 (8.7%) |
Technology Access in Franconia
Computing Device Access in Franconia
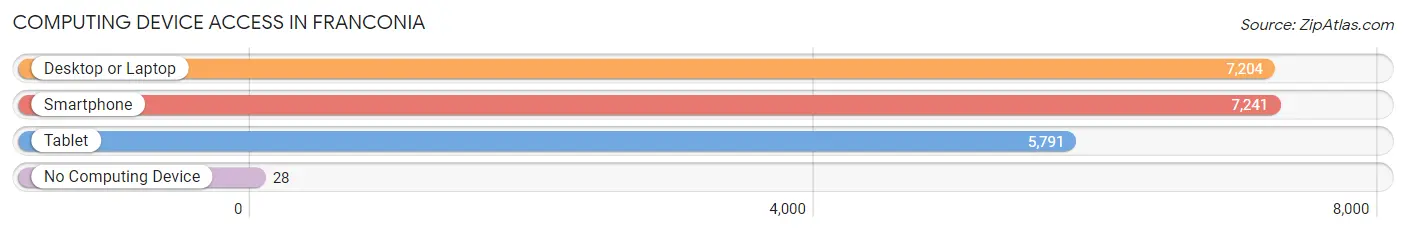
| Device Type | # Households | % Households |
| Desktop or Laptop | 7,204 | 96.6% |
| Smartphone | 7,241 | 97.1% |
| Tablet | 5,791 | 77.7% |
| No Computing Device | 28 | 0.4% |
| Total | 7,456 | 100.0% |
Internet Access in Franconia
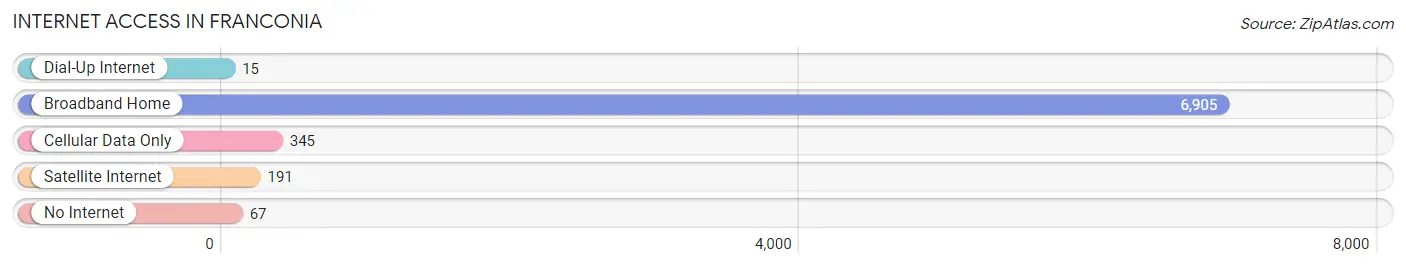
| Internet Type | # Households | % Households |
| Dial-Up Internet | 15 | 0.2% |
| Broadband Home | 6,905 | 92.6% |
| Cellular Data Only | 345 | 4.6% |
| Satellite Internet | 191 | 2.6% |
| No Internet | 67 | 0.9% |
| Total | 7,456 | 100.0% |
Franconia Summary
Franconia is a census-designated place (CDP) in Fairfax County, Virginia, United States. It is located in the southeastern part of the county, near the border with Prince William County. The population was 18,245 at the 2010 census, up from 15,224 at the 2000 census.
History
The area now known as Franconia was first settled in the early 1700s by German and Swiss immigrants. The area was originally known as "Frying Pan" due to the abundance of frying pans found in the area. The name was changed to Franconia in 1875, after the Franconia region of Germany.
The area was largely rural until the 1950s, when the construction of the Capital Beltway and the Franconia-Springfield Parkway spurred development. The area experienced rapid growth in the 1970s and 1980s, and by the 1990s, it had become a densely populated suburban area.
Geography
Franconia is located in southeastern Fairfax County at 38°46'17" North, 77°10'45" West (38.771445, -77.179093). It is bordered to the north by Kingstowne, to the east by Rose Hill, to the south by Newington, and to the west by Springfield.
According to the United States Census Bureau, the Franconia CDP has a total area of 5.2 square miles (13.4 km2), all of it land.
Economy
Franconia is home to several large employers, including the U.S. Department of Defense, the U.S. Department of Homeland Security, and the U.S. Department of State. The area is also home to several large retail stores, including Target, Walmart, and Best Buy.
Demographics
As of the 2010 census, there were 18,245 people, 6,945 households, and 4,845 families residing in the CDP. The population density was 3,521.3 people per square mile (1,364.2/km2). There were 7,093 housing units at an average density of 1,377.3 per square mile (531.2/km2). The racial makeup of the CDP was 68.2% White, 11.3% African American, 0.3% Native American, 11.7% Asian, 0.1% Pacific Islander, 5.2% from other races, and 3.2% from two or more races. Hispanic or Latino of any race were 13.2% of the population.
There were 6,945 households, out of which 33.2% had children under the age of 18 living with them, 53.2% were married couples living together, 11.2% had a female householder with no husband present, and 30.7% were non-families. 24.2% of all households were made up of individuals, and 6.2% had someone living alone who was 65 years of age or older. The average household size was 2.62 and the average family size was 3.13.
In the CDP, the population was spread out, with 24.2% under the age of 18, 8.2% from 18 to 24, 33.2% from 25 to 44, 24.2% from 45 to 64, and 10.2% who were 65 years of age or older. The median age was 36 years. For every 100 females, there were 94.2 males. For every 100 females age 18 and over, there were 91.2 males.
The median income for a household in the CDP was $71,945, and the median income for a family was $81,945. Males had a median income of $50,945 versus $41,945 for females. The per capita income for the CDP was $30,945. About 4.2% of families and 5.2% of the population were below the poverty line, including 6.2% of those under age 18 and 4.2% of those age 65 or over.
Common Questions
What is Per Capita Income in Franconia?
Per Capita income in Franconia is $71,861.
What is the Median Family Income in Franconia?
Median Family Income in Franconia is $172,264.
What is the Median Household income in Franconia?
Median Household Income in Franconia is $143,322.
What is Income or Wage Gap in Franconia?
Income or Wage Gap in Franconia is 14.2%.
Women in Franconia earn 85.8 cents for every dollar earned by a man.
What is Inequality or Gini Index in Franconia?
Inequality or Gini Index in Franconia is 0.35.
What is the Total Population of Franconia?
Total Population of Franconia is 17,906.
What is the Total Male Population of Franconia?
Total Male Population of Franconia is 9,051.
What is the Total Female Population of Franconia?
Total Female Population of Franconia is 8,855.
What is the Ratio of Males per 100 Females in Franconia?
There are 102.21 Males per 100 Females in Franconia.
What is the Ratio of Females per 100 Males in Franconia?
There are 97.83 Females per 100 Males in Franconia.
What is the Median Population Age in Franconia?
Median Population Age in Franconia is 40.4 Years.
What is the Average Family Size in Franconia
Average Family Size in Franconia is 3.1 People.
What is the Average Household Size in Franconia
Average Household Size in Franconia is 2.4 People.
How Large is the Labor Force in Franconia?
There are 11,849 People in the Labor Forcein in Franconia.
What is the Percentage of People in the Labor Force in Franconia?
78.3% of People are in the Labor Force in Franconia.
What is the Unemployment Rate in Franconia?
Unemployment Rate in Franconia is 2.7%.