University of Virginia, VA Map & Demographics
University of Virginia Map
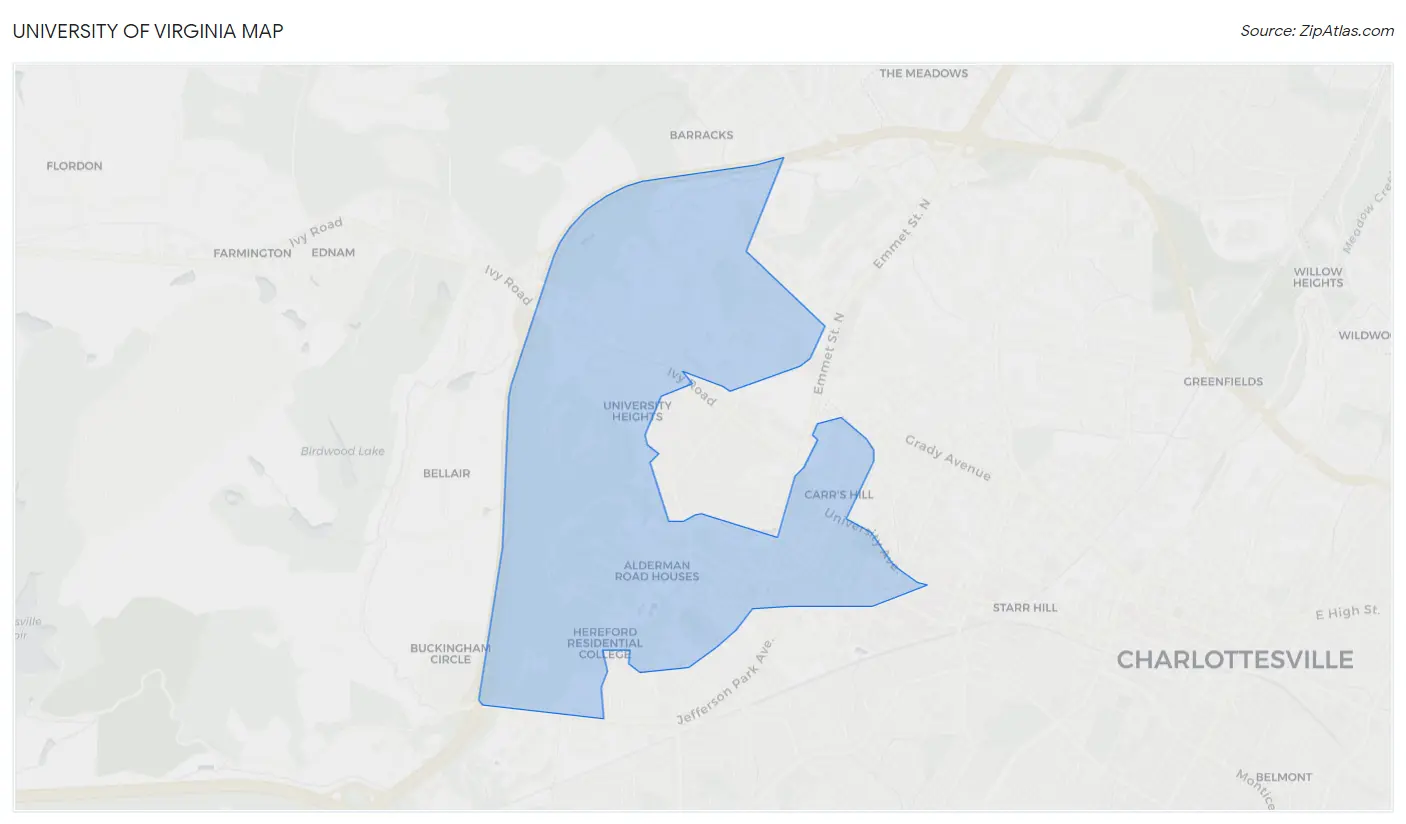
University of Virginia Overview
$12,508
PER CAPITA INCOME
$69,054
AVG FAMILY INCOME
$47,008
AVG HOUSEHOLD INCOME
20.3%
WAGE / INCOME GAP [ % ]
79.7¢/ $1
WAGE / INCOME GAP [ $ ]
0.52
INEQUALITY / GINI INDEX
9,648
TOTAL POPULATION
5,172
MALE POPULATION
4,476
FEMALE POPULATION
115.55
MALES / 100 FEMALES
86.54
FEMALES / 100 MALES
19.7
MEDIAN AGE
2.7
AVG FAMILY SIZE
2.0
AVG HOUSEHOLD SIZE
3,147
LABOR FORCE [ PEOPLE ]
33.6%
PERCENT IN LABOR FORCE
7.4%
UNEMPLOYMENT RATE
Income in University of Virginia
Income Overview in University of Virginia
Per Capita Income in University of Virginia is $12,508, while median incomes of families and households are $69,054 and $47,008 respectively.
| Characteristic | Number | Measure |
| Per Capita Income | 9,648 | $12,508 |
| Median Family Income | 462 | $69,054 |
| Mean Family Income | 462 | $94,381 |
| Median Household Income | 1,269 | $47,008 |
| Mean Household Income | 1,269 | $66,797 |
| Income Deficit | 462 | $0 |
| Wage / Income Gap (%) | 9,648 | 20.28% |
| Wage / Income Gap ($) | 9,648 | 79.72¢ per $1 |
| Gini / Inequality Index | 9,648 | 0.52 |
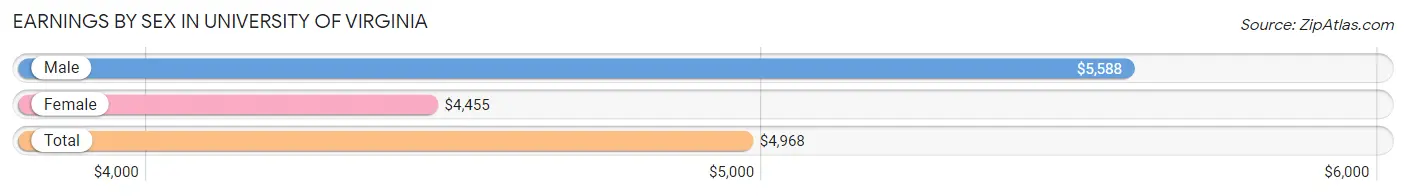
Earnings by Sex in University of Virginia
Average Earnings in University of Virginia are $4,968, $5,588 for men and $4,455 for women, a difference of 20.3%.
| Sex | Number | Average Earnings |
| Male | 3,556 (54.8%) | $5,588 |
| Female | 2,930 (45.2%) | $4,455 |
| Total | 6,486 (100.0%) | $4,968 |
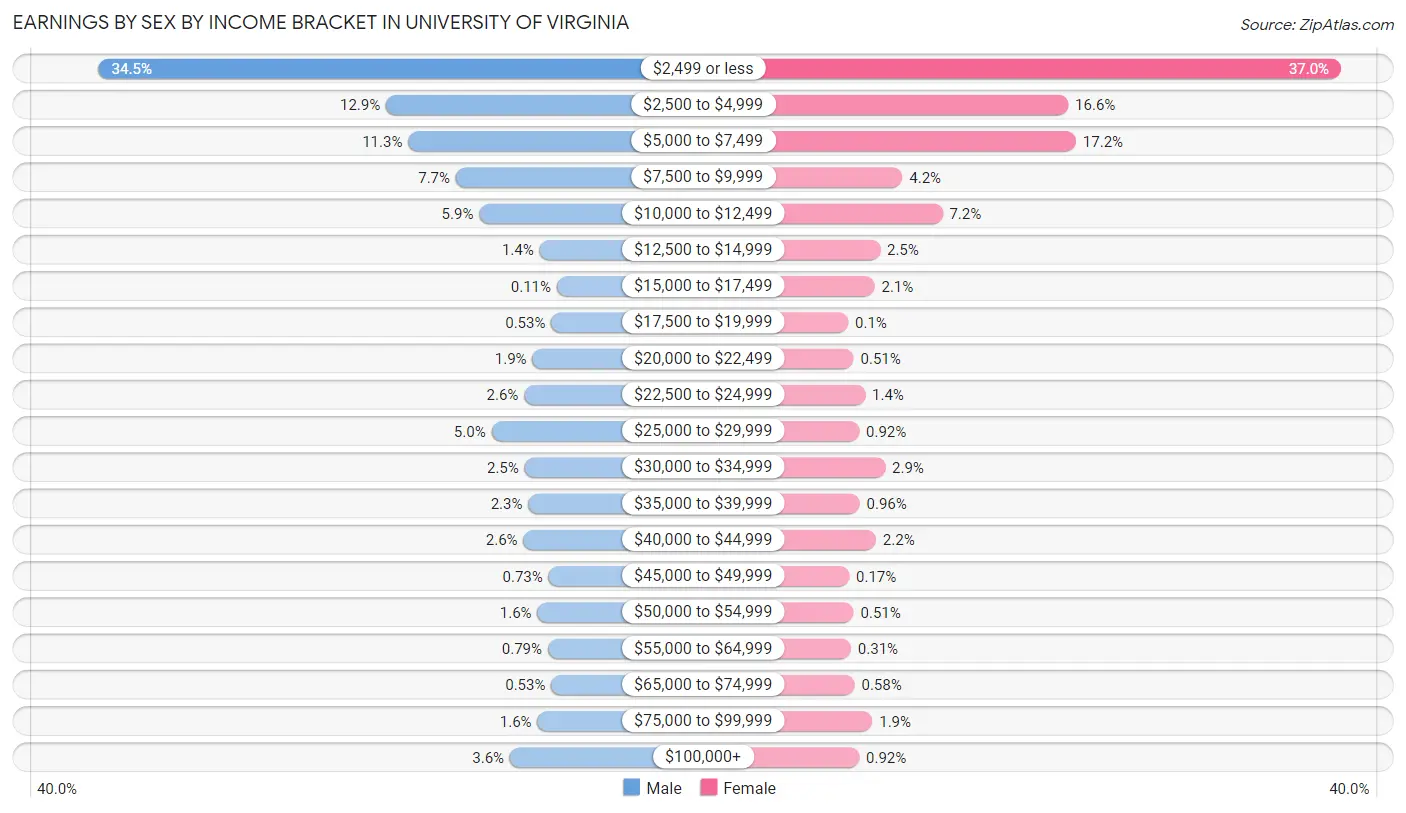
Earnings by Sex by Income Bracket in University of Virginia
The most common earnings brackets in University of Virginia are $2,499 or less for men (1,225 | 34.4%) and $2,499 or less for women (1,085 | 37.0%).
| Income | Male | Female |
| $2,499 or less | 1,225 (34.4%) | 1,085 (37.0%) |
| $2,500 to $4,999 | 459 (12.9%) | 486 (16.6%) |
| $5,000 to $7,499 | 400 (11.3%) | 503 (17.2%) |
| $7,500 to $9,999 | 273 (7.7%) | 122 (4.2%) |
| $10,000 to $12,499 | 211 (5.9%) | 210 (7.2%) |
| $12,500 to $14,999 | 50 (1.4%) | 73 (2.5%) |
| $15,000 to $17,499 | 4 (0.1%) | 61 (2.1%) |
| $17,500 to $19,999 | 19 (0.5%) | 3 (0.1%) |
| $20,000 to $22,499 | 69 (1.9%) | 15 (0.5%) |
| $22,500 to $24,999 | 91 (2.6%) | 40 (1.4%) |
| $25,000 to $29,999 | 178 (5.0%) | 27 (0.9%) |
| $30,000 to $34,999 | 90 (2.5%) | 84 (2.9%) |
| $35,000 to $39,999 | 80 (2.2%) | 28 (1.0%) |
| $40,000 to $44,999 | 93 (2.6%) | 64 (2.2%) |
| $45,000 to $49,999 | 26 (0.7%) | 5 (0.2%) |
| $50,000 to $54,999 | 56 (1.6%) | 15 (0.5%) |
| $55,000 to $64,999 | 28 (0.8%) | 9 (0.3%) |
| $65,000 to $74,999 | 19 (0.5%) | 17 (0.6%) |
| $75,000 to $99,999 | 56 (1.6%) | 56 (1.9%) |
| $100,000+ | 129 (3.6%) | 27 (0.9%) |
| Total | 3,556 (100.0%) | 2,930 (100.0%) |
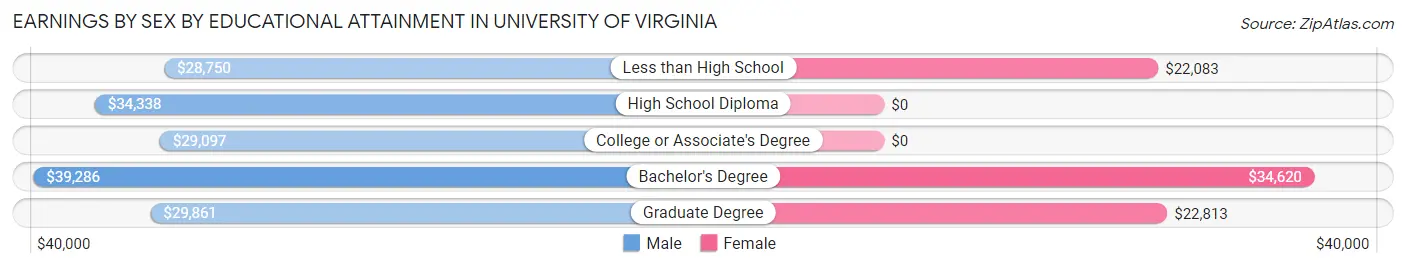
Earnings by Sex by Educational Attainment in University of Virginia
Average earnings in University of Virginia are $32,179 for men and $32,881 for women, a difference of 2.1%. Men with an educational attainment of bachelor's degree enjoy the highest average annual earnings of $39,286, while those with less than high school education earn the least with $28,750. Women with an educational attainment of bachelor's degree earn the most with the average annual earnings of $34,620, while those with less than high school education have the smallest earnings of $22,083.
| Educational Attainment | Male Income | Female Income |
| Less than High School | $28,750 | $22,083 |
| High School Diploma | $34,338 | $0 |
| College or Associate's Degree | $29,097 | $0 |
| Bachelor's Degree | $39,286 | $34,620 |
| Graduate Degree | $29,861 | $22,813 |
| Total | $32,179 | $32,881 |
Family Income in University of Virginia
Family Income Brackets in University of Virginia
According to the University of Virginia family income data, there are 121 families falling into the $50,000 to $74,999 income range, which is the most common income bracket and makes up 26.2% of all families. Conversely, the $10,000 to $14,999 income bracket is the least frequent group with only 5 families (1.1%) belonging to this category.
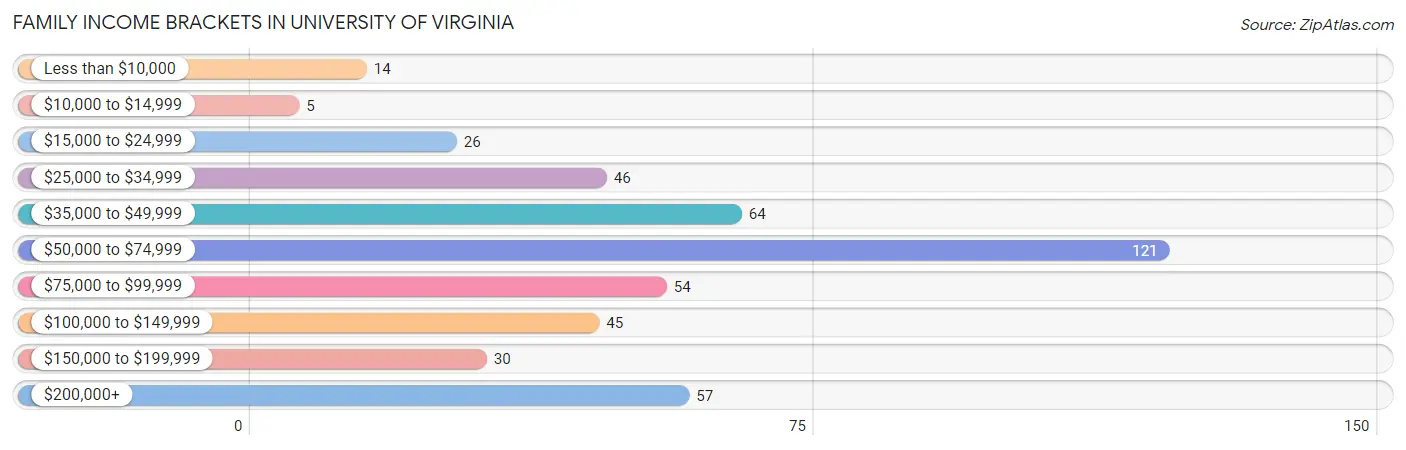
| Income Bracket | # Families | % Families |
| Less than $10,000 | 14 | 3.0% |
| $10,000 to $14,999 | 5 | 1.1% |
| $15,000 to $24,999 | 26 | 5.6% |
| $25,000 to $34,999 | 46 | 10.0% |
| $35,000 to $49,999 | 64 | 13.9% |
| $50,000 to $74,999 | 121 | 26.2% |
| $75,000 to $99,999 | 54 | 11.7% |
| $100,000 to $149,999 | 45 | 9.7% |
| $150,000 to $199,999 | 30 | 6.5% |
| $200,000+ | 57 | 12.3% |
Family Income by Famaliy Size in University of Virginia
5-person families (24 | 5.2%) account for the highest median family income in University of Virginia with $90,357 per family, while 2-person families (316 | 68.4%) have the highest median income of $34,358 per family member.
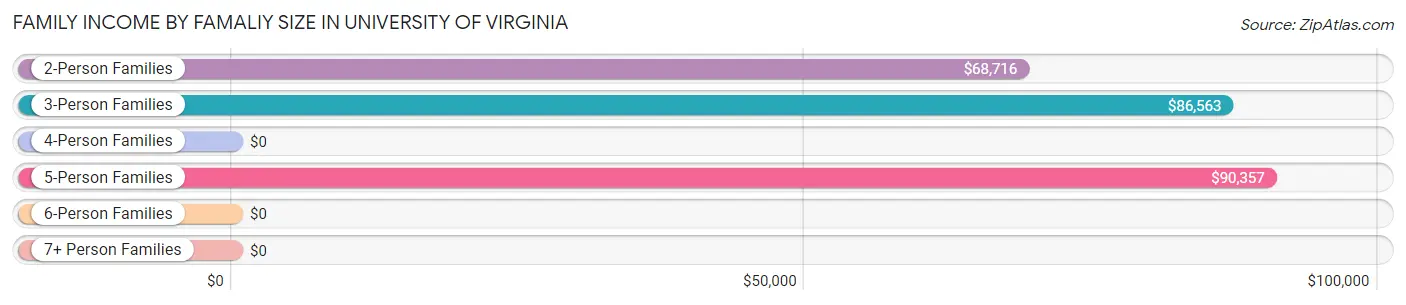
| Income Bracket | # Families | Median Income |
| 2-Person Families | 316 (68.4%) | $68,716 |
| 3-Person Families | 79 (17.1%) | $86,563 |
| 4-Person Families | 34 (7.4%) | $0 |
| 5-Person Families | 24 (5.2%) | $90,357 |
| 6-Person Families | 9 (1.9%) | $0 |
| 7+ Person Families | 0 (0.0%) | $0 |
| Total | 462 (100.0%) | $69,054 |
Family Income by Number of Earners in University of Virginia
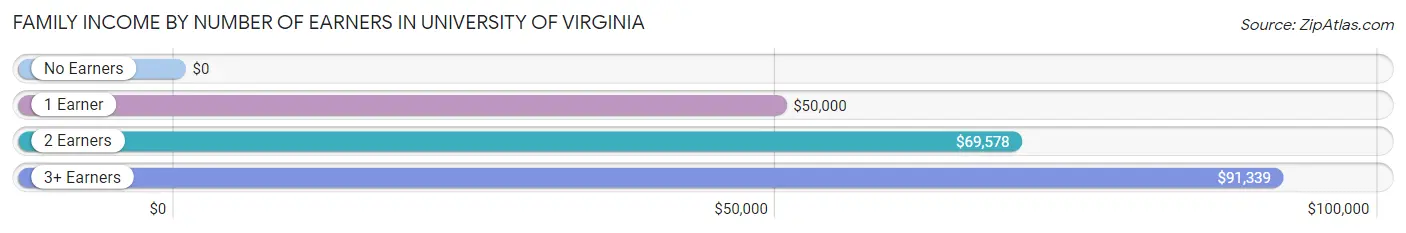
| Number of Earners | # Families | Median Income |
| No Earners | 58 (12.6%) | $0 |
| 1 Earner | 190 (41.1%) | $50,000 |
| 2 Earners | 183 (39.6%) | $69,578 |
| 3+ Earners | 31 (6.7%) | $91,339 |
| Total | 462 (100.0%) | $69,054 |
Household Income in University of Virginia
Household Income Brackets in University of Virginia
With 227 households falling in the category, the $50,000 to $74,999 income range is the most frequent in University of Virginia, accounting for 17.9% of all households. In contrast, only 52 households (4.1%) fall into the $10,000 to $14,999 income bracket, making it the least populous group.
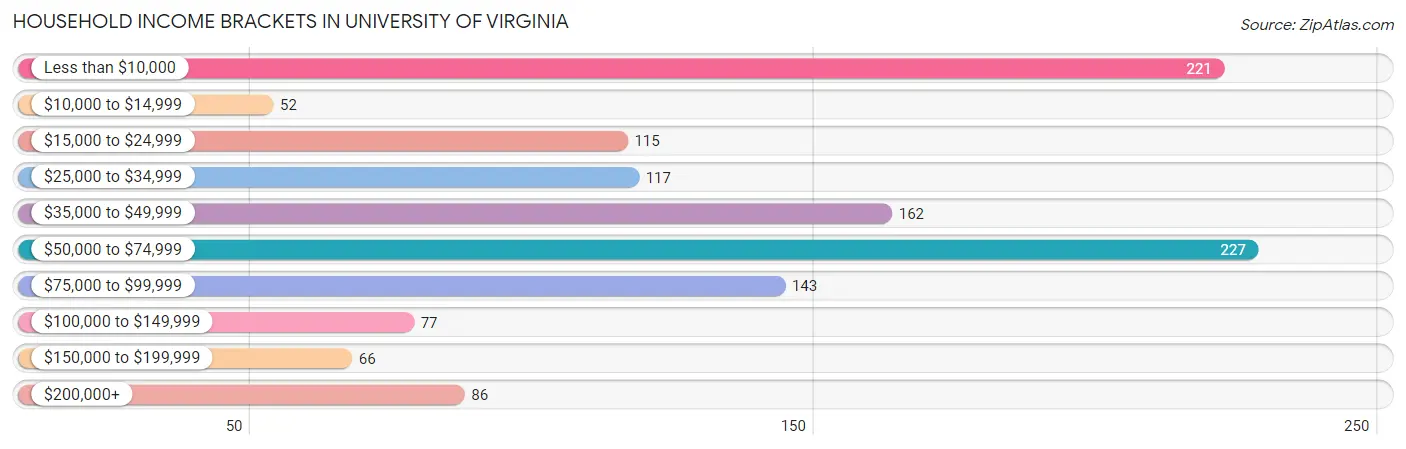
| Income Bracket | # Households | % Households |
| Less than $10,000 | 221 | 17.4% |
| $10,000 to $14,999 | 52 | 4.1% |
| $15,000 to $24,999 | 115 | 9.1% |
| $25,000 to $34,999 | 117 | 9.2% |
| $35,000 to $49,999 | 162 | 12.8% |
| $50,000 to $74,999 | 227 | 17.9% |
| $75,000 to $99,999 | 143 | 11.3% |
| $100,000 to $149,999 | 77 | 6.1% |
| $150,000 to $199,999 | 66 | 5.2% |
| $200,000+ | 86 | 6.8% |
Household Income by Householder Age in University of Virginia
The median household income in University of Virginia is $47,008, with the highest median household income of $79,712 found in the 45 to 64 years age bracket for the primary householder. A total of 207 households (16.3%) fall into this category. Meanwhile, the 15 to 24 years age bracket for the primary householder has the lowest median household income of $0, with 155 households (12.2%) in this group.
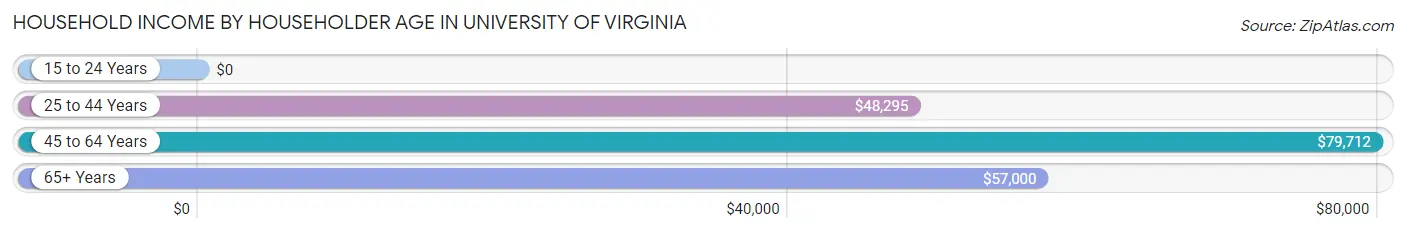
| Income Bracket | # Households | Median Income |
| 15 to 24 Years | 155 (12.2%) | $0 |
| 25 to 44 Years | 689 (54.3%) | $48,295 |
| 45 to 64 Years | 207 (16.3%) | $79,712 |
| 65+ Years | 218 (17.2%) | $57,000 |
| Total | 1,269 (100.0%) | $47,008 |
Poverty in University of Virginia
Income Below Poverty by Sex and Age in University of Virginia
With 25.9% poverty level for males and 29.3% for females among the residents of University of Virginia, 18 to 24 year old males and 18 to 24 year old females are the most vulnerable to poverty, with 143 males (70.8%) and 90 females (63.4%) in their respective age groups living below the poverty level.
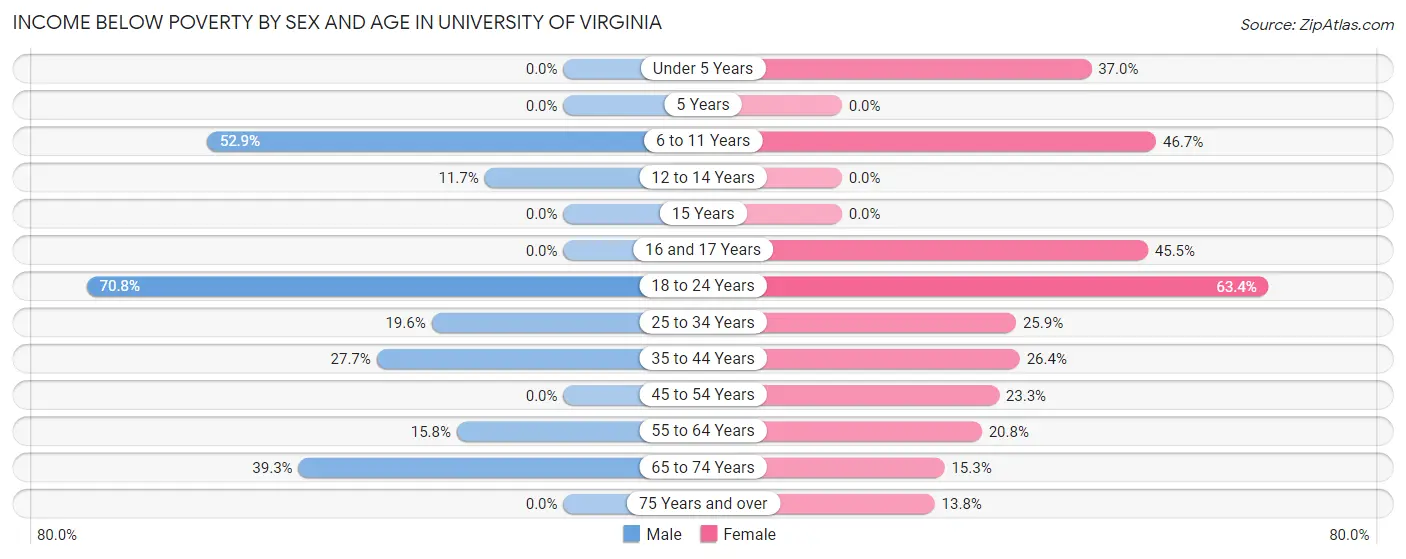
| Age Bracket | Male | Female |
| Under 5 Years | 0 (0.0%) | 20 (37.0%) |
| 5 Years | 0 (0.0%) | 0 (0.0%) |
| 6 to 11 Years | 18 (52.9%) | 14 (46.7%) |
| 12 to 14 Years | 11 (11.7%) | 0 (0.0%) |
| 15 Years | 0 (0.0%) | 0 (0.0%) |
| 16 and 17 Years | 0 (0.0%) | 10 (45.5%) |
| 18 to 24 Years | 143 (70.8%) | 90 (63.4%) |
| 25 to 34 Years | 111 (19.6%) | 127 (25.9%) |
| 35 to 44 Years | 33 (27.7%) | 14 (26.4%) |
| 45 to 54 Years | 0 (0.0%) | 7 (23.3%) |
| 55 to 64 Years | 28 (15.8%) | 16 (20.8%) |
| 65 to 74 Years | 24 (39.3%) | 9 (15.2%) |
| 75 Years and over | 0 (0.0%) | 20 (13.8%) |
| Total | 368 (25.9%) | 327 (29.3%) |
Income Above Poverty by Sex and Age in University of Virginia
According to the poverty statistics in University of Virginia, males aged under 5 years and females aged 5 years are the age groups that are most secure financially, with 100.0% of males and 100.0% of females in these age groups living above the poverty line.
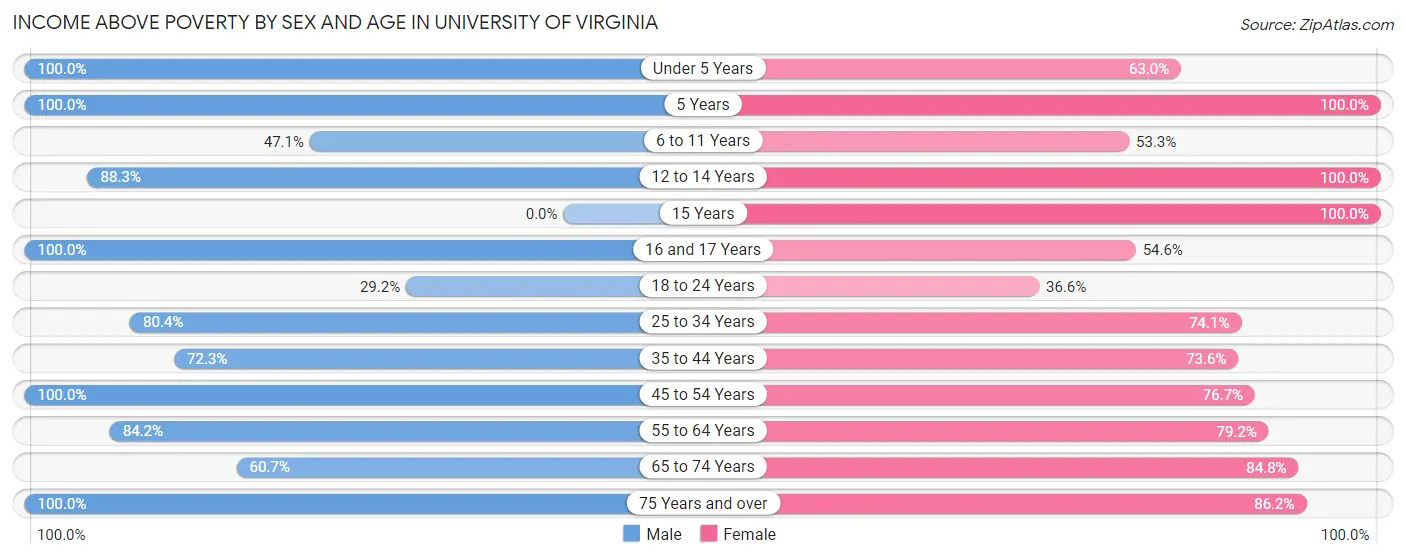
| Age Bracket | Male | Female |
| Under 5 Years | 50 (100.0%) | 34 (63.0%) |
| 5 Years | 9 (100.0%) | 5 (100.0%) |
| 6 to 11 Years | 16 (47.1%) | 16 (53.3%) |
| 12 to 14 Years | 83 (88.3%) | 2 (100.0%) |
| 15 Years | 0 (0.0%) | 4 (100.0%) |
| 16 and 17 Years | 8 (100.0%) | 12 (54.5%) |
| 18 to 24 Years | 59 (29.2%) | 52 (36.6%) |
| 25 to 34 Years | 456 (80.4%) | 364 (74.1%) |
| 35 to 44 Years | 86 (72.3%) | 39 (73.6%) |
| 45 to 54 Years | 46 (100.0%) | 23 (76.7%) |
| 55 to 64 Years | 149 (84.2%) | 61 (79.2%) |
| 65 to 74 Years | 37 (60.7%) | 50 (84.8%) |
| 75 Years and over | 52 (100.0%) | 125 (86.2%) |
| Total | 1,051 (74.1%) | 787 (70.7%) |
Income Below Poverty Among Married-Couple Families in University of Virginia
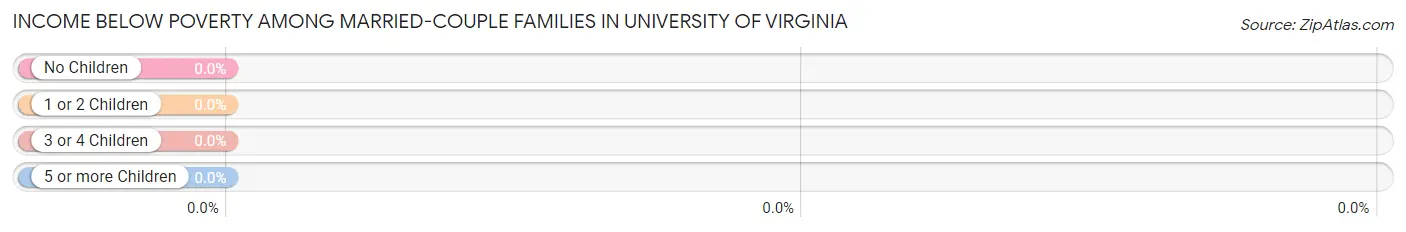
| Children | Above Poverty | Below Poverty |
| No Children | 257 (100.0%) | 0 (0.0%) |
| 1 or 2 Children | 64 (100.0%) | 0 (0.0%) |
| 3 or 4 Children | 10 (100.0%) | 0 (0.0%) |
| 5 or more Children | 0 (0.0%) | 0 (0.0%) |
| Total | 331 (100.0%) | 0 (0.0%) |
Income Below Poverty Among Single-Parent Households in University of Virginia
According to the poverty data in University of Virginia, 7.8% or 5 single-father households and 53.7% or 36 single-mother households are living below the poverty line. Among single-father households, those with 1 or 2 children have the highest poverty rate, with 5 households (16.1%) experiencing poverty. Likewise, among single-mother households, those with 1 or 2 children have the highest poverty rate, with 15 households (78.9%) falling below the poverty line.
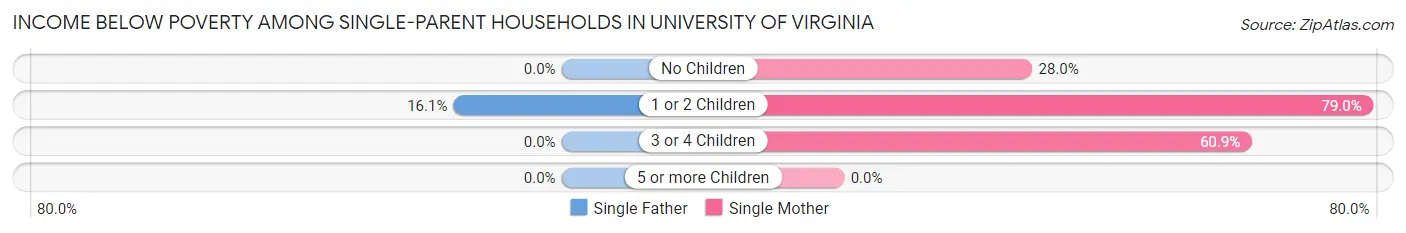
| Children | Single Father | Single Mother |
| No Children | 0 (0.0%) | 7 (28.0%) |
| 1 or 2 Children | 5 (16.1%) | 15 (78.9%) |
| 3 or 4 Children | 0 (0.0%) | 14 (60.9%) |
| 5 or more Children | 0 (0.0%) | 0 (0.0%) |
| Total | 5 (7.8%) | 36 (53.7%) |
Income Below Poverty Among Married-Couple vs Single-Parent Households in University of Virginia
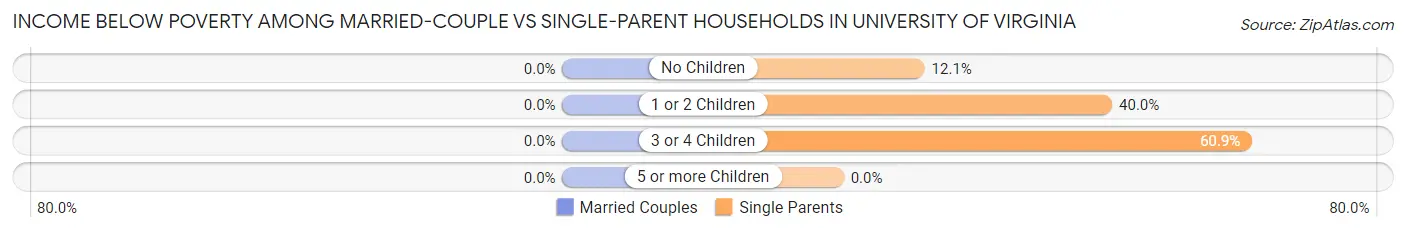
| Children | Married-Couple Families | Single-Parent Households |
| No Children | 0 (0.0%) | 7 (12.1%) |
| 1 or 2 Children | 0 (0.0%) | 20 (40.0%) |
| 3 or 4 Children | 0 (0.0%) | 14 (60.9%) |
| 5 or more Children | 0 (0.0%) | 0 (0.0%) |
| Total | 0 (0.0%) | 41 (31.3%) |
Race in University of Virginia
The most populous races in University of Virginia are White / Caucasian (6,033 | 62.5%), Asian (1,865 | 19.3%), and Black / African American (919 | 9.5%).
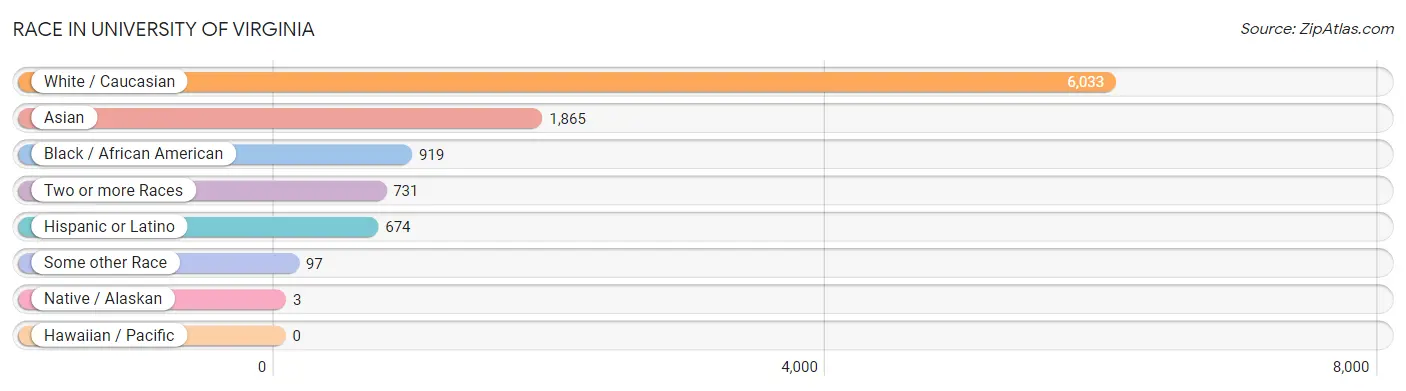
| Race | # Population | % Population |
| Asian | 1,865 | 19.3% |
| Black / African American | 919 | 9.5% |
| Hawaiian / Pacific | 0 | 0.0% |
| Hispanic or Latino | 674 | 7.0% |
| Native / Alaskan | 3 | 0.0% |
| White / Caucasian | 6,033 | 62.5% |
| Two or more Races | 731 | 7.6% |
| Some other Race | 97 | 1.0% |
| Total | 9,648 | 100.0% |
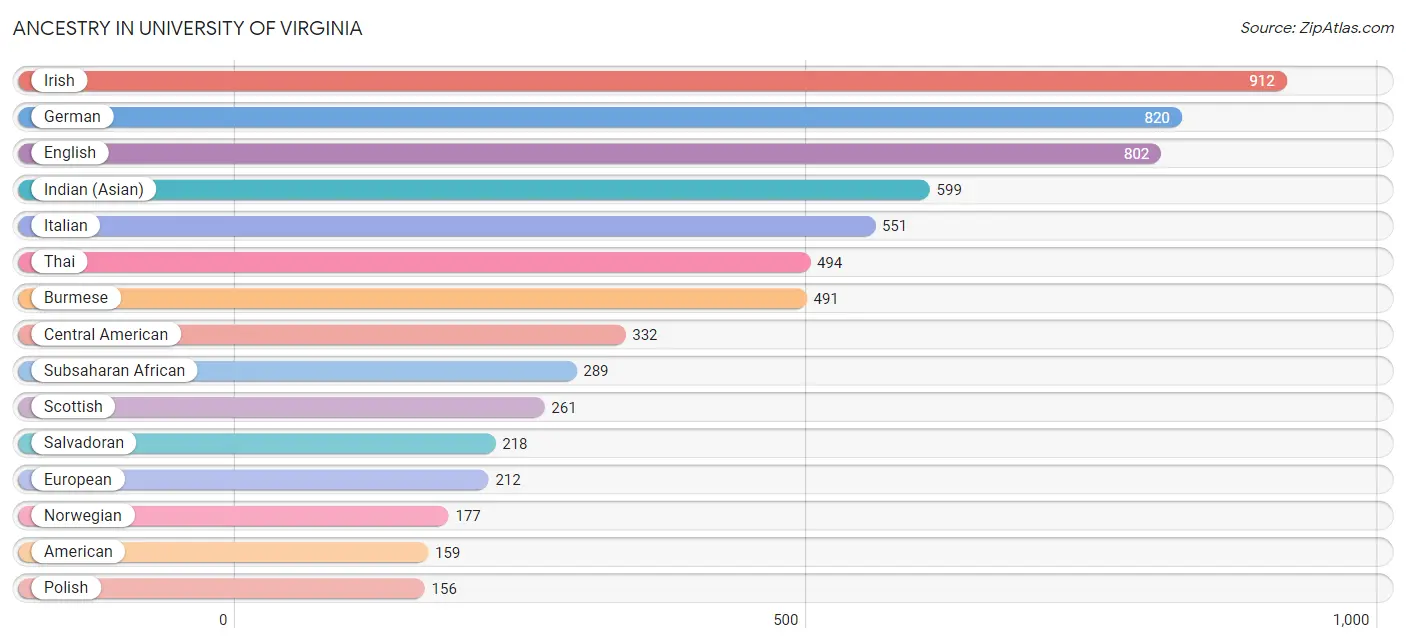
Ancestry in University of Virginia
The most populous ancestries reported in University of Virginia are Irish (912 | 9.5%), German (820 | 8.5%), English (802 | 8.3%), Indian (Asian) (599 | 6.2%), and Italian (551 | 5.7%), together accounting for 38.2% of all University of Virginia residents.
| Ancestry | # Population | % Population |
| Afghan | 13 | 0.1% |
| African | 108 | 1.1% |
| Albanian | 9 | 0.1% |
| American | 159 | 1.7% |
| Arab | 147 | 1.5% |
| Argentinean | 29 | 0.3% |
| Armenian | 41 | 0.4% |
| Australian | 20 | 0.2% |
| Austrian | 23 | 0.2% |
| Basque | 4 | 0.0% |
| Belgian | 4 | 0.0% |
| Bhutanese | 15 | 0.2% |
| Bolivian | 10 | 0.1% |
| Brazilian | 83 | 0.9% |
| British | 107 | 1.1% |
| Burmese | 491 | 5.1% |
| Central American | 332 | 3.4% |
| Cherokee | 13 | 0.1% |
| Colombian | 12 | 0.1% |
| Cuban | 9 | 0.1% |
| Czech | 20 | 0.2% |
| Danish | 73 | 0.8% |
| Dutch | 102 | 1.1% |
| Eastern European | 58 | 0.6% |
| Egyptian | 13 | 0.1% |
| English | 802 | 8.3% |
| Ethiopian | 15 | 0.2% |
| European | 212 | 2.2% |
| Filipino | 25 | 0.3% |
| French | 133 | 1.4% |
| French Canadian | 29 | 0.3% |
| German | 820 | 8.5% |
| Ghanaian | 49 | 0.5% |
| Greek | 45 | 0.5% |
| Guatemalan | 66 | 0.7% |
| Honduran | 48 | 0.5% |
| Hungarian | 62 | 0.6% |
| Indian (Asian) | 599 | 6.2% |
| Iranian | 84 | 0.9% |
| Iraqi | 12 | 0.1% |
| Irish | 912 | 9.5% |
| Israeli | 1 | 0.0% |
| Italian | 551 | 5.7% |
| Jamaican | 27 | 0.3% |
| Japanese | 5 | 0.1% |
| Kenyan | 10 | 0.1% |
| Korean | 50 | 0.5% |
| Laotian | 31 | 0.3% |
| Latvian | 5 | 0.1% |
| Lebanese | 24 | 0.3% |
| Lithuanian | 11 | 0.1% |
| Maltese | 3 | 0.0% |
| Mexican | 119 | 1.2% |
| Moroccan | 18 | 0.2% |
| Native Hawaiian | 6 | 0.1% |
| Nigerian | 69 | 0.7% |
| Northern European | 12 | 0.1% |
| Norwegian | 177 | 1.8% |
| Okinawan | 13 | 0.1% |
| Pakistani | 2 | 0.0% |
| Palestinian | 11 | 0.1% |
| Peruvian | 5 | 0.1% |
| Polish | 156 | 1.6% |
| Portuguese | 9 | 0.1% |
| Puerto Rican | 70 | 0.7% |
| Romanian | 10 | 0.1% |
| Russian | 51 | 0.5% |
| Salvadoran | 218 | 2.3% |
| Scandinavian | 51 | 0.5% |
| Scotch-Irish | 84 | 0.9% |
| Scottish | 261 | 2.7% |
| Slovak | 5 | 0.1% |
| Slovene | 5 | 0.1% |
| Somali | 3 | 0.0% |
| South American | 56 | 0.6% |
| Spaniard | 9 | 0.1% |
| Spanish | 12 | 0.1% |
| Sri Lankan | 91 | 0.9% |
| Subsaharan African | 289 | 3.0% |
| Sudanese | 10 | 0.1% |
| Swedish | 80 | 0.8% |
| Swiss | 55 | 0.6% |
| Syrian | 52 | 0.5% |
| Thai | 494 | 5.1% |
| Trinidadian and Tobagonian | 18 | 0.2% |
| Turkish | 45 | 0.5% |
| Ukrainian | 50 | 0.5% |
| Vietnamese | 82 | 0.9% |
| Welsh | 101 | 1.1% | View All 89 Rows |
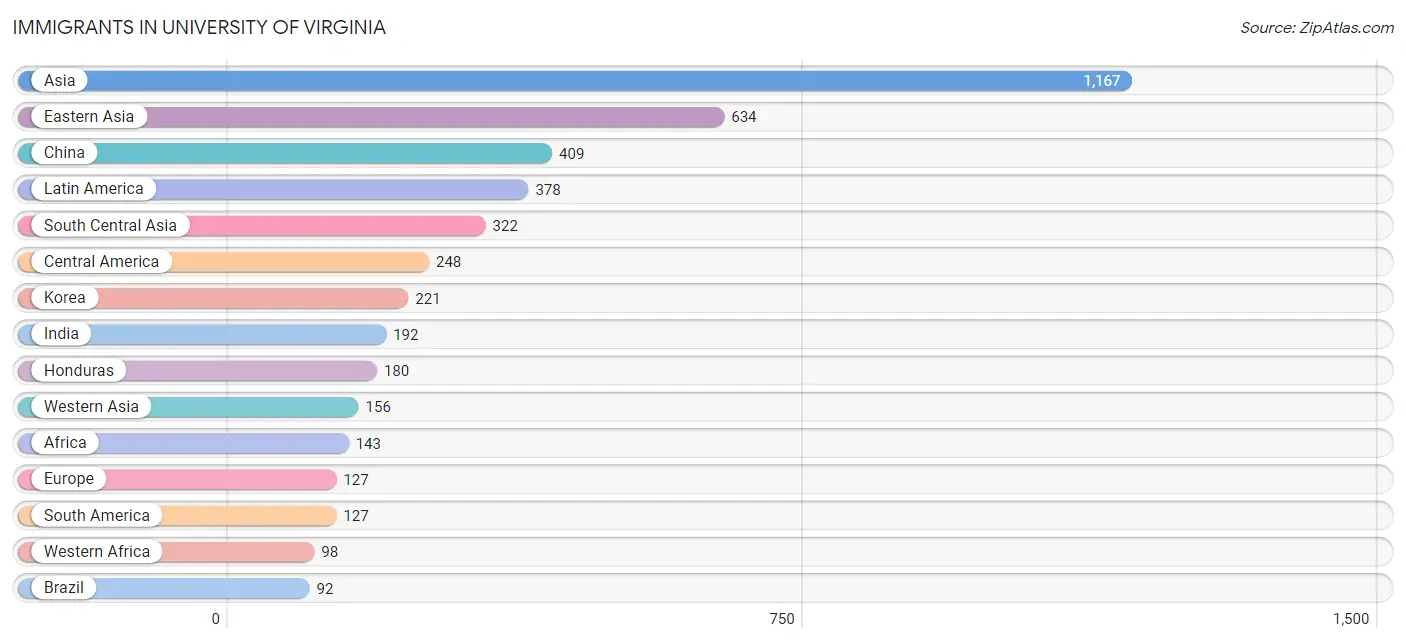
Immigrants in University of Virginia
The most numerous immigrant groups reported in University of Virginia came from Asia (1,167 | 12.1%), Eastern Asia (634 | 6.6%), China (409 | 4.2%), Latin America (378 | 3.9%), and South Central Asia (322 | 3.3%), together accounting for 30.2% of all University of Virginia residents.
| Immigration Origin | # Population | % Population |
| Africa | 143 | 1.5% |
| Argentina | 23 | 0.2% |
| Asia | 1,167 | 12.1% |
| Bangladesh | 41 | 0.4% |
| Brazil | 92 | 0.9% |
| Cambodia | 5 | 0.1% |
| Caribbean | 3 | 0.0% |
| Central America | 248 | 2.6% |
| China | 409 | 4.2% |
| Colombia | 12 | 0.1% |
| Congo | 6 | 0.1% |
| Dominican Republic | 3 | 0.0% |
| Eastern Africa | 14 | 0.2% |
| Eastern Asia | 634 | 6.6% |
| Eastern Europe | 24 | 0.3% |
| Egypt | 9 | 0.1% |
| El Salvador | 9 | 0.1% |
| England | 7 | 0.1% |
| Ethiopia | 4 | 0.0% |
| Europe | 127 | 1.3% |
| Germany | 23 | 0.2% |
| Ghana | 49 | 0.5% |
| Honduras | 180 | 1.9% |
| Hong Kong | 50 | 0.5% |
| India | 192 | 2.0% |
| Indonesia | 19 | 0.2% |
| Iran | 37 | 0.4% |
| Iraq | 38 | 0.4% |
| Israel | 1 | 0.0% |
| Italy | 30 | 0.3% |
| Japan | 4 | 0.0% |
| Jordan | 6 | 0.1% |
| Kenya | 10 | 0.1% |
| Korea | 221 | 2.3% |
| Latin America | 378 | 3.9% |
| Latvia | 5 | 0.1% |
| Mexico | 59 | 0.6% |
| Middle Africa | 22 | 0.2% |
| Nepal | 14 | 0.2% |
| Nigeria | 24 | 0.3% |
| Northern Africa | 9 | 0.1% |
| Northern Europe | 50 | 0.5% |
| Pakistan | 13 | 0.1% |
| Philippines | 7 | 0.1% |
| Poland | 5 | 0.1% |
| Russia | 14 | 0.2% |
| Singapore | 16 | 0.2% |
| South America | 127 | 1.3% |
| South Central Asia | 322 | 3.3% |
| South Eastern Asia | 55 | 0.6% |
| Southern Europe | 30 | 0.3% |
| Syria | 43 | 0.4% |
| Taiwan | 16 | 0.2% |
| Turkey | 58 | 0.6% |
| Vietnam | 8 | 0.1% |
| Western Africa | 98 | 1.0% |
| Western Asia | 156 | 1.6% |
| Western Europe | 23 | 0.2% |
| Zaire | 16 | 0.2% | View All 59 Rows |
Sex and Age in University of Virginia
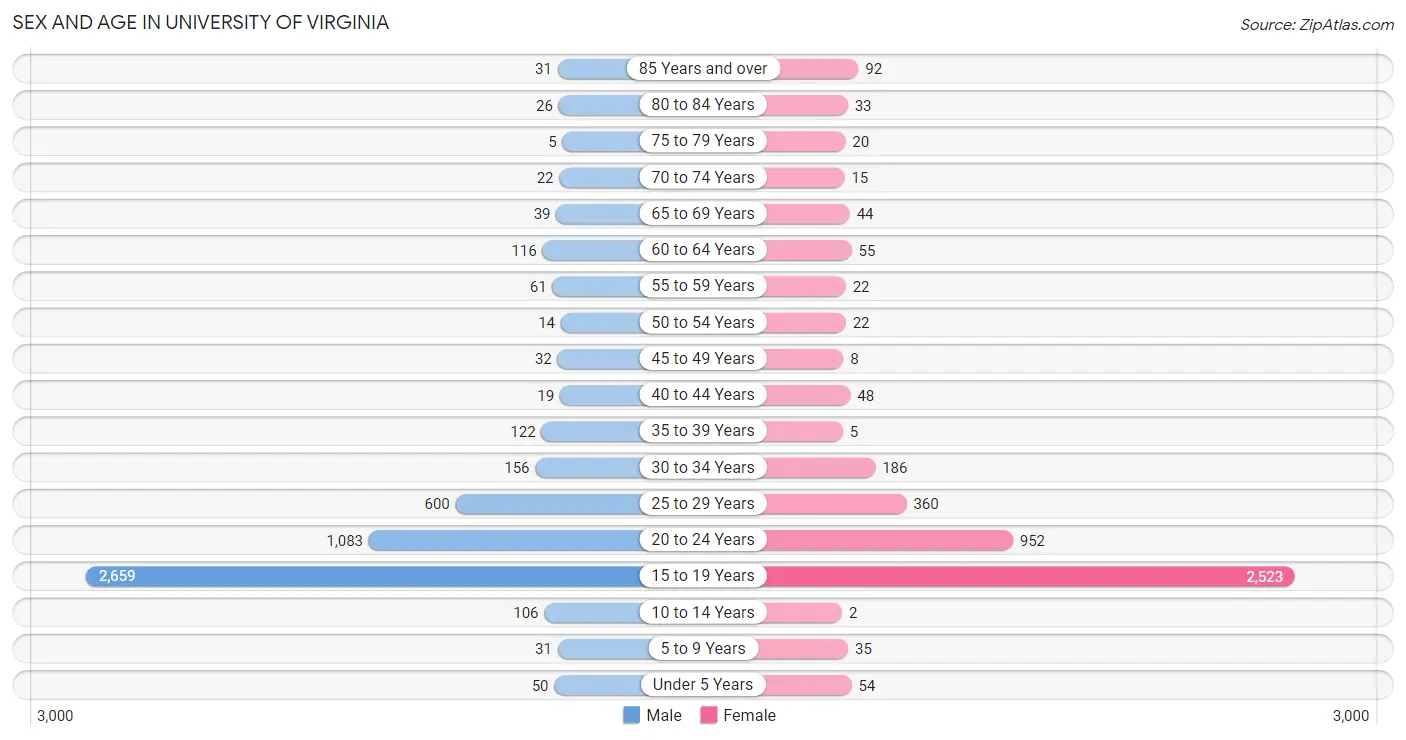
Sex and Age in University of Virginia
The most populous age groups in University of Virginia are 15 to 19 Years (2,659 | 51.4%) for men and 15 to 19 Years (2,523 | 56.4%) for women.
| Age Bracket | Male | Female |
| Under 5 Years | 50 (1.0%) | 54 (1.2%) |
| 5 to 9 Years | 31 (0.6%) | 35 (0.8%) |
| 10 to 14 Years | 106 (2.1%) | 2 (0.0%) |
| 15 to 19 Years | 2,659 (51.4%) | 2,523 (56.4%) |
| 20 to 24 Years | 1,083 (20.9%) | 952 (21.3%) |
| 25 to 29 Years | 600 (11.6%) | 360 (8.0%) |
| 30 to 34 Years | 156 (3.0%) | 186 (4.2%) |
| 35 to 39 Years | 122 (2.4%) | 5 (0.1%) |
| 40 to 44 Years | 19 (0.4%) | 48 (1.1%) |
| 45 to 49 Years | 32 (0.6%) | 8 (0.2%) |
| 50 to 54 Years | 14 (0.3%) | 22 (0.5%) |
| 55 to 59 Years | 61 (1.2%) | 22 (0.5%) |
| 60 to 64 Years | 116 (2.2%) | 55 (1.2%) |
| 65 to 69 Years | 39 (0.7%) | 44 (1.0%) |
| 70 to 74 Years | 22 (0.4%) | 15 (0.3%) |
| 75 to 79 Years | 5 (0.1%) | 20 (0.4%) |
| 80 to 84 Years | 26 (0.5%) | 33 (0.7%) |
| 85 Years and over | 31 (0.6%) | 92 (2.1%) |
| Total | 5,172 (100.0%) | 4,476 (100.0%) |
Families and Households in University of Virginia
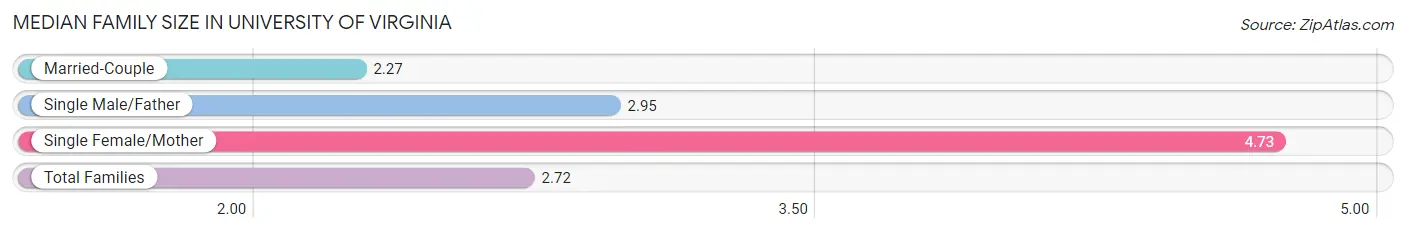
Median Family Size in University of Virginia
The median family size in University of Virginia is 2.72 persons per family, with single female/mother families (67 | 14.5%) accounting for the largest median family size of 4.73 persons per family. On the other hand, married-couple families (331 | 71.7%) represent the smallest median family size with 2.27 persons per family.
| Family Type | # Families | Family Size |
| Married-Couple | 331 (71.7%) | 2.27 |
| Single Male/Father | 64 (13.9%) | 2.95 |
| Single Female/Mother | 67 (14.5%) | 4.73 |
| Total Families | 462 (100.0%) | 2.72 |
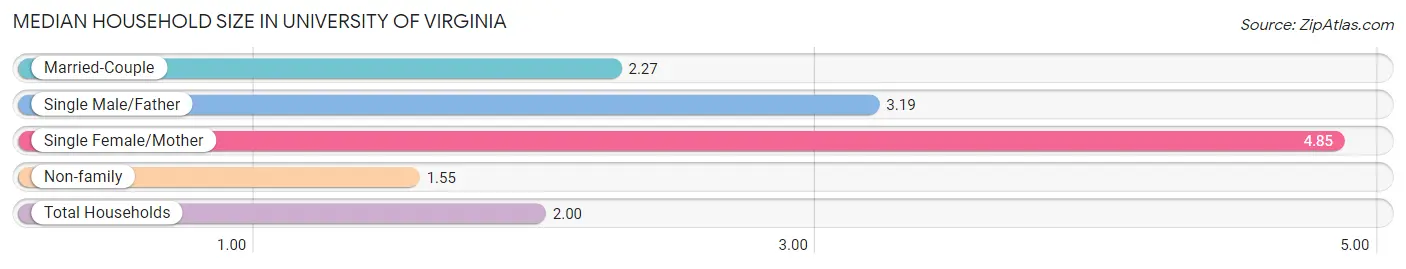
Median Household Size in University of Virginia
The median household size in University of Virginia is 2.00 persons per household, with single female/mother households (67 | 5.3%) accounting for the largest median household size of 4.85 persons per household. non-family households (807 | 63.6%) represent the smallest median household size with 1.55 persons per household.
| Household Type | # Households | Household Size |
| Married-Couple | 331 (26.1%) | 2.27 |
| Single Male/Father | 64 (5.0%) | 3.19 |
| Single Female/Mother | 67 (5.3%) | 4.85 |
| Non-family | 807 (63.6%) | 1.55 |
| Total Households | 1,269 (100.0%) | 2.00 |
Household Size by Marriage Status in University of Virginia
Out of a total of 1,269 households in University of Virginia, 462 (36.4%) are family households, while 807 (63.6%) are nonfamily households. The most numerous type of family households are 2-person households, comprising 309, and the most common type of nonfamily households are 1-person households, comprising 481.
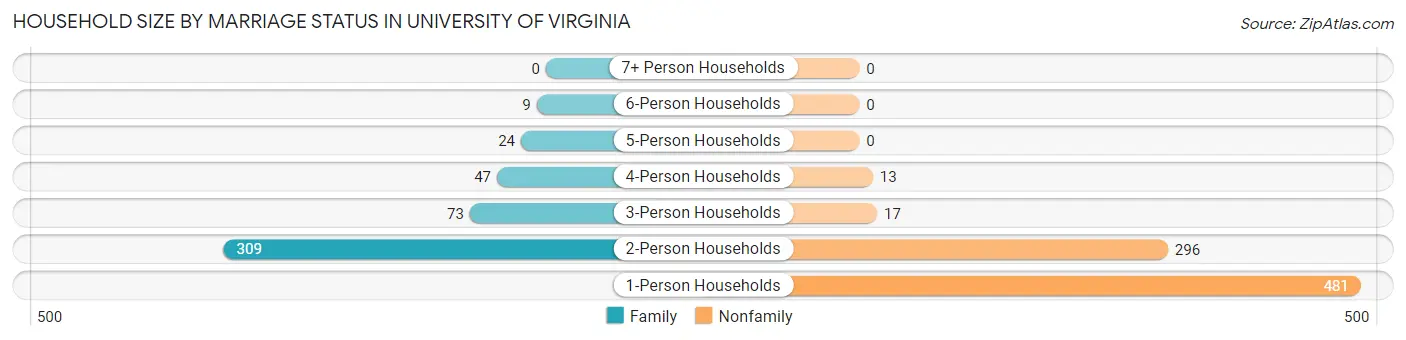
| Household Size | Family Households | Nonfamily Households |
| 1-Person Households | - | 481 (37.9%) |
| 2-Person Households | 309 (24.3%) | 296 (23.3%) |
| 3-Person Households | 73 (5.8%) | 17 (1.3%) |
| 4-Person Households | 47 (3.7%) | 13 (1.0%) |
| 5-Person Households | 24 (1.9%) | 0 (0.0%) |
| 6-Person Households | 9 (0.7%) | 0 (0.0%) |
| 7+ Person Households | 0 (0.0%) | 0 (0.0%) |
| Total | 462 (36.4%) | 807 (63.6%) |
Female Fertility in University of Virginia
Fertility by Age in University of Virginia
Average fertility rate in University of Virginia is 4.0 births per 1,000 women. Women in the age bracket of 35 to 50 years have the highest fertility rate with 66.0 births per 1,000 women. Women in the age bracket of 20 to 34 years acount for 56.2% of all women with births.
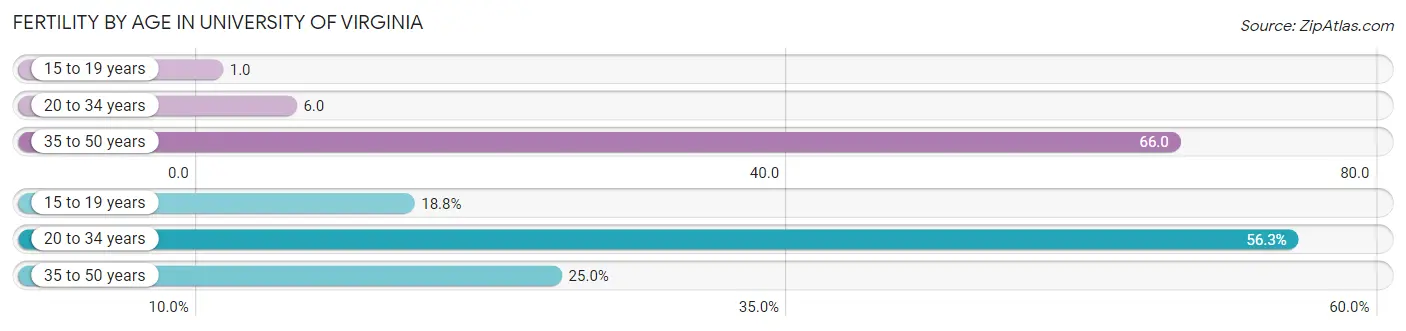
| Age Bracket | Women with Births | Births / 1,000 Women |
| 15 to 19 years | 3 (18.8%) | 1.0 |
| 20 to 34 years | 9 (56.2%) | 6.0 |
| 35 to 50 years | 4 (25.0%) | 66.0 |
| Total | 16 (100.0%) | 4.0 |
Fertility by Age by Marriage Status in University of Virginia
56.2% of women with births (16) in University of Virginia are married. The highest percentage of unmarried women with births falls into 15 to 19 years age bracket with 100.0% of them unmarried at the time of birth, while the lowest percentage of unmarried women with births belong to 35 to 50 years age bracket with 0.0% of them unmarried.
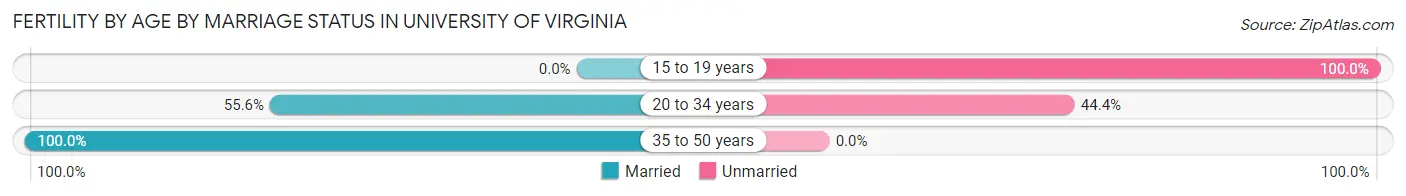
| Age Bracket | Married | Unmarried |
| 15 to 19 years | 0 (0.0%) | 3 (100.0%) |
| 20 to 34 years | 5 (55.6%) | 4 (44.4%) |
| 35 to 50 years | 4 (100.0%) | 0 (0.0%) |
| Total | 9 (56.2%) | 7 (43.8%) |
Fertility by Education in University of Virginia
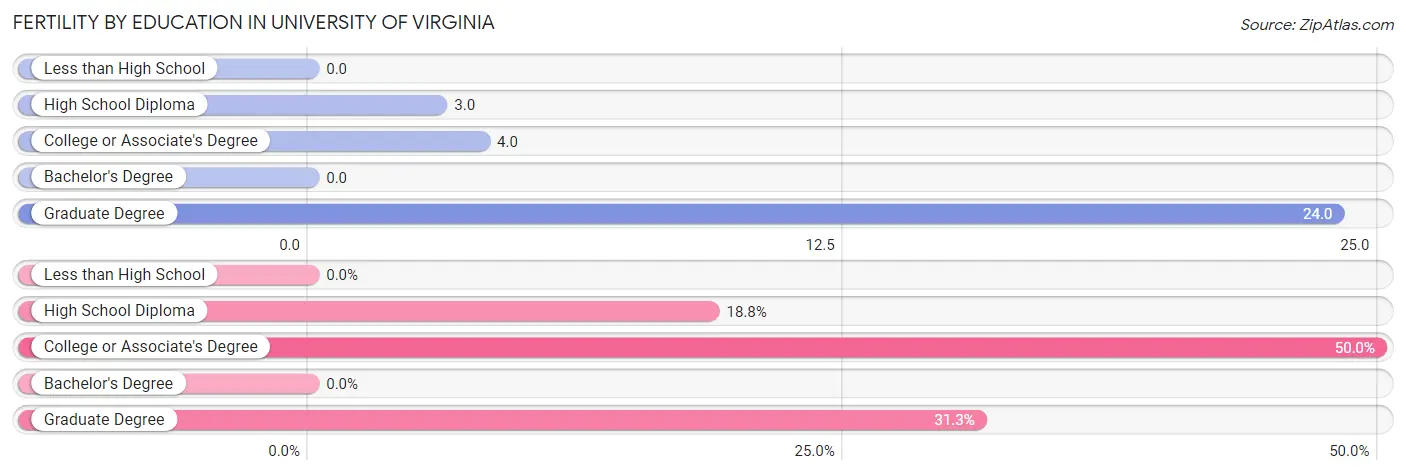
| Educational Attainment | Women with Births | Births / 1,000 Women |
| Less than High School | 0 (0.0%) | 0.0 |
| High School Diploma | 3 (18.8%) | 3.0 |
| College or Associate's Degree | 8 (50.0%) | 4.0 |
| Bachelor's Degree | 0 (0.0%) | 0.0 |
| Graduate Degree | 5 (31.2%) | 24.0 |
| Total | 16 (100.0%) | 4.0 |
Fertility by Education by Marriage Status in University of Virginia
43.8% of women with births in University of Virginia are unmarried. Women with the educational attainment of graduate degree are most likely to be married with 100.0% of them married at childbirth, while women with the educational attainment of high school diploma are least likely to be married with 100.0% of them unmarried at childbirth.
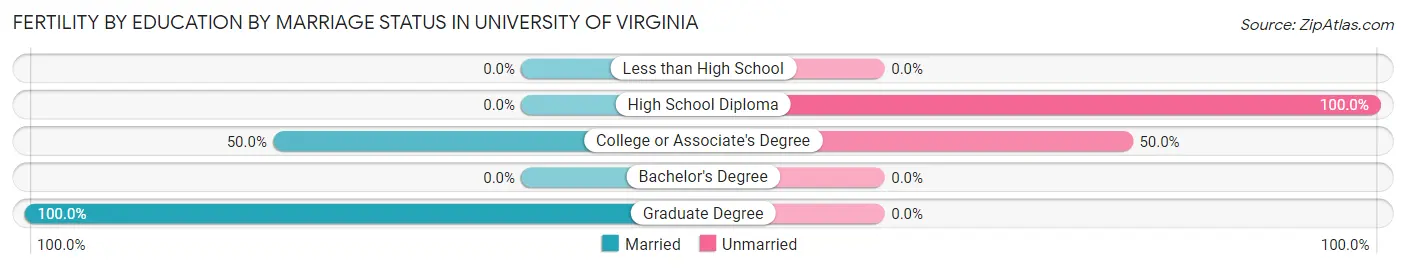
| Educational Attainment | Married | Unmarried |
| Less than High School | 0 (0.0%) | 0 (0.0%) |
| High School Diploma | 0 (0.0%) | 3 (100.0%) |
| College or Associate's Degree | 4 (50.0%) | 4 (50.0%) |
| Bachelor's Degree | 0 (0.0%) | 0 (0.0%) |
| Graduate Degree | 5 (100.0%) | 0 (0.0%) |
| Total | 9 (56.2%) | 7 (43.8%) |
Employment Characteristics in University of Virginia
Employment by Class of Employer in University of Virginia
Among the 2,633 employed individuals in University of Virginia, private company employees (1,477 | 56.1%), state government employees (754 | 28.6%), and not-for-profit organizations (178 | 6.8%) make up the most common classes of employment.
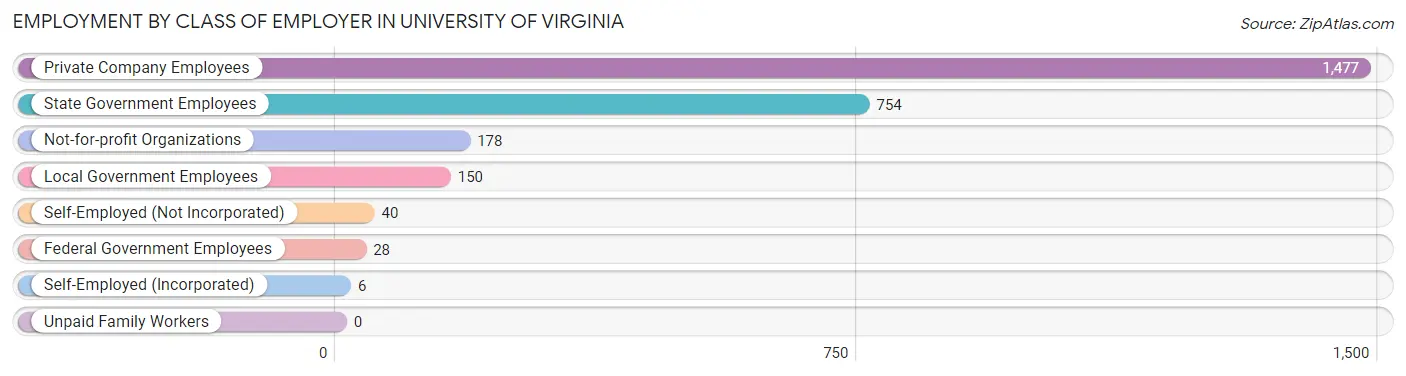
| Employer Class | # Employees | % Employees |
| Private Company Employees | 1,477 | 56.1% |
| Self-Employed (Incorporated) | 6 | 0.2% |
| Self-Employed (Not Incorporated) | 40 | 1.5% |
| Not-for-profit Organizations | 178 | 6.8% |
| Local Government Employees | 150 | 5.7% |
| State Government Employees | 754 | 28.6% |
| Federal Government Employees | 28 | 1.1% |
| Unpaid Family Workers | 0 | 0.0% |
| Total | 2,633 | 100.0% |
Employment Status by Age in University of Virginia
According to the labor force statistics for University of Virginia, out of the total population over 16 years of age (9,366), 33.6% or 3,147 individuals are in the labor force, with 7.4% or 233 of them unemployed. The age group with the highest labor force participation rate is 55 to 59 years, with 85.5% or 71 individuals in the labor force. Within the labor force, the 60 to 64 years age range has the highest percentage of unemployed individuals, with 14.5% or 16 of them being unemployed.
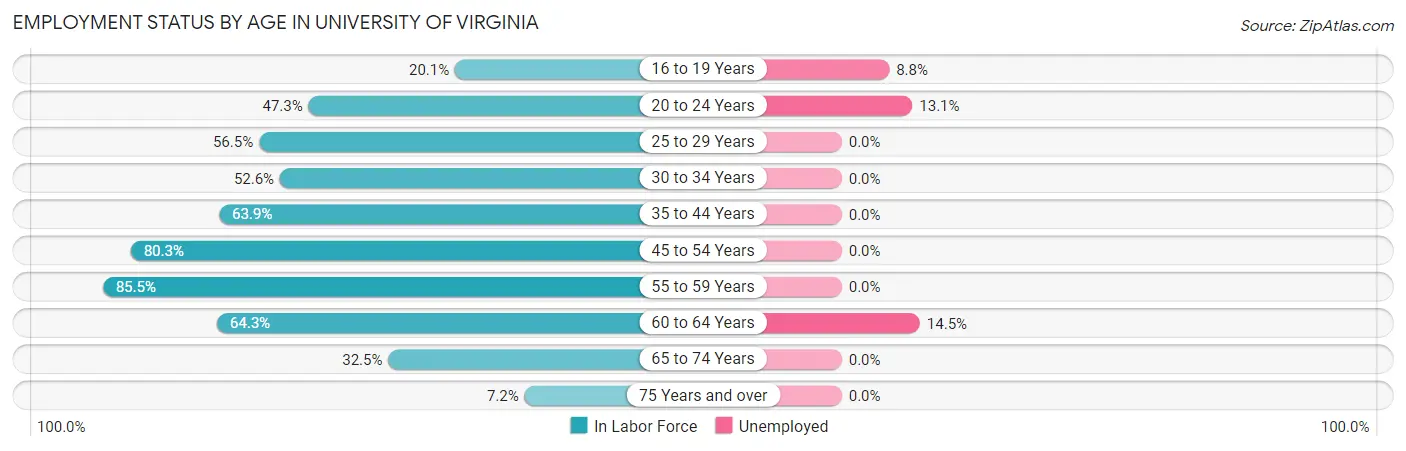
| Age Bracket | In Labor Force | Unemployed |
| 16 to 19 Years | 1,041 (20.1%) | 92 (8.8%) |
| 20 to 24 Years | 963 (47.3%) | 126 (13.1%) |
| 25 to 29 Years | 542 (56.5%) | 0 (0.0%) |
| 30 to 34 Years | 180 (52.6%) | 0 (0.0%) |
| 35 to 44 Years | 124 (63.9%) | 0 (0.0%) |
| 45 to 54 Years | 61 (80.3%) | 0 (0.0%) |
| 55 to 59 Years | 71 (85.5%) | 0 (0.0%) |
| 60 to 64 Years | 110 (64.3%) | 16 (14.5%) |
| 65 to 74 Years | 39 (32.5%) | 0 (0.0%) |
| 75 Years and over | 15 (7.2%) | 0 (0.0%) |
| Total | 3,147 (33.6%) | 233 (7.4%) |
Employment Status by Educational Attainment in University of Virginia
According to labor force statistics for University of Virginia, 59.6% of individuals (1,088) out of the total population between 25 and 64 years of age (1,826) are in the labor force, with 1.5% or 16 of them being unemployed. The group with the highest labor force participation rate are those with the educational attainment of high school diploma, with 78.0% or 170 individuals in the labor force. Within the labor force, individuals with less than high school education have the highest percentage of unemployment, with 8.5% or 9 of them being unemployed.
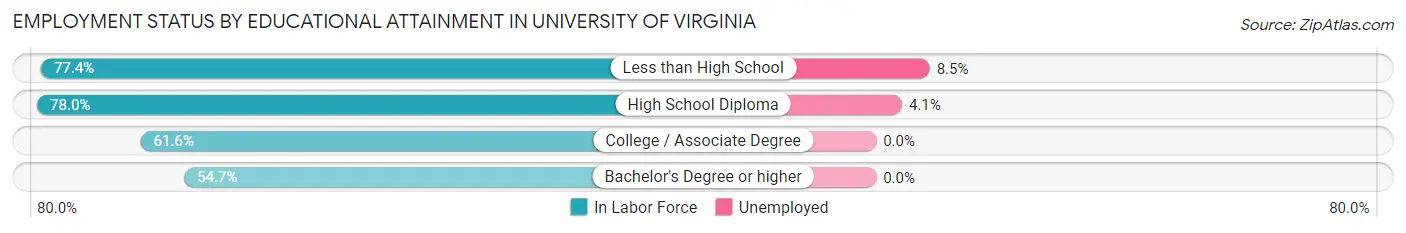
| Educational Attainment | In Labor Force | Unemployed |
| Less than High School | 106 (77.4%) | 12 (8.5%) |
| High School Diploma | 170 (78.0%) | 9 (4.1%) |
| College / Associate Degree | 61 (61.6%) | 0 (0.0%) |
| Bachelor's Degree or higher | 750 (54.7%) | 0 (0.0%) |
| Total | 1,088 (59.6%) | 27 (1.5%) |
Employment Occupations by Sex in University of Virginia
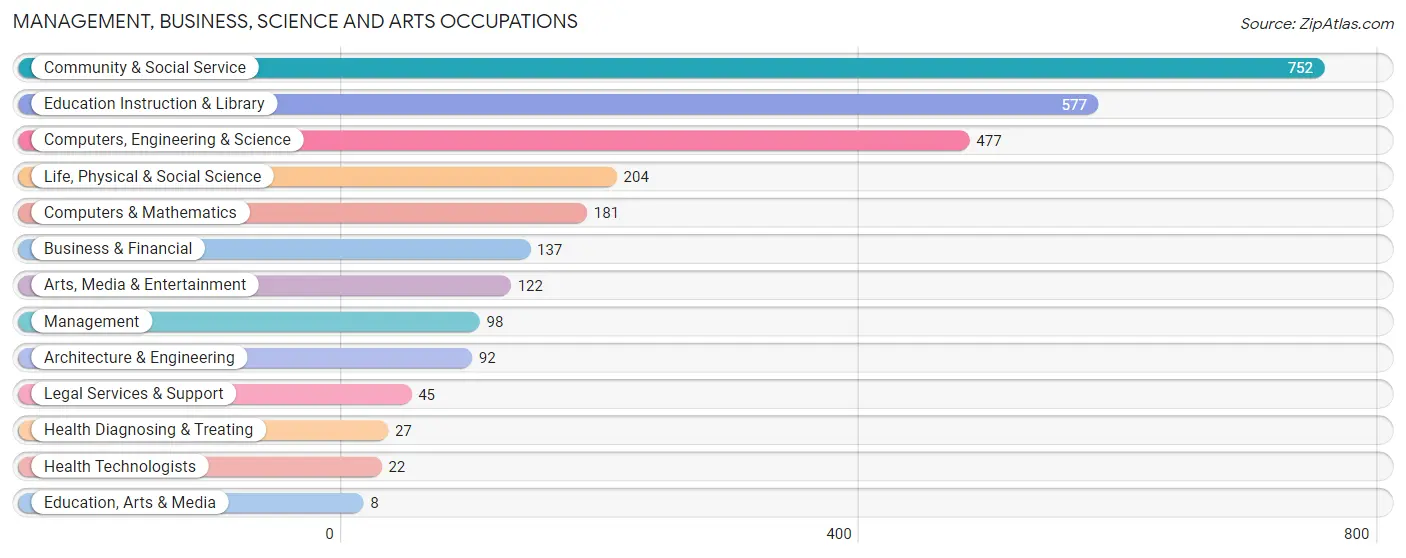
Management, Business, Science and Arts Occupations
The most common Management, Business, Science and Arts occupations in University of Virginia are Community & Social Service (752 | 25.9%), Education Instruction & Library (577 | 19.8%), Computers, Engineering & Science (477 | 16.4%), Life, Physical & Social Science (204 | 7.0%), and Computers & Mathematics (181 | 6.2%).
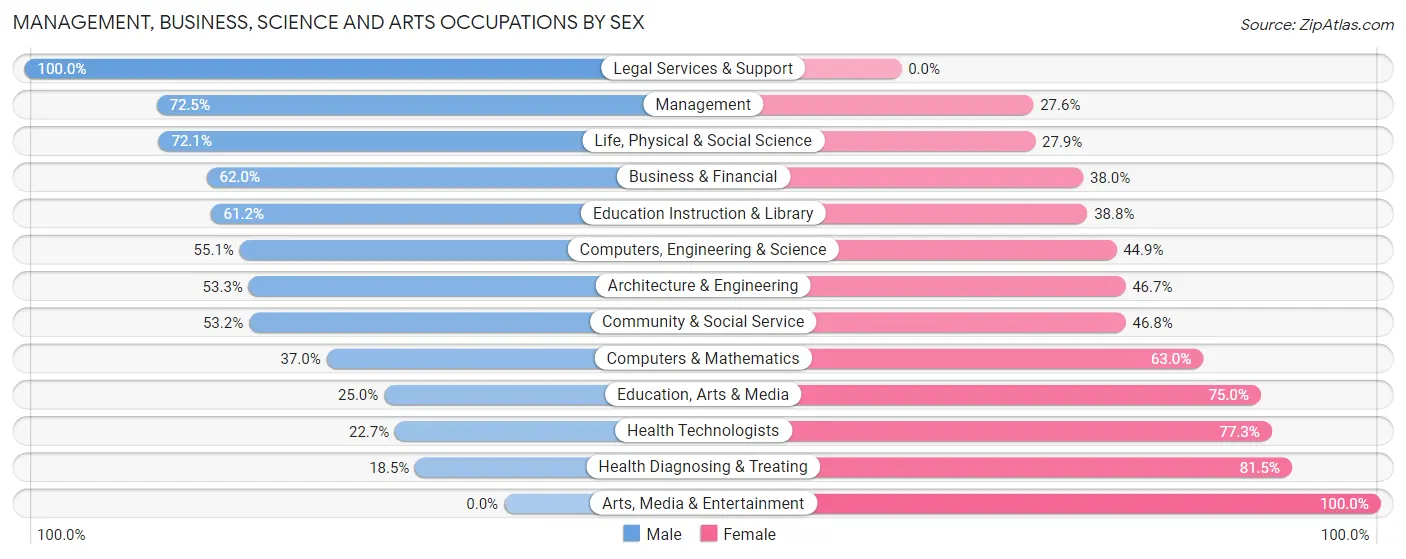
Management, Business, Science and Arts Occupations by Sex
Within the Management, Business, Science and Arts occupations in University of Virginia, the most male-oriented occupations are Legal Services & Support (100.0%), Management (72.5%), and Life, Physical & Social Science (72.1%), while the most female-oriented occupations are Arts, Media & Entertainment (100.0%), Health Diagnosing & Treating (81.5%), and Health Technologists (77.3%).
| Occupation | Male | Female |
| Management | 71 (72.5%) | 27 (27.6%) |
| Business & Financial | 85 (62.0%) | 52 (38.0%) |
| Computers, Engineering & Science | 263 (55.1%) | 214 (44.9%) |
| Computers & Mathematics | 67 (37.0%) | 114 (63.0%) |
| Architecture & Engineering | 49 (53.3%) | 43 (46.7%) |
| Life, Physical & Social Science | 147 (72.1%) | 57 (27.9%) |
| Community & Social Service | 400 (53.2%) | 352 (46.8%) |
| Education, Arts & Media | 2 (25.0%) | 6 (75.0%) |
| Legal Services & Support | 45 (100.0%) | 0 (0.0%) |
| Education Instruction & Library | 353 (61.2%) | 224 (38.8%) |
| Arts, Media & Entertainment | 0 (0.0%) | 122 (100.0%) |
| Health Diagnosing & Treating | 5 (18.5%) | 22 (81.5%) |
| Health Technologists | 5 (22.7%) | 17 (77.3%) |
| Total (Category) | 824 (55.3%) | 667 (44.7%) |
| Total (Overall) | 1,570 (54.0%) | 1,339 (46.0%) |
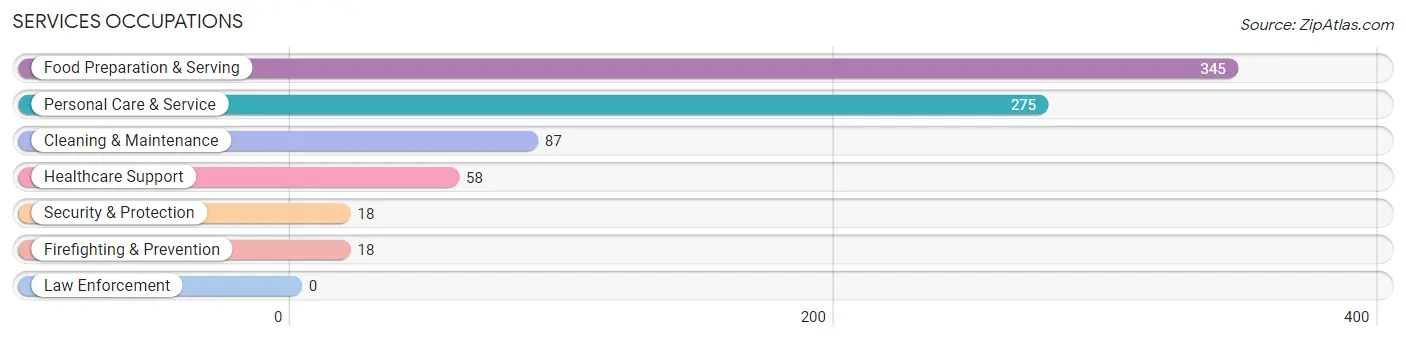
Services Occupations
The most common Services occupations in University of Virginia are Food Preparation & Serving (345 | 11.9%), Personal Care & Service (275 | 9.5%), Cleaning & Maintenance (87 | 3.0%), Healthcare Support (58 | 2.0%), and Security & Protection (18 | 0.6%).
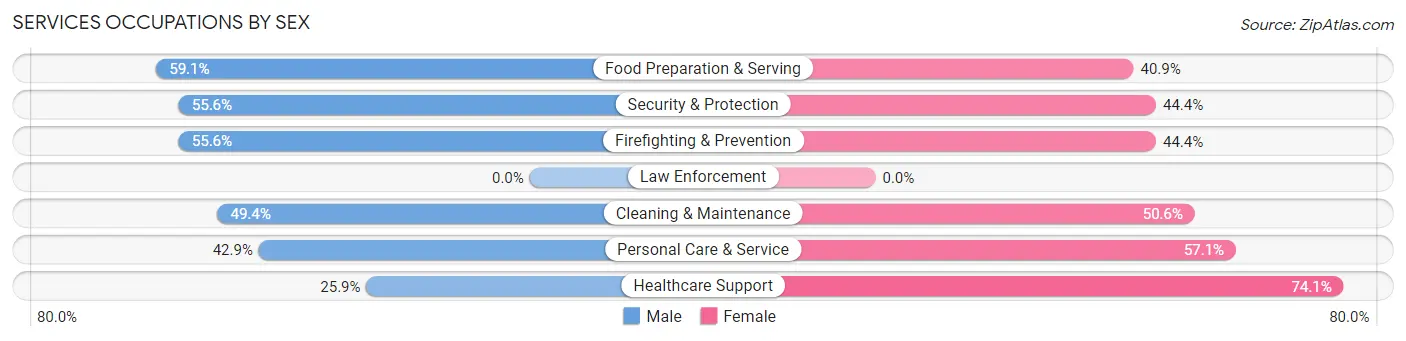
Services Occupations by Sex
Within the Services occupations in University of Virginia, the most male-oriented occupations are Food Preparation & Serving (59.1%), Security & Protection (55.6%), and Firefighting & Prevention (55.6%), while the most female-oriented occupations are Healthcare Support (74.1%), Personal Care & Service (57.1%), and Cleaning & Maintenance (50.6%).
| Occupation | Male | Female |
| Healthcare Support | 15 (25.9%) | 43 (74.1%) |
| Security & Protection | 10 (55.6%) | 8 (44.4%) |
| Firefighting & Prevention | 10 (55.6%) | 8 (44.4%) |
| Law Enforcement | 0 (0.0%) | 0 (0.0%) |
| Food Preparation & Serving | 204 (59.1%) | 141 (40.9%) |
| Cleaning & Maintenance | 43 (49.4%) | 44 (50.6%) |
| Personal Care & Service | 118 (42.9%) | 157 (57.1%) |
| Total (Category) | 390 (49.8%) | 393 (50.2%) |
| Total (Overall) | 1,570 (54.0%) | 1,339 (46.0%) |
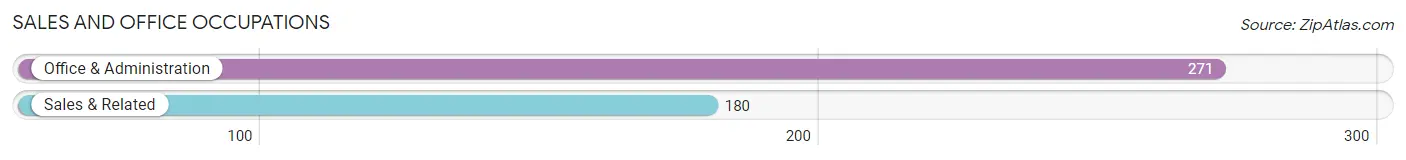
Sales and Office Occupations
The most common Sales and Office occupations in University of Virginia are Office & Administration (271 | 9.3%), and Sales & Related (180 | 6.2%).
Sales and Office Occupations by Sex
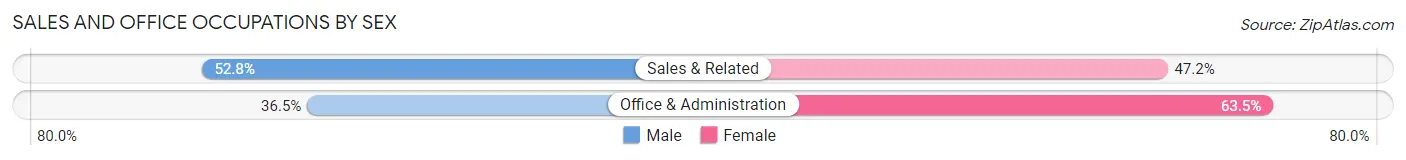
| Occupation | Male | Female |
| Sales & Related | 95 (52.8%) | 85 (47.2%) |
| Office & Administration | 99 (36.5%) | 172 (63.5%) |
| Total (Category) | 194 (43.0%) | 257 (57.0%) |
| Total (Overall) | 1,570 (54.0%) | 1,339 (46.0%) |
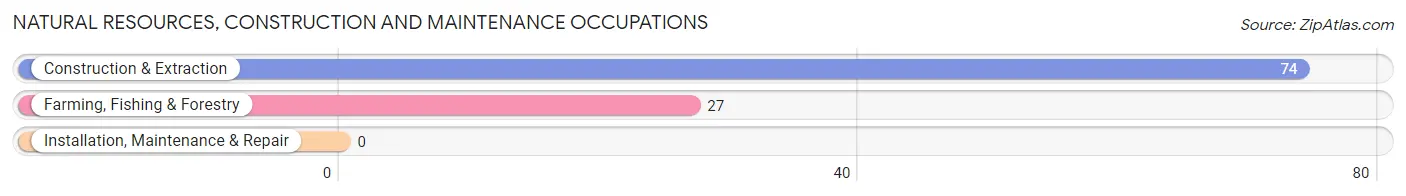
Natural Resources, Construction and Maintenance Occupations
The most common Natural Resources, Construction and Maintenance occupations in University of Virginia are Construction & Extraction (74 | 2.5%), and Farming, Fishing & Forestry (27 | 0.9%).
Natural Resources, Construction and Maintenance Occupations by Sex
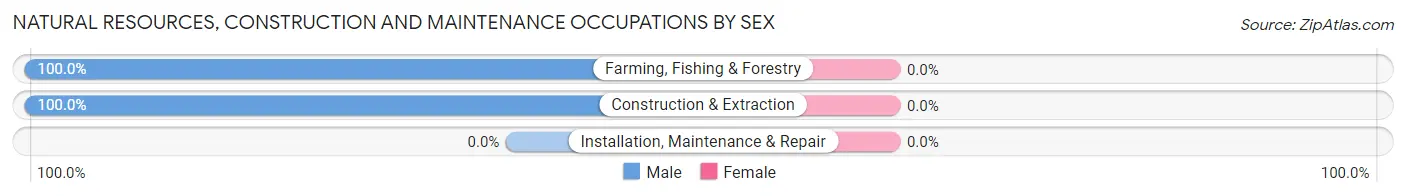
| Occupation | Male | Female |
| Farming, Fishing & Forestry | 27 (100.0%) | 0 (0.0%) |
| Construction & Extraction | 74 (100.0%) | 0 (0.0%) |
| Installation, Maintenance & Repair | 0 (0.0%) | 0 (0.0%) |
| Total (Category) | 101 (100.0%) | 0 (0.0%) |
| Total (Overall) | 1,570 (54.0%) | 1,339 (46.0%) |
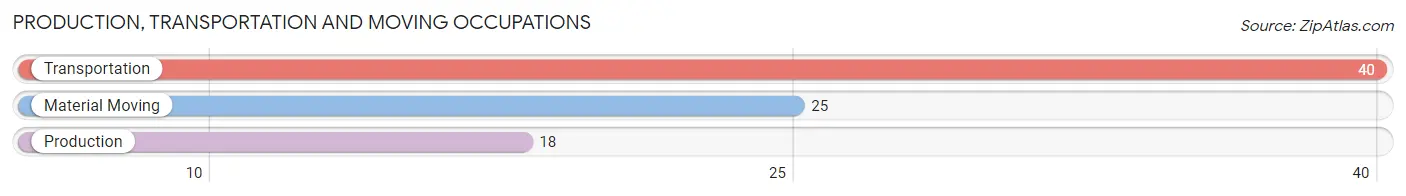
Production, Transportation and Moving Occupations
The most common Production, Transportation and Moving occupations in University of Virginia are Transportation (40 | 1.4%), Material Moving (25 | 0.9%), and Production (18 | 0.6%).
Production, Transportation and Moving Occupations by Sex
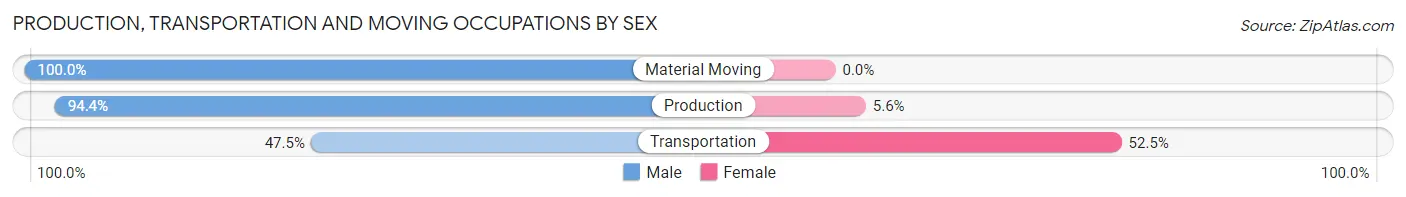
| Occupation | Male | Female |
| Production | 17 (94.4%) | 1 (5.6%) |
| Transportation | 19 (47.5%) | 21 (52.5%) |
| Material Moving | 25 (100.0%) | 0 (0.0%) |
| Total (Category) | 61 (73.5%) | 22 (26.5%) |
| Total (Overall) | 1,570 (54.0%) | 1,339 (46.0%) |
Employment Industries by Sex in University of Virginia
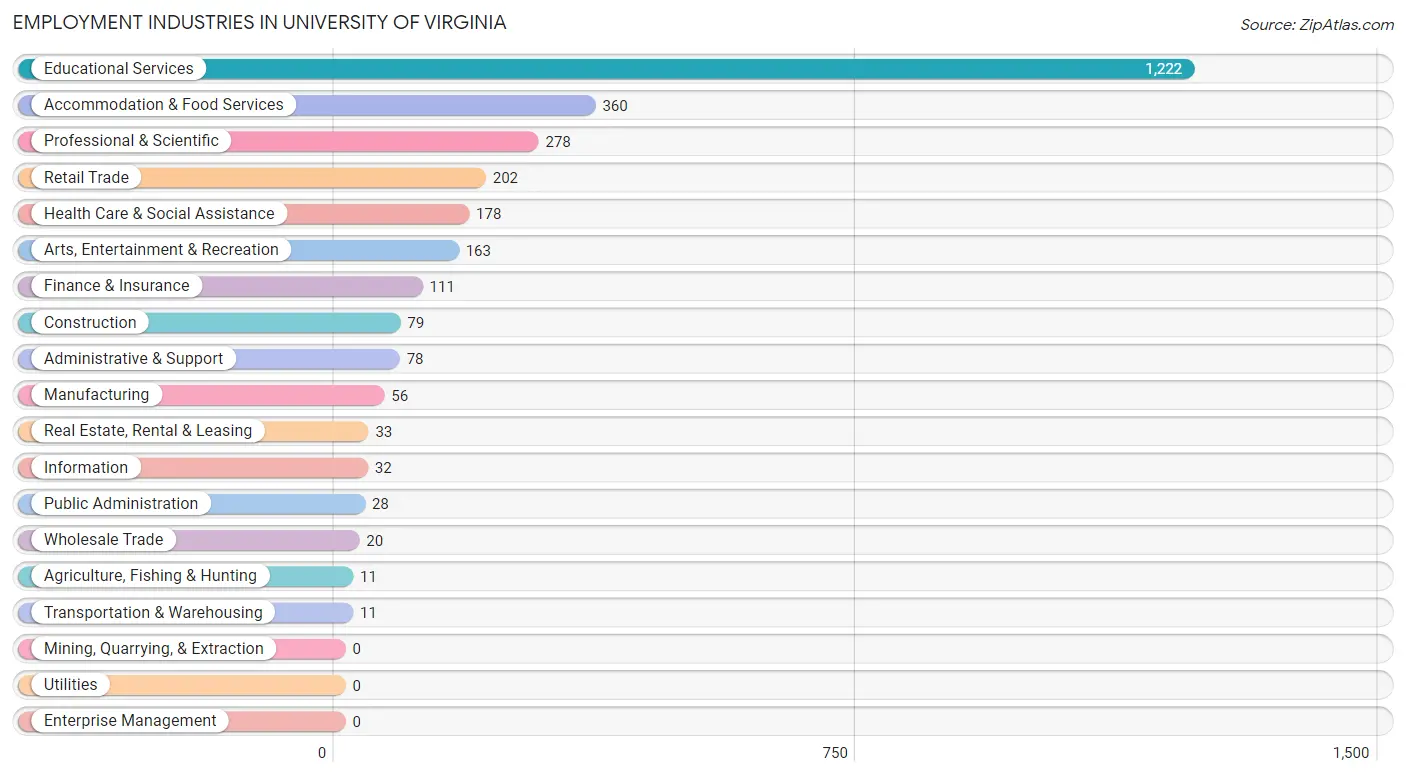
Employment Industries in University of Virginia
The major employment industries in University of Virginia include Educational Services (1,222 | 42.0%), Accommodation & Food Services (360 | 12.4%), Professional & Scientific (278 | 9.6%), Retail Trade (202 | 6.9%), and Health Care & Social Assistance (178 | 6.1%).
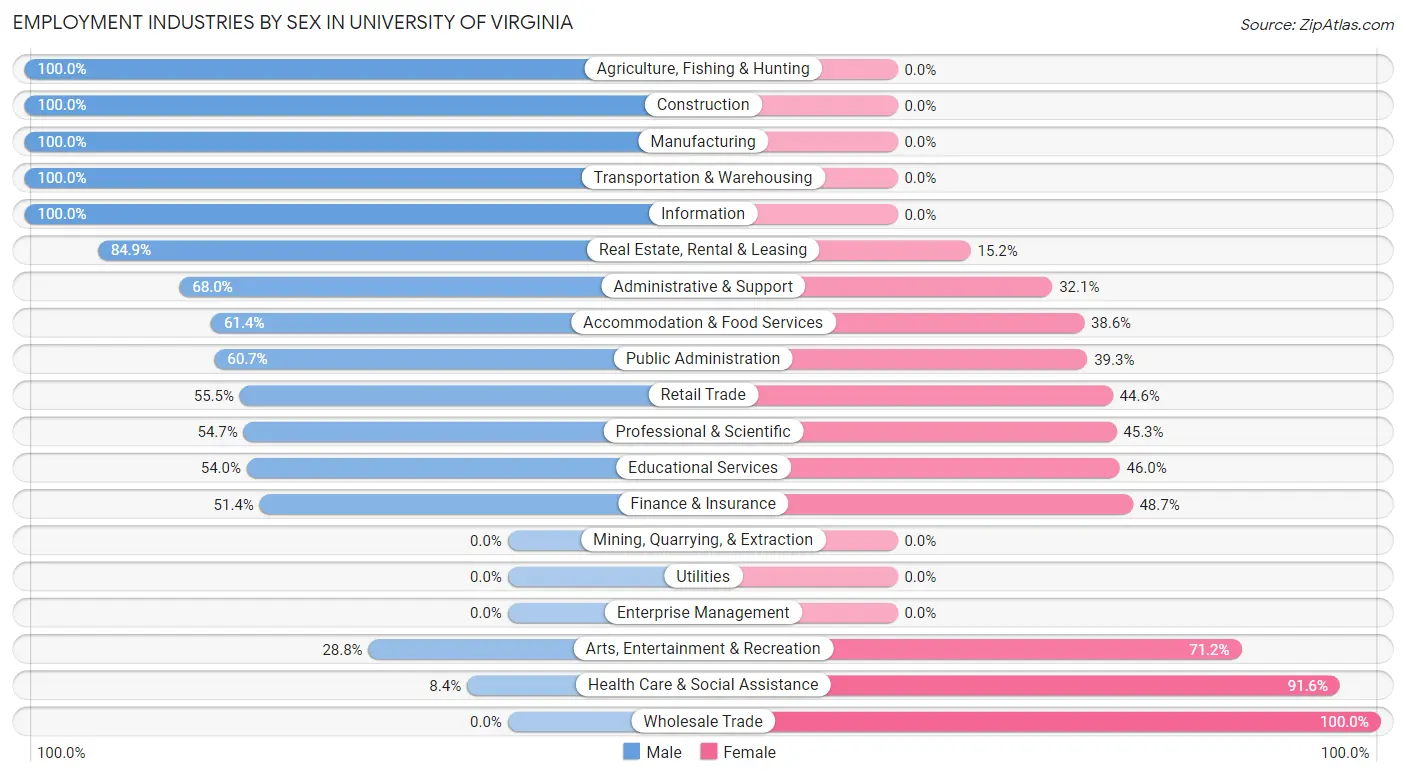
Employment Industries by Sex in University of Virginia
The University of Virginia industries that see more men than women are Agriculture, Fishing & Hunting (100.0%), Construction (100.0%), and Manufacturing (100.0%), whereas the industries that tend to have a higher number of women are Wholesale Trade (100.0%), Health Care & Social Assistance (91.6%), and Arts, Entertainment & Recreation (71.2%).
| Industry | Male | Female |
| Agriculture, Fishing & Hunting | 11 (100.0%) | 0 (0.0%) |
| Mining, Quarrying, & Extraction | 0 (0.0%) | 0 (0.0%) |
| Construction | 79 (100.0%) | 0 (0.0%) |
| Manufacturing | 56 (100.0%) | 0 (0.0%) |
| Wholesale Trade | 0 (0.0%) | 20 (100.0%) |
| Retail Trade | 112 (55.4%) | 90 (44.6%) |
| Transportation & Warehousing | 11 (100.0%) | 0 (0.0%) |
| Utilities | 0 (0.0%) | 0 (0.0%) |
| Information | 32 (100.0%) | 0 (0.0%) |
| Finance & Insurance | 57 (51.3%) | 54 (48.6%) |
| Real Estate, Rental & Leasing | 28 (84.9%) | 5 (15.1%) |
| Professional & Scientific | 152 (54.7%) | 126 (45.3%) |
| Enterprise Management | 0 (0.0%) | 0 (0.0%) |
| Administrative & Support | 53 (67.9%) | 25 (32.1%) |
| Educational Services | 660 (54.0%) | 562 (46.0%) |
| Health Care & Social Assistance | 15 (8.4%) | 163 (91.6%) |
| Arts, Entertainment & Recreation | 47 (28.8%) | 116 (71.2%) |
| Accommodation & Food Services | 221 (61.4%) | 139 (38.6%) |
| Public Administration | 17 (60.7%) | 11 (39.3%) |
| Total | 1,570 (54.0%) | 1,339 (46.0%) |
Education in University of Virginia
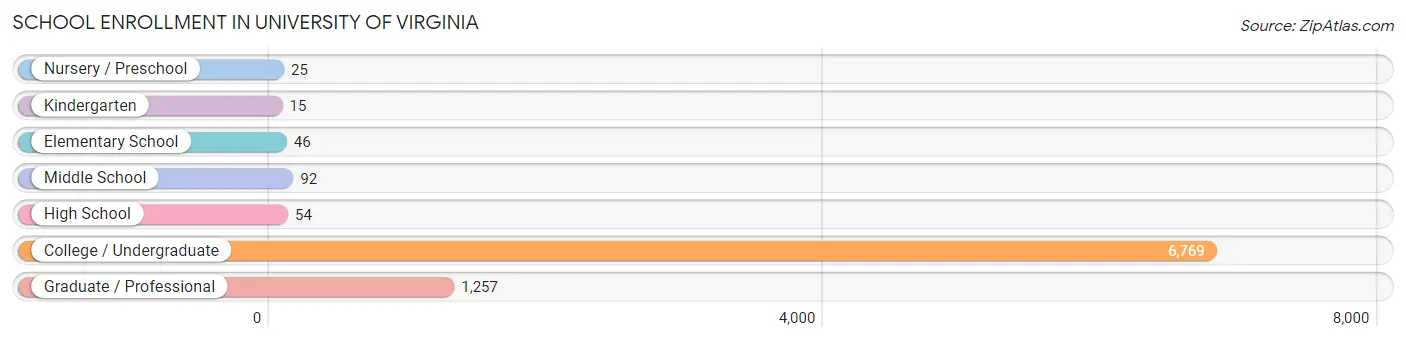
School Enrollment in University of Virginia
The most common levels of schooling among the 8,258 students in University of Virginia are college / undergraduate (6,769 | 82.0%), graduate / professional (1,257 | 15.2%), and middle school (92 | 1.1%).
| School Level | # Students | % Students |
| Nursery / Preschool | 25 | 0.3% |
| Kindergarten | 15 | 0.2% |
| Elementary School | 46 | 0.6% |
| Middle School | 92 | 1.1% |
| High School | 54 | 0.6% |
| College / Undergraduate | 6,769 | 82.0% |
| Graduate / Professional | 1,257 | 15.2% |
| Total | 8,258 | 100.0% |
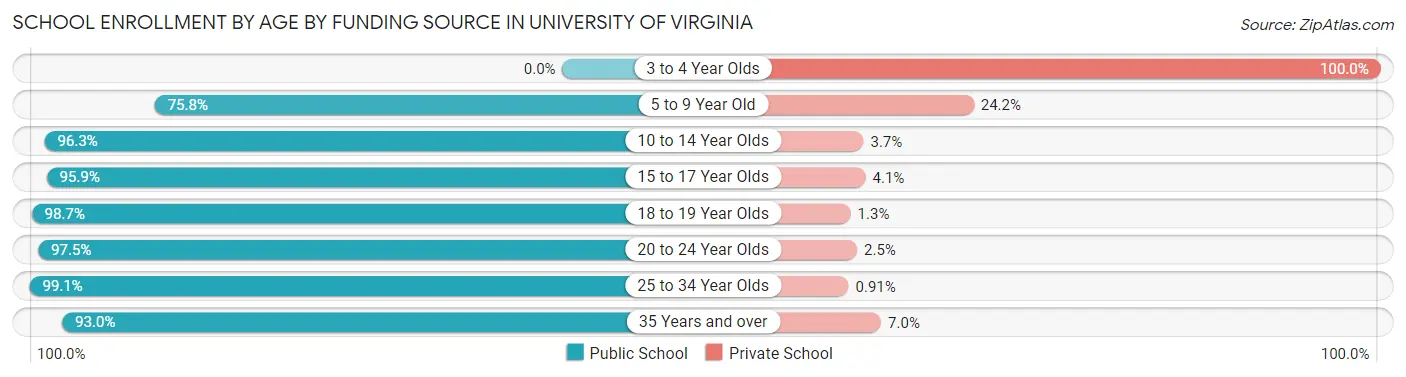
School Enrollment by Age by Funding Source in University of Virginia
Out of a total of 8,258 students who are enrolled in schools in University of Virginia, 173 (2.1%) attend a private institution, while the remaining 8,085 (97.9%) are enrolled in public schools. The age group of 3 to 4 year olds has the highest likelihood of being enrolled in private schools, with 20 (100.0% in the age bracket) enrolled. Conversely, the age group of 25 to 34 year olds has the lowest likelihood of being enrolled in a private school, with 871 (99.1% in the age bracket) attending a public institution.
| Age Bracket | Public School | Private School |
| 3 to 4 Year Olds | 0 (0.0%) | 20 (100.0%) |
| 5 to 9 Year Old | 50 (75.8%) | 16 (24.2%) |
| 10 to 14 Year Olds | 104 (96.3%) | 4 (3.7%) |
| 15 to 17 Year Olds | 94 (95.9%) | 4 (4.1%) |
| 18 to 19 Year Olds | 5,018 (98.7%) | 66 (1.3%) |
| 20 to 24 Year Olds | 1,911 (97.5%) | 49 (2.5%) |
| 25 to 34 Year Olds | 871 (99.1%) | 8 (0.9%) |
| 35 Years and over | 40 (93.0%) | 3 (7.0%) |
| Total | 8,085 (97.9%) | 173 (2.1%) |
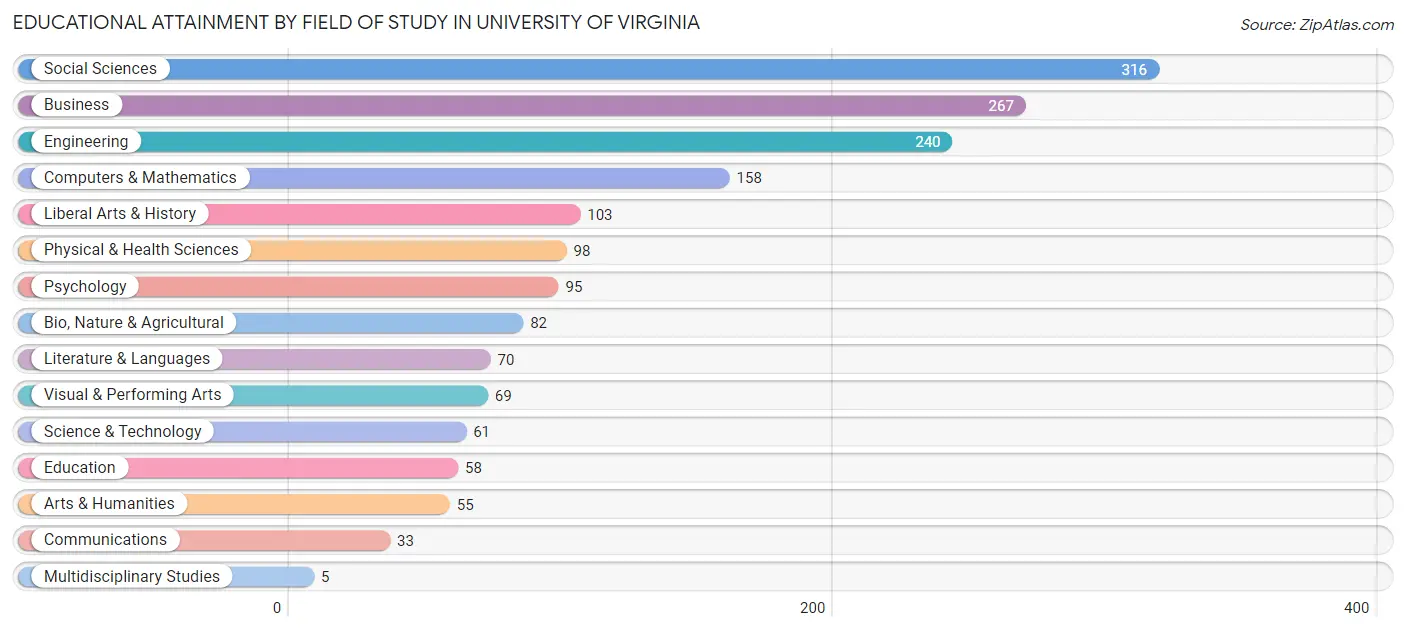
Educational Attainment by Field of Study in University of Virginia
Social sciences (316 | 18.5%), business (267 | 15.6%), engineering (240 | 14.0%), computers & mathematics (158 | 9.2%), and liberal arts & history (103 | 6.0%) are the most common fields of study among 1,710 individuals in University of Virginia who have obtained a bachelor's degree or higher.
| Field of Study | # Graduates | % Graduates |
| Computers & Mathematics | 158 | 9.2% |
| Bio, Nature & Agricultural | 82 | 4.8% |
| Physical & Health Sciences | 98 | 5.7% |
| Psychology | 95 | 5.6% |
| Social Sciences | 316 | 18.5% |
| Engineering | 240 | 14.0% |
| Multidisciplinary Studies | 5 | 0.3% |
| Science & Technology | 61 | 3.6% |
| Business | 267 | 15.6% |
| Education | 58 | 3.4% |
| Literature & Languages | 70 | 4.1% |
| Liberal Arts & History | 103 | 6.0% |
| Visual & Performing Arts | 69 | 4.0% |
| Communications | 33 | 1.9% |
| Arts & Humanities | 55 | 3.2% |
| Total | 1,710 | 100.0% |
Transportation & Commute in University of Virginia
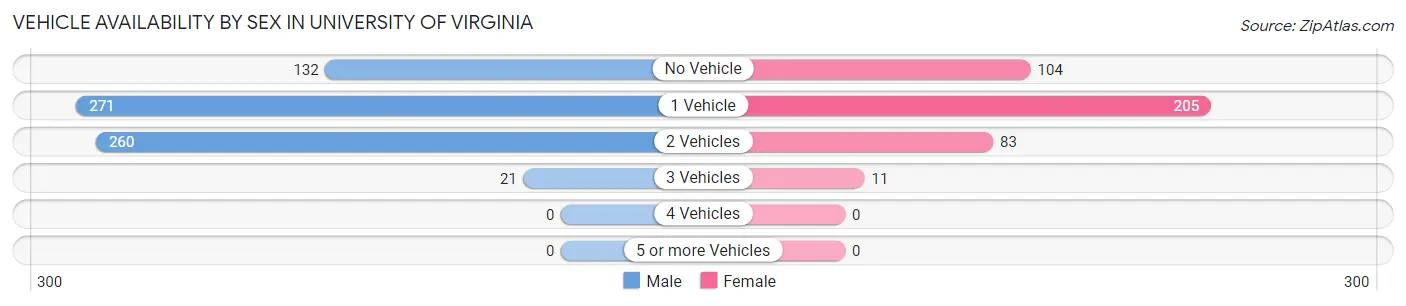
Vehicle Availability by Sex in University of Virginia
The most prevalent vehicle ownership categories in University of Virginia are males with 1 vehicle (271, accounting for 39.6%) and females with 1 vehicle (205, making up 67.2%).
| Vehicles Available | Male | Female |
| No Vehicle | 132 (19.3%) | 104 (25.8%) |
| 1 Vehicle | 271 (39.6%) | 205 (50.9%) |
| 2 Vehicles | 260 (38.0%) | 83 (20.6%) |
| 3 Vehicles | 21 (3.1%) | 11 (2.7%) |
| 4 Vehicles | 0 (0.0%) | 0 (0.0%) |
| 5 or more Vehicles | 0 (0.0%) | 0 (0.0%) |
| Total | 684 (100.0%) | 403 (100.0%) |
Commute Time in University of Virginia
The most frequently occuring commute durations in University of Virginia are 10 to 14 minutes (565 commuters, 25.7%), 15 to 19 minutes (431 commuters, 19.6%), and 30 to 34 minutes (417 commuters, 19.0%).
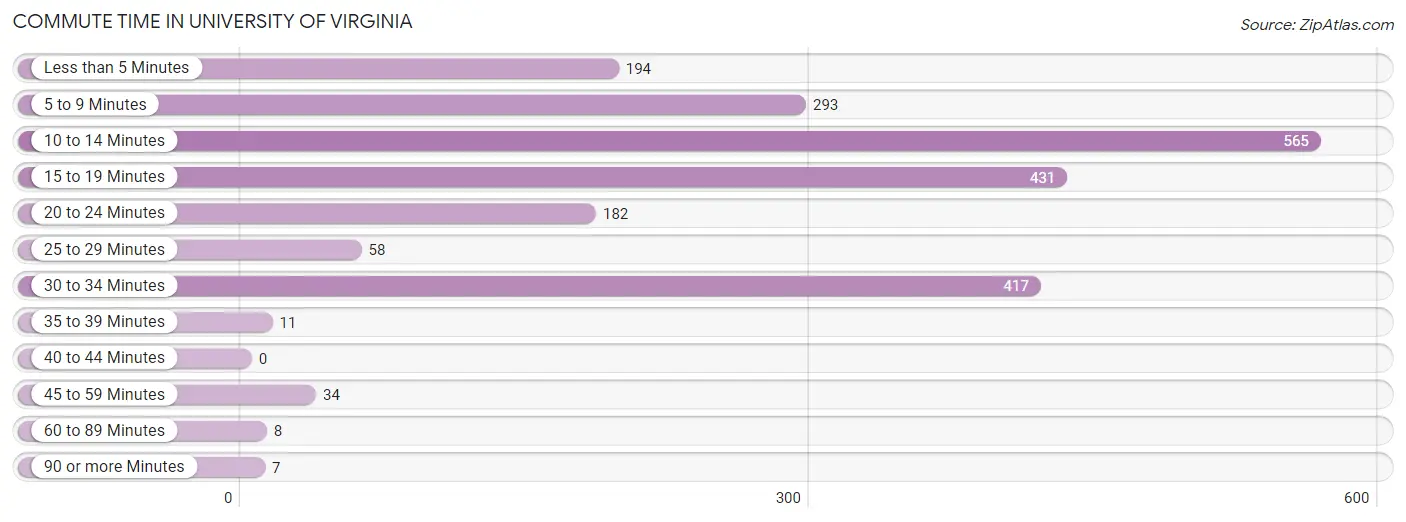
| Commute Time | # Commuters | % Commuters |
| Less than 5 Minutes | 194 | 8.8% |
| 5 to 9 Minutes | 293 | 13.3% |
| 10 to 14 Minutes | 565 | 25.7% |
| 15 to 19 Minutes | 431 | 19.6% |
| 20 to 24 Minutes | 182 | 8.3% |
| 25 to 29 Minutes | 58 | 2.6% |
| 30 to 34 Minutes | 417 | 19.0% |
| 35 to 39 Minutes | 11 | 0.5% |
| 40 to 44 Minutes | 0 | 0.0% |
| 45 to 59 Minutes | 34 | 1.5% |
| 60 to 89 Minutes | 8 | 0.4% |
| 90 or more Minutes | 7 | 0.3% |
Commute Time by Sex in University of Virginia
The most common commute times in University of Virginia are 15 to 19 minutes (280 commuters, 23.9%) for males and 10 to 14 minutes (291 commuters, 28.3%) for females.
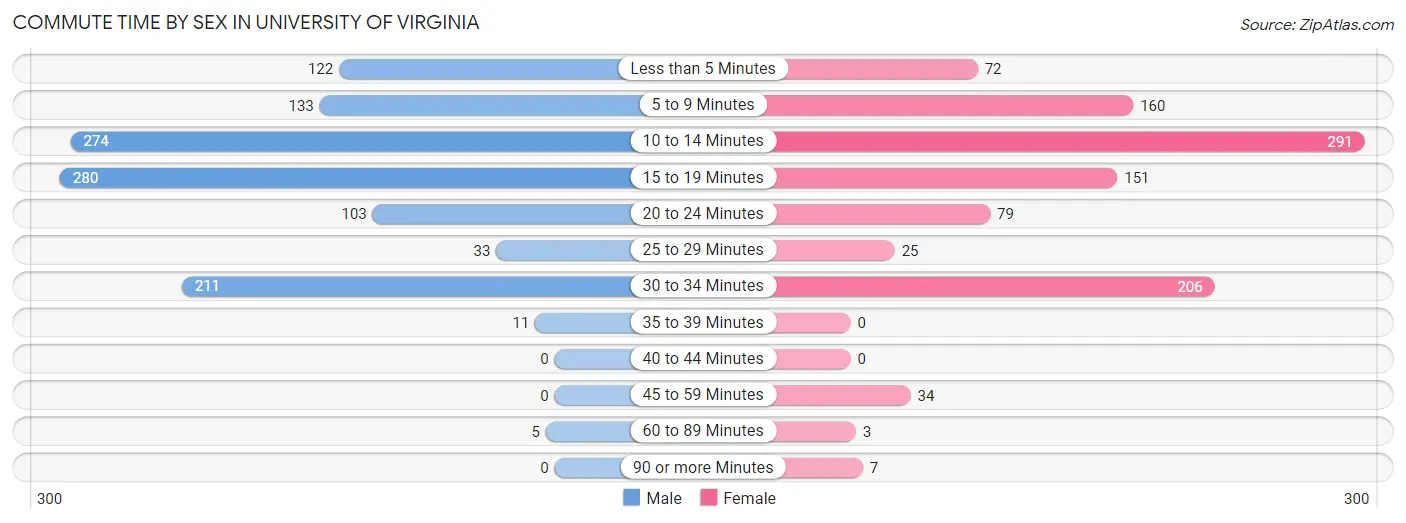
| Commute Time | Male | Female |
| Less than 5 Minutes | 122 (10.4%) | 72 (7.0%) |
| 5 to 9 Minutes | 133 (11.4%) | 160 (15.6%) |
| 10 to 14 Minutes | 274 (23.4%) | 291 (28.3%) |
| 15 to 19 Minutes | 280 (23.9%) | 151 (14.7%) |
| 20 to 24 Minutes | 103 (8.8%) | 79 (7.7%) |
| 25 to 29 Minutes | 33 (2.8%) | 25 (2.4%) |
| 30 to 34 Minutes | 211 (18.0%) | 206 (20.0%) |
| 35 to 39 Minutes | 11 (0.9%) | 0 (0.0%) |
| 40 to 44 Minutes | 0 (0.0%) | 0 (0.0%) |
| 45 to 59 Minutes | 0 (0.0%) | 34 (3.3%) |
| 60 to 89 Minutes | 5 (0.4%) | 3 (0.3%) |
| 90 or more Minutes | 0 (0.0%) | 7 (0.7%) |
Time of Departure to Work by Sex in University of Virginia
The most frequent times of departure to work in University of Virginia are 12:00 PM to 3:59 PM (213, 18.2%) for males and 12:00 PM to 3:59 PM (290, 28.2%) for females.
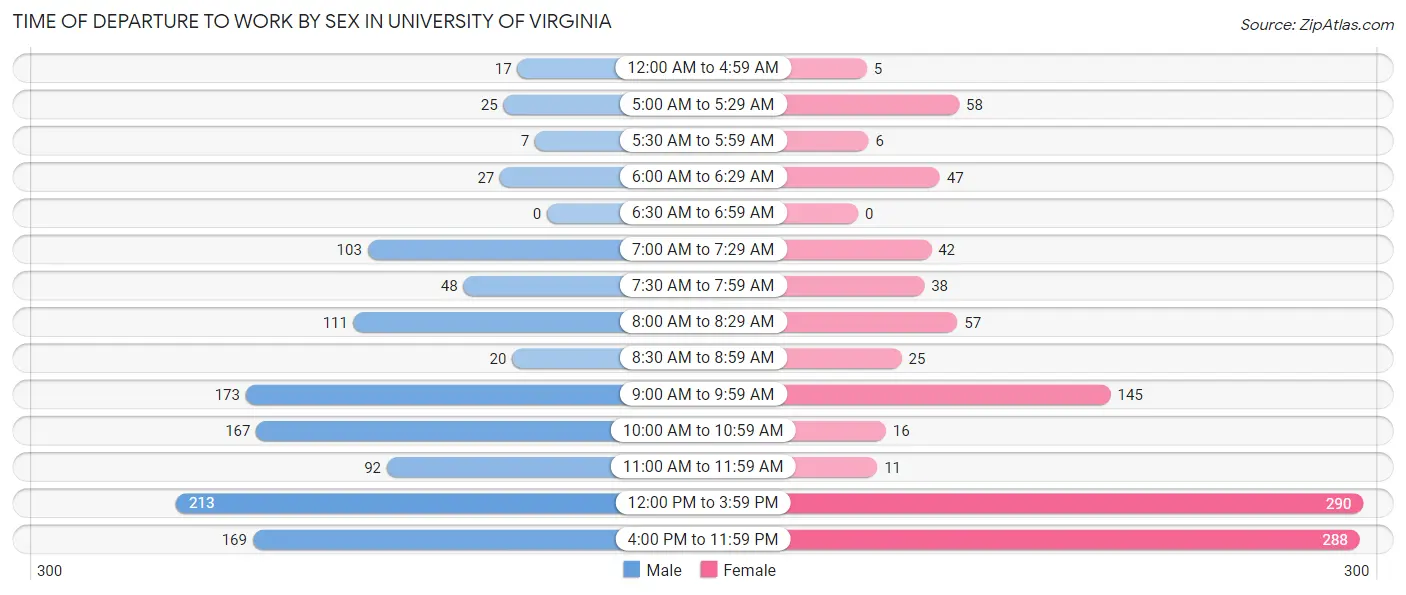
| Time of Departure | Male | Female |
| 12:00 AM to 4:59 AM | 17 (1.5%) | 5 (0.5%) |
| 5:00 AM to 5:29 AM | 25 (2.1%) | 58 (5.6%) |
| 5:30 AM to 5:59 AM | 7 (0.6%) | 6 (0.6%) |
| 6:00 AM to 6:29 AM | 27 (2.3%) | 47 (4.6%) |
| 6:30 AM to 6:59 AM | 0 (0.0%) | 0 (0.0%) |
| 7:00 AM to 7:29 AM | 103 (8.8%) | 42 (4.1%) |
| 7:30 AM to 7:59 AM | 48 (4.1%) | 38 (3.7%) |
| 8:00 AM to 8:29 AM | 111 (9.5%) | 57 (5.5%) |
| 8:30 AM to 8:59 AM | 20 (1.7%) | 25 (2.4%) |
| 9:00 AM to 9:59 AM | 173 (14.8%) | 145 (14.1%) |
| 10:00 AM to 10:59 AM | 167 (14.2%) | 16 (1.6%) |
| 11:00 AM to 11:59 AM | 92 (7.9%) | 11 (1.1%) |
| 12:00 PM to 3:59 PM | 213 (18.2%) | 290 (28.2%) |
| 4:00 PM to 11:59 PM | 169 (14.4%) | 288 (28.0%) |
| Total | 1,172 (100.0%) | 1,028 (100.0%) |
Housing Occupancy in University of Virginia
Occupancy by Ownership in University of Virginia
Of the total 1,269 dwellings in University of Virginia, owner-occupied units account for 250 (19.7%), while renter-occupied units make up 1,019 (80.3%).
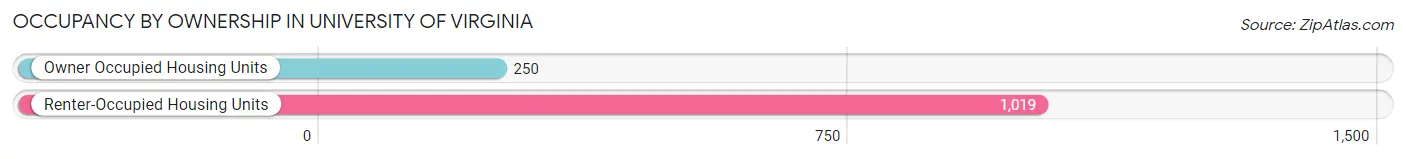
| Occupancy | # Housing Units | % Housing Units |
| Owner Occupied Housing Units | 250 | 19.7% |
| Renter-Occupied Housing Units | 1,019 | 80.3% |
| Total Occupied Housing Units | 1,269 | 100.0% |
Occupancy by Household Size in University of Virginia
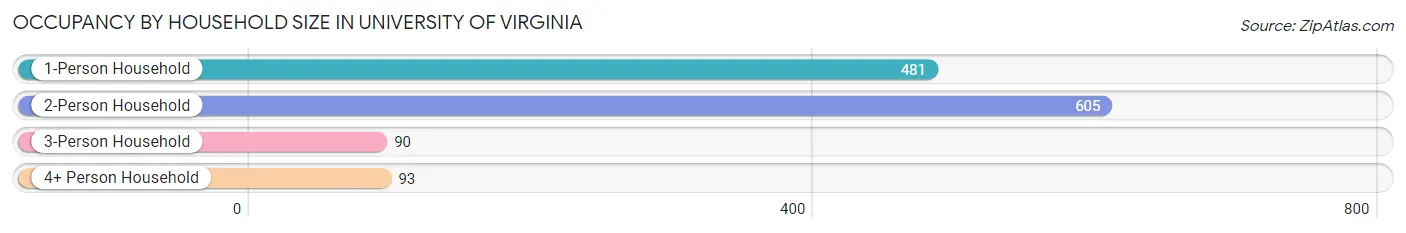
| Household Size | # Housing Units | % Housing Units |
| 1-Person Household | 481 | 37.9% |
| 2-Person Household | 605 | 47.7% |
| 3-Person Household | 90 | 7.1% |
| 4+ Person Household | 93 | 7.3% |
| Total Housing Units | 1,269 | 100.0% |
Occupancy by Ownership by Household Size in University of Virginia
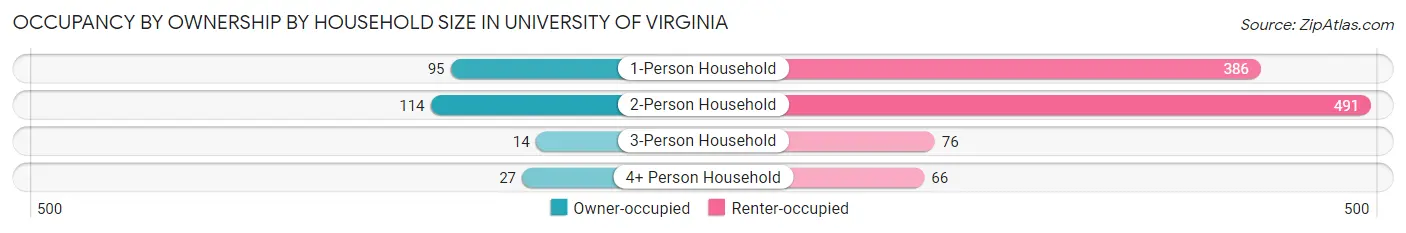
| Household Size | Owner-occupied | Renter-occupied |
| 1-Person Household | 95 (19.8%) | 386 (80.2%) |
| 2-Person Household | 114 (18.8%) | 491 (81.2%) |
| 3-Person Household | 14 (15.6%) | 76 (84.4%) |
| 4+ Person Household | 27 (29.0%) | 66 (71.0%) |
| Total Housing Units | 250 (19.7%) | 1,019 (80.3%) |
Occupancy by Educational Attainment in University of Virginia
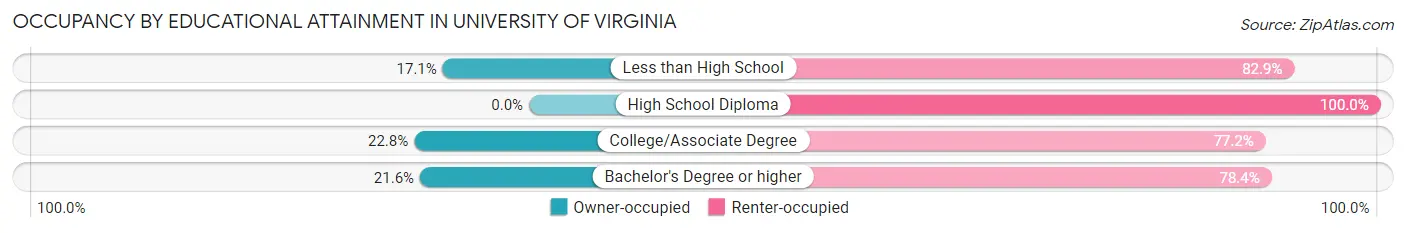
| Household Size | Owner-occupied | Renter-occupied |
| Less than High School | 19 (17.1%) | 92 (82.9%) |
| High School Diploma | 0 (0.0%) | 99 (100.0%) |
| College/Associate Degree | 41 (22.8%) | 139 (77.2%) |
| Bachelor's Degree or higher | 190 (21.6%) | 689 (78.4%) |
Occupancy by Age of Householder in University of Virginia
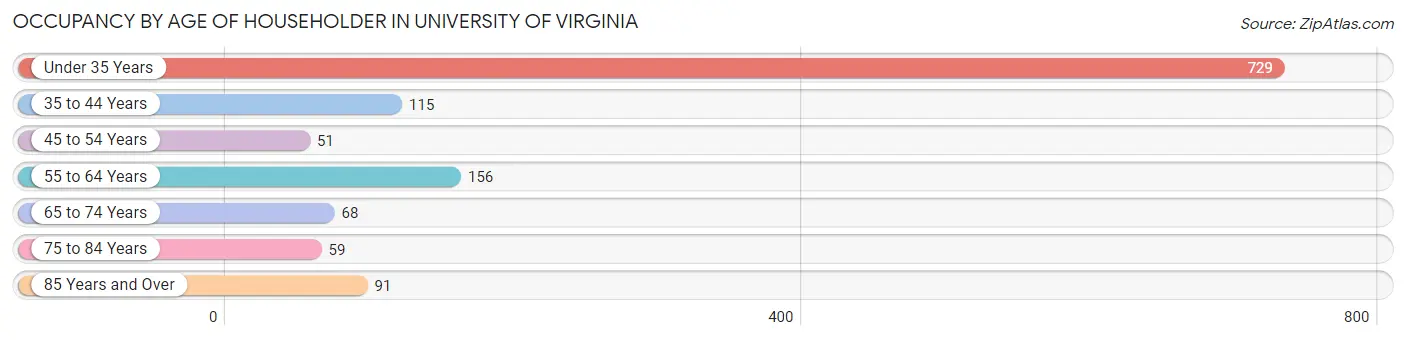
| Age Bracket | # Households | % Households |
| Under 35 Years | 729 | 57.5% |
| 35 to 44 Years | 115 | 9.1% |
| 45 to 54 Years | 51 | 4.0% |
| 55 to 64 Years | 156 | 12.3% |
| 65 to 74 Years | 68 | 5.4% |
| 75 to 84 Years | 59 | 4.6% |
| 85 Years and Over | 91 | 7.2% |
| Total | 1,269 | 100.0% |
Housing Finances in University of Virginia
Median Income by Occupancy in University of Virginia
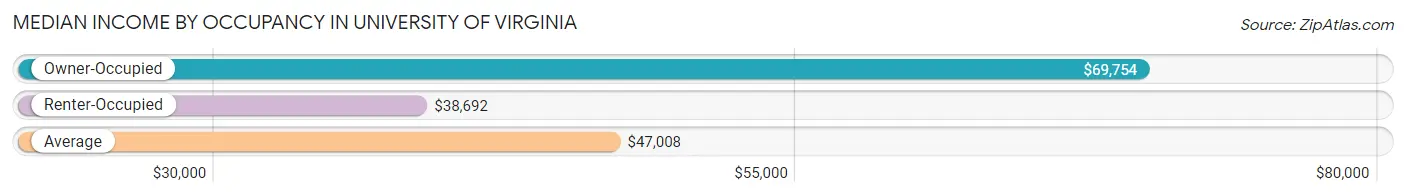
| Occupancy Type | # Households | Median Income |
| Owner-Occupied | 250 (19.7%) | $69,754 |
| Renter-Occupied | 1,019 (80.3%) | $38,692 |
| Average | 1,269 (100.0%) | $47,008 |
Occupancy by Householder Income Bracket in University of Virginia
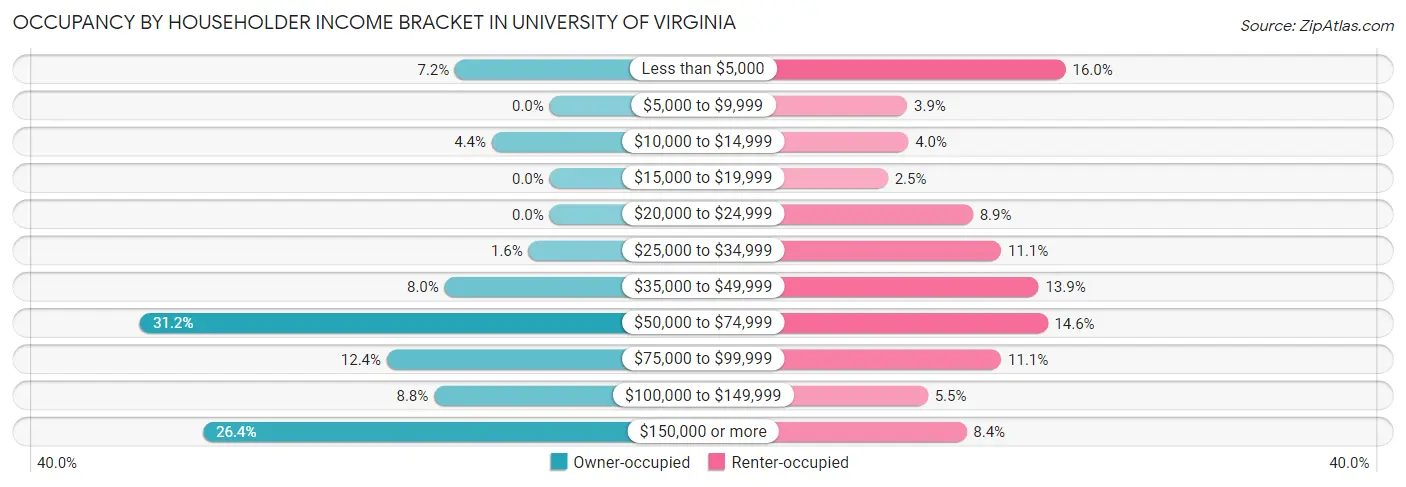
| Income Bracket | Owner-occupied | Renter-occupied |
| Less than $5,000 | 18 (7.2%) | 163 (16.0%) |
| $5,000 to $9,999 | 0 (0.0%) | 40 (3.9%) |
| $10,000 to $14,999 | 11 (4.4%) | 41 (4.0%) |
| $15,000 to $19,999 | 0 (0.0%) | 25 (2.5%) |
| $20,000 to $24,999 | 0 (0.0%) | 91 (8.9%) |
| $25,000 to $34,999 | 4 (1.6%) | 113 (11.1%) |
| $35,000 to $49,999 | 20 (8.0%) | 142 (13.9%) |
| $50,000 to $74,999 | 78 (31.2%) | 149 (14.6%) |
| $75,000 to $99,999 | 31 (12.4%) | 113 (11.1%) |
| $100,000 to $149,999 | 22 (8.8%) | 56 (5.5%) |
| $150,000 or more | 66 (26.4%) | 86 (8.4%) |
| Total | 250 (100.0%) | 1,019 (100.0%) |
Monthly Housing Cost Tiers in University of Virginia
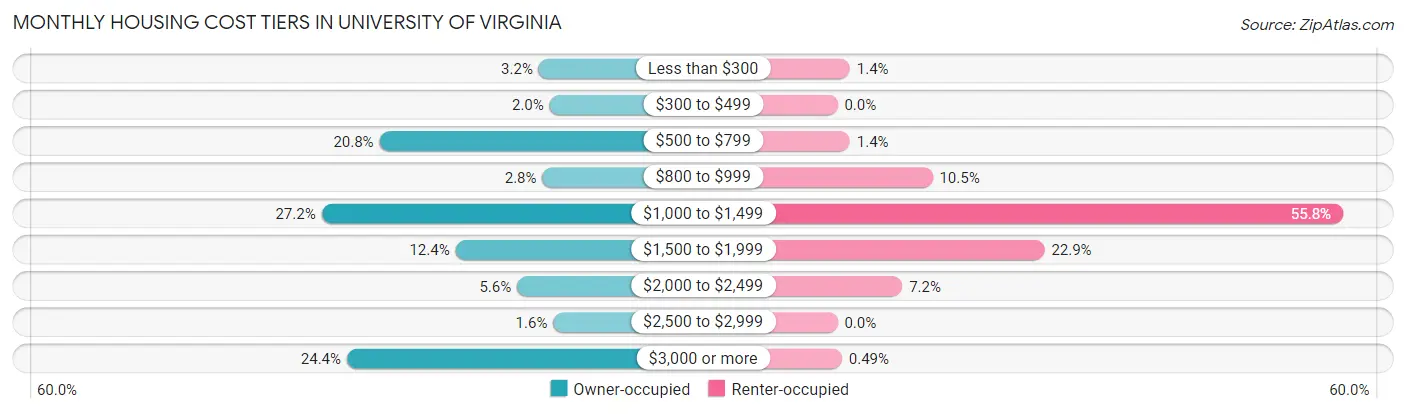
| Monthly Cost | Owner-occupied | Renter-occupied |
| Less than $300 | 8 (3.2%) | 14 (1.4%) |
| $300 to $499 | 5 (2.0%) | 0 (0.0%) |
| $500 to $799 | 52 (20.8%) | 14 (1.4%) |
| $800 to $999 | 7 (2.8%) | 107 (10.5%) |
| $1,000 to $1,499 | 68 (27.2%) | 569 (55.8%) |
| $1,500 to $1,999 | 31 (12.4%) | 233 (22.9%) |
| $2,000 to $2,499 | 14 (5.6%) | 73 (7.2%) |
| $2,500 to $2,999 | 4 (1.6%) | 0 (0.0%) |
| $3,000 or more | 61 (24.4%) | 5 (0.5%) |
| Total | 250 (100.0%) | 1,019 (100.0%) |
Physical Housing Characteristics in University of Virginia
Housing Structures in University of Virginia
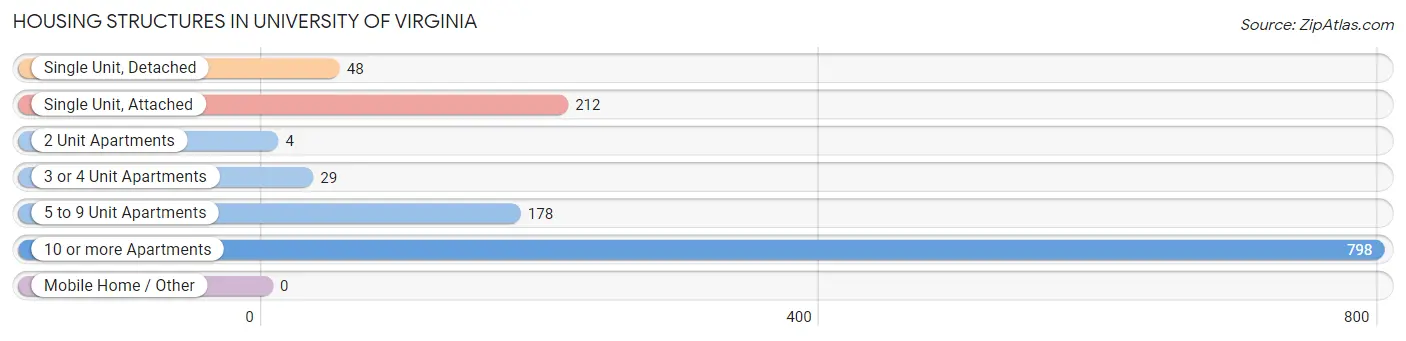
| Structure Type | # Housing Units | % Housing Units |
| Single Unit, Detached | 48 | 3.8% |
| Single Unit, Attached | 212 | 16.7% |
| 2 Unit Apartments | 4 | 0.3% |
| 3 or 4 Unit Apartments | 29 | 2.3% |
| 5 to 9 Unit Apartments | 178 | 14.0% |
| 10 or more Apartments | 798 | 62.9% |
| Mobile Home / Other | 0 | 0.0% |
| Total | 1,269 | 100.0% |
Housing Structures by Occupancy in University of Virginia
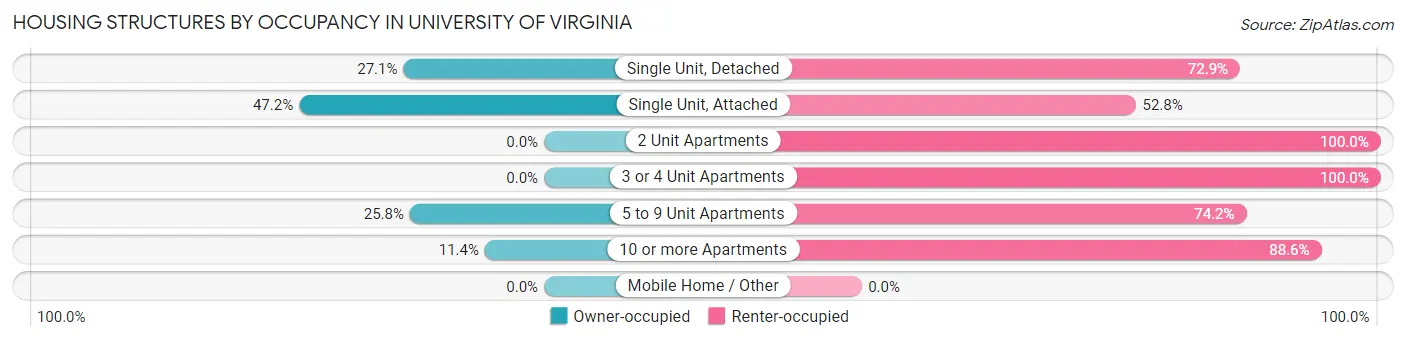
| Structure Type | Owner-occupied | Renter-occupied |
| Single Unit, Detached | 13 (27.1%) | 35 (72.9%) |
| Single Unit, Attached | 100 (47.2%) | 112 (52.8%) |
| 2 Unit Apartments | 0 (0.0%) | 4 (100.0%) |
| 3 or 4 Unit Apartments | 0 (0.0%) | 29 (100.0%) |
| 5 to 9 Unit Apartments | 46 (25.8%) | 132 (74.2%) |
| 10 or more Apartments | 91 (11.4%) | 707 (88.6%) |
| Mobile Home / Other | 0 (0.0%) | 0 (0.0%) |
| Total | 250 (19.7%) | 1,019 (80.3%) |
Housing Structures by Number of Rooms in University of Virginia
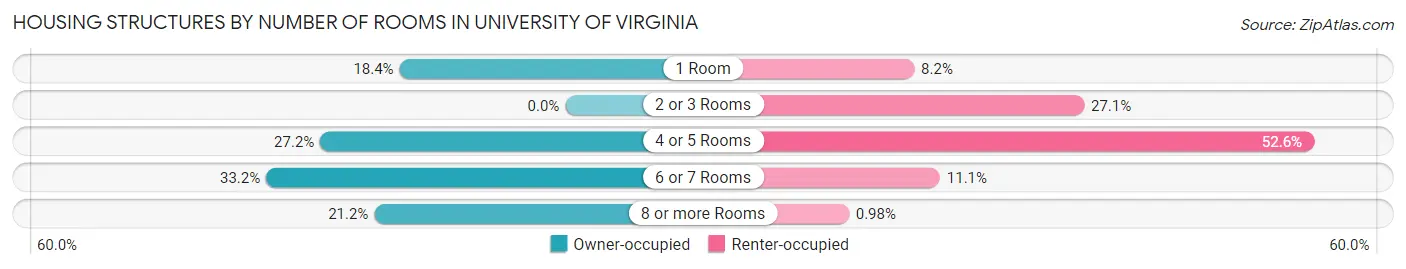
| Number of Rooms | Owner-occupied | Renter-occupied |
| 1 Room | 46 (18.4%) | 84 (8.2%) |
| 2 or 3 Rooms | 0 (0.0%) | 276 (27.1%) |
| 4 or 5 Rooms | 68 (27.2%) | 536 (52.6%) |
| 6 or 7 Rooms | 83 (33.2%) | 113 (11.1%) |
| 8 or more Rooms | 53 (21.2%) | 10 (1.0%) |
| Total | 250 (100.0%) | 1,019 (100.0%) |
Housing Structure by Heating Type in University of Virginia
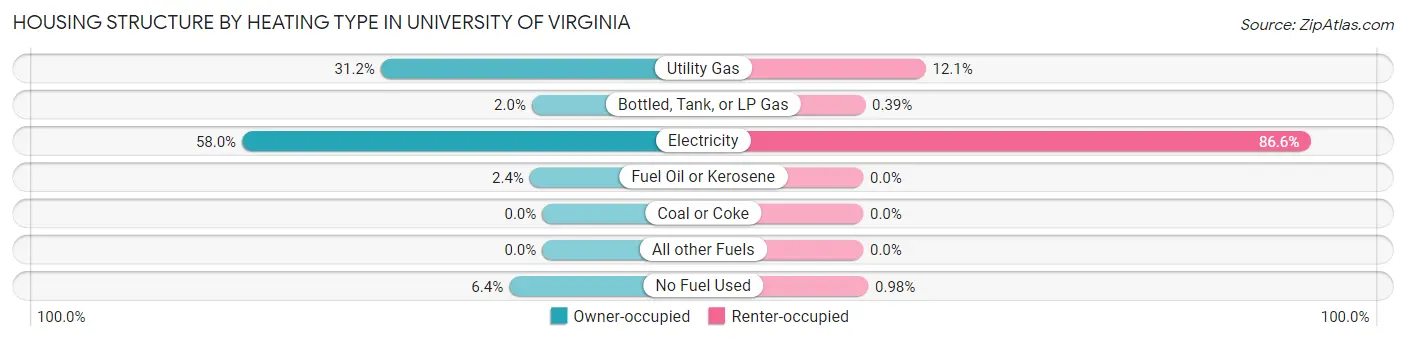
| Heating Type | Owner-occupied | Renter-occupied |
| Utility Gas | 78 (31.2%) | 123 (12.1%) |
| Bottled, Tank, or LP Gas | 5 (2.0%) | 4 (0.4%) |
| Electricity | 145 (58.0%) | 882 (86.6%) |
| Fuel Oil or Kerosene | 6 (2.4%) | 0 (0.0%) |
| Coal or Coke | 0 (0.0%) | 0 (0.0%) |
| All other Fuels | 0 (0.0%) | 0 (0.0%) |
| No Fuel Used | 16 (6.4%) | 10 (1.0%) |
| Total | 250 (100.0%) | 1,019 (100.0%) |
Household Vehicle Usage in University of Virginia
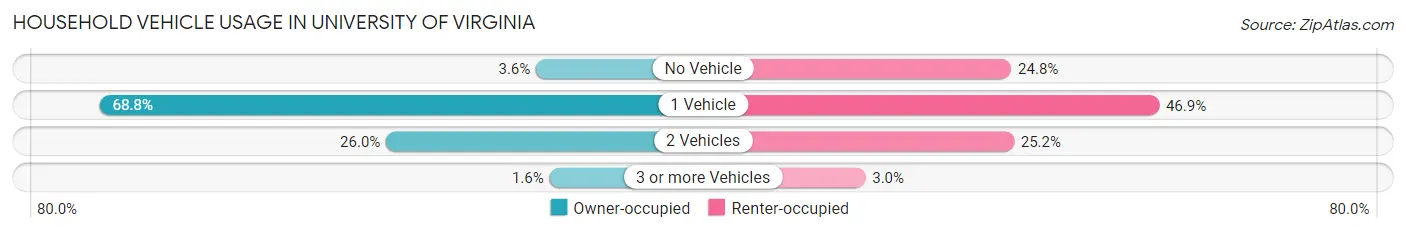
| Vehicles per Household | Owner-occupied | Renter-occupied |
| No Vehicle | 9 (3.6%) | 253 (24.8%) |
| 1 Vehicle | 172 (68.8%) | 478 (46.9%) |
| 2 Vehicles | 65 (26.0%) | 257 (25.2%) |
| 3 or more Vehicles | 4 (1.6%) | 31 (3.0%) |
| Total | 250 (100.0%) | 1,019 (100.0%) |
Real Estate & Mortgages in University of Virginia
Real Estate and Mortgage Overview in University of Virginia
| Characteristic | Without Mortgage | With Mortgage |
| Housing Units | 165 | 85 |
| Median Property Value | $370,500 | $487,500 |
| Median Household Income | $69,647 | $33 |
| Monthly Housing Costs | $1,217 | $54 |
| Real Estate Taxes | $2,994 | $0 |
Property Value by Mortgage Status in University of Virginia
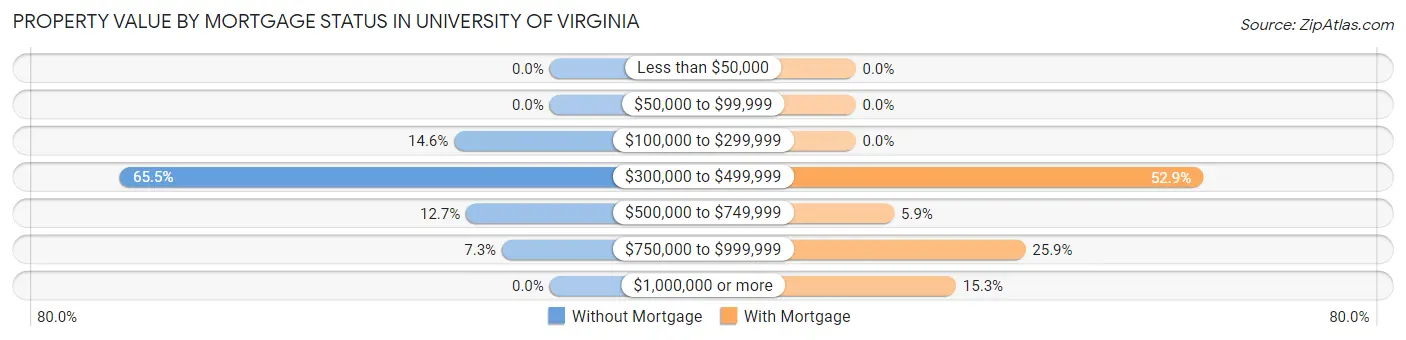
| Property Value | Without Mortgage | With Mortgage |
| Less than $50,000 | 0 (0.0%) | 0 (0.0%) |
| $50,000 to $99,999 | 0 (0.0%) | 0 (0.0%) |
| $100,000 to $299,999 | 24 (14.5%) | 0 (0.0%) |
| $300,000 to $499,999 | 108 (65.4%) | 45 (52.9%) |
| $500,000 to $749,999 | 21 (12.7%) | 5 (5.9%) |
| $750,000 to $999,999 | 12 (7.3%) | 22 (25.9%) |
| $1,000,000 or more | 0 (0.0%) | 13 (15.3%) |
| Total | 165 (100.0%) | 85 (100.0%) |
Household Income by Mortgage Status in University of Virginia
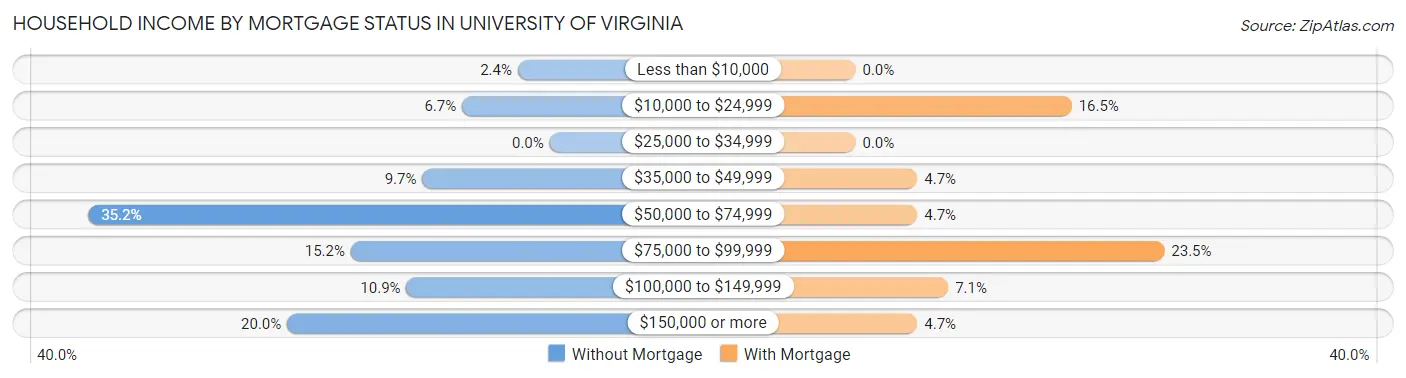
| Household Income | Without Mortgage | With Mortgage |
| Less than $10,000 | 4 (2.4%) | 0 (0.0%) |
| $10,000 to $24,999 | 11 (6.7%) | 14 (16.5%) |
| $25,000 to $34,999 | 0 (0.0%) | 0 (0.0%) |
| $35,000 to $49,999 | 16 (9.7%) | 4 (4.7%) |
| $50,000 to $74,999 | 58 (35.1%) | 4 (4.7%) |
| $75,000 to $99,999 | 25 (15.1%) | 20 (23.5%) |
| $100,000 to $149,999 | 18 (10.9%) | 6 (7.1%) |
| $150,000 or more | 33 (20.0%) | 4 (4.7%) |
| Total | 165 (100.0%) | 85 (100.0%) |
Property Value to Household Income Ratio in University of Virginia
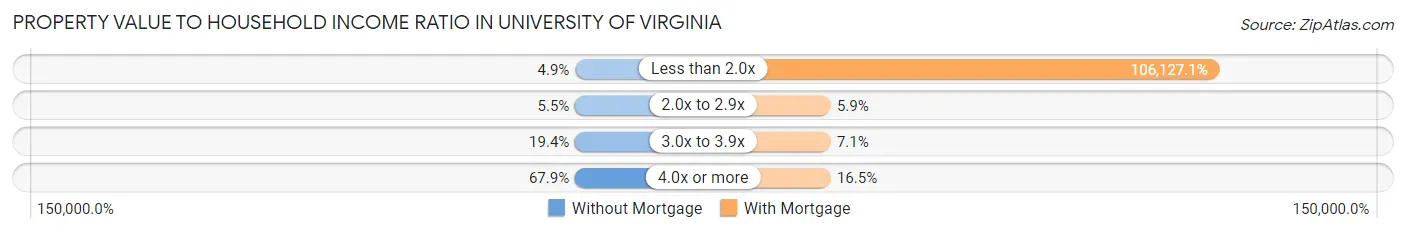
| Value-to-Income Ratio | Without Mortgage | With Mortgage |
| Less than 2.0x | 8 (4.9%) | 90,208 (106,127.1%) |
| 2.0x to 2.9x | 9 (5.4%) | 5 (5.9%) |
| 3.0x to 3.9x | 32 (19.4%) | 6 (7.1%) |
| 4.0x or more | 112 (67.9%) | 14 (16.5%) |
| Total | 165 (100.0%) | 85 (100.0%) |
Real Estate Taxes by Mortgage Status in University of Virginia
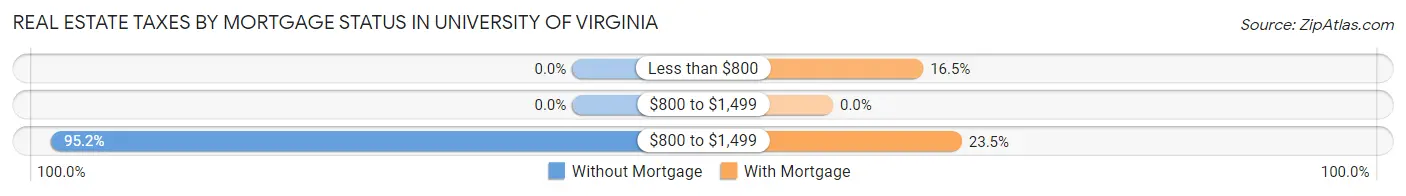
| Property Taxes | Without Mortgage | With Mortgage |
| Less than $800 | 0 (0.0%) | 14 (16.5%) |
| $800 to $1,499 | 0 (0.0%) | 0 (0.0%) |
| $800 to $1,499 | 157 (95.2%) | 20 (23.5%) |
| Total | 165 (100.0%) | 85 (100.0%) |
Health & Disability in University of Virginia
Health Insurance Coverage by Age in University of Virginia
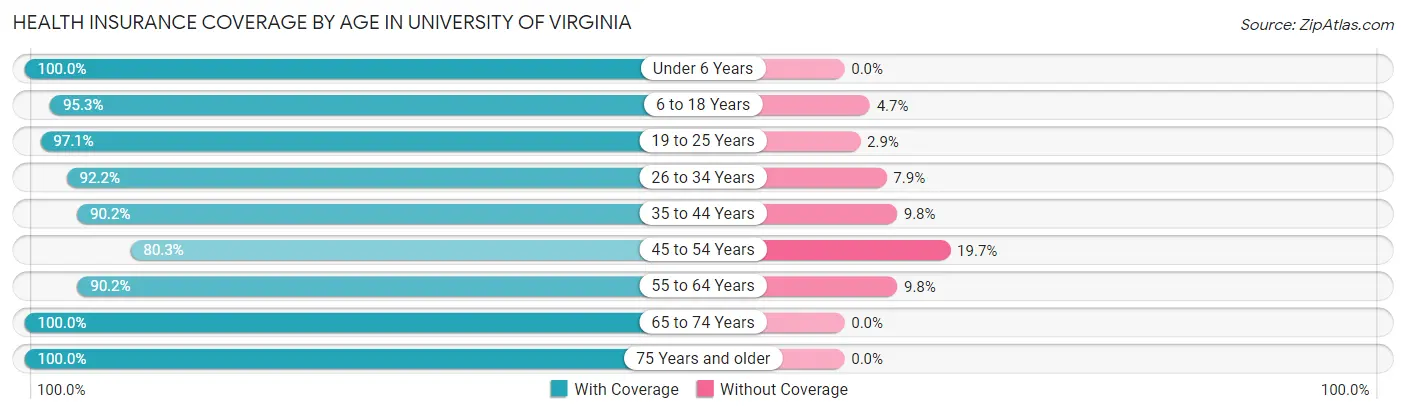
| Age Bracket | With Coverage | Without Coverage |
| Under 6 Years | 118 (100.0%) | 0 (0.0%) |
| 6 to 18 Years | 2,955 (95.3%) | 147 (4.7%) |
| 19 to 25 Years | 4,297 (97.1%) | 130 (2.9%) |
| 26 to 34 Years | 1,056 (92.1%) | 90 (7.9%) |
| 35 to 44 Years | 175 (90.2%) | 19 (9.8%) |
| 45 to 54 Years | 61 (80.3%) | 15 (19.7%) |
| 55 to 64 Years | 229 (90.2%) | 25 (9.8%) |
| 65 to 74 Years | 120 (100.0%) | 0 (0.0%) |
| 75 Years and older | 197 (100.0%) | 0 (0.0%) |
| Total | 9,208 (95.6%) | 426 (4.4%) |
Health Insurance Coverage by Citizenship Status in University of Virginia
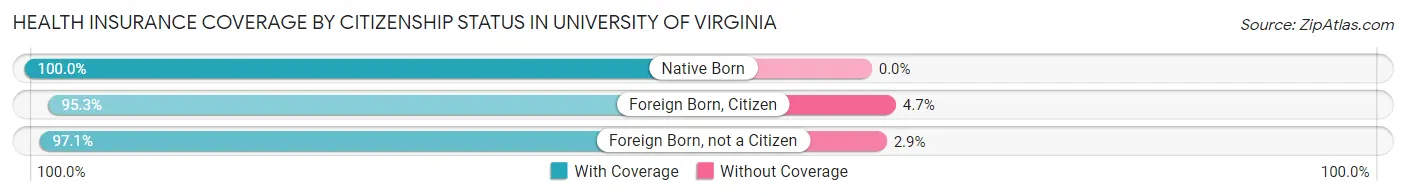
| Citizenship Status | With Coverage | Without Coverage |
| Native Born | 118 (100.0%) | 0 (0.0%) |
| Foreign Born, Citizen | 2,955 (95.3%) | 147 (4.7%) |
| Foreign Born, not a Citizen | 4,297 (97.1%) | 130 (2.9%) |
Health Insurance Coverage by Household Income in University of Virginia
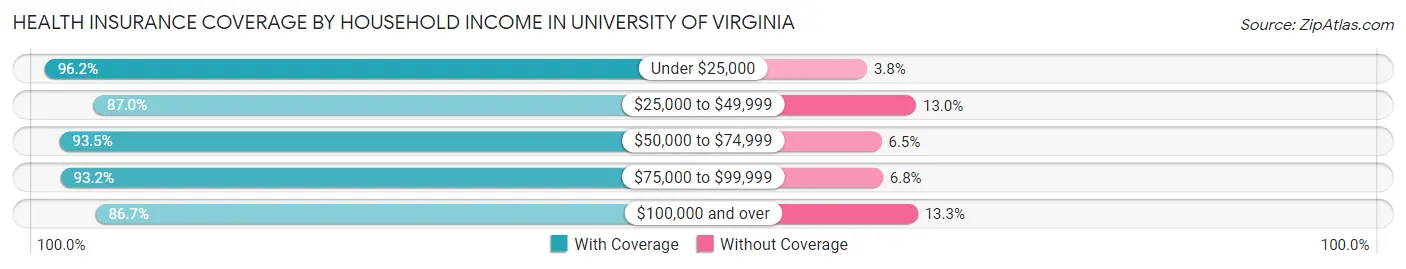
| Household Income | With Coverage | Without Coverage |
| Under $25,000 | 637 (96.2%) | 25 (3.8%) |
| $25,000 to $49,999 | 429 (87.0%) | 64 (13.0%) |
| $50,000 to $74,999 | 445 (93.5%) | 31 (6.5%) |
| $75,000 to $99,999 | 262 (93.2%) | 19 (6.8%) |
| $100,000 and over | 535 (86.7%) | 82 (13.3%) |
Public vs Private Health Insurance Coverage by Age in University of Virginia
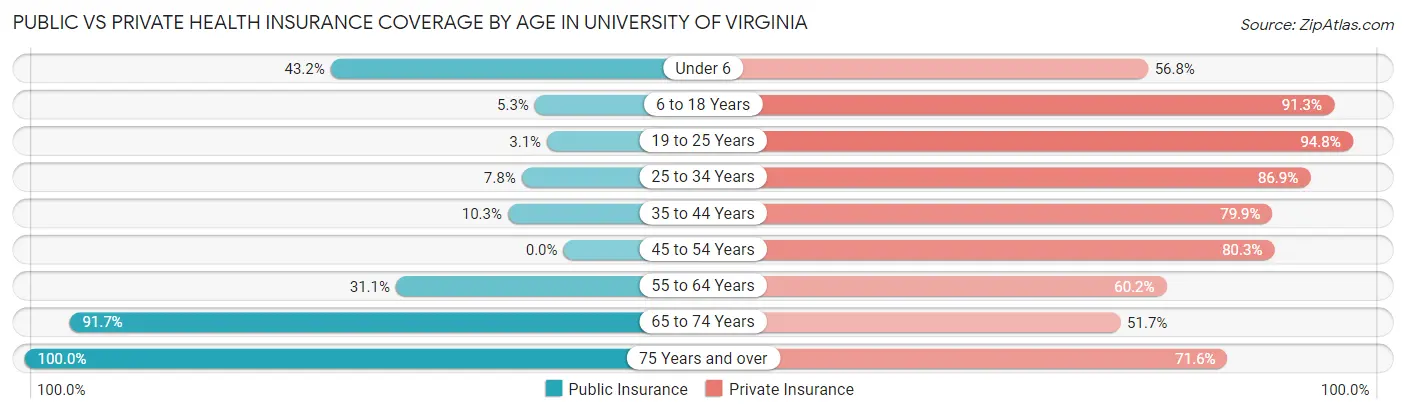
| Age Bracket | Public Insurance | Private Insurance |
| Under 6 | 51 (43.2%) | 67 (56.8%) |
| 6 to 18 Years | 165 (5.3%) | 2,833 (91.3%) |
| 19 to 25 Years | 135 (3.0%) | 4,196 (94.8%) |
| 25 to 34 Years | 89 (7.8%) | 996 (86.9%) |
| 35 to 44 Years | 20 (10.3%) | 155 (79.9%) |
| 45 to 54 Years | 0 (0.0%) | 61 (80.3%) |
| 55 to 64 Years | 79 (31.1%) | 153 (60.2%) |
| 65 to 74 Years | 110 (91.7%) | 62 (51.7%) |
| 75 Years and over | 197 (100.0%) | 141 (71.6%) |
| Total | 846 (8.8%) | 8,664 (89.9%) |
Disability Status by Sex by Age in University of Virginia
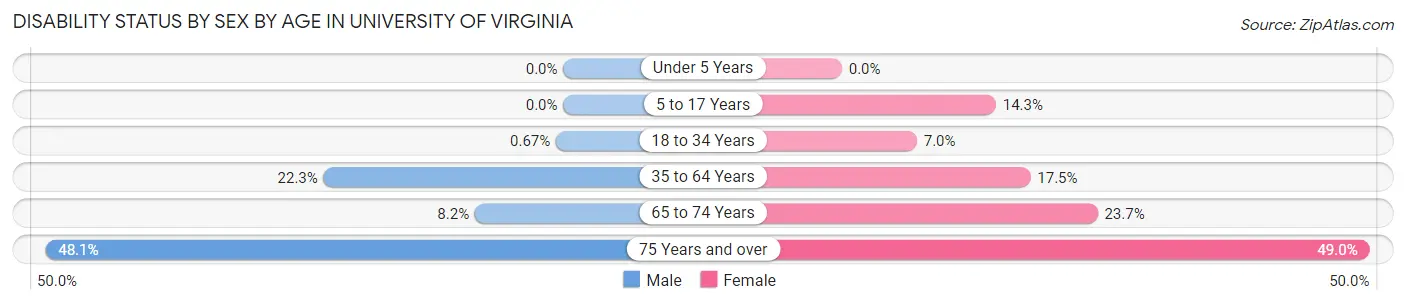
| Age Bracket | Male | Female |
| Under 5 Years | 0 (0.0%) | 0 (0.0%) |
| 5 to 17 Years | 0 (0.0%) | 15 (14.3%) |
| 18 to 34 Years | 30 (0.7%) | 275 (7.0%) |
| 35 to 64 Years | 81 (22.3%) | 28 (17.5%) |
| 65 to 74 Years | 5 (8.2%) | 14 (23.7%) |
| 75 Years and over | 25 (48.1%) | 71 (49.0%) |
Disability Class by Sex by Age in University of Virginia
Disability Class: Hearing Difficulty
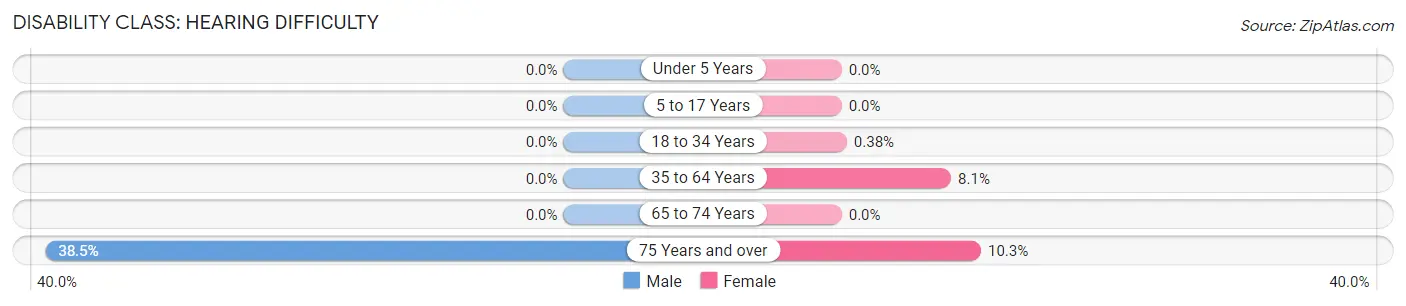
| Age Bracket | Male | Female |
| Under 5 Years | 0 (0.0%) | 0 (0.0%) |
| 5 to 17 Years | 0 (0.0%) | 0 (0.0%) |
| 18 to 34 Years | 0 (0.0%) | 15 (0.4%) |
| 35 to 64 Years | 0 (0.0%) | 13 (8.1%) |
| 65 to 74 Years | 0 (0.0%) | 0 (0.0%) |
| 75 Years and over | 20 (38.5%) | 15 (10.3%) |
Disability Class: Vision Difficulty
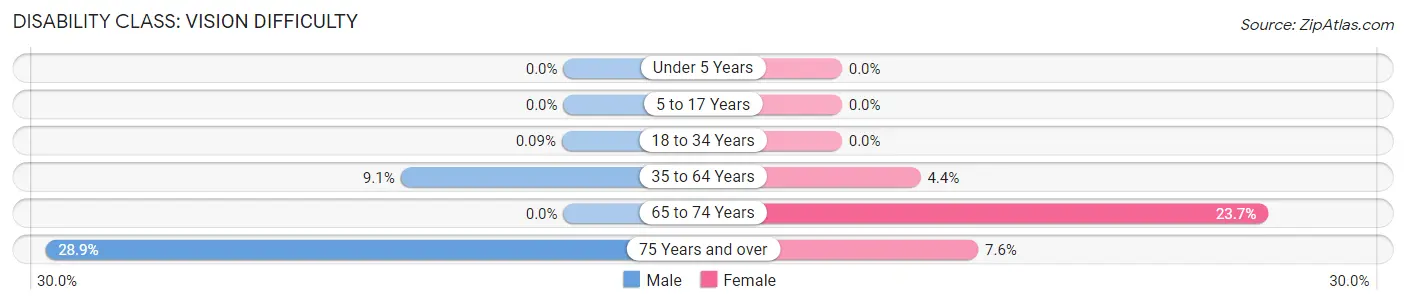
| Age Bracket | Male | Female |
| Under 5 Years | 0 (0.0%) | 0 (0.0%) |
| 5 to 17 Years | 0 (0.0%) | 0 (0.0%) |
| 18 to 34 Years | 4 (0.1%) | 0 (0.0%) |
| 35 to 64 Years | 33 (9.1%) | 7 (4.4%) |
| 65 to 74 Years | 0 (0.0%) | 14 (23.7%) |
| 75 Years and over | 15 (28.8%) | 11 (7.6%) |
Disability Class: Cognitive Difficulty
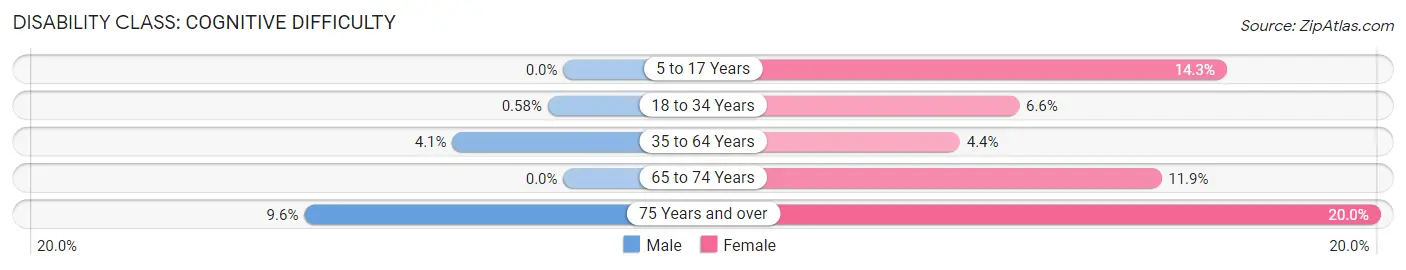
| Age Bracket | Male | Female |
| 5 to 17 Years | 0 (0.0%) | 15 (14.3%) |
| 18 to 34 Years | 26 (0.6%) | 260 (6.6%) |
| 35 to 64 Years | 15 (4.1%) | 7 (4.4%) |
| 65 to 74 Years | 0 (0.0%) | 7 (11.9%) |
| 75 Years and over | 5 (9.6%) | 29 (20.0%) |
Disability Class: Ambulatory Difficulty
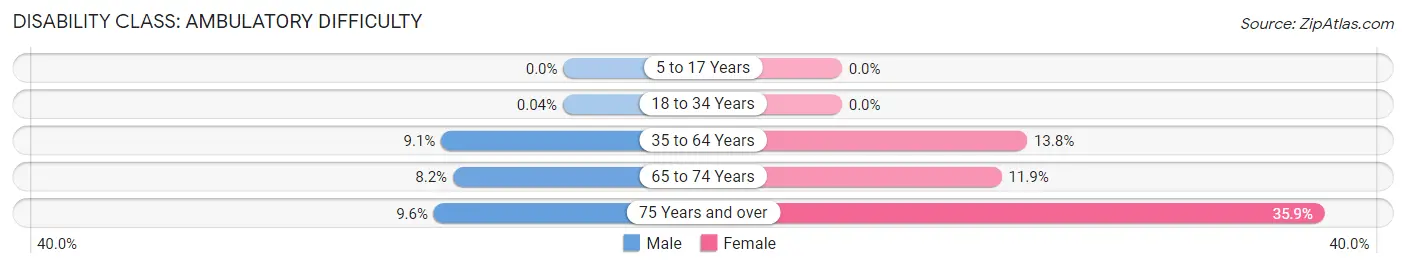
| Age Bracket | Male | Female |
| 5 to 17 Years | 0 (0.0%) | 0 (0.0%) |
| 18 to 34 Years | 2 (0.0%) | 0 (0.0%) |
| 35 to 64 Years | 33 (9.1%) | 22 (13.8%) |
| 65 to 74 Years | 5 (8.2%) | 7 (11.9%) |
| 75 Years and over | 5 (9.6%) | 52 (35.9%) |
Disability Class: Self-Care Difficulty
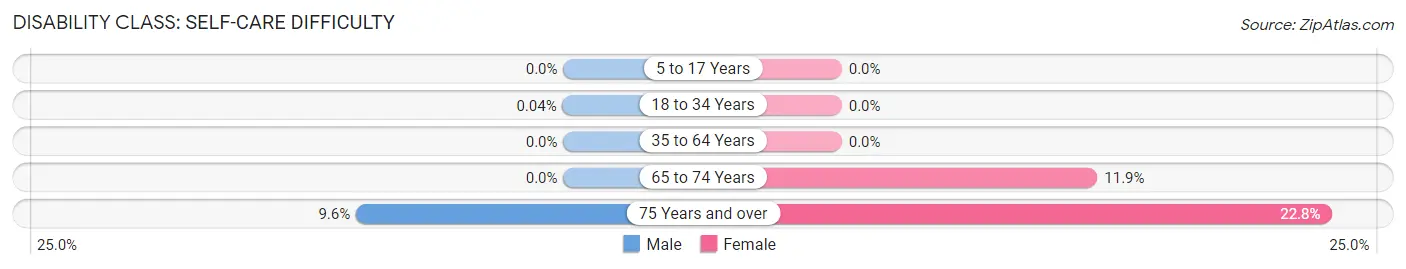
| Age Bracket | Male | Female |
| 5 to 17 Years | 0 (0.0%) | 0 (0.0%) |
| 18 to 34 Years | 2 (0.0%) | 0 (0.0%) |
| 35 to 64 Years | 0 (0.0%) | 0 (0.0%) |
| 65 to 74 Years | 0 (0.0%) | 7 (11.9%) |
| 75 Years and over | 5 (9.6%) | 33 (22.8%) |
Technology Access in University of Virginia
Computing Device Access in University of Virginia
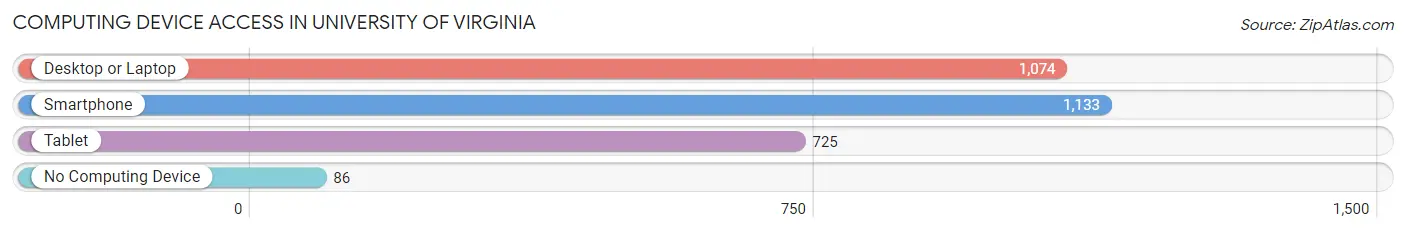
| Device Type | # Households | % Households |
| Desktop or Laptop | 1,074 | 84.6% |
| Smartphone | 1,133 | 89.3% |
| Tablet | 725 | 57.1% |
| No Computing Device | 86 | 6.8% |
| Total | 1,269 | 100.0% |
Internet Access in University of Virginia
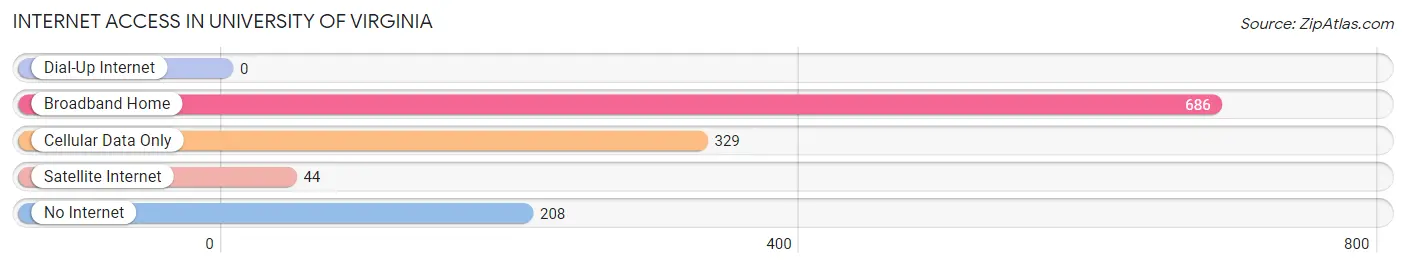
| Internet Type | # Households | % Households |
| Dial-Up Internet | 0 | 0.0% |
| Broadband Home | 686 | 54.1% |
| Cellular Data Only | 329 | 25.9% |
| Satellite Internet | 44 | 3.5% |
| No Internet | 208 | 16.4% |
| Total | 1,269 | 100.0% |
University of Virginia Summary
The University of Virginia (UVA) is a public research university located in Charlottesville, Virginia. Founded in 1819 by Thomas Jefferson, UVA is the flagship university of the Commonwealth of Virginia and is the oldest university in the United States. UVA is consistently ranked among the top universities in the United States and the world.
History
The University of Virginia was founded in 1819 by Thomas Jefferson, the third President of the United States. Jefferson was inspired by the ideals of the Enlightenment and sought to create an institution of higher learning that would be accessible to all, regardless of social class or economic status. He envisioned a university that would be a “great and noble institution” and a “bulwark of the republic.”
Jefferson designed the university’s original buildings and grounds, which are now known as the “Academical Village.” The Academical Village consists of ten pavilions, each of which houses a professor and his family. The Rotunda, the centerpiece of the Academical Village, is modeled after the Pantheon in Rome and serves as the university’s library.
The university opened its doors in 1825 with eight students and two faculty members. Since then, UVA has grown to become one of the most prestigious universities in the world. It is now home to more than 23,000 students and over 3,000 faculty members.
Geography
The University of Virginia is located in Charlottesville, Virginia, a city of approximately 45,000 people in the foothills of the Blue Ridge Mountains. Charlottesville is situated in the heart of the Shenandoah Valley, a region known for its rolling hills, lush forests, and picturesque views.
The university’s main campus is located on 1,682 acres of land in the city of Charlottesville. The campus is divided into four parts: the Academical Village, the Lawn, the Range, and the North Grounds. The Academical Village is the oldest part of the campus and is home to the Rotunda, the centerpiece of the university. The Lawn is the main quadrangle of the university and is lined with historic buildings. The Range is the area between the Lawn and the North Grounds and is home to many of the university’s student residences. The North Grounds is the northernmost part of the campus and is home to the university’s athletics facilities.
Economy
The University of Virginia is a major economic engine for the city of Charlottesville and the Commonwealth of Virginia. The university has an annual economic impact of more than $5 billion and is one of the largest employers in the region.
The university’s economic impact is felt in a variety of ways. UVA is a major source of jobs in the region, providing more than 20,000 jobs in the Charlottesville area. The university also attracts a large number of visitors to the city, which helps to support the local tourism industry. In addition, the university’s research activities have helped to spur economic development in the region.
Demographics
The University of Virginia is a diverse and inclusive community. The university’s student body is composed of students from all 50 states and more than 100 countries. The university’s faculty and staff are also diverse, representing a variety of backgrounds and experiences.
The university’s student body is approximately 54% female and 46% male. The majority of students (63%) are from Virginia, while the remaining 37% are from other states and countries. The university’s student body is also racially and ethnically diverse, with approximately 25% of students identifying as African American, Hispanic, Asian, or Native American.
Common Questions
What is Per Capita Income in University of Virginia?
Per Capita income in University of Virginia is $12,508.
What is the Median Family Income in University of Virginia?
Median Family Income in University of Virginia is $69,054.
What is the Median Household income in University of Virginia?
Median Household Income in University of Virginia is $47,008.
What is Income or Wage Gap in University of Virginia?
Income or Wage Gap in University of Virginia is 20.3%.
Women in University of Virginia earn 79.7 cents for every dollar earned by a man.
What is Inequality or Gini Index in University of Virginia?
Inequality or Gini Index in University of Virginia is 0.52.
What is the Total Population of University of Virginia?
Total Population of University of Virginia is 9,648.
What is the Total Male Population of University of Virginia?
Total Male Population of University of Virginia is 5,172.
What is the Total Female Population of University of Virginia?
Total Female Population of University of Virginia is 4,476.
What is the Ratio of Males per 100 Females in University of Virginia?
There are 115.55 Males per 100 Females in University of Virginia.
What is the Ratio of Females per 100 Males in University of Virginia?
There are 86.54 Females per 100 Males in University of Virginia.
What is the Median Population Age in University of Virginia?
Median Population Age in University of Virginia is 19.7 Years.
What is the Average Family Size in University of Virginia
Average Family Size in University of Virginia is 2.7 People.
What is the Average Household Size in University of Virginia
Average Household Size in University of Virginia is 2.0 People.
How Large is the Labor Force in University of Virginia?
There are 3,147 People in the Labor Forcein in University of Virginia.
What is the Percentage of People in the Labor Force in University of Virginia?
33.6% of People are in the Labor Force in University of Virginia.
What is the Unemployment Rate in University of Virginia?
Unemployment Rate in University of Virginia is 7.4%.