Fairfax Station, VA Map & Demographics
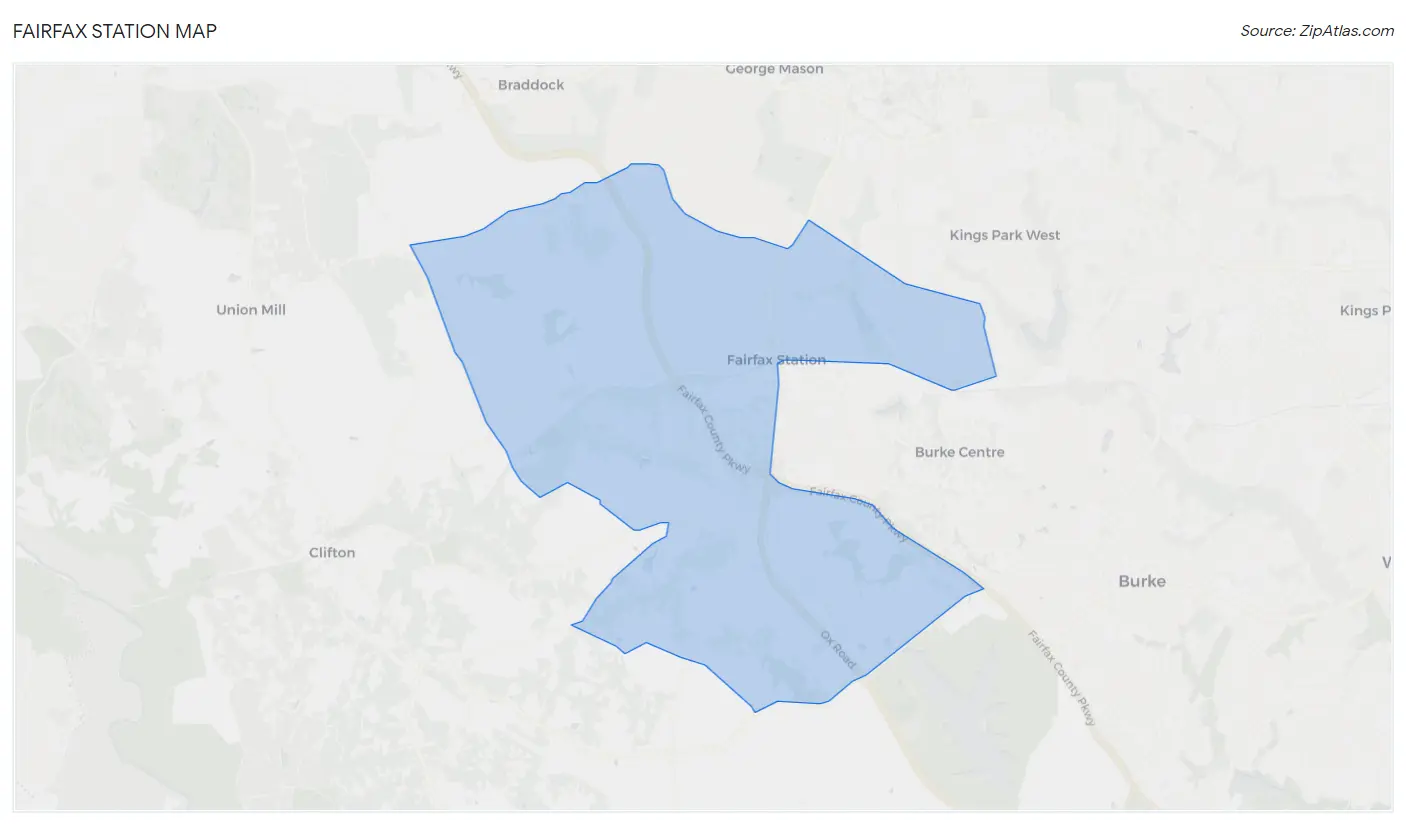
Fairfax Station Map
Fairfax Station Overview
$83,439
PER CAPITA INCOME
$224,180
AVG FAMILY INCOME
$211,000
AVG HOUSEHOLD INCOME
65.1%
WAGE / INCOME GAP [ % ]
34.9¢/ $1
WAGE / INCOME GAP [ $ ]
0.33
INEQUALITY / GINI INDEX
12,277
TOTAL POPULATION
6,210
MALE POPULATION
6,067
FEMALE POPULATION
102.36
MALES / 100 FEMALES
97.70
FEMALES / 100 MALES
44.7
MEDIAN AGE
3.2
AVG FAMILY SIZE
3.0
AVG HOUSEHOLD SIZE
6,643
LABOR FORCE [ PEOPLE ]
66.2%
PERCENT IN LABOR FORCE
4.1%
UNEMPLOYMENT RATE
Fairfax Station Zip Codes
Fairfax Station Area Codes
Income in Fairfax Station
Income Overview in Fairfax Station
Per Capita Income in Fairfax Station is $83,439, while median incomes of families and households are $224,180 and $211,000 respectively.
| Characteristic | Number | Measure |
| Per Capita Income | 12,277 | $83,439 |
| Median Family Income | 3,439 | $224,180 |
| Mean Family Income | 3,439 | $261,549 |
| Median Household Income | 4,158 | $211,000 |
| Mean Household Income | 4,158 | $240,694 |
| Income Deficit | 3,439 | $0 |
| Wage / Income Gap (%) | 12,277 | 65.11% |
| Wage / Income Gap ($) | 12,277 | 34.89¢ per $1 |
| Gini / Inequality Index | 12,277 | 0.33 |
Earnings by Sex in Fairfax Station
Average Earnings in Fairfax Station are $86,493, $132,431 for men and $46,204 for women, a difference of 65.1%.
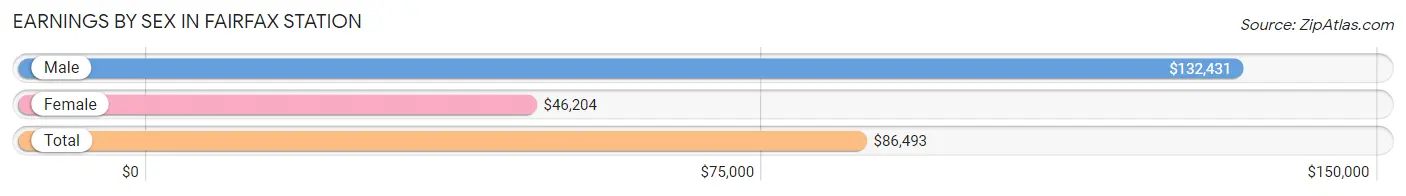
| Sex | Number | Average Earnings |
| Male | 3,793 (53.0%) | $132,431 |
| Female | 3,360 (47.0%) | $46,204 |
| Total | 7,153 (100.0%) | $86,493 |
Earnings by Sex by Income Bracket in Fairfax Station
The most common earnings brackets in Fairfax Station are $100,000+ for men (2,286 | 60.3%) and $100,000+ for women (974 | 29.0%).
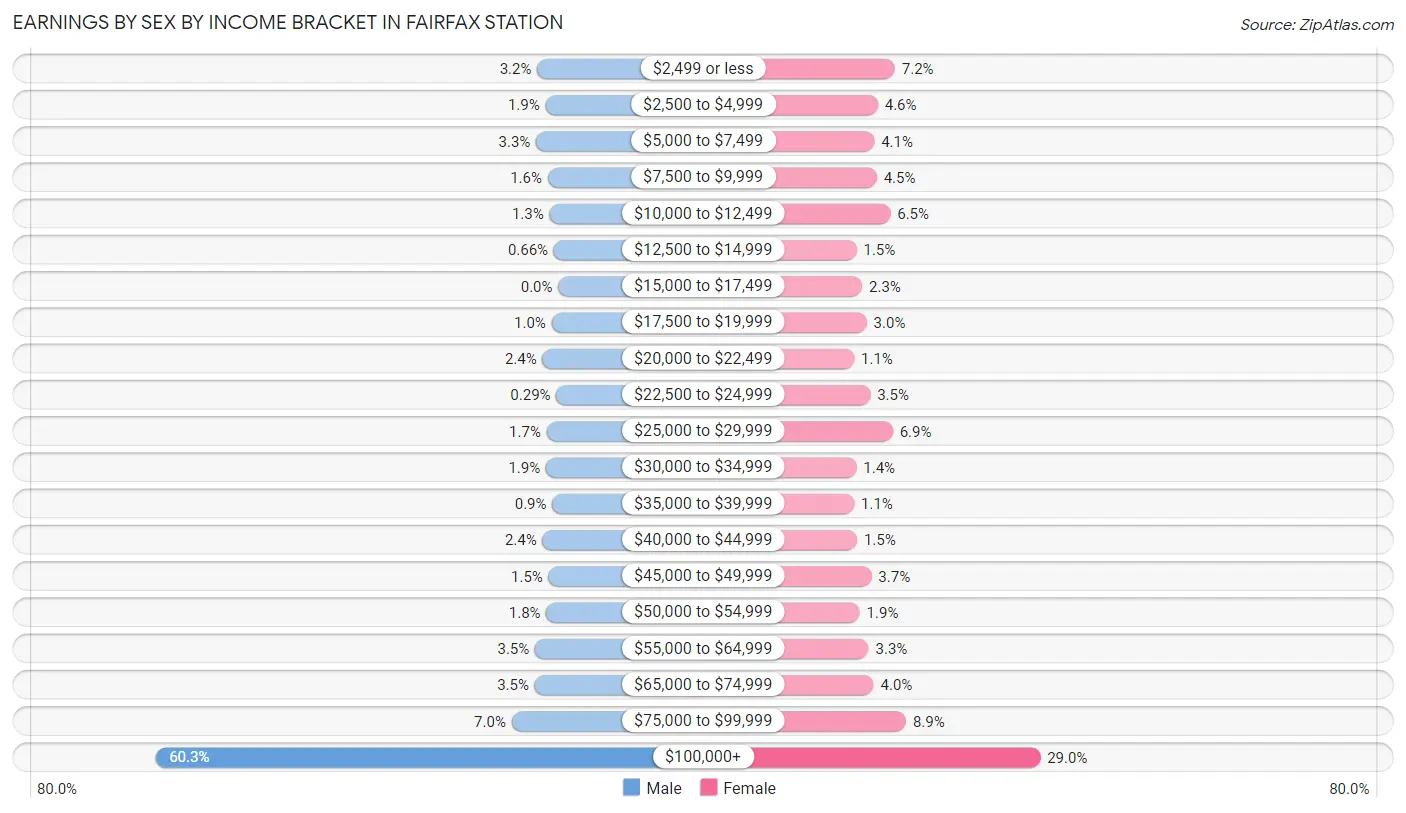
| Income | Male | Female |
| $2,499 or less | 120 (3.2%) | 242 (7.2%) |
| $2,500 to $4,999 | 73 (1.9%) | 156 (4.6%) |
| $5,000 to $7,499 | 126 (3.3%) | 138 (4.1%) |
| $7,500 to $9,999 | 60 (1.6%) | 151 (4.5%) |
| $10,000 to $12,499 | 50 (1.3%) | 219 (6.5%) |
| $12,500 to $14,999 | 25 (0.7%) | 49 (1.5%) |
| $15,000 to $17,499 | 0 (0.0%) | 77 (2.3%) |
| $17,500 to $19,999 | 38 (1.0%) | 100 (3.0%) |
| $20,000 to $22,499 | 90 (2.4%) | 37 (1.1%) |
| $22,500 to $24,999 | 11 (0.3%) | 118 (3.5%) |
| $25,000 to $29,999 | 66 (1.7%) | 231 (6.9%) |
| $30,000 to $34,999 | 70 (1.8%) | 48 (1.4%) |
| $35,000 to $39,999 | 34 (0.9%) | 37 (1.1%) |
| $40,000 to $44,999 | 90 (2.4%) | 51 (1.5%) |
| $45,000 to $49,999 | 55 (1.5%) | 124 (3.7%) |
| $50,000 to $54,999 | 68 (1.8%) | 65 (1.9%) |
| $55,000 to $64,999 | 132 (3.5%) | 110 (3.3%) |
| $65,000 to $74,999 | 134 (3.5%) | 135 (4.0%) |
| $75,000 to $99,999 | 265 (7.0%) | 298 (8.9%) |
| $100,000+ | 2,286 (60.3%) | 974 (29.0%) |
| Total | 3,793 (100.0%) | 3,360 (100.0%) |
Earnings by Sex by Educational Attainment in Fairfax Station
Average earnings in Fairfax Station are $138,696 for men and $67,535 for women, a difference of 51.3%. Men with an educational attainment of graduate degree enjoy the highest average annual earnings of $162,464, while those with high school diploma education earn the least with $46,042. Women with an educational attainment of graduate degree earn the most with the average annual earnings of $93,718, while those with high school diploma education have the smallest earnings of $28,880.
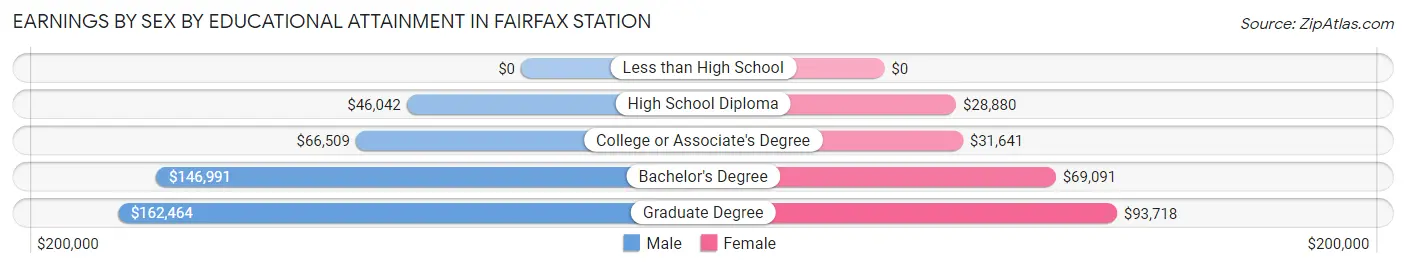
| Educational Attainment | Male Income | Female Income |
| Less than High School | - | - |
| High School Diploma | $46,042 | $28,880 |
| College or Associate's Degree | $66,509 | $31,641 |
| Bachelor's Degree | $146,991 | $69,091 |
| Graduate Degree | $162,464 | $93,718 |
| Total | $138,696 | $67,535 |
Family Income in Fairfax Station
Family Income Brackets in Fairfax Station
According to the Fairfax Station family income data, there are 1,984 families falling into the $200,000+ income range, which is the most common income bracket and makes up 57.7% of all families.
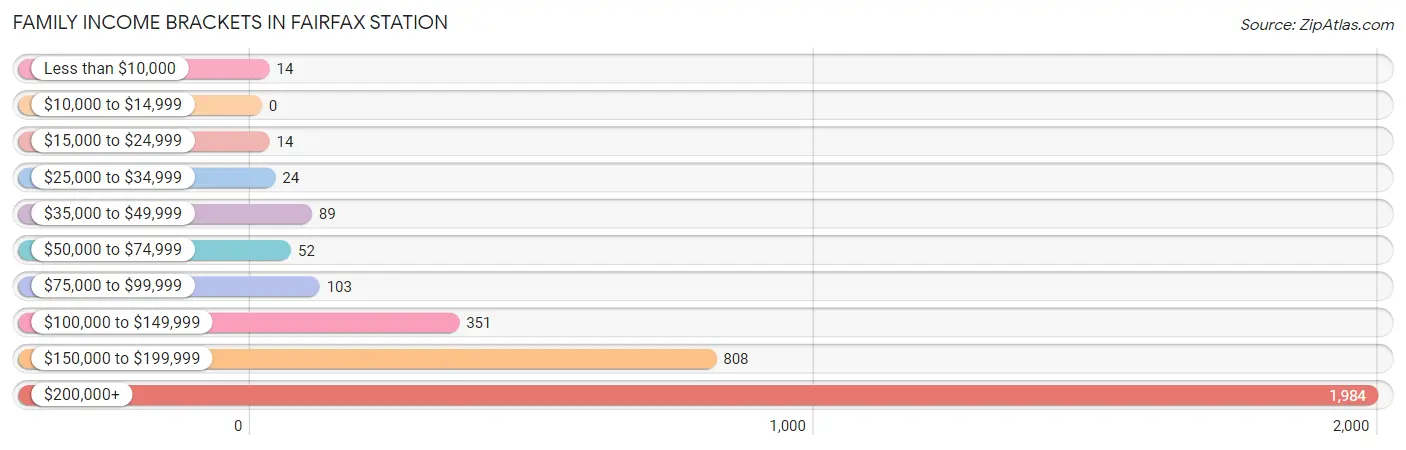
| Income Bracket | # Families | % Families |
| Less than $10,000 | 14 | 0.4% |
| $10,000 to $14,999 | 0 | 0.0% |
| $15,000 to $24,999 | 14 | 0.4% |
| $25,000 to $34,999 | 24 | 0.7% |
| $35,000 to $49,999 | 89 | 2.6% |
| $50,000 to $74,999 | 52 | 1.5% |
| $75,000 to $99,999 | 103 | 3.0% |
| $100,000 to $149,999 | 351 | 10.2% |
| $150,000 to $199,999 | 808 | 23.5% |
| $200,000+ | 1,984 | 57.7% |
Family Income by Famaliy Size in Fairfax Station
6-person families (84 | 2.4%) account for the highest median family income in Fairfax Station with $250,001 per family, while 2-person families (1,322 | 38.4%) have the highest median income of $123,618 per family member.
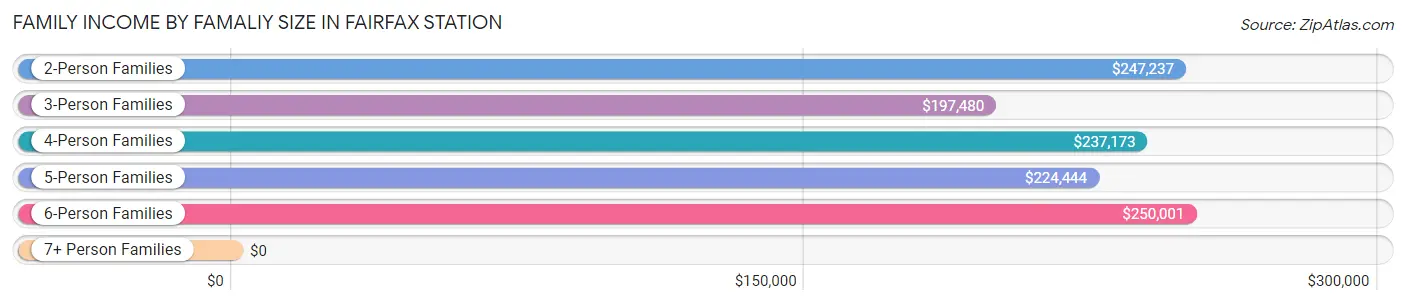
| Income Bracket | # Families | Median Income |
| 2-Person Families | 1,322 (38.4%) | $247,237 |
| 3-Person Families | 975 (28.3%) | $197,480 |
| 4-Person Families | 845 (24.6%) | $237,173 |
| 5-Person Families | 188 (5.5%) | $224,444 |
| 6-Person Families | 84 (2.4%) | $250,001 |
| 7+ Person Families | 25 (0.7%) | $0 |
| Total | 3,439 (100.0%) | $224,180 |
Family Income by Number of Earners in Fairfax Station
The median family income in Fairfax Station is $224,180, with families comprising 3+ earners (617) having the highest median family income of $248,542, while families with no earners (401) have the lowest median family income of $172,159, accounting for 17.9% and 11.7% of families, respectively.
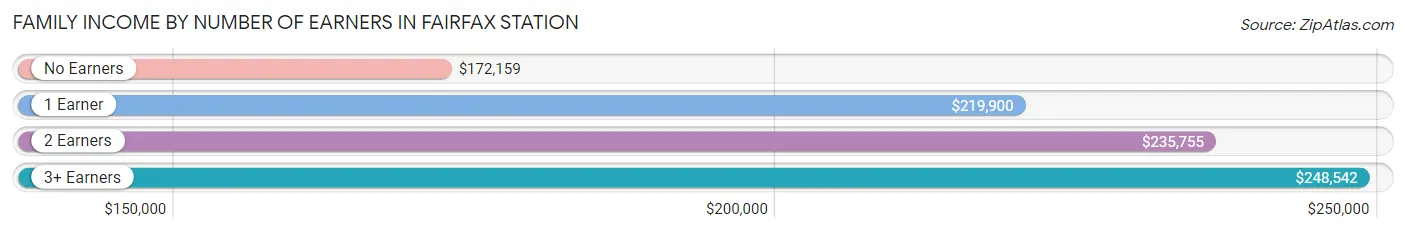
| Number of Earners | # Families | Median Income |
| No Earners | 401 (11.7%) | $172,159 |
| 1 Earner | 902 (26.2%) | $219,900 |
| 2 Earners | 1,519 (44.2%) | $235,755 |
| 3+ Earners | 617 (17.9%) | $248,542 |
| Total | 3,439 (100.0%) | $224,180 |
Household Income in Fairfax Station
Household Income Brackets in Fairfax Station
With 2,183 households falling in the category, the $200,000+ income range is the most frequent in Fairfax Station, accounting for 52.5% of all households. In contrast, only 12 households (0.3%) fall into the less than $10,000 income bracket, making it the least populous group.
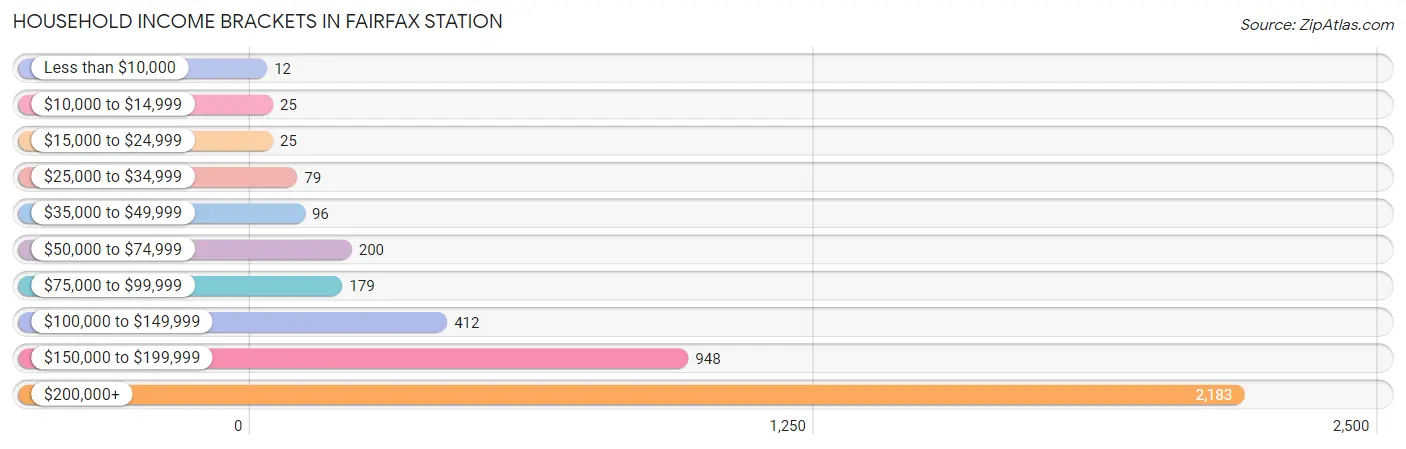
| Income Bracket | # Households | % Households |
| Less than $10,000 | 12 | 0.3% |
| $10,000 to $14,999 | 25 | 0.6% |
| $15,000 to $24,999 | 25 | 0.6% |
| $25,000 to $34,999 | 79 | 1.9% |
| $35,000 to $49,999 | 96 | 2.3% |
| $50,000 to $74,999 | 200 | 4.8% |
| $75,000 to $99,999 | 179 | 4.3% |
| $100,000 to $149,999 | 412 | 9.9% |
| $150,000 to $199,999 | 948 | 22.8% |
| $200,000+ | 2,183 | 52.5% |
Household Income by Householder Age in Fairfax Station
The median household income in Fairfax Station is $211,000, with the highest median household income of $237,193 found in the 45 to 64 years age bracket for the primary householder. A total of 1,886 households (45.4%) fall into this category. Meanwhile, the 15 to 24 years age bracket for the primary householder has the lowest median household income of $25,868, with 73 households (1.8%) in this group.

| Income Bracket | # Households | Median Income |
| 15 to 24 Years | 73 (1.8%) | $25,868 |
| 25 to 44 Years | 846 (20.3%) | $185,543 |
| 45 to 64 Years | 1,886 (45.4%) | $237,193 |
| 65+ Years | 1,353 (32.5%) | $196,620 |
| Total | 4,158 (100.0%) | $211,000 |
Poverty in Fairfax Station
Income Below Poverty by Sex and Age in Fairfax Station
With 0.4% poverty level for males and 3.9% for females among the residents of Fairfax Station, 15 year old males and 18 to 24 year old females are the most vulnerable to poverty, with 6 males (4.2%) and 183 females (28.1%) in their respective age groups living below the poverty level.
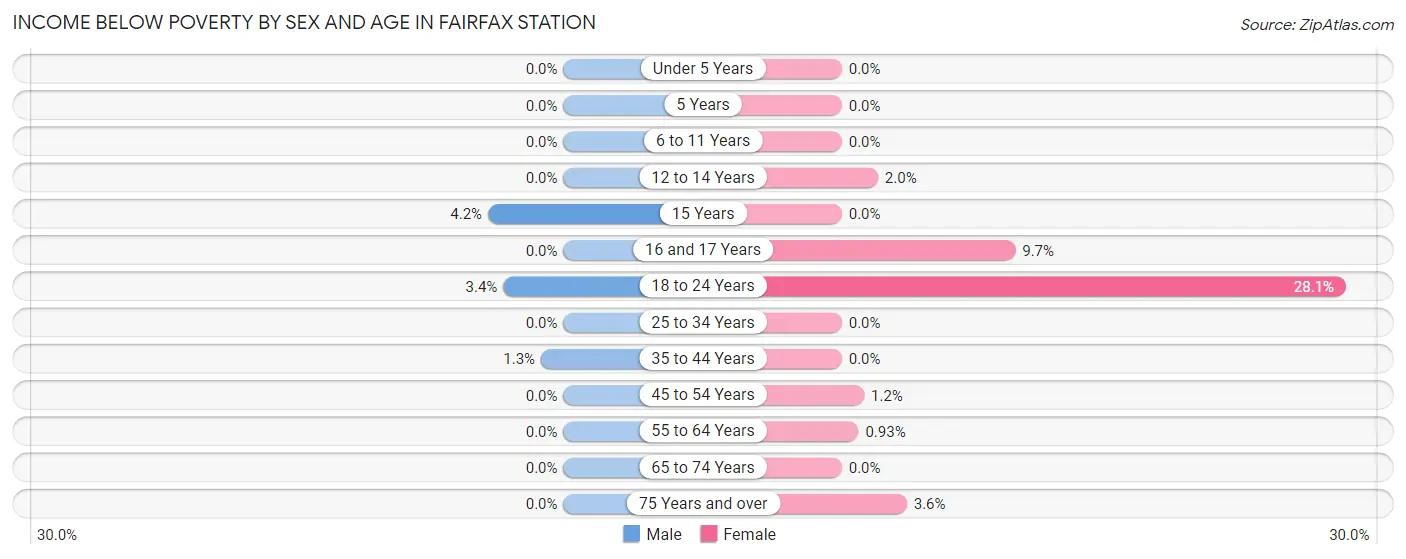
| Age Bracket | Male | Female |
| Under 5 Years | 0 (0.0%) | 0 (0.0%) |
| 5 Years | 0 (0.0%) | 0 (0.0%) |
| 6 to 11 Years | 0 (0.0%) | 0 (0.0%) |
| 12 to 14 Years | 0 (0.0%) | 6 (2.0%) |
| 15 Years | 6 (4.2%) | 0 (0.0%) |
| 16 and 17 Years | 0 (0.0%) | 14 (9.7%) |
| 18 to 24 Years | 12 (3.4%) | 183 (28.1%) |
| 25 to 34 Years | 0 (0.0%) | 0 (0.0%) |
| 35 to 44 Years | 9 (1.3%) | 0 (0.0%) |
| 45 to 54 Years | 0 (0.0%) | 13 (1.2%) |
| 55 to 64 Years | 0 (0.0%) | 8 (0.9%) |
| 65 to 74 Years | 0 (0.0%) | 0 (0.0%) |
| 75 Years and over | 0 (0.0%) | 10 (3.6%) |
| Total | 27 (0.4%) | 234 (3.9%) |
Income Above Poverty by Sex and Age in Fairfax Station
According to the poverty statistics in Fairfax Station, males aged under 5 years and females aged under 5 years are the age groups that are most secure financially, with 100.0% of males and 100.0% of females in these age groups living above the poverty line.
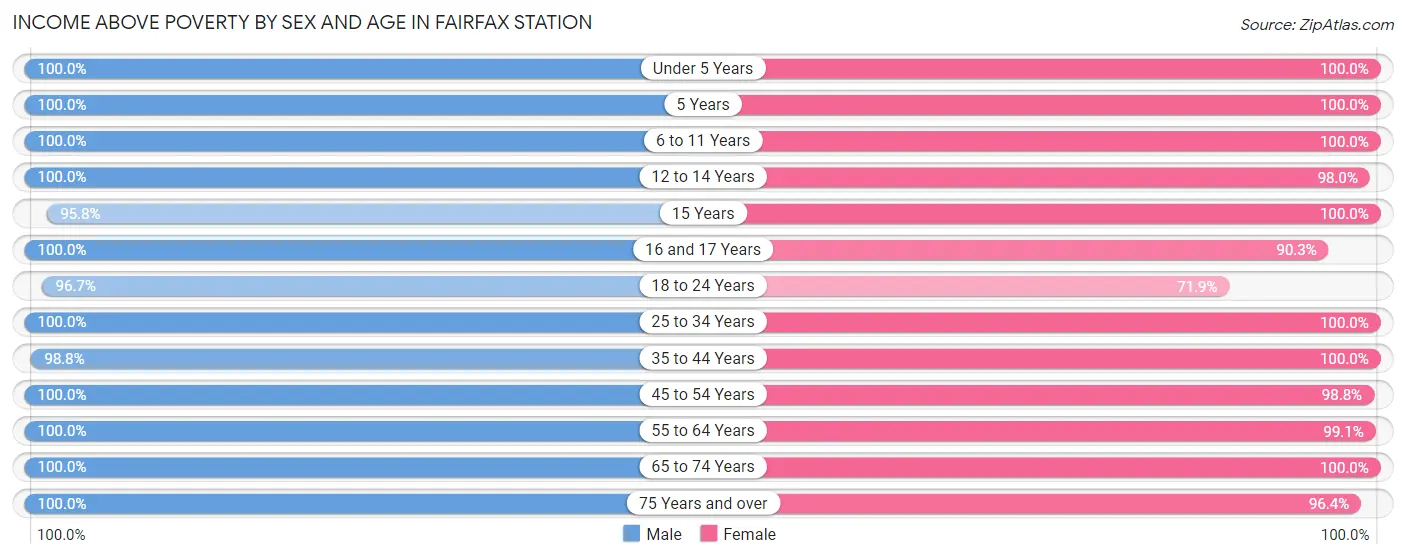
| Age Bracket | Male | Female |
| Under 5 Years | 241 (100.0%) | 280 (100.0%) |
| 5 Years | 80 (100.0%) | 108 (100.0%) |
| 6 to 11 Years | 444 (100.0%) | 281 (100.0%) |
| 12 to 14 Years | 284 (100.0%) | 292 (98.0%) |
| 15 Years | 137 (95.8%) | 84 (100.0%) |
| 16 and 17 Years | 242 (100.0%) | 131 (90.3%) |
| 18 to 24 Years | 346 (96.7%) | 469 (71.9%) |
| 25 to 34 Years | 654 (100.0%) | 541 (100.0%) |
| 35 to 44 Years | 712 (98.8%) | 659 (100.0%) |
| 45 to 54 Years | 771 (100.0%) | 1,036 (98.8%) |
| 55 to 64 Years | 1,098 (100.0%) | 851 (99.1%) |
| 65 to 74 Years | 699 (100.0%) | 835 (100.0%) |
| 75 Years and over | 475 (100.0%) | 266 (96.4%) |
| Total | 6,183 (99.6%) | 5,833 (96.1%) |
Income Below Poverty Among Married-Couple Families in Fairfax Station
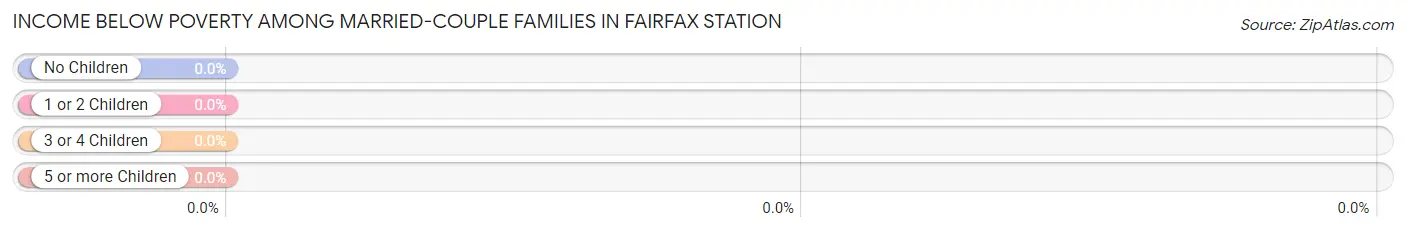
| Children | Above Poverty | Below Poverty |
| No Children | 1,843 (100.0%) | 0 (0.0%) |
| 1 or 2 Children | 1,234 (100.0%) | 0 (0.0%) |
| 3 or 4 Children | 96 (100.0%) | 0 (0.0%) |
| 5 or more Children | 16 (100.0%) | 0 (0.0%) |
| Total | 3,189 (100.0%) | 0 (0.0%) |
Income Below Poverty Among Single-Parent Households in Fairfax Station
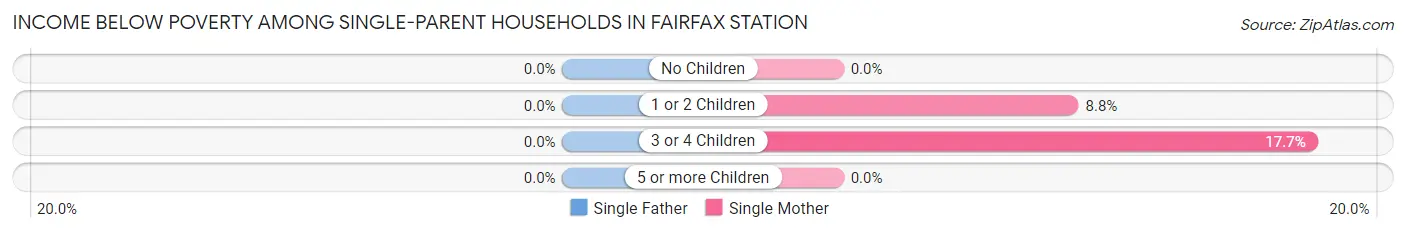
| Children | Single Father | Single Mother |
| No Children | 0 (0.0%) | 0 (0.0%) |
| 1 or 2 Children | 0 (0.0%) | 7 (8.7%) |
| 3 or 4 Children | 0 (0.0%) | 6 (17.6%) |
| 5 or more Children | 0 (0.0%) | 0 (0.0%) |
| Total | 0 (0.0%) | 13 (7.1%) |
Income Below Poverty Among Married-Couple vs Single-Parent Households in Fairfax Station
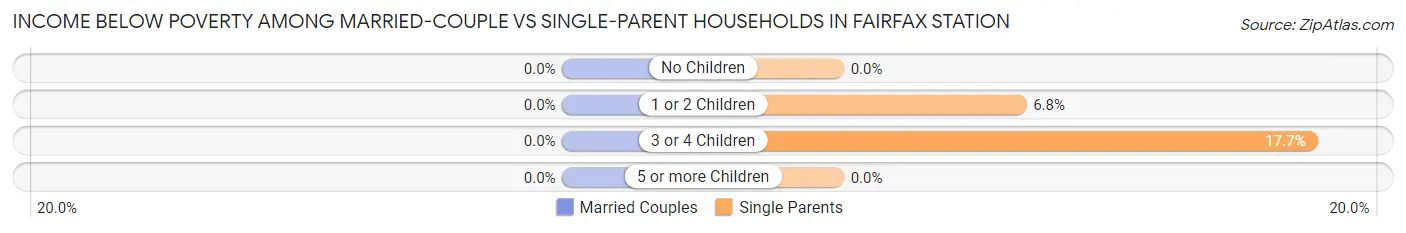
| Children | Married-Couple Families | Single-Parent Households |
| No Children | 0 (0.0%) | 0 (0.0%) |
| 1 or 2 Children | 0 (0.0%) | 7 (6.8%) |
| 3 or 4 Children | 0 (0.0%) | 6 (17.6%) |
| 5 or more Children | 0 (0.0%) | 0 (0.0%) |
| Total | 0 (0.0%) | 13 (5.2%) |
Race in Fairfax Station
The most populous races in Fairfax Station are White / Caucasian (9,251 | 75.3%), Asian (1,399 | 11.4%), and Hispanic or Latino (939 | 7.6%).
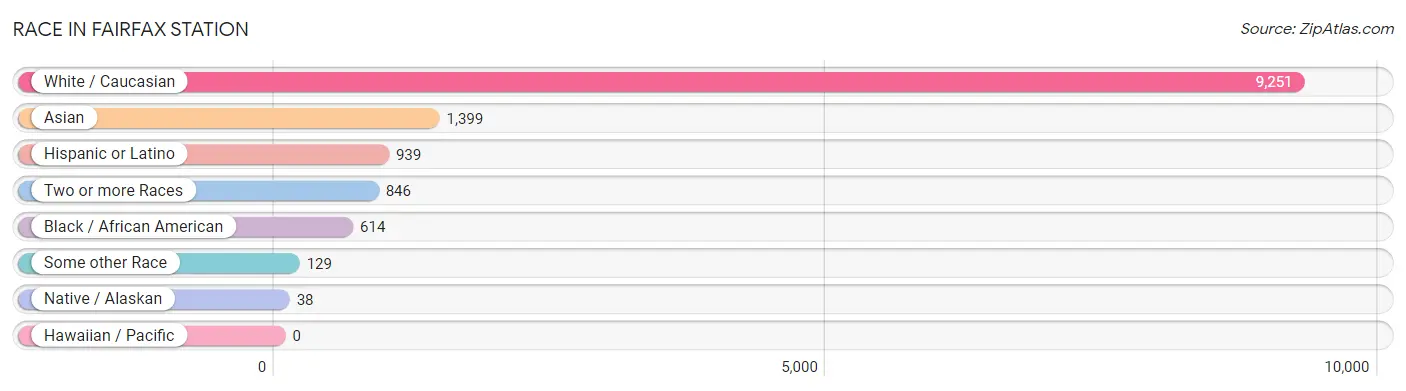
| Race | # Population | % Population |
| Asian | 1,399 | 11.4% |
| Black / African American | 614 | 5.0% |
| Hawaiian / Pacific | 0 | 0.0% |
| Hispanic or Latino | 939 | 7.6% |
| Native / Alaskan | 38 | 0.3% |
| White / Caucasian | 9,251 | 75.3% |
| Two or more Races | 846 | 6.9% |
| Some other Race | 129 | 1.1% |
| Total | 12,277 | 100.0% |
Ancestry in Fairfax Station
The most populous ancestries reported in Fairfax Station are Irish (1,680 | 13.7%), English (1,617 | 13.2%), German (1,568 | 12.8%), Italian (859 | 7.0%), and American (702 | 5.7%), together accounting for 52.3% of all Fairfax Station residents.
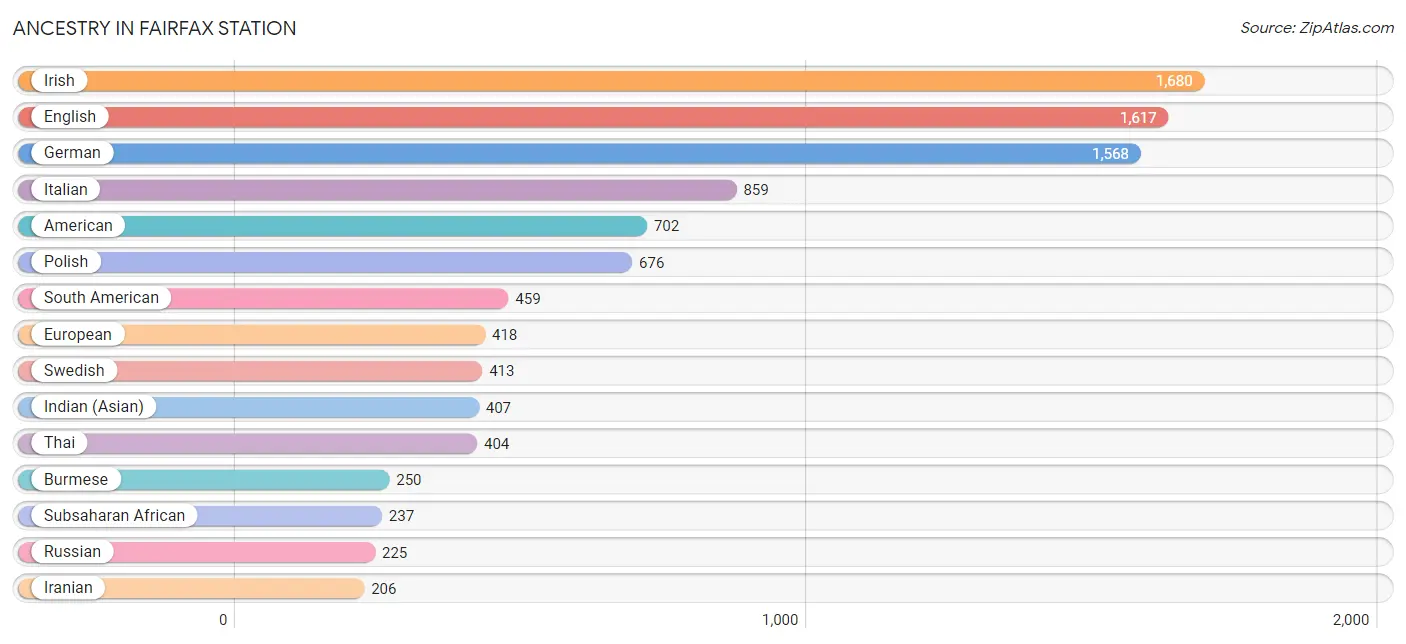
| Ancestry | # Population | % Population |
| Afghan | 33 | 0.3% |
| American | 702 | 5.7% |
| Arab | 159 | 1.3% |
| Argentinean | 16 | 0.1% |
| Armenian | 19 | 0.2% |
| Assyrian / Chaldean / Syriac | 13 | 0.1% |
| Austrian | 42 | 0.3% |
| Bhutanese | 92 | 0.7% |
| Bolivian | 113 | 0.9% |
| Brazilian | 21 | 0.2% |
| British | 201 | 1.6% |
| Burmese | 250 | 2.0% |
| Canadian | 81 | 0.7% |
| Central American | 178 | 1.5% |
| Cherokee | 24 | 0.2% |
| Chilean | 47 | 0.4% |
| Colombian | 105 | 0.9% |
| Cuban | 27 | 0.2% |
| Czech | 56 | 0.5% |
| Czechoslovakian | 21 | 0.2% |
| Danish | 45 | 0.4% |
| Dutch | 154 | 1.3% |
| Eastern European | 59 | 0.5% |
| Ecuadorian | 89 | 0.7% |
| English | 1,617 | 13.2% |
| Ethiopian | 41 | 0.3% |
| European | 418 | 3.4% |
| Filipino | 21 | 0.2% |
| Finnish | 113 | 0.9% |
| French | 151 | 1.2% |
| French Canadian | 62 | 0.5% |
| German | 1,568 | 12.8% |
| Ghanaian | 39 | 0.3% |
| Greek | 133 | 1.1% |
| Guatemalan | 92 | 0.7% |
| Honduran | 1 | 0.0% |
| Hungarian | 109 | 0.9% |
| Indian (Asian) | 407 | 3.3% |
| Iranian | 206 | 1.7% |
| Irish | 1,680 | 13.7% |
| Israeli | 45 | 0.4% |
| Italian | 859 | 7.0% |
| Jamaican | 28 | 0.2% |
| Korean | 108 | 0.9% |
| Latvian | 9 | 0.1% |
| Lebanese | 126 | 1.0% |
| Lithuanian | 37 | 0.3% |
| Malaysian | 22 | 0.2% |
| Mexican | 74 | 0.6% |
| Mongolian | 7 | 0.1% |
| Nicaraguan | 34 | 0.3% |
| Northern European | 85 | 0.7% |
| Norwegian | 53 | 0.4% |
| Peruvian | 83 | 0.7% |
| Polish | 676 | 5.5% |
| Puerto Rican | 73 | 0.6% |
| Romanian | 112 | 0.9% |
| Russian | 225 | 1.8% |
| Salvadoran | 51 | 0.4% |
| Scandinavian | 21 | 0.2% |
| Scotch-Irish | 157 | 1.3% |
| Scottish | 198 | 1.6% |
| Seminole | 38 | 0.3% |
| Serbian | 12 | 0.1% |
| Slavic | 11 | 0.1% |
| Slovak | 10 | 0.1% |
| Slovene | 10 | 0.1% |
| Somali | 157 | 1.3% |
| South American | 459 | 3.7% |
| South American Indian | 7 | 0.1% |
| Spaniard | 8 | 0.1% |
| Spanish | 50 | 0.4% |
| Sri Lankan | 193 | 1.6% |
| Subsaharan African | 237 | 1.9% |
| Swedish | 413 | 3.4% |
| Swiss | 90 | 0.7% |
| Syrian | 13 | 0.1% |
| Thai | 404 | 3.3% |
| Turkish | 14 | 0.1% |
| Venezuelan | 6 | 0.1% |
| Vietnamese | 34 | 0.3% |
| Welsh | 81 | 0.7% | View All 82 Rows |
Immigrants in Fairfax Station
The most numerous immigrant groups reported in Fairfax Station came from Asia (1,066 | 8.7%), Eastern Asia (438 | 3.6%), Latin America (370 | 3.0%), South Central Asia (307 | 2.5%), and South America (291 | 2.4%), together accounting for 20.1% of all Fairfax Station residents.
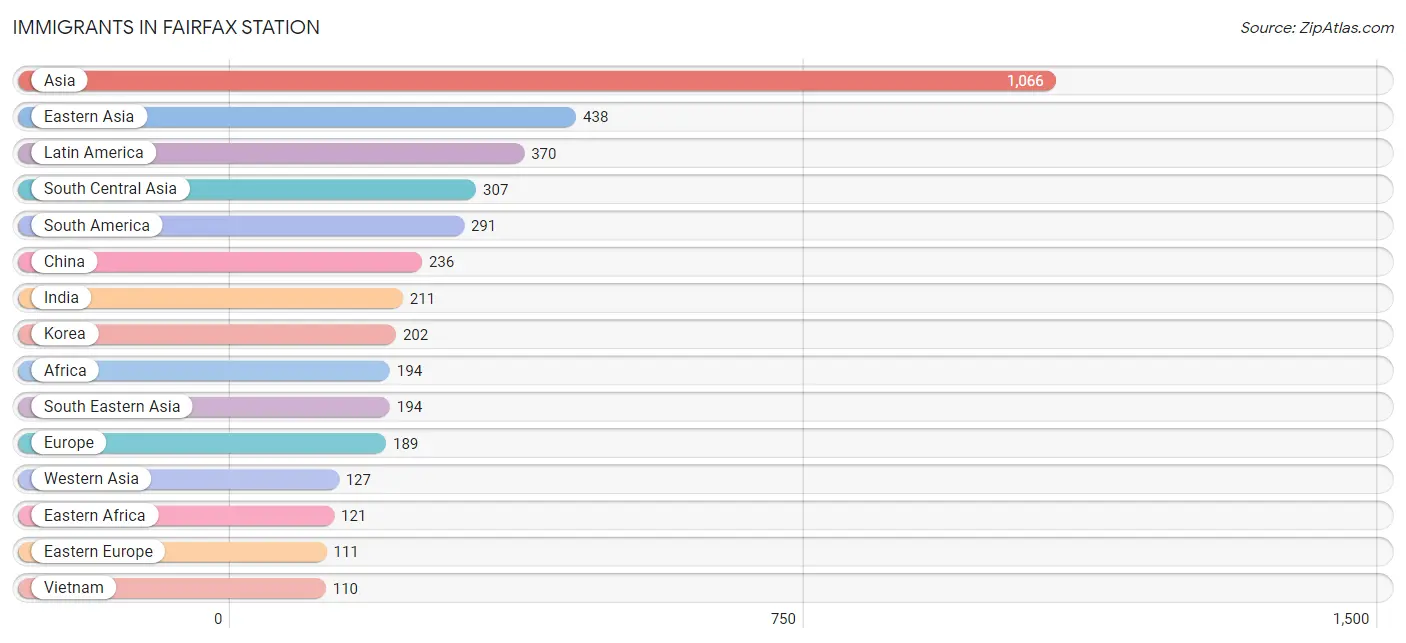
| Immigration Origin | # Population | % Population |
| Afghanistan | 33 | 0.3% |
| Africa | 194 | 1.6% |
| Argentina | 16 | 0.1% |
| Asia | 1,066 | 8.7% |
| Bangladesh | 14 | 0.1% |
| Belarus | 7 | 0.1% |
| Bolivia | 86 | 0.7% |
| Brazil | 89 | 0.7% |
| Canada | 44 | 0.4% |
| Caribbean | 28 | 0.2% |
| Central America | 51 | 0.4% |
| Chile | 27 | 0.2% |
| China | 236 | 1.9% |
| Colombia | 35 | 0.3% |
| Eastern Africa | 121 | 1.0% |
| Eastern Asia | 438 | 3.6% |
| Eastern Europe | 111 | 0.9% |
| Egypt | 12 | 0.1% |
| El Salvador | 38 | 0.3% |
| England | 11 | 0.1% |
| Ethiopia | 14 | 0.1% |
| Europe | 189 | 1.5% |
| Germany | 13 | 0.1% |
| Ghana | 39 | 0.3% |
| Honduras | 1 | 0.0% |
| Hong Kong | 9 | 0.1% |
| India | 211 | 1.7% |
| Iran | 11 | 0.1% |
| Israel | 45 | 0.4% |
| Italy | 21 | 0.2% |
| Jamaica | 28 | 0.2% |
| Kenya | 8 | 0.1% |
| Korea | 202 | 1.7% |
| Laos | 5 | 0.0% |
| Latin America | 370 | 3.0% |
| Lebanon | 55 | 0.4% |
| Malaysia | 7 | 0.1% |
| Mexico | 12 | 0.1% |
| Morocco | 22 | 0.2% |
| Northern Africa | 34 | 0.3% |
| Northern Europe | 36 | 0.3% |
| Oceania | 29 | 0.2% |
| Pakistan | 38 | 0.3% |
| Peru | 32 | 0.3% |
| Philippines | 72 | 0.6% |
| Romania | 51 | 0.4% |
| Russia | 53 | 0.4% |
| Somalia | 81 | 0.7% |
| South America | 291 | 2.4% |
| South Central Asia | 307 | 2.5% |
| South Eastern Asia | 194 | 1.6% |
| Southern Europe | 29 | 0.2% |
| Spain | 8 | 0.1% |
| Taiwan | 36 | 0.3% |
| Turkey | 27 | 0.2% |
| Venezuela | 6 | 0.1% |
| Vietnam | 110 | 0.9% |
| Western Africa | 39 | 0.3% |
| Western Asia | 127 | 1.0% |
| Western Europe | 13 | 0.1% | View All 60 Rows |
Sex and Age in Fairfax Station
Sex and Age in Fairfax Station
The most populous age groups in Fairfax Station are 60 to 64 Years (581 | 9.4%) for men and 50 to 54 Years (619 | 10.2%) for women.
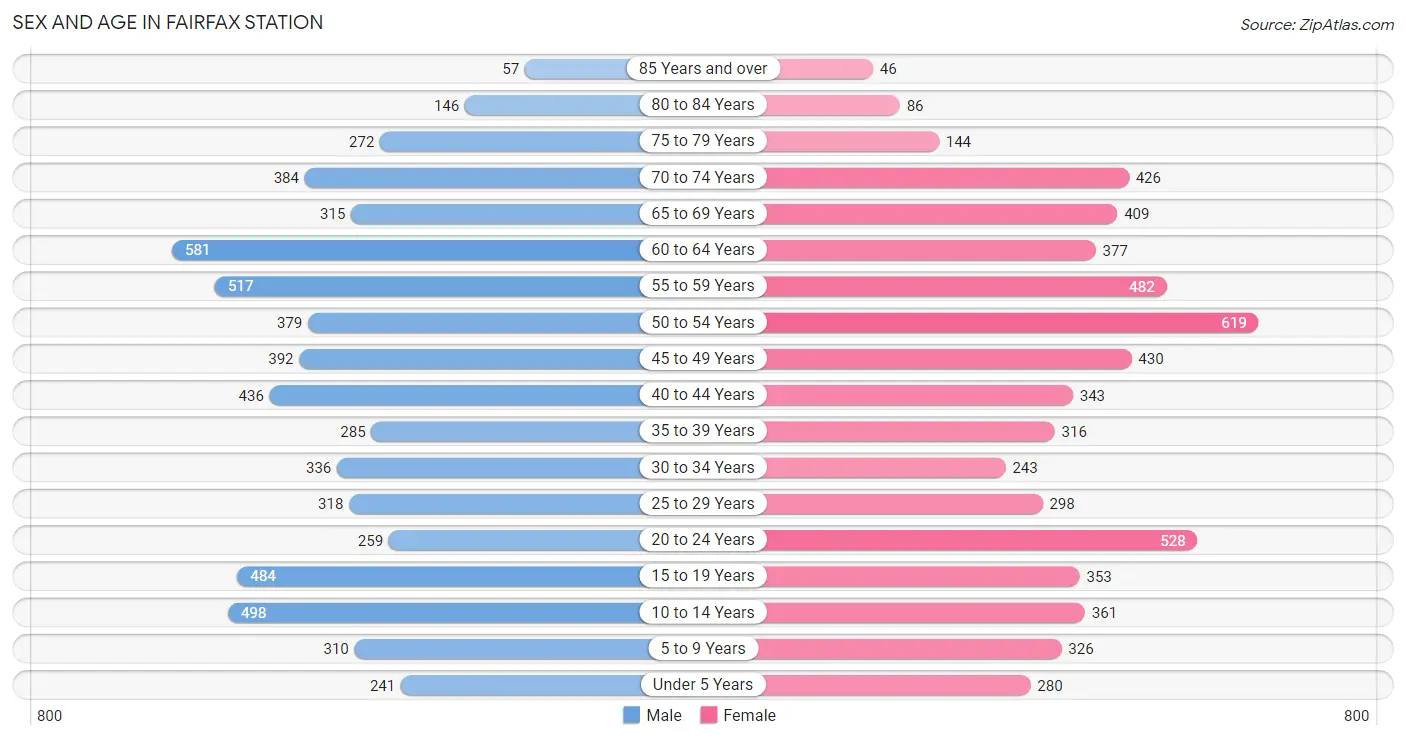
| Age Bracket | Male | Female |
| Under 5 Years | 241 (3.9%) | 280 (4.6%) |
| 5 to 9 Years | 310 (5.0%) | 326 (5.4%) |
| 10 to 14 Years | 498 (8.0%) | 361 (5.9%) |
| 15 to 19 Years | 484 (7.8%) | 353 (5.8%) |
| 20 to 24 Years | 259 (4.2%) | 528 (8.7%) |
| 25 to 29 Years | 318 (5.1%) | 298 (4.9%) |
| 30 to 34 Years | 336 (5.4%) | 243 (4.0%) |
| 35 to 39 Years | 285 (4.6%) | 316 (5.2%) |
| 40 to 44 Years | 436 (7.0%) | 343 (5.7%) |
| 45 to 49 Years | 392 (6.3%) | 430 (7.1%) |
| 50 to 54 Years | 379 (6.1%) | 619 (10.2%) |
| 55 to 59 Years | 517 (8.3%) | 482 (7.9%) |
| 60 to 64 Years | 581 (9.4%) | 377 (6.2%) |
| 65 to 69 Years | 315 (5.1%) | 409 (6.7%) |
| 70 to 74 Years | 384 (6.2%) | 426 (7.0%) |
| 75 to 79 Years | 272 (4.4%) | 144 (2.4%) |
| 80 to 84 Years | 146 (2.4%) | 86 (1.4%) |
| 85 Years and over | 57 (0.9%) | 46 (0.8%) |
| Total | 6,210 (100.0%) | 6,067 (100.0%) |
Families and Households in Fairfax Station
Median Family Size in Fairfax Station
The median family size in Fairfax Station is 3.25 persons per family, with single female/mother families (183 | 5.3%) accounting for the largest median family size of 3.74 persons per family. On the other hand, single male/father families (67 | 1.9%) represent the smallest median family size with 2.66 persons per family.
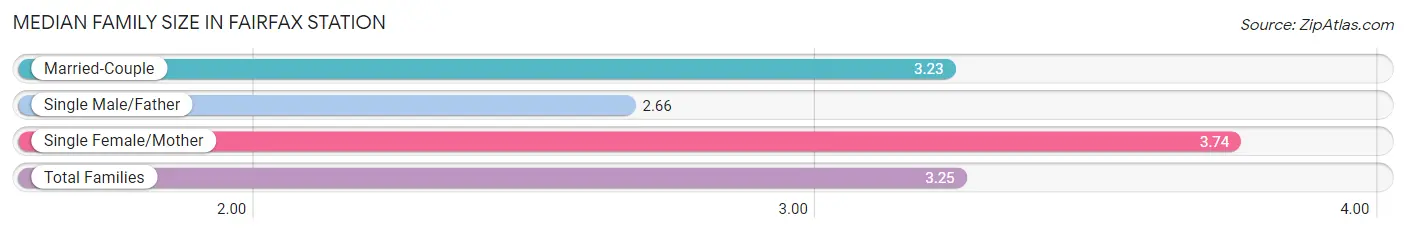
| Family Type | # Families | Family Size |
| Married-Couple | 3,189 (92.7%) | 3.23 |
| Single Male/Father | 67 (1.9%) | 2.66 |
| Single Female/Mother | 183 (5.3%) | 3.74 |
| Total Families | 3,439 (100.0%) | 3.25 |
Median Household Size in Fairfax Station
The median household size in Fairfax Station is 2.95 persons per household, with single female/mother households (183 | 4.4%) accounting for the largest median household size of 3.99 persons per household. non-family households (719 | 17.3%) represent the smallest median household size with 1.38 persons per household.
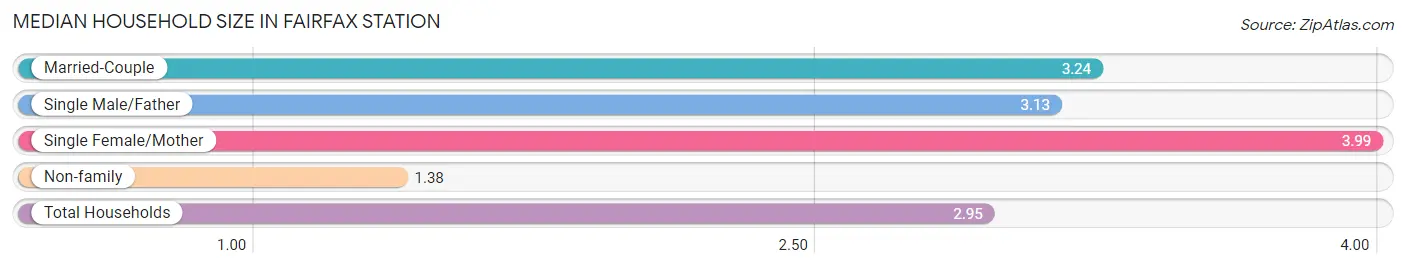
| Household Type | # Households | Household Size |
| Married-Couple | 3,189 (76.7%) | 3.24 |
| Single Male/Father | 67 (1.6%) | 3.13 |
| Single Female/Mother | 183 (4.4%) | 3.99 |
| Non-family | 719 (17.3%) | 1.38 |
| Total Households | 4,158 (100.0%) | 2.95 |
Household Size by Marriage Status in Fairfax Station
Out of a total of 4,158 households in Fairfax Station, 3,439 (82.7%) are family households, while 719 (17.3%) are nonfamily households. The most numerous type of family households are 2-person households, comprising 1,290, and the most common type of nonfamily households are 1-person households, comprising 560.
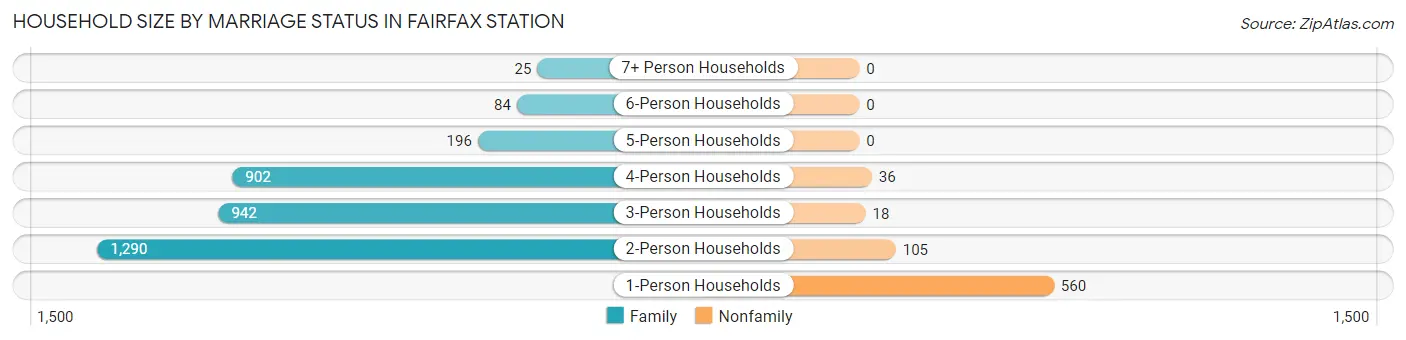
| Household Size | Family Households | Nonfamily Households |
| 1-Person Households | - | 560 (13.5%) |
| 2-Person Households | 1,290 (31.0%) | 105 (2.5%) |
| 3-Person Households | 942 (22.7%) | 18 (0.4%) |
| 4-Person Households | 902 (21.7%) | 36 (0.9%) |
| 5-Person Households | 196 (4.7%) | 0 (0.0%) |
| 6-Person Households | 84 (2.0%) | 0 (0.0%) |
| 7+ Person Households | 25 (0.6%) | 0 (0.0%) |
| Total | 3,439 (82.7%) | 719 (17.3%) |
Female Fertility in Fairfax Station
Fertility by Age in Fairfax Station
Average fertility rate in Fairfax Station is 26.0 births per 1,000 women. Women in the age bracket of 20 to 34 years have the highest fertility rate with 35.0 births per 1,000 women. Women in the age bracket of 20 to 34 years acount for 56.9% of all women with births.
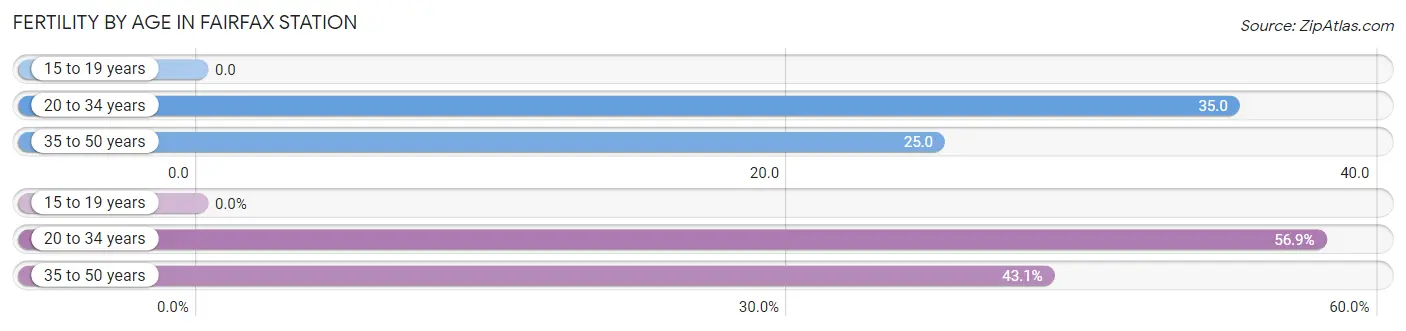
| Age Bracket | Women with Births | Births / 1,000 Women |
| 15 to 19 years | 0 (0.0%) | 0.0 |
| 20 to 34 years | 37 (56.9%) | 35.0 |
| 35 to 50 years | 28 (43.1%) | 25.0 |
| Total | 65 (100.0%) | 26.0 |
Fertility by Age by Marriage Status in Fairfax Station
81.5% of women with births (65) in Fairfax Station are married. The highest percentage of unmarried women with births falls into 20 to 34 years age bracket with 32.4% of them unmarried at the time of birth, while the lowest percentage of unmarried women with births belong to 35 to 50 years age bracket with 0.0% of them unmarried.
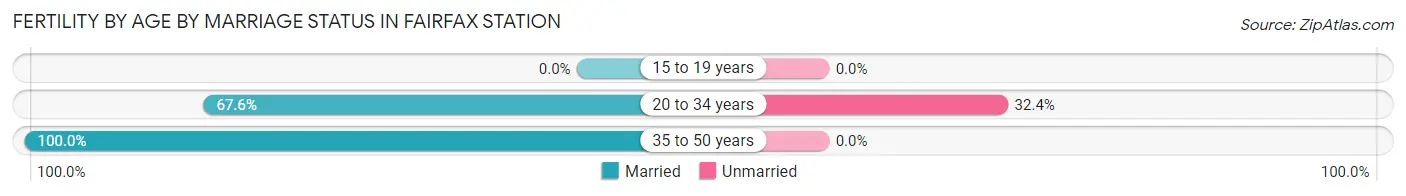
| Age Bracket | Married | Unmarried |
| 15 to 19 years | 0 (0.0%) | 0 (0.0%) |
| 20 to 34 years | 25 (67.6%) | 12 (32.4%) |
| 35 to 50 years | 28 (100.0%) | 0 (0.0%) |
| Total | 53 (81.5%) | 12 (18.5%) |
Fertility by Education in Fairfax Station
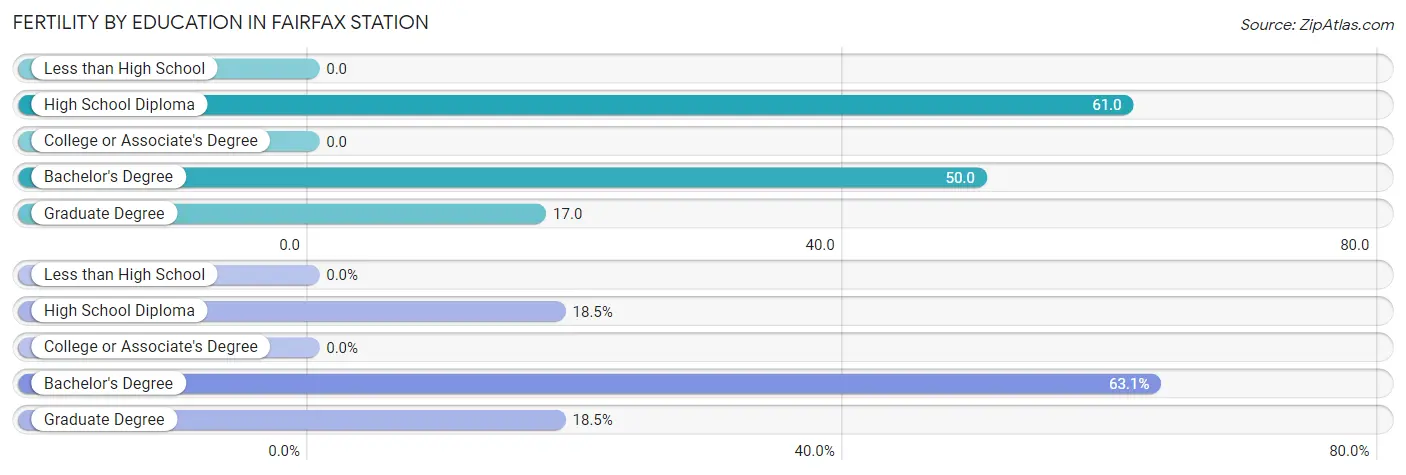
| Educational Attainment | Women with Births | Births / 1,000 Women |
| Less than High School | 0 (0.0%) | 0.0 |
| High School Diploma | 12 (18.5%) | 61.0 |
| College or Associate's Degree | 0 (0.0%) | 0.0 |
| Bachelor's Degree | 41 (63.1%) | 50.0 |
| Graduate Degree | 12 (18.5%) | 17.0 |
| Total | 65 (100.0%) | 26.0 |
Fertility by Education by Marriage Status in Fairfax Station
18.5% of women with births in Fairfax Station are unmarried. Women with the educational attainment of bachelor's degree are most likely to be married with 100.0% of them married at childbirth, while women with the educational attainment of high school diploma are least likely to be married with 100.0% of them unmarried at childbirth.
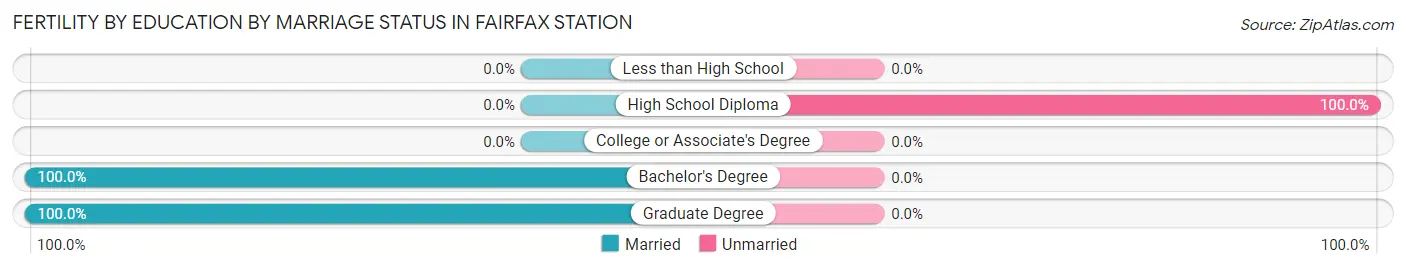
| Educational Attainment | Married | Unmarried |
| Less than High School | 0 (0.0%) | 0 (0.0%) |
| High School Diploma | 0 (0.0%) | 12 (100.0%) |
| College or Associate's Degree | 0 (0.0%) | 0 (0.0%) |
| Bachelor's Degree | 41 (100.0%) | 0 (0.0%) |
| Graduate Degree | 12 (100.0%) | 0 (0.0%) |
| Total | 53 (81.5%) | 12 (18.5%) |
Employment Characteristics in Fairfax Station
Employment by Class of Employer in Fairfax Station
Among the 6,184 employed individuals in Fairfax Station, private company employees (3,345 | 54.1%), federal government employees (991 | 16.0%), and not-for-profit organizations (544 | 8.8%) make up the most common classes of employment.
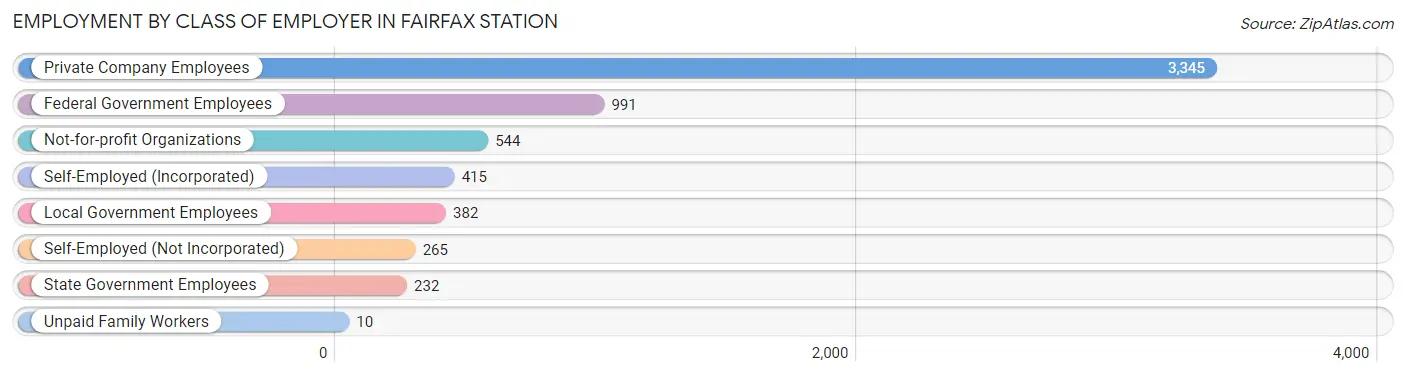
| Employer Class | # Employees | % Employees |
| Private Company Employees | 3,345 | 54.1% |
| Self-Employed (Incorporated) | 415 | 6.7% |
| Self-Employed (Not Incorporated) | 265 | 4.3% |
| Not-for-profit Organizations | 544 | 8.8% |
| Local Government Employees | 382 | 6.2% |
| State Government Employees | 232 | 3.7% |
| Federal Government Employees | 991 | 16.0% |
| Unpaid Family Workers | 10 | 0.2% |
| Total | 6,184 | 100.0% |
Employment Status by Age in Fairfax Station
According to the labor force statistics for Fairfax Station, out of the total population over 16 years of age (10,034), 66.2% or 6,643 individuals are in the labor force, with 4.1% or 272 of them unemployed. The age group with the highest labor force participation rate is 35 to 44 years, with 90.7% or 1,252 individuals in the labor force. Within the labor force, the 16 to 19 years age range has the highest percentage of unemployed individuals, with 15.8% or 30 of them being unemployed.
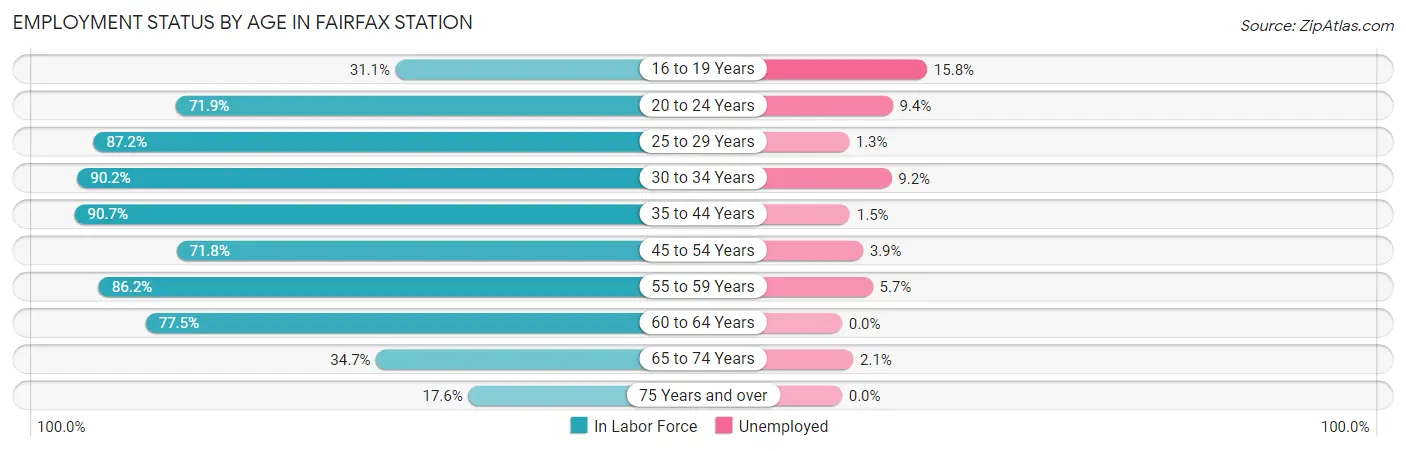
| Age Bracket | In Labor Force | Unemployed |
| 16 to 19 Years | 190 (31.1%) | 30 (15.8%) |
| 20 to 24 Years | 566 (71.9%) | 53 (9.4%) |
| 25 to 29 Years | 537 (87.2%) | 7 (1.3%) |
| 30 to 34 Years | 522 (90.2%) | 48 (9.2%) |
| 35 to 44 Years | 1,252 (90.7%) | 19 (1.5%) |
| 45 to 54 Years | 1,307 (71.8%) | 51 (3.9%) |
| 55 to 59 Years | 861 (86.2%) | 49 (5.7%) |
| 60 to 64 Years | 742 (77.5%) | 0 (0.0%) |
| 65 to 74 Years | 532 (34.7%) | 11 (2.1%) |
| 75 Years and over | 132 (17.6%) | 0 (0.0%) |
| Total | 6,643 (66.2%) | 272 (4.1%) |
Employment Status by Educational Attainment in Fairfax Station
According to labor force statistics for Fairfax Station, 82.2% of individuals (5,221) out of the total population between 25 and 64 years of age (6,352) are in the labor force, with 3.3% or 172 of them being unemployed. The group with the highest labor force participation rate are those with the educational attainment of high school diploma, with 90.4% or 320 individuals in the labor force. Within the labor force, individuals with high school diploma education have the highest percentage of unemployment, with 8.3% or 27 of them being unemployed.
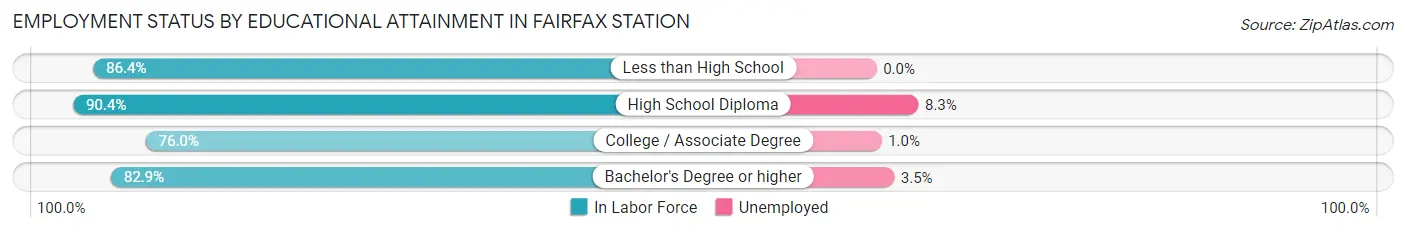
| Educational Attainment | In Labor Force | Unemployed |
| Less than High School | 89 (86.4%) | 0 (0.0%) |
| High School Diploma | 320 (90.4%) | 29 (8.3%) |
| College / Associate Degree | 825 (76.0%) | 11 (1.0%) |
| Bachelor's Degree or higher | 3,987 (82.9%) | 168 (3.5%) |
| Total | 5,221 (82.2%) | 210 (3.3%) |
Employment Occupations by Sex in Fairfax Station
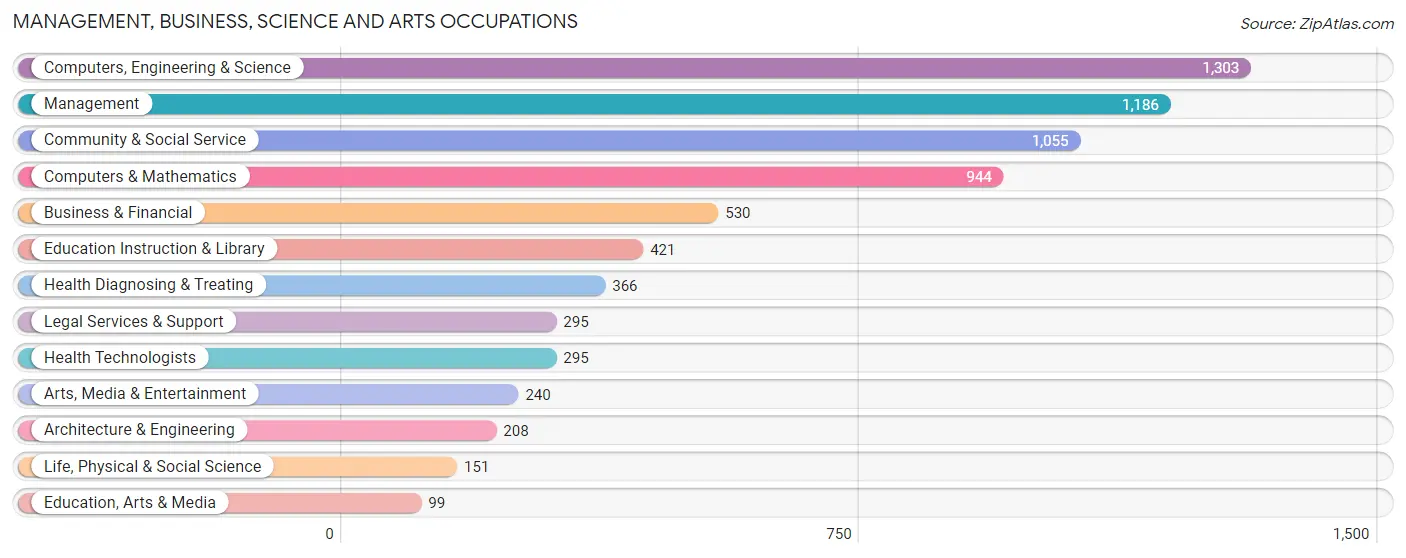
Management, Business, Science and Arts Occupations
The most common Management, Business, Science and Arts occupations in Fairfax Station are Computers, Engineering & Science (1,303 | 20.8%), Management (1,186 | 18.9%), Community & Social Service (1,055 | 16.8%), Computers & Mathematics (944 | 15.0%), and Business & Financial (530 | 8.4%).
Management, Business, Science and Arts Occupations by Sex
Within the Management, Business, Science and Arts occupations in Fairfax Station, the most male-oriented occupations are Architecture & Engineering (86.1%), Computers, Engineering & Science (75.5%), and Management (73.9%), while the most female-oriented occupations are Health Diagnosing & Treating (82.0%), Education Instruction & Library (78.9%), and Health Technologists (77.6%).
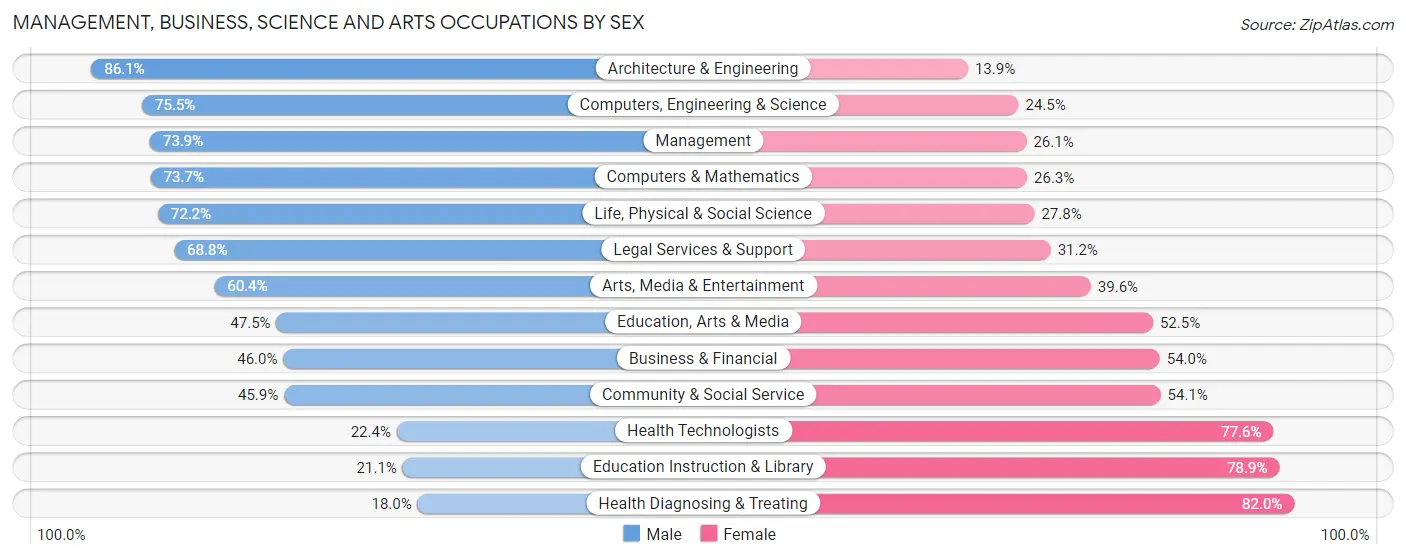
| Occupation | Male | Female |
| Management | 876 (73.9%) | 310 (26.1%) |
| Business & Financial | 244 (46.0%) | 286 (54.0%) |
| Computers, Engineering & Science | 984 (75.5%) | 319 (24.5%) |
| Computers & Mathematics | 696 (73.7%) | 248 (26.3%) |
| Architecture & Engineering | 179 (86.1%) | 29 (13.9%) |
| Life, Physical & Social Science | 109 (72.2%) | 42 (27.8%) |
| Community & Social Service | 484 (45.9%) | 571 (54.1%) |
| Education, Arts & Media | 47 (47.5%) | 52 (52.5%) |
| Legal Services & Support | 203 (68.8%) | 92 (31.2%) |
| Education Instruction & Library | 89 (21.1%) | 332 (78.9%) |
| Arts, Media & Entertainment | 145 (60.4%) | 95 (39.6%) |
| Health Diagnosing & Treating | 66 (18.0%) | 300 (82.0%) |
| Health Technologists | 66 (22.4%) | 229 (77.6%) |
| Total (Category) | 2,654 (59.8%) | 1,786 (40.2%) |
| Total (Overall) | 3,602 (57.4%) | 2,676 (42.6%) |
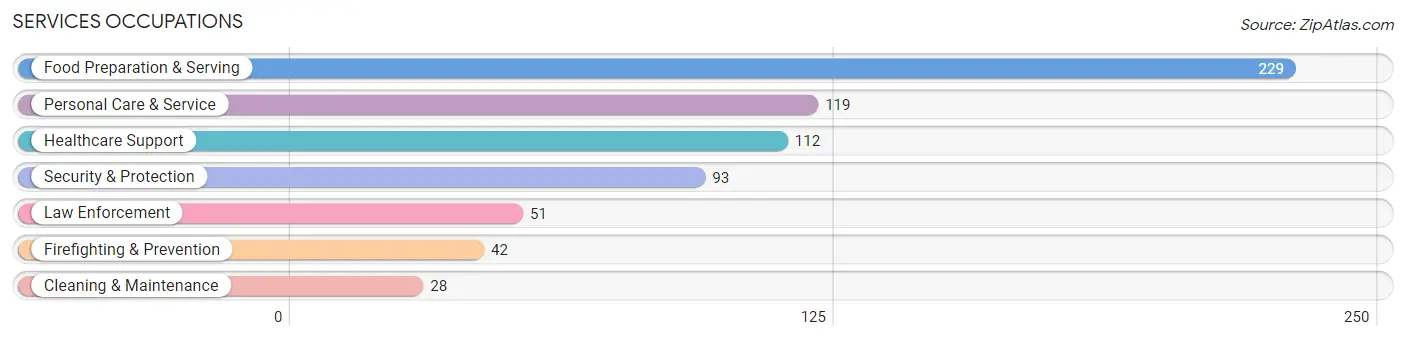
Services Occupations
The most common Services occupations in Fairfax Station are Food Preparation & Serving (229 | 3.6%), Personal Care & Service (119 | 1.9%), Healthcare Support (112 | 1.8%), Security & Protection (93 | 1.5%), and Law Enforcement (51 | 0.8%).
Services Occupations by Sex
Within the Services occupations in Fairfax Station, the most male-oriented occupations are Law Enforcement (100.0%), Security & Protection (95.7%), and Firefighting & Prevention (90.5%), while the most female-oriented occupations are Healthcare Support (89.3%), Cleaning & Maintenance (82.1%), and Personal Care & Service (42.0%).
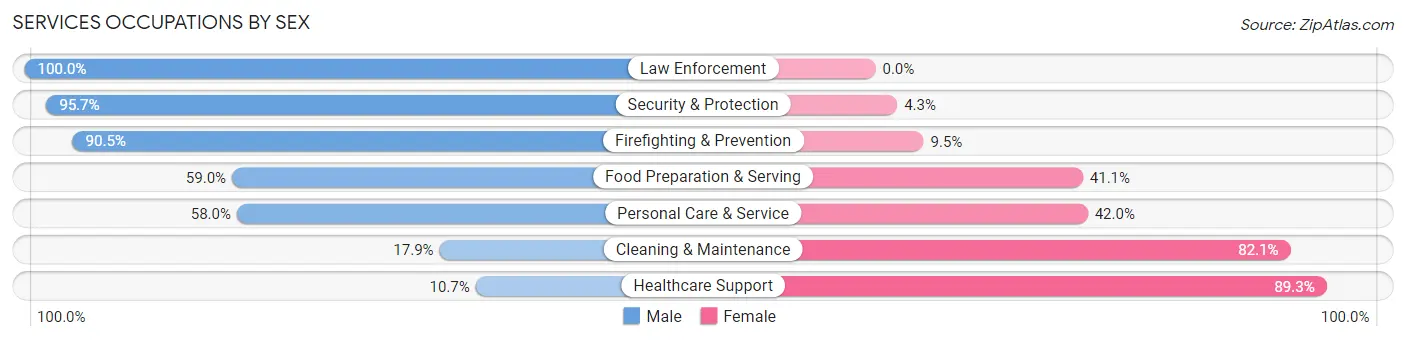
| Occupation | Male | Female |
| Healthcare Support | 12 (10.7%) | 100 (89.3%) |
| Security & Protection | 89 (95.7%) | 4 (4.3%) |
| Firefighting & Prevention | 38 (90.5%) | 4 (9.5%) |
| Law Enforcement | 51 (100.0%) | 0 (0.0%) |
| Food Preparation & Serving | 135 (59.0%) | 94 (41.0%) |
| Cleaning & Maintenance | 5 (17.9%) | 23 (82.1%) |
| Personal Care & Service | 69 (58.0%) | 50 (42.0%) |
| Total (Category) | 310 (53.4%) | 271 (46.6%) |
| Total (Overall) | 3,602 (57.4%) | 2,676 (42.6%) |
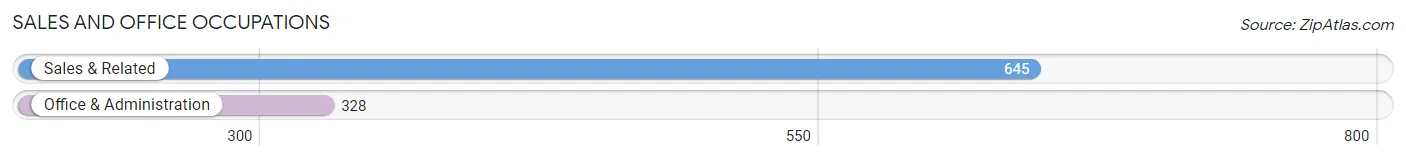
Sales and Office Occupations
The most common Sales and Office occupations in Fairfax Station are Sales & Related (645 | 10.3%), and Office & Administration (328 | 5.2%).
Sales and Office Occupations by Sex
| Occupation | Male | Female |
| Sales & Related | 351 (54.4%) | 294 (45.6%) |
| Office & Administration | 43 (13.1%) | 285 (86.9%) |
| Total (Category) | 394 (40.5%) | 579 (59.5%) |
| Total (Overall) | 3,602 (57.4%) | 2,676 (42.6%) |
Natural Resources, Construction and Maintenance Occupations
The most common Natural Resources, Construction and Maintenance occupations in Fairfax Station are Construction & Extraction (77 | 1.2%), Installation, Maintenance & Repair (18 | 0.3%), and Farming, Fishing & Forestry (1 | 0.0%).
Natural Resources, Construction and Maintenance Occupations by Sex
| Occupation | Male | Female |
| Farming, Fishing & Forestry | 1 (100.0%) | 0 (0.0%) |
| Construction & Extraction | 77 (100.0%) | 0 (0.0%) |
| Installation, Maintenance & Repair | 18 (100.0%) | 0 (0.0%) |
| Total (Category) | 96 (100.0%) | 0 (0.0%) |
| Total (Overall) | 3,602 (57.4%) | 2,676 (42.6%) |
Production, Transportation and Moving Occupations
The most common Production, Transportation and Moving occupations in Fairfax Station are Production (67 | 1.1%), Transportation (64 | 1.0%), and Material Moving (57 | 0.9%).
Production, Transportation and Moving Occupations by Sex
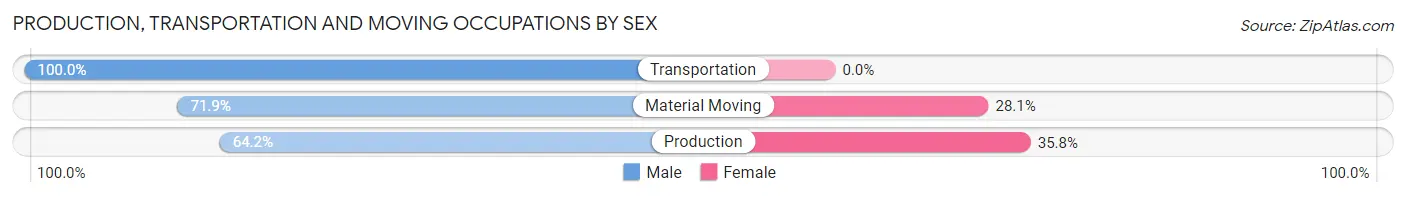
| Occupation | Male | Female |
| Production | 43 (64.2%) | 24 (35.8%) |
| Transportation | 64 (100.0%) | 0 (0.0%) |
| Material Moving | 41 (71.9%) | 16 (28.1%) |
| Total (Category) | 148 (78.7%) | 40 (21.3%) |
| Total (Overall) | 3,602 (57.4%) | 2,676 (42.6%) |
Employment Industries by Sex in Fairfax Station
Employment Industries in Fairfax Station
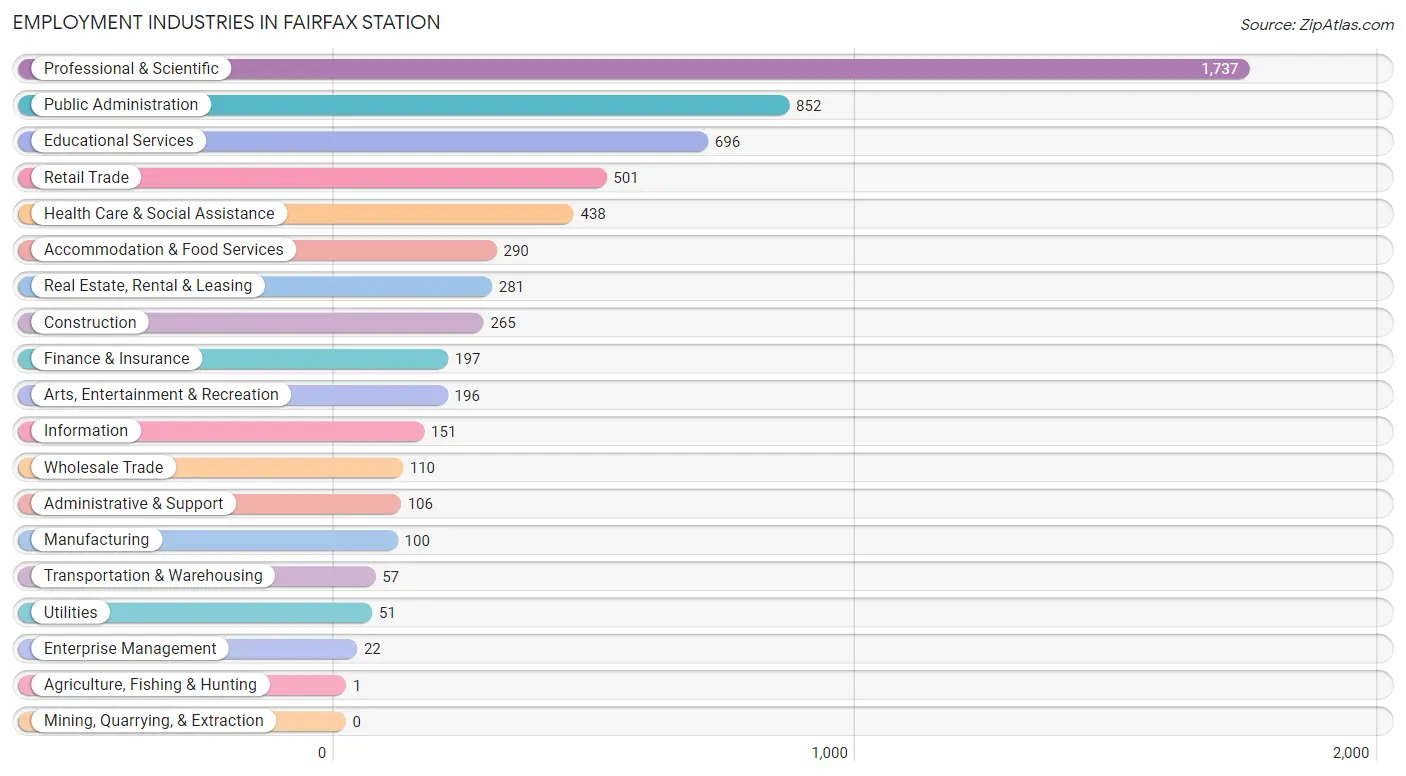
The major employment industries in Fairfax Station include Professional & Scientific (1,737 | 27.7%), Public Administration (852 | 13.6%), Educational Services (696 | 11.1%), Retail Trade (501 | 8.0%), and Health Care & Social Assistance (438 | 7.0%).
Employment Industries by Sex in Fairfax Station
The Fairfax Station industries that see more men than women are Agriculture, Fishing & Hunting (100.0%), Transportation & Warehousing (100.0%), and Construction (92.4%), whereas the industries that tend to have a higher number of women are Enterprise Management (100.0%), Health Care & Social Assistance (86.8%), and Arts, Entertainment & Recreation (76.5%).
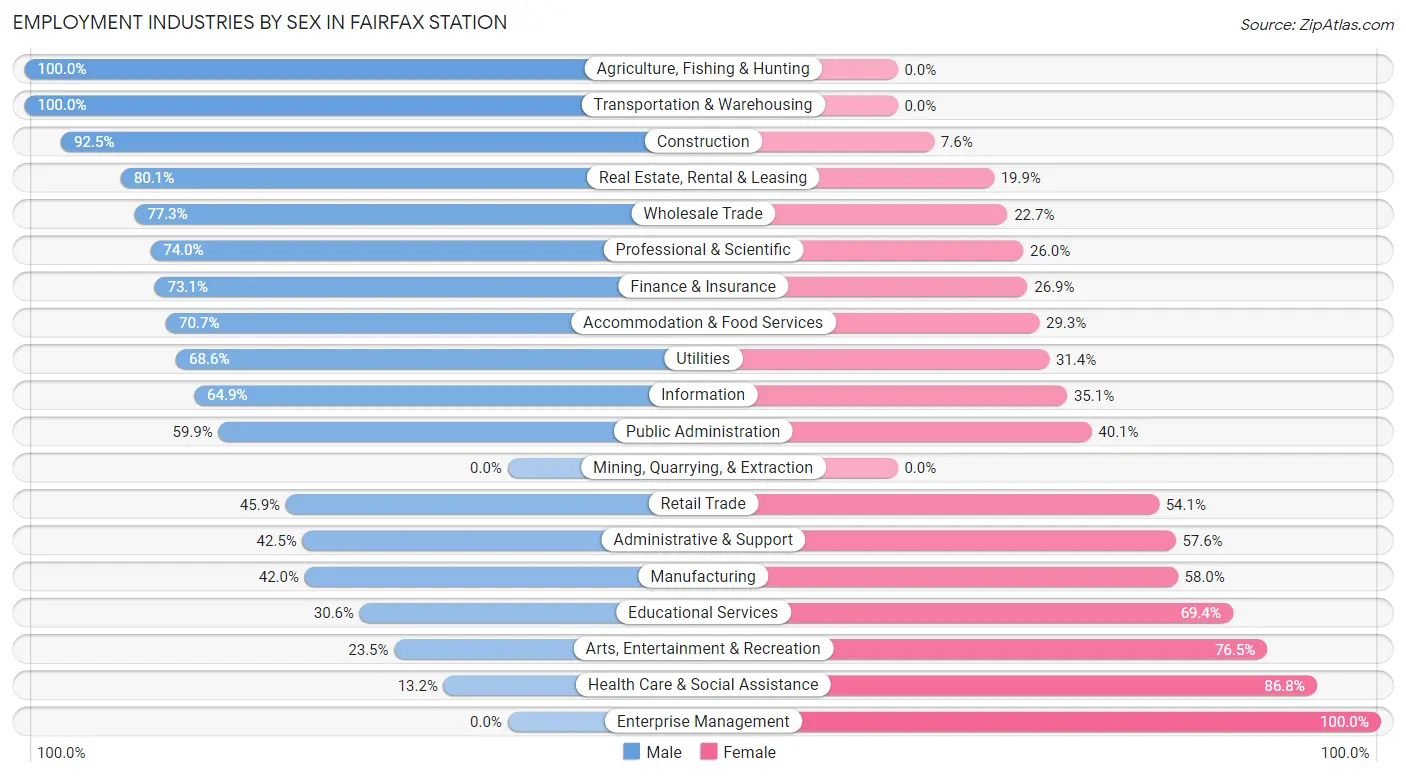
| Industry | Male | Female |
| Agriculture, Fishing & Hunting | 1 (100.0%) | 0 (0.0%) |
| Mining, Quarrying, & Extraction | 0 (0.0%) | 0 (0.0%) |
| Construction | 245 (92.4%) | 20 (7.5%) |
| Manufacturing | 42 (42.0%) | 58 (58.0%) |
| Wholesale Trade | 85 (77.3%) | 25 (22.7%) |
| Retail Trade | 230 (45.9%) | 271 (54.1%) |
| Transportation & Warehousing | 57 (100.0%) | 0 (0.0%) |
| Utilities | 35 (68.6%) | 16 (31.4%) |
| Information | 98 (64.9%) | 53 (35.1%) |
| Finance & Insurance | 144 (73.1%) | 53 (26.9%) |
| Real Estate, Rental & Leasing | 225 (80.1%) | 56 (19.9%) |
| Professional & Scientific | 1,285 (74.0%) | 452 (26.0%) |
| Enterprise Management | 0 (0.0%) | 22 (100.0%) |
| Administrative & Support | 45 (42.4%) | 61 (57.6%) |
| Educational Services | 213 (30.6%) | 483 (69.4%) |
| Health Care & Social Assistance | 58 (13.2%) | 380 (86.8%) |
| Arts, Entertainment & Recreation | 46 (23.5%) | 150 (76.5%) |
| Accommodation & Food Services | 205 (70.7%) | 85 (29.3%) |
| Public Administration | 510 (59.9%) | 342 (40.1%) |
| Total | 3,602 (57.4%) | 2,676 (42.6%) |
Education in Fairfax Station
School Enrollment in Fairfax Station
The most common levels of schooling among the 3,199 students in Fairfax Station are high school (803 | 25.1%), college / undergraduate (729 | 22.8%), and middle school (701 | 21.9%).
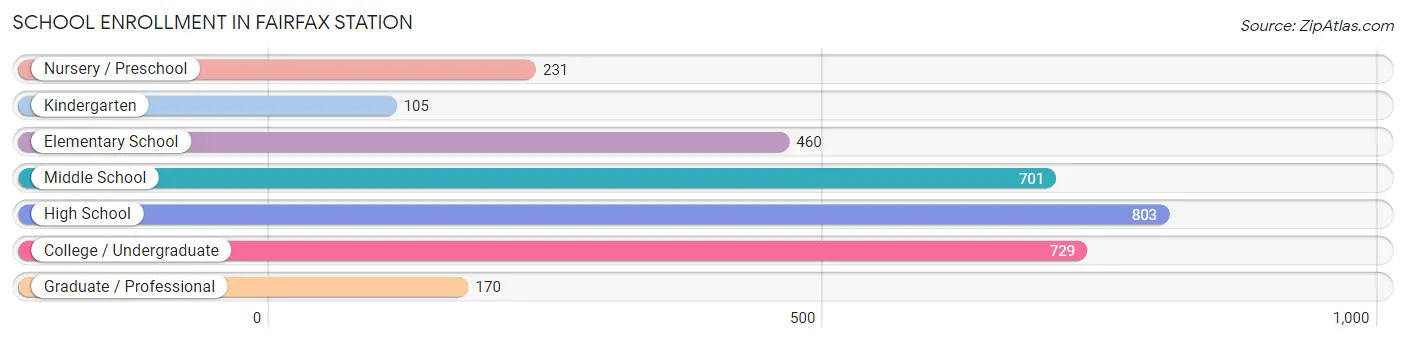
| School Level | # Students | % Students |
| Nursery / Preschool | 231 | 7.2% |
| Kindergarten | 105 | 3.3% |
| Elementary School | 460 | 14.4% |
| Middle School | 701 | 21.9% |
| High School | 803 | 25.1% |
| College / Undergraduate | 729 | 22.8% |
| Graduate / Professional | 170 | 5.3% |
| Total | 3,199 | 100.0% |
School Enrollment by Age by Funding Source in Fairfax Station
Out of a total of 3,199 students who are enrolled in schools in Fairfax Station, 560 (17.5%) attend a private institution, while the remaining 2,639 (82.5%) are enrolled in public schools. The age group of 3 to 4 year olds has the highest likelihood of being enrolled in private schools, with 121 (89.6% in the age bracket) enrolled. Conversely, the age group of 20 to 24 year olds has the lowest likelihood of being enrolled in a private school, with 437 (96.5% in the age bracket) attending a public institution.
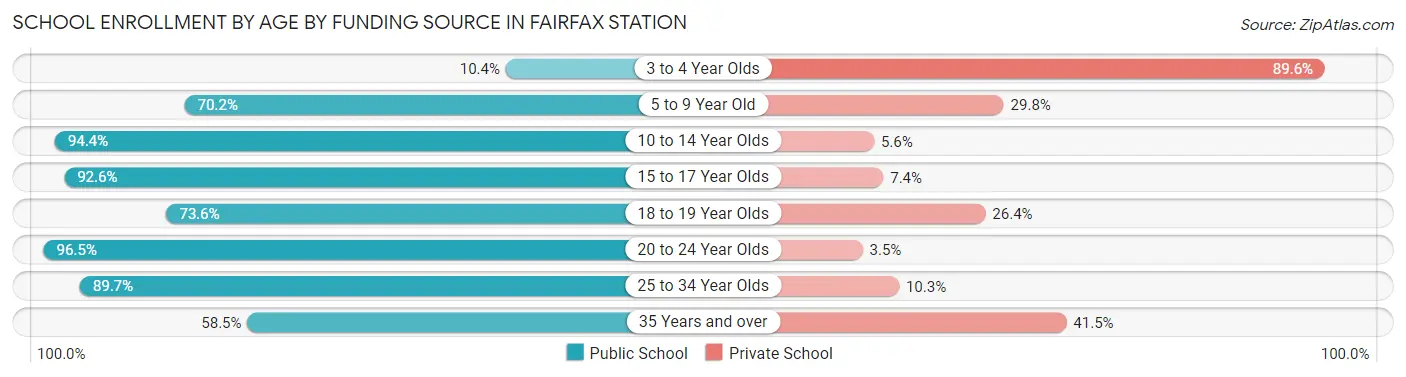
| Age Bracket | Public School | Private School |
| 3 to 4 Year Olds | 14 (10.4%) | 121 (89.6%) |
| 5 to 9 Year Old | 431 (70.2%) | 183 (29.8%) |
| 10 to 14 Year Olds | 803 (94.4%) | 48 (5.6%) |
| 15 to 17 Year Olds | 552 (92.6%) | 44 (7.4%) |
| 18 to 19 Year Olds | 145 (73.6%) | 52 (26.4%) |
| 20 to 24 Year Olds | 437 (96.5%) | 16 (3.5%) |
| 25 to 34 Year Olds | 148 (89.7%) | 17 (10.3%) |
| 35 Years and over | 110 (58.5%) | 78 (41.5%) |
| Total | 2,639 (82.5%) | 560 (17.5%) |
Educational Attainment by Field of Study in Fairfax Station
Business (1,160 | 16.5%), engineering (990 | 14.1%), social sciences (810 | 11.5%), education (612 | 8.7%), and science & technology (484 | 6.9%) are the most common fields of study among 7,044 individuals in Fairfax Station who have obtained a bachelor's degree or higher.
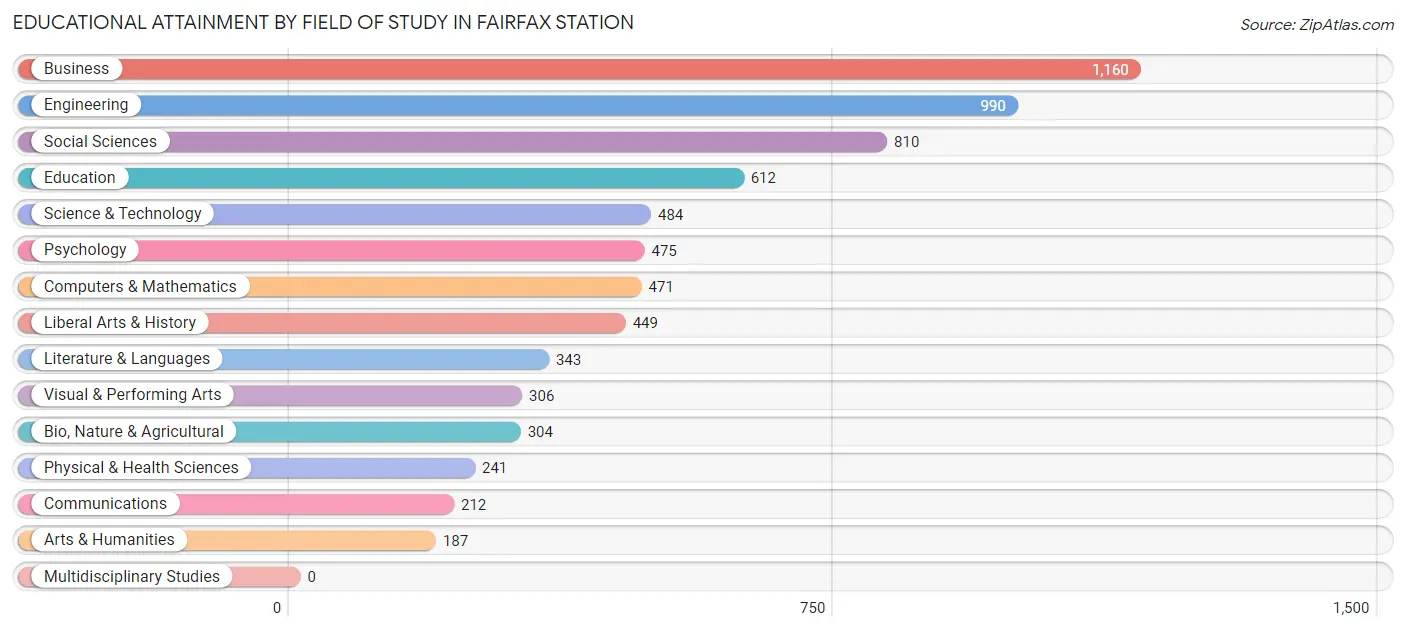
| Field of Study | # Graduates | % Graduates |
| Computers & Mathematics | 471 | 6.7% |
| Bio, Nature & Agricultural | 304 | 4.3% |
| Physical & Health Sciences | 241 | 3.4% |
| Psychology | 475 | 6.7% |
| Social Sciences | 810 | 11.5% |
| Engineering | 990 | 14.1% |
| Multidisciplinary Studies | 0 | 0.0% |
| Science & Technology | 484 | 6.9% |
| Business | 1,160 | 16.5% |
| Education | 612 | 8.7% |
| Literature & Languages | 343 | 4.9% |
| Liberal Arts & History | 449 | 6.4% |
| Visual & Performing Arts | 306 | 4.3% |
| Communications | 212 | 3.0% |
| Arts & Humanities | 187 | 2.6% |
| Total | 7,044 | 100.0% |
Transportation & Commute in Fairfax Station
Vehicle Availability by Sex in Fairfax Station
The most prevalent vehicle ownership categories in Fairfax Station are males with 2 vehicles (1,335, accounting for 37.8%) and females with 2 vehicles (903, making up 50.4%).
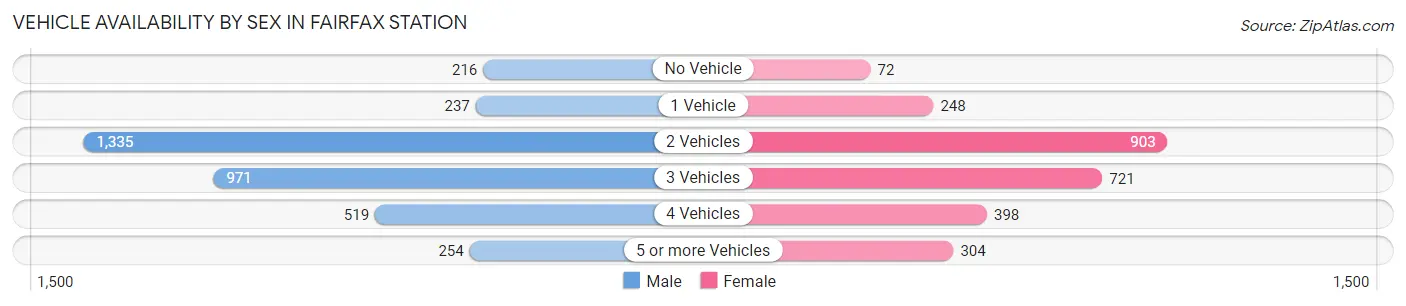
| Vehicles Available | Male | Female |
| No Vehicle | 216 (6.1%) | 72 (2.7%) |
| 1 Vehicle | 237 (6.7%) | 248 (9.4%) |
| 2 Vehicles | 1,335 (37.8%) | 903 (34.1%) |
| 3 Vehicles | 971 (27.5%) | 721 (27.3%) |
| 4 Vehicles | 519 (14.7%) | 398 (15.0%) |
| 5 or more Vehicles | 254 (7.2%) | 304 (11.5%) |
| Total | 3,532 (100.0%) | 2,646 (100.0%) |
Commute Time in Fairfax Station
The most frequently occuring commute durations in Fairfax Station are 20 to 24 minutes (646 commuters, 13.9%), 30 to 34 minutes (628 commuters, 13.5%), and 45 to 59 minutes (576 commuters, 12.4%).
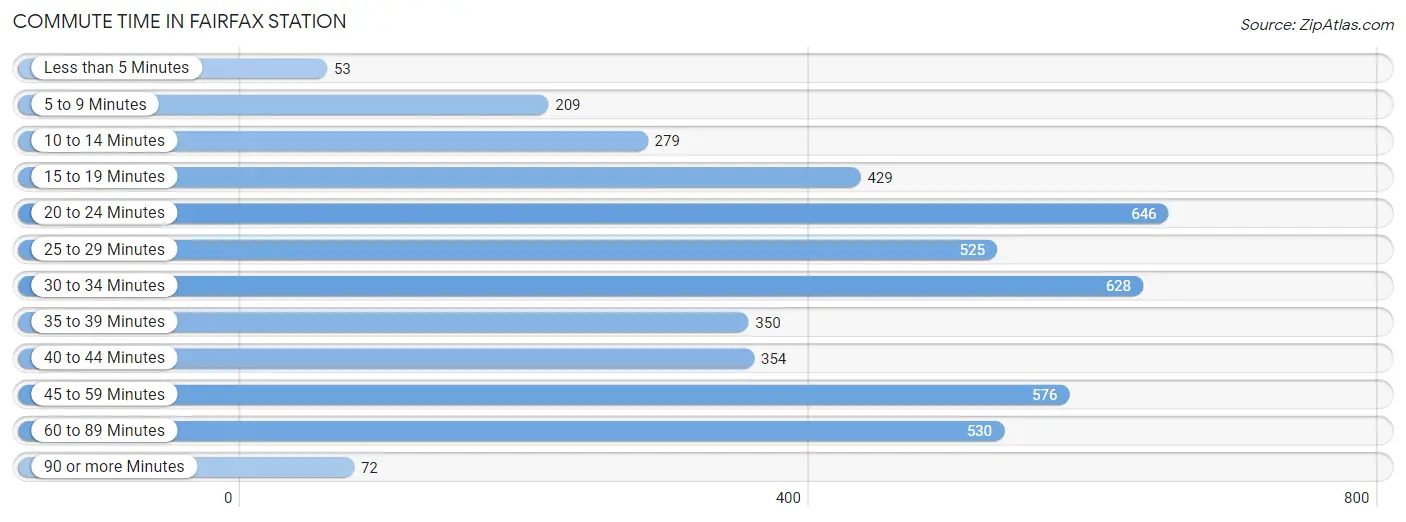
| Commute Time | # Commuters | % Commuters |
| Less than 5 Minutes | 53 | 1.1% |
| 5 to 9 Minutes | 209 | 4.5% |
| 10 to 14 Minutes | 279 | 6.0% |
| 15 to 19 Minutes | 429 | 9.2% |
| 20 to 24 Minutes | 646 | 13.9% |
| 25 to 29 Minutes | 525 | 11.3% |
| 30 to 34 Minutes | 628 | 13.5% |
| 35 to 39 Minutes | 350 | 7.5% |
| 40 to 44 Minutes | 354 | 7.6% |
| 45 to 59 Minutes | 576 | 12.4% |
| 60 to 89 Minutes | 530 | 11.4% |
| 90 or more Minutes | 72 | 1.5% |
Commute Time by Sex in Fairfax Station
The most common commute times in Fairfax Station are 30 to 34 minutes (417 commuters, 16.4%) for males and 20 to 24 minutes (299 commuters, 14.2%) for females.
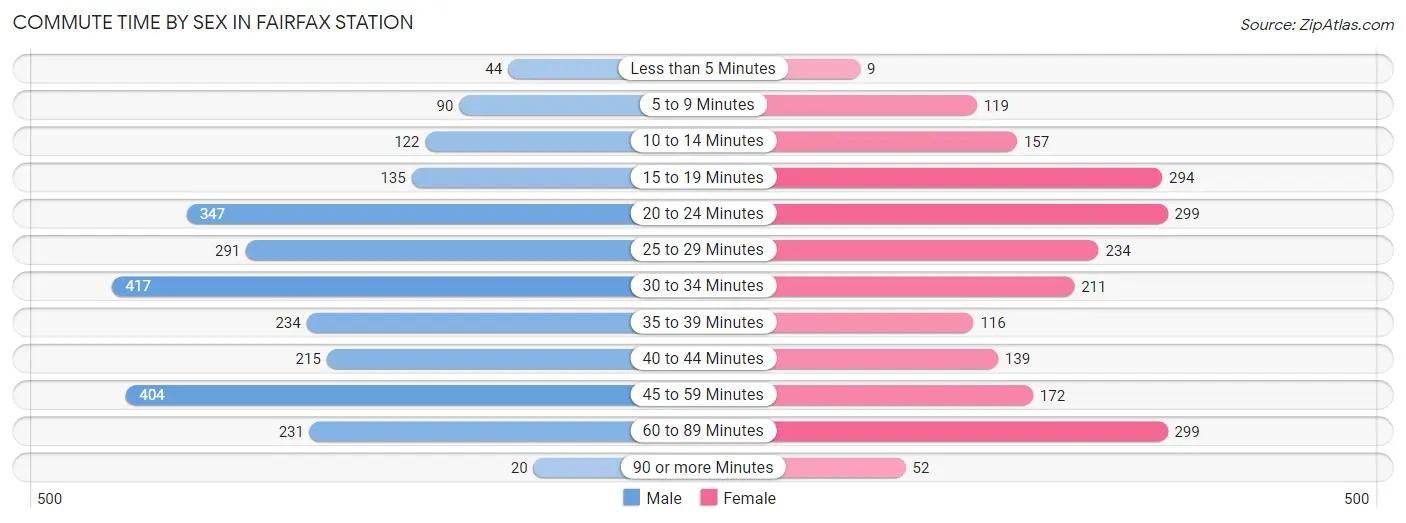
| Commute Time | Male | Female |
| Less than 5 Minutes | 44 (1.7%) | 9 (0.4%) |
| 5 to 9 Minutes | 90 (3.5%) | 119 (5.7%) |
| 10 to 14 Minutes | 122 (4.8%) | 157 (7.5%) |
| 15 to 19 Minutes | 135 (5.3%) | 294 (14.0%) |
| 20 to 24 Minutes | 347 (13.6%) | 299 (14.2%) |
| 25 to 29 Minutes | 291 (11.4%) | 234 (11.1%) |
| 30 to 34 Minutes | 417 (16.4%) | 211 (10.0%) |
| 35 to 39 Minutes | 234 (9.2%) | 116 (5.5%) |
| 40 to 44 Minutes | 215 (8.4%) | 139 (6.6%) |
| 45 to 59 Minutes | 404 (15.8%) | 172 (8.2%) |
| 60 to 89 Minutes | 231 (9.1%) | 299 (14.2%) |
| 90 or more Minutes | 20 (0.8%) | 52 (2.5%) |
Time of Departure to Work by Sex in Fairfax Station
The most frequent times of departure to work in Fairfax Station are 8:00 AM to 8:29 AM (357, 14.0%) for males and 7:30 AM to 7:59 AM (349, 16.6%) for females.
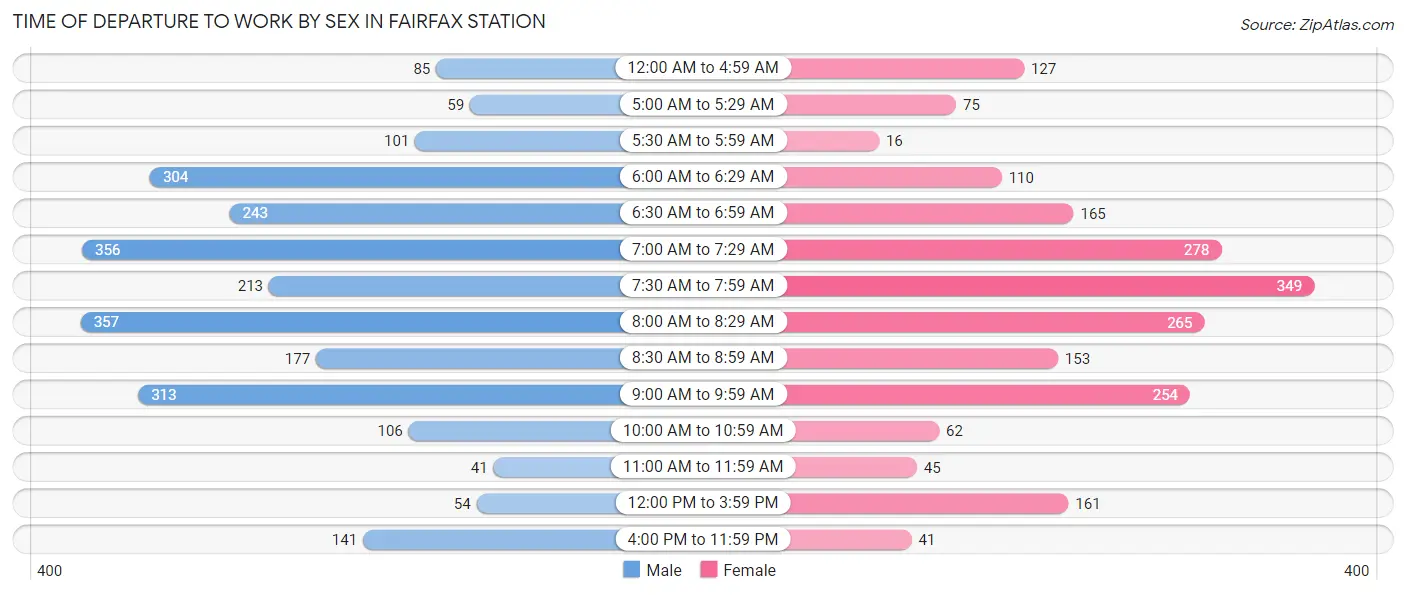
| Time of Departure | Male | Female |
| 12:00 AM to 4:59 AM | 85 (3.3%) | 127 (6.0%) |
| 5:00 AM to 5:29 AM | 59 (2.3%) | 75 (3.6%) |
| 5:30 AM to 5:59 AM | 101 (4.0%) | 16 (0.8%) |
| 6:00 AM to 6:29 AM | 304 (11.9%) | 110 (5.2%) |
| 6:30 AM to 6:59 AM | 243 (9.5%) | 165 (7.9%) |
| 7:00 AM to 7:29 AM | 356 (14.0%) | 278 (13.2%) |
| 7:30 AM to 7:59 AM | 213 (8.4%) | 349 (16.6%) |
| 8:00 AM to 8:29 AM | 357 (14.0%) | 265 (12.6%) |
| 8:30 AM to 8:59 AM | 177 (6.9%) | 153 (7.3%) |
| 9:00 AM to 9:59 AM | 313 (12.3%) | 254 (12.1%) |
| 10:00 AM to 10:59 AM | 106 (4.2%) | 62 (2.9%) |
| 11:00 AM to 11:59 AM | 41 (1.6%) | 45 (2.1%) |
| 12:00 PM to 3:59 PM | 54 (2.1%) | 161 (7.7%) |
| 4:00 PM to 11:59 PM | 141 (5.5%) | 41 (1.9%) |
| Total | 2,550 (100.0%) | 2,101 (100.0%) |
Housing Occupancy in Fairfax Station
Occupancy by Ownership in Fairfax Station
Of the total 4,158 dwellings in Fairfax Station, owner-occupied units account for 3,930 (94.5%), while renter-occupied units make up 228 (5.5%).
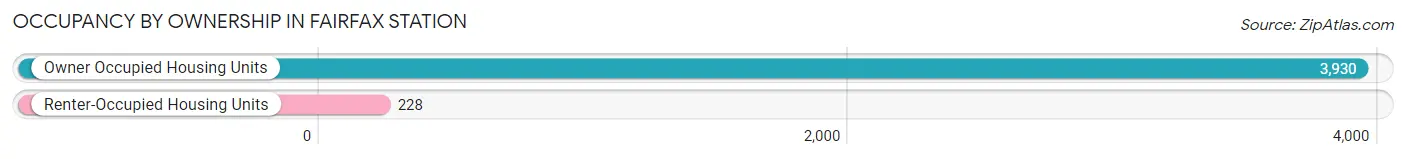
| Occupancy | # Housing Units | % Housing Units |
| Owner Occupied Housing Units | 3,930 | 94.5% |
| Renter-Occupied Housing Units | 228 | 5.5% |
| Total Occupied Housing Units | 4,158 | 100.0% |
Occupancy by Household Size in Fairfax Station
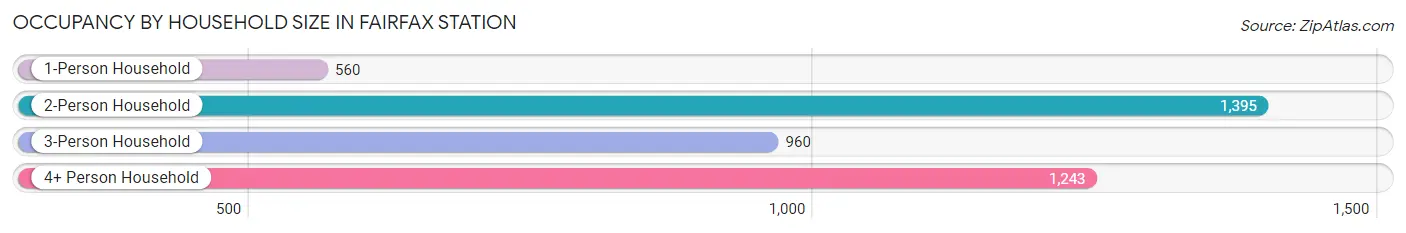
| Household Size | # Housing Units | % Housing Units |
| 1-Person Household | 560 | 13.5% |
| 2-Person Household | 1,395 | 33.6% |
| 3-Person Household | 960 | 23.1% |
| 4+ Person Household | 1,243 | 29.9% |
| Total Housing Units | 4,158 | 100.0% |
Occupancy by Ownership by Household Size in Fairfax Station
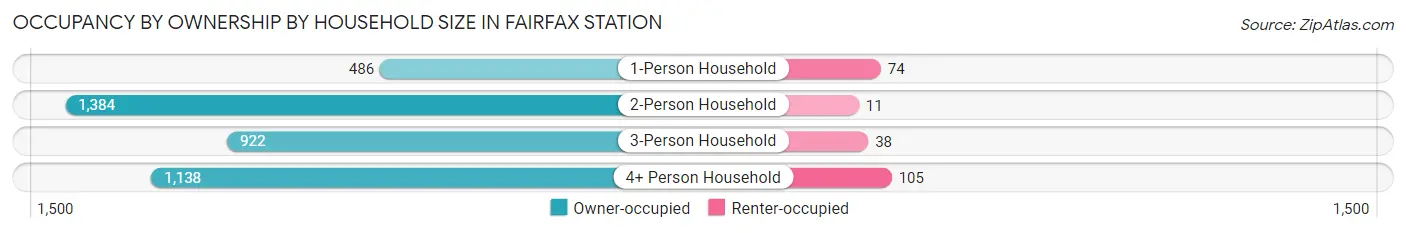
| Household Size | Owner-occupied | Renter-occupied |
| 1-Person Household | 486 (86.8%) | 74 (13.2%) |
| 2-Person Household | 1,384 (99.2%) | 11 (0.8%) |
| 3-Person Household | 922 (96.0%) | 38 (4.0%) |
| 4+ Person Household | 1,138 (91.5%) | 105 (8.5%) |
| Total Housing Units | 3,930 (94.5%) | 228 (5.5%) |
Occupancy by Educational Attainment in Fairfax Station
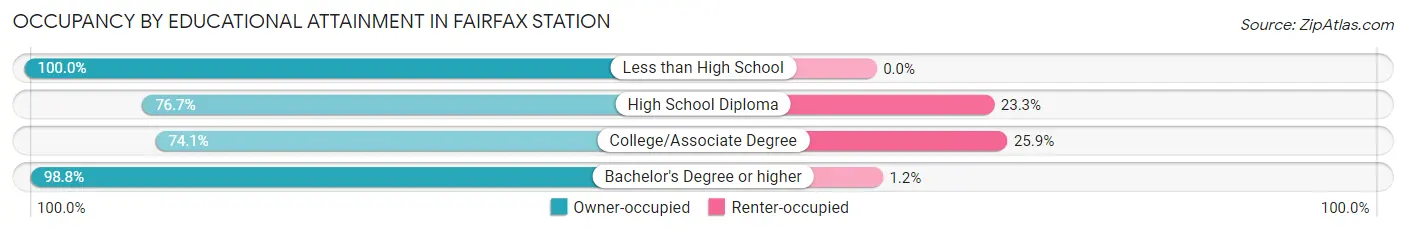
| Household Size | Owner-occupied | Renter-occupied |
| Less than High School | 38 (100.0%) | 0 (0.0%) |
| High School Diploma | 69 (76.7%) | 21 (23.3%) |
| College/Associate Degree | 471 (74.1%) | 165 (25.9%) |
| Bachelor's Degree or higher | 3,352 (98.8%) | 42 (1.2%) |
Occupancy by Age of Householder in Fairfax Station
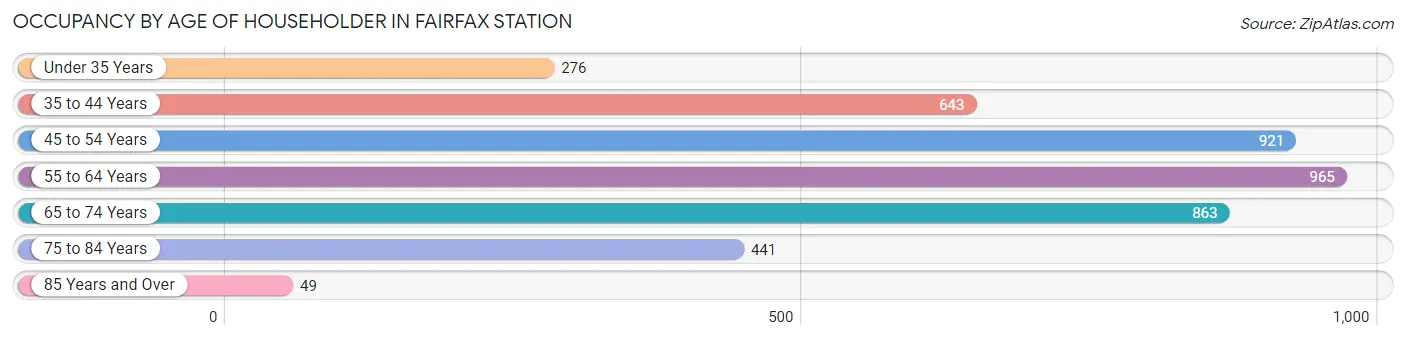
| Age Bracket | # Households | % Households |
| Under 35 Years | 276 | 6.6% |
| 35 to 44 Years | 643 | 15.5% |
| 45 to 54 Years | 921 | 22.2% |
| 55 to 64 Years | 965 | 23.2% |
| 65 to 74 Years | 863 | 20.8% |
| 75 to 84 Years | 441 | 10.6% |
| 85 Years and Over | 49 | 1.2% |
| Total | 4,158 | 100.0% |
Housing Finances in Fairfax Station
Median Income by Occupancy in Fairfax Station
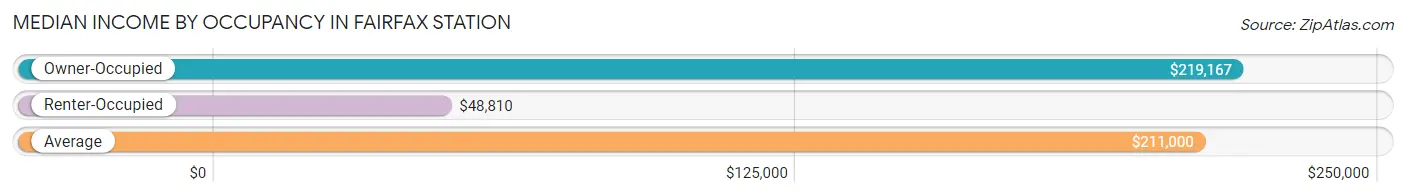
| Occupancy Type | # Households | Median Income |
| Owner-Occupied | 3,930 (94.5%) | $219,167 |
| Renter-Occupied | 228 (5.5%) | $48,810 |
| Average | 4,158 (100.0%) | $211,000 |
Occupancy by Householder Income Bracket in Fairfax Station
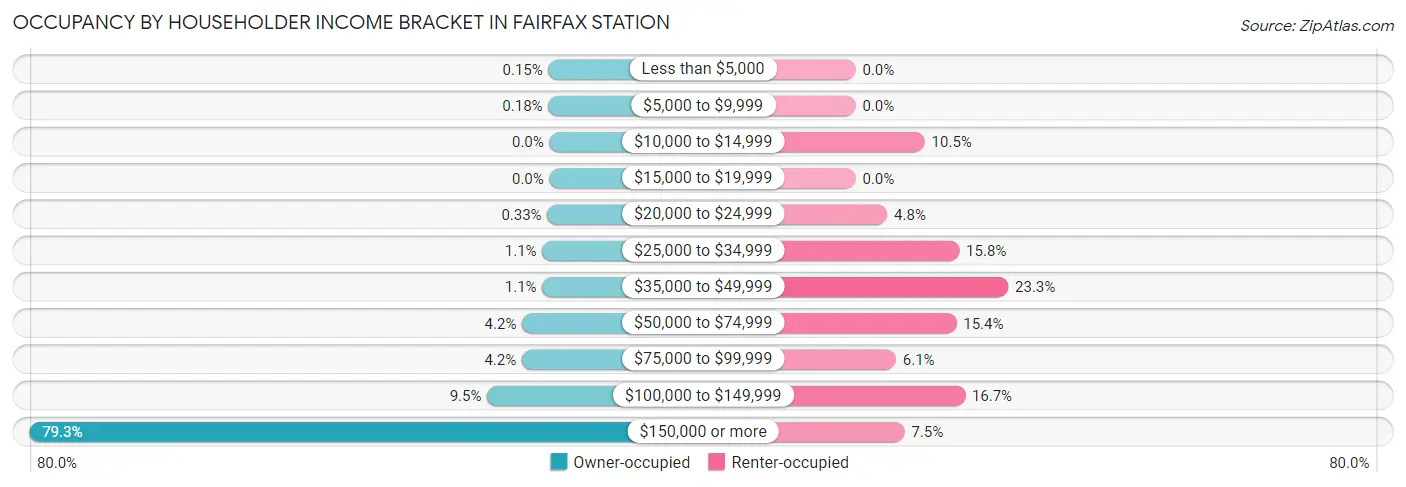
| Income Bracket | Owner-occupied | Renter-occupied |
| Less than $5,000 | 6 (0.2%) | 0 (0.0%) |
| $5,000 to $9,999 | 7 (0.2%) | 0 (0.0%) |
| $10,000 to $14,999 | 0 (0.0%) | 24 (10.5%) |
| $15,000 to $19,999 | 0 (0.0%) | 0 (0.0%) |
| $20,000 to $24,999 | 13 (0.3%) | 11 (4.8%) |
| $25,000 to $34,999 | 43 (1.1%) | 36 (15.8%) |
| $35,000 to $49,999 | 43 (1.1%) | 53 (23.3%) |
| $50,000 to $74,999 | 164 (4.2%) | 35 (15.3%) |
| $75,000 to $99,999 | 165 (4.2%) | 14 (6.1%) |
| $100,000 to $149,999 | 373 (9.5%) | 38 (16.7%) |
| $150,000 or more | 3,116 (79.3%) | 17 (7.5%) |
| Total | 3,930 (100.0%) | 228 (100.0%) |
Monthly Housing Cost Tiers in Fairfax Station
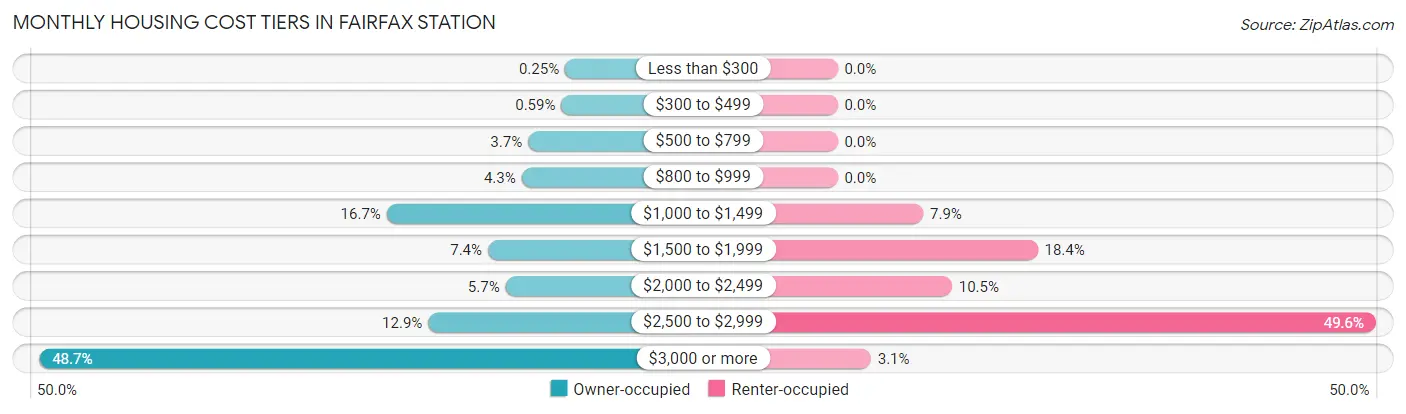
| Monthly Cost | Owner-occupied | Renter-occupied |
| Less than $300 | 10 (0.3%) | 0 (0.0%) |
| $300 to $499 | 23 (0.6%) | 0 (0.0%) |
| $500 to $799 | 144 (3.7%) | 0 (0.0%) |
| $800 to $999 | 167 (4.3%) | 0 (0.0%) |
| $1,000 to $1,499 | 655 (16.7%) | 18 (7.9%) |
| $1,500 to $1,999 | 289 (7.3%) | 42 (18.4%) |
| $2,000 to $2,499 | 225 (5.7%) | 24 (10.5%) |
| $2,500 to $2,999 | 505 (12.9%) | 113 (49.6%) |
| $3,000 or more | 1,912 (48.6%) | 7 (3.1%) |
| Total | 3,930 (100.0%) | 228 (100.0%) |
Physical Housing Characteristics in Fairfax Station
Housing Structures in Fairfax Station
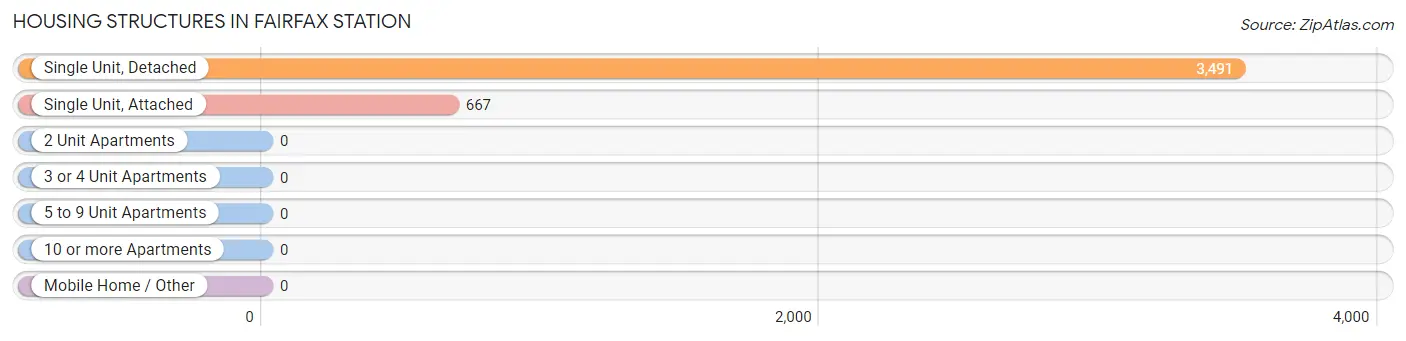
| Structure Type | # Housing Units | % Housing Units |
| Single Unit, Detached | 3,491 | 84.0% |
| Single Unit, Attached | 667 | 16.0% |
| 2 Unit Apartments | 0 | 0.0% |
| 3 or 4 Unit Apartments | 0 | 0.0% |
| 5 to 9 Unit Apartments | 0 | 0.0% |
| 10 or more Apartments | 0 | 0.0% |
| Mobile Home / Other | 0 | 0.0% |
| Total | 4,158 | 100.0% |
Housing Structures by Occupancy in Fairfax Station
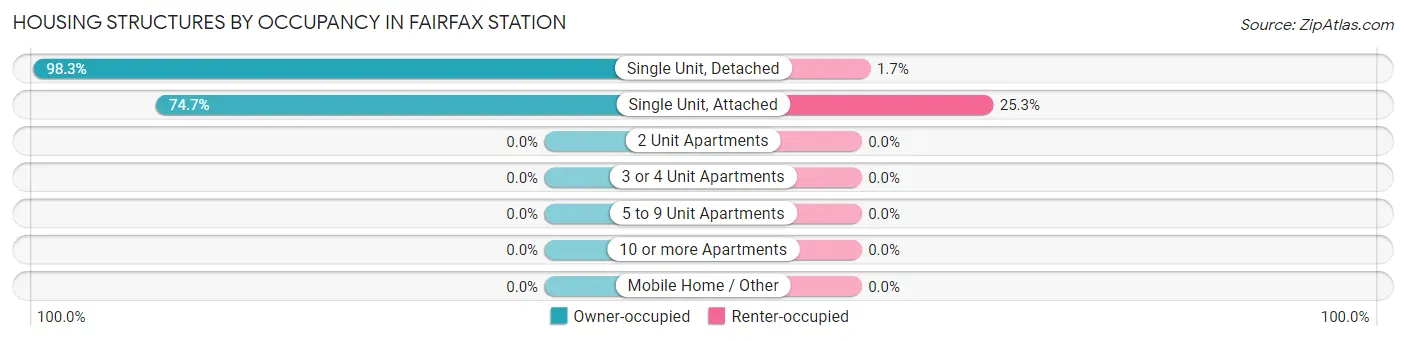
| Structure Type | Owner-occupied | Renter-occupied |
| Single Unit, Detached | 3,432 (98.3%) | 59 (1.7%) |
| Single Unit, Attached | 498 (74.7%) | 169 (25.3%) |
| 2 Unit Apartments | 0 (0.0%) | 0 (0.0%) |
| 3 or 4 Unit Apartments | 0 (0.0%) | 0 (0.0%) |
| 5 to 9 Unit Apartments | 0 (0.0%) | 0 (0.0%) |
| 10 or more Apartments | 0 (0.0%) | 0 (0.0%) |
| Mobile Home / Other | 0 (0.0%) | 0 (0.0%) |
| Total | 3,930 (94.5%) | 228 (5.5%) |
Housing Structures by Number of Rooms in Fairfax Station
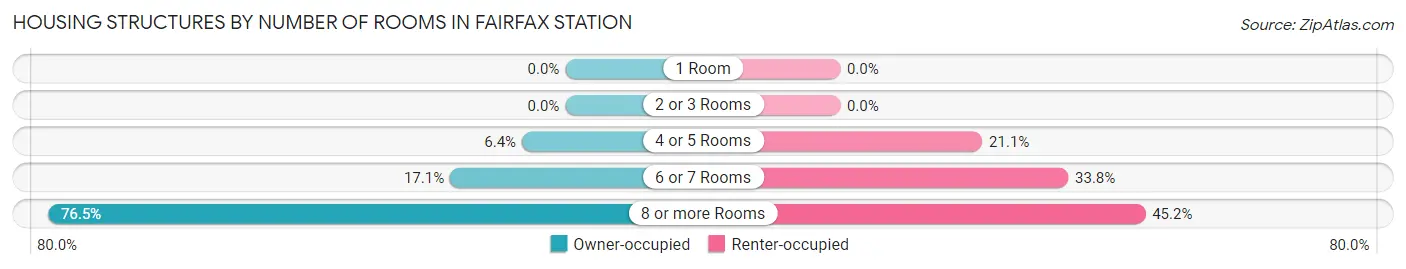
| Number of Rooms | Owner-occupied | Renter-occupied |
| 1 Room | 0 (0.0%) | 0 (0.0%) |
| 2 or 3 Rooms | 0 (0.0%) | 0 (0.0%) |
| 4 or 5 Rooms | 252 (6.4%) | 48 (21.0%) |
| 6 or 7 Rooms | 670 (17.1%) | 77 (33.8%) |
| 8 or more Rooms | 3,008 (76.5%) | 103 (45.2%) |
| Total | 3,930 (100.0%) | 228 (100.0%) |
Housing Structure by Heating Type in Fairfax Station
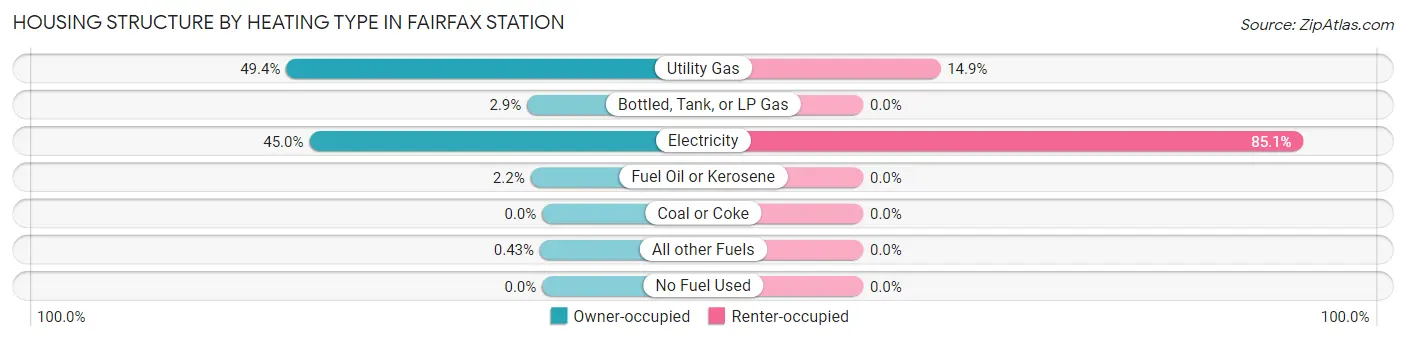
| Heating Type | Owner-occupied | Renter-occupied |
| Utility Gas | 1,943 (49.4%) | 34 (14.9%) |
| Bottled, Tank, or LP Gas | 114 (2.9%) | 0 (0.0%) |
| Electricity | 1,768 (45.0%) | 194 (85.1%) |
| Fuel Oil or Kerosene | 88 (2.2%) | 0 (0.0%) |
| Coal or Coke | 0 (0.0%) | 0 (0.0%) |
| All other Fuels | 17 (0.4%) | 0 (0.0%) |
| No Fuel Used | 0 (0.0%) | 0 (0.0%) |
| Total | 3,930 (100.0%) | 228 (100.0%) |
Household Vehicle Usage in Fairfax Station
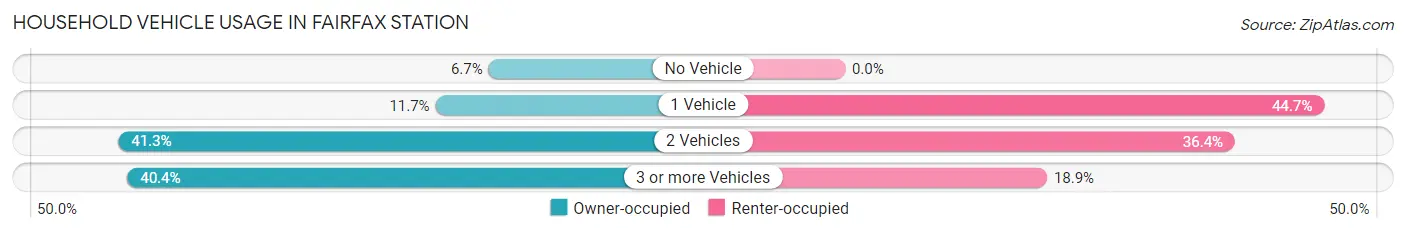
| Vehicles per Household | Owner-occupied | Renter-occupied |
| No Vehicle | 263 (6.7%) | 0 (0.0%) |
| 1 Vehicle | 458 (11.7%) | 102 (44.7%) |
| 2 Vehicles | 1,621 (41.2%) | 83 (36.4%) |
| 3 or more Vehicles | 1,588 (40.4%) | 43 (18.9%) |
| Total | 3,930 (100.0%) | 228 (100.0%) |
Real Estate & Mortgages in Fairfax Station
Real Estate and Mortgage Overview in Fairfax Station
| Characteristic | Without Mortgage | With Mortgage |
| Housing Units | 1,066 | 2,864 |
| Median Property Value | $863,900 | $798,000 |
| Median Household Income | $202,500 | $2,329 |
| Monthly Housing Costs | $1,134 | $1,912 |
| Real Estate Taxes | $8,802 | $74 |
Property Value by Mortgage Status in Fairfax Station
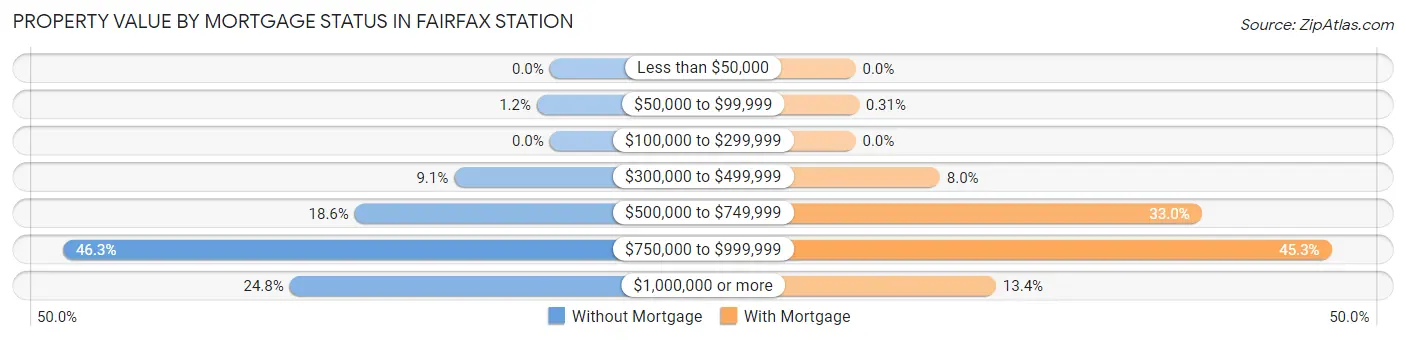
| Property Value | Without Mortgage | With Mortgage |
| Less than $50,000 | 0 (0.0%) | 0 (0.0%) |
| $50,000 to $99,999 | 13 (1.2%) | 9 (0.3%) |
| $100,000 to $299,999 | 0 (0.0%) | 0 (0.0%) |
| $300,000 to $499,999 | 97 (9.1%) | 230 (8.0%) |
| $500,000 to $749,999 | 198 (18.6%) | 944 (33.0%) |
| $750,000 to $999,999 | 494 (46.3%) | 1,298 (45.3%) |
| $1,000,000 or more | 264 (24.8%) | 383 (13.4%) |
| Total | 1,066 (100.0%) | 2,864 (100.0%) |
Household Income by Mortgage Status in Fairfax Station
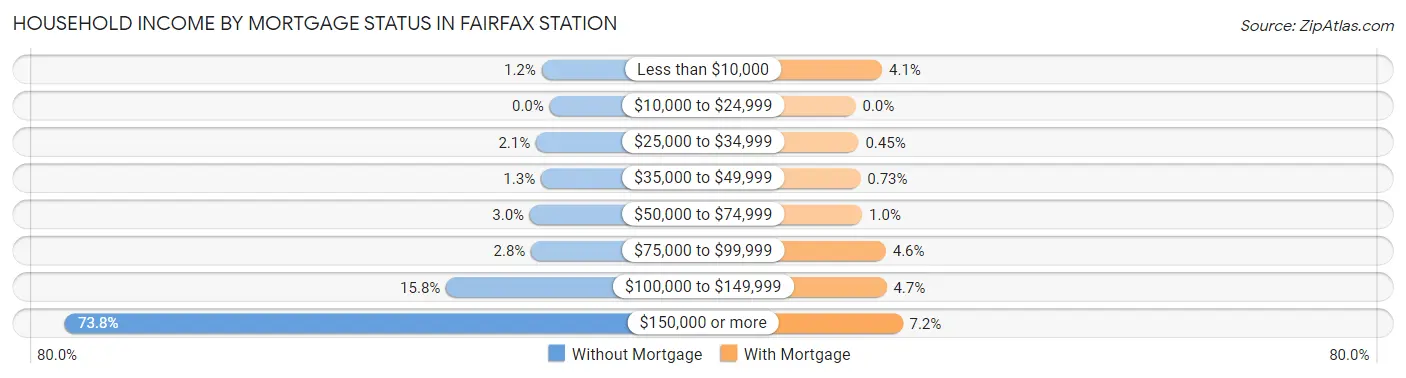
| Household Income | Without Mortgage | With Mortgage |
| Less than $10,000 | 13 (1.2%) | 116 (4.1%) |
| $10,000 to $24,999 | 0 (0.0%) | 0 (0.0%) |
| $25,000 to $34,999 | 22 (2.1%) | 13 (0.4%) |
| $35,000 to $49,999 | 14 (1.3%) | 21 (0.7%) |
| $50,000 to $74,999 | 32 (3.0%) | 29 (1.0%) |
| $75,000 to $99,999 | 30 (2.8%) | 132 (4.6%) |
| $100,000 to $149,999 | 168 (15.8%) | 135 (4.7%) |
| $150,000 or more | 787 (73.8%) | 205 (7.2%) |
| Total | 1,066 (100.0%) | 2,864 (100.0%) |
Property Value to Household Income Ratio in Fairfax Station
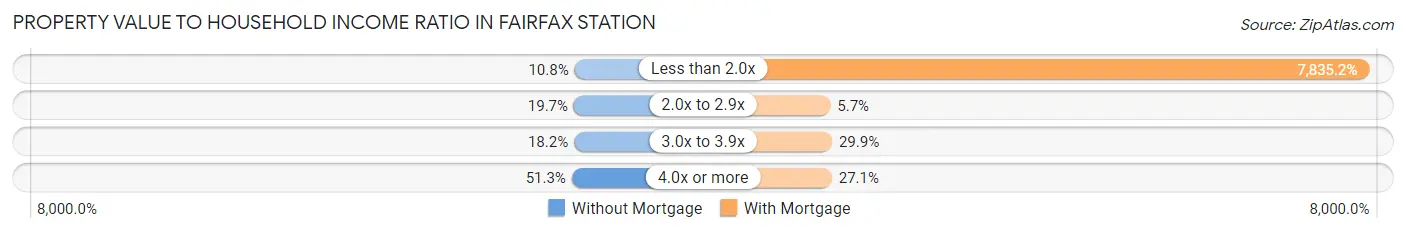
| Value-to-Income Ratio | Without Mortgage | With Mortgage |
| Less than 2.0x | 115 (10.8%) | 224,400 (7,835.2%) |
| 2.0x to 2.9x | 210 (19.7%) | 163 (5.7%) |
| 3.0x to 3.9x | 194 (18.2%) | 857 (29.9%) |
| 4.0x or more | 547 (51.3%) | 776 (27.1%) |
| Total | 1,066 (100.0%) | 2,864 (100.0%) |
Real Estate Taxes by Mortgage Status in Fairfax Station
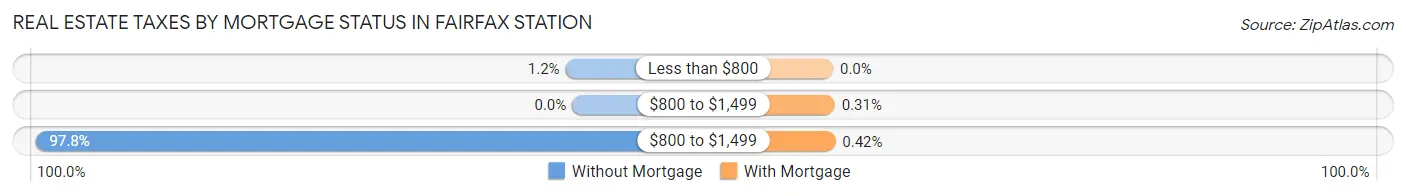
| Property Taxes | Without Mortgage | With Mortgage |
| Less than $800 | 13 (1.2%) | 0 (0.0%) |
| $800 to $1,499 | 0 (0.0%) | 9 (0.3%) |
| $800 to $1,499 | 1,043 (97.8%) | 12 (0.4%) |
| Total | 1,066 (100.0%) | 2,864 (100.0%) |
Health & Disability in Fairfax Station
Health Insurance Coverage by Age in Fairfax Station
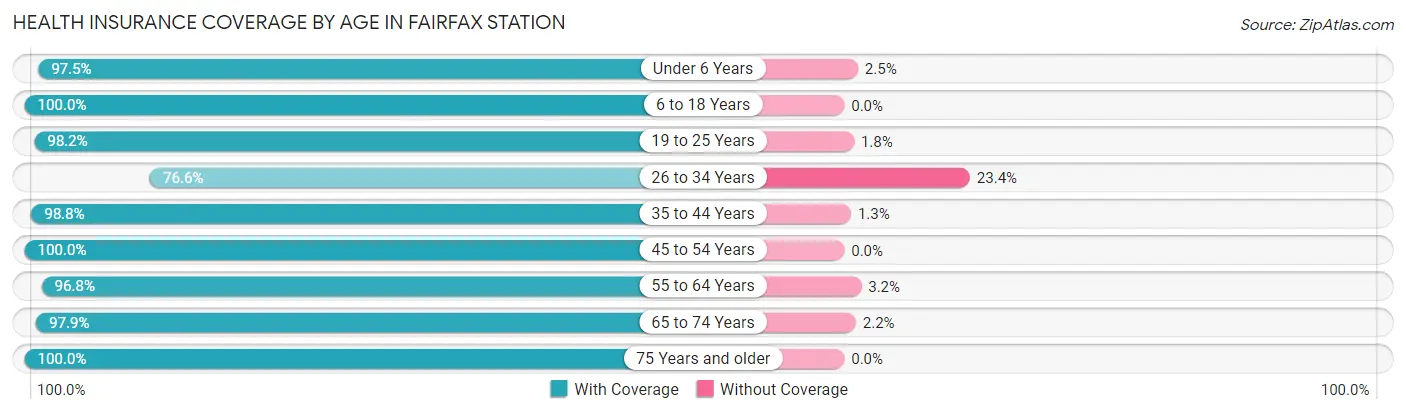
| Age Bracket | With Coverage | Without Coverage |
| Under 6 Years | 691 (97.5%) | 18 (2.5%) |
| 6 to 18 Years | 2,109 (100.0%) | 0 (0.0%) |
| 19 to 25 Years | 923 (98.2%) | 17 (1.8%) |
| 26 to 34 Years | 814 (76.6%) | 249 (23.4%) |
| 35 to 44 Years | 1,341 (98.8%) | 17 (1.3%) |
| 45 to 54 Years | 1,759 (100.0%) | 0 (0.0%) |
| 55 to 64 Years | 1,895 (96.8%) | 62 (3.2%) |
| 65 to 74 Years | 1,501 (97.9%) | 33 (2.1%) |
| 75 Years and older | 751 (100.0%) | 0 (0.0%) |
| Total | 11,784 (96.8%) | 396 (3.3%) |
Health Insurance Coverage by Citizenship Status in Fairfax Station
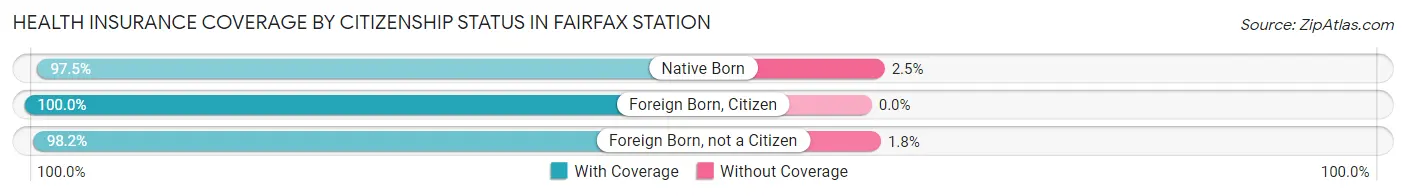
| Citizenship Status | With Coverage | Without Coverage |
| Native Born | 691 (97.5%) | 18 (2.5%) |
| Foreign Born, Citizen | 2,109 (100.0%) | 0 (0.0%) |
| Foreign Born, not a Citizen | 923 (98.2%) | 17 (1.8%) |
Health Insurance Coverage by Household Income in Fairfax Station
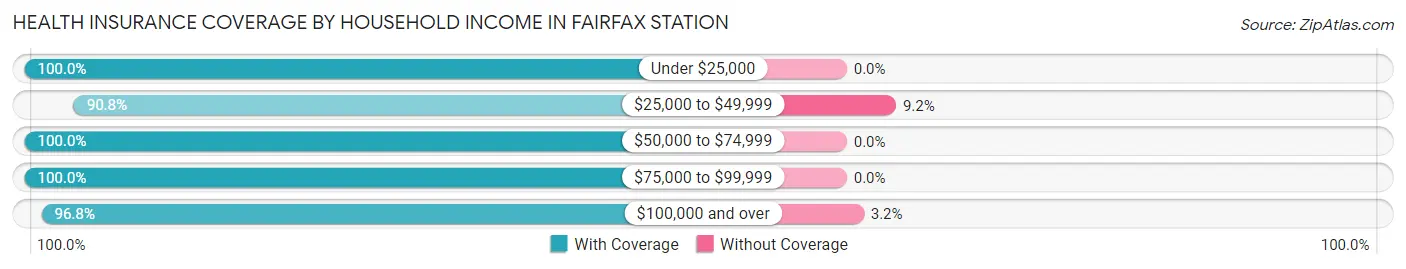
| Household Income | With Coverage | Without Coverage |
| Under $25,000 | 110 (100.0%) | 0 (0.0%) |
| $25,000 to $49,999 | 502 (90.8%) | 51 (9.2%) |
| $50,000 to $74,999 | 280 (100.0%) | 0 (0.0%) |
| $75,000 to $99,999 | 436 (100.0%) | 0 (0.0%) |
| $100,000 and over | 10,450 (96.8%) | 343 (3.2%) |
Public vs Private Health Insurance Coverage by Age in Fairfax Station
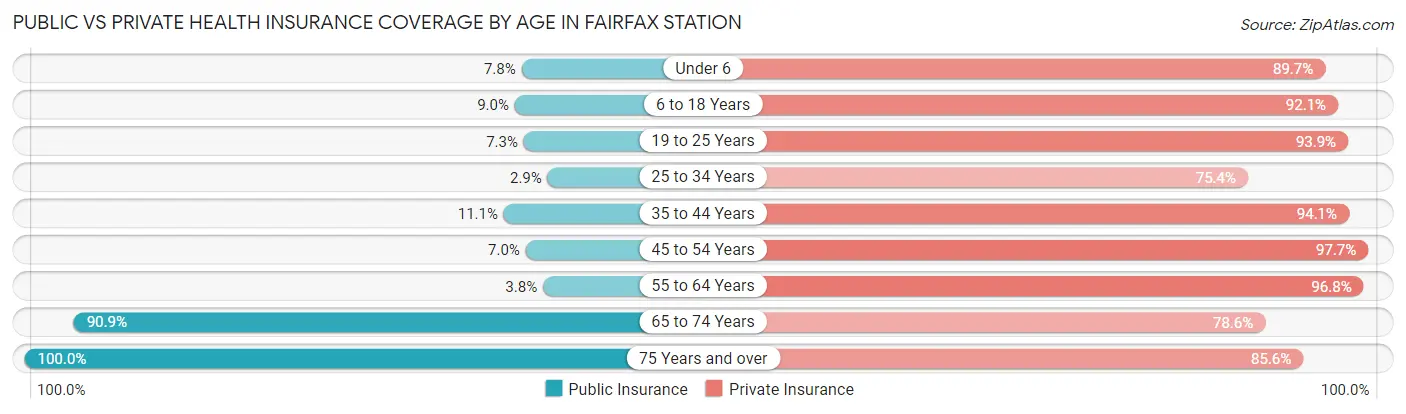
| Age Bracket | Public Insurance | Private Insurance |
| Under 6 | 55 (7.8%) | 636 (89.7%) |
| 6 to 18 Years | 190 (9.0%) | 1,942 (92.1%) |
| 19 to 25 Years | 69 (7.3%) | 883 (93.9%) |
| 25 to 34 Years | 31 (2.9%) | 801 (75.3%) |
| 35 to 44 Years | 150 (11.1%) | 1,278 (94.1%) |
| 45 to 54 Years | 123 (7.0%) | 1,718 (97.7%) |
| 55 to 64 Years | 74 (3.8%) | 1,895 (96.8%) |
| 65 to 74 Years | 1,394 (90.9%) | 1,205 (78.5%) |
| 75 Years and over | 751 (100.0%) | 643 (85.6%) |
| Total | 2,837 (23.3%) | 11,001 (90.3%) |
Disability Status by Sex by Age in Fairfax Station
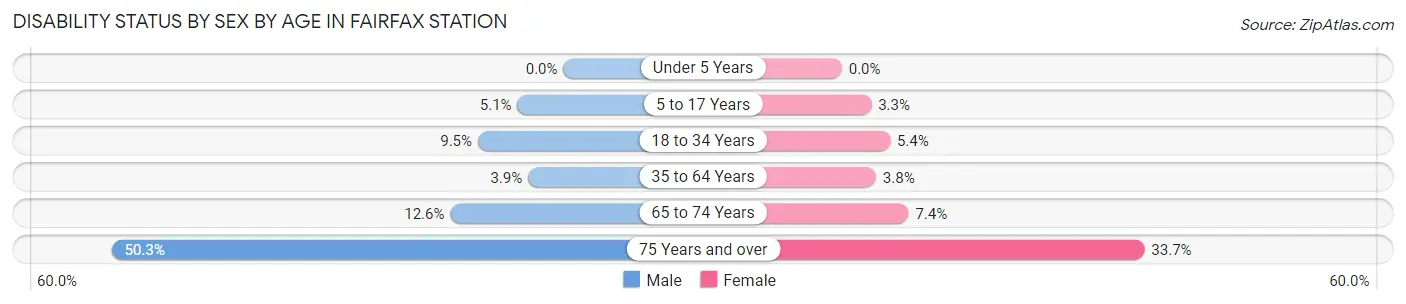
| Age Bracket | Male | Female |
| Under 5 Years | 0 (0.0%) | 0 (0.0%) |
| 5 to 17 Years | 61 (5.1%) | 30 (3.3%) |
| 18 to 34 Years | 95 (9.5%) | 64 (5.4%) |
| 35 to 64 Years | 100 (3.9%) | 96 (3.8%) |
| 65 to 74 Years | 88 (12.6%) | 62 (7.4%) |
| 75 Years and over | 239 (50.3%) | 93 (33.7%) |
Disability Class by Sex by Age in Fairfax Station
Disability Class: Hearing Difficulty
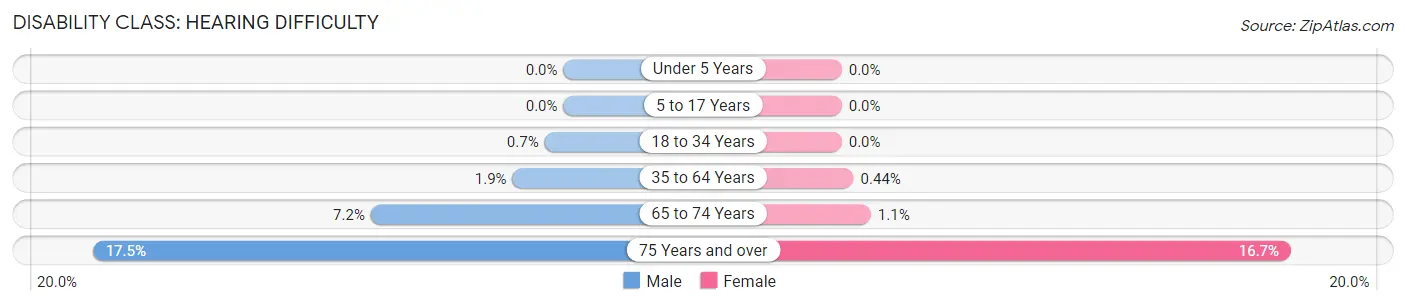
| Age Bracket | Male | Female |
| Under 5 Years | 0 (0.0%) | 0 (0.0%) |
| 5 to 17 Years | 0 (0.0%) | 0 (0.0%) |
| 18 to 34 Years | 7 (0.7%) | 0 (0.0%) |
| 35 to 64 Years | 48 (1.9%) | 11 (0.4%) |
| 65 to 74 Years | 50 (7.1%) | 9 (1.1%) |
| 75 Years and over | 83 (17.5%) | 46 (16.7%) |
Disability Class: Vision Difficulty
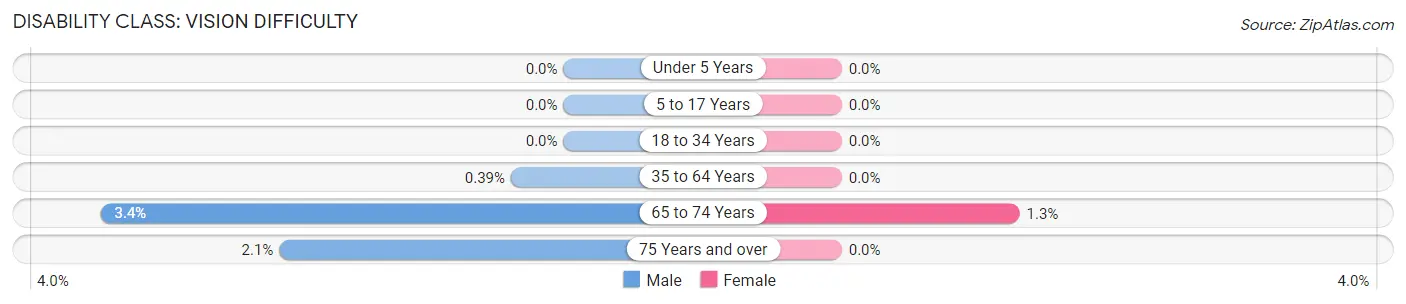
| Age Bracket | Male | Female |
| Under 5 Years | 0 (0.0%) | 0 (0.0%) |
| 5 to 17 Years | 0 (0.0%) | 0 (0.0%) |
| 18 to 34 Years | 0 (0.0%) | 0 (0.0%) |
| 35 to 64 Years | 10 (0.4%) | 0 (0.0%) |
| 65 to 74 Years | 24 (3.4%) | 11 (1.3%) |
| 75 Years and over | 10 (2.1%) | 0 (0.0%) |
Disability Class: Cognitive Difficulty
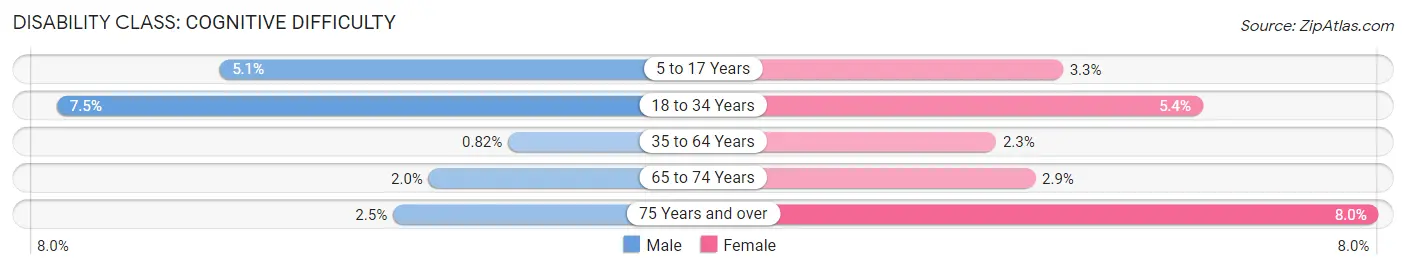
| Age Bracket | Male | Female |
| 5 to 17 Years | 61 (5.1%) | 30 (3.3%) |
| 18 to 34 Years | 75 (7.5%) | 64 (5.4%) |
| 35 to 64 Years | 21 (0.8%) | 58 (2.3%) |
| 65 to 74 Years | 14 (2.0%) | 24 (2.9%) |
| 75 Years and over | 12 (2.5%) | 22 (8.0%) |
Disability Class: Ambulatory Difficulty
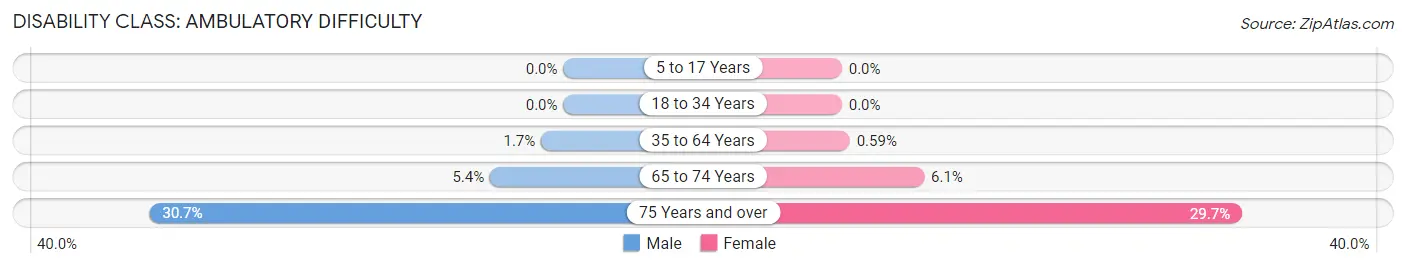
| Age Bracket | Male | Female |
| 5 to 17 Years | 0 (0.0%) | 0 (0.0%) |
| 18 to 34 Years | 0 (0.0%) | 0 (0.0%) |
| 35 to 64 Years | 42 (1.7%) | 15 (0.6%) |
| 65 to 74 Years | 38 (5.4%) | 51 (6.1%) |
| 75 Years and over | 146 (30.7%) | 82 (29.7%) |
Disability Class: Self-Care Difficulty
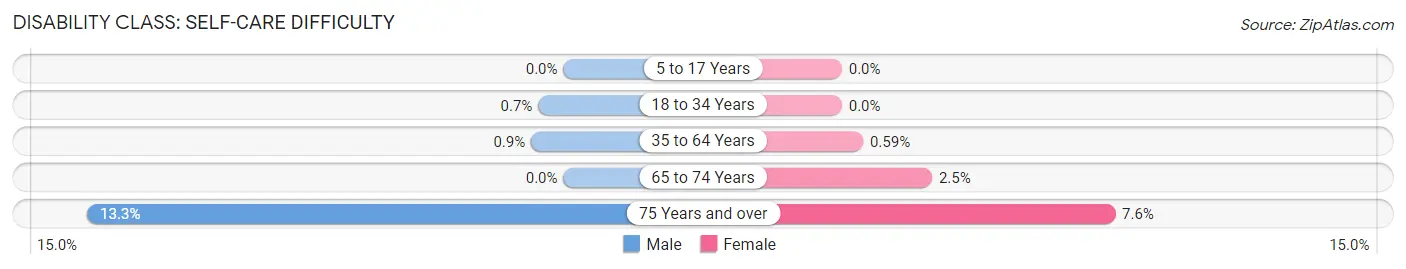
| Age Bracket | Male | Female |
| 5 to 17 Years | 0 (0.0%) | 0 (0.0%) |
| 18 to 34 Years | 7 (0.7%) | 0 (0.0%) |
| 35 to 64 Years | 23 (0.9%) | 15 (0.6%) |
| 65 to 74 Years | 0 (0.0%) | 21 (2.5%) |
| 75 Years and over | 63 (13.3%) | 21 (7.6%) |
Technology Access in Fairfax Station
Computing Device Access in Fairfax Station
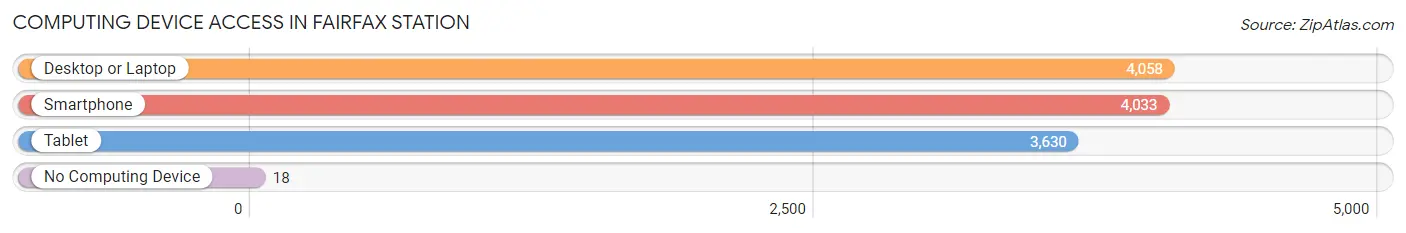
| Device Type | # Households | % Households |
| Desktop or Laptop | 4,058 | 97.6% |
| Smartphone | 4,033 | 97.0% |
| Tablet | 3,630 | 87.3% |
| No Computing Device | 18 | 0.4% |
| Total | 4,158 | 100.0% |
Internet Access in Fairfax Station
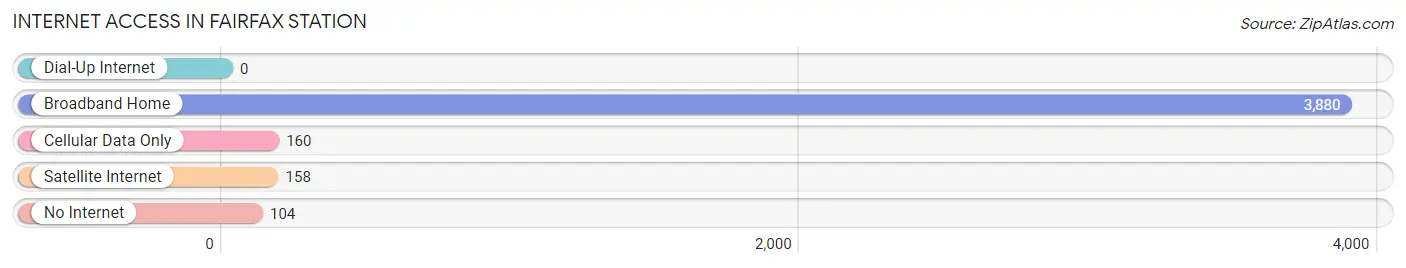
| Internet Type | # Households | % Households |
| Dial-Up Internet | 0 | 0.0% |
| Broadband Home | 3,880 | 93.3% |
| Cellular Data Only | 160 | 3.8% |
| Satellite Internet | 158 | 3.8% |
| No Internet | 104 | 2.5% |
| Total | 4,158 | 100.0% |
Fairfax Station Summary
Fairfax Station is a census-designated place (CDP) located in Fairfax County, Virginia. It is situated in the southeastern corner of the county, approximately 20 miles southwest of Washington, D.C. The population of Fairfax Station was 12,030 as of the 2010 census.
Geography
Fairfax Station is located at 38°41'25" North, 77°20'45" West (38.690278, -77.345833). It is situated in the southeastern corner of Fairfax County, approximately 20 miles southwest of Washington, D.C. The CDP has a total area of 8.3 square miles, all of which is land.
The terrain of Fairfax Station is generally hilly, with some flat areas. The area is heavily wooded, with a mix of deciduous and evergreen trees. The Occoquan River forms the eastern boundary of the CDP.
History
The area that is now Fairfax Station was first settled in the late 1700s. The first settlers were farmers, who grew tobacco and other crops. The area was known as “The Station” due to its proximity to the Orange and Alexandria Railroad, which ran through the area in the mid-1800s.
In 1855, the Fairfax Station post office was established. The area was officially incorporated as a town in 1874. The town was named after Thomas Fairfax, the 6th Lord Fairfax of Cameron, who owned much of the land in the area.
The town grew slowly over the next several decades, and by the early 1900s, it had a population of about 500. The town was primarily agricultural, with some small businesses.
In the mid-1900s, Fairfax Station began to experience rapid growth due to its proximity to Washington, D.C. The population of the town increased from 500 in 1950 to over 12,000 by 2010.
Economy
The economy of Fairfax Station is largely based on the service industry. The area is home to several large corporations, including Booz Allen Hamilton, Northrop Grumman, and Lockheed Martin. The area also has a large number of small businesses, including restaurants, retail stores, and professional services.
The area is also home to several government agencies, including the National Geospatial-Intelligence Agency and the National Reconnaissance Office.
Demographics
As of the 2010 census, the population of Fairfax Station was 12,030. The racial makeup of the CDP was 79.2% White, 8.3% African American, 0.3% Native American, 8.2% Asian, 0.1% Pacific Islander, and 3.9% from other races. Hispanic or Latino of any race were 5.3% of the population.
The median household income in Fairfax Station was $128,945 in 2010. The per capita income was $50,945. The median age was 40.7 years.
Conclusion
Fairfax Station is a census-designated place located in Fairfax County, Virginia. It is situated in the southeastern corner of the county, approximately 20 miles southwest of Washington, D.C. The population of Fairfax Station was 12,030 as of the 2010 census. The area is heavily wooded, with a mix of deciduous and evergreen trees. The Occoquan River forms the eastern boundary of the CDP.
The economy of Fairfax Station is largely based on the service industry. The area is home to several large corporations, including Booz Allen Hamilton, Northrop Grumman, and Lockheed Martin. The area also has a large number of small businesses, including restaurants, retail stores, and professional services.
As of the 2010 census, the population of Fairfax Station was 12,030. The racial makeup of the CDP was 79.2% White, 8.3% African American, 0.3% Native American, 8.2% Asian, 0.1% Pacific Islander, and 3.9% from other races. Hispanic or Latino of any race were 5.3% of the population. The median household income in Fairfax Station was $128,945 in 2010. The per capita income was $50,945. The median age was 40.7 years.
Common Questions
What is Per Capita Income in Fairfax Station?
Per Capita income in Fairfax Station is $83,439.
What is the Median Family Income in Fairfax Station?
Median Family Income in Fairfax Station is $224,180.
What is the Median Household income in Fairfax Station?
Median Household Income in Fairfax Station is $211,000.
What is Income or Wage Gap in Fairfax Station?
Income or Wage Gap in Fairfax Station is 65.1%.
Women in Fairfax Station earn 34.9 cents for every dollar earned by a man.
What is Inequality or Gini Index in Fairfax Station?
Inequality or Gini Index in Fairfax Station is 0.33.
What is the Total Population of Fairfax Station?
Total Population of Fairfax Station is 12,277.
What is the Total Male Population of Fairfax Station?
Total Male Population of Fairfax Station is 6,210.
What is the Total Female Population of Fairfax Station?
Total Female Population of Fairfax Station is 6,067.
What is the Ratio of Males per 100 Females in Fairfax Station?
There are 102.36 Males per 100 Females in Fairfax Station.
What is the Ratio of Females per 100 Males in Fairfax Station?
There are 97.70 Females per 100 Males in Fairfax Station.
What is the Median Population Age in Fairfax Station?
Median Population Age in Fairfax Station is 44.7 Years.
What is the Average Family Size in Fairfax Station
Average Family Size in Fairfax Station is 3.2 People.
What is the Average Household Size in Fairfax Station
Average Household Size in Fairfax Station is 3.0 People.
How Large is the Labor Force in Fairfax Station?
There are 6,643 People in the Labor Forcein in Fairfax Station.
What is the Percentage of People in the Labor Force in Fairfax Station?
66.2% of People are in the Labor Force in Fairfax Station.
What is the Unemployment Rate in Fairfax Station?
Unemployment Rate in Fairfax Station is 4.1%.