Dahlgren, VA Map & Demographics
Dahlgren Map
Dahlgren Overview
$43,977
PER CAPITA INCOME
$115,732
AVG FAMILY INCOME
$104,508
AVG HOUSEHOLD INCOME
32.2%
WAGE / INCOME GAP [ % ]
67.8¢/ $1
WAGE / INCOME GAP [ $ ]
0.33
INEQUALITY / GINI INDEX
3,517
TOTAL POPULATION
1,803
MALE POPULATION
1,714
FEMALE POPULATION
105.19
MALES / 100 FEMALES
95.06
FEMALES / 100 MALES
34.6
MEDIAN AGE
3.2
AVG FAMILY SIZE
2.8
AVG HOUSEHOLD SIZE
2,051
LABOR FORCE [ PEOPLE ]
73.7%
PERCENT IN LABOR FORCE
3.9%
UNEMPLOYMENT RATE
Dahlgren Zip Codes
Dahlgren Area Codes
Income in Dahlgren
Income Overview in Dahlgren
Per Capita Income in Dahlgren is $43,977, while median incomes of families and households are $115,732 and $104,508 respectively.
| Characteristic | Number | Measure |
| Per Capita Income | 3,517 | $43,977 |
| Median Family Income | 892 | $115,732 |
| Mean Family Income | 892 | $128,102 |
| Median Household Income | 1,267 | $104,508 |
| Mean Household Income | 1,267 | $120,413 |
| Income Deficit | 892 | $0 |
| Wage / Income Gap (%) | 3,517 | 32.19% |
| Wage / Income Gap ($) | 3,517 | 67.81¢ per $1 |
| Gini / Inequality Index | 3,517 | 0.33 |
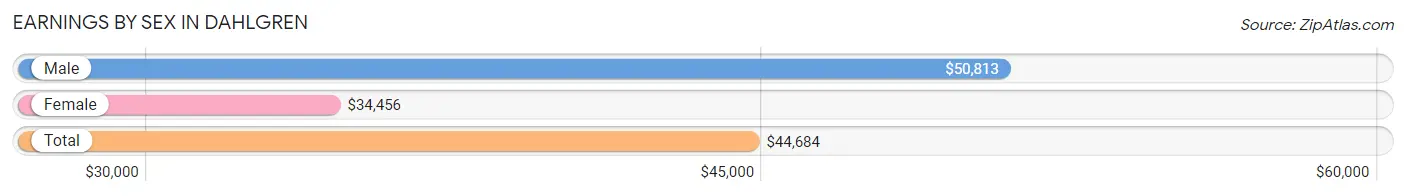
Earnings by Sex in Dahlgren
Average Earnings in Dahlgren are $44,684, $50,813 for men and $34,456 for women, a difference of 32.2%.
| Sex | Number | Average Earnings |
| Male | 1,105 (52.7%) | $50,813 |
| Female | 991 (47.3%) | $34,456 |
| Total | 2,096 (100.0%) | $44,684 |
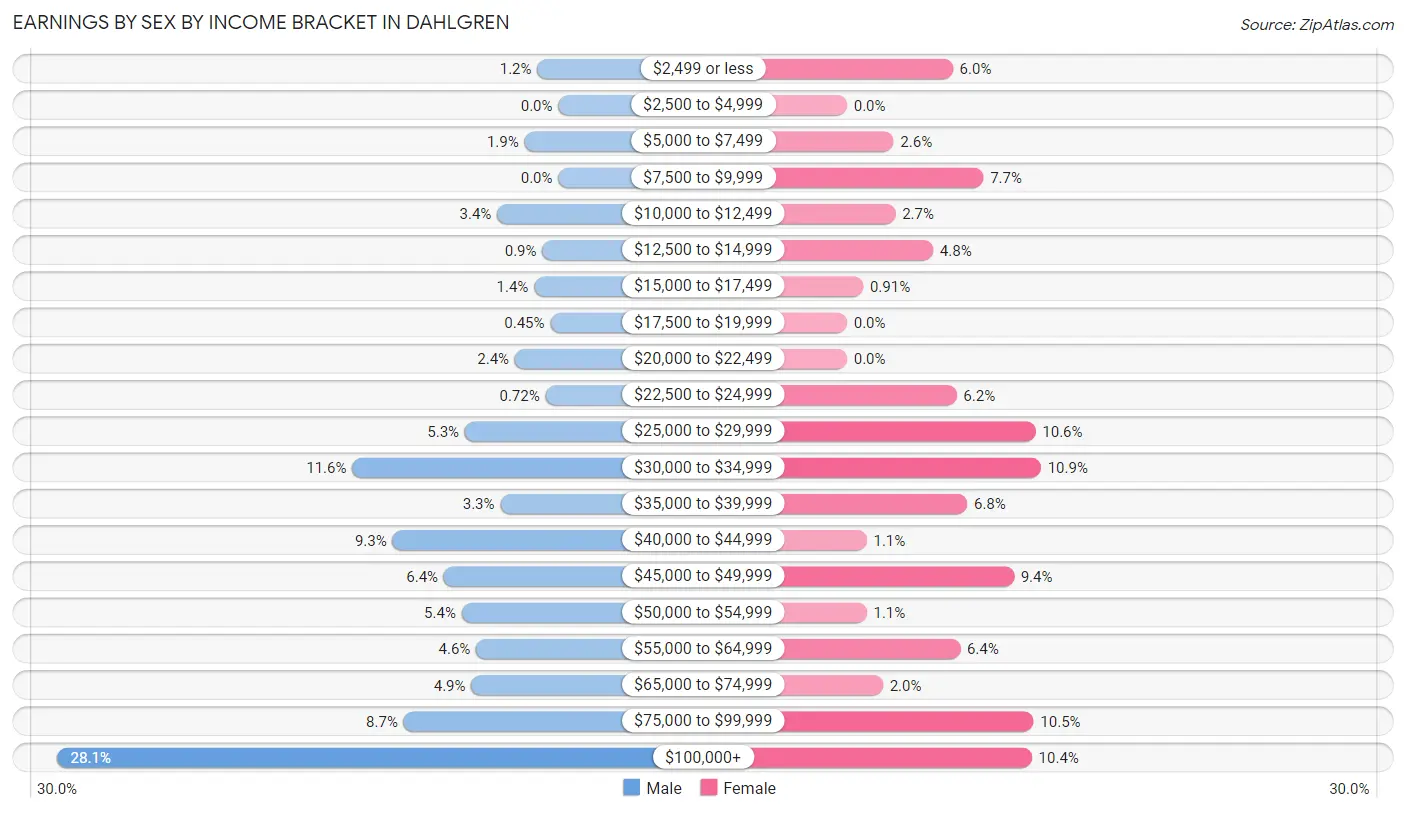
Earnings by Sex by Income Bracket in Dahlgren
The most common earnings brackets in Dahlgren are $100,000+ for men (311 | 28.1%) and $30,000 to $34,999 for women (108 | 10.9%).
| Income | Male | Female |
| $2,499 or less | 13 (1.2%) | 59 (5.9%) |
| $2,500 to $4,999 | 0 (0.0%) | 0 (0.0%) |
| $5,000 to $7,499 | 21 (1.9%) | 26 (2.6%) |
| $7,500 to $9,999 | 0 (0.0%) | 76 (7.7%) |
| $10,000 to $12,499 | 38 (3.4%) | 27 (2.7%) |
| $12,500 to $14,999 | 10 (0.9%) | 48 (4.8%) |
| $15,000 to $17,499 | 15 (1.4%) | 9 (0.9%) |
| $17,500 to $19,999 | 5 (0.4%) | 0 (0.0%) |
| $20,000 to $22,499 | 27 (2.4%) | 0 (0.0%) |
| $22,500 to $24,999 | 8 (0.7%) | 61 (6.2%) |
| $25,000 to $29,999 | 58 (5.2%) | 105 (10.6%) |
| $30,000 to $34,999 | 128 (11.6%) | 108 (10.9%) |
| $35,000 to $39,999 | 36 (3.3%) | 67 (6.8%) |
| $40,000 to $44,999 | 103 (9.3%) | 11 (1.1%) |
| $45,000 to $49,999 | 71 (6.4%) | 93 (9.4%) |
| $50,000 to $54,999 | 60 (5.4%) | 11 (1.1%) |
| $55,000 to $64,999 | 51 (4.6%) | 63 (6.4%) |
| $65,000 to $74,999 | 54 (4.9%) | 20 (2.0%) |
| $75,000 to $99,999 | 96 (8.7%) | 104 (10.5%) |
| $100,000+ | 311 (28.1%) | 103 (10.4%) |
| Total | 1,105 (100.0%) | 991 (100.0%) |
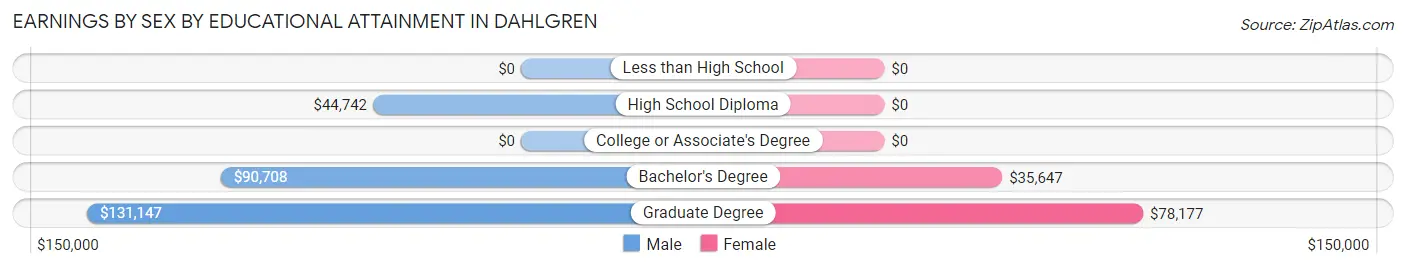
Earnings by Sex by Educational Attainment in Dahlgren
Average earnings in Dahlgren are $68,654 for men and $36,637 for women, a difference of 46.6%. Men with an educational attainment of graduate degree enjoy the highest average annual earnings of $131,147, while those with high school diploma education earn the least with $44,742. Women with an educational attainment of graduate degree earn the most with the average annual earnings of $78,177, while those with bachelor's degree education have the smallest earnings of $35,647.
| Educational Attainment | Male Income | Female Income |
| Less than High School | - | - |
| High School Diploma | $44,742 | $0 |
| College or Associate's Degree | - | - |
| Bachelor's Degree | $90,708 | $35,647 |
| Graduate Degree | $131,147 | $78,177 |
| Total | $68,654 | $36,637 |
Family Income in Dahlgren
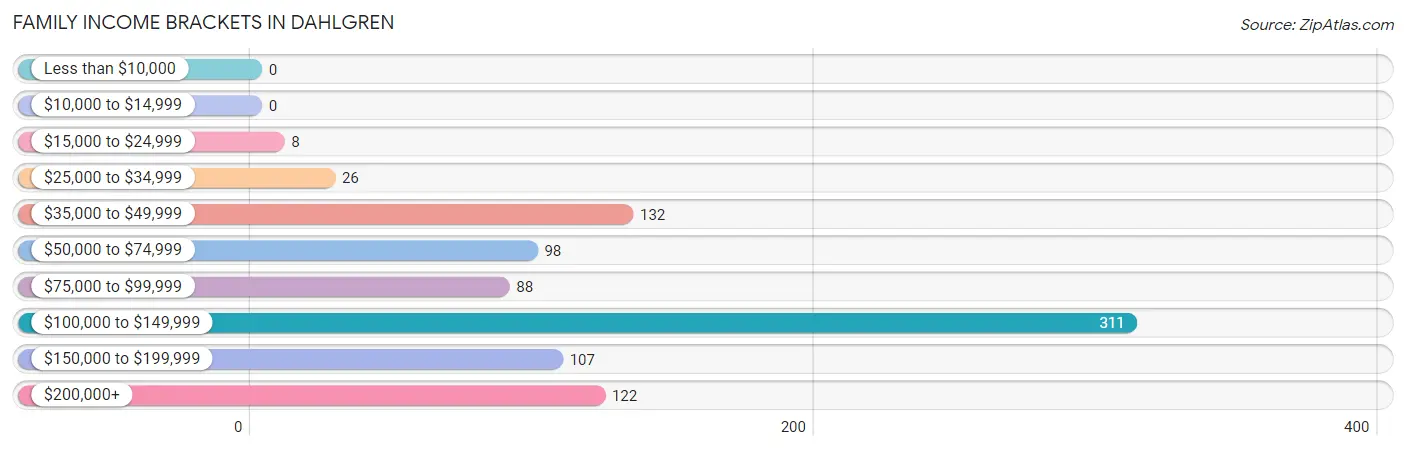
Family Income Brackets in Dahlgren
According to the Dahlgren family income data, there are 311 families falling into the $100,000 to $149,999 income range, which is the most common income bracket and makes up 34.9% of all families.
| Income Bracket | # Families | % Families |
| Less than $10,000 | 0 | 0.0% |
| $10,000 to $14,999 | 0 | 0.0% |
| $15,000 to $24,999 | 8 | 0.9% |
| $25,000 to $34,999 | 26 | 2.9% |
| $35,000 to $49,999 | 132 | 14.8% |
| $50,000 to $74,999 | 98 | 11.0% |
| $75,000 to $99,999 | 88 | 9.9% |
| $100,000 to $149,999 | 311 | 34.9% |
| $150,000 to $199,999 | 107 | 12.0% |
| $200,000+ | 122 | 13.7% |
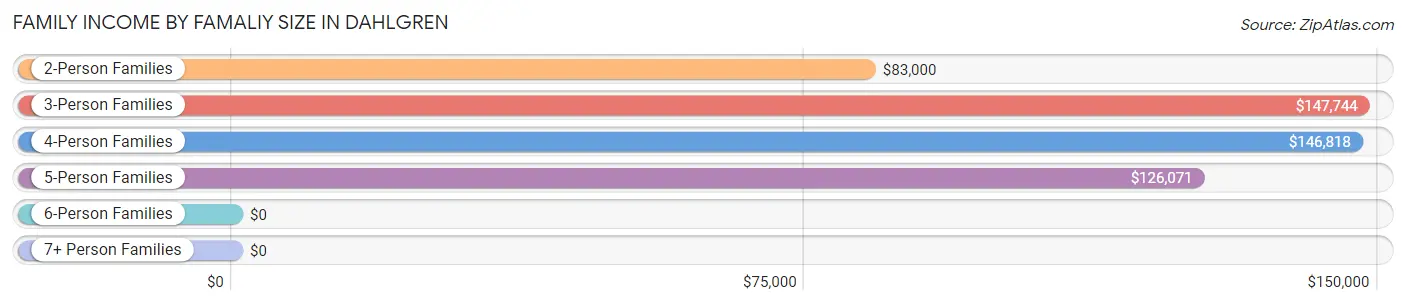
Family Income by Famaliy Size in Dahlgren
3-person families (228 | 25.6%) account for the highest median family income in Dahlgren with $147,744 per family, while 3-person families (228 | 25.6%) have the highest median income of $49,248 per family member.
| Income Bracket | # Families | Median Income |
| 2-Person Families | 356 (39.9%) | $83,000 |
| 3-Person Families | 228 (25.6%) | $147,744 |
| 4-Person Families | 214 (24.0%) | $146,818 |
| 5-Person Families | 66 (7.4%) | $126,071 |
| 6-Person Families | 5 (0.6%) | $0 |
| 7+ Person Families | 23 (2.6%) | $0 |
| Total | 892 (100.0%) | $115,732 |
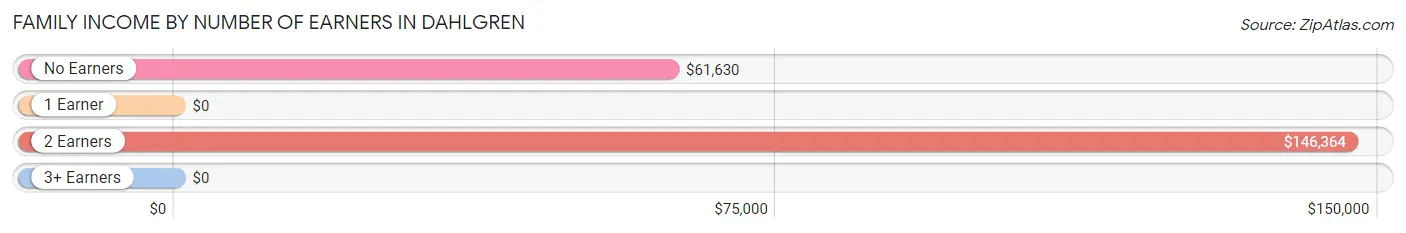
Family Income by Number of Earners in Dahlgren
| Number of Earners | # Families | Median Income |
| No Earners | 54 (6.0%) | $61,630 |
| 1 Earner | 315 (35.3%) | $0 |
| 2 Earners | 360 (40.4%) | $146,364 |
| 3+ Earners | 163 (18.3%) | $0 |
| Total | 892 (100.0%) | $115,732 |
Household Income in Dahlgren
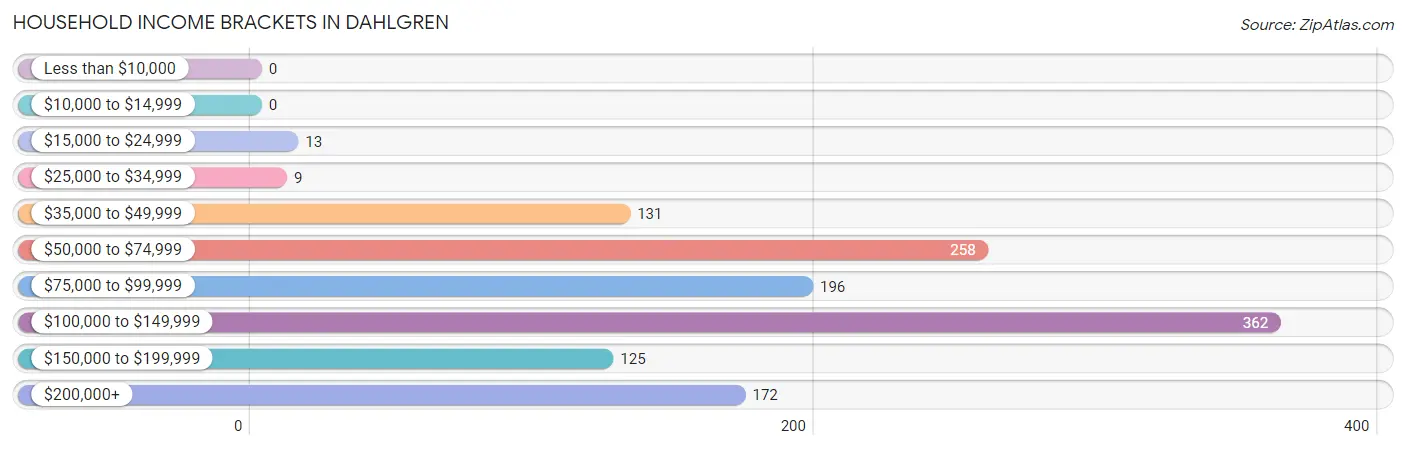
Household Income Brackets in Dahlgren
With 362 households falling in the category, the $100,000 to $149,999 income range is the most frequent in Dahlgren, accounting for 28.6% of all households.
| Income Bracket | # Households | % Households |
| Less than $10,000 | 0 | 0.0% |
| $10,000 to $14,999 | 0 | 0.0% |
| $15,000 to $24,999 | 13 | 1.0% |
| $25,000 to $34,999 | 9 | 0.7% |
| $35,000 to $49,999 | 131 | 10.3% |
| $50,000 to $74,999 | 258 | 20.4% |
| $75,000 to $99,999 | 196 | 15.5% |
| $100,000 to $149,999 | 362 | 28.6% |
| $150,000 to $199,999 | 125 | 9.9% |
| $200,000+ | 172 | 13.6% |
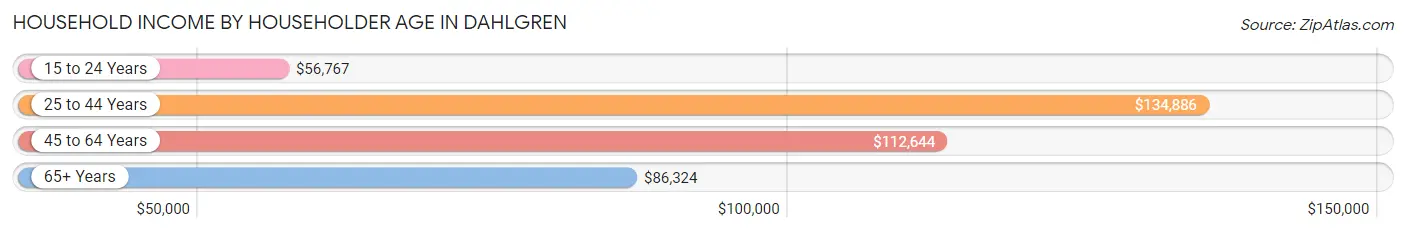
Household Income by Householder Age in Dahlgren
The median household income in Dahlgren is $104,508, with the highest median household income of $134,886 found in the 25 to 44 years age bracket for the primary householder. A total of 549 households (43.3%) fall into this category. Meanwhile, the 15 to 24 years age bracket for the primary householder has the lowest median household income of $56,767, with 71 households (5.6%) in this group.
| Income Bracket | # Households | Median Income |
| 15 to 24 Years | 71 (5.6%) | $56,767 |
| 25 to 44 Years | 549 (43.3%) | $134,886 |
| 45 to 64 Years | 341 (26.9%) | $112,644 |
| 65+ Years | 306 (24.1%) | $86,324 |
| Total | 1,267 (100.0%) | $104,508 |
Poverty in Dahlgren
Income Below Poverty by Sex and Age in Dahlgren
With 2.5% poverty level for males and 4.7% for females among the residents of Dahlgren, 16 and 17 year old males and 15 year old females are the most vulnerable to poverty, with 9 males (23.1%) and 10 females (71.4%) in their respective age groups living below the poverty level.
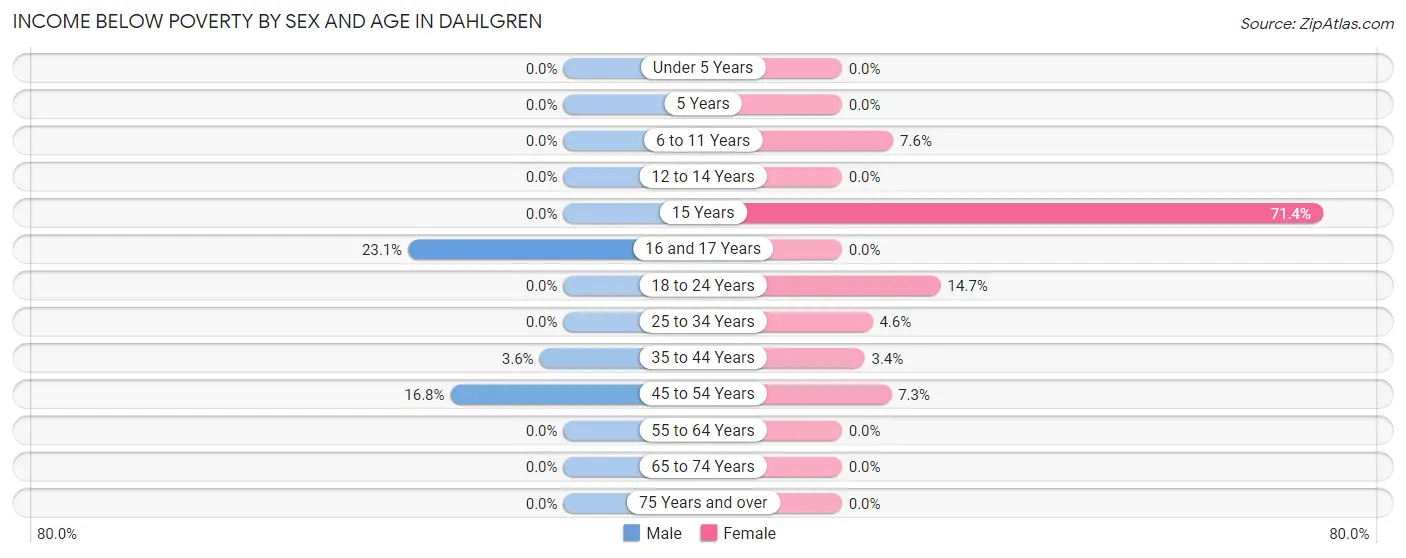
| Age Bracket | Male | Female |
| Under 5 Years | 0 (0.0%) | 0 (0.0%) |
| 5 Years | 0 (0.0%) | 0 (0.0%) |
| 6 to 11 Years | 0 (0.0%) | 9 (7.6%) |
| 12 to 14 Years | 0 (0.0%) | 0 (0.0%) |
| 15 Years | 0 (0.0%) | 10 (71.4%) |
| 16 and 17 Years | 9 (23.1%) | 0 (0.0%) |
| 18 to 24 Years | 0 (0.0%) | 32 (14.7%) |
| 25 to 34 Years | 0 (0.0%) | 13 (4.5%) |
| 35 to 44 Years | 10 (3.5%) | 9 (3.4%) |
| 45 to 54 Years | 25 (16.8%) | 8 (7.3%) |
| 55 to 64 Years | 0 (0.0%) | 0 (0.0%) |
| 65 to 74 Years | 0 (0.0%) | 0 (0.0%) |
| 75 Years and over | 0 (0.0%) | 0 (0.0%) |
| Total | 44 (2.5%) | 81 (4.7%) |
Income Above Poverty by Sex and Age in Dahlgren
According to the poverty statistics in Dahlgren, males aged under 5 years and females aged under 5 years are the age groups that are most secure financially, with 100.0% of males and 100.0% of females in these age groups living above the poverty line.
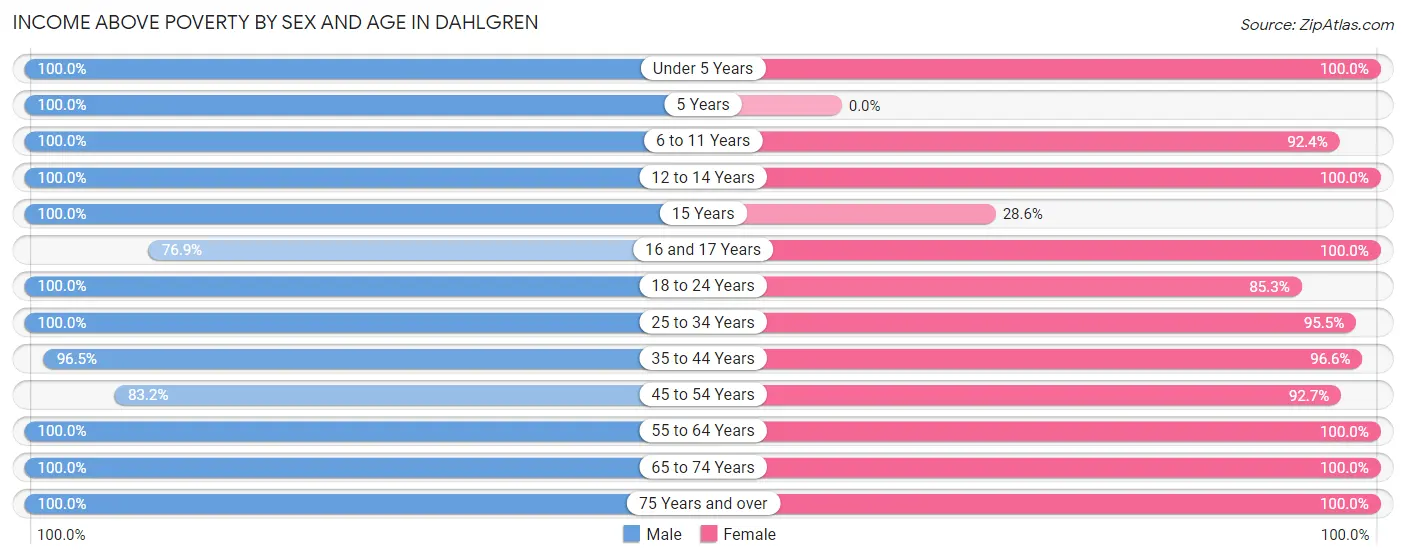
| Age Bracket | Male | Female |
| Under 5 Years | 53 (100.0%) | 102 (100.0%) |
| 5 Years | 49 (100.0%) | 0 (0.0%) |
| 6 to 11 Years | 228 (100.0%) | 109 (92.4%) |
| 12 to 14 Years | 41 (100.0%) | 57 (100.0%) |
| 15 Years | 29 (100.0%) | 4 (28.6%) |
| 16 and 17 Years | 30 (76.9%) | 30 (100.0%) |
| 18 to 24 Years | 270 (100.0%) | 186 (85.3%) |
| 25 to 34 Years | 210 (100.0%) | 273 (95.5%) |
| 35 to 44 Years | 272 (96.5%) | 257 (96.6%) |
| 45 to 54 Years | 124 (83.2%) | 101 (92.7%) |
| 55 to 64 Years | 185 (100.0%) | 206 (100.0%) |
| 65 to 74 Years | 179 (100.0%) | 142 (100.0%) |
| 75 Years and over | 46 (100.0%) | 166 (100.0%) |
| Total | 1,716 (97.5%) | 1,633 (95.3%) |
Income Below Poverty Among Married-Couple Families in Dahlgren
The poverty statistics for married-couple families in Dahlgren show that 2.4% or 17 of the total 698 families live below the poverty line. Families with 3 or 4 children have the highest poverty rate of 27.3%, comprising of 9 families. On the other hand, families with 1 or 2 children have the lowest poverty rate of 0.0%, which includes 0 families.
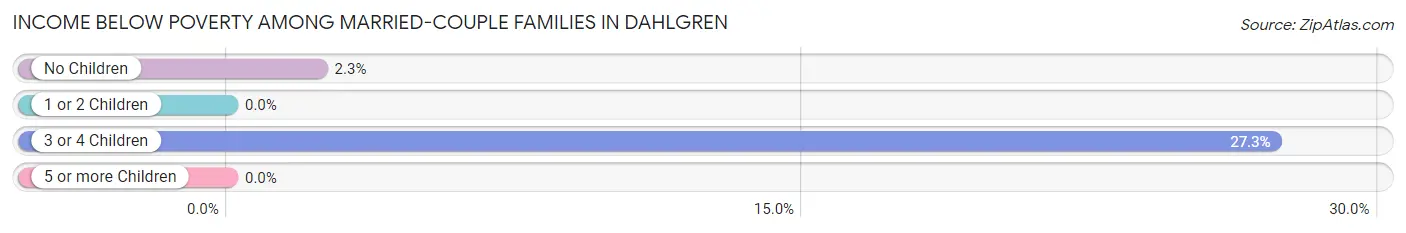
| Children | Above Poverty | Below Poverty |
| No Children | 334 (97.7%) | 8 (2.3%) |
| 1 or 2 Children | 300 (100.0%) | 0 (0.0%) |
| 3 or 4 Children | 24 (72.7%) | 9 (27.3%) |
| 5 or more Children | 23 (100.0%) | 0 (0.0%) |
| Total | 681 (97.6%) | 17 (2.4%) |
Income Below Poverty Among Single-Parent Households in Dahlgren
| Children | Single Father | Single Mother |
| No Children | 0 (0.0%) | 0 (0.0%) |
| 1 or 2 Children | 0 (0.0%) | 0 (0.0%) |
| 3 or 4 Children | 0 (0.0%) | 0 (0.0%) |
| 5 or more Children | 0 (0.0%) | 0 (0.0%) |
| Total | 0 (0.0%) | 0 (0.0%) |
Income Below Poverty Among Married-Couple vs Single-Parent Households in Dahlgren
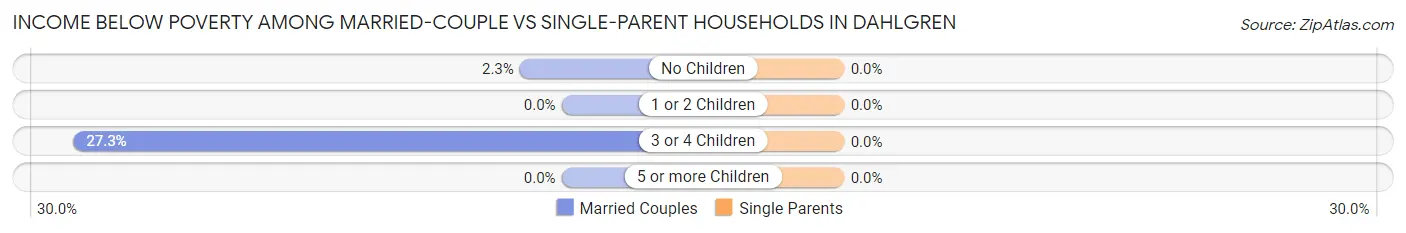
| Children | Married-Couple Families | Single-Parent Households |
| No Children | 8 (2.3%) | 0 (0.0%) |
| 1 or 2 Children | 0 (0.0%) | 0 (0.0%) |
| 3 or 4 Children | 9 (27.3%) | 0 (0.0%) |
| 5 or more Children | 0 (0.0%) | 0 (0.0%) |
| Total | 17 (2.4%) | 0 (0.0%) |
Race in Dahlgren
The most populous races in Dahlgren are White / Caucasian (2,188 | 62.2%), Black / African American (827 | 23.5%), and Hispanic or Latino (302 | 8.6%).
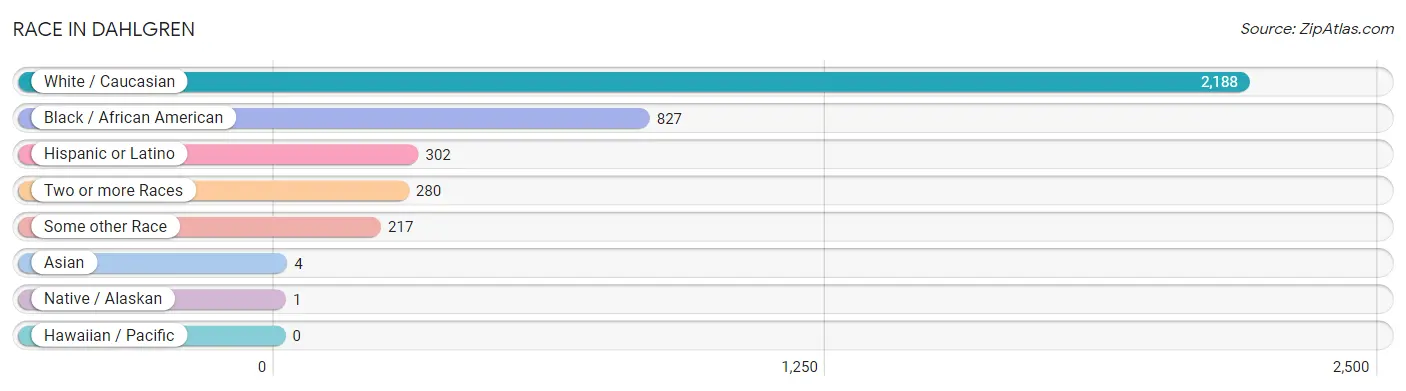
| Race | # Population | % Population |
| Asian | 4 | 0.1% |
| Black / African American | 827 | 23.5% |
| Hawaiian / Pacific | 0 | 0.0% |
| Hispanic or Latino | 302 | 8.6% |
| Native / Alaskan | 1 | 0.0% |
| White / Caucasian | 2,188 | 62.2% |
| Two or more Races | 280 | 8.0% |
| Some other Race | 217 | 6.2% |
| Total | 3,517 | 100.0% |
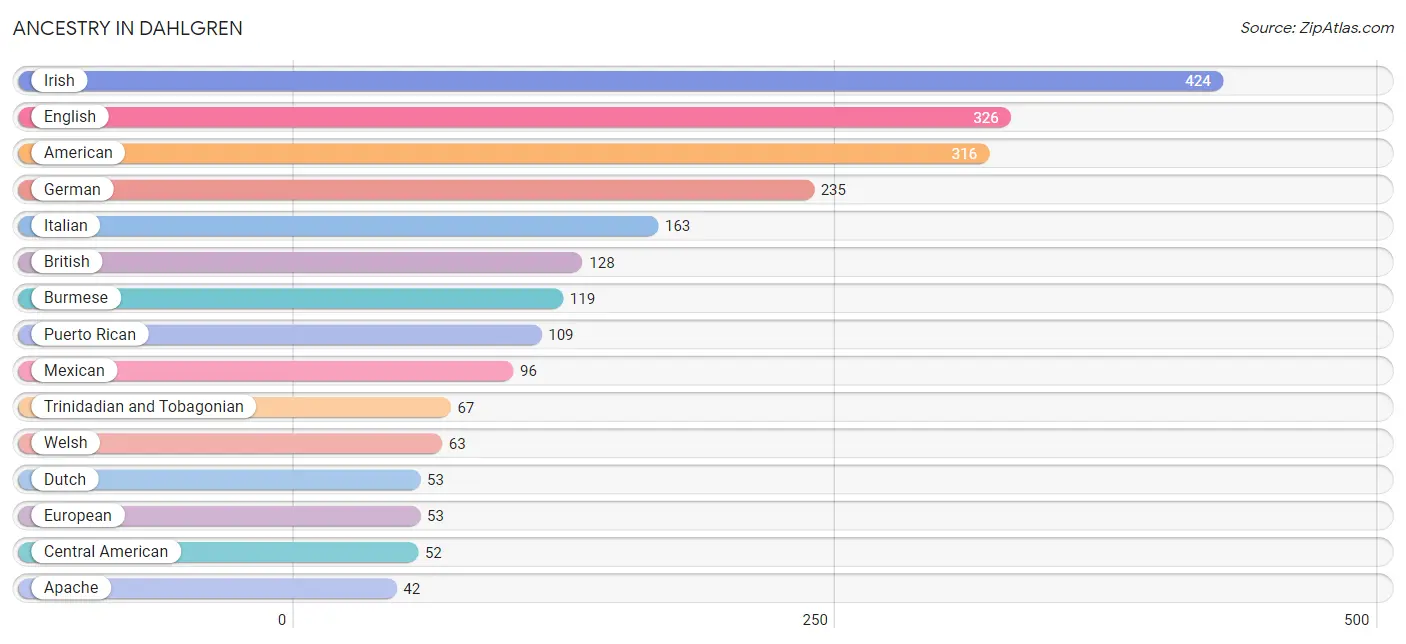
Ancestry in Dahlgren
The most populous ancestries reported in Dahlgren are Irish (424 | 12.1%), English (326 | 9.3%), American (316 | 9.0%), German (235 | 6.7%), and Italian (163 | 4.6%), together accounting for 41.6% of all Dahlgren residents.
| Ancestry | # Population | % Population |
| African | 17 | 0.5% |
| American | 316 | 9.0% |
| Apache | 42 | 1.2% |
| Blackfeet | 17 | 0.5% |
| British | 128 | 3.6% |
| Burmese | 119 | 3.4% |
| Canadian | 25 | 0.7% |
| Central American | 52 | 1.5% |
| Cherokee | 41 | 1.2% |
| Colombian | 33 | 0.9% |
| Comanche | 1 | 0.0% |
| Danish | 15 | 0.4% |
| Dominican | 12 | 0.3% |
| Dutch | 53 | 1.5% |
| English | 326 | 9.3% |
| European | 53 | 1.5% |
| French | 13 | 0.4% |
| French Canadian | 5 | 0.1% |
| German | 235 | 6.7% |
| Greek | 35 | 1.0% |
| Honduran | 13 | 0.4% |
| Irish | 424 | 12.1% |
| Italian | 163 | 4.6% |
| Kiowa | 1 | 0.0% |
| Korean | 26 | 0.7% |
| Mexican | 96 | 2.7% |
| Polish | 27 | 0.8% |
| Portuguese | 41 | 1.2% |
| Puerto Rican | 109 | 3.1% |
| Russian | 29 | 0.8% |
| Salvadoran | 39 | 1.1% |
| Scandinavian | 34 | 1.0% |
| Scottish | 39 | 1.1% |
| South American | 33 | 0.9% |
| Subsaharan African | 17 | 0.5% |
| Swedish | 8 | 0.2% |
| Trinidadian and Tobagonian | 67 | 1.9% |
| Welsh | 63 | 1.8% | View All 38 Rows |
Immigrants in Dahlgren
The most numerous immigrant groups reported in Dahlgren came from Latin America (80 | 2.3%), Caribbean (67 | 1.9%), Trinidad and Tobago (67 | 1.9%), Central America (13 | 0.4%), and Honduras (13 | 0.4%), together accounting for 6.8% of all Dahlgren residents.
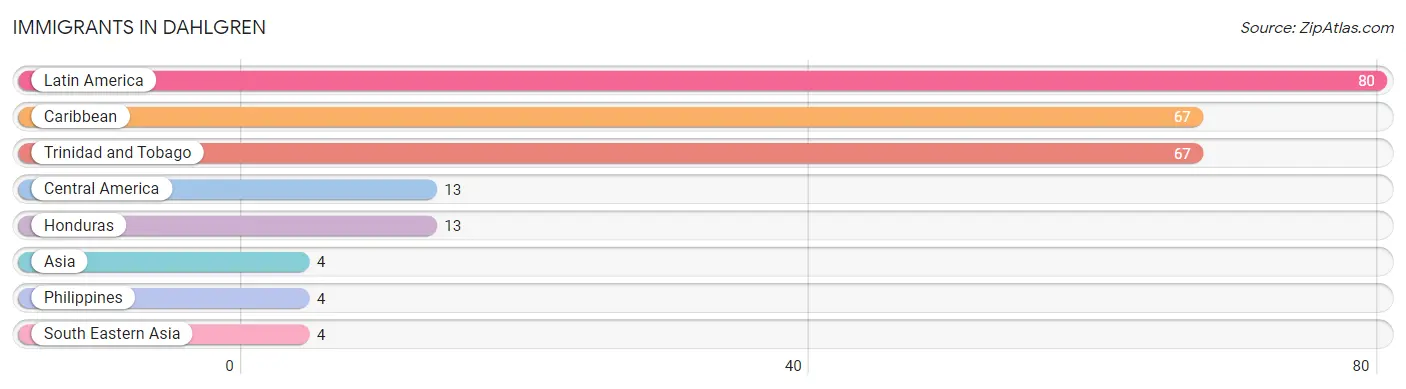
| Immigration Origin | # Population | % Population |
| Asia | 4 | 0.1% |
| Caribbean | 67 | 1.9% |
| Central America | 13 | 0.4% |
| Honduras | 13 | 0.4% |
| Latin America | 80 | 2.3% |
| Philippines | 4 | 0.1% |
| South Eastern Asia | 4 | 0.1% |
| Trinidad and Tobago | 67 | 1.9% | View All 8 Rows |
Sex and Age in Dahlgren
Sex and Age in Dahlgren
The most populous age groups in Dahlgren are 20 to 24 Years (234 | 13.0%) for men and 30 to 34 Years (181 | 10.6%) for women.
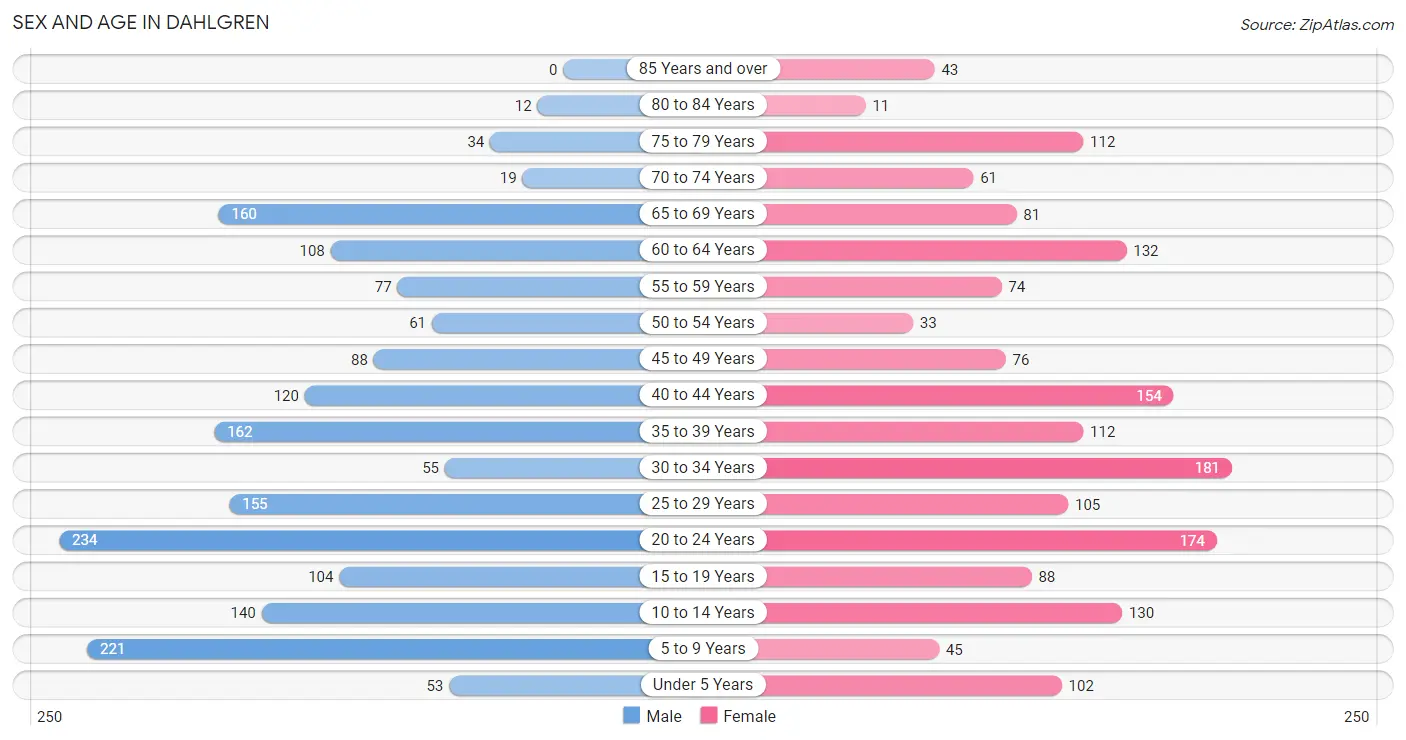
| Age Bracket | Male | Female |
| Under 5 Years | 53 (2.9%) | 102 (5.9%) |
| 5 to 9 Years | 221 (12.3%) | 45 (2.6%) |
| 10 to 14 Years | 140 (7.8%) | 130 (7.6%) |
| 15 to 19 Years | 104 (5.8%) | 88 (5.1%) |
| 20 to 24 Years | 234 (13.0%) | 174 (10.2%) |
| 25 to 29 Years | 155 (8.6%) | 105 (6.1%) |
| 30 to 34 Years | 55 (3.0%) | 181 (10.6%) |
| 35 to 39 Years | 162 (9.0%) | 112 (6.5%) |
| 40 to 44 Years | 120 (6.7%) | 154 (9.0%) |
| 45 to 49 Years | 88 (4.9%) | 76 (4.4%) |
| 50 to 54 Years | 61 (3.4%) | 33 (1.9%) |
| 55 to 59 Years | 77 (4.3%) | 74 (4.3%) |
| 60 to 64 Years | 108 (6.0%) | 132 (7.7%) |
| 65 to 69 Years | 160 (8.9%) | 81 (4.7%) |
| 70 to 74 Years | 19 (1.1%) | 61 (3.6%) |
| 75 to 79 Years | 34 (1.9%) | 112 (6.5%) |
| 80 to 84 Years | 12 (0.7%) | 11 (0.6%) |
| 85 Years and over | 0 (0.0%) | 43 (2.5%) |
| Total | 1,803 (100.0%) | 1,714 (100.0%) |
Families and Households in Dahlgren
Median Family Size in Dahlgren
The median family size in Dahlgren is 3.16 persons per family, with single female/mother families (124 | 13.9%) accounting for the largest median family size of 4.27 persons per family. On the other hand, single male/father families (70 | 7.9%) represent the smallest median family size with 2.10 persons per family.
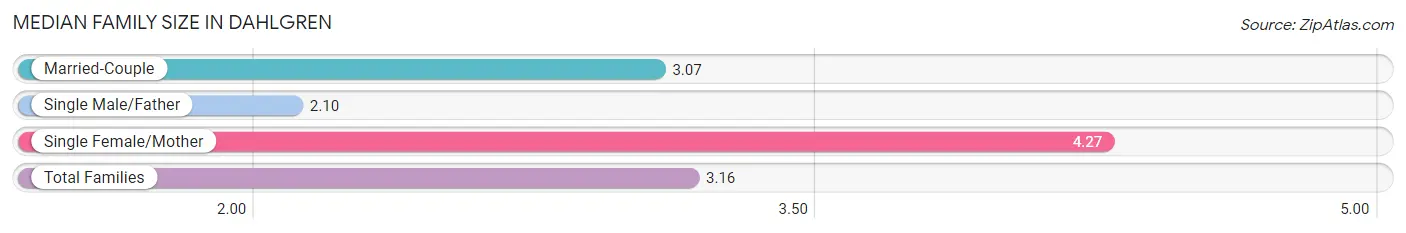
| Family Type | # Families | Family Size |
| Married-Couple | 698 (78.2%) | 3.07 |
| Single Male/Father | 70 (7.9%) | 2.10 |
| Single Female/Mother | 124 (13.9%) | 4.27 |
| Total Families | 892 (100.0%) | 3.16 |
Median Household Size in Dahlgren
The median household size in Dahlgren is 2.78 persons per household, with single female/mother households (124 | 9.8%) accounting for the largest median household size of 4.66 persons per household. non-family households (375 | 29.6%) represent the smallest median household size with 1.33 persons per household.
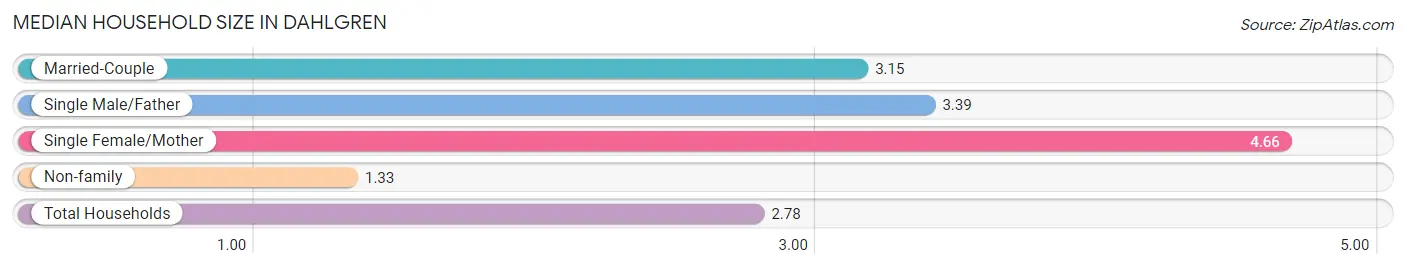
| Household Type | # Households | Household Size |
| Married-Couple | 698 (55.1%) | 3.15 |
| Single Male/Father | 70 (5.5%) | 3.39 |
| Single Female/Mother | 124 (9.8%) | 4.66 |
| Non-family | 375 (29.6%) | 1.33 |
| Total Households | 1,267 (100.0%) | 2.78 |
Household Size by Marriage Status in Dahlgren
Out of a total of 1,267 households in Dahlgren, 892 (70.4%) are family households, while 375 (29.6%) are nonfamily households. The most numerous type of family households are 2-person households, comprising 282, and the most common type of nonfamily households are 1-person households, comprising 265.
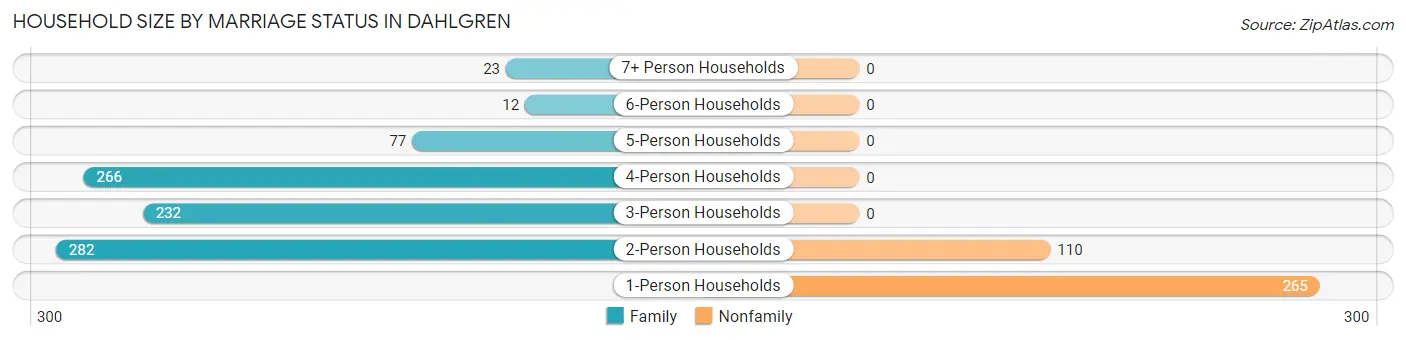
| Household Size | Family Households | Nonfamily Households |
| 1-Person Households | - | 265 (20.9%) |
| 2-Person Households | 282 (22.3%) | 110 (8.7%) |
| 3-Person Households | 232 (18.3%) | 0 (0.0%) |
| 4-Person Households | 266 (21.0%) | 0 (0.0%) |
| 5-Person Households | 77 (6.1%) | 0 (0.0%) |
| 6-Person Households | 12 (0.9%) | 0 (0.0%) |
| 7+ Person Households | 23 (1.8%) | 0 (0.0%) |
| Total | 892 (70.4%) | 375 (29.6%) |
Female Fertility in Dahlgren
Fertility by Age in Dahlgren
Average fertility rate in Dahlgren is 8.0 births per 1,000 women. Women in the age bracket of 20 to 34 years have the highest fertility rate with 15.0 births per 1,000 women. Women in the age bracket of 20 to 34 years acount for 100.0% of all women with births.
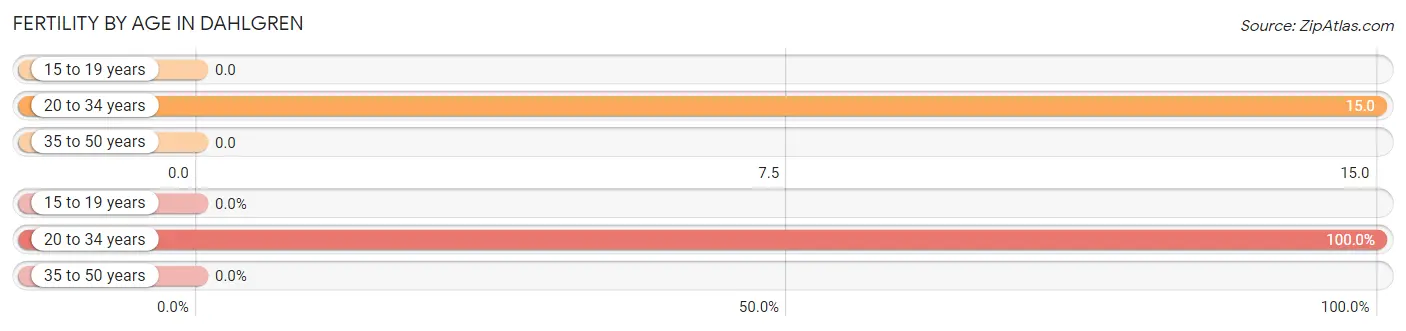
| Age Bracket | Women with Births | Births / 1,000 Women |
| 15 to 19 years | 0 (0.0%) | 0.0 |
| 20 to 34 years | 7 (100.0%) | 15.0 |
| 35 to 50 years | 0 (0.0%) | 0.0 |
| Total | 7 (100.0%) | 8.0 |
Fertility by Age by Marriage Status in Dahlgren
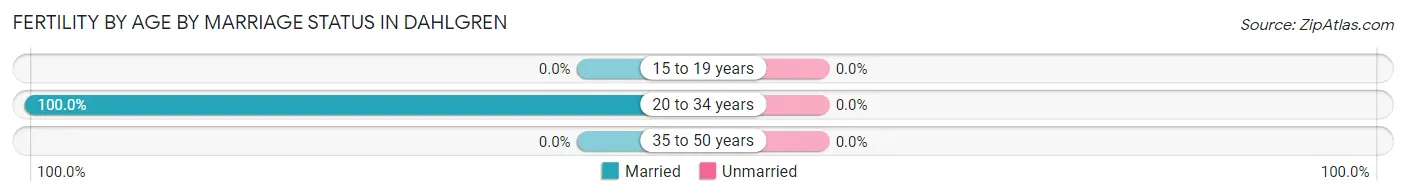
| Age Bracket | Married | Unmarried |
| 15 to 19 years | 0 (0.0%) | 0 (0.0%) |
| 20 to 34 years | 7 (100.0%) | 0 (0.0%) |
| 35 to 50 years | 0 (0.0%) | 0 (0.0%) |
| Total | 7 (100.0%) | 0 (0.0%) |
Fertility by Education in Dahlgren
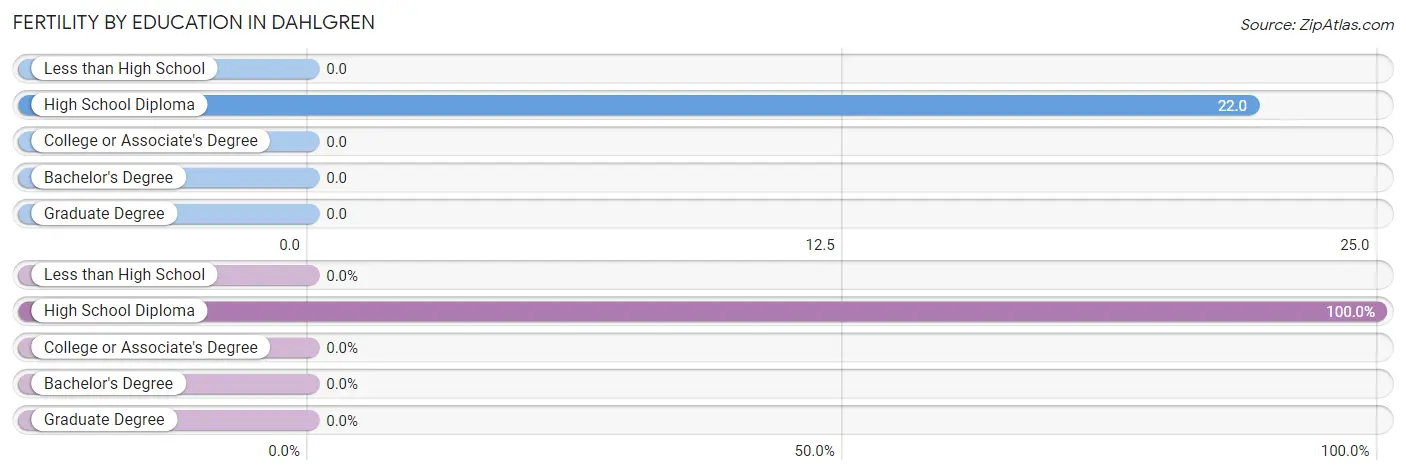
| Educational Attainment | Women with Births | Births / 1,000 Women |
| Less than High School | 0 (0.0%) | 0.0 |
| High School Diploma | 7 (100.0%) | 22.0 |
| College or Associate's Degree | 0 (0.0%) | 0.0 |
| Bachelor's Degree | 0 (0.0%) | 0.0 |
| Graduate Degree | 0 (0.0%) | 0.0 |
| Total | 7 (100.0%) | 8.0 |
Fertility by Education by Marriage Status in Dahlgren
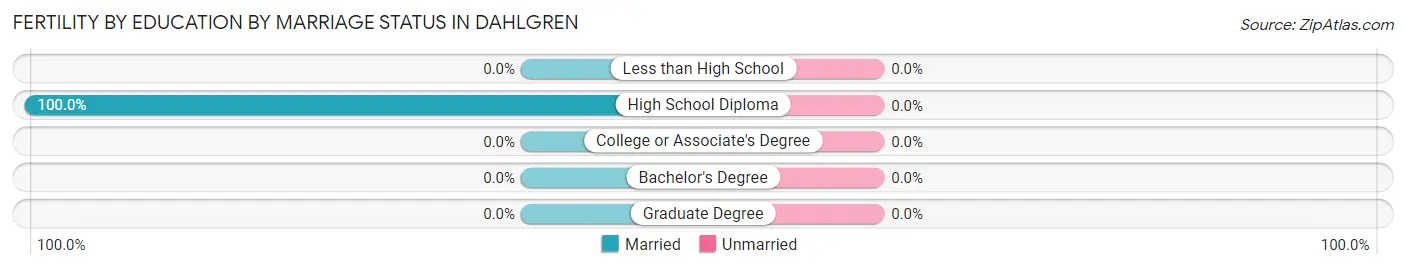
| Educational Attainment | Married | Unmarried |
| Less than High School | 0 (0.0%) | 0 (0.0%) |
| High School Diploma | 7 (100.0%) | 0 (0.0%) |
| College or Associate's Degree | 0 (0.0%) | 0 (0.0%) |
| Bachelor's Degree | 0 (0.0%) | 0 (0.0%) |
| Graduate Degree | 0 (0.0%) | 0 (0.0%) |
| Total | 7 (100.0%) | 0 (0.0%) |
Employment Characteristics in Dahlgren
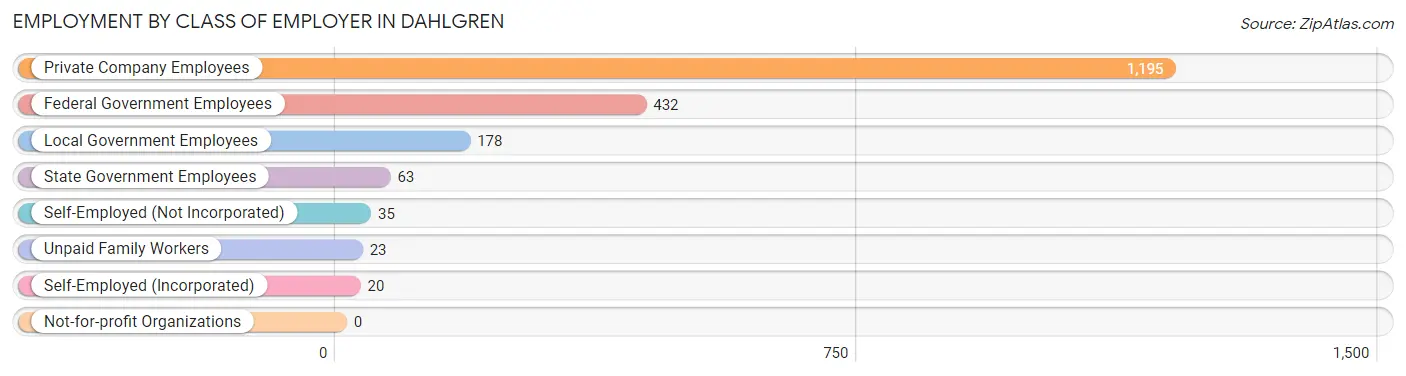
Employment by Class of Employer in Dahlgren
Among the 1,946 employed individuals in Dahlgren, private company employees (1,195 | 61.4%), federal government employees (432 | 22.2%), and local government employees (178 | 9.1%) make up the most common classes of employment.
| Employer Class | # Employees | % Employees |
| Private Company Employees | 1,195 | 61.4% |
| Self-Employed (Incorporated) | 20 | 1.0% |
| Self-Employed (Not Incorporated) | 35 | 1.8% |
| Not-for-profit Organizations | 0 | 0.0% |
| Local Government Employees | 178 | 9.1% |
| State Government Employees | 63 | 3.2% |
| Federal Government Employees | 432 | 22.2% |
| Unpaid Family Workers | 23 | 1.2% |
| Total | 1,946 | 100.0% |
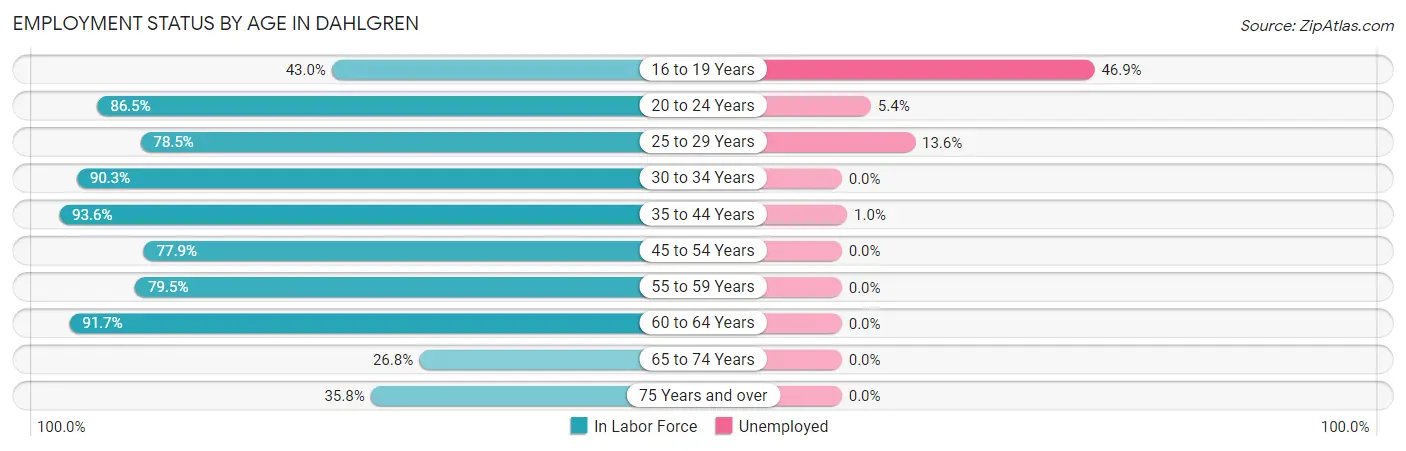
Employment Status by Age in Dahlgren
According to the labor force statistics for Dahlgren, out of the total population over 16 years of age (2,783), 73.7% or 2,051 individuals are in the labor force, with 3.9% or 80 of them unemployed. The age group with the highest labor force participation rate is 35 to 44 years, with 93.6% or 513 individuals in the labor force. Within the labor force, the 16 to 19 years age range has the highest percentage of unemployed individuals, with 46.9% or 30 of them being unemployed.
| Age Bracket | In Labor Force | Unemployed |
| 16 to 19 Years | 64 (43.0%) | 30 (46.9%) |
| 20 to 24 Years | 353 (86.5%) | 19 (5.4%) |
| 25 to 29 Years | 204 (78.5%) | 28 (13.6%) |
| 30 to 34 Years | 213 (90.3%) | 0 (0.0%) |
| 35 to 44 Years | 513 (93.6%) | 5 (1.0%) |
| 45 to 54 Years | 201 (77.9%) | 0 (0.0%) |
| 55 to 59 Years | 120 (79.5%) | 0 (0.0%) |
| 60 to 64 Years | 220 (91.7%) | 0 (0.0%) |
| 65 to 74 Years | 86 (26.8%) | 0 (0.0%) |
| 75 Years and over | 76 (35.8%) | 0 (0.0%) |
| Total | 2,051 (73.7%) | 80 (3.9%) |
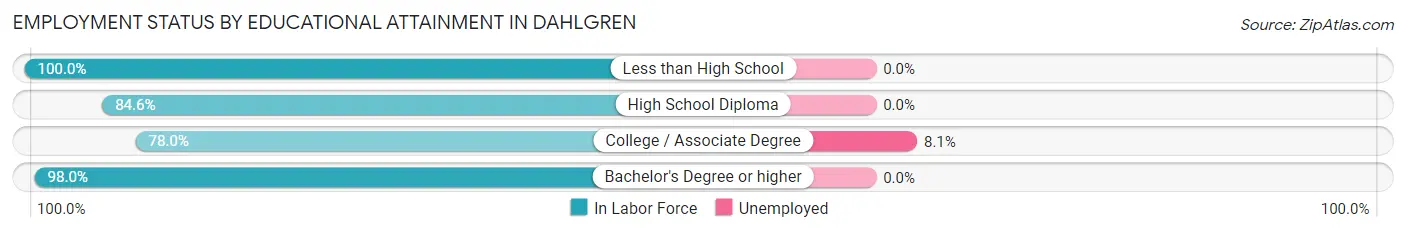
Employment Status by Educational Attainment in Dahlgren
According to labor force statistics for Dahlgren, 86.9% of individuals (1,471) out of the total population between 25 and 64 years of age (1,693) are in the labor force, with 2.2% or 32 of them being unemployed. The group with the highest labor force participation rate are those with the educational attainment of less than high school, with 100.0% or 32 individuals in the labor force. Within the labor force, individuals with college / associate degree education have the highest percentage of unemployment, with 8.1% or 32 of them being unemployed.
| Educational Attainment | In Labor Force | Unemployed |
| Less than High School | 32 (100.0%) | 0 (0.0%) |
| High School Diploma | 548 (84.6%) | 0 (0.0%) |
| College / Associate Degree | 397 (78.0%) | 41 (8.1%) |
| Bachelor's Degree or higher | 494 (98.0%) | 0 (0.0%) |
| Total | 1,471 (86.9%) | 37 (2.2%) |
Employment Occupations by Sex in Dahlgren
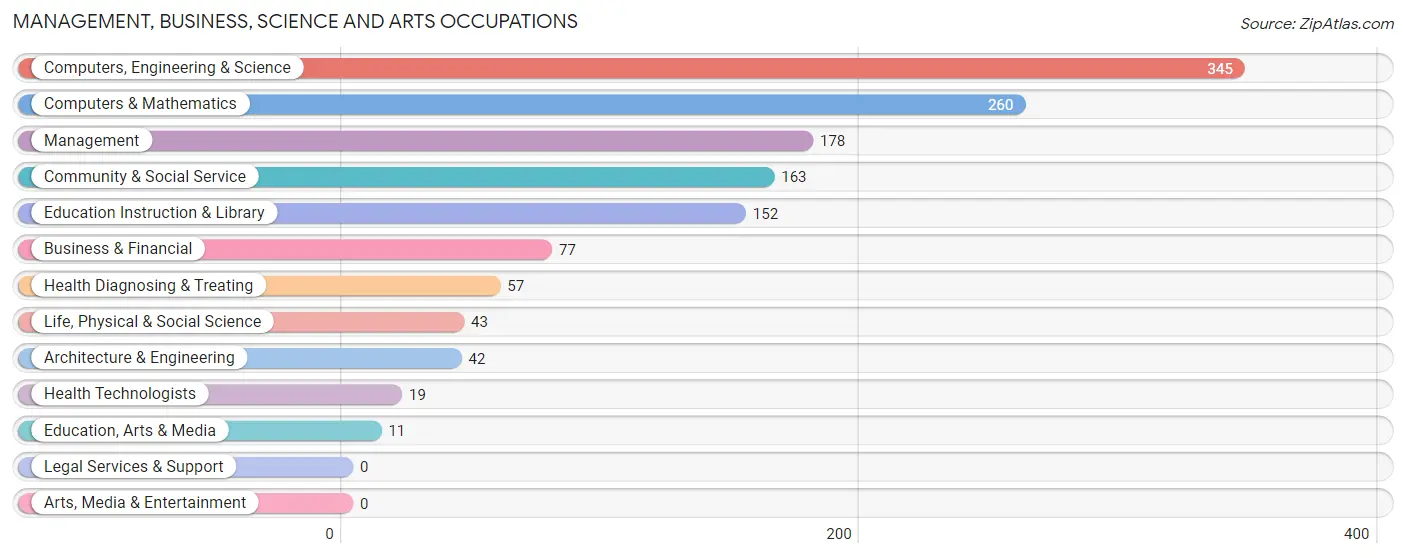
Management, Business, Science and Arts Occupations
The most common Management, Business, Science and Arts occupations in Dahlgren are Computers, Engineering & Science (345 | 18.2%), Computers & Mathematics (260 | 13.7%), Management (178 | 9.4%), Community & Social Service (163 | 8.6%), and Education Instruction & Library (152 | 8.0%).
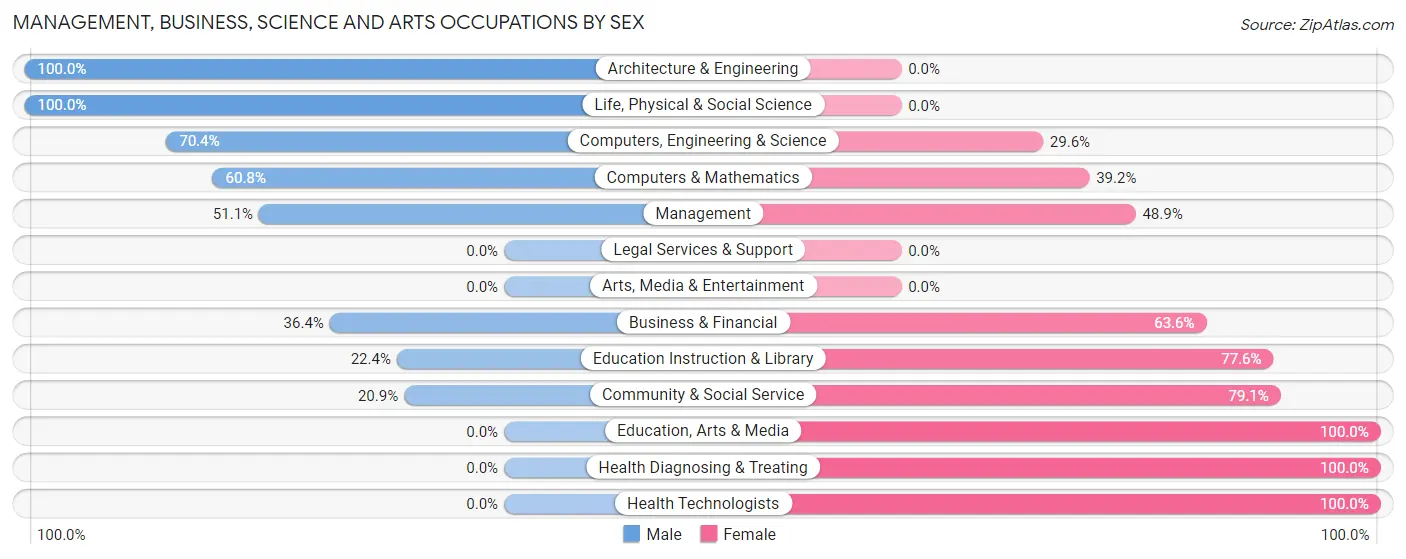
Management, Business, Science and Arts Occupations by Sex
Within the Management, Business, Science and Arts occupations in Dahlgren, the most male-oriented occupations are Architecture & Engineering (100.0%), Life, Physical & Social Science (100.0%), and Computers, Engineering & Science (70.4%), while the most female-oriented occupations are Education, Arts & Media (100.0%), Health Diagnosing & Treating (100.0%), and Health Technologists (100.0%).
| Occupation | Male | Female |
| Management | 91 (51.1%) | 87 (48.9%) |
| Business & Financial | 28 (36.4%) | 49 (63.6%) |
| Computers, Engineering & Science | 243 (70.4%) | 102 (29.6%) |
| Computers & Mathematics | 158 (60.8%) | 102 (39.2%) |
| Architecture & Engineering | 42 (100.0%) | 0 (0.0%) |
| Life, Physical & Social Science | 43 (100.0%) | 0 (0.0%) |
| Community & Social Service | 34 (20.9%) | 129 (79.1%) |
| Education, Arts & Media | 0 (0.0%) | 11 (100.0%) |
| Legal Services & Support | 0 (0.0%) | 0 (0.0%) |
| Education Instruction & Library | 34 (22.4%) | 118 (77.6%) |
| Arts, Media & Entertainment | 0 (0.0%) | 0 (0.0%) |
| Health Diagnosing & Treating | 0 (0.0%) | 57 (100.0%) |
| Health Technologists | 0 (0.0%) | 19 (100.0%) |
| Total (Category) | 396 (48.3%) | 424 (51.7%) |
| Total (Overall) | 1,001 (52.8%) | 896 (47.2%) |
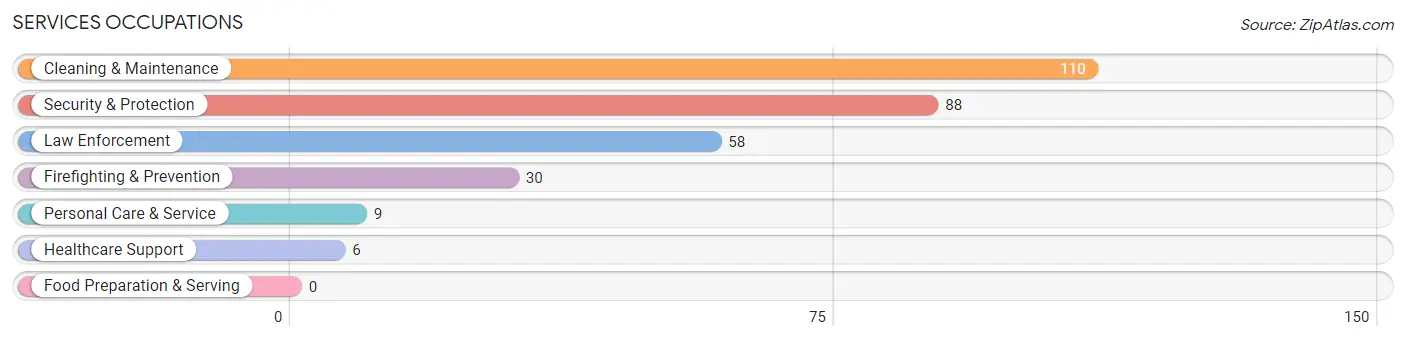
Services Occupations
The most common Services occupations in Dahlgren are Cleaning & Maintenance (110 | 5.8%), Security & Protection (88 | 4.6%), Law Enforcement (58 | 3.1%), Firefighting & Prevention (30 | 1.6%), and Personal Care & Service (9 | 0.5%).
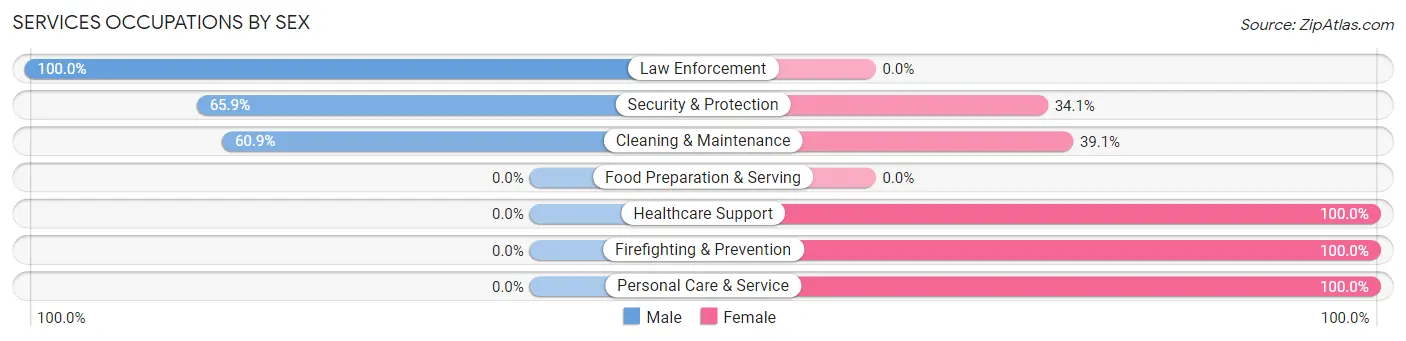
Services Occupations by Sex
Within the Services occupations in Dahlgren, the most male-oriented occupations are Law Enforcement (100.0%), Security & Protection (65.9%), and Cleaning & Maintenance (60.9%), while the most female-oriented occupations are Healthcare Support (100.0%), Firefighting & Prevention (100.0%), and Personal Care & Service (100.0%).
| Occupation | Male | Female |
| Healthcare Support | 0 (0.0%) | 6 (100.0%) |
| Security & Protection | 58 (65.9%) | 30 (34.1%) |
| Firefighting & Prevention | 0 (0.0%) | 30 (100.0%) |
| Law Enforcement | 58 (100.0%) | 0 (0.0%) |
| Food Preparation & Serving | 0 (0.0%) | 0 (0.0%) |
| Cleaning & Maintenance | 67 (60.9%) | 43 (39.1%) |
| Personal Care & Service | 0 (0.0%) | 9 (100.0%) |
| Total (Category) | 125 (58.7%) | 88 (41.3%) |
| Total (Overall) | 1,001 (52.8%) | 896 (47.2%) |
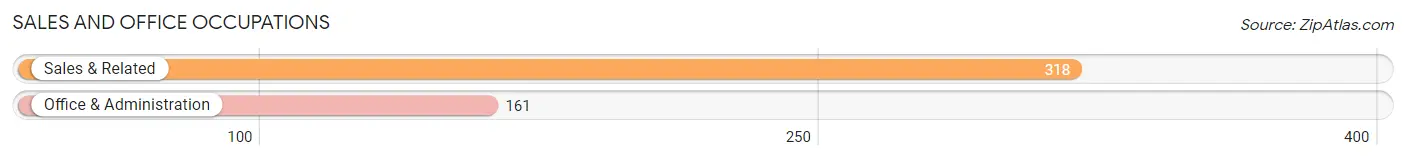
Sales and Office Occupations
The most common Sales and Office occupations in Dahlgren are Sales & Related (318 | 16.8%), and Office & Administration (161 | 8.5%).
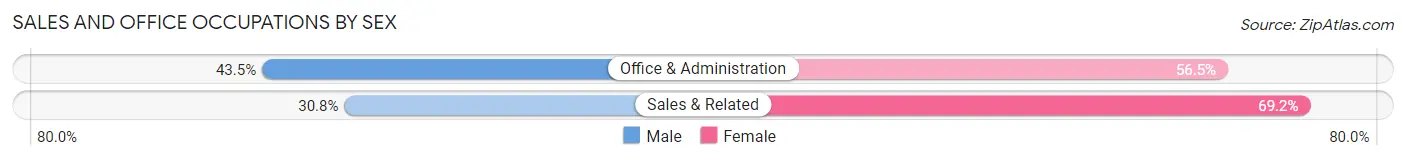
Sales and Office Occupations by Sex
| Occupation | Male | Female |
| Sales & Related | 98 (30.8%) | 220 (69.2%) |
| Office & Administration | 70 (43.5%) | 91 (56.5%) |
| Total (Category) | 168 (35.1%) | 311 (64.9%) |
| Total (Overall) | 1,001 (52.8%) | 896 (47.2%) |
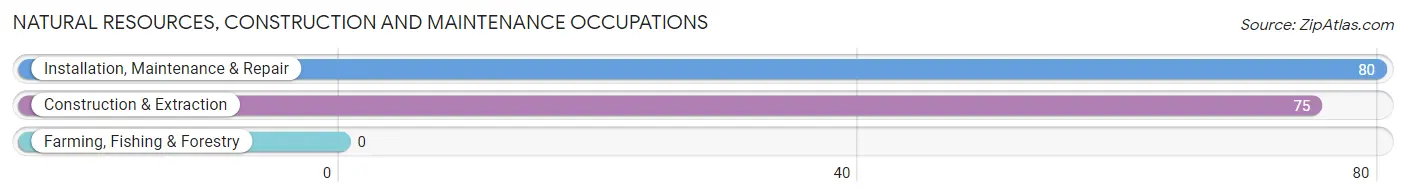
Natural Resources, Construction and Maintenance Occupations
The most common Natural Resources, Construction and Maintenance occupations in Dahlgren are Installation, Maintenance & Repair (80 | 4.2%), and Construction & Extraction (75 | 4.0%).
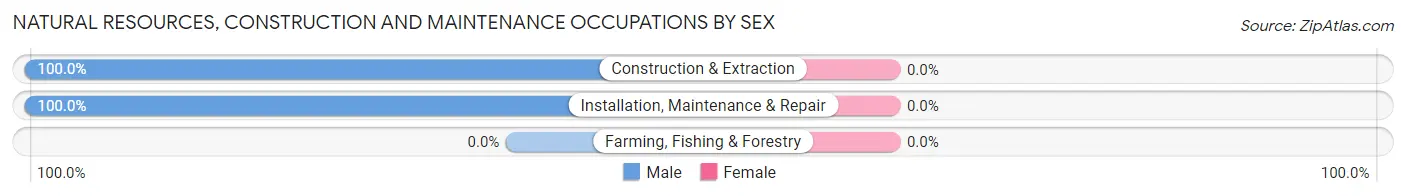
Natural Resources, Construction and Maintenance Occupations by Sex
| Occupation | Male | Female |
| Farming, Fishing & Forestry | 0 (0.0%) | 0 (0.0%) |
| Construction & Extraction | 75 (100.0%) | 0 (0.0%) |
| Installation, Maintenance & Repair | 80 (100.0%) | 0 (0.0%) |
| Total (Category) | 155 (100.0%) | 0 (0.0%) |
| Total (Overall) | 1,001 (52.8%) | 896 (47.2%) |
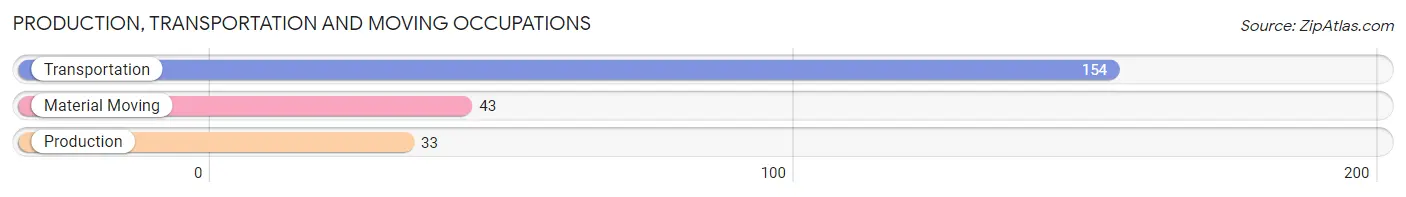
Production, Transportation and Moving Occupations
The most common Production, Transportation and Moving occupations in Dahlgren are Transportation (154 | 8.1%), Material Moving (43 | 2.3%), and Production (33 | 1.7%).
Production, Transportation and Moving Occupations by Sex
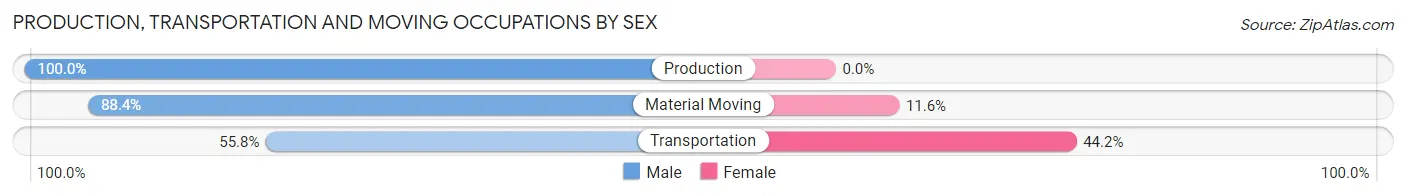
| Occupation | Male | Female |
| Production | 33 (100.0%) | 0 (0.0%) |
| Transportation | 86 (55.8%) | 68 (44.2%) |
| Material Moving | 38 (88.4%) | 5 (11.6%) |
| Total (Category) | 157 (68.3%) | 73 (31.7%) |
| Total (Overall) | 1,001 (52.8%) | 896 (47.2%) |
Employment Industries by Sex in Dahlgren
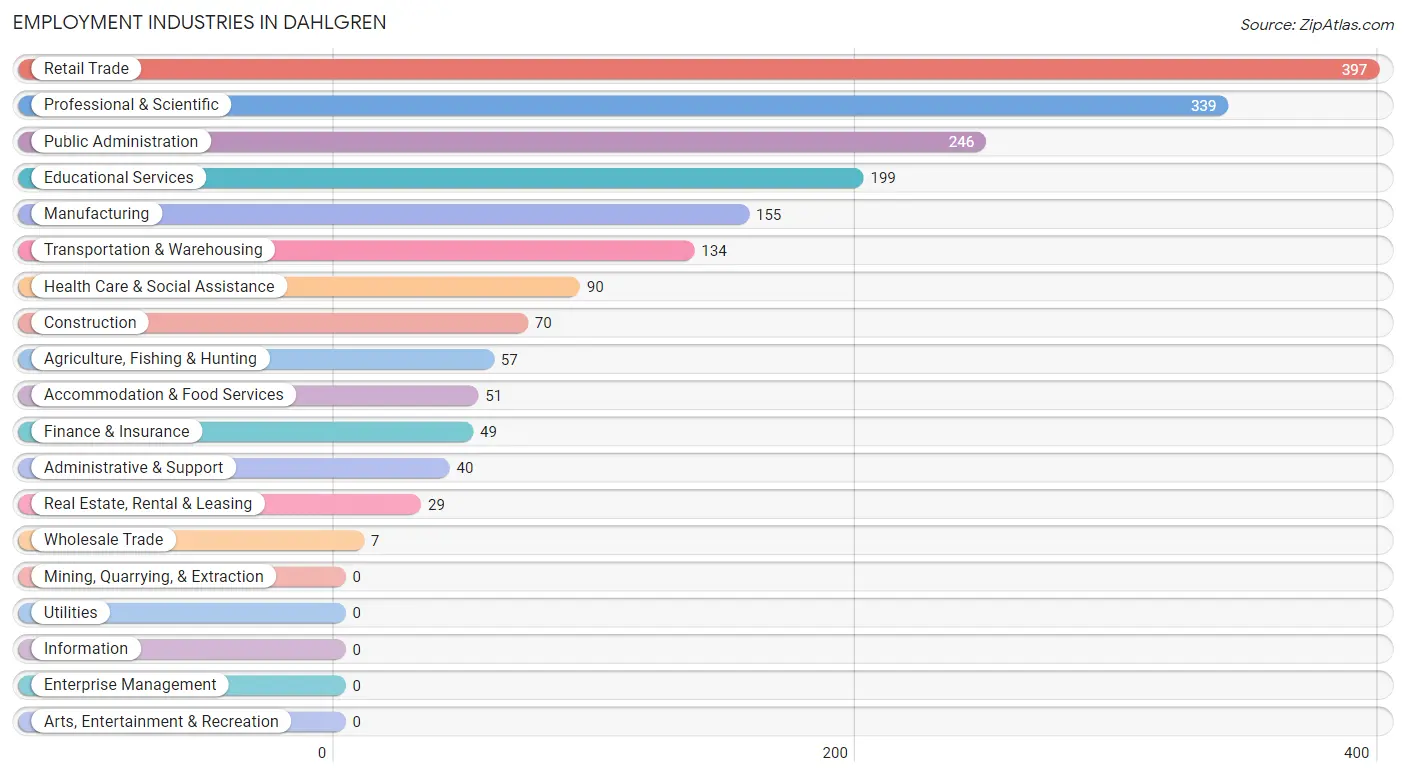
Employment Industries in Dahlgren
The major employment industries in Dahlgren include Retail Trade (397 | 20.9%), Professional & Scientific (339 | 17.9%), Public Administration (246 | 13.0%), Educational Services (199 | 10.5%), and Manufacturing (155 | 8.2%).
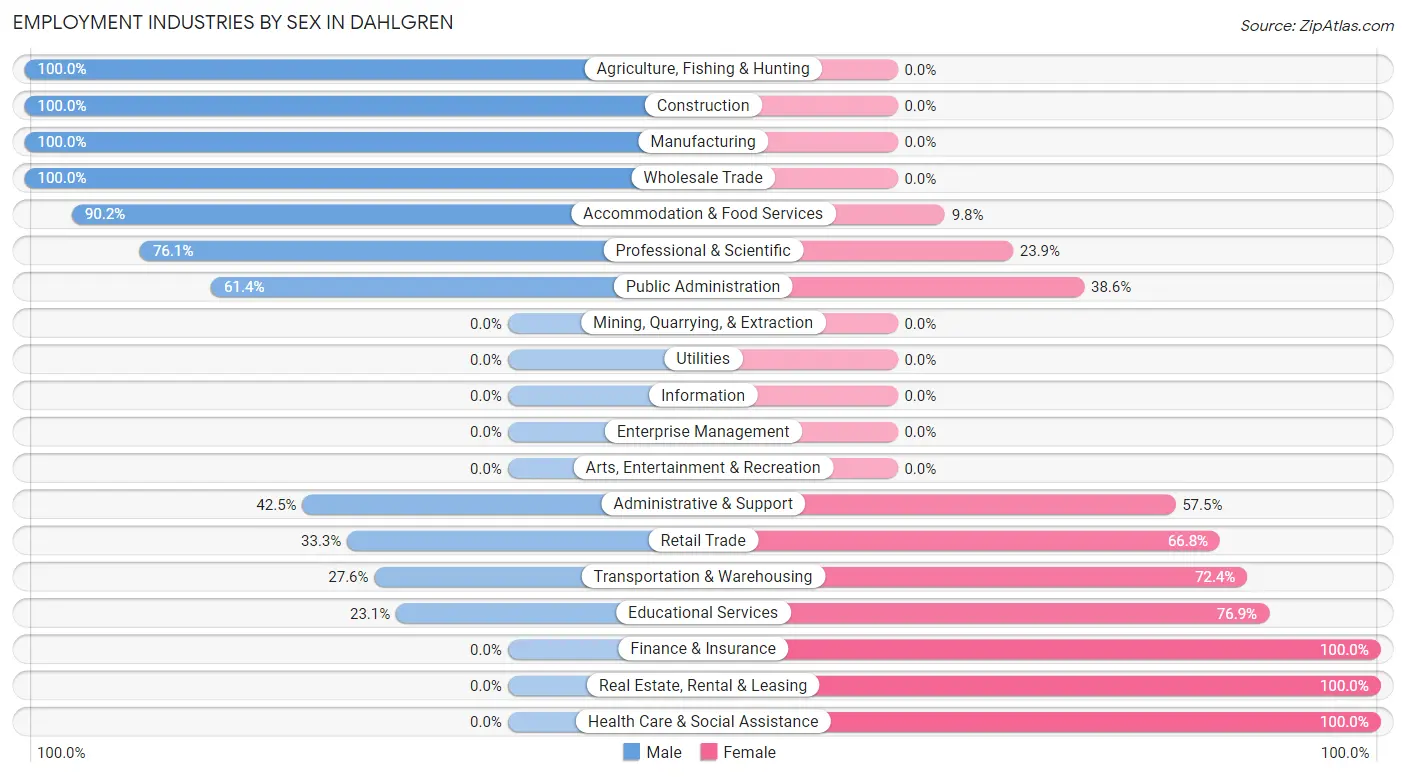
Employment Industries by Sex in Dahlgren
The Dahlgren industries that see more men than women are Agriculture, Fishing & Hunting (100.0%), Construction (100.0%), and Manufacturing (100.0%), whereas the industries that tend to have a higher number of women are Finance & Insurance (100.0%), Real Estate, Rental & Leasing (100.0%), and Health Care & Social Assistance (100.0%).
| Industry | Male | Female |
| Agriculture, Fishing & Hunting | 57 (100.0%) | 0 (0.0%) |
| Mining, Quarrying, & Extraction | 0 (0.0%) | 0 (0.0%) |
| Construction | 70 (100.0%) | 0 (0.0%) |
| Manufacturing | 155 (100.0%) | 0 (0.0%) |
| Wholesale Trade | 7 (100.0%) | 0 (0.0%) |
| Retail Trade | 132 (33.3%) | 265 (66.7%) |
| Transportation & Warehousing | 37 (27.6%) | 97 (72.4%) |
| Utilities | 0 (0.0%) | 0 (0.0%) |
| Information | 0 (0.0%) | 0 (0.0%) |
| Finance & Insurance | 0 (0.0%) | 49 (100.0%) |
| Real Estate, Rental & Leasing | 0 (0.0%) | 29 (100.0%) |
| Professional & Scientific | 258 (76.1%) | 81 (23.9%) |
| Enterprise Management | 0 (0.0%) | 0 (0.0%) |
| Administrative & Support | 17 (42.5%) | 23 (57.5%) |
| Educational Services | 46 (23.1%) | 153 (76.9%) |
| Health Care & Social Assistance | 0 (0.0%) | 90 (100.0%) |
| Arts, Entertainment & Recreation | 0 (0.0%) | 0 (0.0%) |
| Accommodation & Food Services | 46 (90.2%) | 5 (9.8%) |
| Public Administration | 151 (61.4%) | 95 (38.6%) |
| Total | 1,001 (52.8%) | 896 (47.2%) |
Education in Dahlgren
School Enrollment in Dahlgren
The most common levels of schooling among the 845 students in Dahlgren are middle school (242 | 28.6%), elementary school (200 | 23.7%), and high school (180 | 21.3%).
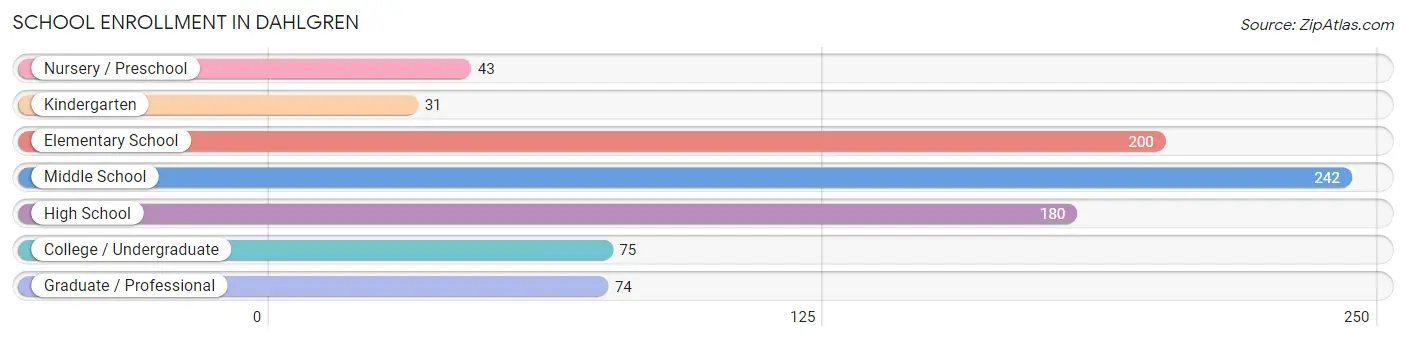
| School Level | # Students | % Students |
| Nursery / Preschool | 43 | 5.1% |
| Kindergarten | 31 | 3.7% |
| Elementary School | 200 | 23.7% |
| Middle School | 242 | 28.6% |
| High School | 180 | 21.3% |
| College / Undergraduate | 75 | 8.9% |
| Graduate / Professional | 74 | 8.8% |
| Total | 845 | 100.0% |
School Enrollment by Age by Funding Source in Dahlgren
Out of a total of 845 students who are enrolled in schools in Dahlgren, 148 (17.5%) attend a private institution, while the remaining 697 (82.5%) are enrolled in public schools. The age group of 25 to 34 year olds has the highest likelihood of being enrolled in private schools, with 12 (35.3% in the age bracket) enrolled. Conversely, the age group of 18 to 19 year olds has the lowest likelihood of being enrolled in a private school, with 41 (100.0% in the age bracket) attending a public institution.
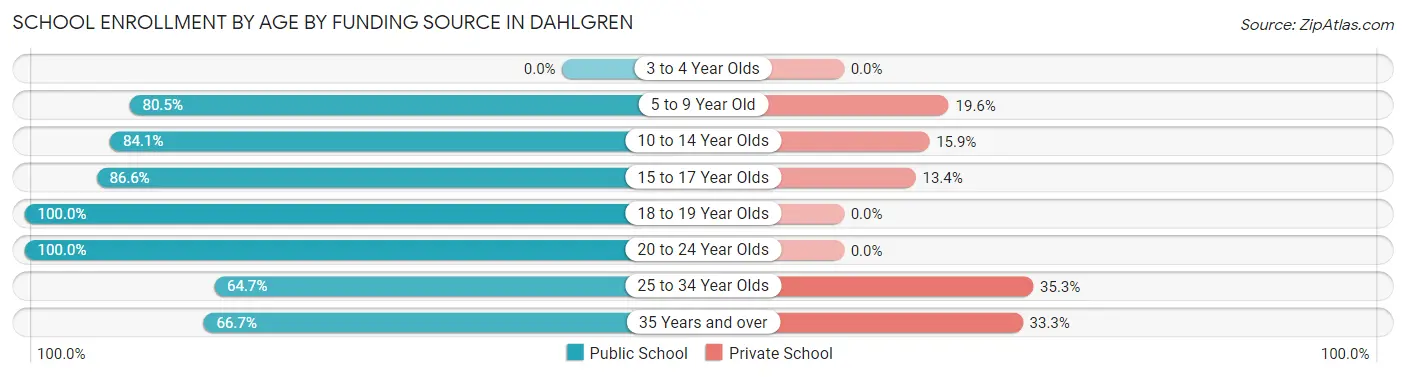
| Age Bracket | Public School | Private School |
| 3 to 4 Year Olds | 0 (0.0%) | 0 (0.0%) |
| 5 to 9 Year Old | 214 (80.4%) | 52 (19.6%) |
| 10 to 14 Year Olds | 227 (84.1%) | 43 (15.9%) |
| 15 to 17 Year Olds | 97 (86.6%) | 15 (13.4%) |
| 18 to 19 Year Olds | 41 (100.0%) | 0 (0.0%) |
| 20 to 24 Year Olds | 44 (100.0%) | 0 (0.0%) |
| 25 to 34 Year Olds | 22 (64.7%) | 12 (35.3%) |
| 35 Years and over | 52 (66.7%) | 26 (33.3%) |
| Total | 697 (82.5%) | 148 (17.5%) |
Educational Attainment by Field of Study in Dahlgren
Computers & mathematics (194 | 23.9%), engineering (104 | 12.8%), education (78 | 9.6%), psychology (75 | 9.2%), and bio, nature & agricultural (66 | 8.1%) are the most common fields of study among 813 individuals in Dahlgren who have obtained a bachelor's degree or higher.
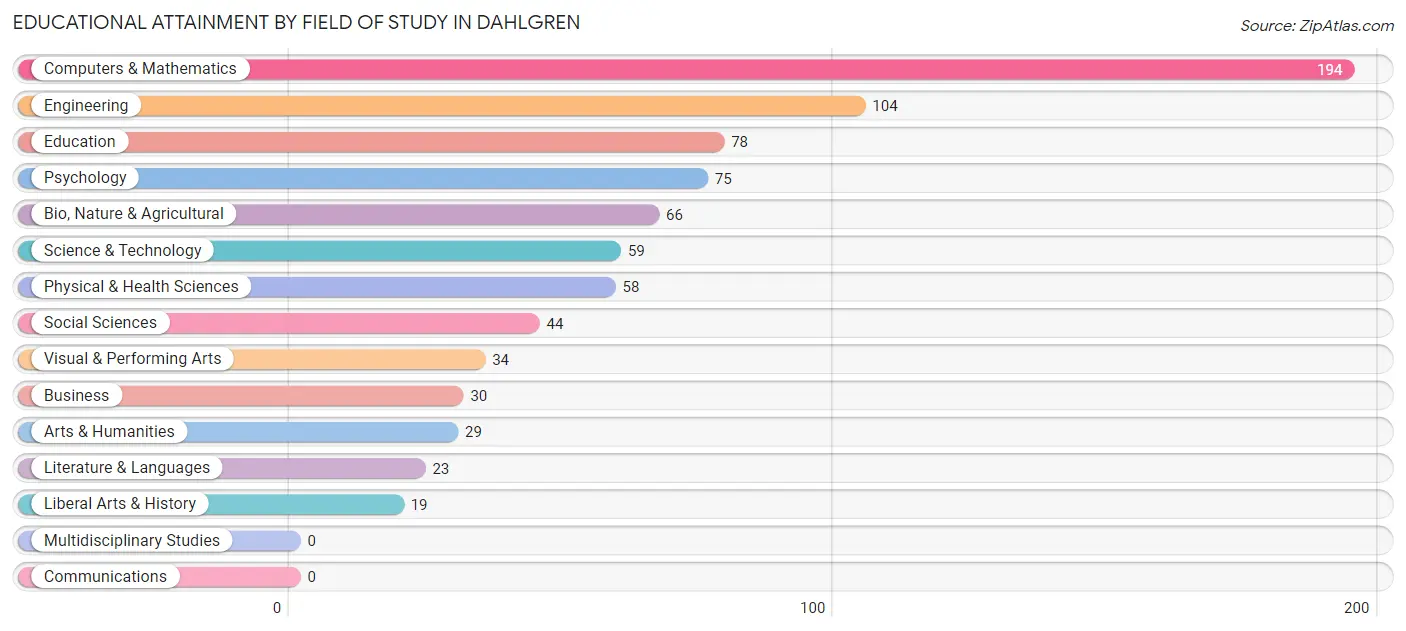
| Field of Study | # Graduates | % Graduates |
| Computers & Mathematics | 194 | 23.9% |
| Bio, Nature & Agricultural | 66 | 8.1% |
| Physical & Health Sciences | 58 | 7.1% |
| Psychology | 75 | 9.2% |
| Social Sciences | 44 | 5.4% |
| Engineering | 104 | 12.8% |
| Multidisciplinary Studies | 0 | 0.0% |
| Science & Technology | 59 | 7.3% |
| Business | 30 | 3.7% |
| Education | 78 | 9.6% |
| Literature & Languages | 23 | 2.8% |
| Liberal Arts & History | 19 | 2.3% |
| Visual & Performing Arts | 34 | 4.2% |
| Communications | 0 | 0.0% |
| Arts & Humanities | 29 | 3.6% |
| Total | 813 | 100.0% |
Transportation & Commute in Dahlgren
Vehicle Availability by Sex in Dahlgren
The most prevalent vehicle ownership categories in Dahlgren are males with 2 vehicles (436, accounting for 41.5%) and females with 2 vehicles (399, making up 48.7%).
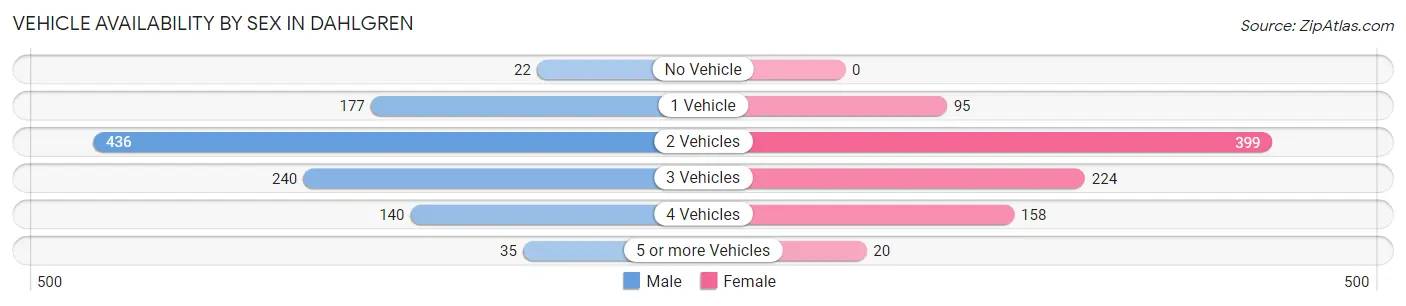
| Vehicles Available | Male | Female |
| No Vehicle | 22 (2.1%) | 0 (0.0%) |
| 1 Vehicle | 177 (16.9%) | 95 (10.6%) |
| 2 Vehicles | 436 (41.5%) | 399 (44.5%) |
| 3 Vehicles | 240 (22.9%) | 224 (25.0%) |
| 4 Vehicles | 140 (13.3%) | 158 (17.6%) |
| 5 or more Vehicles | 35 (3.3%) | 20 (2.2%) |
| Total | 1,050 (100.0%) | 896 (100.0%) |
Commute Time in Dahlgren
The most frequently occuring commute durations in Dahlgren are 10 to 14 minutes (300 commuters, 17.1%), 5 to 9 minutes (255 commuters, 14.5%), and 15 to 19 minutes (208 commuters, 11.8%).
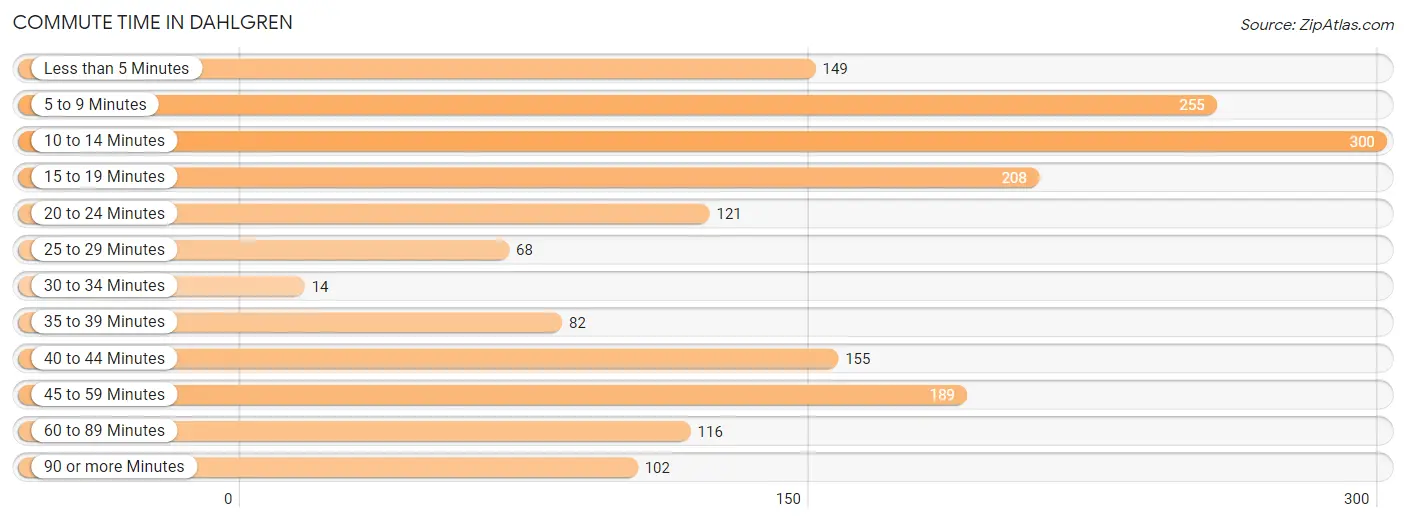
| Commute Time | # Commuters | % Commuters |
| Less than 5 Minutes | 149 | 8.5% |
| 5 to 9 Minutes | 255 | 14.5% |
| 10 to 14 Minutes | 300 | 17.1% |
| 15 to 19 Minutes | 208 | 11.8% |
| 20 to 24 Minutes | 121 | 6.9% |
| 25 to 29 Minutes | 68 | 3.9% |
| 30 to 34 Minutes | 14 | 0.8% |
| 35 to 39 Minutes | 82 | 4.7% |
| 40 to 44 Minutes | 155 | 8.8% |
| 45 to 59 Minutes | 189 | 10.7% |
| 60 to 89 Minutes | 116 | 6.6% |
| 90 or more Minutes | 102 | 5.8% |
Commute Time by Sex in Dahlgren
The most common commute times in Dahlgren are 10 to 14 minutes (276 commuters, 28.3%) for males and 15 to 19 minutes (170 commuters, 21.7%) for females.
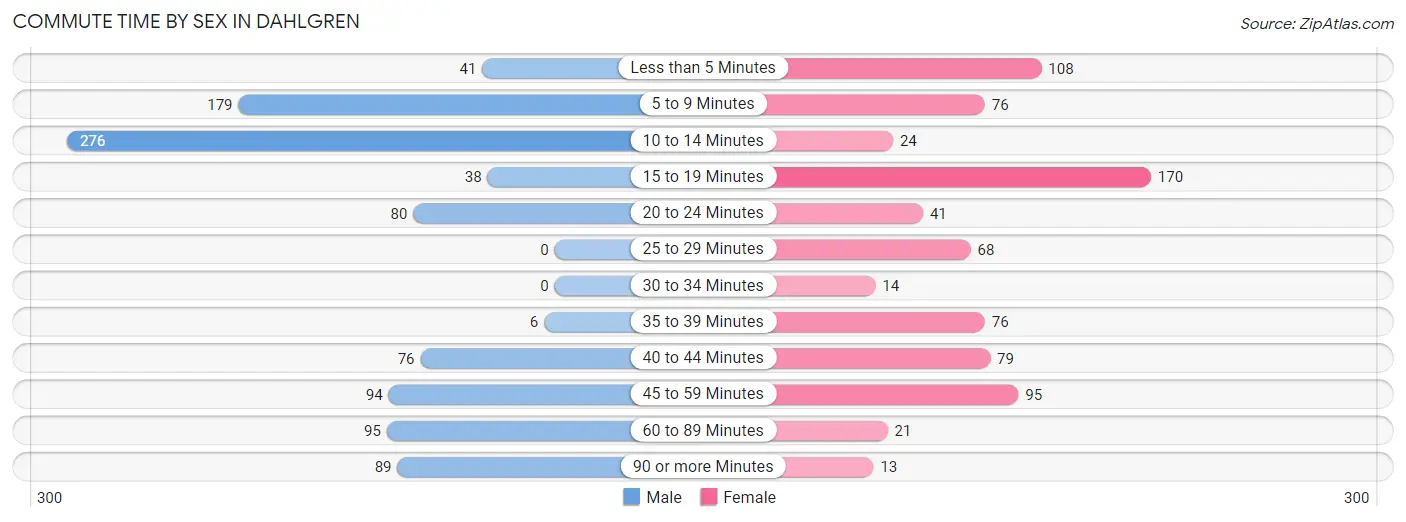
| Commute Time | Male | Female |
| Less than 5 Minutes | 41 (4.2%) | 108 (13.8%) |
| 5 to 9 Minutes | 179 (18.4%) | 76 (9.7%) |
| 10 to 14 Minutes | 276 (28.3%) | 24 (3.1%) |
| 15 to 19 Minutes | 38 (3.9%) | 170 (21.7%) |
| 20 to 24 Minutes | 80 (8.2%) | 41 (5.2%) |
| 25 to 29 Minutes | 0 (0.0%) | 68 (8.7%) |
| 30 to 34 Minutes | 0 (0.0%) | 14 (1.8%) |
| 35 to 39 Minutes | 6 (0.6%) | 76 (9.7%) |
| 40 to 44 Minutes | 76 (7.8%) | 79 (10.1%) |
| 45 to 59 Minutes | 94 (9.7%) | 95 (12.1%) |
| 60 to 89 Minutes | 95 (9.8%) | 21 (2.7%) |
| 90 or more Minutes | 89 (9.1%) | 13 (1.7%) |
Time of Departure to Work by Sex in Dahlgren
The most frequent times of departure to work in Dahlgren are 6:30 AM to 6:59 AM (218, 22.4%) for males and 6:30 AM to 6:59 AM (160, 20.4%) for females.
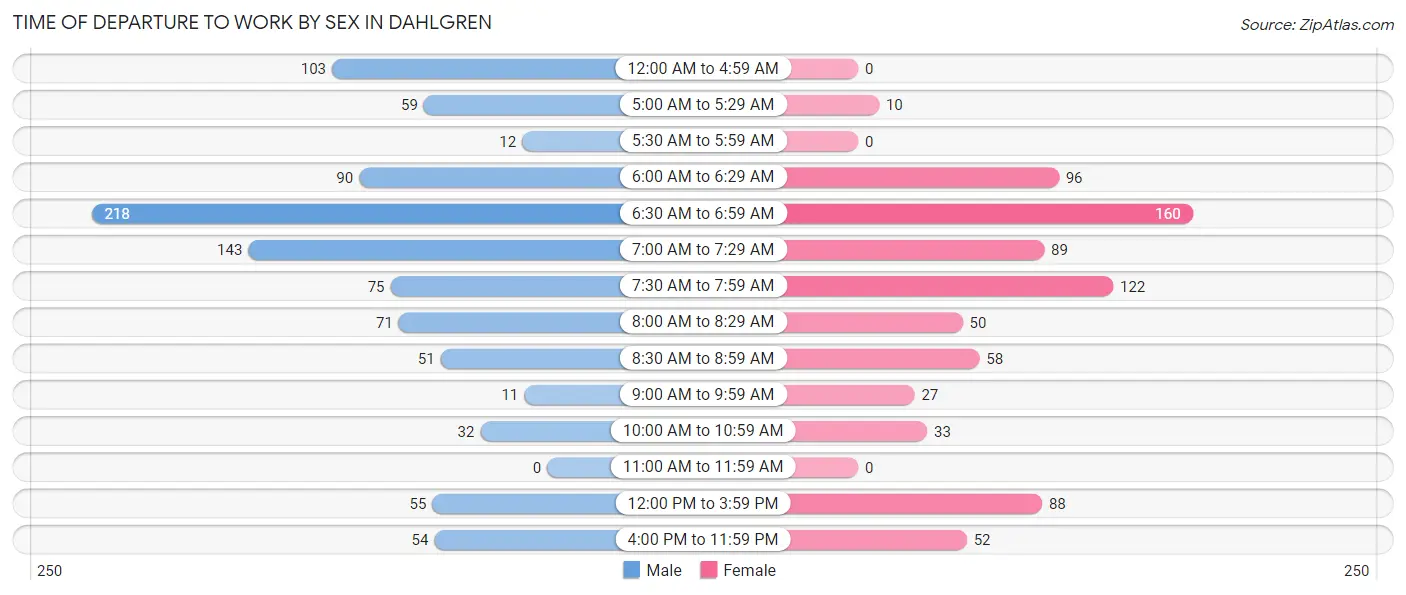
| Time of Departure | Male | Female |
| 12:00 AM to 4:59 AM | 103 (10.6%) | 0 (0.0%) |
| 5:00 AM to 5:29 AM | 59 (6.1%) | 10 (1.3%) |
| 5:30 AM to 5:59 AM | 12 (1.2%) | 0 (0.0%) |
| 6:00 AM to 6:29 AM | 90 (9.2%) | 96 (12.2%) |
| 6:30 AM to 6:59 AM | 218 (22.4%) | 160 (20.4%) |
| 7:00 AM to 7:29 AM | 143 (14.7%) | 89 (11.3%) |
| 7:30 AM to 7:59 AM | 75 (7.7%) | 122 (15.5%) |
| 8:00 AM to 8:29 AM | 71 (7.3%) | 50 (6.4%) |
| 8:30 AM to 8:59 AM | 51 (5.2%) | 58 (7.4%) |
| 9:00 AM to 9:59 AM | 11 (1.1%) | 27 (3.4%) |
| 10:00 AM to 10:59 AM | 32 (3.3%) | 33 (4.2%) |
| 11:00 AM to 11:59 AM | 0 (0.0%) | 0 (0.0%) |
| 12:00 PM to 3:59 PM | 55 (5.7%) | 88 (11.2%) |
| 4:00 PM to 11:59 PM | 54 (5.5%) | 52 (6.6%) |
| Total | 974 (100.0%) | 785 (100.0%) |
Housing Occupancy in Dahlgren
Occupancy by Ownership in Dahlgren
Of the total 1,267 dwellings in Dahlgren, owner-occupied units account for 749 (59.1%), while renter-occupied units make up 518 (40.9%).
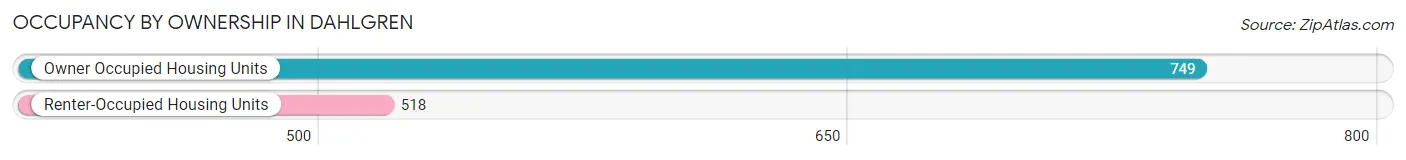
| Occupancy | # Housing Units | % Housing Units |
| Owner Occupied Housing Units | 749 | 59.1% |
| Renter-Occupied Housing Units | 518 | 40.9% |
| Total Occupied Housing Units | 1,267 | 100.0% |
Occupancy by Household Size in Dahlgren
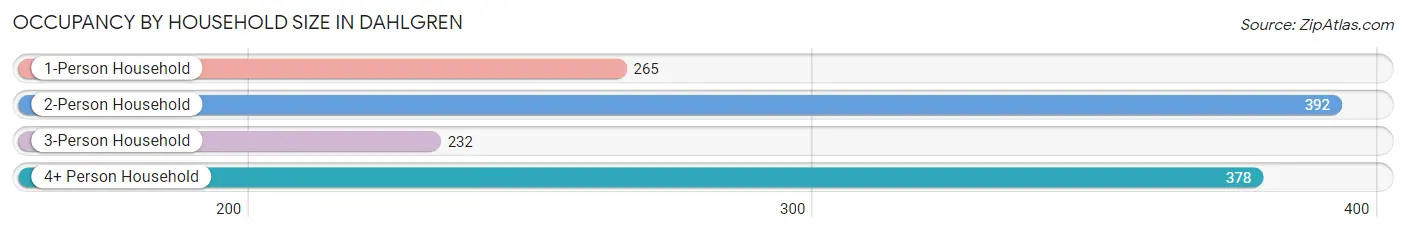
| Household Size | # Housing Units | % Housing Units |
| 1-Person Household | 265 | 20.9% |
| 2-Person Household | 392 | 30.9% |
| 3-Person Household | 232 | 18.3% |
| 4+ Person Household | 378 | 29.8% |
| Total Housing Units | 1,267 | 100.0% |
Occupancy by Ownership by Household Size in Dahlgren
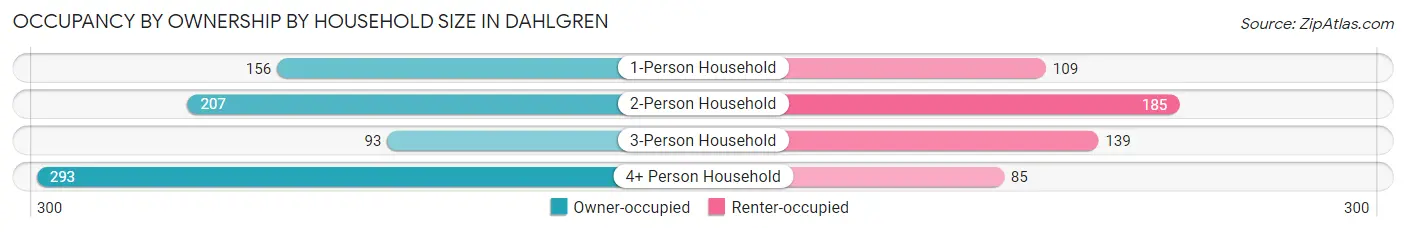
| Household Size | Owner-occupied | Renter-occupied |
| 1-Person Household | 156 (58.9%) | 109 (41.1%) |
| 2-Person Household | 207 (52.8%) | 185 (47.2%) |
| 3-Person Household | 93 (40.1%) | 139 (59.9%) |
| 4+ Person Household | 293 (77.5%) | 85 (22.5%) |
| Total Housing Units | 749 (59.1%) | 518 (40.9%) |
Occupancy by Educational Attainment in Dahlgren
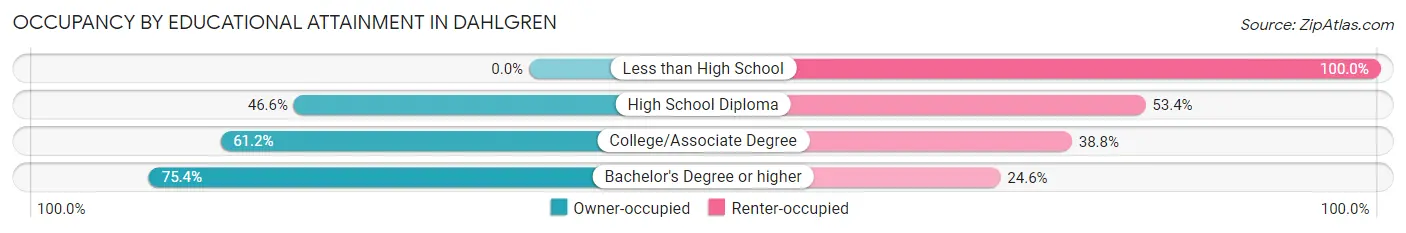
| Household Size | Owner-occupied | Renter-occupied |
| Less than High School | 0 (0.0%) | 59 (100.0%) |
| High School Diploma | 186 (46.6%) | 213 (53.4%) |
| College/Associate Degree | 202 (61.2%) | 128 (38.8%) |
| Bachelor's Degree or higher | 361 (75.4%) | 118 (24.6%) |
Occupancy by Age of Householder in Dahlgren
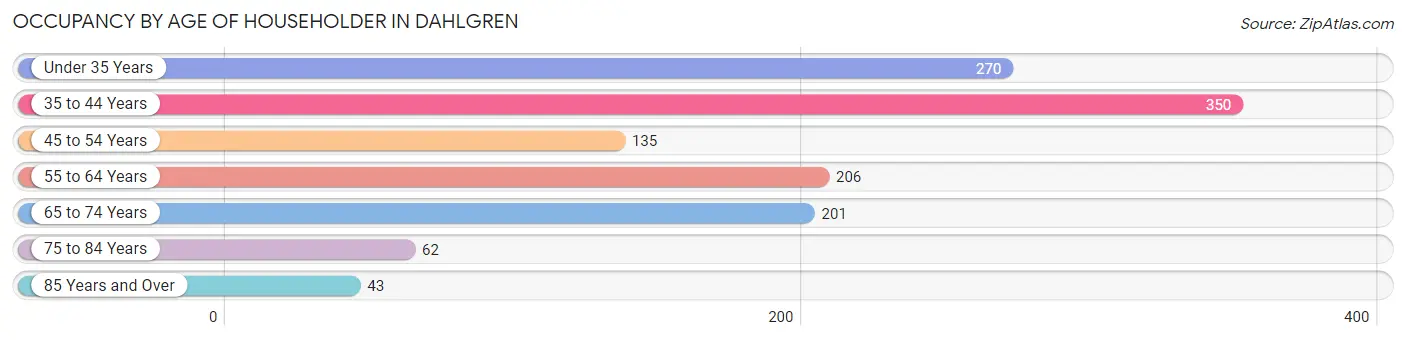
| Age Bracket | # Households | % Households |
| Under 35 Years | 270 | 21.3% |
| 35 to 44 Years | 350 | 27.6% |
| 45 to 54 Years | 135 | 10.7% |
| 55 to 64 Years | 206 | 16.3% |
| 65 to 74 Years | 201 | 15.9% |
| 75 to 84 Years | 62 | 4.9% |
| 85 Years and Over | 43 | 3.4% |
| Total | 1,267 | 100.0% |
Housing Finances in Dahlgren
Median Income by Occupancy in Dahlgren
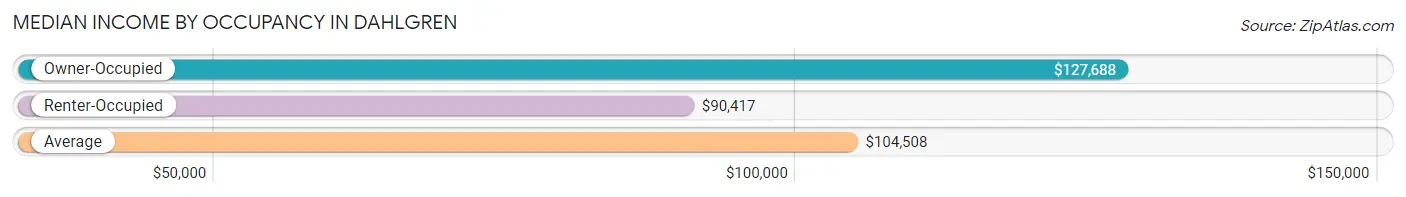
| Occupancy Type | # Households | Median Income |
| Owner-Occupied | 749 (59.1%) | $127,688 |
| Renter-Occupied | 518 (40.9%) | $90,417 |
| Average | 1,267 (100.0%) | $104,508 |
Occupancy by Householder Income Bracket in Dahlgren
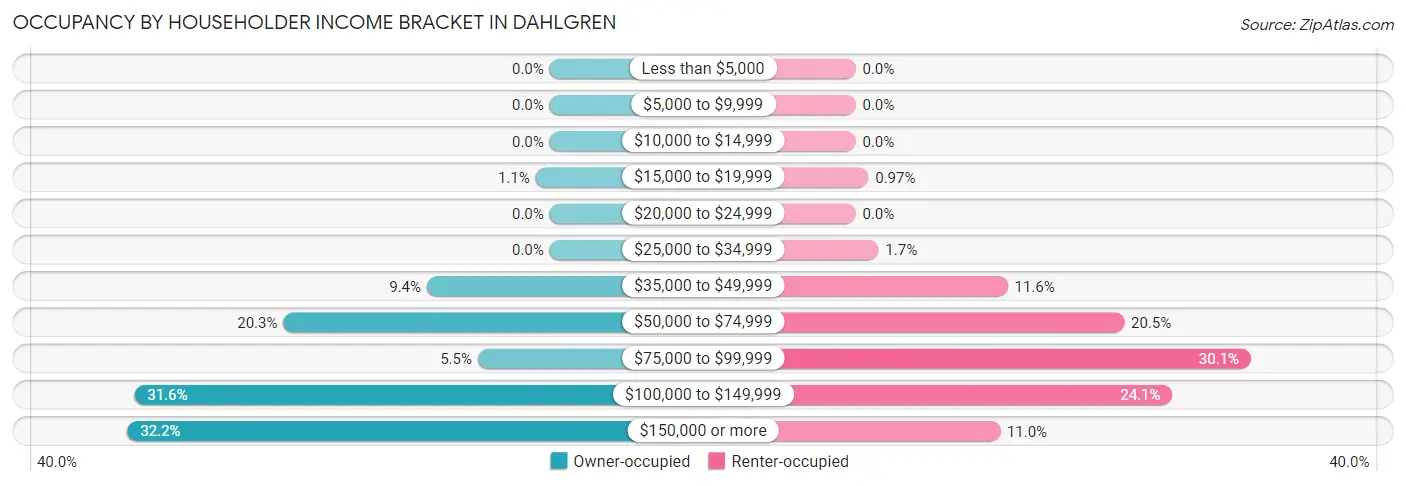
| Income Bracket | Owner-occupied | Renter-occupied |
| Less than $5,000 | 0 (0.0%) | 0 (0.0%) |
| $5,000 to $9,999 | 0 (0.0%) | 0 (0.0%) |
| $10,000 to $14,999 | 0 (0.0%) | 0 (0.0%) |
| $15,000 to $19,999 | 8 (1.1%) | 5 (1.0%) |
| $20,000 to $24,999 | 0 (0.0%) | 0 (0.0%) |
| $25,000 to $34,999 | 0 (0.0%) | 9 (1.7%) |
| $35,000 to $49,999 | 70 (9.3%) | 60 (11.6%) |
| $50,000 to $74,999 | 152 (20.3%) | 106 (20.5%) |
| $75,000 to $99,999 | 41 (5.5%) | 156 (30.1%) |
| $100,000 to $149,999 | 237 (31.6%) | 125 (24.1%) |
| $150,000 or more | 241 (32.2%) | 57 (11.0%) |
| Total | 749 (100.0%) | 518 (100.0%) |
Monthly Housing Cost Tiers in Dahlgren
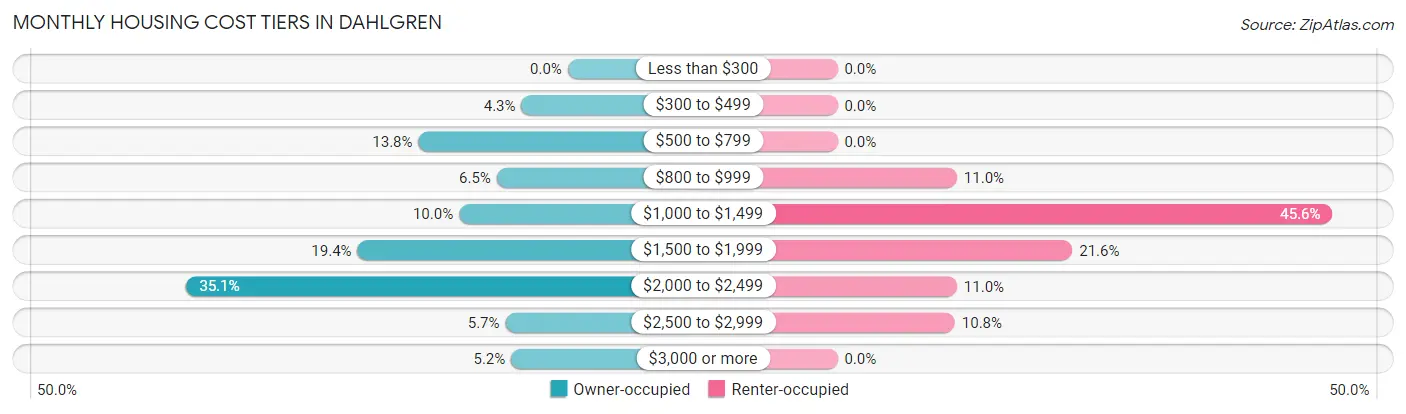
| Monthly Cost | Owner-occupied | Renter-occupied |
| Less than $300 | 0 (0.0%) | 0 (0.0%) |
| $300 to $499 | 32 (4.3%) | 0 (0.0%) |
| $500 to $799 | 103 (13.8%) | 0 (0.0%) |
| $800 to $999 | 49 (6.5%) | 57 (11.0%) |
| $1,000 to $1,499 | 75 (10.0%) | 236 (45.6%) |
| $1,500 to $1,999 | 145 (19.4%) | 112 (21.6%) |
| $2,000 to $2,499 | 263 (35.1%) | 57 (11.0%) |
| $2,500 to $2,999 | 43 (5.7%) | 56 (10.8%) |
| $3,000 or more | 39 (5.2%) | 0 (0.0%) |
| Total | 749 (100.0%) | 518 (100.0%) |
Physical Housing Characteristics in Dahlgren
Housing Structures in Dahlgren
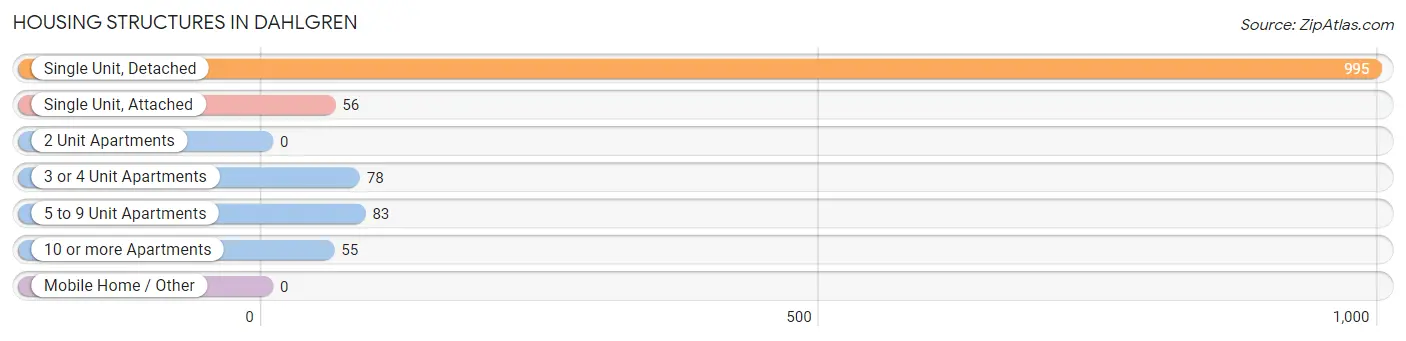
| Structure Type | # Housing Units | % Housing Units |
| Single Unit, Detached | 995 | 78.5% |
| Single Unit, Attached | 56 | 4.4% |
| 2 Unit Apartments | 0 | 0.0% |
| 3 or 4 Unit Apartments | 78 | 6.2% |
| 5 to 9 Unit Apartments | 83 | 6.6% |
| 10 or more Apartments | 55 | 4.3% |
| Mobile Home / Other | 0 | 0.0% |
| Total | 1,267 | 100.0% |
Housing Structures by Occupancy in Dahlgren
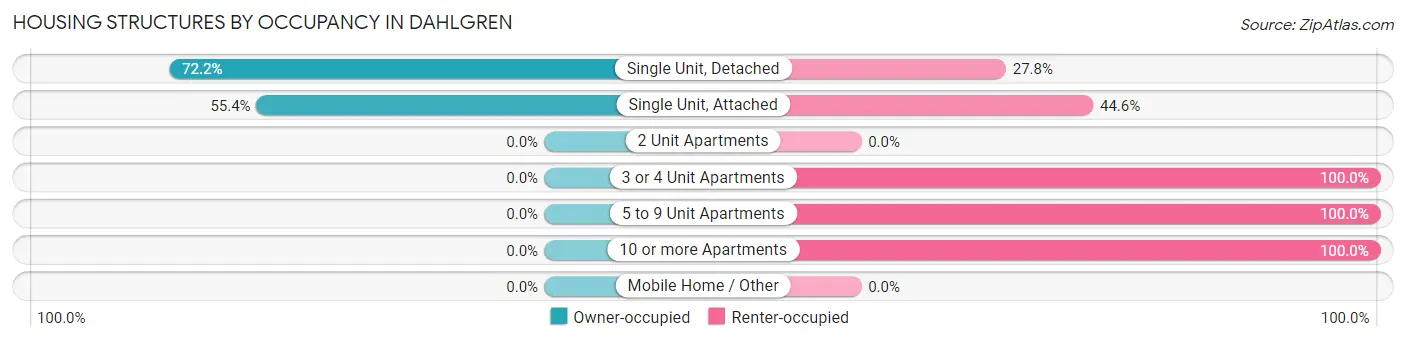
| Structure Type | Owner-occupied | Renter-occupied |
| Single Unit, Detached | 718 (72.2%) | 277 (27.8%) |
| Single Unit, Attached | 31 (55.4%) | 25 (44.6%) |
| 2 Unit Apartments | 0 (0.0%) | 0 (0.0%) |
| 3 or 4 Unit Apartments | 0 (0.0%) | 78 (100.0%) |
| 5 to 9 Unit Apartments | 0 (0.0%) | 83 (100.0%) |
| 10 or more Apartments | 0 (0.0%) | 55 (100.0%) |
| Mobile Home / Other | 0 (0.0%) | 0 (0.0%) |
| Total | 749 (59.1%) | 518 (40.9%) |
Housing Structures by Number of Rooms in Dahlgren
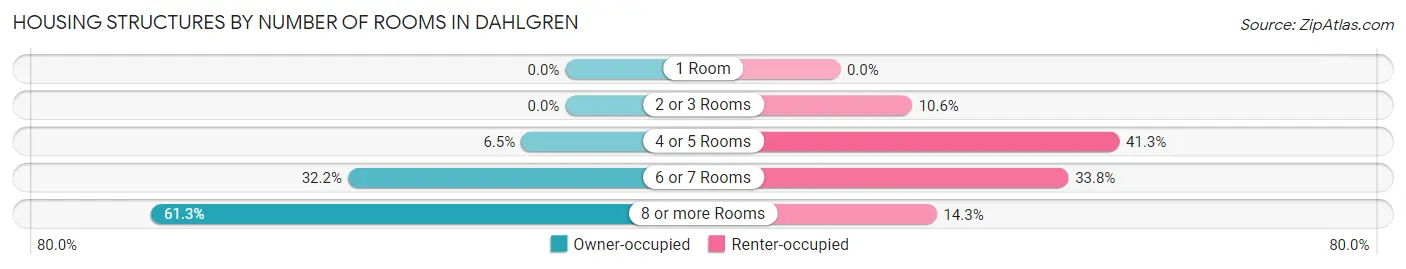
| Number of Rooms | Owner-occupied | Renter-occupied |
| 1 Room | 0 (0.0%) | 0 (0.0%) |
| 2 or 3 Rooms | 0 (0.0%) | 55 (10.6%) |
| 4 or 5 Rooms | 49 (6.5%) | 214 (41.3%) |
| 6 or 7 Rooms | 241 (32.2%) | 175 (33.8%) |
| 8 or more Rooms | 459 (61.3%) | 74 (14.3%) |
| Total | 749 (100.0%) | 518 (100.0%) |
Housing Structure by Heating Type in Dahlgren
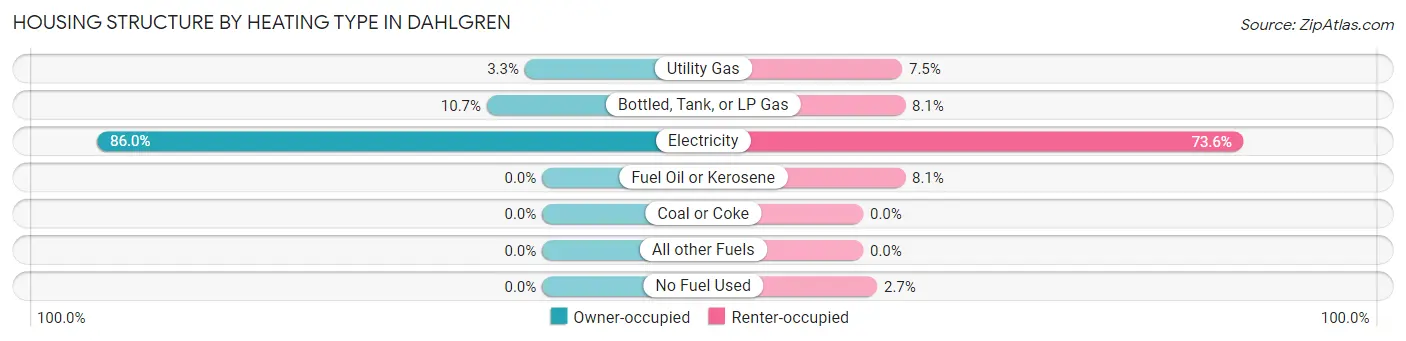
| Heating Type | Owner-occupied | Renter-occupied |
| Utility Gas | 25 (3.3%) | 39 (7.5%) |
| Bottled, Tank, or LP Gas | 80 (10.7%) | 42 (8.1%) |
| Electricity | 644 (86.0%) | 381 (73.6%) |
| Fuel Oil or Kerosene | 0 (0.0%) | 42 (8.1%) |
| Coal or Coke | 0 (0.0%) | 0 (0.0%) |
| All other Fuels | 0 (0.0%) | 0 (0.0%) |
| No Fuel Used | 0 (0.0%) | 14 (2.7%) |
| Total | 749 (100.0%) | 518 (100.0%) |
Household Vehicle Usage in Dahlgren
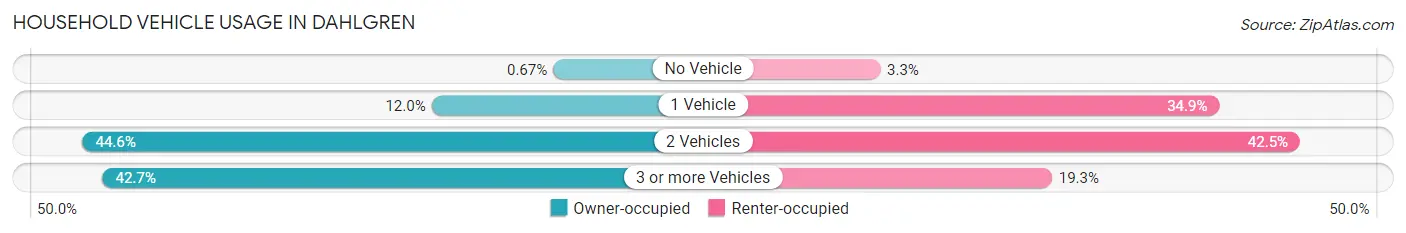
| Vehicles per Household | Owner-occupied | Renter-occupied |
| No Vehicle | 5 (0.7%) | 17 (3.3%) |
| 1 Vehicle | 90 (12.0%) | 181 (34.9%) |
| 2 Vehicles | 334 (44.6%) | 220 (42.5%) |
| 3 or more Vehicles | 320 (42.7%) | 100 (19.3%) |
| Total | 749 (100.0%) | 518 (100.0%) |
Real Estate & Mortgages in Dahlgren
Real Estate and Mortgage Overview in Dahlgren
| Characteristic | Without Mortgage | With Mortgage |
| Housing Units | 169 | 580 |
| Median Property Value | $195,300 | $367,100 |
| Median Household Income | $61,467 | $195 |
| Monthly Housing Costs | $580 | $39 |
| Real Estate Taxes | $1,090 | $46 |
Property Value by Mortgage Status in Dahlgren
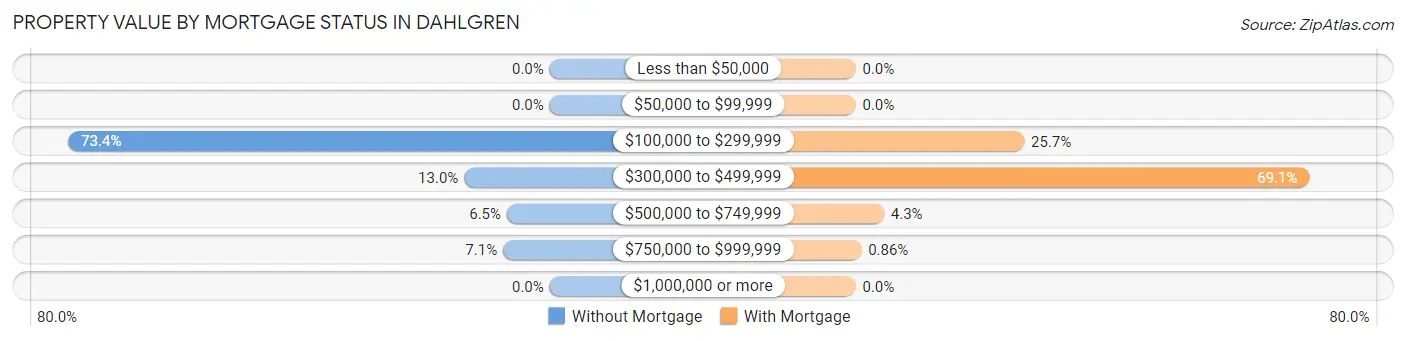
| Property Value | Without Mortgage | With Mortgage |
| Less than $50,000 | 0 (0.0%) | 0 (0.0%) |
| $50,000 to $99,999 | 0 (0.0%) | 0 (0.0%) |
| $100,000 to $299,999 | 124 (73.4%) | 149 (25.7%) |
| $300,000 to $499,999 | 22 (13.0%) | 401 (69.1%) |
| $500,000 to $749,999 | 11 (6.5%) | 25 (4.3%) |
| $750,000 to $999,999 | 12 (7.1%) | 5 (0.9%) |
| $1,000,000 or more | 0 (0.0%) | 0 (0.0%) |
| Total | 169 (100.0%) | 580 (100.0%) |
Household Income by Mortgage Status in Dahlgren
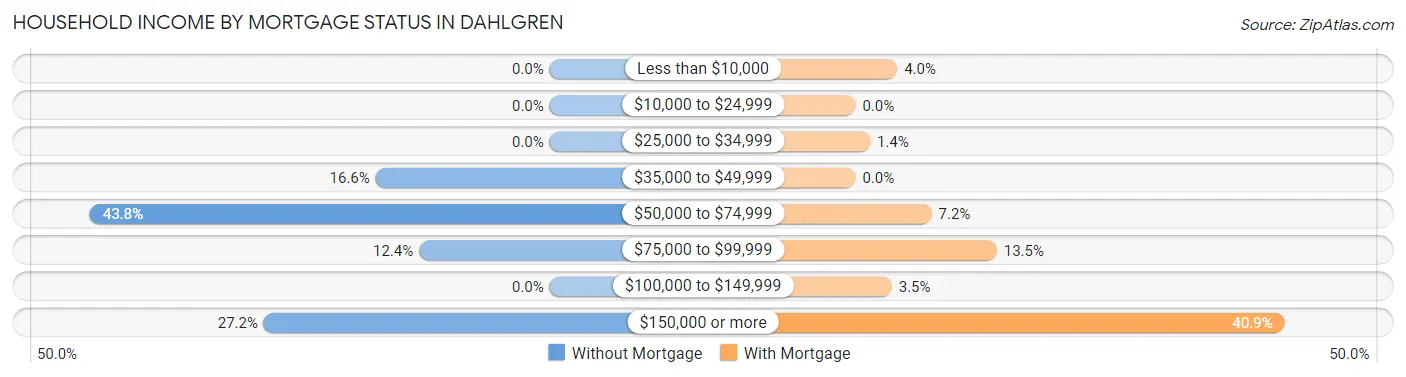
| Household Income | Without Mortgage | With Mortgage |
| Less than $10,000 | 0 (0.0%) | 23 (4.0%) |
| $10,000 to $24,999 | 0 (0.0%) | 0 (0.0%) |
| $25,000 to $34,999 | 0 (0.0%) | 8 (1.4%) |
| $35,000 to $49,999 | 28 (16.6%) | 0 (0.0%) |
| $50,000 to $74,999 | 74 (43.8%) | 42 (7.2%) |
| $75,000 to $99,999 | 21 (12.4%) | 78 (13.5%) |
| $100,000 to $149,999 | 0 (0.0%) | 20 (3.5%) |
| $150,000 or more | 46 (27.2%) | 237 (40.9%) |
| Total | 169 (100.0%) | 580 (100.0%) |
Property Value to Household Income Ratio in Dahlgren
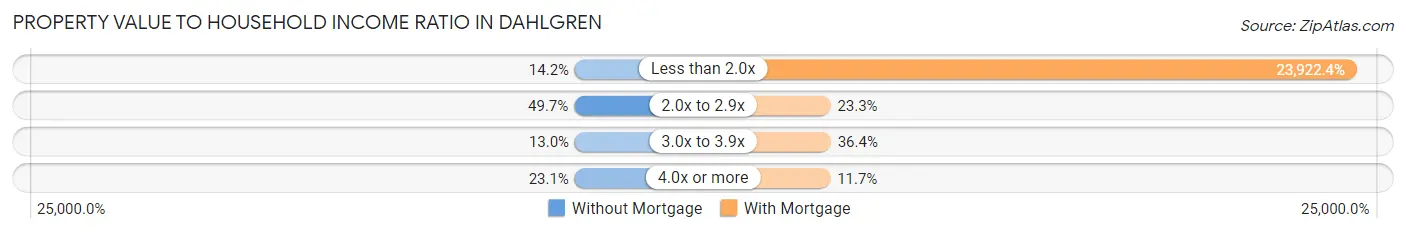
| Value-to-Income Ratio | Without Mortgage | With Mortgage |
| Less than 2.0x | 24 (14.2%) | 138,750 (23,922.4%) |
| 2.0x to 2.9x | 84 (49.7%) | 135 (23.3%) |
| 3.0x to 3.9x | 22 (13.0%) | 211 (36.4%) |
| 4.0x or more | 39 (23.1%) | 68 (11.7%) |
| Total | 169 (100.0%) | 580 (100.0%) |
Real Estate Taxes by Mortgage Status in Dahlgren
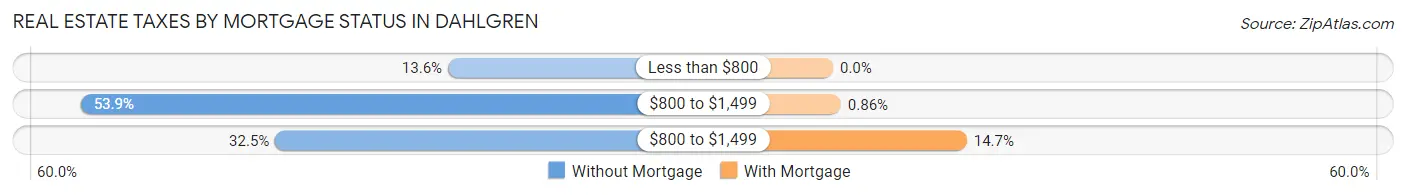
| Property Taxes | Without Mortgage | With Mortgage |
| Less than $800 | 23 (13.6%) | 0 (0.0%) |
| $800 to $1,499 | 91 (53.8%) | 5 (0.9%) |
| $800 to $1,499 | 55 (32.5%) | 85 (14.7%) |
| Total | 169 (100.0%) | 580 (100.0%) |
Health & Disability in Dahlgren
Health Insurance Coverage by Age in Dahlgren
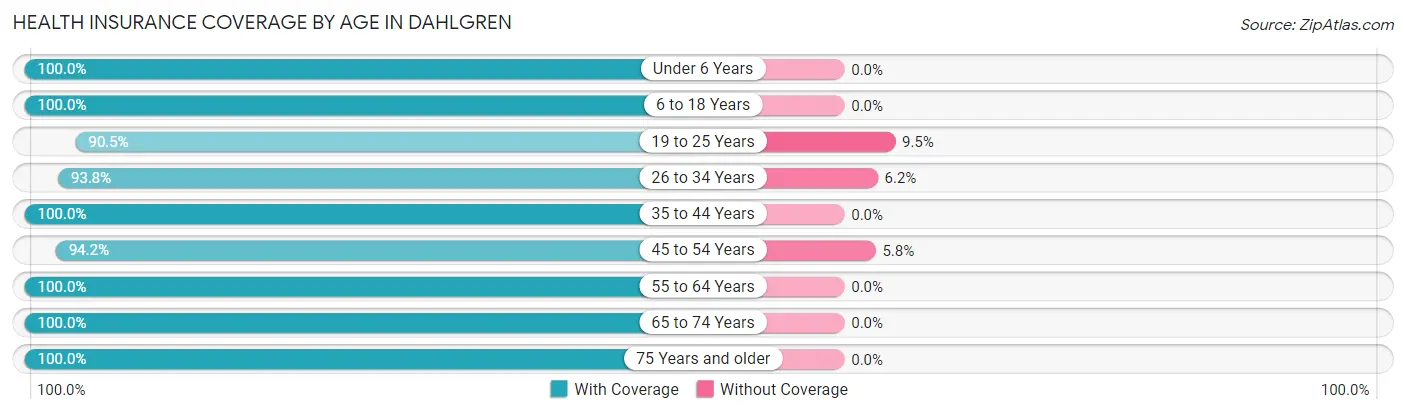
| Age Bracket | With Coverage | Without Coverage |
| Under 6 Years | 204 (100.0%) | 0 (0.0%) |
| 6 to 18 Years | 640 (100.0%) | 0 (0.0%) |
| 19 to 25 Years | 402 (90.5%) | 42 (9.5%) |
| 26 to 34 Years | 408 (93.8%) | 27 (6.2%) |
| 35 to 44 Years | 537 (100.0%) | 0 (0.0%) |
| 45 to 54 Years | 243 (94.2%) | 15 (5.8%) |
| 55 to 64 Years | 391 (100.0%) | 0 (0.0%) |
| 65 to 74 Years | 321 (100.0%) | 0 (0.0%) |
| 75 Years and older | 212 (100.0%) | 0 (0.0%) |
| Total | 3,358 (97.6%) | 84 (2.4%) |
Health Insurance Coverage by Citizenship Status in Dahlgren
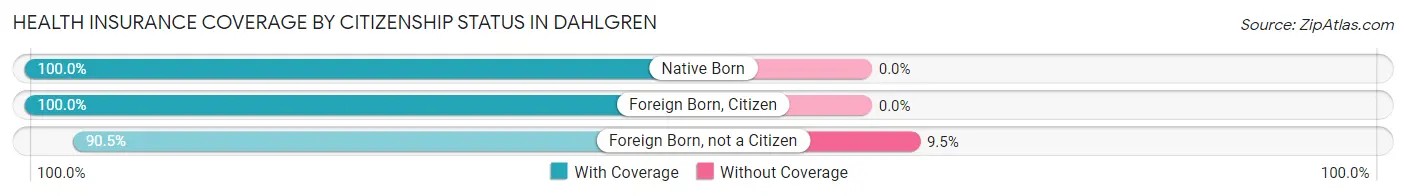
| Citizenship Status | With Coverage | Without Coverage |
| Native Born | 204 (100.0%) | 0 (0.0%) |
| Foreign Born, Citizen | 640 (100.0%) | 0 (0.0%) |
| Foreign Born, not a Citizen | 402 (90.5%) | 42 (9.5%) |
Health Insurance Coverage by Household Income in Dahlgren
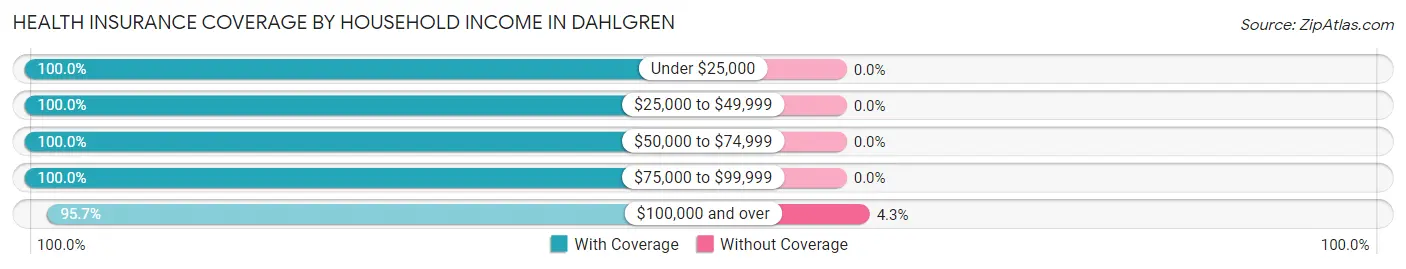
| Household Income | With Coverage | Without Coverage |
| Under $25,000 | 23 (100.0%) | 0 (0.0%) |
| $25,000 to $49,999 | 305 (100.0%) | 0 (0.0%) |
| $50,000 to $74,999 | 669 (100.0%) | 0 (0.0%) |
| $75,000 to $99,999 | 487 (100.0%) | 0 (0.0%) |
| $100,000 and over | 1,874 (95.7%) | 84 (4.3%) |
Public vs Private Health Insurance Coverage by Age in Dahlgren
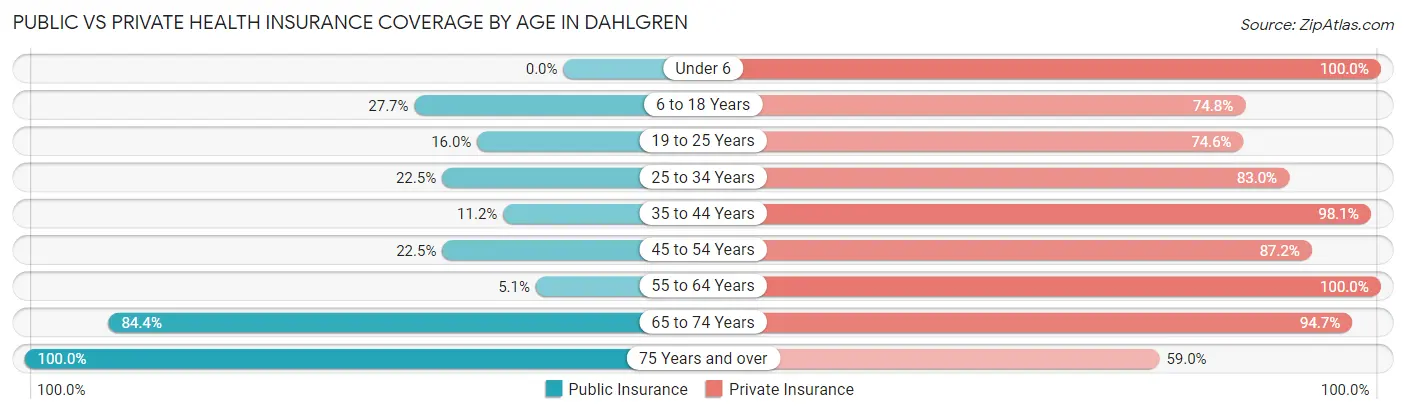
| Age Bracket | Public Insurance | Private Insurance |
| Under 6 | 0 (0.0%) | 204 (100.0%) |
| 6 to 18 Years | 177 (27.7%) | 479 (74.8%) |
| 19 to 25 Years | 71 (16.0%) | 331 (74.6%) |
| 25 to 34 Years | 98 (22.5%) | 361 (83.0%) |
| 35 to 44 Years | 60 (11.2%) | 527 (98.1%) |
| 45 to 54 Years | 58 (22.5%) | 225 (87.2%) |
| 55 to 64 Years | 20 (5.1%) | 391 (100.0%) |
| 65 to 74 Years | 271 (84.4%) | 304 (94.7%) |
| 75 Years and over | 212 (100.0%) | 125 (59.0%) |
| Total | 967 (28.1%) | 2,947 (85.6%) |
Disability Status by Sex by Age in Dahlgren
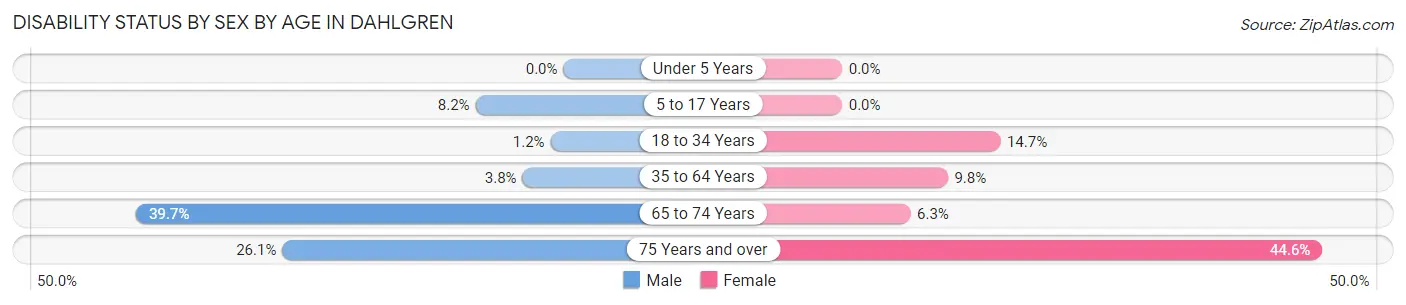
| Age Bracket | Male | Female |
| Under 5 Years | 0 (0.0%) | 0 (0.0%) |
| 5 to 17 Years | 35 (8.2%) | 0 (0.0%) |
| 18 to 34 Years | 5 (1.2%) | 74 (14.7%) |
| 35 to 64 Years | 23 (3.8%) | 57 (9.8%) |
| 65 to 74 Years | 71 (39.7%) | 9 (6.3%) |
| 75 Years and over | 12 (26.1%) | 74 (44.6%) |
Disability Class by Sex by Age in Dahlgren
Disability Class: Hearing Difficulty
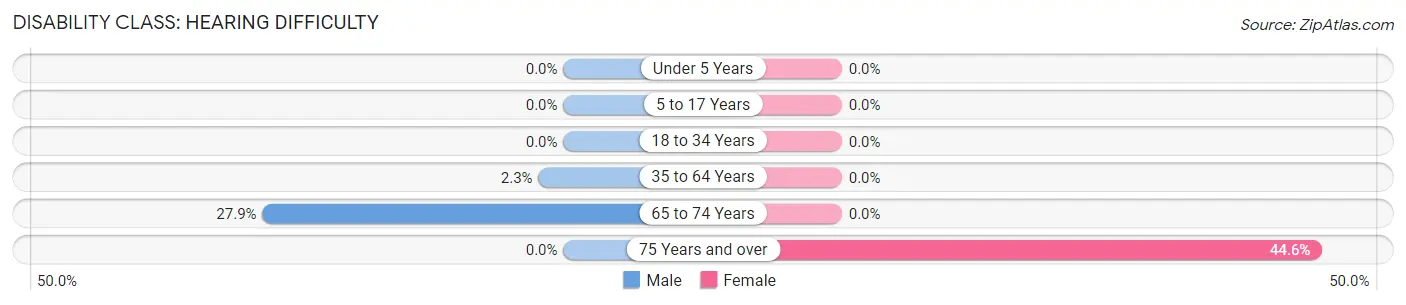
| Age Bracket | Male | Female |
| Under 5 Years | 0 (0.0%) | 0 (0.0%) |
| 5 to 17 Years | 0 (0.0%) | 0 (0.0%) |
| 18 to 34 Years | 0 (0.0%) | 0 (0.0%) |
| 35 to 64 Years | 14 (2.3%) | 0 (0.0%) |
| 65 to 74 Years | 50 (27.9%) | 0 (0.0%) |
| 75 Years and over | 0 (0.0%) | 74 (44.6%) |
Disability Class: Vision Difficulty
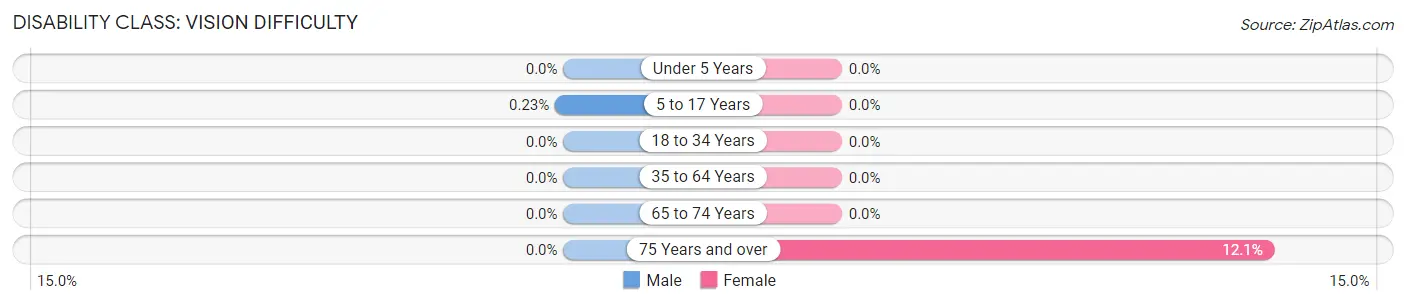
| Age Bracket | Male | Female |
| Under 5 Years | 0 (0.0%) | 0 (0.0%) |
| 5 to 17 Years | 1 (0.2%) | 0 (0.0%) |
| 18 to 34 Years | 0 (0.0%) | 0 (0.0%) |
| 35 to 64 Years | 0 (0.0%) | 0 (0.0%) |
| 65 to 74 Years | 0 (0.0%) | 0 (0.0%) |
| 75 Years and over | 0 (0.0%) | 20 (12.0%) |
Disability Class: Cognitive Difficulty
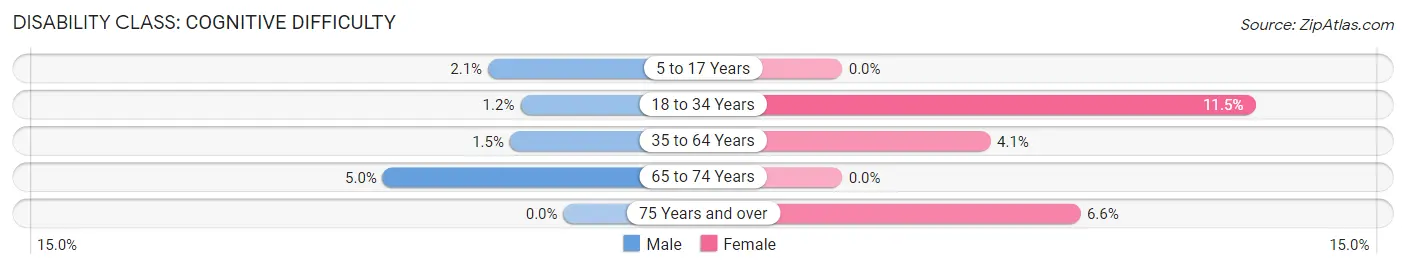
| Age Bracket | Male | Female |
| 5 to 17 Years | 9 (2.1%) | 0 (0.0%) |
| 18 to 34 Years | 5 (1.2%) | 58 (11.5%) |
| 35 to 64 Years | 9 (1.5%) | 24 (4.1%) |
| 65 to 74 Years | 9 (5.0%) | 0 (0.0%) |
| 75 Years and over | 0 (0.0%) | 11 (6.6%) |
Disability Class: Ambulatory Difficulty
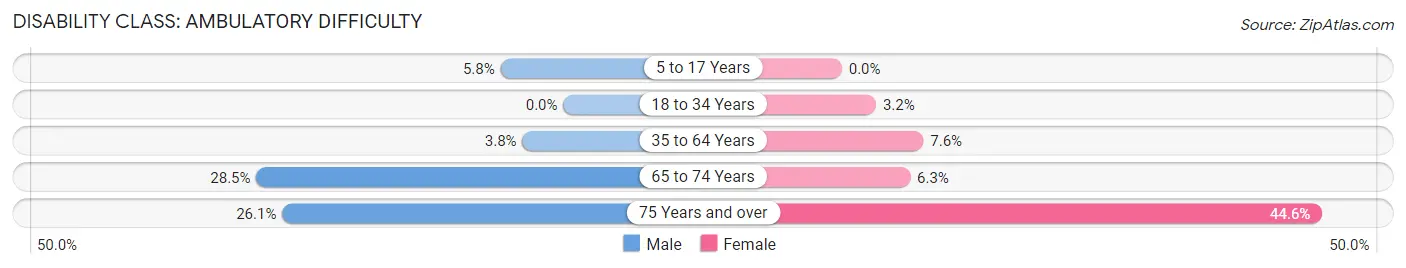
| Age Bracket | Male | Female |
| 5 to 17 Years | 25 (5.8%) | 0 (0.0%) |
| 18 to 34 Years | 0 (0.0%) | 16 (3.2%) |
| 35 to 64 Years | 23 (3.8%) | 44 (7.6%) |
| 65 to 74 Years | 51 (28.5%) | 9 (6.3%) |
| 75 Years and over | 12 (26.1%) | 74 (44.6%) |
Disability Class: Self-Care Difficulty
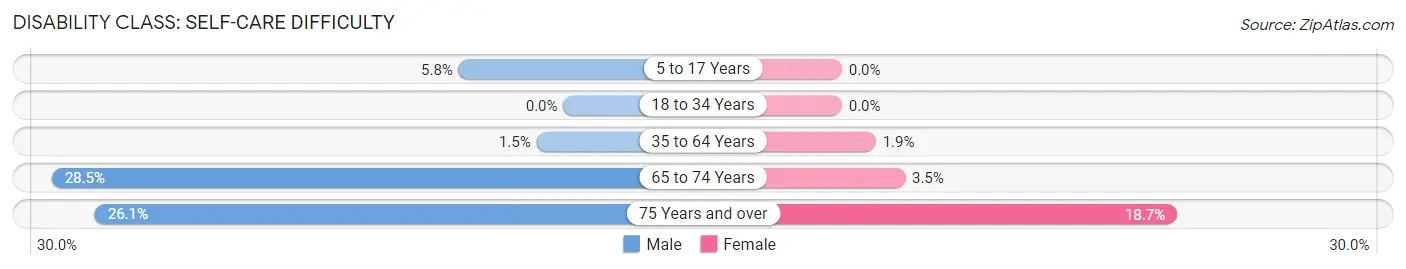
| Age Bracket | Male | Female |
| 5 to 17 Years | 25 (5.8%) | 0 (0.0%) |
| 18 to 34 Years | 0 (0.0%) | 0 (0.0%) |
| 35 to 64 Years | 9 (1.5%) | 11 (1.9%) |
| 65 to 74 Years | 51 (28.5%) | 5 (3.5%) |
| 75 Years and over | 12 (26.1%) | 31 (18.7%) |
Technology Access in Dahlgren
Computing Device Access in Dahlgren
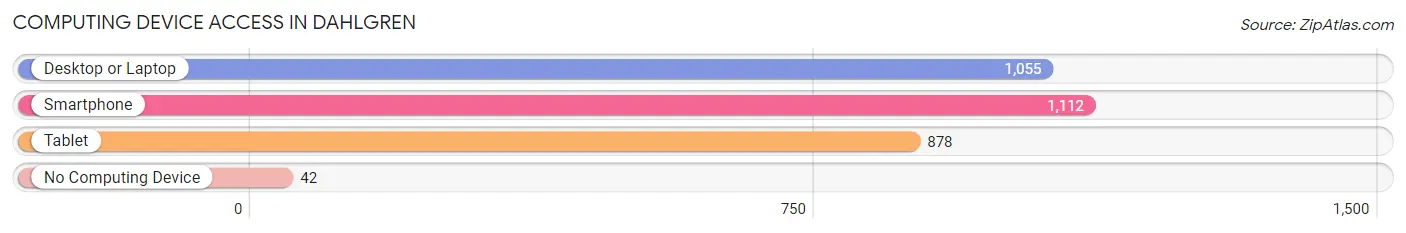
| Device Type | # Households | % Households |
| Desktop or Laptop | 1,055 | 83.3% |
| Smartphone | 1,112 | 87.8% |
| Tablet | 878 | 69.3% |
| No Computing Device | 42 | 3.3% |
| Total | 1,267 | 100.0% |
Internet Access in Dahlgren
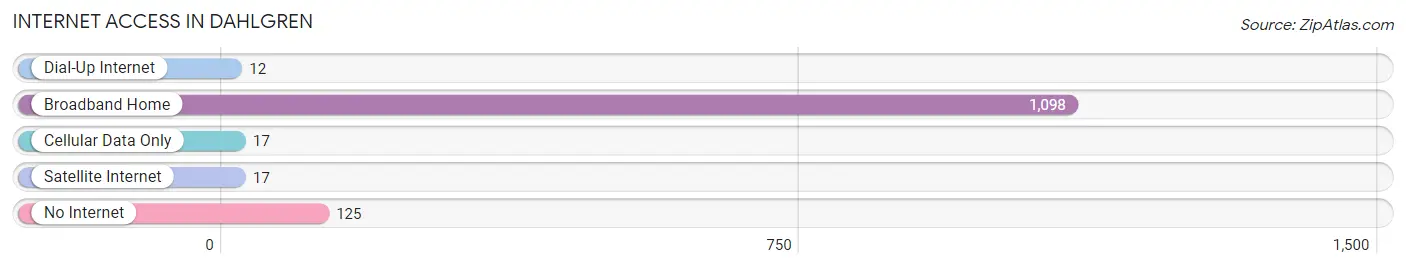
| Internet Type | # Households | % Households |
| Dial-Up Internet | 12 | 0.9% |
| Broadband Home | 1,098 | 86.7% |
| Cellular Data Only | 17 | 1.3% |
| Satellite Internet | 17 | 1.3% |
| No Internet | 125 | 9.9% |
| Total | 1,267 | 100.0% |
Dahlgren Summary
Dahlgren is a small unincorporated community located in King George County, Virginia. It is situated on the Potomac River, approximately 50 miles south of Washington, D.C. The community is named after Rear Admiral John A. Dahlgren, a Union naval officer during the Civil War.
History
The area that is now Dahlgren was first settled in the early 1700s by English colonists. The community was originally known as “Dahlgren’s Landing” and was a major port for the shipment of tobacco and other goods. In 1867, the town was officially incorporated as “Dahlgren” and the post office was established.
During the Civil War, Dahlgren was a strategic location for the Union forces. The town was the site of a major battle in 1864, when Confederate forces attempted to capture the town. The Union forces were successful in defending the town and the Confederate forces were forced to retreat.
In the late 19th century, Dahlgren became a popular tourist destination. The town was home to several resorts and hotels, as well as a popular amusement park. The town also had a thriving shipbuilding industry, which produced several vessels for the U.S. Navy.
In the early 20th century, Dahlgren was home to a large naval base. The base was established in 1918 and was used for training and research. The base was closed in the late 1990s and the land was sold to private developers.
Geography
Dahlgren is located in King George County, Virginia. The town is situated on the Potomac River, approximately 50 miles south of Washington, D.C. The town is bordered by the Potomac River to the east, the Rappahannock River to the west, and the Mattox Creek to the south.
The town has a total area of 1.3 square miles, all of which is land. The terrain is mostly flat, with some rolling hills. The climate is humid subtropical, with hot, humid summers and mild winters.
Economy
The economy of Dahlgren is largely based on tourism and the service industry. The town is home to several resorts and hotels, as well as a popular amusement park. The town also has a thriving shipbuilding industry, which produces several vessels for the U.S. Navy.
The town is also home to several small businesses, including restaurants, retail stores, and other services. The town is also home to a large naval base, which provides employment for many of the town’s residents.
Demographics
As of the 2010 census, the population of Dahlgren was 1,945. The racial makeup of the town was 94.3% White, 2.2% African American, 0.3% Native American, 0.7% Asian, 0.1% Pacific Islander, and 2.4% from other races. The median household income was $50,938, and the median family income was $60,938.
The town is home to several churches, including the Dahlgren United Methodist Church, the Dahlgren Baptist Church, and the Dahlgren Presbyterian Church. The town also has a public library, a post office, and several parks.
Conclusion
Dahlgren is a small unincorporated community located in King George County, Virginia. It is situated on the Potomac River, approximately 50 miles south of Washington, D.C. The town has a long history, dating back to the early 1700s. The economy of Dahlgren is largely based on tourism and the service industry. The town is home to several resorts and hotels, as well as a popular amusement park. The town also has a thriving shipbuilding industry, which produces several vessels for the U.S. Navy. As of the 2010 census, the population of Dahlgren was 1,945. The town is home to several churches, a public library, a post office, and several parks.
Common Questions
What is Per Capita Income in Dahlgren?
Per Capita income in Dahlgren is $43,977.
What is the Median Family Income in Dahlgren?
Median Family Income in Dahlgren is $115,732.
What is the Median Household income in Dahlgren?
Median Household Income in Dahlgren is $104,508.
What is Income or Wage Gap in Dahlgren?
Income or Wage Gap in Dahlgren is 32.2%.
Women in Dahlgren earn 67.8 cents for every dollar earned by a man.
What is Inequality or Gini Index in Dahlgren?
Inequality or Gini Index in Dahlgren is 0.33.
What is the Total Population of Dahlgren?
Total Population of Dahlgren is 3,517.
What is the Total Male Population of Dahlgren?
Total Male Population of Dahlgren is 1,803.
What is the Total Female Population of Dahlgren?
Total Female Population of Dahlgren is 1,714.
What is the Ratio of Males per 100 Females in Dahlgren?
There are 105.19 Males per 100 Females in Dahlgren.
What is the Ratio of Females per 100 Males in Dahlgren?
There are 95.06 Females per 100 Males in Dahlgren.
What is the Median Population Age in Dahlgren?
Median Population Age in Dahlgren is 34.6 Years.
What is the Average Family Size in Dahlgren
Average Family Size in Dahlgren is 3.2 People.
What is the Average Household Size in Dahlgren
Average Household Size in Dahlgren is 2.8 People.
How Large is the Labor Force in Dahlgren?
There are 2,051 People in the Labor Forcein in Dahlgren.
What is the Percentage of People in the Labor Force in Dahlgren?
73.7% of People are in the Labor Force in Dahlgren.
What is the Unemployment Rate in Dahlgren?
Unemployment Rate in Dahlgren is 3.9%.