Toms Brook, VA Map & Demographics
Toms Brook Map
Toms Brook Overview
$27,387
PER CAPITA INCOME
$74,583
AVG FAMILY INCOME
$80,893
AVG HOUSEHOLD INCOME
35.9%
WAGE / INCOME GAP [ % ]
64.1¢/ $1
WAGE / INCOME GAP [ $ ]
0.34
INEQUALITY / GINI INDEX
363
TOTAL POPULATION
187
MALE POPULATION
176
FEMALE POPULATION
106.25
MALES / 100 FEMALES
94.12
FEMALES / 100 MALES
40.1
MEDIAN AGE
3.7
AVG FAMILY SIZE
3.0
AVG HOUSEHOLD SIZE
205
LABOR FORCE [ PEOPLE ]
73.0%
PERCENT IN LABOR FORCE
3.4%
UNEMPLOYMENT RATE
Toms Brook Zip Codes
Toms Brook Area Codes
Income in Toms Brook
Income Overview in Toms Brook
Per Capita Income in Toms Brook is $27,387, while median incomes of families and households are $74,583 and $80,893 respectively.
| Characteristic | Number | Measure |
| Per Capita Income | 363 | $27,387 |
| Median Family Income | 77 | $74,583 |
| Mean Family Income | 77 | $76,595 |
| Median Household Income | 119 | $80,893 |
| Mean Household Income | 119 | $71,087 |
| Income Deficit | 77 | $0 |
| Wage / Income Gap (%) | 363 | 35.94% |
| Wage / Income Gap ($) | 363 | 64.06¢ per $1 |
| Gini / Inequality Index | 363 | 0.34 |
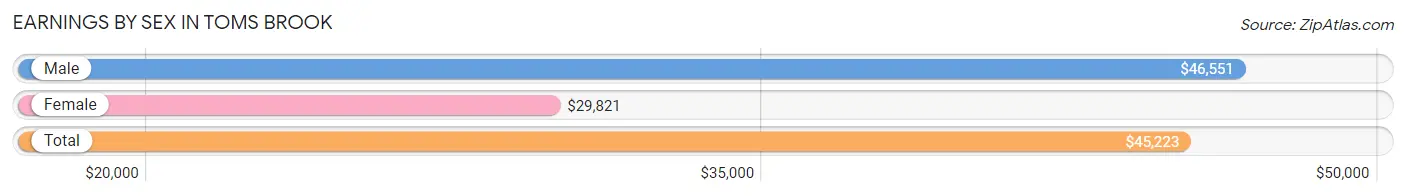
Earnings by Sex in Toms Brook
Average Earnings in Toms Brook are $45,223, $46,551 for men and $29,821 for women, a difference of 35.9%.
| Sex | Number | Average Earnings |
| Male | 119 (58.9%) | $46,551 |
| Female | 83 (41.1%) | $29,821 |
| Total | 202 (100.0%) | $45,223 |
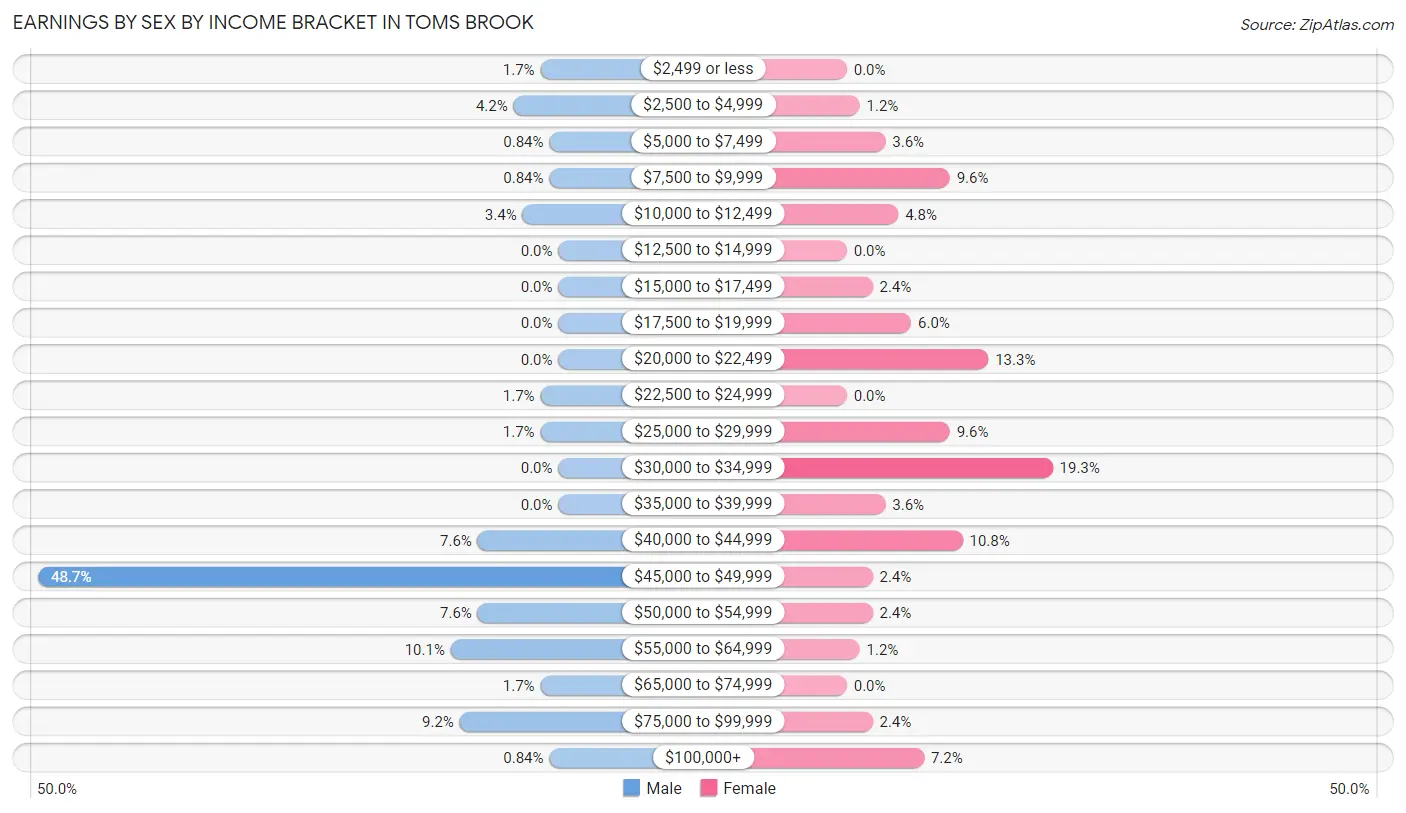
Earnings by Sex by Income Bracket in Toms Brook
The most common earnings brackets in Toms Brook are $45,000 to $49,999 for men (58 | 48.7%) and $30,000 to $34,999 for women (16 | 19.3%).
| Income | Male | Female |
| $2,499 or less | 2 (1.7%) | 0 (0.0%) |
| $2,500 to $4,999 | 5 (4.2%) | 1 (1.2%) |
| $5,000 to $7,499 | 1 (0.8%) | 3 (3.6%) |
| $7,500 to $9,999 | 1 (0.8%) | 8 (9.6%) |
| $10,000 to $12,499 | 4 (3.4%) | 4 (4.8%) |
| $12,500 to $14,999 | 0 (0.0%) | 0 (0.0%) |
| $15,000 to $17,499 | 0 (0.0%) | 2 (2.4%) |
| $17,500 to $19,999 | 0 (0.0%) | 5 (6.0%) |
| $20,000 to $22,499 | 0 (0.0%) | 11 (13.3%) |
| $22,500 to $24,999 | 2 (1.7%) | 0 (0.0%) |
| $25,000 to $29,999 | 2 (1.7%) | 8 (9.6%) |
| $30,000 to $34,999 | 0 (0.0%) | 16 (19.3%) |
| $35,000 to $39,999 | 0 (0.0%) | 3 (3.6%) |
| $40,000 to $44,999 | 9 (7.6%) | 9 (10.8%) |
| $45,000 to $49,999 | 58 (48.7%) | 2 (2.4%) |
| $50,000 to $54,999 | 9 (7.6%) | 2 (2.4%) |
| $55,000 to $64,999 | 12 (10.1%) | 1 (1.2%) |
| $65,000 to $74,999 | 2 (1.7%) | 0 (0.0%) |
| $75,000 to $99,999 | 11 (9.2%) | 2 (2.4%) |
| $100,000+ | 1 (0.8%) | 6 (7.2%) |
| Total | 119 (100.0%) | 83 (100.0%) |
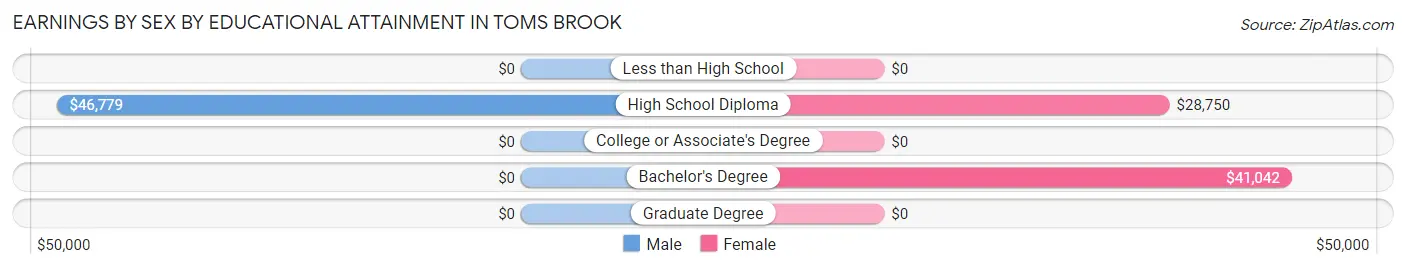
Earnings by Sex by Educational Attainment in Toms Brook
Average earnings in Toms Brook are $46,713 for men and $30,089 for women, a difference of 35.6%. Men with an educational attainment of high school diploma enjoy the highest average annual earnings of $46,779, while those with high school diploma education earn the least with $46,779. Women with an educational attainment of bachelor's degree earn the most with the average annual earnings of $41,042, while those with high school diploma education have the smallest earnings of $28,750.
| Educational Attainment | Male Income | Female Income |
| Less than High School | - | - |
| High School Diploma | $46,779 | $28,750 |
| College or Associate's Degree | - | - |
| Bachelor's Degree | - | - |
| Graduate Degree | - | - |
| Total | $46,713 | $30,089 |
Family Income in Toms Brook
Family Income Brackets in Toms Brook
According to the Toms Brook family income data, there are 24 families falling into the $100,000 to $149,999 income range, which is the most common income bracket and makes up 31.2% of all families.
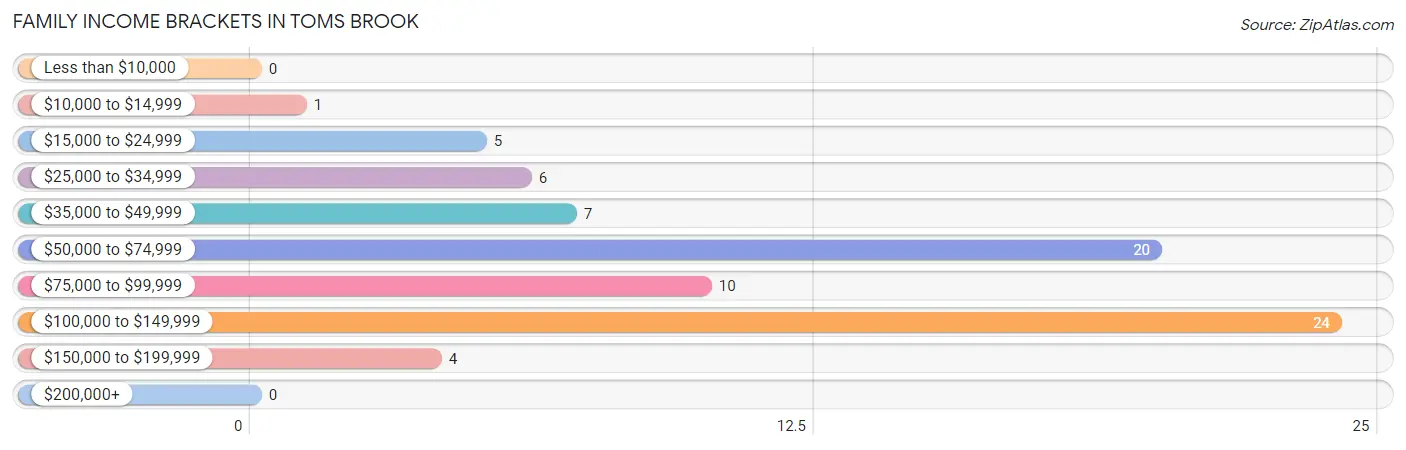
| Income Bracket | # Families | % Families |
| Less than $10,000 | 0 | 0.0% |
| $10,000 to $14,999 | 1 | 1.3% |
| $15,000 to $24,999 | 5 | 6.5% |
| $25,000 to $34,999 | 6 | 7.8% |
| $35,000 to $49,999 | 7 | 9.1% |
| $50,000 to $74,999 | 20 | 26.0% |
| $75,000 to $99,999 | 10 | 13.0% |
| $100,000 to $149,999 | 24 | 31.2% |
| $150,000 to $199,999 | 4 | 5.2% |
| $200,000+ | 0 | 0.0% |
Family Income by Famaliy Size in Toms Brook
3-person families (33 | 42.9%) account for the highest median family income in Toms Brook with $107,768 per family, while 3-person families (33 | 42.9%) have the highest median income of $35,923 per family member.
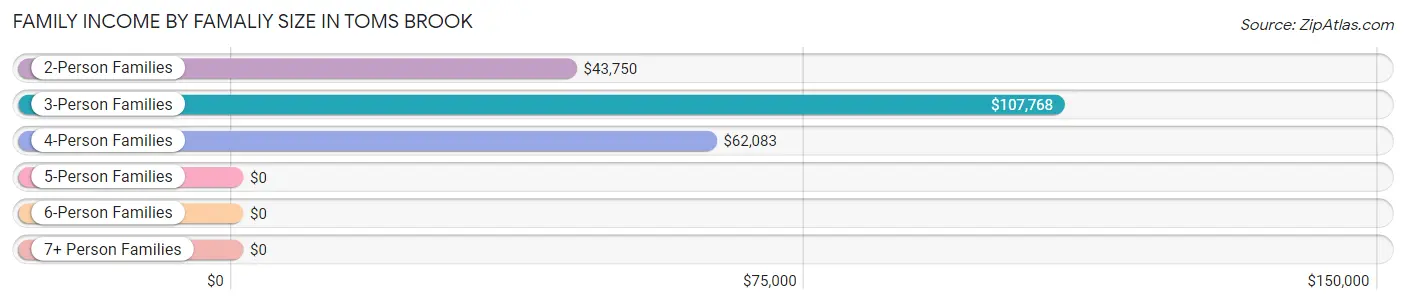
| Income Bracket | # Families | Median Income |
| 2-Person Families | 25 (32.5%) | $43,750 |
| 3-Person Families | 33 (42.9%) | $107,768 |
| 4-Person Families | 10 (13.0%) | $62,083 |
| 5-Person Families | 3 (3.9%) | $0 |
| 6-Person Families | 5 (6.5%) | $0 |
| 7+ Person Families | 1 (1.3%) | $0 |
| Total | 77 (100.0%) | $74,583 |
Family Income by Number of Earners in Toms Brook
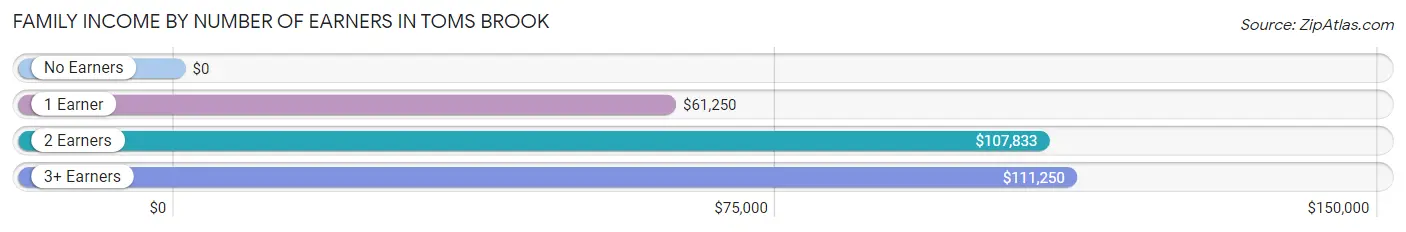
| Number of Earners | # Families | Median Income |
| No Earners | 8 (10.4%) | $0 |
| 1 Earner | 34 (44.2%) | $61,250 |
| 2 Earners | 30 (39.0%) | $107,833 |
| 3+ Earners | 5 (6.5%) | $111,250 |
| Total | 77 (100.0%) | $74,583 |
Household Income in Toms Brook
Household Income Brackets in Toms Brook
With 29 households falling in the category, the $75,000 to $99,999 income range is the most frequent in Toms Brook, accounting for 24.4% of all households.
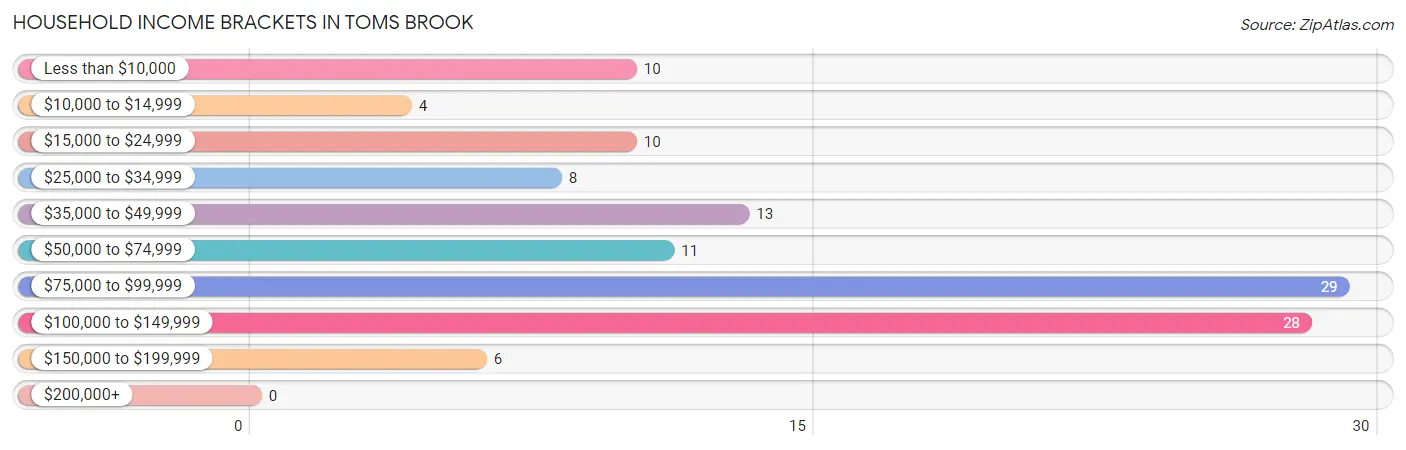
| Income Bracket | # Households | % Households |
| Less than $10,000 | 10 | 8.4% |
| $10,000 to $14,999 | 4 | 3.4% |
| $15,000 to $24,999 | 10 | 8.4% |
| $25,000 to $34,999 | 8 | 6.7% |
| $35,000 to $49,999 | 13 | 10.9% |
| $50,000 to $74,999 | 11 | 9.2% |
| $75,000 to $99,999 | 29 | 24.4% |
| $100,000 to $149,999 | 28 | 23.5% |
| $150,000 to $199,999 | 6 | 5.0% |
| $200,000+ | 0 | 0.0% |
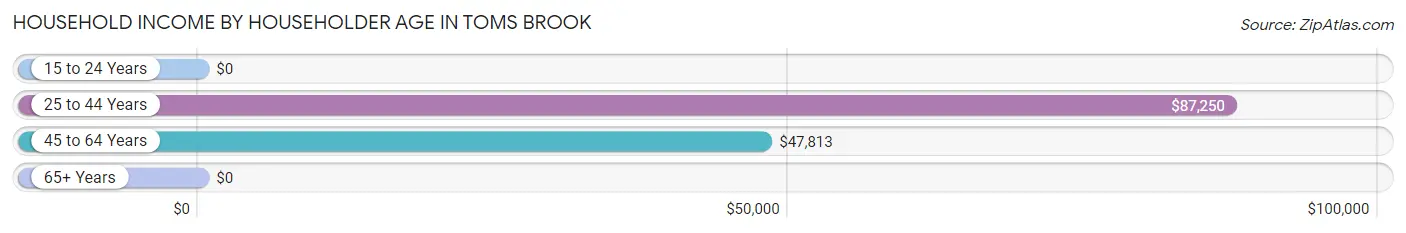
Household Income by Householder Age in Toms Brook
The median household income in Toms Brook is $80,893, with the highest median household income of $87,250 found in the 25 to 44 years age bracket for the primary householder. A total of 43 households (36.1%) fall into this category. Meanwhile, the 15 to 24 years age bracket for the primary householder has the lowest median household income of $0, with 4 households (3.4%) in this group.
| Income Bracket | # Households | Median Income |
| 15 to 24 Years | 4 (3.4%) | $0 |
| 25 to 44 Years | 43 (36.1%) | $87,250 |
| 45 to 64 Years | 37 (31.1%) | $47,813 |
| 65+ Years | 35 (29.4%) | $0 |
| Total | 119 (100.0%) | $80,893 |
Poverty in Toms Brook
Income Below Poverty by Sex and Age in Toms Brook
With 9.1% poverty level for males and 11.9% for females among the residents of Toms Brook, 55 to 64 year old males and 55 to 64 year old females are the most vulnerable to poverty, with 11 males (55.0%) and 7 females (38.9%) in their respective age groups living below the poverty level.
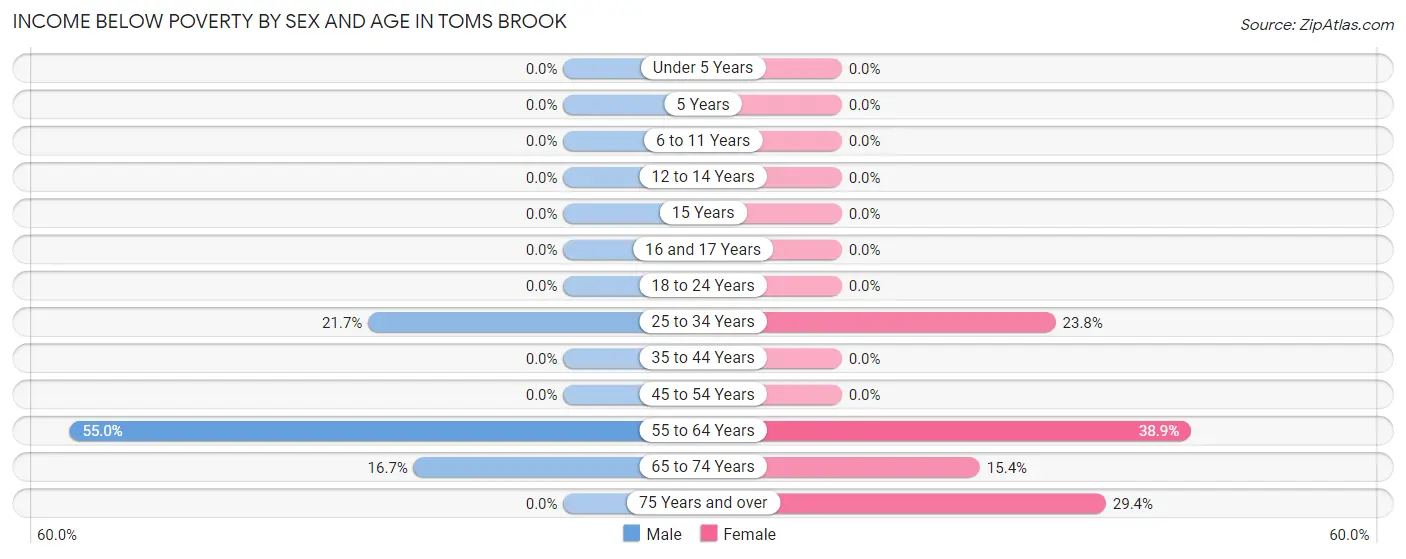
| Age Bracket | Male | Female |
| Under 5 Years | 0 (0.0%) | 0 (0.0%) |
| 5 Years | 0 (0.0%) | 0 (0.0%) |
| 6 to 11 Years | 0 (0.0%) | 0 (0.0%) |
| 12 to 14 Years | 0 (0.0%) | 0 (0.0%) |
| 15 Years | 0 (0.0%) | 0 (0.0%) |
| 16 and 17 Years | 0 (0.0%) | 0 (0.0%) |
| 18 to 24 Years | 0 (0.0%) | 0 (0.0%) |
| 25 to 34 Years | 5 (21.7%) | 5 (23.8%) |
| 35 to 44 Years | 0 (0.0%) | 0 (0.0%) |
| 45 to 54 Years | 0 (0.0%) | 0 (0.0%) |
| 55 to 64 Years | 11 (55.0%) | 7 (38.9%) |
| 65 to 74 Years | 1 (16.7%) | 4 (15.4%) |
| 75 Years and over | 0 (0.0%) | 5 (29.4%) |
| Total | 17 (9.1%) | 21 (11.9%) |
Income Above Poverty by Sex and Age in Toms Brook
According to the poverty statistics in Toms Brook, males aged under 5 years and females aged under 5 years are the age groups that are most secure financially, with 100.0% of males and 100.0% of females in these age groups living above the poverty line.
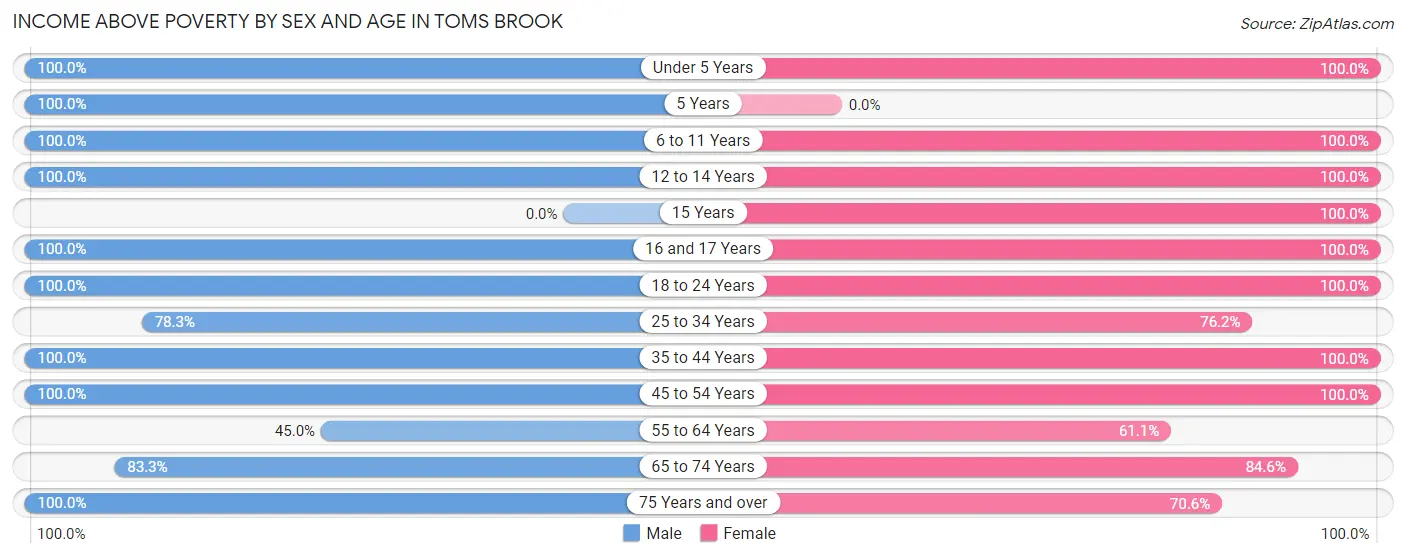
| Age Bracket | Male | Female |
| Under 5 Years | 18 (100.0%) | 10 (100.0%) |
| 5 Years | 2 (100.0%) | 0 (0.0%) |
| 6 to 11 Years | 13 (100.0%) | 22 (100.0%) |
| 12 to 14 Years | 8 (100.0%) | 4 (100.0%) |
| 15 Years | 0 (0.0%) | 5 (100.0%) |
| 16 and 17 Years | 6 (100.0%) | 5 (100.0%) |
| 18 to 24 Years | 9 (100.0%) | 9 (100.0%) |
| 25 to 34 Years | 18 (78.3%) | 16 (76.2%) |
| 35 to 44 Years | 17 (100.0%) | 22 (100.0%) |
| 45 to 54 Years | 63 (100.0%) | 17 (100.0%) |
| 55 to 64 Years | 9 (45.0%) | 11 (61.1%) |
| 65 to 74 Years | 5 (83.3%) | 22 (84.6%) |
| 75 Years and over | 2 (100.0%) | 12 (70.6%) |
| Total | 170 (90.9%) | 155 (88.1%) |
Income Below Poverty Among Married-Couple Families in Toms Brook
The poverty statistics for married-couple families in Toms Brook show that 15.6% or 5 of the total 32 families live below the poverty line. Families with no children have the highest poverty rate of 35.7%, comprising of 5 families. On the other hand, families with 1 or 2 children have the lowest poverty rate of 0.0%, which includes 0 families.
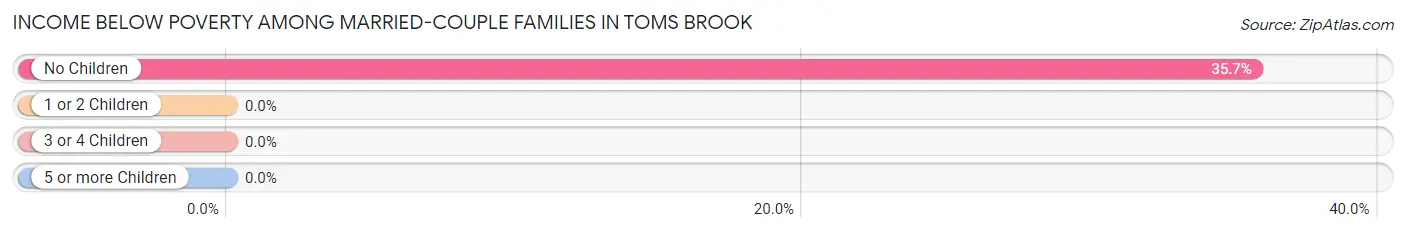
| Children | Above Poverty | Below Poverty |
| No Children | 9 (64.3%) | 5 (35.7%) |
| 1 or 2 Children | 9 (100.0%) | 0 (0.0%) |
| 3 or 4 Children | 8 (100.0%) | 0 (0.0%) |
| 5 or more Children | 1 (100.0%) | 0 (0.0%) |
| Total | 27 (84.4%) | 5 (15.6%) |
Income Below Poverty Among Single-Parent Households in Toms Brook
| Children | Single Father | Single Mother |
| No Children | 0 (0.0%) | 0 (0.0%) |
| 1 or 2 Children | 0 (0.0%) | 0 (0.0%) |
| 3 or 4 Children | 0 (0.0%) | 0 (0.0%) |
| 5 or more Children | 0 (0.0%) | 0 (0.0%) |
| Total | 0 (0.0%) | 0 (0.0%) |
Income Below Poverty Among Married-Couple vs Single-Parent Households in Toms Brook
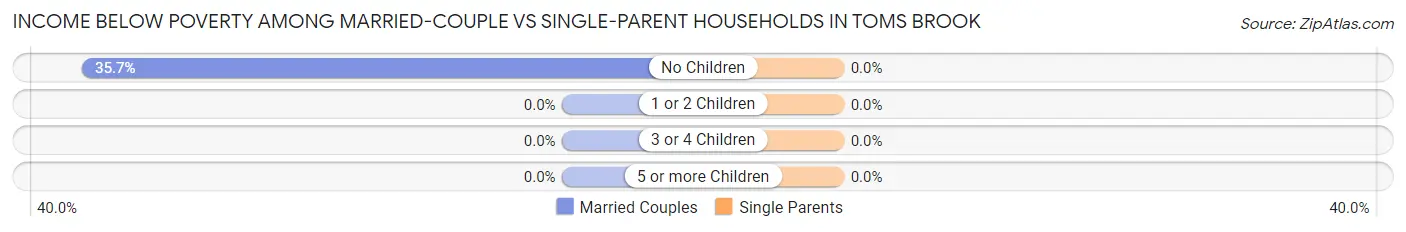
| Children | Married-Couple Families | Single-Parent Households |
| No Children | 5 (35.7%) | 0 (0.0%) |
| 1 or 2 Children | 0 (0.0%) | 0 (0.0%) |
| 3 or 4 Children | 0 (0.0%) | 0 (0.0%) |
| 5 or more Children | 0 (0.0%) | 0 (0.0%) |
| Total | 5 (15.6%) | 0 (0.0%) |
Race in Toms Brook
The most populous races in Toms Brook are White / Caucasian (343 | 94.5%), Black / African American (16 | 4.4%), and Two or more Races (4 | 1.1%).
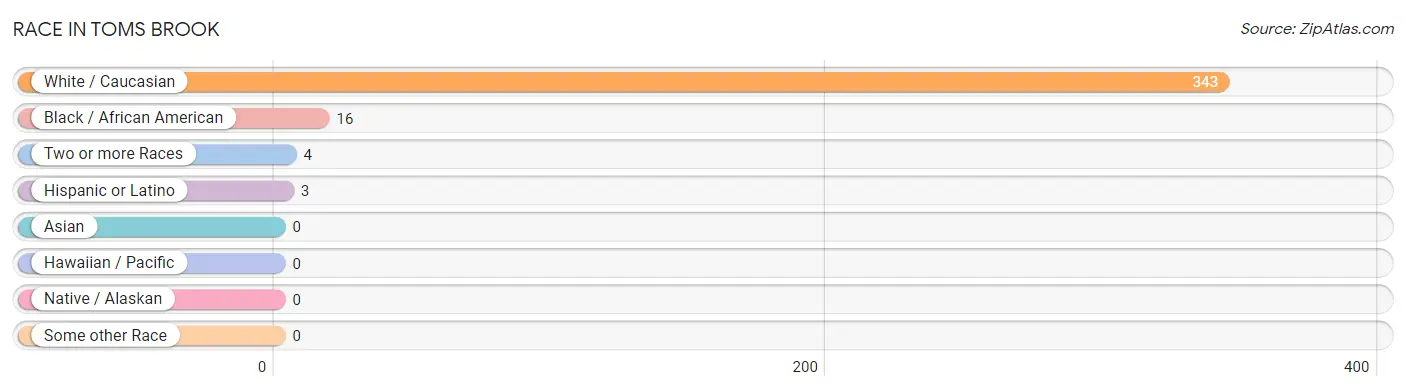
| Race | # Population | % Population |
| Asian | 0 | 0.0% |
| Black / African American | 16 | 4.4% |
| Hawaiian / Pacific | 0 | 0.0% |
| Hispanic or Latino | 3 | 0.8% |
| Native / Alaskan | 0 | 0.0% |
| White / Caucasian | 343 | 94.5% |
| Two or more Races | 4 | 1.1% |
| Some other Race | 0 | 0.0% |
| Total | 363 | 100.0% |
Ancestry in Toms Brook
The most populous ancestries reported in Toms Brook are German (81 | 22.3%), Irish (75 | 20.7%), English (26 | 7.2%), American (24 | 6.6%), and French (8 | 2.2%), together accounting for 58.9% of all Toms Brook residents.
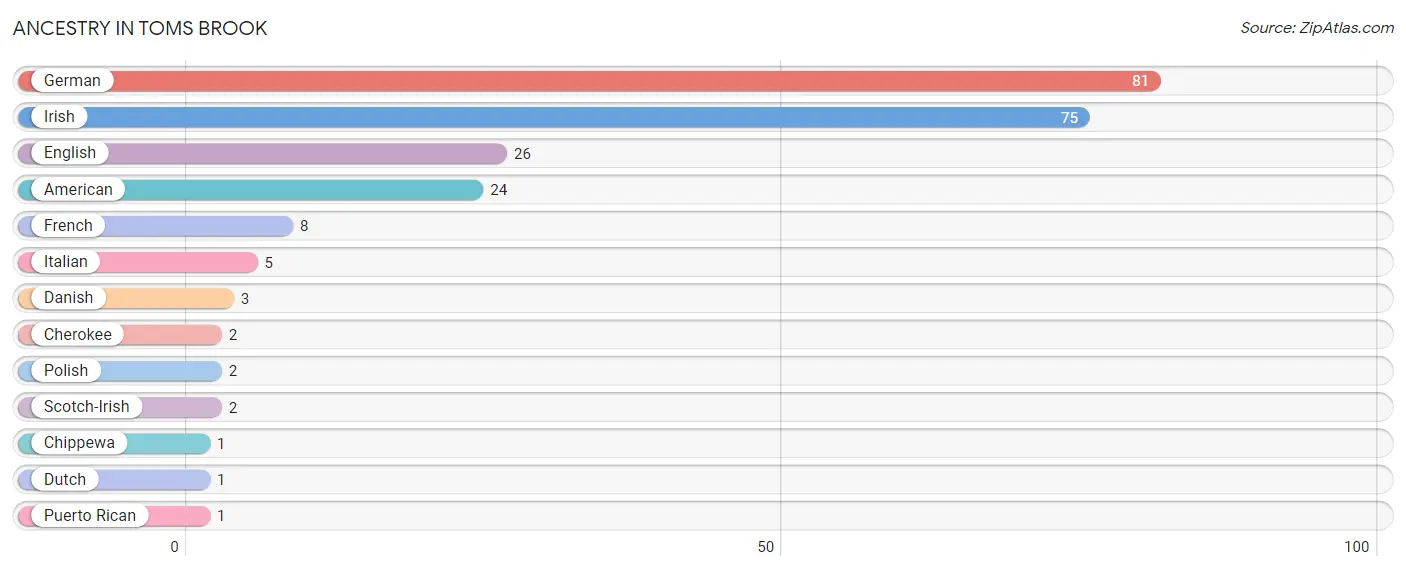
| Ancestry | # Population | % Population |
| American | 24 | 6.6% |
| Cherokee | 2 | 0.5% |
| Chippewa | 1 | 0.3% |
| Danish | 3 | 0.8% |
| Dutch | 1 | 0.3% |
| English | 26 | 7.2% |
| French | 8 | 2.2% |
| German | 81 | 22.3% |
| Irish | 75 | 20.7% |
| Italian | 5 | 1.4% |
| Polish | 2 | 0.5% |
| Puerto Rican | 1 | 0.3% |
| Scotch-Irish | 2 | 0.5% | View All 13 Rows |
Immigrants in Toms Brook
The most numerous immigrant groups reported in Toms Brook came from Caribbean (5 | 1.4%), Latin America (5 | 1.4%), and Trinidad and Tobago (5 | 1.4%), together accounting for 4.1% of all Toms Brook residents.
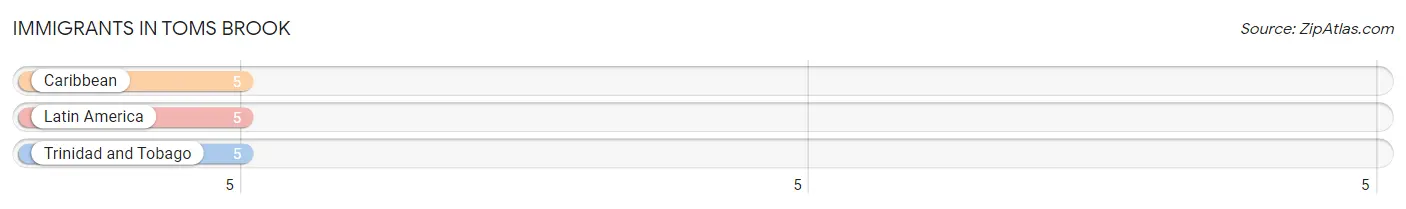
| Immigration Origin | # Population | % Population |
| Caribbean | 5 | 1.4% |
| Latin America | 5 | 1.4% |
| Trinidad and Tobago | 5 | 1.4% | View All 3 Rows |
Sex and Age in Toms Brook
Sex and Age in Toms Brook
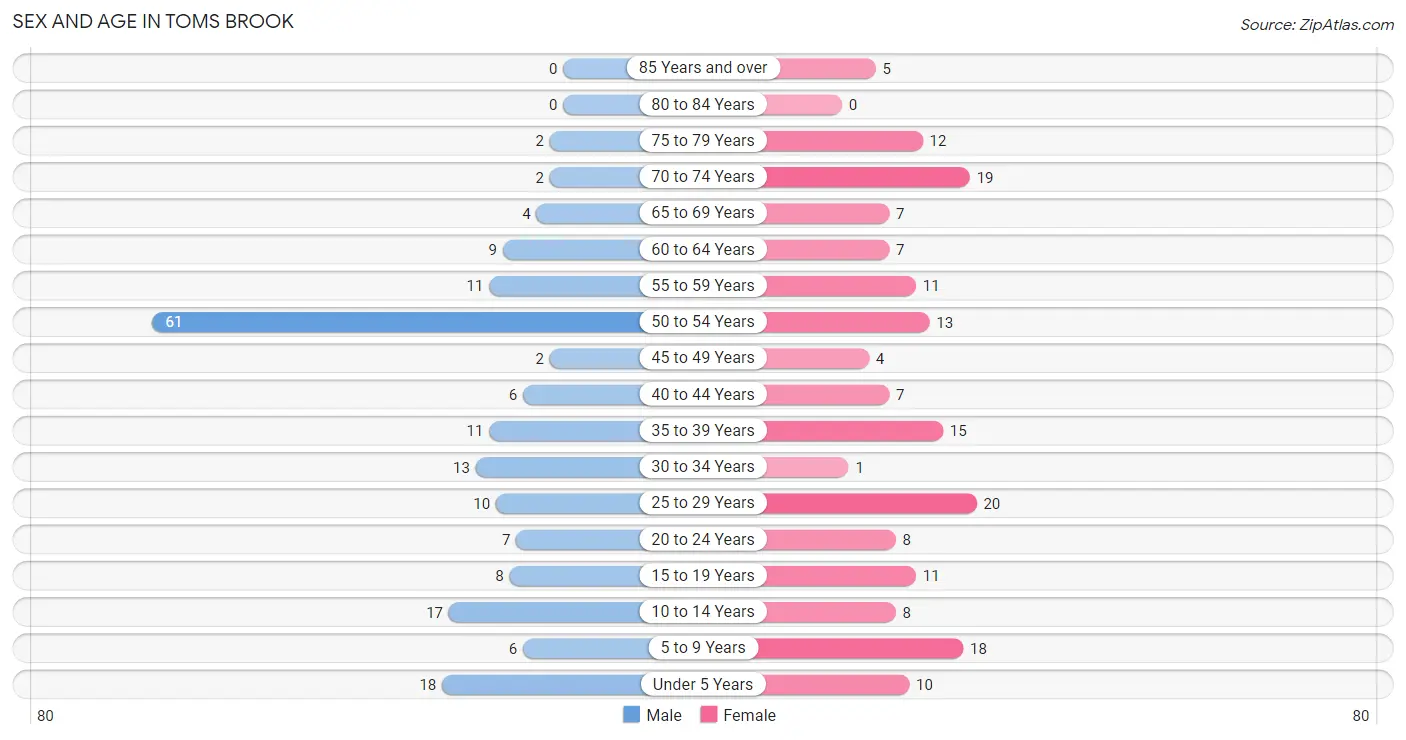
The most populous age groups in Toms Brook are 50 to 54 Years (61 | 32.6%) for men and 25 to 29 Years (20 | 11.4%) for women.
| Age Bracket | Male | Female |
| Under 5 Years | 18 (9.6%) | 10 (5.7%) |
| 5 to 9 Years | 6 (3.2%) | 18 (10.2%) |
| 10 to 14 Years | 17 (9.1%) | 8 (4.5%) |
| 15 to 19 Years | 8 (4.3%) | 11 (6.2%) |
| 20 to 24 Years | 7 (3.7%) | 8 (4.5%) |
| 25 to 29 Years | 10 (5.3%) | 20 (11.4%) |
| 30 to 34 Years | 13 (7.0%) | 1 (0.6%) |
| 35 to 39 Years | 11 (5.9%) | 15 (8.5%) |
| 40 to 44 Years | 6 (3.2%) | 7 (4.0%) |
| 45 to 49 Years | 2 (1.1%) | 4 (2.3%) |
| 50 to 54 Years | 61 (32.6%) | 13 (7.4%) |
| 55 to 59 Years | 11 (5.9%) | 11 (6.2%) |
| 60 to 64 Years | 9 (4.8%) | 7 (4.0%) |
| 65 to 69 Years | 4 (2.1%) | 7 (4.0%) |
| 70 to 74 Years | 2 (1.1%) | 19 (10.8%) |
| 75 to 79 Years | 2 (1.1%) | 12 (6.8%) |
| 80 to 84 Years | 0 (0.0%) | 0 (0.0%) |
| 85 Years and over | 0 (0.0%) | 5 (2.8%) |
| Total | 187 (100.0%) | 176 (100.0%) |
Families and Households in Toms Brook
Median Family Size in Toms Brook
The median family size in Toms Brook is 3.73 persons per family, with married-couple families (32 | 41.6%) accounting for the largest median family size of 4.09 persons per family. On the other hand, single male/father families (14 | 18.2%) represent the smallest median family size with 3.14 persons per family.
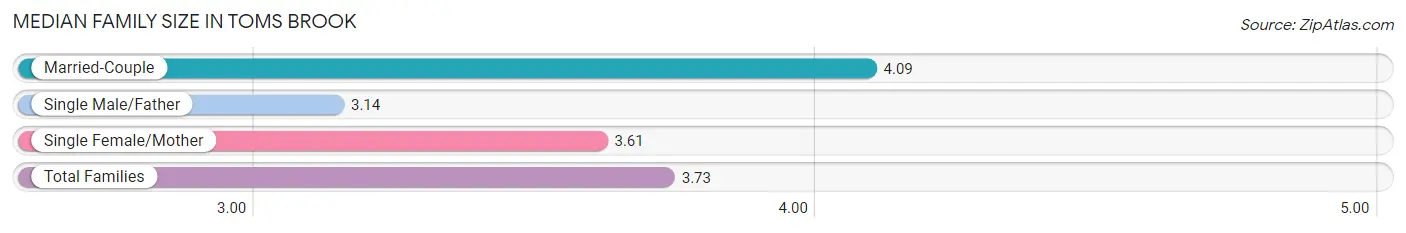
| Family Type | # Families | Family Size |
| Married-Couple | 32 (41.6%) | 4.09 |
| Single Male/Father | 14 (18.2%) | 3.14 |
| Single Female/Mother | 31 (40.3%) | 3.61 |
| Total Families | 77 (100.0%) | 3.73 |
Median Household Size in Toms Brook
The median household size in Toms Brook is 3.05 persons per household, with married-couple households (32 | 26.9%) accounting for the largest median household size of 4.09 persons per household. non-family households (42 | 35.3%) represent the smallest median household size with 1.40 persons per household.
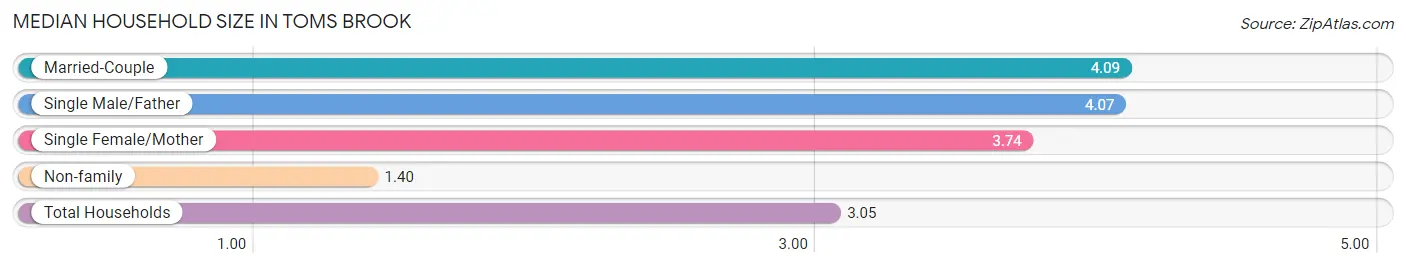
| Household Type | # Households | Household Size |
| Married-Couple | 32 (26.9%) | 4.09 |
| Single Male/Father | 14 (11.8%) | 4.07 |
| Single Female/Mother | 31 (26.1%) | 3.74 |
| Non-family | 42 (35.3%) | 1.40 |
| Total Households | 119 (100.0%) | 3.05 |
Household Size by Marriage Status in Toms Brook
Out of a total of 119 households in Toms Brook, 77 (64.7%) are family households, while 42 (35.3%) are nonfamily households. The most numerous type of family households are 3-person households, comprising 34, and the most common type of nonfamily households are 1-person households, comprising 24.
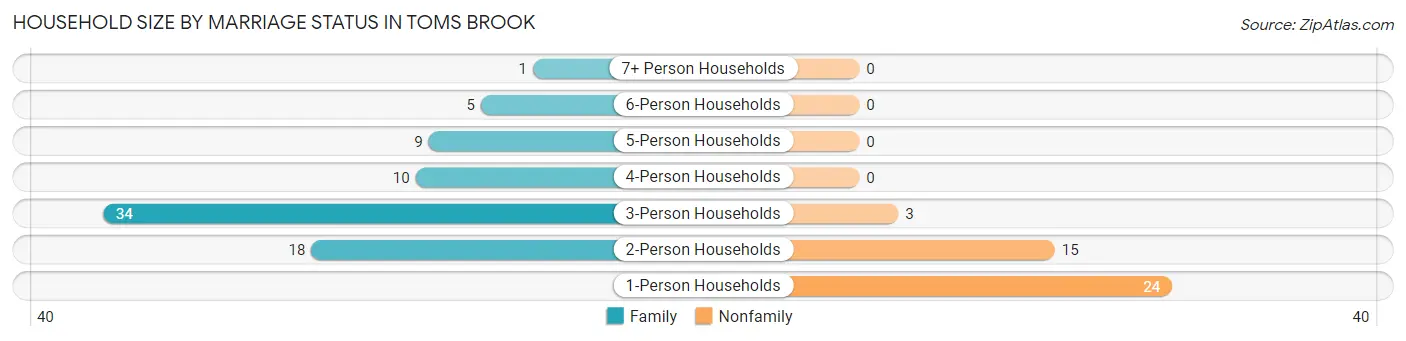
| Household Size | Family Households | Nonfamily Households |
| 1-Person Households | - | 24 (20.2%) |
| 2-Person Households | 18 (15.1%) | 15 (12.6%) |
| 3-Person Households | 34 (28.6%) | 3 (2.5%) |
| 4-Person Households | 10 (8.4%) | 0 (0.0%) |
| 5-Person Households | 9 (7.6%) | 0 (0.0%) |
| 6-Person Households | 5 (4.2%) | 0 (0.0%) |
| 7+ Person Households | 1 (0.8%) | 0 (0.0%) |
| Total | 77 (64.7%) | 42 (35.3%) |
Female Fertility in Toms Brook
Fertility by Age in Toms Brook
| Age Bracket | Women with Births | Births / 1,000 Women |
| 15 to 19 years | 0 (0.0%) | 0.0 |
| 20 to 34 years | 0 (0.0%) | 0.0 |
| 35 to 50 years | 0 (0.0%) | 0.0 |
| Total | 0 (0.0%) | 0.0 |
Fertility by Age by Marriage Status in Toms Brook
| Age Bracket | Married | Unmarried |
| 15 to 19 years | 0 (0.0%) | 0 (0.0%) |
| 20 to 34 years | 0 (0.0%) | 0 (0.0%) |
| 35 to 50 years | 0 (0.0%) | 0 (0.0%) |
| Total | 0 (0.0%) | 0 (0.0%) |
Fertility by Education in Toms Brook
| Educational Attainment | Women with Births | Births / 1,000 Women |
| Less than High School | 0 (0.0%) | 0.0 |
| High School Diploma | 0 (0.0%) | 0.0 |
| College or Associate's Degree | 0 (0.0%) | 0.0 |
| Bachelor's Degree | 0 (0.0%) | 0.0 |
| Graduate Degree | 0 (0.0%) | 0.0 |
| Total | 0 (0.0%) | 0.0 |
Fertility by Education by Marriage Status in Toms Brook
| Educational Attainment | Married | Unmarried |
| Less than High School | 0 (0.0%) | 0 (0.0%) |
| High School Diploma | 0 (0.0%) | 0 (0.0%) |
| College or Associate's Degree | 0 (0.0%) | 0 (0.0%) |
| Bachelor's Degree | 0 (0.0%) | 0 (0.0%) |
| Graduate Degree | 0 (0.0%) | 0 (0.0%) |
| Total | 0 (0.0%) | 0 (0.0%) |
Employment Characteristics in Toms Brook
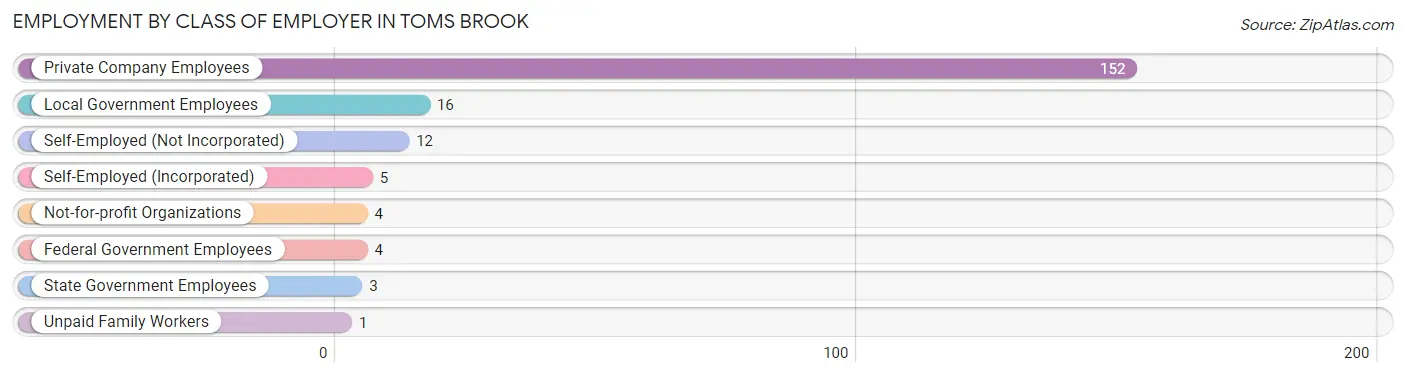
Employment by Class of Employer in Toms Brook
Among the 197 employed individuals in Toms Brook, private company employees (152 | 77.2%), local government employees (16 | 8.1%), and self-employed (not incorporated) (12 | 6.1%) make up the most common classes of employment.
| Employer Class | # Employees | % Employees |
| Private Company Employees | 152 | 77.2% |
| Self-Employed (Incorporated) | 5 | 2.5% |
| Self-Employed (Not Incorporated) | 12 | 6.1% |
| Not-for-profit Organizations | 4 | 2.0% |
| Local Government Employees | 16 | 8.1% |
| State Government Employees | 3 | 1.5% |
| Federal Government Employees | 4 | 2.0% |
| Unpaid Family Workers | 1 | 0.5% |
| Total | 197 | 100.0% |
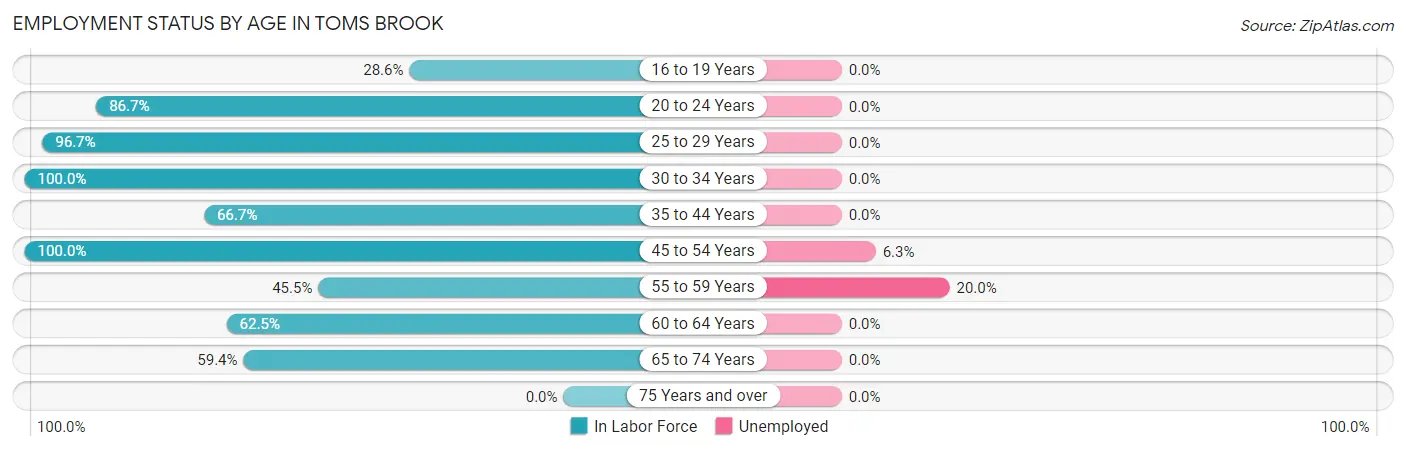
Employment Status by Age in Toms Brook
According to the labor force statistics for Toms Brook, out of the total population over 16 years of age (281), 73.0% or 205 individuals are in the labor force, with 3.4% or 7 of them unemployed. The age group with the highest labor force participation rate is 30 to 34 years, with 100.0% or 14 individuals in the labor force. Within the labor force, the 55 to 59 years age range has the highest percentage of unemployed individuals, with 20.0% or 2 of them being unemployed.
| Age Bracket | In Labor Force | Unemployed |
| 16 to 19 Years | 4 (28.6%) | 0 (0.0%) |
| 20 to 24 Years | 13 (86.7%) | 0 (0.0%) |
| 25 to 29 Years | 29 (96.7%) | 0 (0.0%) |
| 30 to 34 Years | 14 (100.0%) | 0 (0.0%) |
| 35 to 44 Years | 26 (66.7%) | 0 (0.0%) |
| 45 to 54 Years | 80 (100.0%) | 5 (6.3%) |
| 55 to 59 Years | 10 (45.5%) | 2 (20.0%) |
| 60 to 64 Years | 10 (62.5%) | 0 (0.0%) |
| 65 to 74 Years | 19 (59.4%) | 0 (0.0%) |
| 75 Years and over | 0 (0.0%) | 0 (0.0%) |
| Total | 205 (73.0%) | 7 (3.4%) |
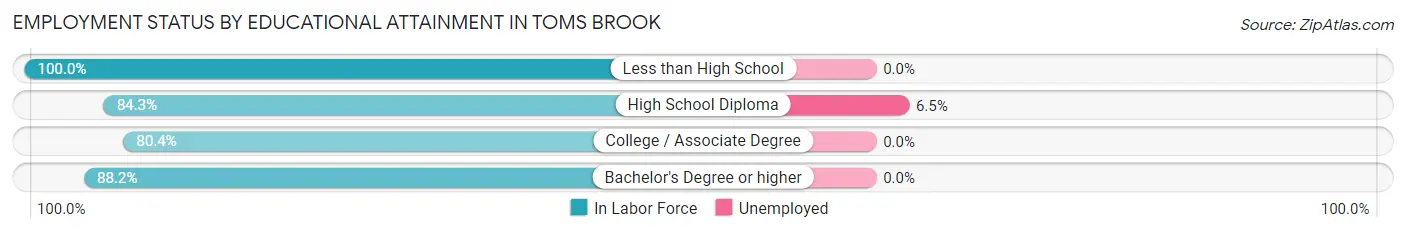
Employment Status by Educational Attainment in Toms Brook
According to labor force statistics for Toms Brook, 84.1% of individuals (169) out of the total population between 25 and 64 years of age (201) are in the labor force, with 4.1% or 7 of them being unemployed. The group with the highest labor force participation rate are those with the educational attainment of less than high school, with 100.0% or 6 individuals in the labor force. Within the labor force, individuals with high school diploma education have the highest percentage of unemployment, with 6.5% or 7 of them being unemployed.
| Educational Attainment | In Labor Force | Unemployed |
| Less than High School | 6 (100.0%) | 0 (0.0%) |
| High School Diploma | 107 (84.3%) | 8 (6.5%) |
| College / Associate Degree | 41 (80.4%) | 0 (0.0%) |
| Bachelor's Degree or higher | 15 (88.2%) | 0 (0.0%) |
| Total | 169 (84.1%) | 8 (4.1%) |
Employment Occupations by Sex in Toms Brook
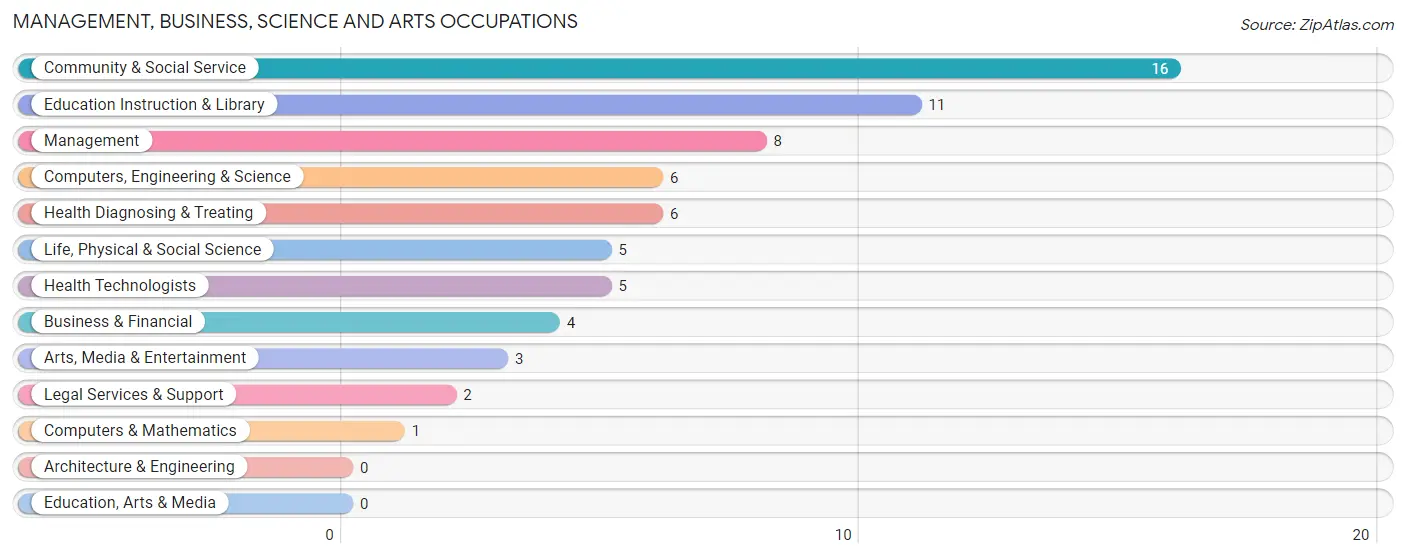
Management, Business, Science and Arts Occupations
The most common Management, Business, Science and Arts occupations in Toms Brook are Community & Social Service (16 | 8.1%), Education Instruction & Library (11 | 5.6%), Management (8 | 4.0%), Computers, Engineering & Science (6 | 3.0%), and Health Diagnosing & Treating (6 | 3.0%).
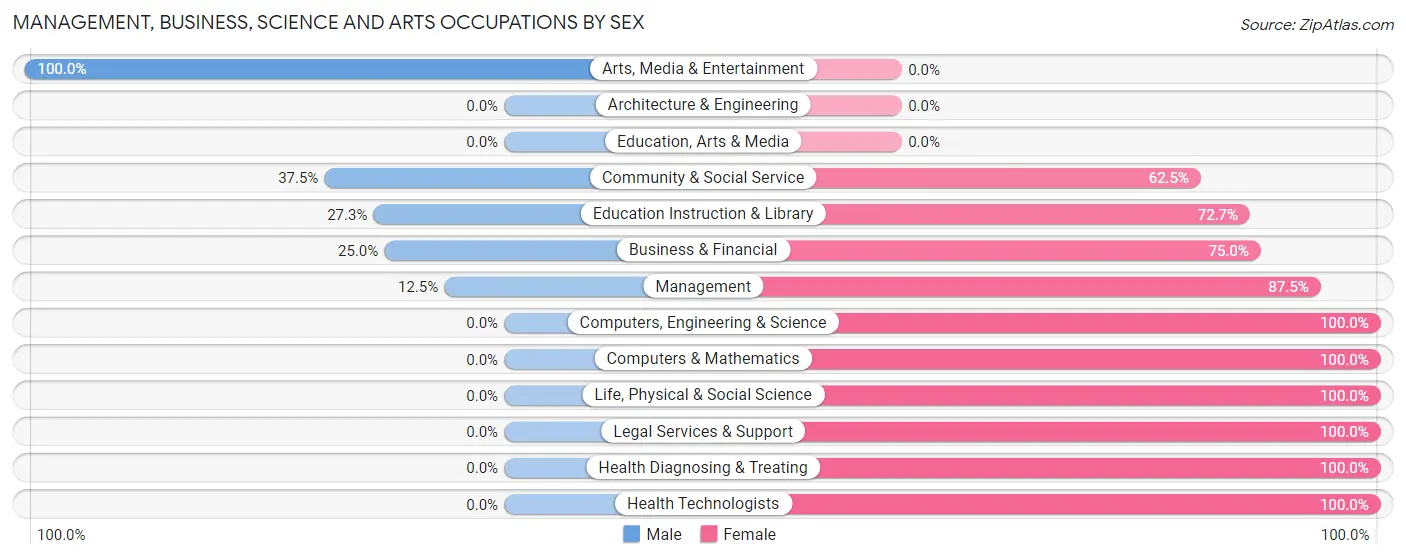
Management, Business, Science and Arts Occupations by Sex
Within the Management, Business, Science and Arts occupations in Toms Brook, the most male-oriented occupations are Arts, Media & Entertainment (100.0%), Community & Social Service (37.5%), and Education Instruction & Library (27.3%), while the most female-oriented occupations are Computers, Engineering & Science (100.0%), Computers & Mathematics (100.0%), and Life, Physical & Social Science (100.0%).
| Occupation | Male | Female |
| Management | 1 (12.5%) | 7 (87.5%) |
| Business & Financial | 1 (25.0%) | 3 (75.0%) |
| Computers, Engineering & Science | 0 (0.0%) | 6 (100.0%) |
| Computers & Mathematics | 0 (0.0%) | 1 (100.0%) |
| Architecture & Engineering | 0 (0.0%) | 0 (0.0%) |
| Life, Physical & Social Science | 0 (0.0%) | 5 (100.0%) |
| Community & Social Service | 6 (37.5%) | 10 (62.5%) |
| Education, Arts & Media | 0 (0.0%) | 0 (0.0%) |
| Legal Services & Support | 0 (0.0%) | 2 (100.0%) |
| Education Instruction & Library | 3 (27.3%) | 8 (72.7%) |
| Arts, Media & Entertainment | 3 (100.0%) | 0 (0.0%) |
| Health Diagnosing & Treating | 0 (0.0%) | 6 (100.0%) |
| Health Technologists | 0 (0.0%) | 5 (100.0%) |
| Total (Category) | 8 (20.0%) | 32 (80.0%) |
| Total (Overall) | 117 (59.1%) | 81 (40.9%) |
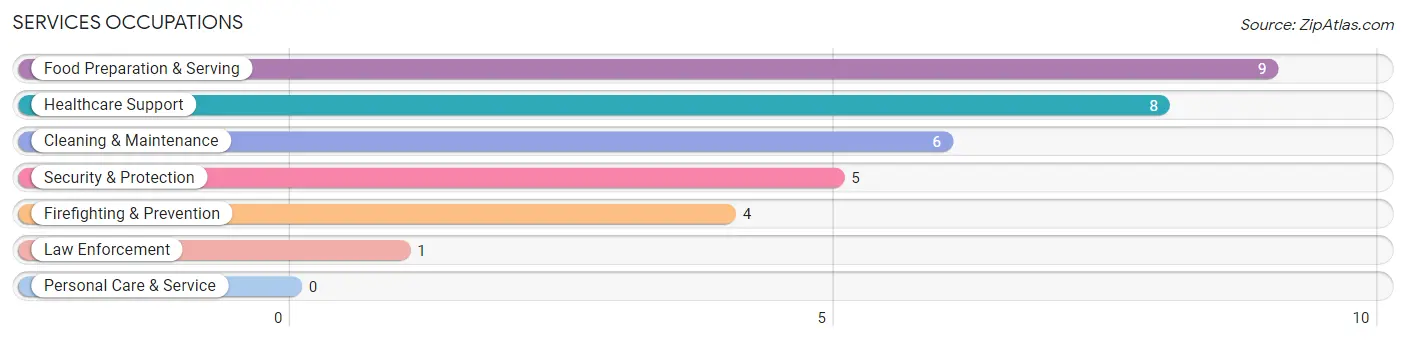
Services Occupations
The most common Services occupations in Toms Brook are Food Preparation & Serving (9 | 4.5%), Healthcare Support (8 | 4.0%), Cleaning & Maintenance (6 | 3.0%), Security & Protection (5 | 2.5%), and Firefighting & Prevention (4 | 2.0%).
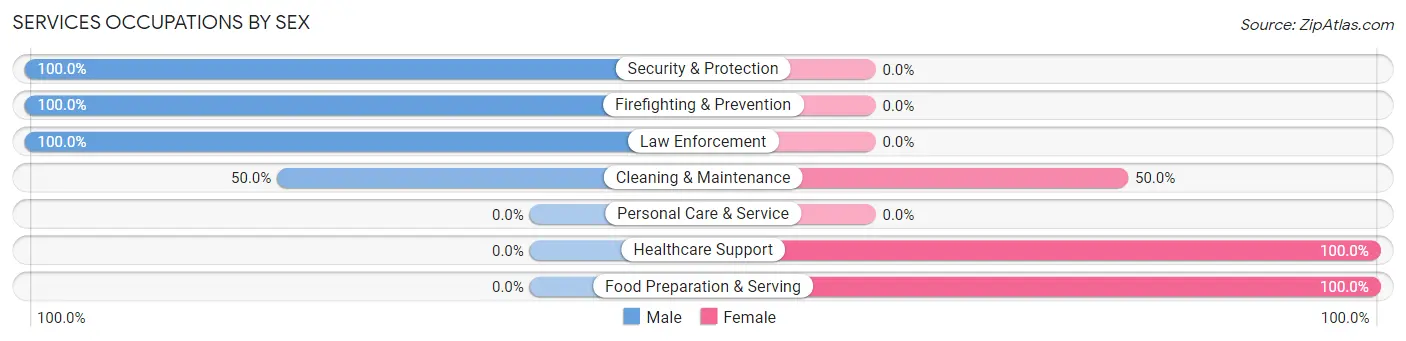
Services Occupations by Sex
Within the Services occupations in Toms Brook, the most male-oriented occupations are Security & Protection (100.0%), Firefighting & Prevention (100.0%), and Law Enforcement (100.0%), while the most female-oriented occupations are Healthcare Support (100.0%), Food Preparation & Serving (100.0%), and Cleaning & Maintenance (50.0%).
| Occupation | Male | Female |
| Healthcare Support | 0 (0.0%) | 8 (100.0%) |
| Security & Protection | 5 (100.0%) | 0 (0.0%) |
| Firefighting & Prevention | 4 (100.0%) | 0 (0.0%) |
| Law Enforcement | 1 (100.0%) | 0 (0.0%) |
| Food Preparation & Serving | 0 (0.0%) | 9 (100.0%) |
| Cleaning & Maintenance | 3 (50.0%) | 3 (50.0%) |
| Personal Care & Service | 0 (0.0%) | 0 (0.0%) |
| Total (Category) | 8 (28.6%) | 20 (71.4%) |
| Total (Overall) | 117 (59.1%) | 81 (40.9%) |
Sales and Office Occupations
The most common Sales and Office occupations in Toms Brook are Office & Administration (7 | 3.5%), and Sales & Related (3 | 1.5%).
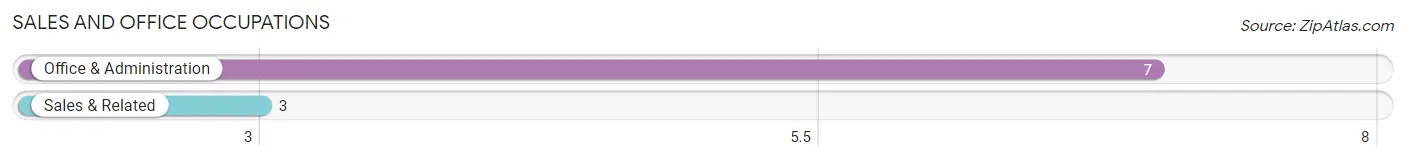
Sales and Office Occupations by Sex
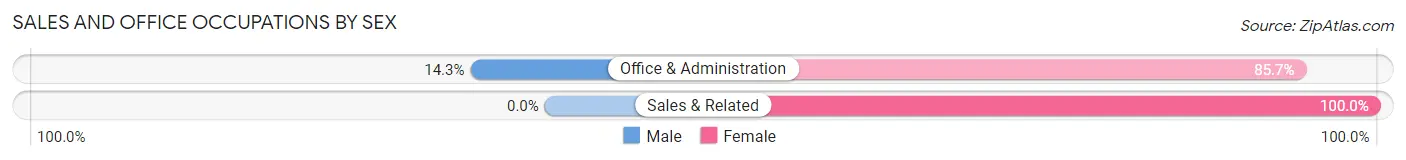
| Occupation | Male | Female |
| Sales & Related | 0 (0.0%) | 3 (100.0%) |
| Office & Administration | 1 (14.3%) | 6 (85.7%) |
| Total (Category) | 1 (10.0%) | 9 (90.0%) |
| Total (Overall) | 117 (59.1%) | 81 (40.9%) |
Natural Resources, Construction and Maintenance Occupations
The most common Natural Resources, Construction and Maintenance occupations in Toms Brook are Construction & Extraction (12 | 6.1%), and Installation, Maintenance & Repair (5 | 2.5%).
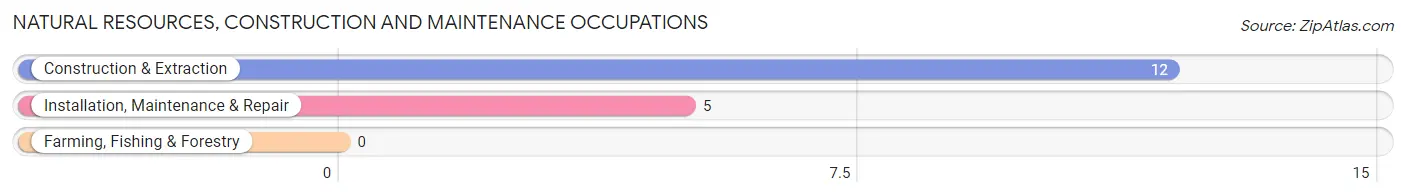
Natural Resources, Construction and Maintenance Occupations by Sex
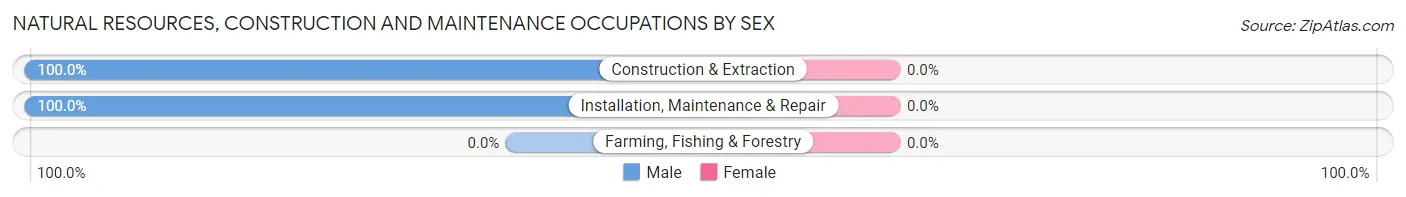
| Occupation | Male | Female |
| Farming, Fishing & Forestry | 0 (0.0%) | 0 (0.0%) |
| Construction & Extraction | 12 (100.0%) | 0 (0.0%) |
| Installation, Maintenance & Repair | 5 (100.0%) | 0 (0.0%) |
| Total (Category) | 17 (100.0%) | 0 (0.0%) |
| Total (Overall) | 117 (59.1%) | 81 (40.9%) |
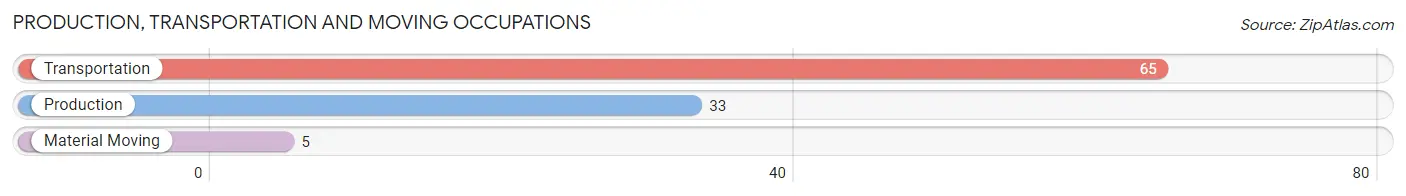
Production, Transportation and Moving Occupations
The most common Production, Transportation and Moving occupations in Toms Brook are Transportation (65 | 32.8%), Production (33 | 16.7%), and Material Moving (5 | 2.5%).
Production, Transportation and Moving Occupations by Sex
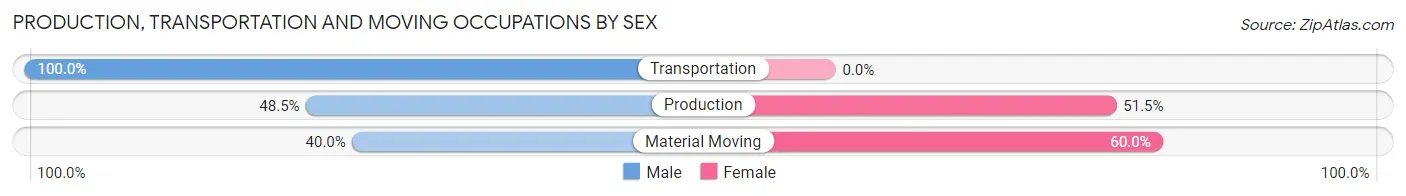
| Occupation | Male | Female |
| Production | 16 (48.5%) | 17 (51.5%) |
| Transportation | 65 (100.0%) | 0 (0.0%) |
| Material Moving | 2 (40.0%) | 3 (60.0%) |
| Total (Category) | 83 (80.6%) | 20 (19.4%) |
| Total (Overall) | 117 (59.1%) | 81 (40.9%) |
Employment Industries by Sex in Toms Brook
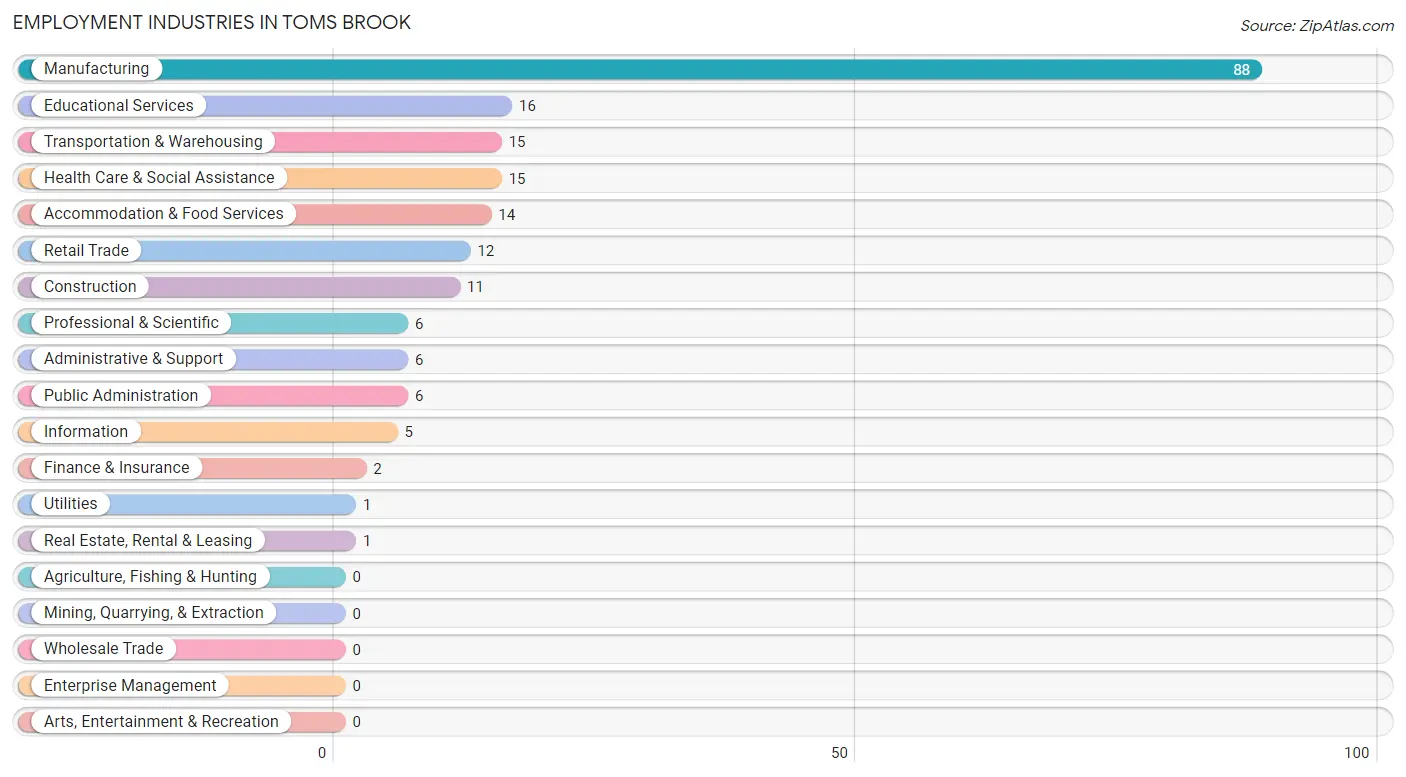
Employment Industries in Toms Brook
The major employment industries in Toms Brook include Manufacturing (88 | 44.4%), Educational Services (16 | 8.1%), Transportation & Warehousing (15 | 7.6%), Health Care & Social Assistance (15 | 7.6%), and Accommodation & Food Services (14 | 7.1%).
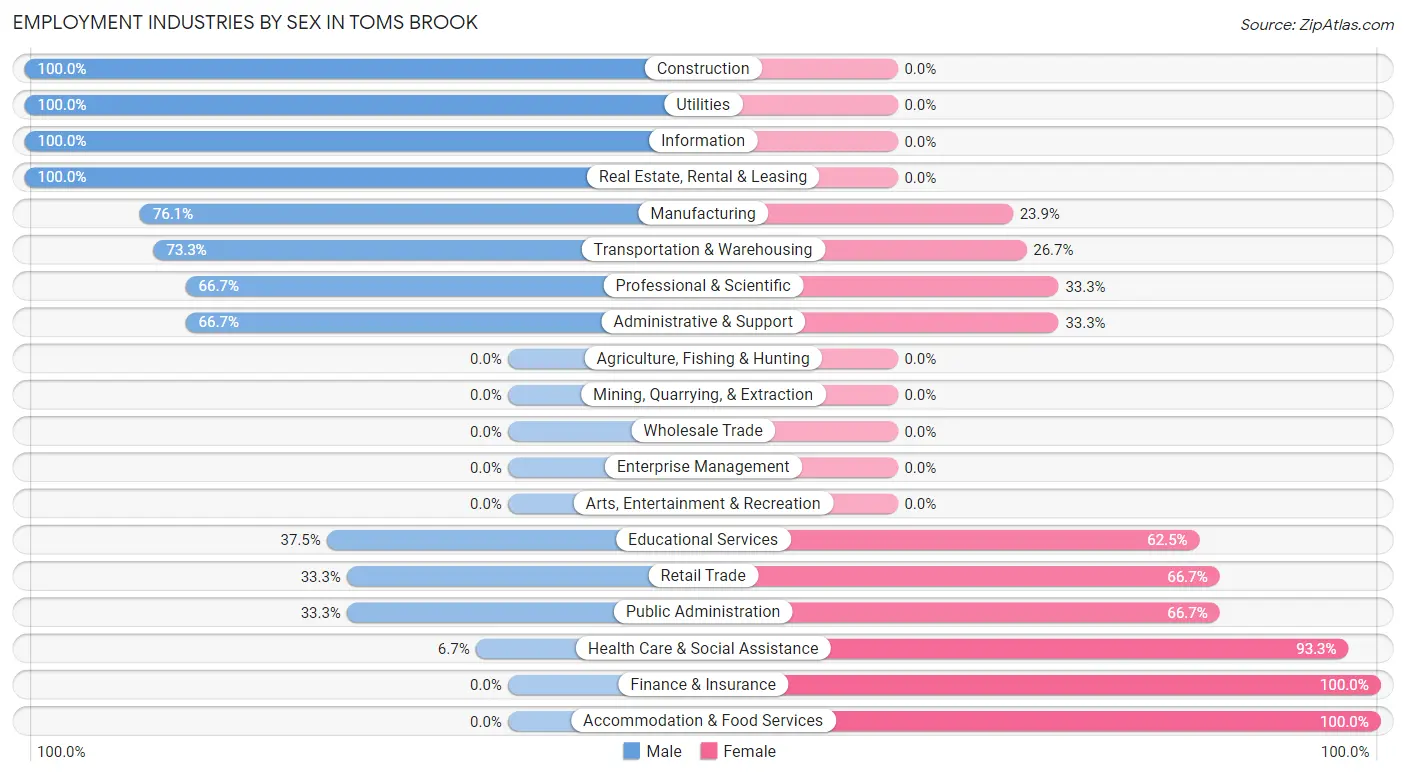
Employment Industries by Sex in Toms Brook
The Toms Brook industries that see more men than women are Construction (100.0%), Utilities (100.0%), and Information (100.0%), whereas the industries that tend to have a higher number of women are Finance & Insurance (100.0%), Accommodation & Food Services (100.0%), and Health Care & Social Assistance (93.3%).
| Industry | Male | Female |
| Agriculture, Fishing & Hunting | 0 (0.0%) | 0 (0.0%) |
| Mining, Quarrying, & Extraction | 0 (0.0%) | 0 (0.0%) |
| Construction | 11 (100.0%) | 0 (0.0%) |
| Manufacturing | 67 (76.1%) | 21 (23.9%) |
| Wholesale Trade | 0 (0.0%) | 0 (0.0%) |
| Retail Trade | 4 (33.3%) | 8 (66.7%) |
| Transportation & Warehousing | 11 (73.3%) | 4 (26.7%) |
| Utilities | 1 (100.0%) | 0 (0.0%) |
| Information | 5 (100.0%) | 0 (0.0%) |
| Finance & Insurance | 0 (0.0%) | 2 (100.0%) |
| Real Estate, Rental & Leasing | 1 (100.0%) | 0 (0.0%) |
| Professional & Scientific | 4 (66.7%) | 2 (33.3%) |
| Enterprise Management | 0 (0.0%) | 0 (0.0%) |
| Administrative & Support | 4 (66.7%) | 2 (33.3%) |
| Educational Services | 6 (37.5%) | 10 (62.5%) |
| Health Care & Social Assistance | 1 (6.7%) | 14 (93.3%) |
| Arts, Entertainment & Recreation | 0 (0.0%) | 0 (0.0%) |
| Accommodation & Food Services | 0 (0.0%) | 14 (100.0%) |
| Public Administration | 2 (33.3%) | 4 (66.7%) |
| Total | 117 (59.1%) | 81 (40.9%) |
Education in Toms Brook
School Enrollment in Toms Brook
The most common levels of schooling among the 70 students in Toms Brook are middle school (23 | 32.9%), elementary school (20 | 28.6%), and high school (17 | 24.3%).
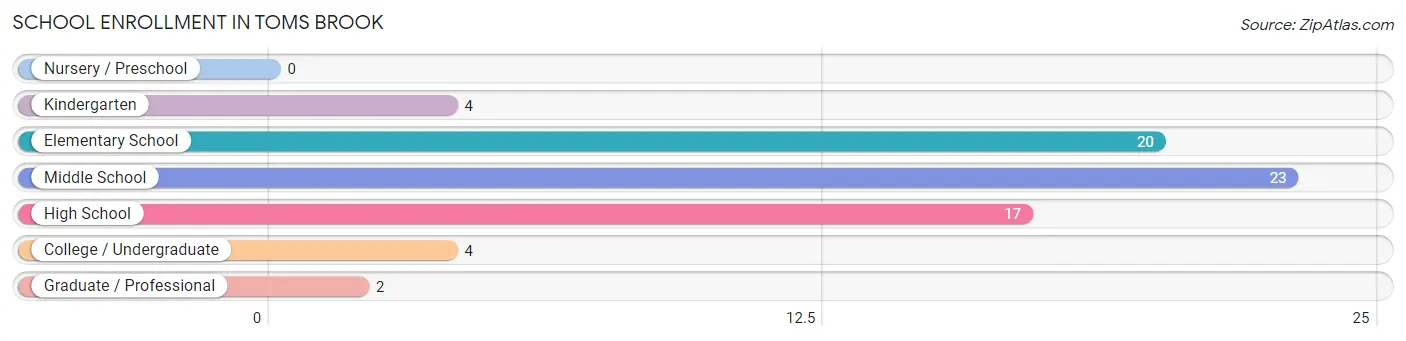
| School Level | # Students | % Students |
| Nursery / Preschool | 0 | 0.0% |
| Kindergarten | 4 | 5.7% |
| Elementary School | 20 | 28.6% |
| Middle School | 23 | 32.9% |
| High School | 17 | 24.3% |
| College / Undergraduate | 4 | 5.7% |
| Graduate / Professional | 2 | 2.9% |
| Total | 70 | 100.0% |
School Enrollment by Age by Funding Source in Toms Brook
Out of a total of 70 students who are enrolled in schools in Toms Brook, 9 (12.9%) attend a private institution, while the remaining 61 (87.1%) are enrolled in public schools. The age group of 20 to 24 year olds has the highest likelihood of being enrolled in private schools, with 2 (66.7% in the age bracket) enrolled. Conversely, the age group of 35 years and over has the lowest likelihood of being enrolled in a private school, with 2 (100.0% in the age bracket) attending a public institution.
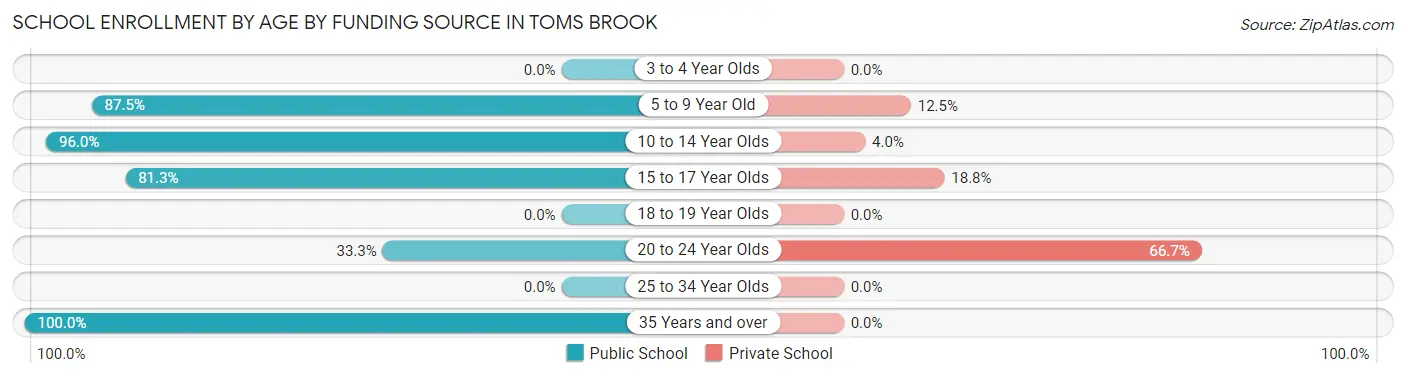
| Age Bracket | Public School | Private School |
| 3 to 4 Year Olds | 0 (0.0%) | 0 (0.0%) |
| 5 to 9 Year Old | 21 (87.5%) | 3 (12.5%) |
| 10 to 14 Year Olds | 24 (96.0%) | 1 (4.0%) |
| 15 to 17 Year Olds | 13 (81.2%) | 3 (18.8%) |
| 18 to 19 Year Olds | 0 (0.0%) | 0 (0.0%) |
| 20 to 24 Year Olds | 1 (33.3%) | 2 (66.7%) |
| 25 to 34 Year Olds | 0 (0.0%) | 0 (0.0%) |
| 35 Years and over | 2 (100.0%) | 0 (0.0%) |
| Total | 61 (87.1%) | 9 (12.9%) |
Educational Attainment by Field of Study in Toms Brook
Arts & humanities (7 | 41.2%), education (4 | 23.5%), business (2 | 11.8%), liberal arts & history (2 | 11.8%), and psychology (1 | 5.9%) are the most common fields of study among 17 individuals in Toms Brook who have obtained a bachelor's degree or higher.
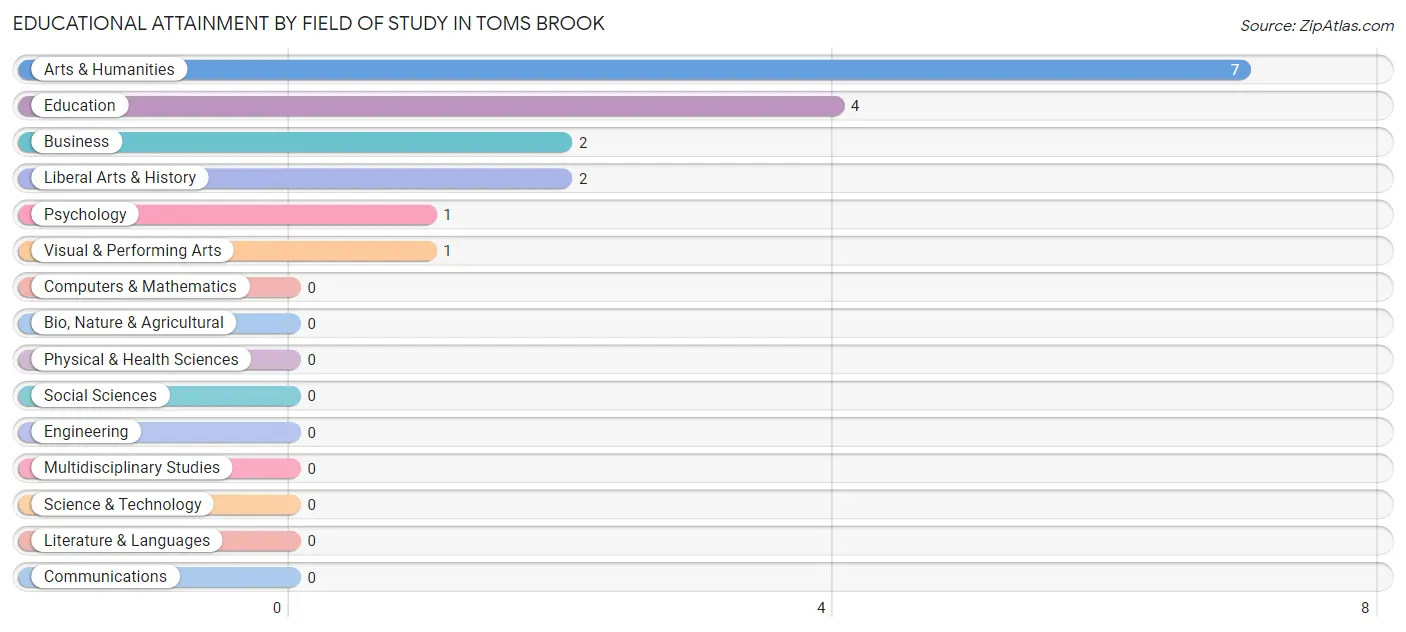
| Field of Study | # Graduates | % Graduates |
| Computers & Mathematics | 0 | 0.0% |
| Bio, Nature & Agricultural | 0 | 0.0% |
| Physical & Health Sciences | 0 | 0.0% |
| Psychology | 1 | 5.9% |
| Social Sciences | 0 | 0.0% |
| Engineering | 0 | 0.0% |
| Multidisciplinary Studies | 0 | 0.0% |
| Science & Technology | 0 | 0.0% |
| Business | 2 | 11.8% |
| Education | 4 | 23.5% |
| Literature & Languages | 0 | 0.0% |
| Liberal Arts & History | 2 | 11.8% |
| Visual & Performing Arts | 1 | 5.9% |
| Communications | 0 | 0.0% |
| Arts & Humanities | 7 | 41.2% |
| Total | 17 | 100.0% |
Transportation & Commute in Toms Brook
Vehicle Availability by Sex in Toms Brook
The most prevalent vehicle ownership categories in Toms Brook are males with 4 vehicles (55, accounting for 47.4%) and females with 4 vehicles (19, making up 67.9%).
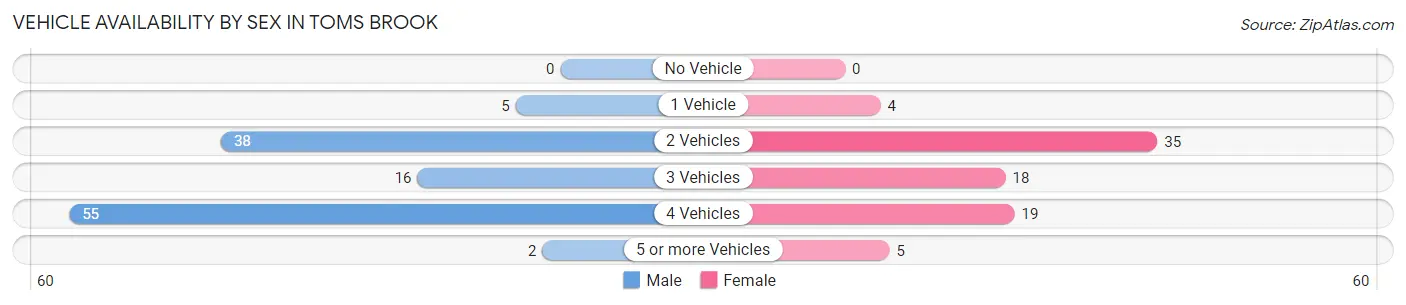
| Vehicles Available | Male | Female |
| No Vehicle | 0 (0.0%) | 0 (0.0%) |
| 1 Vehicle | 5 (4.3%) | 4 (4.9%) |
| 2 Vehicles | 38 (32.8%) | 35 (43.2%) |
| 3 Vehicles | 16 (13.8%) | 18 (22.2%) |
| 4 Vehicles | 55 (47.4%) | 19 (23.5%) |
| 5 or more Vehicles | 2 (1.7%) | 5 (6.2%) |
| Total | 116 (100.0%) | 81 (100.0%) |
Commute Time in Toms Brook
The most frequently occuring commute durations in Toms Brook are 35 to 39 minutes (52 commuters, 26.9%), 30 to 34 minutes (36 commuters, 18.6%), and 15 to 19 minutes (26 commuters, 13.5%).
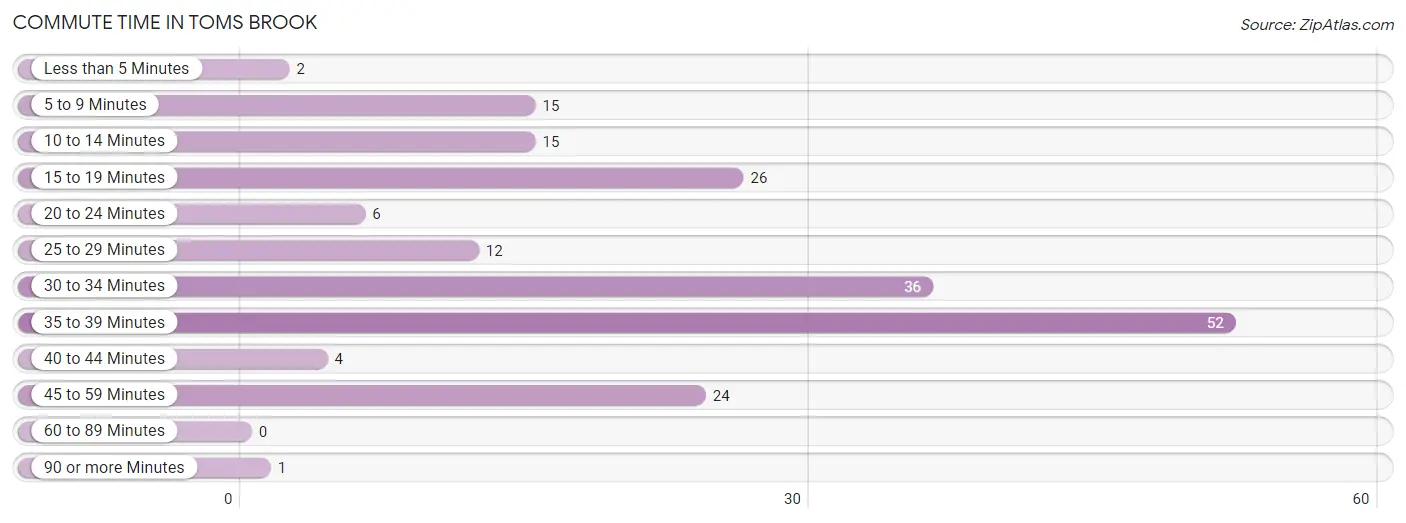
| Commute Time | # Commuters | % Commuters |
| Less than 5 Minutes | 2 | 1.0% |
| 5 to 9 Minutes | 15 | 7.8% |
| 10 to 14 Minutes | 15 | 7.8% |
| 15 to 19 Minutes | 26 | 13.5% |
| 20 to 24 Minutes | 6 | 3.1% |
| 25 to 29 Minutes | 12 | 6.2% |
| 30 to 34 Minutes | 36 | 18.6% |
| 35 to 39 Minutes | 52 | 26.9% |
| 40 to 44 Minutes | 4 | 2.1% |
| 45 to 59 Minutes | 24 | 12.4% |
| 60 to 89 Minutes | 0 | 0.0% |
| 90 or more Minutes | 1 | 0.5% |
Commute Time by Sex in Toms Brook
The most common commute times in Toms Brook are 35 to 39 minutes (52 commuters, 45.2%) for males and 15 to 19 minutes (20 commuters, 25.6%) for females.
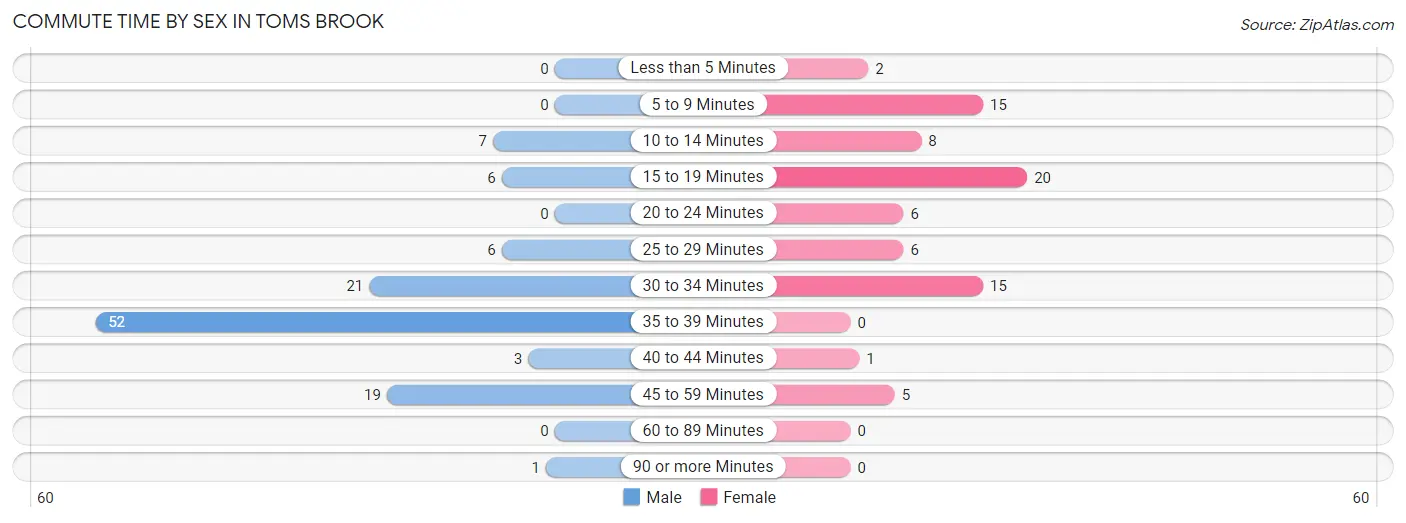
| Commute Time | Male | Female |
| Less than 5 Minutes | 0 (0.0%) | 2 (2.6%) |
| 5 to 9 Minutes | 0 (0.0%) | 15 (19.2%) |
| 10 to 14 Minutes | 7 (6.1%) | 8 (10.3%) |
| 15 to 19 Minutes | 6 (5.2%) | 20 (25.6%) |
| 20 to 24 Minutes | 0 (0.0%) | 6 (7.7%) |
| 25 to 29 Minutes | 6 (5.2%) | 6 (7.7%) |
| 30 to 34 Minutes | 21 (18.3%) | 15 (19.2%) |
| 35 to 39 Minutes | 52 (45.2%) | 0 (0.0%) |
| 40 to 44 Minutes | 3 (2.6%) | 1 (1.3%) |
| 45 to 59 Minutes | 19 (16.5%) | 5 (6.4%) |
| 60 to 89 Minutes | 0 (0.0%) | 0 (0.0%) |
| 90 or more Minutes | 1 (0.9%) | 0 (0.0%) |
Time of Departure to Work by Sex in Toms Brook
The most frequent times of departure to work in Toms Brook are 12:00 PM to 3:59 PM (52, 45.2%) for males and 7:00 AM to 7:29 AM (17, 21.8%) for females.
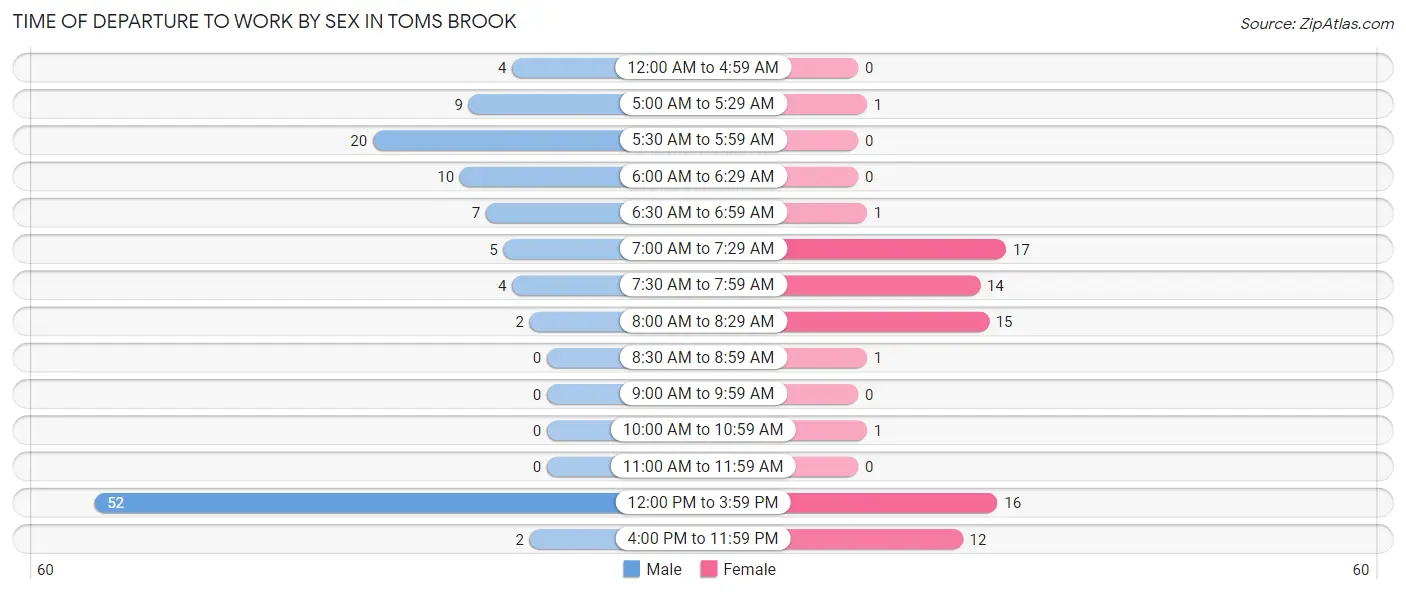
| Time of Departure | Male | Female |
| 12:00 AM to 4:59 AM | 4 (3.5%) | 0 (0.0%) |
| 5:00 AM to 5:29 AM | 9 (7.8%) | 1 (1.3%) |
| 5:30 AM to 5:59 AM | 20 (17.4%) | 0 (0.0%) |
| 6:00 AM to 6:29 AM | 10 (8.7%) | 0 (0.0%) |
| 6:30 AM to 6:59 AM | 7 (6.1%) | 1 (1.3%) |
| 7:00 AM to 7:29 AM | 5 (4.3%) | 17 (21.8%) |
| 7:30 AM to 7:59 AM | 4 (3.5%) | 14 (17.9%) |
| 8:00 AM to 8:29 AM | 2 (1.7%) | 15 (19.2%) |
| 8:30 AM to 8:59 AM | 0 (0.0%) | 1 (1.3%) |
| 9:00 AM to 9:59 AM | 0 (0.0%) | 0 (0.0%) |
| 10:00 AM to 10:59 AM | 0 (0.0%) | 1 (1.3%) |
| 11:00 AM to 11:59 AM | 0 (0.0%) | 0 (0.0%) |
| 12:00 PM to 3:59 PM | 52 (45.2%) | 16 (20.5%) |
| 4:00 PM to 11:59 PM | 2 (1.7%) | 12 (15.4%) |
| Total | 115 (100.0%) | 78 (100.0%) |
Housing Occupancy in Toms Brook
Occupancy by Ownership in Toms Brook
Of the total 119 dwellings in Toms Brook, owner-occupied units account for 97 (81.5%), while renter-occupied units make up 22 (18.5%).
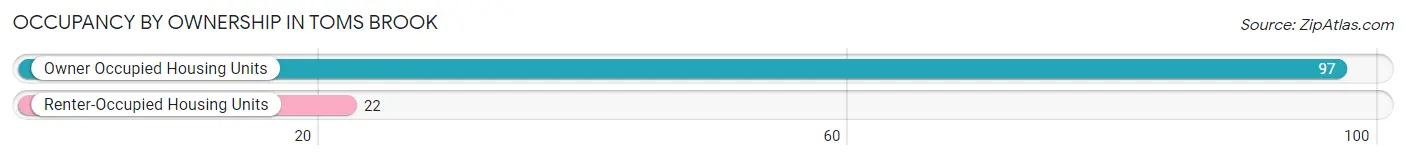
| Occupancy | # Housing Units | % Housing Units |
| Owner Occupied Housing Units | 97 | 81.5% |
| Renter-Occupied Housing Units | 22 | 18.5% |
| Total Occupied Housing Units | 119 | 100.0% |
Occupancy by Household Size in Toms Brook
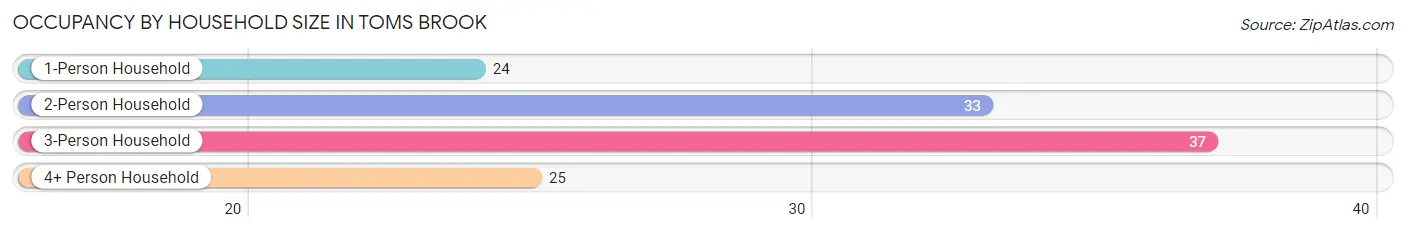
| Household Size | # Housing Units | % Housing Units |
| 1-Person Household | 24 | 20.2% |
| 2-Person Household | 33 | 27.7% |
| 3-Person Household | 37 | 31.1% |
| 4+ Person Household | 25 | 21.0% |
| Total Housing Units | 119 | 100.0% |
Occupancy by Ownership by Household Size in Toms Brook
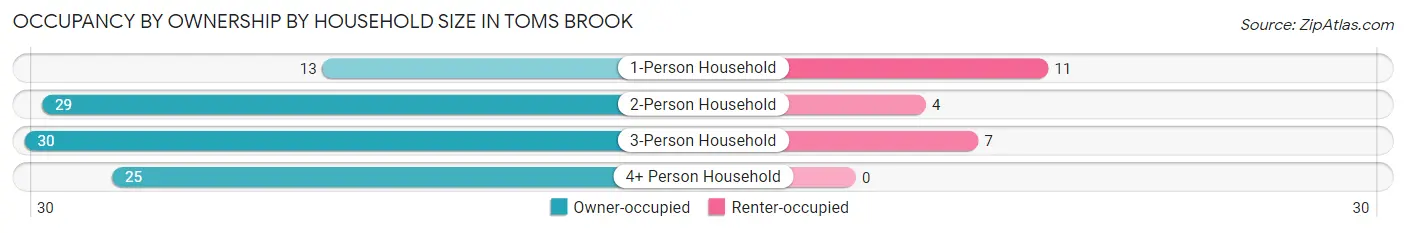
| Household Size | Owner-occupied | Renter-occupied |
| 1-Person Household | 13 (54.2%) | 11 (45.8%) |
| 2-Person Household | 29 (87.9%) | 4 (12.1%) |
| 3-Person Household | 30 (81.1%) | 7 (18.9%) |
| 4+ Person Household | 25 (100.0%) | 0 (0.0%) |
| Total Housing Units | 97 (81.5%) | 22 (18.5%) |
Occupancy by Educational Attainment in Toms Brook
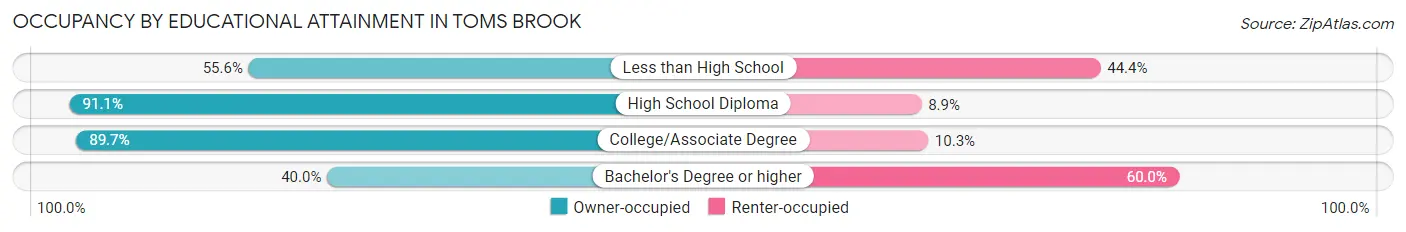
| Household Size | Owner-occupied | Renter-occupied |
| Less than High School | 5 (55.6%) | 4 (44.4%) |
| High School Diploma | 51 (91.1%) | 5 (8.9%) |
| College/Associate Degree | 35 (89.7%) | 4 (10.3%) |
| Bachelor's Degree or higher | 6 (40.0%) | 9 (60.0%) |
Occupancy by Age of Householder in Toms Brook
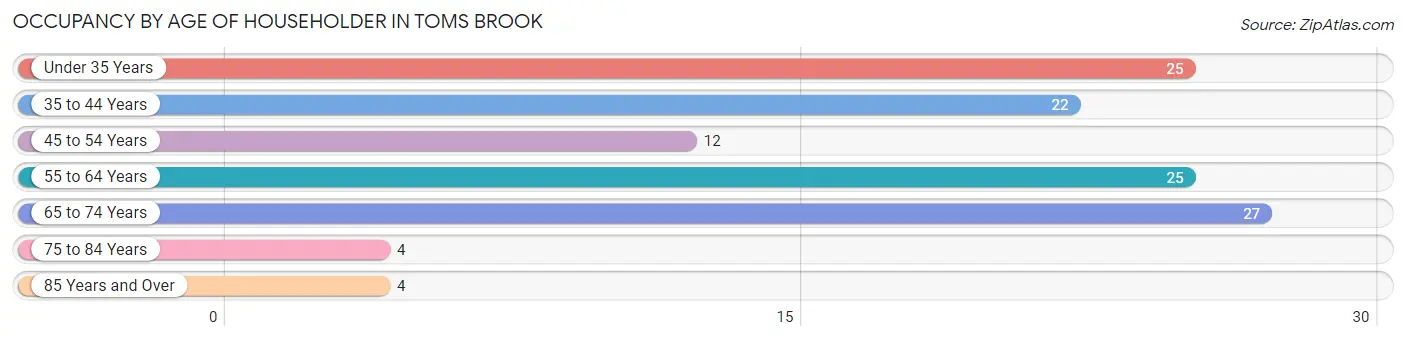
| Age Bracket | # Households | % Households |
| Under 35 Years | 25 | 21.0% |
| 35 to 44 Years | 22 | 18.5% |
| 45 to 54 Years | 12 | 10.1% |
| 55 to 64 Years | 25 | 21.0% |
| 65 to 74 Years | 27 | 22.7% |
| 75 to 84 Years | 4 | 3.4% |
| 85 Years and Over | 4 | 3.4% |
| Total | 119 | 100.0% |
Housing Finances in Toms Brook
Median Income by Occupancy in Toms Brook
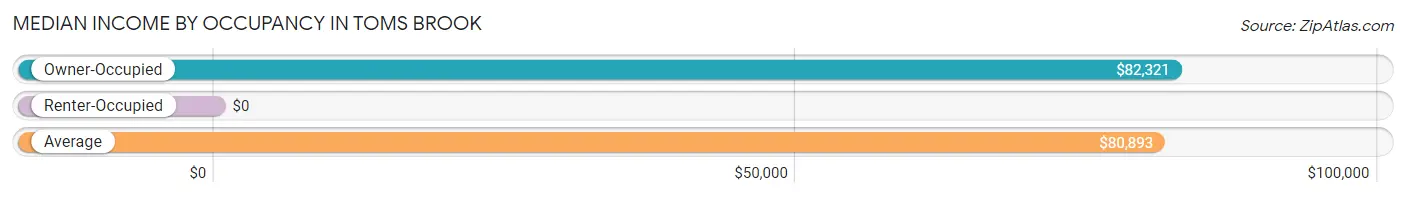
| Occupancy Type | # Households | Median Income |
| Owner-Occupied | 97 (81.5%) | $82,321 |
| Renter-Occupied | 22 (18.5%) | $0 |
| Average | 119 (100.0%) | $80,893 |
Occupancy by Householder Income Bracket in Toms Brook
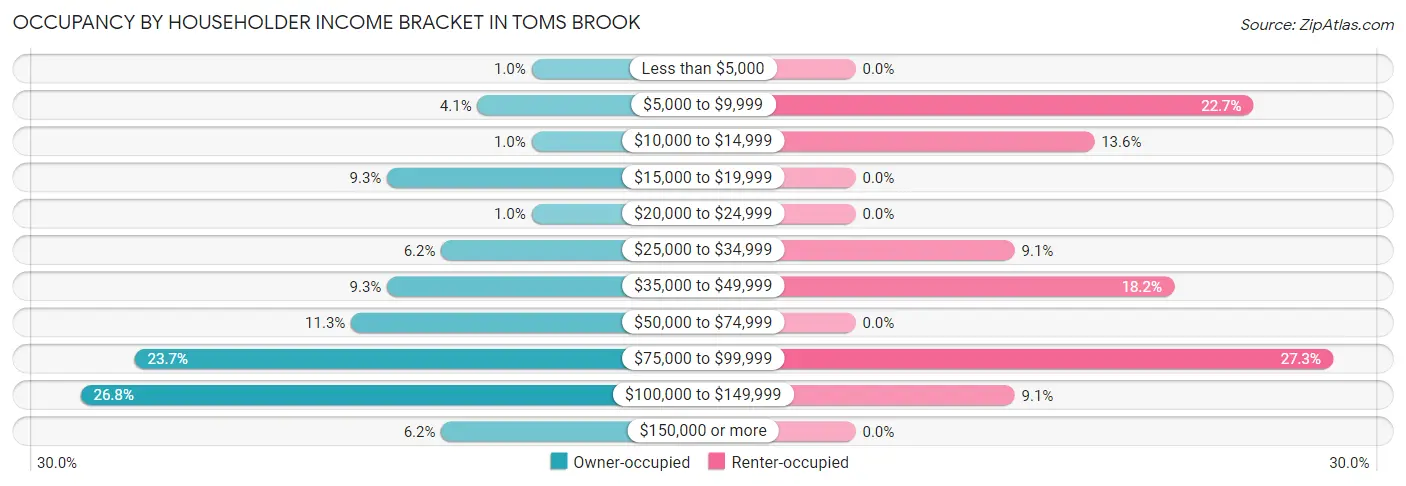
| Income Bracket | Owner-occupied | Renter-occupied |
| Less than $5,000 | 1 (1.0%) | 0 (0.0%) |
| $5,000 to $9,999 | 4 (4.1%) | 5 (22.7%) |
| $10,000 to $14,999 | 1 (1.0%) | 3 (13.6%) |
| $15,000 to $19,999 | 9 (9.3%) | 0 (0.0%) |
| $20,000 to $24,999 | 1 (1.0%) | 0 (0.0%) |
| $25,000 to $34,999 | 6 (6.2%) | 2 (9.1%) |
| $35,000 to $49,999 | 9 (9.3%) | 4 (18.2%) |
| $50,000 to $74,999 | 11 (11.3%) | 0 (0.0%) |
| $75,000 to $99,999 | 23 (23.7%) | 6 (27.3%) |
| $100,000 to $149,999 | 26 (26.8%) | 2 (9.1%) |
| $150,000 or more | 6 (6.2%) | 0 (0.0%) |
| Total | 97 (100.0%) | 22 (100.0%) |
Monthly Housing Cost Tiers in Toms Brook
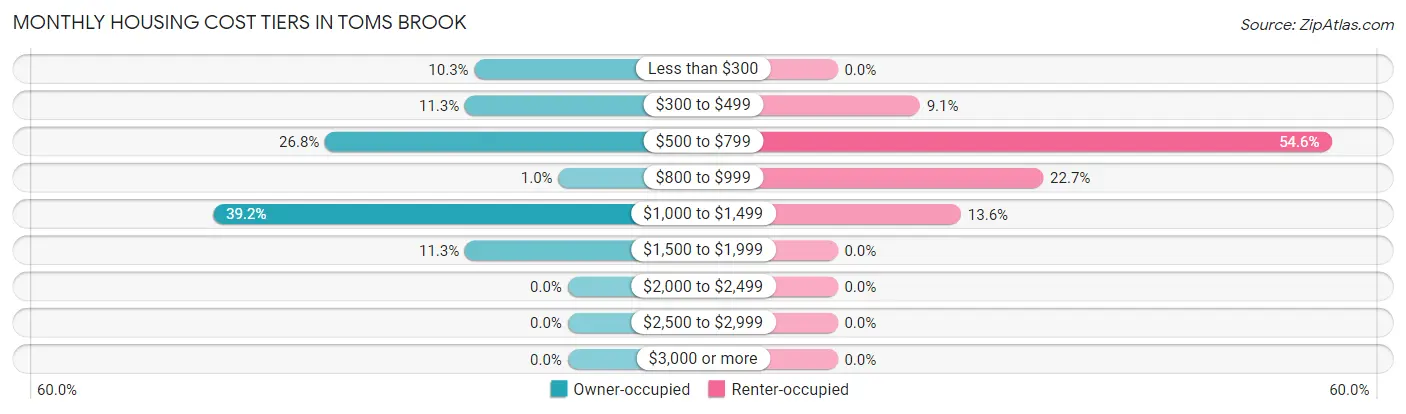
| Monthly Cost | Owner-occupied | Renter-occupied |
| Less than $300 | 10 (10.3%) | 0 (0.0%) |
| $300 to $499 | 11 (11.3%) | 2 (9.1%) |
| $500 to $799 | 26 (26.8%) | 12 (54.5%) |
| $800 to $999 | 1 (1.0%) | 5 (22.7%) |
| $1,000 to $1,499 | 38 (39.2%) | 3 (13.6%) |
| $1,500 to $1,999 | 11 (11.3%) | 0 (0.0%) |
| $2,000 to $2,499 | 0 (0.0%) | 0 (0.0%) |
| $2,500 to $2,999 | 0 (0.0%) | 0 (0.0%) |
| $3,000 or more | 0 (0.0%) | 0 (0.0%) |
| Total | 97 (100.0%) | 22 (100.0%) |
Physical Housing Characteristics in Toms Brook
Housing Structures in Toms Brook
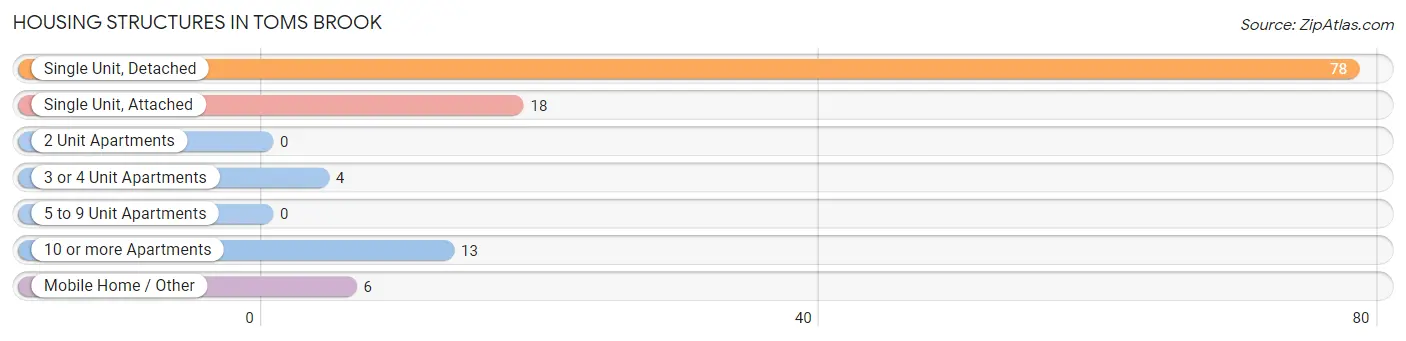
| Structure Type | # Housing Units | % Housing Units |
| Single Unit, Detached | 78 | 65.5% |
| Single Unit, Attached | 18 | 15.1% |
| 2 Unit Apartments | 0 | 0.0% |
| 3 or 4 Unit Apartments | 4 | 3.4% |
| 5 to 9 Unit Apartments | 0 | 0.0% |
| 10 or more Apartments | 13 | 10.9% |
| Mobile Home / Other | 6 | 5.0% |
| Total | 119 | 100.0% |
Housing Structures by Occupancy in Toms Brook
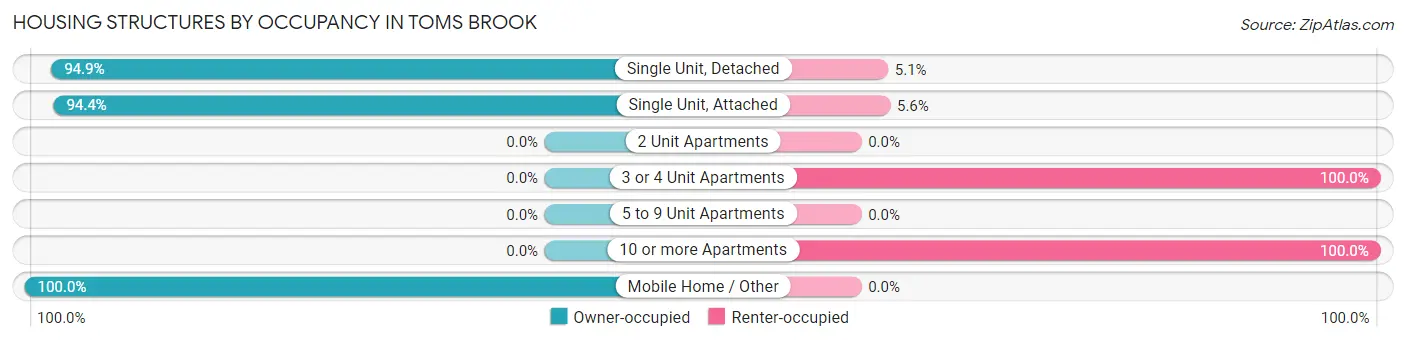
| Structure Type | Owner-occupied | Renter-occupied |
| Single Unit, Detached | 74 (94.9%) | 4 (5.1%) |
| Single Unit, Attached | 17 (94.4%) | 1 (5.6%) |
| 2 Unit Apartments | 0 (0.0%) | 0 (0.0%) |
| 3 or 4 Unit Apartments | 0 (0.0%) | 4 (100.0%) |
| 5 to 9 Unit Apartments | 0 (0.0%) | 0 (0.0%) |
| 10 or more Apartments | 0 (0.0%) | 13 (100.0%) |
| Mobile Home / Other | 6 (100.0%) | 0 (0.0%) |
| Total | 97 (81.5%) | 22 (18.5%) |
Housing Structures by Number of Rooms in Toms Brook
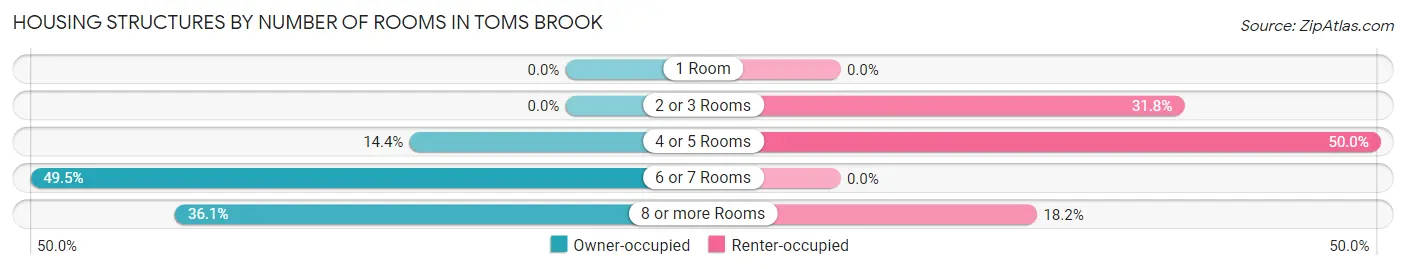
| Number of Rooms | Owner-occupied | Renter-occupied |
| 1 Room | 0 (0.0%) | 0 (0.0%) |
| 2 or 3 Rooms | 0 (0.0%) | 7 (31.8%) |
| 4 or 5 Rooms | 14 (14.4%) | 11 (50.0%) |
| 6 or 7 Rooms | 48 (49.5%) | 0 (0.0%) |
| 8 or more Rooms | 35 (36.1%) | 4 (18.2%) |
| Total | 97 (100.0%) | 22 (100.0%) |
Housing Structure by Heating Type in Toms Brook
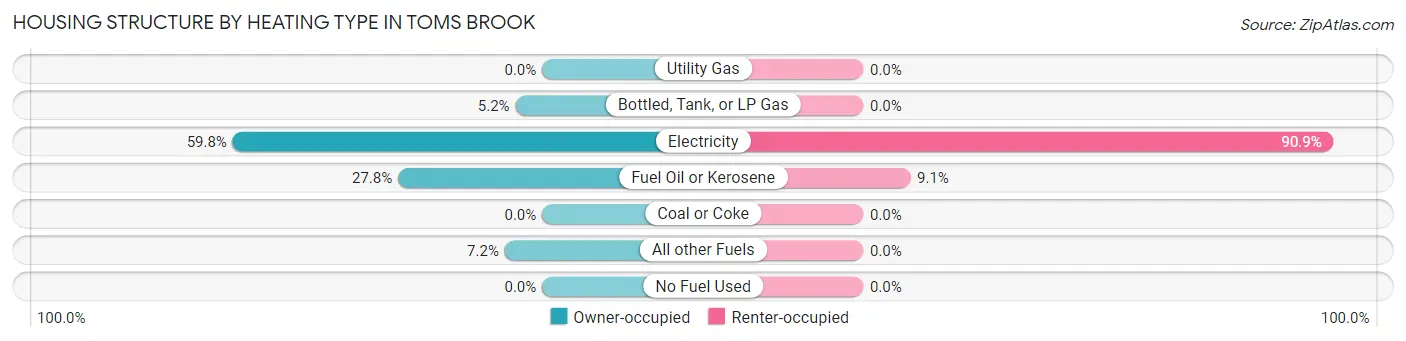
| Heating Type | Owner-occupied | Renter-occupied |
| Utility Gas | 0 (0.0%) | 0 (0.0%) |
| Bottled, Tank, or LP Gas | 5 (5.1%) | 0 (0.0%) |
| Electricity | 58 (59.8%) | 20 (90.9%) |
| Fuel Oil or Kerosene | 27 (27.8%) | 2 (9.1%) |
| Coal or Coke | 0 (0.0%) | 0 (0.0%) |
| All other Fuels | 7 (7.2%) | 0 (0.0%) |
| No Fuel Used | 0 (0.0%) | 0 (0.0%) |
| Total | 97 (100.0%) | 22 (100.0%) |
Household Vehicle Usage in Toms Brook
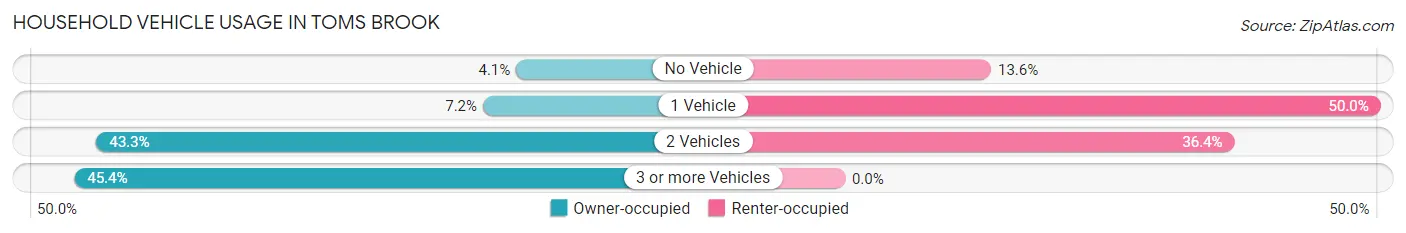
| Vehicles per Household | Owner-occupied | Renter-occupied |
| No Vehicle | 4 (4.1%) | 3 (13.6%) |
| 1 Vehicle | 7 (7.2%) | 11 (50.0%) |
| 2 Vehicles | 42 (43.3%) | 8 (36.4%) |
| 3 or more Vehicles | 44 (45.4%) | 0 (0.0%) |
| Total | 97 (100.0%) | 22 (100.0%) |
Real Estate & Mortgages in Toms Brook
Real Estate and Mortgage Overview in Toms Brook
| Characteristic | Without Mortgage | With Mortgage |
| Housing Units | 30 | 67 |
| Median Property Value | $137,500 | $204,500 |
| Median Household Income | $34,167 | $4 |
| Monthly Housing Costs | $342 | $0 |
| Real Estate Taxes | $857 | $0 |
Property Value by Mortgage Status in Toms Brook
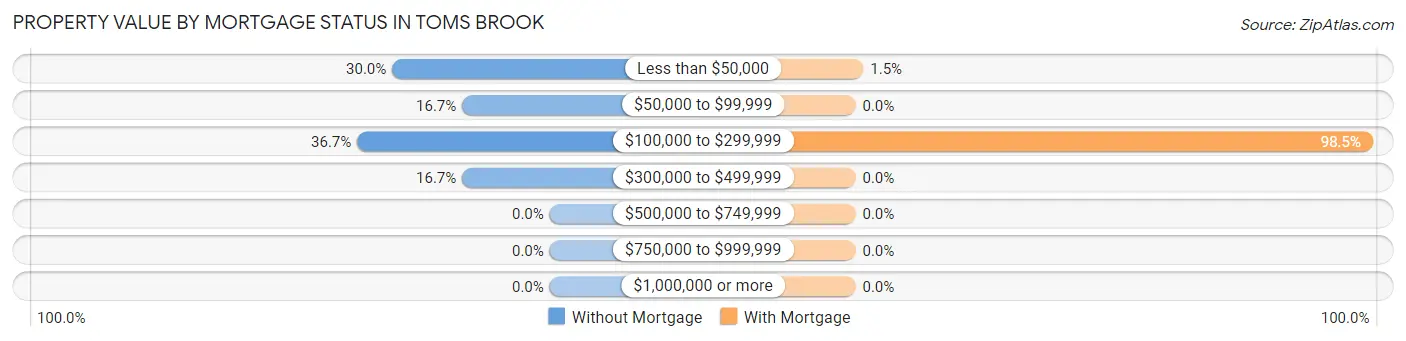
| Property Value | Without Mortgage | With Mortgage |
| Less than $50,000 | 9 (30.0%) | 1 (1.5%) |
| $50,000 to $99,999 | 5 (16.7%) | 0 (0.0%) |
| $100,000 to $299,999 | 11 (36.7%) | 66 (98.5%) |
| $300,000 to $499,999 | 5 (16.7%) | 0 (0.0%) |
| $500,000 to $749,999 | 0 (0.0%) | 0 (0.0%) |
| $750,000 to $999,999 | 0 (0.0%) | 0 (0.0%) |
| $1,000,000 or more | 0 (0.0%) | 0 (0.0%) |
| Total | 30 (100.0%) | 67 (100.0%) |
Household Income by Mortgage Status in Toms Brook
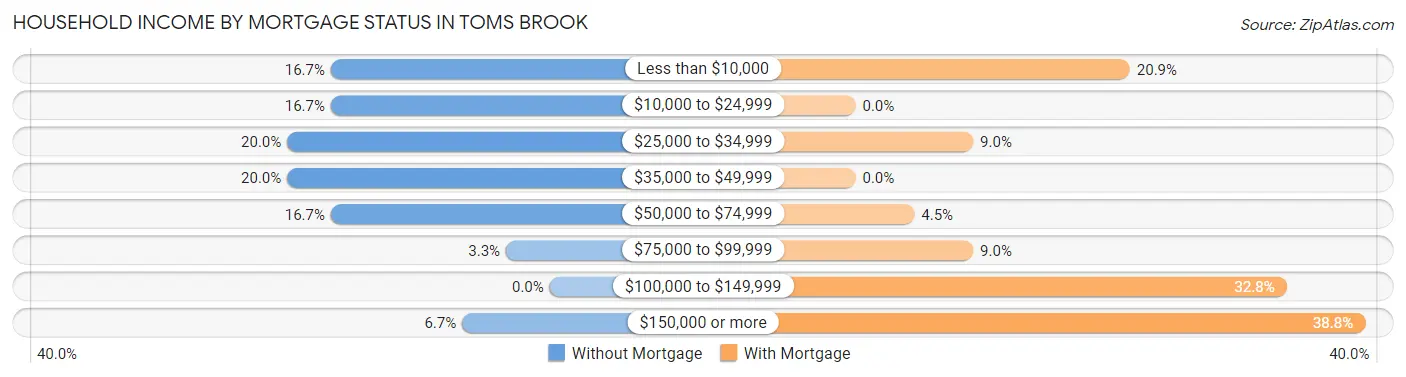
| Household Income | Without Mortgage | With Mortgage |
| Less than $10,000 | 5 (16.7%) | 14 (20.9%) |
| $10,000 to $24,999 | 5 (16.7%) | 0 (0.0%) |
| $25,000 to $34,999 | 6 (20.0%) | 6 (9.0%) |
| $35,000 to $49,999 | 6 (20.0%) | 0 (0.0%) |
| $50,000 to $74,999 | 5 (16.7%) | 3 (4.5%) |
| $75,000 to $99,999 | 1 (3.3%) | 6 (9.0%) |
| $100,000 to $149,999 | 0 (0.0%) | 22 (32.8%) |
| $150,000 or more | 2 (6.7%) | 26 (38.8%) |
| Total | 30 (100.0%) | 67 (100.0%) |
Property Value to Household Income Ratio in Toms Brook
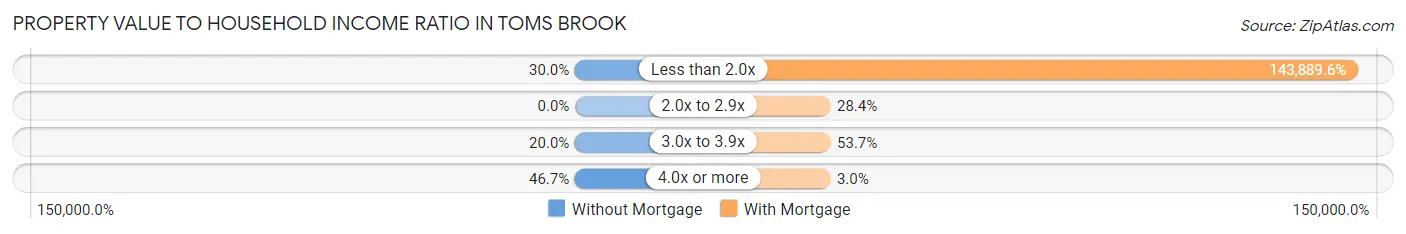
| Value-to-Income Ratio | Without Mortgage | With Mortgage |
| Less than 2.0x | 9 (30.0%) | 96,406 (143,889.6%) |
| 2.0x to 2.9x | 0 (0.0%) | 19 (28.4%) |
| 3.0x to 3.9x | 6 (20.0%) | 36 (53.7%) |
| 4.0x or more | 14 (46.7%) | 2 (3.0%) |
| Total | 30 (100.0%) | 67 (100.0%) |
Real Estate Taxes by Mortgage Status in Toms Brook
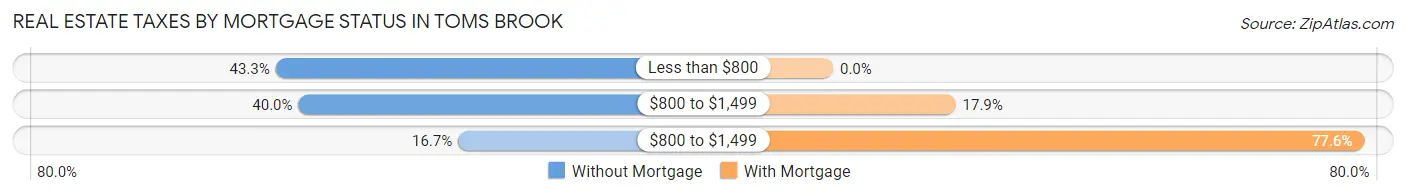
| Property Taxes | Without Mortgage | With Mortgage |
| Less than $800 | 13 (43.3%) | 0 (0.0%) |
| $800 to $1,499 | 12 (40.0%) | 12 (17.9%) |
| $800 to $1,499 | 5 (16.7%) | 52 (77.6%) |
| Total | 30 (100.0%) | 67 (100.0%) |
Health & Disability in Toms Brook
Health Insurance Coverage by Age in Toms Brook
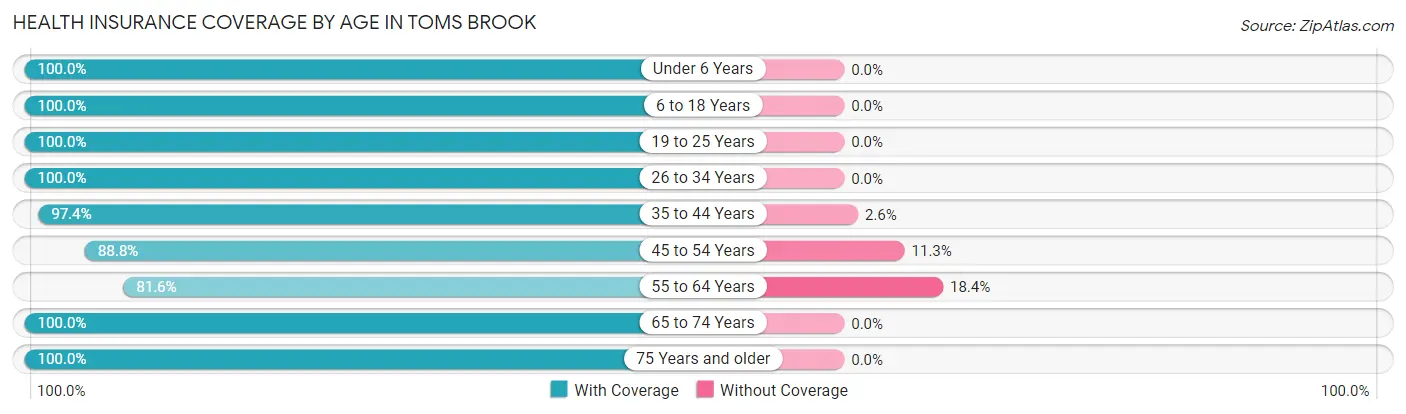
| Age Bracket | With Coverage | Without Coverage |
| Under 6 Years | 30 (100.0%) | 0 (0.0%) |
| 6 to 18 Years | 63 (100.0%) | 0 (0.0%) |
| 19 to 25 Years | 32 (100.0%) | 0 (0.0%) |
| 26 to 34 Years | 30 (100.0%) | 0 (0.0%) |
| 35 to 44 Years | 38 (97.4%) | 1 (2.6%) |
| 45 to 54 Years | 71 (88.7%) | 9 (11.3%) |
| 55 to 64 Years | 31 (81.6%) | 7 (18.4%) |
| 65 to 74 Years | 32 (100.0%) | 0 (0.0%) |
| 75 Years and older | 19 (100.0%) | 0 (0.0%) |
| Total | 346 (95.3%) | 17 (4.7%) |
Health Insurance Coverage by Citizenship Status in Toms Brook
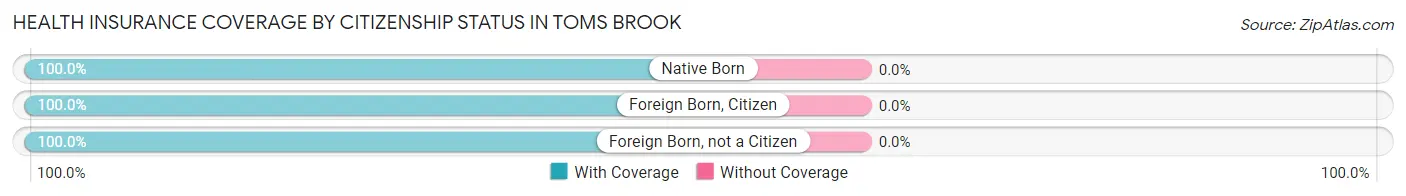
| Citizenship Status | With Coverage | Without Coverage |
| Native Born | 30 (100.0%) | 0 (0.0%) |
| Foreign Born, Citizen | 63 (100.0%) | 0 (0.0%) |
| Foreign Born, not a Citizen | 32 (100.0%) | 0 (0.0%) |
Health Insurance Coverage by Household Income in Toms Brook
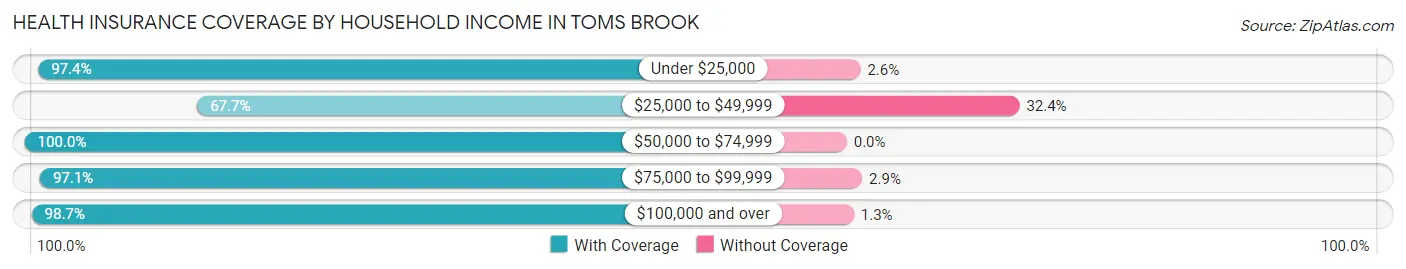
| Household Income | With Coverage | Without Coverage |
| Under $25,000 | 38 (97.4%) | 1 (2.6%) |
| $25,000 to $49,999 | 23 (67.6%) | 11 (32.4%) |
| $50,000 to $74,999 | 34 (100.0%) | 0 (0.0%) |
| $75,000 to $99,999 | 101 (97.1%) | 3 (2.9%) |
| $100,000 and over | 150 (98.7%) | 2 (1.3%) |
Public vs Private Health Insurance Coverage by Age in Toms Brook
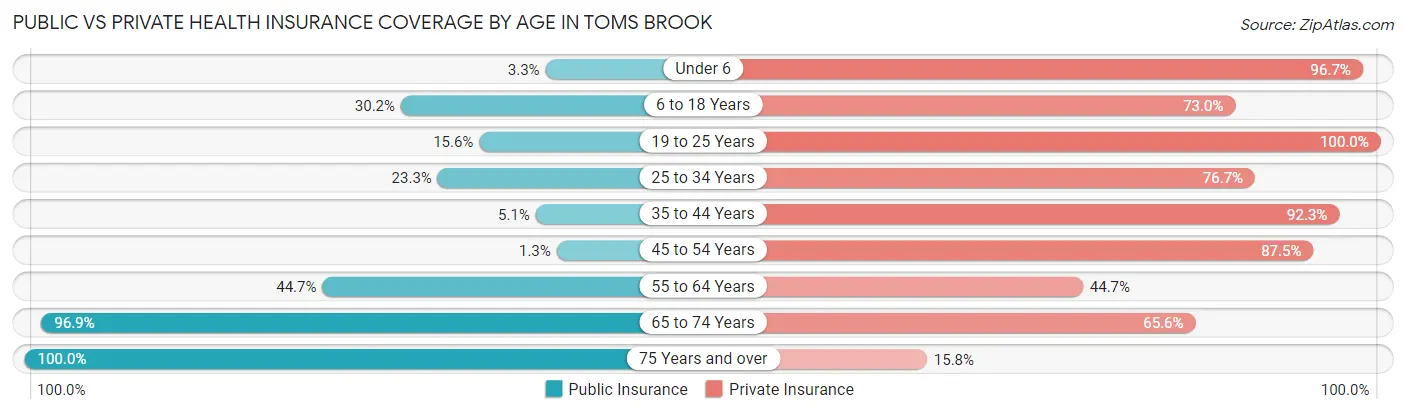
| Age Bracket | Public Insurance | Private Insurance |
| Under 6 | 1 (3.3%) | 29 (96.7%) |
| 6 to 18 Years | 19 (30.2%) | 46 (73.0%) |
| 19 to 25 Years | 5 (15.6%) | 32 (100.0%) |
| 25 to 34 Years | 7 (23.3%) | 23 (76.7%) |
| 35 to 44 Years | 2 (5.1%) | 36 (92.3%) |
| 45 to 54 Years | 1 (1.3%) | 70 (87.5%) |
| 55 to 64 Years | 17 (44.7%) | 17 (44.7%) |
| 65 to 74 Years | 31 (96.9%) | 21 (65.6%) |
| 75 Years and over | 19 (100.0%) | 3 (15.8%) |
| Total | 102 (28.1%) | 277 (76.3%) |
Disability Status by Sex by Age in Toms Brook
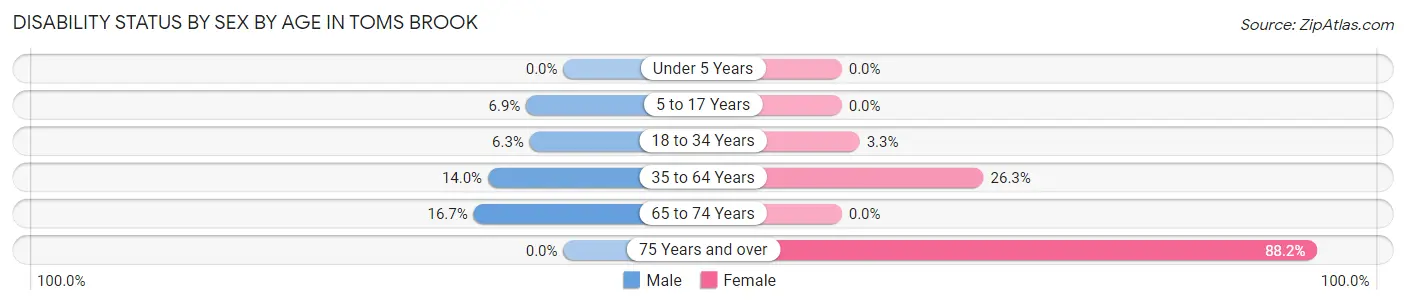
| Age Bracket | Male | Female |
| Under 5 Years | 0 (0.0%) | 0 (0.0%) |
| 5 to 17 Years | 2 (6.9%) | 0 (0.0%) |
| 18 to 34 Years | 2 (6.2%) | 1 (3.3%) |
| 35 to 64 Years | 14 (14.0%) | 15 (26.3%) |
| 65 to 74 Years | 1 (16.7%) | 0 (0.0%) |
| 75 Years and over | 0 (0.0%) | 15 (88.2%) |
Disability Class by Sex by Age in Toms Brook
Disability Class: Hearing Difficulty
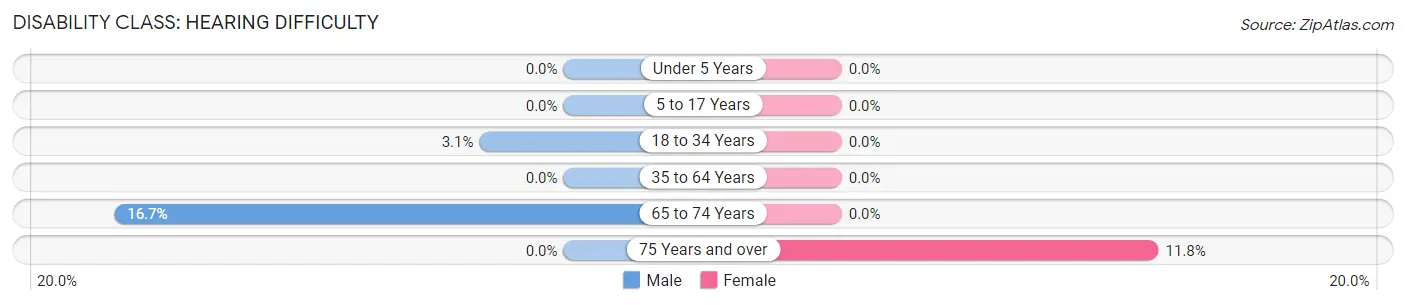
| Age Bracket | Male | Female |
| Under 5 Years | 0 (0.0%) | 0 (0.0%) |
| 5 to 17 Years | 0 (0.0%) | 0 (0.0%) |
| 18 to 34 Years | 1 (3.1%) | 0 (0.0%) |
| 35 to 64 Years | 0 (0.0%) | 0 (0.0%) |
| 65 to 74 Years | 1 (16.7%) | 0 (0.0%) |
| 75 Years and over | 0 (0.0%) | 2 (11.8%) |
Disability Class: Vision Difficulty
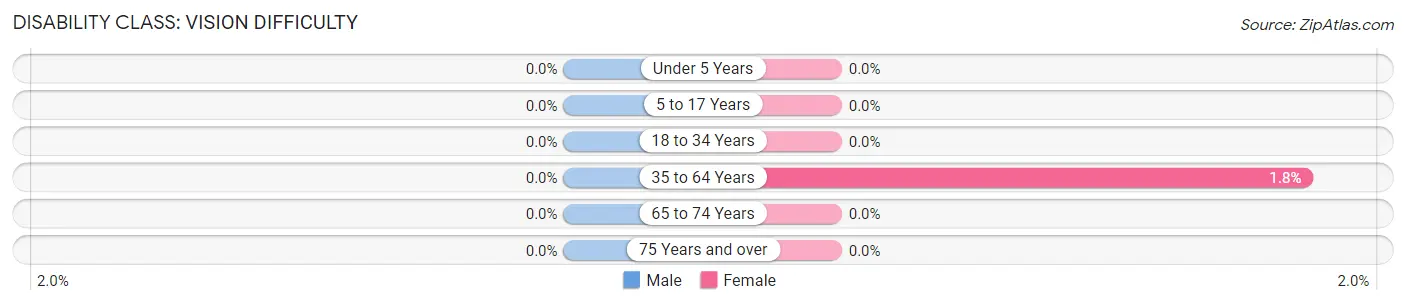
| Age Bracket | Male | Female |
| Under 5 Years | 0 (0.0%) | 0 (0.0%) |
| 5 to 17 Years | 0 (0.0%) | 0 (0.0%) |
| 18 to 34 Years | 0 (0.0%) | 0 (0.0%) |
| 35 to 64 Years | 0 (0.0%) | 1 (1.8%) |
| 65 to 74 Years | 0 (0.0%) | 0 (0.0%) |
| 75 Years and over | 0 (0.0%) | 0 (0.0%) |
Disability Class: Cognitive Difficulty
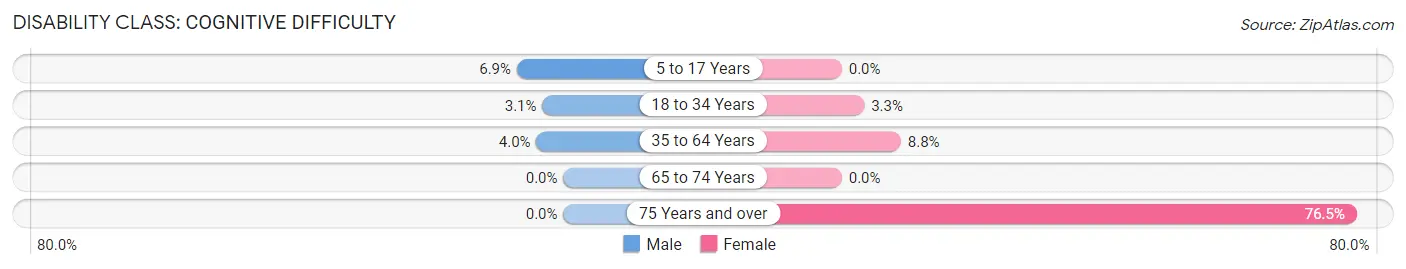
| Age Bracket | Male | Female |
| 5 to 17 Years | 2 (6.9%) | 0 (0.0%) |
| 18 to 34 Years | 1 (3.1%) | 1 (3.3%) |
| 35 to 64 Years | 4 (4.0%) | 5 (8.8%) |
| 65 to 74 Years | 0 (0.0%) | 0 (0.0%) |
| 75 Years and over | 0 (0.0%) | 13 (76.5%) |
Disability Class: Ambulatory Difficulty
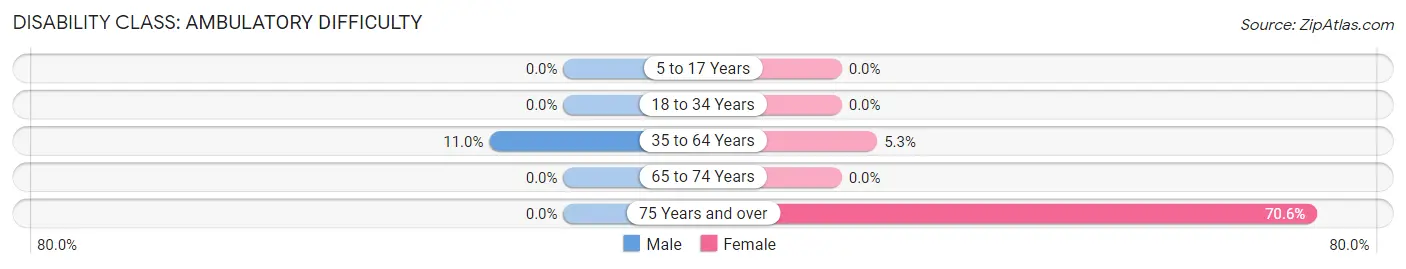
| Age Bracket | Male | Female |
| 5 to 17 Years | 0 (0.0%) | 0 (0.0%) |
| 18 to 34 Years | 0 (0.0%) | 0 (0.0%) |
| 35 to 64 Years | 11 (11.0%) | 3 (5.3%) |
| 65 to 74 Years | 0 (0.0%) | 0 (0.0%) |
| 75 Years and over | 0 (0.0%) | 12 (70.6%) |
Disability Class: Self-Care Difficulty
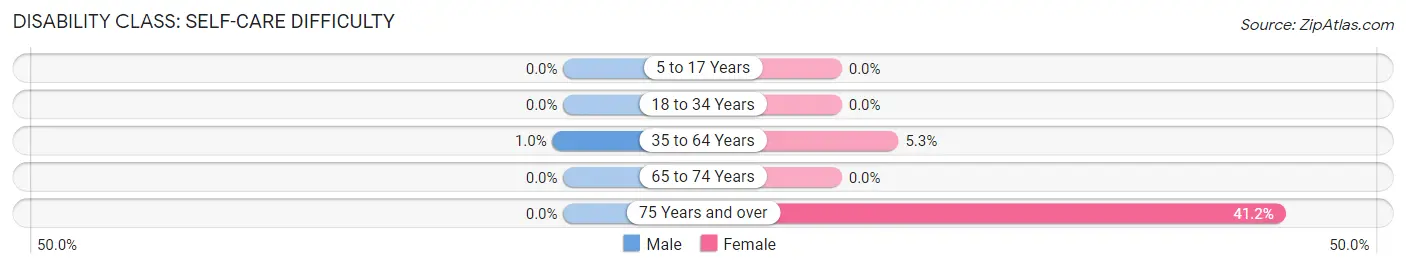
| Age Bracket | Male | Female |
| 5 to 17 Years | 0 (0.0%) | 0 (0.0%) |
| 18 to 34 Years | 0 (0.0%) | 0 (0.0%) |
| 35 to 64 Years | 1 (1.0%) | 3 (5.3%) |
| 65 to 74 Years | 0 (0.0%) | 0 (0.0%) |
| 75 Years and over | 0 (0.0%) | 7 (41.2%) |
Technology Access in Toms Brook
Computing Device Access in Toms Brook
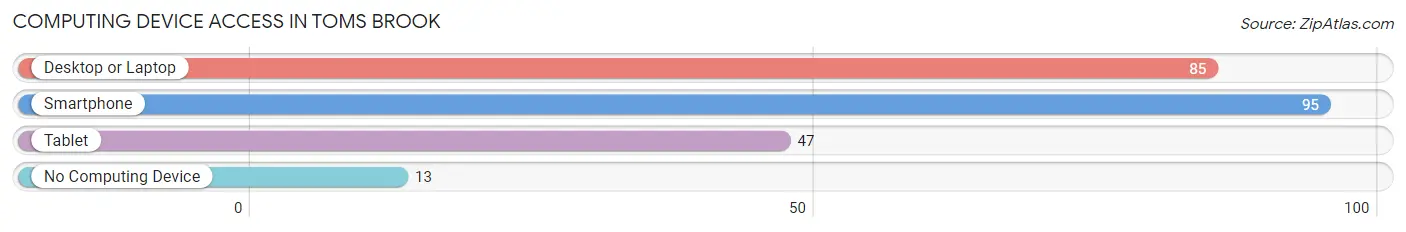
| Device Type | # Households | % Households |
| Desktop or Laptop | 85 | 71.4% |
| Smartphone | 95 | 79.8% |
| Tablet | 47 | 39.5% |
| No Computing Device | 13 | 10.9% |
| Total | 119 | 100.0% |
Internet Access in Toms Brook
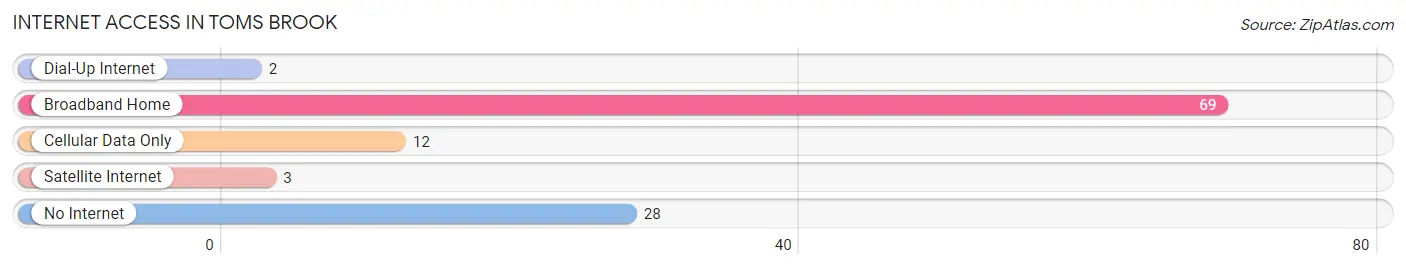
| Internet Type | # Households | % Households |
| Dial-Up Internet | 2 | 1.7% |
| Broadband Home | 69 | 58.0% |
| Cellular Data Only | 12 | 10.1% |
| Satellite Internet | 3 | 2.5% |
| No Internet | 28 | 23.5% |
| Total | 119 | 100.0% |
Toms Brook Summary
Toms Brook is a small unincorporated community located in Shenandoah County, Virginia. It is situated in the northern part of the county, near the border with West Virginia. The town is located along the banks of the Toms Brook, a tributary of the North Fork of the Shenandoah River. The town is home to a population of approximately 500 people, and is part of the larger Shenandoah Valley region.
History
Toms Brook was first settled in the late 1700s by German immigrants. The town was named after the Toms Brook, which was named after a local settler, Thomas Toms. The town was originally a farming community, and the surrounding area was used for grazing livestock. In the early 1800s, the town began to grow and develop, and a post office was established in 1820.
In the mid-1800s, the town became a major stop on the Valley Turnpike, a major transportation route that connected the Shenandoah Valley to the rest of the state. The town also became a major stop on the Winchester and Potomac Railroad, which connected the Shenandoah Valley to the rest of the country.
During the Civil War, Toms Brook was the site of a major battle between Union and Confederate forces. The Battle of Toms Brook, also known as the Woodstock Races, was fought on October 9, 1864. The Union forces were victorious, and the Confederate forces retreated.
Geography
Toms Brook is located in the northern part of Shenandoah County, Virginia. It is situated along the banks of the Toms Brook, a tributary of the North Fork of the Shenandoah River. The town is located in the Shenandoah Valley region, and is surrounded by the Blue Ridge Mountains to the east and the Allegheny Mountains to the west.
The town has a total area of 0.7 square miles, all of which is land. The town is located at an elevation of 1,068 feet above sea level.
Economy
The economy of Toms Brook is largely based on agriculture. The town is home to several farms, which produce a variety of crops, including corn, soybeans, wheat, and hay. The town is also home to several small businesses, including a grocery store, a hardware store, and a restaurant.
Demographics
As of the 2010 census, Toms Brook had a population of 500 people. The racial makeup of the town was 97.2% White, 0.6% African American, 0.2% Native American, 0.2% Asian, 0.2% from other races, and 1.8% from two or more races. Hispanic or Latino of any race were 1.2% of the population.
The median household income in Toms Brook was $41,250, and the median family income was $45,833. The per capita income for the town was $19,945. About 11.2% of families and 13.2% of the population were below the poverty line, including 17.2% of those under age 18 and 8.3% of those age 65 or over.
Common Questions
What is Per Capita Income in Toms Brook?
Per Capita income in Toms Brook is $27,387.
What is the Median Family Income in Toms Brook?
Median Family Income in Toms Brook is $74,583.
What is the Median Household income in Toms Brook?
Median Household Income in Toms Brook is $80,893.
What is Income or Wage Gap in Toms Brook?
Income or Wage Gap in Toms Brook is 35.9%.
Women in Toms Brook earn 64.1 cents for every dollar earned by a man.
What is Inequality or Gini Index in Toms Brook?
Inequality or Gini Index in Toms Brook is 0.34.
What is the Total Population of Toms Brook?
Total Population of Toms Brook is 363.
What is the Total Male Population of Toms Brook?
Total Male Population of Toms Brook is 187.
What is the Total Female Population of Toms Brook?
Total Female Population of Toms Brook is 176.
What is the Ratio of Males per 100 Females in Toms Brook?
There are 106.25 Males per 100 Females in Toms Brook.
What is the Ratio of Females per 100 Males in Toms Brook?
There are 94.12 Females per 100 Males in Toms Brook.
What is the Median Population Age in Toms Brook?
Median Population Age in Toms Brook is 40.1 Years.
What is the Average Family Size in Toms Brook
Average Family Size in Toms Brook is 3.7 People.
What is the Average Household Size in Toms Brook
Average Household Size in Toms Brook is 3.0 People.
How Large is the Labor Force in Toms Brook?
There are 205 People in the Labor Forcein in Toms Brook.
What is the Percentage of People in the Labor Force in Toms Brook?
73.0% of People are in the Labor Force in Toms Brook.
What is the Unemployment Rate in Toms Brook?
Unemployment Rate in Toms Brook is 3.4%.